UNITED STATES
SECURITIES AND EXCHANGE COMMISSION
Washington, D.C. 20549
FORM N-CSR
CERTIFIED SHAREHOLDER REPORT OF REGISTERED
MANAGEMENT INVESTMENT COMPANIES
Investment Company Act file number(s) 811-22845
Babson Capital Funds Trust
(Exact Name of Registrant as Specified in Charter)
550 South Tryon Street
Suite 3300
Charlotte, NC 28202
(Address of Principal Executive Offices)
Registrant’s telephone number, including area code: (704) 805-7200
Janice M. Bishop
Vice President, Secretary and Chief Legal Officer
c/o Babson Capital Management LLC
Independence Wharf
470 Atlantic Avenue
Boston MA 02210
(Name and Address of Agent for Service)
Date of fiscal year end: June 30
Date of reporting period: December 31, 2014
| Item 1. | Reports to Stockholders. |
The Semi-Annual Report to Stockholders is attached hereto.

BABSON CAPITAL FUNDS TRUST
Semi-Annual Report
December 31, 2014
This page intentionally left blank.

Anthony Sciacca
President and Chief Executive Officer
Babson Capital Funds Trust
Babson Capital Funds Trust
Babson Global Floating Rate Fund
Babson Global Credit Income Opportunities Fund
Dear Shareholder,
Global markets experienced renewed volatility in late-2014 as the impact of the precipitous fall in oil prices was felt across a wide range of asset classes. Meanwhile, growth in the world’s major economies diverged throughout the year as the U.S. and U.K. continued to lead the developed market pack, while Europe and Japan remained sluggish and China showed continued signs of slowing.
Looking ahead, we expect this theme of divergence to remain in place throughout 2015. While many market participants expect the U.S. Federal Reserve to finally raise rates this year, such an outcome is far from certain. Domestic growth appears to be supportive of a U.S. rate hike, however, policymakers must consider this within the context of slowing global growth. The implications, both positive and negative, of the fall in energy prices and the strength of the U.S. dollar must also be carefully contemplated. Central bankers in Europe and Japan are in a much different position from those in the U.S. as they continue to rely heavily on quantitative-easing measures in an attempt to buoy their sluggish economies.
The good news is that the corporate sector has largely benefitted from the past several years of historically accommodative monetary policy. Balance sheets generally remain healthy with interest coverage ratios and leverage still in reasonable territory, and default rates low by historical standards. We expect corporate fundamentals to remain relatively healthy as we move through 2015.
While we anticipate that increased global market volatility may stay with us throughout the year, we believe that the current environment is favorable for active credit managers like Babson. In our opinion, the aforementioned changes in global economic conditions, currency values and energy prices will have very different impacts on different countries, asset classes, sectors and individual issuers. At Babson, our investment process is built upon a rigorous, bottom-up fundamental analysis of every company that we invest in. We believe that security selection will be critical in 2015 and that the breadth and depth of our investment teams will enable us to continue to find attractive opportunities for our clients.
As we move into 2015, we remain focused on our clients’ long-term goals and invest with an appreciation of the uncertainty of the world in which we live. On behalf of the entire Babson team, we value the trust you’ve placed in us, and we look forward to helping you achieve your investment objectives.
Sincerely,

Anthony Sciacca
Cautionary Notice: Certain statements contained in this report maybe “forward looking” statements. Investors are cautioned not to place undue reliance on forward-looking statements, which speak only as of the date in which they are made and which reflect management’s current estimates, projections, expectations or beliefs, and which are subject to risks and uncertainties that may cause actual results to differ materially. These statements are subject to change at anytime based upon economic, market or other conditions and may not be relied upon as investment advice or an indication of the Trust’s trading intent. References to specific securities are not recommendations of such securities, and may not be representative of the Trust’s current or future investments. We undertake no obligation to publicly update forward looking statements, whether as a result of new information, future events, or otherwise.
ALPS Distributors, Inc. is the distributor for the Babson Capital mutual funds. Shares of the funds are offered by Babson Capital Securities LLC, an affiliated broker dealer of Babson Capital Management LLC. ALPS and Babson Capital Management are separate and unaffiliated. This material must be preceded or accompanied by the current fund prospectus. Investors should carefully consider the investment objective, risks, charges and expenses of any mutual fund before investing. This and other important information is contained in the prospectus and summary prospectus.
1
Babson Global Floating Rate Fund 2014 Semi-Annual Report
Investment Objective
The investment objective of the Babson Global Floating Rate Fund (“Global Floating Rate Fund” or the “Fund”) is to seek a high level of current income. Preservation of capital is a secondary goal.
Portfolio Management Commentary
How did the Fund perform?
| n | The Fund reported a net total rate of return for the semi-annual reporting period from June 30, 2014 through December 31, 2014 of -1.67% and underperformed the Credit Suisse Global Loan Benchmark, which returned -0.54%.1 |
What factors influenced performance of the Fund?
| n | During the second half of the year, the Fund’s U.S. holdings in both senior secured loans and, to a lesser extent, high yield bonds were the primary detractors from performance. The Fund’s European holdings, however, positively impacted Fund performance as a result of good credit selection within the senior secured loan asset class. European issuers represented seven out of the top ten contributors to Fund performance for this time period. |
| n | U.S. senior secured loans and high yield bonds of energy-related issuers faced significant selling pressure. The Fund was negatively impacted by its overweight exposure to this sector relative to the Benchmark. Six of the Fund’s biggest ten contributors to its underperformance were Oil and Gas focused issuers. In our view, the underlying credit fundamentals for many of these issuers imply a higher value than current trading levels. We feel the selling was indiscriminate and has resulted in oversold conditions for certain investments. While it is difficult to predict the price of commodities, we believe that most of these companies have sufficient liquidity and flexibility in their capital expenditure and operating budgets to withstand the volatility in commodity prices for longer than their current prices would suggest. |
Describe recent portfolio activity.
| n | The number of holdings in the portfolio decreased over the past six months as the Fund experienced a few redemptions in December, presumably due to investors becoming more risk averse to the increased volatility in the high yield market. The Fund moderately trimmed its exposure to high yield bonds to help meet these redemption requests as well as reduce the Fund’s exposure to a more volatile asset class. |
| n | The Fund remained overweight to European assets relative to the global senior secured loan market. Even with the overweight positioning, the Fund increased its exposure to U.S. assets as prices widened more significantly than Europe which, in our opinion, positions the Fund to capture the best risk-adjusted returns from the market. |
Describe portfolio positioning at period end.
| n | The Fund finished the semi-annual reporting period, December 31, 2014, with a 78.0% weighting to global senior secured loans. The remainder of the portfolio was invested in global high yield bonds (9.2%), primarily senior secured bonds. A portion of the Fund is invested in floating rate, high yield bonds (5.4%) predominantly issued by European companies, which increases the total floating rate exposure of the portfolio to 83.4%. |
| 1. | Total return describes the return to an investor based on the Class Y net expense ratio and includes the reinvestment of dividends and capital gains. Performance results reflect past performance and are no guarantee of future results. Current performance may be lower or higher than the performance data quoted. The net asset value (NAV) will fluctuate with market conditions. All returns 1-year or less are cumulative. The Credit Suisse Global Loan Benchmark is a market capitalization weighted average of the Credit Suisse Leveraged Loan Index and the Credit Suisse Western European Leveraged Loan Index. The Credit Suisse Leveraged Loan Index is designed to mirror the investable universe of the U.S. dollar-denominated leveraged loan market. The Credit Suisse Western European Leveraged Loan Index is designed to mirror the investable universe of the Western European leveraged loan market, with loans denominated in U.S. and Western European currencies. Indices are unmanaged. It is not possible to invest directly in an index. |
2
Babson Global Floating Rate Fund 2014 Semi-Annual Report
| n | From an industry perspective, the Fund remains well-diversified across a number of sectors based on Moody’s Industry Classification, with higher concentrations in non-bank related Finance companies (10.2%), Healthcare, Education and Childcare (8.9%), and Diversified/Conglomerate Service (8.3%) as of December 31, 2014. Over the course of the past 6 months, there have been no significant changes to the industry composition of the portfolio. |
| n | As of December 31, 2014, the Fund had the following credit quality breakdown excluding cash and accrued income: 16.8% in Ba assets, 62.9% in single-B credits and a small exposure to Caa and below at 7.0%. Approximately 12.7% of the Fund’s assets are not publicly rated, primarily consisting of European issuers that we believe have a credit quality similar to that of other assets in the portfolio. Baa assets accounted for the remaining 0.6% of the portfolio assets. While there were no significant portfolio shifts from a ratings standpoint, the single-B category increased compared to June 30, 2014 as the assets that were not publicly rated decreased.2 |
| n | The Top 5 countries in the portfolio at the end of the semi-annual reporting period are the United States (65.2%), the United Kingdom (16.7%), Germany (5.0%), France (4.4%) and Ireland (2.5%). Overall, the Fund has exposure to thirteen different countries, and we continue to focus on building a well-diversified portfolio of global floating rate securities. |
Describe market and portfolio outlook.
| n | Looking ahead into 2015, monetary policy will be a key theme capturing the attention of financial markets in the coming months. In Europe, the market will be monitoring the effects of the European Central Bank’s quantitative easing program and in the United States the timing and speed of an eventual increase in rates by the Federal Reserve will be debated and monitored as well. |
| n | Further, headline events such as signs of stability in pricing levels for oil markets and the effects of prices on energy related companies will be closely watched. |
| n | For the global loan market, expectations are that in general high yield corporate earnings profiles will remain stable and default levels should remain benign. That backdrop coupled with the global loan market’s high relative yields compared to historical standards and low comparative volatility, in our opinion, should be favorable for the asset class. |
| 2. | Ratings shown are the highest rating given by one of the following national rating agencies: S&P or Moody’s. Additional information about ratings can be found at www.moodys.com and www.standardandpoors.com. Credit ratings are subject to change. AAA, AA, A, and BBB are investment grade ratings; BB, B, CCC/CC/C and D are below investment grade ratings. Bonds backed by U.S. Government or agency securities are given an implied rating equal to the rating of such securities. Holdings designated Not Publicly Rated are not rated by these national rating agencies. |
3
Babson Global Floating Rate Fund 2014 Semi-Annual Report
PORTFOLIO COMPOSITION (% OF ASSETS*)
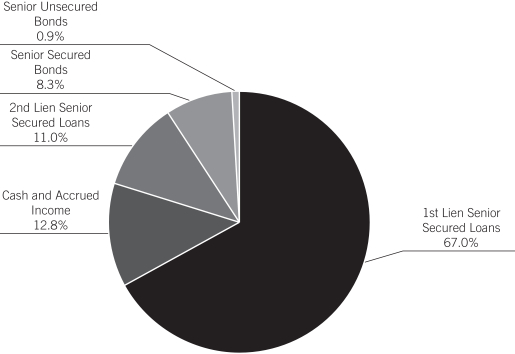
| * | The percentages shown above represent a percentage of the assets as of December 31, 2014. |
COUNTRY COMPOSITION (% OF ASSETS**)
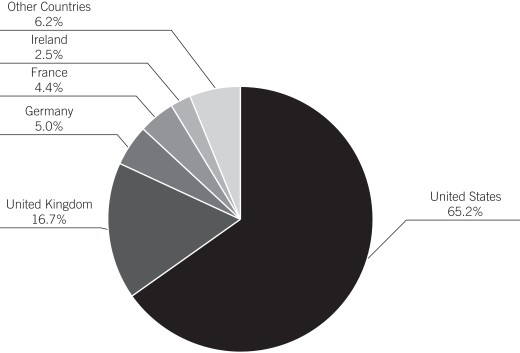
| ** | Percentage of assets are expressed by market value excluding cash and accrued income, and may vary over time. The percentages shown above represent a percentage of the assets as of December 31, 2014. |
4
Babson Global Credit Income Opportunities Fund 2014 Semi-Annual Report
Investment Objective
The investment objective of the Babson Global Credit Income Opportunities Fund (“Global Credit Income Opportunities Fund” or the “Fund”) is to seek an absolute return, primarily through current income and secondarily through capital appreciation.
Portfolio Management Commentary
How did the Fund perform?
| n | The Fund reported a net total rate of return for the semi-annual reporting period from June 30, 2014 through December 31, 2014, of -3.91% and underperformed the 3 Month USD LIBOR + 500 basis points1 Benchmark, which retuned +2.67%.2 |
What factors influenced performance of the Fund?
| n | During the second half of the year, the Fund’s U.S. holdings in both high yield bonds and, to a lesser extent, senior secured loans were the primary detractors from performance. The Fund’s European holdings performed better than its U.S. holdings, although performance from these assets was still negative primarily due to the European high yield bond holdings. European issuers represented six of the top ten contributors to Fund performance for this time period. |
| n | U.S. high yield bonds and senior secured loans of energy-related issuers faced significant selling pressure. The Fund was negatively impacted by its exposure to this sector. Eight of the Fund’s biggest ten contributors to its underperformance were Oil and Gas focused issuers. In our view, the underlying credit fundamentals for many of these issuers imply a higher value than current trading levels. We feel the selling was indiscriminate and has resulted in oversold conditions for certain investments. While it is difficult to predict the price of commodities, we believe that most of these companies have sufficient liquidity and flexibility in their capital expenditure and operating budgets to withstand the volatility in commodity prices for longer than their current prices would suggest. |
| n | The Fund’s Collateralized Loan Obligation (“CLO”) holdings and special situation credits had a minor negative impact on performance during the past six months; however, we believe these assets provide attractive current income to the portfolio and should contribute to the Fund’s performance in the future. |
Describe recent portfolio activity.
| n | The number of holdings in the portfolio has increased moderately as the Fund grew slightly since June 30, 2014. Despite the increased number of holdings, the Fund’s positioning across geographies remained fairly consistent and the Fund continues to maintain significant positions in high conviction credits. |
| n | The Fund trimmed its exposure to global high yield bonds and increased exposure to global senior secured loans as well as CLOs to shift higher up in the corporate capital structure in order to focus on what we believe to be a more attractive part of the market from a risk-adjusted basis. In addition, global senior secured loans tend to be less volatile than global high yield bonds, so this shift could potentially reduce the Fund’s volatility. |
| n | The Fund sought to take advantage of selling pressure in the Oil and Gas sector by swapping some lower-rated energy credits for higher-rated energy credits, potentially increasing the credit quality of the portfolio while still maintaining the potential for capital appreciation. |
| 1. | A unit that is equal to 1/100th of 1% or 0.01%. |
| 2. | Total return describes the return to an investor based on the Class Y net expense ratio and includes the reinvestment of dividends and capital gains. Performance results reflect past performance and are no guarantee of future results. Current performance may be lower or higher than the performance data quoted. The net asset value (NAV) will fluctuate with market conditions. All returns 1-year or less are cumulative. The 3 Month USD LIBOR (London Interbank Offered Rate) is an average interest rate, determined by the British Bankers Association, that banks charge one another for the use of short-term money (3 months) in England’s Eurodollar market. The return shown includes 3 Month USD LIBOR plus 500 bps, or 5% per annum. LIBOR is unmanaged. It is not possible to invest directly in LIBOR. No assurance can be given that the Fund’s performance will exceed that of LIBOR by any given increment, or at all. |
5
Babson Global Credit Income Opportunities Fund 2014 Semi-Annual Report
Describe portfolio positioning at period end.
| n | The Fund finished the semi-annual reporting period, December 31, 2014, with an allocation of 37.9%, 33.2%, and 16.7% to global high yield bonds, senior secured loans and CLOs, respectively. The remainder of the portfolio was invested in a few opportunistic special situation credits at 1.1% and cash at 11.1%. A significant portion of the portfolio (52.2%) is senior secured in nature, which can potentially mitigate principal loss in the event that default rates increase. |
| n | From an industry perspective, the Fund remains well-diversified across a number of sectors based on Moody’s Industry Classification, with higher concentrations in CLOs (16.7%), Oil and Gas (7.2%), and Healthcare, Education and Childcare (6.0%) as of December 31, 2014. Over the course of the past six months, the Fund’s top 3 industry exposures have remained the same except for an increase its CLO position and a decrease in exposure to Oil and Gas companies by approximately 4%. |
| n | As of December 31, 2014, the Fund had the following credit quality breakdown excluding cash and accrued income: 22.6% in Ba assets, 54.9% in single-B credits and a modest exposure to Caa and below at 13.2%. Approximately 9.2% of the Fund’s assets are not publicly rated, primarily consisting of European issuers that we believe have a credit quality similar to that of other assets in the portfolio. Baa and above assets accounted for the remaining 0.1% of the portfolio assets. While there were no significant portfolio shifts from a ratings standpoint, the Ba category increased compared to June 30, 2014 as assets that were not publicly rated decreased.3 |
| n | The Top 5 countries in the portfolio at the end of the semi-annual reporting period are the United States (41.8%), the Cayman Islands (17.9%), the United Kingdom (16.1%), Germany (4.3%) and the Netherlands (4.0%). The Cayman Islands exposure related to the Fund’s CLO holdings is predominantly invested in U.S. senior secured loans. Overall, the Fund has exposure to 17 different countries, and we continue to focus on building a well-diversified portfolio of global high yield securities. |
Describe market and portfolio outlook.
| n | Looking ahead into 2015, monetary policy will be a key theme capturing the attention of financial markets in the coming months. In Europe, the market will be monitoring the effects of the European Central Bank’s quantitative easing program and in the United States the timing and speed of an eventual increase in rates by the Federal Reserve will be debated and monitored as well. |
| n | Further, headline events such as signs of stability in pricing levels for oil markets and the effects of prices on energy related companies will be closely watched. |
| n | For the global loan and high yield bond markets, expectations are that in general high yield corporate earnings profiles will remain stable and default levels should remain benign. That backdrop coupled with elevated yields in global loans and high yield bonds compared to historical standards, in our opinion, should be favorable for the Fund. |
| 3. | Ratings shown are the highest rating given by one of the following national rating agencies: S&P or Moody’s. Additional information about ratings can be found at www.moodys.com and www.standardandpoors.com. Credit ratings are subject to change. AAA, AA, A, and BBB are investment grade ratings; BB, B, CCC/CC/C and D are below investment grade ratings. Bonds backed by U.S. Government or agency securities are given an implied rating equal to the rating of such securities. Holdings designated Not Publicly Rated are not rated by these national rating agencies. |
6
Babson Global Credit Income Opportunities Fund 2014 Semi-Annual Report
PORTFOLIO COMPOSITION (% OF ASSETS*)
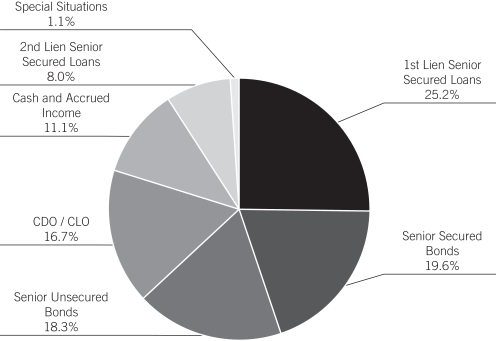
| * | The percentages shown above represent a percentage of the assets as of December 31, 2014. |
COUNTRY COMPOSITION (% OF ASSETS**)
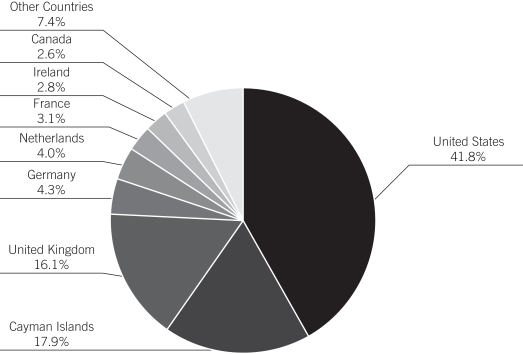
| ** | Percentage of assets are expressed by market value excluding cash and accrued income, and may vary over time. The percentages shown above represent a percentage of the assets as of December 31, 2014. |
7
Babson Capital Funds Trust 2014 Semi-Annual Report
SHAREHOLDER EXPENSES (UNAUDITED)
As a shareholder of Babson Global Floating Rate Fund or Babson Global Credit Income Opportunities Fund, you incur ongoing expenses, such as management fees, shareholder service fees, distribution fees and other fund expenses. The following table is intended to help you understand your ongoing expenses (in dollars and cents) of investing in the Funds and to compare these expenses with the ongoing expenses of investing in other funds.
The table is based on an investment of $1,000 invested at the beginning of the period and held for the entire period from July 1, 2014 to December 31, 2014.
Actual Expenses
The first line in the table below provides information about the actual account values and actual expenses. You may use the information in this line, together with the amount you invested, to estimate the expenses that you paid over the period. Simply divide your account value by $1,000 (for example, an $8,600 account value divided by $1,000 = 8.6), then multiply the result by the number in the first line for the Fund under the heading entitled “Operating Expenses Incurred” to estimate the expenses you paid on your account during this period.
Hypothetical Example for Comparison Purposes
The second line in the table below provides information about the hypothetical account values and hypothetical expenses based on the Fund’s actual expense ratio and an assumed rate of return of 5% per year before expenses, which is not the Fund’s actual return. The hypothetical account value and expenses may not be used to estimate the actual ending account balance or expenses you paid for the period. You may use this information to compare the ongoing costs of investing in your Fund and other funds. To do so, compare this 5% hypothetical example with the 5% hypothetical examples that appear in the shareholder reports of the other funds.
Babson Global Floating Rate Fund
| EXPENSE RATIO | BEGINNING AMOUNT | ENDING VALUE | AVERAGE VALUE | OPERATING EXPENSE INCURRED* | ||||||||||||||||
Class A | ||||||||||||||||||||
Actual | 1.05 | % | $ | 1,000.00 | $ | 982.00 | $ | 991.00 | $ | 5.25 | ||||||||||
Hypothetical | 1.05 | % | 1,000.00 | 1,019.90 | 1,009.95 | 5.35 | ||||||||||||||
Class C | ||||||||||||||||||||
Actual | 1.80 | % | 1,000.00 | 978.30 | 989.15 | 8.98 | ||||||||||||||
Hypothetical | 1.80 | % | 1,000.00 | 1,016.10 | 1,008.05 | 9.15 | ||||||||||||||
Class I | ||||||||||||||||||||
Actual | 0.75 | % | 1,000.00 | 983.30 | 991.65 | 3.75 | ||||||||||||||
Hypothetical | 0.75 | % | 1,000.00 | 1,021.40 | 1,010.70 | 3.82 | ||||||||||||||
Class Y | ||||||||||||||||||||
Actual | 0.75 | % | 1,000.00 | 983.30 | 991.65 | 3.75 | ||||||||||||||
Hypothetical | 0.75 | % | 1,000.00 | 1,021.40 | 1,010.70 | 3.82 | ||||||||||||||
| * | For each Class of the Fund, net expenses are equal to the annualized expense ratio for such class multiplied by the average account value over the period, multiplied by 184/365. |
8
Babson Capital Funds Trust 2014 Semi-Annual Report
SHAREHOLDER EXPENSES (UNAUDITED) (CONTINUED)
Babson Global Credit Income Opportunities Fund
| EXPENSE RATIO | BEGINNING AMOUNT | ENDING VALUE | AVERAGE VALUE | OPERATING EXPENSE INCURRED* | ||||||||||||||||
Class A | ||||||||||||||||||||
Actual | 1.20 | % | $ | 1,000.00 | $ | 960.60 | $ | 980.30 | $ | 5.93 | ||||||||||
Hypothetical | 1.20 | % | 1,000.00 | 1,019.20 | 1,009.60 | 6.11 | ||||||||||||||
Class C | ||||||||||||||||||||
Actual | 1.95 | % | 1,000.00 | 956.20 | 978.10 | 9.61 | ||||||||||||||
Hypothetical | 1.95 | % | 1,000.00 | 1,015.40 | 1,007.70 | 9.91 | ||||||||||||||
Class I | ||||||||||||||||||||
Actual | 0.95 | % | 1,000.00 | 960.90 | 980.45 | 4.70 | ||||||||||||||
Hypothetical | 0.95 | % | 1,000.00 | 1,020.40 | 1,010.20 | 4.84 | ||||||||||||||
Class Y | ||||||||||||||||||||
Actual | 0.95 | % | 1,000.00 | 960.90 | 980.45 | 4.70 | ||||||||||||||
Hypothetical | 0.95 | % | 1,000.00 | 1,020.40 | 1,010.20 | 4.84 | ||||||||||||||
| * | For each Class of the Fund, net expenses are equal to the annualized expense ratio for such class multiplied by the average account value over the period, multiplied by 184/365. |
9
Babson Capital Funds Trust 2014 Semi-Annual Report
BABSON CAPITAL FUNDS TRUST
FINANCIAL REPORT
| Statement of Assets and Liabilities | 11 | |
| Statement of Operations | 13 | |
| Statements of Changes in Net Assets | 14 | |
| Selected Financial Highlights | 15 | |
| Schedule of Investments | 23-40 | |
| Notes to Financial Statements | 41-54 | |
10
Babson Capital Funds Trust 2014 Semi-Annual Report
STATEMENTS OF ASSETS AND LIABILITIES
December 31, 2014 (Unaudited)
| BABSON GLOBAL FLOATING RATE FUND | BABSON GLOBAL CREDIT INCOME OPPORTUNITIES FUND | |||||||
| Assets | ||||||||
| Investments, at fair value (cost $104,588,906 and $74,758,925, respectively) | $ | 98,265,848 | $ | 69,887,385 | ||||
| Foreign currency, at value (cost $785,144 and $545,184, respectively) | 774,446 | 540,055 | ||||||
| Receivable for investments sold | 10,928,556 | 3,301,611 | ||||||
| Receivable for Fund shares sold | 93,127 | 108,496 | ||||||
| Interest receivable | 615,197 | 851,294 | ||||||
| Foreign tax reclaims receivable | – | 494 | ||||||
| Unrealized appreciation on forward foreign currency exchange contracts | 427,072 | 278,608 | ||||||
| Prepaid expenses | 35,942 | 38,385 | ||||||
|
|
|
| |||||
Total assets | 111,140,188 | 75,006,328 | ||||||
|
|
|
| |||||
Liabilities | ||||||||
| Payable for investments purchased | 4,704,335 | 2,635,264 | ||||||
| Payable for Fund shares repurchased | 197,801 | 42,673 | ||||||
| Investment advisery fee payable (see Note 3) | 3,064 | 5,668 | ||||||
| Distribution fees payable | 5,528 | 5,026 | ||||||
| Unrealized depreciation on forward foreign currency exchange contracts | 110,447 | 21,593 | ||||||
| Unrealized depreciation on unfunded loan commitments | 72 | 36 | ||||||
| Accrued expenses and other liabilities | 79,191 | 54,567 | ||||||
|
|
|
| |||||
Total liabilities | 5,100,438 | 2,764,827 | ||||||
|
|
|
| |||||
Total net assets | $ | 106,039,750 | $ | 72,241,501 | ||||
|
|
|
| |||||
| Composition of net assets | ||||||||
| Shares of beneficial interest outstanding (par value $0.00001 per share), unlimited number of shares authorized | $ | 111 | $ | 77 | ||||
| Additional paid-in capital | 112,367,289 | 78,062,223 | ||||||
| Undistributed net investment loss | (2,307,494 | ) | (1,593,320 | ) | ||||
| Accumulated net realized gain | 1,972,066 | 307,478 | ||||||
| Net unrealized depreciation | (5,992,222 | ) | (4,534,957 | ) | ||||
|
|
|
| |||||
Total net assets | $ | 106,039,750 | $ | 72,241,501 | ||||
|
|
|
| |||||
| Class A | ||||||||
| Net assets applicable to outstanding shares | $ | 13,380,871 | $ | 14,018,651 | ||||
|
|
|
| |||||
| Shares of beneficial interest outstanding | 1,403,056 | 1,490,240 | ||||||
|
|
|
| |||||
| Net asset value per share outstanding | $ | 9.54 | $ | 9.41 | ||||
|
|
|
| |||||
| Maximum offering price per share outstanding (Net asset value plus sales charge of 3.00% and 3.75%, respectively) | $ | 9.84 | $ | 9.78 | ||||
|
|
|
| |||||
See accompanying Notes to Financial Statements
11
Babson Capital Funds Trust 2014 Semi-Annual Report
STATEMENTS OF ASSETS AND LIABILITIES (CONTINUED)
December 31, 2014 (Unaudited)
| BABSON GLOBAL FLOATING RATE FUND | BABSON GLOBAL CREDIT INCOME OPPORTUNITIES FUND | |||||||
| Class C | ||||||||
| Net assets applicable to outstanding shares | $ | 3,260,926 | $ | 1,896,231 | ||||
|
|
|
| |||||
| Shares of beneficial interest outstanding | 343,201 | 201,831 | ||||||
|
|
|
| |||||
| Net asset value per share outstanding | $ | 9.50 | $ | 9.40 | ||||
|
|
|
| |||||
| Class I | ||||||||
| Net assets applicable to outstanding shares | $ | 32,229,839 | $ | 25,365,139 | ||||
|
|
|
| |||||
| Shares of beneficial interest outstanding | 3,374,361 | 2,697,205 | ||||||
|
|
|
| |||||
| Net asset value per share outstanding | $ | 9.55 | $ | 9.40 | ||||
|
|
|
| |||||
| Class Y | ||||||||
| Net assets applicable to outstanding shares | $ | 57,168,114 | $ | 30,961,480 | ||||
|
|
|
| |||||
| Shares of beneficial interest outstanding | 5,986,311 | 3,292,084 | ||||||
|
|
|
| |||||
| Net asset value per share outstanding | $ | 9.55 | $ | 9.40 | ||||
|
|
|
| |||||
See accompanying Notes to Financial Statements
12
Babson Capital Funds Trust 2014 Semi-Annual Report
For the Six Months Ended December 31, 2014 (Unaudited)
| BABSON GLOBAL FLOATING RATE FUND | BABSON GLOBAL CREDIT INCOME OPPORTUNITIES FUND | |||||||
| Investment Income | ||||||||
Interest income | $ | 3,161,016 | $ | 2,472,189 | ||||
Other income | 7,434 | 122 | ||||||
|
|
|
| |||||
Total investment income | 3,168,450 | 2,472,311 | ||||||
|
|
|
| |||||
| Operating Expenses | ||||||||
Advisory fees | 374,691 | 294,648 | ||||||
12b-1 distribution and servicing plan | ||||||||
Class A | 17,882 | 19,152 | ||||||
Class C | 14,652 | 7,618 | ||||||
Administrator fees | 85,807 | 53,870 | ||||||
Custody fees | 73,718 | 48,826 | ||||||
Transfer agent fees | 61,177 | 55,776 | ||||||
Professional fees | 52,308 | 52,308 | ||||||
Directors’ fees | 43,231 | 36,886 | ||||||
Registration fees | 26,143 | 31,980 | ||||||
Printing and mailing expenses | 7,561 | 7,561 | ||||||
Other operating expenses | 11,565 | 8,986 | ||||||
|
|
|
| |||||
Total operating expenses | 768,735 | 617,611 | ||||||
Reimbursement of expenses | ||||||||
Class A | (41,029 | ) | (45,995 | ) | ||||
Class C | (19,658 | ) | (16,988 | ) | ||||
Class I | (83,025 | ) | (67,375 | ) | ||||
Class Y | (155,857 | ) | (87,285 | ) | ||||
|
|
|
| |||||
Net operating expenses | 469,166 | 399,968 | ||||||
|
|
|
| |||||
Net investment income | 2,699,284 | 2,072,343 | ||||||
|
|
|
| |||||
Realized and Unrealized Gains (Losses) on Investments | ||||||||
Net realized loss on investments | (1,149,053 | ) | (1,886,682 | ) | ||||
Net realized gain on forward foreign currency exchange contracts | 3,393,193 | 2,360,073 | ||||||
Net realized loss on foreign currency and translation | (181,345 | ) | (47,365 | ) | ||||
|
|
|
| |||||
Net realized gain | 2,062,795 | 426,026 | ||||||
|
|
|
| |||||
Net change in unrealized depreciation on investments | (7,323,296 | ) | (6,276,978 | ) | ||||
Net change in unrealized appreciation on forward foreign currency exchange contracts | 650,794 | 473,480 | ||||||
Net change in unrealized appreciation (depreciation) on foreign currency and translation | (35,755 | ) | 86,084 | |||||
|
|
|
| |||||
Net change in unrealized depreciation | (6,708,257 | ) | (5,717,414 | ) | ||||
|
|
|
| |||||
Net realized and unrealized losses on investments | (4,645,462 | ) | (5,291,388 | ) | ||||
|
|
|
| |||||
Net decrease in net assets resulting from operations | $ | (1,946,178 | ) | $ | (3,219,045 | ) | ||
|
|
|
| |||||
See accompanying Notes to Financial Statements
13
Babson Capital Funds Trust 2014 Semi-Annual Report
STATEMENTS OF CHANGES IN NET ASSETS
(Unaudited)
| BABSON GLOBAL FLOATING RATE FUND | BABSON GLOBAL CREDIT INCOME OPPORTUNITIES FUND | |||||||||||||||
| FOR THE SIX MONTHS ENDED DECEMBER 31, 2014 | PERIOD FROM THROUGH JUNE 30, 2014 (1) | FOR THE SIX MONTHS ENDED DECEMBER 31, 2014 | PERIOD FROM THROUGH JUNE 30, 2014 (1) | |||||||||||||
| Operations | ||||||||||||||||
Net investment income | $ | 2,699,284 | $ | 2,203,083 | $ | 2,072,343 | $ | 2,096,689 | ||||||||
Net realized gain (loss) on investments | 2,062,795 | (139,670 | ) | 426,026 | 541,842 | |||||||||||
Net change in unrealized appreciation (depreciation) on investments | (6,708,257 | ) | 716,035 | (5,717,414 | ) | 1,182,457 | ||||||||||
|
|
|
|
|
|
|
| |||||||||
Net increase (decrease) in net assets from operations | (1,946,178 | ) | 2,779,448 | (3,219,045 | ) | 3,820,988 | ||||||||||
|
|
|
|
|
|
|
| |||||||||
| Dividends to Common Shareholders | ||||||||||||||||
Net investment income | ||||||||||||||||
Class A | (654,235 | ) | (140,982 | ) | (747,936 | ) | (36,805 | ) | ||||||||
|
|
|
|
|
|
|
| |||||||||
Class C | (136,243 | ) | (26,146 | ) | (82,094 | ) | (10,571 | ) | ||||||||
|
|
|
|
|
|
|
| |||||||||
Class I | (1,579,522 | ) | (610,026 | ) | (1,331,688 | ) | (734,939 | ) | ||||||||
|
|
|
|
|
|
|
| |||||||||
Class Y | (2,970,947 | ) | (1,014,718 | ) | (1,720,410 | ) | (790,102 | ) | ||||||||
|
|
|
|
|
|
|
| |||||||||
Net realized gain | ||||||||||||||||
Class A | (11,345 | ) | – | (186,020 | ) | – | ||||||||||
|
|
|
|
|
|
|
| |||||||||
Class C | (2,779 | ) | – | (25,870 | ) | – | ||||||||||
|
|
|
|
|
|
|
| |||||||||
Class I | (27,574 | ) | – | (340,131 | ) | – | ||||||||||
|
|
|
|
|
|
|
| |||||||||
Class Y | (49,009 | ) | – | (416,997 | ) | – | ||||||||||
|
|
|
|
|
|
|
| |||||||||
Total dividends to common shareholders | (5,431,654 | ) | (1,791,872 | ) | (4,851,146 | ) | (1,572,417 | ) | ||||||||
|
|
|
|
|
|
|
| |||||||||
| Capital Share Transactions | ||||||||||||||||
Net proceeds from sale of shares | 14,043,760 | 114,172,093 | 27,620,296 | 60,160,874 | ||||||||||||
Net Asset Value of shares issued to shareholders in payment of distributions declared | 5,330,028 | 1,770,684 | 4,725,649 | 1,559,384 | ||||||||||||
Cost of shares redeemed | (20,589,217 | ) | (2,298,911 | ) | (15,864,748 | ) | (143,371 | ) | ||||||||
Redemption fees | 1,569 | – | 5,037 | – | ||||||||||||
|
|
|
|
|
|
|
| |||||||||
Net increase (decrease) in net assets resulting from capital stock transactions | (1,213,860 | ) | 113,643,866 | 16,486,234 | 61,576,887 | |||||||||||
|
|
|
|
|
|
|
| |||||||||
Total increase (decrease) in net assets | (8,591,692 | ) | 114,631,442 | 8,416,043 | 63,825,458 | |||||||||||
|
|
|
|
|
|
|
| |||||||||
| Net Assets | ||||||||||||||||
Beginning of period | 114,631,442 | – | 63,825,458 | – | ||||||||||||
|
|
|
|
|
|
|
| |||||||||
End of period (includes undistributed net investment income of $2,307,494, $334,169, $1,593,320 and $216,465, respectively) | $ | 106,039,750 | $ | 114,631,442 | $ | 72,241,501 | $ | 63,825,458 | ||||||||
|
|
|
|
|
|
|
| |||||||||
| (1) | Fund commenced operations on September 16, 2013. |
See accompanying Notes to Financial Statements
14
Babson Global Floating Rate Fund 2014 Semi-Annual Report
| CLASS A | ||||||||
FOR THE SIX MONTHS ENDED DECEMBER 31, 2014 (1) | PERIOD FROM SEPTEMBER 16, 2013 THROUGH JUNE 30, 2014 (2) | |||||||
| Per Common Share Data | ||||||||
Net asset value, beginning of period | $ | 10.20 | $ | 10.00 | ||||
Income from investment operations: | ||||||||
Net investment income (3) | 0.22 | 0.30 | ||||||
Net realized and unrealized gain (loss) on investments | (0.40 | ) | 0.08 | |||||
|
|
|
| |||||
Total increase (decrease) from investment operations | (0.18 | ) | 0.38 | |||||
|
|
|
| |||||
Less dividends and distributions: | ||||||||
From net investment income | (0.47 | ) | (0.18 | ) | ||||
From net realized gain | (0.01 | ) | – | |||||
|
|
|
| |||||
Total dividends and distributions | (0.48 | ) | (0.18 | ) | ||||
|
|
|
| |||||
Redemption fees | 0.00 | (4) | 0.00 | |||||
|
|
|
| |||||
Net asset value, at end of period | $ | 9.54 | $ | 10.20 | ||||
|
|
|
| |||||
Total investment return (5)(6) | (1.80 | )% | 3.81 | % | ||||
|
|
|
| |||||
| Supplemental Data and Ratios | ||||||||
Net assets, end of period (000’s) | $ | 13,381 | $ | 12,464 | ||||
Ratio of total expenses (before reductions and reimbursements) to average net assets (7)(8) | 1.62 | % | 2.27 | % | ||||
Ratio of net expenses to average net assets (7) | 1.05 | % | 1.05 | % | ||||
Ratio of net investment income to average net assets (7) | 4.45 | % | 3.76 | % | ||||
Portfolio turnover rate (6) | 30.40 | % | 49.51 | % | ||||
| (1) | Unaudited. |
| (2) | Fund commenced operations on September 16, 2013. |
| (3) | Calculated using average shares outstanding. |
| (4) | Amount rounds to less than $.01 per share. |
| (5) | Total investment return calculation does not consider the effects of sales loads and assumes the reinvestment of dividends at actual prices pursuant to the Fund’s dividend reinvestment plan. |
| (6) | Not annualized. |
| (7) | Annualized for periods less than one full year. |
| (8) | The Adviser has agreed to waive and/or reimburse fees and/or expense so that, on an annualized basis, such expenses incurred will not exceed 1.05% as a percentage of average daily net assets. |
See accompanying Notes to Financial Statements
15
Babson Global Floating Rate Fund 2014 Semi-Annual Report
FINANCIAL HIGHLIGHTS (CONTINUED)
| CLASS C | ||||||||
FOR THE SIX MONTHS ENDED DECEMBER 31, 2014 (1) | PERIOD FROM SEPTEMBER 16, 2013 THROUGH | |||||||
| Per Common Share Data | ||||||||
Net asset value, beginning of period | $ | 10.16 | $ | 10.00 | ||||
Income from investment operations: | ||||||||
Net investment income(3) | 0.19 | 0.24 | ||||||
Net realized and unrealized gain (loss) on investments | (0.41 | ) | 0.07 | |||||
|
|
|
| |||||
Total increase (decrease) from investment operations | (0.22 | ) | 0.31 | |||||
|
|
|
| |||||
Less dividends and distributions: | ||||||||
From net investment income | (0.43 | ) | (0.15 | ) | ||||
From net realized gain | (0.01 | ) | – | |||||
|
|
|
| |||||
Total dividends and distributions | (0.44 | ) | (0.15 | ) | ||||
|
|
|
| |||||
Redemption fees | 0.00 | (4) | 0.00 | |||||
|
|
|
| |||||
Net asset value, at end of period | $ | 9.50 | $ | 10.16 | ||||
|
|
|
| |||||
Total investment return (5)(6) | (2.17 | )% | 3.15 | % | ||||
|
|
|
| |||||
| Supplemental Data and Ratios | ||||||||
Net assets, end of period (000’s) | $ | 3,261 | $ | 2,396 | ||||
Ratio of total expenses (before reductions and reimbursements) to average net assets (7)(8) | 3.14 | % | 4.97 | % | ||||
Ratio of net expenses to average net assets (7) | 1.80 | % | 1.80 | % | ||||
Ratio of net investment income to average net assets (7) | 3.71 | % | 3.07 | % | ||||
Portfolio turnover rate (6) | 30.40 | % | 49.51 | % | ||||
| (1) | Unaudited. |
| (2) | Fund commenced operations on September 16, 2013. |
| (3) | Calculated using average shares outstanding. |
| (4) | Amount rounds to less than $.01 per share. |
| (5) | Total investment return calculation does not consider the effects of sales loads and assumes the reinvestment of dividends at actual prices pursuant to the Fund’s dividend reinvestment plan. |
| (6) | Not annualized. |
| (7) | Annualized for periods less than one full year. |
| (8) | The Adviser has agreed to waive and/or reimburse fees and/or expense so that, on an annualized basis, such expenses incurred will not exceed 1.80% as a percentage of average daily net assets. |
See accompanying Notes to Financial Statements
16
Babson Global Floating Rate Fund 2014 Semi-Annual Report
FINANCIAL HIGHLIGHTS (CONTINUED)
| CLASS I | ||||||||
FOR THE SIX MONTHS ENDED | PERIOD FROM JUNE 30, 2014 (2) | |||||||
| Per Common Share Data | ||||||||
Net asset value, beginning of period | $ | 10.21 | $ | 10.00 | ||||
Income from investment operations: | ||||||||
Net investment income (3) | 0.24 | 0.30 | ||||||
Net realized and unrealized gain (loss) on investments | (0.41 | ) | 0.10 | |||||
|
|
|
| |||||
Total increase (decrease) from investment operations | (0.17 | ) | 0.40 | |||||
|
|
|
| |||||
Less dividends and distributions: | ||||||||
From net investment income | (0.48 | ) | (0.19 | ) | ||||
From net realized gain | (0.01 | ) | – | |||||
|
|
|
| |||||
Total dividends and distributions | (0.49 | ) | (0.19 | ) | ||||
|
|
|
| |||||
Redemption fees | 0.00 | (4) | 0.00 | |||||
|
|
|
| |||||
Net asset value, at end of period | $ | 9.55 | $ | 10.21 | ||||
|
|
|
| |||||
Total investment return (5)(6) | (1.67 | )% | 4.04 | % | ||||
|
|
|
| |||||
| Supplemental Data and Ratios | ||||||||
Net assets, end of period (000’s) | $ | 32,230 | $ | 32,772 | ||||
Ratio of total expenses (before reductions and reimbursements) to average net assets (7)(8) | 1.25 | % | 1.52 | % | ||||
Ratio of net expenses to average net assets (7) | 0.75 | % | 0.75 | % | ||||
Ratio of net investment income to average net assets (7) | 4.75 | % | 3.72 | % | ||||
Portfolio turnover rate (6) | 30.40 | % | 49.51 | % | ||||
| (1) | Unaudited. |
| (2) | Fund commenced operations on September 16, 2013. |
| (3) | Calculated using average shares outstanding. |
| (4) | Amount rounds to less than $.01 per share. |
| (5) | Total investment return calculation assumes the reinvestment of dividends at actual prices pursuant to the Fund’s dividend reinvestment plan. |
| (6) | Not annualized. |
| (7) | Annualized for periods less than one full year. |
| (8) | The Adviser has agreed to waive and/or reimburse fees and/or expense so that, on an annualized basis, such expenses incurred will not exceed .75% as a percentage of average daily net assets. |
See accompanying Notes to Financial Statements
17
Babson Global Floating Rate Fund 2014 Semi-Annual Report
FINANCIAL HIGHLIGHTS (CONTINUED)
| CLASS Y | ||||||||
| FOR THE SIX MONTHS ENDED DECEMBER 31, 2014 (1) | PERIOD FROM SEPTEMBER 16, 2013 THROUGH JUNE 30, 2014 (2) | |||||||
| Per Common Share Data | ||||||||
Net asset value, beginning of period | $ | 10.21 | $ | 10.00 | ||||
Income from investment operations: | ||||||||
Net investment income (3) | 0.24 | 0.30 | ||||||
Net realized and unrealized gain (loss) on investments | (0.41 | ) | 0.10 | |||||
|
|
|
| |||||
Total increase (decrease) from investment operations | (0.17 | ) | 0.40 | |||||
|
|
|
| |||||
Less dividends and distributions: | ||||||||
From net investment income | (0.48 | ) | (0.19 | ) | ||||
From net realized gain | (0.01 | ) | – | |||||
|
|
|
| |||||
Total dividends and distributions | (0.49 | ) | (0.19 | ) | ||||
|
|
|
| |||||
Redemption fees | 0.00 | (4) | 0.00 | |||||
|
|
|
| |||||
Net asset value, at end of period | $ | 9.55 | $ | 10.21 | ||||
|
|
|
| |||||
Total investment return (5)(6) | (1.67 | )% | 4.04 | % | ||||
|
|
|
| |||||
| Supplemental Data and Ratios | ||||||||
Net assets, end of period (000’s) | $ | 57,168 | $ | 66,999 | ||||
Ratio of total expenses (before reductions and reimbursements) to average net assets (7)(8) | 1.23 | % | 1.53 | % | ||||
Ratio of net expenses to average net assets (7) | 0.75 | % | 0.75 | % | ||||
Ratio of net investment income to average net assets (7) | 4.74 | % | 3.80 | % | ||||
Portfolio turnover rate (6) | 30.40 | % | 49.51 | % | ||||
| (1) | Unaudited. |
| (2) | Fund commenced operations on September 16, 2013. |
| (3) | Calculated using average shares outstanding. |
| (4) | Amount rounds to less than $.01 per share. |
| (5) | Total investment return calculation assumes the reinvestment of dividends at actual prices pursuant to the Fund’s dividend reinvestment plan. |
| (6) | Not annualized. |
| (7) | Annualized for periods less than one full year. |
| (8) | The Adviser has agreed to waive and/or reimburse fees and/or expense so that, on an annualized basis, such expenses incurred will not exceed .75% as a percentage of average daily net assets. |
See accompanying Notes to Financial Statements
18
Babson Global Credit Income Opportunities Fund 2014 Semi-Annual Report
FINANCIAL HIGHLIGHTS (CONTINUED)
| CLASS A | ||||||||
| FOR THE SIX MONTHS ENDED DECEMBER 31, 2014 (1) | PERIOD FROM JUNE 30, 2014 (2) | |||||||
| Per Common Share Data | ||||||||
Net asset value, beginning of period | $ | 10.45 | $ | 10.00 | ||||
Income from investment operations: | ||||||||
Net investment income (3) | 0.26 | 0.40 | ||||||
Net realized and unrealized gain (loss) on investments | (0.66 | ) | 0.33 | |||||
|
|
|
| |||||
Total increase (decrease) from investment operations | (0.40 | ) | 0.73 | |||||
|
|
|
| |||||
Less dividends and distributions: | ||||||||
From net investment income | (0.51 | ) | (0.28 | ) | ||||
From net realized gain | (0.13 | ) | – | |||||
|
|
|
| |||||
Total dividends and distributions | (0.64 | ) | (0.28 | ) | ||||
|
|
|
| |||||
Redemption fees | 0.00 | (4) | 0.00 | |||||
|
|
|
| |||||
Net asset value, at end of period | $ | 9.41 | $ | 10.45 | ||||
|
|
|
| |||||
Total investment return (5)(6) | (3.94 | )% | 7.30 | % | ||||
|
|
|
| |||||
| Supplemental Data and Ratios | ||||||||
Net assets, end of period (000’s) | $ | 14,019 | $ | 2,591 | ||||
Ratio of total expenses (before reductions and reimbursements) to average net assets (7)(8) | 1.80 | % | 3.95 | % | ||||
Ratio of net expenses to average net assets (7) | 1.20 | % | 1.20 | % | ||||
Ratio of net investment income to average net assets (7) | 5.18 | % | 4.88 | % | ||||
Portfolio turnover rate (6) | 49.16 | % | 99.72 | % | ||||
| (1) | Unaudited. |
| (2) | Fund commenced operations on September 16, 2013. |
| (3) | Calculated using average shares outstanding. |
| (4) | Amount rounds to less than $.01 per share. |
| (5) | Total investment return calculation does not consider the effects of sales loads and assumes the reinvestment of dividends at actual prices pursuant to the Fund’s dividend reinvestment plan. |
| (6) | Not annualized. |
| (7) | Annualized for periods less than one full year. |
| (8) | The Adviser has agreed to waive and/or reimburse fees and/or expense so that, on an annualized basis, such expenses incurred will not exceed 1.20% as a percentage of average daily net assets. |
See accompanying Notes to Financial Statements
19
Babson Global Credit Income Opportunities Fund 2014 Semi-Annual Report
FINANCIAL HIGHLIGHTS (CONTINUED)
| CLASS C | ||||||||
| FOR THE SIX MONTHS ENDED DECEMBER 31, 2014 (1) | PERIOD FROM SEPTEMBER 16, 2013 THROUGH JUNE 30, 2014 (2) | |||||||
| Per Common Share Data | ||||||||
Net asset value, beginning of period | $ | 10.45 | $ | 10.00 | ||||
Income from investment operations: | ||||||||
Net investment income (3) | 0.23 | 0.35 | ||||||
Net realized and unrealized gain (loss) on investments | (0.68 | ) | 0.32 | |||||
|
|
|
| |||||
Total increase (decrease) from investment operations | (0.45 | ) | 0.67 | |||||
|
|
|
| |||||
Less dividends and distributions: | ||||||||
From net investment income | (0.47 | ) | (0.22 | ) | ||||
From net realized gain | (0.13 | ) | – | |||||
|
|
|
| |||||
Total dividends and distributions | (0.60 | ) | (0.22 | ) | ||||
|
|
|
| |||||
Redemption fees | 0.00 | (4) | 0.00 | |||||
|
|
|
| |||||
Net asset value, at end of period | $ | 9.40 | $ | 10.45 | ||||
|
|
|
| |||||
Total investment return (5)(6) | (4.38 | )% | 6.75 | % | ||||
|
|
|
| |||||
| Supplemental Data and Ratios | ||||||||
Net assets, end of period (000’s) | $ | 1,896 | $ | 944 | ||||
Ratio of total expenses (before reductions and reimbursements) to average net assets (7)(8) | 4.18 | % | 10.50 | % | ||||
Ratio of net expenses to average net assets (7) | 1.95 | % | 1.95 | % | ||||
Ratio of net investment income to average net assets (7) | 4.49 | % | 4.39 | % | ||||
Portfolio turnover rate (6) | 49.16 | % | 99.72 | % | ||||
| (1) | Unaudited. |
| (2) | Fund commenced operations on September 16, 2013. |
| (3) | Calculated using average shares outstanding. |
| (4) | Amount rounds to less than $.01 per share. |
| (5) | Total investment return calculation does not consider the effects of sales loads and assumes the reinvestment of dividends at actual prices pursuant to the Fund’s dividend reinvestment plan. |
| (6) | Not annualized. |
| (7) | Annualized for periods less than one full year. |
| (8) | The Adviser has agreed to waive and/or reimburse fees and/or expense so that, on an annualized basis, such expenses incurred will not exceed 1.95% as a percentage of average daily net assets. |
See accompanying Notes to Financial Statements
20
Babson Global Credit Income Opportunities Fund 2014 Semi-Annual Report
FINANCIAL HIGHLIGHTS (CONTINUED)
| CLASS I | ||||||||
| FOR THE SIX MONTHS ENDED DECEMBER 31, 2014 (1) | PERIOD FROM SEPTEMBER 16, 2013 THROUGH JUNE 30, 2014 (2) | |||||||
| Per Common Share Data | ||||||||
Net asset value, beginning of period | $ | 10.46 | $ | 10.00 | ||||
Income from investment operations: | ||||||||
Net investment income (3) | 0.27 | 0.41 | ||||||
Net realized and unrealized gain (loss) on investments | (0.68 | ) | 0.35 | |||||
|
|
|
| |||||
Total increase (decrease) from investment operations | (0.41 | ) | 0.76 | |||||
|
|
|
| |||||
Less dividends and distributions: | ||||||||
From net investment income | (0.52 | ) | (0.30 | ) | ||||
From net realized gain | (0.13 | ) | – | |||||
|
|
|
| |||||
Total dividends and distributions | (0.65 | ) | (0.30 | ) | ||||
|
|
|
| |||||
Redemption fees | 0.00 | (4) | 0.00 | |||||
|
|
|
| |||||
Net asset value, at end of period | $ | 9.40 | $ | 10.46 | ||||
|
|
|
| |||||
Total investment return (5)(6) | (3.91 | )% | 7.59 | % | ||||
|
|
|
| |||||
| Supplemental Data and Ratios | ||||||||
Net assets, end of period (000’s) | $ | 25,365 | $ | 26,406 | ||||
Ratio of total expenses (before reductions and reimbursements) to average net assets (7)(8) | 1.46 | % | 1.83 | % | ||||
Ratio of net expenses to average net assets (7) | 0.95 | % | 0.95 | % | ||||
Ratio of net investment income to average net assets (7) | 5.33 | % | 5.02 | % | ||||
Portfolio turnover rate (6) | 49.16 | % | 99.72 | % | ||||
| (1) | Unaudited. |
| (2) | Fund commenced operations on September 16, 2013. |
| (3) | Calculated using average shares outstanding. |
| (4) | Amount rounds to less than $.01 per share. |
| (5) | Total investment return calculation assumes the reinvestment of dividends at actual prices pursuant to the Fund’s dividend reinvestment plan. |
| (6) | Not annualized. |
| (7) | Annualized for periods less than one full year. |
| (8) | The Adviser has agreed to waive and/or reimburse fees and/or expense so that, on an annualized basis, such expenses incurred will not exceed .95% as a percentage of average daily net assets. |
See accompanying Notes to Financial Statements
21
Babson Global Credit Income Opportunities Fund 2014 Semi-Annual Report
FINANCIAL HIGHLIGHTS (CONTINUED)
| CLASS Y | ||||||||
| FOR THE SIX MONTHS ENDED DECEMBER 31, 2014 (1) | PERIOD FROM JUNE 30, 2014 (2) | |||||||
| Per Common Share Data | ||||||||
Net asset value, beginning of period | $ | 10.46 | $ | 10.00 | ||||
Income from investment operations: | ||||||||
Net investment income (3) | 0.27 | 0.41 | ||||||
Net realized and unrealized gain (loss) on investments | (0.68 | ) | 0.35 | |||||
|
|
|
| |||||
Total increase (decrease) from investment operations | (0.41 | ) | 0.76 | |||||
|
|
|
| |||||
Less dividends and distributions: | ||||||||
From net investment income | (0.52 | ) | (0.30 | ) | ||||
From net realized gain | (0.13 | ) | – | |||||
|
|
|
| |||||
Total dividends and distributions | (0.65 | ) | (0.30 | ) | ||||
|
|
|
| |||||
Redemption fees | 0.00 | (4) | 0.00 | |||||
|
|
|
| |||||
Net asset value, at end of period | $ | 9.40 | $ | 10.46 | ||||
|
|
|
| |||||
Total investment return (5)(6) | (3.91 | )% | 7.59 | % | ||||
|
|
|
| |||||
| Supplemental Data and Ratios | ||||||||
Net assets, end of period (000’s) | $ | 30,961 | $ | 33,885 | ||||
Ratio of total expenses (before reductions and reimbursements) to average net assets (7)(8) | 1.44 | % | 1.84 | % | ||||
Ratio of net expenses to average net assets (7) | 0.95 | % | 0.95 | % | ||||
Ratio of net investment income to average net assets (7) | 5.31 | % | 5.04 | % | ||||
Portfolio turnover rate (6) | 49.16 | % | 99.72 | % | ||||
| (1) | Unaudited. |
| (2) | Fund commenced operations on September 16, 2013. |
| (3) | Calculated using average shares outstanding. |
| (4) | Amount rounds to less than $.01 per share. |
| (5) | Total investment return calculation assumes the reinvestment of dividends at actual prices pursuant to the Fund’s dividend reinvestment plan. |
| (6) | Not annualized. |
| (7) | Annualized for periods less than one full year. |
| (8) | The Adviser has agreed to waive and/or reimburse fees and/or expense so that, on an annualized basis, such expenses incurred will not exceed .95% as a percentage of average daily net assets. |
See accompanying Notes to Financial Statements
22
Babson Global Floating Rate Fund 2014 Semi-Annual Report
SCHEDULE OF INVESTMENTS (UNAUDITED)
December 31, 2014
| EFFECTIVE INTEREST RATE ‡ | DUE DATE | PRINCIPAL ‡‡ | COST | FAIR VALUE | ||||||||||||||||
Fixed Income — 87.2%*: |
| |||||||||||||||||||
Bank Loans — 78.0%*§: |
| |||||||||||||||||||
Aerospace and Defense — 1.1%*: |
| |||||||||||||||||||
TransDigm Group, Inc. | 3.75 | % | 2/28/2020 | 493,703 | $ | 491,698 | $ | 484,179 | ||||||||||||
TransDigm Group, Inc. | 3.75 | 6/4/2021 | 657,279 | 650,780 | 644,680 | |||||||||||||||
|
|
|
|
|
| |||||||||||||||
Total Aerospace and Defense | 1,150,982 | 1,142,478 | 1,128,859 | |||||||||||||||||
|
|
|
|
|
| |||||||||||||||
Automobile — 1.5%*: |
| |||||||||||||||||||
RAC Finance (Holdings) Ltd.+ | 5.01 | 11/3/2021 | 500,000 | 786,892 | 774,344 | |||||||||||||||
RAC Finance (Holdings) Ltd.+ | 8.25 | 11/3/2022 | 500,000 | 790,886 | 780,275 | |||||||||||||||
|
|
|
|
|
| |||||||||||||||
Total Automobile | 1,000,000 | 1,577,778 | 1,554,619 | |||||||||||||||||
|
|
|
|
|
| |||||||||||||||
Beverage, Food and Tobacco — 2.2%*: |
| |||||||||||||||||||
CEC Entertainment Concepts LP | 4.00 | 2/14/2021 | 747,391 | 743,970 | 724,348 | |||||||||||||||
Del Monte Foods, Inc. | 4.25 | 2/18/2021 | 248,125 | 247,036 | 225,588 | |||||||||||||||
Deoleo S.A.+ | 4.50 | 5/12/2021 | 500,000 | 676,759 | 560,907 | |||||||||||||||
JBS USA Holdings, Inc. | 3.75 | 9/18/2020 | 493,750 | 494,785 | 482,023 | |||||||||||||||
Telepizza SA+ | 7.00 | 9/30/2020 | 250,000 | 314,743 | 298,429 | |||||||||||||||
|
|
|
|
|
| |||||||||||||||
Total Beverage, Food and Tobacco | 2,239,266 | 2,477,293 | 2,291,295 | |||||||||||||||||
|
|
|
|
|
| |||||||||||||||
Broadcasting and Entertainment — 5.8%*: |
| |||||||||||||||||||
All3Media International+ | 5.25 | 6/30/2021 | 500,000 | 833,781 | 766,512 | |||||||||||||||
All3Media International+ | 8.25 | 6/30/2022 | 500,000 | 670,960 | 596,204 | |||||||||||||||
Charter Communications Operating LLC | 3.00 | 1/3/2021 | 494,975 | 493,896 | 484,561 | |||||||||||||||
Cumulus Media Holdings, Inc. | 4.25 | 12/23/2020 | 352,647 | 349,624 | 341,479 | |||||||||||||||
Learfield Communications, Inc. | 4.50 | 10/9/2020 | 415,413 | 414,952 | 412,297 | |||||||||||||||
Telecommunications Management LLC | 4.75 | 4/30/2020 | 41,240 | 41,240 | 40,621 | |||||||||||||||
Tyrol Acquisitions 2 SAS+ | 3.26 | 1/29/2016 | 2,180,613 | 2,882,912 | 2,599,362 | |||||||||||||||
Univision Communications, Inc. | 4.00 | 3/1/2020 | 988,599 | 985,893 | 964,873 | |||||||||||||||
|
|
|
|
|
| |||||||||||||||
Total Broadcasting and Entertainment | 5,473,487 | 6,673,258 | 6,205,909 | |||||||||||||||||
|
|
|
|
|
| |||||||||||||||
Buildings and Real Estate — 1.7%*: |
| |||||||||||||||||||
Alison Bidco Sarl+ | 5.50 | 8/29/2021 | 296,514 | 293,680 | 289,842 | |||||||||||||||
DTZ US Borrower LLC | 5.50 | 11/4/2021 | 316,915 | 312,162 | 315,331 | |||||||||||||||
Jeld-Wen, Inc. | 5.25 | 10/15/2021 | 510,033 | 505,070 | 504,295 | |||||||||||||||
Quikrete Holdings, Inc. | 4.00 | 9/28/2020 | 660,317 | 657,591 | 650,082 | |||||||||||||||
|
|
|
|
|
| |||||||||||||||
Total Buildings and Real Estate | 1,783,779 | 1,768,503 | 1,759,550 | |||||||||||||||||
|
|
|
|
|
| |||||||||||||||
Cargo Transport — 1.0%*: |
| |||||||||||||||||||
Direct ChassisLink, Inc.¤ | 8.25 | 11/12/2019 | 495,238 | 489,150 | 480,381 | |||||||||||||||
Direct ChassisLink, Inc. (Add-On Facility)¤ | 8.25 | 11/12/2019 | 505,716 | 505,716 | 490,544 | |||||||||||||||
Mirror Bidco Corp. | 4.25 | 12/28/2019 | 62,549 | 62,282 | 61,767 | |||||||||||||||
|
|
|
|
|
| |||||||||||||||
Total Cargo Transport | 1,063,503 | 1,057,148 | 1,032,692 | |||||||||||||||||
|
|
|
|
|
| |||||||||||||||
Chemicals, Plastics and Rubber — 3.5%*: |
| |||||||||||||||||||
Chromaflo Technologies Corp. | 4.50 | 12/2/2019 | 620,142 | 621,076 | 610,839 | |||||||||||||||
Colouroz Investment 1 GmbH+ | 4.75 | 9/7/2021 | 644,876 | 638,640 | 624,724 | |||||||||||||||
See accompanying Notes to Financial Statements
23
Babson Global Floating Rate Fund 2014 Semi-Annual Report
SCHEDULE OF INVESTMENTS (UNAUDITED) (CONTINUED)
December 31, 2014
| EFFECTIVE INTEREST RATE ‡ | DUE DATE | PRINCIPAL ‡‡ | COST | FAIR VALUE | ||||||||||||||||
Bank Loans (Continued) |
| |||||||||||||||||||
Chemicals, Plastics and Rubber (Continued) | ||||||||||||||||||||
Emerald Performance Materials LLC | 4.50 | % | 8/1/2021 | 116,858 | $ | 116,306 | $ | 113,937 | ||||||||||||
Ferro Corp. | 4.00 | 7/31/2021 | 149,506 | 148,795 | 146,889 | |||||||||||||||
MacDermid, Inc. | 4.00 | 6/7/2020 | 69,098 | 68,762 | 67,630 | |||||||||||||||
Styrolution Group GmbH+ | 6.50 | 11/7/2019 | 600,000 | 736,170 | 706,580 | |||||||||||||||
Univar, Inc. | 5.00 | 6/30/2017 | 989,709 | 988,242 | 955,752 | |||||||||||||||
Vantage Specialties, Inc. | 5.00 | 2/10/2019 | 493,678 | 492,696 | 483,804 | |||||||||||||||
|
|
|
|
|
| |||||||||||||||
Total Chemicals, Plastics and Rubber | 3,683,867 | 3,810,687 | 3,710,155 | |||||||||||||||||
|
|
|
|
|
| |||||||||||||||
Containers, Packaging and Glass — 4.6%*: |
| |||||||||||||||||||
BWAY Holding Co., Inc. | 5.50 | 8/14/2020 | 233,410 | 231,214 | 232,243 | |||||||||||||||
CD&R Millennium Holdco 6 Sarl+ | 4.50 | 7/31/2021 | 377,216 | 377,283 | 369,358 | |||||||||||||||
Chesapeake Corp. | 5.50 | 9/30/2020 | 493,750 | 787,511 | 767,497 | |||||||||||||||
Chesapeake Corp. | 4.25 | 9/30/2020 | 1,143,993 | 1,143,574 | 1,118,253 | |||||||||||||||
Consolidated Container Co. LLC | 7.75 | 1/3/2020 | 188,280 | 184,860 | 179,337 | |||||||||||||||
Coveris | 5.25 | 5/8/2019 | 384,759 | 383,218 | 383,078 | |||||||||||||||
Coveris | 5.75 | 5/8/2019 | 495,000 | 680,345 | 596,231 | |||||||||||||||
Hilex Poly Co. LLC | 6.00 | 12/5/2021 | 405,858 | 401,799 | 399,518 | |||||||||||||||
Libbey Glass, Inc. | 3.75 | 4/9/2021 | 873,077 | 871,076 | 858,349 | |||||||||||||||
|
|
|
|
|
| |||||||||||||||
Total Containers, Packaging and Glass | 4,595,343 | 5,060,880 | 4,903,864 | |||||||||||||||||
|
|
|
|
|
| |||||||||||||||
Diversified/Conglomerate Manufacturing — 1.8%*: |
| |||||||||||||||||||
Applied Systems, Inc. | 4.25 | 1/25/2021 | 67,147 | 67,001 | 65,931 | |||||||||||||||
Capital Safety North America Holdings, Inc. | 3.75 | 3/29/2021 | 346,166 | 345,774 | 334,915 | |||||||||||||||
Capital Safety North America Holdings, Inc. | 6.50 | 3/28/2022 | 251,661 | 251,373 | 237,820 | |||||||||||||||
Information Resources, Inc. | 4.75 | 9/30/2020 | 157,444 | 156,792 | 156,657 | |||||||||||||||
Quality Home Brands Holdings LLC | 7.75 | 5/25/2018 | 261,695 | 259,657 | 257,552 | |||||||||||||||
STS Operating, Inc. | 4.75 | 2/12/2021 | 314,516 | 313,702 | 308,225 | |||||||||||||||
West Corp. | 2.51 | 7/1/2019 | 514,474 | 496,428 | 502,898 | |||||||||||||||
|
|
|
|
|
| |||||||||||||||
Total Diversified/Conglomerate Manufacturing | 1,913,103 | 1,890,727 | 1,863,998 | |||||||||||||||||
|
|
|
|
|
| |||||||||||||||
Diversified/Conglomerate Service — 7.8%*: | ||||||||||||||||||||
Aquilex Holdings LLC | 5.00 | 12/31/2020 | 198,141 | 197,712 | 193,187 | |||||||||||||||
Atrium Innovations, Inc.+ | 4.25 | 2/13/2021 | 831,929 | 830,511 | 801,772 | |||||||||||||||
Brickman Group Ltd. LLC | 7.50 | 12/17/2021 | 82,406 | 82,042 | 80,603 | |||||||||||||||
EIG Investors Corp. | 5.00 | 11/9/2019 | 595,502 | 597,684 | 591,035 | |||||||||||||||
Garda World Security Corp.+ | 4.00 | 11/6/2020 | 172,618 | 171,893 | 168,086 | |||||||||||||||
Go Daddy Operating Company LLC | 4.75 | 5/13/2021 | 366,782 | 365,104 | 363,496 | |||||||||||||||
Internet Brands, Inc. | 8.50 | 7/8/2022 | 400,000 | 396,229 | 387,000 | |||||||||||||||
MH Sub I LLC | 5.00 | 7/8/2021 | 141,056 | 139,785 | 138,705 | |||||||||||||||
MPH Acquisition Holdings LLC | 3.75 | 3/31/2021 | 810,057 | 808,216 | 786,160 | |||||||||||||||
Northgate Information Solutions Ltd.+ | 5.26 | 3/6/2018 | 502,538 | 672,798 | 583,772 | |||||||||||||||
Northgate Information Solutions Ltd.+ | 5.26 | 3/7/2018 | 505,082 | 676,145 | 586,728 | |||||||||||||||
Power Team Services LLC | 8.25 | 11/6/2020 | 500,000 | 495,774 | 482,500 | |||||||||||||||
RP Crown Parent LLC | 6.00 | 12/21/2018 | 550,985 | 552,905 | 510,697 | |||||||||||||||
RP Crown Parent LLC | 11.25 | 12/20/2019 | 678,571 | 691,673 | 570,563 | |||||||||||||||
See accompanying Notes to Financial Statements
24
Babson Global Floating Rate Fund 2014 Semi-Annual Report
SCHEDULE OF INVESTMENTS (UNAUDITED) (CONTINUED)
December 31, 2014
| EFFECTIVE INTEREST RATE ‡ | DUE DATE | PRINCIPAL ‡‡ | COST | FAIR VALUE | ||||||||||||||||
Bank Loans (Continued) |
| |||||||||||||||||||
Diversified/Conglomerate Service (Continued) | ||||||||||||||||||||
Sabre, Inc. | 4.50 | % | 2/19/2019 | 992,487 | $ | 987,604 | $ | 973,878 | ||||||||||||
SkillSoft Corp. | 5.75 | 4/28/2021 | 448,588 | 446,557 | 438,356 | |||||||||||||||
Triple Point Technology, Inc. | 5.25 | 7/10/2020 | 391,180 | 360,096 | 354,996 | |||||||||||||||
Triple Point Technology, Inc.†† | 9.25 | 7/9/2021 | 182,877 | 170,216 | 156,360 | |||||||||||||||
Vogue International, Inc. | 5.25 | 2/14/2020 | 144,383 | 143,137 | 142,940 | |||||||||||||||
|
|
|
|
|
| |||||||||||||||
Total Diversified/Conglomerate Service | 8,495,182 | 8,786,081 | 8,310,834 | |||||||||||||||||
|
|
|
|
|
| |||||||||||||||
Ecological — 1.8%*: | ||||||||||||||||||||
Biffa Waste Services Ltd.+ | 5.26 | 1/30/2018 | 1,000,000 | 1,650,369 | 1,500,154 | |||||||||||||||
Emerald 3 Ltd.+ | 8.00 | 5/31/2022 | 390,426 | 386,754 | 376,761 | |||||||||||||||
|
|
|
|
|
| |||||||||||||||
Total Ecological | 1,390,426 | 2,037,123 | 1,876,915 | |||||||||||||||||
|
|
|
|
|
| |||||||||||||||
Electronics — 1.3%*: | ||||||||||||||||||||
Freescale Semiconductor, Inc. | 4.25 | 2/28/2020 | 990,000 | 990,000 | 964,636 | |||||||||||||||
Kronos, Inc. | 4.50 | 10/30/2019 | 196,597 | 195,400 | 194,739 | |||||||||||||||
Magic Newco LLC+ | 5.00 | 12/12/2018 | 95,621 | 95,621 | 95,143 | |||||||||||||||
Renaissance Learning, Inc. | 4.50 | 4/9/2021 | 82,544 | 82,171 | 80,412 | |||||||||||||||
|
|
|
|
|
| |||||||||||||||
Total Electronics | 1,364,762 | 1,363,192 | 1,334,930 | |||||||||||||||||
|
|
|
|
|
| |||||||||||||||
Finance — 8.9%*: | ||||||||||||||||||||
AssuredPartners Capital, Inc. | 4.50 | 3/31/2021 | 307,075 | 305,696 | 303,236 | |||||||||||||||
AssuredPartners Capital, Inc. | 7.75 | 4/2/2022 | 136,522 | 135,278 | 131,402 | |||||||||||||||
Confie Seguros Holdings II Co. | 5.75 | 11/9/2018 | 536,840 | 534,739 | 533,485 | |||||||||||||||
Cunningham Lindsey US, Inc. | 9.25 | 6/10/2020 | 748,546 | 750,226 | 726,090 | |||||||||||||||
Evertec Group LLC | 3.50 | 4/17/2020 | 671,421 | 660,689 | 656,871 | |||||||||||||||
First Data Corp. | 3.76 | 3/24/2017 | 500,000 | 500,000 | 491,875 | |||||||||||||||
First Data Corp. | 3.76 | 3/23/2018 | 500,000 | 497,946 | 489,690 | |||||||||||||||
GENEX Services, Inc. | 5.25 | 5/30/2021 | 184,054 | 183,209 | 182,443 | |||||||||||||||
Intertrust Group Holding B.V.+ | 8.00 | 4/16/2022 | 692,451 | 871,581 | 782,489 | |||||||||||||||
Moneygram International, Inc. | 4.25 | 3/27/2020 | 804,427 | 742,952 | 735,649 | |||||||||||||||
National Financial Partners Corp. | 4.50 | 7/1/2020 | 132,529 | 132,529 | 130,873 | |||||||||||||||
P2 Newco Acquisition, Inc. | 5.50 | 10/22/2020 | 422,493 | 418,971 | 415,100 | |||||||||||||||
P2 Newco Acquisition, Inc. | 9.50 | 10/22/2021 | 500,000 | 495,727 | 480,000 | |||||||||||||||
SAM Finance Lux Sarl+ | 5.00 | 12/17/2020 | 343,568 | 554,560 | 535,710 | |||||||||||||||
Sedgwick, Inc. | 3.75 | 3/1/2021 | 496,250 | 495,155 | 481,362 | |||||||||||||||
Sedgwick, Inc. | 6.75 | 2/28/2022 | 561,418 | 560,768 | 526,330 | |||||||||||||||
TransUnion LLC | 4.00 | 4/9/2021 | 994,994 | 990,192 | 978,825 | |||||||||||||||
VFH Parent LLC | 5.75 | 11/6/2019 | 648,799 | 643,840 | 640,689 | |||||||||||||||
Wall Street Systems Delaware, Inc. | 4.50 | 4/30/2021 | 277,433 | 275,743 | 272,578 | |||||||||||||||
|
|
|
|
|
| |||||||||||||||
Total Finance | 9,458,820 | 9,749,801 | 9,494,697 | |||||||||||||||||
|
|
|
|
|
| |||||||||||||||
Healthcare, Education and Childcare — 8.4%*: |
| |||||||||||||||||||
Accellent, Inc. | 4.50 | 3/12/2021 | 943,847 | 941,527 | 921,035 | |||||||||||||||
Aenova Holding GmbH+ | 5.00 | 8/6/2020 | 600,000 | 758,698 | 720,585 | |||||||||||||||
Britax US Holdings, Inc. | 4.50 | 10/15/2020 | 435,229 | 433,418 | 312,277 | |||||||||||||||
See accompanying Notes to Financial Statements
25
Babson Global Floating Rate Fund 2014 Semi-Annual Report
SCHEDULE OF INVESTMENTS (UNAUDITED) (CONTINUED)
December 31, 2014
| EFFECTIVE INTEREST RATE ‡ | DUE DATE | PRINCIPAL ‡‡ | COST | FAIR VALUE | ||||||||||||||||
Bank Loans (Continued) |
| |||||||||||||||||||
Healthcare, Education and Childcare (Continued) | ||||||||||||||||||||
CareCore National LLC | 5.50 | % | 3/5/2021 | 683,060 | $ | 682,589 | $ | 674,522 | ||||||||||||
Drumm Investors LLC | 6.75 | 5/4/2018 | 874,491 | 867,383 | 874,491 | |||||||||||||||
Heartland Dental Care, Inc. | 5.50 | 12/21/2018 | 388,065 | 386,532 | 386,125 | |||||||||||||||
Kindred Healthcare, Inc. | 4.25 | 4/9/2021 | 704,327 | 698,878 | 680,260 | |||||||||||||||
Ortho-Clinical Diagnostics, Inc. | 4.75 | 6/30/2021 | 551,627 | 546,510 | 541,835 | |||||||||||||||
PharMedium Healthcare Corp. | 4.25 | 1/28/2021 | 97,352 | 96,928 | 94,107 | |||||||||||||||
Phibro Animal Health Corp. | 4.00 | 4/16/2021 | 177,715 | 177,313 | 175,197 | |||||||||||||||
PRA Holdings, Inc. | 4.50 | 9/23/2020 | 709,500 | 703,671 | 698,269 | |||||||||||||||
Rodenstock GmbH+ | 4.76 | 5/31/2019 | 500,000 | 666,356 | 577,799 | |||||||||||||||
STHI Holding Corp. | 4.50 | 8/6/2021 | 283,053 | 281,712 | 280,457 | |||||||||||||||
Synarc-Biocore Holdings LLC | 5.50 | 3/10/2021 | 496,250 | 491,840 | 471,437 | |||||||||||||||
Synarc-Biocore Holdings LLC | 9.25 | 3/10/2022 | 500,000 | 495,487 | 436,875 | |||||||||||||||
Tecomet, Inc. | 5.75 | 12/5/2021 | 480,685 | 466,264 | 461,458 | |||||||||||||||
Tunstall Group Holdings Ltd.+ | 5.26 | 10/16/2020 | 500,000 | 791,545 | 571,671 | |||||||||||||||
|
|
|
|
|
| |||||||||||||||
Total Healthcare, Education and Childcare | 8,925,201 | 9,486,651 | 8,878,400 | |||||||||||||||||
|
|
|
|
|
| |||||||||||||||
Home and Office Furnishings, Housewares, and Durable Consumer Products — 0.5%*: |
| |||||||||||||||||||
Leslie’s Poolmart, Inc. | 4.25 | 10/16/2019 | 542,718 | 542,718 | 527,114 | |||||||||||||||
|
|
|
|
|
| |||||||||||||||
Hotels, Motels, Inns and Gaming — 0.7%*: |
| |||||||||||||||||||
Gala Group Ltd.+ | 5.26 | 5/27/2018 | 500,000 | 833,266 | 775,646 | |||||||||||||||
|
|
|
|
|
| |||||||||||||||
Insurance — 2.3%*: | ||||||||||||||||||||
AmWINS Group LLC | 5.00 | 9/6/2019 | 152,146 | 151,838 | 150,498 | |||||||||||||||
Asurion LLC | 5.00 | 5/24/2019 | 975,471 | 974,677 | 961,366 | |||||||||||||||
Hub International Ltd. | 4.25 | 10/2/2020 | 987,538 | 983,466 | 954,208 | |||||||||||||||
USI, Inc. | 4.25 | 12/27/2019 | 238,352 | 236,236 | 233,883 | |||||||||||||||
York Risk Services Holding Corp. | 4.75 | 10/1/2021 | 193,649 | 192,235 | 192,197 | |||||||||||||||
|
|
|
|
|
| |||||||||||||||
Total Insurance | 2,547,156 | 2,538,452 | 2,492,152 | |||||||||||||||||
|
|
|
|
|
| |||||||||||||||
Leisure, Amusement, Entertainment — 1.2%*: |
| |||||||||||||||||||
AP NMT Acquisition B.V.+ | 7.00 | 8/6/2021 | 500,000 | 604,321 | 590,910 | |||||||||||||||
Delta 2 (Lux) Sarl+ | 4.75 | 7/30/2021 | 487,247 | 484,922 | 474,662 | |||||||||||||||
SeaWorld Parks & Entertainment, Inc. | 3.00 | 5/14/2020 | 150,162 | 142,826 | 141,903 | |||||||||||||||
Town Sports International, Inc. | 4.50 | 11/16/2020 | 24,076 | 23,975 | 17,064 | |||||||||||||||
|
|
|
|
|
| |||||||||||||||
Total Leisure, Amusement, Entertainment | 1,161,485 | 1,256,044 | 1,224,539 | |||||||||||||||||
|
|
|
|
|
| |||||||||||||||
Machinery Non-Agriculture, Non-Construction, Non-Electronic — 3.1%*: |
| |||||||||||||||||||
Doncasters Finance US LLC | 4.50 | 4/9/2020 | 992,437 | 990,233 | 983,138 | |||||||||||||||
Gardner Denver, Inc. | 4.25 | 7/30/2020 | 797,980 | 783,313 | 745,113 | |||||||||||||||
Husky Injection Molding Systems Ltd.+ | 4.25 | 6/30/2021 | 194,306 | 193,399 | 190,096 | |||||||||||||||
Husky Injection Molding Systems Ltd.+ | 7.25 | 6/30/2022 | 89,262 | 88,841 | 85,469 | |||||||||||||||
Intelligrated, Inc. | 4.75 | 7/30/2018 | 365,628 | 364,287 | 355,573 | |||||||||||||||
Silver II US Holdings LLC | 4.00 | 12/13/2019 | 945,480 | 940,001 | 876,640 | |||||||||||||||
TCH-2 Holding LLC | 5.50 | 5/6/2021 | 108,705 | 107,713 | 107,074 | |||||||||||||||
|
|
|
|
|
| |||||||||||||||
Total Machinery Non-Agriculture, Non-Construction, Non-Electronic | 3,493,798 | 3,467,787 | 3,343,103 | |||||||||||||||||
|
|
|
|
|
| |||||||||||||||
See accompanying Notes to Financial Statements
26
Babson Global Floating Rate Fund 2014 Semi-Annual Report
SCHEDULE OF INVESTMENTS (UNAUDITED) (CONTINUED)
December 31, 2014
| EFFECTIVE INTEREST RATE ‡ | DUE DATE | PRINCIPAL ‡‡ | COST | FAIR VALUE | ||||||||||||||||
Bank Loans (Continued) |
| |||||||||||||||||||
Mining, Steel, Iron and Non-Precious Metals — 2.0%*: |
| |||||||||||||||||||
Arch Coal, Inc. | 6.25 | % | 5/16/2018 | 994,909 | $ | 981,009 | $ | 821,218 | ||||||||||||
Boomerang Tube LLC†† | 11.00 | 10/11/2017 | 249,123 | 244,796 | 214,246 | |||||||||||||||
H.C. Starck GmbH+ | 3.01 | 5/30/2016 | 500,000 | 679,250 | 589,143 | |||||||||||||||
Metal Services LLC | 6.00 | 6/30/2017 | 105,818 | 105,818 | 104,852 | |||||||||||||||
Murray Energy Corp. | 5.25 | 12/5/2019 | 394,718 | 393,023 | 379,209 | |||||||||||||||
|
|
|
|
|
| |||||||||||||||
Total Mining, Steel, Iron and Non-Precious Metals | 2,244,568 | 2,403,896 | 2,108,668 | |||||||||||||||||
|
|
|
|
|
| |||||||||||||||
Oil and Gas — 4.7%*: |
| |||||||||||||||||||
American Energy – Marcellus LLC | 5.25 | 8/4/2020 | 182,134 | 181,284 | 159,063 | |||||||||||||||
Caelus Energy Alaska O3 LLC | 8.75 | 4/15/2020 | 1,000,000 | 982,301 | 875,000 | |||||||||||||||
Drillships Financing Holding, Inc. | 6.00 | 3/31/2021 | 76,128 | 76,796 | 59,332 | |||||||||||||||
Drillships Ocean Ventures, Inc. | 5.50 | 7/25/2021 | 254,602 | 252,202 | 203,682 | |||||||||||||||
Fieldwood Energy LLC | 8.38 | 9/30/2020 | 825,000 | 818,923 | 599,156 | |||||||||||||||
Floatel International Ltd. | 6.00 | 6/27/2020 | 408,526 | 404,738 | 326,821 | |||||||||||||||
Paragon Offshore Finance Co.+ | 3.75 | 7/18/2021 | 133,315 | 132,690 | 106,152 | |||||||||||||||
Sabine Oil & Gas LLC | 8.75 | 12/31/2018 | 700,000 | 710,065 | 532,000 | |||||||||||||||
Seadrill Partners Finco LLC | 4.00 | 2/21/2021 | 937,370 | 930,433 | 725,056 | |||||||||||||||
Southcross Holdings Borrower LP | 6.00 | 8/4/2021 | 146,696 | 146,001 | 129,826 | |||||||||||||||
Templar Energy LLC | 8.50 | 11/25/2020 | 1,000,000 | 971,205 | 716,000 | |||||||||||||||
TPF II Power LLC | 5.50 | 10/2/2021 | 523,685 | 519,878 | 523,031 | |||||||||||||||
|
|
|
|
|
| |||||||||||||||
Total Oil and Gas | 6,187,456 | 6,126,516 | 4,955,119 | |||||||||||||||||
|
|
|
|
|
| |||||||||||||||
Personal and Non-Durable Consumer Products Mfg. Only — 0.3%*: |
| |||||||||||||||||||
Berlin Packaging LLC | 4.50 | 10/1/2021 | 338,635 | 336,998 | 336,095 | |||||||||||||||
|
|
|
|
|
| |||||||||||||||
Personal, Food and Miscellaneous — 0.1%*: |
| |||||||||||||||||||
Redtop Acquisitions Ltd.+ | 8.25 | 6/3/2021 | 157,571 | 155,879 | 156,389 | |||||||||||||||
|
|
|
|
|
| |||||||||||||||
Personal Transportation — 0.3%*: |
| |||||||||||||||||||
Travelport Finance (Luxembourg) Sarl | 6.00 | 9/2/2021 | 320,850 | 317,015 | 319,746 | |||||||||||||||
|
|
|
|
|
| |||||||||||||||
Printing and Publishing — 1.6%*: |
| |||||||||||||||||||
Emap B2B+ | 5.16 | 10/31/2017 | 556,672 | 802,770 | 723,533 | |||||||||||||||
EMI Music Publishing Ltd. | 3.75 | 6/29/2018 | 255,065 | 255,065 | 250,255 | |||||||||||||||
R.H. Donnelley, Inc. | 9.75 | 12/31/2016 | 106,161 | 77,077 | 75,685 | |||||||||||||||
Springer Science+Business Media Deutschland GmbH+ | 4.75 | 8/14/2020 | 493,769 | 492,446 | 484,614 | |||||||||||||||
SuperMedia, Inc. | 11.60 | 12/30/2016 | 273,400 | 226,055 | 217,763 | |||||||||||||||
|
|
|
|
|
| |||||||||||||||
Total Printing and Publishing | 1,685,067 | 1,853,413 | 1,751,850 | |||||||||||||||||
|
|
|
|
|
| |||||||||||||||
Retail Stores — 4.9%*: |
| |||||||||||||||||||
Abercrombie & Fitch Management Co. | 4.75 | 8/7/2021 | 737,981 | 730,988 | 725,990 | |||||||||||||||
Advantage Sales & Marketing, Inc. | 4.25 | 7/23/2021 | 298,991 | 298,284 | 295,316 | |||||||||||||||
Advantage Sales & Marketing, Inc. | 7.50 | 7/25/2022 | 58,808 | 58,389 | 58,044 | |||||||||||||||
BJ’s Wholesale Club, Inc. | 4.50 | 9/26/2019 | 134,979 | 134,433 | 132,231 | |||||||||||||||
See accompanying Notes to Financial Statements
27
Babson Global Floating Rate Fund 2014 Semi-Annual Report
SCHEDULE OF INVESTMENTS (UNAUDITED) (CONTINUED)
December 31, 2014
| EFFECTIVE INTEREST RATE ‡ | DUE DATE | PRINCIPAL ‡‡ | COST | FAIR VALUE | ||||||||||||||||
Bank Loans (Continued) |
| |||||||||||||||||||
Retail Stores (Continued) | ||||||||||||||||||||
Burlington Coat Factory Warehouse Corp. | 4.25 | % | 8/13/2021 | 460,523 | $ | 458,341 | $ | 453,905 | ||||||||||||
FleetPride Corp. | 5.25 | 11/19/2019 | 988,029 | 973,936 | 966,618 | |||||||||||||||
J Crew Group, Inc. | 4.00 | 3/5/2021 | 1,433,561 | 1,409,042 | 1,347,547 | |||||||||||||||
Smart and Final Stores LLC | 4.75 | 11/15/2019 | 232,483 | 231,998 | 228,996 | |||||||||||||||
Talbots, Inc. (The) | 4.75 | 3/19/2020 | 994,994 | 982,696 | 960,169 | |||||||||||||||
|
|
|
|
|
| |||||||||||||||
Total Retail Stores | 5,340,349 | 5,278,107 | 5,168,816 | |||||||||||||||||
|
|
|
|
|
| |||||||||||||||
Telecommunications — 4.3%*: |
| |||||||||||||||||||
Altice Financing SA+ | 5.50 | 7/2/2019 | 262,969 | 265,268 | 258,532 | |||||||||||||||
Carros Finance Luxembourg Sarl | 4.50 | 9/30/2021 | 292,987 | 292,275 | 287,859 | |||||||||||||||
Eircom Finco Sarl+ | 4.76 | 9/30/2019 | 2,000,000 | 2,668,050 | 2,286,995 | |||||||||||||||
ION Trading Technologies Sarl+ | 7.25 | 6/10/2022 | 842,143 | 835,650 | 795,825 | |||||||||||||||
Numericable US LLC+ | 4.50 | 5/21/2020 | 669,197 | 663,171 | 664,895 | |||||||||||||||
Sungard Availability Services Capital, Inc. | 6.00 | 3/31/2019 | 235,338 | 233,930 | 208,509 | |||||||||||||||
Websense, Inc. | 4.50 | 6/25/2020 | 92,739 | 92,534 | 90,885 | |||||||||||||||
|
|
|
|
|
| |||||||||||||||
Total Telecommunications | 4,395,373 | 5,050,878 | 4,593,500 | |||||||||||||||||
|
|
|
|
|
| |||||||||||||||
Utilities — 0.6%*: |
| |||||||||||||||||||
Bayonne Energy Center LLC | 5.00 | 8/19/2021 | 99,774 | 99,300 | 98,028 | |||||||||||||||
Calpine Construction Finance Co. LP | 3.00 | 5/3/2020 | 494,975 | 493,889 | 475,176 | |||||||||||||||
Exgen Renewables I LLC | 5.25 | 2/8/2021 | 59,724 | 59,463 | 59,724 | |||||||||||||||
|
|
|
|
|
| |||||||||||||||
Total Utilities | 654,473 | 652,652 | 632,928 | |||||||||||||||||
|
|
|
|
|
| |||||||||||||||
Total Bank Loans | 82,107,220 | 87,695,221 | 82,732,382 | |||||||||||||||||
|
|
|
|
|
| |||||||||||||||
Corporate Bonds — 9.2%*: |
| |||||||||||||||||||
Banking — 0.1%*: |
| |||||||||||||||||||
Lock AS+ | 7.00 | 8/15/2021 | 100,000 | 134,225 | 125,059 | |||||||||||||||
|
|
|
|
|
| |||||||||||||||
Beverage, Food and Tobacco — 0.4%*: |
| |||||||||||||||||||
Albain Bidco Norway AS+ | 6.58 | # | 11/1/2020 | 1,000,000 | 166,715 | 118,744 | ||||||||||||||
Findus Bondco SA+ | 9.13 | 7/1/2018 | 100,000 | 140,130 | 127,660 | |||||||||||||||
Twinkle Pizza PLC+ | 6.63 | 8/1/2021 | 100,000 | 169,730 | 158,870 | |||||||||||||||
|
|
|
|
|
| |||||||||||||||
Total Beverage, Food and Tobacco | 1,200,000 | 476,575 | 405,274 | |||||||||||||||||
|
|
|
|
|
| |||||||||||||||
Buildings and Real Estate — 0.3%*: |
| |||||||||||||||||||
Forestar USA Real Estate Group, Inc.^ | 8.50 | 6/1/2022 | 110,000 | 110,000 | 107,250 | |||||||||||||||
Paroc Group Oy+ | 5.33 | # | 5/15/2020 | 100,000 | 137,565 | 115,257 | ||||||||||||||
Paroc Group Oy+ | 6.25 | 5/15/2020 | 100,000 | 137,565 | 113,140 | |||||||||||||||
|
|
|
|
|
| |||||||||||||||
Total Buildings and Real Estate | 310,000 | 385,130 | 335,647 | |||||||||||||||||
|
|
|
|
|
| |||||||||||||||
Chemicals, Plastics and Rubber — 0.5%*: |
| |||||||||||||||||||
Pinnacle Operating Corp.^ | 9.00 | 11/15/2020 | 500,000 | 536,262 | 515,000 | |||||||||||||||
|
|
|
|
|
| |||||||||||||||
Containers, Packaging and Glass — 0.5%*: |
| |||||||||||||||||||
Innovia Group Finance PLC+ | 5.08 | # | 3/31/2020 | 500,000 | 685,078 | 553,598 | ||||||||||||||
|
|
|
|
|
| |||||||||||||||
See accompanying Notes to Financial Statements
28
Babson Global Floating Rate Fund 2014 Semi-Annual Report
SCHEDULE OF INVESTMENTS (UNAUDITED) (CONTINUED)
December 31, 2014
| EFFECTIVE INTEREST RATE ‡ | DUE DATE | PRINCIPAL ‡‡ | COST | FAIR VALUE | ||||||||||||||||
Corporate Bonds (Continued) |
| |||||||||||||||||||
Diversified/Conglomerate Manufacturing — 0.5%*: |
| |||||||||||||||||||
Appvion, Inc.^ | 9.00 | % | 6/1/2020 | 460,000 | $ | 468,398 | $ | 315,100 | ||||||||||||
Galapagos SA+ | 4.83 | # | 6/15/2021 | 200,000 | 272,630 | 237,775 | ||||||||||||||
|
|
|
|
|
| |||||||||||||||
Total Diversified/Conglomerate Manufacturing | 660,000 | 741,028 | 552,875 | |||||||||||||||||
|
|
|
|
|
| |||||||||||||||
Diversified/Conglomerate Service — 0.5%*: |
| |||||||||||||||||||
Carlson Travel Holdings, Inc. PIK^ | 7.50 | 8/15/2019 | 470,000 | 475,731 | 473,525 | |||||||||||||||
|
|
|
|
|
| |||||||||||||||
Finance — 1.3%*: |
| |||||||||||||||||||
Equiniti Newco 2 PLC+ | 6.31 | # | 12/15/2018 | 750,000 | 1,212,995 | 1,116,348 | ||||||||||||||
Galaxy Bidco Ltd.+ | 5.56 | # | 11/15/2019 | 100,000 | 160,994 | 150,794 | ||||||||||||||
Lowell Group Financing PLC+ | 5.88 | 4/1/2019 | 100,000 | 166,730 | 143,781 | |||||||||||||||
|
|
|
|
|
| |||||||||||||||
Total Finance | 950,000 | 1,540,719 | 1,410,923 | |||||||||||||||||
|
|
|
|
|
| |||||||||||||||
Grocery — 0.1%*: |
| |||||||||||||||||||
Premier Foods Finance PLC+ | 5.56 | # | 3/16/2020 | 100,000 | 167,370 | 137,157 | ||||||||||||||
|
|
|
|
|
| |||||||||||||||
Healthcare, Education and Childcare — 0.5%*: |
| |||||||||||||||||||
Unilabs Subholding AB+ | 7.33 | # | 7/15/2018 | 400,000 | 550,842 | 482,520 | ||||||||||||||
|
|
|
|
|
| |||||||||||||||
Insurance — 0.9%*: |
| |||||||||||||||||||
Hastings Insurance Group Finance PLC+ | 6.55 | # | 10/21/2019 | 150,000 | 237,891 | 231,344 | ||||||||||||||
Towergate Finance PLC+ | 6.05 | # | 2/15/2018 | 500,000 | 796,763 | 679,940 | ||||||||||||||
|
|
|
|
|
| |||||||||||||||
Total Insurance | 650,000 | 1,034,654 | 911,284 | |||||||||||||||||
|
|
|
|
|
| |||||||||||||||
Leisure, Amusement, Entertainment — 1.3%*: |
| |||||||||||||||||||
Travelex Financing PLC+ | 6.55 | # | 8/1/2018 | 700,000 | 1,120,781 | 1,096,476 | ||||||||||||||
Travelex Financing PLC+ | 8.00 | 8/1/2018 | 100,000 | 158,440 | 163,186 | |||||||||||||||
Vougeot Bidco PLC+ | 5.33 | # | 7/15/2020 | 100,000 | 135,279 | 118,887 | ||||||||||||||
|
|
|
|
|
| |||||||||||||||
Total Leisure, Amusement, Entertainment | 900,000 | 1,414,500 | 1,378,549 | |||||||||||||||||
|
|
|
|
|
| |||||||||||||||
Oil and Gas — 0.4%*: |
| |||||||||||||||||||
Niska Gas Storage Canada ULC/Niska Gas Storage Canada Finance Corp.+^ | 6.50 | 4/1/2019 | 500,000 | 486,642 | 376,250 | |||||||||||||||
|
|
|
|
|
| |||||||||||||||
Personal, Food and Miscellaneous — 1.2%*: |
| |||||||||||||||||||
Brakes Capital+ | 5.08 | # | 12/15/2018 | 100,000 | 136,645 | 119,492 | ||||||||||||||
Brakes Capital+ | 7.13 | 12/15/2018 | 300,000 | 515,832 | 461,736 | |||||||||||||||
Financiere Quick SAS+ | 4.83 | # | 4/15/2019 | 500,000 | 688,340 | 541,497 | ||||||||||||||
TeamSystem Holding SpA+ | 7.38 | 5/15/2020 | 100,000 | 132,532 | 126,269 | |||||||||||||||
|
|
|
|
|
| |||||||||||||||
Total Personal, Food and Miscellaneous | 1,000,000 | 1,473,349 | 1,248,994 | |||||||||||||||||
|
|
|
|
|
| |||||||||||||||
Retail Stores — 0.5%*: |
| |||||||||||||||||||
Boing Group Financing PLC+ | 6.63 | 7/15/2019 | 100,000 | 136,100 | 112,053 | |||||||||||||||
Brighthouse Group PLC+ | 7.88 | 5/15/2018 | 150,000 | 244,036 | 224,438 | |||||||||||||||
HSS Financing PLC+ | 6.75 | 8/1/2019 | 100,000 | 165,525 | 160,536 | |||||||||||||||
See accompanying Notes to Financial Statements
29
Babson Global Floating Rate Fund 2014 Semi-Annual Report
SCHEDULE OF INVESTMENTS (UNAUDITED) (CONTINUED)
December 31, 2014
| EFFECTIVE INTEREST RATE ‡ | DUE DATE | PRINCIPAL ‡‡ | COST | FAIR VALUE | ||||||||||||||||
Corporate Bonds (Continued) |
| |||||||||||||||||||
Retail Stores (Continued) |
| |||||||||||||||||||
Takko Luxembourg 2 S.C.A.+ | 9.88 | % | 4/15/2019 | 100,000 | $ | 132,144 | $42,352 | |||||||||||||
|
|
|
|
|
| |||||||||||||||
Total Retail Stores | 450,000 | 677,805 | 539,379 | |||||||||||||||||
|
|
|
|
|
| |||||||||||||||
Telecommunications — 0.2%*: |
| |||||||||||||||||||
Numericable Group SA+ | 5.38 | 5/15/2022 | 100,000 | 138,295 | 124,877 | |||||||||||||||
Numericable Group SA+ | 5.63 | 5/15/2024 | 100,000 | 138,165 | 125,240 | |||||||||||||||
|
|
|
|
|
| |||||||||||||||
Total Telecommunications | 200,000 | 276,460 | 250,117 | |||||||||||||||||
|
|
|
|
|
| |||||||||||||||
Total Corporate Bonds | 8,890,000 | 11,056,370 | 9,696,151 | |||||||||||||||||
|
|
|
|
|
| |||||||||||||||
Total Fixed Income | 90,997,220 | 98,751,591 | 92,428,533 | |||||||||||||||||
|
|
|
|
|
| |||||||||||||||
Short-Term Investment — 5.5%*: |
| |||||||||||||||||||
Bank Deposit — 5.5%*: |
| |||||||||||||||||||
State Street Bank & Trust Co. Euro Time Deposit | 0.01 | 1/2/2015 | 5,837,315 | 5,837,315 | 5,837,315 | |||||||||||||||
|
|
|
|
|
| |||||||||||||||
Total Investments | 96,834,535 | 104,588,906 | 98,265,848 | |||||||||||||||||
|
|
|
|
|
| |||||||||||||||
Other assets and liabilities — 7.3%* |
| 7,773,902 | ||||||||||||||||||
|
| |||||||||||||||||||
Net Assets — 100.0% |
| $ | 106,039,750 | |||||||||||||||||
|
| |||||||||||||||||||
| PIK | – Payment-in-kind |
| ‡ | The effective interest rates are based on settled commitment amount. |
| ‡‡ | Unless otherwise indicated, all principal amounts are denominated in United States Dollars. |
| * | Calculated as a percentage of net assets applicable to common shareholders. |
| + | Foreign security. |
Distributions of investments by country of risk (excluding temporary cash investments) as a percentage of total investments in securities, is as follows:
| United States | 65.2% | |||||
| United Kingdom | 16.7% | |||||
| Germany | 5.0% | |||||
| France | 4.4% | |||||
| Ireland | 2.5% | |||||
| Canada | 1.8% | |||||
| Spain | 1.5% | |||||
| Netherlands | 1.5% | |||||
| Other (Individually less than 1%) | 1.4% | |||||
|
| |||||
| Total | 100.0% | |||||
|
|
| ^ | Security acquired in a transaction exempt from registration under Rule 144A of the Securities Act of 1933. These securities may only be resold in transactions exempt from registration, normally to qualified institutional buyers. |
| § | Bank loans are exempt from registration under the Securities Act of 1933, as amended, but contain certain restrictions on resale and cannot be sold publicly. These loans pay interest at rates which adjust periodically. The interest rates shown for bank loans are the current interest rates at December 31, 2014. Bank loans are also subject to mandatory and/or optional prepayment which cannot be predicted. As a result, the remaining maturity may be substantially less than the stated maturity shown. |
See accompanying Notes to Financial Statements
30
Babson Global Floating Rate Fund 2014 Semi-Annual Report
SCHEDULE OF INVESTMENTS (UNAUDITED) (CONTINUED)
December 31, 2014
| ¤ | For fair value measurement disclosure purposes, security is categorized as Level 3. |
| †† | Illiquid security. |
| # | Variable rate security. The interest rate shown is the rate in effect at December 31, 2014. |
A summary of outstanding financial instruments at December 31, 2014 is as follows:
Forward Foreign Currency Exchange Contracts to Buy
| EXPIRATION DATE | COUNTERPARTY | LOCAL CURRENCY | VALUE IN USD | IN EXCHANGE FOR USD | NET UNREALIZED APPRECIATION (DEPRECIATION) | |||||||||||||||||
| 01/14/15 | State Street Bank & Trust Co. | EUR | 3,575,048 | 4,326,402 | 4,435,909 | $ | (109,507 | ) | ||||||||||||||
| 01/14/15 | State Street Bank & Trust Co. | GBP | 210,903 | 328,690 | 329,630 | (940 | ) | |||||||||||||||
| 01/14/15 | State Street Bank & Trust Co. | GBP | 104,406 | 162,715 | 162,639 | 76 | ||||||||||||||||
|
| |||||||||||||||||||||
Net unrealized depreciation on forward foreign exchange contracts to buy |
| $ | (110,371 | ) | ||||||||||||||||||
|
| |||||||||||||||||||||
Forward Foreign Currency Exchange Contracts to Sell
| EXPIRATION DATE | COUNTERPARTY | LOCAL CURRENCY | VALUE IN USD | IN EXCHANGE FOR USD | NET UNREALIZED APPRECIATION | |||||||||||||||||
| 01/14/15 | State Street Bank & Trust Co. | EUR | 19,678,810 | 23,814,632 | 24,233,860 | $ | 419,227 | |||||||||||||||
| 01/14/15 | State Street Bank & Trust Co. | GBP | 7,607,011 | 11,855,456 | 11,857,847 | 2,391 | ||||||||||||||||
| 01/14/15 | State Street Bank & Trust Co. | NOK | 904,726 | 121,359 | 126,737 | 5,378 | ||||||||||||||||
|
| |||||||||||||||||||||
Net unrealized appreciation on forward foreign exchange contracts to sell |
| $ | 426,996 | |||||||||||||||||||
|
| |||||||||||||||||||||
Currency Legend
| EUR | – | Euro | ||
| GBP | – | British Pound Sterling | ||
| NOK | – | Norwegian Krona |
See accompanying Notes to Financial Statements
31
Babson Global Credit Income Opportunities Fund 2014 Semi-Annual Report
SCHEDULE OF INVESTMENTS (UNAUDITED)
December 31, 2014
| EFFECTIVE INTEREST RATE ‡ | DUE DATE | PRINCIPAL ‡‡ | COST | FAIR VALUE | ||||||||||||||||
Fixed Income — 88.9%*: | ||||||||||||||||||||
Asset-Backed Securities — 16.7%*: | ||||||||||||||||||||
CDO/CLO — 16.7%*: | ||||||||||||||||||||
Apidos CLO XII^ | 5.13 | #% | 4/15/2025 | 500,000 | $ | 446,309 | $ | 419,090 | ||||||||||||
Apidos CLO XV^ | 5.73 | # | 10/20/2025 | 500,000 | 461,375 | 424,297 | ||||||||||||||
Atlas Senior Loan Fund Ltd.^ | 5.46 | # | 10/15/2026 | 800,000 | 729,263 | 705,611 | ||||||||||||||
Avery Point CLO Ltd. 2014-1 AE^ | 4.83 | # | 4/25/2026 | 500,000 | 459,947 | 439,885 | ||||||||||||||
BlueMountain CLO Ltd.^¤ | Zero Coupon | 4/30/2026 | 250,000 | 238,221 | 210,000 | |||||||||||||||
Carlyle Global Market Strategies CLO 2013-3 Ltd.^ | 4.83 | # | 7/15/2025 | 500,000 | 456,207 | 443,980 | ||||||||||||||
Carlyle Global Market Strategies CLO 2013-4 Ltd.^ | 4.73 | # | 10/15/2025 | 500,000 | 461,691 | 441,089 | ||||||||||||||
Carlyle Global Market Strategies CLO 2013-4 Ltd.^ | 5.43 | # | 10/15/2025 | 500,000 | 453,785 | 421,098 | ||||||||||||||
Dryden Senior Loan Fund^ | 5.58 | # | 4/18/2026 | 500,000 | 460,104 | 422,234 | ||||||||||||||
Dryden XXXI Senior Loan Fund^ | 4.48 | # | 4/18/2026 | 1,000,000 | 887,762 | 853,670 | ||||||||||||||
Eaton Vance CLO 2013-1 Ltd.^ | 5.23 | # | 11/13/2024 | 500,000 | 463,902 | 445,255 | ||||||||||||||
Flatiron CLO 2013-1 Ltd.^ | 5.58 | # | 1/17/2026 | 500,000 | 459,802 | 401,476 | ||||||||||||||
GoldenTree Loan Opportunities VII Ltd.^ | 5.48 | # | 4/25/2025 | 500,000 | 465,691 | 428,363 | ||||||||||||||
ING IM CLO 2013-2 Ltd.^ | 5.73 | # | 4/25/2025 | 500,000 | 465,274 | 431,496 | ||||||||||||||
ING IM CLO 2013-3 Ltd.^ | 4.73 | # | 1/18/2026 | 500,000 | 451,110 | 432,698 | ||||||||||||||
LCM XIII LP^ | 5.08 | # | 1/19/2023 | 750,000 | 700,483 | 674,300 | ||||||||||||||
LCM XV LP^ | 4.68 | # | 8/25/2024 | 500,000 | 465,884 | 431,224 | ||||||||||||||
LCM XVII LP^ | 4.98 | # | 10/15/2026 | 500,000 | 449,465 | 438,054 | ||||||||||||||
Newhaven CLO Ltd.+^ | 5.40 | # | 11/15/2028 | 500,000 | 618,843 | 552,487 | ||||||||||||||
Oak Hill Credit Partners X Ltd.^ | Zero Coupon | 7/20/2026 | 500,000 | 446,982 | 390,260 | |||||||||||||||
OHA Credit Partners IX Ltd.^ | 5.23 | # | 10/20/2025 | 500,000 | 467,176 | 452,088 | ||||||||||||||
Pinnacle Park CLO Ltd.^ | 5.18 | # | 4/15/2026 | 500,000 | 468,815 | 449,659 | ||||||||||||||
Silver Spring CLO Ltd.^ | 5.17 | # | 10/15/2026 | 1,000,000 | 902,015 | 879,884 | ||||||||||||||
Tyron Park CLO Ltd.^ | 4.63 | # | 7/15/2025 | 500,000 | 462,411 | 438,003 | ||||||||||||||
Voya CLO 2014-3 Ltd.^ | 5.23 | # | 7/25/2026 | 500,000 | 455,880 | 436,646 | ||||||||||||||
|
|
|
|
|
| |||||||||||||||
Total CDO/CLO | 13,800,000 | 12,798,397 | 12,062,847 | |||||||||||||||||
|
|
|
|
|
| |||||||||||||||
Total Asset-Backed Securities | 13,800,000 | 12,798,397 | 12,062,847 | |||||||||||||||||
|
|
|
|
|
| |||||||||||||||
Bank Loans — 34.2%*§: | ||||||||||||||||||||
Aerospace and Defense — 0.1%*: | ||||||||||||||||||||
TransDigm Group, Inc. | 3.75 | 6/4/2021 | 80,636 | 80,080 | 79,090 | |||||||||||||||
|
|
|
|
|
| |||||||||||||||
Automobile — 1.4%*: | ||||||||||||||||||||
Gates Global, Inc. | 4.25 | 7/5/2021 | 249,375 | 247,052 | 242,205 | |||||||||||||||
RAC Finance (Holdings) Ltd.+ | 8.25 | 11/3/2022 | 500,000 | 790,887 | 780,275 | |||||||||||||||
|
|
|
|
|
| |||||||||||||||
Total Automobile | 749,375 | 1,037,939 | 1,022,480 | |||||||||||||||||
|
|
|
|
|
| |||||||||||||||
Beverage, Food and Tobacco — 0.4%*: | ||||||||||||||||||||
Telepizza SA+ | 7.00 | 9/30/2020 | 250,000 | 314,163 | 298,429 | |||||||||||||||
|
|
|
|
|
| |||||||||||||||
See accompanying Notes to Financial Statements
32
Babson Global Credit Income Opportunities Fund 2014 Semi-Annual Report
SCHEDULE OF INVESTMENTS (UNAUDITED) (CONTINUED)
December 31, 2014
| EFFECTIVE INTEREST RATE ‡ | DUE DATE | PRINCIPAL ‡‡ | COST | FAIR VALUE | ||||||||||||||||
Bank Loans (Continued) |
| |||||||||||||||||||
Broadcasting and Entertainment — 2.7%*: | ||||||||||||||||||||
All3Media International+ | 5.25 | % | 6/30/2021 | 500,000 | $ | 833,782 | $ | 766,512 | ||||||||||||
Media General, Inc. | 4.25 | 7/31/2020 | 107,554 | 106,210 | 106,244 | |||||||||||||||
Tyrol Acquisitions 2 SAS+ | 3.26 | 1/29/2016 | 936,380 | 1,234,976 | 1,116,194 | |||||||||||||||
|
|
|
|
|
| |||||||||||||||
Total Broadcasting and Entertainment | 1,543,934 | 2,174,968 | 1,988,950 | |||||||||||||||||
|
|
|
|
|
| |||||||||||||||
Buildings and Real Estate — 1.2%*: | ||||||||||||||||||||
Alison Bidco Sarl+ | 5.50 | 8/29/2021 | 148,258 | 146,840 | 144,922 | |||||||||||||||
DTZ US Borrower LLC | 5.50 | 11/4/2021 | 138,995 | 136,910 | 138,300 | |||||||||||||||
Jeld-Wen, Inc. | 5.25 | 10/15/2021 | 219,515 | 217,380 | 217,046 | |||||||||||||||
Paroc Group Holding OY+¤ | 10.01 | 6/18/2022 | 323,064 | 434,288 | 390,924 | |||||||||||||||
|
|
|
|
|
| |||||||||||||||
Total Buildings and Real Estate | 829,832 | 935,418 | 891,192 | |||||||||||||||||
|
|
|
|
|
| |||||||||||||||
Cargo Transport — 1.0%*: |
| |||||||||||||||||||
Direct ChassisLink, Inc.¤ | 8.25 | 11/12/2019 | 495,238 | 489,150 | 480,381 | |||||||||||||||
Direct ChassisLink, Inc. (Add-On Facility)¤ | 8.25 | 11/12/2019 | 252,858 | 252,858 | 245,272 | |||||||||||||||
|
|
|
|
|
| |||||||||||||||
Total Cargo Transport |
| 748,096 | 742,008 | 725,653 | ||||||||||||||||
|
|
|
|
|
| |||||||||||||||
Chemicals, Plastics and Rubber — 0.9%*: |
| |||||||||||||||||||
Emerald Performance Materials LLC | 4.50 | 8/1/2021 | 58,429 | 58,153 | 56,968 | |||||||||||||||
Styrolution Group GmbH+ | 6.50 | 11/7/2019 | 500,000 | 614,194 | 588,817 | |||||||||||||||
|
|
|
|
|
| |||||||||||||||
Total Chemicals, Plastics and Rubber | 558,429 | 672,347 | 645,785 | |||||||||||||||||
|
|
|
|
|
| |||||||||||||||
Containers, Packaging and Glass — 2.5%*: |
| |||||||||||||||||||
CD&R Millennium Holdco 6 Sarl+ | 4.50 | 7/31/2021 | 155,984 | 156,169 | 152,735 | |||||||||||||||
Chesapeake Corp. | 5.50 | 9/30/2020 | 493,750 | 787,511 | 767,497 | |||||||||||||||
Consolidated Container Co. LLC | 7.75 | 1/3/2020 | 94,140 | 92,430 | 89,668 | |||||||||||||||
Coveris | 5.75 | 5/8/2019 | 495,000 | 680,345 | 596,232 | |||||||||||||||
Hilex Poly Co. LLC | 6.00 | 12/5/2021 | 192,439 | 190,515 | 189,433 | |||||||||||||||
|
|
|
|
|
| |||||||||||||||
Total Containers, Packaging and Glass | 1,431,313 | 1,906,970 | 1,795,565 | |||||||||||||||||
|
|
|
|
|
| |||||||||||||||
Diversified/Conglomerate Manufacturing — 1.5%*: |
| |||||||||||||||||||
Capital Safety North America Holdings, Inc. | 3.75 | 3/29/2021 | 488,443 | 486,651 | 472,569 | |||||||||||||||
Capital Safety North America Holdings, Inc. | 6.50 | 3/28/2022 | 125,831 | 125,686 | 118,910 | |||||||||||||||
Quality Home Brands Holdings LLC | 7.75 | 5/25/2018 | 130,848 | 129,828 | 128,776 | |||||||||||||||
West Corp. | 2.51 | 7/1/2019 | 380,263 | 366,387 | 371,707 | |||||||||||||||
|
|
|
|
|
| |||||||||||||||
Total Diversified/Conglomerate Manufacturing | 1,125,385 | 1,108,552 | 1,091,962 | |||||||||||||||||
|
|
|
|
|
| |||||||||||||||
Diversified/Conglomerate Service — 2.9%*: |
| |||||||||||||||||||
Aquilex Holdings LLC | 5.00 | 12/31/2020 | 99,071 | 98,856 | 96,594 | |||||||||||||||
Atrium Innovations, Inc.+ | 4.25 | 2/13/2021 | 466,400 | 464,870 | 449,493 | |||||||||||||||
Internet Brands, Inc. | 8.50 | 7/8/2022 | 150,000 | 148,586 | 145,125 | |||||||||||||||
MH Sub I LLC | 5.00 | 7/8/2021 | 70,528 | 69,892 | 69,352 | |||||||||||||||
Power Team Services LLC | 8.25 | 11/6/2020 | 300,000 | 298,706 | 289,500 | |||||||||||||||
RP Crown Parent LLC | 6.00 | 12/21/2018 | 550,985 | 552,906 | 510,697 | |||||||||||||||
RP Crown Parent LLC | 11.25 | 12/20/2019 | 178,571 | 183,496 | 150,148 | |||||||||||||||
See accompanying Notes to Financial Statements
33
Babson Global Credit Income Opportunities Fund 2014 Semi-Annual Report
SCHEDULE OF INVESTMENTS (UNAUDITED) (CONTINUED)
December 31, 2014
| EFFECTIVE INTEREST RATE ‡ | DUE DATE | PRINCIPAL ‡‡ | COST | FAIR VALUE | ||||||||||||||||
Bank Loans (Continued) |
| |||||||||||||||||||
Diversified/Conglomerate Service (Continued) | ||||||||||||||||||||
Triple Point Technology, Inc. | 5.25 | % | 7/10/2020 | 391,180 | $ | 360,096 | $ | 354,996 | ||||||||||||
Triple Point Technology, Inc.†† | 9.25 | 7/9/2021 | 63,830 | 59,066 | 54,575 | |||||||||||||||
|
|
|
|
|
| |||||||||||||||
Total Diversified/Conglomerate Service | 2,270,565 | 2,236,474 | 2,120,480 | |||||||||||||||||
|
|
|
|
|
| |||||||||||||||
Ecological — 0.3%*: |
| |||||||||||||||||||
Emerald 3 Ltd.+ | 8.00 | 5/31/2022 | 196,488 | 194,401 | 189,611 | |||||||||||||||
|
|
|
|
|
| |||||||||||||||
Finance — 1.6%*: |
| |||||||||||||||||||
AssuredPartners Capital, Inc. | 7.75 | 4/2/2022 | 68,261 | 67,639 | 65,701 | |||||||||||||||
Confie Seguros Holdings II Co. | 5.75 | 11/9/2018 | 226,109 | 225,252 | 224,696 | |||||||||||||||
GENEX Services, Inc. | 5.25 | 5/30/2021 | 92,027 | 91,604 | 91,222 | |||||||||||||||
Intertrust Group Holding B.V.+ | 8.00 | 4/16/2022 | 96,225 | 95,562 | 94,782 | |||||||||||||||
National Financial Partners Corp. | 4.50 | 7/1/2020 | 66,265 | 66,265 | 65,436 | |||||||||||||||
P2 Newco Acquisition, Inc. | 9.50 | 10/22/2021 | 103,373 | 102,490 | 99,238 | |||||||||||||||
Sedgwick, Inc. | 3.75 | 3/1/2021 | 296,412 | 290,234 | 287,519 | |||||||||||||||
VFH Parent LLC | 5.75 | 11/6/2019 | 213,588 | 212,599 | 210,919 | |||||||||||||||
|
|
|
|
|
| |||||||||||||||
Total Finance |
| 1,162,260 | 1,151,645 | 1,139,513 | ||||||||||||||||
|
|
|
|
|
| |||||||||||||||
Healthcare, Education and Childcare — 3.5%*: |
| |||||||||||||||||||
Aenova Holding GmbH+ | 5.00 | 8/6/2020 | 600,000 | 758,698 | 720,585 | |||||||||||||||
CareCore National LLC | 5.50 | 3/5/2021 | 134,508 | 133,509 | 132,827 | |||||||||||||||
Kindred Healthcare, Inc. | 4.25 | 4/9/2021 | 102,790 | 102,559 | 99,277 | |||||||||||||||
PRA Holdings, Inc. | 4.50 | 9/23/2020 | 439,302 | 438,524 | 432,348 | |||||||||||||||
STHI Holding Corp. | 4.50 | 8/6/2021 | 141,527 | 140,856 | 140,229 | |||||||||||||||
Synarc-Biocore Holdings LLC | 5.50 | 3/10/2021 | 397,874 | 394,338 | 377,980 | |||||||||||||||
Synarc-Biocore Holdings LLC | 9.25 | 3/10/2022 | 500,000 | 495,486 | 436,875 | |||||||||||||||
Tecomet, Inc. | 5.75 | 12/5/2021 | 209,856 | 203,561 | 201,462 | |||||||||||||||
|
|
|
|
|
| |||||||||||||||
Total Healthcare, Education and Childcare |
| 2,525,857 | 2,667,531 | 2,541,583 | ||||||||||||||||
|
|
|
|
|
| |||||||||||||||
Leisure, Amusement, Entertainment — 1.4%*: |
| |||||||||||||||||||
AP NMT Acquisition B.V.+ | 7.00 | 8/6/2021 | 400,000 | 483,894 | 472,728 | |||||||||||||||
AP NMT Acquisition B.V.+ | 10.00 | 8/13/2022 | 300,000 | 276,993 | 286,500 | |||||||||||||||
Delta 2 (Lux) Sarl+ | 4.75 | 7/30/2021 | 243,623 | 242,461 | 237,331 | |||||||||||||||
|
|
|
|
|
| |||||||||||||||
Total Leisure, Amusement, Entertainment |
| 943,623 | 1,003,348 | 996,559 | ||||||||||||||||
|
|
|
|
|
| |||||||||||||||
Machinery Non-Agriculture, Non-Construction, Non-Electronic — 1.1%*: |
| |||||||||||||||||||
Doncasters Finance US LLC | 4.50 | 4/9/2020 | 248,109 | 247,558 | 245,785 | |||||||||||||||
Gardner Denver, Inc. | 4.25 | 7/30/2020 | 498,738 | 489,571 | 465,696 | |||||||||||||||
TCH-2 Holding LLC | 5.50 | 5/6/2021 | 54,352 | 53,856 | 53,537 | |||||||||||||||
|
|
|
|
|
| |||||||||||||||
Total Machinery Non-Agriculture, Non-Construction, Non-Electronic | 801,199 | 790,985 | 765,018 | |||||||||||||||||
|
|
|
|
|
| |||||||||||||||
Mining, Steel, Iron and Non-Precious Metals — 1.1%*: |
| |||||||||||||||||||
Arch Coal, Inc. | 6.25 | 5/16/2018 | 746,182 | 735,755 | 615,914 | |||||||||||||||
Boomerang Tube LLC†† | 11.00 | 10/11/2017 | 249,123 | 244,796 | 214,245 | |||||||||||||||
|
|
|
|
|
| |||||||||||||||
Total Mining, Steel, Iron and Non-Precious Metals |
| 995,305 | 980,551 | 830,159 | ||||||||||||||||
|
|
|
|
|
| |||||||||||||||
See accompanying Notes to Financial Statements
34
Babson Global Credit Income Opportunities Fund 2014 Semi-Annual Report
SCHEDULE OF INVESTMENTS (UNAUDITED) (CONTINUED)
December 31, 2014
| EFFECTIVE INTEREST RATE ‡ | DUE DATE | PRINCIPAL ‡‡ | COST | FAIR VALUE | ||||||||||||||||
Bank Loans (Continued) |
| |||||||||||||||||||
Oil and Gas — 2.7%*: |
| |||||||||||||||||||
American Energy – Marcellus LLC | 8.50 | % | 8/4/2021 | 60,369 | $ | 59,513 | $ | 54,935 | ||||||||||||
Caelus Energy Alaska O3 LLC | 8.75 | 4/15/2020 | 500,000 | 491,130 | 437,500 | |||||||||||||||
Drillships Ocean Ventures, Inc. | 5.50 | 7/25/2021 | 127,301 | 126,101 | 101,841 | |||||||||||||||
Fieldwood Energy LLC | 8.38 | 9/30/2020 | 324,231 | 316,215 | 235,473 | |||||||||||||||
Floatel International Ltd. | 6.00 | 6/27/2020 | 204,263 | 202,369 | 163,410 | |||||||||||||||
Jonah Energy LLC | 7.50 | 5/12/2021 | 173,566 | 171,195 | 147,531 | |||||||||||||||
Paragon Offshore Finance Co.+ | 3.75 | 7/18/2021 | 66,658 | 66,345 | 53,076 | |||||||||||||||
Seadrill Partners Finco LLC | 4.00 | 2/21/2021 | 129,672 | 100,820 | 100,302 | |||||||||||||||
Southcross Holdings Borrower LP | 6.00 | 8/4/2021 | 73,348 | 73,000 | 64,913 | |||||||||||||||
Templar Energy LLC | 8.50 | 11/25/2020 | 800,000 | 776,713 | 572,800 | |||||||||||||||
|
|
|
|
|
| |||||||||||||||
Total Oil and Gas |
| 2,459,408 | 2,383,401 | 1,931,781 | ||||||||||||||||
|
|
|
|
|
| |||||||||||||||
Personal and Non-Durable Consumer Products Mfg. Only — 0.2%*: |
| |||||||||||||||||||
Berlin Packaging LLC | 4.50 | 10/1/2021 | 145,747 | 145,042 | 144,654 | |||||||||||||||
|
|
|
|
|
| |||||||||||||||
Printing and Publishing — 1.4%*: |
| |||||||||||||||||||
Emap B2B+ | 5.16 | 10/31/2017 | 556,672 | 802,494 | 723,533 | |||||||||||||||
R.H. Donnelley, Inc. | 9.75 | 12/31/2016 | 106,162 | 77,077 | 75,685 | |||||||||||||||
SuperMedia, Inc. | 11.60 | 12/30/2016 | 234,744 | 194,401 | 186,973 | |||||||||||||||
|
|
|
|
|
| |||||||||||||||
Total Printing and Publishing |
| 897,578 | 1,073,972 | 986,191 | ||||||||||||||||
|
|
|
|
|
| |||||||||||||||
Retail Stores — 2.4%*: |
| |||||||||||||||||||
Advantage Sales & Marketing, Inc. | 4.25 | 7/23/2021 | 688,021 | 681,988 | 679,565 | |||||||||||||||
Maxeda DIY B.V.+ | 15.00 | 6/30/2018 | 500,000 | 663,015 | 556,623 | |||||||||||||||
Talbots, Inc. (The) | 4.75 | 3/19/2020 | 498,744 | 487,644 | 481,288 | |||||||||||||||
|
|
|
|
|
| |||||||||||||||
Total Retail Stores |
| 1,686,765 | 1,832,647 | 1,717,476 | ||||||||||||||||
|
|
|
|
|
| |||||||||||||||
Telecommunications — 3.3%*: |
| |||||||||||||||||||
Altice Financing SA+ | 5.50 | 7/2/2019 | 262,968 | 265,268 | 258,533 | |||||||||||||||
Eircom Finco Sarl+ | 4.76 | 9/30/2019 | 1,000,000 | 1,327,615 | 1,143,497 | |||||||||||||||
ION Trading Technologies Sarl+ | 7.25 | 6/10/2022 | 894,762 | 888,353 | 845,550 | |||||||||||||||
Sungard Availability Services Capital, Inc. | 6.00 | 3/31/2019 | 117,669 | 117,166 | 104,255 | |||||||||||||||
|
|
|
|
|
| |||||||||||||||
Total Telecommunications | 2,275,399 | 2,598,402 | 2,351,835 | |||||||||||||||||
|
|
|
|
|
| |||||||||||||||
Utilities — 0.6%*: |
| |||||||||||||||||||
Texas Competitive Electric Holdings Co. LLC | 4.76 | 10/10/2017 | 650,000 | 508,583 | 419,523 | |||||||||||||||
|
|
|
|
|
| |||||||||||||||
Total Bank Loans | 24,327,194 | 26,539,427 | 24,673,489 | |||||||||||||||||
|
|
|
|
|
| |||||||||||||||
Corporate Bonds — 38.0%*: | ||||||||||||||||||||
Aerospace and Defense — 0.4%*: |
| |||||||||||||||||||
TransDigm, Inc. | 6.50 | 7/15/2024 | 315,000 | 315,000 | 316,575 | |||||||||||||||
|
|
|
|
|
| |||||||||||||||
Automobile — 3.6%*: |
| |||||||||||||||||||
Allied Specialty Vehicles, Inc.^ | 8.50 | 11/1/2019 | 1,000,000 | 1,030,747 | 1,047,500 | |||||||||||||||
Dana Holding Corp. | 5.50 | 12/15/2024 | 251,000 | 251,000 | 253,510 | |||||||||||||||
See accompanying Notes to Financial Statements
35
Babson Global Credit Income Opportunities Fund 2014 Semi-Annual Report
SCHEDULE OF INVESTMENTS (UNAUDITED) (CONTINUED)
December 31, 2014
| EFFECTIVE INTEREST RATE ‡ | DUE DATE | PRINCIPAL ‡‡ | COST | FAIR VALUE | ||||||||||||||||
Corporate Bonds (Continued) |
| |||||||||||||||||||
Automobile (Continued) | ||||||||||||||||||||
International Automotive Components Group SA^ | 9.13 | % | 6/1/2018 | 750,000 | $ | 772,938 | $ | 781,875 | ||||||||||||
JB Poindexter & Co., Inc.^ | 9.00 | 4/1/2022 | 500,000 | 525,574 | 540,000 | |||||||||||||||
|
|
|
|
|
| |||||||||||||||
Total Automobile | 2,501,000 | 2,580,259 | 2,622,885 | |||||||||||||||||
|
|
|
|
|
| |||||||||||||||
Banking — 0.4%*: |
| |||||||||||||||||||
Lock AS+ | 7.00 | 8/15/2021 | 250,000 | 335,562 | 312,647 | |||||||||||||||
|
|
|
|
|
| |||||||||||||||
Beverage, Food and Tobacco — 1.0%*: |
| |||||||||||||||||||
Albain Bidco Norway AS+ | 6.75 | 11/1/2020 | 200,000 | 273,998 | 218,111 | |||||||||||||||
Findus Bondco SA+ | 9.13 | 7/1/2018 | 200,000 | 293,491 | 255,321 | |||||||||||||||
Twinkle Pizza PLC+ | 6.63 | 8/1/2021 | 150,000 | 254,595 | 238,305 | |||||||||||||||
|
|
|
|
|
| |||||||||||||||
Total Beverage, Food and Tobacco | 550,000 | 822,084 | 711,737 | |||||||||||||||||
|
|
|
|
|
| |||||||||||||||
Broadcasting and Entertainment — 2.4%*: |
| |||||||||||||||||||
Harron Communications LP/Harron Finance Corp.^ | 9.13 | 4/1/2020 | 500,000 | 544,685 | 545,000 | |||||||||||||||
LIN Television Corp.^ | 5.88 | 11/15/2022 | 233,000 | 231,853 | 230,670 | |||||||||||||||
RCN Telecom Services LLC/RCN Capital Corp.^ | 8.50 | 8/15/2020 | 775,000 | 778,150 | 798,250 | |||||||||||||||
Unitymedia Hessen GmbH & Co. KG/Unitymedia NRW GmbH+ | 6.25 | 1/15/2029 | 100,000 | 133,825 | 136,736 | |||||||||||||||
|
|
|
|
|
| |||||||||||||||
Total Broadcasting and Entertainment | 1,608,000 | 1,688,513 | 1,710,656 | |||||||||||||||||
|
|
|
|
|
| |||||||||||||||
Buildings and Real Estate — 1.6%*: |
| |||||||||||||||||||
Deutsche Raststaetten Gruppe IV GmbH+ | 6.75 | 12/30/2020 | 100,000 | 135,605 | 128,265 | |||||||||||||||
Keystone Financing PLC+ | 9.50 | 10/15/2019 | 350,000 | 563,181 | 534,600 | |||||||||||||||
Paroc Group Oy+ | 5.33 | # | 5/15/2020 | 100,000 | 137,565 | 115,257 | ||||||||||||||
Paroc Group Oy+ | 6.25 | 5/15/2020 | 100,000 | 137,565 | 113,140 | |||||||||||||||
Roofing Supply Group LLC/Roofing Supply Finance, Inc.^ | 10.00 | 6/1/2020 | 271,000 | 292,209 | 268,805 | |||||||||||||||
|
|
|
|
|
| |||||||||||||||
Total Buildings and Real Estate | 921,000 | 1,266,125 | 1,160,067 | |||||||||||||||||
|
|
|
|
|
| |||||||||||||||
Cargo Transport — 2.1%*: |
| |||||||||||||||||||
Kenan Advantage Group, Inc. (The)^ | 8.38 | 12/15/2018 | 1,000,000 | 1,042,484 | 1,030,000 | |||||||||||||||
Moto Finance PLC+ | 10.25 | 3/15/2017 | 300,000 | 514,382 | 492,128 | |||||||||||||||
|
|
|
|
|
| |||||||||||||||
Total Cargo Transport | 1,300,000 | 1,556,866 | 1,522,128 | |||||||||||||||||
|
|
|
|
|
| |||||||||||||||
Chemicals, Plastics and Rubber — 1.6%*: |
| |||||||||||||||||||
Ciech Group Financing AB+ | 9.50 | 11/30/2019 | 200,000 | 293,755 | 266,840 | |||||||||||||||
Monitchem HoldCo 2 SA+ | 6.88 | 6/15/2022 | 100,000 | 136,455 | 108,067 | |||||||||||||||
Monitchem HoldCo 3 SA+ | 5.25 | 6/15/2021 | 150,000 | 183,816 | 178,785 | |||||||||||||||
Pinnacle Operating Corp.^ | 9.00 | 11/15/2020 | 600,000 | 616,816 | 618,000 | |||||||||||||||
|
|
|
|
|
| |||||||||||||||
Total Chemicals, Plastics and Rubber | 1,050,000 | 1,230,842 | 1,171,692 | |||||||||||||||||
|
|
|
|
|
| |||||||||||||||
Containers, Packaging and Glass — 1.6%*: |
| |||||||||||||||||||
Ardagh Finance Holdings SA PIK^ | 8.63 | 6/15/2019 | 344,468 | 341,468 | 339,301 | |||||||||||||||
Innovia Group Finance PLC+ | 5.08 | # | 3/31/2020 | 100,000 | 136,058 | 110,720 | ||||||||||||||
See accompanying Notes to Financial Statements
36
Babson Global Credit Income Opportunities Fund 2014 Semi-Annual Report
SCHEDULE OF INVESTMENTS (UNAUDITED) (CONTINUED)
December 31, 2014
| EFFECTIVE INTEREST RATE ‡ | DUE DATE | PRINCIPAL ‡‡ | COST | FAIR VALUE | ||||||||||||||||
Corporate Bonds (Continued) |
| |||||||||||||||||||
Containers, Packaging and Glass (Continued) | ||||||||||||||||||||
Mustang Merger Corp.^ | 8.50 | % | 8/15/2021 | 750,000 | $ | 745,880 | $ | 712,500 | ||||||||||||
|
|
|
|
|
| |||||||||||||||
Total Containers, Packaging and Glass | 1,194,468 | 1,223,406 | 1,162,521 | |||||||||||||||||
|
|
|
|
|
| |||||||||||||||
Diversified/Conglomerate Manufacturing — 2.0%*: |
| |||||||||||||||||||
Appvion, Inc.^ | 9.00 | 6/1/2020 | 500,000 | 513,986 | 342,500 | |||||||||||||||
CTP Transportation Products LLC/CTP Finance, Inc.^ | 8.25 | 12/15/2019 | 448,000 | 459,458 | 472,640 | |||||||||||||||
Galapagos Holding SA+ | 7.00 | 6/15/2022 | 175,000 | 230,926 | 195,347 | |||||||||||||||
Galapagos SA+ | 5.38 | 6/15/2021 | 175,000 | 219,083 | 209,578 | |||||||||||||||
West Corp.^ | 5.38 | 7/15/2022 | 250,000 | 237,557 | 239,375 | |||||||||||||||
|
|
|
|
|
| |||||||||||||||
Total Diversified/Conglomerate Manufacturing | 1,548,000 | 1,661,010 | 1,459,440 | |||||||||||||||||
|
|
|
|
|
| |||||||||||||||
Diversified/Conglomerate Service — 1.4%*: |
| |||||||||||||||||||
ADT Corp. (The) | 5.25 | 3/15/2020 | 363,000 | 363,000 | 367,538 | |||||||||||||||
Carlson Travel Holdings, Inc. PIK^ | 7.50 | 8/15/2019 | 665,000 | 675,202 | 669,987 | |||||||||||||||
|
|
|
|
|
| |||||||||||||||
Total Diversified/Conglomerate Service | 1,028,000 | 1,038,202 | 1,037,525 | |||||||||||||||||
|
|
|
|
|
| |||||||||||||||
Finance — 1.9%*: |
| |||||||||||||||||||
Arrow Global Finance PLC+ | 5.34 | # | 11/1/2021 | 100,000 | 122,953 | 119,492 | ||||||||||||||
Cabot Financial Luxembourg SA+ | 10.38 | 10/1/2019 | 100,000 | 175,227 | 169,492 | |||||||||||||||
Galaxy Bidco Ltd.+ | 6.38 | 11/15/2020 | 100,000 | 161,665 | 151,886 | |||||||||||||||
Galaxy Finco Ltd.+ | 7.88 | 11/15/2021 | 100,000 | 165,474 | 143,235 | |||||||||||||||
Lowell Group Financing PLC+ | 5.88 | 4/1/2019 | 100,000 | 166,730 | 143,781 | |||||||||||||||
TMF Group Holding BV+ | 9.88 | 12/1/2019 | 500,000 | 720,591 | 621,663 | |||||||||||||||
|
|
|
|
|
| |||||||||||||||
Total Finance | 1,000,000 | 1,512,640 | 1,349,549 | |||||||||||||||||
|
|
|
|
|
| |||||||||||||||
Grocery — 0.4%*: |
| |||||||||||||||||||
Premier Foods PLC+ | 6.50 | 3/15/2021 | 200,000 | 339,700 | 267,456 | |||||||||||||||
|
|
|
|
|
| |||||||||||||||
Healthcare, Education and Childcare — 2.5%*: |
| |||||||||||||||||||
BioScrip, Inc.^ | 8.88 | 2/15/2021 | 500,000 | 517,964 | 450,000 | |||||||||||||||
HomeVi SAS+ | 6.88 | 8/15/2021 | 250,000 | 334,500 | 316,126 | |||||||||||||||
Priory Group No. 3 PLC+ | 8.88 | 2/15/2019 | 500,000 | 807,316 | 802,679 | |||||||||||||||
Unilabs Subholding AB+ | 8.50 | 7/15/2018 | 200,000 | 286,317 | 245,640 | |||||||||||||||
|
|
|
|
|
| |||||||||||||||
Total Healthcare, Education and Childcare | 1,450,000 | 1,946,097 | 1,814,445 | |||||||||||||||||
|
|
|
|
|
| |||||||||||||||
Hotels, Motels, Inns and Gaming — 0.4%*: |
| |||||||||||||||||||
Gala Electric Casinos PLC+ | 11.50 | 6/1/2019 | 100,000 | 177,955 | 162,250 | |||||||||||||||
NH Hoteles SA+ | 6.88 | 11/15/2019 | 100,000 | 135,775 | 130,129 | |||||||||||||||
|
|
|
|
|
| |||||||||||||||
Total Hotels, Motels, Inns and Gaming | 200,000 | 313,730 | 292,379 | |||||||||||||||||
|
|
|
|
|
| |||||||||||||||
Insurance — 0.5%*: |
| |||||||||||||||||||
Hastings Insurance Group Finance PLC+ | 8.00 | 10/21/2020 | 100,000 | 159,915 | 160,690 | |||||||||||||||
Towergate Finance PLC+ | 8.50 | 2/15/2018 | 150,000 | 250,071 | 207,021 | |||||||||||||||
|
|
|
|
|
| |||||||||||||||
Total Insurance | 250,000 | 409,986 | 367,711 | |||||||||||||||||
|
|
|
|
|
| |||||||||||||||
See accompanying Notes to Financial Statements
37
Babson Global Credit Income Opportunities Fund 2014 Semi-Annual Report
SCHEDULE OF INVESTMENTS (UNAUDITED) (CONTINUED)
December 31, 2014
| EFFECTIVE INTEREST RATE ‡ | DUE DATE | PRINCIPAL ‡‡ | COST | FAIR VALUE | ||||||||||||||||
Corporate Bonds (Continued) |
| |||||||||||||||||||
Leisure, Amusement, Entertainment — 1.5%*: |
| |||||||||||||||||||
Dometic Group AB PIK+ | 9.50 | % | 6/26/2019 | 500,000 | $ | 679,440 | $ | 579,311 | ||||||||||||
Vougeot Bidco PLC+ | 7.88 | 7/15/2020 | 300,000 | 512,448 | 483,946 | |||||||||||||||
|
|
|
|
|
| |||||||||||||||
Total Leisure, Amusement, Entertainment | 800,000 | 1,191,888 | 1,063,257 | |||||||||||||||||
|
|
|
|
|
| |||||||||||||||
Machinery Non-Agriculture, Non-Construction, Non-Electronic — 1.4%*: |
| |||||||||||||||||||
KraussMaffei Group GmbH+ | 8.75 | 12/15/2020 | 90,000 | 130,179 | 117,867 | |||||||||||||||
Novafives SAS+ | 4.50 | 6/30/2021 | 100,000 | 136,335 | 118,440 | |||||||||||||||
Xerium Technologies, Inc. | 8.88 | 6/15/2018 | 720,000 | 739,748 | 756,450 | |||||||||||||||
|
|
|
|
|
| |||||||||||||||
Total Machinery Non-Agriculture, Non-Construction, Non-Electronic | 910,000 | 1,006,262 | 992,757 | |||||||||||||||||
|
|
|
|
|
| |||||||||||||||
Mining, Steel, Iron and Non-Precious Metals — 0.6%*: |
| |||||||||||||||||||
Constellium NV+ | 7.00 | 1/15/2023 | 250,000 | 307,213 | 290,034 | |||||||||||||||
Murray Energy Corp.^ | 9.50 | 12/5/2020 | 150,000 | 164,341 | 150,000 | |||||||||||||||
|
|
|
|
|
| |||||||||||||||
Total Mining, Steel, Iron and Non-Precious Metals | 400,000 | 471,554 | 440,034 | |||||||||||||||||
|
|
|
|
|
| |||||||||||||||
Oil and Gas — 4.5%*: |
| |||||||||||||||||||
American Energy — Woodford LLC/AEW Finance Corp.^ | 9.00 | 9/15/2022 | 268,000 | 257,292 | 171,520 | |||||||||||||||
Baytex Energy Corp.+^ | 5.63 | 6/1/2024 | 350,000 | 284,680 | 297,500 | |||||||||||||||
California Resources Corp.^ | 6.00 | 11/15/2024 | 400,000 | 400,000 | 338,000 | |||||||||||||||
Calumet Specialty Products Partners LP/Calumet Finance Corp.^ | 6.50 | 4/15/2021 | 500,000 | 500,000 | 445,000 | |||||||||||||||
Global Partners LP/GLP Finance Corp.^ | 6.25 | 7/15/2022 | 317,000 | 316,242 | 307,490 | |||||||||||||||
Jupiter Resources, Inc.+^ | 8.50 | 10/1/2022 | 750,000 | 719,325 | 564,375 | |||||||||||||||
Millennium Offshore Services Superholdings LLC+^ | 9.50 | 2/15/2018 | 500,000 | 519,697 | 497,500 | |||||||||||||||
Niska Gas Storage Canada ULC/Niska Gas Storage Canada Finance Corp.+^ | 6.50 | 4/1/2019 | 500,000 | 500,000 | 376,250 | |||||||||||||||
Seventy Seven Energy, Inc. | 6.50 | 7/15/2022 | 440,000 | 440,000 | 257,400 | |||||||||||||||
|
|
|
|
|
| |||||||||||||||
Total Oil and Gas | 4,025,000 | 3,937,236 | 3,255,035 | |||||||||||||||||
|
|
|
|
|
| |||||||||||||||
Personal and Non-Durable Consumer Products Mfg. Only — 0.2%*: |
| |||||||||||||||||||
Ontex Group NV+ | 4.75 | 11/15/2021 | 100,000 | 124,835 | 127,055 | |||||||||||||||
|
|
|
|
|
| |||||||||||||||
Personal, Food and Miscellaneous — 1.7%*: |
| |||||||||||||||||||
Brakes Capital+ | 7.13 | 12/15/2018 | 500,000 | 843,233 | 769,559 | |||||||||||||||
TeamSystem Holding SpA+ | 7.38 | 5/15/2020 | 350,000 | 476,625 | 441,941 | |||||||||||||||
|
|
|
|
|
| |||||||||||||||
Total Personal, Food and Miscellaneous | 850,000 | 1,319,858 | 1,211,500 | |||||||||||||||||
|
|
|
|
|
| |||||||||||||||
Retail Stores — 2.2%*: |
| |||||||||||||||||||
Boing Group Financing PLC+ | 6.63 | 7/15/2019 | 200,000 | 272,200 | 224,106 | |||||||||||||||
Brighthouse Group PLC+ | 7.88 | 5/15/2018 | 150,000 | 244,036 | 224,439 | |||||||||||||||
See accompanying Notes to Financial Statements
38
Babson Global Credit Income Opportunities Fund 2014 Semi-Annual Report
SCHEDULE OF INVESTMENTS (UNAUDITED) (CONTINUED)
December 31, 2014
| EFFECTIVE INTEREST RATE ‡ | DUE DATE | PRINCIPAL ‡‡ | COST | FAIR VALUE | ||||||||||||||||
Corporate Bonds (Continued) |
| |||||||||||||||||||
Retail Stores (Continued) | ||||||||||||||||||||
HSS Financing PLC+ | 6.75 | % | 8/1/2019 | 100,000 | $ | 165,525 | $160,536 | |||||||||||||
New Look Bondco I PLC+ | 8.75 | 5/14/2018 | 450,000 | 729,742 | 735,562 | |||||||||||||||
Pendragon PLC+ | 6.88 | 5/1/2020 | 100,000 | 171,598 | 160,536 | |||||||||||||||
Takko Luxembourg 2 S.C.A.+ | 9.88 | 4/15/2019 | 200,000 | 257,903 | 84,703 | |||||||||||||||
|
|
|
|
|
| |||||||||||||||
Total Retail Stores | 1,200,000 | 1,841,004 | 1,589,882 | |||||||||||||||||
|
|
|
|
|
| |||||||||||||||
Telecommunications — 2.1%*: |
| |||||||||||||||||||
eircom Finance Ltd.+ | 9.25 | 5/15/2020 | 100,000 | 148,285 | 130,534 | |||||||||||||||
Norcell Sweden Holding 3 AB+ | 5.25 | 11/4/2019 | 3,000,000 | 401,245 | 384,512 | |||||||||||||||
Numericable Group SA+ | 5.63 | 5/15/2024 | 100,000 | 138,165 | 125,240 | |||||||||||||||
Numericable Group SA+^ | 6.00 | 5/15/2022 | 315,000 | 315,000 | 316,733 | |||||||||||||||
UPC Holding BV+ | 6.75 | 3/15/2023 | 200,000 | 213,250 | 219,372 | |||||||||||||||
Wind Acquisition Finance SA+ | 4.00 | 7/15/2020 | 100,000 | 135,965 | 118,700 | |||||||||||||||
Wind Acquisition Finance SA+ | 4.08 | # | 7/15/2020 | 100,000 | 135,965 | 116,117 | ||||||||||||||
Wind Acquisition Finance SA+ | 7.00 | 4/23/2021 | 100,000 | 137,975 | 118,316 | |||||||||||||||
|
|
|
|
|
| |||||||||||||||
Total Telecommunications | 4,015,000 | 1,625,850 | 1,529,524 | |||||||||||||||||
|
|
|
|
|
| |||||||||||||||
Total Corporate Bonds | 27,665,468 | 29,758,509 | 27,488,457 | |||||||||||||||||
|
|
|
|
|
| |||||||||||||||
Total Fixed Income | 65,792,662 | 69,096,333 | 64,224,793 | |||||||||||||||||
|
|
|
|
|
| |||||||||||||||
Short-Term Investment — 7.8%*: | ||||||||||||||||||||
Bank Deposit — 7.8%*: | ||||||||||||||||||||
State Street Bank & Trust Co. Euro Time Deposit | 0.01 | 1/2/2015 | 5,662,592 | 5,662,592 | 5,662,592 | |||||||||||||||
|
|
|
|
|
| |||||||||||||||
Total Investments | 71,455,254 | 74,758,925 | 69,887,385 | |||||||||||||||||
|
|
|
|
|
| |||||||||||||||
Other assets and liabilities — 3.3%* | 2,354,116 | |||||||||||||||||||
|
| |||||||||||||||||||
Net Assets — 100.0% | $ | 72,241,501 | ||||||||||||||||||
|
| |||||||||||||||||||
PIK Payment-in-kind
| ‡ | The effective interest rates are based on settled commitment amount. |
| ‡‡ | Unless otherwise indicated, all principal amounts are denominated in United States Dollars. |
| * | Calculated as a percentage of net assets applicable to common shareholders. |
| + | Foreign security. |
See accompanying Notes to Financial Statements
39
Babson Global Credit Income Opportunities Fund 2014 Semi-Annual Report
SCHEDULE OF INVESTMENTS (UNAUDITED) (CONTINUED)
December 31, 2014
Distributions of investments by country of risk (excluding temporary cash investments) as a percentage of total investments in securities, is as follows:
| United States | 41.8% | |||||
| Cayman Islands | 17.9% | |||||
| United Kingdom | 16.1% | |||||
| Germany | 4.3% | |||||
| Netherlands | 4.0% | |||||
| France | 3.1% | |||||
| Ireland | 2.8% | |||||
| Canada | 2.6% | |||||
| Sweden | 1.9% | |||||
| Italy | 1.2% | |||||
| Other (Individually less than 1%) | 4.3% | |||||
|
| |||||
| Total | 100.0% | |||||
|
|
| ^ | Security acquired in a transaction exempt from registration under Rule 144A of the Securities Act of 1933. These securities may only be resold in transactions exempt from registration, normally to qualified institutional buyers. |
| § | Bank loans are exempt from registration under the Securities Act of 1933, as amended, but contain certain restrictions on resale and cannot be sold publicly. These loans pay interest at rates which adjust periodically. The interest rates shown for bank loans are the current interest rates at December 31, 2014. Bank loans are also subject to mandatory and/or optional prepayment which cannot be predicted. As a result, the remaining maturity may be substantially less than the stated maturity shown. |
| ¤ | For fair value measurement disclosure purposes, security is categorized as Level 3. |
| †† | Illiquid security. |
| # | Variable rate security. The interest rate shown is the rate in effect at December 31, 2014. |
A summary of outstanding financial instruments at December 31, 2014 is as follows:
Forward Foreign Currency Exchange Contracts to Buy
| EXPIRATION DATE | COUNTERPARTY | LOCAL CURRENCY | VALUE IN USD | IN EXCHANGE FOR USD | NET UNREALIZED APPRECIATION (DEPRECIATION) | |||||||||||||||||
| 01/14/15 | State Street Bank & Trust Co. | EUR | 828,461 | 1,002,575 | 1,024,168 | $ | (21,593 | ) | ||||||||||||||
| 01/14/15 | State Street Bank & Trust Co. | GBP | 212,669 | 331,442 | 331,288 | 154 | ||||||||||||||||
|
| |||||||||||||||||||||
Net unrealized depreciation on forward foreign exchange contracts to buy |
| $ | (21,439 | ) | ||||||||||||||||||
|
| |||||||||||||||||||||
Forward Foreign Currency Exchange Contracts to Sell
| EXPIRATION DATE | COUNTERPARTY | LOCAL CURRENCY | VALUE IN USD | IN EXCHANGE FOR USD | NET UNREALIZED APPRECIATION | |||||||||||||||||
| 01/14/15 | State Street Bank & Trust Co. | CHF | 222,916 | 224,245 | 228,002 | $ | 3,757 | |||||||||||||||
| 01/14/15 | State Street Bank & Trust Co. | EUR | 12,551,135 | 15,188,960 | 15,449,533 | 260,573 | ||||||||||||||||
| 01/14/15 | State Street Bank & Trust Co. | GBP | 5,349,958 | 8,337,860 | 8,339,542 | 1,682 | ||||||||||||||||
| 01/14/15 | State Street Bank & Trust Co. | SEK | 3,006,472 | 385,677 | 398,119 | 12,442 | ||||||||||||||||
|
| |||||||||||||||||||||
Net unrealized appreciation on forward foreign exchange contracts to sell |
| $ | 278,454 | |||||||||||||||||||
|
| |||||||||||||||||||||
Currency Legend
| CHF | – | Swiss Franc | ||
| EUR | – | Euro | ||
| GBP | – | British Pound Sterling | ||
| SEK | – | Swedish Krona |
See accompanying Notes to Financial Statements
40
Babson Capital Funds Trust 2014 Semi-Annual Report
NOTES TO FINANCIAL STATEMENTS (UNAUDITED)
December 31, 2014
| 1. | Organization |
Babson Capital Funds Trust (the “Trust”) was organized as a business trust under the laws of the Commonwealth of Massachusetts on May 3, 2013 and commenced operations on September 16, 2013. The Trust is registered under the Investment Company Act of 1940, as amended (the “1940 Act”), as a non-diversified, open-end management investment company. The Trust currently consists of two funds (separately, a “Fund” and collectively, the “Funds”): Babson Global Floating Rate Fund (“Global Floating Rate Fund”) and Babson Global Credit Income Opportunities Fund (“Global Credit Income Opportunities Fund”).
Babson Capital Management LLC (the “Adviser”), a wholly-owned indirect subsidiary of Massachusetts Mutual Life Insurance Company, is a registered investment adviser under the Investment Advisers Act of 1940, as amended, and serves as investment adviser to the Funds.
Babson Capital Global Advisors Limited (“Sub-Adviser”), an indirect wholly-owned subsidiary of the Adviser, serves as a sub-adviser with respect to the Funds’ European investments.
The primary investment objective of the Global Floating Rate Fund is to seek a high level of current income. The Fund seeks preservation of capital as a secondary investment objective. The primary investment objective of the Global Credit Income Opportunities Fund is to seek an absolute return, primarily through current income and secondarily through capital appreciation.
There can be no assurance that the Funds will achieve their investment objectives. The Funds will seek to take advantage of inefficiencies between geographies, primarily the North American and European high yield bond, loan and other debt markets. Under normal market conditions, the Global Floating Rate Fund will invest at least 80% of its net assets in income-producing floating rate debt securities, consisting of floating rate loans, bonds and notes, issued primarily by North American and Western European companies that are, at the time of purchase, rated below investment grade (below Baa3 by Moody’s Investors Service, Inc. (“Moody’s”) or below BBB- by either Standard & Poor’s Rating Services, a division of the McGraw-Hill Company, Inc. (“S&P”) or Fitch, Inc. (“Fitch”)) or unrated but judged by the Adviser or Sub-Adviser to be of comparable quality. Under normal market conditions, the Global Credit Income Opportunities Fund will invest at least 80% of its net assets in debt instruments, consisting of loans, bonds and notes, based in U.S. and non-U.S. markets, as well as over-the-counter and exchange-traded derivatives. Investments may
be issued or guaranteed by governments and their agencies, corporations, financial institutions and supranational organizations that the Funds believe have the potential to provide a high total return over time. A significant portion of the Funds’ investments in debt instruments will be denominated in a currency other than the U.S. dollar. Although the investments in non-U.S. dollar denominated assets may be on a currency hedged or unhedged basis, the Funds expect that, under current market conditions, they will seek to hedge substantially all of their exposure to foreign currencies.
Each Fund has four classes of shares: Class A, C, I, and Y, each with different expenses and dividends. A front-end sales charge is normally added to the net asset value (“NAV”) for Class A shares. There is no front-end sales charge in the case of Class C, I, and Y shares. There may be a contingent deferred sales charge (“CDSC”) in certain cases as follows: Class A shares purchased without an initial sales charge and redeemed within the first year of purchase (subject to certain exceptions as set forth in each Fund’s prospectus) and Class C shares redeemed within the first year of purchase. All classes of shares have equal voting rights, with the exception of matters that relate solely to one class.
Prior to commencement of operations on September 16, 2013, the Trust had no operations other than those relating to organizational matters and the sale of 10,000 Common Shares on August 20, 2013 to the Adviser, an affiliate of the Trust, for $100,000.
| 2. | Significant Accounting Policies |
The following is a summary of significant accounting policies followed consistently by the Funds in the preparation of their financial statements in conformity with accounting principles generally accepted in the United States of America (“U.S. GAAP”).
| A. | Valuation of Investments |
The Funds’ investments in fixed income securities are generally valued using the prices provided directly by independent third party services or provided directly from one or more broker dealers or market makers, each in accordance with the valuation policies and procedures approved by the Funds’ Board of Trustees (the “Board”).
The pricing services may use valuation models or matrix pricing, which consider yield or prices with respect to comparable bond quotations from bond dealers or by reference to other securities that are considered comparable
41
Babson Capital Funds Trust 2014 Semi-Annual Report
NOTES TO FINANCIAL STATEMENTS (UNAUDITED) (CONTINUED)
December 31, 2014
in such characteristics as credit rating, interest rates and maturity date to determine the current value. The Funds’ investments in bank loans are normally valued at the bid quotation obtained from dealers in loans by an independent pricing service in accordance with the Funds’ valuation policies and procedures approved by the Board. Short-term securities with remaining maturities of 60 days or less may be valued at amortized cost, which approximates fair value.
The Board has determined that it is in the best interest of the Funds and their shareholders to delegate the Board’s responsibility to a Valuation Committee, made up of officers of the Trust and employees of the Adviser, for: (1) determining whether market quotations are readily available for investments held by the Fund; and (2) determining the fair value of investments held by the Fund for which market quotations are not readily available or are deemed not reliable by the Adviser. In certain cases, authorized pricing service vendors may not provide prices for a security held by the Funds, or the price provided by such pricing service vendor is deemed unreliable by the Adviser. In such cases, the Funds may use market maker quotations provided by an established market maker for that security (i.e., broker quotes) to value the security if the Adviser has experience obtaining quotations from the market maker and the Adviser determines that quotations obtained from the market maker in the past have generally been reliable (or, if the Adviser has no such experience with respect to a market maker, it determines based on other information available to it that quotations to be obtained by it from the market maker are reasonably likely to be reliable). In any such case, the Adviser will review any market quotations so obtained in light of other information in its possession for their general liability.
Bond investments are valued on the basis of last available bid prices or current market quotations provided by dealers or pricing services. Bank loan positions are valued at the bid price from one or more brokers or dealers as obtained from a pricing service. In determining the value of a
particular investment, pricing services may use certain information with respect to transactions in such investments, quotations from dealers, pricing matrixes, market transactions in comparable investments, various relationships observed in the market between investments and calculated yield measures. Asset-backed and mortgage-backed securities are valued by independent pricing services using models that consider estimated cash flows of each tranche of the security, establish a benchmark yield and develop an estimated tranche-specific spread to the benchmark yield based on the unique attributes of the tranche.
Bank loans in which the Funds may invest have similar risks to lower-rated fixed income securities. Changes in the financial condition of the borrower or economic conditions or other circumstances may reduce the capacity of the borrower to make principal and interest payments on such instruments and may lead to defaults. Senior secured bank loans are supported by collateral; however, the value of the collateral may be insufficient to cover the amount owed to the Funds. By relying on a third party to administer a loan, the Funds are subject to the risk that the third party will fail to perform its obligations. The loans in which the Funds will invest are largely floating rate instruments; therefore, the interest rate risk generally is lower than for fixed-rate debt obligations. However, from the perspective of the borrower, an increase in interest rates may adversely affect the borrower’s financial condition. Due to the unique and customized nature of loan agreements evidencing loans and the private syndication thereof, loans are not as easily purchased or sold as publicly traded securities. Although the range of investors in loans has broadened in recent years, there can be no assurance that future levels of supply and demand in loan trading will provide the degree of liquidity which currently exists in the market. In addition, the terms of the loans may restrict their transferability without borrower consent. These factors may have an adverse effect on the market price and the Funds’ ability to dispose of particular portfolio investments. A less liquid secondary market also may make it more difficult for the Funds to obtain precise valuations of the high yield loans in its portfolio.
The Funds may invest in collateralized debt obligations (“CDOs”), which include collateralized bond obligations (“CBOs”) and collateralized loan obligations (“CLOs”). CBOs and CLOs are types of asset-backed securities. A CDO is an entity that is backed by a diversified pool of debt securities (CBOs) or syndicated bank loans (CLOs). The cash flows of the CDO can be split into multiple segments, called “tranches,” which will vary in risk profile and yield. The riskiest segment is the subordinated or “equity” tranche. This tranche bears the greatest risk of defaults from the underlying assets in the CDO and serves to protect the other, more senior, tranches from default in all but the most severe circumstances. Since it is shielded from defaults by the more junior tranches, a “senior” tranche will typically have higher credit ratings and lower yields than their underlying securities, and often receive investment grade ratings from one or more of the nationally recognized rating agencies. Despite the protection from the more junior tranches, senior tranches can experience substantial losses due to actual defaults, increased sensitivity
42
Babson Capital Funds Trust 2014 Semi-Annual Report
NOTES TO FINANCIAL STATEMENTS (UNAUDITED) (CONTINUED)
December 31, 2014
to future defaults and the disappearance of one or more protecting tranches as a result of changes in the credit profile of the underlying pool of assets.
Fair value is defined as the price that the Funds would receive upon selling an investment in a timely transaction to an independent buyer in the principal or most advantageous market of the investment. A three-tier hierarchy is utilized to maximize the use of observable market data and minimize the use of unobservable inputs and to establish classification of fair value measurements for disclosure purposes. Inputs refer broadly to the assumptions that market participants would use in pricing the asset or liability, including assumptions about risk. For example, market participants would consider the risk inherent in a particular valuation technique used to measure fair value, such as a pricing model, and/or the risk inherent in the inputs to the valuation technique. Inputs may be observable or unobservable. Observable inputs are inputs that reflect the assumptions market participants would use in pricing the asset or liability and are developed based on market data obtained from sources independent of the reporting entity. Unobservable inputs are inputs that reflect the reporting entity’s own assumptions about the assumptions market participants would use in pricing the asset or liability and are developed based on the best information available in the circumstances. The three-tier hierarchy of inputs is summarized in the three broad levels listed below.
Level 1 – quoted prices in active markets for identical securities
Level 2 – other significant observable inputs (including quoted prices for similar securities, interest rates, prepayment speeds, credit risk, etc.)
Level 3 – significant unobservable inputs (including the Funds’ own assumptions in determining the fair value of investments)
The availability of observable inputs can vary from security to security and is affected by a wide variety of factors, including, for example, the type of security, whether the security is new and not yet established in the marketplace, the liquidity of markets, and other characteristics particular to the security. To the extent that valuation is based on models or inputs that are less observable or unobservable in the market, the determination of fair value requires more judgment. Accordingly, the degree of judgment exercised in determining fair value is greatest for instruments categorized in level 3.
The inputs used to measure fair value may fall into different levels of the fair value hierarchy. In such cases, for disclosure purposes, the level in the fair value hierarchy within which the fair value measurement falls in its entirety is determined based on the lowest level input that is significant to the fair value measurement in its entirety.
The following is a summary of the inputs used as of December 31, 2014 in valuing the Funds’ investments:
Global Floating Rate Fund
| DESCRIPTION | LEVEL 1 | LEVEL 2 | LEVEL 3 | TOTAL INVESTMENTS | ||||||||||||
Assets:* | ||||||||||||||||
| Fixed Income: | ||||||||||||||||
Bank Loans | $ | – | $ | 81,761,457 | $ | 970,925 | $ | 82,732,382 | ||||||||
Corporate Bonds | – | 9,696,151 | – | 9,696,151 | ||||||||||||
|
|
|
|
|
|
|
| |||||||||
| Total Fixed Income | – | 91,457,608 | 970,925 | 92,428,533 | ||||||||||||
|
|
|
|
|
|
|
| |||||||||
Short-Term Investment: | ||||||||||||||||
Bank Deposit | – | 5,837,315 | – | 5,837,315 | ||||||||||||
Derivative Securities: | ||||||||||||||||
Forward Foreign Currency Exchange Contracts | – | 427,072 | – | 427,072 | ||||||||||||
|
|
|
|
|
|
|
| |||||||||
| Total Investments | $ | – | $ | 97,721,995 | $ | 970,925 | $ | 98,692,920 | ||||||||
|
|
|
|
|
|
|
| |||||||||
Liabilities:* | ||||||||||||||||
| Derivative Securities: | ||||||||||||||||
Forward Foreign Currency Exchange Contracts | – | (110,447 | ) | – | (110,447 | ) | ||||||||||
|
|
|
|
|
|
|
| |||||||||
Total Investments | $ | – | $ | 97,611,548 | $ | 970,925 | $ | 98,582,473 | ||||||||
|
|
|
|
|
|
|
| |||||||||
| * | There were no transfers between levels during the period ended December 31, 2014. |
43
Babson Capital Funds Trust 2014 Semi-Annual Report
NOTES TO FINANCIAL STATEMENTS (UNAUDITED) (CONTINUED)
December 31, 2014
The following is a reconciliation of investments with unobservable inputs (Level 3) that were used in determining fair value:
INVESTMENTS IN SECURITIES | BALANCE AS OF 2014 | REALIZED GAIN (LOSS) | CHANGE IN UNREALIZED | NET TRANSFERS IN (OUT) OF LEVEL 3 | ACCRUED PREMIUMS/ | PURCHASES | SALES | BALANCE AS OF DECEMBER 31, 2014 | CHANGE IN UNREALIZED | |||||||||||||||||||||||||||
Fixed Income | ||||||||||||||||||||||||||||||||||||
Bank Loans | $ | 497,619 | $ | 30 | $ | (30,688 | ) | $ | – | $ | 629 | $ | 508,257 | $ | (4,922 | ) | $ | 970,925 | $ | (30,688 | ) | |||||||||||||||
|
|
|
|
|
|
|
|
|
|
|
|
|
|
|
|
|
| |||||||||||||||||||
| Total | $ | 497,619 | $ | 30 | $ | (30,688 | ) | $ | – | $ | 629 | $ | 508,257 | $ | (4,922 | ) | $ | 970,925 | $ | (30,688 | ) | |||||||||||||||
|
|
|
|
|
|
|
|
|
|
|
|
|
|
|
|
|
| |||||||||||||||||||
Global Credit Income Opportunities Fund
| DESCRIPTION | LEVEL 1 | LEVEL 2 | LEVEL 3 | TOTAL INVESTMENTS | ||||||||||||
Assets: | ||||||||||||||||
| Fixed Income: | ||||||||||||||||
Asset-Backed Securities | $ | – | $ | 11,852,847 | $ | 210,000 | $ | 12,062,847 | ||||||||
Bank Loans | – | 23,556,912 | 1,116,577 | 24,673,489 | ||||||||||||
Corporate Bonds | – | 27,488,457 | – | 27,488,457 | ||||||||||||
|
|
|
|
|
|
|
| |||||||||
| Total Fixed Income | – | 62,898,216 | 1,326,577 | 64,224,793 | ||||||||||||
|
|
|
|
|
|
|
| |||||||||
Short-Term Investment: | ||||||||||||||||
Bank Deposit | – | 5,662,592 | – | 5,662,592 | ||||||||||||
Derivative Securities: | ||||||||||||||||
Forward Foreign Currency Exchange Contracts | – | 278,608 | – | 278,608 | ||||||||||||
|
|
|
|
|
|
|
| |||||||||
| Total Investments | $ | – | $ | 68,839,416 | $ | 1,326,577 | $ | 70,165,993 | ||||||||
|
|
|
|
|
|
|
| |||||||||
Liabilities: | ||||||||||||||||
| Derivative Securities: | ||||||||||||||||
Forward Foreign Currency Exchange Contracts | – | (21,593 | ) | – | (21,593 | ) | ||||||||||
|
|
|
|
|
|
|
| |||||||||
Total Investments | $ | – | $ | 68,817,823 | $ | 1,326,577 | $ | 70,144,400 | ||||||||
|
|
|
|
|
|
|
| |||||||||
The following is a reconciliation of investments with unobservable inputs (Level 3) that were used in determining fair value:
INVESTMENTS IN SECURITIES | BALANCE AS OF 2014 | REALIZED GAIN (LOSS) | CHANGE IN UNREALIZED APPRECIATION (DEPRECIATION) | NET TRANSFERS IN (OUT) OF LEVEL 3 | ACCRUED PREMIUMS/ | PURCHASES | SALES | BALANCE AS OF DECEMBER 31, 2014 | CHANGE IN UNREALIZED APPRECIATION (DEPRECIATION) FROM INVESTMENTS HELD AT DECEMBER 31, 2014 | |||||||||||||||||||||||||||
Fixed Income | ||||||||||||||||||||||||||||||||||||
Asset-Backed Securities | $ | – | $ | – | $ | (34,419 | ) | $ | 243,875 | $ | 544 | $ | – | $ | – | $ | 210,000 | $ | (34,419 | ) | ||||||||||||||||
|
|
|
|
|
|
|
|
|
|
|
|
|
|
|
|
|
| |||||||||||||||||||
Bank Loans | $ | 497,619 | $ | 30 | $ | (69,006 | ) | $ | 393,033 | $ | 629 | $ | 297,924 | $ | (3,652 | ) | $ | 1,116,577 | $ | (69,006 | ) | |||||||||||||||
|
|
|
|
|
|
|
|
|
|
|
|
|
|
|
|
|
| |||||||||||||||||||
| Total | $ | 497,619 | $ | 30 | $ | (103,425 | ) | $ | 636,908 | $ | 1,173 | $ | 297,924 | $ | (3,652 | ) | $ | 1,326,577 | $ | (103,425 | ) | |||||||||||||||
|
|
|
|
|
|
|
|
|
|
|
|
|
|
|
|
|
| |||||||||||||||||||
44
Babson Capital Funds Trust 2014 Semi-Annual Report
NOTES TO FINANCIAL STATEMENTS (UNAUDITED) (CONTINUED)
December 31, 2014
| B. | Forward Commitments and When-Issued Delayed Delivery Securities |
The Funds may purchase securities on a when-issued basis and may purchase or sell securities on a forward commitment basis. Settlement of such transactions normally occurs within a month or more after the purchase or sale commitment is made. The Funds may purchase securities under such conditions with the intention of actually acquiring them, but may enter into a separate agreement to sell the securities before the settlement date. Since the value of securities purchased may fluctuate prior to settlement, the Funds may be required to pay more at settlement than the security is worth. In addition, the Funds are not entitled to any of the interest earned prior to settlement. When purchasing a security on a delayed delivery basis, the Funds assume the rights and risks of ownership of the security, including the risk of price and yield fluctuations. In the event of default by the counterparty, the Funds’ maximum amount of loss is the unrealized appreciation of unsettled when-issued transactions, which is shown in the Schedule of Investments.
| C. | Cash and Short-Term Investments |
Cash and cash equivalents consist principally of short-term investments that are readily convertible into cash and have original maturities of three months or less. At December 31, 2014, all cash and cash equivalents are held by the custodian.
| D. | Investment Transactions, Related Investment Income and Expenses |
Investment transactions are accounted for on a trade date basis. Interest income is recorded on the accrual basis, including the amortization of premiums and accretion of discounts on bonds held using the yield-to-maturity method.
Realized gains and losses on investment transactions and unrealized appreciation and depreciation of investments are reported for financial statement and Federal income tax purposes on the identified cost method.
Expenses are recorded on the accrual basis as incurred.
| E. | Redemption Fees |
Redemptions of Fund shares held for 60 days or less may be assessed a 1% short-term trading fee and recorded as paid-in capital.
| F. | Use of Estimates |
The preparation of financial statements in conformity with U.S. GAAP requires management to make estimates and assumptions that affect the reported amounts of assets and liabilities at the date of the financial statements and the reported amounts of revenues and expenses during the reporting period. Actual results could differ from these estimates.
| G. | Federal Income Taxation |
The Funds have elected to be taxed as a Regulated Investment Company (“RIC”) under sub-chapter M of the U.S. Internal Revenue Code of 1986, as amended, and intend to maintain this qualification and to distribute substantially all of their net taxable income to their shareholders. As of December 31, 2014, the Funds had no uncertain tax positions that would require financial statement recognition, de-recognition, or disclosure. The Funds file a U.S. federal income tax return annually after their fiscal year-end, which is subject to examination by the Internal Revenue Service for a period of three years from the date of the filings.
| H. | Dividends and Distributions |
The Funds declared and paid dividends monthly from net investment income. To the extent that these distributions exceed net investment income, they may be classified as return of capital. The Funds also pay a distribution at least annually from their net realized capital gains, if any. Dividends and distributions are recorded on the ex-dividend date. All common shares have equal dividend and other distribution rights. A notice disclosing the source(s) of a distribution will be provided if payment is made from any source other than net investment income. Any such notice would be provided only for informational purposes in order to comply with the requirements of Section 19(a) of the 1940 Act and not for tax reporting purposes. The tax composition of the Funds’ distributions for each calendar year is reported on Internal Revenue Service Form 1099-DIV. Per the Funds’ prospectuses, effective January 1, 2015, each Fund shall declare a dividend daily based on the Adviser’s projections of the Funds’ estimated net investment income and distribute such dividend monthly.
Dividends from net investment income and distributions from realized gains from investment transactions have been determined in accordance with Federal income tax regulations and may differ from net investment income and realized gains recorded by the Funds for financial reporting purposes. These differences, which could be temporary or
45
Babson Capital Funds Trust 2014 Semi-Annual Report
NOTES TO FINANCIAL STATEMENTS (UNAUDITED) (CONTINUED)
December 31, 2014
permanent in nature may result in reclassification of distributions; however, net investment income, net realized gains and losses, and net assets are not affected.
| I. | Bank Loans |
The Funds may invest in bank loans, which usually take the form of loan participations and assignments. Loan participations and assignments are agreements to make money available to U.S. or foreign corporations, partnerships or other business entities (the “Borrower”) in a specified amount, at a specified rate and within a specified time. A loan is typically originated, negotiated and structured by a U.S. or foreign bank, insurance company or other financial institution (the “Agent”) for a group of loan investors (“Loan Investors”). The Agent typically administers and enforces the loan on behalf of the other Loan Investors in the syndicate and may hold any collateral on behalf of the Loan Investors. Such loan participations and assignments are typically senior, secured and collateralized in nature. The Funds record an investment when the Borrower withdraws money and records interest as earned. These loans pay interest at rates which are periodically reset by reference to a base lending rate plus a spread. These base lending rates are generally the prime rate offered by a designated U.S. bank or London InterBank Offered Rate (“LIBOR”).
The loans in which the Funds invest may be subject to some restrictions on resale. For example, the Funds may be contractually obligated to receive approval from the Agent and/or Borrower prior to the sale of these investments. The Funds generally have no right to enforce compliance with the terms of the loan agreement with the Borrower. As a result, the Funds assume the credit risk of the Borrower, the selling participant and any other persons interpositioned between the Funds and the Borrower (“Intermediate Participants”). In the event that the Borrower, selling participant or Intermediate Participants become insolvent or enter into bankruptcy, the Funds may incur certain costs and delays in realizing payment or may suffer a loss of principal and/or interest.
Unfunded commitments represent the remaining obligation of the Funds to the Borrower. At any point in time, up to the maturity date of the issue, the Borrower may demand the unfunded portion. Until demanded by the Borrower, unfunded commitments are not recognized as an asset on the Statements of Assets and Liabilities. Unrealized appreciation/depreciation on unfunded commitments presented on the Statements of Assets and Liabilities represents mark to market of the unfunded portion of the Funds’ bank loans. As of December 31,
2014, the Global Floating Rate Fund had one unfunded loan commitment which amounted to $9,870 of par and had cost and fair value of $9,778 and $9,706, respectively. As of December 31, 2014, the Global Credit Income Opportunities Fund had one unfunded loan commitment which amounted to $4,935 of par and had cost and fair value of $4,889 and $4,853, respectively.
| J. | Derivative Instruments |
The following is a description of the derivative instruments that the Funds utilize as part of their investment strategy, including the primary underlying risk exposures related to the instrument.
Forward Foreign Currency Exchange Contracts – The Funds are subject to foreign currency exchange rate risk in the normal course of pursuing their investment objectives. The Funds may use forward foreign currency exchange contracts to hedge against changes in the value of foreign currencies. The Funds may enter into forward foreign currency exchange contracts obligating the Funds to deliver or receive a currency at a specified future date. Forward contracts are valued daily and unrealized appreciation or depreciation is recorded daily as the difference between the contract exchange rate and the closing forward rate applied to the face amount of the contract. A realized gain or loss is recorded at the time the forward contract expires. Credit risk may arise as a result of the failure of the counterparty to comply with the terms of the contract. The Funds consider the creditworthiness of each counterparty to a contract in evaluating potential credit risk quarterly. The Funds are also subject to credit risk with respect to the counterparties to derivative contracts that are not cleared through a central counterparty but instead are traded over-the-counter between two counterparties. If a counterparty to an over-the-counter derivative becomes bankrupt or otherwise fails to perform its obligations under a derivative contract due to financial difficulties, the Funds may experience significant delays in obtaining any recovery under the derivative contract in a bankruptcy or other reorganization proceeding. The Funds may obtain only a limited recovery or may obtain no recovery in such circumstances. The counterparty risk for cleared derivatives is generally lower than for uncleared over-the-counter derivative transactions since generally a clearing organization becomes substituted for each counterparty to a cleared derivative contract and, in effect, guarantees the parties’ performance under the contract as each party to a trade looks only to the clearing house for performance of financial obligations. However, there can be no assurance
46
Babson Capital Funds Trust 2014 Semi-Annual Report
NOTES TO FINANCIAL STATEMENTS (UNAUDITED) (CONTINUED)
December 31, 2014
that the clearing house, or its members, will satisfy its obligations to the Funds. In addition, in the event of a bankruptcy of a clearing house, the Funds could experience a loss of the funds deposited with such clearing house as margin and of any profits on its open positions. The counterparty risk to the Funds is limited to the net unrealized gain, if any, on the contract.
The use of forward foreign currency exchange contracts does not eliminate fluctuations in the underlying prices of the Funds’ investment securities; however, it does establish a rate of exchange that can be achieved in the future. The use of forward foreign currency exchange contracts involves the risk that anticipated currency movements will not be accurately predicted. A forward foreign currency exchange contract would limit the risk of loss due to a decline in the value of a particular currency; however, it would also limit any potential gain that might result should the value of the currency increase instead of decrease. These contracts may involve market risk in excess of the amount of receivable or payable reflected on the Statement of Assets and Liabilities.
The Funds may purchase call or put options. When a Fund purchases an option, the premium paid by the Fund is recorded as an asset and is subsequently adjusted to the current fair value of the option purchased. Purchasing call options tends to increase the Fund’s exposure to the underlying instrument. Purchasing put options tends to decrease the Fund’s exposure to the underlying instrument. Premiums paid for purchasing options that expire are treated as realized losses. Premiums paid for purchasing options that are exercised or closed are added to the amounts paid or offset against the proceeds on the underlying security to determine the realized gain or loss. The risks associated with purchasing put and call options are potential loss of the premium paid and, in the instances of over-the-counter derivatives, the failure of the counterparty to honor its obligation under the contract.
The Funds may enter into swap options (“swaptions”). A swaption is an option to enter into a pre-defined swap agreement by some specified date in the future. The writer of the swaption becomes the counterparty to the swap if the buyer exercises. The interest rate swaption agreement will specify whether the buyer of the swaption will be a fixed-rate receiver or a fixed rate buyer. Depending on the terms of the particular option agreement, a Fund generally will incur a greater degree of risk when the Fund writes a swaption than the Fund will incur when it purchases a swaption. When a Fund purchases a swaption, the Fund’s
risk of loss is limited to the amount of the premium it has paid should it decide to let the swaption expire unexercised.
During the period ended December 31, 2014, the Funds’ direct investment in derivatives consisted of forward foreign currency exchange contracts and purchased options.
The following is a summary of the fair value of derivative instruments held directly by the Funds as of December 31, 2014:
Global Floating Rate Fund
| ASSET DERIVATIVES | STATEMENTS OF ASSETS AND LIABILITIES LOCATION | FOREIGN EXCHANGE CONTRACTS RISK | ||||
Forward Foreign Currency Exchange Contracts | Unrealized appreciation on forward foreign currency exchange contracts | $ | 427,072 | |||
|
| |||||
Total | $ | 427,072 | ||||
|
| |||||
| LIABILITY DERIVATIVES | STATEMENTS OF ASSETS AND LIABILITIES LOCATION | FOREIGN EXCHANGE CONTRACTS RISK | ||||
Forward Foreign Currency Exchange Contracts | Unrealized depreciation on forward foreign currency exchange contracts | $ | 110,447 | |||
|
| |||||
Total | $ | 110,447 | ||||
|
| |||||
Global Credit Income Opportunities Fund
| ASSET DERIVATIVES | STATEMENTS OF ASSETS AND LIABILITIES LOCATION | FOREIGN EXCHANGE CONTRACTS RISK | ||||
Forward Foreign Currency Exchange Contracts | Unrealized appreciation on forward foreign currency exchange contracts | $ | 278,608 | |||
|
| |||||
Total | $ | 278,608 | ||||
|
| |||||
47
Babson Capital Funds Trust 2014 Semi-Annual Report
NOTES TO FINANCIAL STATEMENTS (UNAUDITED) (CONTINUED)
December 31, 2014
| LIABILITY DERIVATIVES | STATEMENTS OF ASSETS AND LIABILITIES LOCATION | FOREIGN EXCHANGE CONTRACTS RISK | ||||
Forward Foreign Currency Exchange Contracts | Unrealized depreciation on forward foreign currency exchange contracts | $ | 21,593 | |||
|
| |||||
Total | $ | 21,593 | ||||
|
| |||||
Amount of Realized Gain/(Loss) on Derivatives:
Global Floating Rate Fund
| FOREIGN EXCHANGE CONTRACTS RISK | ||||
Forward Foreign Currency Exchange Contracts | $ | 3,393,193 | ||
|
| |||
Total | $ | 3,393,193 | ||
|
| |||
Global Credit Income Opportunities Fund
| FOREIGN EXCHANGE CONTRACTS RISK | INTEREST RISK | TOTAL | ||||||||||
Forward Foreign Currency Exchange Contracts | $ | 2,360,073 | $ | – | $ | 2,360,073 | ||||||
Purchased Options | – | (68,501 | ) | (68,501 | ) | |||||||
|
|
|
|
|
| |||||||
Total | $ | 2,360,073 | $ | (68,501 | ) | $ | 2,291,572 | |||||
|
|
|
|
|
| |||||||
Change in Unrealized Appreciation/(Depreciation) on Derivatives:
Global Floating Rate Fund
| FOREIGN EXCHANGE CONTRACTS RISK | ||||
Forward Foreign Currency Exchange Contracts | $ | 650,794 | ||
|
| |||
Total | $ | 650,794 | ||
|
| |||
Global Credit Income Opportunities Fund
| FOREIGN EXCHANGE CONTRACTS RISK | INTEREST RISK | TOTAL | ||||||||||
Forward Foreign Currency Exchange Contracts | $ | 473,480 | $ | – | $ | 473,480 | ||||||
Purchased Options | – | (10,693 | ) | (10,693 | ) | |||||||
|
|
|
|
|
| |||||||
Total | $ | 473,480 | $ | (10,693 | ) | $ | 462,787 | |||||
|
|
|
|
|
| |||||||
Global Floating Rate Fund
| NUMBER OF CONTRACTS, NOTIONAL AMOUNTS OF SHARES/UNITS | FOREIGN EXCHANGE CONTRACTS RISK | |||
Forward Foreign Currency Exchange Contracts(1) | 39,199,397 | |||
|
| |||
Total | 39,199,397 | |||
|
| |||
| (1) | Volume of derivative activity is based on an average of month-end notional amounts outstanding during the period. |
Global Credit Income Opportunities Fund
| NUMBER OF CONTRACTS, NOTIONAL AMOUNTS OF SHARES/ UNITS | FOREIGN EXCHANGE CONTRACTS RISK | INTEREST RATE RISK | TOTAL | |||||||||
Forward Foreign Currency Exchange Contracts(1) | 26,998,631 | – | 26,998,631 | |||||||||
Purchased Options(1) | – | 15,857,143 | 15,857,143 | |||||||||
|
|
|
|
|
| |||||||
Total | 26,998,631 | 15,857,143 | 42,855,774 | |||||||||
|
|
|
|
|
| |||||||
| (1) | Volume of derivative activity is based on an average of month-end notional amounts outstanding during the period. |
| K. | Disclosures about Offsetting Assets and Liabilities |
The Financial Accounting Standards Board (“FASB”) issued Accounting Standards Update No. 2011-11 “Disclosures about Offsetting Assets and Liabilities” (“ASU 2011-11”). These disclosure requirements are intended to help better assess the effect or potential effect of offsetting
48
Babson Capital Funds Trust 2014 Semi-Annual Report
NOTES TO FINANCIAL STATEMENTS (UNAUDITED) (CONTINUED)
December 31, 2014
arrangements on a fund’s financial position. In addition, FASB issued Accounting Standards Update No. 2013-01 “Clarifying the Scope of Offsetting Assets and Liabilities” (“ASU 2013-01”), specifying which transactions are subject to disclosures about offsetting.
The following tables illustrate gross and net information about recognized assets eligible for offset in the Statement
of Assets and Liabilities; and disclose such amounts subject to an enforceable master netting agreement or similar agreement, by counterparty. A master netting agreement is an agreement between two counterparties who have multiple contracts with each other that provides for the net settlement of all contracts, as well as cash collateral, through a single payment in the event of default on or termination of any one contract:
Global Floating Rate Fund
| DESCRIPTION | GROSS AMOUNTS OF RECOGNIZED ASSETS | GROSS AMOUNTS OFFSET IN THE STATEMENTS OF ASSETS AND LIABILITIES | NET AMOUNTS OF ASSETS PRESENTED IN THE STATEMENTS OF ASSETS AND LIABILITIES | |||||||||
Forward Foreign Currency Exchange Contracts | $ | 427,072 | $ | – | $ | 427,072 | ||||||
|
|
|
|
|
| |||||||
Total | $ | 427,072 | $ | – | $ | 427,072 | ||||||
|
|
|
|
|
| |||||||
| GROSS AMOUNTS NOT OFFSET IN THE STATEMENTS OF ASSETS AND LIABILITIES | ||||||||||||||||
| COUNTERPARTY | NET AMOUNTS OF ASSETS PRESENTED IN THE STATEMENTS OF ASSETS AND LIABILITIES | FINANCIAL INSTRUMENT (a) | CASH COLLATERAL RECEIVED (a) | NET AMOUNT (b) | ||||||||||||
State Street Bank & Trust Co. | $ | 427,072 | $ | (110,447 | ) | $ | – | $ | 316,625 | |||||||
|
|
|
|
|
|
|
| |||||||||
Total | $ | 427,072 | $ | (110,447 | ) | $ | – | $ | 316,625 | |||||||
|
|
|
|
|
|
|
| |||||||||
| (a) | Collateral disclosed is limited to an amount not to exceed 100% of the net amount of assets presented in the Statements of Assets and Liabilities, for each respective counterparty. |
| (b) | Net Amount represents the amount that is subject to loss in the event of a counterparty failure as of December 31, 2014. |
| DESCRIPTION | GROSS AMOUNTS OF RECOGNIZED LIABILITIES | GROSS AMOUNTS OFFSET IN THE STATEMENTS OF ASSETS AND LIABILITIES | NET AMOUNTS OF LIABILITIES PRESENTED IN THE STATEMENTS OF ASSETS AND LIABILITIES | |||||||||
Forward Foreign Currency Exchange Contracts | $ | 110,447 | $ | – | $ | 110,447 | ||||||
|
|
|
|
|
| |||||||
Total | $ | 110,447 | $ | – | $ | 110,447 | ||||||
|
|
|
|
|
| |||||||
| GROSS AMOUNTS NOT OFFSET IN THE STATEMENTS OF ASSETS AND LIABILITIES | ||||||||||||||||
| COUNTERPARTY | NET AMOUNTS OF LIABILITIES PRESENTED IN THE STATEMENTS OF ASSETS AND LIABILITIES | FINANCIAL INSTRUMENT (a) | CASH COLLATERAL PLEDGED (a) | NET AMOUNT (b) | ||||||||||||
State Street Bank & Trust Co. | $ | 110,447 | $ | (110,447 | ) | $ | – | $ | – | |||||||
|
|
|
|
|
|
|
| |||||||||
Total | $ | 110,447 | $ | (110,447 | ) | $ | – | $ | – | |||||||
|
|
|
|
|
|
|
| |||||||||
| (a) | Collateral disclosed is limited to an amount not to exceed 100% of the net amount of assets presented in the Statements of Assets and Liabilities, for each respective counterparty. |
| (b) | Net Amount represents the amount that is subject to loss in the event of a counterparty failure as of December 31, 2014. |
49
Babson Capital Funds Trust 2014 Semi-Annual Report
NOTES TO FINANCIAL STATEMENTS (UNAUDITED) (CONTINUED)
December 31, 2014
Global Credit Income Opportunities Fund
| DESCRIPTION | GROSS AMOUNTS OF RECOGNIZED ASSETS | GROSS AMOUNTS OFFSET IN THE STATEMENTS OF ASSETS AND LIABILITIES | NET AMOUNTS OF ASSETS PRESENTED IN THE STATEMENTS OF ASSETS AND LIABILITIES | |||||||||
Forward Foreign Currency Exchange Contracts | $ | 278,608 | $ | — | $ | 278,608 | ||||||
|
|
|
|
|
| |||||||
Total | $ | 278,608 | $ | — | $ | 278,608 | ||||||
|
|
|
|
|
| |||||||
| GROSS AMOUNTS NOT OFFSET IN THE STATEMENTS OF ASSETS AND LIABILITIES | ||||||||||||||||
| COUNTERPARTY | NET AMOUNTS OF ASSETS PRESENTED IN THE STATEMENTS OF ASSETS AND LIABILITIES | FINANCIAL INSTRUMENT (a) | CASH COLLATERAL RECEIVED (a) | NET AMOUNT (b) | ||||||||||||
State Street Bank & Trust Co. | $ | 278,608 | $ | (21,593 | ) | $ | — | $ | 257,015 | |||||||
|
|
|
|
|
|
|
| |||||||||
Total | $ | 278,608 | $ | (21,593 | ) | $ | — | $ | 257,015 | |||||||
|
|
|
|
|
|
|
| |||||||||
| (a) | Collateral disclosed is limited to an amount not to exceed 100% of the net amount of assets presented in the Statements of Assets and Liabilities, for each respective counterparty. |
| (b) | Net Amount represents the amount that is subject to loss in the event of a counterparty failure as of December 31, 2014. |
| DESCRIPTION | GROSS AMOUNTS OF RECOGNIZED LIABILITIES | GROSS AMOUNTS OFFSET IN THE STATEMENTS OF ASSETS AND LIABILITIES | NET AMOUNTS OF LIABILITIES PRESENTED IN THE STATEMENTS OF ASSETS AND LIABILITIES | |||||||||
Forward Foreign Currency Exchange Contracts | $ | 21,593 | $ | — | $ | 21,593 | ||||||
|
|
|
|
|
| |||||||
Total | $ | 21,593 | $ | — | $ | 21,593 | ||||||
|
|
|
|
|
| |||||||
| GROSS AMOUNTS NOT OFFSET IN THE STATEMENTS OF ASSETS AND LIABILITIES | ||||||||||||||||
| COUNTERPARTY | NET AMOUNTS OF LIABILITIES PRESENTED IN THE STATEMENTS OF ASSETS AND LIABILITIES | FINANCIAL INSTRUMENT (a) | CASH COLLATERAL PLEDGED (a) | NET AMOUNT (b) | ||||||||||||
State Street Bank & Trust Co. | $ | 21,593 | $ | (21,593 | ) | $ | — | $ | — | |||||||
|
|
|
|
|
|
|
| |||||||||
Total | $ | 21,593 | $ | (21,593 | ) | $ | — | $ | — | |||||||
|
|
|
|
|
|
|
| |||||||||
| (a) | Collateral disclosed is limited to an amount not to exceed 100% of the net amount of assets presented in the Statements of Assets and Liabilities, for each respective counterparty. |
| (b) | Net Amount represents the amount that is subject to loss in the event of a counterparty failure as of December 31, 2014. |
| L. | Foreign Securities |
Investing in securities of foreign companies and foreign governments involves special risks and considerations not typically associated with investing in U.S. companies and the U.S. government. These risks include valuation of currencies and adverse political and economic developments. Moreover, securities of many foreign companies, foreign governments, and their markets may be less liquid and their prices more volatile than those of securities of comparable U.S. companies and the U.S. government.
50
Babson Capital Funds Trust 2014 Semi-Annual Report
NOTES TO FINANCIAL STATEMENTS (UNAUDITED) (CONTINUED)
December 31, 2014
| M. | Foreign Currency Translation |
The books and records of the Funds are maintained in U.S. dollars. Foreign currency transactions are translated into U.S. dollars on the following basis: (i) market value of investment securities, assets and liabilities at the daily rates of exchange, and (ii) purchases and sales of investment securities, dividend and interest income and certain expenses at the rates of exchange prevailing on the respective dates of such transactions. For financial reporting purposes, the Funds do not isolate changes in the exchange rate of investment securities from the fluctuations arising from changes in the market prices of securities. However, for Federal income tax purposes, the Funds do isolate and treat as ordinary income the effect of changes in foreign exchange rates on realized gain or loss from the sale of investment securities and payables and receivables arising from trade-date and settlement-date differences.
| N. | Counterparty Risk |
The Funds seek to manage counterparty credit risk by entering into agreements only with counterparties the Adviser believes have the financial resources to honor their obligations. The Adviser monitors the financial stability of the Funds’ counterparties.
| 3. | Advisory Fee |
The Funds have entered into an Investment Management Agreement (the “Agreement”) with the Adviser. Pursuant to the Agreement, the Global Floating Rate Fund agrees to pay the Adviser a fee payable at the end of each calendar month, at an annual rate of 0.65% of the Fund’s average daily net assets during such month. The Global Credit Income Opportunities Fund agrees to pay the Adviser a fee payable at the end of each calendar month, at an annual rate of 0.75% of the Fund’s average daily net assets during such month.
The Adviser has contractually agreed to waive and/or reimburse a portion of its fees and/or reimburse expenses (excluding 12b-1 fees, interest expenses, taxes, fees incurred in acquiring and disposing of securities and extraordinary expenses) such that total net annual operating expenses for each class do not exceed the following rates:
| CLASS A | CLASS C | CLASS I | CLASS Y | |||||||||||||
Global Floating Rate Fund | 1.05 | % | 1.80 | % | 0.75 | % | 0.75 | % | ||||||||
Global Credit Income Opportunities Fund | 1.20 | % | 1.95 | % | 0.95 | % | 0.95 | % | ||||||||
Pursuant to the expense waiver/reimbursement agreement, the Adviser is entitled to be reimbursed for any fees the Adviser waives and Fund expenses that the Adviser reimburses for a period of three years following such fee waivers and expense reimbursements, to the extent that such reimbursement of the Adviser by a Fund will not cause the Fund to exceed any applicable expense limitation that is in place for the Fund.
The contractual management fee waiver and expense reimbursement agreements between the Funds and the Adviser may be terminated only upon the approval of the Funds’ Board of Trustees.
Subject to the supervision of the Adviser and the Board, the Sub-Adviser manages the investment and reinvestment of a portion of the assets of the Funds, as allocated from time to time to the Sub-Adviser. The Adviser (not the Funds) will pay a portion of the fees it receives to the Sub-Adviser in return for its services.
| 4. | 12b-1 Distribution and Service Plan |
ALPS Distributors, Inc. (the “Distributor”) is the Distributor of the Funds’ shares as of December 31, 2014.
The Funds have adopted a Distribution and Shareholder Services Plan (the “Plan”), pursuant to Rule 12b-1 under the 1940 Act. Under the Plan, each Fund’s Class A and Class C shares may compensate certain financial institutions, including the Distributor, for certain distribution and shareholder servicing activities. The Funds’ Class A shares may expend an aggregate amount, on an annual basis, not to exceed 0.25% of the value of the average daily net assets of a Fund attributable to Class A shares and 1.00% of the value of the average daily net assets of a Fund attributable to Class C shares. The Plan provides that the distribution and service fees are payable to the Distributor regardless of the amounts actually expended by the Distributor for distribution of the Funds’ shares and service activities.
Under its terms, the Funds’ Plan shall remain in effect from year to year, provided such continuance is approved annually by a vote of a majority of the Boards’ members and a majority of those Boards’ members who are not “interested persons” of the Funds and who have no direct or indirect financial interest in the operation of the Plan or in any agreement related to the Plan.
51
Babson Capital Funds Trust 2014 Semi-Annual Report
NOTES TO FINANCIAL STATEMENTS (UNAUDITED) (CONTINUED)
December 31, 2014
| 5. | Sales Charges and Commissions |
For the period ended December 31, 2014, the amount of sales charges retained by the Distributor on sales of Class A and Class C shares of the Funds were as follows:
| CLASS C | ||||
Global Floating Rate Fund | $ | 8,614 | ||
Global Credit Income Opportunities Fund | 9,359 | |||
For the period ended December 31, 2014, the Distributor received the following commissions on sales of shares of the Funds, after concessions were paid to authorized dealers:
| DISTRIBUTOR COMMISSIONS | DEALERS’ CONCESSIONS | |||||||
Global Floating Rate Fund | $ | 1,426 | $ | 15,814 | ||||
Global Credit Income Opportunities Fund | 1,680 | 10,449 | ||||||
| 6. | Administrator, Custody, and Transfer Agent Fees |
The Funds have engaged State Street Bank and Trust (“SSB”) to serve as the Funds’ administrator, custodian, fund accountant, and transfer agent. For each of these services, the Funds have agreed to pay SSB a fee payable at the end of each calendar month pursuant to fee agreements between SSB and the Funds. For the period ended December 31, 2014, the aggregate effective fee for these services was at an annual rate of 0.38% and 0.40% of Global Floating Rate Fund and Global Credit Income Opportunities Fund’s average daily managed assets, respectively.
| 7. | Income Taxes |
It is the Funds’ intention to qualify as a RIC under subchapter M of the Internal Revenue Code and distribute all of its taxable income. Accordingly, no provision for Federal income taxes is required in the financial statements.
The tax character of dividends paid to shareholders during tax year ended June 30, 2014 was as follows:
| ORDINARY INCOME | RETURN OF CAPITAL | TOTAL DISTRIBUTIONS PAID | ||||||||||
Global Floating Rate Fund | $ | 1,730,080 | $ | 61,792 | $ | 1,791,872 | ||||||
Global Credit Income Opportunities Fund | 1,572,417 | – | 1,572,417 | |||||||||
In accordance with the Regulated Investment Company Modernization Act of 2010, the Funds will carryforward capital losses incurred in taxable years beginning after December 22, 2010 (“post-enactment losses”) indefinitely. Post-enactment losses will also retain their character as either short-term or long-term and be utilized before any pre-enactment losses.
As of December 31, 2014, the aggregate unrealized security gains and losses based on cost for U.S. federal income tax purposes were as follows:
| COST OF INVESTMENTS | GROSS UNREALIZED APPRECIATION | GROSS UNREALIZED DEPRECIATION | NET UNREALIZED DEPRECIATION | |||||||||||||
Global Floating Rate Fund | $ | 104,612,165 | $ | 30,901 | $ | (6,377,218 | ) | $ | (6,346,317 | ) | ||||||
Global Credit Income Opportunities Fund | 74,778,794 | 150,692 | (5,042,101 | ) | (4,891,409 | ) | ||||||||||
The difference between book-basis and tax-basis unrealized gains (losses) is attributable to wash sales.
| 8. | Investment Transactions |
Purchases and sales of securities (excluding short-term debt securities) for the period ended December 31, 2014 were as follows:
| PURCHASES | SALES | |||||||
Global Floating Rate Fund | $ | 32,876,254 | $ | 45,133,980 | ||||
Global Credit Income Opportunities Fund | 47,650,961 | 35,393,911 | ||||||
52
Babson Capital Funds Trust 2014 Semi-Annual Report
NOTES TO FINANCIAL STATEMENTS (UNAUDITED) (CONTINUED)
December 31, 2014
| 9. | Common Stock |
Transactions in common stock for the period ended December 31, 2014 were as follows:
Global Floating Rate Fund
| FOR THE SIX MONTHS ENDED DECEMBER 31, 2014 | PERIOD FROM SEPTEMBER 16, 2013 THROUGH JUNE 30, 2014 (1) | |||||||||||||||
| CLASS A | SHARES | AMOUNT | SHARES | AMOUNT | ||||||||||||
Shares sold | 713,779 | $ | 7,172,732 | 1,222,507 | $ | 12,481,232 | ||||||||||
Shares sold through reinvestments of distributions | 67,489 | 658,990 | 13,651 | 139,125 | ||||||||||||
Shares redeemed | (600,444 | ) | (6,006,161 | ) | (13,926 | ) | (142,258 | ) | ||||||||
Redemption fees | – | 182 | – | – | ||||||||||||
|
|
|
|
|
|
|
| |||||||||
Net increase | 180,824 | $ | 1,825,743 | 1,222,232 | $ | 12,478,099 | ||||||||||
|
|
|
|
|
|
|
| |||||||||
CLASS C | ||||||||||||||||
Shares sold | 98,403 | $ | 984,967 | 233,502 | $ | 2,379,349 | ||||||||||
Shares sold through reinvestments of distributions | 13,202 | 127,817 | 2,446 | 24,864 | ||||||||||||
Shares redeemed | (4,200 | ) | (41,254 | ) | (152 | ) | (1,544 | ) | ||||||||
Redemption fees | – | 39 | – | – | ||||||||||||
|
|
|
|
|
|
|
| |||||||||
Net increase | 107,405 | $ | 1,071,569 | 235,796 | $ | 2,402,669 | ||||||||||
|
|
|
|
|
|
|
| |||||||||
CLASS I | ||||||||||||||||
Shares sold | – | $ | – | 3,150,134 | $ | 31,550,060 | ||||||||||
Shares sold through reinvestments of distributions | 164,488 | 1,607,096 | 59,739 | 610,026 | ||||||||||||
Shares redeemed | – | – | – | – | ||||||||||||
Redemption fees | – | 460 | – | – | ||||||||||||
|
|
|
|
|
|
|
| |||||||||
Net increase | 164,488 | $ | 1,607,556 | 3,209,873 | $ | 32,160,086 | ||||||||||
|
|
|
|
|
|
|
| |||||||||
CLASS Y | ||||||||||||||||
Shares sold | 583,121 | $ | 5,886,061 | 6,676,274 | $ | 67,761,452 | ||||||||||
Shares sold through reinvestments of distributions | 300,049 | 2,936,125 | 97,618 | 996,669 | ||||||||||||
Shares redeemed | (1,459,962 | ) | (14,541,802 | ) | (210,789 | ) | (2,155,109 | ) | ||||||||
Redemption fees | – | 888 | – | – | ||||||||||||
|
|
|
|
|
|
|
| |||||||||
Net increase (decrease) | (576,792 | ) | $ | (5,718,728 | ) | 6,563,103 | $ | 66,603,012 | ||||||||
|
|
|
|
|
|
|
| |||||||||
| (1) | Fund commenced operations on September 16, 2013. |
53
Babson Capital Funds Trust 2014 Semi-Annual Report
NOTES TO FINANCIAL STATEMENTS (UNAUDITED) (CONTINUED)
December 31, 2014
Global Credit Income Opportunities Fund
| FOR THE SIX MONTHS ENDED DECEMBER 31, 2014 | PERIOD FROM SEPTEMBER 16, 2013 THROUGH JUNE 30, 2014 (1) | |||||||||||||||
| CLASS A | SHARES | AMOUNT | SHARES | AMOUNT | ||||||||||||
Shares sold | 1,832,648 | $ | 18,948,319 | 250,892 | $ | 2,588,194 | ||||||||||
Shares sold through reinvestments of distributions | 91,590 | 891,315 | 3,520 | 36,805 | ||||||||||||
Shares redeemed | (681,782 | ) | (6,806,582 | ) | (6,628 | ) | (69,594 | ) | ||||||||
Redemption fees | – | 1,022 | – | – | ||||||||||||
|
|
|
|
|
|
|
| |||||||||
Net increase | 1,242,456 | $ | 13,034,074 | 247,784 | $ | 2,555,405 | ||||||||||
|
|
|
|
|
|
|
| |||||||||
CLASS C | ||||||||||||||||
Shares sold | 113,172 | $ | 1,158,927 | 89,635 | $ | 933,045 | ||||||||||
Shares sold through reinvestments of distributions | 9,200 | 88,675 | 900 | 9,400 | ||||||||||||
Shares redeemed | (10,917 | ) | (106,545 | ) | (159 | ) | (1,661 | ) | ||||||||
Redemption fees | – | 109 | – | – | ||||||||||||
|
|
|
|
|
|
|
| |||||||||
Net increase | 111,455 | $ | 1,141,166 | 90,376 | $ | 940,784 | ||||||||||
|
|
|
|
|
|
|
| |||||||||
CLASS I | ||||||||||||||||
Shares sold | – | $ | – | 2,455,000 | $ | 24,550,000 | ||||||||||
Shares sold through reinvestments of distributions | 171,928 | 1,671,819 | 70,277 | 734,939 | ||||||||||||
Shares redeemed | – | – | – | – | ||||||||||||
Redemption fees | – | 1,685 | – | – | ||||||||||||
|
|
|
|
|
|
|
| |||||||||
Net increase | 171,928 | $ | 1,673,504 | 2,525,277 | $ | 25,284,939 | ||||||||||
|
|
|
|
|
|
|
| |||||||||
CLASS Y | ||||||||||||||||
Shares sold | 726,150 | $ | 7,513,050 | 3,172,809 | $ | 32,089,635 | ||||||||||
Shares sold through reinvestments of distributions | 212,824 | 2,073,840 | 74,417 | 778,240 | ||||||||||||
Shares redeemed | (887,241 | ) | (8,951,621 | ) | (6,875 | ) | (72,116 | ) | ||||||||
Redemption fees | – | 2,221 | – | – | ||||||||||||
|
|
|
|
|
|
|
| |||||||||
Net increase | 51,733 | $ | 637,490 | 3,240,351 | $ | 32,795,759 | ||||||||||
|
|
|
|
|
|
|
| |||||||||
| (1) | Fund commenced operations on September 16, 2013. |
| 10. | Line of Credit |
During the period ended December 31, 2014, the Trust (the “Borrower”) entered into a Credit Agreement (the “Credit Agreement”) with State Street Bank and Trust Company (the “Bank”). The Credit Agreement provides for a revolving credit facility of $20,000,000 (the “Facility Amount”) to be utilized for temporary or emergency purposes to fund shareholder redemptions or for other short-term liquidity purposes. Per the Credit Agreement, outstanding principal on the loan shall bear interest at a variable rate per annum equal to the higher of (a) the Federal Funds Rate as in effect on the day of the borrowing plus 1.25% and (b) the Overnight LIBOR rate as in effect on the day of the borrowing plus 1.25%. In addition, the Borrower shall pay to the Bank a commitment fee at the rate of 0.125% per annum on the daily unused portion of the Facility Amount. As of December 31, 3014, there were no loans outstanding pursuant to the Credit Agreement.
54

JOINT PRIVACY NOTICE OF BABSON CAPITAL MANAGEMENT LLC AND
BABSON CAPITAL FUNDS TRUST
When you use Babson Capital Management LLC (“Babson Capital”) as your investment adviser or invest in Babson Global Floating Rate Fund or Babson Global Credit Opportunities Income Fund, each a series of Babson Capital Funds Trust (each a “Fund” and collectively the “Funds”) you entrust us not only with your hard-earned assets but also with your personal and financial data. We consider your data to be private and confidential, and protecting its confidentiality is important to us. Our policies and procedures regarding your personal information are summarized below.
We may collect non-public personal information about you from:
| n | Applications or other forms, interviews, or by other means; |
| n | Consumer or other reporting agencies, government agencies, employers or others; |
| n | Your transactions with us, our affiliates, or others; and |
| n | Our Internet website. |
We may share the financial information we collect with our financial service affiliates, such as insurance companies, investment companies and securities broker-dealers. Additionally, so that we may continue to offer you products and services that best meet your investment needs and to effect transactions that you request or authorize, we may disclose the information we collect, as described above, to companies that perform administrative or marketing services on our behalf, such as transfer agents, custodian banks, service providers or printers and mailers that assist us in the distribution of investor materials or that provide operational support to Babson Capital entities. These companies are required to protect this information and will use this information only for the services for which we hire them, and are not permitted to use or share this information for any other purpose. Some of these companies may perform such services in jurisdictions other than the United States. We may share some or all of the information we collect with other financial institutions with whom we jointly market products. This may be done only if it is permitted in the state in which you live. Some disclosures may be limited to your name, contact and transaction information with us or our affiliates.
Any disclosures will be only to the extent permitted by federal and state law. Certain disclosures may require us to get an “opt-in” or “opt-out” from you. If this is required, we will do so before information is shared. Otherwise, we do not share any personal information about our customers or former customers unless authorized by the customer or as permitted by law.
We restrict access to personal information about you to those employees who need to know that information to provide products and services to you. We maintain physical, electronic and procedural safeguards that comply with legal standards to guard your personal information. As an added measure, we do not include personal or account information in non-secure e-mails that we send you via the Internet without your prior consent. We advise you not to send such information to us in non-secure e-mails.
This joint notice describes the privacy policies of Babson Capital and the Funds. It applies to all Babson Capital and the Fund accounts you presently have, or may open in the future, using your social security number or federal taxpayer identification number – whether or not you remain a shareholder of our Funds or as an advisory client of Babson Capital. As mandated by rules issued by the Securities and Exchange Commission, we will be sending you this notice annually, as long as you own shares in the Funds or have an account with Babson Capital.
February 2015
55
| Babson Capital Funds Trust |

| Item 2. | Code of Ethics. |
Not applicable to this semi-annual report.
| Item 3. | Audit Committee Financial Expert. |
Not applicable to this semi-annual report.
| Item 4. | Principal Accountant Fees and Services. |
Not applicable to this semi-annual report.
| Item 5. | Audit Committee of Listed Registrants. |
Not applicable.
| Item 6. | Schedule of Investments. |
| (a) | The registrant’s Consolidated Schedule of Investments as of the close of the reporting period is included in the Semi-Annual Report to Stockholders filed under item 1 of this form. |
| (b) | Not applicable. |
| Item 7. | Disclosure of Proxy Voting Policies and Procedures for Closed-End Management Investment Companies. |
Not applicable.
| Item 8. | Portfolio Managers of Closed-End Investment Management Companies. |
Not applicable.
| Item 9. | Purchases of Equity Securities by Closed-End Management Investment Company and Affiliated Purchasers. |
Not applicable.
| Item 10. | Submission of Matters to a Vote of Security Holders. |
There have been no material changes to procedures by which the shareholders may recommend nominees to the registrant’s Board of Trustees.
| Item 11. | Controls and Procedures. |
| (a) | The registrant’s principal executive officer and principal financial officers, or persons performing similar functions, have concluded that the registrant’s disclosure controls and procedures as defined in Rule 30a-3(c) under the Investment Company Act of 1940, as amended (the “1940 Act”), are effective as of a date within 90 days of the filing date of this report based on the evaluation of these controls and procedures required by Rule 30a-3(b) under the 1940 Act and Rules 13a-15(b) or 15d-15(b) under the Securities Exchange Act of 1934, as amended. |
| (b) | There were no changes in the registrant’s internal control over financial reporting (as defined in Rule 30a-3(d) under the 1940 Act) that occurred during the second fiscal quarter of the period covered by this report that have materially affected or are reasonably likely to materially affect, the registrant’s internal control over financial reporting. |
| Item 12. | Exhibits. |
| (a)(1) | Not applicable to this semi-annual report. |
| (a)(2) | Certifications pursuant to Rule 30a-2(a) are attached hereto. |
| (a)(3) | Not applicable. |
| (b) | Certification pursuant to Rule 30a-2(b) are attached hereto. |
SIGNATURES
Pursuant to the requirements of the Securities Exchange Act of 1934 and the Investment Company Act of 1940, the registrant has duly caused this report to be signed on its behalf by the undersigned, thereunto duly authorized.
| (Registrant) | Babson Capital Funds Trust | |
| By (Signature and Title) | /s/ Anthony J. Sciacca | |
| Anthony J. Sciacca, President (Principal Executive Officer) | ||
| Date March 6, 2015 | ||
Pursuant to the requirements of the Securities Exchange Act of 1934 and the Investment Company Act of 1940, this report has been signed below by the following persons on behalf of the registrant and in the capacities and on the dates indicated.
| By (Signature and Title) | /s/ Anthony J. Sciacca | |
| Anthony J. Sciacca, President (Principal Executive Officer) | ||
| Date March 6, 2015 | ||
| By (Signature and Title) | /s/ Patrick Hoefling | |
| Patrick Hoefling, Chief Financial Officer (Principal Financial Officer) | ||
| Date March 6, 2015 | ||