Free Writing Prospectus
Filed Pursuant to Rule 433
File No. 333-177891-05

Free Writing Prospectus
Structural and Collateral Term Sheet
$1,107,001,430
(Approximate Aggregate Cut-off Date Balance of Mortgage Pool)
$972,777,000
(Approximate Aggregate Principal Balance of Offered Certificates)
WFRBS Commercial Mortgage Trust 2013-C15
as Issuing Entity
RBS Commercial Funding Inc.
as Depositor
The Royal Bank of Scotland
Wells Fargo Bank, National Association
NCB, FSB
Liberty Island Group I LLC
C-III Commercial Mortgage LLC
Basis Real Estate Capital II, LLC
as Sponsors and Mortgage Loan Sellers
Commercial Mortgage Pass-Through Certificates
Series 2013-C15
July 29, 2013
| RBS | WELLS FARGO SECURITIES | |
| Co-Lead Manager and | Co-Lead Manager and | |
| Co-Bookrunner | Co-Bookrunner | |
Deutsche Bank Securities
Co-Manager
STATEMENT REGARDING THIS FREE WRITING PROSPECTUS
The depositor has filed a registration statement (including a prospectus) with the Securities and Exchange Commission (‘‘SEC’’) (SEC File No. 333-177891) for the offering to which this communication relates. Before you invest, you should read the prospectus in the registration statement and other documents the depositor has filed with the SEC for more complete information about the depositor, the issuing entity and this offering. You may get these documents for free by visiting EDGAR on the SEC Web site at www.sec.gov. Alternatively, the depositor, any underwriter, or any dealer participating in the offering will arrange to send you the prospectus after filing if you request it by calling toll free 1-866-884-2071 (8 a.m. – 5 p.m. EST) or by emailing rbscmbs@rbs.com.
Nothing in this document constitutes an offer to sell or a solicitation to buy securities in any jurisdiction where such offer, solicitation or sale is not permitted. The information contained herein is preliminary as of the date hereof, supersedes any such information previously delivered to you and will be superseded by any information subsequently delivered and ultimately by the final prospectus relating to the securities. These materials are subject to change, completion, supplement or amendment from time to time.
STATEMENT REGARDING ASSUMPTIONS AS TO SECURITIES, PRICING ESTIMATES AND OTHER INFORMATION
The attached information contains certain tables and other statistical analyses (the “Computational Materials”) which have been prepared in reliance upon information furnished by the Mortgage Loan Sellers. Numerous assumptions were used in preparing the Computational Materials, which may or may not be reflected herein. As such, no assurance can be given as to the Computational Materials’ accuracy, appropriateness or completeness in any particular context; or as to whether the Computational Materials and/or the assumptions upon which they are based reflect present market conditions or future market performance. The Computational Materials should not be construed as either projections or predictions or as legal, tax, financial or accounting advice. You should consult your own counsel, accountant and other advisors as to the legal, tax, business, financial and related aspects of a purchase of these securities. Any weighted average lives, yields and principal payment periods shown in the Computational Materials are based on prepayment and/or loss assumptions, and changes in such prepayment and/or loss assumptions may dramatically affect such weighted average lives, yields and principal payment periods. In addition, it is possible that prepayments or losses on the underlying assets will occur at rates higher or lower than the rates shown in the attached Computational Materials. The specific characteristics of the securities may differ from those shown in the Computational Materials due to differences between the final underlying assets and the preliminary underlying assets used in preparing the Computational Materials. The principal amount and designation of any security described in the Computational Materials are subject to change prior to issuance. None of RBS Securities Inc. (“RBSSI”), Wells Fargo Securities, LLC (“WFS”), Deutsche Bank Securities, Inc. or any of their respective affiliates make any representation or warranty as to the actual rate or timing of payments or losses on any of the underlying assets or the payments or yield on the securities. The information in this presentation is based upon management forecasts and reflects prevailing conditions and management’s views as of this date, all of which are subject to change. In preparing this presentation, we have relied upon and assumed, without independent verification, the accuracy and completeness of all information available from public sources or which was provided to us by or on behalf of the Mortgage Loan Sellers or which was otherwise reviewed by us.
This free writing prospectus contains certain forward-looking statements. If and when included in this free writing prospectus, the words “expects”, “intends”, “anticipates”, “estimates” and analogous expressions and all statements that are not historical facts, including statements about our beliefs or expectations, are intended to identify forward-looking statements. Any forward-looking statements are made subject to risks and uncertainties which could cause actual results to differ materially from those stated. Those risks and uncertainties include, among other things, declines in general economic and business conditions, increased competition, changes in demographics, changes in political and social conditions, regulatory initiatives and changes in customer preferences, many of which are beyond our control and the control of any other person or entity related to this offering. The forward-looking statements made in this free writing prospectus are made as of the date stated on the cover. We have no obligation to update or revise any forward-looking statement.
RBS is a trade name for the investment banking business of RBSSI. Securities, syndicated loan arranging, financial advisory and other investment banking activities are performed by RBSSI and their securities affiliates. Lending, derivatives and other commercial banking activities are performed by The Royal Bank of Scotland plc and their banking affiliates. RBSSI is a member of SIPC, FINRA and the NYSE.
Wells Fargo Securities is the trade name for the capital markets and investment banking services of Wells Fargo & Company and its subsidiaries, including Wells Fargo Securities, LLC, a member of FINRA, NYSE, NFA and SIPC, Wells Fargo Institutional Securities, LLC, a member of FINRA and SIPC, Wells Fargo Prime Services, LLC, a member of FINRA, NFA and SIPC and Wells Fargo Bank, N.A.
IRS CIRCULAR 230 NOTICE
THIS TERM SHEET IS NOT INTENDED OR WRITTEN TO BE USED, AND CANNOT BE USED, FOR THE PURPOSE OF AVOIDING U.S. FEDERAL, STATE OR LOCAL TAX PENALTIES. THIS TERM SHEET IS WRITTEN AND PROVIDED BY THE DEPOSITOR IN CONNECTION WITH THE PROMOTION OR MARKETING BY THE DEPOSITOR AND THE CO-LEAD BOOKRUNNING MANAGERS OF THE TRANSACTION OR MATTERS ADDRESSED HEREIN. INVESTORS SHOULD SEEK ADVICE BASED ON THEIR PARTICULAR CIRCUMSTANCES FROM AN INDEPENDENT TAX ADVISOR.
IMPORTANT NOTICE REGARDING THE OFFERED CERTIFICATES
The offered certificates referred to in these materials and the asset pool backing them are subject to modification or revision (including the possibility that one or more classes of certificates may be split, combined or eliminated at any time prior to issuance or availability of a final prospectus) and are offered on a “when, as and if issued” basis. Prospective investors should understand that, when considering the purchase of the offered certificates, a contract of sale will come into being no sooner than the date on which the relevant class of certificates has been priced and the underwriters have confirmed the allocation of certificates to be made to investors; any “indications of interest” expressed by any prospective investor, and any “soft circles” generated by the underwriters, will not create binding contractual obligations for such prospective investors, on the one hand, or the underwriters, the depositor or any of their respective agents or affiliates, on the other hand.
As a result of the foregoing, a prospective investor may commit to purchase certificates that have characteristics that may change, and each prospective investor is advised that all or a portion of the certificates referred to in these materials may be issued that differ from the characteristics described in these materials. The underwriters’ obligation to sell certificates to any prospective investor is conditioned on the certificates and the transaction having the characteristics described in these materials. If the underwriters determine that a condition is not satisfied in any material respect, such prospective investor will be notified, and neither the depositor nor the underwriters will have any obligation to such prospective investor to deliver any portion of the offered certificates which such prospective investor has committed to purchase, and there will be no liability between the underwriters, the depositor or any of their respective agents or affiliates, on the one hand, and such prospective investor, on the other hand, as a consequence of the non-delivery.
Each prospective investor has requested that the underwriters provide to such prospective investor information in connection with such prospective investor’s consideration of the purchase of the certificates described in these materials. These materials are being provided to each prospective investor for informative purposes only in response to such prospective investor’s specific request. The underwriters described in these materials may from time to time perform investment banking services for, or solicit investment banking business from, any company named in these materials. The underwriters and/or their affiliates or respective employees may from time to time have a long or short position in any security or contract discussed in these materials.
The information contained herein supersedes any previous such information delivered to any prospective investor and will be superseded by information delivered to such prospective investor prior to the time of sale.
IMPORTANT NOTICE RELATING TO AUTOMATICALLY-GENERATED EMAIL DISCLAIMERS
Any legends, disclaimers or other notices that may appear at the bottom of, or attached to, any email communication to which this free writing prospectus is attached relating to (1) these materials not constituting an offer (or a solicitation of an offer), (2) no representation that these materials are accurate or complete and may not be updated or (3) these materials possibly being confidential, are not applicable to these materials and should be disregarded. Such legends, disclaimers or other notices have been automatically generated as a result of these materials having been sent via Bloomberg or another system.
THE INFORMATION IN THIS STRUCTURAL AND COLLATERAL TERM SHEET IS NOT COMPLETE AND MAY BE AMENDED PRIOR TO THE TIME OF SALE. THIS TERM SHEET IS NOT AN OFFER TO SELL THESE SECURITIES AND IT IS NOT A SOLICITATION OF AN OFFER TO BUY THESE SECURITIES IN ANY JURISDICTION WHERE THE OFFER OR SALE IS NOT PERMITTED.
2
| WFRBS Commercial Mortgage Trust 2013-C15 | Issue Characteristics |
| I. | Certificate Structure |
| Class | Expected Ratings (Fitch/KBRA/Moody’s)(1) | Approximate Initial Certificate Principal Balance or Notional Amount(2) | Approx. Initial Credit Support(3) | Pass-Through Rate Description | Weighted Average Life (Years)(4) | Expected Principal Window(4) | Certificate Principal to Value Ratio(5) | Certificate Principal U/W NOI Debt Yield(6) | ||||||||
| Offered Certificates | ||||||||||||||||
A-1 | AAA(sf)/AAA(sf)/Aaa(sf) | $60,151,000 | 30.000% | (7) | 2.73 | 9/13 - 7/18 | 27.3% | 21.1% | ||||||||
A-2 | AAA(sf)/AAA(sf)/Aaa(sf) | $48,146,000 | 30.000% | (7) | 4.94 | 7/18 - 8/18 | 27.3% | 21.1% | ||||||||
A-3 | AAA(sf)/AAA(sf)/Aaa(sf) | $260,000,000 | 30.000% | (7) | 9.84 | 5/23 - 7/23 | 27.3% | 21.1% | ||||||||
A-4 | AAA(sf)/AAA(sf)/Aaa(sf) | $301,785,000 | 30.000% | (7) | 9.90 | 7/23 - 7/23 | 27.3% | 21.1% | ||||||||
A-SB | AAA(sf)/AAA(sf)/Aaa(sf) | $104,819,000 | 30.000% | (7) | 7.41 | 8/18 - 5/23 | 27.3% | 21.1% | ||||||||
A-S(8) | AAA(sf)/AAA(sf)/Aaa(sf) | $80,257,000 | 22.750% | (7) | 9.92 | 7/23 - 8/23 | 30.2% | 19.1% | ||||||||
B(8) | AA-(sf)/AA-(sf)/Aa3(sf) | $74,723,000 | 16.000% | (7) | 9.99 | 8/23 - 8/23 | 32.8% | 17.6% | ||||||||
C(8) | A-(sf)/A-(sf)/A3(sf) | $42,896,000 | 12.125% | (7) | 9.99 | 8/23 - 8/23 | 34.3% | 16.8% | ||||||||
PEX(8) | A-(sf)/A-(sf)/A1(sf) | $197,876,000 | 12.125% | (7) | 9.96 | 7/23 - 8/23 | 34.3% | 16.8% | ||||||||
X-A | AAA(sf)/AAA(sf)/Aaa(sf) | $855,158,000(9) | NAP | Variable(10) | NAP | NAP | N/A | N/A | ||||||||
| Non-Offered Certificates | ||||||||||||||||
D | BBB-(sf)/BBB-(sf)/NR(sf) | $62,269,000 | 6.500% | (7) | 9.99 | 8/23 - 8/23 | 36.5% | 15.8% | ||||||||
E | BB(sf)/BB(sf)/NR(sf) | $22,140,000 | 4.500% | (7) | 9.99 | 8/23 - 8/23 | 37.3% | 15.5% | ||||||||
F | B(sf)/B(sf)/NR(sf) | $11,070,000 | 3.500% | (7) | 9.99 | 8/23 - 8/23 | 37.7% | 15.3% | ||||||||
G | NR/NR/NR | $38,745,430 | 0.000% | (7) | 10.46 | 8/23 - 8/28 | 39.1% | 14.8% | ||||||||
Notes:
| (1) | The expected ratings presented are those of Fitch, Inc. (“Fitch”), Kroll Bond Ratings Agency, Inc. (“KBRA”) and Moody’s Investors Service, Inc. (“Moody’s”), which the depositor hired to rate the rated offered certificates. One or more other nationally recognized statistical ratings organizations, as defined in Section 3(a)(62) of the Securities Exchange Act of 1934, as amended (the “Exchange Act”), that were not hired by the depositor may use information they receive pursuant to Rule 17g-5 under the Securities Exchange Act or otherwise to rate or provide market reports and/or published commentary related to the offered certificates. We cannot assure you as to what ratings a non-hired nationally recognized statistical rating organization would assign or that its reports will not express differing, possibly negative, views of the mortgage loans and/or the offered certificates. See “Risk Factors–Risks Related to the Offered Certificates–Nationally Recognized Statistical Rating Organizations May Assign Different Ratings to the Certificates; Ratings of the Certificates Reflect Only the Views of the Applicable Rating Agencies as of the Dates Such Ratings Were Issued; Ratings May Affect ERISA Eligibility; Ratings May be Downgraded” in the free writing prospectus, dated July 29, 2013 (the “Free Writing Prospectus”). |
| (2) | The principal balances and notional amounts set forth in the table are approximate. The actual initial principal balances and notional amounts may be larger or smaller depending on the aggregate cut-off date principal balance of the mortgage loans definitively included in the pool of mortgage loans, which aggregate cut-off date principal balance may be as much as 5% larger or smaller than the amount presented in the Free Writing Prospectus. |
| (3) | The approximate initial credit support with respect to the Class A-1, A-2, A-3, A-4 and A-SB Certificates represents the approximate credit enhancement for the Class A-1, A-2, A-3, A-4 and A-SB Certificates in the aggregate. The Initial Subordination Level for the Class C and PEX certificates are equal to the Subordination Amount of the Class C regular interest. |
| (4) | Weighted Average Lives and Expected Principal Windows are calculated based on an assumed prepayment rate of 0% CPR and the “Structuring Assumptions” described on Annex D to the Free Writing Prospectus. |
| (5) | The Certificate Principal to Value Ratio for each Class of Certificates (other than the Class A-1, A-2, A-3, A-4, A-SB and X-A) is calculated by dividing the aggregate principal balance of such class of certificates and all classes of certificates (other than Class X-A) senior to such class by the aggregate appraised value of $2,833,587,130 (calculated as described in the Free Writing Prospectus) of the mortgaged properties securing the mortgage loans (excluding, with respect to the Augusta Mall and Carolina Place loan combinations, a pro rata portion of the related appraised value allocated to the related companion loan based on its cut-off date principal balance). The Certificate Principal to Value Ratios for each of the Class A-1, A-2, A-3, A-4 and A-SB Certificates are calculated by dividing the aggregate principal balance of the Class A-1, A-2, A-3, A-4 and A-SB Certificates by such aggregate appraised value (excluding, with respect to the Augusta Mall and Carolina Place loan combinations, a pro rata portion of the related appraised value allocated to the related companion loan based on its cut-off date principal balance). However, excess mortgaged property value associated with a mortgage loan will not be available to offset losses on any other mortgage loan (unless such mortgage loans are cross-collateralized and the cross-collateralization remains in effect). |
| (6) | The Certificate Principal U/W NOI Debt Yield for each Class of Certificates (other than the Class A-1, A-2, A-3, A-4, A-SB and X-A) is calculated by dividing the underwritten net operating income (which excludes, with respect to the Augusta Mall and Carolina Place loan combinations, a pro rata portion of the related underwritten net operating income allocated to the related companion loan based on its cut-off date principal balance) for the mortgage pool of $163,383,262 (calculated as described in the Free Writing Prospectus) by the aggregate principal balance of such class of certificates and all classes of certificates (other than Class X-A) senior to such class of certificates. The Certificate Principal U/W NOI Debt Yield for each of the Class A-1, A-2, A-3, A-4 and A-SB Certificates is calculated by dividing such mortgage pool underwritten net operating income (which excludes, with respect to the Augusta Mall and Carolina Place loan combinations, a pro rata portion of the related underwritten net operating income allocated to the related companion loan based on its cut-off date principal balance) by the aggregate principal balance of the Class A-1, A-2, A-3, A-4 and A-SB Certificates. However, cash flow from each mortgaged property supports only the related mortgage loan and will not be available to support any other mortgage loan (unless such mortgage loans are cross-collateralized and the cross-collateralization remains in effect). |
| (7) | The pass-through rates for the Class A-1, A-2, A-3, A-4, A-SB, D, E, F and G Certificates and the Class A-S, B and C regular interests, in each case, will be one of the following: (i) a fixed rate per annum, (ii) the WAC Rate (as defined in the Free Writing Prospectus) for the related distribution date, (iii) a variable rate per annum equal to the lesser of (a) a fixed rate and (b) the WAC Rate for the related distribution date or (iv) a variable rate per annum equal to the WAC Rate for the related distribution date minus a specified percentage. The Class PEX Certificates will not have a pass-through rate, but will be entitled to receive the sum of the interest distributable on the percentage interests of the Class A-S, B and C regular interests represented by the Class PEX Certificates. The pass-through rates on the Class A-S, B and C certificates will at all times be the same as the pass-through rates of the Class A-S, B and C regular interests. |
| (8) | The Class A-S, Class B, Class C and Class PEX Certificates are “Exchangeable Certificates”. On the closing date, the upper-tier REMIC of the issuing entity will issue the Class A-S, Class B and Class C regular interests (each a “regular interest”) which will have outstanding principal balances on the closing date of $80,257,000, $74,723,000 and $42,896,000, respectively. The regular interests will be held in a grantor trust for the benefit of the holders of the Class A-S, Class B, Class C and Class PEX Certificates. The Class A-S, Class B, Class C and Class PEX Certificates will, at all times, represent undivided beneficial ownership interests in a grantor trust that will hold those regular interests. Each class of the Class A-S, Class B, Class C and Class PEX Certificates will, at all times, represent an undivided beneficial ownership interest in a percentage of the outstanding certificate principal balances of the Class A-S, Class B and Class C regular interests. Following any exchange of Class A-S, Class B and Class C Certificates for Class PEX Certificates or any exchange of Class PEX Certificates for Class A-S, Class B and Class C Certificates as described in the Free Writing Prospectus, the percentage interest of the outstanding certificate principal balances of the Class A-S, Class B and Class C regular interest that is represented by the Class A-S, Class B, Class C and Class PEX Certificates will be increased or decreased accordingly. The initial certificate principal balance of each of the Class A-S, Class B and Class C Certificates shown in the table represents the maximum certificate principal balance of such class without giving effect to any issuance of Class PEX certificates. The initial certificate principal balance of the Class PEX Certificates shown in the table is equal to the aggregate of the maximum initial Certificate Principal Balance of the Class A-S, Class B |
THE INFORMATION IN THIS STRUCTURAL AND COLLATERAL TERM SHEET IS NOT COMPLETE AND MAY BE AMENDED PRIOR TO THE TIME OF SALE. THIS TERM SHEET IS NOT AN OFFER TO SELL THESE SECURITIES AND IT IS NOT A SOLICITATION OF AN OFFER TO BUY THESE SECURITIES IN ANY JURISDICTION WHERE THE OFFER OR SALE IS NOT PERMITTED.
3
| WFRBS Commercial Mortgage Trust 2013-C15 | Issue Characteristics |
and Class C Certificates, representing the maximum certificate principal balance of the Class PEX Certificates that could be issued in an exchange. The certificate principal balances of the Class A-S, Class B and Class C Certificates to be issued on the closing date will be reduced, in required proportions, by an amount equal to the certificate principal balance of the Class PEX Certificates issued on the closing date. Distributions and allocations of payments and losses with respect to the Exchangeable Certificates are described in this Term Sheet under “Allocations and Distributions on the Class A-S, Class B, Class C and Class PEX Certificates” and under “Description of the Offered Certificates—Distributions” in the Free Writing Prospectus. The maximum certificate principal balance of the Class PEX Certificates is set forth in the table but is not included in the certificate principal balance of the certificates set forth on the cover page of this Term Sheet or on the top of the cover page of the Free Writing Prospectus. |
| (9) | The Class X-A Certificates are notional amount certificates. The Notional Amount of the Class X-A Certificates will be equal to the aggregate principal balance of the Class A-1, A-2, A-3, A-4, A-SB Certificates and the Class A-S regular interest outstanding from time to time. The Class X-A Certificates will not be entitled to distributions of principal. |
| (10) | The pass-through rate for the Class X-A Certificates for any distribution date will be a perannum rate equal to the excess, if any, of (a) the WAC Rate for the related distribution date, over (b) the weighted average of the pass-through rates on the Class A-1, A-2, A-3, A-4 and A-SB Certificates and the A-S regular interest for the related distribution date, weighted on the basis of their respective aggregate principal balances outstanding immediately prior to that distribution date. |
THE INFORMATION IN THIS STRUCTURAL AND COLLATERAL TERM SHEET IS NOT COMPLETE AND MAY BE AMENDED PRIOR TO THE TIME OF SALE. THIS TERM SHEET IS NOT AN OFFER TO SELL THESE SECURITIES AND IT IS NOT A SOLICITATION OF AN OFFER TO BUY THESE SECURITIES IN ANY JURISDICTION WHERE THE OFFER OR SALE IS NOT PERMITTED.
4
| WFRBS Commercial Mortgage Trust 2013-C15 | Issue Characteristics |
| II. | Transaction Highlights |
Mortgage Loan Sellers:
Mortgage Loan Seller | Number of Mortgage Loans | Number of Mortgaged Properties | Aggregate Cut-off Date Balance | % of Cut-off Date Pool Balance | ||||||||
The Royal Bank of Scotland(1) | 12 | 14 | $475,138,887 | 42.9% | ||||||||
Wells Fargo Bank, National Association | 19 | 56 | 345,599,436 | 31.2 | ||||||||
NCB, FSB | 24 | 24 | 104,081,895 | 9.4 | ||||||||
Liberty Island Group I LLC | 8 | 12 | 72,589,554 | 6.6 | ||||||||
C-III Commercial Mortgage LLC | 17 | 18 | 67,678,094 | 6.1 | ||||||||
Basis Real Estate Capital II, LLC | 6 | 12 | 41,913,563 | 3.8 | ||||||||
|
|
|
|
|
| |||||||
Total | 86 | 136 | $1,107,001,430 | 100.0% | ||||||||
|
|
|
|
| ||||||||
(1) | The mortgage loan seller referred to herein as The Royal Bank of Scotland is comprised of two affiliated companies: The Royal Bank of Scotland plc and RBS Financial Products Inc. With respect to the mortgage loans being sold for deposit into the trust by The Royal Bank of Scotland: (a) 9 mortgage loans, having an aggregate cut-off date principal balance of $266,468,887 and representing approximately 24.1% of the aggregate principal balance of the pool of mortgage loans as of the cut-off date, were originated, and are being sold to the issuing entity, only by The Royal Bank of Scotland plc, (b) 2 mortgage loans, having an aggregate cut-off date principal balance of $104,900,000 and representing approximately 9.5% of the aggregate principal balance of the pool of mortgage loans as of the cut-off date, were originated, and are being sold to the issuing entity, only by RBS Financial Products Inc. and (c) 1 mortgage loan, having an aggregate cut-off date principal balance of $103,770,000 and representing approximately 9.4% of the aggregate principal balance of the pool of mortgage loans as of the cut-off date, was co-originated, and is being sold to the issuing entity, by The Royal Bank of Scotland plc and RBS Financial Products Inc. |
Loan Pool:
Cut-off Date Balance: | $1,107,001,430 | |||
Number of Mortgage Loans: | 86 | |||
Average Cut-off Date Balance per Mortgage Loan: | $12,872,110 | |||
Number of Mortgaged Properties: | 136 | |||
Average Cut-off Date Balance per Mortgaged Property(1): | $8,139,716 | |||
Weighted Average Mortgage Interest Rate: | 4.526% | |||
Ten Largest Mortgage Loans as % of Cut-off Date Pool Balance: | 56.2% | |||
Weighted Average Original Term to Maturity or ARD (months): | 118 | |||
Weighted Average Remaining Term to Maturity or ARD (months): | 117 | |||
Weighted Average Original Amortization Term (months)(2): | 347 | |||
Weighted Average Remaining Amortization Term (months)(2): | 347 | |||
Weighted Average Seasoning (months): | 1 |
| (1) | Information regarding mortgage loans secured by multiple properties is based on an allocation according to relative appraised values or the allocated loan amounts or property-specific release prices set forth in the related loan documents or such other allocation as the related mortgage loan seller deemed appropriate. | |||
| (2) | Excludes any mortgage loan that does not amortize. | |||
Credit Statistics:
Weighted Average U/W Net Cash Flow DSCR(1): | 2.49x | |||
Weighted Average U/W Net Operating Income Debt Yield Ratio(1): | 14.8% | |||
Weighted Average Cut-off Date Loan-to-Value Ratio(1): | 61.0% | |||
Weighted Average Balloon or ARD Loan-to-Value Ratio(1): | 52.1% | |||
% of Mortgage Loans with Additional Subordinate Debt(2): | 8.3% | |||
% of Mortgage Loans with Single Tenants(3): | 12.2% |
(1) | With respect to the Augusta Mall and Carolina Place mortgage loans, loan-to-value ratio, debt service coverage ratio, debt yield and cut-off date balance per unit of measure calculations include the relatedpari passu companion loan (unless otherwise stated) in total debt. The information for each mortgaged property that relates to a mortgage loan that is cross-collateralized with other mortgage loans is based upon the principal balance of that mortgage loan, except that the applicable loan-to-value ratio, debt service coverage ratio, debt yield or cut-off date balance per unit of measure for each such mortgaged property is based upon the ratio, yield or balance (as applicable) for the aggregate indebtedness evidenced by all loans in the group. On an individual basis, without regard to the cross-collateralization feature, any mortgaged property securing a mortgage loan that is part of a cross-collateralized group of mortgage loans may have a higher loan-to-value ratio, lower debt service coverage ratio and/or lower debt yield than is presented herein. The DSCR and Debt Yield information for each residential cooperative mortgage loan is calculated using underwritten net cash flow for the related residential cooperative property which is the projected net cash flow reflected in the most recent appraisal obtained by or otherwise in the possession of the related mortgage loan seller as of the cut-off date, and the loan-to value ratio information for each residential cooperative mortgage loan is based upon the appraised value of the residential cooperative property determined as if such residential cooperative property is operated as a residential cooperative. See Annex A to the Free Writing Prospectus. Debt service coverage ratio, debt yield and loan-to-value ratio information takes no account of subordinate debt (whether or not secured by the mortgaged property), if any, that is allowed under the terms of any mortgage loan. | |||
(2) | Eighteen (18) of the mortgage loans, each of which are secured by residential cooperative properties, currently have in place subordinate secured lines of credit to the related mortgage borrowers that permit future advances (such loans, collectively, the “Subordinate Coop LOCs”). The percentage figure expressed as “% of Mortgage loans with Additional Subordinate Debt” is determined as a percentage of cut-off date principal balance and does not take into account future subordinate debt (whether or not secured by the mortgaged property), if any, that may be permitted under the terms of any mortgage loan or the Pooling and Servicing Agreement. See “Description of the Mortgage Pool—Subordinate and/or Other Financing” and “—Additional Debt Financing for Mortgage Loans Secured by Residential Cooperatives” in the Free Writing Prospectus. | |||
(3) | Excludes mortgage loans that are secured by multiple single-tenant properties with different tenants at such properties. | |||
THE INFORMATION IN THIS STRUCTURAL AND COLLATERAL TERM SHEET IS NOT COMPLETE AND MAY BE AMENDED PRIOR TO THE TIME OF SALE. THIS TERM SHEET IS NOT AN OFFER TO SELL THESE SECURITIES AND IT IS NOT A SOLICITATION OF AN OFFER TO BUY THESE SECURITIES IN ANY JURISDICTION WHERE THE OFFER OR SALE IS NOT PERMITTED.
5
| WFRBS Commercial Mortgage Trust 2013-C15 | Issue Characteristics |
Loan Structural Features:
Amortization: Based on the Cut-off Date Pool Balance, 87.4% of the mortgage pool (81 mortgage loans) has scheduled amortization, as follows:
47.8% (69 mortgage loans) requires amortization during the entire loan term
39.5% (12 mortgage loans) provides for an interest-only period followed by an amortization period
Interest-Only: Based on the Cut-off Date Pool Balance, 12.6% of the mortgage pool (5 mortgage loans) provides for interest-only payments during the entire loan term. The Weighted Average Cut-off Date Loan-to-Value Ratio and Weighted Average U/W Net Cash Flow DSCR for those mortgage loans is 57.0% and 5.49x, respectively.
Hard Lockboxes: Based on the Cut-off Date Pool Balance, 59.3% of the mortgage pool (23 mortgage loans) has hard lockboxes in place.
Reserves: The mortgage loans require amounts to be escrowed monthly as follows (excluding any mortgage loans with springing provisions):
Real Estate Taxes: | 50.4% of the pool | |||
Insurance Premiums: | 22.0% of the pool | |||
Capital Replacements: | 47.0% of the pool | |||
TI/LC: | 26.7% of the pool(1) |
(1) | The percentage of Cut-off Date Balance for loans with TI/LC reserves is based on the aggregate principal balance allocable to office, retail and mixed use properties. |
Call Protection/Defeasance: Based on the Cut-off Date Pool Balance, the mortgage pool has the following call protection and defeasance features:
66.5% of the mortgage pool (52 mortgage loans) features a lockout period, then defeasance only until an open period
13.9% of the mortgage pool (6 mortgage loans) features a lockout period, then the greater of a prepayment premium or yield maintenance until an open period
9.4% of the mortgage pool (24 mortgage loans) features no lockout period, but requires the greater of a prepayment premium or yield maintenance for a period, then a prepayment premium until an open period
9.0% of the mortgage pool (3 mortgage loans) features a lockout period, then the greater of a prepayment premium or yield maintenance, then defeasance or the greater of a prepayment premium or yield maintenance until an open period
1.3% of the mortgage pool (1 mortgage loan) features a lockout period, then defeasance or the greater of a prepayment premium or yield maintenance until an open period
Please refer to Annex A to the Free Writing Prospectus for further description of individual loan call protection.
THE INFORMATION IN THIS STRUCTURAL AND COLLATERAL TERM SHEET IS NOT COMPLETE AND MAY BE AMENDED PRIOR TO THE TIME OF SALE. THIS TERM SHEET IS NOT AN OFFER TO SELL THESE SECURITIES AND IT IS NOT A SOLICITATION OF AN OFFER TO BUY THESE SECURITIES IN ANY JURISDICTION WHERE THE OFFER OR SALE IS NOT PERMITTED.
6
| WFRBS Commercial Mortgage Trust 2013-C15 | Issue Characteristics |
| III. | Issue Characteristics |
| Securities Offered: | $972,777,000 approximate monthly pay, multi-class, commercial mortgage REMIC pass-through certificates consisting of eight classes (Classes A-1, A-2, A-3, A-4, A-SB, A-S, B, C, PEX and X-A), which are offered pursuant to a registration statement filed with the SEC. | |||||
| Mortgage Loan Sellers: | The Royal Bank of Scotland (“RBS”); Wells Fargo Bank, National Association (“WFB”); NCB, FSB; Liberty Island Group I LLC (“LIG I”); C-III Commercial Mortgage LLC (“CIIICM”) and Basis Real Estate Capital II, LLC (“Basis”) | |||||
| Co-lead Bookrunning Managers: | RBS Securities Inc. and Wells Fargo Securities, LLC | |||||
| Co-Manager: | Deutsche Bank Securities Inc. | |||||
| Rating Agencies: | Fitch, Inc., Kroll Bond Rating Agency, Inc. and Moody’s Investors Service, Inc. | |||||
| Master Servicers: | Wells Fargo Bank, National Association and NCB, FSB | |||||
| Special Servicers: | CWCapital Asset Management LLC and NCB, FSB | |||||
| Certificate Administrator: | Wells Fargo Bank, National Association | |||||
| Trustee: | U.S. Bank National Association | |||||
| Trust Advisor: | Trimont Real Estate Advisors, Inc. | |||||
| Cut-off Date: | The Cut-off Date with respect to each mortgage loan is the due date for the monthly debt service payment that is due in August 2013 (or, in the case of any mortgage loan that has its first due date in September 2013, the date that would have been its due date in August 2013 under the terms of that mortgage loan if a monthly debt service payment were scheduled to be due in that month). | |||||
| Expected Closing Date: | On or about August 20, 2013. | |||||
| Determination Dates: | The eleventh day of each month (or if that day is not a business day, the next succeeding business day), commencing in September 2013. | |||||
| Distribution Dates: | The fourth business day following the Determination Date in each month, commencing in September 2013. | |||||
| Rated Final Distribution Date: | The Distribution Date in August 2046. | |||||
| Interest Accrual Period: | With respect to any Distribution Date, the calendar month preceding the month in which such Distribution Date occurs. | |||||
| Day Count: | The Offered Certificates will accrue interest on a 30/360 basis. | |||||
| Minimum Denominations: | $10,000 for each Class of Offered Certificates (other than the X-A) and $1,000,000 for the X-A Certificates. Investments may also be made in any whole dollar denomination in excess of the applicable minimum denomination. | |||||
| Clean-up Call: | 1% | |||||
| Delivery: | DTC, Euroclear and Clearstream Banking | |||||
| ERISA/SMMEA Status: | Each Class of Offered Certificates is expected to be eligible for exemptive relief under ERISA. No Class of Offered Certificates will be SMMEA eligible. | |||||
| Risk Factors: | THE CERTIFICATES INVOLVE CERTAIN RISKS AND MAY NOT BE SUITABLE FOR ALL INVESTORS. SEE THE “RISK FACTORS” SECTION OF THE FREE WRITING PROSPECTUS. | |||||
| Bond Analytics Information: | The Certificate Administrator will be authorized to make distribution date settlements, CREFC reports and certain supplemental reports (other than confidential information) available to certain financial modeling and data provision services, including Bloomberg Financial Markets L.P., Trepp LLC, Intex Solutions, Inc., Markit Group Limited, Interactive Data Corp. and BlackRock Financial Management Inc. | |||||
THE INFORMATION IN THIS STRUCTURAL AND COLLATERAL TERM SHEET IS NOT COMPLETE AND MAY BE AMENDED PRIOR TO THE TIME OF SALE. THIS TERM SHEET IS NOT AN OFFER TO SELL THESE SECURITIES AND IT IS NOT A SOLICITATION OF AN OFFER TO BUY THESE SECURITIES IN ANY JURISDICTION WHERE THE OFFER OR SALE IS NOT PERMITTED.
7
| WFRBS Commercial Mortgage Trust 2013-C15 | Characteristics of the Mortgage Pool |
| IV. | Characteristics of the Mortgage Pool(1) |
| A. | Ten Largest Mortgage Loans |
Mortgage Loan | Mortgage Loan Name | City | State | Number of Mortgage Loans / Mortgaged Properties | Mortgage Loan ($) | % of Cut-off | Property Type | Number of SF or Rooms | Cut-off Date ($) | Cut-off Date Ratio | Balloon or (%) | U/W NCF DSCR (x) | U/W NOI Debt Yield (%) | |||||||||||||||||||||||||
WFB | Augusta Mall | Augusta | GA | 1 / 1 | $110,000,000 | 9.9% | Retail | 500,222 | $340 | 68.0% | 68.0% | 2.25x | 10.4% | |||||||||||||||||||||||||
RBS | Molina Office Portfolio | Various | Various | 1 / 2 | 103,770,000 | 9.4 | Office | 621,446 | 167 | 65.4 | 59.7 | 1.77 | 11.2 | |||||||||||||||||||||||||
RBS | Meritage Resort & Spa | Napa | CA | 1 / 1 | 92,000,000 | 8.3 | Hospitality | 319 | 288,401 | 62.7 | 51.8 | 1.60 | 11.9 | |||||||||||||||||||||||||
RBS | Carolina Place | Pineville | NC | 1 / 1 | 85,000,000 | 7.7 | Retail | 647,511 | 270 | 66.5 | 57.3 | 1.71 | 10.1 | |||||||||||||||||||||||||
RBS | Kitsap Mall | Silverdale | WA | 1 / 1 | 77,300,000 | 7.0 | Retail | 533,480 | 145 | 69.6 | 64.9 | 1.70 | 10.7 | |||||||||||||||||||||||||
WFB | SecurCare Self Storage | Various | Various | 1 / 24 | 41,104,000 | 3.7 | Self Storage | 1,040,619 | 40 | 73.4 | 58.7 | 1.44 | 10.2 | |||||||||||||||||||||||||
| Portfolio | ||||||||||||||||||||||||||||||||||||||
RBS | Sunrise Technology Park | Reston | VA | 1 / 1 | 40,430,000 | 3.7 | Office | 315,579 | 128 | 65.0 | 54.3 | 1.83 | 11.3 | |||||||||||||||||||||||||
WFB | Northwest Self Storage | Various | Various | 1 / 13 | 27,084,000 | 2.4 | Self Storage | 563,685 | 48 | 73.4 | 58.8 | 1.41 | 9.8 | |||||||||||||||||||||||||
| Portfolio | ||||||||||||||||||||||||||||||||||||||
WFB | Renaissance Charlotte | Charlotte | NC | 1 / 1 | 23,975,328 | 2.2 | Hospitality | 264 | 90,816 | 62.1 | 51.4 | 1.67 | 13.7 | |||||||||||||||||||||||||
| Southpark | ||||||||||||||||||||||||||||||||||||||
RBS | American Self Storage | Staten Island | NY | 1 / 1 | 20,948,223 | 1.9 | Self Storage | 165,103 | 127 | 65.5 | 53.2 | 1.34 | 8.6 | |||||||||||||||||||||||||
| - Staten Island | ||||||||||||||||||||||||||||||||||||||
Top Three Total/Weighted Average | 3 / 4 | $305,770,000 | 27.6% | 65.5% | 60.3% | 1.89x | 11.1% | |||||||||||||||||||||||||||||||
Top Five Total/Weighted Average | 5 / 6 | $468,070,000 | 42.3% | 66.4% | 60.5% | 1.83x | 10.9% | |||||||||||||||||||||||||||||||
Top Ten Total/Weighted Average | 10 / 46 | $621,611,551 | 56.2% | 66.9% | 59.3% | 1.76x | 10.8% | |||||||||||||||||||||||||||||||
Non-Top Ten Total/Weighted Average | 76 / 90 | $485,389,879 | 43.8% | 53.4% | 42.9% | 3.42x | 19.8% | |||||||||||||||||||||||||||||||
(1) | With respect to the Augusta Mall and Carolina Place mortgage loans, Cut-off Date Balance per unit of measure, loan-to-value ratio, debt service coverage ratio and debt yield calculations include the relatedpari passu companion loan (unless otherwise stated) in total debt. |
| B. | Summary ofPari Passu Split Loan Structures |
| Mortgage Loan Name | Mortgage Loan Seller | Related Notes in Loan Group (Original Balance) | Holder of Note | Whether Note is Lead Servicing for the Entire Loan Combination | Current Master Servicer Under Related Securitization PSA | Current Special Servicer Under Related Securitization PSA | ||||||||
Augusta Mall | WFB | $110,000,000 | WFRBS 2013-C15 | Yes | Wells Fargo Bank, National Association | CWCapital Asset Management LLC | ||||||||
| WFB | $60,000,000 | (1) | No | TBD | TBD | |||||||||
Carolina Place | RBS | $90,000,000 | WFCM 2013-LC12 | Yes | Wells Fargo Bank, National Association | Rialto Capital Advisors, LLC | ||||||||
| RBS | $85,000,000 | WFRBS 2013-C15 | No | Wells Fargo Bank, National Association | CWCapital Asset Management LLC | |||||||||
(1) | The relatedpari passu companion loan is currently held by the mortgage loan seller for the mortgage loan included in the WFRBS 2013-C15 trust. |
THE INFORMATION IN THIS STRUCTURAL AND COLLATERAL TERM SHEET IS NOT COMPLETE AND MAY BE AMENDED PRIOR TO THE TIME OF SALE. THIS TERM SHEET IS NOT AN OFFER TO SELL THESE SECURITIES AND IT IS NOT A SOLICITATION OF AN OFFER TO BUY THESE SECURITIES IN ANY JURISDICTION WHERE THE OFFER OR SALE IS NOT PERMITTED.
8
| WFRBS Commercial Mortgage Trust 2013-C15 | Characteristics of the Mortgage Pool |
| C. | Previous Securitization History(1) |
| Loan No. | Mortgage Loan Seller | Mortgage Loan or Mortgaged Property Name | City | State | Property Type | Mortgage Loan or Mortgaged Property Cut-off Date Balance ($) | % of Cut-off Date Pool Balance (%) | Previous Securitization | ||||||||||
1 | WFB | Augusta Mall | Augusta | GA | Retail | $110,000,000 | 9.9% | JPMCC 2007-LDPX | ||||||||||
4 | RBS | Carolina Place | Pineville | NC | Retail | 85,000,000 | 7.7 | CGCMT 2005-C3 | ||||||||||
10 | RBS | American Self Storage - Staten Island | Staten Island | NY | Self Storage | 20,948,223 | 1.9 | MLCFC 2007-7 | ||||||||||
19 | NCB, FSB | 33 Greenwich Owners Corp. | New York | NY | Multifamily | 11,990,567 | 1.1 | MSC 2005-IQ10 | ||||||||||
21 | WFB | Vallejo Mobile Estates | Vallejo | CA | Manufactured Housing Community | 11,187,241 | 1.0 | WBCMT 2004-C14 | ||||||||||
28 | WFB | Whittier Gateway | Whittier | CA | Retail | 9,200,000 | 0.8 | BSCMS 2003-PWR2 | ||||||||||
29 | CIIICM | Oakwood MHC | Bryan | TX | Manufactured Housing Community | 6,275,000 | 0.6 | CSFB 2003-C5 | ||||||||||
30 | CIIICM | Bel Air MHC | Bryan | TX | Manufactured Housing Community | 1,450,000 | 0.1 | CSFB 2003-C5 | ||||||||||
31 | CIIICM | Country Village | Bryan | TX | Manufactured Housing Community | 1,275,000 | 0.1 | CSFB 2003-C5 | ||||||||||
38 | WFB | Halsted Village | Farmington Hills | MI | Retail | 8,000,000 | 0.7 | JPMCC 2003-CB6 | ||||||||||
39 | WFB | Newburgh Plaza - MI | Livonia | MI | Retail | 8,000,000 | 0.7 | JPMCC 2003-LN1 | ||||||||||
42 | NCB, FSB | Fleetwood Court Apartments, Inc. | Yonkers | NY | Multifamily | 7,479,103 | 0.7 | CSFB 2004-C4 | ||||||||||
45 | RBS | Central Park Tower | Bedford | TX | Office | 6,991,665 | 0.6 | JPMCC 2004-CB8 | ||||||||||
49 | CIIICM | Brightwood Manor MHC | Apopka | FL | Manufactured Housing Community | 4,692,602 | 0.4 | GECMC 2003-C2 | ||||||||||
50 | CIIICM | Desoto Village MHC | Arcadia | FL | Manufactured Housing Community | 1,397,796 | 0.1 | GECMC 2003-C2 | ||||||||||
59 | NCB, FSB | West 73rdTenants Corp. | New York | NY | Multifamily | 4,743,898 | 0.4 | MSC 2003-IQ6 | ||||||||||
61 | NCB, FSB | The Beverly House, Inc. | Kew Gardens | NY | Multifamily | 4,486,304 | 0.4 | CSFB 2004-C4 | ||||||||||
62 | NCB, FSB | Broadpark Lodge Corp. | White Plains | NY | Multifamily | 4,094,179 | 0.4 | CSFB 2004-C4 | ||||||||||
63 | NCB, FSB | Coronet Owners, Inc. | Woodside | NY | Multifamily | 3,743,975 | 0.3 | MSC 2003-IQ6 | ||||||||||
65 | NCB, FSB | 400 East 17thStreet Corp. | Brooklyn | NY | Multifamily | 3,595,131 | 0.3 | CSFB 2004-C4 | ||||||||||
66 | NCB, FSB | 1120 Park Corporation | New York | NY | Multifamily | 3,450,000 | 0.3 | MSC 2004-IQ7 | ||||||||||
67 | NCB, FSB | Archer Cooperative, Inc. | Bronx | NY | Multifamily | 2,997,759 | 0.3 | CSFB 2004-C1 | ||||||||||
68.01 | CIIICM | El Valle del Sol MHC | Mission | TX | Manufactured Housing Community | 2,544,062 | 0.2 | CSFB 2003-C4 | ||||||||||
68.02 | CIIICM | Luna MHC | McAllen | TX | Manufactured Housing Community | 451,191 | 0.0 | CSFB 2003-C4 | ||||||||||
69 | NCB, FSB | Chelsea-Warren Corp. | New York | NY | Multifamily | 2,990,817 | 0.3 | CSFB 2003-C3 | ||||||||||
72 | CIIICM | Ashbury Ridge MHC | Mooresville | IN | Manufactured Housing Community | 2,397,377 | 0.2 | BACM 2003-2 | ||||||||||
73 | CIIICM | Alamo Self Storage | Carson | CA | Self Storage | 2,172,595 | 0.2 | MSC 2004-T13 | ||||||||||
74 | NCB, FSB | 130 East 75thStreet Owners Corp. | New York | NY | Multifamily | 2,000,000 | 0.2 | MSC 2004-IQ7 | ||||||||||
76 | NCB, FSB | Bainbridge House, Inc. | Bronx | NY | Multifamily | 1,996,649 | 0.2 | CSFB 2004-C4 | ||||||||||
79 | NCB, FSB | Gramgar, Inc. | Bronxville | NY | Multifamily | 1,655,909 | 0.1 | CSFB 2004-C4 | ||||||||||
81 | NCB, FSB | 17thStreet Artists Corp. | New York | NY | Multifamily | 1,595,294 | 0.1 | MSC 2006-IQ11 | ||||||||||
84 | NCB, FSB | Victory Apartments, Inc. | Elmhurst | NY | Multifamily | 1,098,758 | 0.1 | MSC 2003-IQ6 | ||||||||||
86 | NCB, FSB | Remsen Owners Corp. | Brooklyn | NY | Multifamily | 1,046,882 | 0.1 | MSC 2005-IQ10 | ||||||||||
Total | $340,947,978 | 30.8% | ||||||||||||||||
(1) | The table above represents the most recent securitization with respect to the mortgaged property securing the related mortgage loan, based on information provided by the related borrower or obtained through searches of a third-party database. While the above mortgage loans may have been securitized multiple times in prior transactions, mortgage loans are only listed in the above chart if the mortgage loan paid off a mortgage loan in another securitization. The information has not otherwise been confirmed by the mortgage loan sellers. |
THE INFORMATION IN THIS STRUCTURAL AND COLLATERAL TERM SHEET IS NOT COMPLETE AND MAY BE AMENDED PRIOR TO THE TIME OF SALE. THIS TERM SHEET IS NOT AN OFFER TO SELL THESE SECURITIES AND IT IS NOT A SOLICITATION OF AN OFFER TO BUY THESE SECURITIES IN ANY JURISDICTION WHERE THE OFFER OR SALE IS NOT PERMITTED.
9
| WFRBS Commercial Mortgage Trust 2013-C15 | Characteristics of the Mortgage Pool |
| D. | Mortgage Loans with Scheduled Balloon Payments and Related Classes |
Class A-2(1) | ||||||||||||||||||||||||||||||||||||||||||||||
| Loan No. | Mortgage Loan Seller | Mortgage Loan Name | State | Property Type | Mortgage Loan Cut-off Date Balance ($) |
% of | Mortgage Loan Balance at Maturity ($) | % of Class A-2 Certificate Principal Balance (%)(2) | Units/SF /Rooms | Loan per Unit/ SF/ Room ($) | U/W NCF DSCR (x) | U/W NOI Debt Yield (%) | Cut-off Date LTV Ratio (%) | Balloon LTV Ratio (%) | Rem. IO Period (mos.) | Rem. Term to Maturity (mos.) | ||||||||||||||||||||||||||||||
20 | WFB | Arizona Student Housing Portfolio | AZ | Multifamily | $11,400,000 | 1.0% | $10,776,342 | 22.4% | 304 | $37,500 | 1.43x | 9.4% | 72.3% | 68.3% | 18 | 60 | ||||||||||||||||||||||||||||||
23 | WFB | Gander Mountain Portfolio | Various | Retail | 10,327,370 | 0.9 | 9,445,349 | 19.6 | 103,860 | 99 | 2.00 | 13.0 | 54.4 | 49.7 | 0 | 59 | ||||||||||||||||||||||||||||||
27 | WFB | DoubleTree - Holland | MI | Hospitality | 9,500,000 | 0.9 | 8,836,897 | 18.4 | 168 | 56,548 | 2.28 | 15.6 | 51.9 | 48.3 | 11 | 59 | ||||||||||||||||||||||||||||||
37 | WFB | College Town - Tucson | AZ | Multifamily | 8,100,000 | 0.7 | 7,656,874 | 15.9 | 228 | 35,526 | 1.48 | 10.0 | 64.8 | 61.3 | 18 | 60 | ||||||||||||||||||||||||||||||
45 | RBS | Central Park Tower | TX | Office | 6,991,665 | 0.6 | 6,406,143 | 13.3 | 103,572 | 68 | 1.51 | 11.0 | 74.4 | 68.2 | 0 | 59 | ||||||||||||||||||||||||||||||
70 | CIIICM | Candlewood Suites | FL | Hospitality | 2,535,000 | 0.2 | 2,292,031 | 4.8 | 80 | 31,688 | 1.49 | 13.4 | 53.9 | 48.8 | 0 | 60 | ||||||||||||||||||||||||||||||
Total/Weighted Average | $48,854,035 | 4.4% | $45,413,635 | 94.3% | 1.74x | 11.9% | 62.7% | 58.3% | 9 | 59 | ||||||||||||||||||||||||||||||||||||
(1) | The table above presents the mortgage loans whose balloon payments would be applied to pay down the principal balance of the Class A-2 Certificates, assuming a 0% CPR and applying the “Structuring Assumptions” described in the Free Writing Prospectus, including the assumptions that (i) none of the mortgage loans in the pool experience prepayments, defaults or losses; (ii) there are no extensions of maturity dates of any mortgage loans in the pool; and (iii) each mortgage loan in the pool is paid in full on its stated maturity date. Each class of Certificates, including the Class A-2 Certificates, evidences undivided ownership interests in the entire pool of mortgage loans. | |
(2) |
Reflects the percentage of the Mortgage Loan Balance at Maturity divided by the initial Class A-2 Certificate Principal Balance. |
Class A-SB(1) | ||||||||||||||||||||||||||||||||||||||||||||
| Loan No. | Mortgage Loan Seller | Mortgage Loan Name | State | Property Type | Mortgage Loan Cut-off Date Balance ($) |
% of | Mortgage Loan Balance at Maturity ($) | % of A-SB | SF/ Rooms | Loan per SF/ Room ($) | U/W NCF DSCR (x) | U/W NOI Debt Yield (%) | Cut-off Date LTV Ratio (%) | Balloon LTV Ratio (%) | Rem. IO Period (mos.) | Rem. Term to Maturity (mos.) | ||||||||||||||||||||||||||||
36 | WFB | Southpark Village | NC | Retail | $8,250,000 | 0.7% | $7,526,137 | 7.2% | 33,652 | $245 | 1.45x | 9.3% | 74.3% | 67.8% | 23 | 83 | ||||||||||||||||||||||||||||
57 | Basis | Hawthorne Suites by Wyndham-College Station | TX | Hospitality | 4,950,000 | 0.4 | 4,157,594 | 4.0 | 81 | 61,111 | 1.69 | 13.6 | 65.1 | 54.7 | 0 | 84 | ||||||||||||||||||||||||||||
Total/Weighted Average | $13,200,000 | 1.2% | $11,683,731 | 11.1% | 1.54x | 10.9% | 70.9% | 62.9% | 14 | 83 | ||||||||||||||||||||||||||||||||||
| (1) | The table above presents the mortgage loans whose balloon payments would be applied to pay down the principal balance of the Class A-SB Certificates, assuming a 0% CPR and applying the “Structuring Assumptions” described in the Free Writing Prospectus, including the assumptions that (i) none of the mortgage loans in the pool experience prepayments, defaults or losses; (ii) there are no extensions of maturity dates of any mortgage loans in the pool; and (iii) each mortgage loan in the pool is paid in full on its stated maturity date. Each class of Certificates, including the Class A-SB Certificates, evidences undivided ownership interests in the entire pool of mortgage loans. | |
(2) |
Reflects the percentage of the Mortgage Loan Balance at Maturity divided by the initial Class A-SB Certificate Principal Balance. |
THE INFORMATION IN THIS STRUCTURAL AND COLLATERAL TERM SHEET IS NOT COMPLETE AND MAY BE AMENDED PRIOR TO THE TIME OF SALE. THIS TERM SHEET IS NOT AN OFFER TO SELL THESE SECURITIES AND IT IS NOT A SOLICITATION OF AN OFFER TO BUY THESE SECURITIES IN ANY JURISDICTION WHERE THE OFFER OR SALE IS NOT PERMITTED.
10
| WFRBS Commercial Mortgage Trust 2013-C15 | Characteristics of the Mortgage Pool |
| E. | Property Type Distribution(1) |
| Property Type | Number of Mortgaged Properties | Aggregate Cut- off Date Balance ($) | % of Cut- off Date Pool Balance (%) | Weighted Average Cut-off Date LTV Ratio (%) | Weighted Average Balloon or ARD LTV Ratio (%) | Weighted Average U/W NCF DSCR (x) | Weighted Average U/W NOI Debt Yield (%) | Weighted Average U/W NCF Debt Yield (%) | Weighted Average Mortgage Rate (%) | |||||||||||||||||||||||||
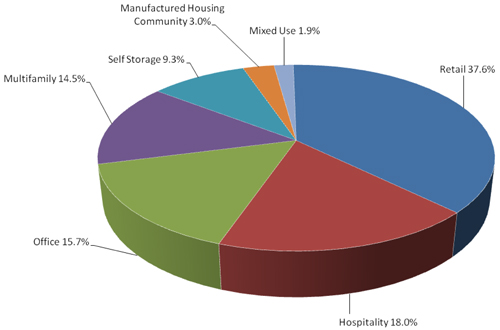
Retail | 26 | $416,150,674 | 37.6% | 66.7% | 58.9% | 1.86x | 11.2% | 10.5% | 4.376% | |||||||||||||||||||||||||
Regional Mall | 3 | 272,300,000 | 24.6 | 68.0 | 63.8 | 1.93 | 10.4 | 9.9 | 4.185 | |||||||||||||||||||||||||
Anchored | 10 | 71,761,734 | 6.5 | 60.4 | 43.7 | 1.90 | 14.8 | 13.4 | 4.797 | |||||||||||||||||||||||||
Single Tenant | 8 | 34,201,651 | 3.1 | 64.3 | 49.9 | 1.59 | 11.5 | 10.6 | 4.746 | |||||||||||||||||||||||||
Unanchored | 3 | 25,187,290 | 2.3 | 71.4 | 57.1 | 1.48 | 10.2 | 9.4 | 4.773 | |||||||||||||||||||||||||
Shadow Anchored(2) | 2 | 12,700,000 | 1.1 | 71.8 | 66.8 | 1.63 | 10.8 | 9.7 | 4.316 | |||||||||||||||||||||||||
Hospitality | 11 | 198,933,810 | 18.0 | 61.1 | 49.4 | 1.67 | 13.2 | 11.3 | 5.129 | |||||||||||||||||||||||||
Full Service | 5 | 153,426,168 | 13.9 | 62.0 | 51.3 | 1.66 | 12.8 | 10.9 | 5.087 | |||||||||||||||||||||||||
Limited Service | 6 | 45,507,642 | 4.1 | 57.8 | 43.0 | 1.71 | 14.4 | 12.8 | 5.270 | |||||||||||||||||||||||||
Office | 8 | 173,398,436 | 15.7 | 65.3 | 57.6 | 1.74 | 11.3 | 10.4 | 4.296 | |||||||||||||||||||||||||
Suburban | 6 | 166,898,436 | 15.1 | 65.4 | 57.9 | 1.76 | 11.3 | 10.4 | 4.247 | |||||||||||||||||||||||||
Medical | 2 | 6,500,000 | 0.6 | 65.0 | 49.5 | 1.42 | 11.6 | 10.5 | 5.540 | |||||||||||||||||||||||||
Multifamily | 37 | 160,552,820 | 14.5 | 33.6 | 28.3 | 6.95 | 34.3 | 33.9 | 4.190 | |||||||||||||||||||||||||
Cooperative | 24 | 104,081,895 | 9.4 | 14.7 | 12.4 | 9.86 | 46.9 | 46.9 | 3.958 | |||||||||||||||||||||||||
Garden | 10 | 36,970,925 | 3.3 | 68.2 | 53.3 | 1.66 | 11.8 | 10.6 | 4.532 | |||||||||||||||||||||||||
Student Housing | 3 | 19,500,000 | 1.8 | 69.2 | 65.4 | 1.45 | 9.6 | 9.1 | 4.780 | |||||||||||||||||||||||||
Self Storage | 42 | 103,414,615 | 9.3 | 70.6 | 56.9 | 1.43 | 9.8 | 9.4 | 4.684 | |||||||||||||||||||||||||
Self Storage | 42 | 103,414,615 | 9.3 | 70.6 | 56.9 | 1.43 | 9.8 | 9.4 | 4.684 | |||||||||||||||||||||||||
Manufactured Housing Community | 10 | 33,670,270 | 3.0 | 67.4 | 54.2 | 1.52 | 10.5 | 10.3 | 5.082 | |||||||||||||||||||||||||
Manufactured Housing Community | 10 | 33,670,270 | 3.0 | 67.4 | 54.2 | 1.52 | 10.5 | 10.3 | 5.082 | |||||||||||||||||||||||||
Mixed Use | 2 | 20,880,806 | 1.9 | 61.9 | 54.2 | 1.49 | 9.7 | 9.1 | 4.569 | |||||||||||||||||||||||||
Office/Retail | 2 | 20,880,806 | 1.9 | 61.9 | 54.2 | 1.49 | 9.7 | 9.1 | 4.569 | |||||||||||||||||||||||||
Total/Weighted Average | 136 | $1,107,001,430 | 100.0% | 61.0% | 52.1% | 2.49x | 14.8% | 13.9% | 4.526% | |||||||||||||||||||||||||
(1) | Because this table presents information relating to the mortgaged properties and not the mortgage loans, (a) the information for mortgage loans secured by more than one mortgaged property (other than through cross-collateralization with other mortgage loans) is based on allocated amounts (allocating the mortgage loan principal balance to each of those properties according to the relative appraised values of the mortgaged properties or the allocated loan amounts or property-specific release prices set forth in the related mortgage loan documents or such other allocation as the related mortgage loan seller deemed appropriate), and (b) the information for each mortgaged property that relates to a mortgage loan that is cross-collateralized with other mortgage loans is based upon the principal balance of that mortgage loan, except that the applicable loan-to-value ratio, debt service coverage ratio or debt yield for each such mortgaged property is based upon the ratio or yield (as applicable) for the aggregate indebtedness evidenced by all loans in the group. On an individual basis, without regard to the cross-collateralization feature, any mortgaged property securing a mortgage loan that is part of a cross-collateralized group of mortgage loans may have a higher loan-to-value ratio, lower debt service coverage ratio and/or lower debt yield than is presented herein. For mortgaged properties securing residential cooperative mortgage loans, the debt service coverage ratio or debt yield for each such mortgaged property are calculated using underwritten net cash flow for the related residential cooperative property which is the projected net cash flow reflected in the most recent appraisal obtained by or otherwise in the possession of the related mortgage loan seller as of the cut-off date, and the loan-to-value ratio is calculated based upon the appraised value of the residential cooperative property determined as if such residential cooperative property is operated as a residential cooperative. Debt service coverage ratio, debt yield and loan-to-value ratio information takes no account of subordinate debt (whether or not secured by the mortgaged property), if any, that is allowed under the terms of any mortgage loan. With respect to the Augusta Mall and Carolina Place mortgage loans, loan-to-value ratio, debt service coverage ratio and debt yield calculations include the relatedpari passu companion loan (unless otherwise stated) in total debt. | |
(2) | A mortgaged property is classified as shadow anchored if it is located in close proximity to an anchored retail property. |
THE INFORMATION IN THIS STRUCTURAL AND COLLATERAL TERM SHEET IS NOT COMPLETE AND MAY BE AMENDED PRIOR TO THE TIME OF SALE. THIS TERM SHEET IS NOT AN OFFER TO SELL THESE SECURITIES AND IT IS NOT A SOLICITATION OF AN OFFER TO BUY THESE SECURITIES IN ANY JURISDICTION WHERE THE OFFER OR SALE IS NOT PERMITTED.
11
| WFRBS Commercial Mortgage Trust 2013-C15 | Characteristics of the Mortgage Pool |
| F. | Geographic Distribution(1)(2) |

| Location(3) | Number of Mortgaged Properties | Aggregate Cut-off Date Balance ($) | % of Cut-off Date Pool Balance | Weighted Average Cut-off Date LTV Ratio (%) | Weighted Average Balloon or ARD LTV Ratio (%) | Weighted Average U/W NCF DSCR (x) | Weighted Average U/W NOI Debt Yield (%) | Weighted Average U/W NCF Debt Yield (%) | Weighted Average Mortgage Rate (%) | |||||||||||||||||
California | 8 | $232,217,837 | 21.0% | 63.4% | 54.5% | 1.65x | 11.4% | 10.4% | 4.770% | |||||||||||||||||
Northern | 3 | 117,237,241 | 10.6 | 62.8 | 51.3 | 1.59 | 11.8 | 10.5 | 5.098 | |||||||||||||||||
Southern | 5 | 114,980,595 | 10.4 | 64.0 | 57.7 | 1.71 | 10.9 | 10.3 | 4.437 | |||||||||||||||||
New York | 27 | 137,756,539 | 12.4 | 27.3 | 22.6 | 7.79 | 37.7 | 37.5 | 4.156 | |||||||||||||||||
North Carolina | 6 | 126,193,328 | 11.4 | 66.7 | 57.0 | 1.67 | 10.7 | 9.8 | 4.170 | |||||||||||||||||
Georgia | 5 | 119,021,040 | 10.8 | 67.6 | 66.9 | 2.21 | 10.5 | 10.0 | 4.369 | |||||||||||||||||
Washington | 6 | 95,765,000 | 8.7 | 70.1 | 64.8 | 1.67 | 10.7 | 10.0 | 4.336 | |||||||||||||||||
Ohio | 7 | 56,845,786 | 5.1 | 67.1 | 56.5 | 1.66 | 12.3 | 10.3 | 4.638 | |||||||||||||||||
Texas | 21 | 55,515,674 | 5.0 | 69.3 | 57.0 | 1.54 | 11.5 | 10.3 | 4.948 | |||||||||||||||||
Other States(4) | 56 | 283,686,227 | 25.6 | 64.1 | 50.0 | 1.71 | 12.5 | 11.4 | 4.688 | |||||||||||||||||
Total/Weighted Average | 136 | $1,107,001,430 | 100.0% | 61.0% | 52.1% | 2.49x | 14.8% | 13.9% | 4.526% | |||||||||||||||||
| (1) | The Mortgaged Properties are located in 26 states. |
| (2) | Because this table presents information relating to the mortgaged properties and not the mortgage loans, (a) the information for mortgage loans secured by more than one mortgaged property (other than through cross-collateralization with other mortgage loans) is based on allocated amounts (allocating the mortgage loan principal balance to each of those properties according to the relative appraised values of the mortgaged properties or the allocated loan amounts or property-specific release prices set forth in the related mortgage loan documents or such other allocation as the related mortgage loan seller deemed appropriate), and (b) the information for each mortgaged property that relates to a mortgage loan that is cross-collateralized with other mortgage loans is based upon the principal balance of that mortgage loan, except that the applicable loan-to-value ratio, debt service coverage ratio or debt yield for each such mortgaged property is based upon the ratio or yield (as applicable) for the aggregate indebtedness evidenced by all loans in the group. On an individual basis, without regard to the cross-collateralization feature, any mortgaged property securing a mortgage loan that is part of a cross-collateralized group of mortgage loans may have a higher loan-to-value ratio, lower debt service coverage ratio and/or lower debt yield than is presented herein. For mortgaged properties securing residential cooperative mortgage loans, the debt service coverage ratio or debt yield for each such mortgaged property are calculated using underwritten net cash flow for the related residential cooperative property which is the projected net cash flow reflected in the most recent appraisal obtained by or otherwise in the possession of the related mortgage loan seller as of the cut-off date, and the loan-to-value ratio is calculated based upon the appraised value of the residential cooperative property determined as if such residential cooperative property is operated as a residential cooperative. Debt service coverage ratio, debt yield and loan-to-value ratio information takes no account of subordinate debt (whether or not secured by the mortgaged property), if any, that is allowed under the terms of any mortgage loan. With respect to the Augusta Mall and Carolina Place mortgage loans, loan-to-value ratio, debt service coverage ratio, debt yield and cut-off date balance per unit of measure calculations include the relatedpari passu companion loan (unless otherwise stated) in total debt. |
| (3) | For purposes of determining whether a mortgaged property is in Northern California or Southern California, Northern California includes areas with zip codes above 93600 and Southern California includes areas with zip codes of 93600 and below. |
| (4) | Includes 19 other states. |
THE INFORMATION IN THIS STRUCTURAL AND COLLATERAL TERM SHEET IS NOT COMPLETE AND MAY BE AMENDED PRIOR TO THE TIME OF SALE. THIS TERM SHEET IS NOT AN OFFER TO SELL THESE SECURITIES AND IT IS NOT A SOLICITATION OF AN OFFER TO BUY THESE SECURITIES IN ANY JURISDICTION WHERE THE OFFER OR SALE IS NOT PERMITTED.
12
| WFRBS Commercial Mortgage Trust 2013-C15 | Characteristics of the Mortgage Pool |
| G. | Characteristics of the Mortgage Pool(1) |
| CUT-OFF DATE BALANCE | ||||||||
| Range of Cut-off Date Balances ($) | Number of Mortgage Loans | Aggregate Cut- off Date Balance ($) | % of Cut-off Date Pool Balance | |||||
1,046,882 – 2,000,000 | 16 | $24,771,362 | 2.2% | |||||
2,000,001 – 3,000,000 | 7 | 18,585,230 | 1.7 | |||||
3,000,001 – 4,000,000 | 4 | 14,384,621 | 1.3 | |||||
4,000,001 – 5,000,000 | 8 | 37,428,105 | 3.4 | |||||
5,000,001 – 6,000,000 | 5 | 27,020,264 | 2.4 | |||||
6,000,001 – 7,000,000 | 6 | 39,328,359 | 3.6 | |||||
7,000,001 – 8,000,000 | 6 | 46,261,292 | 4.2 | |||||
8,000,001 – 9,000,000 | 6 | 50,295,959 | 4.5 | |||||
9,000,001 – 10,000,000 | 4 | 38,611,431 | 3.5 | |||||
10,000,001 –15,000,000 | 11 | 133,097,469 | 12.0 | |||||
15,000,001 – 20,000,000 | 3 | 55,605,786 | 5.0 | |||||
20,000,001 – 30,000,000 | 3 | 72,007,551 | 6.5 | |||||
30,000,001 – 50,000,000 | 2 | 81,534,000 | 7.4 | |||||
50,000,001 – 90,000,000 | 2 | 162,300,000 | 14.7 | |||||
90,000,001 – 110,000,000 | 3 | 305,770,000 | 27.6 | |||||
Total: | 86 | $1,107,001,430 | 100.0% | |||||
Average: | $12,872,110 | |||||||
UNDERWRITTEN NOI DEBT SERVICE COVERAGE RATIO | ||||||||
| Range of U/W NOI DSCRs (x) | Number of Mortgage Loans | Aggregate Cut- off Date Balance ($) | % of Cut-off Date Pool Balance | |||||
1.40 – 1.50 | 8 | $90,685,612 | 8.2% | |||||
1.51 – 1.60 | 19 | 143,809,711 | 13.0 | |||||
1.61 – 1.70 | 4 | 34,897,734 | 3.2 | |||||
1.71 – 1.80 | 6 | 175,200,581 | 15.8 | |||||
1.81 – 1.90 | 9 | 274,244,462 | 24.8 | |||||
1.91 – 2.00 | 4 | 29,145,230 | 2.6 | |||||
2.01 – 2.25 | 5 | 93,459,455 | 8.4 | |||||
2.26 – 2.50 | 4 | 138,455,851 | 12.5 | |||||
2.51 – 3.00 | 2 | 17,500,000 | 1.6 | |||||
3.01 – 3.50 | 2 | 12,486,304 | 1.1 | |||||
3.51 – 88.02 | 23 | 97,116,489 | 8.8 | |||||
Total: | 86 | $1,107,001,430 | 100.0% | |||||
Weighted Average: | 2.63x | |||||||
UNDERWRITTEN NCF DEBT SERVICE COVERAGE RATIO | ||||||||
| Range of U/W NCF DSCRs (x) | Number of Mortgage Loans | Aggregate Cut- off Date Balance | % of Cut-off Date Pool Balance | |||||
1.29 – 1.30 | 1 | $5,040,000 | 0.5% | |||||
1.31 – 1.40 | 6 | 56,765,997 | 5.1 | |||||
1.41 – 1.50 | 22 | 182,197,911 | 16.5 | |||||
1.51 – 1.60 | 7 | 140,415,570 | 12.7 | |||||
1.61 – 1.70 | 10 | 182,893,571 | 16.5 | |||||
1.71 – 1.80 | 7 | 236,103,862 | 21.3 | |||||
1.81 – 1.90 | 2 | 45,680,000 | 4.1 | |||||
1.91 – 2.00 | 1 | 10,327,370 | 0.9 | |||||
2.01 – 2.25 | 2 | 112,995,253 | 10.2 | |||||
2.26 – 2.50 | 3 | 24,979,103 | 2.3 | |||||
2.51 – 3.50 | 2 | 12,486,304 | 1.1 | |||||
3.51 – 88.02 | 23 | 97,116,489 | 8.8 | |||||
Total: | 86 | $1,107,001,430 | 100.0% | |||||
Weighted Average: | 2.49x | |||||||
| LOAN PURPOSE | ||||||||
| Loan Purpose | Number of Mortgage Loans | Aggregate Cut- off Date Balance ($) | % of Cut-off Date Pool Balance | |||||
Refinance | 70 | $801,344,284 | 72.4% | |||||
Acquisition | 15 | 287,532,856 | 26.0 | |||||
Various | 1 | 18,124,290 | 1.6 | |||||
Total: | 86 | $1,107,001,430 | 100.0% | |||||
MORTGAGE RATE | ||||||||
| Range of Mortgage Rates (%) | Number of Mortgage Loans | Aggregate Cut- off Date Balance ($) | % of Cut-off Date Pool Balance | |||||
3.330 – 3.750 | 10 | $71,828,053 | 6.5% | |||||
3.751 – 4.000 | 10 | 121,753,624 | 11.0 | |||||
4.001 – 4.250 | 6 | 46,572,863 | 4.2 | |||||
4.251 – 4.500 | 12 | 364,161,149 | 32.9 | |||||
4.501 – 4.750 | 12 | 174,225,801 | 15.7 | |||||
4.751 – 5.000 | 11 | 64,776,956 | 5.9 | |||||
5.001 – 5.250 | 11 | 197,904,324 | 17.9 | |||||
5.251 – 5.500 | 4 | 23,911,085 | 2.2 | |||||
5.501 – 5.750 | 8 | 37,332,575 | 3.4 | |||||
5.751 – 6.000 | 2 | 4,535,000 | 0.4 | |||||
Total: | 86 | $1,107,001,430 | 100.0% | |||||
Weighted Average: | 4.526% | |||||||
UNDERWRITTEN NOI DEBT YIELD | ||||||||
| Range of U/W NOI Debt Yields (%) | Number of Mortgage Loans | Aggregate Cut- off Date Balance ($) | % of Cut-off Date Pool Balance | |||||
8.6 – 8.9 | 2 | $32,135,465 | 2.9% | |||||
9.0 – 9.9 | 11 | 94,671,344 | 8.6 | |||||
10.0 – 10.9 | 19 | 409,888,066 | 37.0 | |||||
11.0 – 11.9 | 11 | 295,004,042 | 26.6 | |||||
12.0 – 12.9 | 3 | 24,456,771 | 2.2 | |||||
13.0 – 13.9 | 9 | 89,027,741 | 8.0 | |||||
14.0 – 14.9 | 1 | 8,488,459 | 0.8 | |||||
15.0 – 15.9 | 2 | 27,481,496 | 2.5 | |||||
16.0 – 16.9 | 1 | 2,995,253 | 0.3 | |||||
17.0 – 17.9 | 2 | 9,486,304 | 0.9 | |||||
18.0 – 19.9 | 1 | 5,250,000 | 0.5 | |||||
20.0 – 324.9 | 24 | 108,116,489 | 9.8 | |||||
Total: | 86 | $1,107,001,430 | 100.0% | |||||
Weighted Average: | 14.8% | |||||||
UNDERWRITTEN NCF DEBT YIELD | ||||||||
| Range of U/W NCF Debt Yields (%) | Number of Mortgage Loans | Aggregate Cut- off Date Balance ($) | % of Cut-off Date Pool Balance | |||||
8.2 – 8.9 | 5 | $53,732,965 | 4.9% | |||||
9.0 – 9.9 | 22 | 403,551,737 | 36.5 | |||||
10.0 – 10.9 | 16 | 377,733,837 | 34.1 | |||||
11.0 – 11.9 | 8 | 89,339,913 | 8.1 | |||||
12.0 – 12.9 | 3 | 29,327,370 | 2.6 | |||||
13.0 – 13.9 | 4 | 27,467,562 | 2.5 | |||||
14.0 – 19.9 | 4 | 17,731,557 | 1.6 | |||||
20.0 – 324.9 | 24 | 108,116,489 | 9.8 | |||||
Total: | 86 | $1,107,001,430 | 100.0% | |||||
Weighted Average: | 13.9% | |||||||
(1) | Information regarding mortgage loans that are cross-collateralized with other mortgage loans is based upon the individual loan balances, except that the applicable loan-to value ratio, debt service coverage ratio or debt yield for each such mortgage loan is based upon the ratio or yield (as applicable) for the aggregate indebtedness evidenced by all loans in the group. On an individual basis, without regard to the cross-collateralization feature, any mortgage loan that is part of a cross-collateralized group of mortgage loans may have a higher loan-to-value ratio, lower debt service coverage ratio and/or lower debt yield than is presented herein. For mortgaged properties securing residential cooperative mortgage loans, the debt service coverage ratio or debt yield for each such mortgaged property are calculated using underwritten net cash flow for the related residential cooperative property which is the projected net cash flow reflected in the most recent appraisal obtained by or otherwise in the possession of the related mortgage loan seller as of the cut-off date, and the loan-to-value ratio is calculated based upon the appraised value of the residential cooperative property determined as if such residential cooperative property is operated as a residential cooperative. Debt service coverage ratio, debt yield and loan-to-value ratio information takes no account of subordinate debt (whether or not secured by the mortgaged property), if any, that is allowed under the terms of any mortgage loan. With respect to the Augusta Mall and Carolina Place mortgage loans, loan-to-value ratio, debt service coverage ratio and debt yield calculations include the relatedpari passu companion loan (unless otherwise stated) in total debt. |
THE INFORMATION IN THIS STRUCTURAL AND COLLATERAL TERM SHEET IS NOT COMPLETE AND MAY BE AMENDED PRIOR TO THE TIME OF SALE. THIS TERM SHEET IS NOT AN OFFER TO SELL THESE SECURITIES AND IT IS NOT A SOLICITATION OF AN OFFER TO BUY THESE SECURITIES IN ANY JURISDICTION WHERE THE OFFER OR SALE IS NOT PERMITTED.
13
| WFRBS Commercial Mortgage Trust 2013-C15 | Characteristics of the Mortgage Pool |
ORIGINAL TERM TO MATURITY OR ARD
| Range of Original Terms to Maturity or ARD (months) | Number of Loans | Aggregate Cut-off Date Balance ($) | % of Cut-off Date Pool Balance | |||||||
60 | 6 | $48,854,035 | 4.4% | |||||||
61 - 84 | 2 | 13,200,000 | 1.2 | |||||||
85 - 120 | 76 | 1,028,947,395 | 92.9 | |||||||
121 - 180 | 2 | 16,000,000 | 1.4 | |||||||
Total: | 86 | $1,107,001,430 | 100.0% | |||||||
Weighted Average: | 118 months | |||||||||
| REMAINING TERM TO MATURITY OR ARD | ||||||||||
| Range of Remaining Terms to Maturity or ARD (months) | Number of Loans | Aggregate Cut-off Date Balance ($) | % of Cut-off Date Pool Balance | |||||||
59 - 60 | 6 | $48,854,035 | 4.4% | |||||||
61 - 84 | 2 | 13,200,000 | 1.2 | |||||||
85 - 120 | 76 | 1,028,947,395 | 92.9 | |||||||
121 - 180 | 2 | 16,000,000 | 1.4 | |||||||
Total: | 86 | $1,107,001,430 | 100.0% | |||||||
Weighted Average: | 117 months | |||||||||
| ORIGINAL AMORTIZATION TERM(1) | ||||||||||
| Range of Original Amortization Terms (months) | Number of Loans | Aggregate Cut-off Date Balance ($) | % of Cut-off Date Pool Balance | |||||||
Non-Amortizing | 5 | $139,950,000 | 12.6% | |||||||
180 | 3 | 21,250,000 | 1.9 | |||||||
181 - 240 | 2 | 18,692,088 | 1.7 | |||||||
241 - 300 | 16 | 162,077,393 | 14.6 | |||||||
301 - 360 | 53 | 734,054,084 | 66.3 | |||||||
361 - 480 | 7 | 30,977,864 | 2.8 | |||||||
Total: | 86 | $1,107,001,430 | 100.0% | |||||||
Weighted Average(2): | 347 months | |||||||||
(1) The original amortization term shown for any mortgage loan that is interest-only for part of its term does not include the number of months in its interest-only period and reflects only the number of months as of the commencement of amortization remaining from the end of such interest-only period. (2) Excludes the non-amortizing loans. | ||||||||||
| REMAINING AMORTIZATION TERM(3) | ||||||||||
| Range of Remaining Amortization Terms (months) | Number of Loans | Aggregate Cut-off Date Balance ($) | % of Cut-off Date Pool Balance | |||||||
Non-Amortizing | 5 | $139,950,000 | 12.6% | |||||||
180 | 3 | 21,250,000 | 1.9 | |||||||
181 - 240 | 2 | 18,692,088 | 1.7 | |||||||
241 - 300 | 16 | 162,077,393 | 14.6 | |||||||
301 – 360 | 53 | 734,054,084 | 66.3 | |||||||
361 – 479 | 7 | 30,977,864 | 2.8 | |||||||
Total: | 86 | $1,107,001,430 | 100.0% | |||||||
Weighted Average(4): | 347 months | |||||||||
(3) The remaining amortization term shown for any mortgage loan that is interest-only for part of its term does not include the number of months in its interest-only period and reflects only the number of months as of the commencement of amortization remaining from the end of such interest-only period. (4) Excludes the non-amortizing loans. | ||||||||||
LOCKBOXES | ||||||||||
| Type of Lockbox | Number of Mortgage Loans | Aggregate Cut-off Date Balance ($) | % of Cut-off Date Pool | |||||||
Hard/Springing Cash Management | 20 | $630,549,923 | 57.0% | |||||||
None | 34 | 209,972,580 | 19.0 | |||||||
Soft/Springing Cash Management | 9 | 121,360,682 | 11.0 | |||||||
Springing (W/Out Estab. Account) | 15 | 98,518,806 | 8.9 | |||||||
Hard/Upfront Cash Management | 3 | 25,457,500 | 2.3 | |||||||
Springing (W/ Estab. Account) | 5 | 21,141,938 | 1.9 | |||||||
Total: | 86 | $1,107,001,430 | 100.0% | |||||||
PREPAYMENT PROVISION SUMMARY
| Prepayment Provision | Number of Mortgage | Aggregate Cut-off Date Balance ($) | % of Cut-off Date Pool Balance | |||||||||
Lockout/Defeasance/Open | 52 | $735,767,683 | 66.5% | |||||||||
Lockout/YM%/Open | 6 | 153,601,852 | 13.9 | |||||||||
YM%/1%/Open | 24 | 104,081,895 | 9.4 | |||||||||
Lockout/YM%/Defeasance or YM%/Open | 3 | 99,500,000 | 9.0 | |||||||||
Lockout/Defeasance or YM%/Open | 1 | 14,050,000 | 1.3 | |||||||||
Total: | 86 | $1,107,001,430 | 100.0% | |||||||||
| CUT-OFF DATE LOAN-TO-VALUE RATIO | ||||||||||||
| Range of Cut-off Date LTV Ratios (%) | Number of Mortgage | Aggregate Cut-off Date Balance ($) | % of Cut-off Date Pool Balance | |||||||||
1.3 - 30.0 | 23 | $96,602,793 | 8.7% | |||||||||
30.1 - 35.0 | 1 | 8,000,000 | 0.7 | |||||||||
35.1 - 40.0 | 1 | 7,479,103 | 0.7 | |||||||||
40.1 - 45.0 | 2 | 13,000,000 | 1.2 | |||||||||
45.1 - 50.0 | 1 | 5,250,000 | 0.5 | |||||||||
50.1 - 55.0 | 6 | 36,557,623 | 3.3 | |||||||||
55.1 - 60.0 | 10 | 77,068,600 | 7.0 | |||||||||
60.1 - 65.0 | 7 | 182,581,649 | 16.5 | |||||||||
65.1 - 70.0 | 16 | 483,458,470 | 43.7 | |||||||||
70.1 - 74.7 | 19 | 197,003,193 | 17.8 | |||||||||
Total: | 86 | $1,107,001,430 | 100.0% | |||||||||
Weighted Average: | 61.0% | |||||||||||
| BALLOON OR ARD LOAN-TO-VALUE RATIO | ||||||||||||
| Range of Balloon or ARD LTV Ratios (%) | Number of Mortgage | Aggregate Cut-off Date Balance ($) | % of Cut-off Date Pool Balance | |||||||||
0.3 - 30.0 | 26 | $117,852,793 | 10.6% | |||||||||
30.1 - 35.0 | 1 | 7,479,103 | 0.7 | |||||||||
35.1 - 40.0 | 2 | 11,745,253 | 1.1 | |||||||||
40.1 - 45.0 | 7 | 44,828,858 | 4.0 | |||||||||
45.1 - 50.0 | 10 | 74,636,295 | 6.7 | |||||||||
50.1 - 55.0 | 15 | 267,312,904 | 24.1 | |||||||||
55.1 - 60.0 | 13 | 328,290,237 | 29.7 | |||||||||
60.1 - 65.0 | 7 | 105,514,324 | 9.5 | |||||||||
65.1 - 68.3 | 5 | 149,341,665 | 13.5 | |||||||||
Total: | 86 | $1,107,001,430 | 100.0% | |||||||||
Weighted Average: | 52.1% | |||||||||||
| AMORTIZATION TYPE | ||||||||||||
| Type of Amortization | Number of Mortgage | Aggregate Cut-off Date Balance ($) | % of Cut-off Date Pool Balance | |||||||||
Amortizing Balloon | 66 | $504,763,430 | 45.6% | |||||||||
Interest-only, Amortizing Balloon | 11 | 333,768,000 | 30.2 | |||||||||
Interest-only, Balloon | 5 | 139,950,000 | 12.6 | |||||||||
Interest-only, Amortizing ARD | 1 | 103,770,000 | 9.4 | |||||||||
Fully Amortizing | 2 | 16,000,000 | 1.4 | |||||||||
Amortizing Balloon, ARD | 1 | 8,750,000 | 0.8 | |||||||||
Total: | 86 | $1,107,001,430 | 100.0% | |||||||||
| ORIGINAL TERM OF INTEREST-ONLY PERIOD FOR PARTIAL IO LOANS | ||||||||||||
| IO Term (months) | Number of Mortgage | Aggregate Cut-off Date Balance ($) | % of Cut-off Date Pool Balance | |||||||||
12 | 1 | $9,500,000 | 0.9% | |||||||||
13 – 24 | 6 | 136,368,000 | 12.3 | |||||||||
25 - 72 | 5 | 291,670,000 | 26.3 | |||||||||
Total: | 12 | $437,538,000 | 39.5% | |||||||||
Weighted Average: | 45 months | |||||||||||
| SEASONING | ||||||||||||
| Seasoning (months) | Number of Mortgage | Aggregate Cut-off Date Balance ($) | % of Cut-off Date Pool Balance | |||||||||
0 | 23 | $346,982,500 | 31.3% | |||||||||
1 – 3 | 63 | 760,018,930 | 68.7 | |||||||||
Total: | 86 | $1,107,001,430 | 100.0% | |||||||||
Weighted Average: | 1 month | |||||||||||
THE INFORMATION IN THIS STRUCTURAL AND COLLATERAL TERM SHEET IS NOT COMPLETE AND MAY BE AMENDED PRIOR TO THE TIME OF SALE. THIS TERM SHEET IS NOT AN OFFER TO SELL THESE SECURITIES AND IT IS NOT A SOLICITATION OF AN OFFER TO BUY THESE SECURITIES IN ANY JURISDICTION WHERE THE OFFER OR SALE IS NOT PERMITTED.
14
| WFRBS Commercial Mortgage Trust 2013-C15 | Certain Terms and Conditions |
| V. | Certain Terms and Conditions |
| Interest Entitlements: | The interest entitlement of each Class of Offered Certificates on each Distribution Date generally will be the interest accrued during the related Interest Accrual Period on the related Certificate Principal Balance or Notional Amount at the related pass-through rate, net of any prepayment interest shortfalls allocated to that Class for such Distribution Date as described below. If prepayment interest shortfalls arise from voluntary prepayments (without special servicer consent) on particular non-specially serviced mortgage loans during any collection period, the Master Servicer is required to make a compensating interest payment to offset those shortfalls, generally up to an amount equal to the portion of its master servicing fees that accrue at one basis point per annum. The remaining amount of prepayment interest shortfalls will be allocated to reduce the interest entitlement on all Classes of Certificates (other than the Class X-A Certificates), pro rata, based on their respective amounts of accrued interest for the related Distribution Date (except with respect to the allocation among the Class A-S, Class B, Class PEX and Class C Certificates as described below under “Allocations and Distributions on the Class A-S, B, C and PEX Certificates”). If a Class receives less than the entirety of its interest entitlement on any Distribution Date, then the shortfall, excluding any shortfall due to prepayment interest shortfalls, will be added to its interest entitlement for the next succeeding Distribution Date. Interest entitlements on the Class D, C and B Certificates, in that order, may be reduced by certain Trust Advisor expenses (subject to the discussion below under “Allocations and Distributions on the Class A-S, B, C and PEX Certificates”). | |||||||
| Principal Distribution Amount: | The Principal Distribution Amount for each Distribution Date generally will be the aggregate amount of principal received or advanced in respect of the mortgage loans, net of any non-recoverable advances and interest thereon that are reimbursed to the applicable Master Servicer, the applicable Special Servicer or the Trustee during the related collection period. Non-recoverable advances and interest thereon are reimbursable from principal collections and advances before reimbursement from other amounts. The Principal Distribution Amount may also be reduced, with a corresponding loss, to the Class D, C, B and A-S Certificates, then to the Class A-1, A-2, A-3, A-4 and A-SB Certificates (with any losses on the Class A-1, A-2, A-3, A-4 and A-SB Certificates allocatedpro rataaccording to their respective Certificate Principal Balances immediately prior to that Distribution Date), in that order, in connection with certain Trust Advisor expenses to the extent that interest entitlements on the Class B, C and D Certificates are insufficient to absorb the effect of the expense on any particular Distribution Date, in each case except as discussed below under “Allocations and Distributions on the Class A-S, B, C and PEX Certificates”. | |||||||
| Distributions: | On each Distribution Date, funds available for distribution from the mortgage loans, net of specified trust fees, expenses and reimbursements will generally be distributed in the following amounts and order of priority (in each case to the extent of remaining available funds): | |||||||
| 1. | Class A-1, A-2, A-3, A-4, A-SB and X-A Certificates: To interest on the Class A-1, A-2, A-3, A-4, A-SB and X-A Certificates, pro rata, according to their respective interest entitlements. | |||||||
| 2. | Class A-1, A-2, A-3, A-4 and A-SB Certificates: To principal on the Class A-1, A-2, A-3, A-4 and A-SB Certificates in the following amounts and order of priority: (i) first, to principal on the Class A-SB Certificates, in an amount up to the Principal Distribution Amount for such Distribution Date until their Certificate Principal Balance is reduced to the Class A-SB Planned Principal Balance for such Distribution Date; (ii) second, to principal on the Class A-1 Certificates until their Certificate Principal Balance is reduced to zero, up to the remainder of the Principal Distribution Amount for such Distribution Date; (iii) third, to principal on the Class A-2 Certificates until their Certificate Principal Balance is reduced to zero, up to the remainder of the Principal Distribution Amount for such Distribution Date; (iv) fourth, to principal on the Class A-3 Certificates until their Certificate Principal Balance is reduced to zero, up to the remainder of the Principal Distribution Amount for such Distribution Date; (v) fifth, to principal on the Class A-4 Certificates until their Certificate Principal Balance is reduced to zero, up to the remainder of the Principal Distribution Amount for such Distribution Date; and (vi) sixth, to principal on the Class A-SB Certificates until their Certificate Principal Balance is reduced to zero, up to the remainder of the Principal Distribution Amount for such Distribution Date. However, if the Certificate Principal Balance of each and every Class of Principal Balance Certificates, other than the Class A-1, A-2, A-3, A-4 and A-SB Certificates, has been reduced to zero as a result of the allocation of Mortgage Loan losses and expenses and any of the Class A-1, A-2, A-3, A-4 and A-SB Certificates remains outstanding, then the Principal Distribution Amount will be distributed on the Class A-1, A-2, A-3, A-4 and A-SB Certificates,pro rata, based on their respective outstanding Certificate Principal Balances, until their Certificate | |||||||
THE INFORMATION IN THIS STRUCTURAL AND COLLATERAL TERM SHEET IS NOT COMPLETE AND MAY BE AMENDED PRIOR TO THE TIME OF SALE. THIS TERM SHEET IS NOT AN OFFER TO SELL THESE SECURITIES AND IT IS NOT A SOLICITATION OF AN OFFER TO BUY THESE SECURITIES IN ANY JURISDICTION WHERE THE OFFER OR SALE IS NOT PERMITTED.
15
| WFRBS Commercial Mortgage Trust 2013-C15 | Certain Terms and Conditions |
Principal Balances have been reduced to zero. | ||||||
| 3. | Class A-1, A-2, A-3, A-4, A-SB Certificates: To reimburse the holders of the Class A-1, A-2, A-3, A-4 and A-SB Certificates,pro rata, for any previously unreimbursed losses (other than certain Trust Advisor expenses) on the mortgage loans that were previously allocated in reduction of the Certificate Principal Balances of such Classes. | |||||
| 4. | Class A-S regular interest: To make distributions on the Class A-S regular interest as follows: (a) first, to interest on the Class A-S regular interest in the amount of the interest entitlement for that Class; (b) next, to the extent of the portion of the Principal Distribution Amount remaining after distributions in respect of principal to each Class with a higher distribution priority (in this case, the Class A-1, A-2, A-3, A-4 and A-SB Certificates) to principal on the Class A-S regular interest until its Certificate Principal Balance is reduced to zero; and (c) next, to reimburse the holders of the Class A-S regular interest for any previously unreimbursed losses (other than certain Trust Advisor expenses) on the mortgage loans that were previously allocated to that Class in reduction of its Certificate Principal Balance. | |||||
| 5. | Class B regular interest: To make distributions on the Class B regular interest as follows: (a) first, to interest on Class B regular interest in the amount of the interest entitlement for that Class; (b) next, to the extent of the portion of the Principal Distribution Amount remaining after distributions in respect of principal to each Class with a higher distribution priority (in this case, the Class A-1, A-2, A-3, A-4 and A-SB Certificates and the A-S regular interest) to principal on the Class B regular interest until its Certificate Principal Balance is reduced to zero; and (c) next, to reimburse the holders of the Class B regular interest for any previously unreimbursed losses (other than certain Trust Advisor expenses) on the mortgage loans that were previously allocated to that Class in reduction of its Certificate Principal Balance. | |||||
| 6. | Class C regular interest: To make distributions on the Class C regular interest as follows: (a) first, to interest on Class C regular interest in the amount of the interest entitlement for that Class; (b) next, to the extent of the portion of the Principal Distribution Amount remaining after distributions in respect of principal to each Class with a higher distribution priority (in this case, the Class A-1, A-2, A-3, A-4 and A-SB Certificates and the A-S and B regular interests), to principal on the Class C regular interest until its Certificate Principal Balance is reduced to zero; and (c) next, to reimburse the holders of the Class C regular interest for any previously unreimbursed losses (other than certain Trust Advisor expenses) on the mortgage loans that were previously allocated to that Class in reduction of its Certificate Principal Balance. | |||||
| 7. | After the Class A-1, A-2, A-3, A-4 and A-SB Certificates and Class A-S, B and C regular interests are paid all amounts to which they are entitled, the remaining funds available for distribution will be used to pay interest, principal and loss reimbursement amounts (other than certain Trust Advisor expenses) on the Class D, E, F and G Certificates sequentially in that order in a manner analogous to the Class C regular interest. | |||||
THE INFORMATION IN THIS STRUCTURAL AND COLLATERAL TERM SHEET IS NOT COMPLETE AND MAY BE AMENDED PRIOR TO THE TIME OF SALE. THIS TERM SHEET IS NOT AN OFFER TO SELL THESE SECURITIES AND IT IS NOT A SOLICITATION OF AN OFFER TO BUY THESE SECURITIES IN ANY JURISDICTION WHERE THE OFFER OR SALE IS NOT PERMITTED.
16
| WFRBS Commercial Mortgage Trust 2013-C15 | Certain Terms and Conditions |
| Allocations and Distributions on the Class A-S, B, C and PEX Certificates: | On the closing date, the upper-tier REMIC of the issuing entity will issue the Class A-S, Class B and Class C regular interests (each a “regular interest”) which will have outstanding principal balances on the closing date of $80,257,000, $74,723,000 and $42,896,000, respectively. The regular interests will be held in a grantor trust for the benefit of the holders of the Class A-S, B, C and PEX Certificates. The Class A-S, B, C and PEX Certificates will, at all times, represent undivided beneficial ownership interests in a grantor trust that will hold those regular interests. Each class of the Class A-S, B, C and PEX Certificates will, at all times, represent an undivided beneficial ownership interest in a percentage of the outstanding principal balance of the regular interest with the same alphabetical class designation. The Class PEX Certificates will, at all times, represent an undivided beneficial ownership interest in the remaining percentages of the outstanding principal balances of the Class A-S, B and C regular interests and which percentage interests are referred to in this Term Sheet as the “Class PEX Component A-S, Class PEX Component B and Class PEX Component C” (collectively, the “Class PEX Components”). | |
Interest, principal, prepayment premiums, yield maintenance charges and voting rights that are allocated to the Class A-S, B or C regular interest will be distributed or allocated, as applicable, as between the Class A-S, B or C Certificates, as applicable, on the one hand, and Class PEX Component A-S, Class PEX Component B or Class PEX Component C, as applicable (and correspondingly, the Class PEX Certificates), on the other hand, pro rata, based on their respective percentage interests in the Class A-S, Class B or Class C regular interest, as applicable. In addition, any losses (including, without limitation, as a result of Trust Advisor expenses) that are allocated to the Class A-S, Class B or Class C regular interest will correspondingly be allocated as between the Class A-S, B or C Certificates, as applicable, on the one hand, and Class PEX Component A-S, Class PEX Component B or Class PEX Component C, as applicable (and correspondingly, the Class PEX Certificates), on the other hand, pro rata, based on their respective percentage interests in the Class A-S, Class B or Class C regular interest, as applicable. For a complete description of the allocations and distributions with respect to the Class A-S regular interest, the Class B regular interest and the Class C regular interest (and correspondingly the Class A-S, B, C and PEX Certificates and the Class PEX Component A-S, Class PEX Component B and Class PEX Component C), see “Description of the Offered Certificates” in the Free Writing Prospectus. See “Material Federal Income Tax Consequences” in the Free Writing Prospectus for a discussion of the tax treatment of the Exchangeable Certificates. | ||
| Exchanging Certificates through Combination and Recombination: | If you own Class A-S, B and C Certificates, you will be able to exchange them for a proportionate interest in the Class PEX Certificates, and vice versa, as described in the Free Writing Prospectus. You can exchange your Exchangeable Certificates by notifying the Certificate Administrator. If Exchangeable Certificates are outstanding and held by certificateholders, those certificates will receive principal and interest that would otherwise have been payable on the same proportion of certificates exchanged therefor if those certificates were outstanding and held by certificateholders. Any such allocations of principal and interest between classes of Exchangeable Certificates will have no effect on the principal or interest entitlements of any other class of certificates. The Free Writing Prospectus describes the available combinations of Exchangeable Certificates eligible for exchange. | |
| Allocation of Yield Maintenance and Prepayment Premiums: | If any yield maintenance charges and prepayment premiums are collected during any particular collection period with respect to any mortgage loan, then on the distribution date corresponding to that collection period, the certificate administrator will pay a portion of the yield maintenance charges and prepayment premiums (net of liquidation fees payable therefrom) to the Class A-1, A-2, A-3, A-4, A-SB and D Certificates and the Class A-S, B and C regular interests up to an amount equal to the product of (a) such yield maintenance or prepayment premium, (b) the related Base Interest Fraction (as defined in the Free Writing Prospectus), and (c) a fraction, which in no event may be greater than 1.0, the numerator of which is equal to the amount of principal distributed to the holder(s) of such class or regular interest for that distribution date, and the denominator of which is the aggregate amount of principal distributed to all the certificates and regular interests for that distribution date. Any yield maintenance charges or prepayment premium remaining after such distributions to Principal Balance Certificates and regular interests described above will be distributed to the Class X-A Certificates. The holders of the Class X-A Certificates will also be entitled to all Prepayment Premiums and Yield Maintenance Charges collected after the Class A-1, A-2, A-3, A-4, A-SB, and D Certificates and the Class A-S, B and C Regular Interests (and, therefore, the Class A-S, B, C, and PEX Certificates) are retired. | |
| Yield maintenance charges and prepayment premiums allocated to the Class A-S, B and C regular interests will be allocated to the Class A-S, B, C and PEX Certificates as described above. | ||
THE INFORMATION IN THIS STRUCTURAL AND COLLATERAL TERM SHEET IS NOT COMPLETE AND MAY BE AMENDED PRIOR TO THE TIME OF SALE. THIS TERM SHEET IS NOT AN OFFER TO SELL THESE SECURITIES AND IT IS NOT A SOLICITATION OF AN OFFER TO BUY THESE SECURITIES IN ANY JURISDICTION WHERE THE OFFER OR SALE IS NOT PERMITTED.
17
| WFRBS Commercial Mortgage Trust 2013-C15 | Certain Terms and Conditions |
No prepayment premiums or yield maintenance charges will be distributed to the holders of the Class E, F and G. For a description of when prepayment premiums and yield maintenance charges are generally required on the mortgage loans, see Annex A to the Free Writing Prospectus. See also “Risk Factors – Risks Related to the Offered Certificates – Your Yield May Be Affected by Defaults, Prepayments and Other Factors” in the Free Writing Prospectus. Prepayment premiums and yield maintenance charges will be distributed on each Distribution Date only to the extent they are actually received on the mortgage loans as of the related Determination Date. | ||
| Realized Losses: | The Certificate Principal Balances of the Class A-1, A-2, A-3, A-4, A-SB, D, E, F and G Certificates, the Class A-S regular interest (and, therefore, the Class A-S Certificates and the Class PEX Component A-S of the Class PEX Certificates), the Class B regular interest (and, therefore, the Class B Certificates and the Class PEX Component B of the Class PEX Certificates) and the Class C regular interest (and, therefore, the Class C Certificates and the Class PEX Component C of the Class PEX Certificates) will be reduced without distribution on any Distribution Date as a write-off to the extent of any losses realized on the mortgage loans allocated to such Class or regular interest on such Distribution Date. Such losses (other than certain Trust Advisor expenses) will be applied in the following order, in each case until the related Certificate Principal Balance is reduced to zero: first, to the Class G Certificates; second, to the Class F Certificates; third, to the Class E Certificates; fourth, to the Class D Certificates; fifth, to the Class C regular interest (and, therefore, the Class C Certificates and the Class PEX Component C of the Class PEX Certificates); sixth, to the Class B regular interest (and, therefore, the Class B Certificates and the Class PEX Component B of the Class PEX Certificates); seventh, to the Class A-S regular interest (and, therefore, the Class A-S Certificates and the Class PEX Component A-S of the Class PEX Certificates); and, finally,pro rata, to Classes A-1, A-2, A-3, A-4 and A-SB Certificates based on their outstanding Certificate Principal Balances. Certain Trust Advisor expenses (if not absorbed by reductions of interest entitlements on Classes D Certificates and the Class C and B regular interests) will be applied as write-offs in a similar manner, except that such write-offs will be applied only to the Class D Certificates, the Class C regular interest (and, therefore, the Class C Certificates and the Class PEX Component C of the Class PEX Certificates), the Class B regular interest (and, therefore, the Class B Certificates and the Class PEX Component B of the Class PEX Certificates) and the Class A-S regular interest (and, therefore, the Class A-S Certificates and the Class PEX Component A-S of the Class PEX Certificates), in that order, in each case until the Certificate Principal Balance of that Class of Certificates or regular interest has been reduced to zero. Thereafter, any remaining Trust Advisor expenses will be allocated among the Class A 1, A- 2, A-3, A-4 and A-SB Certificates, pro rata (based upon their respective Certificate Principal Balances), until the aggregate Certificate Principal Balance of the Class A-1, Class A-2, Class A-3, Class A- 4 and Class A-SB Certificates has been reduced to zero. The notional amount of the Class X-A Certificates will be reduced by the amount of all losses that are allocated to the Class A-1, A-2, A-3, A-4 or A-SB Certificates or the A-S regular interest as write-offs in reduction of their Certificate Principal Balances. | |
| Debt Service Advances: | The related Master Servicer or, if such Master Servicer fails to do so, the Trustee, will be obligated to advance delinquent debt service payments (other than balloon payments and default interest) and assumed debt service payments on the mortgage loans (including the Augusta Mall and Carolina Place mortgage loans but not their relatedpari passu companion loans), except to the extent any such advance is deemed non-recoverable from collections on the related mortgage loan. In addition, if an Appraisal Reduction Amount exists for a given mortgage loan, the interest portion of any debt service advance for such mortgage loan will be reduced, which will have the effect of reducing the amount of interest available for distribution to the Certificates in reverse alphabetical order of their Class designations (except that interest payments on the Class A-1, A- 2, A-3, A-4, A-SB and X-A Certificates would be affected on apari passu basis). | |
| Servicing Advances: | Each Master Servicer or, if either Master Servicer fails to do so, the Trustee, will be obligated to make servicing advances with respect to each mortgage loan that it services, including the payment of delinquent property taxes, insurance premiums and ground rent, except to the extent that those advances are deemed non-recoverable from collections on the related mortgage loan. The master servicer under the WFCM 2013-LC12 securitization will have the primary obligation to make any servicing advances with respect to the Carolina Place loan combination. | |
| Appraisal Reduction Amounts: | An Appraisal Reduction Amount generally will be created in the amount, if any, by which the principal balance of a required appraisal loan (which is a mortgage loan with respect to which certain defaults, modifications or insolvency events have occurred as further described in the Free Writing Prospectus) plus other amounts overdue or advanced in connection with such mortgage loan exceeds 90% of the appraised value of the related mortgaged property plus certain escrows and reserves (including letters of credit) held with respect to the mortgage loan. | |
THE INFORMATION IN THIS STRUCTURAL AND COLLATERAL TERM SHEET IS NOT COMPLETE AND MAY BE AMENDED PRIOR TO THE TIME OF SALE. THIS TERM SHEET IS NOT AN OFFER TO SELL THESE SECURITIES AND IT IS NOT A SOLICITATION OF AN OFFER TO BUY THESE SECURITIES IN ANY JURISDICTION WHERE THE OFFER OR SALE IS NOT PERMITTED.
18
| WFRBS Commercial Mortgage Trust 2013-C15 | Certain Terms and Conditions |
A mortgage loan will cease to be a required appraisal loan when the same has ceased to be a specially serviced mortgage loan (if applicable), has been brought current for at least three consecutive months and no other circumstances exist that would cause such mortgage loan to be a required appraisal loan. | ||
Appraisal Reduction Amounts will affect the amount of debt service advances on the related mortgage loan. Appraisal Reduction Amounts will also be taken into account in the determination of the identity of the Class whose majority constitutes the “majority subordinate certificateholder” and is entitled to appoint the subordinate class representative. | ||
| Clean-Up Call and Exchange Termination: | On each Distribution Date occurring after the aggregate unpaid principal balance of the mortgage loans is reduced below 1% of the initial aggregate principal balance of the mortgage loans as of the Cut-off Date, certain specified persons will have the option to purchase all of the remaining mortgage loans (and the trust’s interest in all property acquired through exercise of remedies in respect of any mortgage loan) at the price specified in the Free Writing Prospectus. Exercise of the option will terminate the trust and retire the then-outstanding certificates. | |
If the aggregate Certificate Principal Balances of each of the Class A-1, A-2, A-3, A-4, A-SB and D Certificates, the Class A-S regular interest (and, therefore, the Class A-S Certificates and the Class PEX Component A-S of the Class PEX Certificates), the Class B regular interest (and, therefore, the Class B Certificates and the Class PEX Component B of the Class PEX Certificates) and the Class C regular interest (and, therefore, the Class C Certificates and the Class PEX Component C of the Class PEX Certificates) have been reduced to zero, the trust may also be terminated in connection with an exchange of all the then-outstanding certificates, for the mortgage loans and REO properties then remaining in the issuing entity, but all of the holders of those Classes of outstanding certificates would have to voluntarily participate in the exchange. | ||
| Liquidated Loan Waterfall: | Following the liquidation of any loan or property, the net liquidation proceeds generally will be applied (after reimbursement of advances and certain trust fund expenses), first, as a recovery of accrued interest, other than delinquent interest that was not advanced as a result of Appraisal Reduction Amounts, and then as a recovery of principal until all principal has been recovered. Any liquidation proceeds remaining thereafter will be applied as a recovery of delinquent interest that was not advanced as a result of Appraisal Reduction Amounts. | |
| Majority Subordinate Certificateholder and Subordinate Class Representative: | A subordinate class representative may be appointed by the “majority subordinate certificateholder”, which will be the holder (s) of a majority of: (a) during a “subordinate control period”, the most subordinate class among the Class E, F and G Certificates that has a Certificate Principal Balance, as notionally reduced by any Appraisal Reduction Amounts allocable to that class, that is at least equal to 25% of its total initial principal balance and (b) during a “collective consultation period”, the most subordinate class among the Class E, F and G Certificates that has a total principal balance, without regard to Appraisal Reduction Amounts, that is at least equal to 25% of its initial Certificate Principal Balance. The majority subordinate certificateholder will have a continuing right to appoint, remove or replace the subordinate class representative in its sole discretion. This right may be exercised at any time and from time to time. See “The Pooling and Servicing Agreement—The Majority Subordinate Certificateholder and the Subordinate Class Representative” in the Free Writing Prospectus. | |
| Control and Consultation: | The rights of various parties to replace each Special Servicer and approve or consult with respect to major actions of either Special Servicer will vary according to defined periods. A “subordinate control period” will exist as long as the Class E Certificates have a Certificate Principal Balance, net of any Appraisal Reduction Amounts allocable to that class, that is not less than 25% of the initial principal balance of that class (unless a senior consultation period is deemed to occur generally or with respect to a particular mortgage loan, pursuant to clause (ii) of the definition of “senior consultation period”). In general, during a subordinate control period, (i) the subordinate class representative will be entitled to grant or withhold approval of asset status reports prepared, and material servicing actions proposed, by either Special Servicer, and (ii) the majority subordinate certificateholder, or the subordinate class representative on its behalf will be entitled to terminate and replace each Special Servicer with or without cause, and appoint itself or another person as the applicable successor special servicer (other than with respect to the Carolina Place loan combination). It will be a condition to such appointment that Fitch, KBRA and Moody’s confirm that the appointment would not result in a qualification, downgrade or withdrawal of any of their then-current ratings of certificates. A “collective consultation period” will exist as long as the Class E Certificates have a Certificate Principal Balance that both (i) as notionally reduced by any Appraisal Reduction Amounts allocable to that class, is less than 25% of its initial principal balance and (ii) without regard to any Appraisal Reduction Amounts allocable to that class, is 25% or more of its initial Certificate Principal Balance (unless a senior consultation period is deemed to occur generally or with respect to a particular mortgage loan, pursuant to clause (ii) of the definition of | |
THE INFORMATION IN THIS STRUCTURAL AND COLLATERAL TERM SHEET IS NOT COMPLETE AND MAY BE AMENDED PRIOR TO THE TIME OF SALE. THIS TERM SHEET IS NOT AN OFFER TO SELL THESE SECURITIES AND IT IS NOT A SOLICITATION OF AN OFFER TO BUY THESE SECURITIES IN ANY JURISDICTION WHERE THE OFFER OR SALE IS NOT PERMITTED.
19
| WFRBS Commercial Mortgage Trust 2013-C15 | Certain Terms and Conditions |
“senior consultation period”). In general, during a collective consultation period, each Special Servicer will be required to consult with each of the subordinate class representative and the Trust Advisor in connection with asset status reports and material special servicing actions. A “senior consultation period” will exist as long as either (i) the Class E certificates have an aggregate principal balance, without regard to any appraisal reduction amounts allocable to that class, that is less than 25% of its initial principal balance or (ii) during such time as the Class E certificates are the most subordinate class of control-eligible certificates that have a then outstanding principal balance, net of appraisal reduction amounts, at least equal to 25% of its initial principal balance, the then majority subordinate certificateholder has waived its right to appoint a subordinate class representative and to exercise any of the rights of the majority subordinate certificateholder or cause the exercise of the rights of the subordinate class representative and such rights have not been reinstated to a successor majority subordinate certificateholder as set forth in the pooling and servicing agreement. In general, during a senior consultation period, each Special Servicer must seek to consult with the Trust Advisor in connection with asset status reports and material special servicing actions, and, in general, no subordinate class representative will be recognized or have any right to terminate either Special Servicer or approve, direct or consult with respect to servicing matters. | ||
Notwithstanding any contrary description set forth above, with respect to the Augusta Mall mortgage loan (a) the holder of the related pari passu companion loan or its representative will have consultation rights with respect to asset status reports and material special servicing actions involving the related loan combination, as provided for in the related intercreditor agreement and as described in the Free Writing Prospectus. Those rights will be in addition to the rights of the subordinate class representative in this transaction described above; and (b) the existence of a subordinate control period, collective consultation period or senior consultation period under the WFRBS 2013-C15 pooling and servicing agreement will not limit the consultation rights of the holder of the pari passu companion loan. | ||
Furthermore, notwithstanding any contrary description set forth above, with respect to the Carolina Place mortgage loan, in general the loan combination will be serviced under the WFCM 2013-LC12 pooling and servicing agreement, which grants to a subordinate class representative control rights that include the right to approve or disapprove various material servicing actions involving the loan combination but the subordinate class representative for this securitization will nonetheless have the right to be consulted on a non-binding basis with respect to such actions. For purposes of the servicing of the Carolina Place loan combination, the occurrence and continuance of a collective consultation period or senior consultation period with respect to the subordinate class representative under this securitization will not limit the control or other rights of the subordinate class representative under the WFCM 2013-LC12 securitization, and any collective consultation period or senior consultation period or similar period under the WFCM 2013- LC12 securitization will not limit the consultation rights of the subordinate class representative under this securitization. | ||
In general, loan combination control rights also include the right to replace the special servicer for the related loan combination only. | ||
| Replacement of Special Servicer by General Vote of Certificateholders: | During any “collective consultation period” or “senior consultation period”, each Special Servicer may be terminated and replaced upon the affirmative direction of certificate owners holding not less than 75% of the appraisal-reduced voting rights of all certificates, following a proposal from certificate owners holding not less than 25% of the appraisal-reduced voting rights of all certificates. The certificateholders who initiate a vote on a termination and replacement of either Special Servicer without cause must cause Fitch, KBRA and Moody’s to confirm the then-current ratings of the certificates (or decline to review the matter) and cause the payment of the fees and expenses incurred in the replacement. | |
| Appraisal Remedy: | Solely for purposes of determining whether a “subordinate control period” is in effect, whenever either Special Servicer obtains an appraisal or updated appraisal under the pooling and servicing agreement, the subordinate class representative, with respect to the mortgage loans (other than the Carolina Place mortgage loan) will have the right (at its or their expense) to direct such Special Servicer to hire a qualified appraiser to prepare a second appraisal of the mortgaged property. The Special Servicer must thereafter determine whether, based on its assessment of such second appraisal, any recalculation of the Appraisal Reduction Amount is warranted. The Appraisal Reduction Amount, whether based on the first or the second appraisal, will become effective following the second appraisal, except that the Appraisal Reduction Amount based on the first appraisal shall become effective if the subordinate class representative declines to demand a second appraisal within a specified number of business days, or if a second appraisal is not received within 90 days after the direction of the subordinate class representative. In addition, for the same purposes, if there is a material change in the mortgaged property securing any mortgage loan for which an Appraisal Reduction Amount has been calculated, the majority | |
THE INFORMATION IN THIS STRUCTURAL AND COLLATERAL TERM SHEET IS NOT COMPLETE AND MAY BE AMENDED PRIOR TO THE TIME OF SALE. THIS TERM SHEET IS NOT AN OFFER TO SELL THESE SECURITIES AND IT IS NOT A SOLICITATION OF AN OFFER TO BUY THESE SECURITIES IN ANY JURISDICTION WHERE THE OFFER OR SALE IS NOT PERMITTED.
20
| WFRBS Commercial Mortgage Trust 2013-C15 | Certain Terms and Conditions |
certificateholder of the Class E, F or G Certificates or other designed certificateholders will be entitled (at its expense) to present an additional appraisal to such Special Servicer, which will generally be required to recalculate the Appraisal Reduction Amount based upon such additional appraisal. This latter right may not be exercised more frequently than once in any 12-month period for each mortgage loan for which an Appraisal Reduction Amount was calculated and can only be exercised during a subordinate control period or a collective consultation period as further described in the Free Writing Prospectus. | ||
| Sale of Defaulted Assets: | There will be no “fair value” purchase option. Instead, the pooling and servicing agreement will authorize each Special Servicer to sell defaulted mortgage loans serviced by such Special Servicer to the highest bidder in a manner generally similar to sales of REO properties. The sale of a defaulted loan for less than par plus accrued interest and certain other fees and expenses owed on the loan will be subject to consent or consultation rights of the subordinate class representative and/or Trust Advisor, as described in the Free Writing Prospectus. In the case of the Augusta Mall loan combination, the Special Servicer may offer to sell to any person (or may offer to purchase) for cash such loan combination during such times as such loan combination constitutes a defaulted mortgage loan, and, in connection with any such sale, the related Special Servicer will be required to sell both the related mortgage loan and the related pari passu companion loan. With respect to the Augusta Mall loan combination, the holder of the related pari passu companion loan or its representative (which following a securitization of such pari passu companion loan will include the subordinate class representative under the pooling and servicing agreement for such securitization) will have consultation rights, as described in the Free Writing Prospectus. | |
In the case of the Carolina Place mortgage loan, pursuant to the respective intercreditor agreement and the WFCM 2013-LC12 pooling and servicing agreement, the WFCM 2013-LC12 special servicer may offer to sell to any person (or may offer to purchase) for cash such loan combination during such time as such loan combination constitutes a defaulted mortgage loan, and, in connection with any such sale, the WFCM 2013-LC12 special servicer is required to sell both the pari passu mortgage loan and related pari passu companion loan in any such loan combination as a whole loan. The subordinate class representative will have consultation rights as the holder of an interest in the related pari passu mortgage loan, as described in the Free Writing Prospectus. | ||
| “As-Is” Appraisals: | Appraisals must be conducted on an “as-is” basis, and must be no more than 9 months old, for purposes of determining Appraisal Reduction Amounts, market value in connection with REO sales, etc. Required appraisals may consist of updates of prior appraisals. Internal valuations by the applicable Special Servicer are permitted if the principal balance of a mortgage loan is less than $2,000,000. | |
| Trust Advisor: | The Trust Advisor will perform certain review duties that will generally include a limited annual review of and report regarding each Special Servicer to the Certificate Administrator. The review and report generally will be based on: (a) during a collective consultation period or senior consultation period, any asset status reports and additional information delivered to the Trust Advisor by either Special Servicer with respect to any mortgage loan serviced by such Special Servicer, and/or (b) during a senior consultation period, in addition to the applicable information described above, a meeting with each Special Servicer to conduct a limited review of such Special Servicer’s operational practices on a platform basis in light of the servicing standard. In addition, during any collective consultation period or senior consultation period, each Special Servicer must seek to consult with the Trust Advisor (in addition to the subordinate class representative during a collective consultation period) in connection with material special servicing actions with respect to specially serviced mortgage loans serviced by such Special Servicer. Furthermore, under certain circumstances, but only during a senior consultation period, the Trust Advisor may recommend the replacement of either Special Servicer, in which case the Certificate Administrator will deliver notice of such recommendation to the certificateholders, and certificateholders with specified percentages of the voting rights may direct the replacement of such Special Servicer at their expense. | |
Notwithstanding any contrary provision described above, the Trust Advisor will have no rights or duties in connection with the Carolina Place mortgage loan. | ||
The Trust Advisor may be removed and replaced without cause upon the affirmative direction of certificates owners holding not less than 75% of the appraisal-reduced voting rights of all certificates, following a proposal from certificate owners holding not less than 25% of the appraisal-reduced voting rights of all certificates. The certificateholders who initiate a vote on a termination and replacement of the Trust Advisor without cause must cause Fitch, KBRA and Moody’s to confirm the then-current ratings of the certificates (or decline to review the matter) and cause the payment of the fees and expenses incurred in the replacement. During any | ||
THE INFORMATION IN THIS STRUCTURAL AND COLLATERAL TERM SHEET IS NOT COMPLETE AND MAY BE AMENDED PRIOR TO THE TIME OF SALE. THIS TERM SHEET IS NOT AN OFFER TO SELL THESE SECURITIES AND IT IS NOT A SOLICITATION OF AN OFFER TO BUY THESE SECURITIES IN ANY JURISDICTION WHERE THE OFFER OR SALE IS NOT PERMITTED.
21
| WFRBS Commercial Mortgage Trust 2013-C15 | Certain Terms and Conditions |
“subordinate control period”, the proposed replacement trust advisor will be subject to the subordinate class representative’s consent (such consent not to be unreasonably withheld). If a proposed termination and replacement of the Trust Advisor is not consummated within 180 days following the initial request of the certificateholders who requested a vote, the proposed termination and replacement shall have no further force or effect. The Trust Advisor generally may be discharged from its duties if and when the Class A-1, A-2, A-3, A-4, A-SB and D Certificates and the Class A-S, B and C regular interests are retired. | ||
| Certain Fee Offsets: | If a workout fee is earned by either Special Servicer following a loan default with respect to any mortgage loan that it services, then certain limitations will apply to the collection and retention of a modification fee from the borrower. The modification fee generally must not exceed 1% of the principal balance of the loan as modified. In addition, if the loan re-defaults within a specified period of months and other conditions are satisfied, any subsequent workout or liquidation fee on that loan must be reduced by a portion of the previously-collected modification fee. Furthermore, workout fees, liquidation fees and modification fees collected with respect to any workout, liquidation and/or partial liquidation of a mortgage loan or loan combination that is serviced by a special servicer will be subject to an aggregate cap equal to the greater of (i) $1,000,000 and (ii) 1.00% of the stated principal balance of the subject mortgage loan or loan combination. | |
| Deal Website: | The Certificate Administrator will be required to maintain a deal website which will include, among other items: (a) summaries of asset status reports prepared by each Special Servicer, (b) inspection reports, (c) appraisals, (d) various “special notices” described in the Free Writing Prospectus, (e) the “Investor Q&A Forum” and (f) a voluntary “Investor Registry”. Investors may access the deal website following execution of a certification and confidentiality agreement. | |
| Initial Majority Subordinate Certificateholder: | It is expected that C15 B-Holder 13, LLC or an affiliate will be the initial majority subordinate certificateholder. | |
| Loan Combinations: | The mortgaged properties identified on Annex A to the Free Writing Prospectus as Augusta Mall and Carolina Place each secure both a mortgage loan to be included in the trust and one other mortgage loan, referred to as a “pari passu companion loan”, that will not be included in the trust, which will bepari passu in right of payment with the mortgage note to be included in the trust. We refer to each such group of mortgage loans in this Term Sheet as a “loan combination”. The Augusta Mall loan combination will be serviced under the pooling and servicing agreement relating to the WFRBS 2013-C15 transaction. The Carolina Place loan combination will be serviced under the pooling and servicing agreement relating to the WFCM 2013-LC12 transaction. | |
THE INFORMATION IN THIS STRUCTURAL AND COLLATERAL TERM SHEET IS NOT COMPLETE AND MAY BE AMENDED PRIOR TO THE TIME OF SALE. THIS TERM SHEET IS NOT AN OFFER TO SELL THESE SECURITIES AND IT IS NOT A SOLICITATION OF AN OFFER TO BUY THESE SECURITIES IN ANY JURISDICTION WHERE THE OFFER OR SALE IS NOT PERMITTED.
22
[THIS PAGE INTENTIONALLY LEFT BLANK.]
23
AUGUSTA MALL

THE INFORMATION IN THIS STRUCTURAL AND COLLATERAL TERM SHEET IS NOT COMPLETE AND MAY BE AMENDED PRIOR TO THE TIME OF SALE. THIS TERM SHEET IS NOT AN OFFER TO SELL THESE SECURITIES AND IT IS NOT A SOLICITATION OF AN OFFER TO BUY THESE SECURITIES IN ANY JURISDICTION WHERE THE OFFER OR SALE IS NOT PERMITTED.
24
AUGUSTA MALL
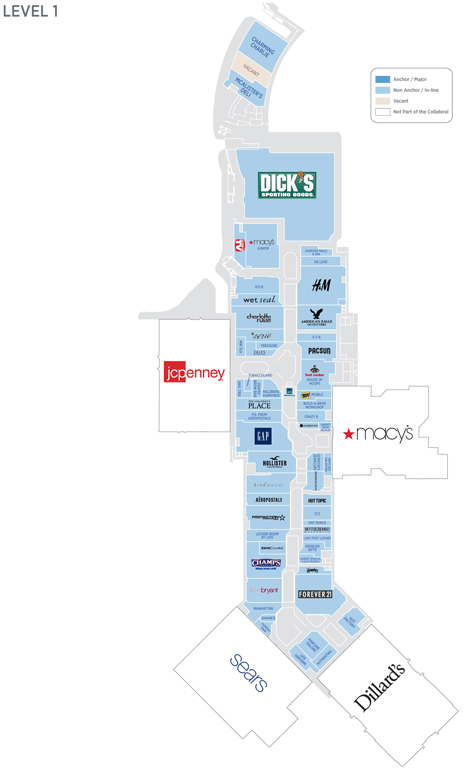
THE INFORMATION IN THIS STRUCTURAL AND COLLATERAL TERM SHEET IS NOT COMPLETE AND MAY BE AMENDED PRIOR TO THE TIME OF SALE. THIS TERM SHEET IS NOT AN OFFER TO SELL THESE SECURITIES AND IT IS NOT A SOLICITATION OF AN OFFER TO BUY THESE SECURITIES IN ANY JURISDICTION WHERE THE OFFER OR SALE IS NOT PERMITTED.
25
AUGUSTA MALL
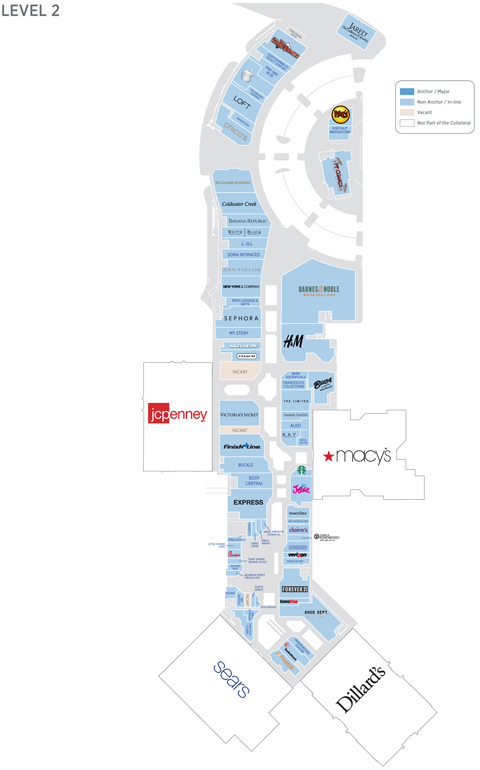
THE INFORMATION IN THIS STRUCTURAL AND COLLATERAL TERM SHEET IS NOT COMPLETE AND MAY BE AMENDED PRIOR TO THE TIME OF SALE. THIS TERM SHEET IS NOT AN OFFER TO SELL THESE SECURITIES AND IT IS NOT A SOLICITATION OF AN OFFER TO BUY THESE SECURITIES IN ANY JURISDICTION WHERE THE OFFER OR SALE IS NOT PERMITTED.
26
AUGUSTA MALL
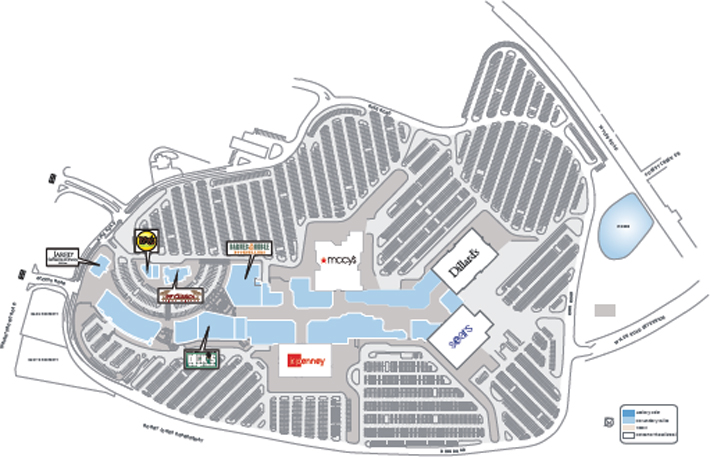
THE INFORMATION IN THIS STRUCTURAL AND COLLATERAL TERM SHEET IS NOT COMPLETE AND MAY BE AMENDED PRIOR TO THE TIME OF SALE. THIS TERM SHEET IS NOT AN OFFER TO SELL THESE SECURITIES AND IT IS NOT A SOLICITATION OF AN OFFER TO BUY THESE SECURITIES IN ANY JURISDICTION WHERE THE OFFER OR SALE IS NOT PERMITTED.
27
AUGUSTA MALL
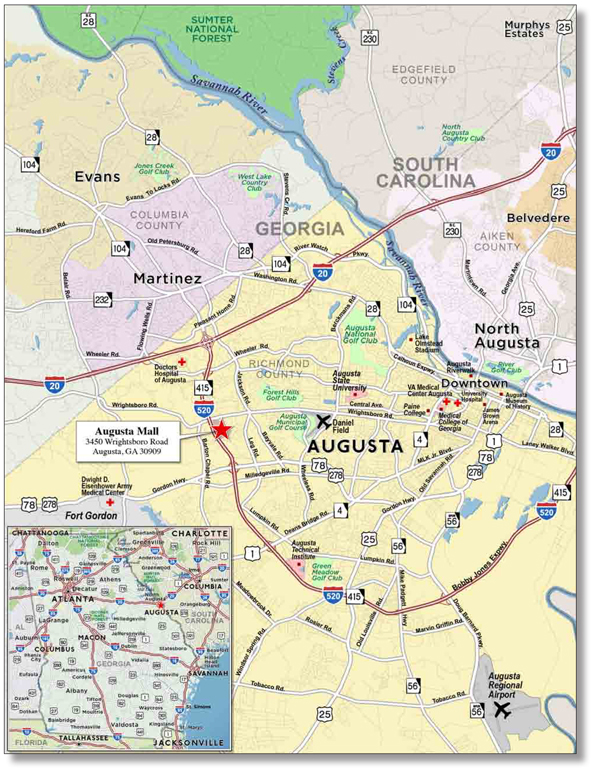
THE INFORMATION IN THIS STRUCTURAL AND COLLATERAL TERM SHEET IS NOT COMPLETE AND MAY BE AMENDED PRIOR TO THE TIME OF SALE. THIS TERM SHEET IS NOT AN OFFER TO SELL THESE SECURITIES AND IT IS NOT A SOLICITATION OF AN OFFER TO BUY THESE SECURITIES IN ANY JURISDICTION WHERE THE OFFER OR SALE IS NOT PERMITTED.
28
No. 1 – Augusta Mall
|
| Loan Information | ||||||
Mortgage Loan Seller: |
Wells Fargo Bank, National Association | |||||
Credit Assessment | NR/NR/NR | |||||
| (Fitch/KBRA/Moody’s): | ||||||
Original Principal Balance(1): |
$ 110,000,000 | |||||
Cut-off Date Principal Balance(1): |
$ 110,000,000 | |||||
% of Initial Pool Balance: |
9.9% | |||||
| Loan Purpose: | Refinance | |||||
| Borrower Name: | Augusta Mall, LLC | |||||
Sponsor: |
GGPLP L.L.C. | |||||
Mortgage Rate: |
4.360% | |||||
Note Date: |
July 11, 2013 | |||||
Anticipated Repayment Date: |
NAP | |||||
Maturity Date: |
August 1, 2023 | |||||
IO Period: |
120 months | |||||
Loan Term (Original): |
120 months | |||||
Seasoning: |
0 months | |||||
Amortization Term (Original): |
NAP | |||||
Loan Amortization Type: |
Interest-only, Balloon | |||||
Interest Accrual Method: |
Actual/360 | |||||
Call Protection: |
L(24),D(89),O(7) | |||||
Lockbox Type: |
Hard/Springing Cash Management | |||||
Additional Debt(1): |
Yes | |||||
Additional Debt Type(1): |
Pari Passu and Future Mezzanine | |||||
| Escrows and Reserves(2): | ||||||
| Type: | Initial | Monthly | Cap (If Any) | |||
Taxes |
$0 |
Springing |
NAP | |||
Insurance |
$0 |
Springing |
NAP | |||
Replacement Reserves |
$0 |
Springing |
$102,540 | |||
TI/LC Reserve |
$0 |
Springing |
$512,712 | |||
Tenants Specific TI/LC Reserve | $1,798,660 | $0 | NAP | |||
Immediate Repairs |
$9,550 |
$0 |
NAP | |||
Ground Rent |
$0 |
Springing |
NAP | |||
| Property Information | ||
Single Asset/Portfolio: |
Single Asset | |
| Property Type: | Retail | |
| Specific Property Type: | Regional Mall | |
Location: |
Augusta, GA | |
Size: |
500,222 SF | |
Cut-off Date Principal Balance Per SF(1): | $339.85 | |
Year Built/Renovated: |
1978/2007 | |
Title Vesting(3): |
Fee/Leasehold | |
Property Manager: |
Self-managed | |
3rdMost Recent Occupancy (As of): |
93.1% (12/31/2010) | |
2ndMost Recent Occupancy (As of): |
94.0% (12/31/2011) | |
Most Recent Occupancy (As of): |
98.2% (12/31/2012) | |
Current Occupancy (As of)(4): |
97.6% (5/31/2013) | |
Underwriting and Financial Information: | ||
3rdMost Recent NOI (As of): |
$15,684,217 (12/31/2011) | |
2ndMost Recent NOI (As of): |
$16,380,499 (12/31/2012) | |
Most Recent NOI (As of)(5): |
$17,339,534 (TTM 5/31/2013) | |
| U/W Revenues: | $25,197,539 | |
U/W Expenses: |
$7,570,672 | |
U/W NOI(5): |
$17,626,867 | |
U/W NCF: |
$16,871,867 | |
U/W NOI DSCR(1)(6): |
2.35x | |
U/W NCF DSCR(1)(6): |
2.25x | |
U/W NOI Debt Yield(1): |
10.4% | |
U/W NCF Debt Yield(1): |
9.9% | |
As-Is Appraised Value: |
$250,000,000 | |
| As-Is Appraisal Valuation Date: | June 25, 2013 | |
| Cut-off Date LTV Ratio(1): | 68.0% | |
LTV Ratio at Maturity or ARD(1):
|
68.0%
| |
| (1) | The Augusta Mall Loan Combination, totaling $170,000,000, is comprised of twopari passu notes (Notes A-1 and A-2). Note A-1 had an original principal balance of $110,000,000, has an outstanding principal balance as of the Cut-off Date of $110,000,000 and will be contributed to the WFRBS 2013-C15 Trust. Note A-2 had an original principal balance of $60,000,000 and is expected to be contributed to a future trust. All statistical information related to balances per square foot, loan-to-value ratios, debt service coverage ratios and debt yields are based on the Augusta Mall Loan Combination. |
| (2) | See “Escrows” section. |
| (3) | See “Ground Lease” section. |
| (4) | Current Occupancy includes 20,089 square feet attributed to temporary tenants. Excluding temporary tenants, Current Occupancy is 97.5%. |
| (5) | See “Cash Flow Analysis” section for detail on the increase from Most Recent NOI to U/W NOI. |
| (6) | U/W NOI DSCR and U/W NCF DSCR are based on interest-only payments. Assuming a 30-year amortization term, the U/W NOI DSCR and U/W NCF DSCR would be 1.73x and 1.66x, respectively. |
The Mortgage Loan. The mortgage loan (the “Augusta Mall Loan Combination”) is evidenced by twopari passu promissory notes (Note A-1 and Note A-2) secured by a first mortgage encumbering a regional mall located in Augusta, Georgia (the “Augusta Mall Property”). The Augusta Mall Loan Combination was originated on July 11, 2013 by Wells Fargo Bank, National Association. The Augusta Mall Loan Combination had an original principal balance of $170,000,000, has an outstanding principal balance as of the Cut-off Date of $170,000,000 and accrues interest at an interest rate of 4.360% per annum. The Augusta Mall Loan Combination had an initial term of 120 months, has a remaining term of 120 months as of the Cut-off Date and requires interest-only payments through the term of the Augusta Mall Loan Combination. The Augusta Mall Loan Combination matures on August 1, 2023. See “Description of the Mortgage Pool - Additional Indebtedness - The Loan Combinations - The Augusta Mall Loan Combination” and “The Pooling and Service Agreement - Servicing of the Loan Combinations” in the Free Writing Prospectus.
THE INFORMATION IN THIS STRUCTURAL AND COLLATERAL TERM SHEET IS NOT COMPLETE AND MAY BE AMENDED PRIOR TO THE TIME OF SALE. THIS TERM SHEET IS NOT AN OFFER TO SELL THESE SECURITIES AND IT IS NOT A SOLICITATION OF AN OFFER TO BUY THESE SECURITIES IN ANY JURISDICTION WHERE THE OFFER OR SALE IS NOT PERMITTED.
29
AUGUSTA MALL
Note A-1, which represents the controlling interest in the Augusta Mall Loan Combination and will be contributed to the WFRBS 2013-C15 Trust, had an original principal balance of $110,000,000 and has an outstanding principal balance as of the Cut-off Date of $110,000,000. Note A-2 had an original principal balance of $60,000,000 and is expected to be securitized in a future trust (the “Augusta Mall Companion Loan”).
Following the lockout period, the borrower has the right to defease the Augusta Mall Loan Combination in whole, but not in part, on any date before February 1, 2023. In addition, the Augusta Mall Loan Combination is prepayable without penalty on or after February 1, 2023.
Sources and Uses
| Sources | Uses | |||||||||
Original loan combination amount | $170,000,000 | 100.0% | Loan payoff(1) | $165,295,958 | 97.2% | |||||
| Closing costs | 789,794 | 0.5 | ||||||||
| Return of equity | 3,914,248 | 2.3 | ||||||||
Total Sources | $170,000,000 | 100.0% | Total Uses | $170,000,000 | 100.0% |
| (1) | The Augusta Mall Property was previously securitized in JPMCC 2007-LDP10. |
The Property. The Augusta Mall Property is a two-story regional mall located in Augusta, Georgia that contains approximately 1.1 million square feet, of which 500,222 square feet secures the Augusta Mall Loan Combination. The Augusta Mall Property is anchored by Dillard’s, Macy’s, JC Penney and Sears, all of which are not part of the collateral. The Augusta Mall Property is situated on 92.5 acres (including approximately 37.4 acres that is subject to a ground lease; see “Ground Lease” section) and was built in 1978 and renovated in 2007. The sponsor invested approximately $80.0 million in the 2007 renovation, which consisted of the addition of approximately 200,000 square feet of lifestyle space as well as a complete interior renovation with new flooring, entrances, food court amenities and renovated restrooms. Parking is provided by 5,082 surface parking spaces, resulting in a parking ratio of 4.6 spaces per 1,000 square feet of net rentable area. The Augusta Mall Property’s mix of in-line tenants includes Apple, Aeropostale, American Eagle Outfitters, Banana Republic, Forever 21 and Sephora. For the trailing 12-month period ending April 30, 2013, tenants occupying less than 10,000 square feet had comparable in-line sales of $444 per square foot with an average occupancy cost of 12.5%. As of May 31, 2013, the Augusta Mall Property was 97.6% leased to 128 tenants.
THE INFORMATION IN THIS STRUCTURAL AND COLLATERAL TERM SHEET IS NOT COMPLETE AND MAY BE AMENDED PRIOR TO THE TIME OF SALE. THIS TERM SHEET IS NOT AN OFFER TO SELL THESE SECURITIES AND IT IS NOT A SOLICITATION OF AN OFFER TO BUY THESE SECURITIES IN ANY JURISDICTION WHERE THE OFFER OR SALE IS NOT PERMITTED.
30
AUGUSTA MALL
The following table presents certain information relating to the tenancies at the Augusta Mall Property:
Major Tenants
| Tenant Name | Credit Rating (Fitch/ S&P) (1) | Tenant NRSF | % of NRSF | Annual U/W Base Rent PSF(2) | Annual U/W Base | % of Total U/W Base | Sales PSF(3) | Occupancy Cost(3) | Lease Expiration Date | |||||||||||||||||||
Anchor Tenants – Not Part of Collateral |
| |||||||||||||||||||||||||||
Dillard’s | BBB-/Ba3/BB+ | 160,000 | ANCHOR OWNED – NOT PART OF THE COLLATERAL | |||||||||||||||||||||||||
Sears | CCC/B3/CCC+ | 157,971 | ANCHOR OWNED – NOT PART OF THE COLLATERAL | |||||||||||||||||||||||||
Macy’s | BBB/Baa3/BBB | 146,763 | ANCHOR OWNED – NOT PART OF THE COLLATERAL | |||||||||||||||||||||||||
JC Penney | B-/Caa1/CCC+ | 132,489 | ANCHOR OWNED – NOT PART OF THE COLLATERAL | |||||||||||||||||||||||||
Major Tenants – Collateral |
| |||||||||||||||||||||||||||
American Eagle Outfitters | NR/NR/NR | 6,352 | 1.3% | $95.17 | $604,520 | 4.2% | $600 | 14.7% | 1/31/2021 | |||||||||||||||||||
H&M(4) | NR/NR/NR | 23,241 | 4.6% | $25.00 | $581,025 | 4.0% | NAV(4) | NAV(4) | 1/31/2025(5) | |||||||||||||||||||
Dick’s Sporting Goods | NR/NR/NR | 63,000 | 12.6% | $8.33 | $524,790 | 3.6% | $158 | 6.3% | 1/31/2018 | |||||||||||||||||||
Forever 21 | NR/NR/NR | 16,101 | 3.2% | $0.00(6) | $0(6) | 0.0% | $198 | 17.8% | 4/30/2020(7) | |||||||||||||||||||
Barnes & Noble | NR/NR/NR | 29,495 | 5.9% | $13.56 | $399,952 | 2.8% | $217 | 6.5% | 1/31/2019 | |||||||||||||||||||
Foot Locker/House of Hoops(8) | NR/Ba3/BB+ | 6,011 | 1.2% | $61.90 | $372,081 | 2.6% | $625(8) | 10.0%(8) | 8/31/2023 | |||||||||||||||||||
Footaction USA | NR/Ba3/BB+ | 6,340 | 1.3% | $57.56 | $364,930 | 2.5% | $316 | 18.6% | 3/31/2022 | |||||||||||||||||||
Gap | BBB-/Baa3/BBB- | 9,871 | 2.0% | $36.56 | $360,884 | 2.5% | $255 | 15.2% | 1/31/2014 | |||||||||||||||||||
The Shoe Dept. | NR/NR/NR | 8,360 | 1.7% | $38.56 | $322,362 | 2.2% | $219 | 16.7% | 3/31/2021 | |||||||||||||||||||
Champs Sports | NR/Ba3/BB+ | 6,684 | 1.3% | $48.17 | $321,968 | 2.2% | $517 | 9.4% | 1/31/2021 | |||||||||||||||||||
Sephora | NR/NR/NR | 5,265 | 1.1% | $50.47 | $265,725 | 1.8% | $664 | 9.4% | 1/31/2019 | |||||||||||||||||||
Apple | NR/Aa1/AA+ | 5,538 | 1.1% | $45.02 | $249,321 | 1.7% | $2,497 | 1.9% | 1/31/2020 | |||||||||||||||||||
|
|
|
| |||||||||||||||||||||||||
Total Major Tenants – Collateral | 186,258 | 37.2% | $23.45 | $4,367,558 | 30.0% | |||||||||||||||||||||||
Non-Major Tenants – Collateral(9)(10) | 301,817 | 60.3% | $35.06 | $10,168,968 | 70.0% | |||||||||||||||||||||||
|
|
|
| |||||||||||||||||||||||||
Occupied Collateral Total(9)(10) | 488,075 | 97.6% | $30.44 | $14,536,526 | 100.0% | |||||||||||||||||||||||
|
| |||||||||||||||||||||||||||
Vacant Space | 12,147 | 2.4% | ||||||||||||||||||||||||||
|
| |||||||||||||||||||||||||||
Collateral Total | 500,222 | 100% | ||||||||||||||||||||||||||
|
| |||||||||||||||||||||||||||
| (1) | Certain ratings are those of the parent company whether or not the parent guarantees the lease. |
| (2) | Annual U/W Base Rent PSF and Annual U/W Base Rent include contractual rent escalations through July 2014. |
| (3) | Sales PSF and Occupancy Cost represent the trailing 12-month period ending April 30, 2013. |
| (4) | H&M has a signed lease, but has not yet taken occupancy of its space. The tenant is expected to be in occupancy and paying rent in May 2014. |
| (5) | H&M has the right to terminate its lease if net sales do not exceed $4,750,000 ($204 per square foot) in the fourth full lease year (anticipated to end January 2019). The tenant is required to provide notice of its intention to terminate within 90 days of the last day of the fourth full lease year and pay a termination fee equal to 50% of all unamortized tenant improvement costs and leasing commissions. The lease will terminate on the 365th day following the landlord’s receipt of such notice. |
| (6) | Forever 21 has the option to pay rent in an amount equal to 14% of net sales through April 30, 2015 if net sales, on a trailing 12-month basis, do not exceed $3,500,000 ($217 per square foot). Following April 30, 2015, the tenant will commence paying an annual contractual base rent of $637,761 ($39.61 per square foot). An amount equal to 14% of Forever 21’s net sales for the trailing 12-month period ending April 30, 2013 ($446,547; $27.73 per square foot) was underwritten. |
| (7) | Forever 21 has the right to terminate its lease at any time within 30 days following April 30, 2015 with 180 days written notice and the payment of a termination fee equal to 55% of unamortized tenant improvement costs, provided that net sales for each of the two preceding trailing 12-month periods are less than $3,150,000 ($196 per square foot). |
| (8) | Foot Locker/House of Hoops has signed a lease to expand into a larger 6,011 square foot space and is expected to be in occupancy and paying rent in September 2013. The Sales PSF and Occupancy Cost shown are based on the tenant’s current space, which contains 3,200 square feet. |
| (9) | Includes outparcel tenants Jared Galleria of Jewelry and P.F. Chang’s China Bistro, which own their buildings and have no attributed square footage. The Annual U/W Base Rent ($291,110) from these tenants was excluded from the Annual U/W Base Rent PSF for Non-Major Tenants – Collateral and Occupied Collateral Total. |
| (10) | Includes 20,089 square feet attributed to temporary tenants that were not included in the Annual U/W Base Rent. The Annual U/W Base Rent PSF for Non-Major Tenants – Collateral and Occupied Collateral Total exclude the square footage attributed to these tenants. |
THE INFORMATION IN THIS STRUCTURAL AND COLLATERAL TERM SHEET IS NOT COMPLETE AND MAY BE AMENDED PRIOR TO THE TIME OF SALE. THIS TERM SHEET IS NOT AN OFFER TO SELL THESE SECURITIES AND IT IS NOT A SOLICITATION OF AN OFFER TO BUY THESE SECURITIES IN ANY JURISDICTION WHERE THE OFFER OR SALE IS NOT PERMITTED.
31
AUGUSTA MALL
The following table presents certain information relating to the historical sales and occupancy costs at the Augusta Mall Property:
Historical Sales (PSF) and Occupancy Costs(1)
| Tenant Name | 2010 | 2011 | 2012 | TTM 4/30/2013 | ||||
American Eagle Outfitters | $557 | $577 | $612 | $600 | ||||
H&M(2) | NAV | NAV | NAV | NAV | ||||
Dick’s Sporting Goods | $151 | $151 | $157 | $158 | ||||
Forever 21 | $244 | $215 | $205 | $198 | ||||
Barnes & Noble | $186 | $186 | $217 | $217 | ||||
Foot Locker/House of Hoops(3) | $461 | $505 | $608 | $625 | ||||
Footaction USA | $310 | $322 | $352 | $316 | ||||
Gap | $317 | $270 | $271 | $255 | ||||
The Shoe Dept. | $348 | $254 | $214 | $219 | ||||
Champs Sports | $290 | $343 | $491 | $517 | ||||
Sephora | $696 | $748 | $692 | $664 | ||||
Apple | $1,679 | $2,223 | $2,570 | $2,497 | ||||
Total In-line (<10,000 square feet)(4) | $413 | $423 | $447 | $444 | ||||
Occupancy Costs(5) | 12.0% | 12.4% | 12.0% | 12.5% | ||||
(1) | Historical Sales (PSF) and Occupancy Costs are based on historical statements provided by the borrower. | |
(2) | H&M has a signed lease, but has not yet taken occupancy of its space. | |
(3) | Foot Locker/House of Hoops signed a lease to expand into a larger 6,011 square foot space, but has not yet taken occupancy. The Sales PSF and Occupancy Costs shown are based on the tenant’s current space, which contains 3,200 square feet. | |
(4) | Excluding Apple, Total In-line (<10,000 square feet) sales PSF for 2010, 2011, 2012 and TTM 4/30/2013 were $388, $388, $407 and $406, respectively. | |
(5) | Excluding Apple, Occupancy Costs for 2010, 2011, 2012 and TTM 4/30/2013 were 12.9%, 13.6%, 13.2% and 13.8%, respectively. |
The following table presents certain information relating to the lease rollover schedule at the Augusta Mall Property:
Lease Expiration Schedule(1)(2)
Year Ending December 31, | No. of Leases Expiring | Expiring NRSF | % of Total NRSF | Cumulative Expiring NRSF | Cumulative % of Total NRSF | Annual U/W Base Rent | Annual U/W | |||||||||||||||||||
MTM(4) | 9 | 20,089 | 4.0% | 20,089 | 4.0% | $0 | $0.00 | |||||||||||||||||||
2013 | 4 | 5,086 | 1.0% | 25,175 | 5.0% | $141,120 | $27.75 | |||||||||||||||||||
2014 | 10 | 29,685 | 5.9% | 54,860 | 11.0% | $1,010,194 | $34.03 | |||||||||||||||||||
2015 | 10 | 20,035 | 4.0% | 74,895 | 15.0% | $702,640 | $35.07 | |||||||||||||||||||
2016 | 13 | 38,284 | 7.7% | 113,179 | 22.6% | $1,211,068 | $31.63 | |||||||||||||||||||
2017 | 13 | 29,625 | 5.9% | 142,804 | 28.5% | $905,834 | $30.58 | |||||||||||||||||||
2018(5) | 22 | 122,015 | 24.4% | 264,819 | 52.9% | $2,605,823 | $20.50 | |||||||||||||||||||
2019 | 15 | 60,948 | 12.2% | 325,767 | 65.1% | $1,692,637 | $27.77 | |||||||||||||||||||
2020 | 10 | 43,576 | 8.7% | 369,343 | 73.8% | $1,131,672 | $25.97 | |||||||||||||||||||
2021 | 7 | 29,213 | 5.8% | 398,556 | 79.7% | $1,591,875 | $54.49 | |||||||||||||||||||
2022 | 8 | 28,831 | 5.8% | 427,387 | 85.4% | $1,269,674 | $44.04 | |||||||||||||||||||
2023 | 10 | 37,447 | 7.5% | 464,834 | 92.9% | $1,505,940 | $40.22 | |||||||||||||||||||
Thereafter(6) | 2 | 23,241 | 4.6% | 488,075 | 97.6% | $768,048 | $25.00 | |||||||||||||||||||
Vacant | 0 | 12,147 | 2.4% | 500,222 | 100.0% | $0 | $0.00 | |||||||||||||||||||
Total/Weighted Average | 133 | 500,222 | 100.0% | $14,536,526 | $30.44 | |||||||||||||||||||||
(1) | Information obtained from the underwritten rent roll. | |
(2) | Certain tenants may have lease termination options that are exercisable prior to the originally stated expiration date of the subject lease and that are not considered in the Lease Expiration Schedule. | |
(3) | Weighted average Annual U/W Base Rent PSF excludes vacant space, Annual U/W Base Rent attributed to leased fee tenants and square footage attributed to temporary tenants, which were not included in Annual U/W Base Rent. | |
(4) | Includes nine temporary tenants totaling 20,089 square feet that were not included in Annual U/W Base Rent. | |
(5) | Includes outparcel tenant P.F. Chang’s China Bistro, which owns its building and has no attributed square footage. This tenant’s Annual U/W Base Rent of $104,087 was excluded from the Annual U/W Base Rent PSF calculation. | |
(6) | Includes outparcel tenant Jared Galleria of Jewelry, which owns its building and has no attributed square footage. This tenant’s Annual U/W Base Rent of $187,023 was excluded from the Annual U/W Base Rent PSF calculation. |
The following table presents historical occupancy percentages at the Augusta Mall Property:
Historical Occupancy(1)
| 12/31/2010 | 12/31/2011 | 12/31/2012 | 5/31/2013(2) | |||
93.1% | 94.0% | 98.2% | 97.6% |
(1) | Information obtained from the borrower. | |
(2) | Occupancy includes 20,089 square feet attributed to temporary tenants. As of May 31, 2013, the occupancy excluding temporary tenants was 97.5%. |
THE INFORMATION IN THIS STRUCTURAL AND COLLATERAL TERM SHEET IS NOT COMPLETE AND MAY BE AMENDED PRIOR TO THE TIME OF SALE. THIS TERM SHEET IS NOT AN OFFER TO SELL THESE SECURITIES AND IT IS NOT A SOLICITATION OF AN OFFER TO BUY THESE SECURITIES IN ANY JURISDICTION WHERE THE OFFER OR SALE IS NOT PERMITTED.
32
AUGUSTA MALL
Operating History and Underwritten Net Cash Flow. The following table presents certain information relating to the historical operating performance and Underwritten Net Cash Flow at the Augusta Mall Property:
Cash Flow Analysis
| 2011 | 2012 | | TTM 5/31/2013 | | U/W(1) | U/W $ per SF | ||||||||||||||||||||||
Base Rent | $12,563,647 | $13,017,782 | $13,500,968 | $14,536,526 | $28.35 | |||||||||||||||||||||||
Grossed Up Vacant Space | 0 | 0 | 0 | 330,366 | 0.64 | |||||||||||||||||||||||
Percentage Rent | 1,245,105 | 1,159,668 | 1,101,522 | 1,409,830 | 2.75 | |||||||||||||||||||||||
Total Reimbursables | 7,143,269 | 7,965,871 | 8,362,797 | 7,602,099 | 14.83 | |||||||||||||||||||||||
Other Income | 1,921,174 | 1,840,350 | 1,995,811 | 2,062,063 | 4.02 | |||||||||||||||||||||||
Less Vacancy & Credit Loss | 6,168 | (291,177) | (397,271) | (743,345)(2) | (1.45) | |||||||||||||||||||||||
Effective Gross Income | $22,879,363 | $23,692,494 | $24,563,827 | $25,197,539 | $49.15 | |||||||||||||||||||||||
Total Operating Expenses | $7,195,146 | $7,311,995 | $7,224,293 | $7,570,672 | $14.77 | |||||||||||||||||||||||
Net Operating Income | $15,684,217 | $16,380,499 | $17,339,534 | $17,626,867 | $34.38 | |||||||||||||||||||||||
TI/LC | 0 | 0 | 0 | 652,458 | 1.27 | |||||||||||||||||||||||
Capital Expenditures | 0 | 0 | 0 | 102,542 | 0.20 | |||||||||||||||||||||||
Net Cash Flow | $15,684,217 | $16,380,499 | $17,339,534 | $16,871,867 | $32.91 | |||||||||||||||||||||||
NOI DSCR(3) | 2.09x | 2.18x | 2.31x | 2.35x | ||||||||||||||||||||||||
NCF DSCR(3) | 2.09x | 2.18x | 2.31x | 2.25x | ||||||||||||||||||||||||
NOI DY(3) | 9.2% | 9.6% | 10.2% | 10.4% | ||||||||||||||||||||||||
NCF DY(3) | 9.2% | 9.6% | 10.2% | 9.9% | ||||||||||||||||||||||||
(1) | The increase in U/W NOI is due to the inclusion of contractual rent escalations through July 2014 and recent leasing activity. H&M, Finish Line and Foot Locker/House of Hoops all executed leases but have not taken occupancy on their respective spaces. | |
(2) | The underwritten economic vacancy is 5.0%. The Augusta Mall Property was 97.6% physically occupied as of May 31, 2013. | |
(3) | DSCRs and debt yields are based on the Augusta Mall Loan Combination. |
Appraisal. As of the appraisal valuation date of June 25, 2013, the Augusta Mall Property had an “as-is” appraised value of $250,000,000.
Environmental Matters. According to a Phase I environmental site assessment dated July 3, 2013, there was no evidence of any recognized environmental conditions at the Augusta Mall Property.
Market Overview and Competition. The Augusta Mall Property is located on the southeast corner of the intersection of Interstate 520 (Bobby Jones Parkway) and Wrightsboro Road, approximately seven miles west of the Augusta central business district, 142 miles east of Atlanta and 77 miles southwest of Columbia, South Carolina. Primary regional access is provided by Interstate 20, which is approximately two miles north of the Augusta Mall Property, with primary local access provided by Interstate 520 (Bobby Jones Parkway) and Wrightsboro Road, both of which are adjacent to the Augusta Mall Property. Augusta is Georgia’s second largest city, and the surrounding area is home to several colleges and universities with a combined student population of approximately 17,000. In addition, the United States Army Signal Center is located approximately seven miles southwest of the Augusta Mall Property and has a population of approximately 18,000. The city of Augusta is also known for hosting golf’s Masters Tournament, which is estimated to attract approximately 250,000 visitors every April. According to the appraisal, as of 2013, the estimated population within a 10-mile and 25-mile radius of the Augusta Mall Property was approximately 330,653 and 518,986, respectively. The estimated household income within the same 10-mile and 25-mile radii was approximately $63,058 and $61,169, respectively.
According to a third party market research report, the Augusta Mall Property is located within the South Richmond County submarket, which has an estimated inventory of 800 retail buildings totaling approximately 8.6 million square feet with a 5.8% vacancy rate, as of the first quarter of 2013. The appraiser concluded a market rent of $34.97 per square foot, on a triple net basis, for the Augusta Mall Property.
THE INFORMATION IN THIS STRUCTURAL AND COLLATERAL TERM SHEET IS NOT COMPLETE AND MAY BE AMENDED PRIOR TO THE TIME OF SALE. THIS TERM SHEET IS NOT AN OFFER TO SELL THESE SECURITIES AND IT IS NOT A SOLICITATION OF AN OFFER TO BUY THESE SECURITIES IN ANY JURISDICTION WHERE THE OFFER OR SALE IS NOT PERMITTED.
33
AUGUSTA MALL
The following table presents certain information relating to comparable retail properties for the Augusta Mall Property:
Competitive Set(1)
Augusta Mall | Augusta Exchange | Columbiana Centre | WestGate Mall | Haywood Mall | Anderson Mall | |||||||
Location | Augusta, GA | Augusta, GA | Columbia, SC | Spartanburg, SC | Greenville, SC | Anderson, SC | ||||||
Distance from Subject | -- | 1.5 miles | 67.0 miles | 100.0 miles | 95.0 miles | 80.0 miles | ||||||
Property Type | Regional Mall | Power Center | Regional Mall | Regional Mall | Regional Mall | Regional Mall | ||||||
Year Built/Renovated | 1978/2007 | 1997/NAP | 1990/2005 | 1975/1996 | 1980/2005 | 1972/2008 | ||||||
Target, Hobby Lobby, Sports Authority, HH | Sears, Belk, Dillard’s, JC | |||||||||||
| Dillard’s, Sears, | Gregg, Ashley | Belk, Dillard’s, | Penney, Bed | Belk, Dillard’s, | ||||||||
Anchors | Macy’s, JC | Furniture, Bed Bath & | Sears, JC | Bath & Beyond, | Macy’s, Sears, JC | Belk, Dillard’s, JC | ||||||
| Penney | Beyond, Buy Buy Baby, | Penney | Dick’s, Regal | Penney | Penney, Sears | |||||||
| PetSmart, Staples, | Cinemas | |||||||||||
| Michaels, Ulta | ||||||||||||
Total GLA | 1,097,445 SF(2) | 532,945 SF | 826,331 SF | 954,302 SF | 1,229,000 SF | 671,803 SF | ||||||
Total Occupancy | 99%(2) | 98% | 96% | 99% | 99% | 85% |
| (1) | Information obtained from the appraisal. |
| (2) | Total GLA and Total Occupancy are inclusive of non-collateral anchors. |
The Borrower. The borrower is Augusta Mall, LLC, a single purpose entity with two independent directors. Legal counsel to the borrower delivered a non-consolidation opinion in connection with the origination of the Augusta Mall Loan Combination. GGPLP L.L.C., the loan sponsor, is the guarantor of certain nonrecourse carveouts under the Augusta Mall Loan Combination.
The Sponsor. The loan sponsor is GGPLP L.L.C. (“GGP”). GGP is a publicly traded REIT that had total assets of approximately $26.9 billion as of March 31, 2013 according to GGP’s 10-Q. As of March 31, 2013, GGP’s portfolio consisted of 142 regional malls totaling approximately 134 million square feet which generated sales of $558 per square foot for the trailing 12-month period ending March 31, 2013. GGP entered Chapter 11 bankruptcy proceedings in April 2009 and emerged from bankruptcy protection in November 2010. See “Risk Factors - The Borrower’s Form of Entity May Cause Special Risks” in the Free Writing Prospectus.
Escrows. Upon origination, the borrower issued a guaranty for $1,798,660 in connection with outstanding tenant improvement allowances for H&M ($1,394,460), P.S. from Aeropostale ($111,700), Clark’s ($100,000), Finish Line ($100,000), Body Central ($75,000) and Soma Intimates ($17,500). The borrower also issued a guaranty for $9,550 in connection with immediate repairs, which are to be completed within 90 days of the closing date of the Augusta Mall Loan Combination.
The loan documents do not require monthly escrows for real estate taxes provided the following conditions are met: (i) no event of default has occurred and is continuing; (ii) the borrower has provided the lender with timely proof of full payment; and (iii) a Trigger Event Period (as defined below) does not currently exist. The loan documents do not require monthly escrows for insurance provided either (i) (a) no event of default has occurred and is continuing; (b) the insurance required to be maintained by the borrower is maintained pursuant to one or more blanket policies; and (c) the borrower provides the lender with proof of payment of insurance premiums satisfactory to the lender; or (ii) a Trigger Event Period does not currently exist. The loan documents do not require monthly escrows for replacement reserves as long as no Trigger Event Period exists and is continuing. During a Trigger Event Period, the borrower is required to deposit monthly replacement reserves in an amount equal to $8,545 (subject to a cap of $102,540). The loan documents do not require monthly escrows for tenant improvements and leasing commissions as long as no Trigger Event Period exists and is continuing. During a Trigger Event Period, the borrower is required to deposit monthly into the escrow account for tenant improvement and leasing commissions in an amount equal to $42,726 (subject to a cap of $512,712). In addition, during a Trigger Event Period, the borrower is required to make monthly deposits into a ground rent reserve account in an amount equal to one-twelfth of the estimated annual ground rent payment payable during the next ensuing 12 months.
A “Trigger Event Period” will commence upon (i) the occurrence and continuance of an event of default or (ii) the debt service coverage ratio (based on a 30-year amortization term) for the trailing 12-month period falling below 1.25x at the end of any calendar quarter. A Trigger Event Period will expire upon the cure of such event of default or the debt service coverage ratio (based on a 30-year amortization term) being equal to or greater than 1.25x for two consecutive calendar quarters.
Lockbox and Cash Management. The Augusta Mall Loan Combination requires a lender-controlled lockbox account, which is already in place, and that the borrower direct tenants to pay their rents directly into such lockbox account. The loan documents also require that all rents received by the borrower or the property manager be deposited into the lockbox account within five business days of receipt. Prior to the occurrence of a Trigger Event Period, all funds on deposit in the lockbox account are swept into the borrower’s operating account on a daily basis. During a Trigger Event Period, all excess cash flow is swept on a monthly basis (or daily during the continuance of an event of default) to a cash management account under control of the lender.
Property Management. The Augusta Mall Property is managed by an affiliate of the borrower.
THE INFORMATION IN THIS STRUCTURAL AND COLLATERAL TERM SHEET IS NOT COMPLETE AND MAY BE AMENDED PRIOR TO THE TIME OF SALE. THIS TERM SHEET IS NOT AN OFFER TO SELL THESE SECURITIES AND IT IS NOT A SOLICITATION OF AN OFFER TO BUY THESE SECURITIES IN ANY JURISDICTION WHERE THE OFFER OR SALE IS NOT PERMITTED.
34
AUGUSTA MALL
Assumption. The borrower has the one-time right to transfer the Augusta Mall Property, provided that no event of default has occurred and is continuing and certain other conditions are satisfied, including, but not limited to the following: (i) the lender’s reasonable determination that the proposed transferee and guarantor satisfy lender’s credit review and underwriting standards, taking into consideration transferee experience, financial strength and general business standing; (ii) execution of a recourse guaranty and an environmental indemnity by an affiliate of the transferee; and (iii) if requested by lender, rating agency confirmation from Fitch, KBRA and Moody’s that the transfer will not result in a downgrade, withdrawal or qualification of the respective ratings assigned to the Series 2013-C15 Certificates, and similar confirmations with respect to the ratings of any securities backed by the Augusta Mall Companion Loan.
In addition, the loan documents permit equity transfers of direct or indirect equity interests in a Restricted Party (as defined in the loan documents) subject to certain conditions, including not less than 50% of equity interests in the borrower being owned by a Qualified Equity holder (as defined below) and controls the borrower.
A “Qualified Equity holder” is defined as GGP or an affiliate, or other institution having total assets in excess of $600 million and capital/statutory surplus in excess of $250 million, or any permitted mezzanine lender or party for whom written confirmation from Fitch, KBRA and Moody’s has been obtained that the transfer to the entity in question will not result in a downgrade, withdrawal or qualification of the then-current ratings assigned to the Series 2013-C15 Certificates, and similar confirmations with respect to the ratings of any securities backed by the Augusta Mall Companion Loan.
Partial Release. The borrower may obtain a release of certain vacant, non-income producing, unimproved outlots or parcels from the lien of the mortgage upon the satisfaction of certain conditions including without limitation (i) no event of default will have occurred and be continuing on the date the borrower delivers notice and on the date of release; (ii) the delivery of a legal opinion to the lender to demonstrate that the release of the related outparcel will satisfy REMIC requirements; and (iii) receipt of written confirmation from Fitch, KBRA and Moody’s that the transfer will not result in a downgrade, withdrawal or qualification of the then-current ratings assigned to the Series 2013-C15 Certificates, and similar confirmations with respect to the ratings of any securities backed by the Augusta Mall Companion Loan.
Real Estate Substitution. The borrower may obtain a release of certain vacant, non-income producing, unimproved outlots or parcels from the lien of the mortgage in connection with a substitution of a different parcel subject to the satisfaction of certain conditions, including without limitation (i) no event of default will have occurred and be continuing on the date the borrower delivers notice and on the date of release; (ii) simultaneously with the substitution, the borrower will be required to acquire the fee simple or leasehold interest to the substitution parcel located at the shopping center of which the substituted parcel is a part, that is at least equal in value to the substituted parcel; (iii) delivery to the lender of an acceptable Phase I report (as defined in the loan documents) and a physical condition report (if the substitution parcel is improved); and (iv) receipt of written confirmation from Fitch, KBRA and Moody’s that the transfer will not result in a downgrade, withdrawal or qualification of the then-current ratings assigned to the Series 2013-C15 Certificates, and similar confirmations with respect to the ratings of any securities backed by the Augusta Mall Companion Loan.
Subordinate and Mezzanine Indebtedness. There is no existing mezzanine debt in place related to the Augusta Mall Loan Combination, however, future mezzanine debt is permitted subject to satisfaction of certain conditions, including (i) no event of default has occurred and is continuing; (ii) the lender receives no less than 30 days prior written notice; (iii) an intercreditor agreement in form and substance acceptable to Fitch, KBRA, Moody’s and any rating agencies rating securities backed by the Augusta Mall Companion Loan and reasonably acceptable to the lender; (iv) the combined loan-to-value ratio will not be greater than 70%; (v) the combined debt service coverage ratio (based on a 30-year amortization term) will not be less than 1.66x; and (vi) mezzanine loan documents acceptable to Fitch, KBRA, Moody’s and any rating agencies rating securities backed by the Augusta Mall Companion Loan and reasonably acceptable to the lender will have been delivered to the lender.
The loan documents permit certain sponsor affiliates to pledge indirect ownership interests to a qualified pledgee (an institution having $600 million in total assets and $250 million in capital/statutory surplus, and regularly engaged in business of owning or making commercial real estate loans, or otherwise is party for whom rating agency confirmation has been obtained) subject to certain conditions, including: (i) a pledge is given in connection with a credit facility secured by multiple properties for which repayment is not primarily dependent upon property cash flow; and (ii) neither the granting or exercise of remedies related to the pledge shall result in the Augusta Mall Property’ s being managed by a party other than the borrower or a Qualified Manager (as defined in the Augusta Mall Loan Combination documents).
Ground Lease. Two portions of the Augusta Mall Property, comprising a total of approximately 37.4 acres of the 92.5-acre site, are subject to independent ground leases, each of which has an expiration date of December 31, 2043 and one 25-year extension option. The ground leases for the two parcels have features that create special risks. See “Description of the Mortgage Pool – Statistical Characteristics of the Mortgage Pool –Ground Leases” in the Free Writing Prospectus.
Terrorism Insurance. The loan documents require that the “all risk” insurance policy required to be maintained by the borrower provides coverage for terrorism in an amount equal to the full replacement cost of the Augusta Mall Property; provided, however, that the borrower will not be required to spend more than 200% of the costs of a stand-alone policy for terrorism insurance immediately prior to the date that TRIA or a similar government backstop is no longer in effect. The loan documents also require business interruption insurance covering no less than the 18-month period following the occurrence of a casualty event, together with an extended period of indemnity, which shall continue for the lesser of (i) the period of time until income returns to the same level as it was prior to loss and (ii) 90 days.
THE INFORMATION IN THIS STRUCTURAL AND COLLATERAL TERM SHEET IS NOT COMPLETE AND MAY BE AMENDED PRIOR TO THE TIME OF SALE. THIS TERM SHEET IS NOT AN OFFER TO SELL THESE SECURITIES AND IT IS NOT A SOLICITATION OF AN OFFER TO BUY THESE SECURITIES IN ANY JURISDICTION WHERE THE OFFER OR SALE IS NOT PERMITTED.
35
MOLINA OFFICE PORTFOLIO
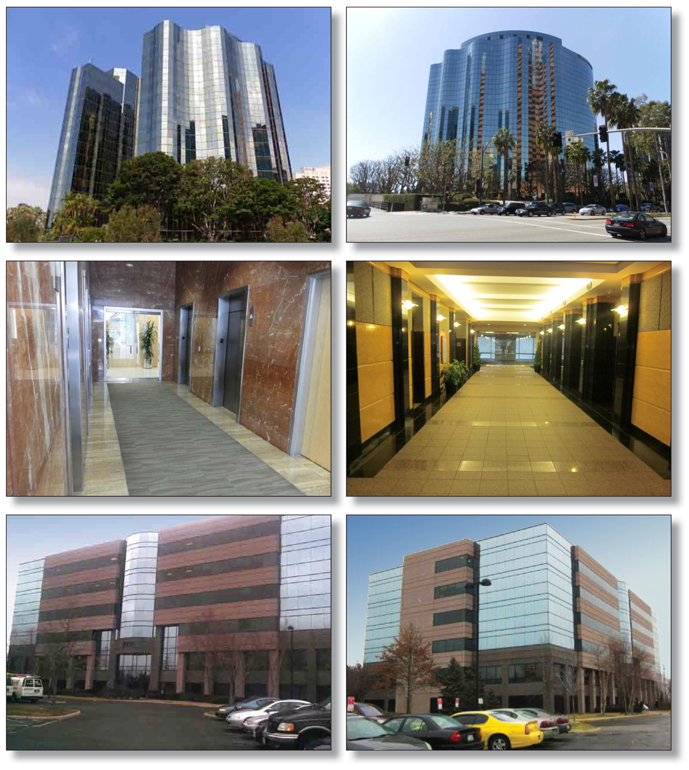
THE INFORMATION IN THIS STRUCTURAL AND COLLATERAL TERM SHEET IS NOT COMPLETE AND MAY BE AMENDED PRIOR TO THE TIME OF SALE. THIS TERM SHEET IS NOT AN OFFER TO SELL THESE SECURITIES AND IT IS NOT A SOLICITATION OF AN OFFER TO BUY THESE SECURITIES IN ANY JURISDICTION WHERE THE OFFER OR SALE IS NOT PERMITTED.
36
MOLINA OFFICE PORTFOLIO
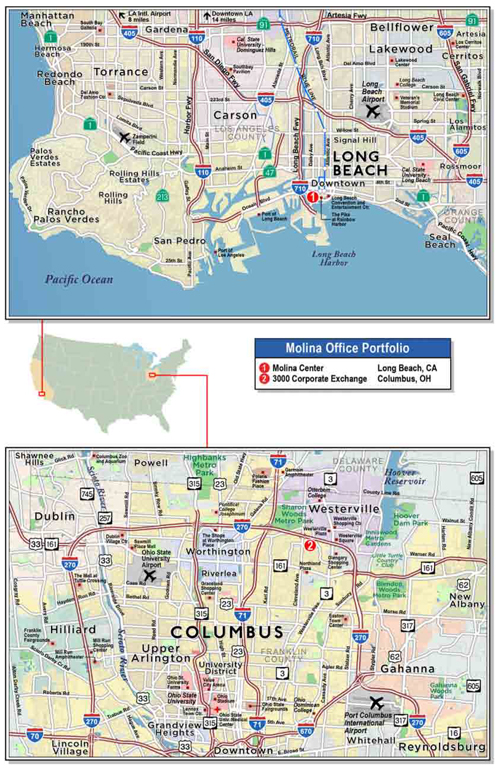
THE INFORMATION IN THIS STRUCTURAL AND COLLATERAL TERM SHEET IS NOT COMPLETE AND MAY BE AMENDED PRIOR TO THE TIME OF SALE. THIS TERM SHEET IS NOT AN OFFER TO SELL THESE SECURITIES AND IT IS NOT A SOLICITATION OF AN OFFER TO BUY THESE SECURITIES IN ANY JURISDICTION WHERE THE OFFER OR SALE IS NOT PERMITTED.
37
| No. 2 – Molina Office Portfolio | ||
| Loan Information | ||||||
Mortgage Loan Seller: |
The Royal Bank of Scotland | |||||
Credit Assessment | ||||||
| (Fitch/KBRA/Moody’s): | NR/NR/NR | |||||
Original Principal Balance: | $103,770,000 | |||||
Cut-off Date Principal Balance: | $ 103,770,000 | |||||
% of Initial Pool Balance: | 9.4% | |||||
Loan Purpose: |
Acquisition | |||||
Borrower Name: |
AGNL Clinic, L.P. | |||||
Sponsor: | AG Net Lease II Corp. | |||||
Mortgage Rate: | 4.356% | |||||
Note Date: |
June 13, 2013 | |||||
| Anticipated Repayment Date: |
July 6, 2023 | |||||
| Maturity Date: |
July 6, 2043 | |||||
IO Period: |
60 months | |||||
Loan Term (Original): |
120 months | |||||
Seasoning: |
1 month | |||||
Amortization Term (Original): |
360 months | |||||
Loan Amortization Type: |
Interest-only, Amortizing ARD | |||||
Interest Accrual Method: |
Actual/360 | |||||
Call Protection: |
L(25),GRTR 1% or YM(88),O(7) | |||||
Lockbox Type: |
Hard/Springing Cash Management | |||||
Additional Debt: |
Yes | |||||
Additional Debt Type: |
Future Mezzanine | |||||
Escrows and Reserves(1): | ||||||
| Type: | Initial | Monthly | Cap (If Any) | |||
Taxes | $0 | Springing | NAP | |||
Insurance | $0 | Springing | NAP | |||
Replacement Reserves | $0 | Springing | $1,000,000 | |||
TI/LC Reserve | $3,270,000 | Springing | $5,000,000 | |||
| Property Information | ||
Single Asset/Portfolio: |
Portfolio | |
Property Type: |
Office | |
Specific Property Type: |
Suburban | |
Location: |
Various – See Table | |
Size: |
621,446 SF | |
Cut-off Date Principal |
$166.98 | |
| Balance Per SF: | ||
Year Built/Renovated: |
Various – See Table | |
Title Vesting: | Fee | |
Property Manager: |
McKinney Brokerage Group, | |
3rdMost Recent Occupancy(2): | NAV | |
2ndMost Recent Occupancy(2): |
NAV | |
Most Recent Occupancy(2): |
NAV | |
Current Occupancy (As of): |
100.0%(8/1/2013) | |
| Underwriting and Financial Information: | ||
| 3rdMost Recent NOI(2): | NAV | |
2ndMost Recent NOI(2): | NAV | |
Most Recent NOI(2): | NAV | |
U/W Revenues: | $11,946,282 | |
U/W Expenses: |
$358,388 | |
U/W NOI: |
$11,587,894 | |
U/W NCF: |
$10,991,953 | |
U/W NOI DSCR: |
1.87x | |
U/W NCF DSCR: |
1.77x | |
U/W NOI Debt Yield: |
11.2% | |
U/W NCF Debt Yield: |
10.6% | |
As-Is Appraised Value: |
$158,700,000 | |
As-Is Appraisal Valuation Date(3): |
Various | |
Cut-off Date LTV Ratio: |
65.4% | |
LTV Ratio at Maturity or ARD: |
59.7% | |
| (1) | See “Escrows” section. |
| (2) | Historical occupancy and financial data is not available as the Molina Office Portfolio properties were acquired in a sale-leaseback transaction in June 2013. |
| (3) | See “Appraisal” section. |
The Mortgage Loan. The mortgage loan (the “Molina Office Portfolio Mortgage Loan”) is evidenced by a single promissory note that is secured by a first mortgage encumbering a portfolio comprised of two, 14-story office towers in Long Beach, California and a six-story office tower in Columbus, Ohio (the “Molina Office Portfolio Properties”). The Molina Office Portfolio Mortgage Loan was originated on June 13, 2013 by The Royal Bank of Scotland. The Molina Office Portfolio Mortgage Loan had an original principal balance of $103,770,000, has an outstanding principal balance as of the Cut-off Date of $103,770,000 and accrues interest at an interest rate of 4.356% per annum. The Molina Office Portfolio Mortgage Loan had an initial term of 120 months, has a remaining term of 119 months as of the Cut-off Date and requires interest-only payments for the first 60 payments following origination and thereafter requires payments of principal and interest based on a 30-year amortization schedule through the anticipated repayment date (“ARD”). The ARD is July 6, 2023 and the final maturity date is July 6, 2043. In the event the Molina Office Portfolio Mortgage Loan is not paid in full on or before the ARD, the Molina Office Portfolio Mortgage Loan will have a remaining term of 240 months and will accrue interest at a rate equal to the greater of (i) 7.356% and (ii) the interpolated 20-year treasury rate as of the ARD plus 3.0%. The ARD automatically triggers a full cash flow sweep whereby all excess cash flow will be used to pay down the principal balance.
Following the lockout period, the borrower has the right to prepay the Molina Office Portfolio Mortgage Loan in whole, but not in part, provided that the borrower pays the greater of a yield maintenance premium or a prepayment premium equal to 1.0% of the principal amount being prepaid on any date before January 6, 2023. In addition, the Molina Office Portfolio Mortgage Loan is prepayable without penalty on or after January 6, 2023.
THE INFORMATION IN THIS STRUCTURAL AND COLLATERAL TERM SHEET IS NOT COMPLETE AND MAY BE AMENDED PRIOR TO THE TIME OF SALE. THIS TERM SHEET IS NOT AN OFFER TO SELL THESE SECURITIES AND IT IS NOT A SOLICITATION OF AN OFFER TO BUY THESE SECURITIES IN ANY JURISDICTION WHERE THE OFFER OR SALE IS NOT PERMITTED.
38
MOLINA OFFICE PORTFOLIO
Sources and Uses
| Sources | Uses | |||||||||||||||
Original loan amount | $103,770,000 | 63.8% | Purchase price | $158,625,566 | 97.5% | |||||||||||
Sponsor’s new cash contribution | 58,970,917 | 36.2 | Reserves | 3,270,000 | 2.0 | |||||||||||
| Closing costs | 845,351 | 0.5 | ||||||||||||||
Total Sources | $162,740,917 | 100.0% | Total Uses | $162,740,917 | 100.0% |
The Properties. The Molina Office Portfolio Properties are comprised of two, 14-story class A office buildings located in Long Beach, California (“Molina Center”) and a six-story class B office building located in Columbus, Ohio (“3000 Corporate Exchange”). The Molina Office Portfolio Properties are leased to Molina Healthcare Inc., (NYSE: MOH) and collectively contain 621,446 square feet of office space. The Molina Center property serves as the corporate headquarters for Molina Healthcare Inc. and is comprised of two adjacent, 14-story class A office buildings that contain a total of 461,265 square feet. The Molina Center property was built in 1983 and renovated and updated in 2013. The Molina Center property is located along Ocean Boulevard and the Long Beach Freeway and has views of the Pacific Ocean. Parking is provided by 1,093 spaces in a three-level parking structure, which equates to 2.4 spaces per 1,000 square feet of rentable area. The 3000 Corporate Exchange property serves as the Ohio state headquarters of Molina Healthcare Inc., and is a six-story, class B office building containing 160,181 square feet. The 3000 Corporate Exchange property was built in 1999, renovated in 2013, and is a LEED certified building located at the intersection of Interstate 270 and the Cleveland Avenue highway interchange. Parking is provided by 1,067 surface parking spaces, resulting in a parking ratio of 6.7 spaces per 1,000 square feet of rentable area. As of August 1, 2013, the Molina Office Portfolio Properties were 100.0% occupied by Molina Healthcare Inc. on a triple net lease through April 2038. The lease has six, five-year renewal options with 18 months written notice and 3.0% rent increases. Molina Healthcare Inc. was founded in Long Beach, California in 1980 and reported March 30, 2013 assets and equity of $2.5 billion and $764.2 million, respectively.
The following table presents certain information relating to the Molina Office Portfolio Properties:
| Property Name | Location | Allocated Cut- off Date Principal Balance | % of Portfolio Cut-off Date Principal Balance | Occupancy | Year Built/ Renovated | Net Rentable Area��(SF) | Appraised Value | |||||||
Molina Center | Long Beach, CA | $88,070,000 | 84.9% | 100.0% | 1983/2013 | 461,265 | $134,700,000 | |||||||
3000 Corporate Exchange | Columbus, OH | $15,700,000 | 15.1% | 100.0% | 1999/2013 | 160,181 | $24,000,000 | |||||||
Total/Weighted Average |
$103,770,000 | 100.0% | 100.0% | 621,446 | $158,700,000 |
The following table presents certain information relating to the tenant at the Molina Office Portfolio Properties:
Major Tenant
| Tenant Name | Credit Rating (Fitch/Moody’s/ S&P) | Tenant NRSF | % of NRSF | Annual U/W Base Rent PSF(1) | Annual U/W Base Rent(1) | % of Total Annual U/W Base Rent | Lease Expiration Date | |||||||||||||||||
Major Tenant | ||||||||||||||||||||||||
Molina Healthcare Inc. |
NR/NR/NR
|
|
621,446
|
|
|
100.0%
|
|
|
$20.24
|
|
|
$12,575,034
|
|
|
100.0%
|
|
4/30/2038
| |||||||
|
|
|
| |||||||||||||||||||||
Total Major Tenant | 621,446 | 100.0% | $20.24 | $12,575,034 | 100.0% | |||||||||||||||||||
|
|
|
| |||||||||||||||||||||
| (1) | The Annual U/W Base Rent represents an average of the tenant’s annual rental obligations during the term of the Molina Office Portfolio Mortgage Loan. The tenant currently pays an annual base rental rate of $17.54 per net rentable square foot, on a triple net basis. The weighted average Annual U/W Base Rent PSF is $20.24, based on $23.06 per net rentable square foot at the Molina Center property and $12.10 per net rentable square foot at the 3000 Corporate Exchange property, on a triple net basis, which includes increases at the end of each calendar year in an amount equal to 3.0% per net rentable square foot. |
THE INFORMATION IN THIS STRUCTURAL AND COLLATERAL TERM SHEET IS NOT COMPLETE AND MAY BE AMENDED PRIOR TO THE TIME OF SALE. THIS TERM SHEET IS NOT AN OFFER TO SELL THESE SECURITIES AND IT IS NOT A SOLICITATION OF AN OFFER TO BUY THESE SECURITIES IN ANY JURISDICTION WHERE THE OFFER OR SALE IS NOT PERMITTED.
39
MOLINA OFFICE PORTFOLIO
The following table presents certain information relating to the lease rollover schedule at the Molina Office Portfolio Properties:
Lease Expiration Schedule(1)
Year Ending December 31, | No. of Leases Expiring | Expiring NRSF | % of Total NRSF | Cumulative Expiring NRSF | Cumulative % of Total NRSF | Annual U/W Base Rent | Annual U/W Base | |||||||||||||||||||
MTM | 0 | 0 | 0.0 | % | 0 | 0.0 | % | $0 | $0.00 | |||||||||||||||||
2013 | 0 | 0 | 0.0 | % | 0 | 0.0 | % | $0 | $0.00 | |||||||||||||||||
2014 | 0 | 0 | 0.0 | % | 0 | 0.0 | % | $0 | $0.00 | |||||||||||||||||
2015 | 0 | 0 | 0.0 | % | 0 | 0.0 | % | $0 | $0.00 | |||||||||||||||||
2016 | 0 | 0 | 0.0 | % | 0 | 0.0 | % | $0 | $0.00 | |||||||||||||||||
2017 | 0 | 0 | 0.0 | % | 0 | 0.0 | % | $0 | $0.00 | |||||||||||||||||
2018 | 0 | 0 | 0.0 | % | 0 | 0.0 | % | $0 | $0.00 | |||||||||||||||||
2019 | 0 | 0 | 0.0 | % | 0 | 0.0 | % | $0 | $0.00 | |||||||||||||||||
2020 | 0 | 0 | 0.0 | % | 0 | 0.0 | % | $0 | $0.00 | |||||||||||||||||
2021 | 0 | 0 | 0.0 | % | 0 | 0.0 | % | $0 | $0.00 | |||||||||||||||||
2022 | 0 | 0 | 0.0 | % | 0 | 0.0 | % | $0 | $0.00 | |||||||||||||||||
2023 | 0 | 0 | 0.0 | % | 0 | 0.0 | % | $0 | $0.00 | |||||||||||||||||
Thereafter | 1 | 621,446 | 100.0 | % | 621,446 | 100.0 | % | $12,575,034 | $20.24 | |||||||||||||||||
Vacant | 0 | 0 | 0.0 | % | 621,446 | 100.0 | % | $0 | $0.00 | |||||||||||||||||
Total/Weighted Average | 1 | 621,446 | 100.0 | % | $12,575,034 | $20.24 | ||||||||||||||||||||
| (1) | Information obtained from the underwritten rent roll. |
The following table presents historical occupancy percentages at the Molina Office Portfolio Properties:
Historical Occupancy(1)
| 12/31/2010 | 12/31/2011 | 12/31/2012 | 8/1/2013 | |||
| NAV | NAV | NAV | 100% | |||
(1) | The Molina Office Portfolio Properties were previously owner-occupied by Molina Healthcare Inc. and certain of its affiliates and a lease was not in place. The borrower acquired the Molina Office Portfolio Properties in June 2013 through a sale-leaseback transaction and executed a new lease. |
Operating History and Underwritten Net Cash Flow. The following table presents certain information relating to the Underwritten Net Cash Flow at the Molina Office Portfolio Properties:
Cash Flow Analysis(1)
| In Place | U/W | U/W $ per SF | ||||||||||
Base Rent | $10,901,851 | $12,575,034 | $20.24 | |||||||||
Grossed Up Vacant Space | 0 | 0 | 0.00 | |||||||||
Other Income | 0 | 0 | 0.00 | |||||||||
Total Reimbursables | 0 | 0 | 0.00 | |||||||||
Less Vacancy & Credit Loss | 0 | (628,752)(2) | (1.01) | |||||||||
|
|
|
|
|
| |||||||
Effective Gross Income | $10,901,851 | $11,946,282 | $19.22 | |||||||||
Total Operating Expenses | $0 | $358,388(3) | $0.58 | |||||||||
|
|
|
|
|
| |||||||
Net Operating Income | $10,901,851 | $11,587,894 | $18.65 | |||||||||
TI/LC | 0 | 452,430 | 0.73 | |||||||||
Capital Expenditures | 0 | 143,511 | 0.23 | |||||||||
|
|
|
|
|
| |||||||
Net Cash Flow | $10,901,851 | $10,991,953 | $17.69 | |||||||||
NOI DSCR | 1.76x | 1.87x | ||||||||||
NCF DSCR | 1.76x | 1.77x | ||||||||||
NOI DY | 10.5% | 11.2% | ||||||||||
NCF DY | 10.5% | 10.6% | ||||||||||
(1) | No historical financial information is available as the Molina Office Portfolio Properties were acquired by a sale-leaseback transaction in June 2013. | |
(2) | The underwritten economic vacancy is 5.0%. The Molina Office Portfolio Properties were 100.0% physically occupied as of August 1, 2013. | |
(3) | The only underwritten operating expense is a management fee of 3.0% of Effective Gross Income. All other expenses are paid directly by Molina Healthcare Inc. |
Appraisal. As of the appraisal valuation dates of February 28, 2013 and March 1, 2013 for the Molina Center property and the 3000 Corporate Exchange property, respectively, the Molina Office Portfolio Properties had an aggregate “as-is” appraised value of $158,700,000 and an aggregate hypothetical “go dark” value of $108,850,000.
THE INFORMATION IN THIS STRUCTURAL AND COLLATERAL TERM SHEET IS NOT COMPLETE AND MAY BE AMENDED PRIOR TO THE TIME OF SALE. THIS TERM SHEET IS NOT AN OFFER TO SELL THESE SECURITIES AND IT IS NOT A SOLICITATION OF AN OFFER TO BUY THESE SECURITIES IN ANY JURISDICTION WHERE THE OFFER OR SALE IS NOT PERMITTED.
40
MOLINA OFFICE PORTFOLIO
Environmental Matters. According to the Phase I environmental site assessment dated March 13, 2013, there was evidence of a historical recognized environmental condition (“REC”) at the Molina Center property related to a 550-gallon diesel fuel underground storage tank which had earlier been removed. No further action was recommended. The Phase I report also identified suspect asbestos containing materials that may be located at the Molina Center property. The suspect asbestos containing materials are not considered an REC when maintained in good condition and no further action was recommended.
According to the Phase I environmental site assessment dated March 11, 2013, there was no evidence of any REC at the 3000 Corporate Exchange property.
Market Overview and Competition. The Molina Office Portfolio Properties are located in Long Beach, California and Columbus, Ohio.
The Molina Center property is located in downtown Long Beach, within Los Angeles County, California. The Molina Center property is located approximately 14 miles south of the Los Angeles Civic Center and less than nine miles southwest of the Long Beach Municipal Airport. According to the appraisal, Long Beach is the fifth largest city in California and benefits from over 5.5 million visitors, adding over $1.75 billion each year to Long Beach’s economy. According to the appraisal, the 2012 population and average household income within a five-mile radius of the Molina Center property were approximately 380,883 and $61,597, respectively. According to the appraisal, the Molina Center property is located within the downtown Long Beach submarket of the Los Angeles County office market. As of the fourth quarter 2012, the Los Angeles County office market had a vacancy rate and average annual asking gross lease rate of 18.4% and $30.36 per square foot, respectively. As of the fourth quarter of 2012, the Downtown Long Beach submarket had a vacancy rate and average annual asking gross lease rate of 17.4% and $25.20 per square foot, respectively.
The 3000 Corporate Exchange property is located at the intersection of Interstate 270 and the Cleveland Avenue highway interchange, approximately 10 miles northeast of the Columbus central business district. The 3000 Corporate Exchange property is approximately seven miles northwest of the Port Columbus International Airport and approximately eight miles northeast of Ohio State University. According to the appraisal, the 3000 Corporate Exchange property is located within the Columbus office market and the Westerville submarket. As of year end 2012, the Columbus office market vacancy rate and average asking gross lease rate were 18.1% and $18.01, respectively. As of year-end 2012, the Westerville submarket vacancy rate and average asking gross lease rate were 29.3% and $17.57, respectively.
The following table presents certain information relating to comparable office properties for the Molina Center property:
Competitive Set(1)
Molina Center (Subject) | Landmark Square | 333 W Ocean Blvd | Salvation Army | Shoreline Square | Union Bank Building | |||||||
Location | Long Beach, CA | Long Beach, CA | Long Beach, CA | Long Beach, CA | Long Beach, CA | Long Beach, CA | ||||||
Distance from Subject | -- | 0.4 miles | 0.3 miles | 0.6 miles | 0.6 miles | <0.1 miles | ||||||
Property Type | Office | Office | Office | Office | Office | Office | ||||||
Year Built | 1983 | 1990 | 1962 | 1982 | 1987 | 1976 | ||||||
Number of Stories | 14 | 24 | 5 | 12 | 21 | 14 | ||||||
Total GLA | 461,265 SF | 442,777 SF | 188,965 SF | 199,156 SF | 383,630 SF | 157,683 SF | ||||||
Total Occupancy | 100% | 85% | 100% | 100% | 91% | 97% |
| (1) | Information obtained from the underwritten rent roll and appraisal. |
The following table presents certain information relating to comparable office properties for the 3000 Corporate Exchange property:
Competitive Set(1)
3000 Corporate | Community Corporate Center | Office at Polaris | Corporate Exchange V | 1105 Schrock | Confidential | |||||||
Location | Columbus, OH | Columbus, OH | Columbus, OH | Columbus, OH | Columbus, OH | Columbus, OH | ||||||
Distance from Subject | -- | 6.0 miles | 4.3 miles | <0.1 miles | 3.3 miles | -- | ||||||
Property Type | Office | Office | Office | Office | Office | Office | ||||||
Year Built | 1999 | 1988 | 1997 | 1986 | 1983 | 1983 | ||||||
Number of Stories | 6 | 9 | 4 | 4 | 8 | 3 | ||||||
Total GLA | 160,181 SF | 255,371 SF | 96,646 SF | 126,254 SF | 213,249 SF | 103,683 SF | ||||||
Total Occupancy | 100% | NAV | NAV | NAV | NAV | NAV |
| (1) | Information obtained from the underwritten rent roll and appraisal. |
The Borrower. The borrower is AGNL Clinic, L.P., a Delaware limited partnership with two independent directors. Legal counsel to the borrower delivered a non-consolidation opinion in connection with the origination of the Molina Office Portfolio Mortgage Loan. AG Net Lease II Corp. is the guarantor of certain nonrecourse carveouts under the Molina Office Portfolio Mortgage Loan.
THE INFORMATION IN THIS STRUCTURAL AND COLLATERAL TERM SHEET IS NOT COMPLETE AND MAY BE AMENDED PRIOR TO THE TIME OF SALE. THIS TERM SHEET IS NOT AN OFFER TO SELL THESE SECURITIES AND IT IS NOT A SOLICITATION OF AN OFFER TO BUY THESE SECURITIES IN ANY JURISDICTION WHERE THE OFFER OR SALE IS NOT PERMITTED.
41
MOLINA OFFICE PORTFOLIO
The Sponsor. The sponsor is AG Net Lease II Corp. (“AG Net Lease”), a subsidiary of Angelo, Gordon & Co. AG Net Lease is a real estate investment firm that focuses on the management, acquisition, financing, disposition, leasing and construction of commercial real estate throughout North America and select international markets. Angelo, Gordon & Co. was founded in 1988 and has acquired over $24.0 billion of properties.
Escrows. The loan documents provide for an upfront escrow at closing in the amount of $3,270,000 for tenant improvements currently underway at the Molina Office Portfolio Properties. The loan documents do not require monthly escrow deposits for taxes or insurance so long as: (i) no Cash Management Period (as defined below) has occurred and is continuing and (ii) no Lease Sweep Period (as defined below) has occurred and is continuing. No monthly replacement reserve escrow is required so long as (i) no Cash Management Period has occurred or is continuing and (ii) the tenant under lease with Molina Healthcare Inc. is maintaining the Molina Office Portfolio Properties in accordance with the terms of such lease. No monthly replacement reserves or tenant improvement and leasing commission reserves are required so long as no Cash Management Period has occurred and is continuing.
Lockbox and Cash Management. The Molina Office Portfolio Mortgage Loan requires a lender-controlled lockbox account, which is already in place, into which the tenant is directed to pay its rents directly. The loan documents also require that all cash revenues and all other monies received by the borrower or the property manager relating to the Molina Office Portfolio Properties be deposited into the lockbox account within one business day of receipt. Prior to the occurrence of a Cash Management Period, all funds on deposit in the lockbox account are swept into the borrower’s operating account on a daily basis. During a Cash Management Period, all funds on deposit in the lockbox account are swept on a daily basis to a cash management account under control of the lender.
A “Cash Management Period” will commence upon the earlier of: (i) the occurrence and continuance of an event of default; (ii) the debt service coverage ratio falling below 1.15x as tested each calendar quarter; (iii) the Anticipated Repayment Date; (iv) the commencement of a Lease Sweep Period; or (v) an approved mezzanine loan. A Cash Management Period will end: (1) with respect to the matters described in clause (i) above, when such event of default has been cured; (2) with respect to the matters described in clause (ii) above, when a debt service coverage ratio of at least 1.15x has been achieved for two consecutive calendar quarters; or (3) with respect to the matters described in clause (iv) above, when such Lease Sweep Period has ended.
A “Lease Sweep Period” will commence on the first payment date following the occurrence of any of the following: (i) any Major Lease (as defined below) at the Molina Office Portfolio Properties is cancelled or terminated prior to its then current expiration date; (ii) if any tenant under a Major Lease discontinues its business at the premises or gives notice that it intends to discontinue its business; or (iii) upon the occurrence of an insolvency proceeding by any tenant under a Major Lease. A Lease Sweep Period will end with respect to clause (i) above, on the date which such space has been fully leased pursuant to a replacement lease and all associated expenses have been paid in full; with respect to clause (ii) above, when the tenant under the Major Lease commences operations again at its premises in accordance with the terms of the Major Lease; and with respect to clause (iii) above, when the applicable insolvency proceeding regarding the tenant under the applicable Major Lease has terminated and the Major Lease has been affirmed, assumed or assigned in accordance with the applicable bankruptcy code.
A “Major Lease” is defined as the Molina Healthcare Inc. lease and any other lease entered into which demises more than 20.0% of the rentable area of the Molina Office Portfolio Properties.
Properties Management. The Molina Office Portfolio Properties are managed by McKinney Brokerage Group, Inc.
Assumption. The borrower has the right to transfer all the Molina Office Portfolio Properties, in whole but not in part, subject to customary conditions set forth in the loan documents, including but not limited to: (i) no event of default has occurred and is continuing, (ii) the proposed transferee, the property manager and management agreement are satisfactory to the lender and applicable rating agencies; and (iii) rating agency confirmation from Fitch, KBRA and Moody’s that the transfer will not result in a downgrade, withdrawal or qualification of the respective ratings assigned to the Series 2013-C15 Certificates.
Partial Release. Following the second anniversary of the issuance of the Series 2013-C15 Certificates, the borrower may obtain the release of an individual property from the lien of the related mortgage upon the satisfaction of certain conditions including, but not limited to: (i) the release is permitted under the Molina Healthcare lease, (ii) the property to be released must be the subject of sale to a bona fide third party purchaser who is neither a Restricted Party (as defined below) nor an affiliate of a Restricted Party; (iii) the borrower must provide the lender a written notice at least 20 days prior to the proposed release date; (iv) no event of default has occurred before such sale and immediately thereafter; (v) payment by the borrower in an amount equal to 110% of the allocated loan amount for the individual property to be released, along with any applicable yield maintenance or prepayment premium; (vi) after such release, the debt service coverage ratio of the remaining properties must not be less than the greater of (a) the debt service coverage ratio immediately preceding such release and (b) 1.64x; and (vii) after such release, the loan-to-value ratio of the remaining properties must not be greater than the lesser of (x) the loan-to-value ratio immediately preceding such release and (y) 65.4%.
A “Restricted Party” means the borrower, any principal or the guarantor or any affiliate thereof under the Molina Office Portfolio Mortgage Loan.
Real Estate Substitution. Not permitted.
THE INFORMATION IN THIS STRUCTURAL AND COLLATERAL TERM SHEET IS NOT COMPLETE AND MAY BE AMENDED PRIOR TO THE TIME OF SALE. THIS TERM SHEET IS NOT AN OFFER TO SELL THESE SECURITIES AND IT IS NOT A SOLICITATION OF AN OFFER TO BUY THESE SECURITIES IN ANY JURISDICTION WHERE THE OFFER OR SALE IS NOT PERMITTED.
42
MOLINA OFFICE PORTFOLIO
Subordinate and Mezzanine Indebtedness. The borrower has the right to incur mezzanine financing subject to satisfaction of certain conditions, including: (i) no event of default has occurred and is continuing; (ii) the execution of an intercreditor agreement in form and substance that is reasonably acceptable to the lender; (iii) the Aggregate DSCR (as defined below) is not less than 1.20x; (iv) the Aggregate LTV (as defined below) will not be greater than 72.5%; (v) the debt yield is not less than 8.0%; (vi) mezzanine loan documents that are reasonably acceptable to the lender will have been delivered to the lender; and (vii) rating agency confirmation from Fitch, KBRA and Moody’s that the mezzanine financing will not result in a downgrade, withdrawal or qualification of the respective ratings assigned to the Series 2013-C15 Certificates.
The “Aggregate DSCR” is the aggregate debt service coverage ratio based on the amortizing debt service under the Molina Office Portfolio Mortgage Loan and approved mezzanine loan that is outstanding.
The “Aggregate LTV” is the aggregate loan to value ratio based on the outstanding principal balance of the Molina Office Portfolio Mortgage Loan and any approved mezzanine loan that is outstanding.
Ground Lease. None.
Terrorism Insurance. The loan documents require that the “all risk” insurance policy required to be maintained by the borrower provides coverage from terrorism in an amount equal to the full replacement cost of the Molina Office Portfolio Properties as well as business interruption insurance covering no less than the 18-month period following the occurrence of a casualty event, together with a six-month extended period of indemnity.
THE INFORMATION IN THIS STRUCTURAL AND COLLATERAL TERM SHEET IS NOT COMPLETE AND MAY BE AMENDED PRIOR TO THE TIME OF SALE. THIS TERM SHEET IS NOT AN OFFER TO SELL THESE SECURITIES AND IT IS NOT A SOLICITATION OF AN OFFER TO BUY THESE SECURITIES IN ANY JURISDICTION WHERE THE OFFER OR SALE IS NOT PERMITTED.
43
MERITAGE RESORT & SPA

THE INFORMATION IN THIS STRUCTURAL AND COLLATERAL TERM SHEET IS NOT COMPLETE AND MAY BE AMENDED PRIOR TO THE TIME OF SALE. THIS TERM SHEET IS NOT AN OFFER TO SELL THESE SECURITIES AND IT IS NOT A SOLICITATION OF AN OFFER TO BUY THESE SECURITIES IN ANY JURISDICTION WHERE THE OFFER OR SALE IS NOT PERMITTED.
44
MERITAGE RESORT & SPA
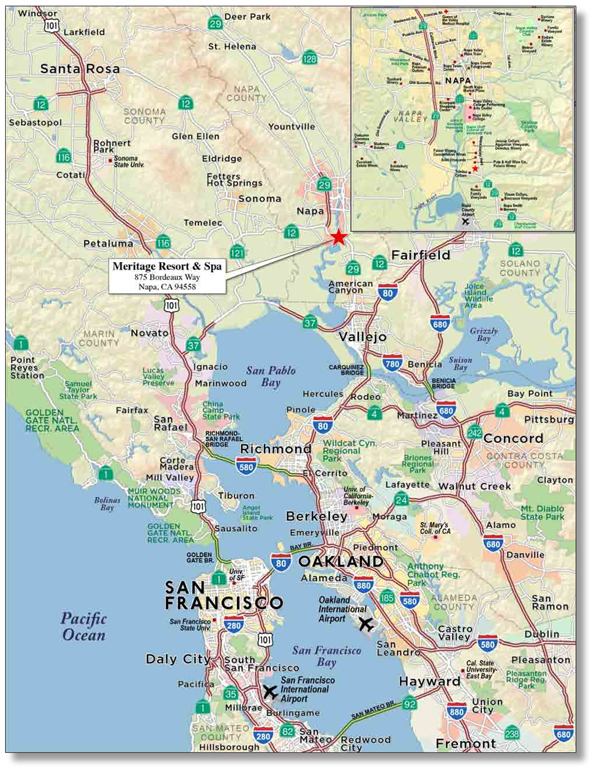
THE INFORMATION IN THIS STRUCTURAL AND COLLATERAL TERM SHEET IS NOT COMPLETE AND MAY BE AMENDED PRIOR TO THE TIME OF SALE. THIS TERM SHEET IS NOT AN OFFER TO SELL THESE SECURITIES AND IT IS NOT A SOLICITATION OF AN OFFER TO BUY THESE SECURITIES IN ANY JURISDICTION WHERE THE OFFER OR SALE IS NOT PERMITTED.
45
| No. 3 – Meritage Resort & Spa | ||
| Loan Information |
Mortgage Loan Seller: |
The Royal Bank of Scotland | |||
Credit Assessment | NR/NR/NR | |||
| (Fitch/KBRA/Moody’s): | ||||
Original Principal Balance: |
$92,000,000 | |||
Cut-off Date Principal Balance: |
$ 92,000,000 | |||
% of Initial Pool Balance: |
8.3% | |||
Loan Purpose: |
Refinance | |||
Borrower Name: |
The Meritage Resort, LLC | |||
Sponsor: |
Timothy R. Busch | |||
Mortgage Rate: |
5.129% | |||
Note Date: |
July 2, 2013 | |||
Anticipated Repayment Date: |
NAP | |||
Maturity Date: |
August 1, 2023 | |||
IO Period: |
None | |||
Loan Term (Original): |
120 months | |||
Seasoning: |
0 months | |||
Amortization Term (Original): |
360 months | |||
Loan Amortization Type: |
Amortizing Balloon | |||
Interest Accrual Method: |
Actual/360 | |||
Call Protection: |
L(24),D(89),O(7) | |||
Lockbox Type: |
Hard/Springing Cash Management | |||
Additional Debt: |
None | |||
Additional Debt Type: |
NAP | |||
| Escrows and Reserves(1): | ||||
| Type: | Initial | Monthly | Cap (If Any) | |||
Taxes |
$333,100 |
$83,275 |
NAP | |||
Insurance |
$0 |
Springing |
NAP | |||
FF&E |
$104,928 |
$104,928 |
NAP | |||
Room Renovation Reserve |
$1,766,325 |
$0 |
NAP | |||
| Property Information |
Single Asset/Portfolio: |
Single Asset | |||
Property Type: |
Hospitality | |||
Specific Property Type: |
Full Service | |||
Location: |
Napa, CA | |||
Size(2): |
319 rooms | |||
Cut-off Date Principal | $288,401 | |||
| Balance Per Room: | ||||
Year Built/Renovated(2): |
2006/2012 | |||
Title Vesting(3): |
Fee | |||
Property Manager: |
Self-managed | |||
3rdMost Recent Occupancy: |
65.9%(12/31/2010) | |||
2nd Most Recent Occupancy (As of): |
65.7%(12/31/2011) | |||
Most Recent Occupancy (As of)(2): |
62.9%(12/31/2012) | |||
Current Occupancy (As of)(2): |
59.0%(5/31/2013) | |||
| Underwriting and Financial Information: | ||||
| 3rdMost Recent NOI (As of)(4): | $5,421,092(12/31/2011) | |||
2ndMost Recent NOI (As of)(4): |
$9,278,336(12/31/2012) | |||
Most Recent NOI (As of)(4): |
$11,431,705 (TTM 5/31/2013) | |||
| U/W Revenues: | $32,305,170 | |||
U/W Expenses: |
$21,376,197 | |||
U/W NOI: |
$10,928,973 | |||
U/W NCF: |
$9,636,767 | |||
U/W NOI DSCR: |
1.82x | |||
U/W NCF DSCR: |
1.60x | |||
U/W NOI Debt Yield: |
11.9% | |||
U/W NCF Debt Yield: |
10.5% | |||
As-Is Appraised Value: |
$146,700,000 | |||
As-Is Appraisal Valuation Date: |
May 1, 2013 | |||
Cut-off Date LTV Ratio: |
62.7% | |||
LTV Ratio at Maturity or ARD: |
51.8% | |||
| (1) | See “Escrows” section. |
| (2) | In May 2012, the Meritage Resort & Spa property was expanded by 165 guestrooms. |
| (3) | See “Ground Lease” section. |
| (4) | See “Cash Flow Analysis” section for detail on the increase from 3rd Most Recent NOI to Most Recent NOI. |
The Mortgage Loan. The mortgage loan (the “Meritage Resort & Spa Mortgage Loan”) is evidenced by a single promissory note that is secured by a first mortgage encumbering a full service hotel located in Napa, California (the “Meritage Resort & Spa Property”). The Meritage Resort & Spa Mortgage Loan was originated on July 2, 2013 by The Royal Bank of Scotland. The Meritage Resort & Spa Mortgage Loan had an original principal balance of $92,000,000, has an outstanding principal balance as of the Cut-off Date of $92,000,000 and accrues interest at an interest rate of 5.129% per annum. The Meritage Resort & Spa Mortgage Loan had an initial term of 120 months, has a remaining term of 120 months as of the Cut-off Date and requires payments of principal and interest based on a 30-year amortization schedule. The Meritage Resort & Spa Mortgage Loan matures on August 1, 2023.
Following the lockout period, the borrower has the right to defease the Meritage Resort & Spa Mortgage Loan in whole, but not in part, on any date before February 1, 2023. In addition, the Meritage Resort & Spa Mortgage Loan is prepayable without penalty on or after February 1, 2023.
Sources and Uses
| Sources | Uses | |||||||||||||||||
Original loan amount | $ | 92,000,000 | 100.0% | Loan payoff | $ | 66,039,615 | 71.8% | |||||||||||
Reserves | 2,204,353 | 2.4 | ||||||||||||||||
Closing costs | 631,204 | 0.7 | ||||||||||||||||
Return of equity | 23,124,828 | 25.1 | ||||||||||||||||
Total Sources | $ | 92,000,000 | 100.0% | Total Uses | $ | 92,000,000 | 100.0% |
THE INFORMATION IN THIS STRUCTURAL AND COLLATERAL TERM SHEET IS NOT COMPLETE AND MAY BE AMENDED PRIOR TO THE TIME OF SALE. THIS TERM SHEET IS NOT AN OFFER TO SELL THESE SECURITIES AND IT IS NOT A SOLICITATION OF AN OFFER TO BUY THESE SECURITIES IN ANY JURISDICTION WHERE THE OFFER OR SALE IS NOT PERMITTED.
46
MERITAGE RESORT & SPA
The Property. The Meritage Resort & Spa Property is a 319-room, full service hotel and spa located in Napa, California. The Meritage Resort & Spa Property was built in 2006 and underwent a $42.1 million renovation between 2010 and 2012, which added approximately 150,000 square feet, including 165 additional guestrooms, a ballroom, boardrooms and a kitchen. Amenities at the Meritage Resort & Spa Property include a business center, approximately 35,000 square feet of meeting space, an outdoor swimming pool, a whirlpool, a restaurant that serves breakfast, lunch and dinner, a café, a lounge with a six-lane bowling alley, a wine bar, a spa, a gift shop, fitness center and a bocce ball court. Guestrooms at the Meritage Resort & Spa Property are located in two, three-story buildings. The main building contains the original 154 guestrooms and the west building contains 165 additional guestrooms, which were built in 2012. Standard guestrooms in the main building are approximately 375 square feet, while suites range from 550 to 1,300 square feet. Standard guestrooms in the west building range from 427 to 481 square feet, while suites are approximately 775 square feet. The standard guestrooms feature a 32-inch flat screen TV, refrigerator, high-speed internet access and a desk. Suites feature amenities such as a separate bath and shower, jacuzzi, fire place, dining table and kitchen. Some guestrooms also feature a private balcony or patio and benefit from views of the vineyard or pool. Vino Bello Village (“Vino Bello”) is a 182-unit timeshare development (not part of the collateral), located adjacent to the Meritage Resort & Spa Property. Vino Bello is owned by a third party unaffiliated with the borrower that participates in a shared operating agreement with the Meritage Resort & Spa Property (see “Vino Bello Timeshare” below). The Meritage Resort & Spa Property has 607 surface parking spaces, which equates to 1.9 spaces per room.
Vino Bello Timeshare. Vino Bello (which is described above and not part of the collateral) is owned by an unaffiliated third party. The units are comprised of apartment-style living, complete with kitchens and living areas. The shared operating agreement requires Vino Bello to pay (i) a management fee equal to 10% of operating expenses; (ii) a monthly accounting fee of $2,000; (iii) a daily fee of $20 whereby owners and guests of the Vino Bello property can utilize the facilities at the Meritage Resort & Spa Property; and (iv) a sales referral fee equal to 35% of all gross rooms revenue generated by a sales referral from the Meritage Resort & Spa Property. The management agreement, originated in June 2004 allows for various shared costs to the Meritage Resort & Spa Property in addition to numerous hotel services and amenities for timeshare guests. The agreement is for a period of 10 years from the commencement date and shall automatically renew for two, five-year periods, unless either party gives the other notice of its election to not renew at least one year prior to the expiration of the current lease term.
Operating History and Underwritten Net Cash Flow. The following table represents certain information relating to the historical operating performance and the Underwritten Net Cash Flow at the Meritage Resort & Spa Property:
Cash Flow Analysis
| 2011 | 2012 | TTM 5/31/2013 | U/W | U/W $ per Room | ||||||||||||||||
Average Annual Room Count(1) | 155 | 257 | 319 | 319 | ||||||||||||||||
Occupancy | 65.7% | 62.9% | 59.0% | 59.0% | ||||||||||||||||
ADR | $182.08 | $198.54 | $210.15 | $210.15 | ||||||||||||||||
RevPAR | $119.63 | $124.88 | $123.88 | $123.88 | ||||||||||||||||
Total Revenue | $16,875,406 | $26,896,838 | $32,305,170 | $32,305,170 | $101,270 | |||||||||||||||
Total Department Expenses | 6,789,052 | 10,187,031 | 12,230,366 | 12,230,366 | 38,340 | |||||||||||||||
|
|
|
|
|
|
|
|
|
| |||||||||||
Gross Operating Profit | $10,086,354 | $16,709,807 | $20,074,804 | $20,074,804 | $62,930 | |||||||||||||||
Total Undistributed Expenses | 4,077,067 | 6,514,320 | 7,539,801 | 7,831,414 | 24,550 | |||||||||||||||
|
|
|
|
|
|
|
|
|
| |||||||||||
Profit Before Fixed Charges | $6,009,287 | $10,195,487 | $12,535,003 | $12,243,390 | $38,381 | |||||||||||||||
Total Fixed Charges | 588,195 | 917,151 | 1,103,298 | 1,314,417 | 4,120 | |||||||||||||||
|
|
|
|
|
|
|
|
|
| |||||||||||
Net Operating Income | $5,421,092 | $9,278,336 | $11,431,705 | $10,928,973 | $34,260 | |||||||||||||||
FF&E | 0 | 0 | 0 | 1,292,207 | 4,051 | |||||||||||||||
|
|
|
|
|
|
|
|
|
| |||||||||||
Net Cash Flow | $5,421,092 | $9,278,336 | $11,431,705 | $9,636,767 | $30,209 | |||||||||||||||
NOI DSCR | 0.90x | 1.54x | 1.90x | 1.82x | ||||||||||||||||
NCF DSCR | 0.90x | 1.54x | 1.90x | 1.60x | ||||||||||||||||
NOI DY | 5.9% | 10.1% | 12.4% | 11.9% | ||||||||||||||||
NCF DY | 5.9% | 10.1% | 12.4% | 10.5% | ||||||||||||||||
| ||||||||||||||||||||
| (1) | Due to the May 2012 expansion at the Meritage Resort & Spa Property, the 2011 Cash Flow Analysis figures are based on 155 guestrooms, the 2012 figures are based on 257 guestrooms and the figures from the trailing 12-month ending May 31, 2013 are based on 319 guestrooms. |
Appraisal. As of the appraisal valuation date of May 1, 2013, the Meritage Resort & Spa Property had an “as-is” appraised value of $146,700,000.
Environmental Matters. According to the Phase I environmental site assessment dated April 29, 2013, there was no evidence of any recognized environmental conditions at the Meritage Resort & Spa Property.
THE INFORMATION IN THIS STRUCTURAL AND COLLATERAL TERM SHEET IS NOT COMPLETE AND MAY BE AMENDED PRIOR TO THE TIME OF SALE. THIS TERM SHEET IS NOT AN OFFER TO SELL THESE SECURITIES AND IT IS NOT A SOLICITATION OF AN OFFER TO BUY THESE SECURITIES IN ANY JURISDICTION WHERE THE OFFER OR SALE IS NOT PERMITTED.
47
MERITAGE RESORT & SPA
Market Overview and Competition. The Meritage Resort & Spa Property is located in Napa, California approximately 50 miles north of San Francisco. According to the appraisal, Napa Valley benefits from approximately 4.5 million tourists annually, generating more than $1.3 billion in annual revenue. The Meritage Resort & Spa Property is located approximately four miles south of downtown Napa, which encompasses approximately 45,300 acres of vineyards. The Meritage Resort & Spa Property is located less than 1.5 miles north of Highway 29, which accommodates, on average, approximately 50,000 vehicles per day.
The following table presents certain information relating to the Meritage Resort & Spa Property’s competitive set:
Subject and Market Historical Occupancy, ADR and RevPAR(1)
| Competitive Set | Meritage Resort & Spa | Penetration Factor | ||||||||||||||||||
|
|
| ||||||||||||||||||
Year | Occupancy | ADR | RevPAR | Occupancy | ADR | RevPAR | Occupancy | ADR | RevPAR | |||||||||||
|
|
|
|
|
|
|
| |||||||||||||
5/31/2013 YTD | 60.6% | $203.10 | $122.99 | 56.5% | $200.26 | $113.12 | 93.3% | 98.6% | 92.0% | |||||||||||
5/31/2012 YTD | 56.9% | $191.98 | $109.31 | 65.8% | $159.70 | $105.04 | 115.5% | 83.2% | 96.1% | |||||||||||
5/31/2011 YTD | 55.5% | $183.10 | $101.56 | 62.1% | $160.84 | $99.96 | 112.0% | 87.8% | 98.4% | |||||||||||
5/31/2013 TTM | 68.4% | $228.97 | $156.63 | 59.0% | $209.97 | $123.93 | 86.3% | 91.7% | 79.1% | |||||||||||
5/31/2012 TTM | 66.0% | $214.19 | $141.38 | 67.3% | $180.79 | $121.65 | 101.9% | 84.4% | 86.0% | |||||||||||
5/31/2011 TTM | 62.8% | $201.90 | $126.77 | 66.5% | $177.29 | $117.90 | 105.9% | 87.8% | 93.0% | |||||||||||
| (1) | Information obtained from a third party hospitality report dated June 19, 2013. According to such third party hospitality report, the competitive set includes the following hotels: Marriott Napa Valley Hotel & Spa, Silverado Resort, Embassy Suites Napa Valley, Fairmont Sonoma Mission Inn & Spa, Renaissance Lodge @ Sonoma Resort & Spa and Westin Verasa Napa. |
The Borrower. The borrower is The Meritage Resort, LLC, a California limited liability company and a single purpose entity with two independent directors. Legal counsel to the borrower delivered a non-consolidation opinion in connection with the origination of the Meritage Resort & Spa Mortgage Loan. Timothy R. Busch and the Lenawee Trust are the guarantors of certain nonrecourse carveouts under the Meritage Resort & Spa Mortgage Loan.
The Sponsor. The sponsor for the Meritage Resort & Spa Mortgage Loan is Timothy R. Busch. Mr. Busch is the Chief Executive Officer of Pacific Hospitality Group, which was founded in 1987 and manages, develops, finances and owns hotels and resorts primarily located in California. Pacific Hospitality Group’s portfolio consists of eight hotel and resorts, representing over 2,015 rooms and 165,500 square feet of premier indoor meeting and event space. As of December 31, 2011, Mr. Busch reported a net worth and liquidity of approximately $85.8 million and $12.9 million, respectively.
Escrows. The loan documents provide for upfront escrows at closing in the amount of $333,100 for real estate taxes, $104,928 for FF&E and $1,766,325 for room renovations currently underway. The loan documents do not require upfront or ongoing escrows for insurance provided the following conditions are met: (i) no event of default has occurred and is continuing; and (ii) the borrower provides the lender with proof of payment and renewal for insurance premiums satisfactory to the lender. The loan documents provide for ongoing monthly escrows in the amount of $83,275 for real estate taxes and $104,928 for FF&E.
Lockbox and Cash Management. The Meritage Resort & Spa Mortgage Loan requires a lender-controlled lockbox account, which is already in place, where the borrower will cause all credit card receipts and all rents from leases at the Meritage Resort & Spa Property to be deposited directly. Prior to the occurrence of a Cash Management Period (as defined below), all funds on deposit in the lockbox account are swept into the borrower’s operating account on a daily basis. During a Cash Management Period, all funds on deposit in the lockbox account are swept to a lender-controlled cash management account each business day.
A “Cash Management Period” will exist upon: (i) the occurrence and continuance of an event of default or (ii) the debt service coverage falling below 1.20x at the end of any calendar quarter. A Cash Management Period will expire: (1) with respect to the matters described in clause (i) above, upon the cure of such event of default; and (2) with respect to the matters described in clause (ii) above, the debt service coverage ratio being at least 1.20x for two consecutive calendar quarters.
Property Management. The Meritage Resort & Spa Property is managed by an affiliate of the borrower.
Assumption. The borrower has the right to transfer the Meritage Resort & Spa Property provided that certain conditions are satisfied, including: (i) no event of default has occurred and is continuing; (ii) the lender reasonably determined that the proposed transferee and guarantor satisfy the lender’s credit review and underwriting standards, taking into consideration transferee experience, financial strength and general business standing; and (iii) the lender has received confirmation from Fitch, KBRA and Moody’s that such assumption will not result in a downgrade, withdrawal or qualification of the respective ratings assigned to the Series 2013-C15 Certificates.
Partial Release. Not permitted.
Real Estate Substitution. Not permitted.
Subordinate and Mezzanine Indebtedness. Not permitted.
THE INFORMATION IN THIS STRUCTURAL AND COLLATERAL TERM SHEET IS NOT COMPLETE AND MAY BE AMENDED PRIOR TO THE TIME OF SALE. THIS TERM SHEET IS NOT AN OFFER TO SELL THESE SECURITIES AND IT IS NOT A SOLICITATION OF AN OFFER TO BUY THESE SECURITIES IN ANY JURISDICTION WHERE THE OFFER OR SALE IS NOT PERMITTED.
48
MERITAGE RESORT & SPA
Ground Lease. A vineyard that comprises a portion of the Meritage Resort & Spa Property is ground leased to the related borrower by a third party, Shell Owners Association - West. The ground lease expires in 2104 and the annual rent is $100 during the term. Any transfer of the borrower’s ground lease interest to a third party upon a foreclosure would require the consent of the ground lessee. The vineyard was given no value in the appraisal or for underwriting. The vineyard has not generated income for the borrower and is not material to the use and operation of the Meritage Resort & Spa Property. Therefore, the encumbered interest in the Meritage Resort & Spa Property is characterized as fee interest.
Terrorism Insurance. The loan documents require that the “all risk” insurance policy required to be maintained by the borrower provides coverage for terrorism in an amount equal to the full replacement cost of the Meritage Resort & Spa Property, as well as business interruption insurance covering no less than the 18-month period following the occurrence of a casualty event, together with a six-month extended period of indemnity.
THE INFORMATION IN THIS STRUCTURAL AND COLLATERAL TERM SHEET IS NOT COMPLETE AND MAY BE AMENDED PRIOR TO THE TIME OF SALE. THIS TERM SHEET IS NOT AN OFFER TO SELL THESE SECURITIES AND IT IS NOT A SOLICITATION OF AN OFFER TO BUY THESE SECURITIES IN ANY JURISDICTION WHERE THE OFFER OR SALE IS NOT PERMITTED.
49
CAROLINA PLACE
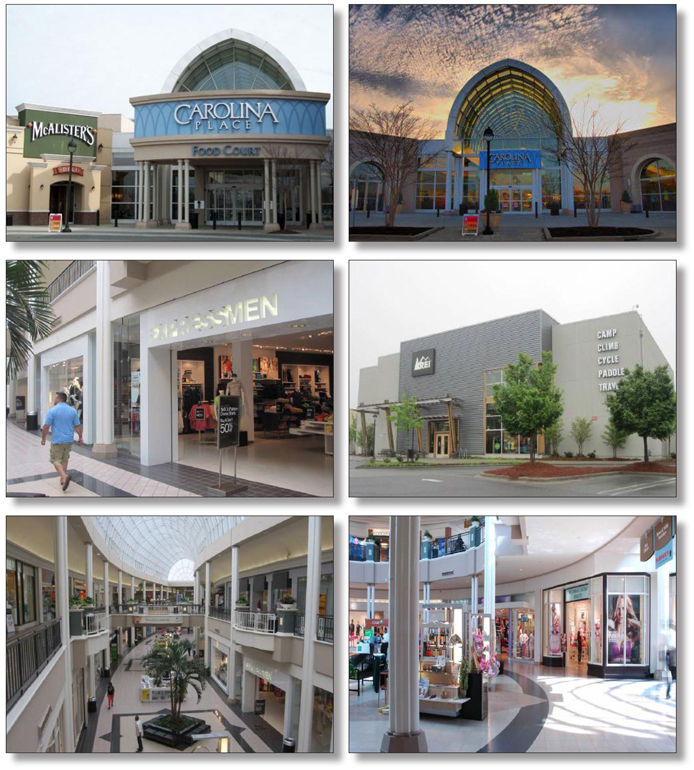
THE INFORMATION IN THIS STRUCTURAL AND COLLATERAL TERM SHEET IS NOT COMPLETE AND MAY BE AMENDED PRIOR TO THE TIME OF SALE. THIS TERM SHEET IS NOT AN OFFER TO SELL THESE SECURITIES AND IT IS NOT A SOLICITATION OF AN OFFER TO BUY THESE SECURITIES IN ANY JURISDICTION WHERE THE OFFER OR SALE IS NOT PERMITTED.
50
CAROLINA PLACE
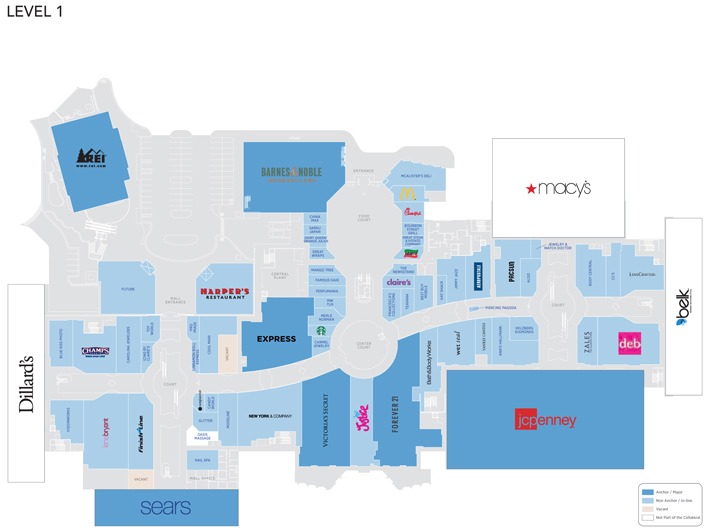
THE INFORMATION IN THIS STRUCTURAL AND COLLATERAL TERM SHEET IS NOT COMPLETE AND MAY BE AMENDED PRIOR TO THE TIME OF SALE. THIS TERM SHEET IS NOT AN OFFER TO SELL THESE SECURITIES AND IT IS NOT A SOLICITATION OF AN OFFER TO BUY THESE SECURITIES IN ANY JURISDICTION WHERE THE OFFER OR SALE IS NOT PERMITTED.
51
CAROLINA PLACE
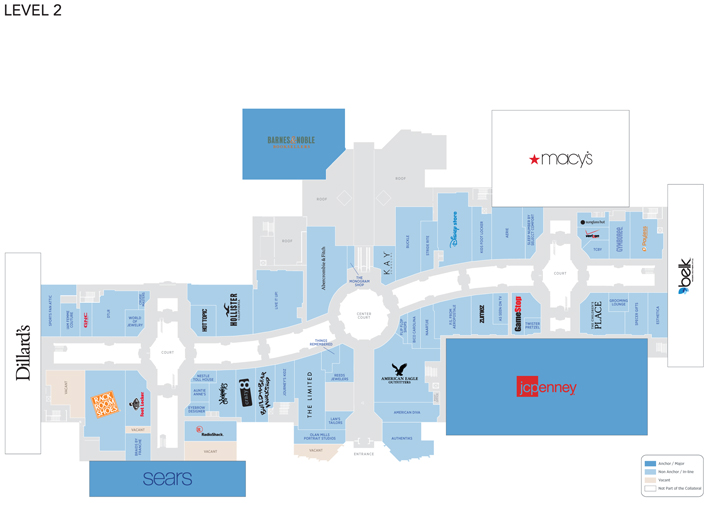
THE INFORMATION IN THIS STRUCTURAL AND COLLATERAL TERM SHEET IS NOT COMPLETE AND MAY BE AMENDED PRIOR TO THE TIME OF SALE. THIS TERM SHEET IS NOT AN OFFER TO SELL THESE SECURITIES AND IT IS NOT A SOLICITATION OF AN OFFER TO BUY THESE SECURITIES IN ANY JURISDICTION WHERE THE OFFER OR SALE IS NOT PERMITTED.
52
CAROLINA PLACE
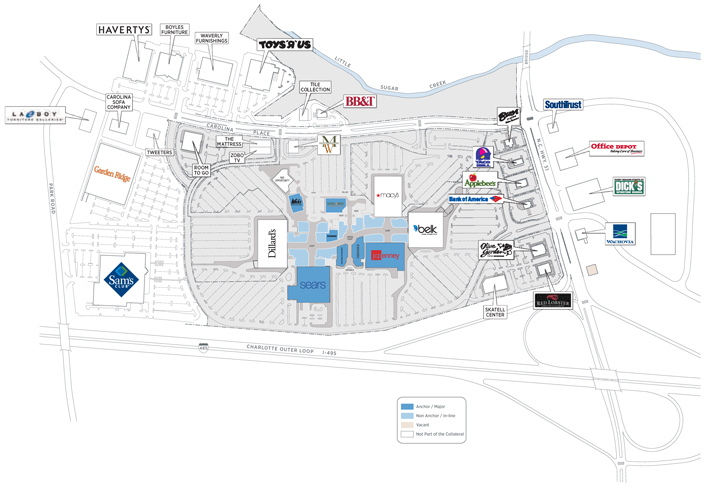
THE INFORMATION IN THIS STRUCTURAL AND COLLATERAL TERM SHEET IS NOT COMPLETE AND MAY BE AMENDED PRIOR TO THE TIME OF SALE. THIS TERM SHEET IS NOT AN OFFER TO SELL THESE SECURITIES AND IT IS NOT A SOLICITATION OF AN OFFER TO BUY THESE SECURITIES IN ANY JURISDICTION WHERE THE OFFER OR SALE IS NOT PERMITTED.
53
CAROLINA PLACE
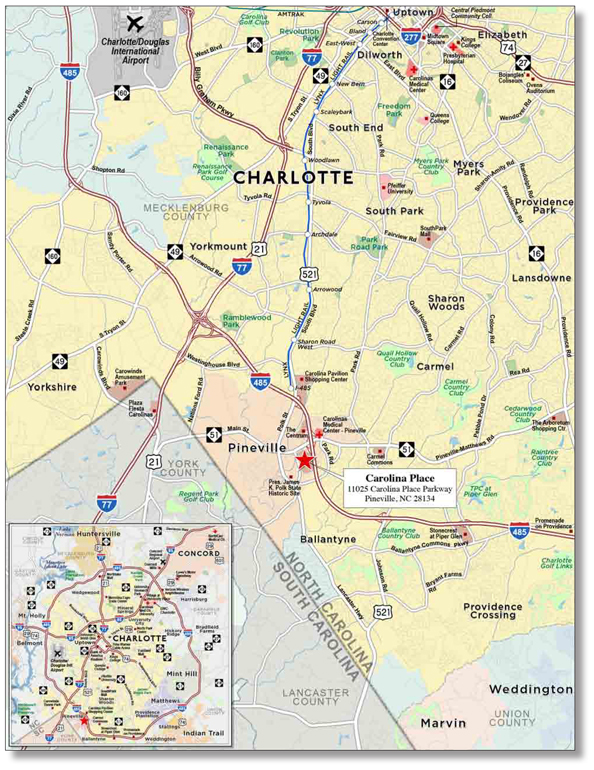
THE INFORMATION IN THIS STRUCTURAL AND COLLATERAL TERM SHEET IS NOT COMPLETE AND MAY BE AMENDED PRIOR TO THE TIME OF SALE. THIS TERM SHEET IS NOT AN OFFER TO SELL THESE SECURITIES AND IT IS NOT A SOLICITATION OF AN OFFER TO BUY THESE SECURITIES IN ANY JURISDICTION WHERE THE OFFER OR SALE IS NOT PERMITTED.
54
| No. 4 – Carolina Place |
| Loan Information | ||
| Mortgage Loan Seller: | The Royal Bank of Scotland | |
Credit Assessment | NR/NR/NR | |
| (Fitch/KBRA/Moody’s): | ||
Original Principal Balance(1): |
$85,000,000 | |
Cut-off Date Principal Balance(1): |
$85,000,000 | |
% of Initial Pool Balance: |
7.7% | |
Loan Purpose: |
Refinance | |
Borrower Name: |
Carolina Place L.L.C. | |
Sponsor: |
General Growth Properties, Inc./ Homart II L.L.C. | |
| Mortgage Rate: |
3.839% | |
Note Date: |
May 13, 2013 | |
Anticipated Repayment Date: |
NAP | |
Maturity Date: |
June 1, 2023 | |
IO Period: |
36 months | |
Loan Term (Original): |
120 months | |
Seasoning: |
2 months | |
Amortization Term (Original): |
360 months | |
Loan Amortization Type: |
Interest-only, Amortizing Balloon | |
Interest Accrual Method: |
Actual/360 | |
Call Protection: |
L(26),D(90),O(4) | |
Lockbox Type: |
Hard/Springing Cash Management | |
Additional Debt(1): |
Yes | |
Additional Debt Type(1): |
Pari Passu and Future Mezzanine |
Escrows and Reserves(2):
| Type: | Initial | Monthly | Cap (If Any) | |||
Taxes | $0 | Springing | NAP | |||
Insurance | $0 | Springing | NAP | |||
Replacement Reserves | $0 | Springing | $161,878 | |||
TI/LC Reserve | $0 | Springing | $647,511 | |||
| Property Information | ||
| Single Asset/Portfolio: | Single Asset | |
Property Type: |
Retail | |
Specific Property Type: |
Regional Mall | |
Location: |
Pineville, NC | |
Size: |
647,511 SF | |
Cut-off Date Principal | $270.27 | |
| Balance Per SF(1): | ||
Year Built/Renovated: |
1991/2006 | |
Title Vesting: |
Fee | |
Property Manager: |
Self-managed | |
3rd Most Recent Occupancy (As of)(3): |
98.9% (12/31/2010) | |
2ndMost Recent Occupancy (As of)(3): |
98.5% (12/31/2011) | |
Most Recent Occupancy (As of)(3): |
97.6% (12/31/2012) | |
Current Occupancy (As of)(3): |
97.7% (3/31/2013) | |
Underwriting and Financial Information:
| ||
| 3rdMost Recent NOI (As of): | $18,183,976 (12/31/2011) | |
2ndMost Recent NOI (As of): |
$17,807,851 (12/31/2012) | |
Most Recent NOI (As of): |
$17,824,809 (TTM 3/31/2013) | |
U/W Revenues: |
$24,662,207 | |
U/W Expenses: |
$6,968,607 | |
U/W NOI: |
$17,693,600 | |
U/W NCF: |
$16,803,371 | |
U/W NOI DSCR(1): |
1.80x | |
U/W NCF DSCR(1): |
1.71x | |
U/W NOI Debt Yield(1): |
10.1% | |
U/W NCF Debt Yield(1): |
9.6% | |
As-Is Appraised Value: |
$263,000,000 | |
As-Is Appraisal Valuation Date: |
April 29, 2013 | |
Cut-off Date LTV Ratio(1): |
66.5% | |
LTV Ratio at Maturity or ARD(1): |
57.3% | |
| (1) | The Carolina Place Loan Combination, totalling $175,000,000, is comprised of twopari passu notes (Notes A-1 and A-2). Note A-1 had an original principal balance of $90,000,000, has an outstanding principal balance as of the Cut-off Date of $90,000,000 and was contributed to the WFCM 2013-LC12 Trust. Note A-2 had an original balance of $85,000,000 and will be contributed to the WFRBS 2013-C15 Trust. All presented statistical information related to balances per square foot, loan-to-value ratios, debt service coverage ratios, and debt yields are based on the Carolina Place Loan Combination. |
| (2) | See “Escrows” section. |
| (3) | Historical and current occupancy includes temporary and seasonal tenants. As of March 31, 2013, the occupancy exclusive of these tenants was 94.4%. |
The Mortgage Loan. The mortgage loan (the “Carolina Place Loan Combination”) is evidenced by twopari passu notes (Note A-1 and Note A-2) secured by a first mortgage encumbering a regional mall located in Pineville, North Carolina (the “Carolina Place Property”). The Carolina Place Loan Combination was originated on May 13, 2013 by The Royal Bank of Scotland. The Carolina Place Loan Combination had an original principal balance of $175,000,000, has an outstanding principal balance as of the Cut-off Date of $175,000,000 and accrues interest at an interest rate of 3.839% per annum. The Carolina Place Loan Combination had an initial term of 120 months, has a remaining term of 118 months as of the Cut-off Date and requires interest-only payments for the first 36 payments following origination and thereafter requires payments of principal and interest based on a 30-year amortization schedule. The Carolina Place Loan Combination matures on June 1, 2023.
Note A-2, which represents the non-controlling interest in the Carolina Place Loan Combination and will be contributed to the WFRBS 2013-C15 Trust, had an original principal balance of $85,000,000 and has an outstanding principal balance as of the Cut-off Date of $85,000,000. Note A-1 had an original principal balance of $90,000,000, was contributed to the WFCM 2013-LC12 Trust, and represents the controlling interest in the Carolina Place Loan Combination. See “Description of the Mortgage Pool - Additional Indebtedness - The Loan Combinations - The Carolina Place Loan Combination” and “The Pooling and Service Agreement - Servicing of the Loan Combinations” in the Free Writing Prospectus.
Following the lockout period, the borrower will have the right to defease the Carolina Place Loan Combination in whole, but not in part, on any payment date before March 1, 2023. In addition, the Carolina Place Loan Combination is prepayable without penalty on or after March 1, 2023.
THE INFORMATION IN THIS STRUCTURAL AND COLLATERAL TERM SHEET IS NOT COMPLETE AND MAY BE AMENDED PRIOR TO THE TIME OF SALE. THIS TERM SHEET IS NOT AN OFFER TO SELL THESE SECURITIES AND IT IS NOT A SOLICITATION OF AN OFFER TO BUY THESE SECURITIES IN ANY JURISDICTION WHERE THE OFFER OR SALE IS NOT PERMITTED.
55
CAROLINA PLACE
Sources and Uses
Sources | Uses | |||||||||||||||||||
Original loan combination amount | $175,000,000 | 100.0% | Loan payoff | $140,306,905 | 80.2% | |||||||||||||||
Closing costs | 639,094 | 0.4 | ||||||||||||||||||
Return of equity | 34,054,000 | 19.5 | ||||||||||||||||||
Total Sources | $175,000,000 | 100.0% | Total Uses | $175,000,000 | 100.0% |
The Property. The Carolina Place Property is an approximately 1.2 million square foot, two-level regional mall located in Pineville, North Carolina, approximately 10 miles south of the central business district of Charlotte. The collateral for the Carolina Place Loan Combination consists of 647,511 square feet of the approximately 1.2 million square foot mall. The Carolina Place Property is anchored by Dillard’s, Belk and Macy’s (none of which are part of the collateral) and Sears and JC Penney. The Carolina Place Property was built in 1991 and was renovated and expanded in 2006, for a cost of approximately $24.0 million, which included a redevelopment of the food court areas and the addition of new lifestyle tenant space. As of March 31, 2013, the Carolina Place Property was 94.4% occupied by approximately 110 tenants, excluding seasonal and temporary tenants, and 97.7% leased including seasonal and temporary tenants. In-line tenants include Victoria’s Secret, Express, New York & Company, Foot Locker, Aeropostale and American Eagle, among others. For the trailing 12-month period ending January 31, 2013, tenants occupying less than 10,000 square feet had comparable in-line sales of $411 per square foot with an average occupancy cost of 15.6%. The Carolina Place Property contains 5,482 surface parking spaces reflecting a parking ratio of 4.72 spaces per 1,000 square feet of net rentable area.
The following table presents certain information relating to the tenancies at the Carolina Place Property:
Major Tenants
| Tenant Name | Credit Rating (Fitch/ Moody’s/ S&P)(1) | Tenant NRSF | % of NRSF | Annual U/W Base Rent PSF(2) | Annual U/W Base Rent(2) | % of Total Annual U/W Base Rent | Sales PSF(3) | Occupancy Cost(3)(4) | Lease Expiration Date | |||||||||||||||||||||||||||
Anchor Tenants - Not Part of Collateral |
| |||||||||||||||||||||||||||||||||||
Dillard’s | BBB-/Ba3/BB+ | 175,326 | ANCHOR OWNED - NOT PART OF THE COLLATERAL | |||||||||||||||||||||||||||||||||
Belk | NR/NR/NR | 173,580 | ANCHOR OWNED - NOT PART OF THE COLLATERAL | |||||||||||||||||||||||||||||||||
Macy’s | BBB/Baa3/BBB | 147,192 | ANCHOR OWNED - NOT PART OF THE COLLATERAL | |||||||||||||||||||||||||||||||||
Anchor Tenants - Collateral |
| |||||||||||||||||||||||||||||||||||
Sears | CCC/B3/CCC+ | 157,752 | 24.4% | $3.95 | $623,120 | 4.8% | $101 | 5.2% | 7/23/2016(5) | |||||||||||||||||||||||||||
JC Penney | B-/Caa1/CCC+ | 119,652 | 18.5% | $4.10 | $490,424 | 3.8% | $157 | 3.0% | 5/31/2016(6) | |||||||||||||||||||||||||||
|
|
| ||||||||||||||||||||||||||||||||||
Total Anchor Tenants - Collateral | 277,404 | 42.8% | $4.01 | $1,113,544 | 8.6% | |||||||||||||||||||||||||||||||
Major Tenants - Collateral | ||||||||||||||||||||||||||||||||||||
REI | NR/NR/NR | 26,500 | 4.1% | $24.00 | $636,000 | 4.9% | NAV | NAV | 8/31/2016 | |||||||||||||||||||||||||||
H&M | NR/NR/NR | 14,631 | 2.3% | $30.89 | $451,958 | 3.5% | NAV | NAV | 1/31/2024 | |||||||||||||||||||||||||||
Barnes & Noble | NR/NR/NR | 31,414 | 4.9% | $13.53 | $425,000 | 3.3% | $174 | 7.8% | 1/31/2017 | |||||||||||||||||||||||||||
Forever 21 | NR/NR/NR | 13,401 | 2.1% | $18.00 | $241,218 | 1.9% | $396 | 13.4% | 1/31/2017 | |||||||||||||||||||||||||||
|
|
| ||||||||||||||||||||||||||||||||||
Total Major Tenants - Collateral | 85,946 | 13.3% | $20.41 | $1,754,176 | 13.5% | |||||||||||||||||||||||||||||||
Non-Major Tenants - Collateral | 248,208 | 38.3% | $40.90 | $10,152,073 | 78.0% | |||||||||||||||||||||||||||||||
|
|
| ||||||||||||||||||||||||||||||||||
Occupied Collateral Total(7) | 611,558 | 94.4% | $21.29 | $13,019,793 | 100.0% | |||||||||||||||||||||||||||||||
|
| |||||||||||||||||||||||||||||||||||
Vacant Space | 35,953 | 5.6% | ||||||||||||||||||||||||||||||||||
|
| |||||||||||||||||||||||||||||||||||
Collateral Total | 647,511 | 100.0% | ||||||||||||||||||||||||||||||||||
|
| |||||||||||||||||||||||||||||||||||
| (1) | Certain ratings are those of the parent company whether or not the parent guarantees the lease. |
| (2) | Annual U/W Base Rent PSF and Annual U/W Base Rent include contractual rent steps through December 2013. |
| (3) | Sales and occupancy costs are for the trailing 12-month period ending January 31, 2013. |
| (4) | Occupancy costs include base rent, reimbursements and percentage rent, as applicable. |
| (5) | Sears has four, five-year extension options upon lease expiration. |
| (6) | JC Penney has four, five-year extension options upon lease expiration. |
| (7) | Occupancy excludes temporary and seasonal tenants. As of March 31, 2013, the occupancy, inclusive of these tenants, was 97.7%. |
THE INFORMATION IN THIS STRUCTURAL AND COLLATERAL TERM SHEET IS NOT COMPLETE AND MAY BE AMENDED PRIOR TO THE TIME OF SALE. THIS TERM SHEET IS NOT AN OFFER TO SELL THESE SECURITIES AND IT IS NOT A SOLICITATION OF AN OFFER TO BUY THESE SECURITIES IN ANY JURISDICTION WHERE THE OFFER OR SALE IS NOT PERMITTED.
56
CAROLINA PLACE
The following table presents certain information relating to the historical sales and occupancy costs at the Carolina Place Property:
Historical Sales (PSF) and Occupancy Costs(1)
| Tenant Name | 2010 | 2011 | 2012 | TTM 1/31/2013 | ||||||
Sears | $118 | $104 | $101 | $101 | ||||||
JC Penney | $134 | $160 | $157 | $157 | ||||||
Barnes & Noble | $177 | $174 | $174 | $174 | ||||||
REI | NAV | NAV | NAV | NAV | ||||||
H&M | NAV | NAV | NAV | NAV | ||||||
Forever 21 | $360 | $422 | $395 | $396 | ||||||
Victoria’s Secret | $315 | $346 | $355 | $358 | ||||||
Express | $274 | $327 | $352 | $358 | ||||||
Total In-line (<10,000 square feet)(2) | $365 | $385 | $412 | $411 | ||||||
Occupancy Costs | 16.7% | 15.9% | 15.5% | 15.6% | ||||||
| (1) | Historical Sales (PSF) and Occupancy Costs are based on historical statements provided by the borrower. |
| (2) | Represents tenants occupying less than 10,000 square feet that reported sales for two years prior to each trailing 12-month |
reporting period.
The following table presents certain information relating to the lease rollover schedule at the Carolina Place Property:
Lease Expiration Schedule(1)(2)
Year Ending December 31, | No. of Leases Expiring | Expiring NRSF | % of Total NRSF | Cumulative Expiring NRSF | Cumulative % of Total NRSF | Annual U/W Base Rent | Annual U/W Base Rent PSF(3) | |||||||||||||||||
MTM | 1 | 0 | 0.0% | 0 | 0.0% | $14,400 | $0.00 | |||||||||||||||||
2013 | 6 | 9,203 | 1.4% | 9,203 | 1.4% | $620,821 | $67.46 | |||||||||||||||||
2014 | 17 | 36,252 | 5.6% | 45,455 | 7.0% | $1,230,141 | $33.93 | |||||||||||||||||
2015 | 9 | 9,980 | 1.5% | 55,435 | 8.6% | $611,467 | $61.27 | |||||||||||||||||
2016 | 22 | 365,525 | 56.5% | 420,960 | 65.0% | $3,990,211 | $10.92 | |||||||||||||||||
2017 | 17 | 70,257 | 10.9% | 491,217 | 75.9% | $1,849,232 | $26.32 | |||||||||||||||||
2018 | 7 | 18,110 | 2.8% | 509,327 | 78.7% | $745,093 | $41.14 | |||||||||||||||||
2019 | 5 | 23,261 | 3.6% | 532,588 | 82.3% | $739,041 | $31.77 | |||||||||||||||||
2020 | 5 | 15,689 | 2.4% | 548,277 | 84.7% | $619,793 | $39.50 | |||||||||||||||||
2021 | 2 | 1,294 | 0.2% | 549,571 | 84.9% | $105,804 | $81.77 | |||||||||||||||||
2022 | 13 | 20,183 | 3.1% | 569,754 | 88.0% | $964,207 | $47.77 | |||||||||||||||||
2023 | 4 | 27,173 | 4.2% | 596,927 | 92.2% | $986,029 | $36.29 | |||||||||||||||||
Thereafter | 6 | 14,631 | 2.3% | 611,558 | 94.4% | $543,554 | $37.15 | |||||||||||||||||
Vacant(4) | 0 | 35,953 | 5.6% | 647,511 | 100.0% | $0 | $0.00 | |||||||||||||||||
Total/Weighted Average | 114 | 647,511 | 100.0% | $13,019,793 | $21.29 | |||||||||||||||||||
| (1) | Information obtained from the underwritten rent roll. |
| (2) | Certain tenants may have lease termination options that are exercisable prior to the originally stated expiration date of the subject lease and |
that are not considered in the Lease Expiration Schedule.
| (3) | Weighted Average Annual U/W Base Rent PSF excludes vacant space. |
| (4) | Occupancy excludes temporary and seasonal tenants. As of March 31, 2013, the occupancy, inclusive of these tenants, was 97.7%. |
The following table presents historical occupancy percentages at the Carolina Place Property:
Historical Occupancy(1)(2)
| 12/31/2010 | 12/31/2011 | 12/31/2012 | 3/31/2013 | |||
98.9% | 98.5% | 97.6% | 97.7% | |||
(1) Information obtained from the borrower. (2) Occupancy includes temporary and seasonal tenants. | ||||||
THE INFORMATION IN THIS STRUCTURAL AND COLLATERAL TERM SHEET IS NOT COMPLETE AND MAY BE AMENDED PRIOR TO THE TIME OF SALE. THIS TERM SHEET IS NOT AN OFFER TO SELL THESE SECURITIES AND IT IS NOT A SOLICITATION OF AN OFFER TO BUY THESE SECURITIES IN ANY JURISDICTION WHERE THE OFFER OR SALE IS NOT PERMITTED.
57
CAROLINA PLACE
Operating History and Underwritten Net Cash Flow. The following table presents certain information relating to the historical operating performance and the Underwritten Net Cash Flow at the Carolina Place Property:
Cash Flow Analysis
| 2011 | 2012 | TTM 3/31/2013 | U/W | U/W $ per SF | ||||||||||||||||||
Base Rent | $12,395,361 | $12,371,128 | $12,399,958 | $13,019,793 | $20.11 | |||||||||||||||||
Grossed Up Vacant Space | 0 | 0 | 0 | 1,872,191 | 2.89 | |||||||||||||||||
Percentage Rent | 199,534 | 134,856 | 140,222 | 134,082(1) | 0.21 | |||||||||||||||||
Total Reimbursables | 8,324,233 | 8,509,640 | 8,477,040 | 8,572,562 | 13.24 | |||||||||||||||||
Other Income | 3,204,623 | 2,939,191 | 2,935,770 | 2,935,770 | 4.53 | |||||||||||||||||
Less Vacancy & Credit Loss | (54,633) | (125,222) | (119,067) | (1,872,191)(2) | (2.89) | |||||||||||||||||
|
|
|
|
|
|
|
|
|
| |||||||||||||
Effective Gross Income | $24,069,118 | $23,829,593 | $23,833,923 | $24,662,207 | $38.09 | |||||||||||||||||
Total Operating Expenses | $5,885,142 | $6,021,742 | $6,009,114 | $6,968,607 | $10.76 | |||||||||||||||||
|
|
|
|
|
|
|
|
|
| |||||||||||||
Net Operating Income | $18,183,976 | $17,807,851 | $17,824,809 | $17,693,600 | $27.33 | |||||||||||||||||
TI/LC | 0 | 0 | 0 | 695,975 | 1.07 | |||||||||||||||||
Capital Expenditures | 0 | 0 | 0 | 194,253 | 0.30 | |||||||||||||||||
|
|
|
|
|
|
|
|
|
| |||||||||||||
Net Cash Flow | $18,183,976 | $17,807,851 | $17,824,809 | $16,803,371 | $25.95 | |||||||||||||||||
NOI DSCR(3) | 1.85x | 1.81x | 1.81x | 1.80x | ||||||||||||||||||
NCF DSCR(3) | 1.85x | 1.81x | 1.81x | 1.71x | ||||||||||||||||||
NOI DY(3) | 10.4% | 10.2% | 10.2% | 10.1% | ||||||||||||||||||
NCF DY(3) | 10.4% | 10.2% | 10.2% | 9.6% | ||||||||||||||||||
| (1) | Underwritten Percentage Rent includes $27,603 of percentage rent in lieu of base rent and $106,479 of percentage overage rent. |
| (2) | The underwritten economic vacancy is 7.1%. The Carolina Place Property was 94.4% physically occupied exclusive of seasonal |
and temporary tenants and 97.7% physically occupied inclusive of seasonal and temporary tenants as of March 31, 2013.
| (3) | DSCRs and debt yields are based on the Carolina Place Loan Combination on an aggregate basis. |
Appraisal. As of the appraisal valuation date of April 29, 2013, the Carolina Place Property had an “as-is” appraised value of $263,000,000.
Environmental Matters. According to a Phase I environmental site assessment dated May 3, 2013, there was no evidence of any recognized environmental condition at the Carolina Place Property.
Market Overview and Competition. The Carolina Place Property is located approximately 10 miles south of the central business district of Charlotte, North Carolina. Major employers in the area include Carolinas Healthcare System, Wells Fargo & Co., Bank of America Corp. and Wal-Mart Stores, Inc. Charlotte is the home to the Charlotte Motor Speedway and the NASCAR Hall of Fame, which opened in May 2010. In addition to motorsports, Charlotte is the location of the National Football League’s Carolina Panthers and the National Basketball Association’s Charlotte Bobcats.
According to the appraisal, the Carolina Place Property has a primary trade area that encompasses 33 zip codes within the Charlotte metropolitan statistical area. Per the appraisal, 2013 population and average household income for the trade area were reported at approximately 654,424 and $68,460, respectively.
The appraiser estimated market rent for in-line suites under 10,000 square feet to be $38.33 per square foot on a modified gross basis and used an estimate of $25.00 for in-line suites over 10,000 square feet on a modified gross basis. Additionally, based on an average of comparable properties, the appraiser estimated the local market vacancy rate to be 3.0% within a 30-mile radius.
The following table presents certain information relating to some comparable retail centers provided in the appraisal for the Carolina Place Property:
Competitive Set(1)
Carolina Place (Subject) | Southpark | NorthLake Mall | Concord Mills | |||||
Market | Pineville, NC | Charlotte, NC | Charlotte, NC | Concord, NC | ||||
Distance from Subject | -- | 5.3 miles | 18.6 miles | 21.5 miles | ||||
Property Type | Regional Mall | Regional Mall | Regional Mall | Regional Mall | ||||
Year Built/Renovated | 1991/2006 | 1970/2004 | 2005/NAP | 1999/NAP | ||||
Anchors | Dillard’s, Belk, Sears, Macy’s, JC Penney | Belk, Dillard’s, Macy’s, Nordstrom, Dick’s | Belk, Dillard’s, Hecht’s, Dick’s | Bass Pro, Burlington Coat Factory, AMC Theatres | ||||
Total GLA | 1,161,307 SF | 1,621,000 SF | 1,070,000 SF | 1,285,813 SF | ||||
Total Occupancy | 98% | 99% | 100% | 99% |
| (1) | Information obtained from the borrower’s rent roll and the appraisal. |
The Borrower. The borrower is Carolina Place L.L.C., a Delaware limited liability company and a single purpose entity with two independent directors. Legal counsel to the borrower delivered a non-consolidation opinion in connection with the origination of the Carolina Place Loan Combination. The borrower is 99.5% owned by GGP/Homart II L.L.C., the guarantor of certain nonrecourse carveouts under the Carolina Place Loan Combination, and 0.5% owned by GGPLP Real Estate, Inc.
THE INFORMATION IN THIS STRUCTURAL AND COLLATERAL TERM SHEET IS NOT COMPLETE AND MAY BE AMENDED PRIOR TO THE TIME OF SALE. THIS TERM SHEET IS NOT AN OFFER TO SELL THESE SECURITIES AND IT IS NOT A SOLICITATION OF AN OFFER TO BUY THESE SECURITIES IN ANY JURISDICTION WHERE THE OFFER OR SALE IS NOT PERMITTED.
58
CAROLINA PLACE
The Sponsor. The sponsor, General Growth Properties, Inc./Homart II L.L.C., is a joint venture 50% owned by the New York State Common Retirement Fund and 50% owned by GGP Limited Partnership, which is majority owned by General Growth Properties, Inc. (“GGP”). GGP is a publicly traded REIT that had total assets of approximately $26.9 billion as of March 31, 2013 according to GGP’s 10-Q. Over the same time period, GGP’s portfolio had sales of $558 per square foot for comparable tenants with less than 10,000 square feet. GGP entered Chapter 11 bankruptcy proceedings in April 2009 and emerged from bankruptcy protection in November 2010. The New York State Common Retirement Fund was the third largest pension plan in the United States with $153.3 billion in assets, as of March 31, 2012. See “Risk Factors - The Borrower’s Form of Entity May Cause Special Risks” and “ERISA Considerations” in the Free Writing Prospectus.
Escrows. No monthly tax escrow is required so long as no Cash Management Period (as defined below) has occurred and is continuing under the Carolina Place Loan Combination. No monthly insurance escrow is required so long as (i) no Cash Management Period has occurred and is continuing under the Carolina Place Loan Combination, and (ii) the insurance required to be maintained by the borrower is effected under an acceptable blanket insurance policy. No monthly replacement reserve or tenant improvement and leasing commissions reserves are required so long as no Cash Management Period has occurred and is continuing. However, GGP/Homart II L.L.C., has entered into a separate guaranty agreement in favor of the lender pursuant to which GGP/Homart II L.L.C. guarantees certain upcoming tenant improvement and leasing costs in the amount of $1,042,980 for H&M and $75,000 for Lim’s.
Lockbox and Cash Management. The Carolina Place Loan Combination requires a lender-controlled lockbox account, which is already in place, and that the borrower direct tenants to pay their rents directly to such lockbox account. The loan documents also require that all rents received by the borrower or the property manager be deposited into the lockbox account within two business days after receipt. Prior to the occurrence of a Cash Management Period (as defined below) all funds on deposit in the lockbox account are swept into the borrower’s operating account on a daily basis. During a Cash Management Period, all funds on deposit in the lockbox account are swept on a daily basis to a cash management account under the control of the lender.
A “Cash Management Period” will commence upon either of the following events occurring: (i) the occurrence of an event of default, or (ii) the amortizing debt service coverage ratio falling below 1.25x as of the end of any calendar quarter. A Cash Management Period will end with respect to the matters described in clause (i) above, when such event of default has been cured, and with respect to the matters described in clause (ii) above, when an amortizing debt service coverage ratio of at least 1.25x has been achieved for two consecutive calendar quarters.
Property Management. The Carolina Place Property is managed by an affiliate of the borrower.
Assumption. The borrower has the right to transfer the Carolina Place Property, provided that no event of default has occurred and is continuing and certain other conditions are satisfied, including (i) execution of a recourse guaranty and an environmental indemnity by an affiliate of the transferee; (ii) if requested by the lender, rating agency confirmation from Fitch, KBRA and Moody’s that the transfer will not result in a downgrade, withdrawal or qualification of the respective ratings assigned to the Series 2013-C15 Certificates; and (iii) the lender reasonably determines that the proposed transferee and guarantor satisfy the lender’s credit review and underwriting standards, taking into consideration transferee experience, financial strength and general business standing.
Free Release. The borrower may obtain a release of certain immaterial, non-income producing portions of the Carolina Place Property from the lien of the mortgage upon the satisfaction of certain conditions including, but not limited to, (i) no event of default will have occurred and be continuing; (ii) the parcel to be released will be an Acquired Expansion Parcel (as defined below) or will be vacant, non-income-producing and unimproved; (iii) the borrower must deliver written evidence to the lender that release will not diminish the value of the remaining property as collateral for the Carolina Place Loan Combination; and (iv) an opinion of counsel that the REMIC trust will not fail to maintain its REMIC status due to the partial defeasance.
An “Acquired Expansion Parcel” is a parcel of land that the borrower may acquire as additional collateral for the Carolina Place Loan Combination subject to customary conditions set forth in the loan documents including, but not limited to, (i) no event of default has occurred and is continuing; (ii) the borrower has delivered to the lender a copy of the deed or ground lease conveying the borrower’s ownership interest in the expansion parcel; (iii) the borrower must have paid all reasonable out-of-pocket costs and expenses incurred by the lender in connection with the acquisition of the expansion parcel; and (iv) the guarantor will deliver to the lender a reaffirmation of its obligations under the related guaranty agreement under the Carolina Place Loan Combination.
Real Estate Substitution. The borrower may obtain a release of one or more portions of the Carolina Place Property and acquire a corresponding substitute portion of the Carolina Place Property upon the satisfaction of certain conditions, including but not limited to, (i) no event of default will have occurred and be continuing; (ii) the exchanged parcel will be an Acquired Expansion Parcel or will be vacant, non-income-producing and unimproved; (iii) not less than thirty days prior to date of substitution, the borrower will deliver to the lender a notice setting forth evidence that the exchanged parcel will not diminish the value of the Carolina Place Property as collateral for the loan or otherwise cause any material adverse effect; and (iv) the borrower will ensure that the lender receives all third party reports required under the loan documents and that substitution will not cause collateral for the loan to be non-compliant in regards to zoning or insurance requirements.
THE INFORMATION IN THIS STRUCTURAL AND COLLATERAL TERM SHEET IS NOT COMPLETE AND MAY BE AMENDED PRIOR TO THE TIME OF SALE. THIS TERM SHEET IS NOT AN OFFER TO SELL THESE SECURITIES AND IT IS NOT A SOLICITATION OF AN OFFER TO BUY THESE SECURITIES IN ANY JURISDICTION WHERE THE OFFER OR SALE IS NOT PERMITTED.
59
CAROLINA PLACE
Subordinate and Mezzanine Indebtedness. The borrower has the right to incur mezzanine financing subject to the lender’s approval and other customary conditions including: (i) no event of default has occurred and is continuing; (ii) the combined loan-to-value ratio including all debt is not greater than 66.5%; (iii) the amortizing debt service coverage ratio including all debt is not less than 1.80x; (iv) the execution of an intercreditor agreement acceptable to the lender; and (v) receipt of rating agency confirmation from Fitch, KBRA and Moody’s that the mezzanine financing will not result in a downgrade, withdrawal or qualification of the respective ratings assigned to the Series 2013-C15 Certificates.
The loan documents permit certain sponsor affiliates to pledge their indirect ownership interests in the borrower to an institutional lender providing a corporate line of credit or corporate credit facility to such sponsor affiliates, subject to certain conditions, including that such sponsor affiliates pledging such indirect ownership interests under such corporate line of credit or corporate credit facility will be required to (i) have an aggregate net worth of at least $500,000,000 and (ii) pledge, grant a security interest in or otherwise encumber all or substantially all of their assets in connection with such corporate line of credit or corporate credit facility.
Ground Lease. None.
Terrorism Insurance. The loan documents require that the “all risk” insurance policy required to be maintained by the borrower provides coverage for damage from terrorism in an amount equal to the full replacement cost of the Carolina Place Property as well as business interruption insurance covering no less than the 18-month period following the occurrence of a casualty event, together with a six-month extended period of indemnity.
THE INFORMATION IN THIS STRUCTURAL AND COLLATERAL TERM SHEET IS NOT COMPLETE AND MAY BE AMENDED PRIOR TO THE TIME OF SALE. THIS TERM SHEET IS NOT AN OFFER TO SELL THESE SECURITIES AND IT IS NOT A SOLICITATION OF AN OFFER TO BUY THESE SECURITIES IN ANY JURISDICTION WHERE THE OFFER OR SALE IS NOT PERMITTED.
60
[THIS PAGE INTENTIONALLY LEFT BLANK.]
61
KITSAP MALL

THE INFORMATION IN THIS STRUCTURAL AND COLLATERAL TERM SHEET IS NOT COMPLETE AND MAY BE AMENDED PRIOR TO THE TIME OF SALE. THIS TERM SHEET IS NOT AN OFFER TO SELL THESE SECURITIES AND IT IS NOT A SOLICITATION OF AN OFFER TO BUY THESE SECURITIES IN ANY JURISDICTION WHERE THE OFFER OR SALE IS NOT PERMITTED.
62
KITSAP MALL
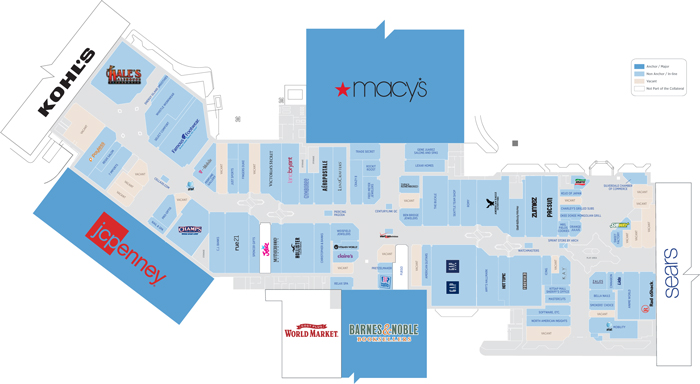
THE INFORMATION IN THIS STRUCTURAL AND COLLATERAL TERM SHEET IS NOT COMPLETE AND MAY BE AMENDED PRIOR TO THE TIME OF SALE. THIS TERM SHEET IS NOT AN OFFER TO SELL THESE SECURITIES AND IT IS NOT A SOLICITATION OF AN OFFER TO BUY THESE SECURITIES IN ANY JURISDICTION WHERE THE OFFER OR SALE IS NOT PERMITTED.
63
KITSAP MALL
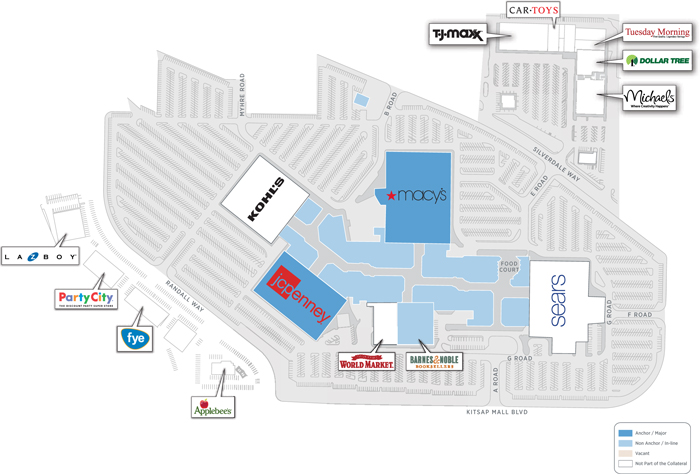
THE INFORMATION IN THIS STRUCTURAL AND COLLATERAL TERM SHEET IS NOT COMPLETE AND MAY BE AMENDED PRIOR TO THE TIME OF SALE. THIS TERM SHEET IS NOT AN OFFER TO SELL THESE SECURITIES AND IT IS NOT A SOLICITATION OF AN OFFER TO BUY THESE SECURITIES IN ANY JURISDICTION WHERE THE OFFER OR SALE IS NOT PERMITTED.
64
KITSAP MALL

THE INFORMATION IN THIS STRUCTURAL AND COLLATERAL TERM SHEET IS NOT COMPLETE AND MAY BE AMENDED PRIOR TO THE TIME OF SALE. THIS TERM SHEET IS NOT AN OFFER TO SELL THESE SECURITIES AND IT IS NOT A SOLICITATION OF AN OFFER TO BUY THESE SECURITIES IN ANY JURISDICTION WHERE THE OFFER OR SALE IS NOT PERMITTED.
65
| No. 5 – Kitsap Mall |
| Loan Information | ||
| Mortgage Loan Seller: | The Royal Bank of Scotland | |
Credit Assessment | NR/NR/NR | |
| (Fitch/KBRA/Moody’s): | ||
Original Principal Balance: | $77,300,000 | |
Cut-off Date Principal Balance: | $77,300,000 | |
% of Initial Pool Balance: | 7.0% | |
Loan Purpose: | Acquisition | |
Borrower Name: | Kitsap Mall LLC | |
Sponsor: | Starwood Capital Global Group, L.P. | |
Mortgage Rate: | 4.316% | |
Note Date: | June 12, 2013 | |
Anticipated Repayment Date: | NAP | |
Maturity Date: | July 1, 2023 | |
IO Period: | 72 months | |
Loan Term (Original): | 120 months | |
Seasoning: | 1 month | |
Amortization Term (Original): | 360 months | |
Loan Amortization Type: | Interest-only, Amortizing Balloon | |
Interest Accrual Method: | Actual/360 | |
Call Protection: |
L(18),GRTR 1% or YM(7),D or GRTR 1% or YM(88),O(7) | |
Lockbox Type: | Hard/Springing Cash Management | |
Additional Debt: | Yes | |
Additional Debt Type: | Future Mezzanine |
Escrows and Reserves(1):
| Type: | Initial | Monthly | Cap (If Any) | |||
Taxes | $0 | Springing | NAP | |||
Insurance | $0 | Springing | NAP | |||
Replacement Reserves | $0 | Springing | $64,000 | |||
TI/LC Reserve | $852,816 | Springing | $128,000 | |||
| Property Information | ||
| Single Asset/Portfolio: | Single Asset | |
Property Type: | Retail | |
Specific Property Type: | Regional Mall | |
Location: | Silverdale, WA | |
Size: | 533,480 SF | |
Cut-off Date Principal | $144.90 | |
Balance Per SF: | ||
Year Built/Renovated: | 1985/1995 | |
Title Vesting: | Fee | |
Property Manager: | Self-managed | |
3rdMost Recent Occupancy (As of)(2): | 92.1% (12/31/2010) | |
2ndMost Recent Occupancy (As of)(2): | 91.9% (12/31/2011) | |
Most Recent Occupancy (As of)(2): | 91.9% (12/31/2012) | |
Current Occupancy (As of)(2): | 91.7% (4/30/2013) | |
Underwriting and Financial Information:
| ||
| 3rdMost Recent NOI (As of): | $8,323,427 (12/31/2011) | |
2ndMost Recent NOI (As of): | $8,124,275 (12/31/2012) | |
Most Recent NOI (As of): | $8,179,838 (TTM 3/31/2013) | |
U/W Revenues: | $12,731,457 | |
U/W Expenses: | $4,496,764 | |
U/W NOI: | $8,234,693 | |
U/W NCF: | $7,812,071 | |
U/W NOI DSCR: | 1.79x | |
U/W NCF DSCR: | 1.70x | |
U/W NOI Debt Yield: | 10.7% | |
U/W NCF Debt Yield: | 10.1% | |
As-Is Appraised Value: | $111,000,000 | |
As-Is Appraisal Valuation Date: | May 18, 2013 | |
Cut-off Date LTV Ratio: | 69.6% | |
LTV Ratio at Maturity or ARD: | 64.9% | |
| (1) | See “Escrows” section. |
| (2) | Historical and current occupancy excludes temporary and seasonal tenants. As of April 30, 2013, the occupancy inclusive of these tenants was 94.5%. |
The Mortgage Loan. The mortgage loan (the “Kitsap Mall Mortgage Loan”) is evidenced by a single promissory note that is secured by a first mortgage encumbering a regional mall located in Silverdale, Washington (the “Kitsap Mall Property”). The Kitsap Mall Mortgage Loan was originated on June 12, 2013 by The Royal Bank of Scotland. The Kitsap Mall Mortgage Loan had an original principal balance of $77,300,000, has an outstanding principal balance as of the Cut-off Date of $77,300,000 and accrues interest at an interest rate of 4.316% per annum. The Kitsap Mall Mortgage Loan had an initial term of 120 months, has a remaining term of 119 months as of the Cut-off Date and requires interest-only payments for the first 72 payments following origination, and thereafter requires payments of principal and interest based on a 30-year amortization schedule. The Kitsap Mall Mortgage Loan matures on July 1, 2023.
Following the lockout period, the borrower has the right to prepay the Kitsap Mall Mortgage Loan in whole, but not in part, provided that the borrower pays the greater of a yield maintenance premium or a prepayment premium equal to 1.0% of the outstanding loan balance. Following the defeasance lockout period, the borrower will also have the right to defease the Kitsap Mall Mortgage Loan in whole, but not in part, on any due date before January 1, 2023. In addition, the Kitsap Mall Mortgage Loan is prepayable without penalty on any due date on or after January 1, 2023.
Sources and Uses
| Sources | Uses | |||||||||||||||||
Original loan amount | $77,300,000 | 67.7% | Purchase price | $112,387,500 | 98.5% | |||||||||||||
Sponsor’s new cash contribution | 36,796,700 | 32.3 | Reserves | 852,816 | 0.7 | |||||||||||||
Closing costs | 856,383 | 0.8 | ||||||||||||||||
Total Sources | $114,096,700 | 100.0% | Total Uses | $114,096,700 | 100.0% | |||||||||||||
THE INFORMATION IN THIS STRUCTURAL AND COLLATERAL TERM SHEET IS NOT COMPLETE AND MAY BE AMENDED PRIOR TO THE TIME OF SALE. THIS TERM SHEET IS NOT AN OFFER TO SELL THESE SECURITIES AND IT IS NOT A SOLICITATION OF AN OFFER TO BUY THESE SECURITIES IN ANY JURISDICTION WHERE THE OFFER OR SALE IS NOT PERMITTED.
66
KITSAP MALL
The Property. The Kitsap Mall Property is comprised of a 715,225 square foot regional mall located in Silverdale, Washington, within the north-central region of the Kitsap Peninsula. The collateral for the Kitsap Mall Mortgage Loan consists of 533,480 square feet of the 715,225 square foot mall. The Kitsap Mall Property is anchored by Sears and Kohl’s (neither of which are part of the collateral), JC Penney (on a ground lease) and Macy’s. The Kitsap Mall Property was built in 1985 and underwent renovations in 1988 and 1995. In-line stores include Barnes & Noble (on a ground lease), Gap, Hollister, Forever 21, American Eagle, Victoria’s Secret, and Champs Sports, among others. The Kitsap Mall Property contains 2,677 surface parking spaces reflecting a parking ratio of 5.0 spaces per 1,000 square feet of net rentable area. For the trailing 12-month period ending March 31, 2013, tenants occupying less than 10,000 square feet had comparable in-line sales of $389 per square foot with an average occupancy cost of 13.7%. As of April 30, 2013, the Kitsap Mall Property was 94.5% occupied by approximately 87 tenants, including seasonal and temporary tenants, and 91.7% leased excluding seasonal and temporary tenants.
The following table presents certain information relating to the tenancies at the Kitsap Mall Property:
Major Tenants
| Tenant Name | Credit Rating Moody’s/ S&P)(1) | Tenant NRSF | % of NRSF | Annual U/W Base Rent PSF(2) | Annual U/W Base Rent(2) | % of Total Annual U/W Base Rent | Sales PSF(3) | Occupancy Cost(3)(4) | Lease Expiration Date | |||||||||||||||||||||||||
Anchor Tenants - Not Part of Collateral |
| |||||||||||||||||||||||||||||||||
Sears | CCC/B3/CCC+ | 105,600 | ANCHOR OWNED - NOT PART OF THE COLLATERAL | |||||||||||||||||||||||||||||||
Kohl’s | BBB+/Baa1/BBB+ | 76,145 | ANCHOR OWNED - NOT PART OF THE COLLATERAL | |||||||||||||||||||||||||||||||
Anchor Tenants - Collateral | ||||||||||||||||||||||||||||||||||
Macy’s | BBB/Baa3/BBB | 121,000 | 22.7% | $8.69 | $1,051,116 | 15.5% | $190 | 6.2% | 1/31/2024 | |||||||||||||||||||||||||
JC Penney(5) | B-/Caa1/CCC+ | 157,238 | 29.5% | $0.95 | $150,000 | 2.2% | $114 | 2.1% | 8/31/2018(7 | ) | ||||||||||||||||||||||||
|
|
|
| |||||||||||||||||||||||||||||||
Total Anchor Tenants - Collateral | 278,238 | 52.2% | $4.32 | $1,201,116 | 17.8% | |||||||||||||||||||||||||||||
Major Tenants - Collateral | ||||||||||||||||||||||||||||||||||
Hale’s Alehouse | NR/NR/NR | 7,876 | 1.5% | $29.70 | $233,917 | 3.5% | $228 | 20.5% | 6/30/2020 | |||||||||||||||||||||||||
Famous Footwear | NR/NR/NR | 6,494 | 1.2% | $24.27 | $157,611 | 2.3% | $279 | 17.9% | 9/30/2015 | |||||||||||||||||||||||||
Hollister Co. | NR/NR/NR | 5,584 | 1.0% | $19.58 | $109,342 | 1.6% | $204 | 21.4% | 1/31/2019 | |||||||||||||||||||||||||
Red Robin(5) | NR/NR/NR | 7,000 | 1.3% | $14.50 | $101,474 | 1.5% | $694 | 2.7% | 1/31/2015 | |||||||||||||||||||||||||
Barnes & Noble(5)(6) | NR/NR/NR | 51,430 | 9.6% | $0.97 | $50,000 | 0.7% | $184 | 2.0% | 8/31/2015 | |||||||||||||||||||||||||
|
|
|
| |||||||||||||||||||||||||||||||
Total Major Tenants - Collateral | 78,384 | 14.7% | $8.32 | $652,343 | 9.6% | |||||||||||||||||||||||||||||
Non-Major Tenants - Collateral | 132,722 | 24.9% | $36.98 | $4,907,887 | 72.6% | |||||||||||||||||||||||||||||
|
|
|
| |||||||||||||||||||||||||||||||
Occupied Collateral Total | 489,344 | 91.7% | $13.82 | $6,761,346 | 100.0% | |||||||||||||||||||||||||||||
|
| |||||||||||||||||||||||||||||||||
Vacant Space | 44,136 | 8.3% | ||||||||||||||||||||||||||||||||
|
| |||||||||||||||||||||||||||||||||
Collateral Total | 533,480 | 100.0% | ||||||||||||||||||||||||||||||||
|
| |||||||||||||||||||||||||||||||||
| (1) | Certain ratings are those of the parent company whether or not the parent guarantees the lease. |
| (2) | Underwritten base rent includes contractual rent steps through February 2014. |
| (3) | Sales and occupancy costs are for the trailing 12-month period ending March 31, 2013. |
| (4) | Occupancy costs include base rent, reimbursements and percentage rent, as applicable. |
| (5) | JC Penney, Red Robin and Barnes & Noble own their own improvements and are the lessees under ground leases with the borrower. |
| (6) | Barnes & Noble is subletting 19,320 square feet of space to Cost Plus World Market. Cost Plus World Market pays the greater of (i) 0.45% of gross sales and (ii) $50,000. |
| (7) | JC Penney has six, five-year renewal options remaining. |
THE INFORMATION IN THIS STRUCTURAL AND COLLATERAL TERM SHEET IS NOT COMPLETE AND MAY BE AMENDED PRIOR TO THE TIME OF SALE. THIS TERM SHEET IS NOT AN OFFER TO SELL THESE SECURITIES AND IT IS NOT A SOLICITATION OF AN OFFER TO BUY THESE SECURITIES IN ANY JURISDICTION WHERE THE OFFER OR SALE IS NOT PERMITTED.
67
KITSAP MALL
The following table presents certain information relating to the historical sales and occupancy costs at the Kitsap Mall Property:
Historical Sales (PSF) and Occupancy Costs(1)
| TTM | ||||||||||
| Tenant Name | 2010 | 2011 | 2012 | 3/31/2013 | ||||||
| JC Penney | $138 | $139 | $114 | $114 | ||||||
| Macy’s | $196 | $194 | $190 | $190 | ||||||
| Barnes & Noble | $175 | $175 | $175 | $184 | ||||||
| Gap | $159 | $147 | $135 | $136 | ||||||
| Hale’s Alehouse | $188 | $255 | $234 | $228 | ||||||
| Red Robin | $715 | $733 | $702 | $694 | ||||||
| Famous Footwear | $292 | $264 | $271 | $279 | ||||||
| Hollister Co. | $191 | $198 | $202 | $204 | ||||||
| Total In-line (<10,000 square feet)(2) | $384 | $395 | $390 | $389 | ||||||
| Occupancy Costs | 13.5% | 13.6% | 13.3% | 13.7% | ||||||
(1) |
Historical Sales (PSF) and Occupancy Costs are based on historical statements provided by the borrower. | |||||||||
(2) | Represents tenants occupying less than 10,000 square feet who reported sales for two years prior to each trailing 12-month reporting period. | |||||||||
The following table presents certain information relating to the lease rollover schedule at the Kitsap Mall Property:
Lease Expiration Schedule(1)(2)
Year Ending December 31, | No. of Leases Expiring | Expiring NRSF | % of Total NRSF | Cumulative Expiring NRSF | Cumulative % of Total NRSF | Annual U/W Base Rent | Annual U/W Base Rent PSF(3) | |||||||||||||||||||||
| MTM | 3 | 10,840 | 2.0% | 10,840 | 2.0% | $357,636 | $32.99 | |||||||||||||||||||||
| 2013 | 2 | 4,186 | 0.8% | 15,026 | 2.8% | $134,095 | $32.03 | |||||||||||||||||||||
| 2014 | 19 | 42,402 | 7.9% | 57,428 | 10.8% | $1,180,446 | $27.84 | |||||||||||||||||||||
| 2015 | 17 | 78,420 | 14.7% | 135,848 | 25.5% | $1,088,282 | $13.88 | |||||||||||||||||||||
| 2016 | 8 | 12,845 | 2.4% | 148,693 | 27.9% | $711,138 | $55.36 | |||||||||||||||||||||
| 2017 | 10 | 13,952 | 2.6% | 162,645 | 30.5% | $539,132 | $38.64 | |||||||||||||||||||||
| 2018 | 3 | 161,634 | 30.3% | 324,279 | 60.8% | $355,317 | $2.20 | |||||||||||||||||||||
| 2019 | 5 | 15,277 | 2.9% | 339,556 | 63.6% | $477,128 | $31.23 | |||||||||||||||||||||
| 2020 | 2 | 11,076 | 2.1% | 350,632 | 65.7% | $359,974 | $32.50 | |||||||||||||||||||||
| 2021 | 3 | 11,574 | 2.2% | 362,206 | 67.9% | $330,567 | $28.56 | |||||||||||||||||||||
| 2022 | 1 | 2,089 | 0.4% | 364,295 | 68.3% | $57,068 | $27.32 | |||||||||||||||||||||
| 2023 | 1 | 1,949 | 0.4% | 366,244 | 68.7% | $44,827 | $23.00 | |||||||||||||||||||||
| Thereafter | 2 | 123,100 | 23.1% | 489,344 | 91.7% | $1,125,736 | $9.14 | |||||||||||||||||||||
| Vacant | 0 | 44,136 | 8.3% | 533,480 | 100.0% | $0 | $0.00 | |||||||||||||||||||||
Total/Weighted Average | 76 | 533,480 | 100.0% | $6,761,346 | $13.82 | |||||||||||||||||||||||
(1) |
Information obtained from the underwritten rent roll. |
| ||||||||||||||||||||||||||
(2) | Certain tenants may have lease termination options that are exercisable prior to the originally stated expiration date of the subject lease and that are not considered in the Lease Expiration Schedule. | |||||||||||||||||||||||||||
(3) | Weighted Average Annual U/W Base Rent PSF excludes vacant space. | |||||||||||||||||||||||||||
The following table presents historical occupancy percentages at the Kitsap Mall Property:
Historical Occupancy(1)(2)
12/31/2010 | 12/31/2011 | 12/31/2012 | 4/30/2013 | |||
| 92.1% | 91.9% | 91.9% | 91.7% | |||
| (1) | Information obtained from the borrower. |
| (2) | Occupancy excludes temporary and seasonal tenants. |
THE INFORMATION IN THIS STRUCTURAL AND COLLATERAL TERM SHEET IS NOT COMPLETE AND MAY BE AMENDED PRIOR TO THE TIME OF SALE. THIS TERM SHEET IS NOT AN OFFER TO SELL THESE SECURITIES AND IT IS NOT A SOLICITATION OF AN OFFER TO BUY THESE SECURITIES IN ANY JURISDICTION WHERE THE OFFER OR SALE IS NOT PERMITTED.
68
KITSAP MALL
Operating History and Underwritten Net Cash Flow. The following table presents certain information relating to the historical operating performance and the Underwritten Net Cash Flow at the Kitsap Mall Property:
Cash Flow Analysis
| 2011 | 2012 | TTM 3/31/2013 | U/W | U/W $ per SF | ||||||||||||||||||||
Base Rent | $6,447,031 | $6,539,947 | $6,513,847 | $6,761,346 | $12.67 | |||||||||||||||||||
Grossed Up Vacant Space | 0 | 0 | 0 | 1,607,820 | 3.01 | |||||||||||||||||||
Percentage Rent | 980,759 | 757,402 | 744,080 | 608,475(1) | 1.14 | |||||||||||||||||||
Total Reimbursables | 3,806,718 | 3,736,706 | 3,982,708 | 3,847,035 | 7.21 | |||||||||||||||||||
Other Income | 1,347,615 | 1,447,856 | 1,514,601 | 1,514,601 | 2.84 | |||||||||||||||||||
Less Vacancy & Credit Loss | (78,084) | 18,081 | (88,032) | (1,607,820)(2) | (3.01) | |||||||||||||||||||
|
|
|
|
|
|
|
|
|
| |||||||||||||||
Effective Gross Income | $12,504,039 | $12,499,992 | $12,667,204 | $12,731,457 | $23.86 | |||||||||||||||||||
Total Operating Expenses | $4,180,612 | $4,375,717 | $4,487,366 | $4,496,764 | $8.43 | |||||||||||||||||||
|
|
|
|
|
|
|
|
|
| |||||||||||||||
Net Operating Income | $8,323,427 | $8,124,275 | $8,179,838 | $8,234,693 | $15.44 | |||||||||||||||||||
TI/LC | 0 | 0 | 0 | 315,926 | 0.59 | |||||||||||||||||||
Capital Expenditures | 0 | 0 | 0 | 106,696 | 0.20 | |||||||||||||||||||
|
|
|
|
|
|
|
|
|
| |||||||||||||||
Net Cash Flow | $8,323,427 | $8,124,275 | $8,179,838 | $7,812,071 | $14.64 | |||||||||||||||||||
NOI DSCR | 1.81x | 1.77x | 1.78x | 1.79x | ||||||||||||||||||||
NCF DSCR | 1.81x | 1.77x | 1.78x | 1.70x | ||||||||||||||||||||
NOI DY | 10.8% | 10.5% | 10.6% | 10.7% | ||||||||||||||||||||
NCF DY | 10.8% | 10.5% | 10.6% | 10.1% | ||||||||||||||||||||
| (1) | Percentage Rent includes $483,244 of percentage overage rent and $125,231 of percentage rent in lieu. | |||||||||||||||||||||||
| (2) | The underwritten economic vacancy is 12.3%. The Kitsap Mall Property was 94.5% physically occupied inclusive of seasonal and temporary tenants and 91.7% physically occupied exclusive of seasonal and temporary tenants as of April 30, 2013. | |||||||||||||||||||||||
Appraisal. As of the appraisal valuation date of May 18, 2013, the Kitsap Mall Property had an “as-is” appraised value of $111,000,000.
Environmental Matters. According to a Phase I environmental site assessment dated May 31, 2013, the Kitsap Mall Property identified one Recognized Environmental Condition (“REC”). The REC identified soil and groundwater contamination at the Sears Auto Shop (not part of the collateral). The Phase I report recommended Sears Auto Shop determine the extent of the contamination, however, any and all liability associated with the contamination is the responsibility of Sears Auto Shop.
Market Overview and Competition. The Kitsap Mall Property is located along the Kitsap Peninsula in Silverdale, Washington. Located approximately 10 miles northwest of Bremerton, this metropolitan statistical area has become a primary retail hub within the area. The Bremerton metropolitan statistical area is located approximately 18 miles west of Seattle and transportation between the two metro areas is reliant on ferries due to the 65 mile drive without use of a ferry. The Kitsap Mall Property is the only regional shopping center within Kitsap County and the north part of the Olympic Peninsula. The Kitsap Mall Property is located approximately 0.2 miles southeast of Route 3 and is approximately one half mile south of Route 303.
According to the appraisal, the Kitsap Mall Property has a primary trade area that encompasses 10 miles within the Bremerton metropolitan statistical area. The 2013 population and average household income for the trade area were reported at approximately 191,931 and $74,623, respectively. According to the appraisal, the Kitsap Mall Property has a secondary trade area that encompasses 15 miles and has a 2013 population of 334,964. The appraiser estimated market rent for in-line tenants to be $27.98 per square foot on a triple net basis. Additionally, based on an average of comparable properties, the appraiser estimated a vacancy rate of 6.2%.
The following table presents certain information relating to some comparable retail center properties for the Kitsap Mall Property:
Competitive Set(1)
| Kitsap Mall (Subject) | Tacoma Mall | Lakewood Towne Center | The Commons at Federal Way | Westfield Southcenter | Westfield Capital | |||||||
Market | Silverdale, WA | Tacoma, WA | Lakewood, WA | Federal Way, WA | Tukwila, WA | Olympia, WA | ||||||
Distance from Subject | – – | 33.0 miles | 38.0 miles | 43.0 miles | 53.0 miles | 58.0 miles | ||||||
Property Type | Regional Mall | Regional Mall | Regional Mall | Regional Mall | Regional Mall | Regional Mall | ||||||
Year Built/Renovated | 1985/1995 | 1964/2009 | 1961/2007 | 1975/2008 | 1961/2008 | 1978/2006 | ||||||
Anchors |
JC Penney, |
Nordstrom, |
Target, Burlington |
Macy’s, Sears, |
Nordstrom, |
Macy’s, JC | ||||||
Total GLA | 715,225 SF | 1,325,746 SF | 924,758 SF | 783,299 SF | 1,721,609 SF | 779,268 SF | ||||||
Total Occupancy | 92% | 98% | 80% | 95% | 97% | 95% |
| (1) | Information obtained from the borrower’s rent roll and the appraisal. |
THE INFORMATION IN THIS STRUCTURAL AND COLLATERAL TERM SHEET IS NOT COMPLETE AND MAY BE AMENDED PRIOR TO THE TIME OF SALE. THIS TERM SHEET IS NOT AN OFFER TO SELL THESE SECURITIES AND IT IS NOT A SOLICITATION OF AN OFFER TO BUY THESE SECURITIES IN ANY JURISDICTION WHERE THE OFFER OR SALE IS NOT PERMITTED.
69
KITSAP MALL
The Borrower. The borrower is Kitsap Mall LLC, a Delaware limited liability company and a single purpose entity with two independent managers. Legal counsel to the borrower delivered a non-consolidation opinion in connection with the origination of the Kitsap Mall Mortgage Loan. The borrower is 100% indirectly owned by Retail Portfolio I, L.P. and Retail Portfolio II, L.P., the guarantors of certain nonrecourse carveouts under the Kitsap Mall Mortgage Loan.
The Sponsor. The sponsor, Starwood Capital Global Group, L.P. (“SCGG”), a subsidiary of Starwood Capital Group, is a privately held global investment firm owned by more than 60 partners. SCGG has completed over 490 transactions representing assets of approximately $38.0 billion, with assets under management of approximately $23.0 billion, as of December 31, 2012. SCGG has approximately 250 employees located across 10 offices in five countries and has invested approximately $12.0 billion of equity since 1991. As of December 31, 2012, SCGG has invested in 36.1 million square feet of office space, 24.7 million square feet of retail space, over 2,200 hotels, 67,100 multifamily and condominium units and over 9,500 acres of land in over 20 operating companies.
Escrows. No monthly tax escrow is required so long as no Trigger Period (as defined below) has occurred and is continuing under the Kitsap Mall Mortgage Loan. No monthly insurance escrow payments are required so long as (i) no Trigger Period has occurred and is continuing under the Kitsap Mall Mortgage Loan, or (ii) the insurance required to be maintained by the borrower is in effect under an acceptable blanket insurance policy. No upfront or monthly replacement reserve escrows are required so long as no Trigger Period has occurred and is continuing under the Kitsap Mall Mortgage Loan. In the event that a Trigger Period has occurred, a monthly replacement reserve of $5,300 will commence (subject to a cap of $64,000). The loan documents provide for an upfront escrow in the amount of $852,816 for tenant improvement and leasing commissions. In the event that a Trigger Period has occurred under the Kitsap Mall Mortgage Loan, a monthly tenant improvement and leasing commission escrow of $11,000 will commence (subject to a cap of $128,000).
Lockbox and Cash Management. The Kitsap Mall Mortgage Loan requires a lender-controlled lockbox account, which is already in place, and that the borrower direct tenants to pay their rents directly to such lockbox account. The loan documents also require that all rents received by the borrower or the property manager be deposited into the lockbox account within three business days after receipt. Prior to the occurrence of a Trigger Period, all funds on deposit in the lockbox account are swept into the borrower’s operating account on a daily basis. During a Trigger Period, all funds on deposit in the lockbox account are swept on a daily basis to a cash management account under the control of the lender.
A “Trigger Period” will commence upon either of the following events: (i) the occurrence of an event of default, or (ii) the amortizing debt service coverage ratio falling below 1.25x as of the end of any calendar quarter. A Trigger Period will end with respect to the matters described in clause (i) above, when such event of default has been cured, and with respect to the matters described in clause (ii) above, when an amortizing debt service coverage ratio of at least 1.25x has been achieved for two consecutive calendar quarters.
Property Management. The Kitsap Mall Property is managed by an affiliate of the borrower.
Assumption. The borrower has the right to transfer the Kitsap Mall Property, provided that no event of default has occurred and is continuing and certain other conditions are satisfied, including, but not limited to: (i) if requested by the lender, rating agency confirmation from Fitch, KBRA and Moody’s that the transfer will not result in a downgrade, withdrawal or qualification of the respective ratings assigned to the Series 2013-C15 Certificates; and (ii) the lender reasonably determines that the proposed transferee is majority owned and controlled by a qualified transferee (as defined in the loan documents) and guarantor is acceptable to lender in all respects.
Partial Release. Not permitted.
Real Estate Substitution. Not permitted.
Subordinate and Mezzanine Indebtedness. The borrower has the right to incur mezzanine financing subject to customary conditions including: (i) no event of default has occurred and is continuing; (ii) the loan-to-value ratio including all debt is not greater than 70.0%; (iii) the amortizing debt service coverage ratio including all debt is not less than 1.25x; (iv) the execution and delivery of an intercreditor agreement acceptable to the lender; and (v) receipt of rating agency confirmation from Fitch, KBRA and Moody’s that the mezzanine financing will not result in a downgrade, withdrawal or qualification of the respective ratings assigned to the Series 2013-C15 Certificates.
The loan documents permit certain sponsor affiliates to pledge their indirect ownership interests in the guarantor to an institutional lender providing a corporate line of credit or corporate credit facility to such sponsor affiliates, subject to certain conditions, including that such pledge or any foreclosure thereon does not result in a change in control of the borrower or guarantor, and the sponsor together with any affiliates controlled by the sponsor or any Qualified GP (as defined in the Kitsap Mall loan documents), with respect to whom a rating agency confirmation has been obtained, continues (i) to own, directly or indirectly, at least 10% of the equity interests in the borrower and guarantor and (ii) control the same.
Ground Lease. None.
Terrorism Insurance. The loan documents require that the “all risk” insurance policy required to be maintained by the borrower provides coverage for damage from terrorism in an amount equal to the full replacement cost of the Kitsap Mall Property as well as business interruption insurance covering no less than the 18-month period following the occurrence of a casualty event, together with a six-month extended period of indemnity.
THE INFORMATION IN THIS STRUCTURAL AND COLLATERAL TERM SHEET IS NOT COMPLETE AND MAY BE AMENDED PRIOR TO THE TIME OF SALE. THIS TERM SHEET IS NOT AN OFFER TO SELL THESE SECURITIES AND IT IS NOT A SOLICITATION OF AN OFFER TO BUY THESE SECURITIES IN ANY JURISDICTION WHERE THE OFFER OR SALE IS NOT PERMITTED.
70
[THIS PAGE INTENTIONALLY LEFT BLANK.]
71
SECURCARE SELF STORAGE PORTFOLIO

THE INFORMATION IN THIS STRUCTURAL AND COLLATERAL TERM SHEET IS NOT COMPLETE AND MAY BE AMENDED PRIOR TO THE TIME OF SALE. THIS TERM SHEET IS NOT AN OFFER TO SELL THESE SECURITIES AND IT IS NOT A SOLICITATION OF AN OFFER TO BUY THESE SECURITIES IN ANY JURISDICTION WHERE THE OFFER OR SALE IS NOT PERMITTED.
72
SECURCARE SELF STORAGE PORTFOLIO

THE INFORMATION IN THIS STRUCTURAL AND COLLATERAL TERM SHEET IS NOT COMPLETE AND MAY BE AMENDED PRIOR TO THE TIME OF SALE. THIS TERM SHEET IS NOT AN OFFER TO SELL THESE SECURITIES AND IT IS NOT A SOLICITATION OF AN OFFER TO BUY THESE SECURITIES IN ANY JURISDICTION WHERE THE OFFER OR SALE IS NOT PERMITTED.
73
| No. 6 – SecurCare Self Storage Portfolio |
| Loan Information | ||||||
| Mortgage Loan Seller: | Wells Fargo Bank, National Association | |||||
Credit Assessment | NR/NR/NR | |||||
| (Fitch/KBRA/Moody’s): | ||||||
Original Principal Balance: | $41,104,000 | |||||
Cut-off Date Principal Balance: | $41,104,000 | |||||
% of Initial Pool Balance: | 3.7% | |||||
Loan Purpose: | Refinance | |||||
SecurCare Properties II R, LLC; | ||||||
| Borrower Names: | SecurCare Value Properties R, LLC; | |||||
| Oklahoma Self Storage, LP | ||||||
Sponsors: | NSA OP, LP; Arlen Nordhagen | |||||
Mortgage Rate: | 4.600% | |||||
Note Date: | June 10, 2013 | |||||
Anticipated Repayment Date: | NAP | |||||
Maturity Date: | July 1, 2023 | |||||
IO Period: | 24 months | |||||
Loan Term (Original): | 120 months | |||||
Seasoning: | 1 month | |||||
Amortization Term (Original): | 300 months | |||||
Loan Amortization Type: | Interest-only, Amortizing Balloon | |||||
Interest Accrual Method: | Actual/360 | |||||
Call Protection: | L(25),D(91),O(4) | |||||
Lockbox Type: | Soft/Springing Cash Management | |||||
Additional Debt: | None | |||||
Additional Debt Type: | NAP | |||||
Escrows and Reserves(1):
| ||||||
| Type: | Initial | Monthly | Cap (If Any) | |||
Taxes | $243,251 | $46,319 | NAP | |||
Insurance | $0 | Springing | NAP | |||
Replacement Reserves | $0 | $17,344 | $624,372 | |||
Deferred Maintenance | $333,873 | $0 | NAP | |||
| Property Information | ||
| Single Asset/Portfolio: | Portfolio | |
Property Type: | Self Storage | |
Specific Property Type: | Self Storage | |
Location: | Various – See Table | |
Size: | 1,040,619 SF | |
| Cut-off Date Principal | ||
| Balance Per SF: | $39.50 | |
Year Built/Renovated: | Various – See Table | |
Title Vesting: | Fee | |
Property Manager: | Self-managed | |
3rdMost Recent Occupancy (As of): | 81.8% (12/31/2010) | |
2ndMost Recent Occupancy (As of): | 82.7% (12/31/2011) | |
Most Recent Occupancy (As of): | 85.0% (12/31/2012) | |
Current Occupancy (As of): | 83.1% (5/6/2013) | |
Underwriting and Financial Information: | ||
3rdMost Recent NOI (As of): | $3,882,281 (12/31/2011) | |
2ndMost Recent NOI (As of): | $4,125,201 (12/31/2012) | |
Most Recent NOI (As of): | $4,233,814 (TTM 3/31/2013) | |
U/W Revenues: | $7,126,954 | |
U/W Expenses: | $2,929,159 | |
U/W NOI: | $4,197,795 | |
U/W NCF: | $3,989,671 | |
U/W NOI DSCR: | 1.52x | |
U/W NCF DSCR: | 1.44x | |
U/W NOI Debt Yield: | 10.2% | |
U/W NCF Debt Yield: | 9.7% | |
As-Is Appraised Value(2): | $56,000,000 | |
As-Is Appraisal Valuation Date(2): | May 10, 2013 | |
Cut-off Date LTV Ratio: | 73.4% | |
LTV Ratio at Maturity or ARD: | 58.7% | |
| (1) | See “Escrows” section. |
| (2) | See “Appraisal” section. |
The Mortgage Loan. The mortgage loan (the “SecurCare Self Storage Portfolio Mortgage Loan”) is evidenced by a single promissory note that is secured by a first mortgage encumbering 24 self storage properties located in seven states (the “SecurCare Self Storage Portfolio Properties”). The SecurCare Self Storage Portfolio Mortgage Loan was originated on June 10, 2013 by Wells Fargo Bank, National Association. The SecurCare Self Storage Portfolio Mortgage Loan had an original principal balance of $41,104,000, has an outstanding principal balance as of the Cut-off Date of $41,104,000 and accrues interest at an interest rate of 4.600% per annum. The SecurCare Self Storage Portfolio Mortgage Loan had an initial term of 120 months, has a remaining term of 119 months as of the Cut-off Date and requires interest-only payments for the first 24 payments following origination and thereafter requires payments of principal and interest based on a 25-year amortization schedule. The SecurCare Self Storage Portfolio Mortgage Loan matures on July 1, 2023.
Following the lockout period, the borrowers have the right to defease the SecurCare Self Storage Portfolio Mortgage Loan in whole, but not in part, on any day before April 1, 2023. In addition, the SecurCare Self Storage Portfolio Mortgage Loan is prepayable without penalty on or after April 1, 2023.
THE INFORMATION IN THIS STRUCTURAL AND COLLATERAL TERM SHEET IS NOT COMPLETE AND MAY BE AMENDED PRIOR TO THE TIME OF SALE. THIS TERM SHEET IS NOT AN OFFER TO SELL THESE SECURITIES AND IT IS NOT A SOLICITATION OF AN OFFER TO BUY THESE SECURITIES IN ANY JURISDICTION WHERE THE OFFER OR SALE IS NOT PERMITTED.
74
SECURCARE SELF STORAGE PORTFOLIO
Sources and Uses
Sources | Uses | |||||||||||||||
Original loan amount | $41,104,000 | 79.7 | % | Loan payoff | $28,205,826 | 54.7% | ||||||||||
Sponsor’s new cash contribution(1) | 10,497,982 | 20.3 | Reserves | 577,124 | 1.1 | |||||||||||
Closing costs | 519,032 | 1.0 | ||||||||||||||
Previous partner buy-out | 22,300,000 | 43.2 | ||||||||||||||
Total Sources | $51,601,982 | 100.0 | % | Total Uses | $51,601,982 | 100.0% |
| (1) | The sponsor’s new cash contribution is the result of a return of equity from the refinance of the Northwest Self Storage Portfolio, a mortgage loan that is also included in the WFRBS 2013–C15 securitization. |
The Properties. The SecurCare Self Storage Portfolio Mortgage Loan is secured by the fee interests in 24 self storage properties totaling 1,040,619 rentable square feet and located in seven states: Texas (11), Georgia (3), North Carolina (3), Oklahoma (3), Mississippi (2), California (1) and Colorado (1). No property consists of more than 10.5% of the Allocated Cut-off Date Principal Balance of the SecurCare Self Storage Portfolio Mortgage Loan and no property consists of more than 13.2% of the Underwritten Net Cash Flow. The SecurCare Self Storage Portfolio Properties range in size from 21,710 square feet to 132,895 square feet and as of May 6, 2013, the SecurCare Self Storage Portfolio Properties were 83.1% occupied.
The following table presents certain information relating to the SecurCare Self Storage Portfolio Properties:
| Property Name – Location | Allocated Cut-off Date Principal Balance | % of Portfolio Cut-off Date Principal Balance | Occupancy | Year Built/ | Net Rentable Area (SF) | Appraised Value(1) | ||||||||||||||||||
526 McArthur Road – Fayetteville, NC | $4,333,000 | 10.5% | 80.8% | 1973/NAP | 107,346 | $5,470,000 | ||||||||||||||||||
4360 South Mingo Road – Tulsa, OK | $3,961,000 | 9.6% | 68.7% | 1980/NAP | 132,895 | $5,000,000 | ||||||||||||||||||
9135 South Sheridan Road – Tulsa, OK | $3,565,000 | 8.7% | 99.3% | 1995/NAP | 65,550 | $4,500,000 | ||||||||||||||||||
5311 Apex Highway – Durham, NC | $3,090,000 | 7.5% | 96.6% | 1982/1992 | 45,590 | $3,900,000 | ||||||||||||||||||
6834 South Trenton Avenue – Tulsa, OK | $2,812,000 | 6.8% | 86.1% | 1994/NAP | 60,150 | $3,550,000 | ||||||||||||||||||
13870 Indian Street – Moreno Valley, CA | $2,638,000 | 6.4% | 76.5% | 2003/NAP | 57,360 | $3,330,000 | ||||||||||||||||||
4729 Astrozon Boulevard – Colorado Springs, CO | $2,218,000 | 5.4% | 84.8% | 1986/NAP | 50,145 | $2,800,000 | ||||||||||||||||||
1010 North Loop 250 West – Midland, TX | $2,218,000 | 5.4% | 94.1% | 1978/NAP | 42,528 | $2,800,000 | ||||||||||||||||||
8457–D Roswell Road – Sandy Springs, GA | $1,941,000 | 4.7% | 68.2% | 1979/NAP | 59,202 | $2,450,000 | ||||||||||||||||||
426 South College Road – Wilmington, NC | $1,545,000 | 3.8% | 92.2% | 1982/NAP | 26,201 | $1,950,000 | ||||||||||||||||||
914 North Belt Line Road – Grand Prairie, TX | $1,252,000 | 3.0% | 91.7% | 1973/NAP | 27,832 | $1,580,000 | ||||||||||||||||||
3654 West Pioneer Parkway – Pantego, TX | $1,236,000 | 3.0% | 82.3% | 1972/NAP | 33,980 | $1,560,000 | ||||||||||||||||||
3120 Knickerbocker Road – San Angelo, TX | $1,085,000 | 2.6% | 87.2% | 1971/NAP | 43,520 | $1,370,000 | ||||||||||||||||||
1311 Northwest Loop 281 – Longview, TX | $1,077,000 | 2.6% | 85.5% | 1974/NAP | 29,020 | $1,360,000 | ||||||||||||||||||
108 Gilmer Road – Longview, TX | $1,046,000 | 2.5% | 80.8% | 1979/NAP | 36,620 | $1,320,000 | ||||||||||||||||||
2316 Highway 19 North – Meridian, MS | $1,030,000 | 2.5% | 90.4% | 1977/NAP | 27,880 | $1,300,000 | ||||||||||||||||||
3415 Highway 45 North – Meridian, MS | $1,030,000 | 2.5% | 86.2% | 1975/NAP | 25,080 | $1,300,000 | ||||||||||||||||||
218 Eisenhower Drive – Savannah, GA | $1,030,000 | 2.5% | 97.1% | 1976/NAP | 21,716 | $1,300,000 | ||||||||||||||||||
4155 Milgen Road – Columbus, GA | $832,000 | 2.0% | 90.3% | 1977/NAP | 24,624 | $1,050,000 | ||||||||||||||||||
3233 East Highway 80 – Odessa, TX | $753,000 | 1.8% | 95.3% | 1978/NAP | 22,450 | $950,000 | ||||||||||||||||||
3814 West Amarillo Boulevard – Amarillo, TX | $701,000 | 1.7% | 83.2% | 1983/NAP | 32,160 | $885,000 | ||||||||||||||||||
4000 Interstate 40 East – Amarillo, TX | $697,000 | 1.7% | 87.3% | 1976/2013 | 21,710 | $880,000 | ||||||||||||||||||
1005 West Cotton Street – Longview, TX | $570,000 | 1.4% | 67.1% | 1972/NAP | 24,000 | $720,000 | ||||||||||||||||||
831 North Forest Street – Amarillo, TX | $444,000 | 1.1% | 67.4% | 1973/NAP | 23,060 | $560,000 | ||||||||||||||||||
Total/Weighted Average | $41,104,000 | 100.0% | 83.1% | 1,040,619 | $51,885,000 | |||||||||||||||||||
| (1) | Although the summation of the individual appraised values is $51,885,000, the appraiser concluded that the aggregate value of the portfolio as a whole is $56,000,000. See “Appraisal” section for more details. |
THE INFORMATION IN THIS STRUCTURAL AND COLLATERAL TERM SHEET IS NOT COMPLETE AND MAY BE AMENDED PRIOR TO THE TIME OF SALE. THIS TERM SHEET IS NOT AN OFFER TO SELL THESE SECURITIES AND IT IS NOT A SOLICITATION OF AN OFFER TO BUY THESE SECURITIES IN ANY JURISDICTION WHERE THE OFFER OR SALE IS NOT PERMITTED.
75
SECURCARE SELF STORAGE PORTFOLIO
The following table presents historical occupancy percentages at the SecurCare Self Storage Portfolio Properties:
Historical Occupancy(1)
| 12/31/2010 | 12/31/2011 | 12/31/2012 | 5/6/2013 | |||
81.8% | 82.7% | 85.0% | 83.1% | |||
(1) Information obtained from the borrowers. | ||||||
Operating History and Underwritten Net Cash Flow. The following table presents certain information relating to the historical operating performance and the Underwritten Net Cash Flow at the SecurCare Self Storage Portfolio Properties:
Cash Flow Analysis
| 2011 | 2012 | TTM 3/31/2013 | U/W | U/W $ per SF | ||||||||||||||||||
Base Rent | $6,773,260 | $7,021,317 | $6,522,270 | $6,949,868 | $6.68 | |||||||||||||||||
Grossed Up Vacant Space | 0 | 0 | 0 | 1,371,264 | 1.32 | |||||||||||||||||
Less Concessions | (733,646) | (574,265) | 0 | (694,977) | (0.67) | |||||||||||||||||
Other Income | 526,518 | 559,939 | 614,669 | 765,391 | 0.74 | |||||||||||||||||
Less Vacancy & Credit Loss | 0 | 0 | 0 | (1,264,592)(1) | (1.22) | |||||||||||||||||
|
|
|
|
|
|
|
|
|
| |||||||||||||
Effective Gross Income | $6,566,132 | $7,006,991 | $7,136,939 | $7,126,954 | $6.85 | |||||||||||||||||
Total Operating Expenses | $2,683,851 | $2,881,790 | $2,903,125 | $2,929,159 | $2.81 | |||||||||||||||||
|
|
|
|
|
|
|
|
|
| |||||||||||||
Net Operating Income | $3,882,281 | $4,125,201 | $4,233,814 | $4,197,795 | $4.03 | |||||||||||||||||
TI/LC | 0 | 0 | 0 | 0 | 0.00 | |||||||||||||||||
Capital Expenditures | 0 | 0 | 0 | 208,124 | 0.20 | |||||||||||||||||
|
|
|
|
|
|
|
|
|
| |||||||||||||
Net Cash Flow | $3,882,281 | $4,125,201 | $4,233,814 | $3,989,671 | $3.83 | |||||||||||||||||
NOI DSCR | 1.40x | 1.49x | 1.53x | 1.52x | ||||||||||||||||||
NCF DSCR | 1.40x | 1.49x | 1.53x | 1.44x | ||||||||||||||||||
NOI DY | 9.4% | 10.0% | 10.3% | 10.2% | ||||||||||||||||||
NCF DY | 9.4% | 10.0% | 10.3% | 9.7% | ||||||||||||||||||
(1) The underwritten economic vacancy is 15.2%. The SecurCare Self Storage Portfolio Properties were 83.1% physically occupied as of May 6, 2013. | ||||||||||||||||||||||
Appraisal. As of the appraisal valuation dates ranging from May 1, 2013 to May 8, 2013 the SecurCare Self Storage Portfolio Properties had an aggregate “as-is” appraised value of $51,885,000. However, the appraiser assumed a portfolio premium due to the SecurCare Self Storage Portfolio Properties covering a wide variety of areas and regions as well as a scarcity of available self storage portfolios, which would increase investor demand if marketed as a portfolio and determined a portfolio “as-is” appraised value of $56,000,000.
Environmental Matters. According to the Phase I environmental site assessments dated from March 8, 2013 through April 5, 2013, recognized environmental conditions (“REC”) were identified at three of the SecurCare Self Storage Portfolio Properties. A former gasoline service station and a tire station were located immediately southeast of the 4360 South Mingo Road property and an auto body and paint facility were located immediately east of the 4360 South Mingo Road property. A Phase II investigation was performed to address the potential of polluted soil and/or ground water at the 4360 South Mingo Road property. The result of a Phase II environmental site assessment dated May 28, 2013 recommended no further action. An REC was identified at the 3120 Knickerbocker Road property due to a dry-cleaner located immediately south of the 3120 Knickerbocker Road property. The Phase I site assessment recommended a sub-surface Phase II investigation and a Phase II environmental assessment dated May 24, 2013 recommended no further investigation. An REC was identified at the 4000 Interstate 40 East property due to a chemical storage area located immediately south of the 4000 Interstate 40 East property. The Phase I site assessment recommended a sub-surface Phase II investigation and a Phase II environmental assessment dated May 24, 2013 recommended no further action.
According to Phase I environmental assessments dated March 8, 2013 through April 5, 2013, there were no evidence of any RECs at the remaining SecurCare Self Storage Portfolio Properties.
The Borrowers. The borrowers are comprised of two separate limited liability companies and one limited partnership, each of which is a single purpose entity and has an independent director. Legal counsel to the borrowers delivered a non-consolidation opinion in connection with the origination of the SecurCare Self Storage Portfolio Mortgage Loan. NSA OP, LP and Arlen Nordhagen are the guarantors of certain nonrecourse carveouts under the SecurCare Self Storage Portfolio Mortgage Loan.
The Sponsors. The sponsors are NSA OP, LP (“NSA”) and Arlen Nordhagen. NSA is a private upREIT that is the managing member and sole owner of the two separate limited liability companies and one limited partnership that consist of the borrowers. NSA will allocate operating partnership units in exchange for the borrowers’ interest in the properties. NSA was formed via the contributions of self storage assets from three self storage operators: SecurCare Self Storage, Northwest Self Storage and Optivest Properties. Arlen Nordhagen is the President of SecurCare Self Storage and also serves as the CEO of NSA. Mr. Nordhagen was one of the founders of SecurCare in 1988 and SecurCare currently operates 140 self storage facilities in 11 states. In 2011, Mr. Nordhagen was involved in a discounted pay-off of a loan secured by a self storage property located at 13870 Indian Street, Morena Valley, California. The 13870 Indian Street property is included in the SecurCare Self Storage Portfolio Properties.
THE INFORMATION IN THIS STRUCTURAL AND COLLATERAL TERM SHEET IS NOT COMPLETE AND MAY BE AMENDED PRIOR TO THE TIME OF SALE. THIS TERM SHEET IS NOT AN OFFER TO SELL THESE SECURITIES AND IT IS NOT A SOLICITATION OF AN OFFER TO BUY THESE SECURITIES IN ANY JURISDICTION WHERE THE OFFER OR SALE IS NOT PERMITTED.
76
SECURCARE SELF STORAGE PORTFOLIO
Escrows. The loan documents provide for upfront escrows in the amount of $243,251 for real estate taxes and $333,873 for deferred maintenance. The loan documents provide for ongoing monthly reserves in the amount of $46,319 for real estate taxes and ongoing monthly deposits of $17,344 for replacement reserves (subject to a cap of $624,372). Ongoing monthly reserves for insurance are not required so as long as (i) no event of default has occurred and is continuing; (ii) the SecurCare Self Storage Portfolio Properties are covered by an acceptable blanket policy; and (iii) the borrowers provide the lender with evidence of renewal of the policies and proof of payment of the insurance premiums when due.
Lockbox and Cash Management. The SecurCare Self Storage Portfolio Mortgage Loan requires a lender-controlled lockbox account, which is already in place, and that the borrowers direct the property managers to deliver all rents with respect to the SecurCare Self Storage Portfolio Properties directly into the lockbox account. The loan documents also require that all revenues received by the borrowers or the property managers be deposited into the lockbox account within one business day of receipt. Other than during a Cash Trap Event Period (as defined below), all funds on deposit are disbursed to the borrowers.
A “Cash Trap Event Period” will commence upon the earlier of (i) the occurrence and continuance of an event of default; (ii) the debt service coverage ratio for the trailing 12-month period falling below 1.25x at the end of any calendar quarter; and (iii) the debt yield being less than 8.75% at the end of any calendar quarter. A Cash Trap Event Period will expire, with regard to circumstances in clause (i), upon the cure of such event of default; with regards to circumstances in clause (ii) the debt service coverage ratio is equal to or greater than 1.30x for two consecutive calendar quarters (provided that an event of default has not occurred and is continuing and a Cash Trap Event Period has not occurred and is continuing pursuant to clause (iii)); with regards to circumstances in clause (iii) the debt yield is equal to or greater than 9.0% for two consecutive quarters (provided that an event of default has not occurred and is continuing and a Cash Trap Event Period has not occurred and is continuing pursuant to clause (ii)).
Property Management. The SecurCare Self Storage Portfolio Properties are managed by an affiliate of the borrowers.
Assumption. The borrowers have the right to transfer the SecurCare Self Storage Portfolio Properties, provided that no event of default has occurred and is continuing and certain other conditions are satisfied, including (i) the lender’s reasonable determination that the proposed transferee and guarantor satisfy the lender’s credit review and underwriting standards, taking into consideration transferee experience, financial strength and general business standing; (ii) execution of a recourse guaranty and an environmental indemnity by an affiliate of the transferee; and (iii) if requested by the lender, rating agency confirmation from Fitch, KBRA and Moody’s that the transfer will not result in a downgrade, withdrawal or qualification of the respective ratings assigned to the Series 2013-C15 Certificates.
Partial Release. Not permitted.
Real Estate Substitution. Not permitted.
Subordinate and Mezzanine Indebtedness. Not permitted.
Ground Lease. None.
Terrorism Insurance. The loan documents require that the “all risk” insurance policy required to be maintained by the borrowers provide coverage for terrorism in an amount equal to the full replacement cost of the SecurCare Self Storage Portfolio Properties; provided that the borrowers will not be required to spend more than 200% of the cost of a stand-alone policy for terrorism insurance immediately prior to the date that TRIPRA or a similar government backstop is no longer in effect. The loan documents also require business interruption insurance covering no less than the 18-month period following the occurrence of a casualty event, together with a six-month extended period of indemnity.
THE INFORMATION IN THIS STRUCTURAL AND COLLATERAL TERM SHEET IS NOT COMPLETE AND MAY BE AMENDED PRIOR TO THE TIME OF SALE. THIS TERM SHEET IS NOT AN OFFER TO SELL THESE SECURITIES AND IT IS NOT A SOLICITATION OF AN OFFER TO BUY THESE SECURITIES IN ANY JURISDICTION WHERE THE OFFER OR SALE IS NOT PERMITTED.
77
SUNRISE TECHNOLOGY PARK

THE INFORMATION IN THIS STRUCTURAL AND COLLATERAL TERM SHEET IS NOT COMPLETE AND MAY BE AMENDED PRIOR TO THE TIME OF SALE. THIS TERM SHEET IS NOT AN OFFER TO SELL THESE SECURITIES AND IT IS NOT A SOLICITATION OF AN OFFER TO BUY THESE SECURITIES IN ANY JURISDICTION WHERE THE OFFER OR SALE IS NOT PERMITTED.
78
SUNRISE TECHNOLOGY PARK
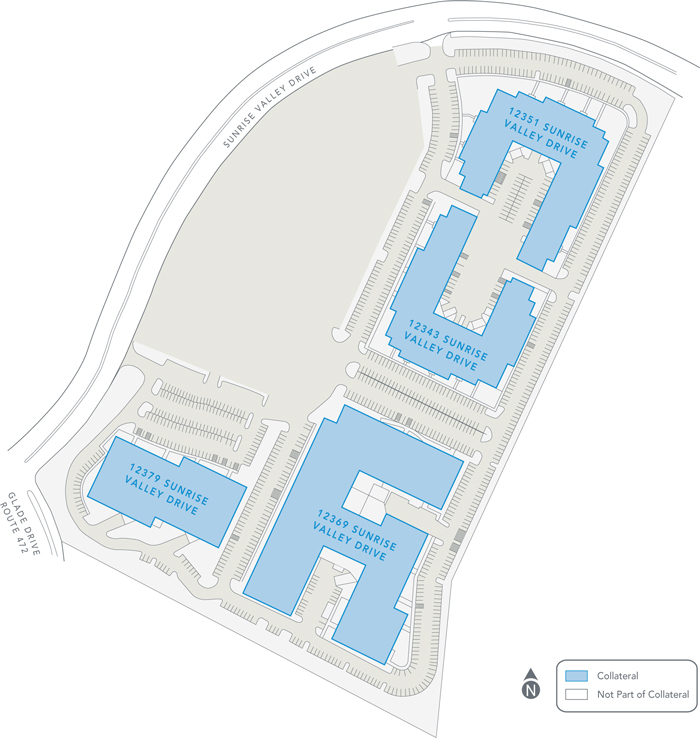
THE INFORMATION IN THIS STRUCTURAL AND COLLATERAL TERM SHEET IS NOT COMPLETE AND MAY BE AMENDED PRIOR TO THE TIME OF SALE. THIS TERM SHEET IS NOT AN OFFER TO SELL THESE SECURITIES AND IT IS NOT A SOLICITATION OF AN OFFER TO BUY THESE SECURITIES IN ANY JURISDICTION WHERE THE OFFER OR SALE IS NOT PERMITTED.
79
SUNRISE TECHNOLOGY PARK
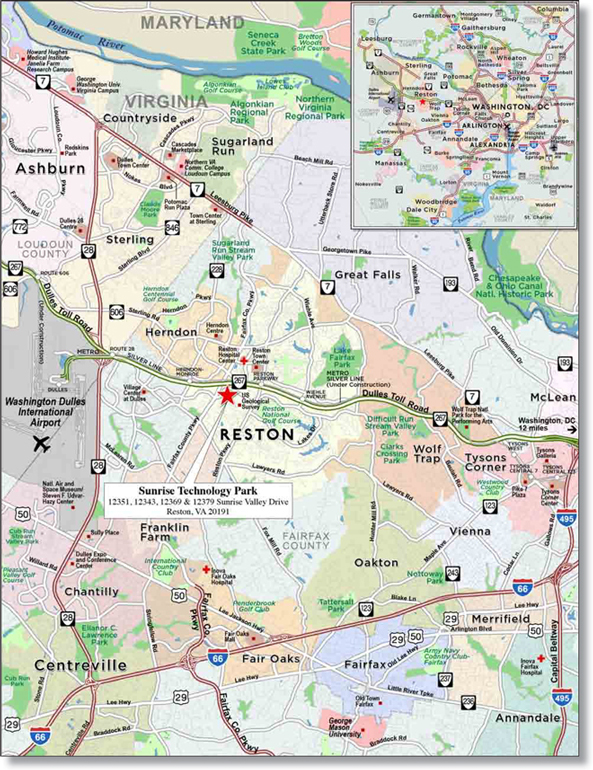
THE INFORMATION IN THIS STRUCTURAL AND COLLATERAL TERM SHEET IS NOT COMPLETE AND MAY BE AMENDED PRIOR TO THE TIME OF SALE. THIS TERM SHEET IS NOT AN OFFER TO SELL THESE SECURITIES AND IT IS NOT A SOLICITATION OF AN OFFER TO BUY THESE SECURITIES IN ANY JURISDICTION WHERE THE OFFER OR SALE IS NOT PERMITTED.
80
| No. 7 – Sunrise Technology Park |
| Loan Information | ||
Mortgage Loan Seller: |
The Royal Bank of Scotland | |
Credit Assessment (Fitch/KBRA/Moody’s): | NR/NR/NR | |
Original Principal Balance: |
$40,430,000 | |
Cut-off Date Principal Balance: |
$40,430,000 | |
% of Initial Pool Balance: |
3.7% | |
| Loan Purpose: | Refinance | |
| Borrower Name: | Sunrise Tech Park Co. LLC | |
Sponsor: |
TRZ Holdings LLC | |
Mortgage Rate: |
3.700% | |
Note Date: |
June 10, 2013 | |
Anticipated Repayment Date: |
NAP | |
Maturity Date: |
July 1, 2023 | |
IO Period: |
24 months | |
Loan Term (Original): |
120 months | |
Seasoning: |
1 month | |
Amortization Term (Original): |
360 months | |
Loan Amortization Type: |
Interest-only, Amortizing Balloon | |
Interest Accrual Method: |
Actual/360 | |
Call Protection: |
L(25),D(91),O(4) | |
Lockbox Type: |
Hard/Springing Cash Management | |
Additional Debt: |
Yes | |
Additional Debt Type: |
Future Mezzanine | |
Escrows and Reserves(1):
| Type: | Initial | Monthly | Cap (If Any) | |||
Taxes | $368,516 | $46,064 | NAP | |||
Insurance | $0 | Springing | NAP | |||
Replacement Reserves | $0 | $5,259 | $189,347 | |||
TI/LC Reserve | $481,659 | $26,298 | NAP | |||
GSA Space TI/LC Reserve | $500,000 | $0 | NAP | |||
|
| Property Information | ||
Single Asset/Portfolio: |
Single Asset | |
| Property Type: | Office | |
| Specific Property Type: | Suburban | |
Location: |
Reston, VA | |
Size: |
315,579 SF | |
Cut-off Date Principal Balance Per SF: |
$128.11 | |
Year Built/Renovated: |
1985/NAP | |
Title Vesting: |
Fee | |
Property Manager: |
Self-managed | |
3rd Most Recent Occupancy (As of): |
90.0% (12/31/2010) | |
2nd Most Recent Occupancy (As of): |
85.7% (12/31/2011) | |
Most Recent Occupancy (As of): |
88.0% (12/31/2012) | |
Current Occupancy (As of): |
90.4% (4/30/2013) | |
| Underwriting and Financial Information: | ||
| 3rdMost Recent NOI (As of): | $5,061,750 (12/31/2011) | |
2ndMost Recent NOI (As of): |
$4,719,135 (12/31/2012) | |
Most Recent NOI (As of): |
$4,677,451 (TTM 3/31/2013) | |
| U/W Revenues: | $6,135,357 | |
U/W Expenses: |
$1,549,943 | |
U/W NOI: |
$4,585,413 | |
U/W NCF: |
$4,093,849 | |
U/W NOI DSCR: |
2.05x | |
U/W NCF DSCR: |
1.83x | |
U/W NOI Debt Yield: |
11.3% | |
U/W NCF Debt Yield: |
10.1% | |
As-Is Appraised Value: |
$62,200,000 | |
As-Is Appraisal Valuation Date: |
April 17, 2013 | |
Cut-off Date LTV Ratio: |
65.0% | |
LTV Ratio at Maturity or ARD: |
54.3% | |
| ||
(1) See “Escrows” section.
The Mortgage Loan. The mortgage loan (the “Sunrise Technology Park Mortgage Loan”) is evidenced by a single promissory note that is secured by a first mortgage encumbering four adjacent office buildings, located in Reston, Virginia (the “Sunrise Technology Park Property”). The Sunrise Technology Park Mortgage Loan was originated on June 10, 2013 by The Royal Bank of Scotland. The Sunrise Technology Park Mortgage Loan had an original principal balance of $40,430,000, has an outstanding principal balance as of the Cut-off Date of $40,430,000 and accrues interest at an interest rate of 3.700% per annum. The Sunrise Technology Park Mortgage Loan had an initial term of 120 months, has a remaining term of 119 months as of the Cut-off Date and requires interest-only payments for the first 24 payments following origination and thereafter requires payments of principal and interest based on a 30-year amortization schedule. The Sunrise Technology Park Mortgage Loan matures on July 1, 2023.
Following the lockout period, the borrower has the right to defease the Sunrise Technology Park Mortgage Loan in whole, but not in part, on any due date before April 1, 2023. In addition, the Sunrise Technology Park Mortgage Loan is prepayable without penalty on or after April 1, 2023.
Sources and Uses
| Sources | Uses | |||||||||||||||||
Original loan amount | $ | 40,430,000 | 100.0 | % | Loan payoff | $ | 35,649,274 | 88.2 | % | |||||||||
Reserves | 1,350,175 | 3.3 | ||||||||||||||||
Closing costs | 353,040 | 0.9 | ||||||||||||||||
Return of equity | 3,077,511 | 7.6 | ||||||||||||||||
Total Sources | $ | 40,430,000 | 100.0 | % | Total Uses | $ | 40,430,000 | 100.0 | % |
THE INFORMATION IN THIS STRUCTURAL AND COLLATERAL TERM SHEET IS NOT COMPLETE AND MAY BE AMENDED PRIOR TO THE TIME OF SALE. THIS TERM SHEET IS NOT AN OFFER TO SELL THESE SECURITIES AND IT IS NOT A SOLICITATION OF AN OFFER TO BUY THESE SECURITIES IN ANY JURISDICTION WHERE THE OFFER OR SALE IS NOT PERMITTED.
81
SUNRISE TECHNOLOGY PARK
The Property. The Sunrise Technology Park Property consists of three, one-story and one, two-story class B office buildings located in Reston, Virginia. The Sunrise Technology Park Property was built in 1985 on 21.7 acres of land and contains 315,579 rentable square feet. The Sunrise Technology Park Property was originally constructed as an office flex property, which allows tenants the ability to build out their space with office and warehouse space per their specifications. The Sunrise Technology Park Property is comprised of 246,376 square feet of office space and 69,203 square feet of data center space. As of April 30, 2013, the Sunrise Technology Park Property was 90.4% leased to a mix of 14 separate government, technology, healthcare and professional service tenants.
The following table presents certain information relating to the tenancies at the Sunrise Technology Park Property:
Major Tenants
| Tenant Name | Credit Rating (Fitch/ Moody’s/ S&P) (1) | Tenant NRSF | % of NRSF | Annual U/W Base Rent PSF(2) | Annual U/W Base Rent(2) | % of Total Annual U/W Base Rent | Lease Expiration Date | |||||||||||||||||
Major Tenants | ||||||||||||||||||||||||
ValueOptions | NR/NR/NR | 61,229 | 19.4% | $15.29 | $936,337 | 18.2% | 6/30/2017 | |||||||||||||||||
United States of America | AAA/Aaa/AA+ | 30,139 | 9.6% | $26.56 | $800,492 | 15.5% | 4/9/2018 | |||||||||||||||||
Verizon Business Services | A/A3/A- | 32,189 | 10.2% | $23.00 | $740,347 | 14.4% | 2/28/2019 | |||||||||||||||||
Government Scientific Source | NR/NR/NR | 36,585 | 11.6% | $14.69 | $537,434 | 10.4% | 10/11/2014 | |||||||||||||||||
Level 3 Communications | NR/NR/NR | 16,391 | 5.2% | $30.00 | $491,730 | 9.5% | 12/31/2017 | |||||||||||||||||
Carahsoft Technology Corp | NR/NR/NR | 32,671 | 10.4% | $13.91 | $454,454 | 8.8% | 5/31/2016 | |||||||||||||||||
MCI Metro Access Transmission | B-/Caa2/B | 16,739 | 5.3% | $21.00 | $351,519 | 6.8% | 2/28/2015 | |||||||||||||||||
Rincon Technology | NR/NR/NR | 13,954 | 4.4% | $12.36 | $172,471 | 3.3% | 3/20/2018 | |||||||||||||||||
Comcast of Virginia | BBB+/A3/A- | 11,116 | 3.5% | $15.30 | $170,075 | 3.3% | 12/31/2014 | |||||||||||||||||
|
|
|
| |||||||||||||||||||||
Total Major Tenants | 251,013 | 79.5% | $18.54 | $4,654,859 | 90.2% | |||||||||||||||||||
Non-Major Tenants | 34,278 | 10.9% | $14.69 | $503,433 | 9.8% | |||||||||||||||||||
|
|
|
| |||||||||||||||||||||
Occupied Collateral | 285,291 | 90.4% | $18.08 | $5,158,292 | 100.0% | |||||||||||||||||||
|
| |||||||||||||||||||||||
Vacant Space | 30,288 | 9.6% | ||||||||||||||||||||||
|
| |||||||||||||||||||||||
Collateral Total | 315,579 | 100.0% | ||||||||||||||||||||||
|
| |||||||||||||||||||||||
| ||||||||||||||||||||||||
(1) Certain ratings are those of the parent company whether or not the parent guarantees the lease. (2) Annual U/W Base Rent and Annual U/W Base Rent PSF includes contractual rent steps through December 2013. | ||||||||||||||||||||||||
The following tables present certain information relating to the lease rollover schedule at the Sunrise Technology Park Property:
Lease Expiration Schedule(1)(2)
| Year Ending December 31, | No. of Leases Expiring | Expiring NRSF | % of Total NRSF | Cumulative of Total NRSF | Cumulative % of Total NRSF | Annual U/W Base Rent | Annual U/W Base Rent PSF(3) | |||||||||||||||||
MTM | 0 | 0 | 0.0% | 0 | 0.0% | $0 | $0.00 | |||||||||||||||||
2013 | 0 | 0 | 0.0% | 0 | 0.0% | $0 | $0.00 | |||||||||||||||||
2014 | 2 | 47,701 | 15.1% | 47,701 | 15.1% | $707,508 | $14.83 | |||||||||||||||||
2015 | 2 | 26,112 | 8.3% | 73,813 | 23.4% | $625,783 | $23.97 | |||||||||||||||||
2016 | 2 | 40,130 | 12.7% | 113,943 | 36.1% | $551,421 | $13.74 | |||||||||||||||||
2017 | 2 | 77,968 | 24.7% | 191,911 | 60.8% | $1,287,856 | $16.52 | |||||||||||||||||
2018 | 2 | 44,093 | 14.0% | 236,004 | 74.8% | $972,963 | $22.07 | |||||||||||||||||
2019 | 2 | 37,640 | 11.9% | 273,644 | 86.7% | $828,544 | $22.01 | |||||||||||||||||
2020 | 0 | 0 | 0.0% | 273,644 | 86.7% | $0 | $0.00 | |||||||||||||||||
2021 | 0 | 0 | 0.0% | 273,644 | 86.7% | $0 | $0.00 | |||||||||||||||||
2022 | 1 | 3,884 | 1.2% | 277,528 | 87.9% | $60,008 | $15.45 | |||||||||||||||||
2023 | 1 | 7,763 | 2.5% | 285,291 | 90.4% | $124,208 | $16.00 | |||||||||||||||||
Thereafter | 0 | 0 | 0.0% | 285,291 | 90.4% | $0 | $0.00 | |||||||||||||||||
Vacant | 0 | 30,288 | 9.6% | 315,579 | 100.0% | $0 | $0.00 | |||||||||||||||||
Total / Weighted | 14 | 315,579 | 100.0% | $5,158,292 | $18.08 | |||||||||||||||||||
(1) Information obtained from the underwritten rent roll. (2) Certain tenants may have lease termination options that are exercisable prior to the stated expiration date of the subject lease and that are not considered in the Lease Expiration Schedule. (3) Weighted Average Annual U/W Base Rent PSF excludes vacant space. | ||||||||||||||||||||||||
THE INFORMATION IN THIS STRUCTURAL AND COLLATERAL TERM SHEET IS NOT COMPLETE AND MAY BE AMENDED PRIOR TO THE TIME OF SALE. THIS TERM SHEET IS NOT AN OFFER TO SELL THESE SECURITIES AND IT IS NOT A SOLICITATION OF AN OFFER TO BUY THESE SECURITIES IN ANY JURISDICTION WHERE THE OFFER OR SALE IS NOT PERMITTED.
82
SUNRISE TECHNOLOGY PARK
The following table presents historical occupancy percentages at the Sunrise Technology Park Property:
Historical Occupancy(1)
| 12/31/2010 | 12/31/2011 | 12/31/2012 | 4/30/2013 | |||
90.0% | 85.7% | 88.0% | 90.4% | |||
(1) Information obtained from the underwritten rent roll. | ||||||
Operating History and Underwritten Net Cash Flow. The following table presents certain information relating to the Underwritten Net Cash Flow at the Sunrise Technology Park Property:
Cash Flow Analysis
| 2011 | 2012 | TTM 3/31/2013 | U/W | U/W $ per SF | ||||||||||||||||
Base Rent | $4,884,178 | $4,922,997 | $4,842,957 | $5,158,292 | $16.35 | |||||||||||||||
Grossed Up Vacant Space | 0 | 0 | 0 | 567,294 | 1.80 | |||||||||||||||
Total Reimbursables | 1,138,634 | 1,226,883 | 1,288,433 | 1,263,770 | 4.00 | |||||||||||||||
Other Income | 525,487 | 46,782 | 43,558 | 43,558 | 0.14 | |||||||||||||||
Less Vacancy & Credit Loss | (71,843) | 1,071 | (655) | (897,557)(1) | (2.84) | |||||||||||||||
|
|
|
|
|
|
|
|
| ||||||||||||
Effective Gross Income | $6,476,456 | $6,197,733 | $6,174,293 | $6,135,357 | $19.44 | |||||||||||||||
Total Operating Expenses | $1,414,706 | $1,478,598 | $1,496,842 | $1,549,943 | $4.91 | |||||||||||||||
|
|
|
|
|
|
|
|
| ||||||||||||
Net Operating Income | $5,061,750 | $4,719,135 | $4,677,451 | $4,585,413 | $14.53 | |||||||||||||||
TI/LC | 0 | 0 | 0 | 428,449 | 1.36 | |||||||||||||||
Capital Expenditures | 0 | 0 | 0 | 63,116 | 0.20 | |||||||||||||||
|
|
|
|
|
|
|
|
| ||||||||||||
Net Cash Flow | $5,061,750 | $4,719,135 | $4,677,451 | $4,093,849 | $12.97 | |||||||||||||||
NOI DSCR | 2.27x | 2.11x | 2.09x | 2.05x | ||||||||||||||||
NCF DSCR | 2.27x | 2.11x | 2.09x | 1.83x | ||||||||||||||||
NOI DY | 12.5% | 11.7% | 11.6% | 11.3% | ||||||||||||||||
NCF DY | 12.5% | 11.7% | 11.6% | 10.1% | ||||||||||||||||
(1) The underwritten economic vacancy is 13.0%. The Sunrise Technology Park Property was 90.4% physically occupied as of April 30, 2013.
Appraisal. As of the appraisal valuation date of April 17, 2013, the Sunrise Technology Park Property had an “as-is” appraised value of $62,200,000.
Environmental Matters. According to the Phase I environmental site assessment dated April 24, 2013, there was no evidence of any recognized environmental conditions, but continued implementation of the existing asbestos operations and maintenance (“O&M”) plan is recommended.
Market Overview and Competition. The Sunrise Technology Park Property is located in Reston, Fairfax County, Virginia approximately 23 miles northwest of the Washington, DC central business district and six miles east of the Washington Dulles International Airport. According to the appraisal, the estimated 2013 population and average household income within a five-mile radius of the Sunrise Technology Park Property are 222,526 and $154,469, respectively. The average unemployment rate in Fairfax County in 2012 was 4.0% compared to the Washington, DC metropolitan statistical area’s unemployment of 5.4%.
According to a third party market research report, the Reston office submarket, contains approximately 4.5 million square feet of class B office space with an overall vacancy rate of 15.8%, as of the first quarter 2013. The overall market rent was $22.52 per square foot, on a triple net basis, as of the first quarter 2013.
Competitive Set(1)
Sunrise | Greenbriar Corporate | Monroe Business Center 4 | Southgate I | Sunset Corporate Plaza 1 | Dulles Business Park | |||||||
Market | Reston, VA | Fairfax, VA | Herndon, VA | Chantilly, VA | Reston, VA | Chantilly, VA | ||||||
Distance from Subject | -- | 5.8 miles | 2.9 miles | 8.7 miles | 3.2 miles | 5.7 miles | ||||||
Property Type | Office | Office | Office | Office | Office | Office | ||||||
Year Built | 1985 | 1986 | 1987 | 2000 | 1985 | 2001 | ||||||
Total GLA | 315,579 SF | 111,722 SF | 23,772 SF | 104,000 SF | 101,000 SF | 163,190 SF | ||||||
Total Occupancy | 90% | 77% | 85% | 85% | 100% | 100% |
| (1) | Information obtained from the appraisal dated April 17, 2013. |
THE INFORMATION IN THIS STRUCTURAL AND COLLATERAL TERM SHEET IS NOT COMPLETE AND MAY BE AMENDED PRIOR TO THE TIME OF SALE. THIS TERM SHEET IS NOT AN OFFER TO SELL THESE SECURITIES AND IT IS NOT A SOLICITATION OF AN OFFER TO BUY THESE SECURITIES IN ANY JURISDICTION WHERE THE OFFER OR SALE IS NOT PERMITTED.
83
SUNRISE TECHNOLOGY PARK
The Borrower. The borrower is Sunrise Tech Park Co. LLC, a Delaware limited liability company and a single purpose entity with two independent directors. Legal counsel to the borrower delivered a non-consolidation opinion in connection with the origination of the Sunrise Technology Park Mortgage Loan. TRZ Holdings LLC is the guarantor of certain nonrecourse carveouts under the Sunrise Technology Park Mortgage Loan.
The Sponsor. The sponsor, TRZ Holdings LLC, is a wholly owned subsidiary of Brookfield (NYSE: BPO), a publicly traded commercial real estate firm with its U.S. headquarters located in New York, New York, and ownership in properties located throughout the U.S., Canada, Australia and the United Kingdom. As of December 31, 2012, Brookfield had total assets of approximately $27.5 billion.
Escrows. The loan documents provide for upfront escrows at closing in the amount of $368,516 for real estate taxes, $481,659 for tenant improvements and leasing commissions and $500,000 for tenant improvements and leasing commissions associated with the United States of America re-leasing their space. The $500,000 reserve is expected to be released to the borrower in the near future since the United States of America executed a lease extension on July 12, 2013. The loan documents also provide for ongoing monthly escrows in the amount of $46,064 for real estate taxes, $5,259 for replacement reserves (subject to a cap of $189,347) and $26,298 for tenant improvements and leasing commissions. No monthly insurance escrow is required so long as the following conditions are met: (i) no event of default has occurred and is continuing; (ii) the insurance required to be maintained by the borrower is effected under an acceptable blanket insurance policy; and (iii) the borrower provides the lender with satisfactory proof of renewal and payment of insurance premiums.
Lockbox and Cash Management. The Sunrise Technology Park Mortgage Loan requires a lender-controlled lockbox account, which is already in place, and that the borrower direct tenants to pay their rents directly to such lockbox account. The loan documents also require that all rents received by the borrower or the property manager be deposited into the lockbox account within two business days after receipt. Prior to the occurrence of a Cash Management Period (as defined below) all funds on deposit in the lockbox account are swept into the borrower’s operating account on a daily basis. During a Cash Management Period, all funds on deposit in the lockbox account are swept on a daily basis to a cash management account under the control of the lender.
A “Cash Management Period” will commence upon either of the following events: (i) the occurrence of an event of default, or (ii) the amortizing debt service coverage ratio falling below 1.10x as of the end of any calendar quarter (or at any time when an approved mezzanine loan (as described below) is outstanding). A Cash Management Period will end with respect to the matters described in clause (i) above, when such event of default has been cured, and with respect to the matters described in clause (ii) above, when (1) an amortizing debt service coverage ratio of at least 1.10x has been achieved for two consecutive calendar quarters or (2) the borrower deposits additional collateral to the lender to achieve a debt service coverage ratio of at least 1.10x.
Property Management. The Sunrise Technology Park Property is managed by an affiliate of the borrower.
Assumption. The borrower has the right to transfer the Sunrise Technology Park Property, provided that no event of default has occurred and is continuing and certain other conditions are satisfied, including: (i) rating agency confirmation from Fitch, KBRA and Moody’s that the transfer will not result in a downgrade, withdrawal or qualification of the respective ratings assigned to the Series 2013-C15 Certificates; and (ii) the lender reasonably determines that the proposed transferee and guarantor satisfy the lender’s credit review and underwriting standards, taking into consideration transferee experience, financial strength and general business standing.
Partial Release. Not permitted.
Real Estate Substitution. Not Permitted.
Subordinate and Mezzanine Indebtedness. The borrower has the right to incur mezzanine financing subject to customary conditions including: (i) no event of default has occurred and is continuing; (ii) the loan-to-value ratio including all debt is not greater than 80.0%; (iii) the amortizing debt service coverage ratio including all debt is not less than 1.15x; (iv) the execution of an intercreditor agreement acceptable to the lender; and (v) receipt of rating agency confirmation from Fitch, KBRA and Moody’s that the mezzanine financing will not result in a downgrade, withdrawal or qualification of the respective ratings assigned to the Series 2013-C15 Certificates.
Ground Lease. None.
Terrorism Insurance. The loan documents require that the “all risk” insurance policy required to be maintained by the borrower provides coverage for damage from terrorism in an amount equal to the full replacement cost of the Sunrise Technology Park Property as well as business interruption insurance covering no less than the 18-month period following the occurrence of a casualty event, together with an extended period of indemnity of six months. The terrorism insurance policy required to be obtained by the borrower may be issued by a captive insurance company wholly-owned and controlled by an affiliate of the borrower.
THE INFORMATION IN THIS STRUCTURAL AND COLLATERAL TERM SHEET IS NOT COMPLETE AND MAY BE AMENDED PRIOR TO THE TIME OF SALE. THIS TERM SHEET IS NOT AN OFFER TO SELL THESE SECURITIES AND IT IS NOT A SOLICITATION OF AN OFFER TO BUY THESE SECURITIES IN ANY JURISDICTION WHERE THE OFFER OR SALE IS NOT PERMITTED.
84
[THIS PAGE INTENTIONALLY LEFT BLANK.]
85
NORTHWEST SELF STORAGE PORTFOLIO
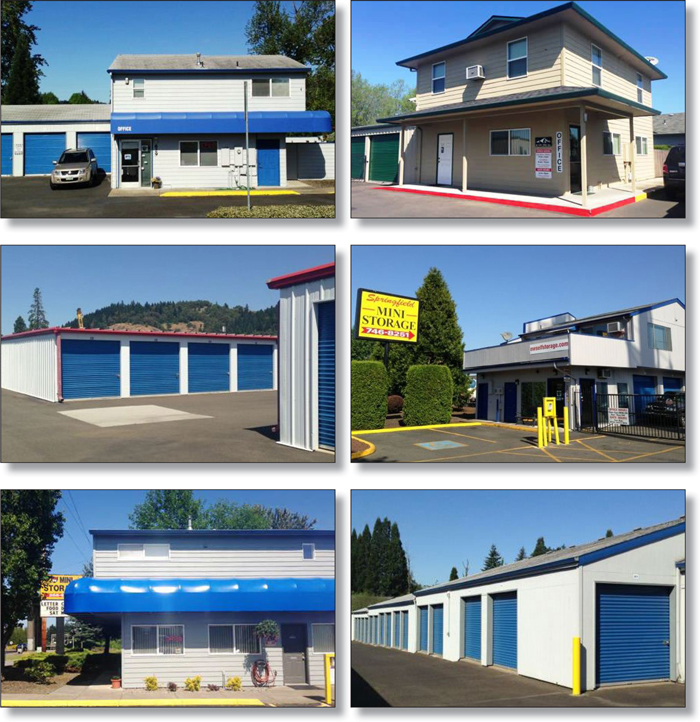
THE INFORMATION IN THIS STRUCTURAL AND COLLATERAL TERM SHEET IS NOT COMPLETE AND MAY BE AMENDED PRIOR TO THE TIME OF SALE. THIS TERM SHEET IS NOT AN OFFER TO SELL THESE SECURITIES AND IT IS NOT A SOLICITATION OF AN OFFER TO BUY THESE SECURITIES IN ANY JURISDICTION WHERE THE OFFER OR SALE IS NOT PERMITTED.
86
NORTHWEST SELF STORAGE PORTFOLIO
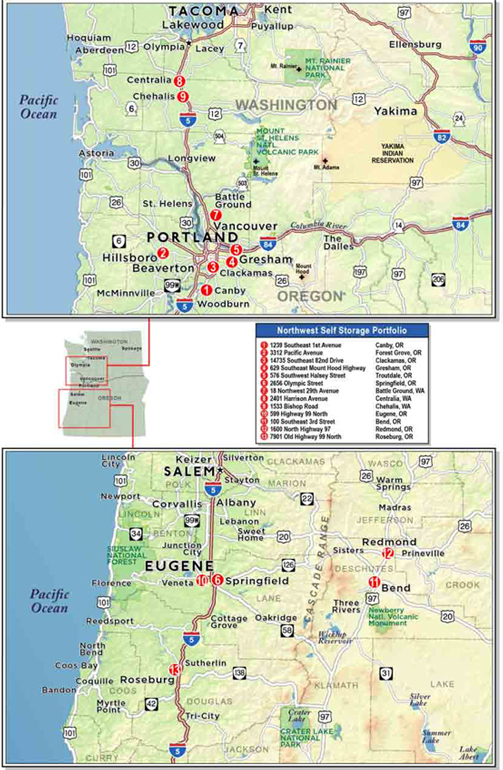
THE INFORMATION IN THIS STRUCTURAL AND COLLATERAL TERM SHEET IS NOT COMPLETE AND MAY BE AMENDED PRIOR TO THE TIME OF SALE. THIS TERM SHEET IS NOT AN OFFER TO SELL THESE SECURITIES AND IT IS NOT A SOLICITATION OF AN OFFER TO BUY THESE SECURITIES IN ANY JURISDICTION WHERE THE OFFER OR SALE IS NOT PERMITTED.
87
| No. 8 – Northwest Self Storage Portfolio |
| Loan Information | ||||||
| Mortgage Loan Seller: | Wells Fargo Bank, National Association | |||||
Credit Assessment |
NR/NR/NR | |||||
| (Fitch/KBRA/Moody’s): | ||||||
Original Principal Balance: | $ 27,084,000 | |||||
Cut-off Date Principal Balance: | $ 27,084,000 | |||||
% of Initial Pool Balance: | 2.4% | |||||
| Loan Purpose: | Refinance | |||||
| Borrower Names(1): | Various | |||||
Sponsors: | NSA OP, LP; Kevin Howard; Tim | |||||
| Warren | ||||||
Mortgage Rate: | 4.650% | |||||
Note Date: | June 10, 2013 | |||||
Anticipated Repayment Date: | NAP | |||||
Maturity Date: | July 1, 2023 | |||||
IO Period: | 24 months | |||||
Loan Term (Original): | 120 months | |||||
Seasoning: | 1 month | |||||
Amortization Term (Original): | 300 months | |||||
Loan Amortization Type: | Interest-only, Amortizing Balloon | |||||
Interest Accrual Method: | Actual/360 | |||||
Call Protection: | L(25),D(91),O(4) | |||||
Lockbox Type: | Soft/Springing Cash Management | |||||
Additional Debt: | None | |||||
Additional Debt Type: | NAP | |||||
| Escrows and Reserves(2): | ||||||
| Type: | Initial | Monthly | Cap (If Any) | |||
Taxes | $83,256 | $28,113 | NAP | |||
Insurance | $0 | Springing | NAP | |||
ReplacementReserves | $0 | $7,046 | $253,659 | |||
DeferredMaintenance
| $38,951 | $0 | NAP |
| Property Information | ||
Single Asset/Portfolio: |
Portfolio | |
Property Type: |
Self Storage | |
Specific Property Type: |
Self Storage | |
Location: |
Various – See Table | |
Size: |
563,685 SF | |
Cut-off Date Principal | $48.05 | |
Balance Per SF: | ||
Year Built/Renovated: | Various – See Table | |
Title Vesting: |
Fee | |
Property Manager: |
Self-managed | |
3rdMost Recent Occupancy (As of): | 84.3%(12/31/2010) | |
2ndMost Recent Occupancy (As of): | 83.5%(12/31/2011) | |
Most Recent Occupancy (As of): | 84.2%(12/31/2012) | |
Current Occupancy (As of): | 85.2%(5/2/2013) | |
Underwriting and Financial Information: | ||
3rdMost Recent NOI (As of): | $2,492,178(12/31/2011) | |
2ndMost Recent NOI (As of): | $2,628,466(12/31/2012) | |
Most Recent NOI (As of): | $2,690,777 (TTM 3/31/2013) | |
| U/W Revenues: | $4,343,612 | |
U/W Expenses: | $1,681,729 | |
U/W NOI: | $2,661,883 | |
U/W NCF: | $2,577,331 | |
U/W NOI DSCR: | 1.45x | |
U/W NCF DSCR: | 1.41x | |
U/W NOI Debt Yield: | 9.8% | |
U/W NCF Debt Yield: | 9.5% | |
As-Is Appraised Value(3): | $36,900,000 | |
| As-Is Appraisal Valuation Date(3): | May 10, 2013 | |
| Cut-off Date LTV Ratio: | 73.4% | |
LTV Ratio at Maturity or ARD:
| 58.8% | |
| (1) | The borrowers consist of 12 separate limited liability companies. See “The Borrower” section. |
| (2) | See “Escrows” section. |
| (3) | See “Appraisal” section. |
The Mortgage Loan. The mortgage loan (the “Northwest Self Storage Portfolio Mortgage Loan”) is evidenced by a single promissory note that is secured by a first mortgage encumbering 13 self storage properties located in two states (the “Northwest Self Storage Portfolio Properties”). The Northwest Self Storage Portfolio Mortgage Loan was originated on June 10, 2013 by Wells Fargo Bank, National Association. The Northwest Self Storage Portfolio Mortgage Loan had an original principal balance of $27,084,000, has an outstanding principal balance as of the Cut-off Date of $27,084,000 and accrues interest at an interest rate of 4.650% per annum. The Northwest Self Storage Portfolio Mortgage Loan had an initial term of 120 months, has a remaining term of 119 months as of the Cut-off Date and requires interest-only payments for the first 24 payments following origination and thereafter requires payments of principal and interest based on a 25-year amortization schedule. The Northwest Self Storage Portfolio Mortgage Loan matures on July 1, 2023.
Following the lockout period, the borrowers have the right to defease the Northwest Self Storage Portfolio Mortgage Loan in whole, but not in part, on any date before April 1, 2023. In addition, the Northwest Self Storage Portfolio Mortgage Loan is prepayable without penalty on or after April 1, 2023.
THE INFORMATION IN THIS STRUCTURAL AND COLLATERAL TERM SHEET IS NOT COMPLETE AND MAY BE AMENDED PRIOR TO THE TIME OF SALE. THIS TERM SHEET IS NOT AN OFFER TO SELL THESE SECURITIES AND IT IS NOT A SOLICITATION OF AN OFFER TO BUY THESE SECURITIES IN ANY JURISDICTION WHERE THE OFFER OR SALE IS NOT PERMITTED.
88
NORTHWEST SELF STORAGE PORTFOLIO
Sources and Uses
| Sources | Uses | |||||||||
Original loan amount | $27,084,000 | 100.0% | Loan payoff | $15,766,723 | 58.2% | |||||
Reserves | 122,207 | 0.5 | ||||||||
Closing costs | 443,498 | 1.6 | ||||||||
Return of equity(1) | 10,751,572 | 39.7 | ||||||||
Total Sources | $27,084,000 | 100.0% | Total Uses | $27,084,000 | 100.0% |
| (1) | The sponsor’s return of equity was used to buy-out previous partners’ ownership interests in the SecurCare Self Storage Portfolio Properties, a mortgage loan that is also included in the WFRBS 2013–C15 securitization. |
The Properties. The Northwest Self Storage Portfolio Mortgage Loan is secured by the fee interest in 13 self storage properties totaling 563,685 rentable square feet located in two states: Oregon (10) and Washington (3). No property consists of more than 13.6% of the Allocated Cut-off Date Principal Balance and 13.8% of the Underwritten Net Cash Flow for the Northwest Self Storage Portfolio Mortgage Loan. The Northwest Self Storage Portfolio Properties range in size from 32,350 square feet to 59,570 square feet and as of May 2, 2013, the Northwest Self Storage Portfolio Properties were 85.2% occupied.
The following table presents certain information relating to the Northwest Self Storage Portfolio Properties:
| Property Name – Location | Allocated Cut-off Date Principal Balance | % of Portfolio Cut-off Date Principal Balance | Occupancy | Year Built/ Renovated | Net Rentable Area (SF) | Appraised Value(1) | ||||||||||||||||||
1239 Southeast 1stAvenue – Canby, OR | $3,672,000 | 13.6% | 85.2% | 1993/NAP | 56,698 | $4,650,000 | ||||||||||||||||||
3312 Pacific Avenue – Forest Grove, OR | $2,665,000 | 9.8% | 94.3% | 1994/NAP | 38,385 | $3,375,000 | ||||||||||||||||||
14735 Southeast 82ndDrive – Clackamas, OR | $2,598,000 | 9.6% | 93.0% | 1976/NAP | 47,612 | $3,290,000 | ||||||||||||||||||
629 Southeast Mount Hood Highway – Gresham, OR | $2,468,000 | 9.1% | 80.0% | 1997/NAP | 47,900 | $3,125,000 | ||||||||||||||||||
576 Southwest Halsey Street – Troutdale, OR | $2,290,000 | 8.5% | 78.7% | 1996/NAP | 45,555 | $2,900,000 | ||||||||||||||||||
2656 Olympic Street – Springfield, OR | $2,282,000 | 8.4% | 80.8% | 1989/NAP | 39,500 | $2,890,000 | ||||||||||||||||||
18 Northwest 29thAvenue – Battle Ground, WA | $2,132,000 | 7.9% | 97.1% | 2001/NAP | 37,655 | $2,700,000 | ||||||||||||||||||
2401 Harrison Avenue – Centralia, WA | $2,053,000 | 7.6% | 80.5% | 1986/NAP | 47,120 | $2,600,000 | ||||||||||||||||||
1533 Bishop Road – Chehalis, WA | $1,580,000 | 5.8% | 72.7% | 1996/NAP | 39,800 | $2,000,000 | ||||||||||||||||||
599 Highway 99 North – Eugene, OR | $1,501,000 | 5.5% | 77.5% | 1999/NAP | 33,175 | $1,900,000 | ||||||||||||||||||
100 Southeast 3rdStreet – Bend, OR | $1,481,000 | 5.5% | 94.7% | 1989/NAP | 32,350 | $1,875,000 | ||||||||||||||||||
1600 North Highway 97 – Redmond, OR | $1,248,000 | 4.6% | 80.9% | 1993/NAP | 38,365 | $1,580,000 | ||||||||||||||||||
7901 Old Highway 99 North – Roseburg, OR | $1,114,000 | 4.1% | 91.7% | 2003/NAP | 59,570 | $1,410,000 | ||||||||||||||||||
Total/Weighted Average | $27,084,000 | 100.0% | 85.2% | 563,685 | $34,295,000 | |||||||||||||||||||
| (1) | Although the summation of the individual appraised values is $34,295,000, the appraiser concluded that the aggregate value of the portfolio as a whole is $36,900,000. See “Appraisal” section for more details. |
The following table presents historical occupancy percentages at the Northwest Self Storage Portfolio Properties:
Historical Occupancy(1)
12/31/2010 | 12/31/2011 | 12/31/2012 | 5/2/2013 | |||
84.3% | 83.5% | 84.2% | 85.2% |
| (1) | Information obtained from the borrowers. |
THE INFORMATION IN THIS STRUCTURAL AND COLLATERAL TERM SHEET IS NOT COMPLETE AND MAY BE AMENDED PRIOR TO THE TIME OF SALE. THIS TERM SHEET IS NOT AN OFFER TO SELL THESE SECURITIES AND IT IS NOT A SOLICITATION OF AN OFFER TO BUY THESE SECURITIES IN ANY JURISDICTION WHERE THE OFFER OR SALE IS NOT PERMITTED.
89
NORTHWEST SELF STORAGE PORTFOLIO
Operating History and Underwritten Net Cash Flow. The following table presents certain information relating to the historical operating performance and the Underwritten Net Cash Flow at the Northwest Self Storage Portfolio Properties:
Cash Flow Analysis
TTM 3/31/2013 | ||||||||||||||||||||||
| 2011 | 2012 | U/W | U/W $ per SF | |||||||||||||||||||
Base Rent | $3,810,087 | $3,966,608 | $4,033,595 | $4,240,049 | $7.52 | |||||||||||||||||
Grossed Up Vacant Space | 0 | 0 | 0 | 808,992 | 1.44 | |||||||||||||||||
Total Reimbursables | 0 | 0 | 0 | 0 | 0.00 | |||||||||||||||||
Other Income | 274,254 | 306,038 | 310,017 | 331,523 | 0.59 | |||||||||||||||||
Less Vacancy & Credit Loss | 0 | 0 | 0 | (1,036,952)(1) | (1.84) | |||||||||||||||||
|
|
|
|
|
|
|
|
|
| |||||||||||||
Effective Gross Income | $4,084,341 | $4,272,646 | $4,343,612 | $4,343,612 | $7.71 | |||||||||||||||||
Total Operating Expenses | $1,592,163 | $1,644,180 | $1,652,835 | $1,681,729 | $2.98 | |||||||||||||||||
|
|
|
|
|
|
|
|
|
| |||||||||||||
Net Operating Income | $2,492,178 | $2,628,466 | $2,690,777 | $2,661,883 | $4.72 | |||||||||||||||||
TI/LC | 0 | 0 | 0 | 0 | 0.00 | |||||||||||||||||
Capital Expenditures | 0 | 0 | 0 | 84,553 | 0.15 | |||||||||||||||||
|
|
|
|
|
|
|
|
|
| |||||||||||||
Net Cash Flow | $2,492,178 | $2,628,466 | $2,690,777 | $2,577,331 | $4.57 | |||||||||||||||||
NOI DSCR | 1.36x | 1.43x | 1.47x | 1.45x | ||||||||||||||||||
NCF DSCR | 1.36x | 1.43x | 1.47x | 1.41x | ||||||||||||||||||
NOI DY | 9.2% | 9.7% | 9.9% | 9.8% | ||||||||||||||||||
NCF DY | 9.2% | 9.7% | 9.9% | 9.5% | ||||||||||||||||||
| (1) | The underwritten economic vacancy is 18.5%. The Northwest Self Storage Portfolio Properties were 85.2% physically occupied as of May 2, 2013. |
Appraisal. As of the appraisal valuation dates ranging from May 1, 2013 to May 8, 2013 the Northwest Self Storage Portfolio Properties had an aggregate “as-is” appraised value of $34,295,000. However, the appraiser assumed a portfolio premium due to the Northwest Self Storage Portfolio Properties covering a wide variety of areas and regions as well as a scarcity of available self storage portfolios, which would increase investor demand if marketed as a portfolio and determined a portfolio “as-is” appraised value of $36,900,000.
Environmental Matters. According to the Phase I environmental site assessments dated March 15, 2013 through April 5, 2013, recognized environmental conditions (“REC”) were identified at two of the Northwest Self Storage Portfolio Properties. Due to a reported 1995 release of waste oil and the property’s prior use as a crane service facility, a Phase II environmental site assessment was performed at the 7901 Old Highway 99 North property. A Phase II environmental site assessment dated May 10, 2013 tested the soil and based on the analytical results no further investigation was recommended. RECs were identified at the 2401 Harrison Avenue property due to the property operating as a former gasoline station from 1957 through 1972. A Phase II environmental site assessment dated June 4, 2013 was performed to test the soil and groundwater and based on the analytical results, the historical site operations associated with a former gasoline station has not impacted the subsurface soil or ground water and no further investigation was recommended.
According to Phase I environmental assessments dated March 15, 2013 through April 5, 2013, there were no evidence of any RECs at the remaining Northwest Self Storage Portfolio Properties.
The Borrowers. The borrowers comprise 12 separate limited liability companies, each of which is a single purpose entity and has an independent director. Legal counsel to the borrowers delivered a non-consolidation opinion in connection with the origination of the Northwest Self Storage Portfolio Mortgage Loan. NSA OP, LP, Kevin Howard and Tim Warren are the guarantors of certain nonrecourse carveouts under the Northwest Self Storage Portfolio Mortgage Loan.
The Sponsors. The sponsors are NSA OP, LP (“NSA”), Kevin Howard and Tim Warren. NSA OP, LP is a private upREIT that is the managing member and sole owner of the 12 separate limited liability companies that consist of the borrower. NSA will allocate operating partnership units in exchange for the borrowers’ interest in the properties. NSA was formed via the contributions of self storage assets from three self storage operators: SecurCare Self Storage, Northwest Self Storage, Optivest Properties. Kevin Howard and Tim Warren are the principals of Northwest Storage, which own approximately 70 self storage facilities in Oregon and Washington.
Escrows. The loan documents provide for upfront escrows in the amount of $83,256 for real estate taxes and $38,951 for deferred maintenance. The loan documents provide for ongoing monthly reserves in the amount of $28,113 for real estate taxes and ongoing monthly deposits of $7,046 for replacement reserves (subject to a cap of $253,659). Ongoing monthly reserves for insurance are not required as long as (i) no event of default has occurred and is continuing; (ii) the Northwest Self Storage Portfolio Properties are covered by an acceptable blanket policy; and (iii) the borrowers provide the lender with evidence of renewal of the policies and proof of payment of the insurance premiums when due.
THE INFORMATION IN THIS STRUCTURAL AND COLLATERAL TERM SHEET IS NOT COMPLETE AND MAY BE AMENDED PRIOR TO THE TIME OF SALE. THIS TERM SHEET IS NOT AN OFFER TO SELL THESE SECURITIES AND IT IS NOT A SOLICITATION OF AN OFFER TO BUY THESE SECURITIES IN ANY JURISDICTION WHERE THE OFFER OR SALE IS NOT PERMITTED.
90
NORTHWEST SELF STORAGE PORTFOLIO
Lockbox and Cash Management. The Northwest Self Storage Portfolio Mortgage Loan requires a lender-controlled lockbox account, which is already in place, and that the borrowers direct the property managers to deliver all rents with respect to the Northwest Self Storage Portfolio Properties directly into the lockbox account. The loan documents also require that all revenues received by the borrowers or the property managers into the lockbox account within one business day of receipt. Other than during a Cash Trap Event Period (as defined below), all funds on deposit are disbursed to the borrowers.
A “Cash Trap Event Period” will commence upon the earlier of (i) the occurrence and continuance of an event of default; (ii) the debt service coverage ratio for the trailing 12-month period falling below 1.25x at the end of any calendar quarter; and (iii) the debt yield being less than 8.25% at the end of any calendar quarter. A Cash Trap Event Period will expire, with regard to circumstances in clause (i), upon the cure of such event of default; with regards to circumstances in clause (ii) the debt service coverage ratio is equal to or greater than 1.30x for two consecutive calendar quarters (provided that an event of default has not occurred and is continuing and a Cash Trap Event Period has not occurred and is continuing pursuant to clause (iii)); with regards to circumstances in clause (iii), the debt yield is equal to or greater than 8.5% for two consecutive quarters (provided that an event of default has not occurred and is continuing and a Cash Trap Event Period has not occurred and is not continuing pursuant to clause (ii)).
Property Management. The Northwest Self Storage Portfolio Properties are managed by an affiliate of the borrowers.
Assumption. The borrowers have the right to transfer the Northwest Self Storage Portfolio Properties, provided that no event of default has occurred and is continuing and certain other conditions are satisfied, including (i) the lender’s reasonable determination that the proposed transferee and guarantor satisfy the lender’s credit review and underwriting standards, taking into consideration transferee experience, financial strength and general business standing; (ii) execution of a recourse guaranty and an environmental indemnity by an affiliate of the transferee; and (iii) if requested by the lender, rating agency confirmation from Fitch, KBRA and Moody’s that the transfer will not result in a downgrade, withdrawal or qualification of the respective ratings assigned to the Series 2013-C15 Certificates.
Partial Release. Not permitted
Real Estate Substitution. Not permitted.
Subordinate and Mezzanine Indebtedness. Not permitted.
Ground Lease. None.
Terrorism Insurance. The loan documents require that the “all risk” insurance policy required to be maintained by the borrowers provide coverage for terrorism in an amount equal to the full replacement cost of the Northwest Self Storage Portfolio Properties; provided that the borrowers will not be required to spend more than 200% of the cost of a stand-alone policy for terrorism insurance immediately prior to the date that TRIPRA or a similar government backstop is no longer in effect. The loan documents also require business interruption insurance covering no less than the 18-month period following the occurrence of a casualty event, together with a six-month extended period of indemnity.
THE INFORMATION IN THIS STRUCTURAL AND COLLATERAL TERM SHEET IS NOT COMPLETE AND MAY BE AMENDED PRIOR TO THE TIME OF SALE. THIS TERM SHEET IS NOT AN OFFER TO SELL THESE SECURITIES AND IT IS NOT A SOLICITATION OF AN OFFER TO BUY THESE SECURITIES IN ANY JURISDICTION WHERE THE OFFER OR SALE IS NOT PERMITTED.
91
RENAISSANCE CHARLOTTE SOUTHPARK

THE INFORMATION IN THIS STRUCTURAL AND COLLATERAL TERM SHEET IS NOT COMPLETE AND MAY BE AMENDED PRIOR TO THE TIME OF SALE. THIS TERM SHEET IS NOT AN OFFER TO SELL THESE SECURITIES AND IT IS NOT A SOLICITATION OF AN OFFER TO BUY THESE SECURITIES IN ANY JURISDICTION WHERE THE OFFER OR SALE IS NOT PERMITTED.
92
RENAISSANCE CHARLOTTE SOUTHPARK
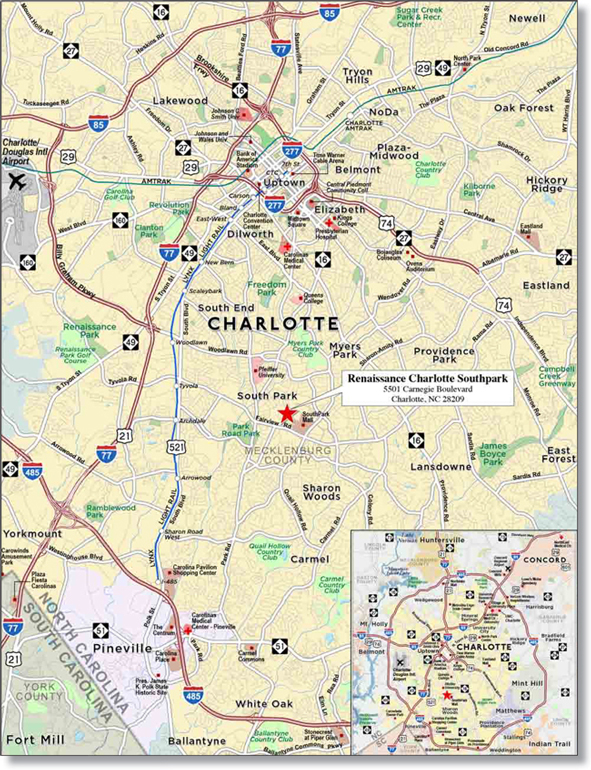
THE INFORMATION IN THIS STRUCTURAL AND COLLATERAL TERM SHEET IS NOT COMPLETE AND MAY BE AMENDED PRIOR TO THE TIME OF SALE. THIS TERM SHEET IS NOT AN OFFER TO SELL THESE SECURITIES AND IT IS NOT A SOLICITATION OF AN OFFER TO BUY THESE SECURITIES IN ANY JURISDICTION WHERE THE OFFER OR SALE IS NOT PERMITTED.
93
| No. 9 – Renaissance Charlotte Southpark |
| Loan Information | ||||||
| Mortgage Loan Seller: | Wells Fargo Bank, National Association | |||||
Credit Assessment |
NR/NR/NR | |||||
| (Fitch/KBRA/Moody’s): | ||||||
Original Principal Balance: |
$24,000,000 | |||||
Cut-off Date Principal Balance: |
$ 23,975,328 | |||||
| % of Initial Pool Balance: | 2.2% | |||||
| Loan Purpose: | Refinance | |||||
| Borrower Name: | Cartman Hotel, LLC | |||||
Sponsor: |
JWM Family Enterprises, L.P. | |||||
Mortgage Rate: | 5.140% | |||||
Note Date: | June 7, 2013 | |||||
Anticipated Repayment Date: | NAP | |||||
Maturity Date: | July 1, 2023 | |||||
IO Period: | None | |||||
Loan Term (Original): | 120 months | |||||
Seasoning: | 1 month | |||||
Amortization Term (Original): | 360 months | |||||
Loan Amortization Type: | Amortizing Balloon | |||||
Interest Accrual Method: | Actual/360 | |||||
Call Protection: | L(25),D(91),O(4) | |||||
Lockbox Type: | None | |||||
Additional Debt: | Yes | |||||
Additional Debt Type: | Unsecured | |||||
| Escrows and Reserves(1): |
| Type: | Initial | Monthly | Cap (If Any) | |||||||
Taxes | $0 | Springing | NAP | |||||||
Insurance | $0 | Springing | NAP | |||||||
FF&E | $0 | 5% of Gross Revenue | NAP |
| Property Information | ||
| Single Asset/Portfolio: | Single Asset | |||||
| Property Type: | Hospitality | |||||
| Specific Property Type: | Full Service | |||||
Location: | Charlotte, NC | |||||
Size: | 264 rooms | |||||
Cut-off Date Principal | $90,816 | |||||
| Balance Per Room: | ||||||
Year Built/Renovated: | 1989/2009 | |||||
Title Vesting: | Fee | |||||
Property Manager: | Self-managed | |||||
3rd Most Recent Occupancy (As of): | 65.0%(12/31/2010) | |||||
2nd Most Recent Occupancy (As of): | 74.9%(12/31/2011) | |||||
Most Recent Occupancy (As of): | 76.0%(12/31/2012) | |||||
Current Occupancy (As of): | 76.0%(3/31/2013) | |||||
Underwriting and Financial Information:
| ||||||
| 3rdMost Recent NOI (As of): | $2,178,792(12/31/2011) | |||||
2ndMost Recent NOI (As of): | $3,191,874(12/31/2012) | |||||
Most Recent NOI (As of): | $3,509,730 (TTM 3/31/2013) | |||||
| U/W Revenues: | $12,958,960 | |||||
U/W Expenses: | $9,681,396 | |||||
U/W NOI: | $3,277,564 | |||||
U/W NCF: | $2,629,616 | |||||
U/W NOI DSCR: | 2.09x | |||||
U/W NCF DSCR: | 1.67x | |||||
U/W NOI Debt Yield: | 13.7% | |||||
U/W NCF Debt Yield: | 11.0% | |||||
As-Is Appraised Value: | $38,600,000 | |||||
As-Is Appraisal Valuation Date: | April 26, 2013 | |||||
Cut-off Date LTV Ratio: | 62.1% | |||||
LTV Ratio at Maturity or ARD: | 51.4% | |||||
| (1) | See “Escrows” section. |
The Mortgage Loan. The mortgage loan (the “Renaissance Charlotte Southpark Mortgage Loan”) is evidenced by a single promissory note that is secured by a first mortgage encumbering a seven-story, full service hotel located in Charlotte, North Carolina (the “Renaissance Charlotte Southpark Property”). The Renaissance Charlotte Southpark Mortgage Loan was originated on June 7, 2013 by Wells Fargo Bank, National Association. The Renaissance Charlotte Southpark Mortgage Loan had an original balance of $24,000,000, has an outstanding balance as of the Cut-off Date of $23,975,328 and accrues interest at an interest rate of 5.140% per annum. The Renaissance Charlotte Southpark Mortgage Loan had an initial term of 120 months, has a remaining term of 119 months as of the Cut-off Date and requires payments of principal and interest based on a 30-year amortization schedule. The Renaissance Charlotte Southpark Mortgage Loan matures on July 1, 2023.
Following the lockout period, the borrower has the right to defease the Renaissance Charlotte Southpark Mortgage Loan in whole, but not in part, on any date before April 1, 2023. In addition, the Renaissance Charlotte Southpark Mortgage Loan is prepayable without penalty on or after April 1, 2023.
Sources and Uses
| Sources | Uses | |||||||||||||
Original loan amount | $24,000,000 | 84.0% | Loan payoff | $28,282,004 | 98.9% | |||||||||
Sponsor’s new cash contribution | 4,584,235 | 16.0 | Closing costs | 302,231 | 1.1 | |||||||||
Total Sources | $28,584,235 | 100.0% | Total Uses | $28,584,235 | 100.0% | |||||||||
THE INFORMATION IN THIS STRUCTURAL AND COLLATERAL TERM SHEET IS NOT COMPLETE AND MAY BE AMENDED PRIOR TO THE TIME OF SALE. THIS TERM SHEET IS NOT AN OFFER TO SELL THESE SECURITIES AND IT IS NOT A SOLICITATION OF AN OFFER TO BUY THESE SECURITIES IN ANY JURISDICTION WHERE THE OFFER OR SALE IS NOT PERMITTED.
94
RENAISSANCE CHARLOTTE SOUTHPARK
The Property. The Renaissance Charlotte Southpark Property is a seven-story full service hotel, which was built in 1989 and renovated in 2009, and is located in Charlotte, North Carolina. The Renaissance Charlotte Southpark Property offers 264 guest rooms, including 172 king bed guestrooms, 90 double/queen bed guestrooms and two king bed suites. Amenities at the Renaissance Charlotte Southpark Property include two restaurants, salt water indoor pool, fitness center, business center, approximately 8,000 square feet of meeting and banquet space and a three-story parking deck. Each guestroom has a flat screen television, a desk and lounge chairs and the suites offer kitchenettes. The hotel was formerly operated as a Hyatt until February 2007 when it was converted to a Renaissance. The Renaissance Charlotte Southpark Property underwent a $14.0 million renovation, which was completed in 2009. The renovation included new guestroom soft and case goods, new corridor finishes, renovation of the ballrooms and conference rooms and a new roof. The Renaissance Charlotte Southpark Property is indirectly owned by the Marriott family (see “Sponsor” section) and no franchise agreement is in-place. The property management contract expires on April 30, 2027.
Operating History and Underwritten Net Cash Flow. The following table represents certain information relating to the historical operating performance and the Underwritten Net Cash Flow at the Renaissance Charlotte Southpark Property:
Cash Flow Analysis
| 2011 | 2012 | TTM 3/31/2013 | U/W | U/W $ per Room | ||||||||||||||||
Occupancy | 74.9% | 76.0% | 76.0% | 76.0% | ||||||||||||||||
ADR | $117.50 | $133.20 | $134.76 | $134.76 | ||||||||||||||||
RevPAR | $88.01 | $101.23 | $102.42 | $102.42 | ||||||||||||||||
Total Revenue | $11,295,675 | $12,593,019 | $13,248,589 | $12,958,960 | $49,087 | |||||||||||||||
Total Department Expenses | 4,610,960 | 4,902,444 | 5,085,909 | 5,074,627 | 19,222 | |||||||||||||||
|
|
|
|
|
|
|
|
|
| |||||||||||
Gross Operating Profit | $6,684,715 | $7,690,575 | $8,162,680 | $7,884,333 | $29,865 | |||||||||||||||
Total Undistributed Expenses | 4,015,013 | 4,060,352 | 4,195,847 | 4,110,769 | 15,571 | |||||||||||||||
|
|
|
|
|
|
|
|
|
| |||||||||||
Profit Before Fixed Charges | $2,669,702 | $3,630,223 | $3,966,833 | $3,773,564 | $14,294 | |||||||||||||||
Total Fixed Charges | 490,910 | 438,349 | 457,103 | 496,000 | 1,879 | |||||||||||||||
|
|
|
|
|
|
|
|
|
| |||||||||||
Net Operating Income | $2,178,792 | $3,191,874 | $3,509,730 | $3,277,564 | $12,415 | |||||||||||||||
FF&E | 564,784 | 629,651 | 662,431 | 647,948 | 2,454 | |||||||||||||||
|
|
|
|
|
|
|
|
|
| |||||||||||
Net Cash Flow | $1,614,008 | $2,562,223 | $2,847,299 | $2,629,616 | $9,961 | |||||||||||||||
NOI DSCR | 1.39x | 2.03x | 2.23x | 2.09x | ||||||||||||||||
NCF DSCR | 1.03x | 1.63x | 1.81x | 1.67x | ||||||||||||||||
NOI DY | 9.1% | 13.3% | 14.6% | 13.7% | ||||||||||||||||
NCF DY | 6.7% | 10.7% | 11.9% | 11.0% | ||||||||||||||||
Appraisal. As of the appraisal valuation date of April 26, 2013, the Renaissance Charlotte Southpark Property had an “as-is” appraised value of $38,600,000.
Environmental Matters. According to the Phase I environmental assessment dated May 14, 2013, there was no evidence of any recognized environmental conditions at the Renaissance Charlotte Southpark Property.
Market Overview and Competition. The Renaissance Charlotte Southpark Property is situated on the southwest corner of the intersection of Barclay Downs Drive and Carnegie Boulevard, directly across from the 1.3 million square foot SouthPark Mall in the SouthPark submarket of Charlotte, North Carolina. The Renaissance Charlotte Southpark Property is located five miles south of the Charlotte central business district and approximately eight miles southeast of Charlotte/Douglas International Airport. The SouthPark submarket contains 4.3 million square feet of office space, which is approximately 9.8% of the Charlotte region’s office market. Charlotte serves as the headquarters for Bank of America, Duke Energy, Chiquita Brands International and the east coast headquarters for Wells Fargo. Primary access is primarily via Fairview Road, which is the primary east-west artery in the immediate area. Fairview Road provides access from Renaissance Charlotte Southpark Property to Interstate 77, which is the primary commuter artery in the Charlotte region.
THE INFORMATION IN THIS STRUCTURAL AND COLLATERAL TERM SHEET IS NOT COMPLETE AND MAY BE AMENDED PRIOR TO THE TIME OF SALE. THIS TERM SHEET IS NOT AN OFFER TO SELL THESE SECURITIES AND IT IS NOT A SOLICITATION OF AN OFFER TO BUY THESE SECURITIES IN ANY JURISDICTION WHERE THE OFFER OR SALE IS NOT PERMITTED.
95
RENAISSANCE CHARLOTTE SOUTHPARK
The following table presents certain information relating to the Renaissance Charlotte Southpark Property’s competitive set:
Subject and Market Historical Occupancy, ADR and RevPAR(1)
Competitive Set | Renaissance Charlotte Southpark | Penetration Factor | ||||||||||||||||||
| Year | Occupancy | ADR | RevPAR | Occupancy | ADR | RevPAR | Occupancy | ADR | RevPAR | |||||||||||
3/31/2013 TTM | 74.1% | $126.55 | $93.79 | 75.8% | $135.11 | $102.40 | 102.3% | 106.8% | 109.2% | |||||||||||
3/31/2012 TTM | 74.1% | $115.42 | $85.54 | 75.3% | $120.71 | $90.87 | 101.6% | 104.6% | 106.2% | |||||||||||
3/31/2011 TTM | 72.6% | $110.09 | $79.92 | 65.8% | $110.93 | $72.94 | 90.6% | 100.8% | 91.3% | |||||||||||
| (1) | Information obtained from a third party hospitality research report dated April 18, 2013. According to such third party hospitality report, the Competitive Set includes the following hotels: Doubletree Charlotte Southpark, Embassy Suites Charlotte, Hilton Charlotte Executive Park and Hampton Inn Suites Charlotte Southpark at Phillips Place. |
The Borrower. The borrower is Cartman Hotel, LLC, a Delaware limited liability company and a single purpose entity. JWM Family Enterprises, L.P., the loan sponsor, is the guarantor of certain nonrecourse carveouts under the Renaissance Charlotte Southpark Mortgage Loan.
The Sponsor. The sponsor, JWM Family Enterprises, L.P. (“JWMFE”), is a private investment fund owned primarily by Marriott family members and is controlled by J.W. Marriott III. The fund was formed to hold Marriott family assets and currently owns interests in eleven hotels. JWMFE acquires underperforming hotels, performs significant capital upgrades and operates the properties under the Marriott franchise brand.
Escrows. The loan documents do not require monthly escrows for real estate taxes provided payments are paid by the property manager and in accordance with the management agreement. The loan documents do not require monthly escrows for insurance premiums provided the property manager provides payments in a timely manner and the coverage is maintained in accordance with the management agreement. The loan documents provide for monthly deposits into an FF&E reserve, controlled and paid by the property manager, equal to 5.0% of the gross revenue for the most recent calendar month.
Lockbox and Cash Management. None.
Property Management. The Renaissance Charlotte Southpark Property is managed by an affiliate of the borrower.
Assumption. The borrower has a two-time right to transfer the Renaissance Charlotte Southpark Property, provided that no event of default has occurred and is continuing and certain other conditions are satisfied, including (i) the lender’s reasonable determination that the proposed transferee and guarantor satisfy the lender’s credit review and underwriting standards, taking into consideration transferee experience, financial strength and general business standing; (ii) execution of a recourse guaranty and an environmental indemnity by an affiliate of the transferee; and (iii) if requested by the lender, rating agency confirmation from Fitch, KBRA and Moody’s that the transfer will not result in a downgrade, withdrawal or qualification of the respective ratings assigned to the Series 2013-C15 Certificates.
Right of First Offer. The property manager, Renaissance Hotel Operating Company, a Marriott-related affiliate, has a 30 day period to negotiate the purchase terms (“ROFO”) of the Renaissance Chartlotte Southpark Property prior to the Renaissance Charlotte Southpark Property being offered for sale to a third party. The ROFO is not extinguished by foreclosure or deed-in-lieu thereof, but the management agreement provides that foreclosure or deed-in-lieu thereof by any mortgage does not trigger the ROFO.
Partial Release. Not permitted.
Real Estate Substitution. Not permitted.
Subordinate and Mezzanine Indebtedness. The borrower has incurred $25,861,890 of unsecured subordinate debt provided by the sponsor. The unsecured subordinate debt accures at an interest rate of 2.16% and is payable from excess cash flow after all property expenses, reserves and debt service payments have been made. A subordination and standstill agreement was obtained from the related sponsor.
Ground Lease. None.
Terrorism Insurance. As long as the Renaissance Charlotte Southpark Property is managed under the current management agreement, the loan documents require that the “all risk” insurance policy to be maintained by the borrower provides coverage for terrorism to the extent available at commercially reasonable rates, terms and conditions. Terrorism insurance is currently in-place in an amount equal to the full replacement cost of the Renaissance Charlotte Southpark Property, as well as business interruption insurance covering no less than the 12-month period following the occurrence of a casualty event, together with a six-month extended period of indemnity. See also Representations and Warranties No. 18 (Insurance) and No. 31 (Acts of Terrorism Exclusion) on Annex E-1 to this free writing prospectus and the exceptions thereto on Annex E-2 to this free writing prospectus (subject to the limitations and qualifications set forth in the preamble to Annex E-1 to this free writing prospectus).
THE INFORMATION IN THIS STRUCTURAL AND COLLATERAL TERM SHEET IS NOT COMPLETE AND MAY BE AMENDED PRIOR TO THE TIME OF SALE. THIS TERM SHEET IS NOT AN OFFER TO SELL THESE SECURITIES AND IT IS NOT A SOLICITATION OF AN OFFER TO BUY THESE SECURITIES IN ANY JURISDICTION WHERE THE OFFER OR SALE IS NOT PERMITTED.
96
[THIS PAGE INTENTIONALLY LEFT BLANK.]
97
AMERICAN SELF STORAGE - STATEN ISLAND
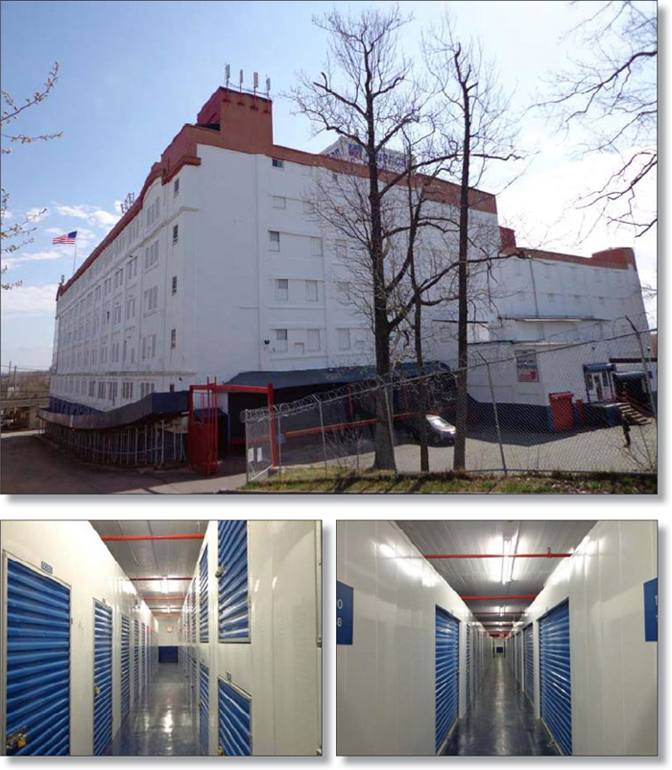
THE INFORMATION IN THIS STRUCTURAL AND COLLATERAL TERM SHEET IS NOT COMPLETE AND MAY BE AMENDED PRIOR TO THE TIME OF SALE. THIS TERM SHEET IS NOT AN OFFER TO SELL THESE SECURITIES AND IT IS NOT A SOLICITATION OF AN OFFER TO BUY THESE SECURITIES IN ANY JURISDICTION WHERE THE OFFER OR SALE IS NOT PERMITTED.
98
AMERICAN SELF STORAGE - STATEN ISLAND
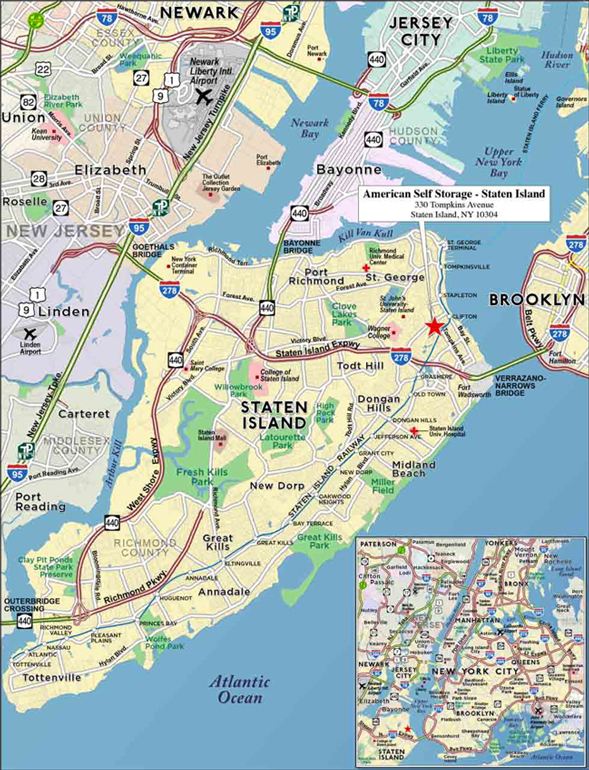
THE INFORMATION IN THIS STRUCTURAL AND COLLATERAL TERM SHEET IS NOT COMPLETE AND MAY BE AMENDED PRIOR TO THE TIME OF SALE. THIS TERM SHEET IS NOT AN OFFER TO SELL THESE SECURITIES AND IT IS NOT A SOLICITATION OF AN OFFER TO BUY THESE SECURITIES IN ANY JURISDICTION WHERE THE OFFER OR SALE IS NOT PERMITTED.
99
| No. 10 – American Self Storage - Staten Island |
| Loan Information | ||
Mortgage Loan Seller: | The Royal Bank of Scotland | |
Credit Assessment | ||
| (Fitch/KBRA/Moody’s): | NR/NR/NR | |
Original Principal Balance: | $ 21,000,000 | |
Cut-off Date Principal Balance: | $ 20,948,223 | |
% of Initial Pool Balance: | 1.9% | |
Loan Purpose: | Refinance | |
| Borrower Name: |
American Self-Storage Staten Island, LLC | |
| Sponsors: |
Warren Diamond; John Del Monaco | |
Mortgage Rate: | 4.596% | |
Note Date: | May 30, 2013 | |
Anticipated Repayment Date: | NAP | |
Maturity Date: | June 1, 2023 | |
IO Period: | None | |
Loan Term (Original): | 120 months | |
Seasoning: | 2 months | |
Amortization Term (Original): | 360 months | |
Loan Amortization Type: | Amortizing Balloon | |
Interest Accrual Method: | Actual/360 | |
Call Protection: | L(26),D(90),O(4) | |
Lockbox Type: |
Hard/Springing Cash Management | |
Additional Debt: | None | |
Additional Debt Type: | NAP |
Escrows and Reserves(1):
| Type: | Initial | Monthly | Cap (If Any) | |||
Taxes | $47,092 | $7,849 | NAP | |||
Insurance | $23,163 | $3,860 | NAP | |||
Replacement Reserves | $388,482 | $7,713 | NAP | |||
Environmental Reserve | $78,000 | $0 | NAP | |||
Deferred Maintenance | $44,313 | $0 | NAP | |||
| Property Information | ||
Single Asset/Portfolio: | Single Asset | |
Property Type: | Self Storage | |
Specific Property Type: | Self Storage | |
Location: | Staten Island, NY | |
Size: | 165,103 SF | |
Cut-off Date Principal | ||
| Balance Per SF: | $126.88 | |
Year Built/Renovated: | 1924/2004 | |
Title Vesting: | Fee | |
Property Manager: | Self-managed | |
3rdMost Recent Occupancy (As of): | 76.2% (12/31/2010) | |
2ndMost Recent Occupancy (As of): | 75.3% (12/31/2011) | |
Most Recent Occupancy (As of): | 75.1% (12/31/2012) | |
Current Occupancy (As of): | 79.2% (3/30/2013) |
Underwriting and Financial Information:
| 3rdMost Recent NOI (As of): | $1,734,784 (12/31/2011) | |
2ndMost Recent NOI (As of): | $1,830,420 (12/31/2012) | |
Most Recent NOI (As of): | $1,842,994 (TTM 3/31/2013) | |
U/W Revenues: | $2,707,069 | |
U/W Expenses: | $895,724 | |
U/W NOI: | $1,811,345 | |
U/W NCF: | $1,723,840 | |
U/W NOI DSCR: | 1.40x | |
U/W NCF DSCR: | 1.34x | |
U/W NOI Debt Yield: | 8.6% | |
U/W NCF Debt Yield: | 8.2% | |
As-Is Appraised Value: | $32,000,000 | |
As-Is Appraisal Valuation Date: | April 16, 2013 | |
Cut-off Date LTV Ratio: | 65.5% | |
LTV Ratio at Maturity or ARD: | 53.2% | |
| (1) | See “Escrows” section. |
The Mortgage Loan. The mortgage loan (the “American Self Storage - Staten Island Mortgage Loan”) is evidenced by a single promissory note that is secured by a first mortgage encumbering a 165,103 square foot self storage facility located in Staten Island, New York (the “American Self Storage - Staten Island Property”). The American Self Storage - Staten Island Mortgage Loan was originated on May 30, 2013 by The Royal Bank of Scotland. The American Self Storage - Staten Island Mortgage Loan had an original principal balance of $21,000,000, has an outstanding principal balance as of the Cut-off Date of $20,948,223 and accrues interest at an interest rate of 4.596% per annum. The American Self Storage - Staten Island Mortgage Loan had an initial term of 120 months, has a remaining term of 118 months as of the Cut-off Date and requires payments of principal and interest based on a 30-year amortization schedule. The American Self Storage - Staten Island Mortgage Loan matures on June 1, 2023.
Following the lockout period, the borrower has the right to defease the American Self Storage - Staten Island Mortgage Loan in whole, but not in part, on any date before March 1, 2023. In addition, the American Self Storage - Staten Island Mortgage Loan is prepayable without penalty on or after March 1, 2023.
THE INFORMATION IN THIS STRUCTURAL AND COLLATERAL TERM SHEET IS NOT COMPLETE AND MAY BE AMENDED PRIOR TO THE TIME OF SALE. THIS TERM SHEET IS NOT AN OFFER TO SELL THESE SECURITIES AND IT IS NOT A SOLICITATION OF AN OFFER TO BUY THESE SECURITIES IN ANY JURISDICTION WHERE THE OFFER OR SALE IS NOT PERMITTED.
100
AMERICAN SELF STORAGE - STATEN ISLAND
Sources and Uses
| Sources | Uses | |||||||||||||||||
Original loan amount | $21,000,000 | 100.0% | Loan payoff | $9,813,411 | 46.7% | |||||||||||||
Reserves | 581,050 | 2.8 | ||||||||||||||||
Closing costs | 888,815 | 4.2 | ||||||||||||||||
Return of equity | 9,716,724 | 46.3 | ||||||||||||||||
Total Sources | $21,000,000 | 100.0% | Total Uses | $21,000,000 | 100.0% |
The Property. The American Self Storage - Staten Island Mortgage Loan is secured by the fee interest in a self storage facility totaling 165,103 square feet located in Staten Island, New York. The American Self Storage - Staten Island Property was originally built in 1924 as an industrial property and converted to self storage space in 2004. The American Self Storage - Staten Island Property is a seven-story facility that currently encompasses 2,221 units. The American Self Storage - Staten Island Property is currently undergoing an expansion, which will add 86 units encompassing 6,025 square feet of additional space. The expansion will bring the total unit count and square footage up to 2,307 and 171,128, respectively. The American Self Storage - Staten Island Property has a range of amenities including video surveillance, an alarm system and security access. The American Self Storage - Staten Island Property includes 26 outdoor parking spaces that are available for rent.
The following table presents information relating to the historical occupancy for the American Self Storage - Staten Island Property:
Historical Occupancy(1)
12/31/2010 | 12/31/2011 | 12/31/2012 | 3/30/2013 | |||
76.2% | 75.3% | 75.1% | 79.2% | |||
(1) Information obtained from the borrower. | ||||||
Operating History and Underwritten Net Cash Flow. The following table presents certain information relating to the historical operating performance and the Underwritten Net Cash Flow at the American Self Storage - Staten Island Property:
Cash Flow Analysis
| 2011 | 2012 | TTM 3/31/2013 | U/W | U /W $ per SF | ||||||||||||||||||
Base Rent | $2,263,758 | $2,368,849 | $2,418,194 | $2,418,194 | $14.65 | |||||||||||||||||
Grossed Up Vacant Space | 0 | 0 | 0 | 549,031 | 3.33 | |||||||||||||||||
Less Concessions | 0 | 0 | 0 | 0 | 0.00 | |||||||||||||||||
Other Income | 432,987 | 416,594 | 419,137 | 419,137 | 2.54 | |||||||||||||||||
Less Vacancy & Credit Loss | (105,435) | (96,468) | (130,262) | (679,293)(1) | (4.11) | |||||||||||||||||
|
|
|
|
|
|
|
|
|
| |||||||||||||
Effective Gross Income | $2,591,310 | $2,688,975 | $2,707,069 | $2,707,069 | $16.40 | |||||||||||||||||
Total Operating Expenses
|
| $856,526
|
|
| $858,555
|
|
| $864,075
|
|
| $895,724
|
|
| $5.43
|
| |||||||
|
|
|
|
|
|
|
|
|
| |||||||||||||
Net Operating Income | $1,734,784 | $1,830,420 | $1,842,994 | $1,811,345 | $10.97 | |||||||||||||||||
Replacement Reserves | 0 | 0 | 0 | 87,505 | 0.53 | |||||||||||||||||
|
|
|
|
|
|
|
|
|
| |||||||||||||
Net Cash Flow | $1,734,784 | $1,830,420 | $1,842,994 | $1,723,840 | $10.44 | |||||||||||||||||
NOI DSCR | 1.34x | 1.42x | 1.43x | 1.40x | ||||||||||||||||||
NCF DSCR | 1.34x | 1.42x | 1.43x | 1.34x | ||||||||||||||||||
NOI DY | 8.3% | 8.7% | 8.8% | 8.6% | ||||||||||||||||||
NCF DY | 8.3% | 8.7% | 8.8% | 8.2% | ||||||||||||||||||
(1) The underwritten economic vacancy is 22.9%. The American Self Storage - Staten Island Property was 79.2% physically occupied as of March 30, 2013. | ||||||||||||||||||||||
Appraisal. As of the appraisal valuation date of April 16, 2013, the American Self Storage - Staten Island Property had an “as-is” appraised value of $32,000,000.
Environmental Matters. According to a Phase I environmental site assessment dated May 30, 2013, two recognized environmental conditions (“RECs”) were identified at the American Self Storage - Staten Island Property. The Phase I report showed an REC related to one 10,000 gallon underground storage tank (“UST”) and one 550 gallon UST. The Phase I report recommended both USTs, along with approximately 57 tons of contaminated soil be removed and $78,000 was reserved for this purpose. Once the USTs and soil have been removed, no further action is required. The Phase I report also identified approximately 1,380 feet of asbestos-containing pipe insulation on-site. The Phase I report recommended that an asbestos operations and maintenance program be implemented to monitor the asbestos-containing and suspect-asbestos-containing materials that may be located at the American Self Storage - Staten Island Property.
THE INFORMATION IN THIS STRUCTURAL AND COLLATERAL TERM SHEET IS NOT COMPLETE AND MAY BE AMENDED PRIOR TO THE TIME OF SALE. THIS TERM SHEET IS NOT AN OFFER TO SELL THESE SECURITIES AND IT IS NOT A SOLICITATION OF AN OFFER TO BUY THESE SECURITIES IN ANY JURISDICTION WHERE THE OFFER OR SALE IS NOT PERMITTED.
101
AMERICAN SELF STORAGE - STATEN ISLAND
Market Overview and Competition. The American Self Storage - Staten Island Property is located on Tompkins Avenue in Staten Island, New York, one of the five boroughs comprising New York City. The American Self Storage - Staten Island Property is located less than 1.5 miles from Interstate 278, which provides access to Brooklyn and Manhattan via the Verrazano Bridge to the east and access to Interstate 95 and New Jersey to the west. The American Self Storage - Staten Island Property is situated approximately 20 miles southwest of the John F. Kennedy International Airport and 20 miles southeast of the LaGuardia Airport. Per the appraisal, the estimated 2013 population and median household income for the borough of Staten Island were reported at 472,330 and $71,352, respectively. Of the five boroughs, Staten Island has the highest median household income, which is expected to increase by 10.1% over the next five years.
The Borrower. The borrower is American Self-Storage Staten Island, LLC, a New York limited liability company and a single purpose entity with one independent director. Legal counsel to the borrower delivered a non-consolidation opinion in connection with the origination of the American Self Storage - Staten Island Mortgage Loan. American Self-Storage Staten Island, LLC, is ultimately controlled by John Del Monaco (28.3%) and Warren Diamond (23.3%), both of which will serve as the guarantors for the American Self Storage - Staten Island Mortgage Loan.
The Sponsors. The sponsors for the American Self Storage - Staten Island Mortgage Loan are John Del Monaco and Warren Diamond. Warren Diamond is the chief executive officer of American Real Estate Management Associates, a developer of commercial and residential real estate in New York and New Jersey. Warren Diamond also founded American Self Storage in 1986 and has over 25 years of real estate experience. American Self Storage is one of the leading self storage developers and operators in the metropolitan New York/New Jersey area.
Escrows. The loan documents provide for upfront escrows at closing in the amount of $47,092 for real estate taxes, $23,163 for insurance premiums, $388,482 for replacement reserves, $44,313 for deferred maintenance and $78,000 for an environmental reserve (see “Environmental Matters” section). The loan documents also provide for ongoing monthly escrows in the amount of $7,849 for real estate taxes, $3,860 for insurance premiums and $7,713 for replacement reserves.
Lockbox and Cash Management. The American Self Storage - Staten Island Mortgage Loan requires a lender-controlled lockbox account, which is already in place, and that the borrower direct tenants to pay their rents directly into such lockbox account. The loan documents also require that all rents received by the borrower or the property manager be deposited into the lockbox account within one business day after receipt. Prior to the occurrence of a Cash Management Period (as defined below) all funds on deposit in the lockbox account are swept into the borrower’s operating account on a daily basis. During a Cash Management Period, all funds on deposit in the lockbox account are swept on a daily basis to a cash management account under the control of the lender.
A “Cash Management Period” will commence upon either of the following events occurring: (i) the occurrence of an event of default, or (ii) the debt service coverage ratio falling below 1.10x as of the end of any calendar quarter. A Cash Management Period will end with respect to the matters described in clause (i) above, when such event of default has been cured, and with respect to the matters described in clause (ii) above, when a debt service coverage ratio of at least 1.10x has been achieved for two consecutive calendar quarters.
Property Management. The American Self Storage - Staten Island Property is managed by an affiliate of the borrower.
Assumption. The borrower has the right to transfer the American Self Storage - Staten Island Property, provided that no event of default has occurred and is continuing and certain other conditions are satisfied, including: (i) execution of a recourse guaranty and an environmental indemnity by an affiliate of the transferee; (ii) if requested by the lender, rating agency confirmation from Fitch, KBRA and Moody’s that the transfer will not result in a downgrade, withdrawal or qualification of the respective ratings assigned to the Series 2013-C15 Certificates; and (iii) the lender reasonably determines that the proposed transferee and guarantor satisfy the lender’s credit review and underwriting standards, taking into consideration transferee experience, financial strength and general business standing.
Partial Release. Not permitted.
Real Estate Substitution. Not permitted.
Subordinate and Mezzanine Indebtedness. Not permitted.
Ground Lease. None.
Terrorism Insurance. The loan documents require that the “all risk” insurance policy required to be maintained by the borrower provides coverage for damage from terrorism in an amount equal to the full replacement cost of the American Self Storage - Staten Island Property as well as business interruption insurance covering no less than the 12-month period following the occurrence of a casualty event.
THE INFORMATION IN THIS STRUCTURAL AND COLLATERAL TERM SHEET IS NOT COMPLETE AND MAY BE AMENDED PRIOR TO THE TIME OF SALE. THIS TERM SHEET IS NOT AN OFFER TO SELL THESE SECURITIES AND IT IS NOT A SOLICITATION OF AN OFFER TO BUY THESE SECURITIES IN ANY JURISDICTION WHERE THE OFFER OR SALE IS NOT PERMITTED.
102
[THIS PAGE INTENTIONALLY LEFT BLANK.]
103
| No. 11 – Acropolis Gardens Realty Corp. |
| Loan Information | ||
Mortgage Loan Seller: | NCB, FSB | |
| Credit Assessment | ||
| (Fitch/KBRA/Moody’s): | NR/NR/NR | |
Original Principal Balance: | $19,500,000 | |
Cut-off Date Principal Balance: | $19,500,000 | |
% of Initial Pool Balance: | 1.8% | |
Loan Purpose: | Refinance | |
Borrower Name: | Acropolis Gardens Realty Corp. | |
Sponsor(1): | NAP | |
Mortgage Rate: | 4.640% | |
Note Date: | June 21, 2013 | |
Anticipated Repayment Date: | NAP | |
Maturity Date: | July 1, 2023 | |
IO Period: | 120 months | |
Loan Term (Original): | 120 months | |
Seasoning: | 1 month | |
Amortization Term (Original): | NAP | |
Loan Amortization Type: | Interest-only, Balloon | |
Interest Accrual Method: | Actual/360 | |
Call Protection: |
GRTR 1% or YM(113), 1%(3),O(4) | |
Lockbox Type: | None | |
Additional Debt(2): | Yes | |
Additional Debt Type(2): | Secured |
Escrows and Reserves:
| Type: | Initial | Monthly | Cap (If Any) | |||
Taxes | $206,911 | $103,455 | NAP | |||
Insurance(3) | $0 | Springing | NAP | |||
Capital Improvements Escrow | $4,000,000 | $0 | NAP | |||
| Property Information | ||
Single Asset/Portfolio: | Single Asset | |
Property Type: | Multifamily | |
Specific Property Type: | Cooperative | |
Location: | Astoria, NY | |
Size: | 612 units | |
Cut-off Date Principal Balance Per Unit: | $31,863 | |
Year Built/Renovated: | 1923/2007 | |
Title Vesting: | Fee | |
Property Manager: |
Metropolitan Pacific Properties, Inc. | |
3rdMost Recent Occupancy: | NAP | |
2ndMost Recent Occupancy: | NAP | |
Most Recent Occupancy: | NAP | |
Occupancy (As of)(4): | 96.0% (4/24/2013) |
Underwriting and Financial Information:
| 3rdMost Recent NOI(5): | NAP | |
2ndMost Recent NOI(5): | NAP | |
Most Recent NOI(5): | NAP | |
U/W Revenues(6): | $9,700,621 | |
U/W Expenses(6): | $4,770,000 | |
U/W NOI(6): | $4,930,621 | |
U/W NCF(6): | $4,930,621 | |
U/W NOI DSCR(6): | 5.37x | |
U/W NCF DSCR(6): | 5.37x | |
U/W NOI Debt Yield(6): | 25.3% | |
U/W NCF Debt Yield(6): | 25.3% | |
As-Is Appraised Value(7): | $138,570,000 | |
As-Is Appraisal Valuation Date(7): | April 24, 2013 | |
Cut-off Date LTV Ratio(7):: | 14.1% | |
LTV Ratio at Maturity or ARD(7):: | 14.1% | |
| (1) | The Acropolis Gardens Realty Corp. property is owned by the borrower, which is a cooperative housing corporation. No individual or entity (other than the borrower) has recourse obligations with respect to the loan, including pursuant to any guaranty or environmental indemnity. |
| (2) | The property securing the Acropolis Gardens Realty Corp. mortgage loan is subject to a subordinate wraparound mortgage (the “Wrap Mortgage”) with a stated outstanding principal balance of $19,500,001. The Wrap Mortgage’s “equity” (i.e., principal amount of the Wrap Mortgage as to which the wraparound mortgage is entitled to payment) is $1.00. |
| (3) | Upon the occurrence of an event of default, borrower shall deposit one-twelfth of annual insurance premiums on a monthly basis. |
| (4) | Occupancy reflects the property vacancy assumption in the appraisal for purposes of determining the Appraised Value of the Acropolis Gardens Realty Corp. property as a multifamily rental property (i.e., the Coop - Rental Value). Additionally, the Occupancy (As of) date reflects the appraisal valuation date for the Acropolis Gardens Realty Corp. property. |
| (5) | Residential cooperatives are not-for-profit entities that set maintenance fees to cover current expenses and plan for future capital needs. A residential cooperative can increase or decrease maintenance fees according to its anticipated expenses and level of cash reserves. The historical NOI figures are not representative of the cash flow generated by the Acropolis Gardens Realty Corp. property if it were operated as a multifamily rental property. |
| (6) | For purposes of determining U/W NOI DSCR, U/W NCF DSCR, U/W NOI Debt Yield, U/W NCF Debt Yield, U/W NCF and U/W NOI, see Annex D of the Free Writing Prospectus, in so far as such terms pertain to residential cooperative properties. |
| (7) | For purposes of determining the As-Is Appraised Value, Cut-off Date LTV Ratio and the LTV Ratio at Maturity or ARD, see Annex D of the Free Writing Prospectus, in so far as such terms pertain to residential cooperative properties. |
THE INFORMATION IN THIS STRUCTURAL AND COLLATERAL TERM SHEET IS NOT COMPLETE AND MAY BE AMENDED PRIOR TO THE TIME OF SALE. THIS TERM SHEET IS NOT AN OFFER TO SELL THESE SECURITIES AND IT IS NOT A SOLICITATION OF AN OFFER TO BUY THESE SECURITIES IN ANY JURISDICTION WHERE THE OFFER OR SALE IS NOT PERMITTED.
104
ACROPOLIS GARDENS REALTY CORP.
The Acropolis Gardens Realty Corp. mortgage loan is evidenced by a single promissory note that is secured by a first mortgage encumbering a multifamily residential cooperative corporation located in Astoria, New York, (the “Acropolis Gardens Realty Corp. Property”). The Acropolis Gardens Realty Corp. Property is a “cond-op” in that one condominium unit is structured as a commercial condo and the other condominium unit is structured as a residential cooperative. The underlying mortgage is secured only by the residential cooperative condo unit. The Acropolis Gardens Realty Corp. Property improvements consists of 16 five-story and basement, walk-up apartment buildings which were constructed circa 1923 and converted to a cooperative ownership circa 1988. The Acropolis Gardens Realty Corp. Property contains a total of 611 saleable residential units with shares, a professional unit with shares and a superintendent’s unit without shares. The cooperative is 54.9% sold to shareholders with 336 shareholder-owned units and 276 investor-held units. The 276 investor-held units are held by 11 different entities. Of the 276 investor-held units, 36 units did not provide rent information. The remaining investor-held units have an aggregate positive cash flow of approximately $1.4 million.
Sources and Uses
| Sources | Uses | |||||||||||||||||
Original loan amount | $19,500,000 | 100.0% | Loan payoff | $12,865,535 | 66.0% | |||||||||||||
Capital improvement escrow | 4,000,000 | 20.5 | ||||||||||||||||
Accounts payable | 1,007,260 | 5.2 | ||||||||||||||||
Unrestricted reserves | 455,255 | 2.3 | ||||||||||||||||
Initial tax escrow | 206,911 | 1.1 | ||||||||||||||||
Closing costs | 965,039 | 4.9 | ||||||||||||||||
Total Sources | $19,500,000 | 100.0% | Total Uses | $19,500,000 | 100.0% |
The following table presents certain information relating to the unit mix of the Acropolis Gardens Realty Corp. Property:
Unit Mix Summary(1)
| Unit Type | No. of Units | % of Total Units | Unit Size (SF) | Total Net Sq. | ||||||||
2.0 Room/Studio | 15 | 2.5% | 350 | 5,250 | ||||||||
3.0 Room/1 Bedroom | 155 | 25.3 | 500 | 77,500 | ||||||||
4.0 Room/2 Bedroom | 406 | 66.3 | 600 | 243,600 | ||||||||
5.0 Room/3 Bedroom | 35 | 5.7 | 850 | 29,750 | ||||||||
Professional Unit
| 1 | 0.2 | 3,250 | 3,250 | ||||||||
Total/Weighted Average | 612 | 100.0% | 359,350 | |||||||||
(1) Information obtained from the appraisal dated May 2, 2013. | ||||||||||||
The following table presents historical occupancy percentages at the Acropolis Gardens Realty Corp. Property:
Historical Occupancy
12/31/2010 | 12/31/2011 | 12/31/2012 | 4/24/2013(1) | |||
NAP | NAP | NAP | 96.0% | |||
(1) The occupancy rate reported reflects the vacancy assumption in the related appraisal for purposes of determining the appraised value of the Acropolis Gardens Realty Corp. Property as a multifamily rental property (i.e., the Coop - Rental Value). Additionally, the occupancy date reflects the appraisal valuation date for the Acropolis Gardens Realty Corp. Property. | ||||||
THE INFORMATION IN THIS STRUCTURAL AND COLLATERAL TERM SHEET IS NOT COMPLETE AND MAY BE AMENDED PRIOR TO THE TIME OF SALE. THIS TERM SHEET IS NOT AN OFFER TO SELL THESE SECURITIES AND IT IS NOT A SOLICITATION OF AN OFFER TO BUY THESE SECURITIES IN ANY JURISDICTION WHERE THE OFFER OR SALE IS NOT PERMITTED.
105
ACROPOLIS GARDENS REALTY CORP.
Operating History and Underwritten Net Cash Flow. The following table presents certain information relating to the Underwritten Net Cash Flow at the Acropolis Gardens Realty Corp. Property:
Cash Flow Analysis(1)
| U/W | U/W per Unit | |||||||
Gross Rental Income | $10,054,814 | $16,429 | ||||||
Other Income | 50,000 | 82 | ||||||
Less Vacancy & Credit Loss | (404,193)(2) | (660) | ||||||
|
|
|
| |||||
Effective Gross Income | $9,700,621 | $15,851 | ||||||
Total Operating Expenses
|
| $4,770,000
|
|
| $7,794
|
| ||
|
|
|
| |||||
Net Operating Income
| $4,930,621 | $8,057 | ||||||
|
|
|
| |||||
Net Cash Flow | $4,930,621 | $8,057 | ||||||
NOI DSCR | 5.37x | |||||||
NCF DSCR | 5.37x | |||||||
NOI DY | 25.3% | |||||||
NCF DY | 25.3% | |||||||
(1) | Residential cooperatives are not-for-profit entities that set maintenance fees to cover current expenses and plan for future capital needs. A residential cooperative can increase or decrease maintenance fees according to its anticipated expenses and level of cash reserves. Historical NOI figures are not representative of the cash flow generated by the Acropolis Gardens Realty Corp. Property if it were operated as a multifamily rental property and are, therefore, not presented. The U/W Net Operating Income and the U/W Net Cash Flow for a residential cooperative property is the projected net cash flow reflected in an appraisal and, in general, equals projected operating income at the Acropolis Gardens Realty Corp. Property assuming it is operated as a rental property with rents and other income set at prevailing market rates (but taking into account the presence of existing rent-regulated or rent-controlled rental tenants), reduced by U/W Total Operating Expenses, a market-rate vacancy assumption and projected replacement reserves – in each case as determined by the appraiser. However, the projected net cash flow used in such determinations may differ materially from the scheduled monthly maintenance payments from the tenant-stockholders upon which residential cooperatives depend. For purposes of determining U/W NOI DSCR, U/W NCF DSCR, U/W NOI Debt Yield and U/W NCF Debt Yield, U/W NCF and the U/W NOI for a residential cooperative property, see Annex D of the Free Writing Prospectus. | |||||
(2) | The vacancy reported reflects the vacancy assumption in the related appraisal for purposes of determining the appraised value of the Acropolis Gardens Realty Corp. Property as a multifamily rental property (i.e., the Coop - Rental Value). | |||||
THE INFORMATION IN THIS STRUCTURAL AND COLLATERAL TERM SHEET IS NOT COMPLETE AND MAY BE AMENDED PRIOR TO THE TIME OF SALE. THIS TERM SHEET IS NOT AN OFFER TO SELL THESE SECURITIES AND IT IS NOT A SOLICITATION OF AN OFFER TO BUY THESE SECURITIES IN ANY JURISDICTION WHERE THE OFFER OR SALE IS NOT PERMITTED.
106
[THIS PAGE INTENTIONALLY LEFT BLANK.]
107
| No. 12 – Devonshire Portfolio |
| Loan Information | ||
Mortgage Loan Seller: | Liberty Island Group I LLC | |
Credit Assessment | ||
| (Fitch/KBRA/Moody’s): | NR/NR/NR | |
Original Principal Balance: | $18,172,500 | |
Cut-off Date Principal Balance: | $ 18,124,290 | |
% of Initial Pool Balance: | 1.6% | |
Loan Purpose(1): | Various | |
| Borrower Names: |
DFG-Swanton, LLC; DFG-Village Crossings, LLC; DFG-Sandusky, LLC; DFG-Lancaster, LLC | |
| Sponsors: |
Devonshire Operating Partnership, LP; Christopher S. Campbell | |
Mortgage Rate: | 4.230% | |
Note Date: | May 17, 2013 | |
Anticipated Repayment Date: | NAP | |
Maturity Date: | June 1, 2023 | |
IO Period: | None | |
Loan Term (Original): | 120 months | |
Seasoning: | 2 months | |
Amortization Term (Original): | 360 months | |
Loan Amortization Type: | Amortizing Balloon | |
Interest Accrual Method: | Actual/360 | |
Call Protection: | L(27),GRTR 1% or YM(89),O(4) | |
Lockbox Type: | None | |
Additional Debt: | None | |
Additional Debt Type: | NAP |
Escrows and Reserves:
| Type: | Initial | Monthly | Cap (If Any) | |||
Taxes | $41,479 | $20,740 | NAP | |||
Insurance | $17,764 | $2,538 | NAP | |||
Replacement Reserves | $8,196 | $8,196 | NAP | |||
TI/LC Reserve | $11,500 | $11,500 | $276,000 | |||
Deferred Maintenance | $257,625 | $0 | NAP | |||
Tenant Specific Leasing Reserve(2) | $113,600 | $0 | NAP | |||
Tenant Holdback(3) | $150,000 | $0 | NAP | |||
| Property Information | ||
Single Asset/Portfolio: | Portfolio | |
Property Type: | Retail | |
Specific Property Type: | Various | |
Location: | Various, OH | |
Size: | 329,819 SF | |
Cut-off Date Principal | ||
| Balance Per SF: | $54.95 | |
Year Built/Renovated: | Various – See Table | |
Title Vesting: | Fee | |
Property Manager: | Devonshire Fund, LLC | |
3rdMost Recent Occupancy (As of): | 86.6% (12/31/2010) | |
2ndMost Recent Occupancy (As of): | 84.6% (12/31/2011) | |
Most Recent Occupancy (As of): | 86.8% (12/31/2012) | |
Current Occupancy (As of): | 94.3% (4/6/2013) |
Underwriting and Financial Information:
| 3rdMost Recent NOI (As of): | $1,734,268 (12/31/2010) | |
2ndMost Recent NOI (As of): | $1,779,929 (12/31/2011) | |
Most Recent NOI (As of): | $1,961,539 (12/31/2012) | |
U/W Revenues: | $2,819,433 | |
U/W Expenses: | $856,217 | |
U/W NOI: | $1,963,216 | |
U/W NCF: | $1,719,476 | |
U/W NOI DSCR: | 1.83x | |
U/W NCF DSCR: | 1.61x | |
U/W NOI Debt Yield: | 10.8% | |
U/W NCF Debt Yield: | 9.5% | |
As-Is Appraised Value: | $24,250,000 | |
As-Is Appraisal Valuation Date: | March 25, 2013 | |
Cut-off Date LTV Ratio: | 74.7% | |
LTV Ratio at Maturity or ARD: | 60.0% | |
| (1) | Of the $18,172,500 loan amount, $6,275,000 was used towards the acquisition of the Village Crossing Shopping Center mortgaged property. The rest of the proceeds will be used towards the refinancing of the Plaza Shopping Center, CVS Sandusky, and Rite Aid Swanton mortgaged properties. |
| (2) | A reserve in the amount of $113,600 was established at closing in connection with the borrowers’ outstanding tenant improvement allowance owed to Cincinnati Asia Market, Inc. Release of the reserved amount is conditioned upon receipt of a certificate of occupancy, lien waiver, and a clean estoppel. |
| (3) | A reserve in the amount of $150,000 was established at closing in connection with the borrowers’ outstanding tenant improvement allowance owed to Carnival Foods. Release of the reserved amount is conditioned upon a clean estoppel. The borrower agreed that the work will be completed on or prior to September 30, 2013. |
The Devonshire Portfolio mortgage loan is evidenced by a single promissory note that is secured by a first mortgage encumbering two retail centers and two single tenant retail buildings located in Lancaster, Evendale, Sandusky and Swanton, Ohio (the “Devonshire Portfolio Properties”). The Devonshire Portfolio Properties consist of a 216,102 square foot retail center (Plaza Shopping Center) located in Lancaster, Ohio; a 92,412 square foot retail center (Village Crossing Shopping Center) located in Evendale, Ohio; a 10,125 square foot single tenant retail building (CVS Sandusky) located in Sandusky, Ohio; and a 11,180 square foot single tenant retail building (Rite Aid Swanton) located in Swanton, Ohio. The Devonshire Portfolio Properties are collectively situated on approximately 30.9 acres. The Devonshire Portfolio Properties were built between 1958 and 1998. As of April 6, 2013, the Plaza Shopping Center property was 95.8% leased by 19 tenants and the Village Crossing Shopping Center property was 89.6% leased by eight tenants. As of August 1, 2013, the CVS Sandusky property was 100.0% leased by one tenant and the Rite Aid Swanton property was 100.0% leased by one tenant.
THE INFORMATION IN THIS STRUCTURAL AND COLLATERAL TERM SHEET IS NOT COMPLETE AND MAY BE AMENDED PRIOR TO THE TIME OF SALE. THIS TERM SHEET IS NOT AN OFFER TO SELL THESE SECURITIES AND IT IS NOT A SOLICITATION OF AN OFFER TO BUY THESE SECURITIES IN ANY JURISDICTION WHERE THE OFFER OR SALE IS NOT PERMITTED.
108
DEVONSHIRE PORTFOLIO
Sources and Uses(1)
Sources | Uses | |||||||||||
Original loan amount | $18,172,500 | 97.7% | Loan payoff | $ | 10,751,771 | 57.8% | ||||||
Sponsor’s new cash contribution | 235,000 | 1.3 | Purchase price | 6,275,000 | 33.7 | |||||||
Other sources | 197,680 | 1.1 | Reserves | 600,164 | 3.2 | |||||||
| Return of equity | 141,611 | 0.8 | ||||||||||
| Closing costs | 836,633 | 4.5 | ||||||||||
Total Sources | $18,605,180 | 100.0% | Total Uses | $ | 18,605,180 | 100.0% |
| (1) | Of the $18,172,500 loan amount, $6,275,000 will be used towards the acquisition of the Village Crossing Shopping Center mortgaged property. The rest of the proceeds will be used towards the refinancing of the Plaza Shopping Center, CVS Sandusky, and Rite Aid Swanton mortgaged properties. |
The following table represents certain information relating to the Devonshire Portfolio Properties:
Property Name | Location | | Allocated Cut-off Date Principal Balance | | % of Portfolio Cut-off Date Principal Balance | Occupancy | Year Built/ Renovated | | Net Rentable Area (SF) | | | Appraised Value | | |||||||||
Plaza Shopping Center(1) | Lancaster, OH | $9,940,332 | 54.8% | 95.8% | 1958/NAP | 216,102 | $13,300,000 | |||||||||||||||
Village Crossing Shopping Center | Evendale, OH | $4,962,692 | 27.4% | 89.6% | 1960/NAP | 92,412 | $6,640,000 | |||||||||||||||
CVS Sandusky | Sandusky, OH | $1,726,479 | 9.5% | 100.0% | 1997/NAP | 10,125 | $2,310,000 | |||||||||||||||
Rite Aid Swanton | Swanton, OH | $1,494,787 | 8.2% | 100.0% | 1998/NAP | 11,180 | $2,000,000 | |||||||||||||||
Total/Weighted Average | $18,124,290 | 100.0% | 94.3% | 329,819 | $24,250,000 |
| (1) | The Plaza Shopping Center mortgaged property is not subject to partial release. |
The following table presents certain information relating to the tenancies at the Devonshire Portfolio Properties:
Major Tenants
| Tenant Name | Credit Rating Moody’s/ S&P)(1) | Tenant NRSF | % of NRSF | Annual U/W Base Rent PSF | Annual U/W Base Rent | % of Total Annual U/W Base Rent | Lease Expiration Date | |||||||||||||||||||
Major Tenants | ||||||||||||||||||||||||||
Carnival Foods | NR/NR/NR | 78,330 | 23.7% | $4.90 | $384,107 | 17.2% | 12/31/2025 | |||||||||||||||||||
Cincinnati Asia Market, Inc. | NR/NR/NR | 30,812 | 9.3% | $6.79 | $209,076 | 9.4% | 1/31/2024 | |||||||||||||||||||
Rite Aid of Ohio, Inc. | CCC+/Caa2/B- | 11,180 | 3.4% | $16.39 | $183,272 | 8.2% | 10/31/2028 | |||||||||||||||||||
CVS Sandusky | BBB+/Baa2/BBB+ | 10,125 | 3.1% | $17.50 | $177,153 | 7.9% | 1/31/2019 | |||||||||||||||||||
Big Lots Inc. | NR/NR/BBB- | 26,184 | 7.9% | $6.00 | $157,104 | 7.0% | 7/31/2014 | |||||||||||||||||||
Aldi Inc. | NR/NR/NR | 18,012 | 5.5% | $8.50 | $153,102 | 6.9% | 9/30/2017 | |||||||||||||||||||
|
|
|
| |||||||||||||||||||||||
Total Major Tenants | 174,643 | 53.0% | $7.24 | $1,263,814 | 56.7% | |||||||||||||||||||||
Non-Major Tenants
|
| 136,453
|
|
| 41.4%
|
| $7.07
|
| $965,096
|
|
| 43.3%
|
| |||||||||||||
|
|
|
| |||||||||||||||||||||||
Occupied Collateral Total | 311,096 | 94.3% | $7.16 | $2,228,910 | 100.0% | |||||||||||||||||||||
|
| |||||||||||||||||||||||||
Vacant Space
|
| 18,723
|
|
| 5.7%
|
| ||||||||||||||||||||
|
| |||||||||||||||||||||||||
Collateral Total | 329,819 | 100.0% | ||||||||||||||||||||||||
|
| |||||||||||||||||||||||||
| (1) | Certain ratings are those of the parent company whether or not the parent guarantees the lease. |
THE INFORMATION IN THIS STRUCTURAL AND COLLATERAL TERM SHEET IS NOT COMPLETE AND MAY BE AMENDED PRIOR TO THE TIME OF SALE. THIS TERM SHEET IS NOT AN OFFER TO SELL THESE SECURITIES AND IT IS NOT A SOLICITATION OF AN OFFER TO BUY THESE SECURITIES IN ANY JURISDICTION WHERE THE OFFER OR SALE IS NOT PERMITTED.
109
DEVONSHIRE PORTFOLIO
The following table presents certain information relating to the lease rollover schedule at the Devonshire Portfolio Properties:
Lease Expiration Schedule(1)(2)(3)
Year Ending December 31, | No. of Leases Expiring | Expiring NRSF | % of Total NRSF | Cumulative Expiring NRSF | Cumulative % of Total NRSF | Annual U/W Base Rent | Annual U/W | |||||||||||||||||
MTM | 1 | 6,750 | 2.0 | % | 6,750 | 2.0% | $22,688 | $3.36 | ||||||||||||||||
2013 | 0 | 0 | 0.0 | % | 6,750 | 2.0% | $0 | $0.00 | ||||||||||||||||
2014 | 6 | 48,153 | 14.6 | % | 54,903 | 16.6% | $345,667 | $7.18 | ||||||||||||||||
2015 | 4 | 10,248 | 3.1 | % | 65,151 | 19.8% | $109,488 | $10.68 | ||||||||||||||||
2016 | 5 | 36,035 | 10.9 | % | 101,186 | 30.7% | $193,302 | $5.36 | ||||||||||||||||
2017 | 5 | 45,410 | 13.8 | % | 146,596 | 44.4% | $347,688 | $7.66 | ||||||||||||||||
2018 | 2 | 15,250 | 4.6 | % | 161,846 | 49.1% | $126,188 | $8.27 | ||||||||||||||||
2019 | 3 | 28,928 | 8.8 | % | 190,774 | 57.8% | $301,725 | $10.43 | ||||||||||||||||
2020 | 0 | 0 | 0.0 | % | 190,774 | 57.8% | $0 | $0.00 | ||||||||||||||||
2021 | 0 | 0 | 0.0 | % | 190,774 | 57.8% | $0 | $0.00 | ||||||||||||||||
2022 | 1 | 0 | 0.0 | % | 190,774 | 57.8% | $5,711 | $0.00 | ||||||||||||||||
2023 | 0 | 0 | 0.0 | % | 190,774 | 57.8% | $0 | $0.00 | ||||||||||||||||
Thereafter | 3 | 120,322 | 36.5 | % | 311,096 | 94.3% | $776,455 | $6.45 | ||||||||||||||||
Vacant | 0 | 18,723 | 5.7 | % | 329,819 | 100.0% | $0 | $0.00 | ||||||||||||||||
Total/Weighted Average | 30 | 329,819 | 100.0 | % | $2,228,910 | $7.16 | ||||||||||||||||||
(1) Information obtained from the underwritten rent roll. (2) Certain tenants may have lease termination options that are exercisable prior to the originally stated expiration date of the subject lease and that are not considered in the Lease Expiration Schedule. (3) Lease Expiration Schedule includes tenants that do not take up physical space, but are paying rent. (4) Weighted Average Annual U/W Base Rent PSF excludes vacant space. | ||||||||||||||||||||||||
The following table presents historical occupancy percentages at the Devonshire Portfolio Properties:
Historical Occupancy(1)
12/31/2010 | 12/31/2011 | 12/31/2012 | 4/6/2013 | |||||||||
86.6% | 84.6% | 86.8% | 94.3% | |||||||||
(1) Information obtained from borrowers’ rent rolls. | ||||||||||||
Operating History and Underwritten Net Cash Flow. The following table presents certain information relating to the historical operating performance and the Underwritten Net Cash Flow at the Devonshire Portfolio Properties:
Cash Flow Analysis
| 2010 | 2011 | 2012 | U/W | U/W $ per SF | ||||||||||||||||
Base Rent | $2,086,736 | $2,045,334 | $2,084,300 | $2,228,910 | $6.76 | |||||||||||||||
Grossed Up Vacant Space | 0 | 0 | 0 | 124,336 | 0.38 | |||||||||||||||
Total Reimbursables | 300,878 | 376,770 | 392,257 | 637,501 | 1.93 | |||||||||||||||
Other Income | 0 | 0 | 34,909 | 0 | 0.00 | |||||||||||||||
Less Vacancy & Credit Loss | 0 | (6,982) | 2,750 | (171,314)(1) | (0.52) | |||||||||||||||
|
|
|
|
|
|
|
|
|
| |||||||||||
Effective Gross Income | $2,387,614 | $2,415,122 | $2,514,217 | $2,819,433 | $8.55 | |||||||||||||||
Total Operating Expenses | $653,346 | $635,193 | $552,678 | $856,217 | $2.60 | |||||||||||||||
|
|
|
|
|
|
|
|
|
| |||||||||||
Net Operating Income | $1,734,268 | $1,779,929 | $1,961,539 | $1,963,216 | $5.95 | |||||||||||||||
TI/LC | 0 | 0 | 0 | 145,394 | 0.44 | |||||||||||||||
Reserves for Replacements | 0 | 0 | 0 | 98,346 | 0.30 | |||||||||||||||
|
|
|
|
|
|
|
|
|
| |||||||||||
Net Cash Flow | $1,734,268 | $1,779,929 | $1,961,539 | $1,719,476 | $5.21 | |||||||||||||||
NOI DSCR | 1.62x | 1.66x | 1.83x | 1.83x | ||||||||||||||||
NCF DSCR | 1.62x | 1.66x | 1.83x | 1.61x | ||||||||||||||||
NOI DY | 9.6% | 9.8% | 10.8% | 10.8% | ||||||||||||||||
NCF DY | 9.6% | 9.8% | 10.8% | 9.5% | ||||||||||||||||
(1) The underwritten economic vacancy is 7.3%. The Devonshire Portfolio Properties were 94.3% physically occupied as of April 6, 2013. |
| |||||||||||||||||||
THE INFORMATION IN THIS STRUCTURAL AND COLLATERAL TERM SHEET IS NOT COMPLETE AND MAY BE AMENDED PRIOR TO THE TIME OF SALE. THIS TERM SHEET IS NOT AN OFFER TO SELL THESE SECURITIES AND IT IS NOT A SOLICITATION OF AN OFFER TO BUY THESE SECURITIES IN ANY JURISDICTION WHERE THE OFFER OR SALE IS NOT PERMITTED.
110
[THIS PAGE INTENTIONALLY LEFT BLANK.]
111
| No. 13 – Cleveland Airport Marriott |
| Loan Information | ||
Mortgage Loan Seller: |
Wells Fargo Bank, National Association | |
Credit Assessment (Fitch/KBRA/Moody’s): |
NR/NR/NR | |
Original Principal Balance: | $18,000,000 | |
Cut-off Date Principal Balance: | $ 17,981,496 | |
% of Initial Pool Balance: | 1.6% | |
Loan Purpose: | Refinance | |
Borrower Name: | Big River Real Estate, LLC | |
Sponsor: | Thomas Point Ventures, LP | |
Mortgage Rate: | 5.140% | |
Note Date: | June 7, 2013 | |
Anticipated Repayment Date: | NAP | |
Maturity Date: | July 1, 2023 | |
IO Period: | None | |
Loan Term (Original): | 120 months | |
Seasoning: | 1 month | |
Amortization Term (Original): | 360 months | |
Loan Amortization Type: | Amortizing Balloon | |
Interest Accrual Method: | Actual/360 | |
Call Protection: | L(25),D(91),O(4) | |
Lockbox Type: | None | |
Additional Debt(1): | Yes | |
Additional Debt Type(1): | Unsecured |
Escrows and Reserves:
| Type: | Initial | Monthly | Cap (If Any) | |||
Taxes(2) | $0 | Springing | NAP | |||
Insurance(3) | $0 | Springing | NAP | |||
FF&E(4) | $0 | 4% of Gross Revenue | NAP | |||
|
| Property Information | ||
Single Asset/Portfolio: | Single Asset | |
Property Type: | Hospitality | |
Specific Property Type: | Full Service | |
Location: | Cleveland, OH | |
Size: | 372 rooms | |
| Cut-off Date Principal | ||
| Balance Per Room: | $48,337 | |
Year Built/Renovated: | 1969/2009 | |
Title Vesting: | Fee | |
Property Manager: | Self-managed | |
3rd Most Recent Occupancy (As of): | 58.9% (12/31/2010) | |
2nd Most Recent Occupancy (As of): | 63.8% (12/31/2011) | |
Most Recent Occupancy (As of): | 71.4% (12/31/2012) | |
Current Occupancy (As of): | 71.5% (4/30/2013) | |
Underwriting and Financial Information:
| ||
| 3rdMost Recent NOI (As of): | $2,256,828 (12/31/2011) | |
2ndMost Recent NOI (As of): | $3,066,497 (12/31/2012) | |
Most Recent NOI (As of) | $3,130,723 (TTM 4/30/2013) | |
U/W Revenues: | $15,022,821 | |
U/W Expenses: | $12,242,855 | |
U/W NOI: | $2,779,966 | |
U/W NCF: | $2,028,825 | |
U/W NOI DSCR: | 2.36x | |
U/W NCF DSCR: | 1.72x | |
U/W NOI Debt Yield: | 15.5% | |
U/W NCF Debt Yield: | 11.3% | |
As-Is Appraised Value: | $30,000,000 | |
As-Is Appraisal Valuation Date: | April 25, 2013 | |
Cut-off Date LTV Ratio: | 59.9% | |
LTV Ratio at Maturity or ARD: | 49.6% | |
| (1) | The borrower has incurred unsecured subordinate debt with an outstanding principal balance of $15,741,615, provided by the sponsor. The unsecured subordinate debt accrues at an interest rate of 2.16% and is payable from excess cash flow after all property expenses, reserves and debt service payments have been made. A subordination and standstill agreement was obtained from the related sponsor. |
| (2) | Monthly real estate tax escrows are not required provided payments are paid by the property manager in accordance with the management agreement. |
| (3) | Monthly insurance escrows are not required provided the property manager makes payments and coverage is maintained in accordance with the management agreement. |
| (4) | The property manager will make monthly deposits into an FF&E reserve, which is also controlled by the property manager. |
The Cleveland Airport Marriott mortgage loan is evidenced by a single promissory note that is secured by a first mortgage encumbering a 372-room, full service hotel located in Cleveland, Ohio (the “Cleveland Airport Marriott Property”). The Cleveland Airport Marriott Property was acquired by the sponsor in 2007 and subsequently completed an approximately $19.4 million renovation. Improvements included a complete renovation of all guest rooms, meeting spaces, the restaurant and upgrades to the HVAC. Amenities include an indoor pool, concierge lounge, approximately 18,842 square feet of meeting space, exercise facility, restaurant, sundry shop and a business center. The Cleveland Airport Marriott Property is located off of Interstate 71, approximately three miles northeast of the Cleveland Hopkins International Airport and approximately ten miles southwest of the Cleveland central business district. The Cleveland Airport Marriott Property is owned by the Marriott family and no franchise agreement is in place. A management agreement is in place that expires on December 31, 2028 and includes a 10-year automatic extension option, unless the property manager gives written notice to not renew the management agreement at least 300 days prior to December 31, 2028.
THE INFORMATION IN THIS STRUCTURAL AND COLLATERAL TERM SHEET IS NOT COMPLETE AND MAY BE AMENDED PRIOR TO THE TIME OF SALE. THIS TERM SHEET IS NOT AN OFFER TO SELL THESE SECURITIES AND IT IS NOT A SOLICITATION OF AN OFFER TO BUY THESE SECURITIES IN ANY JURISDICTION WHERE THE OFFER OR SALE IS NOT PERMITTED.
112
CLEVELAND AIRPORT MARRIOTT
Sources and Uses
Sources | Uses | |||||||||||
Original loan amount | $18,000,000 | 86.4% | Loan payoff | $ | 20,480,181 | 98.6% | ||||||
Sponsor’s new cash contribution | 2,780,018 | 13.4 | Closing costs | 299,837 | 1.4 | |||||||
Total Sources | $20,780,018 | 100.0% | Total Uses | $ | 20,780,018 | 100.0% |
The following table presents certain information relating the historical performance of the Cleveland Airport Marriott Property compared to the performance of a competitive set of properties as provided in a third party hospitality report:
Subject and Market Historical Occupancy, ADR and RevPAR(1)
Competitive Set | Cleveland Airport Marriott | Penetration Factor | ||||||||||||||||
|
|
| ||||||||||||||||
| Year | Occupancy | ADR | RevPAR | Occupancy | ADR | RevPAR | Occupancy | ADR | RevPAR | |||||||||
|
|
|
|
|
|
|
| |||||||||||
4/30/2013 TTM | 66.5% | $80.78 | $53.69 | 71.8% | $105.82 | $76.01 | 108.1% | 131.0% | 141.6% | |||||||||
4/30/2012 TTM | 63.9% | $76.97 | $49.21 | 65.7% | $105.79 | $69.45 | 102.7% | 137.4% | 141.1% | |||||||||
4/30/2011 TTM | 57.9% | $77.54 | $44.86 | 61.9% | $99.68 | $61.66 | 106.9% | 128.6% | 137.5% | |||||||||
| (1) | Information obtained from a third party hospitality report dated May 18, 2013. |
Operating History and Underwritten Net Cash Flow. The following table represents certain information relating to the historical operating performance and the Underwritten Net Cash Flow at the Cleveland Airport Marriott Property:
Cash Flow Analysis
| 2011 | 2012 | TTM 4/30/2013 | U/W | U/W $ per Room | ||||||||||||||||
Occupancy | 63.8% | 71.4% | 71.5% | 67.5% | ||||||||||||||||
ADR | $103.90 | $105.66 | $105.19 | $105.19 | ||||||||||||||||
RevPAR | $66.29 | $75.44 | $75.18 | $71.00 | ||||||||||||||||
Total Revenue | $14,033,676 | $15,962,462 | $16,370,784 | $15,022,821 | $40,384 | |||||||||||||||
Total Department Expenses | 6,384,360 | 7,162,387 | 7,368,377 | 6,679,170 | 17,955 | |||||||||||||||
|
|
|
|
|
|
|
|
|
| |||||||||||
Gross Operating Profit | $7,649,316 | $8,800,075 | $9,002,407 | $8,343,651 | $22,429 | |||||||||||||||
Total Undistributed Expenses | 4,940,308 | 5,047,105 | 5,170,833 | 4,812,685 | 12,937 | |||||||||||||||
|
|
|
|
|
|
|
|
|
| |||||||||||
Profit Before Fixed Charges | $2,709,008 | $3,752,970 | $3,831,574 | $3,530,966 | $9,492 | |||||||||||||||
Total Fixed Charges | 452,180 | 686,473 | 700,851 | 751,000 | 2,019 | |||||||||||||||
|
|
|
|
|
|
|
|
|
| |||||||||||
Net Operating Income | $2,256,828 | $3,066,497 | $3,130,723 | $2,779,966 | $7,473 | |||||||||||||||
FF&E | 701,684 | 798,123 | 818,539 | 751,141 | 2,019 | |||||||||||||||
|
|
|
|
|
|
|
|
|
| |||||||||||
Net Cash Flow | $1,555,144 | $2,268,374 | $2,312,184 | $2,028,825 | $5,454 | |||||||||||||||
NOI DSCR | 1.92x | 2.60x | 2.66x | 2.36x | ||||||||||||||||
NCF DSCR | 1.32x | 1.93x | 1.96x | 1.72x | ||||||||||||||||
NOI DY | 12.6% | 17.1% | 17.4% | 15.5% | ||||||||||||||||
NCF DY | 8.6% | 12.6% | 12.9% | 11.3% | ||||||||||||||||
THE INFORMATION IN THIS STRUCTURAL AND COLLATERAL TERM SHEET IS NOT COMPLETE AND MAY BE AMENDED PRIOR TO THE TIME OF SALE. THIS TERM SHEET IS NOT AN OFFER TO SELL THESE SECURITIES AND IT IS NOT A SOLICITATION OF AN OFFER TO BUY THESE SECURITIES IN ANY JURISDICTION WHERE THE OFFER OR SALE IS NOT PERMITTED.
113
| No. 14 – Avatar Hotel |
| Loan Information | ||
Mortgage Loan Seller: |
Wells Fargo Bank, National Association | |
Credit Assessment | NR/NR/NR | |
| (Fitch/KBRA/Moody’s): | ||
Original Principal Balance: | $14,050,000 | |
Cut-off Date Principal Balance: | $ 14,050,000 | |
% of Initial Pool Balance: | 1.3% | |
Loan Purpose: | Refinance | |
Borrower Name: | Skyline Avatar House, LP | |
Sponsors(1): | Various | |
Mortgage Rate: | 5.210% | |
Note Date: | July 17, 2013 | |
Anticipated Repayment Date: | NAP | |
Maturity Date: | August 1, 2023 | |
IO Period: | None | |
Loan Term (Original): | 120 months | |
Seasoning: | 0 months | |
Amortization Term (Original): | 300 months | |
Loan Amortization Type: | Amortizing Balloon | |
Interest Accrual Method: | Actual/360 | |
Call Protection: | L(24),D or GRTR 1% or YM(89),O(7) | |
Lockbox Type: | Soft/Springing Cash Management | |
Additional Debt(2): | Yes | |
Additional Debt Type(2)(3): | Existing and Future Mezzanine Debt |
Escrows and Reserves:
| Type: | Initial | Monthly | Cap (If Any) | |||
Taxes | $71,595 | $14,319 | NAP | |||
Insurance(4) | $0 | Springing | NAP | |||
FF&E | $0 | $17,121 | NAP | |||
PIP Reserve(5) | $0 | Springing | NAP | |||
|
| Property Information | ||
Single Asset/Portfolio: |
Single Asset | |
Property Type: | Hospitality | |
Specific Property Type: | Limited Service | |
Location: | Santa Clara, CA | |
Size: | 168 rooms | |
| Cut-off Date Principal | ||
| Balance Per Room: | $83,631 | |
Year Built/Renovated: | 1985/2010 | |
Title Vesting: | Fee | |
Property Manager: | Joie de Vivre Hospitality, LLC | |
3rd Most Recent Occupancy (As of): | 65.4% (12/31/2010) | |
2nd Most Recent Occupancy (As of): | 59.4% (12/31/2011) | |
Most Recent Occupancy (As of): | 63.2% (12/31/2012) | |
Current Occupancy (As of): | 63.8% (4/30/2013) | |
Underwriting and Financial Information:
| ||
| 3rdMost Recent NOI (As of): | $1,408,429 (12/31/2011) | |
2ndMost Recent NOI (As of): | $1,982,733 (12/31/2012) | |
Most Recent NOI (As of) | $2,129,644 (TTM 4/30/2013) | |
| U/W Revenues: | $5,136,354 | |
U/W Expenses: | $3,239,697 | |
U/W NOI: | $1,896,657 | |
U/W NCF: | $1,691,203 | |
U/W NOI DSCR: | 1.88x | |
U/W NCF DSCR: | 1.68x | |
U/W NOI Debt Yield: | 13.5% | |
U/W NCF Debt Yield: | 12.0% | |
As-Is Appraised Value: | $24,800,000 | |
As-Is Appraisal Valuation Date: | May 29, 2013 | |
Cut-off Date LTV Ratio: | 56.7% | |
LTV Ratio at Maturity or ARD: | 42.7% | |
| ||
| (1) | The sponsors are Robert Michael House individually and as the trustee for the House Family Trust and Richard C. Ronald individually and as the trustee of the Panoramic Revocable Trust. |
| (2) | The equity interests in the borrower have been pledged to secure mezzanine indebtedness with a balance as of the Cut-off Date of $1,308,699. The mezzanine indebtedness was provided by Skyline 61, Holiday, LP, which owns a 49.1% beneficial interest in the borrower. The mezzanine lender does not have notice and cure rights or rights to purchase the Avatar Hotel mortgage loan. The mezzanine indebtedness is only payable out of excess cash flow after all property expenses, escrows and the Avatar Hotel mortgage loan debt service payments have been made. |
| (3) | Future mezzanine debt is permitted subject to the following conditions: (i) the combined loan-to-value will not be greater than 70.0%; (ii) the combined debt service coverage ratio will not be less than 1.50x; (iii) the combined debt yield is not less than 12.0%; and (iv) the delivery of mezzanine loan documents are reasonably acceptable to lender and acceptable to Fitch, KBRA and Moody’s. |
| (4) | Monthly insurance escrows are not required provided the following conditions are satisfied: (i) no event of default exists and is continuing; (ii) the Avatar Hotel Property is covered under a blanket policy acceptable to the lender; and (iii) the borrower provides the lender evidence of renewal of the policies and timely payment of insurance premiums when due. |
| (5) | Deposits into a PIP Reserve totaling 125.0% of the required PIP will commence if imposed by a franchisor. |
The Avatar Hotel mortgage loan is evidenced by a single promissory note that is secured by a first mortgage encumbering a 168-room, limited service hotel located in Santa Clara, California (the “Avatar Hotel Property”). The Avatar Hotel Property was acquired by the borrower in 2008 and a $3.9 million renovation was completed in 2010. Upgrades included new furniture, carpet, mattresses, bedding, drapes and flat-screen televisions. Hotel amenities include complimentary parking, concierge services, an on-site 24-hour IHOP restaurant with direct access from the hotel lobby, laundry/dry cleaning, complimentary newspaper, luggage storage, approximately 2,900 square feet of meeting space, a heated pool, a whirlpool, a fitness center, a 24-hour business center and free shuttle services to attractions in the vicinity. Room features include high definition televisions, iPod docking stations, high-speed internet, a single serving coffee maker and a refrigerator. Executive rooms include additional amenities such as complimentary breakfast, upgraded Wi-Fi, and a larger flat-screen television. The Avatar Hotel Property is located in Silicon Valley at the intersection of Great America Parkway and Mission College Boulevard in Santa Clara, California with access to Highway 101, Interstate 280, State Route 237, State Route 87, Central Expressway and El Camino Real. The Avatar Hotel Property is located approximately seven miles northwest of downtown San Jose, four miles northwest of the San Jose International Airport, one mile south of the Great America Theme Park, and approximately one mile south of both the new San Francisco 49ers football stadium and the Santa Clara Convention Center, which
THE INFORMATION IN THIS STRUCTURAL AND COLLATERAL TERM SHEET IS NOT COMPLETE AND MAY BE AMENDED PRIOR TO THE TIME OF SALE. THIS TERM SHEET IS NOT AN OFFER TO SELL THESE SECURITIES AND IT IS NOT A SOLICITATION OF AN OFFER TO BUY THESE SECURITIES IN ANY JURISDICTION WHERE THE OFFER OR SALE IS NOT PERMITTED.
114
AVATAR HOTEL
contains approximately 302,000 square feet of convention space. Santa Clara County is home to the largest concentration of technology corporations and major employers include Cisco Systems, County of Santa Clara, Apple Computer Inc., and Stanford University. The Avatar Hotel Property is managed by Joie de Vivre Hospitality, LLC (“JDV”), California’s largest boutique hotelier. JDV merged with Thompson Hotels in 2011 to form Commune Hotels & Resorts. Key executives of Commune include John Pritzker, son of the late Hyatt Hotels founder Jay Pritzker; Jason Pomeranc, the cofounder of Thompson Hotels; and CEO Niki Leondakis, the former President and COO of Kimpton Hotels and Restaurant Group. The management agreement expires in June 2016 with one, 10-year renewal option.
Sources and Uses
Sources | Uses | |||||||||||
Original loan amount | $14,050,000 | 100.0% | Loan payoff | $9,751,652 | 69.4% | |||||||
Reserves | 71,595 | 0.5 | ||||||||||
Closing costs | 1,472,311 | 10.5 | ||||||||||
Return of equity | 2,754,441 | 19.6 | ||||||||||
Total Sources | $14,050,000 | 100.0% | Total Uses | $14,050,000 | 100.0% |
The following table presents certain information relating the historical performance of the Avatar Hotel Property compared to the performance of a competitive set of properties as provided in a third party hospitality report:
Subject and Market Historical Occupancy, ADR and RevPAR(1)
Competitive Set | Avatar Hotel | Penetration Factor | ||||||||||||||||
|
|
| ||||||||||||||||
| Year | Occupancy | ADR | RevPAR | Occupancy | ADR | RevPAR | Occupancy | ADR | RevPAR | |||||||||
|
|
|
|
|
|
|
| |||||||||||
5/31/2013 TTM | 67.1% | $118.08 | $79.26 | 64.3% | $126.05 | $81.03 | 95.8% | 106.8% | 102.2% | |||||||||
5/31/2012 TTM | 60.7% | $110.05 | $66.83 | 61.9% | $110.86 | $68.67 | 102.0% | 100.7% | 102.8% | |||||||||
5/31/2011 TTM | 54.0% | $106.09 | $57.25 | 62.1% | $95.70 | $59.38 | 115.0% | 90.2% | 103.7% | |||||||||
| (1) | Information obtained from a third party hospitality report dated June 19, 2013. According to such third party hospitality report, the competitive set includes the following hotels: Ramada Silicon Valley, Biltmore Hotel & Suites, The Plaza Suites and Country Inn & Suites Sunnyvale. |
Operating History and Underwritten Net Cash Flow. The following table represents certain information relating to the historical operating performance and the Underwritten Net Cash Flow at the Avatar Hotel Property:
Cash Flow Analysis
| 2011 | 2012 | TTM 4/30/2013 | U/W | U/W $ per Room | ||||||||||||||||
Occupancy | 59.4% | 63.2% | 63.8% | 63.8% | ||||||||||||||||
ADR | $108.10 | $121.60 | $125.59 | $124.92 | ||||||||||||||||
RevPAR | $64.18 | $76.85 | $80.18 | $80.24 | ||||||||||||||||
Total Revenue | $4,134,048 | $4,931,460 | $5,136,354 | $5,136,354 | $30,574 | |||||||||||||||
Total Department Expenses | 1,325,528 | 1,402,667 | 1,460,544 | 1,465,573 | 8,724 | |||||||||||||||
|
|
|
|
|
|
|
|
|
| |||||||||||
Gross Operating Profit | $2,808,520 | $3,528,792 | $3,675,810 | $3,670,781 | $21,850 | |||||||||||||||
Total Undistributed Expenses | 1,203,469 | 1,337,180 | 1,340,442 | 1,567,822 | 9,332 | |||||||||||||||
|
|
|
|
|
|
|
|
|
| |||||||||||
Profit Before Fixed Charges | $1,605,051 | $2,191,612 | $2,335,368 | $2,102,959 | $12,518 | |||||||||||||||
Total Fixed Charges | 196,622 | 208,879 | 205,724 | 206,302 | 1,228 | |||||||||||||||
|
|
|
|
|
|
|
|
|
| |||||||||||
Net Operating Income | $1,408,429 | $1,982,733 | $2,129,644 | $1,896,657 | $11,290 | |||||||||||||||
FF&E | 0 | 0 | 0 | 205,454 | 1,223 | |||||||||||||||
|
|
|
|
|
|
|
|
|
| |||||||||||
Net Cash Flow | $1,408,429 | $1,982,733 | $2,129,644 | $1,691,203 | $10,067 | |||||||||||||||
NOI DSCR | 1.40x | 1.97x | 2.12x | 1.88x | ||||||||||||||||
NCF DSCR | 1.40x | 1.97x | 2.12x | 1.68x | ||||||||||||||||
NOI DY | 10.0% | 14.1% | 15.2% | 13.5% | ||||||||||||||||
NCF DY | 10.0% | 14.1% | 15.2% | 12.0% | ||||||||||||||||
THE INFORMATION IN THIS STRUCTURAL AND COLLATERAL TERM SHEET IS NOT COMPLETE AND MAY BE AMENDED PRIOR TO THE TIME OF SALE. THIS TERM SHEET IS NOT AN OFFER TO SELL THESE SECURITIES AND IT IS NOT A SOLICITATION OF AN OFFER TO BUY THESE SECURITIES IN ANY JURISDICTION WHERE THE OFFER OR SALE IS NOT PERMITTED.
115
| No. 15 – AutoZone Center |
| Loan Information | ||
Mortgage Loan Seller: |
Liberty Island Group I LLC | |
Credit Assessment (Fitch/KBRA/Moody’s): | NR/NR/NR | |
Original Principal Balance: | $13,860,000 | |
Cut-off Date Principal Balance: |
$13,844,175 | |
% of Initial Pool Balance: |
1.3% | |
| Loan Purpose: | Acquisition | |
| Borrower Name: | Prosperity Center LLC d/b/a Prosperity Shopping Center LLC | |
| Sponsors: |
Frederick A. Hessick II; William H. Hessick III | |
| Mortgage Rate: | 4.690% | |
| Note Date: | June 21, 2013 | |
Anticipated Repayment Date: |
NAP | |
Maturity Date: |
July 1, 2023 | |
| IO Period: | None | |
| Loan Term (Original): | 120 months | |
Seasoning: |
1 month | |
Amortization Term (Original): |
360 months | |
Loan Amortization Type: |
Amortizing Balloon | |
Interest Accrual Method: |
Actual/360 | |
Call Protection: |
L(25),D(91),O(4) | |
| Lockbox Type: |
Soft/Springing Cash Management | |
| Additional Debt: |
None | |
| Additional Debt Type: |
NAP | |
Escrows and Reserves:
| Type: | Initial | Monthly | Cap (If Any) | |||
Taxes | $52,505 | $17,502 | NAP | |||
Insurance | $5,902 | $1,180 | NAP | |||
Replacement Reserves(1) | $280,100 | $1,100 | NAP | |||
TI/LC Reserve(2) | $10,000 | $10,000 | $480,000 | |||
Deferred Maintenance Reserve(3) | $69,250 | $0 | NAP | |||
|
| Property Information | ||
Single Asset/Portfolio: |
Single Asset | |
| Property Type: | Retail | |
| Specific Property Type: | Unanchored | |
Location: |
Leesburg, VA | |
Size: |
66,052 SF | |
Cut-off Date Principal Balance Per SF: | $209.60 | |
| Year Built/Renovated: | 1987/NAP | |
| Title Vesting: | Fee | |
| Property Manager: | Rappaport Management Company | |
3rd Most Recent Occupancy (As of): |
86.0% (12/31/2010) | |
2nd Most Recent Occupancy (As of): |
85.0% (12/31/2011) | |
Most Recent Occupancy (As of): |
92.0% (12/31/2012) | |
Current Occupancy (As of): |
95.2% (4/1/2013) | |
| Underwriting and Financial Information: | ||
| 3rdMost Recent NOI (As of): | $1,067,506 (12/31/2010) | |
2ndMost Recent NOI (As of): |
$1,117,549 (12/31/2011) | |
Most Recent NOI (As of): |
$1,140,338 (12/31/2012) | |
| U/W Revenues: | $1,840,988 | |
U/W Expenses: |
$452,273 | |
U/W NOI(4): |
$1,388,715 | |
U/W NCF: |
$1,317,772 | |
U/W NOI DSCR: |
1.61x | |
U/W NCF DSCR: |
1.53x | |
U/W NOI Debt Yield: |
10.0% | |
U/W NCF Debt Yield: |
9.5% | |
As-Is Appraised Value: |
$19,400,000 | |
As-Is Appraisal Valuation Date: |
April 17, 2013 | |
Cut-off Date LTV Ratio: |
71.4% | |
LTV Ratio at Maturity or ARD: |
58.1% | |
| (1) | The borrower deposited $279,000 at closing into the replacement reserve, which represents the cost identified in the engineering report as roof replacement ($264,000) and repairs for standing seam metal roofs ($15,000) in year two of the AutoZone Center mortgage loan. The lender has further required monthly deposits of $1,100 into the replacement reserve for the future repair or replacement of those items identified in the engineering report. |
| (2) | The borrower established a leasing reserve at loan closing, into which monthly deposits of $10,000 per month will be made with a cap of $480,000. The cap is applicable after the lender has received satisfactory notification that the AutoZone tenant has not exercised its termination right. Then, if the reserve exceeds the cap, monthly deposits will not be required. Funds in the leasing reserve can be applied to future tenant improvement costs and leasing commissions, subject to any limitations and conditions specified in the loan documents. |
| (3) | The borrower deposited $69,250 into a deferred maintenance reserve at closing. All immediate repairs identified in the engineering report must be completed on or before 180 days from closing, and the borrower must provide the lender with satisfactory evidence that such work has been completed. |
| (4) | See “Cash Flow Analysis” section for detail on the increase from Most Recent NOI to U/W NOI. |
The AutoZone Center mortgage loan is evidenced by a single promissory note that is secured by a first mortgage encumbering a 66,052 square foot unanchored retail property located in Leesburg, Virginia (the “AutoZone Center Property”). The AutoZone Center Property was built in 1987 and is situated on a 5.5 acre site. Parking at the AutoZone Center Property is provided by 251 surface spaces, resulting in a parking ratio of 3.8 spaces per 1,000 square feet of rentable area. As of April 1, 2013, the AutoZone Center Property was 95.2% leased to 21 tenants.
116
AUTOZONE CENTER
Sources and Uses
Sources | Uses | |||||||||||
Original loan amount | $13,860,000 | 73.2% | Purchase price | $18,200,000 | 96.2% | |||||||
Sponsor’s new cash contribution | 4,271,294 | 22.6 | Reserves | 417,758 | 2.2 | |||||||
Other sources | 791,444 | 4.2 | Closing costs | 304,980 | 1.6 | |||||||
Total Sources | $18,922,738 | 100.0% | Total Uses | $18,922,738 | 100.0% |
The following table presents certain information relating to the tenancies at the AutoZone Center Property:
Major Tenants
| Tenant Name | Credit Rating (Fitch/ Moody’s/ S&P)(1) | Tenant NRSF | % of NRSF | Annual U/W Base Rent PSF | Annual U/W Base | % of Total Annual U/W Base Rent | Lease Expiration Date | |||||||||||||||||
Major Tenants | ||||||||||||||||||||||||
AutoZone | BBB/Baa2/BBB | 8,327 | 12.6% | $25.00 | $208,175 | 13.7% | 11/30/2022 | |||||||||||||||||
Dance Academy of Loudoun | NR/NR/NR | 8,493 | 12.9% | $23.15 | $196,634 | 12.9% | 7/31/2015 | |||||||||||||||||
Hope’s Treasures | NR/NR/NR | 8,601 | 13.0% | $22.28 | $191,621 | 12.6% | 10/31/2017 | |||||||||||||||||
Wells Fargo | AA-/A2/A+ | 2,552 | 3.9% | $45.00 | $114,840 | 7.5% | 5/31/2020 | |||||||||||||||||
LA Boxing | NR/NR/NR | 6,773 | 10.3% | $15.00 | $101,595 | 6.7% | 3/31/2023 | |||||||||||||||||
|
|
|
| |||||||||||||||||||||
Total Major Tenants | 34,746 | 52.6% | $23.39 | $812,865 | 53.4% | |||||||||||||||||||
Non-Major Tenants
|
| 28,111
|
|
| 42.6%
|
|
| $25.22
|
|
| $708,936
|
|
| 46.6%
|
| |||||||||
|
|
|
| |||||||||||||||||||||
Occupied Collateral Total |
|
62,857 |
|
|
95.2% |
| $24.21 | $1,521,801 | 100.0% | |||||||||||||||
|
| |||||||||||||||||||||||
Vacant Space | 3,195 | |||||||||||||||||||||||
|
4.8% |
| ||||||||||||||||||||||
|
| |||||||||||||||||||||||
Collateral Total |
|
66,052 |
|
|
100.0% |
| ||||||||||||||||||
|
| |||||||||||||||||||||||
(1) Certain ratings are those of the parent company whether or not the parent guarantees the lease. | ||||||||||||||||||||||||
The following table presents certain information relating to the lease rollover schedule at the AutoZone Center Property:
Lease Expiration Schedule(1)(2)
Year Ending December 31, | No. of Leases Expiring | Expiring NRSF | % of Total NRSF | Cumulative Expiring NRSF | Cumulative % of Total NRSF | Annual U/W Base | Annual U/W | |||||||||||||||||
MTM | 0 | 0 | 0.0 | % | 0 | 0.0% | $0 | $0.00 | ||||||||||||||||
2013 | 0 | 0 | 0.0 | % | 0 | 0.0% | $0 | $0.00 | ||||||||||||||||
2014 | 3 | 5,787 | 8.8 | % | 5,787 | 8.8% | $169,448 | $29.28 | ||||||||||||||||
2015 | 3 | 11,733 | 17.8 | % | 17,520 | 26.5% | $263,262 | $22.44 | ||||||||||||||||
2016 | 3 | 4,065 | 6.2 | % | 21,585 | 32.7% | $102,365 | $25.18 | ||||||||||||||||
2017 | 3 | 12,062 | 18.3 | % | 33,647 | 50.9% | $270,585 | $22.43 | ||||||||||||||||
2018 | 2 | 3,848 | 5.8 | % | 37,495 | 56.8% | $91,290 | $23.72 | ||||||||||||||||
2019 | 1 | 2,229 | 3.4 | % | 39,724 | 60.1% | $44,580 | $20.00 | ||||||||||||||||
2020 | 2 | 4,594 | 7.0 | % | 44,318 | 67.1% | $183,516 | $39.95 | ||||||||||||||||
2021 | 2 | 3,439 | 5.2 | % | 47,757 | 72.3% | $86,984 | $25.29 | ||||||||||||||||
2022 | 1 | 8,327 | 12.6 | % | 56,084 | 84.9% | $208,175 | $25.00 | ||||||||||||||||
2023 | 1 | 6,773 | 10.3 | % | 62,857 | 95.2% | $101,595 | $15.00 | ||||||||||||||||
Thereafter | 0 | 0 | 0.0 | % | 62,857 | 95.2% | $0 | $0.00 | ||||||||||||||||
Vacant | 0 | 3,195 | 4.8 | % | 66,052 | 100.0% | $0 | $0.00 | ||||||||||||||||
Total/Weighted Average | 21 | 66,052 | 100.0 | % | $1,521,801 | $24.21 | ||||||||||||||||||
| (1) | Information was obtained from the underwritten rent roll. |
| (2) | Certain tenants may have lease termination options that are exercisable prior to the originally stated expiration date of the subject lease and that are not considered in the Lease Expiration Schedule. |
| (3) | Weighted Average Annual U/W Base Rent PSF excludes vacant space. |
THE INFORMATION IN THIS STRUCTURAL AND COLLATERAL TERM SHEET IS NOT COMPLETE AND MAY BE AMENDED PRIOR TO THE TIME OF SALE. THIS TERM SHEET IS NOT AN OFFER TO SELL THESE SECURITIES AND IT IS NOT A SOLICITATION OF AN OFFER TO BUY THESE SECURITIES IN ANY JURISDICTION WHERE THE OFFER OR SALE IS NOT PERMITTED.
117
AUTOZONE CENTER
The following table presents historical occupancy percentages at the AutoZone Center Property:
Historical Occupancy(1)
12/31/2010 �� | 12/31/2011 | 12/31/2012 | 4/1/2013 | |||||||||
86.0% | 85.0% | 92.0% | 95.2% | |||||||||
(1) Information obtained from underwritten rent roll. | ||||||||||||
Operating History and Underwritten Net Cash Flow. The following table presents certain information relating to the historical operating performance and the Underwritten Net Cash Flow at the AutoZone Center Property:
Cash Flow Analysis
| 2010 | 2011 | 2012 | U/W | U/W $ per SF | ||||||||||||||||
Base Rent | $1,500,632 | $1,513,001 | $1,600,345 | $1,521,801 | $23.04 | |||||||||||||||
Grossed Up Vacant Space | 0 | 0 | 0 | 75,960 | 1.15 | |||||||||||||||
Total Reimbursables | 338,976 | 396,602 | 328,345 | 423,082 | 6.41 | |||||||||||||||
Other Income | 14,651 | 6,873 | (1,419) | 0 | 0.00 | |||||||||||||||
Less Vacancy & Credit Loss | (312,155) | (360,671) | (370,649) | (179,855)(1) | (2.72) | |||||||||||||||
|
|
|
|
|
|
|
|
|
| |||||||||||
Effective Gross Income | $1,542,104 | $1,555,805 | $1,556,623 | $1,840,988 | $27.87 | |||||||||||||||
Total Operating Expenses | $474,598 | $438,256 | $416,285 | $452,273 | $6.85 | |||||||||||||||
|
|
|
|
|
|
|
|
|
| |||||||||||
Net Operating Income | $1,067,506 | $1,117,549 | $1,140,338 | $1,388,715(2) | $21.02 | |||||||||||||||
TI/LC | 0 | 0 | 0 | 57,739 | 0.87 | |||||||||||||||
Capital Expenditures | 0 | 0 | 0 | 13,204 | 0.20 | |||||||||||||||
|
|
|
|
|
|
|
|
|
| |||||||||||
Net Cash Flow | $1,067,506 | $1,117,549 | $1,140,338 | $1,317,772 | $19.95 | |||||||||||||||
NOI DSCR | 1.24x | 1.30x | 1.32x | 1.61x | ||||||||||||||||
NCF DSCR | 1.24x | 1.30x | 1.32x | 1.53x | ||||||||||||||||
NOI DY | 7.7% | 8.1% | 8.2% | 10.0% | ||||||||||||||||
NCF DY | 7.7% | 8.1% | 8.2% | 9.5% | ||||||||||||||||
| (1) | The underwritten economic vacancy is 8.9%. The AutoZone Center Property was 95.2% physically occupied as of April 1, 2013. |
| (2) | The increase in U/W Net Operating Income since 2011 is due to the increase in occupancy from 85.0% as of December 31, 2011 to 95.2% as of April 1, 2013. New leases comprising 26.2% of the net rentable area were executed in December of 2012. In addition there were increases due to the exclusion of historical rent abatements, which are no longer being offered, as well as underwriting additional expense reimbursements as the occupancy has increased. |
THE INFORMATION IN THIS STRUCTURAL AND COLLATERAL TERM SHEET IS NOT COMPLETE AND MAY BE AMENDED PRIOR TO THE TIME OF SALE. THIS TERM SHEET IS NOT AN OFFER TO SELL THESE SECURITIES AND IT IS NOT A SOLICITATION OF AN OFFER TO BUY THESE SECURITIES IN ANY JURISDICTION WHERE THE OFFER OR SALE IS NOT PERMITTED.
118
| WFRBS Commercial Mortgage Trust 2013-C15 | Transaction Contact Information |
VI. Transaction Contact Information
Questions regarding this Structural and Collateral Term Sheet may be directed to any of the following individuals:
| RBS Securities Inc. | Wells Fargo Securities, LLC | |||||
| Todd Jaeger - Trading | Tel. (203) 897-2900 | Brigid Mattingly | Tel. (312) 269-3062 | |||
| Fax (312) 658-0140 | ||||||
| Adam Ansaldi | Tel. (203) 897-0881 | A.J. Sfarra | Tel. (212) 214-5613 | |||
| Fax (203) 873-3542 | Fax (212) 214-8970 | |||||
| Jim Barnard | Tel. (203) 897-4417 | Alex Wong | Tel. (212) 214-5615 | |||
| Fax (203) 873-4310 | Fax (212) 214-8970 | |||||
THE INFORMATION IN THIS STRUCTURAL AND COLLATERAL TERM SHEET IS NOT COMPLETE AND MAY BE AMENDED PRIOR TO THE TIME OF SALE. THIS TERM SHEET IS NOT AN OFFER TO SELL THESE SECURITIES AND IT IS NOT A SOLICITATION OF AN OFFER TO BUY THESE SECURITIES IN ANY JURISDICTION WHERE THE OFFER OR SALE IS NOT PERMITTED.
119