UNITED STATES
SECURITIES AND EXCHANGE COMMISSION
Washington, D.C. 20549
FORM N-CSR
CERTIFIED SHAREHOLDER REPORT OF REGISTERED
MANAGEMENT INVESTMENT COMPANIES
| INVESTMENT COMPANY ACT FILE NUMBER: | 811-22887 |
| | |
| EXACT NAME OF REGISTRANT AS SPECIFIED IN CHARTER: | Calamos ETF Trust |
| | |
| ADDRESS OF PRINCIPAL EXECUTIVE OFFICES: | 2020 Calamos Court, Naperville |
| | Illinois 60563-2787 |
| | |
| | |
| NAME AND ADDRESS OF AGENT FOR SERVICE: | John P Calamos, Sr., c/o Calamos Advisors LLC 2020 Calamos Court, Naperville, Illinois 60563-2787 |
| REGISTRANT’S TELEPHONE NUMBER, INCLUDING AREA CODE: | (630) 245-7200 |
| DATE OF FISCAL YEAR END: | July 31, 2024 |
| DATE OF REPORTING PERIOD: | August 1, 2023 through July 31, 2024 |
Item 1: Reports to Shareholders.
TABLE OF CONTENTS
Annual Shareholder Report - July 31, 2024
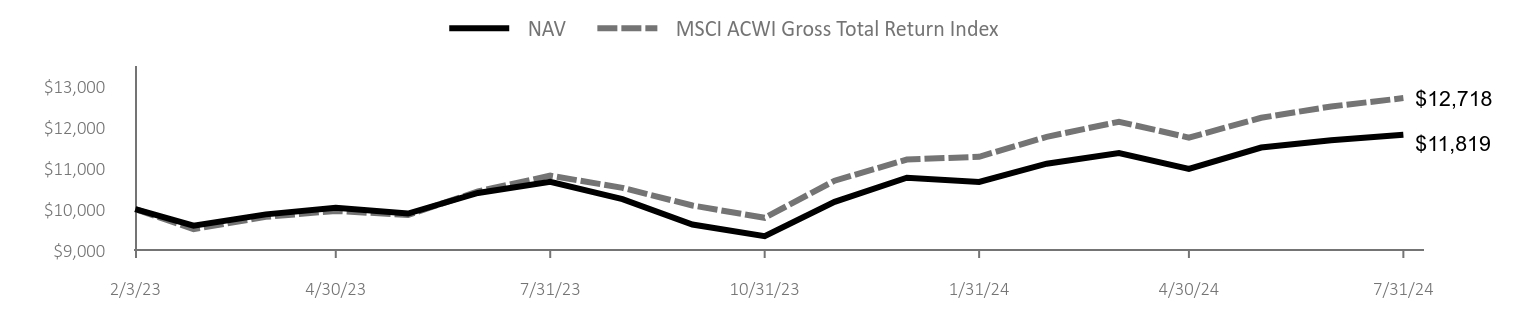
This annual shareholder report contains important information about the Calamos Antetokounmpo Global Sustainable Equities ETF for the period of February 3, 2023 to July 31, 2024. You can find additional information about the Fund at www.calamos.com/resources. You can also request this information by contacting us at 866-363-9219.
WHAT WERE THE FUND COSTS FOR THE LAST YEAR?
(based on a hypothetical $10,000 investment)
| Fund Ticker | Costs of a $10,000 Investment | Costs Paid as a Percentage of a $10,000 Investment |
|---|
| SROI | $100 | 0.95% |
The Fund generated a strong double-digit return but lagged behind the MSCI ACWI Index, dominated by six US AI-related names that accounted for over 35% of the Index’s return. The Fund was invested in five of those six names but was slightly underweight. Those companies collectively generate strong cash flows but are richly valued, and the Fund pursues a more diversified, risk-conscious approach. Additionally, investments in the financials sector lagged as holdings in overseas financials underperformed. A zero weight in the energy sector was additive to performance. We avoid companies with less sustainable business practices and have yet to find renewable energy companies that meet our standards. We believe the Fund’s focus on quality businesses has benefited performance, but stocks with strong momentum have been the market’s top performers during the period.
| NAV | MSCI ACWI Gross Total Return Index |
|---|
| 2/3/23 | $10,000 | $9,999 |
| 2/28/23 | $9,596 | $9,511 |
| 3/31/23 | $9,872 | $9,811 |
| 4/30/23 | $10,036 | $9,957 |
| 5/31/23 | $9,892 | $9,857 |
| 6/30/23 | $10,396 | $10,434 |
| 7/31/23 | $10,668 | $10,819 |
| 8/31/23 | $10,244 | $10,521 |
| 9/30/23 | $9,624 | $10,089 |
| 10/31/23 | $9,340 | $9,788 |
| 11/30/23 | $10,180 | $10,696 |
| 12/31/23 | $10,769 | $11,214 |
| 1/31/24 | $10,664 | $11,282 |
| 2/29/24 | $11,112 | $11,770 |
| 3/31/24 | $11,375 | $12,140 |
| 4/30/24 | $10,987 | $11,751 |
| 5/31/24 | $11,508 | $12,236 |
| 6/30/24 | $11,686 | $12,513 |
| 7/31/24 | $11,819 | $12,718 |
AVERAGE ANNUAL TOTAL RETURNS (%)
| 1 YEAR | SINCE INCEPTION 2/3/23 |
|---|
| NAV | 10.74 | 11.61 |
| Market Price | 10.79 | 11.86 |
| MSCI ACWI Gross Total Return Index | 17.55 | 17.50 |
The Fund's past performance is not a good predictor of the Fund's future performance.
The graph and table do not reflect the deduction of taxes that a shareholder would pay on fund distributions or redemption of fund shares. Principal value and investment return of an investment will fluctuate so that your shares, when redeemed, may be worth more or less than their original cost. Average annual total return measures net investment income and capital gain or loss from portfolio investments as an annualized average. All performance shown assumes reinvestment of dividends and capital gains distributions. Visit https://www.calamos.com/funds/etf for the most recent performance information.
| Total Net Assets | # of Portfolio Holdings | Portfolio Turnover Rate | Total Advisory Fees Paid |
|---|
| $11,784,496 | 106 | 25% | $102,141 |
Calamos Antetokounmpo Global Sustainable Equities ETF
Annual Shareholder Report - July 31, 2024
WHAT DID THE FUND INVEST IN?
The multi-cap equity Fund employs an integrated, fundamental, and proprietary sustainable process to evaluate and select what we deem to be high-quality growth companies around the globe that have strong financial metrics and address nonfinancial risks related to governance, ecological impact, and human development.
Sector weightings and top 10 holdings exclude, if any, cash or cash equivalents.
| Information Technology | 25.4 |
| Industrials | 13.6 |
| Health Care | 12.8 |
| Financials | 12.7 |
| Consumer Discretionary | 9.6 |
| Consumer Staples | 7.4 |
| Communication Services | 6.3 |
| Materials | 5.0 |
| Utilities | 3.1 |
| Real Estate | 1.3 |
| Microsoft Corp. | 4.7 |
| Alphabet, Inc., Class A | 4.5 |
| Apple, Inc. | 4.0 |
| Taiwan Semiconductor Manufacturing Co. Ltd. | 3.8 |
| NVIDIA Corp. | 2.4 |
| SAP SE | 1.9 |
| Visa, Inc., Class A | 1.6 |
| TJX Cos., Inc. | 1.5 |
| Novo Nordisk AS, Class B | 1.4 |
| Costco Wholesale Corp. | 1.4 |
For additional information about the Fund, including its prospectus, financial information, holdings and proxy information, please visit www.calamos.com/resources. You can also request information by contacting us at 866-363-9219.
©2024 Calamos Investments LLC. All Rights Reserved. Calamos® and Calamos Investments® are registered trademarks of Calamos Investments LLC.
Calamos Investments LLC | 2020 Calamos Court | Naperville, IL 60563 | 866-363-9219 | www.calamos.com |SROITSRA 24
Annual Shareholder Report - July 31, 2024
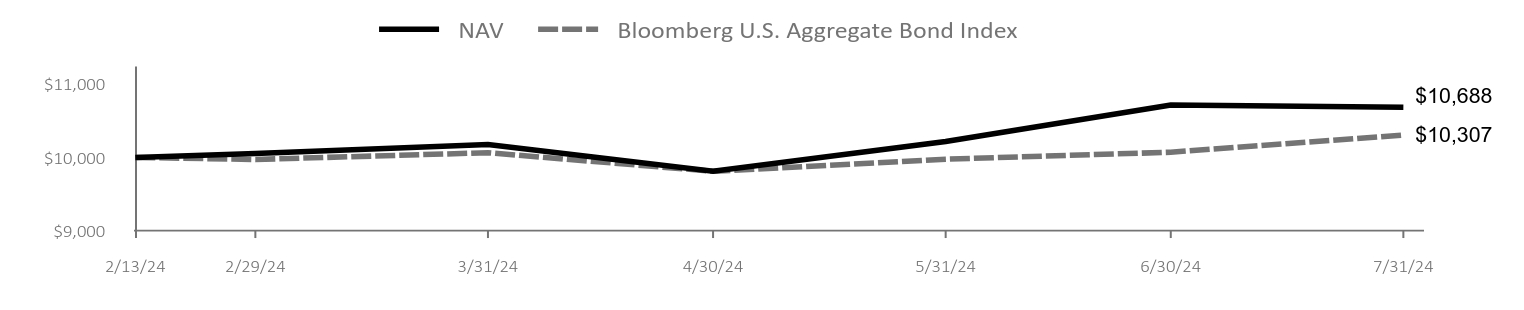
This annual shareholder report contains important information about the Calamos Alternative Nasdaq & Bond ETF for the period of February 13, 2024 to July 31, 2024. You can find additional information about the Fund at www.calamos.com/resources. You can also request this information by contacting us at 866-363-9219.
WHAT WERE THE FUND COSTS FOR THE LAST YEAR?
(based on a hypothetical $10,000 investment)
| Fund Ticker | Costs of a $10,000 Investment | Costs Paid as a Percentage of a $10,000 Investment |
|---|
| CANQ | $37Footnote Reference* | 0.77% |
| Footnote | Description |
Footnote* | The period from inception to the date of this report is less than a full reporting period. Expenses for a full reporting period would be higher. |
Since its inception on February 13, 2024, through July 31, 2024, the Fund performed as expected, outperforming the Bloomberg US Aggregate Bond Index and participating in the upside of the Nasdaq-100 Total Return Index®. Broadly speaking, during the reporting period, investors were enthusiastic about the prospects of growth businesses and, specifically, AI and tech-related companies. In addition, the Fund provided lower volatility than the Nasdaq-100 Index® through its use of fixed income and options on Nasdaq-100-related securities. Importantly, during market downturns within the Nasdaq-100 Index, the Fund provided better downside protection for investors, notably in market sell-offs during mid-April and the latter part of July.
| NAV | Bloomberg U.S. Aggregate Bond Index |
|---|
| 2/13/24 | $10,000 | $10,001 |
| 2/29/24 | $10,056 | $9,973 |
| 3/31/24 | $10,177 | $10,065 |
| 4/30/24 | $9,811 | $9,811 |
| 5/31/24 | $10,219 | $9,977 |
| 6/30/24 | $10,716 | $10,072 |
| 7/31/24 | $10,688 | $10,307 |
AVERAGE ANNUAL TOTAL RETURNS (%)
| SINCE INCEPTION 2/13/24 |
|---|
| NAV | 6.96 |
| Market Price | 6.88 |
| Bloomberg U.S. Aggregate Bond Index | 3.07 |
The Fund's past performance is not a good predictor of the Fund's future performance.
The graph and table do not reflect the deduction of taxes that a shareholder would pay on fund distributions or redemption of fund shares. Principal value and investment return of an investment will fluctuate so that your shares, when redeemed, may be worth more or less than their original cost. Average annual total return measures net investment income and capital gain or loss from portfolio investments as an annualized average. All performance shown assumes reinvestment of dividends and capital gains distributions. Visit https://www.calamos.com/funds/etf for the most recent performance information.
| Total Net Assets | # of Portfolio Holdings | Portfolio Turnover Rate | Total Advisory Fees Paid |
|---|
| $1,306,858 | 28 | 9% | $4,546 |
Calamos Alternative Nasdaq & Bond ETF
Annual Shareholder Report - July 31, 2024
WHAT DID THE FUND INVEST IN?
The Fund invests in a combination of fixed-income oriented securities and Nasdaq-100 oriented options with the intent to participate in the performance of Nasdaq-100 securities while potentially offering better downside protection.
Asset allocation and top 10 holdings exclude, if any, cash or cash equivalents.
| Exchange-Traded Funds | 86.9 |
| Purchased Options | 12.5 |
| Simplify MBS ETF | 20.1 |
| Franklin Senior Loan ETF | 19.7 |
| SPDR Portfolio High Yield Bond ETF | 17.4 |
| Vanguard Emerging Markets Government Bond ETF | 12.3 |
| Janus Henderson AAA CLO ETF | 6.6 |
| Schwab 1-5 Year Corporate Bond ETF | 4.4 |
| iShares Broad USD Investment Grade Corporate Bond ETF | 3.4 |
| Vanguard Long-Term Corporate Bond ETF | 2.9 |
| NVIDIA Corp. Call option | 2.6 |
| Broadcom, Inc. Call option | 2.3 |
For additional information about the Fund, including its prospectus, financial information, holdings and proxy information, please visit www.calamos.com/resources. You can also request information by contacting us at 866-363-9219.
©2024 Calamos Investments LLC. All Rights Reserved. Calamos® and Calamos Investments® are registered trademarks of Calamos Investments LLC.
Calamos Investments LLC | 2020 Calamos Court | Naperville, IL 60563 | 866-363-9219 | www.calamos.com |CANQTSRA 24
Annual Shareholder Report - July 31, 2024
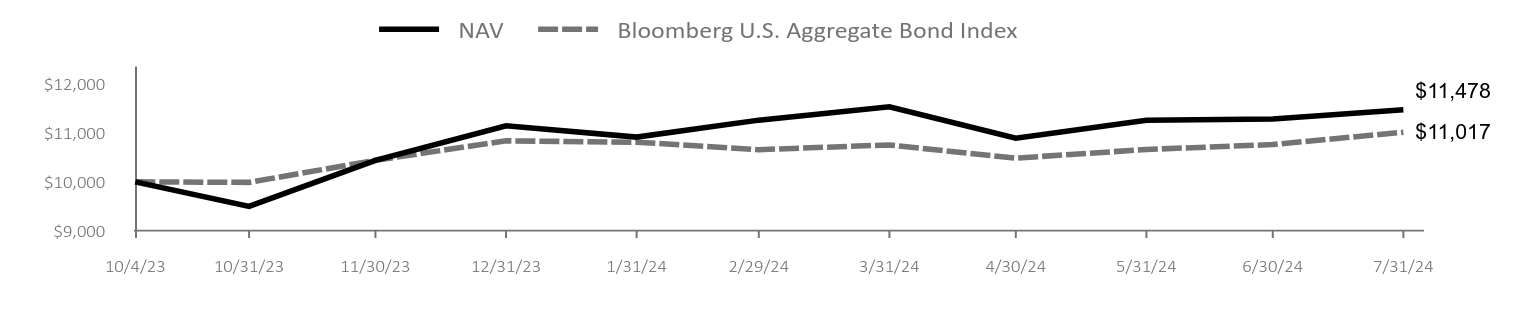
This annual shareholder report contains important information about the Calamos Convertible Equity Alternative ETF for the period of October 4, 2023 to July 31, 2024. You can find additional information about the Fund at www.calamos.com/resources. You can also request this information by contacting us at 866-363-9219.
WHAT WERE THE FUND COSTS FOR THE LAST YEAR?
(based on a hypothetical $10,000 investment)
| Fund Ticker | Costs of a $10,000 Investment | Costs Paid as a Percentage of a $10,000 Investment |
|---|
| CVRT | $61Footnote Reference* | 0.69% |
| Footnote | Description |
Footnote* | The period from inception to the date of this report is less than a full reporting period. Expenses for a full reporting period would be higher. |
The Fund generated strong double-digit returns, outperforming the broad-based Bloomberg US Aggregate Bond Index. The Fund also outperformed the ICE US Core Equity Alternative Index (+10.75%), which focuses on more equity-sensitive convertible securities similar to what the Fund invests in. Convertibles displaying a high amount of equity sensitivity benefited from the strong performance of the equity market, which was also evident in the strong gains of the convertibles’ underlying equities. Relative to the broader convertible market represented by the ICE BofA All US Convertibles Index, the Fund saw strong relative performance in the utilities and information technology sectors, while relative returns in the consumer discretionary and real estate sectors held back the result.
| NAV | Bloomberg U.S. Aggregate Bond Index |
|---|
| 10/4/23 | $10,000 | $10,000 |
| 10/31/23 | $9,497 | $9,990 |
| 11/30/23 | $10,442 | $10,443 |
| 12/31/23 | $11,150 | $10,842 |
| 1/31/24 | $10,918 | $10,813 |
| 2/29/24 | $11,266 | $10,660 |
| 3/31/24 | $11,540 | $10,758 |
| 4/30/24 | $10,897 | $10,487 |
| 5/31/24 | $11,262 | $10,664 |
| 6/30/24 | $11,289 | $10,765 |
| 7/31/24 | $11,478 | $11,017 |
AVERAGE ANNUAL TOTAL RETURNS (%)
| SINCE INCEPTION 10/4/23 |
|---|
| NAV | 14.37 |
| Market Price | 14.78 |
| Bloomberg U.S. Aggregate Bond Index | 10.17 |
The Fund's past performance is not a good predictor of the Fund's future performance.
The graph and table do not reflect the deduction of taxes that a shareholder would pay on fund distributions or redemption of fund shares. Principal value and investment return of an investment will fluctuate so that your shares, when redeemed, may be worth more or less than their original cost. Average annual total return measures net investment income and capital gain or loss from portfolio investments as an annualized average. All performance shown assumes reinvestment of dividends and capital gains distributions. Visit https://www.calamos.com/funds/etf for the most recent performance information.
| Total Net Assets | # of Portfolio Holdings | Portfolio Turnover Rate | Total Advisory Fees Paid |
|---|
| $8,214,145 | 62 | 123% | $61,845 |
Calamos Convertible Equity Alternative ETF
Annual Shareholder Report - July 31, 2024
WHAT DID THE FUND INVEST IN?
The Fund seeks to deliver total returns through capital appreciation and current income by investing primarily in a portfolio of US convertible securities exhibiting a high level of equity sensitivity.
Sector weightings and top 10 holdings exclude, if any, cash or cash equivalents.
| Information Technology | 32.4 |
| Consumer Discretionary | 19.8 |
| Health Care | 9.6 |
| Utilities | 9.4 |
| Industrials | 8.5 |
| Materials | 6.3 |
| Financials | 5.1 |
| Energy | 3.5 |
| Real Estate | 2.1 |
| Consumer Staples | 1.9 |
| Communication Services | 0.6 |
| Royal Caribbean Cruises Ltd. | 6.6 |
| Palo Alto Networks, Inc. | 6.4 |
| Western Digital Corp. | 3.8 |
| Apollo Global Management, Inc. | 3.5 |
| Seagate HDD Cayman | 3.4 |
| NextEra Energy, Inc. | 3.2 |
| Carnival Corp. | 3.2 |
| Albemarle Corp. | 3.1 |
| NextEra Energy, Inc. | 3.0 |
| Booking Holdings, Inc. | 2.8 |
For additional information about the Fund, including its prospectus, financial information, holdings and proxy information, please visit www.calamos.com/resources. You can also request information by contacting us at 866-363-9219.
©2024 Calamos Investments LLC. All Rights Reserved. Calamos® and Calamos Investments® are registered trademarks of Calamos Investments LLC.
Calamos Investments LLC | 2020 Calamos Court | Naperville, IL 60563 | 866-363-9219 | www.calamos.com |CVRTTSRA 24
Annual Shareholder Report - July 31, 2024
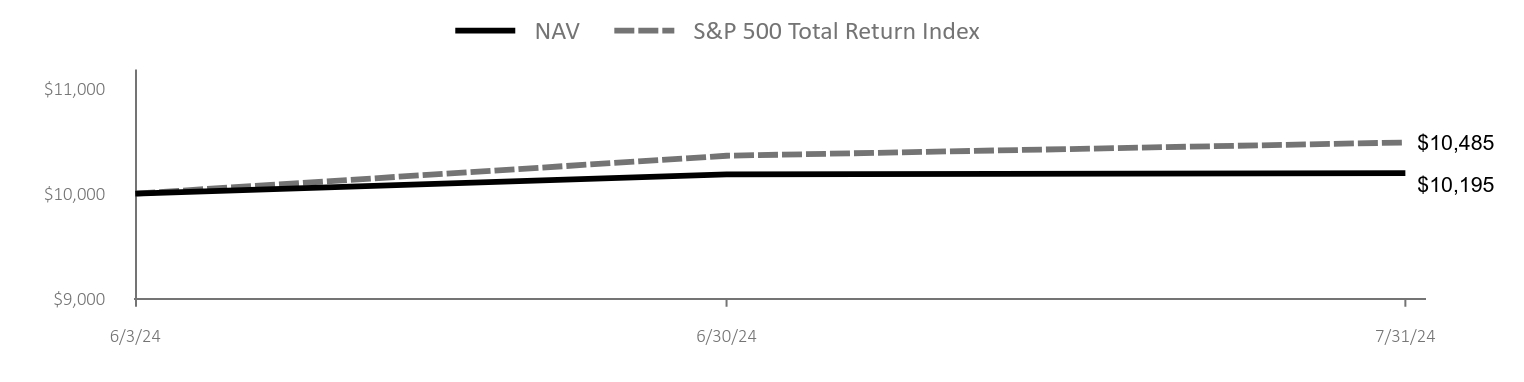
This annual shareholder report contains important information about the Calamos Nasdaq 100® Structured Alt Protection ETF™ – June for the period of June 3, 2024 to July 31, 2024. You can find additional information about the Fund at www.calamos.com/resources. You can also request this information by contacting us at 866-363-9219.
WHAT WERE THE FUND COSTS FOR THE LAST YEAR?
(based on a hypothetical $10,000 investment)
| Fund Ticker | Costs of a $10,000 Investment | Costs Paid as a Percentage of a $10,000 Investment |
|---|
| CPNJ | $11Footnote Reference* | 0.69% |
| Footnote | Description |
Footnote* | The period from inception to the date of this report is less than a full reporting period. Expenses for a full reporting period would be higher. |
Since its inception on June 3, 2024, through July 31, 2024, the Fund has delivered on its objectives of safeguarding investors’ capital, minimizing volatility, and offering upside participation in the Nasdaq-100® over the initial one-year term of the options strategies tied to Nasdaq-100 related securities. The Fund’s returns for the period reflect the value of the option strategies as of period end, understanding that the term of the option strategies still holds approximately 10 months of time value as of July 31, 2024. The option strategies also provide a predetermined level of protection for investors as of period end, unlike direct investment in equity securities.
| NAV | S&P 500 Total Return Index |
|---|
| 6/3/24 | $10,000 | $10,000 |
| 6/30/24 | $10,182 | $10,359 |
| 7/31/24 | $10,195 | $10,485 |
AVERAGE ANNUAL TOTAL RETURNS (%)
| SINCE INCEPTION 6/3/24 |
|---|
| NAV | 1.91 |
| Market Price | 1.95 |
| S&P 500 Total Return Index | 4.85 |
The Fund's past performance is not a good predictor of the Fund's future performance.
The graph and table do not reflect the deduction of taxes that a shareholder would pay on fund distributions or redemption of fund shares. The Fund cannot guarantee the desired protection, which may only be realized if shares are held from the first day of the one-year outcome period through the last day. Principal value and investment return of an investment will fluctuate so that your shares, when redeemed, may be worth more or less than their original cost. Average annual total return measures net investment income and capital gain or loss from portfolio investments as an annualized average. All performance shown assumes reinvestment of dividends and capital gains distributions. Visit https://www.calamos.com/funds/etf for the most recent performance information.
| Total Net Assets | # of Portfolio Holdings | Portfolio Turnover Rate | Total Advisory Fees Paid |
|---|
| $64,850,121 | 3 | 0% | $61,792 |
Calamos Nasdaq 100® Structured Alt Protection ETF™ – June
Annual Shareholder Report - July 31, 2024
WHAT DID THE FUND INVEST IN?
The Fund invests in a combination of FLEX® Options in order to create a predetermined risk-reward at the onset of the strategy. The Fund uses these FLEX Options to buy options on Nasdaq-100-related securities and to purchase puts at the current market price on the Fund’s inception date, in this case beginning in June 2024. The Fund also sells calls on Nasdaq-100-related securities to help pay for the put options. The sale of calls creates the cap on upside participation over the one-year period.
| Long Call Option | 101.5 |
| Long Put Option | 4.3 |
| Short Call Option | (6.5) |
For additional information about the Fund, including its prospectus, financial information, holdings and proxy information, please visit www.calamos.com/resources. You can also request information by contacting us at 866-363-9219.
©2024 Calamos Investments LLC. All Rights Reserved. Calamos® and Calamos Investments® are registered trademarks of Calamos Investments LLC.
Calamos Investments LLC | 2020 Calamos Court | Naperville, IL 60563 | 866-363-9219 | www.calamos.com |CPNJTSRA 24
Annual Shareholder Report - July 31, 2024
This annual shareholder report contains important information about the Calamos Russell 2000® Structured Alt Protection ETF™ - July for the period of July 1, 2024 to July 31, 2024. You can find additional information about the Fund at www.calamos.com/resources. You can also request this information by contacting us at 866-363-9219.
WHAT WERE THE FUND COSTS FOR THE LAST YEAR?
(based on a hypothetical $10,000 investment)
| Fund Ticker | Costs of a $10,000 Investment | Costs Paid as a Percentage of a $10,000 Investment |
|---|
| CPRJ | $6Footnote Reference* | 0.69% |
| Footnote | Description |
Footnote* | The period from inception to the date of this report is less than a full reporting period. Expenses for a full reporting period would be higher. |
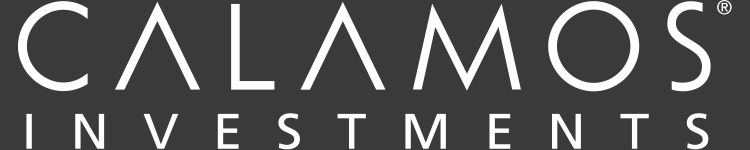
Since its inception on July 1, 2024, through July 31, 2024, the Fund has delivered on its objectives of safeguarding investors’ capital, minimizing volatility, and offering upside participation in the Russell 2000® over the initial one-year term of the options strategies tied to Russell 2000 related securities. The Fund’s returns for the period reflect the value of the option strategies as of period end, understanding that the term of the option strategies still holds approximately 11 months of time value as of July 31, 2024. The option strategies also provide a predetermined level of protection for investors as of period end, unlike direct investment in equity securities.
| NAV | Russell 3000 Total Return Index |
|---|
| 7/1/24 | $10,000 | $9,996 |
| 7/31/24 | $10,263 | $10,182 |
AVERAGE ANNUAL TOTAL RETURNS (%)
| SINCE INCEPTION 7/1/24 |
|---|
| NAV | 2.91 |
| Market Price | 2.63 |
| Russell 3000 Total Return Index | 1.82 |
The Fund's past performance is not a good predictor of the Fund's future performance.
The graph and table do not reflect the deduction of taxes that a shareholder would pay on fund distributions or redemption of fund shares. The Fund cannot guarantee the desired protection, which may only be realized if shares are held from the first day of the one-year outcome period through the last day. Principal value and investment return of an investment will fluctuate so that your shares, when redeemed, may be worth more or less than their original cost. Average annual total return measures net investment income and capital gain or loss from portfolio investments as an annualized average. All performance shown assumes reinvestment of dividends and capital gains distributions. Visit https://www.calamos.com/funds/etf for the most recent performance information.
| Total Net Assets | # of Portfolio Holdings | Portfolio Turnover Rate | Total Advisory Fees Paid |
|---|
| $55,777,119 | 3 | 0% | $24,340 |
Calamos Russell 2000® Structured Alt Protection ETF™ - July
Annual Shareholder Report - July 31, 2024
WHAT DID THE FUND INVEST IN?
The Fund invests in a combination of FLEX® Options in order to create a predetermined risk-reward at the onset of the strategy. The Fund uses these FLEX Options to buy options on Russell 2000-related securities and to purchase puts at the current market price on the Fund’s inception date, in this case beginning in July 2024. The Fund also sells calls on Russell 2000-related securities to help pay for the put options. The sale of calls creates the cap on upside participation over the one-year period.
| Long Call Option | 106.4 |
| Long Put Option | 3.6 |
| Short Call Option | (10.2) |
For additional information about the Fund, including its prospectus, financial information, holdings and proxy information, please visit www.calamos.com/resources. You can also request information by contacting us at 866-363-9219.
©2024 Calamos Investments LLC. All Rights Reserved. Calamos® and Calamos Investments® are registered trademarks of Calamos Investments LLC.
Calamos Investments LLC | 2020 Calamos Court | Naperville, IL 60563 | 866-363-9219 | www.calamos.com |CPRJTSRA 24
Annual Shareholder Report - July 31, 2024
This annual shareholder report contains important information about the Calamos S&P 500® Structured Alt Protection ETF™ - July for the period of July 1, 2024 to July 31, 2024. You can find additional information about the Fund at www.calamos.com/resources. You can also request this information by contacting us at 866-363-9219.
WHAT WERE THE FUND COSTS FOR THE LAST YEAR?
(based on a hypothetical $10,000 investment)
| Fund Ticker | Costs of a $10,000 Investment | Costs Paid as a Percentage of a $10,000 Investment |
|---|
CPSJ | $6Footnote Reference* | 0.69% |
| Footnote | Description |
Footnote* | The period from inception to the date of this report is less than a full reporting period. Expenses for a full reporting period would be higher. |
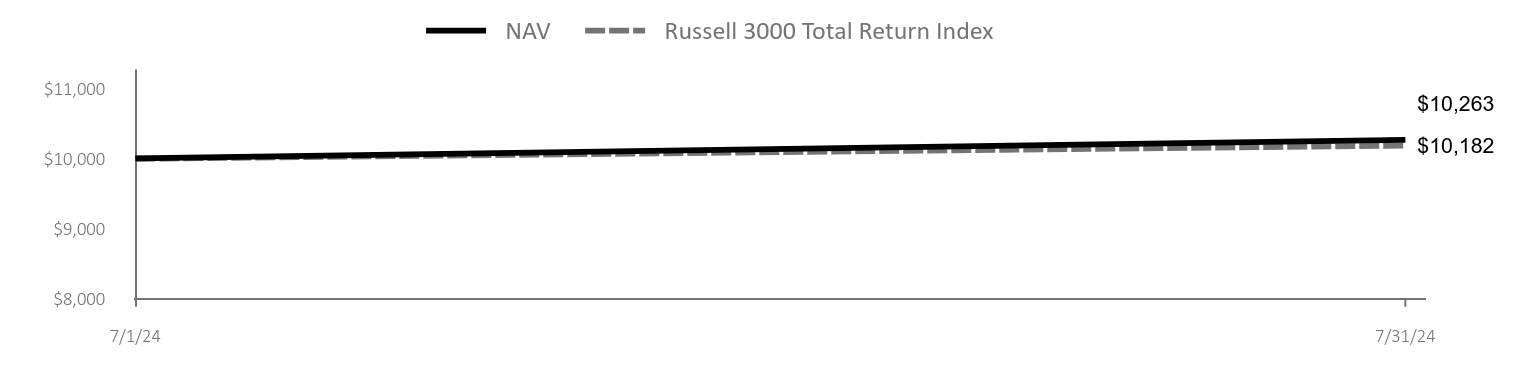
Since its inception on July 1, 2024, through July 31, 2024, the Fund has delivered on its objectives of safeguarding investors’ capital, minimizing volatility, and offering upside participation in the S&P 500® over the initial one-year term of the options strategies tied to S&P 500-related securities. The Fund’s returns for the period reflect the value of the option strategies as of period end, understanding that the term of the option strategies still holds approximately 11 months of time value as of July 31, 2024. The option strategies also provide a predetermined level of protection for investors as of period end, unlike direct investment in equity securities.
| NAV | S&P 500 Total Return Index |
|---|
| 7/1/24 | $10,000 | $10,002 |
| 7/31/24 | $10,096 | $10,124 |
AVERAGE ANNUAL TOTAL RETURNS (%)
| SINCE INCEPTION 7/1/24 |
|---|
| NAV | 1.34 |
| Market Price | 0.96 |
| S&P 500 Total Return Index | 1.24 |
The Fund's past performance is not a good predictor of the Fund's future performance.
The graph and table do not reflect the deduction of taxes that a shareholder would pay on fund distributions or redemption of fund shares. The Fund cannot guarantee the desired protection, which may only be realized if shares are held from the first day of the one-year outcome period through the last day. Principal value and investment return of an investment will fluctuate so that your shares, when redeemed, may be worth more or less than their original cost. Average annual total return measures net investment income and capital gain or loss from portfolio investments as an annualized average. All performance shown assumes reinvestment of dividends and capital gains distributions. Visit https://www.calamos.com/funds/etf for the most recent performance information.
| Total Net Assets | # of Portfolio Holdings | Portfolio Turnover Rate | Total Advisory Fees Paid |
|---|
| $30,348,381 | 3 | 0% | $14,059 |
Calamos S&P 500® Structured Alt Protection ETF™ - July
Annual Shareholder Report - July 31, 2024
WHAT DID THE FUND INVEST IN?
The Fund invests in a combination of FLEX® Options in order to create a predetermined risk reward at the onset of the strategy. The Fund uses these FLEX Options to buy options on S&P 500-related securities and to purchase puts at the current market price on the Fund’s inception date, in this case beginning in July 2024. The Fund also sells calls on S&P 500-related securities to help pay for the put options. The sale of calls creates the cap on upside participation over the one-year period.
| Long Call Option | 99.3 |
| Long Put Option | 3.8 |
| Short Call Option | (3.4) |
For additional information about the Fund, including its prospectus, financial information, holdings and proxy information, please visit www.calamos.com/resources. You can also request information by contacting us at 866-363-9219.
©2024 Calamos Investments LLC. All Rights Reserved. Calamos® and Calamos Investments® are registered trademarks of Calamos Investments LLC.
Calamos Investments LLC | 2020 Calamos Court | Naperville, IL 60563 | 866-363-9219 | www.calamos.com |CPSJTSRA 24
Annual Shareholder Report - July 31, 2024
This annual shareholder report contains important information about the Calamos S&P 500® Structured Alt Protection ETF™ - May for the period of May 1, 2024 to July 31, 2024. You can find additional information about the Fund at www.calamos.com/resources. You can also request this information by contacting us at 866-363-9219.
WHAT WERE THE FUND COSTS FOR THE LAST YEAR?
(based on a hypothetical $10,000 investment)
| Fund Ticker | Costs of a $10,000 Investment | Costs Paid as a Percentage of a $10,000 Investment |
|---|
| CPSM | $17Footnote Reference* | 0.69% |
| Footnote | Description |
Footnote* | The period from inception to the date of this report is less than a full reporting period. Expenses for a full reporting period would be higher. |
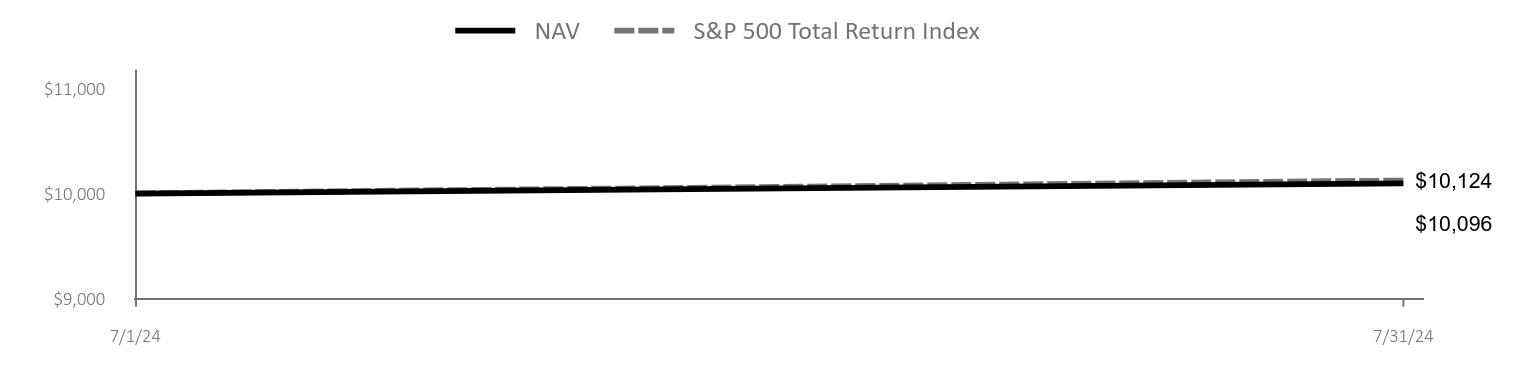
Since its inception on May 1, 2024, through July 31, 2024, the Fund has delivered on its objectives of safeguarding investors’ capital, minimizing volatility, and offering upside participation in the S&P 500® over the initial one-year term of the options strategies tied to S&P 500 related securities. The Fund’s returns for the period reflect the value of the option strategies as of period end, understanding that the term of the option strategies still holds approximately nine months of time value as of July 31, 2024. The option strategies also provide a predetermined level of protection for investors as of period end, unlike direct investment in equity securities.
| NAV | S&P 500 Total Return Index |
|---|
| 5/1/24 | $10,000 | $9,999 |
| 5/31/24 | $10,172 | $10,495 |
| 6/30/24 | $10,276 | $10,871 |
| 7/31/24 | $10,368 | $11,004 |
AVERAGE ANNUAL TOTAL RETURNS (%)
| SINCE INCEPTION 5/1/24 |
|---|
| NAV | 3.92 |
| Market Price | 3.68 |
| S&P 500 Total Return Index | 10.04 |
The Fund's past performance is not a good predictor of the Fund's future performance.
The graph and table do not reflect the deduction of taxes that a shareholder would pay on fund distributions or redemption of fund shares. The Fund cannot guarantee the desired protection, which may only be realized if shares are held from the first day of the one-year outcome period through the last day. Principal value and investment return of an investment will fluctuate so that your shares, when redeemed, may be worth more or less than their original cost. Average annual total return measures net investment income and capital gain or loss from portfolio investments as an annualized average. All performance shown assumes reinvestment of dividends and capital gains distributions. Visit https://www.calamos.com/funds/etf for the most recent performance information.
| Total Net Assets | # of Portfolio Holdings | Portfolio Turnover Rate | Total Advisory Fees Paid |
|---|
| $107,803,313 | 3 | 0% | $176,696 |
Calamos S&P 500® Structured Alt Protection ETF™ - May
Annual Shareholder Report - July 31, 2024
WHAT DID THE FUND INVEST IN?
The Fund invests in a combination of FLEX® Options in order to create a predetermined risk-reward at the onset of the strategy. The Fund uses these FLEX Options to buy options on S&P 500®-related securities and to purchase puts at the current market price on the inception date of the Fund, in this case beginning in May 2024. The Fund also sells calls on S&P 500-related securities to help pay for the put options. The sale of calls creates the cap on upside participation over the one-year period.
| Long Call Option | 105.2 |
| Long Put Option | 2.0 |
| Short Call Option | (7.4) |
For additional information about the Fund, including its prospectus, financial information, holdings and proxy information, please visit www.calamos.com/resources. You can also request information by contacting us at 866-363-9219.
©2024 Calamos Investments LLC. All Rights Reserved. Calamos® and Calamos Investments® are registered trademarks of Calamos Investments LLC.
Calamos Investments LLC | 2020 Calamos Court | Naperville, IL 60563 | 866-363-9219 | www.calamos.com |CPSMTSRA 24
Annual Shareholder Report - July 31, 2024
This annual shareholder report contains important information about the Calamos CEF Income & Arbitrage ETF for the period of January 16, 2024 to July 31, 2024. You can find additional information about the Fund at www.calamos.com/resources. You can also request this information by contacting us at 866-363-9219.
WHAT WERE THE FUND COSTS FOR THE LAST YEAR?
(based on a hypothetical $10,000 investment)
| Fund Ticker | Costs of a $10,000 Investment | Costs Paid as a Percentage of a $10,000 Investment |
|---|
| CCEF | $42Footnote Reference* | 0.74% |
| Footnote | Description |
Footnote* | The period from inception to the date of this report is less than a full reporting period. Expenses for a full reporting period would be higher. |
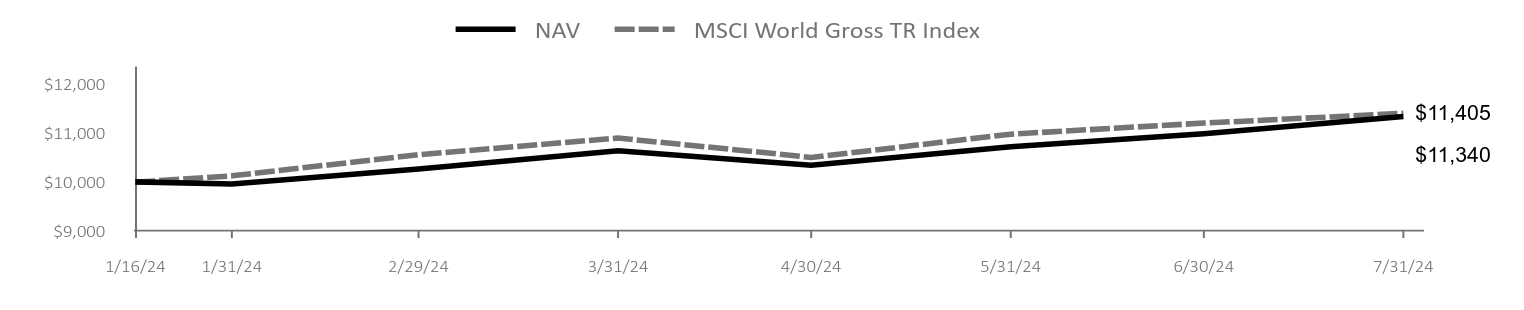
Since the Fund’s inception on January 16, 2024, through July 31, 2024, it generated strong double-digit returns, slightly trailing the all-equity MSCI World Index, while outperforming the S-Network Composite Closed-End Fund Index (SNCEFCT). The Fund also paid out attractive distributions over the period. The Fund’s performance was driven by the increase in the value of the underlying assets of the closed-end funds held in the portfolio, which are diversified across a variety of assets and industries, such as real estate, energy, and municipal bonds. Broadly speaking, a positive environment for various asset classes and the closed-end fund market in general characterized the reporting period.
| NAV | MSCI World Gross TR Index |
|---|
| 1/16/24 | $10,000 | $9,993 |
| 1/31/24 | $9,956 | $10,124 |
| 2/29/24 | $10,264 | $10,557 |
| 3/31/24 | $10,639 | $10,899 |
| 4/30/24 | $10,342 | $10,502 |
| 5/31/24 | $10,721 | $10,978 |
| 6/30/24 | $10,988 | $11,205 |
| 7/31/24 | $11,340 | $11,405 |
AVERAGE ANNUAL TOTAL RETURNS (%)
| SINCE INCEPTION 1/16/24 |
|---|
| NAV | 13.36 |
| Market Price | 13.40 |
| MSCI World Gross TR Index | 14.05 |
The Fund's past performance is not a good predictor of the Fund's future performance.
The graph and table do not reflect the deduction of taxes that a shareholder would pay on fund distributions or redemption of fund shares. Principal value and investment return of an investment will fluctuate so that your shares, when redeemed, may be worth more or less than their original cost. Average annual total return measures net investment income and capital gain or loss from portfolio investments as an annualized average. All performance shown assumes reinvestment of dividends and capital gains distributions. Visit https://www.calamos.com/funds/etf for the most recent performance information.
| Total Net Assets | # of Portfolio Holdings | Portfolio Turnover Rate | Total Advisory Fees Paid |
|---|
| $13,127,501 | 43 | 66% | $31,332 |
Calamos CEF Income & Arbitrage ETF
Annual Shareholder Report - July 31, 2024
WHAT DID THE FUND INVEST IN?
The Fund seeks to deliver high current income and long-term capital appreciation by investing in income-producing closed-end funds trading at attractive discounts, which commonly offer attractive yields.
Fund Categories and top 10 holdings exclude, if any, cash or cash equivalents.
| Sector Equity | 23.9 |
| Allocation | 21.1 |
| Taxable Bond | 17.6 |
| Nontraditional Equity | 14.7 |
| International Equity | 9.6 |
| U.s. Equity | 7.8 |
| Municipal Bond | 3.5 |
| John Hancock Premium Dividend Fund | 4.1 |
| Bexil Investment Trust | 4.0 |
| abrdn Healthcare Opportunities Fund | 3.8 |
| BlackRock Enhanced Equity Dividend Trust | 3.6 |
| Nuveen Municipal Credit Opportunities Fund | 3.5 |
| Eaton Vance Tax-Managed Global Diversified Equity Income Fund | 3.4 |
| Eaton Vance Tax Managed Global Buy Write Opportunities Fund | 3.2 |
| Royce Small-Cap Trust, Inc. | 3.1 |
| John Hancock Tax-Advantaged Dividend Income Fund | 3.0 |
| Brookfield Real Assets Income Fund, Inc. | 3.0 |
For additional information about the Fund, including its prospectus, financial information, holdings and proxy information, please visit www.calamos.com/resources. You can also request information by contacting us at 866-363-9219.
©2024 Calamos Investments LLC. All Rights Reserved. Calamos® and Calamos Investments® are registered trademarks of Calamos Investments LLC.
Calamos Investments LLC | 2020 Calamos Court | Naperville, IL 60563 | 866-363-9219 | www.calamos.com |CCEFTSRA 24
Item 2: Code of Ethics.
(a) As of the end of the period covered by this report, the registrant has adopted a code of ethics (the “Code of Ethics”) that applies to its principal executive officer, principal financial officer, principal accounting officer or controller, or person performing similar functions.
(b) No response required.
(c) The registrant has not amended its Code of Ethics as it relates to any element of the code of ethics definition enumerated in paragraph (b) of this Item 2 during the period covered by this report.
(d) The registrant has not granted a waiver or an implicit waiver from its Code of Ethics during the period covered by this report.
(e) Not applicable.
(f) (1) The registrant’s Code of Ethics is attached as an Exhibit hereto.
Item 3: Audit Committee Financial Expert.
| (a) | The registrant’s Board of Trustees has determined that it has five audit committee financial experts serving on its audit committee, each of whom is an independent Trustee for purpose of this N-CSR item: John E. Neal, William R. Rybak, Virginia G. Breen, Karen L. Stuckey and Christopher M. Toub. Under applicable securities laws, a person who is determined to be an audit committee financial expert will not be deemed an “expert” for any purpose, including without limitation for the purposes of Section 11 of the Securities Act of 1933, as a result of being designated or identified as an audit committee financial expert pursuant to this Item. The designation or identification of a person as an audit committee financial expert does not impose on such person any duties, obligations, or liabilities that are greater than the duties, obligations and liabilities imposed on such personas a member of audit committee and board of directors in the absence of such designation or identification. The designation or identification of a person as an audit committee financial expert pursuant to this Item does not affect the duties, obligations, or liabilities of any other member of the audit committee or board of trustees. |
Item 4: Principal Accountant Fees and Services.
| Fiscal Years Ended | | 07/31/2023 | | | 07/31/2024 | |
| Audit Fees(a) | | $ | 39,000 | | | $ | 172,000 | |
| Audit-Related Fees(b) | | $ | - | | | $ | 99,960 | |
| Tax Fees(c) | | $ | 734 | | | $ | - | |
| All Other Fees(d) | | $ | - | | | $ | - | |
| Total | | $ | 39,734 | | | $ | 271,960 | |
(a) Audit fees are the aggregate fees billed in each of the last two fiscal years for professional services rendered by the principal accountant to the registrant for the audit of the registrant’s annual financial statements or services that are normally provided by the accountant in connection with statutory and regulatory filings or engagements for those fiscal years.
(b) Audit-related fees are the aggregate fees billed in each of the last two fiscal years for assurance and related services rendered by the principal accountant to the registrant that are reasonably related to the performance of the audit of the registrant’s financial statements and are not reported under paragraph (a) of this Item 4.
(c) Tax fees are the aggregate fees billed in each of the last two fiscal years for professional services rendered by the principal accountant to the registrant for tax compliance, tax advice and tax planning.
(d) All other fees are the aggregate fees billed in each of the last two fiscal years for products and services provided by the principal accountant to the registrant, other than the services reported in paragraph (a)-(c) of this Item 4.
(e)(1) Registrant’s audit committee meets with the principal accountants and management to review and pre-approve all audit services to be provided by the principal accountants.
The audit committee shall pre-approve all non-audit services to be provided by the principal accountants to the registrant, including the fees and other compensation to be paid to the principal accountants; provided that the pre-approval of non-audit services is waived if (i) the services were not recognized by management at the time of the engagement as non-audit services,(ii) the aggregate fees for all non-audit services provided to the registrant are less than 5% of the total fees paid by the registrant to its principal accountants during the fiscal year in which the non-audit services are provided, and (iii) such services are promptly brought to the attention of the audit committee by management and the audit committee approves them prior to the completion of the audit.
The audit committee shall pre-approve all non-audit services to be provided by the principal accountants to the investment adviser or any entity controlling, controlled by or under common control with the adviser that provides ongoing services to the registrant if the engagement relates directly to the operations or financial reporting of the registrant, including the fees and other compensation to be paid to the principal accountants; provided that pre-approval of non-audit services to the adviser or an affiliate of the adviser is not required if (i) the services were not recognized by management at the time of the engagement as non-audit services, (ii) the aggregate fees for all non-audit services provided to the adviser and all entities controlling, controlled by or under common control with the adviser are less than 5% of the total fees for non-audit services requiring preapproval under paragraph (e)(1)of this Item 4 paid by the registrant, the adviser or its affiliates to the registrant’s principal accountants during the fiscal year in which the nonaudit services are provided, and (iii) such services are promptly brought to the attention of the audit committee by management and the audit committee approves them prior to the completion of the audit.
(e)(2) No percentage of the principal accountant’s fees or services described in each of paragraphs (b)—(d) of this Item were approved pursuant to the waiver provision paragraph (c)(7)(i)(C) of Rule 2-01 of Regulation S-X.
(f) No disclosures are required by this Item 4(f).
(g) The following table presents the aggregate non-audit fees billed in each of the last two fiscal years for services rendered by the principal accountant to the registrant and the aggregate non-audit fees billed in each of the last two fiscal years for services rendered by the principal accountant to the investment adviser or any entity controlling, controlled by or under common control of the adviser.
| Fiscal Years Ended | | 07/31/2023 | | | 07/31/2024 | |
| Registrant | | $ | 734 | | | $ | - | |
| Investment Adviser | | $ | - | | | $ | - | |
(h) No disclosures are required by this Item 4(h).
(i) Not applicable.
(j) Not applicable.
Item 5: Audit Committee of Listed Registrants.
(a) The registrant is a listed issuer as defined in Rule 10A-3 under the Exchange Act of 1934 and has an audit committee as specified in Section 3(a)(58)(A) of the Exchange Act of 1934. The audit committee members are William R. Rybak, John E. Neal, Virginia G. Breen, Lloyd A. Wennlund, Karen L. Stuckey, and Christopher M. Toub.
(b) Not applicable.
Item 6: Investments.
Not applicable. The complete schedule of investments is included in the financial statements filed under Item 7 of the N-CSR.
Item 7: Financial Statements and Financial Highlights for Open-End Management Investment Companies.

TIMELY INFORMATION INSIDE


Calamos Antetokounmpo Global Sustainable Equities ETF
ANNUAL FINANCIAL STATEMENTS AND OTHER INFORMATION JULY 31, 2024

Visit www.calamos.com/paperless to enroll. You can view shareholder communications, including fund prospectuses, annual reports and other shareholder materials online long before the printed publications arrive by traditional mail.

Calamos Antetokounmpo Global Sustainable Equities ETF
Statement of Assets and Liabilities July 31, 2024
ASSETS | |
Investments in securities, at value (cost $9,502,479) | | $ | 11,452,934 | | |
Cash with custodian | | | 332,961 | | |
Receivables: | |
Accrued dividends | | | 15,010 | | |
Total assets | | | 11,800,905 | | |
LIABILITIES | |
Foreign currency overdraft (cost $469) | | | 466 | | |
Affiliates: | |
Investment advisory fees | | | 9,501 | | |
Other accounts payable and accrued liabilities | | | 6,442 | | |
Total liabilities | | | 16,409 | | |
NET ASSETS | | $ | 11,784,496 | | |
COMPOSITION OF NET ASSETS | |
Paid in capital | | $ | 9,845,629 | | |
Accumulated distributable earnings (loss) | | | 1,938,867 | (a) | |
NET ASSETS | | $ | 11,784,496 | | |
Shares outstanding (no par value; unlimited number of shares authorized) | | | 404,000 | | |
Net asset value per share | | $ | 29.17 | | |
(a) Net of deferred foreign capital gains tax of $(6,442).
See accompanying Notes to Financial Statements
www.calamos.com
1
Statement of Operations Year Ended July 31, 2024
INVESTMENT INCOME | |
Interest | | $ | 9,702 | | |
Dividends | | | 219,489 | | |
Dividend taxes withheld | | | (17,283 | ) | |
Total investment income | | | 211,908 | | |
EXPENSES | |
Investment advisory fees | | | 102,141 | | |
Total expenses | | | 102,141 | | |
NET INVESTMENT INCOME (LOSS) | | | 109,767 | | |
REALIZED AND UNREALIZED GAIN (LOSS) | |
Net realized gain (loss) from: | |
Investments | | | (37,330 | )(a) | |
Foreign currency transactions | | | 1,466 | | |
Change in net unrealized appreciation/(depreciation) on: | |
Investments | | | 1,069,152 | (b) | |
Foreign currency translations | | | (129 | ) | |
NET GAIN (LOSS) | | | 1,033,159 | | |
NET INCREASE (DECREASE) IN NET ASSETS RESULTING FROM OPERATIONS | | $ | 1,142,926 | | |
(a) Net of foreign capital gains tax of $1,352.
(b) Net of change of $(5,239) in deferred capital gains tax.
See accompanying Notes to Financial Statements
CALAMOS ANTETOKOUNMPO GLOBAL SUSTAINABLE EQUITIES ETF ANNUAL REPORT
2
Statements of Changes in Net Assets
| | | YEAR
ENDED
JULY 31,
2024 | | PERIOD
ENDED
JULY 31,
2023(a) | |
OPERATIONS | |
Net investment income (loss) | | $ | 109,767 | | | $ | 52,985 | | |
Net realized gain (loss) | | | (35,864 | ) | | | (31,084 | ) | |
Change in unrealized appreciation/(depreciation) | | | 1,069,023 | | | | 874,996 | | |
Net increase (decrease) in net assets resulting from operations | | | 1,142,926 | | | | 896,897 | | |
DISTRIBUTIONS TO SHAREHOLDERS | |
Total distributions | | | (100,956 | ) | | | — | | |
CAPITAL SHARE TRANSACTIONS | | | — | | | | 9,745,629 | | |
TOTAL INCREASE (DECREASE) IN NET ASSETS | | | 1,041,970 | | | | 10,642,526 | | |
NET ASSETS | |
Beginning of year/period | | $ | 10,742,526 | | | $ | 100,000 | | |
End of year/period | | $ | 11,784,496 | | | $ | 10,742,526 | | |
CAPITAL SHARE TRANSACTIONS | |
Shares outstanding, beginning of year/period | | | 404,000 | | | | 4,000 | | |
Shares issued | | | — | | | | 400,000 | | |
Net increase (decrease) in capital shares outstanding | | | — | | | | 400,000 | | |
Shares outstanding, end of year/period | | | 404,000 | | | | 404,000 | | |
(a) Calamos Antetokounmpo Global Sustainable Equities ETF commenced operations on February 3, 2023.
See accompanying Notes to Financial Statements
www.calamos.com
3
Selected data for a share outstanding throughout each year/period were as follows:
| | | YEAR ENDED
JULY 31,
2024 | | PERIOD ENDED
JULY 31,
2023• | |
PER SHARE OPERATING PERFORMANCE | |
Net asset value, beginning of year | | $ | 26.59 | | | $ | 25.00 | | |
Income from investment operations: | |
Net investment income (loss)(a) | | | 0.27 | | | | 0.18 | | |
Net realized and unrealized gain (loss) | | | 2.56 | | | | 1.41 | | |
Total from investment operations | | | 2.83 | | | | 1.59 | | |
Less distributions to common shareholders from: | |
Net investment income | | | (0.25 | ) | | | — | | |
Total distributions(b) | | | (0.25 | ) | | | — | | |
Net asset value, end of year | | $ | 29.17 | | | $ | 26.59 | | |
TOTAL RETURN APPLICABLE TO COMMON SHAREHOLDERS | |
Total investment return based on: | |
Net asset value(c) | | | 10.74 | % | | | 6.36 | % | |
RATIOS TO AVERAGE NET ASSETS APPLICABLE TO COMMON SHAREHOLDERS | |
Net expenses | | | 0.95 | % | | | 0.95 | %(d) | |
Net investment income (loss) | | | 1.02 | % | | | 1.47 | %(d) | |
SUPPLEMENTAL DATA | |
Net assets applicable to common shareholders, end of year (000) | | $ | 11,784 | | | $ | 10,743 | | |
Portfolio turnover rate(e)(f) | | | 25 | % | | | 7 | % | |
• Calamos Antetokounmpo Global Sustainable Equities ETF commenced operations on February 3, 2023.
(a) Net investment income (loss) allocated based on average shares method.
(b) Distribution for annual periods determined in accordance with federal income tax regulations.
(c) Total return measures net investment income (loss) and capital gain or loss from portfolio investments assuming reinvestment of dividends and capital gains distributions. Total return is not annualized for periods that are less than a full year and does not reflect the deduction of taxes that a shareholder would pay on fund distributions or the redemption of fund shares.
(d) Annualized.
(e) Portfolio turnover rate excludes securities received or delivered from in-kind processing of creations or redemptions.
(f) Not annualized.
CALAMOS ANTETOKOUNMPO GLOBAL SUSTAINABLE EQUITIES ETF ANNUAL REPORT
4
Calamos Antetokounmpo Global Sustainable Equities ETF Schedule of Investments July 31, 2024
NUMBER OF
SHARES | | | | VALUE | |
COMMON STOCKS (97.2%) | | | |
| | | Communication Services (6.3%) | |
| | 3,095 | | | Alphabet, Inc. - Class A | | $ | 530,916 | | |
| | 2,012 | CAD | | BCE, Inc. | | | 67,866 | | |
| | 437,735 | KES | | Safaricom, PLC | | | 53,953 | | |
| | 2,190 | | | Verizon Communications, Inc. | | | 88,739 | | |
| | | | 741,474 | | |
| | | Consumer Discretionary (9.6%) | |
| | 1,758 | EUR | | Amadeus IT Group, SA | | | 115,564 | | |
| | 5,192 | HKD | | BYD Company, Ltd. - Class H | | | 151,516 | | |
| | 2,219 | EUR | | Cie Generale des Etablissements
Michelin SCA | | | 87,895 | | |
| | 2,876 | GBP | | Greggs, PLC | | | 115,872 | | |
| | 311 | | | Home Depot, Inc. | | | 114,498 | | |
| | 2,278 | EUR | | Industria de Diseno Textil, SA | | | 110,596 | | |
| | 33 | | | MercadoLibre, Inc.# | | | 55,074 | | |
| | 1,650 | | | Sony Group Corp. (ADR) | | | 146,173 | | |
| | 1,528 | | | TJX Companies, Inc. | | | 172,695 | | |
| | 234 | | | Tractor Supply Company | | | 61,617 | | |
| | | | 1,131,500 | | |
| | | Consumer Staples (7.4%) | |
| | 961 | | | Colgate-Palmolive Company | | | 95,321 | | |
| | 194 | | | Costco Wholesale Corp. | | | 159,468 | | |
| | 2,563 | | | Darling Ingredients, Inc.# | | | 101,828 | | |
| | 20,285 | GBP | | Haleon, PLC | | | 91,166 | | |
| | 4,242 | EUR | | Jeronimo Martins SGPS, SA | | | 74,143 | | |
| | 1,117 | EUR | | Kerry Group, PLC - Class A | | | 104,447 | | |
| | 1,891 | EUR | | Koninklijke Ahold Delhaize, NV | | | 60,946 | | |
| | 162 | EUR | | L'Oreal, SA | | | 70,244 | | |
| | 760 | | | Target Corp. | | | 114,312 | | |
| | | | 871,875 | | |
| | | Financials (12.7%) | |
| | 18,268 | HKD | | AIA Group, Ltd. | | | 122,755 | | |
| | 13,122 | GBP | | Aviva, PLC | | | 84,379 | | |
| | 1,524 | | | Bank of New York Mellon Corp. | | | 99,167 | | |
| | 232,600 | IDR | | Bank Rakyat Indonesia Persero, Tbk PT | | | 66,805 | | |
| | 3,408 | NOK | | DNB Bank, ASA | | | 70,436 | | |
| | 1,807 | EUR | | Edenred, SE | | | 75,311 | | |
| | 9,210 | MXN | | Grupo Financiero Banorte, SAB de CV -
Class O | | | 69,163 | | |
| | 2,582 | | | HDFC Bank, Ltd. (ADR) | | | 154,946 | | |
| | 1,559 | HKD | | Hong Kong Exchanges & Clearing, Ltd. | | | 46,254 | | |
| | 574 | | | Intercontinental Exchange, Inc. | | | 86,995 | | |
| | 9,252 | | | Itau Unibanco Holding, SA (ADR) | | | 55,697 | | |
| | 495 | | | Jack Henry & Associates, Inc. | | | 84,883 | | |
| | 1,080 | EUR | | KBC Group, NV | | | 83,735 | | |
| | 198 | | | S&P Global, Inc. | | | 95,977 | | |
NUMBER OF
SHARES | | | | VALUE | |
| | 510 | | | Travelers Companies, Inc. | | $ | 110,384 | | |
| | 702 | | | Visa, Inc. - Class A | | | 186,500 | | |
| | | | 1,493,387 | | |
| | | Health Care (12.8%) | |
| | 636 | GBP | | AstraZeneca, PLC | | | 101,122 | | |
| | 316 | AUD | | Cochlear, Ltd. | | | 71,296 | | |
| | 459 | AUD | | CSL, Ltd. | | | 92,966 | | |
| | 2,600 | JPY | | Daiichi Sankyo Company, Ltd. | | | 106,704 | | |
| | 744 | | | Edwards Lifesciences Corp.# | | | 46,909 | | |
| | 399 | EUR | | EssilorLuxottica, SA | | | 91,416 | | |
| | 1,066 | | | Gilead Sciences, Inc. | | | 81,080 | | |
| | 141 | CHF | | Lonza Group, AG# | | | 94,359 | | |
| | 912 | | | Merck & Company, Inc. | | | 103,174 | | |
| | 418 | EUR | | Merck KGaA | | | 75,005 | | |
| | 1,257 | DKK | | Novo Nordisk, A/S - Class B | | | 166,253 | | |
| | 307 | CHF | | Roche Holding, AG | | | 99,961 | | |
| | 3,300 | JPY | | Sysmex Corp. | | | 54,466 | | |
| | 196 | | | Thermo Fisher Scientific, Inc. | | | 120,215 | | |
| | 235 | | | UnitedHealth Group, Inc. | | | 135,397 | | |
| | 394 | | | Zoetis, Inc. | | | 70,936 | | |
| | | | 1,511,259 | | |
| | | Industrials (13.6%) | |
| | 1,810 | SEK | | Assa Abloy, AB - Class B | | | 55,082 | | |
| | 3,400 | SEK | | Atlas Copco, AB - Class A | | | 60,512 | | |
| | 1,730 | | | Ball Corp. | | | 110,426 | | |
| | 1,438 | | | Canadian Pacific Kansas City, Ltd. | | | 120,533 | | |
| | 1,115 | EUR | | Cie de Saint-Gobain | | | 95,861 | | |
| | 205 | | | Deere & Company | | | 76,256 | | |
| | 2,488 | SEK | | Epiroc, AB - Class A | | | 46,465 | | |
| | 478 | | | Ferguson, PLC | | | 106,427 | | |
| | 6,500 | JPY | | Hitachi, Ltd. | | | 142,665 | | |
| | 905 | | | Otis Worldwide Corp. | | | 85,522 | | |
| | 440 | | | Quanta Services, Inc. | | | 116,767 | | |
| | 1,600 | JPY | | Recruit Holdings Company, Ltd. | | | 92,472 | | |
| | 175 | | | Rockwell Automation, Inc. | | | 48,764 | | |
| | 569 | EUR | | Siemens, AG | | | 104,329 | | |
| | 100 | JPY | | SMC Corp. | | | 49,498 | | |
| | 3,500 | CNY | | Sungrow Power Supply Company, Ltd. -
Class A | | | 33,334 | | |
| | 242 | | | Trane Technologies, PLC | | | 80,896 | | |
| | 226 | | | Verisk Analytics, Inc. | | | 59,155 | | |
| | 576 | | | Waste Management, Inc. | | | 116,732 | | |
| | | | 1,601,696 | | |
| | | Information Technology (25.4%) | |
| | 242 | | | Accenture, PLC - Class A | | | 80,010 | | |
| | 146 | | | Adobe, Inc.# | | | 80,541 | | |
| | 2,145 | | | Apple, Inc. | | | 476,362 | | |
See accompanying Notes to Financial Statements
www.calamos.com
5
Calamos Antetokounmpo Global Sustainable Equities ETF Schedule of Investments July 31, 2024
NUMBER OF
SHARES | | | | VALUE | |
| | 660 | | | Applied Materials, Inc. | | $ | 140,052 | | |
| | 99 | EUR | | ASML Holding, NV | | | 91,125 | | |
| | 904 | EUR | | Dassault Systemes, SE | | | 34,282 | | |
| | 2,932 | EUR | | Infineon Technologies, AG | | | 101,700 | | |
| | 138 | | | Intuit, Inc. | | | 89,334 | | |
| | 1,326 | | | Microsoft Corp. | | | 554,732 | | |
| | 2,420 | | | NVIDIA Corp. | | | 283,188 | | |
| | 2,017 | KRW | | Samsung Electronics Company, Ltd. | | | 122,917 | | |
| | 187 | KRW | | Samsung SDI Company, Ltd. | | | 43,397 | | |
| | 1,034 | EUR | | SAP, SE | | | 218,236 | | |
| | 2,724 | | | Taiwan Semiconductor Manufacturing
Company, Ltd. (ADR) | | | 451,639 | | |
| | 784 | | | TE Connectivity, Ltd. | | | 120,995 | | |
| | 541 | | | Texas Instruments, Inc. | | | 110,261 | | |
| | | | 2,998,771 | | |
| | | Materials (5.0%) | |
| | 471 | EUR | | Air Liquide, SA | | | 86,034 | | |
| | 860 | GBP | | Croda International, PLC | | | 44,687 | | |
| | 568 | EUR | | DSM-Firmenich, AG | | | 72,568 | | |
| | 541 | | | Ecolab, Inc. | | | 124,803 | | |
| | 13,399 | BRL | | Klabin, SA | | | 52,330 | | |
| | 226 | | | Linde, PLC | | | 102,491 | | |
| | 1,028 | DKK | | Novozymes, A/S - Class B | | | 65,448 | | |
| | 146 | CHF | | Sika, AG# | | | 44,378 | | |
| | | | 592,739 | | |
| | | Real Estate (1.3%) | |
| | 364 | | | American Tower Corp. | | | 80,226 | | |
| | 550 | | | Prologis, Inc. | | | 69,327 | | |
| | | | 149,553 | | |
| | | Utilities (3.1%) | |
| | 80,000 | HKD | | China Water Affairs Group, Ltd. | | | 52,017 | | |
| | 2,931 | EUR | | EDP Renovaveis, SA | | | 45,487 | | |
| | 10,674 | COP | | Interconexion Electrica, SA ESP | | | 46,111 | | |
| | 5,452 | GBP | | National Grid, PLC | | | 69,107 | | |
| | 15,397 | INR | | Power Grid Corp. of India, Ltd. | | | 64,215 | | |
| | 1,046 | | | Sempra | | | 83,743 | | |
| | | | 360,680 | | |
| | | TOTAL COMMON STOCKS
(Cost $9,502,479) | | | 11,452,934 | | |
| | | TOTAL INVESTMENTS (97.2%)
(Cost $9,502,479) | | | 11,452,934 | | |
OTHER ASSETS, LESS LIABILITIES (2.8%) | | | 331,562 | | |
NET ASSETS (100.0%) | | $ | 11,784,496 | | |
NOTES TO SCHEDULE OF INVESTMENTS
# Non-income producing security.
FOREIGN CURRENCY ABBREVIATIONS
AUD Australian Dollar
BRL Brazilian Real
CAD Canadian Dollar
CHF Swiss Franc
CNY Chinese Yuan Renminbi
COP Colombian Peso
DKK Danish Krone
EUR European Monetary Unit
GBP British Pound Sterling
HKD Hong Kong Dollar
IDR Indonesian Rupiah
INR Indian Rupee
JPY Japanese Yen
KES Kenyan Shilling
KRW South Korean Won
MXN Mexican Peso
NOK Norwegian Krone
SEK Swedish Krona
ABBREVIATION
ADR American Depositary Receipt
Note: Value for securities denominated in foreign currencies is shown in U.S. Dollars.
See accompanying Notes to Financial Statements
CALAMOS ANTETOKOUNMPO GLOBAL SUSTAINABLE EQUITIES ETF ANNUAL REPORT
6
Calamos Antetokounmpo Global Sustainable Equities ETF Schedule of Investments July 31, 2024
CURRENCY EXPOSURE
JULY 31, 2024
| | | VALUE | | % OF TOTAL
INVESTMENTS | |
US Dollar | | $ | 6,842,083 | | | | 59.7 | % | |
European Monetary Unit | | | 1,798,924 | | | | 15.7 | % | |
British Pound Sterling | | | 506,333 | | | | 4.4 | % | |
Japanese Yen | | | 445,805 | | | | 3.9 | % | |
Hong Kong Dollar | | | 372,542 | | | | 3.3 | % | |
Swiss Franc | | | 238,698 | | | | 2.1 | % | |
Danish Krone | | | 231,701 | | | | 2.0 | % | |
South Korean Won | | | 166,314 | | | | 1.4 | % | |
Australian Dollar | | | 164,262 | | | | 1.4 | % | |
Swedish Krona | | | 162,059 | | | | 1.4 | % | |
Norwegian Krone | | | 70,436 | | | | 0.6 | % | |
Mexican Peso | | | 69,163 | | | | 0.6 | % | |
Canadian Dollar | | | 67,866 | | | | 0.6 | % | |
Indonesian Rupiah | | | 66,805 | | | | 0.6 | % | |
Indian Rupee | | | 64,215 | | | | 0.6 | % | |
Kenyan Shilling | | | 53,953 | | | | 0.5 | % | |
Brazilian Real | | | 52,330 | | | | 0.5 | % | |
Colombian Peso | | | 46,111 | | | | 0.4 | % | |
Chinese Yuan Renminbi | | | 33,334 | | | | 0.3 | % | |
Total Investments | | $ | 11,452,934 | | | | 100.0 | % | |
Currency exposure may vary over time.
See accompanying Notes to Financial Statements
www.calamos.com
7
Notes to Financial Statements
Note 1 – Organization and Significant Accounting Policies
Organization. Calamos ETF Trust (the "Trust"), a Delaware statutory trust organized on June 17, 2013, consisted of eight series as of the date of this report, including Calamos Antetokounmpo Global Sustainable Equities ETF (the "Fund"), which commenced operations on February 3, 2023. The Trust is registered under the Investment Company Act of 1940, as amended (the "1940 Act"), as an open-end management investment company. Prior to commencement of operations, the Fund had issued 4,000 shares of beneficial interest at an aggregate purchase price of $100,000 to Calamos Investments, LLC, the parent of Calamos Advisors, LLC.
The Fund is a diversified, actively managed exchange-traded fund ("ETF"). The Fund's investment objective is long-term capital appreciation.
Calamos Antetokounmpo Asset Management LLC ("CGAM", or the "Adviser"), serves as the Fund's adviser. CGAM is jointly owned by Calamos Advisors LLC ("Calamos Advisors") and Original C Fund, LLC, an entity whose voting rights are wholly owned by Original PE, LLC which, in turn, is wholly owned by Giannis Sina Ugo Antetokounmpo. Calamos Advisors serves as the Fund's subadviser ("Subadviser").
Significant Accounting Policies. The financial statements have been prepared in conformity with accounting principles generally accepted in the United States of America (U.S. GAAP), and the Fund is considered an investment company under U.S. GAAP and follows the accounting and reporting guidance applicable to investment companies. Under U.S. GAAP, management is required to make certain estimates and assumptions at the date of the financial statements and actual results may differ from those estimates. Subsequent events, if any, through the date that the financial statements were issued, have been evaluated in the preparation of the financial statements. The following summarizes the significant accounting policies of the Fund.
Fund Valuation. The Fund's Board of Trustees ("Board" or "Trustees"), including a majority of the Trustees who are not "interested persons" of the Fund, have designated the Adviser to perform fair valuation determinations related to all Fund investments under the oversight of the Board. As "valuation designee" the Adviser has adopted procedures to guide the determination of the net asset value ("NAV") on any day on which the Fund's NAVs are determined. The valuation of the Fund's investments is in accordance with these procedures.
Fund securities that are traded on U.S. securities exchanges, except option securities, are valued at the official closing price, which is the last current reported sales price on its principal exchange at the time the Fund determines its NAV. Securities traded in the over-the-counter market and quoted on The NASDAQ Stock Market are valued at the NASDAQ Official Closing Price, as determined by NASDAQ, or lacking a NASDAQ Official Closing Price, the last current reported sale price on NASDAQ at the time a Fund determines its NAV. When a last sale or closing price is not available, equity securities, other than option securities, that are traded on a U.S. securities exchange and other equity securities traded in the over-the-counter market are valued at the mean between the most recent bid and asked quotations on its principal exchange in accordance with guidelines adopted by the Board. Each option security traded on a U.S. securities exchange is valued at the mid-point of the consolidated bid/ask quote for the option security, also in accordance with guidelines adopted by the Board. Each over-the-counter option that is not traded through the Options Clearing Corporation is valued either by an independent pricing agent approved by the Board or based on a quotation provided by the counterparty to such option under the ultimate supervision of the Board.
Trading on European and Far Eastern exchanges and over-the-counter markets is typically completed at various times before the close of business on each day on which the New York Stock Exchange ("NYSE") is open. Securities and those that are principally traded in other foreign markets, are valued as of the last reported sale price at the time the Fund determines its NAV, or when reliable market prices or quotations are not readily available, at the mean between the most recent bid and asked quotations as of the close of the appropriate exchange or other designated time. Trading of foreign securities may not take place on every NYSE business day. In addition, trading may take place in various foreign markets on Saturdays or on other days when the NYSE is not open and on which the Fund's NAV is not calculated.
If the valuation designee determines that the valuation of a security in accordance with the methods described above is not reflective of a fair value for such security, the security is valued at a fair value by the valuation designee.
The Fund also may use fair value pricing, pursuant to guidelines adopted by the Adviser, if trading in the security is halted or if the value of a security it holds is materially affected by events occurring before the Fund's pricing time but after the close of the primary market or exchange on which the security is listed. Those procedures may utilize valuations furnished by pricing services approved by the Adviser, which may be based on market transactions for comparable securities and various
CALAMOS ANTETOKOUNMPO GLOBAL SUSTAINABLE EQUITIES ETF ANNUAL REPORT
8
Notes to Financial Statements
relationships between securities that are generally recognized by institutional traders, a computerized matrix system, or appraisals derived from information concerning the securities or similar securities received from recognized dealers in those securities.
When fair value pricing of securities is employed, the prices of securities used by the Fund to calculate its NAV may differ from market quotations or official closing prices. There can be no assurance that the Fund could purchase or sell a portfolio security at the price used to calculate the Fund's NAV.
Investment Transactions. Investment transactions are recorded on a trade date basis as of July 31, 2024. Net realized gains and losses from investment transactions are reported on an identified cost basis. Interest income is recognized using the accrual method and includes accretion of original issue and market discount and amortization of premium. Dividend income is recognized on the ex-dividend date, except that certain dividends from foreign securities are recorded as soon as the information becomes available after the ex-dividend date.
Foreign Currency Translation. Values of investments and other assets and liabilities denominated in foreign currencies are translated into U.S. dollars using a rate quoted by a major bank or dealer in the particular currency market, as reported by a recognized quotation dissemination service.
The Fund does not isolate that portion of the results of operations resulting from changes in foreign exchange rates on investments from the fluctuations arising from changes in market prices of securities held. Such fluctuations are included with the net realized and unrealized gain or loss from investments.
Reported net realized foreign currency gains or losses arise from disposition of foreign currency, the difference in the foreign exchange rates between the trade and settlement dates on securities transactions, and the difference between the amounts of dividends, interest and foreign withholding taxes recorded on the ex-date or accrual date and the U.S. dollar equivalent of the amounts actually received or paid. Net unrealized foreign exchange gains and losses arise from changes (due to the changes in the exchange rate) in the value of foreign currency and other assets and liabilities denominated in foreign currencies held at period end.
Allocation of Expenses Among Funds. Expenses directly attributable to a Fund are charged to that Fund; certain other common expenses of Calamos Advisors Trust, Calamos Investment Trust, Calamos Convertible Opportunities and Income Fund, Calamos Convertible and High Income Fund, Calamos Strategic Total Return Fund, Calamos Global Total Return Fund, Calamos Global Dynamic Income Fund, Calamos Dynamic Convertible and Income Fund, Calamos Long/Short Equity & Dynamic Income Trust, Calamos Antetokounmpo Sustainable Equities Trust, and Calamos ETF Trust are allocated proportionately among each fund to which the expenses relate in relation to the net assets of each fund or on another reasonable basis.
Income Taxes. No provision has been made for U.S. income taxes because the Fund's policy is to continue to qualify as a regulated investment company under the Internal Revenue Code of 1986, as amended, and distribute to shareholders substantially all of the Fund's taxable income and net realized gains.
Dividends and distributions paid to shareholders are recorded on the ex-dividend date. The amount of dividends and distributions from net investment income and net realized capital gains is determined in accordance with federal income tax regulations, which may differ from U.S. generally accepted accounting principles. To the extent these "book/tax" differences are permanent in nature, such amounts are reclassified within the capital accounts based on their federal tax-basis treatment. These differences are primarily due to differing treatments for foreign currency transactions and investments in passive foreign investment companies. The financial statements are not adjusted for temporary differences.
The Fund recognized no liability for uncertain tax positions. A reconciliation is not provided as the beginning and ending amounts of unrecognized benefits are zero, with no interim additions, reductions or settlements. Tax years 2023-2024 remain subject to examination by the U.S. and the State of Illinois tax jurisdictions.
Indemnifications. Under the Trust's organizational documents, the Trust is obligated to indemnify its officers and trustees against certain liabilities incurred by them by reason of having been an officer or trustee of the Trust. In addition, in the normal course of business, the Trust may enter into contracts that provide general indemnifications to other parties. The Fund's maximum exposure under these arrangements is unknown as this would involve future claims that may be made against the Fund that have not yet occurred. Currently, the Fund's management expects the risk of material loss in connection to a potential claim to be remote.
www.calamos.com
9
Notes to Financial Statements
Note 2 – Investment Adviser and Transactions With Affiliates Or Certain Other Parties
Advisory Fee. Pursuant to an investment advisory agreement with CGAM, the Fund pays a monthly unitary investment advisory fee based on the average daily net assets of the Fund at the annual rate of 0.95%.
Distributor. The distributor of the Fund is Calamos Financial Services LLC ("CFS" or "Distributor"). CFS is a limited purpose broker-dealer affiliated with Calamos Advisors. Prior to February 12, 2024, Foreside Fund Services, LLC, an affiliate of Foreside Financial Group, LLC (d/b/a ACA Group), served as the distributor of the Fund. The Distributor has entered into a distribution agreement with the Trust pursuant to which it distributes Fund Shares.
Affiliated Trustees and Officers. A Trustee and certain officers of the Trust are also officers and/or directors of CGAM. A Trustee and certain officers of the Fund are also officers and/or directors of Calamos Advisors. Such trustee and officers serve without direct compensation from the Trust. The Trust's Statement of Additional Information contains additional information about the Trust's Trustees and Officers and is available without charge, upon request, at www.calamos.com or by calling 866.363.9219.
Note 3 – Investments
The cost of purchases and proceeds from sales of long-term investments, excluding short-term investments and in-kind transactions, for the year ended July 31, 2024 were as follows:
| | | U.S. GOVERNMENT
SECURITIES | | OTHER | |
Cost of purchases | | $ | — | | | $ | 2,671,467 | | |
Proceeds from sales | | | — | | | | 2,826,302 | | |
Note 4 – Income Taxes
The following information is presented on a federal income tax basis as of July 31, 2024. Differences between the cost basis under U.S. GAAP and federal income tax purposes are primarily due to temporary differences.
The cost basis of investments for federal income tax purposes at July 31, 2024 was as follows:
Cost basis of investments | | $ | 9,504,713 | | |
Gross unrealized appreciation | | | 2,325,130 | | |
Gross unrealized depreciation | | | (376,909 | ) | |
Net unrealized appreciation (depreciation) | | $ | 1,948,221 | | |
For the fiscal year ended July 31, 2024, the Fund recorded the following permanent reclassifications to reflect tax character. The results of operations and net assets were not affected by these reclassifications.
Paid-in capital | | $ | — | | |
Undistributed net investment income/(loss) | | | 6,329 | | |
Accumulated net realized gain/(loss) on investments | | | (6,329 | ) | |
Distributions were characterized for federal income tax purposes as follows:
| | | YEAR ENDED
JULY 31, 2024 | |
Distributions paid from: | |
Ordinary income | | $ | 100,956 | | |
Long-term capital gains | | | — | | |
Return of capital | | | — | | |
CALAMOS ANTETOKOUNMPO GLOBAL SUSTAINABLE EQUITIES ETF ANNUAL REPORT
10
Notes to Financial Statements
As of July 31, 2024, the components of accumulated earnings/(loss) on a tax basis were as follows:
Undistributed ordinary income | | $ | 68,579 | | |
Undistributed capital gains | | | — | | |
Total undistributed earnings | | | 68,579 | | |
Accumulated capital and other losses | | | (71,497 | ) | |
Net unrealized gains/(losses) | | | 1,941,785 | | |
Total accumulated earnings/(losses) | | | 1,938,867 | | |
Other | | | — | | |
Paid-in-capital | | | 9,845,629 | | |
Net assets applicable to common shareholders | | $ | 11,784,496 | | |
The Fund had short-term capital loss carryforwards of $66,343 and long-term capital loss carryforwards of $5,154 for the period ended July 31, 2024, with no expiration date, available to offset future realized capital gains.
Note 5 – Securities Lending
The Fund may loan one or more of its securities to broker-dealers and banks. Any such loan must be secured by collateral in cash or cash equivalents maintained on a current basis in an amount at least equal to the value of the securities loaned by the Fund. The Fund continues to receive the equivalent of the interest or dividends paid by the issuer on the securities loaned and also receives an additional return that may be in the form of a fixed fee or a percentage of the collateral. The additional return, if any, is disclosed on a net basis as Securities lending income in the Statement of Operations. Upon receipt of cash or cash equivalent collateral, the Fund's securities lending agent invests the collateral into short term investments following investment guidelines approved by Calamos Advisors. The Fund records the investment of collateral as an asset (Investment in securities, at value or Restricted cash for collateral on securities loaned) and the value of the collateral as a liability (Collateral for securities loaned) on the Statement of Assets and Liabilities. If the value of the invested collateral declines below the value of the collateral deposited by the borrower, the Fund will record unrealized depreciation equal to the decline in value of the invested collateral. The Fund will pay reasonable fees to persons unaffiliated with the Fund for services in arranging these loans. The Fund has the right to call a loan and obtain the securities loaned at any time. The Fund does not have the right to vote the securities during the existence of the loan but could call the loan in an attempt to permit voting of the securities in certain circumstances. Upon return of the securities loaned, the cash or cash equivalent collateral will be returned to the borrower. In the event of bankruptcy or other default of the borrower, the Fund could experience both delays in liquidating the loan collateral or recovering the loaned securities and losses, including (a) possible decline in the value of the collateral or in the value of the securities loaned during the year while the Fund seeks to enforce its rights thereto, (b) possible subnormal levels of income and lack of access to income during this year, and (c) the expenses of enforcing its rights. In an effort to reduce these risks, the Fund's security lending agent monitors and reports to Calamos Advisors on the creditworthiness of the firms to which the Fund lends securities.
The Fund did not participate in securities lending during the year ended July 31, 2024.
Note 6 – Fair Value Measurement
Various inputs are used to determine the value of the Fund's investments. These inputs are categorized into three broad levels as follows:
• Level 1 – Prices are determined using inputs from unadjusted quoted prices from active markets (including securities actively traded on a securities exchange) for identical assets.
• Level 2 – Prices are determined using significant observable market inputs other than unadjusted quoted prices, including quoted prices of similar securities, fair value adjustments to quoted foreign securities, interest rates, credit risk, prepayment speeds, and other relevant data.
• Level 3 – Prices reflect unobservable market inputs (including the Fund's own judgments about assumptions market participants would use in determining fair value) when observable inputs are unavailable.
Debt securities are valued based upon evaluated prices received from an independent pricing service or from a dealer or broker who makes markets in such securities. Pricing services utilize various observable market data and as such, debt securities are generally categorized as Level 2. The levels are not necessarily an indication of the risk or liquidity of the Fund's investments.
www.calamos.com
11
Notes to Financial Statements
The following is a summary of the inputs used in valuing the Fund's holdings at fair value:
| | | LEVEL 1 | | LEVEL 2 | | LEVEL 3 | | TOTAL | |
Assets: | |
Common Stocks | | $ | 11,452,934 | | | $ | — | | | $ | — | | | $ | 11,452,934 | | |
Total | | $ | 11,452,934 | | | $ | — | | | $ | — | | | $ | 11,452,934 | | |
Note 7 – Creation and Redemption Transactions
The Fund offers and issues Shares at NAV only in aggregations of a specified number of Shares, generally in exchange for a basket of securities constituting the portfolio holdings of the Fund, together with the deposit of a specified cash payment, or, in certain circumstances, for an all cash payment. Shares of the Fund are listed and principally traded on NYSE Arca, Inc. ("NYSE Arca" or the "Exchange"). Shares trade on the Exchange at market prices that may be below, at, or above NAV. Unlike mutual funds, Fund Shares are not individually redeemable securities. Rather, the Fund issues and redeems Shares on a continuous basis at NAV, typically in creation units of 50,000 Shares (each, a "Creation Unit"). In the event of the liquidation of the Fund, the Trust may lower the number of Shares in a Creation Unit. Financial entities known as "authorized participants" (which are discussed in greater detail below) have contractual arrangements with the Fund or the Distributor to purchase and redeem Fund Shares directly with such Fund in Creation Units in exchange for the securities comprising the Fund and/or cash, or some combination thereof. Fund Shares are traded in the secondary market and elsewhere at market prices that may be at, above, or below the Fund's NAV. Fund Shares are only redeemable in Creation Units by authorized participants. An authorized participant that purchases a Creation Unit of Fund Shares deposits with such Fund a "basket" of securities and/or other assets identified by the Fund that day, and then receives the Creation Unit of Fund Shares in return for those assets. The redemption process is the reverse of the purchase process: the authorized participant redeems a Creation Unit of Fund Shares for a basket of securities and other assets. The basket is generally representative of the Fund's portfolio, and together with a cash balancing amount, it is equal to the NAV of the Fund Shares comprising the Creation Unit. Pursuant to Rule 6c-11 of the 1940 Act ("Rule 6c-11"), the Fund may utilize baskets that are not representative of the Fund's portfolio. Such "custom baskets" are discussed in the Fund's Statement of Additional Information in the section entitled "Creation and Redemption of Creation Units". Transaction fees and other costs associated with creations or redemptions that include cash may be higher than the transaction fees and other costs associated with in-kind creations or redemptions. In all cases, conditions with respect to creations and redemptions of shares and fees will be limited in accordance with the requirements of SEC rules and regulations applicable to management investment companies offering redeemable securities.
CALAMOS ANTETOKOUNMPO GLOBAL SUSTAINABLE EQUITIES ETF ANNUAL REPORT
12
Report of Independent Registered Public Accounting Firm
To the shareholders and the Board of Trustees of Calamos ETF Trust
Opinion on the Financial Statements and Financial Highlights
We have audited the accompanying statement of assets and liabilities, including the schedule of investments, of Calamos Antetokounmpo Global Sustainable Equities ETF (the "Fund"), one of the funds constituting the Calamos ETF Trust, as of July 31, 2024, the related statement of operations for the year then ended, the statements of changes in net assets, and the financial highlights for the year then ended and the period from February 3, 2023 (commencement of operations) through July 31, 2023, and the related notes. In our opinion, the financial statements and financial highlights present fairly, in all material respects, the financial position of the Fund as of July 31, 2024, and the results of its operations for the year then ended, the changes in its net assets, and the financial highlights for the year then ended and the period from February 3, 2023 (commencement of operations) through July 31, 2023, in conformity with accounting principles generally accepted in the United States of America.
Basis for Opinion
These financial statements and financial highlights are the responsibility of the Fund's management. Our responsibility is to express an opinion on the Fund's financial statements and financial highlights based on our audits. We are a public accounting firm registered with the Public Company Accounting Oversight Board (United States) (PCAOB) and are required to be independent with respect to the Fund in accordance with the U.S. federal securities laws and the applicable rules and regulations of the Securities and Exchange Commission and the PCAOB.
We conducted our audits in accordance with the standards of the PCAOB. Those standards require that we plan and perform the audit to obtain reasonable assurance about whether the financial statements and financial highlights are free of material misstatement, whether due to error or fraud. The Fund is not required to have, nor were we engaged to perform, an audit of its internal control over financial reporting. As part of our audits we are required to obtain an understanding of internal control over financial reporting but not for the purpose of expressing an opinion on the effectiveness of the Fund's internal control over financial reporting. Accordingly, we express no such opinion.
Our audits included performing procedures to assess the risks of material misstatement of the financial statements and financial highlights, whether due to error or fraud, and performing procedures that respond to those risks. Such procedures included examining, on a test basis, evidence regarding the amounts and disclosures in the financial statements and financial highlights. Our audits also included evaluating the accounting principles used and significant estimates made by management, as well as evaluating the overall presentation of the financial statements and financial highlights. Our procedures included confirmation of securities owned as of July 31, 2024, by correspondence with the custodian and brokers. We believe that our audits provide a reasonable basis for our opinion.

Chicago, Illinois
September 19, 2024
We have served as the auditor of one or more Calamos Advisors LLC investment companies since 2003.
www.calamos.com
13
Statement Regarding Basis for Approval of Investment Advisory Contract
The Board of Trustees ("Board" or the "Trustees") of Calamos ETF Trust ("Trust") oversees the management of Calamos Antetokounmpo Global Sustainable Equities ETF (the "Fund"), a series of the Trust, and, as required by law, determines annually whether to continue the Trust's management agreement with Calamos Antetokounmpo Asset Management LLC ("Adviser"), pursuant to which the Adviser serves as the investment manager and provides certain administrative services for the Fund, and the investment sub-advisory agreement by and among the Trust, the Adviser and Calamos Advisors LLC ("Sub-Adviser"), pursuant to which the Sub-Adviser serves as investment sub-adviser for the Fund. The "Independent Trustees," who comprise more than 80% of the Board, have never been affiliated with the Adviser or the Sub-Adviser.
In connection with their most recent consideration regarding the continuation of the management agreement and investment sub-advisory agreement, the Trustees received and reviewed a substantial amount of information provided by the Adviser and Sub-Adviser in response to detailed requests of the Independent Trustees and their independent legal counsel. In the course of their consideration of the agreements, the Independent Trustees were advised by their counsel and, in addition to meeting with management of the Adviser and Sub-Adviser, they met separately in executive session with their counsel.
At a meeting held on June 27, 2024, based on their evaluation of the information referred to above and other information provided in this and previous meetings, the Trustees determined that the overall arrangements between the Trust and the Adviser and Sub-Adviser on behalf of the Fund were fair in light of the nature, quality and extent of the services provided by the Adviser, Sub-Adviser and their affiliates, as applicable, the fees charged for those services and other matters that the Trustees considered relevant in the exercise of their business judgment. At that meeting, the Trustees, including all of the Independent Trustees, approved the continuation of the management agreement and investment sub-advisory agreement with respect to the Fund through January 10, 2026, subject to possible earlier termination as provided in such agreements.
In connection with its consideration of the management agreement and investment sub-advisory agreement of the Trust, the Board considered, among other things: (i) the nature, quality and extent of the Adviser's and Sub-Adviser's services, (ii) the investment performance of the Fund as well as performance information for comparable funds and other, comparable clients of the Adviser and Sub-Adviser, (iii) the fees and other expenses paid by the Fund as well as expense information for comparable funds and for other, comparable clients of the Adviser and Sub-Adviser, (iv) the profitability of the Adviser and Sub-Adviser and their affiliates from their relationship with the Fund, (v) whether economies of scale may be realized as the Fund grows and whether potential economies may be shared, in some measure, with the Fund's investors and (vi) other benefits to the Adviser and Sub-Adviser from their relationship with the Fund. In the Board's deliberations, no single factor was responsible for the Board's decision to approve the continuation of the management agreement and investment sub-advisory agreement, and each Trustee may have afforded different weight to the various factors.
Nature, Quality and Extent of Services. The Board's consideration of the nature, quality and extent of the Adviser's and Sub-Adviser's services to the Fund took into account the knowledge gained from the Board's meetings with the Adviser and/or Sub-Adviser throughout the years. In addition, the Board considered: the Adviser's and Sub-Adviser's history of managing the Fund and the Sub-Adviser's long-term history of managing other funds in the Calamos fund complex; the consistency of investment approach; the Sub-Adviser's recent acquisition of Pearl Impact Capital LLC ("Pearl Impact"); the background and experience of Messrs. Madden and Tursich and Ms. Williamson (who are now employees of the Sub-Adviser) and the other investment personnel responsible for managing the Fund; the Sub-Adviser's provision of administrative services for other funds in the Calamos fund complex, including, among other things, in the areas of brokerage selection, trade execution, compliance and shareholder communications; and the "dual-hatting" arrangement in place between the Adviser and Sub-Adviser with respect to employees of the Sub-Adviser that will provide services to the Adviser. The Board also reviewed the Adviser's and Sub-Adviser's resources and key personnel involved in providing investment management and investment sub-advisory services to the Fund. In addition, the Board considered compliance reports about the Adviser and Sub-Adviser from the Trust's Chief Compliance Officer.
The Board also considered the information provided by the Adviser and Sub-Adviser regarding the Fund's performance and the steps the Adviser and Sub-Adviser are taking to improve performance. In particular, the Board noted the additional personnel added to the Sub-Adviser's investment team, which includes portfolio managers, research analysts, research associates and risk management personnel. The Board also noted the Adviser's and Sub-Adviser's significant investment into their infrastructure and investment processes.
Investment Performance of the Fund. The Board considered the Fund's investment performance over various time periods, including how the Fund performed compared to the average performance of a group of comparable funds (the Fund's "Category") selected by an independent third-party service provider. As noted below, the Category represents a custom
CALAMOS ANTETOKOUNMPO GLOBAL SUSTAINABLE EQUITIES ETF ANNUAL REPORT
14
Statement Regarding Basis for Approval of Investment Advisory Contract
group of comparable funds, also selected by the independent third-party service provider. The performance periods considered by the Board ended on March 31, 2024, except where otherwise noted. Because the Fund commenced operations on February 3, 2023, three-, five- and ten-year performance was not available and the Board only considered one-year performance. To the extent the Board considered data for periods other than those ending on March 31, 2024 or considered comparative data in addition to that of the Category, such as comparative data for an alternate group of comparable funds (a "category"), the data was still produced by an independent third-party service provider.
The Board considered that the Fund outperformed its custom Category average for all periods.
Costs of Services Provided and Profits Realized by the Adviser and Sub-Adviser. Using information provided by an independent third-party service provider, the Board evaluated the Fund's actual management fee rate and sub-advisory fee rate compared to the median management fee rate and sub-advisory fee rate for other open-end funds similar in size, character and investment strategy (the Fund's "Expense Group") and the Fund's total expense ratio compared to the median total expense ratio of the Fund's Expense Group.
The Board also reviewed the Adviser's and Sub-Adviser's management fee rates for their institutional separate accounts, other advisory accounts and sub-advisory accounts with comparable investment strategies. The Board took into account that, although the rates of fees paid by institutional clients or for sub-advisory services were generally lower than the rates of fees paid by the Fund, the differences reflected the Adviser's and Sub-Adviser's greater level of responsibilities and significantly broader scope of services regarding the Fund, the more extensive regulatory obligations and risks associated with managing the Fund, and other financial considerations with respect to creation and sponsorship of the Fund. The Board considered factors that led to more expenses for registered funds including but not limited to: (i) capital expenditures to establish a fund, (ii) length of time to reach critical mass, and the related expenses, (iii) higher servicing costs of intermediaries and shareholders, (iv) higher redemption rates of assets under management, (v) entrepreneurial risk assumed by the Adviser and Sub-Adviser and (vi) greater exposure to "make whole" errors.
The Board also considered the Adviser's and Sub-Adviser's costs in serving as the Fund's investment adviser and sub-adviser, respectively, including but not limited to costs associated with technology, infrastructure and compliance necessary to manage or sub-advise the Fund. The Board reviewed the Adviser's and Sub-Adviser's methodology for allocating costs among their lines of business. The Board also considered information regarding the structure of the Adviser's and Sub-Adviser's compensation program for portfolio managers, analysts and certain other employees, and the relationship of such compensation to the attraction and retention of quality personnel. Finally, the Board reviewed information on the profitability of the Adviser and the Sub-Adviser in serving as the Fund's investment adviser and sub-adviser, respectively, and of the Adviser, Sub-Adviser and their respective affiliates in all of their relationships with the Fund, as well as an explanation of the methodology utilized in allocating various expenses among the Fund and the Adviser's and Sub-Adviser's other business units. Data was provided to the Board with respect to profitability, both on a pre- and post-marketing cost basis. The Board reviewed the financial statements of the Adviser's and Sub-Adviser's parent companies and discussed their corporate structure.
The Board considered that the Fund's management fee rate and total expense ratio are higher than the respective medians of the Fund's Expense Group. The Board also considered that the Fund's management fee was a unitary or "all-inclusive" fee structure which combines fees for investment advisory and administrative services rendered by the Adviser to the Fund.
Economies of Scale. The Board considered whether the Fund's management fee shares with shareholders potential economies of scale that may be achieved by the Adviser and Sub-Adviser. The Board also considered the benefits accruing to shareholders from the Adviser's and Sub-Adviser's investments into their infrastructure and investment processes.
Other Benefits Derived from the Relationship with the Fund. The Board also considered other benefits that accrue to the Adviser and Sub-Adviser and their affiliates from their relationship with the Fund. The Board concluded that, while each of the Adviser and Sub-Adviser may potentially benefit from its relationship with the Fund in ways other than the fees payable by the Fund, the Fund also may benefit from its relationship with the Adviser and Sub-Adviser in ways other than the services to be provided by the Adviser and Sub-Adviser and their affiliates pursuant to their agreements with the Fund and the fees payable by the Fund.
The Board also considered the Sub-Adviser's use of a portion of the commissions paid by the Fund on its portfolio brokerage transactions to obtain research products and services benefiting the Fund and/or other clients of the Sub-Adviser and concluded, based on reports from the Trust's Chief Compliance Officer, that the Sub-Adviser's use of "soft" commission dollars to obtain research products and services was consistent with regulatory requirements.
www.calamos.com
15
Statement Regarding Basis for Approval of Investment Advisory Contract
After full consideration of the above factors as well as other factors that were instructive in their consideration, the Trustees, including all of the Independent Trustees, concluded that the continuation of the management agreement for the Fund with the Adviser and the investment sub-advisory agreement with the Sub-Adviser with respect to the Fund were in best interest of the Fund and its shareholders.
CALAMOS ANTETOKOUNMPO GLOBAL SUSTAINABLE EQUITIES ETF ANNUAL REPORT
16
Tax Information (Unaudited)
We are providing this information as required by the Internal Revenue Code (Code). The amounts shown may differ from those elsewhere in this report due to differences between tax and financial reporting requirements. In February 2025, shareholders will receive Form 1099-DIV which will include their share of qualified dividends and capital gains distributed during the calendar year 2024. Shareholders are advised to check with their tax advisors for information on the treatment of these amounts on their individual income tax returns.
Under Section 852(b)(3)(C) of the Code, the Fund had no capital gain dividends for the fiscal year ended July 31, 2024.
Under Section 854(b)(2) of the Code, the Fund had $121,585 of qualified dividends for the fiscal year ended July 31, 2024.
Under Section 854(b)(2) of the Code, the Fund hereby designates 26.4% of ordinary income dividends as income qualifying for the dividends received deduction for the fiscal year ended July 31, 2024.
www.calamos.com
17

TIMELY INFORMATION INSIDE


Visit www.calamos.com/paperless to enroll. You can view shareholder communications, including fund prospectuses, annual reports and other shareholder materials online long before the printed publications arrive by traditional mail.
ETF Family of Funds
ANNUAL FINANCIAL STATEMENTS AND OTHER INFORMATION JULY 31, 2024
Exchange-Traded Funds
Calamos Convertible Equity Alternative ETF (Ticker: CVRT)
Calamos CEF Income & Arbitrage ETF (Ticker: CCEF)
Calamos Alternative Nasdaq® & Bond ETF (Ticker: CANQ)
Calamos S&P 500® Structured Alt Protection ETFTM—May (Ticker: CPSM)
Calamos S&P 500® Structured Alt Protection ETFTM—July (Ticker: CPSJ)
Calamos Nasdaq-100® Structured Alt Protection ETFTM—June (Ticker: CPNJ)
Calamos Russell 2000® Structured Alt Protection ETFTM—July (Ticker: CPRJ)

TABLE OF CONTENTS
Statements of Assets and Liabilities | | | 1 | | |
Statements of Operations | | | 3 | | |
Statements of Changes In Net Assets | | | 5 | | |
Financial Highlights | | | 7 | | |
Schedules of Investments | | | 14 | | |
Notes to Financial Statements | | | 22 | | |
Report of Independent Registered Public Accounting Firm | | | 32 | | |
Statement Regarding Basis for Approval of Investment
Advisory Contract | | | 34 | | |
Tax Information | | | 40 | | |
Statements of Assets and Liabilities July 31, 2024
| | | CONVERTIBLE
EQUITY
ALTERNATIVE ETF | | CEF INCOME &
ARBITRAGE ETF | | ALTERNATIVE
NASDAQ® &
BOND ETF | |
ASSETS | |
Investments in securities, at cost | | $ | 8,794,032 | | | $ | 12,174,659 | | | $ | 1,240,189 | | |
Investment in securities, at value* | | $ | 9,577,254 | | | $ | 12,885,102 | | | $ | 1,298,495 | | |
Cash with custodian | | | 64,303 | | | | 582,901 | | | | 9,085 | | |
Receivables: | |
Investments sold | | | 788,056 | | | | 229,231 | | | | — | | |
Accrued interest and dividends | | | 36,933 | | | | 23,854 | | | | 143 | | |
Total assets | | | 10,466,546 | | | | 13,721,088 | | | | 1,307,723 | | |
LIABILITIES | |
Collateral for securities loaned | | | 1,430,793 | | | | — | | | | — | | |
Payables: | |
Investments purchased | | | 815,175 | | | | 585,708 | | | | — | | |
Affiliates: | |
Investment Advisory fees | | | 6,433 | | | | 7,879 | | | | 865 | | |
Total liabilities | | | 2,252,401 | | | | 593,587 | | | | 865 | | |
NET ASSETS | | $ | 8,214,145 | | | $ | 13,127,501 | | | $ | 1,306,858 | | |
COMPOSITION OF NET ASSETS | |
Paid in capital | | $ | 8,216,299 | | | $ | 12,308,263 | | | $ | 1,242,791 | | |
Accumulated distributable earnings | | | (2,154 | ) | | | 819,238 | | | | 64,067 | | |
NET ASSETS | | $ | 8,214,145 | | | $ | 13,127,501 | | | $ | 1,306,858 | | |
Shares outstanding (no par value; unlimited number of shares authorized) | | | 300,001 | | | | 475,001 | | | | 50,001 | | |
Net asset value per share | | $ | 27.38 | | | $ | 27.64 | | | $ | 26.14 | | |
| * Includes securities on loan | | $ | 1,419,480 | | | $ | — | | | $ | — | | |
See accompanying Notes to Financial Statements
www.calamos.com
1
Statements of Assets and Liabilities July 31, 2024
| | | S&P 500®
STRUCTURED ALT
PROTECTION
ETFTM—MAY | | S&P 500®
STRUCTURED ALT
PROTECTION
ETFTM—JULY | | NASDAQ-100®
STRUCTURED ALT
PROTECTION
ETFTM—JUNE | | RUSSELL 2000®
STRUCTURED ALT
PROTECTION
ETFTM—JULY | |
ASSETS | |
Investments in securities, at cost | | $ | 109,468,017 | | | $ | 31,052,472 | | | $ | 67,877,901 | | | $ | 56,598,210 | | |
Investment in securities, at value | | $ | 115,539,286 | | | $ | 31,303,182 | | | $ | 68,616,288 | | | $ | 61,332,862 | | |
Cash with custodian | | | 428,523 | | | | 83,875 | | | | 502,133 | | | | 134,248 | | |
Receivables: | |
Investments sold | | | — | | | | — | | | | 38,978 | | | | — | | |
Funds shares sold | | | — | | | | — | | | | 600,444 | | | | — | | |
Accrued interest | | | 6,540 | | | | — | | | | 1,448 | | | | — | | |
Total assets | | | 115,974,349 | | | | 31,387,057 | | | | 69,759,291 | | | | 61,467,110 | | |
LIABILITIES | |
Options written, at value (premium $4,384,344, $1,041,964, $4,098,601 and $2,406,210) | | | 7,994,340 | | | | 1,024,617 | | | | 4,212,000 | | | | 5,665,651 | | |
Payables: | |
Investments purchased | | | — | | | | — | | | | 635,378 | | | | — | | |
Affiliates: | |
Investment Advisory fees | | | 176,696 | | | | 14,059 | | | | 61,792 | | | | 24,340 | | |
Total liabilities | | | 8,171,036 | | | | 1,038,676 | | | | 4,909,170 | | | | 5,689,991 | | |
NET ASSETS | | $ | 107,803,313 | | | $ | 30,348,381 | | | $ | 64,850,121 | | | $ | 55,777,119 | | |
COMPOSITION OF NET ASSETS | |
Paid in capital | | $ | 105,342,040 | | | $ | 30,082,988 | | | $ | 64,225,133 | | | $ | 54,314,766 | | |
Accumulated distributable earnings | | | 2,461,273 | | | | 265,393 | | | | 624,988 | | | | 1,462,353 | | |
NET ASSETS | | $ | 107,803,313 | | | $ | 30,348,381 | | | $ | 64,850,121 | | | $ | 55,777,119 | | |
Shares outstanding (no par value; unlimited number of shares authorized) | | | 4,150,001 | | | | 1,250,001 | | | | 2,700,001 | | | | 2,225,001 | | |
Net asset value per share | | $ | 25.98 | | | $ | 24.28 | | | $ | 24.02 | | | $ | 25.07 | | |
See accompanying Notes to Financial Statements
ETF FAMILY OF FUNDS ANNUAL REPORT
2
Statements of Operations Period Ended July 31, 2024
| | | CONVERTIBLE
EQUITY
ALTERNATIVE ETF(a) | | CEF INCOME &
ARBITRAGE ETF(b) | | ALTERNATIVE
NASDAQ® &
BOND ETF(c) | |
INVESTMENT INCOME | |
Interest | | $ | 96,056 | | | $ | 2,586 | | | $ | 180 | | |
(Amortization)/accretion of investment securities | | | (1,226,285 | ) | | | — | | | | — | | |
Net interest | | | (1,130,229 | ) | | | 2,586 | | | | 180 | | |
Dividends | | | 74,274 | | | | 359,203 | | | | 32,329 | | |
Securities lending income, net of rebates received or paid to borrowers | | | 2,766 | | | | — | | | | — | | |
Total investment income (loss) | | | (1,053,189 | ) | | | 361,789 | | | | 32,509 | | |
EXPENSES | |
Investment Advisory fees | | | 61,845 | | | | 31,332 | | | | 4,546 | | |
Total expenses | | | 61,845 | | | | 31,332 | | | | 4,546 | | |
NET INVESTMENT INCOME (LOSS) | | | (1,115,034 | ) | | | 330,457 | | | | 27,963 | | |
REALIZED AND UNREALIZED GAIN (LOSS) | |
Net realized gain (loss) from: | |
Investments, excluding purchased options | | | 482,825 | | | | 31,240 | | | | (842 | ) | |
In-kind redemptions | | | 1,355,231 | | | | 26,339 | | | | — | | |
Purchased options | | | — | | | | — | | | | 205 | | |
Change in net unrealized appreciation/(depreciation) on: | |
Investments, excluding purchased options | | | 783,222 | | | | 710,443 | | | | 12,284 | | |
Purchased options | | | — | | | | — | | | | 46,022 | | |
NET GAIN (LOSS) | | | 2,621,278 | | | | 768,022 | | | | 57,669 | | |
NET INCREASE (DECREASE) IN NET ASSETS RESULTING FROM OPERATIONS | | $ | 1,506,244 | | | $ | 1,098,479 | | | $ | 85,632 | | |
(a) Calamos Convertible Equity Alternative ETF commenced operations on October 4, 2023.
(b) Calamos CEF Income & Arbitrage ETF commenced operations on January 16, 2024.
(c) Calamos Alternative Nasdaq® & Bond ETF commenced operations on February 13, 2024.
See accompanying Notes to Financial Statements
www.calamos.com
3
Statements of Operations Period Ended July 31, 2024
| | | S&P 500®
STRUCTURED ALT
PROTECTION
ETFTM—MAY(d) | | S&P 500®
STRUCTURED ALT
PROTECTION
ETFTM—JULY(e) | | NASDAQ-100®
STRUCTURED ALT
PROTECTION
ETFTM—JUNE(f) | | RUSSELL 2000®
STRUCTURED ALT
PROTECTION
ETFTM—JULY(g) | |
INVESTMENT INCOME | |
Interest | | $ | 9,121 | | | $ | 303 | | | $ | 3,655 | | | $ | 463 | | |
Total investment income (loss) | | | 9,121 | | | | 303 | | | | 3,655 | | | | 463 | | |
EXPENSES | |
Investment Advisory fees | | | 176,696 | | | | 14,059 | | | | 61,792 | | | | 24,340 | | |
Total expenses | | | 176,696 | | | | 14,059 | | | | 61,792 | | | | 24,340 | | |
NET INVESTMENT INCOME (LOSS) | | | (167,575 | ) | | | (13,756 | ) | | | (58,137 | ) | | | (23,877 | ) | |
REALIZED AND UNREALIZED GAIN (LOSS) | |
Net realized gain (loss) from: | |
In-kind redemptions | | | 1,068,992 | | | | — | | | | 94,510 | | | | — | | |
Purchased options | | | — | | | | (1,757 | ) | | | — | | | | (8,527 | ) | |
Written options | | | — | | | | (907 | ) | | | — | | | | (4,331 | ) | |
Change in net unrealized appreciation/(depreciation) on: | |
Purchased options | | | 6,071,269 | | | | 250,710 | | | | 738,387 | | | | 4,734,652 | | |
Written options | | | (3,609,996 | ) | | | 17,347 | | | | (113,399 | ) | | | (3,259,441 | ) | |
NET GAIN (LOSS) | | | 3,530,265 | | | | 265,393 | | | | 719,498 | | | | 1,462,353 | | |
NET INCREASE (DECREASE) IN NET ASSETS RESULTING
FROM OPERATIONS | | $ | 3,362,690 | | | $ | 251,637 | | | $ | 661,361 | | | $ | 1,438,476 | | |
(d) Calamos S&P 500® Structured Alt Protection ETFTM—May commenced operations on May 1, 2024.
(e) Calamos S&P 500® Structured Alt Protection ETFTM—July commenced operations on July 1, 2024.
(f) Calamos Nasdaq-100® Structured Alt Protection ETFTM—June commenced operations on June 3, 2024.
(g) Calamos Russell 2000® Structured Alt Protection ETFTM—July commenced operations on July 1, 2024.
See accompanying Notes to Financial Statements
ETF FAMILY OF FUNDS ANNUAL REPORT
4
Statements of Changes in Net Assets
| | | CONVERTIBLE
EQUITY
ALTERNATIVE
ETF | | CEF INCOME &
ARBITRAGE
ETF | | ALTERNATIVE
NASDAQ® &
BOND ETF | |
| | | FOR THE
PERIOD ENDED
JULY 31,
2024(a) | | FOR THE
PERIOD ENDED
JULY 31,
2024(b) | | FOR THE
PERIOD ENDED
JULY 31,
2024(c) | |
OPERATIONS | |
Net investment income (loss) | | $ | (1,115,034 | ) | | $ | 330,457 | | | $ | 27,963 | | |
Net realized gain (loss) | | | 1,838,056 | | | | 57,579 | | | | (637 | ) | |
Change in unrealized appreciation/(depreciation) | | | 783,222 | | | | 710,443 | | | | 58,306 | | |
Net increase (decrease) in net assets resulting from operations | | | 1,506,244 | | | | 1,098,479 | | | | 85,632 | | |
DISTRIBUTIONS TO SHAREHOLDERS | |
Total distributions | | | (142,447 | ) | | | (252,902 | ) | | | (21,565 | ) | |
CAPITAL STOCK TRANSACTIONS | |
Proceeds from shares sold | | | 17,917,543 | | | | 12,924,470 | | | | 1,242,791 | | |
Redeemed | | | (11,067,195 | ) | | | (642,546 | ) | | | — | | |
Net increase (decrease) in net assets from capital stock transactions | | | 6,850,348 | | | | 12,281,924 | | | | 1,242,791 | | |
TOTAL INCREASE (DECREASE) IN NET ASSETS | | | 8,214,145 | | | | 13,127,501 | | | | 1,306,858 | | |
NET ASSETS | |
Beginning of period | | $ | — | | | $ | — | | | $ | — | | |
End of period | | $ | 8,214,145 | | | $ | 13,127,501 | | | $ | 1,306,858 | | |
CAPITAL SHARE TRANSACTIONS | |
Shares issued | | | 700,001 | | | | 500,001 | | | | 50,001 | | |
Shares redeemed | | | (400,000 | ) | | | (25,000 | ) | | | — | | |
Net increase (decrease) in capital shares outstanding | | | 300,001 | | | | 475,001 | | | | 50,001 | | |
Shares outstanding, end of period | | | 300,001 | | | | 475,001 | | | | 50,001 | | |
(a) Calamos Convertible Equity Alternative ETF commenced operations on October 4, 2023.
(b) Calamos CEF Income & Arbitrage ETF commenced operations on January 16, 2024.
(c) Calamos Alternative Nasdaq® & Bond ETF commenced operations on February 13, 2024.
See accompanying Notes to Financial Statements
www.calamos.com
5
Statements of Changes in Net Assets
| | | S&P 500®
STRUCTURED ALT
PROTECTION
ETFTM—MAY | | S&P 500®
STRUCTURED ALT
PROTECTION
ETFTM—JULY | | NASDAQ-100®
STRUCTURED ALT
PROTECTION
ETFTM—JUNE | | RUSSELL 2000®
STRUCTURED ALT
PROTECTION
ETFTM—JULY | |
| | | FOR THE
PERIOD ENDED
JULY 31,
2024(d) | | FOR THE
PERIOD ENDED
JULY 31,
2024(e) | | FOR THE
PERIOD ENDED
JULY 31,
2024(f) | | FOR THE
PERIOD ENDED
JULY 31,
2024(g) | |
OPERATIONS | |
Net investment income (loss) | | $ | (167,575 | ) | | $ | (13,756 | ) | | $ | (58,137 | ) | | $ | (23,877 | ) | |
Net realized gain (loss) | | | 1,068,992 | | | | (2,664 | ) | | | 94,510 | | | | (12,858 | ) | |
Change in unrealized appreciation/(depreciation) | | | 2,461,273 | | | | 268,057 | | | | 624,988 | | | | 1,475,211 | | |
Net increase (decrease) in net assets resulting from operations | | | 3,362,690 | | | | 251,637 | | | | 661,361 | | | | 1,438,476 | | |
DISTRIBUTIONS TO SHAREHOLDERS | |
Total distributions | | | — | | | | — | | | | — | | | | — | | |
CAPITAL STOCK TRANSACTIONS | |
Proceeds from shares sold | | | 117,361,737 | | | | 30,096,744 | | | | 65,397,058 | | | | 54,338,643 | | |
Redeemed | | | (12,921,114 | ) | | | — | | | | (1,208,298 | ) | | | — | | |
Net increase (decrease) in net assets from capital stock transactions | | | 104,440,623 | | | | 30,096,744 | | | | 64,188,760 | | | | 54,338,643 | | |
TOTAL INCREASE (DECREASE) IN NET ASSETS | | | 107,803,313 | | | | 30,348,381 | | | | 64,850,121 | | | | 55,777,119 | | |
NET ASSETS | |
Beginning of period | | $ | — | | | $ | — | | | $ | — | | | $ | — | | |
End of period | | $ | 107,803,313 | | | $ | 30,348,381 | | | $ | 64,850,121 | | | $ | 55,777,119 | | |
CAPITAL SHARE TRANSACTIONS | |
Shares issued | | | 4,650,001 | | | | 1,250,001 | | | | 2,750,001 | | | | 2,225,001 | | |
Shares redeemed | | | (500,000 | ) | | | — | | | | (50,000 | ) | | | — | | |
Net increase (decrease) in capital shares outstanding | | | 4,150,001 | | | | 1,250,001 | | | | 2,700,001 | | | | 2,225,001 | | |
Shares outstanding, end of period | | | 4,150,001 | | | | 1,250,001 | | | | 2,700,001 | | | | 2,225,001 | | |
(d) Calamos S&P 500® Structured Alt Protection ETFTM—May commenced operations on May 1, 2024.
(e) Calamos S&P 500® Structured Alt Protection ETFTM—July commenced operations on July 1, 2024.
(f) Calamos Nasdaq-100® Structured Alt Protection ETFTM—June commenced operations on June 3, 2024.
(g) Calamos Russell 2000® Structured Alt Protection ETFTM—July commenced operations on July 1, 2024.
See accompanying Notes to Financial Statements
ETF FAMILY OF FUNDS ANNUAL REPORT
6
Calamos Convertible Equity Alternative ETF Financial Highlights
Selected data for a share outstanding throughout the period was as follows:
| | | OCTOBER 4, 2023•
THROUGH
JULY 31, 2024 | |
PER SHARE OPERATING PERFORMANCE | |
Net asset value, beginning of period | | $ | 24.23 | | |
Income from investment operations: | |
Net investment income (loss)(a) | | | (2.74 | ) | |
Net realized and unrealized gain (loss) | | | 6.21 | | |
Total from investment operations | | | 3.47 | | |
Less distributions to common shareholders from: | |
Net investment income | | | (0.32 | ) | |
Total distributions(b) | | | (0.32 | ) | |
Net asset value, end of period | | $ | 27.38 | | |
TOTAL RETURN APPLICABLE TO COMMON SHAREHOLDERS | |
Total investment return based on: | |
Net asset value(c) | | | 14.37 | % | |
RATIOS TO AVERAGE NET ASSETS APPLICABLE TO COMMON SHAREHOLDERS | |
Net expenses | | | 0.69 | %(d) | |
Net investment income (loss) | | | (12.44 | %)(d) | |
SUPPLEMENTAL DATA | |
Net assets applicable to common shareholders, end of period (000) | | $ | 8,214 | | |
Portfolio turnover rate | | | 123 | %(e)(f) | |
• Commencement of operations.
(a) Net investment income (loss) allocated based on average shares method.
(b) Distribution for annual periods determined in accordance with federal income tax regulations.
(c) Total return measures net investment income (loss) and capital gain or loss from portfolio investments assuming reinvestment of dividends and capital gains distributions. Total return is not annualized for periods that are less than a full year and does not reflect the deduction of taxes that a shareholder would pay on fund distributions or the redemption of fund shares.
(d) Annualized.
(e) Not annualized.
(f) Portfolio turnover rate excludes securities received or delivered from in-kind processing of creations or redemptions.
www.calamos.com
7
Calamos CEF Income & Arbitrage ETF Financial Highlights
Selected data for a share outstanding throughout the period was as follows:
| | | JANUARY 16, 2024•
THROUGH
JULY 31, 2024 | |
PER SHARE OPERATING PERFORMANCE | |
Net asset value, beginning of period | | $ | 25.03 | | |
Income from investment operations: | |
Net investment income (loss)(a) | | | 1.11 | | |
Net realized and unrealized gain (loss) | | | 2.19 | | |
Total from investment operations | | | 3.30 | | |
Less distributions to common shareholders from: | |
Net investment income | | | (0.69 | ) | |
Total distributions(b) | | | (0.69 | ) | |
Net asset value, end of period | | $ | 27.64 | | |
TOTAL RETURN APPLICABLE TO COMMON SHAREHOLDERS | |
Total investment return based on: | |
Net asset value(c) | | | 13.36 | % | |
RATIOS TO AVERAGE NET ASSETS APPLICABLE TO COMMON SHAREHOLDERS | |
Net expenses | | | 0.74 | %(d)(e) | |
Net investment income (loss) | | | 7.80 | %(d)(e) | |
SUPPLEMENTAL DATA | |
Net assets applicable to common shareholders, end of period (000) | | $ | 13,128 | | |
Portfolio turnover rate | | | 66 | %(f)(g) | |
• Commencement of operations.
(a) Net investment income (loss) allocated based on average shares method.
(b) Distribution for annual periods determined in accordance with federal income tax regulations.
(c) Total return measures net investment income (loss) and capital gain or loss from portfolio investments assuming reinvestment of dividends and capital gains distributions. Total return is not annualized for periods that are less than a full year and does not reflect the deduction of taxes that a shareholder would pay on fund distributions or the redemption of fund shares.
(d) Annualized.
(e) The Fund invests in other funds and indirectly bears its proportionate shares of fees and expenses incurred by the underlying funds in which the Fund is invested. This ratio does not include these indirect fees and expenses.
(f) Not annualized.
(g) Portfolio turnover rate excludes securities received or delivered from in-kind processing of creations or redemptions.
ETF FAMILY OF FUNDS ANNUAL REPORT
8
Calamos Alternative Nasdaq® & Bond ETF Financial Highlights
Selected data for a share outstanding throughout the period was as follows:
| | | FEBRUARY 13, 2024•
THROUGH
JULY 31, 2024 | |
PER SHARE OPERATING PERFORMANCE | |
Net asset value, beginning of period | | $ | 24.86 | | |
Income from investment operations: | |
Net investment income (loss)(a) | | | 0.56 | | |
Net realized and unrealized gain (loss) | | | 1.15 | | |
Total from investment operations | | | 1.71 | | |
Less distributions to common shareholders from: | |
Net investment income | | | (0.43 | ) | |
Total distributions(b) | | | (0.43 | ) | |
Net asset value, end of period | | $ | 26.14 | | |
TOTAL RETURN APPLICABLE TO COMMON SHAREHOLDERS | |
Total investment return based on: | |
Net asset value(c) | | | 6.96 | % | |
RATIOS TO AVERAGE NET ASSETS APPLICABLE TO COMMON SHAREHOLDERS | |
Net expenses | | | 0.77 | %(d) | |
Net investment income (loss) | | | 4.74 | %(d) | |
SUPPLEMENTAL DATA | |
Net assets applicable to common shareholders, end of period (000) | | $ | 1,307 | | |
Portfolio turnover rate | | | 9 | %(e)(f) | |
• Commencement of operations.
(a) Net investment income (loss) allocated based on average shares method.
(b) Distribution for annual periods determined in accordance with federal income tax regulations.
(c) Total return measures net investment income (loss) and capital gain or loss from portfolio investments assuming reinvestment of dividends and capital gains distributions. Total return is not annualized for periods that are less than a full year and does not reflect the deduction of taxes that a shareholder would pay on fund distributions or the redemption of fund shares.
(d) Annualized.
(e) Not annualized.
(f) Portfolio turnover rate excludes securities received or delivered from in-kind processing of creations or redemptions.
www.calamos.com
9
Calamos S&P 500® Structured Alt Protection ETFTM—May Financial Highlights
Selected data for a share outstanding throughout the period was as follows:
| | | MAY 1, 2024•
THROUGH
JULY 31, 2024 | |
PER SHARE OPERATING PERFORMANCE | |
Net asset value, beginning of period | | $ | 25.00 | | |
Income from investment operations: | |
Net investment income (loss)(a) | | | (0.04 | ) | |
Net realized and unrealized gain (loss) | | | 1.02 | | |
Total from investment operations | | | 0.98 | | |
Less distributions to common shareholders from: | |
Net investment income | | | — | | |
Total distributions | | | — | | |
Net asset value, end of period | | $ | 25.98 | | |
TOTAL RETURN APPLICABLE TO COMMON SHAREHOLDERS | |
Total investment return based on: | |
Net asset value(b) | | | 3.92 | % | |
RATIOS TO AVERAGE NET ASSETS APPLICABLE TO COMMON SHAREHOLDERS | |
Net expenses | | | 0.69 | %(c) | |
Net investment income (loss) | | | (0.65 | %)(c) | |
SUPPLEMENTAL DATA | |
Net assets applicable to common shareholders, end of period (000) | | $ | 107,803 | | |
Portfolio turnover rate | | | 0 | %(d) | |
• Commencement of operations.
(a) Net investment income (loss) allocated based on average shares method.
(b) Total return measures net investment income (loss) and capital gain or loss from portfolio investments assuming reinvestment of dividends and capital gains distributions. Total return is not annualized for periods that are less than a full year and does not reflect the deduction of taxes that a shareholder would pay on fund distributions or the redemption of fund shares.
(c) Annualized.
(d) Not annualized.
ETF FAMILY OF FUNDS ANNUAL REPORT
10
Calamos S&P 500® Structured Alt Protection ETFTM—July Financial Highlights
Selected data for a share outstanding throughout the period was as follows:
| | | JULY 1, 2024•
THROUGH
JULY 31, 2024 | |
PER SHARE OPERATING PERFORMANCE | |
Net asset value, beginning of period | | $ | 23.96 | | |
Income from investment operations: | |
Net investment income (loss)(a) | | | (0.01 | ) | |
Net realized and unrealized gain (loss) | | | 0.33 | | |
Total from investment operations | | | 0.32 | | |
Less distributions to common shareholders from: | |
Net investment income | | | — | | |
Total distributions | | | — | | |
Net asset value, end of period | | $ | 24.28 | | |
TOTAL RETURN APPLICABLE TO COMMON SHAREHOLDERS | |
Total investment return based on: | |
Net asset value(b) | | | 1.34 | % | |
RATIOS TO AVERAGE NET ASSETS APPLICABLE TO COMMON SHAREHOLDERS | |
Net expenses | | | 0.69 | %(c) | |
Net investment income (loss) | | | (0.68 | %)(c) | |
SUPPLEMENTAL DATA | |
Net assets applicable to common shareholders, end of period (000) | | $ | 30,348 | | |
Portfolio turnover rate | | | 0 | %(d) | |
• Commencement of operations.
(a) Net investment income (loss) allocated based on average shares method.
(b) Total return measures net investment income (loss) and capital gain or loss from portfolio investments assuming reinvestment of dividends and capital gains distributions. Total return is not annualized for periods that are less than a full year and does not reflect the deduction of taxes that a shareholder would pay on fund distributions or the redemption of fund shares.
(c) Annualized.
(d) Not annualized.
www.calamos.com
11
Calamos Nasdaq-100® Structured Alt Protection ETFTM—June Financial Highlights
Selected data for a share outstanding throughout the period was as follows:
| | | JUNE 3, 2024•
THROUGH
JULY 31, 2024 | |
PER SHARE OPERATING PERFORMANCE | |
Net asset value, beginning of period | | $ | 23.57 | | |
Income from investment operations: | |
Net investment income (loss)(a) | | | (0.03 | ) | |
Net realized and unrealized gain (loss) | | | 0.48 | | |
Total from investment operations | | | 0.45 | | |
Less distributions to common shareholders from: | |
Net investment income | | | — | | |
Total distributions | | | — | | |
Net asset value, end of period | | $ | 24.02 | | |
TOTAL RETURN APPLICABLE TO COMMON SHAREHOLDERS | |
Total investment return based on: | |
Net asset value(b) | | | 1.91 | % | |
RATIOS TO AVERAGE NET ASSETS APPLICABLE TO COMMON SHAREHOLDERS | |
Net expenses | | | 0.69 | %(c) | |
Net investment income (loss) | | | (0.65 | %)(c) | |
SUPPLEMENTAL DATA | |
Net assets applicable to common shareholders, end of period (000) | | $ | 64,850 | | |
Portfolio turnover rate | | | 0 | %(d) | |
• Commencement of operations.
(a) Net investment income (loss) allocated based on average shares method.
(b) Total return measures net investment income (loss) and capital gain or loss from portfolio investments assuming reinvestment of dividends and capital gains distributions. Total return is not annualized for periods that are less than a full year and does not reflect the deduction of taxes that a shareholder would pay on fund distributions or the redemption of fund shares.
(c) Annualized.
(d) Not annualized.
ETF FAMILY OF FUNDS ANNUAL REPORT
12
Calamos Russell 2000® Structured Alt Protection ETFTM—July Financial Highlights
Selected data for a share outstanding throughout the period was as follows:
| | JULY 1, 2024•
THROUGH
JULY 31, 2024 | |
PER SHARE OPERATING PERFORMANCE | |
Net asset value, beginning of period | | $ | 24.36 | | |
Income from investment operations: | |
Net investment income (loss)(a) | | | (0.01 | ) | |
Net realized and unrealized gain (loss) | | | 0.72 | | |
Total from investment operations | | | 0.71 | | |
Less distributions to common shareholders from: | |
Net investment income | | | — | | |
Total distributions | | | — | | |
Net asset value, end of period | | $ | 25.07 | | |
TOTAL RETURN APPLICABLE TO COMMON SHAREHOLDERS | |
Total investment return based on: | |
Net asset value(b) | | | 2.91 | % | |
RATIOS TO AVERAGE NET ASSETS APPLICABLE TO COMMON SHAREHOLDERS | |
Net expenses | | | 0.69 | %(c) | |
Net investment income (loss) | | | (0.68 | %)(c) | |
SUPPLEMENTAL DATA | |
Net assets applicable to common shareholders, end of period (000) | | $ | 55,777 | | |
Portfolio turnover rate | | | 0 | %(d) | |
• Commencement of operations.
(a) Net investment income (loss) allocated based on average shares method.
(b) Total return measures net investment income (loss) and capital gain or loss from portfolio investments assuming reinvestment of dividends and capital gains distributions. Total return is not annualized for periods that are less than a full year and does not reflect the deduction of taxes that a shareholder would pay on fund distributions or the redemption of fund shares.
(c) Annualized.
(d) Not annualized.
www.calamos.com
13
Convertible Equity Alternative ETF Schedule of Investments July 31, 2024
PRINCIPAL
AMOUNT | | | | VALUE | |
CONVERTIBLE BONDS (82.6%) | | | |
| | | Communication Services (0.6%) | |
| | 36,000 | | | Sphere Entertainment Company*
3.500%, 12/01/28 | | $ | 52,235 | | |
| | | | 52,235 | | |
| | | Consumer Discretionary (19.8%) | |
| | 115,000 | | | Booking Holdings, Inc.^
0.750%, 05/01/25 | | | 226,938 | | |
| | 48,000 | | | Burlington Stores, Inc.*
1.250%, 12/15/27 | | | 66,763 | | |
| | | | | Carnival Corp. | | | | | |
| | 57,000 | | | 5.750%, 10/01/24 | | | 95,454 | | |
| | 171,000 | | | 5.750%, 12/01/27 | | | 258,520 | | |
| | 62,000 | | | Cinemark Holdings, Inc.
4.500%, 08/15/25 | | | 106,002 | | |
| | 50,000 | | | Guess?, Inc.
3.750%, 04/15/28 | | | 60,838 | | |
| | 36,000 | | | Patrick Industries, Inc.
1.750%, 12/01/28 | | | 49,394 | | |
| | 171,000 | | | Royal Caribbean Cruises, Ltd.
6.000%, 08/15/25 | | | 542,718 | | |
| | 56,000 | | | Stride, Inc.
1.125%, 09/01/27 | | | 85,226 | | |
| | 93,000 | | | Wayfair, Inc.
3.500%, 11/15/28 | | | 132,036 | | |
| | | | 1,623,889 | | |
| | | Consumer Staples (1.9%) | |
| | 52,000 | | | Freshpet, Inc.
3.000%, 04/01/28 | | | 97,791 | | |
| | 53,000 | | | Post Holdings, Inc.
2.500%, 08/15/27 | | | 60,355 | | |
| | | | 158,146 | | |
| | | Energy (3.5%) | |
| | 46,000 | | | CNX Resources Corp.
2.250%, 05/01/26 | | | 96,189 | | |
| | 71,000 | | | Northern Oil & Gas, Inc.^
3.625%, 04/15/29 | | | 90,455 | | |
| | 30,000 | | | Peabody Energy Corp.
3.250%, 03/01/28 | | | 39,617 | | |
| | 48,000 | | | Sunrun, Inc.*
4.000%, 03/01/30 | | | 61,176 | | |
| | | | 287,437 | | |
| | | Financials (1.6%) | |
| | 36,000 | | | Bread Financial Holdings, Inc.
4.250%, 06/15/28 | | | 55,964 | | |
| | 60,000 | | | HAT Holdings I, LLC / HAT Holdings II, LLC*
3.750%, 08/15/28 | | | 80,135 | | |
| | | | 136,099 | | |
PRINCIPAL
AMOUNT | | | | VALUE | |
| | | Health Care (8.9%) | |
| | 85,000 | | | Insmed, Inc.
0.750%, 06/01/28 | | $ | 193,724 | | |
| | 67,000 | | | Integer Holdings Corp.
2.125%, 02/15/28 | | | 98,018 | | |
| | 60,000 | | | Lantheus Holdings, Inc.
2.625%, 12/15/27 | | | 89,928 | | |
| | 33,000 | | | Mirum Pharmaceuticals, Inc.
4.000%, 05/01/29 | | | 49,901 | | |
| | 46,000 | | | Natera, Inc.
2.250%, 05/01/27 | | | 123,096 | | |
| | 47,000 | | | Tandem Diabetes Care, Inc.*
1.500%, 03/15/29 | | | 61,591 | | |
| | 66,000 | | | TransMedics Group, Inc.
1.500%, 06/01/28 | | | 111,631 | | |
| | | | 727,889 | | |
| | | Industrials (6.4%) | |
| | 92,000 | | | Axon Enterprise, Inc.
0.500%, 12/15/27 | | | 129,286 | | |
| | 36,000 | | | Chart Industries, Inc.
1.000%, 11/15/24 | | | 99,160 | | |
| | 62,000 | | | Fluor Corp.*
1.125%, 08/15/29 | | | 76,079 | | |
| | 44,000 | | | Granite Construction, Inc.^
3.750%, 05/15/28 | | | 69,298 | | |
| | 39,000 | | | Rocket Lab USA, Inc.*
4.250%, 02/01/29 | | | 49,031 | | |
| | 84,000 | | | Tetra Tech, Inc.*
2.250%, 08/15/28 | | | 101,815 | | |
| | | | 524,669 | | |
| | | Information Technology (32.4%) | |
| | 77,000 | | | CyberArk Software, Ltd.
0.000%, 11/15/24 | | | 125,638 | | |
| | 100,000 | | | Datadog, Inc.
0.125%, 06/15/25 | | | 132,861 | | |
| | 66,000 | | | Guidewire Software, Inc.
1.250%, 03/15/25 | | | 88,559 | | |
| | 61,000 | | | HubSpot, Inc.
0.375%, 06/01/25 | | | 108,162 | | |
| | 30,000 | | | Impinj, Inc.
1.125%, 05/15/27 | | | 47,032 | | |
| | 45,000 | | | Insight Enterprises, Inc.^
0.750%, 02/15/25 | | | 147,152 | | |
| | 61,000 | | | Interdigital, Inc.
3.500%, 06/01/27 | | | 99,506 | | |
| | 60,000 | | | MACOM Technology Solutions Holdings, Inc.
0.250%, 03/15/26 | | | 78,592 | | |
| | 104,000 | | | MicroStrategy, Inc.*
0.625%, 03/15/30 | | | 131,373 | | |
| | 107,000 | | | ON Semiconductor Corp.
0.000%, 05/01/27 | | | 166,209 | | |
See accompanying Notes to Schedule of Investments
ETF FAMILY OF FUNDS ANNUAL REPORT
14
Convertible Equity Alternative ETF Schedule of Investments July 31, 2024
PRINCIPAL
AMOUNT | | | | VALUE | |
| | 162,000 | | | Palo Alto Networks, Inc.
0.375%, 06/01/25 | | $ | 528,982 | | |
| | 202,000 | | | Seagate HDD Cayman*^
3.500%, 06/01/28 | | | 275,629 | | |
| | 10,000 | | | Semtech Corp.*
4.000%, 11/01/28 | | | 17,230 | | |
| | 60,000 | | | Tyler Technologies, Inc.
0.250%, 03/15/26 | | | 72,700 | | |
| | 36,000 | | | Varonis Systems, Inc.
1.250%, 08/15/25 | | | 65,430 | | |
| | 37,000 | | | Vertex, Inc.*
0.750%, 05/01/29 | | | 47,559 | | |
| | 213,000 | | | Western Digital Corp.*
3.000%, 11/15/28 | | | 310,754 | | |
| | 169,000 | | | Zscaler, Inc.
0.125%, 07/01/25 | | | 215,372 | | |
| | | | 2,658,740 | | |
| | | Materials (3.2%) | |
| | 42,000 | | | ATI, Inc.
3.500%, 06/15/25 | | | 183,877 | | |
| | 27,000 | | | United States Steel Corp.
5.000%, 11/01/26 | | | 83,478 | | |
| | | | 267,355 | | |
| | | Real Estate (2.1%) | |
| | 138,000 | | | Welltower OP, LLC*
2.750%, 05/15/28 | | | 169,568 | | |
| | | | 169,568 | | |
| | | Utilities (2.2%) | |
| | 149,000 | | | NextEra Energy Capital Holdings, Inc.*
3.000%, 03/01/27 | | | 179,749 | | |
| | | TOTAL CONVERTIBLE BONDS
(Cost $6,051,086) | | | 6,785,776 | | |
NUMBER OF
SHARES | | | | VALUE | |
CONVERTIBLE PREFERRED STOCKS (16.6%) | | | |
| | | Financials (3.5%) | |
| | 4,229 | | | Apollo Global Management, Inc.^
6.750%, 07/31/26 | | | 287,572 | | |
| | | Health Care (0.7%) | |
| | 1,193 | | | Brightspring Health Services, Inc.
6.750%, 02/01/27 | | | 57,467 | | |
| | | Industrials (2.1%) | |
| | 1,272 | | | Chart Industries, Inc.^
6.750%, 12/15/25 | | | 79,144 | | |
| | 700 | | | RBC Bearings, Inc.
5.000%, 10/15/24 | | | 90,314 | | |
| | | | 169,458 | | |
NUMBER OF
SHARES | | | | VALUE | |
| | | Materials (3.1%) | |
| | 5,658 | | | Albemarle Corp.
7.250%, 03/01/27 | | $ | 253,026 | | |
| | | Utilities (7.2%) | |
| | 1,946 | | | CenterPoint Energy, Inc. (Warner Media,
LLC, Charter Communications
Time, Inc.)#§**
3.369%, 09/15/29 | | | 77,519 | | |
| | 4,795 | | | NextEra Energy, Inc.
7.299%, 06/01/27# | | | 249,579 | | |
| | 6,025 | | | 6.926%, 09/01/25^ | | | 266,064 | | |
| | | | 593,162 | | |
| | | TOTAL CONVERTIBLE
PREFERRED STOCKS
(Cost $1,312,153) | | | 1,360,685 | | |
NUMBER OF
SHARES/
PRINCIPAL
AMOUNT | | | | VALUE | |
INVESTMENT OF CASH COLLATERAL FOR SECURITIES
LOANED (17.4%) | | | |
| | 1,430,793 | | | State Street Navigator Securities
Lending Government Money Market
Portfolio, 5.317%†***
(Cost $1,430,793) | | | 1,430,793 | | |
| | | TOTAL INVESTMENTS (116.6%)
(Cost $8,794,032) | | | 9,577,254 | | |
PAYABLE UPON RETURN OF SECURITIES ON LOAN (-17.4%) | | | (1,430,793 | ) | |
OTHER ASSETS, LESS LIABILITIES (0.8%) | | | 67,684 | | |
NET ASSETS (100.0%) | | $ | 8,214,145 | | |
NOTES TO SCHEDULE OF INVESTMENTS
* Securities issued and sold pursuant to a Rule 144A transaction are exempted from the registration requirement of the Securities Act of 1933, as amended. These securities may only be sold to qualified institutional buyers ("QIBs"), such as the Fund. Any resale of these securities must generally be effected through a sale that is registered under the Act or otherwise exempted from such registration requirements.
^ Security, or portion of security, is on loan.
# Non-income producing security.
§ Securities exchangeable or convertible into securities of one or more entities that are different than the issuer. Each entity is identified in the parenthetical.
** Step coupon security. Coupon changes periodically based upon a predetermined schedule. The rate shown is the rate in effect at July 31, 2024.
† Represents investment of cash collateral received from securities on loan as of July 31, 2024.
*** The rate disclosed is the 7 day net yield as of July 31, 2024.
See accompanying Notes to Schedule of Investments
www.calamos.com
15
CEF Income & Arbitrage ETF Schedule of Investments July 31, 2024
NUMBER OF
SHARES | | | | VALUE | |
CLOSED-END FUNDS (98.2%) | | | |
| | | Allocation (21.1%) | |
| | 38,627 | | | Bexil Investment Trust | | $ | 519,533 | | |
| | 30,501 | | | Brookfield Real Assets Income Fund, Inc. | | | 394,988 | | |
| | 10,659 | | | Eaton Vance Tax-Advantaged Dividend
Income Fund | | | 259,014 | | |
| | 43,206 | | | John Hancock Premium Dividend Fund | | | 534,458 | | |
| | 18,544 | | | John Hancock Tax-Advantaged Dividend
Income Fund | | | 395,173 | | |
| | 31,953 | | | RiverNorth Opportunities Fund, Inc. | | | 392,383 | | |
| | 16,370 | | | Thornburg Income Builder
Opportunities Trust | | | 269,450 | | |
| | | | 2,764,999 | | |
| | | International Equity (9.6%) | |
| | 44,498 | | | abrdn Total Dynamic Dividend Fund | | | 381,793 | | |
| | 14,326 | | | India Fund, Inc. | | | 264,745 | | |
| | 12,265 | | | Morgan Stanley India Investment Fund, Inc. | | | 338,023 | | |
| | 21,558 | | | Templeton Emerging Markets Fund | | | 271,631 | | |
| | | | 1,256,192 | | |
| | | Municipal Bond (3.5%) | |
| | 41,230 | | | Nuveen Municipal Credit Opportunities
Fund | | | 459,714 | | |
| | | Nontraditional Equity (14.7%) | |
| | 1,980 | | | BlackRock Enhanced Capital and Income
Fund, Inc. | | | 38,471 | | |
| | 54,946 | | | BlackRock Enhanced Equity Dividend Trust | | | 468,140 | | |
| | 13,433 | | | Eaton Vance Enhanced Equity Income
Fund II | | | 287,063 | | |
| | 51,078 | | | Eaton Vance Tax Managed Global Buy
Write Opportunities Fund | | | 425,480 | | |
| | 53,276 | | | Eaton Vance Tax-Managed Global
Diversified Equity Income Fund | | | 450,715 | | |
| | 18,035 | | | Nuveen Dow 30sm Dynamic
Overwrite Fund | | | 262,229 | | |
| | | | 1,932,098 | | |
| | | Sector Equity (23.9%) | |
| | 18,855 | | | abrdn Global Infrastructure Income Fund | | | 359,188 | | |
| | 23,046 | | | abrdn Healthcare Opportunities Fund | | | 495,258 | | |
| | 3,942 | | | BlackRock Health Sciences Trust | | | 162,095 | | |
| | 27,531 | | | BlackRock Resources & Commodities
Strategy Trust | | | 260,168 | | |
| | 24,656 | | | CBRE Global Real Estate Income Fund | | | 142,019 | | |
| | 8,745 | | | ClearBridge MLP & Midstream Fund, Inc. | | | 388,016 | | |
| | 21,887 | | | Cohen & Steers Quality Income Realty
Fund, Inc. | | | 275,557 | | |
| | 4,391 | | | John Hancock Financial Opportunities Fund | | | 143,761 | | |
| | 35,660 | | | Kayne Anderson Energy Infrastructure Fund | | | 374,430 | | |
NUMBER OF
SHARES | | | | VALUE | |
| | 27,637 | | | Neuberger Berman Energy
Infrastructure & Income Fund, Inc. | | $ | 221,925 | | |
| | 7,202 | | | Tortoise Midstream Energy Fund, Inc. | | | 313,647 | | |
| | | | 3,136,064 | | |
| | | Taxable Bond (17.6%) | |
| | 48,372 | | | Aberdeen Asia-Pacific Income Fund, Inc. | | | 135,442 | | |
| | 42,691 | | | Allspring Multi-Sector Income Fund | | | 390,623 | | |
| | 19,734 | | | BlackRock Taxable Municipal Bond Trust | | | 336,267 | | |
| | 19,816 | | | Eaton Vance, Ltd. Duration Income Fund | | | 195,782 | | |
| | 39,274 | | | Highland Opportunities and Income Fund | | | 244,677 | | |
| | 44,718 | | | Nuveen Credit Strategies Income Fund | | | 256,234 | | |
| | 26,260 | | | Nuveen Preferred & Income
Opportunities Fund | | | 201,677 | | |
| | 16,669 | | | Nuveen Taxable Municipal Income Fund | | | 271,038 | | |
| | 29,708 | | | TCW Strategic Income Fund, Inc. | | | 146,460 | | |
| | 11,041 | | | Western Asset High Yield Defined
Opportunity Fund, Inc. | | | 130,505 | | |
| | | | 2,308,705 | | |
| | | U.S. Equity (7.8%) | |
| | 19,284 | | | Liberty All-Star Equity Fund | | | 131,324 | | |
| | 66,443 | | | Liberty All-Star Growth Fund, Inc. | | | 359,457 | | |
| | 13,360 | | | Royce Micro-Cap Trust, Inc. | | | 132,665 | | |
| | 25,227 | | | Royce Small-Cap Trust, Inc. | | | 403,884 | | |
| | | | 1,027,330 | | |
| | | TOTAL CLOSED-END FUNDS
(Cost $12,174,659) | | | 12,885,102 | | |
| | | TOTAL INVESTMENTS (98.2%)
(Cost $12,174,659) | | | 12,885,102 | | |
OTHER ASSETS, LESS LIABILITIES (1.8%) | | | 242,399 | | |
NET ASSETS (100.0%) | | $ | 13,127,501 | | |
See accompanying Notes to Schedule of Investments
ETF FAMILY OF FUNDS ANNUAL REPORT
16
Alternative Nasdaq® & Bond ETF Schedule of Investments July 31, 2024
NUMBER OF
SHARES | | | | VALUE | |
EXCHANGE-TRADED FUNDS (86.9%) | | | |
| | | Taxable Bond (86.9%) | |
| | 10,546 | | | Franklin Senior Loan ETF | | $ | 257,533 | | |
| | 867 | | | iShares Broad USD Investment Grade
Corporate Bond ETF | | | 44,417 | | |
| | 1,700 | | | Janus Henderson AAA CLO ETF | | | 86,564 | | |
| | 1,168 | | | Schwab 1-5 Year Corporate Bond ETF | | | 57,150 | | |
| | 5,148 | | | Simplify MBS ETF | | | 262,703 | | |
| | 9,644 | | | SPDR Portfolio High Yield Bond ETF | | | 227,502 | | |
| | 2,507 | | | Vanguard Emerging Markets
Government Bond ETF | | | 160,849 | | |
| | 489 | | | Vanguard Long-Term Corporate
Bond ETF | | | 38,132 | | |
| | | | 1,134,850 | | |
| | | TOTAL EXCHANGE-TRADED FUNDS
(Cost $1,122,566) | | | 1,134,850 | | |
NUMBER OF
CONTRACTS/
NOTIONAL
AMOUNT | | | | VALUE | |
PURCHASED OPTIONS (12.5%)#? | | | |
| | | Communication Services (1.7%) | |
| | 4 | | | Alphabet, Inc. | | | | | |
| | 68,616 | | | Call, 01/17/25, Strike $161.00 | | | 8,469 | | |
| | 1 | | | Meta Platforms, Inc. | | | | | |
| | 47,483 | | | Call, 03/21/25, Strike $540.00 | | | 3,939 | | |
| | 1 | | | Netflix, Inc. | | | | | |
| | 62,835 | | | Call, 09/27/24, Strike $587.00 | | | 5,821 | | |
| | 2 | | | T-Mobile U.S., Inc. | | | | | |
| | 36,456 | | | Call, 09/27/24, Strike $161.00 | | | 4,584 | | |
| | | | 22,813 | | |
| | | Consumer Discretionary (0.8%) | |
| | 3 | | | Amazon.com, Inc. | | | | | |
| | 56,094 | | | Call, 03/21/25, Strike $199.00 | | | 5,153 | | |
| | 2 | | | Tesla, Inc. | | | | | |
| | 46,414 | | | Call, 01/17/25, Strike $249.00 | | | 5,725 | | |
| | | | 10,878 | | |
| | | Consumer Staples (1.0%) | |
| | 1 | | | Costco Wholesale Corp. | | | | | |
| | 82,200 | | | Call, 06/20/25, Strike $766.00 | | | 12,154 | | |
| | 1 | | | PepsiCo, Inc. | | | | | |
| | 17,267 | | | Call, 06/20/25, Strike $174.00 | | | 1,185 | | |
| | | | 13,339 | | |
NUMBER OF
CONTRACTS/
NOTIONAL
AMOUNT | | | | VALUE | |
| | | Information Technology (7.7%) | | | |
| | 1 | | | Adobe, Inc. | | | | | |
| | 55,165 | | | Call, 03/21/25, Strike $711.00 | | $ | 1,556 | | |
| | 2 | | | Advanced Micro Devices, Inc. | | | | | |
| | 28,896 | | | Call, 09/27/24, Strike $195.00 | | | 265 | | |
| | 7 | | | Apple, Inc. | | | | | |
| | 155,456 | | | Call, 09/27/24, Strike $189.00 | | | 25,183 | | |
| | 10 | | | Broadcom, Inc. | | | | | |
| | 160,680 | | | Call, 06/20/25, Strike $153.00 | | | 29,718 | | |
| | 4 | | | Cisco Systems, Inc. | | | | | |
| | 19,380 | | | Call, 01/17/25, Strike $50.00 | | | 980 | | |
| | 4 | | | Intel Corp. | | | | | |
| | 12,296 | | | Call, 03/21/25, Strike $51.00 | | | 190 | | |
| | 3 | | | Microsoft Corp. | | | | | |
| | 125,505 | | | Call, 06/20/25, Strike $460.00 | | | 8,289 | | |
| | 10 | | | NVIDIA Corp. | | | | | |
| | 117,020 | | | Call, 01/17/25, Strike $90.50 | | | 33,913 | | |
| | | | 100,094 | | |
| | | Other (1.3%) | | | |
| | | | | Direxion Nasdaq-100® Equal Weighted
Index Shares | | | | | |
| | 9 | | | | | | | | |
| | 79,740 | | | Call, 01/17/25, Strike $88.00 | | | 3,923 | | |
| | 9 | | | | | | | | |
| | 79,740 | | | Call, 03/21/25, Strike $88.00 | | | 4,733 | | |
| | 9 | | | | | | | | |
| | 79,740 | | | Call, 09/27/24, Strike $88.00 | | | 2,209 | | |
| | 9 | | | | | | | | |
| | 79,740 | | | Call, 06/20/25, Strike $88.00 | | | 5,656 | | |
| | | | 16,521 | | |
| | | TOTAL PURCHASED OPTIONS
(Cost $117,623) | | | 163,645 | | |
| | | TOTAL INVESTMENTS (99.4%)
(Cost $1,240,189) | | | 1,298,495 | | |
OTHER ASSETS, LESS LIABILITIES (0.6%) | | | 8,363 | | |
NET ASSETS (100.0%) | | $ | 1,306,858 | | |
NOTES TO SCHEDULE OF INVESTMENTS
# Non-income producing security.
? FLexible EXchange® Options (see Note 1).
See accompanying Notes to Schedule of Investments
www.calamos.com
17
S&P 500® Structured Alt Protection ETFTM—May Schedule of Investments July 31, 2024
NUMBER OF
CONTRACTS/
NOTIONAL
AMOUNT | | | | VALUE | |
PURCHASED OPTIONS (107.2%)#? | | | |
| | | Long Call Option (105.2%) | |
| | 2,063 | | | SPDR® S&P 500® ETF Trust | | | | | |
| | 113,632,103 | | | Expires 04/30/25, Strike $0.65 | | $ | 113,402,072 | | |
| | | Long Put Option (2.0%) | |
| | 2,063 | | | SPDR® S&P 500® ETF Trust | | | | | |
| | 113,632,103 | | | Expires 04/30/25, Strike $502.13 | | | 2,137,214 | | |
| | | TOTAL PURCHASED OPTIONS
(Cost $109,468,017) | | | 115,539,286 | | |
| | | TOTAL INVESTMENTS (107.2%)
(Cost $109,468,017) | | | 115,539,286 | | |
LIABILITIES, LESS OTHER ASSETS (-7.2%) | | | (7,735,973 | ) | |
NET ASSETS (100.0%) | | $ | 107,803,313 | | |
WRITTEN OPTION (-7.4%)#? | | | |
| | | Short Call Option (-7.4%) | |
| | (2,063 | ) | | SPDR® S&P 500® ETF Trust | | | | | |
| | (113,632,103 | ) | | Expires 04/30/25, Strike $552.18
(Premium $4,384,344) | | $ | (7,994,340 | ) | |
NOTES TO SCHEDULE OF INVESTMENTS
# Non-income producing security.
? FLexible EXchange® Options (see Note 1).
See accompanying Notes to Schedule of Investments
ETF FAMILY OF FUNDS ANNUAL REPORT
18
S&P 500® Structured Alt Protection ETFTM—July Schedule of Investments July 31, 2024
NUMBER OF
CONTRACTS/
NOTIONAL
AMOUNT | | | | VALUE | |
PURCHASED OPTIONS (103.1%)#? | | | |
| | | Long Call Option (99.3%) | |
| | 550 | | | SPDR® S&P 500® ETF Trust | | | | | |
| | 30,294,550 | | | Expires 06/30/25, Strike $0.76 | | $ | 30,149,805 | | |
| | | Long Put Option (3.8%) | |
| | 550 | | | SPDR® S&P 500® ETF Trust | | | | | |
| | 30,294,550 | | | Expires 06/30/25, Strike $544.27 | | | 1,153,377 | | |
| | | TOTAL PURCHASED OPTIONS
(Cost $31,052,472) | | | 31,303,182 | | |
| | | TOTAL INVESTMENTS (103.1%)
(Cost $31,052,472) | | | 31,303,182 | | |
LIABILITIES, LESS OTHER ASSETS (-3.1%) | | | (954,801 | ) | |
NET ASSETS (100.0%) | | $ | 30,348,381 | | |
WRITTEN OPTION (-3.4%)#? | | | |
| | | Short Call Option (-3.4%) | |
| | (550 | ) | | SPDR® S&P 500® ETF Trust | | | | | |
| | (30,294,550 | ) | | Expires 06/30/25, Strike $595.70
(Premium $1,041,964) | | $ | (1,024,617 | ) | |
NOTES TO SCHEDULE OF INVESTMENTS
# Non-income producing security.
? FLexible EXchange® Options (see Note 1).
See accompanying Notes to Schedule of Investments
www.calamos.com
19
Nasdaq-100® Structured Alt Protection ETFTM—June Schedule of Investments July 31, 2024
NUMBER OF
CONTRACTS/
NOTIONAL
AMOUNT | | | | VALUE | |
PURCHASED OPTIONS (105.8%)#? | | | |
| | | Long Call Option (101.5%) | |
| | 1,404 | | | Invesco QQQ Trust Series 1 | | | | | |
| | 66,138,228 | | | Expires 05/30/25, Strike $0.68 | | $ | 65,834,964 | | |
| | | Long Put Option (4.3%) | |
| | 1,404 | | | Invesco QQQ Trust Series 1 | | | | | |
| | 66,138,228 | | | Expires 05/30/25, Strike $450.76 | | | 2,781,324 | | |
| | | TOTAL PURCHASED OPTIONS
(Cost $67,877,901) | | | 68,616,288 | | |
| | | TOTAL INVESTMENTS (105.8%)
(Cost $67,877,901) | | | 68,616,288 | | |
LIABILITIES, LESS OTHER ASSETS (-5.8%) | | | (3,766,167 | ) | |
NET ASSETS (100.0%) | | $ | 64,850,121 | | |
WRITTEN OPTION (-6.5%)#? | | | |
| | | Short Call Option (-6.5%) | |
| | (1,404 | ) | | Invesco QQQ Trust Series 1 | | | | | |
| | (66,138,228 | ) | | Expires 05/30/25, Strike $497.00
(Premium $4,098,601) | | $ | (4,212,000 | ) | |
NOTES TO SCHEDULE OF INVESTMENTS
# Non-income producing security.
? FLexible EXchange® Options (see Note 1).
See accompanying Notes to Schedule of Investments
ETF FAMILY OF FUNDS ANNUAL REPORT
20
Russell 2000® Structured Alt Protection ETFTM—July Schedule of Investments July 31, 2024
NUMBER OF
CONTRACTS/
NOTIONAL
AMOUNT | | | | VALUE | |
PURCHASED OPTIONS (110.0%)#? | | | |
| | | Long Call Option (106.4%) | |
| | 2,670 | | | iShares Russell 2000 ETF | | | | | |
| | 59,770,620 | | | Expires 06/30/25, Strike $0.28 | | $ | 59,319,156 | | |
| | | Long Put Option (3.6%) | |
| | 2,670 | | | iShares Russell 2000 ETF | | | | | |
| | 59,770,620 | | | Expires 06/30/25, Strike $202.91 | | | 2,013,706 | | |
| | | TOTAL PURCHASED OPTIONS
(Cost $56,598,210) | | | 61,332,862 | | |
| | | TOTAL INVESTMENTS (110.0%)
(Cost $56,598,210) | | | 61,332,862 | | |
LIABILITIES, LESS OTHER ASSETS (-10.0%) | | | (5,555,743 | ) | |
NET ASSETS (100.0%) | | $ | 55,777,119 | | |
WRITTEN OPTION (-10.2%)#? | | | |
| | | Short Call Option (-10.2%) | |
| | (2,670 | ) | | iShares Russell 2000 ETF | | | | | |
| | (59,770,620 | ) | | Expires 06/30/25, Strike $225.65
(Premium $2,406,210) | | $ | (5,665,651 | ) | |
NOTES TO SCHEDULE OF INVESTMENTS
# Non-income producing security.
? FLexible EXchange® Options (see Note 1).
See accompanying Notes to Schedule of Investments
www.calamos.com
21
Notes to Financial Statements
Note 1 – Organization and Significant Accounting Policies
Organization. Calamos ETF Trust (the "Trust"), a Delaware statutory trust organized on June 17, 2013, consisted of eight series as of the date of this report, including Convertible Equity Alternative ETF (commenced operations on October 4, 2023), CEF Income & Arbitrage ETF (commenced operations on January 16, 2024), Alternative Nasdaq® & Bond ETF (commenced operations on February 13, 2024), S&P 500® Structured Alt Protection ETFTM—May (commenced operations on May 1, 2024), S&P 500® Structured Alt Protection ETFTM—July (commenced operation on July 1, 2024), Nasdaq-100® Structured Alt Protection ETFTM—June (commenced operations on June 3, 2024), and Russell 2000® Structured Alt Protection ETFTM—July (commenced operations on July 1, 2024), (each a "Fund" and collectively the "Funds"). The Trust is registered under the Investment Company Act of 1940, as amended (the "1940 Act'), as an open-end management investment company. Prior to commencement of operations, each Fund had issued one share of beneficial interest at a purchase price of $25 to Calamos Investments, LLC, the parent of Calamos Advisors, LLC.
Each Fund is a non-diversified, actively managed exchange-traded fund ("ETF"). Convertible Equity Alternative ETF's investment objective is total return through capital appreciation and current income. CEF Income & Arbitrage ETF's investment objective is high current income and long-term capital appreciation. Alternative Nasdaq® & Bond ETF's investment objective is attractive risk-adjusted total return through capital appreciation and current income. S&P 500® Structured Alt Protection ETFTM—May seeks to provide investment results that, before taking fees and expenses into account, match the positive price return of the SPDR® S&P 500® ETF Trust up to a cap of 9.81%, while protecting against 100% of negative price return of the underlying ETF (before fees and expenses), for the period from May 1, 2024 through April 30, 2025. S&P 500® Structured Alt Protection ETFTM—July seeks to provide investment results that, before taking fees and expenses into account, match the positive price return of the SPDR® S&P 500® ETF Trust up to a cap of 9.45%, while protecting against 100% of negative price return of the underlying ETF (before fees and expenses), for the period from July 1, 2024 through June 30, 2025. Nasdaq-100® Structured Alt Protection ETFTM—June seeks to provide investment results that, before taking fees and expenses into account, match the positive price return of the Invesco QQQ TrustSM, Series 1 up to a cap of 10.20%, while protecting against 100% of negative price return of the underlying ETF (before fees and expenses), for the period from June 3, 2024 through May 31, 2025. Russell 2000® Structured Alt Protection ETFTM—July seeks to provide investment results that, before taking fees and expenses into account, match the positive price return of the iShares® Russell 2000® ETF up to a cap of 11.20%, while protecting against 100% of negative price return of the underlying ETF (before fees and expenses), for the period from July 1, 2024 through June 30, 2025.
Calamos Advisors LLC ("Calamos Advisors" or the "Adviser"), serves as the Funds' adviser.
Significant Accounting Policies. The financial statements have been prepared in conformity with accounting principles generally accepted in the United States of America (U.S. GAAP), and the Funds are each considered an investment company under U.S. GAAP and follow the accounting and reporting guidance applicable to investment companies. Under U.S. GAAP, management is required to make certain estimates and assumptions at the date of the financial statements and actual results may differ from those estimates. Subsequent events, if any, through the date that the financial statements were issued, have been evaluated in the preparation of the financial statements. The following summarizes the significant accounting policies of the Funds:
Fund Valuation. The Funds' Board of Trustees ("Board" or "Trustees"), including a majority of the Trustees who are not "interested persons" of the Trust, have designated the Adviser to perform fair valuation determinations related to all Fund investments under the oversight of the Board. As "valuation designee" the Adviser has adopted procedures to guide the determination of the net asset value ("NAV") on any day on which the Funds' NAVs are determined. The valuation of the Funds' investments is in accordance with these procedures.
Fund securities that are traded on U.S. securities exchanges, except option securities, are valued at the official closing price, which is the last current reported sales price on its principal exchange at the time each Fund determines its NAV. Securities traded in the over-the-counter market and quoted on The NASDAQ Stock Market are valued at the NASDAQ Official Closing Price, as determined by NASDAQ, or lacking a NASDAQ Official Closing Price, the last current reported sale price on NASDAQ at the time a Fund determines its NAV. When a last sale or closing price is not available, equity securities, other than option securities, that are traded on a U.S. securities exchange and other equity securities traded in the over-the-counter market are valued at the mean between the most recent bid and asked quotations on its principal exchange in accordance with guidelines adopted by the Board. Each option security traded on a U.S. securities exchange is valued at the mid-point of the consolidated bid/ask quote for the option security, also in accordance with guidelines adopted by the Board. Each over-the-counter option that is not traded through the Options Clearing Corporation is valued either by an independent pricing agent approved by the Board or based on a quotation provided by the counterparty to such option under the ultimate supervision of the Board.
ETF FAMILY OF FUNDS ANNUAL REPORT
22
Notes to Financial Statements
Trading on European and Far Eastern exchanges and over-the-counter markets is typically completed at various times before the close of business on each day on which the New York Stock Exchange ("NYSE") is open. Securities that are principally traded in foreign markets are valued as of the last reported sale price at the time the respective Fund determines its NAV, or when reliable market prices or quotations are not readily available, at the mean between the most recent bid and asked quotations as of the close of the appropriate exchange or other designated time. Trading of foreign securities may not take place on every NYSE business day. In addition, trading may take place in various foreign markets on Saturdays or on other days when the NYSE is not open and on which the respective Fund's NAV is not calculated.
FLexible EXchange® Options ("FLEX Options") listed on an exchange will typically be valued at a model-based price at the official close of that exchange's trading day. However, when a Fund's option has a same-day market trade price, this same-day market trade price will be used for FLEX Option values instead of the exchange's model-based price. If the pricing vendor is not available to provide a model price for that day, the value of a FLEX Option will be determined by the Valuation Designee (as defined in Rule 2a-5) in accordance with the Pricing and Valuation Policy and Fair Value Procedures.
If the valuation designee determines that the valuation of a security in accordance with the methods described above is not reflective of a fair value for such security, the security is valued at a fair value by the valuation designee.
Each Fund also may use fair value pricing, pursuant to guidelines adopted by the Adviser, if trading in the security is halted or if the value of a security it holds is materially affected by events occurring before the Funds' pricing time but after the close of the primary market or exchange on which the security is listed. Those procedures may utilize valuations furnished by pricing services approved by the Adviser, which may be based on market transactions for comparable securities and various relationships between securities that are generally recognized by institutional traders, a computerized matrix system, or appraisals derived from information concerning the securities or similar securities received from recognized dealers in those securities.
When fair value pricing of securities is employed, the prices of securities used by a Fund to calculate its NAV may differ from market quotations or official closing prices. There can be no assurance that a Fund could purchase or sell a portfolio security at the price used to calculate a Fund's NAV.
Investment Transactions. Investment transactions are recorded on a trade date basis as of July 31, 2024. Net realized gains and losses from investment transactions are reported on an identified cost basis. Interest income is recognized using the accrual method and includes accretion of original issue and market discount and amortization of premium. Dividend income is recognized on the ex-dividend date, except that certain dividends from foreign securities are recorded as soon as the information becomes available after the ex-dividend date.
Foreign Currency Translation. Values of investments and other assets and liabilities denominated in foreign currencies are translated into U.S. dollars using a rate quoted by a major bank or dealer in the particular currency market, as reported by a recognized quotation dissemination service.
The Funds do not isolate that portion of the results of operations resulting from changes in foreign exchange rates on investments from the fluctuations arising from changes in market prices of securities held. Such fluctuations are included with the net realized and unrealized gain or loss from investments.
Reported net realized foreign currency gains or losses arise from disposition of foreign currency, the difference in the foreign exchange rates between the trade and settlement dates on securities transactions, and the difference between the amounts of dividends, interest and foreign withholding taxes recorded on the ex-date or accrual date and the U.S. dollar equivalent of the amounts actually received or paid. Net unrealized foreign exchange gains and losses arise from changes (due to the changes in the exchange rate) in the value of foreign currency and other assets and liabilities denominated in foreign currencies held at period end.
Allocation of Expenses Among Funds. Expenses directly attributable to a Fund are charged to that Fund; certain other common expenses of Calamos Advisors Trust, Calamos Investment Trust, Calamos Convertible Opportunities and Income Fund, Calamos Convertible and High Income Fund, Calamos Strategic Total Return Fund, Calamos Global Total Return Fund, Calamos Global Dynamic Income Fund, Calamos Dynamic Convertible and Income Fund, Calamos Long/Short Equity & Dynamic Income Trust, Calamos Antetokounmpo Sustainable Equities Trust, and Calamos ETF Trust are allocated proportionately among each Fund to which the expenses relate in relation to the net assets of each Fund or on another reasonable basis.
www.calamos.com
23
Notes to Financial Statements
Income Taxes. No provision has been made for U.S. income taxes because each Fund's policy is to continue to qualify as a regulated investment company under the Internal Revenue Code of 1986, as amended, and distribute to its shareholders substantially all of the Fund's taxable income and net realized gains.
Dividends and distributions paid to shareholders are recorded on the ex-dividend date. The amount of dividends and distributions from net investment income and net realized capital gains is determined in accordance with federal income tax regulations, which may differ from U.S. generally accepted accounting principles. To the extent these "book/tax" differences are permanent in nature, such amounts are reclassified within the capital accounts based on their federal tax-basis treatment. These differences are primarily due to differing treatments for foreign currency transactions and investments in passive foreign investment companies. The financial statements are not adjusted for temporary differences.
The Funds recognized no liability for uncertain tax positions. A reconciliation is not provided as the beginning and ending amounts of unrecognized benefits are zero, with no interim additions, reductions or settlements. Tax year 2024 remains subject to examination by the U.S. and the State of Illinois tax jurisdictions.
Indemnifications. Under the Trust's organizational documents, the Trust is obligated to indemnify its officers and trustees against certain liabilities incurred by them by reason of having been an officer or trustee of the Trust. In addition, in the normal course of business, the Trust may enter into contracts that provide general indemnifications to other parties. Each Fund's maximum exposure under these arrangements is unknown as this would involve future claims that may be made against the Funds that have not yet occurred. Currently, the Funds' management expects the risk of material loss in connection to a potential claim to be remote.
Note 2 – Investment Adviser and Transactions With Affiliates Or Certain Other Parties
Advisory Fee. Pursuant to an investment advisory agreement with Calamos Advisors, each Fund pays a monthly unitary advisory fee based on the average daily net assets of the Fund at the annual rate of 0.69%, 0.74%, 0.77%, 0.69%, 0.69%, 0.69% and 0.69% for Convertible Equity Alternative ETF, CEF Income & Arbitrage ETF, Alternative Nasdaq® & Bond ETF, S&P 500® Structured Alt Protection ETFTM—May, S&P 500® Structured Alt Protection ETFTM—July, Nasdaq-100® Structured Alt Protection ETFTM—June and Russell 2000® Structured Alt Protection ETFTM—July, respectively.
Distributor. The distributor of each Fund is currently Calamos Financial Services LLC ("CFS" or the "Distributor"), which has served as such for CEF Income & Arbitrage ETF, Alternative Nasdaq® & Bond ETF, S&P 500® Structured Alt Protection ETFTM—May, S&P 500® Structured Alt Protection ETFTM—July, Nasdaq-100® Structured Alt Protection ETFTM—June and Russell 2000® Structured Alt Protection ETFTM—July, since their inception and for Convertible Equity Alternative ETF since February 12, 2024. Prior to that time, Foreside Fund Services, LLC, an affiliate of Foreside Financial Group, LLC (d/b/a ACA Group), served as the distributor of Convertible Equity Alternative ETF. The Distributor has entered into a distribution agreement with the Trust pursuant to which it distributes Fund Shares.
Affiliated Trustees and Officers. A Trustee and certain officers of the Trust are also officers and/or directors of Calamos Financial Services LLC ("CFS") and Calamos Advisors. Such trustee and officers serve without direct compensation from the Trust. The Trust's Statement of Additional Information contains additional information about the Trust's Trustees and Officers and is available without charge, upon request, at www.calamos.com or by calling 866.363.9219.
Note 3 – Investments
The cost of purchases and proceeds from sales of long-term investments, excluding short-term investments and in-kind transactions, for the period ended July 31, 2024 are shown in the table below.
| | | COST OF PURCHASES | | PROCEEDS FROM SALES | |
FUND | | U.S. GOV'T
SECURITIES | | OTHER | | U.S. GOV'T
SECURITIES | | OTHER | |
Convertible Equity Alternative ETF | | $ | — | | | $ | 13,753,366 | | | $ | — | | | $ | 13,074,749 | | |
CEF Income & Arbitrage ETF | | | — | | | | 5,703,977 | | | | — | | | | 5,341,381 | | |
Alternative Nasdaq® & Bond ETF | | | — | | | | 171,937 | | | | — | | | | 109,957 | | |
S&P 500® Structured Alt Protection ETFTM—May | | | — | | | | — | | | | — | | | | — | | |
S&P 500® Structured Alt Protection ETFTM—July | | | — | | | | — | | | | — | | | | — | | |
Nasdaq-100® Structured Alt Protection ETFTM—June | | | — | | | | — | | | | — | | | | — | | |
Russell 2000® Structured Alt Protection ETFTM—July | | | — | | | | — | | | | — | | | | — | | |
ETF FAMILY OF FUNDS ANNUAL REPORT
24
Notes to Financial Statements
The cost of purchases and proceeds from in-kind transactions associated with creations and redemptions for the period ended July 31, 2024 are shown in the table below.
FUND | | COST OF IN-KIND
PURCHASES | | PROCEEDS FROM
IN-KIND SALES | |
Convertible Equity Alternative ETF | | $ | 17,497,087 | | | $ | 10,925,758 | | |
CEF Income & Arbitrage ETF | | | 12,387,590 | | | | 633,106 | | |
Alternative Nasdaq® & Bond ETF | | | 1,125,993 | | | | — | | |
S&P 500® Structured Alt Protection ETFTM—May | | | — | | | | 14,267,039 | | |
S&P 500® Structured Alt Protection ETFTM—July | | | — | | | | — | | |
Nasdaq-100® Structured Alt Protection ETFTM—June | | | — | | | | 1,428,711 | | |
Russell 2000® Structured Alt Protection ETFTM—July | | | — | | | | — | | |
Note 4 – Income Taxes
The cost basis of investments for federal income tax purposes at July 31, 2024 was as follows:
FUND | | COST BASIS OF
INVESTMENTS | | GROSS UNREALIZED
APPRECIATION | | GROSS UNREALIZED
DEPRECIATION | | NET UNREALIZED
APPRECIATION
(DEPRECIATION) | |
Convertible Equity Alternative ETF | | $ | 9,258,898 | | | $ | 490,202 | | | $ | (171,846 | ) | | $ | 318,356 | | |
CEF Income & Arbitrage ETF | | | 12,180,125 | | | | 713,952 | | | | (8,975 | ) | | | 704,977 | | |
Alternative Nasdaq® & Bond ETF | | | 1,240,189 | | | | 85,746 | | | | (27,440 | ) | | | 58,306 | | |
S&P 500® Structured Alt Protection ETFTM—May | | | 105,083,673 | | | | 7,878,896 | | | | (5,417,623 | ) | | | 2,461,273 | | |
S&P 500® Structured Alt Protection ETFTM—July | | | 30,010,508 | | | | 268,057 | | | | — | | | | 268,057 | | |
Nasdaq-100® Structured Alt Protection ETFTM—June | | | 63,779,300 | | | | 924,638 | | | | (299,650 | ) | | | 624,988 | | |
Russell 2000® Structured Alt Protection ETFTM—July | | | 54,192,000 | | | | 1,475,211 | | | | — | | | | 1,475,211 | | |
For the fiscal year ended July 31, 2024, the Funds recorded the following permanent reclassifications to reflect tax character. The results of operations and net assets were not affected by these reclassifications.
FUND | | PAID-IN
CAPITAL | | UNDISTRIBUTED/
(OVERDISTRIBUTED)
NET INVESTMENT
INCOME | | ACCUMULATED
NET REALIZED
GAIN/(LOSS) ON
INVESTMENTS | |
Convertible Equity Alternative ETF | | $ | 1,365,951 | | | $ | 1,191,958 | | | $ | (2,557,909 | ) | |
CEF Income & Arbitrage ETF | | | 26,339 | | | | — | | | | (26,339 | ) | |
Alternative Nasdaq® & Bond ETF | | | — | | | | — | | | | — | | |
S&P 500® Structured Alt Protection ETFTM—May | | | 901,417 | | | | 167,575 | | | | (1,068,992 | ) | |
S&P 500® Structured Alt Protection ETFTM—July | | | (13,756 | ) | | | 13,756 | | | | — | | |
Nasdaq-100® Structured Alt Protection ETFTM—June | | | 36,373 | | | | 58,137 | | | | (94,510 | ) | |
Russell 2000® Structured Alt Protection ETFTM—July | | | (23,877 | ) | | | 23,877 | | | | — | | |
Distributions during the fiscal year ended July 31, 2024 were characterized for federal income tax purposes as follows:
FUND | | ORDINARY
INCOME | | LONG-TERM
CAPITAL GAIN | | RETURN OF
CAPITAL | |
Convertible Equity Alternative ETF | | $ | 142,447 | | | $ | — | | | $ | — | | |
CEF Income & Arbitrage ETF | | | 252,902 | | | | — | | | | — | | |
Alternative Nasdaq® & Bond ETF | | | 21,565 | | | | — | | | | — | | |
S&P 500® Structured Alt Protection ETFTM—May | | | — | | | | — | | | | — | | |
S&P 500® Structured Alt Protection ETFTM—July | | | — | | | | — | | | | — | | |
Nasdaq-100® Structured Alt Protection ETFTM—June | | | — | | | | — | | | | — | | |
Russell 2000® Structured Alt Protection ETFTM—July | | | — | | | | — | | | | — | | |
www.calamos.com
25
Notes to Financial Statements
As of July 31, 2024, the components of accumulated earnings/(loss) on a tax basis were as follows:
| | CONVERTIBLE
EQUITY
ALTERNATIVE ETF | | CEF INCOME &
ARBITRAGE ETF | | ALTERNATIVE
NASDAQ® & BOND
ETF | |
Undistributed ordinary income | | $ | — | | | $ | 114,261 | | | $ | 6,398 | | |
Undistributed capital gains | | | — | | | | — | | | | — | | |
Total undistributed earnings | | | — | | | | 114,261 | | | | 6,398 | | |
Accumulated capital and other losses | | | (318,768 | ) | | | — | | | | (637 | ) | |
Net unrealized gains/(losses) | | | 316,614 | | | | 704,977 | | | | 58,306 | | |
Total accumulated earnings/(losses) | | | (2,154 | ) | | | 819,238 | | | | 64,067 | | |
Other | | | — | | | | — | | | | — | | |
Paid-in-capital | | | 8,216,299 | | | | 12,308,263 | | | | 1,242,791 | | |
Net assets applicable to common shareholders | | $ | 8,214,145 | | | $ | 13,127,501 | | | $ | 1,306,858 | | |
| | S&P 500®
STRUCTURED ALT
PROTECTION
ETFTM—MAY | | S&P 500®
STRUCTURED ALT
PROTECTION
ETFTM—JULY | | NASDAQ-100®
STRUCTURED ALT
PROTECTION
ETFTM—JUNE | | RUSSELL 2000®
STRUCTURED ALT
PROTECTION
ETFTM—JULY | |
Undistributed ordinary income | | $ | — | | | $ | — | | | $ | — | | | $ | — | | |
Undistributed capital gains | | | — | | | | — | | | | — | | | | — | | |
Total undistributed earnings | | | — | | | | — | | | | — | | | | — | | |
Accumulated capital and other losses | | | — | | | | (2,664 | ) | | | — | | | | (12,858 | ) | |
Net unrealized gains/(losses) | | | 2,461,273 | | | | 268,057 | | | | 624,988 | | | | 1,475,211 | | |
Total accumulated earnings/(losses) | | | 2,461,273 | | | | 265,393 | | | | 624,988 | | | | 1,462,353 | | |
Other | | | — | | | | — | | | | — | | | | — | | |
Paid-in-capital | | | 105,342,040 | | | | 30,082,988 | | | | 64,225,133 | | | | 54,314,766 | | |
Net assets applicable to common shareholders | | $ | 107,803,313 | | | $ | 30,348,381 | | | $ | 64,850,121 | | | $ | 55,777,119 | | |
The following Funds had capital loss carryforwards for the year ended July 31, 2024, with no expiration date, available to offset future realized capital gains:
FUND | | SHORT-TERM | | LONG-TERM | |
Convertible Equity Alternative ETF | | $ | 318,768 | | | $ | — | | |
CEF Income & Arbitrage ETF | | | — | | | | — | | |
Alternative Nasdaq® & Bond ETF | | | 637 | | | | — | | |
S&P 500® Structured Alt Protection ETFTM—May | | | — | | | | — | | |
S&P 500® Structured Alt Protection ETFTM—July | | | 2,664 | | | | — | | |
Nasdaq-100® Structured Alt Protection ETFTM—June | | | — | | | | — | | |
Russell 2000® Structured Alt Protection ETFTM—July | | | 12,858 | | | | — | | |
Note 5 – Derivative Instruments
Equity Risk. Each Fund may engage in option transactions and in doing so achieves similar objectives to what it would achieve through the sale or purchase of individual securities. A call option, upon payment of a premium, gives the purchaser of the option the right to buy, and the seller of the option the obligation to sell, the underlying security, index or other instrument at the exercise price. A put option gives the purchaser of the option, upon payment of a premium, the right to sell, and the seller the obligation to buy, the underlying security, index, or other instrument at the exercise price.
To seek to offset some of the risk of a potential decline in value of certain long positions, each Fund may also purchase put options on individual securities, broad-based securities indexes or certain exchange-traded funds ("ETFs"). Each Fund may also seek to generate income from option premiums by writing (selling) options on a portion of the equity securities (including securities that are convertible into equity securities) in a Fund's portfolio, on broad-based securities indexes, or certain ETFs.
ETF FAMILY OF FUNDS ANNUAL REPORT
26
Notes to Financial Statements
When a Fund purchases an option, it pays a premium and an amount equal to that premium is recorded as an asset. When a Fund writes an option, it receives a premium and an amount equal to that premium is recorded as a liability. The asset or liability is adjusted daily to reflect the current market value of the option. If an option expires unexercised, a Fund realizes a gain or loss to the extent of the premium received or paid. If an option is exercised, the premium received or paid is recorded as an adjustment to the proceeds from the sale or the cost basis of the purchase. The difference between the premium and the amount received or paid on a closing purchase or sale transaction is also treated as a realized gain or loss. The cost of securities acquired through the exercise of call options is increased by premiums paid. The proceeds from securities sold through the exercise of put options are decreased by the premiums paid. Gain or loss on written options and purchased options is presented separately on the Statements of Operations as net realized gain or loss on written options and net realized gain or loss on purchased options, respectively.
Options written by each Fund do not typically give rise to counterparty credit risk since options written obligate each Fund and not the counterparty to perform. Exchange traded purchased options have minimal counterparty credit risk to each Fund since the exchange's clearinghouse, as counterparty to such instruments, guarantees against a possible default.
The Funds may invest in FLEX Options issued and guaranteed for settlement by The Options Clearing Corporation ("OCC"). FLEX Options are customized option contracts that trade on an exchange but provide investors with the ability to customize key contract terms like strike price, style and expiration date while achieving price discovery in competitive, transparent auctions markets and avoiding the counterparty exposure of over-the-counter options positions. Like traditional exchange-traded options, FLEX Options are guaranteed for settlement by the OCC, a market clearinghouse that guarantees performance by counterparties to certain derivatives contracts. The Funds bear the risk that the OCC will be unable or unwilling to perform its obligations under the FLEX Options contracts. Additionally, FLEX Options may be illiquid, and in such cases, the Funds may have difficulty closing out certain FLEX Options positions at desired times and prices. The FLEX Options held by the Funds will be exercisable at the strike price only on their expiration date. Prior to the expiration date, the value of the FLEX Options will be determined based upon market quotations or using other recognized pricing methods. The value of the FLEX Options prior to the expiration date may vary because of related factors other than the value of the reference asset. Factors that may influence the value of the FLEX Options, other than gains or losses in the reference asset, may include interest rate changes, changing supply and demand, decreased liquidity of the FLEX Options and changing volatility levels of the reference asset. In connection with the creation and redemption of Fund Shares, to the extent market participants are not willing or able to enter into FLEX Option transactions with the Funds at prices that reflect the market price of the Fund Shares, a Fund's NAV and, in turn the share price of a Fund, could be negatively impacted. The Funds may experience substantial downside from specific FLEX Option positions and certain FLEX Option positions may expire worthless.
As of July 31, 2024, the Funds had outstanding derivative contracts which are reflected on the Statements of Assets and Liabilities as follows:
| | ASSET
DERIVATIVES | | LIABILITY
DERIVATIVES | |
| | | ALTERNATIVE NASDAQ® & BOND ETF | |
Gross amounts at fair value: | |
Purchased Options(1) | | $ | 163,645 | | | $ | — | | |
| | | $ | 163,645 | | | $ | — | | |
| | | S&P 500® STRUCTURED ALT
PROTECTION ETFTM—MAY | |
Gross amounts at fair value: | |
Purchased Options(1) | | $ | 115,539,286 | | | $ | — | | |
Written Option(2) | | | — | | | | 7,994,340 | | |
| | | $ | 115,539,286 | | | $ | 7,994,340 | | |
www.calamos.com
27
Notes to Financial Statements
| | | S&P 500® STRUCTURED ALT
PROTECTION ETFTM—JULY | |
Gross amounts at fair value: | |
Purchased Options(1) | | $ | 31,303,182 | | | $ | — | | |
Written Option(2) | | | — | | | | 1,024,617 | | |
| | | $ | 31,303,182 | | | $ | 1,024,617 | | |
| | | NASDAQ-100® STRUCTURED ALT
PROTECTION ETFTM—JUNE | |
Gross amounts at fair value: | |
Purchased Options(1) | | $ | 68,616,288 | | | $ | — | | |
Written Option(2) | | | — | | | | 4,212,000 | | |
| | | $ | 68,616,288 | | | $ | 4,212,000 | | |
| | | RUSSELL 2000® STRUCTURED ALT
PROTECTION ETFTM—JULY | |
Gross amounts at fair value: | |
Purchased Options(1) | | $ | 61,332,862 | | | $ | — | | |
Written Option(2) | | | — | | | | 5,665,651 | | |
| | | $ | 61,332,862 | | | $ | 5,665,651 | | |
For the period ended July 31, 2024, the volume of derivative activity for the Fund is reflected below:*
FUND | | PURCHASED
OPTIONS(1) | | WRITTEN
OPTIONS(2) | |
Convertible Equity Alternative ETF | | | — | | | | — | | |
CEF Income & Arbitrage ETF | | | — | | | | — | | |
Alternative Nasdaq® & Bond ETF | | | 75 | | | | — | | |
S&P 500® Structured Alt Protection ETFTM—May | | | 4,606 | | | | 2,303 | | |
S&P 500® Structured Alt Protection ETFTM—July | | | 1,100 | | | | 550 | | |
Nasdaq-100® Structured Alt Protection ETFTM—June | | | 2,860 | | | | 1,430 | | |
Russell 2000® Structured Alt Protection ETFTM—July | | | 5,340 | | | | 2,670 | | |
* Activity during the period is measured by opened number of contracts for options purchased or written.
(1) Generally, the Statement of Assets and Liabilities location for Purchased Options is "Investments in securities, at value".
(2) Generally, the Statement of Assets and Liabilities location for Written Options is "Options written, at value".
Note 6 – Securities Lending
The Funds may loan one or more of their securities to broker-dealers and banks. Any such loan must be secured by collateral in cash or cash equivalents maintained on a current basis in an amount at least equal to the value of the securities loaned by the Funds. The Funds continue to receive the equivalent of the interest or dividends paid by the issuer on the securities loaned and also receives an additional return that may be in the form of a fixed fee or a percentage of the collateral. The additional return is disclosed on a net basis as Securities lending income in the Statements of Operations. Upon receipt of cash or cash equivalent collateral, the Funds' securities lending agent invests the collateral into short term investments following investment guidelines approved by the Adviser. The Funds record the investment of collateral as an asset (Investment in securities, at value or Restricted cash for collateral on securities loaned) and the value of the collateral as a liability (Collateral for securities loaned) on the Statements of Assets and Liabilities. If the value of the invested collateral declines below the value of the collateral deposited by the borrower, the Funds will record unrealized depreciation equal to the decline in value of the invested collateral. The Funds will pay reasonable fees to persons unaffiliated with the Funds for services in arranging these loans. The Funds have the right to call a loan and obtain the securities loaned at any time. The Funds do not have the right to vote the securities during the existence of the loan but could call the loan in an attempt to permit voting of the securities in certain circumstances. Upon return of the securities loaned, the cash or cash equivalent collateral will be returned to the borrower. In the event of bankruptcy or other default of the borrower, the Funds could experience both delays in
ETF FAMILY OF FUNDS ANNUAL REPORT
28
Notes to Financial Statements
liquidating the loan collateral or recovering the loaned securities and losses, including (a) possible decline in the value of the collateral or in the value of the securities loaned during the year while the Funds seek to enforce its rights thereto, (b) possible subnormal levels of income and lack of access to income during this year, and (c) the expenses of enforcing their rights. In an effort to reduce these risks, the Funds' security lending agent monitors and reports to Calamos Advisors on the creditworthiness of the firms to which the Funds lend securities.
The following table indicates the total amount of securities loaned by asset class, reconciled to the gross liability payable upon return of the securities loaned by the Funds as July 31, 2024.
| | | AMOUNT OF
COLLATERAL
HELD IN
SHORT TERM
INVESTMENTS
AND
RESTRICTED | | AMOUNT OF
NON-CASH | | TOTAL | | VALUE OF SECURITIES ON
LOAN TO BROKER-DEALERS AND
BANKS BY ASSET CLASS ON LOAN | | EXCESS
AMOUNT
DUE TO/(FROM) | |
FUND | | CASH | | COLLATERAL | | COLLATERAL | | EQUITY | | FIXED INCOME | | TOTAL | | COUNTERPARTY | |
Convertible Equity Alternative ETF | | $ | 1,430,793 | | | $ | — | | | $ | 1,430,793 | | | $ | 632,780 | | | $ | 786,700 | | | $ | 1,419,480 | | | $ | 11,313 | | |
Note 7 – Fair Value Measurements
Various inputs are used to determine the value of the Funds' investments. These inputs are categorized into three broad levels as follows:
• Level 1 – Prices are determined using inputs from unadjusted quoted prices from active markets (including securities actively traded on a securities exchange) for identical assets.
• Level 2 – Prices are determined using significant observable market inputs other than unadjusted quoted prices, including quoted prices of similar securities, fair value adjustments to quoted foreign securities, interest rates, credit risk, prepayment speeds, and other relevant data.
• Level 3 – Prices reflect unobservable market inputs (including the Funds' own judgments about assumptions market participants would use in determining fair value) when observable inputs are unavailable.
Debt securities are valued based upon evaluated prices received from an independent pricing service or from a dealer or broker who makes markets in such securities. Pricing services utilize various observable market data and as such, debt securities are generally categorized as Level 2. The levels are not necessarily an indication of the risk or liquidity of a Fund's investments.
The following is a summary of the inputs used in valuing the Funds' holdings at fair value:
| | | CONVERTIBLE EQUITY ALTERNATIVE ETF | |
| | | LEVEL 1 | | LEVEL 2 | | LEVEL 3 | | TOTAL | |
Assets: | |
Convertible Bonds | | $ | — | | | $ | 6,785,776 | | | $ | — | | | $ | 6,785,776 | | |
Convertible Preferred Stocks | | | 1,283,166 | | | | 77,519 | | | | — | | | | 1,360,685 | | |
Investment of Cash Collateral For Securities Loaned | | | — | | | | 1,430,793 | | | | — | | | | 1,430,793 | | |
Total | | $ | 1,283,166 | | | $ | 8,294,088 | | | $ | — | | | $ | 9,577,254 | | |
| | | CEF INCOME & ARBITRAGE ETF | |
| | | LEVEL 1 | | LEVEL 2 | | LEVEL 3 | | TOTAL | |
Assets: | |
Closed-End Funds | | $ | 12,885,102 | | | $ | — | | | $ | — | | | $ | 12,885,102 | | |
Total | | $ | 12,885,102 | | | $ | — | | | $ | — | | | $ | 12,885,102 | | |
www.calamos.com
29
Notes to Financial Statements
| | | ALTERNATIVE NASDAQ® & BOND ETF | |
| | | LEVEL 1 | | LEVEL 2 | | LEVEL 3 | | TOTAL | |
Assets: | |
Exchange-Traded Funds | | $ | 1,134,850 | | | $ | — | | | $ | — | | | $ | 1,134,850 | | |
Purchased Options | | | — | | | | 163,645 | | | | — | | | | 163,645 | | |
Total | | $ | 1,134,850 | | | $ | 163,645 | | | $ | — | | | $ | 1,298,495 | | |
| | | S&P 500® STRUCTURED ALT PROTECTION ETFTM—MAY | |
| | | LEVEL 1 | | LEVEL 2 | | LEVEL 3 | | TOTAL | |
Assets: | |
Purchased Options | | $ | — | | | $ | 115,539,286 | | | $ | — | | | $ | 115,539,286 | | |
Total | | $ | — | | | $ | 115,539,286 | | | $ | — | | | $ | 115,539,286 | | |
Liabilities: | |
Written Option | | $ | — | | | $ | 7,994,340 | | | $ | — | | | $ | 7,994,340 | | |
Total | | $ | — | | | $ | 7,994,340 | | | $ | — | | | $ | 7,994,340 | | |
| | | S&P 500® STRUCTURED ALT PROTECTION ETFTM—JULY | |
| | | LEVEL 1 | | LEVEL 2 | | LEVEL 3 | | TOTAL | |
Assets: | |
Purchased Options | | $ | — | | | $ | 31,303,182 | | | $ | — | | | $ | 31,303,182 | | |
Total | | $ | — | | | $ | 31,303,182 | | | $ | — | | | $ | 31,303,182 | | |
Liabilities: | |
Written Option | | $ | — | | | $ | 1,024,617 | | | $ | — | | | $ | 1,024,617 | | |
Total | | $ | — | | | $ | 1,024,617 | | | $ | — | | | $ | 1,024,617 | | |
| | | NASDAQ-100® STRUCTURED ALT PROTECTION ETFTM—JUNE | |
| | | LEVEL 1 | | LEVEL 2 | | LEVEL 3 | | TOTAL | |
Assets: | |
Purchased Options | | $ | — | | | $ | 68,616,288 | | | $ | — | | | $ | 68,616,288 | | |
Total | | $ | — | | | $ | 68,616,288 | | | $ | — | | | $ | 68,616,288 | | |
Liabilities: | |
Written Option | | $ | — | | | $ | 4,212,000 | | | $ | — | | | $ | 4,212,000 | | |
Total | | $ | — | | | $ | 4,212,000 | | | $ | — | | | $ | 4,212,000 | | |
| | | RUSSELL 2000® STRUCTURED ALT PROTECTION ETFTM—JULY | |
| | | LEVEL 1 | | LEVEL 2 | | LEVEL 3 | | TOTAL | |
Assets: | |
Purchased Options | | $ | — | | | $ | 61,332,862 | | | $ | — | | | $ | 61,332,862 | | |
Total | | $ | — | | | $ | 61,332,862 | | | $ | — | | | $ | 61,332,862 | | |
Liabilities: | |
Written Option | | $ | — | | | $ | 5,665,651 | | | $ | — | | | $ | 5,665,651 | | |
Total | | $ | — | | | $ | 5,665,651 | | | $ | — | | | $ | 5,665,651 | | |
ETF FAMILY OF FUNDS ANNUAL REPORT
30
Notes to Financial Statements
Note 8 – Creation and Redemption Transactions
Each Fund offers and issues Shares at NAV only in aggregations of a specified number of Shares, generally in exchange for a basket of securities constituting the portfolio holdings of a Fund, together with the deposit of a specified cash payment, or, in certain circumstances, for an all cash payment. Shares of the Funds (except for Alternative Nasdaq® & Bond ETF) are listed and principally traded on NYSE Arca, Inc. (the "Exchange"). Shares of Alternative Nasdaq® & Bond ETF are principally traded on The Nasdaq Stock Market LLC (also referred to herein as the "Exchange"). Shares trade on the Exchange at market prices that may be below, at, or above NAV. Unlike mutual funds, Fund Shares are not individually redeemable securities. Rather, each Fund issues and redeems Shares on a continuous basis at NAV, typically in creation units of 50,000 Shares for Convertible Equity Alternative ETF, 25,000 Shares for CEF Income & Arbitrage ETF, 50,000 Shares for Alternative Nasdaq® & Bond ETF, 25,000 Shares for S&P 500® Structured Alt Protection ETFTM—May, 25,000 Shares for S&P 500® Structured Alt Protection ETFTM—July, 25,000 Shares for Nasdaq—100® Structured Alt Protection ETFTM—June, and 25,000 Shares for Russell 2000® Structured Alt Protection ETFTM—July (each, a "Creation Unit"). In the event of the liquidation of a Fund, the Trust may lower the number of Shares in a Creation Unit. Financial entities known as "authorized participants" have contractual arrangements with each Fund or the Distributor to purchase and redeem Fund Shares directly with such Fund in Creation Units in exchange for the securities comprising the Fund and/or cash, or some combination thereof. Fund Shares are traded in the secondary market and elsewhere at market prices that may be at, above, or below a Fund's NAV. Fund Shares are only redeemable in Creation Units by authorized participants. An authorized participant that purchases a Creation Unit of Fund Shares deposits with such Fund a "basket" of securities and/or other assets identified by the Fund that day, and then receives the Creation Unit of Fund Shares in return for those assets. The redemption process is the reverse of the purchase process: the authorized participant redeems a Creation Unit of Fund Shares for a basket of securities and other assets. The basket is generally representative of a Fund's portfolio, and together with a cash balancing amount, it is equal to the NAV of the Fund Shares comprising the Creation Unit. Pursuant to Rule 6c-11 of the 1940 Act ("Rule 6c-11"), a Fund may utilize baskets that are not representative of the Fund's portfolio. Such "custom baskets" are discussed in each Fund's Statement of Additional Information in the section entitled "Creation and Redemption of Creation Units". Transaction fees and other costs associated with creations or redemptions that include cash may be higher than the transaction fees and other costs associated with in-kind creations or redemptions. In all cases, conditions with respect to creations and redemptions of shares and fees will be limited in accordance with the requirements of SEC rules and regulations applicable to management investment companies offering redeemable securities.
www.calamos.com
31
Report of Independent Registered Public Accounting Firm
To the shareholders and the Board of Trustees of Calamos ETF Trust
Opinion on the Financial Statements and Financial Highlights
We have audited the accompanying statements of assets and liabilities of Calamos ETF Trust (the "Funds") comprising the Calamos Convertible Equity Alternative ETF, Calamos CEF Income & Arbitrage ETF, Calamos Alternative Nasdaq® & Bond ETF, Calamos S&P 500® Structured Alt Protection ETFTM—May, Calamos S&P 500® Structured Alt Protection ETFTM—July, Calamos Nasdaq-100® Structured Alt Protection ETFTM—June, and Calamos Russell 2000® Structured Alt Protection ETFTM—July, including the schedules of investments, as of July 31, 2024, the related statements of operations, changes in net assets, and the financial highlights for the periods indicated in the table below, and the related notes. In our opinion, the financial statements and financial highlights present fairly, in all material respects, the financial position of each of the funds constituting the Calamos ETF Trust as of July 31, 2024, and the results of their operations, the changes in their net assets, and the financial highlights for each of the periods listed in the table below in conformity with accounting principles generally accepted in the United States of America.
Individual Fund Comprising the
Calamos ETF Trust | | Statement of
Operations | | Statement of
Changes in
Net Assets | | Financial Highlights | |
Calamos Convertible Equity Alternative ETF | | For the period from October 4, 2023 (commencement of operations) to July 31, 2024 | |
Calamos CEF Income & Arbitrage ETF | | For the period from January 16, 2024 (commencement of operations) to July 31, 2024 | |
Calamos Alternative Nasdaq® & Bond ETF | | For the period from February 13, 2024 (commencement of operations) to July 31, 2024 | |
Calamos S&P 500® Structured Alt Protection ETFTM—May | | For the period from May 1, 2024 (commencement of operations) to July 31, 2024 | |
Calamos Nasdaq-100® Structured Alt Protection ETFTM—June | | For the period from June 3, 2024 (commencement of operations) to July 31, 2024 | |
Calamos S&P 500® Structured Alt Protection ETFTM—July | | For the period from July 1, 2024 (commencement of operations) to July 31, 2024 | |
Calamos Russell 2000® Structured Alt Protection ETFTM—July | | | |
Basis for Opinion
These financial statements and financial highlights are the responsibility of the Funds' management. Our responsibility is to express an opinion on the Funds' financial statements and financial highlights based on our audits. We are a public accounting firm registered with the Public Company Accounting Oversight Board (United States) (PCAOB) and are required to be independent with respect to the Funds in accordance with the U.S. federal securities laws and the applicable rules and regulations of the Securities and Exchange Commission and the PCAOB.
We conducted our audits in accordance with the standards of the PCAOB. Those standards require that we plan and perform the audit to obtain reasonable assurance about whether the financial statements and financial highlights are free of material misstatement, whether due to error or fraud. The Funds are not required to have, nor were we engaged to perform, an audit of their internal control over financial reporting. As part of our audits we are required to obtain an understanding of internal control over financial reporting but not for the purpose of expressing an opinion on the effectiveness of the Funds' internal control over financial reporting. Accordingly, we express no such opinion.
Our audits included performing procedures to assess the risks of material misstatement of the financial statements and financial highlights, whether due to error or fraud, and performing procedures that respond to those risks. Such procedures included examining, on a test basis, evidence regarding the amounts and disclosures in the financial statements and financial highlights. Our audits also included evaluating the accounting principles used and significant estimates made by management, as well as evaluating the overall presentation of the financial statements and financial highlights. Our procedures included confirmation of securities owned as of July 31, 2024, by correspondence with the custodian and brokers; when replies were
ETF FAMILY OF FUNDS ANNUAL REPORT
32
Report of Independent Registered Public Accounting Firm
not received from brokers, we performed other auditing procedures. We believe that our audits provide a reasonable basis for our opinion.

Chicago, Illinois
September 19, 2024
We have served as the auditor of one or more Calamos Advisors LLC investment companies since 2003.
www.calamos.com
33
Statement Regarding Basis for Approval of Investment Advisory Contract
The Board of Trustees ("Board" or the "Trustees") of Calamos ETF Trust ("Trust"), on behalf of its new series, Calamos Alternative Nasdaq & Bond ETF (the "New Fund"), oversees the management of the New Fund, and, as required by law, determines whether to approve or (annually thereafter) continue the New Fund's management agreement with Calamos Advisors LLC ("Adviser") pursuant to which the Adviser serves as the investment manager and provides certain administrative services for the New Fund. The "Independent Trustees," who comprise more than 80% of the Board, have never been affiliated with the Adviser.
In connection with their consideration regarding the initial approval of the management agreement for the New Fund, the Trustees received and reviewed a substantial amount of information provided by the Adviser in response to detailed requests from the Independent Trustees and their independent legal counsel. The Board, including the Independent Trustees, considered the data provided by the Adviser and concluded that sufficient information had been provided to allow them to evaluate the terms of the management agreement and the New Fund's investment advisory fee. In the course of their consideration of the agreement, the Independent Trustees were advised by their counsel and, in addition to meeting with management of the Adviser, they met separately in executive session with their counsel.
At a meeting held on December 12, 2023, based on their evaluation of the information referred to above and other information provided in this and previous meetings, the Trustees determined that the overall arrangement between the New Fund and the Adviser was fair in light of the nature, quality and extent of the services to be provided by the Adviser and its affiliates, as applicable, the proposed fees to be charged for those services, and other matters that the Trustees considered relevant in the exercise of their business judgment. At that meeting, the Trustees, including all of the Independent Trustees, approved the management agreement with respect to the New Fund through September 1, 2025, subject to possible earlier termination as provided in such agreement.
In connection with its consideration of the management agreement with respect to the New Fund, the Board considered, among other things: (i) the nature, quality and extent of the Adviser's services to be provided, (ii) the fees and other expenses to be paid by the New Fund as well as expense information for comparable funds, (iii) the estimated profitability of the Adviser and its affiliates from their relationship with the New Fund, (iv) whether economies of scale may be realized as the New Fund grows and whether potential economies may be shared, in some measure, with the New Fund's investors; and (v) other benefits to the Adviser from ITS relationship with the New Fund. In the Board's deliberations, no single factor was responsible for the Board's decision to approve the management agreement, and each Trustee may have afforded different weight to the various factors.
Nature, Quality and Extent of Services. The Board's consideration of the nature, quality and extent of the Adviser's services to be provided to the New Fund took into account the knowledge that may be gained from the Board's meetings with the Adviser throughout the years. In addition, the Board considered: the Adviser's long-term history of managing other funds in the Calamos fund complex; the consistency of the Adviser's investment approach; the background and experience of the portfolio management personnel who will play key roles in managing the New Fund; and the Adviser's provision of administrative services for other funds in the Calamos fund complex, including, among other things, in the areas of brokerage selection, trade execution, compliance and shareholder communications. The Board also reviewed the Adviser's resources and key personnel expected to be involved in providing investment management services to the New Fund. The Board also considered compliance reports about the Adviser from the Trust's Chief Compliance Officer. The Board concluded that the nature, quality and extent of the services to be provided by the Adviser to the New Fund were appropriate and consistent with the management agreement and that the New Fund was likely to benefit from services to be provided under the management agreement with the Adviser.
Investment Performance of the New Fund. Because the New Fund has not yet commenced operations, the Board did not consider the investment performance of the New Fund. The Board did consider, however, the results of another account managed using a strategy similar to the strategy the New Fund is expected to pursue.
Costs of Services Provided and Profits Realized by the Adviser. Using information provided by an independent third-party service provider, the Board evaluated the New Fund's proposed management fee rate compared to the median management fee rate for other funds similar in size to the estimated size of the New Fund, character and investment strategy (the "Expense Group") and estimated total expense ratio compared to the median total expense ratio of the Expense Group. The Board considered that the New Fund's estimated total net expense ratio was higher than the median of the Expense Group and that the proposed management fee rate was higher than the median of the Expense Group. The Board also took into account that the proposed management fee was a unitary or "all-inclusive" fee structure which combines fees for investment advisory and administrative services proposed to be rendered by the Adviser to the New Fund. Lastly, the Board considered the Adviser's
ETF FAMILY OF FUNDS ANNUAL REPORT
34
Statement Regarding Basis for Approval of Investment Advisory Contract
confidence in its investment team to deliver favorable performance and scale given its track record with another account that it manages in a strategy similar to that of the New Fund.
Economies of Scale. The Board noted that the proposed management fee does not contain breakpoints. The Board also considered that the proposed unitary fee structure provides investors with additional stability and increased fee certainty during the contractual period. The Trustees noted that, to the extent the Adviser may achieve economies of scale relating to the New Fund, it may share the benefits of such economies of scale with the New Fund through, for example, enhancements to investment practices and operations and increasing levels of services to the New Fund and its shareholders.
Profitability. The Board considered information on the anticipated profitability of the Adviser in serving as the New Fund's investment manager and of the Adviser and its affiliates in their relationships with the New Fund, as well as an explanation of the methodology utilized in allocating various expenses among the funds in the Calamos fund complex and the Adviser's other business units.
Other Benefits Derived from the Relationship with the New Fund. The Board considered other benefits that could accrue to the Adviser and its affiliates from their relationship with the New Fund. The Board concluded that while the Adviser may potentially benefit from its relationship with the New Fund in ways other than the proposed fees payable by the New Fund, the New Fund also may benefit from its relationship with the Adviser in ways other than the services to be provided by the Adviser and its affiliates pursuant to its agreement with the New Fund and the proposed fees payable by the New Fund.
In light of all of the information presented, and after full consideration of the above factors as well as other factors that were instructive in their consideration, the Trustees, including all of the Independent Trustees, concluded that the Trust's proposed management agreement with the Adviser with respect to the New Fund was, and its approval would be, in the best interest of the New Fund and its prospective shareholders.
www.calamos.com
35
Statement Regarding Basis for Approval of Investment Advisory Contract
The Board of Trustees ("Board" or the "Trustees") of Calamos ETF Trust ("Trust"), on behalf of its new series, Calamos S&P 500 Structured Alt Protection ETF—May, Calamos S&P 500 Structured Alt Protection ETF—July, Calamos S&P 500 Structured Alt Protection ETF—August, and Calamos Capital Protected Nasdaq 100 ETF—June (each, a "New Fund" and, together, the "New Funds"), oversees the management of the New Funds, and, as required by law, determines whether to approve or (annually thereafter) continue each New Fund's management agreement with Calamos Advisors LLC ("Adviser") pursuant to which the Adviser serves as the investment manager and provides certain administrative services for such New Fund. The "Independent Trustees," who comprise more than 80% of the Board, have never been affiliated with the Adviser.
In connection with their consideration regarding the initial approval of the management agreement for each New Fund, the Trustees received and reviewed a substantial amount of information provided by the Adviser in response to detailed requests from the Independent Trustees and their independent legal counsel. The Board, including the Independent Trustees, considered the data provided by the Adviser and concluded that sufficient information had been provided to allow them to evaluate the terms of the management agreement and each New Fund's investment advisory fee. In the course of their consideration of the agreement, the Independent Trustees were advised by their counsel and, in addition to meeting with management of the Adviser, they met separately in executive session with their counsel.
At a meeting held on March 28, 2024 based on their evaluation of the information referred to above and other information provided in this and previous meetings, the Trustees determined that the overall arrangement between each New Fund and the Adviser was fair in light of the nature, quality and extent of the services to be provided by the Adviser and its affiliates, as applicable, the proposed fees to be charged for those services, and other matters that the Trustees considered relevant in the exercise of their business judgment. At that meeting, the Trustees, including all of the Independent Trustees, approved the management agreement with respect to each New Fund through September 1, 2025, subject to possible earlier termination as provided in such agreement.
In connection with its consideration of the management agreement with respect to each New Fund, the Board considered, among other things: (i) the nature, quality and extent of the Adviser's services to be provided, (ii) the fees and other expenses to be paid by each New Fund as well as expense information for comparable funds, (iii) the estimated profitability of the Adviser and its affiliates from their relationship with each New Fund, (iv) whether economies of scale may be realized as each New Fund grows and whether potential economies may be shared, in some measure, with each New Fund's investors; and (v) other benefits to the Adviser from its relationship with each New Fund. In the Board's deliberations, no single factor was responsible for the Board's decision to approve the management agreement, and each Trustee may have afforded different weight to the various factors.
Nature, Quality and Extent of Services. The Board's consideration of the nature, quality and extent of the Adviser's services to be provided to each New Fund took into account the knowledge that may be gained from the Board's meetings with the Adviser throughout the years. In addition, the Board considered: the Adviser's long-term history of managing other funds in the Calamos fund complex; the consistency of the Adviser's investment approach; the background and experience of the portfolio management personnel who will play key roles in managing each New Fund; and the Adviser's provision of administrative services for other funds in the Calamos fund complex, including, among other things, in the areas of brokerage selection, trade execution, compliance and shareholder communications. The Board also reviewed the Adviser's resources and key personnel expected to be involved in providing investment management services to each New Fund. The Board also considered compliance reports about the Adviser from the Trust's Chief Compliance Officer. The Board concluded that the nature, quality and extent of the services to be provided by the Adviser to each New Fund were appropriate and consistent with the management agreement and that each New Fund was likely to benefit from services to be provided under the management agreement with the Adviser.
Investment Performance of the New Funds. Because the New Funds have not yet commenced operations, the Board did not consider the investment performance of the New Funds.
Costs of Services Provided and Profits Realized by the Adviser. Using information provided by an independent third-party service provider, the Board evaluated each New Fund's proposed management fee rate compared to the median management fee rate for other funds similar in size to the estimated size of each New Fund, character and investment strategy (the "Expense Group") and estimated total expense ratio compared to the median total expense ratio of the Expense Group. The Board considered that each New Fund's estimated total net expense ratio and proposed management fee rate are both lower than the respective medians of each New Fund's Expense Group. The Board also took into consideration that the proposed management fee was a unitary or "all-inclusive" fee structure which combines fees for investment advisory and administrative services proposed to be rendered by the Adviser to each New Fund. Lastly, the Board considered the Adviser's
ETF FAMILY OF FUNDS ANNUAL REPORT
36
Statement Regarding Basis for Approval of Investment Advisory Contract
confidence in its investment team to deliver favorable performance and scale given its track record with other accounts that it manages.
Economies of Scale. The Board noted that the proposed management fee does not contain breakpoints. The Board also considered that the proposed unitary fee structure provides investors with additional stability and increased fee certainty during the contractual period. The Trustees noted that, to the extent the Adviser may achieve economies of scale relating to each New Fund, it may share the benefits of such economies of scale with each New Fund through, for example, enhancements to investment practices and operations and increasing levels of services to each New Fund and its shareholders.
Profitability. The Board considered information on the anticipated profitability of the Adviser in serving as each New Fund's investment manager and of the Adviser and its affiliates in their relationships with each New Fund as well as an explanation of the methodology utilized in allocating various expenses among the funds in the Calamos fund complex and the Adviser's other business units.
Other Benefits Derived from the Relationship with each New Fund. The Board considered other benefits that could accrue to the Adviser and its affiliates from their relationship with each New Fund. The Board concluded that while the Adviser may potentially benefit from its relationship with each New Fund in ways other than the proposed fees payable by each New Fund, each New Fund also may benefit from its relationship with the Adviser in ways other than the services to be provided by the Adviser and its affiliates pursuant to its agreement with each New Fund and the proposed fees payable by each New Fund.
In light of all the information presented, and after full consideration of the above factors as well as other factors that were instructive in their consideration, the Trustees, including all of the Independent Trustees, concluded that the Trust's proposed management agreement with the Adviser with respect to each New Fund was, and its approval would be, in the best interest of each New Fund and its prospective shareholders.
www.calamos.com
37
Statement Regarding Basis for Approval of Investment Advisory Contract
The Board of Trustees ("Board" or the "Trustees") of Calamos ETF Trust ("Trust"), on behalf of its new series, Calamos Russell 2000 Structured Alt Protection ETF—July (the "New Fund"), oversees the management of the New Funds, and, as required by law, determines whether to approve or (annually thereafter) continue the New Fund's management agreement with Calamos Advisors LLC ("Adviser") pursuant to which the Adviser serves as the investment manager and provides certain administrative services for the New Fund. The "Independent Trustees," who comprise more than 80% of the Board, have never been affiliated with the Adviser.
In connection with their consideration regarding the initial approval of the management agreement for the New Fund, the Trustees received and reviewed a substantial amount of information provided by the Adviser in response to detailed requests from the Independent Trustees and their independent legal counsel. The Board, including the Independent Trustees, considered the data provided by the Adviser and concluded that sufficient information had been provided to allow them to evaluate the terms of the management agreement and the New Fund's investment advisory fee. In the course of their consideration of the agreement, the Independent Trustees were advised by their counsel and, in addition to meeting with management of the Adviser, they met separately in executive session with their counsel.
At a meeting held on May 13, 2024,* based on their evaluation of the information referred to above and other information provided in this and previous meetings, the Trustees determined that the overall arrangement between the New Fund and the Adviser was fair in light of the nature, quality and extent of the services to be provided by the Adviser and its affiliates, as applicable, the proposed fees to be charged for those services, and other matters that the Trustees considered relevant in the exercise of their business judgment. At that meeting, the Trustees, including all of the Independent Trustees, approved the management agreement with respect to the New Fund through September 1, 2025, subject to possible earlier termination as provided in such agreement.
In connection with its consideration of the management agreement with respect to the New Fund, the Board considered, among other things: (i) the nature, quality and extent of the Adviser's services to be provided, (ii) the fees and other expenses to be paid by the New Fund as well as expense information for comparable funds, (iii) the estimated profitability of the Adviser and its affiliates from their relationship with the New Fund, (iv) whether economies of scale may be realized as the New Fund grows and whether potential economies may be shared, in some measure, with the New Fund's investors; and (v) other benefits to the Adviser from its relationship with the New Fund. In the Board's deliberations, no single factor was responsible for the Board's decision to approve the management agreement, and each Trustee may have afforded different weight to the various factors.
Nature, Quality and Extent of Services. The Board's consideration of the nature, quality and extent of the Adviser's services to be provided to the New Fund took into account the knowledge that may be gained from the Board's meetings with the Adviser throughout the years. In addition, the Board considered: the Adviser's long-term history of managing other funds in the Calamos fund complex; the consistency of the Adviser's investment approach; the background and experience of the portfolio management personnel who will play key roles in managing the New Fund; and the Adviser's provision of administrative services for other funds in the Calamos fund complex, including, among other things, in the areas of brokerage selection, trade execution, compliance and shareholder communications. The Board also reviewed the Adviser's resources and key personnel expected to be involved in providing investment management services to the New Fund. The Board also considered compliance reports about the Adviser from the Trust's Chief Compliance Officer. The Board concluded that the nature, quality and extent of the services to be provided by the Adviser to the New Fund were appropriate and consistent with the management agreement and that the New Fund was likely to benefit from services to be provided under the management agreement with the Adviser.
Investment Performance of the New Fund. Because the New Fund has not yet commenced operations, the Board did not consider the investment performance of the New Fund.
Costs of Services Provided and Profits Realized by the Adviser. Using information provided by an independent third-party service provider, the Board evaluated the New Fund's proposed management fee rate compared to the median management fee rate for other funds similar in size to the estimated size of the New Fund, character and investment strategy (the "Expense Group") and estimated total expense ratio compared to the median total expense ratio of the Expense Group. The Board considered that the New Fund's estimated total net expense ratio and proposed management fee rate are both lower than the respective medians of the New Fund's Expense Group. The Board also took into consideration that the proposed management fee was a unitary or "all-inclusive" fee structure which combines fees for investment advisory and administrative
* The meeting was held via videoconference in reliance on an exemptive order issued by the Securities and Exchange Commission on June 19, 2020.
ETF FAMILY OF FUNDS ANNUAL REPORT
38
Statement Regarding Basis for Approval of Investment Advisory Contract
services proposed to be rendered by the Adviser to the New Fund. Lastly, the Board considered the Adviser's confidence in its investment team to deliver favorable performance and scale given its track record with other accounts that it manages.
Economies of Scale. The Board noted that the proposed management fee does not contain breakpoints. The Board also considered that the proposed unitary fee structure provides investors with additional stability and increased fee certainty during the contractual period. The Trustees noted that, to the extent the Adviser may achieve economies of scale relating to the New Fund, it may share the benefits of such economies of scale with the New Fund through, for example, enhancements to investment practices and operations and increasing levels of services to the New Fund and its shareholders.
Profitability. The Board considered information on the anticipated profitability of the Adviser in serving as the New Fund's investment manager and of the Adviser and its affiliates in their relationships with the New Fund as well as an explanation of the methodology utilized in allocating various expenses among the funds in the Calamos fund complex and the Adviser's other business units.
Other Benefits Derived from the Relationship with the New Fund. The Board considered other benefits that could accrue to the Adviser and its affiliates from their relationship with the New Fund. The Board concluded that while the Adviser may potentially benefit from its relationship with the New Fund in ways other than the proposed fees payable by the New Fund, the New Fund also may benefit from its relationship with the Adviser in ways other than the services to be provided by the Adviser and its affiliates pursuant to its agreement with the New Fund and the proposed fees payable by the New Fund.
In light of all the information presented, and after full consideration of the above factors as well as other factors that were instructive in their consideration, the Trustees, including all of the Independent Trustees, concluded that the Trust's proposed management agreement with the Adviser with respect to the New Fund was, and its approval would be, in the best interest of the New Fund and its prospective shareholders.
www.calamos.com
39
Tax Information (Unaudited)
We are providing this information as required by the Internal Revenue Code (Code). The amounts shown may differ from those elsewhere in this report due to differences between tax and financial reporting requirements. In February 2025, shareholders will receive Form 1099-DIV which will include their share of qualified dividends and capital gains distributed during the calendar year 2024. Shareholders are advised to check with their tax advisors for information on the treatment of these amounts on their individual income tax returns.
Under Section 852(b)(3)(C) of the Code, the Funds hereby designate the following amounts as capital gain dividends for the fiscal period ended July 31, 2024:
FUND | | CAPITAL GAINS DIVIDENDS | |
Convertible Equity Alternative ETF | | $ | — | | |
CEF Income & Arbitrage ETF | | | — | | |
Alternative Nasdaq® & Bond ETF | | | — | | |
S&P 500® Structured Alt Protection ETFTM—May | | | — | | |
S&P 500® Structured Alt Protection ETFTM—July | | | — | | |
Nasdaq-100® Structured Alt Protection ETFTM—June | | | — | | |
Russell 2000® Structured Alt Protection ETFTM—July | | | — | | |
Under Section 854(b)(2) of the Code, the Funds hereby designate the following amounts, or the maximum amount allowable under the Code, as qualified dividends for the fiscal period ended July 31, 2024:
FUND | | QUALIFIED DIVIDENDS | |
Convertible Equity Alternative ETF | | $ | 64,225 | | |
CEF Income & Arbitrage ETF | | | — | | |
Alternative Nasdaq® & Bond ETF | | | — | | |
S&P 500® Structured Alt Protection ETFTM—May | | | — | | |
S&P 500® Structured Alt Protection ETFTM—July | | | — | | |
Nasdaq-100® Structured Alt Protection ETFTM—June | | | — | | |
Russell 2000® Structured Alt Protection ETFTM—July | | | — | | |
Under Section 854(b)(2) of the Code, the Funds hereby designate the following percentage amounts of the ordinary income dividends as income qualifying for the dividends received deduction for the period ended July 31, 2024:
FUND | | DIVIDENDS RECEIVED DEDUCTION | |
Convertible Equity Alternative ETF | | | 43 | % | |
CEF Income & Arbitrage ETF | | | 98 | | |
Alternative Nasdaq® & Bond ETF | | | 100 | | |
S&P 500® Structured Alt Protection ETFTM—May | | | — | | |
S&P 500® Structured Alt Protection ETFTM—July | | | — | | |
Nasdaq-100® Structured Alt Protection ETFTM—June | | | — | | |
Russell 2000® Structured Alt Protection ETFTM—July | | | — | | |
ETF FAMILY OF FUNDS ANNUAL REPORT
40
Item 8: Changes in and Disagreements with Accountants for Open-End Management Investment Companies.
Not applicable.
Item 9: Proxy Disclosures for Open-End Management Investment Companies.
Not applicable.
Item 10: Remuneration Paid to Directors, Officers, and Others of Open-End Management Investment Companies.
1. Aggregate remuneration paid to all trustees for the period covered by the report was $68,297 for services provided to the Calamos ETF Trust. Such remuneration only is paid to independent (“non-interested”) trustees. John P. Calamos, Sr., the trustee who is an “interested person” of the Calamos ETF Trust, does not receive remuneration for services provided to the Calamos ETF Trust.
2. Not applicable.
3. Mark J. Mickey, Chief Compliance Officer of the Calamos ETF Trust, is the only officer who receives compensation from the Calamos ETF Trust. During the period covered by the report, Mr. Mickey was paid $5,101 for services provided to the Calamos ETF Trust.
4. Not applicable.
Item 11: Statement Regarding Basis for Approval of Investment Advisory Contracts.
Statement Regarding Basis for Approval of Investment Advisory Contracts – Included as part of the financial statements filed under Item 7 of the N-CSR.
Item 12: Disclosure of Proxy Voting Policies and Procedures for Closed-End Management Investment Companies.
Not applicable.
Item 13: Portfolio Managers of Closed-End Management Investment Companies.
Not applicable.
Item 14: Purchase of Equity Securities by Closed-End Management Investment Company and Affiliated Purchasers.
Not applicable.
Item 15: Submission of Matters to a Vote of Security Holders.
There have been no material changes to the procedures by which the shareholders may recommend nominees to the registrant’s Board of Trustees.
Item 16: Controls and Procedures.
a) The registrant’s principal executive officer and principal financial officer have evaluated the registrant’s disclosure controls and procedures within 90 days of this filing and have concluded that the registrant’s disclosure controls and procedures were effective, as of that date, in ensuring that information required to be disclosed by the registrant in this Form N-CSR was recorded, processed, summarized, and timely reported.
b) There were no changes in the registrant’s internal controls over financial reporting (as defined in Rule 30a-3(d) under the Investment Company Act of 1940) that occurred during the period covered by this report that has materially affected, or is reasonably likely to materially affect, the registrant’s internal control over financial reporting.
Item 17: Disclosure of Securities Lending Activities for Closed-End Management Investment Companies.
Not applicable.
Item 18: Recovery of Erroneously Awarded Compensation.
Not applicable.
Item 19: Exhibits.
(a)(1) Code of Ethics.
(a)(3)(i) Certifications filed herewith.
(a)(3)(ii) Certifications field herewith.
Pursuant to the requirements of the Securities Exchange Act of 1934 and the Investment Company Act of 1940, the registrant has duly caused this report to be signed on its behalf by the undersigned, thereunto duly authorized.
SIGNATURES
Pursuant to the requirements of the Securities Exchange Act of 1934 and the Investment Company Act of 1940, the registrant has duly caused this report to be signed on its behalf by the undersigned, thereunto duly authorized.
Calamos ETF Trust
| By: | /s/ John P. Calamos, Sr. | |
| Name: | John P. Calamos, Sr. | |
| Title: | Principal Executive Officer | |
| Date: | September 24, 2024 | |
| By: | /s/ Thomas E. Herman | |
| Name: | Thomas E. Herman | |
| Title: | Principal Financial Officer | |
| Date: | September 24, 2024 | |
Pursuant to the requirements of the Securities Exchange Act of 1934 and the Investment Company Act of 1940, this report has been signed by the following persons on behalf of the registrant and in the capacities and on the dates indicated.
| By: | /s/ John P. Calamos, Sr. | |
| Name: | John P. Calamos, Sr. | |
| Title: | Principal Executive Officer | |
| Date: | September 24, 2024 | |
| By: | /s/ Thomas E. Herman | |
| Name: | Thomas E. Herman | |
| Title: | Principal Financial Officer | |
| Date: | September 24, 2024 | |