UNITED STATES
SECURITIES AND EXCHANGE COMMISSION
Washington, D.C. 20549
FORM N-CSR
CERTIFIED SHAREHOLDER REPORT OF REGISTERED
MANAGEMENT INVESTMENT COMPANIES
INVESTMENT COMPANY ACT FILE NUMBER: 811-22887
(EXACT NAME OF REGISTRANT AS SPECIFIED IN CHARTER)
|
2020 Calamos Court, Naperville, Illinois 60563-2787 |
(ADDRESS OF PRINCIPAL EXECUTIVE OFFICES)
|
John P. Calamos, Sr., President Calamos Advisors LLC 2020 Calamos Court Naperville, Illinois 60563-2787 |
(NAME AND ADDRESS OF AGENT FOR SERVICE)
REGISTRANT’S TELEPHONE NUMBER, INCLUDING AREA CODE: (630) 245-7200
DATE OF FISCAL YEAR END: October 31, 2015
DATE OF REPORTING PERIOD: November 1, 2014 through October 31, 2015
Item 1. Report to Shareholders

Experience and Foresight
About Calamos Investments
For over 35 years, we have helped investors like you manage and build wealth to meet long-term objectives. Because investors have different time horizons, risk tolerances and goals, we offer funds to suit a variety of asset allocation needs. Our mutual funds, closed-end funds and ETF are comprised of equity, fixed income, convertible and alternative funds. We offer U.S. funds as well as global and international choices.
We are dedicated to helping our clients build and protect wealth. We understand when you entrust us with your assets, you also entrust us with your achievements, goals and aspirations. We believe we best honor this trust by making investment decisions guided by integrity, by discipline and by our conscientious research.
We believe an active, risk-conscious approach is essential for wealth creation. In the 1970s, we pioneered the use of convertible securities as a means to control risk in volatile markets. We followed with strategies that combine convertibles and stocks, with the aim of participating in equity market upside with potentially less volatility than an all-stock portfolio. In the 1990s, we introduced our first stock fund, which invests in growth companies both large and small. Across our funds, our investment process seeks to manage risk at multiple levels and draws upon our experience investing through many market cycles. In a rapidly changing environment, we believe that this active management is essential.
We are global in our perspective. We believe globalization offers tremendous opportunities for countries and companies all over the world. In our U.S., global and international portfolios, we are seeking to capitalize on the potential growth of the global economy.
We believe there are opportunities in all markets. Our history traces back to the 1970s, a period of significant volatility and economic concerns. We have invested through multiple market cycles, each with its own challenges. Out of this experience comes our belief that the flipside of volatility is opportunity.
Letter to Shareholders

JOHN P. CALAMOS, SR.
CEO and Global Co-CIO
Dear Fellow Shareholder,
Welcome to your annual report for the 12-month period ended October 31, 2015. In this report, you will find commentary from the management team of the Calamos Focus Growth ETF (the “Fund”) as well as a listing of portfolio holdings, financial statements and highlights, and detailed information about the Fund’s performance and positioning. I invite you to review not only the commentary for this Fund, but also to discuss with your financial advisor if there are other Calamos Funds that could be suitable for your asset allocation.
Active, Innovative Client Solutions
The Focus Growth ETF is the company’s first active equity exchange-traded fund (ETF) and one of the industry’s first actively managed equity ETFs. Our decision to offer the Fund—particularly at this early juncture in the market’s development—is right in line with our history of anticipating the needs of investors and offering innovative solutions to satisfy those needs. From our convertible strategy launched in 1979 to our market neutral income strategy launched in 1990 and our long/short strategy launched in 2013, we believe Calamos has been a leader in developing innovative solutions that help our clients navigate the evolving investment landscape.
Market Environment
Investor sentiment shifted back and forth from a “risk-on” to “risk-off” mindset throughout the period. Markets were heartened by factors including continued global accommodative monetary policy, declining U.S. unemployment and healthy consumer activity, and encouraging economic data points in the euro zone. However, investors remained concerned about global monetary policy, including the Federal Reserve’s interest rate strategy. Fears of slowing global growth, especially in China, also contributed to investor anxiety, as did political concerns, which ranged from long-standing global geopolitical tensions to future health care legislation in the U.S.
The U.S. market advanced with the S&P 500 Index gaining 5.20%. Growth-oriented stocks far surpassed value-oriented stocks, as the Russell 3000 Growth Index returned 8.72% versus 0.24% for the Russell 3000 Value Index.
| | | | | | |
| | CALAMOS FOCUS GROWTH ETF ANNUAL REPORT | | | 1 | |
Letter to Shareholders
Outlook
Looking forward, our view is that market volatility is likely to remain high due to global economic, fiscal and monetary policy unknowns. Nonetheless, our team sees many opportunities for investors who take a long-term approach. Our positioning continues to reflect a focus on risk management, as we carefully assess the impact and interaction of top-down macroeconomic factors, market sentiment, and company-specific characteristics.
While we do not expect robust economic expansion and remain concerned about policies that discourage global entrepreneurship, we believe global and U.S. GDP can grow at a slow pace in 2016. Against this backdrop, our view is that stocks can continue to advance, with growth stocks remaining especially attractive. We believe that markets may well experience spikes in short-term volatility in the wake of Federal Reserve interest rate increases, but we do not believe a more normal U.S. interest rate environment is likely to create longer-term headwinds for well-run businesses.
Also, we believe a more normal interest rate environment can fuel stronger economic growth. For example, in an expanding economy, higher interest rates can provide greater incentive for banks to extend loans to small businesses because lending activities would be more profitable. Small businesses are an important engine of job growth, so with increased access to capital, small businesses are better positioned to grow and hire more people.
In Closing
We thank you for your continued trust in Calamos Investments. We are honored you have chosen us to help you achieve your financial objectives. If you’d like to learn more about our views on the markets and investment opportunities, please visit us at www.calamos.com for commentary, blogs and videos.
Sincerely,

John P. Calamos, Sr.
Founder, CEO and Global Co-CIO
| | | | |
| 2 | | CALAMOS FOCUS GROWTH ETF ANNUAL REPORT | | |
Letter to Shareholders
Before investing carefully consider the fund’s investment objectives, risks, charges and expenses. Please see the prospectus and summary prospectus containing this and other information or call 1-844-922-5226. Read it carefully before investing.
The S&P 500 Index is an unmanaged index generally considered representative of the U.S. stock market. The Russell 3000 Growth Index measures the performance of the broad growth segment of the U.S. equity universe. It includes those Russell 3000 companies with higher price-to-book ratios and higher forecasted growth values. The Russell 3000 Value Index measures the performance of the broad value segment of the U.S. equity universe. It includes those Russell 3000 companies with lower price-to-book ratios and lower forecasted growth values. Unmanaged index returns assume reinvestment of any and all distributions and, unlike fund returns, do not reflect fees, expenses or sales charges. Investors cannot invest directly in an index.
The information contained herein is based on internal research derived from various sources and does not purport to be statements of all material facts relating to the securities mentioned. The information contained herein, while not guaranteed as to the accuracy or completeness, has been obtained from sources we believe to be reliable. There are certain risks involved with investing in convertible securities in addition to market risk, such as call risk, dividend risk, liquidity risk and default risk, that should be carefully considered prior to investing. This information is being provided for informational purposes only and should not be considered investment advice or an offer to buy or sell any security in the portfolio.
This report is intended for informational purposes only and should not be considered investment advice.
| | | | | | |
| | CALAMOS FOCUS GROWTH ETF ANNUAL REPORT | | | 3 | |
Investment Team Discussion
OVERVIEW
The Fund invests in a select portfolio of equities issued by “blue chip” U.S. companies that offer opportunities for growth.
KEY FEATURES
| | ¡ | | Active management utilizing over 20 years of extensive research experience in growth investing | |
| | ¡ | | A compact portfolio consisting of only those large cap stocks in which we have the greatest confidence of sustained growth | |
| | ¡ | | Stress company fundamentals, including global presence, strong and/or accelerated earnings growth, and solid, returns on invested capital | |
PORTFOLIO FIT
The Fund is a core growth equity allocation option centered on a compact portfolio of large cap stocks.
FUND TICKER SYMBOL
CFGE
CALAMOS FOCUS GROWTH ETF
INVESTMENT TEAM DISCUSSION
How has the Fund performed?
For the 12-month period ended October 31, 2015, the Fund gained 4.86% on a market price basis and 5.36% on a net asset value (NAV) basis versus a return of 5.20% for the S&P 500 Index and a gain of 9.18% for the Russell 1000 Growth Index.
The Fund performed well on an absolute basis and stayed in-line with the broad equity market, although it did not capture the full strength of the growth equity market. The Fund performed along with the Russell 1000 Growth Index throughout the majority of the period, but it was unable to keep up with the benchmark in October when cyclical and lower-quality companies rallied off the September lows.
Since its inception on July 14, 2014, the Fund has returned 6.57% on a NAV and market basis versus a return of 6.10% for the S&P 500 Index and a 9.66% return for the Russell 1000 Growth Index.
SINCE INCEPTION MARKET PRICE AND NAV HISTORY THROUGH 10/31/15
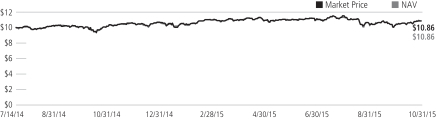
Performance data quoted represents past performance, which is no guarantee of future results. Current performance may be lower or higher than the performance quoted.
What factors influenced performance?
The markets followed a mostly range-bound pattern during the first nine months of the period, but not without bouts of volatility. A slide in oil prices and weakness within China’s economy were countered by robust U.S. labor and housing markets as well as steady corporate earnings. The biggest market move was made in the later months as concerns about China’s weakening economy and its currency devaluation ripped through global markets, sending stocks sharply lower in August and September. Equities bounced in October, but it was led by beaten-down commodity-related names and other lower-quality risk assets, which rallied strongly from their late summer lows and staged a comeback.
Positioning and selection within health care, especially in health care equipment and biotechnology, held back returns the most during the period versus the Russell 1000 Growth Index. We believe that innovative and competitive companies within the sector offer a desirable combination of growth catalysts, quality characteristics and strong fundamentals. Also, an underweight stance and selection in consumer staples, including holdings in packaged foods and meats and food retail, also hindered results.
Selection in asset management and custody banks aided relative performance in the financials sector, which contributed the most in the period. Also, an underweight stance and good relative selection within industrials (railroads) were beneficial. We are
| | | | |
| 4 | | CALAMOS FOCUS GROWTH ETF ANNUAL REPORT | | |
Investment Team Discussion
opportunistic in evaluating investments within the sector. Some industries have recently come under pressure from falling commodity prices and slowing growth from emerging economies, especially from the slowdown in China.
How is the Fund positioned?
We favor opportunities within the information technology, consumer discretionary and health care sectors. We believe that our holdings will benefit from secular themes such as mobility and innovation, open access to information and entertainment, productivity enhancements and global infrastructure demand. We are mindful of valuations and have looked to reduce higher valued names in light of a more volatile market. In addition to seeking out reasonable valuations, we favor companies with higher quality attributes and the ability to grow earnings even in a slow-growth economic environment. We see opportunities among companies tied to the U.S. consumer, social media and Internet security. We are concerned about companies that are dependent on commodity prices and emerging market demand.
Among selected changes in the period, we added to the information technology sector through holdings that we believe have attractive fundamentals, growth prospects and security-specific factors. Companies we purchased are in the systems software, data processing and outsourced services, and application software industries. We also increased the Fund’s weighting to consumer staples and health care. We reduced allocations to industrials, energy and financials. We hold a cautious view towards the industrials and energy sectors in particular because of pressures from falling commodity prices, decreased corporate earnings and declining growth catalysts.
What closing thoughts do you have for Fund shareholders?
Our focus for growth equities remains on strong fundamentals, sustainable business models and reasonable valuations. We see good opportunities tied to the U.S. consumer as well as within many industries within information technology and health care. U.S. households have improved their finances and reduced their debt burden this year, giving them the ability to spend. We are wary of companies more dependent upon commodity prices and emerging market demand.
We believe the U.S. stock market went through a reset period, not a precursor to a recession, as investors contemplated the prospect of slowing global economic growth. We expect elevated volatility to persist over the next several quarters, due to both well-entrenched concerns as well as growing uncertainty around fiscal policy and the 2016 election. We further believe that heightened volatility is likely to remain within the markets going forward, although certain dislocations may provide meaningful investment opportunities given our longer-term, active approach.
| | | | |
| SECTOR WEIGHTINGS | |
Information Technology | | | 36.9 | % |
Consumer Discretionary | | | 22.8 | |
Health Care | | | 15.5 | |
Consumer Staples | | | 5.9 | |
Industrials | | | 3.9 | |
Financials | | | 2.9 | |
Telecommunication Services | | | 2.2 | |
Energy | | | 1.4 | |
Sector weightings are subject to change daily and are calculated as a percentage of net assets. The table excludes cash or cash equivalents, any government/sovereign bonds or broad based index hedging securities the Fund may hold.
| | | | | | |
| | CALAMOS FOCUS GROWTH ETF ANNUAL REPORT | | | 5 | |
Investment Team Discussion
AVERAGE ANNUAL TOTAL RETURN AS OF 10/31/15
| | | | | | | | |
TOTAL RETURN* Inception 7/14/14 | |
| | | 1 YEAR | | | SINCE
INCEPTION** | |
| On Market Price | | | 4.86% | | | | 6.57% | |
| On NAV | | | 5.36% | | | | 6.57% | |
Performance data quoted represents past performance, which is no guarantee of future results. Current performance may be lower or higher than the performance quoted. You can purchase or sell shares daily. Like any other stock, market price will fluctuate with the market. Upon sale, your shares may have a market price that is above or below NAV and may be worth more or less than your original investment. Shares of exchange-traded funds frequently trade at a market price that is below their NAV. Market performance is determined using the bid/ask midpoint at 4:00pm Eastern time, when the NAV is typically calculated. Market performance does not represent the returns you would receive if you traded shares at other times. For the fund’s most recent month end performance, please call 844.922.5226 or visit www.calamos.com. As of the prospectus dated 3/1/15, the Fund’s gross expense ratio is 2.50%. The Fund’s investment advisor has contractually agreed to reimburse Fund expenses through March 1, 2017, to the extent necessary so that Total Annual Operating Expenses (excluding taxes, brokerage commissions, acquired fund fees and expenses and extraordinary expenses, if any) are limited to 0.90% annually.
| * | Total return measures net investment income and net realized gain or loss from Fund investments, and change in net unrealized appreciation or depreciation, assuming reinvestment of income and net realized gains distributions. |
| ** | Annualized since inception. |
NOTES:
The S&P 500 Index is an unmanaged index generally considered representative of the U.S. stock market.
The Russell 1000® Growth Index measures the performance of the large-cap growth segment of the U.S. equity universe. It includes those Russell 1000 companies with higher price-to-book ratios and higher forecasted growth values.
Index returns assume reinvestment of dividends and do not reflect deduction of fees and expenses. It is not possible to invest directly in an index.
| | | | |
| 6 | | CALAMOS FOCUS GROWTH ETF ANNUAL REPORT | | |
Expense Overview
EXPENSE OVERVIEW
As a shareholder of an ETF, you incur two types of costs. You incur:
1) Transaction costs, including brokerage commissions paid on purchases and sales for fund shares.
2) Ongoing costs, including management fees, and other fund expenses.
The examples in this report are based on an investment of $1,000 made at the beginning of the period and held for the entire period from May 1, 2015 to October 31, 2015. It is intended to help you understand the ongoing costs associated with investing in each mutual fund and to compare these costs with the ongoing costs of investing in other mutual funds.
There are two parts of each Fund’s chart:
Actual
In this part of the chart, you’ll see the actual expenses you would have paid on a $1,000 investment made at the beginning of the period and held for the entire period in each fund from May 1, 2015 to October 31, 2015, the period covered by this report. This chart also shows the actual returns, after expenses, you would have earned during that time. This chart can help you estimate your own expenses. For example, if you invested $8,600 in Class A shares of the fund, simply divide $8,600 by $1,000, then multiply that result by the figure in the Actual Expenses per $1,000 row. In this example, you would multiply 8.6 times the figure.
Hypothetical
In this part of the chart, you’ll see the hypothetical expenses you would have paid on a $1,000 investment from May 1, 2015 to October 31, 2015, and the hypothetical returns, after expenses, you would have earned during that time. The Securities and Exchange Commission (SEC) has established the guidelines for this chart, including the assumed 5% annual rate of return before expenses, which is what you’ll see in the chart. Note that this chart will not help you determine your own expenses, but will help you compare expenses of the fund you own to the expenses of another fund since the information for that fund should be calculated using the same assumptions.
Please note that the expenses shown in the chart are meant to highlight your ongoing costs only and do not include any transactional costs, such as sales charges (loads), redemption fees or exchange fees. Therefore, the second line of the chart is useful in comparing ongoing costs only and will not help you determine the relative total costs of owning different funds. In addition, if these transaction costs were included, your costs would have been higher.
| | | | | | |
| | CALAMOS FOCUS GROWTH ETF ANNUAL REPORT | | | 7 | |
Expense Overview
The actual and hypothetical examples shown assume a $1,000 investment at the beginning of the period, May 1, 2015 and held through October 31, 2015.
| | | | |
Actual Expenses per $1,000* | | $ | 4.54 | |
| | | | |
Actual—Ending Balance | | $ | 1,000.00 | |
Hypothetical Expenses per $1,000* | | $ | 4.58 | |
Hypothetical—Ending Value | | $ | 1,020.67 | |
| | | | |
Annualized expense ratio(1) | | | 0.90 | % |
| * | Expenses are equal to the Fund’s annualized expense ratio, multiplied by the average account value over the period, multiplied by 184/365. |
| (1) | Annualized Expense Ratios are adjusted to reflect fee waiver. |
| | | | |
| 8 | | CALAMOS FOCUS GROWTH ETF ANNUAL REPORT | | |
Schedule of Investments October 31, 2015
| | | | | | | | | | |
NUMBER OF
SHARES | | | | | | | VALUE | |
| | COMMON STOCKS (91.5%) | |
| | | | | | Consumer Discretionary (22.8%) | |
| | 6,550 | | | | | Dollar General Corp. | | $ | 443,893 | |
| | 16,000 | | | | | Hilton Worldwide Holdings, Inc. | | | 399,840 | |
| | 7,970 | | | | | Home Depot, Inc. | | | 985,411 | |
| | 13,200 | | | | | Liberty Global, PLC - Class A# | | | 587,664 | |
| | 2,375 | | | | | Nike, Inc. - Class B | | | 311,196 | |
| | 367 | | | | | Priceline Group, Inc.# | | | 533,706 | |
| | 3,850 | | | | | PVH Corp. | | | 350,158 | |
| | 4,300 | | | | | Royal Caribbean Cruises, Ltd. | | | 422,905 | |
| | 12,200 | | | | | Starbucks Corp. | | | 763,354 | |
| | 1,625 | | | | | Tesla Motors, Inc.#^ | | | 336,261 | |
| | 3,325 | | | | | Tractor Supply Company^ | | | 307,197 | |
| | 9,050 | | | | | Walt Disney Company^ | | | 1,029,347 | |
| | | | | | | | | | |
| | | | | | | | | 6,470,932 | |
| | | | | | | | | | |
| | | | | | Consumer Staples (5.9%) | |
| | 10,500 | | | | | Mondelez International, Inc. - Class A | | | 484,680 | |
| | 24,300 | | | | | Reynolds American, Inc. | | | 1,174,176 | |
| | | | | | | | | | |
| | | | | | | | | 1,658,856 | |
| | | | | | | | | | |
| | | | | | Energy (1.4%) | |
| | 4,900 | | | | | Schlumberger, Ltd.^ | | | 382,984 | |
| | | | | | | | | | |
| | | | | | Financials (2.9%) | |
| | 1,900 | | | | | Intercontinental Exchange, Inc. | | | 479,560 | |
| | 9,100 | | | | | Realogy Holdings Corp.# | | | 355,810 | |
| | | | | | | | | | |
| | | | | | | | | 835,370 | |
| | | | | | | | | | |
| | | | | | Health Care (15.5%) | |
| | 5,600 | | | | | AbbVie, Inc. | | | 333,480 | |
| | 5,625 | | | | | Acadia Healthcare Company, Inc.# | | | 345,431 | |
| | 2,240 | | | | | Alexion Pharmaceuticals, Inc.#^ | | | 394,240 | |
| | 5,500 | | | | | Alkermes, PLC# | | | 395,560 | |
| | 4,970 | | | | | Celgene Corp.# | | | 609,869 | |
| | 9,850 | | | | | Cepheid# | | | 328,990 | |
| | 4,900 | | | | | Cerner Corp.# | | | 324,821 | |
| | 4,400 | | | | | HCA Holdings, Inc.# | | | 302,676 | |
| | 1,640 | | | | | Illumina, Inc.# | | | 234,979 | |
| | 2,575 | | | | | Shire, PLC | | | 584,654 | |
| | 12,700 | | | | | Zoetis, Inc. | | | 546,227 | |
| | | | | | | | | | |
| | | | | | | | | 4,400,927 | |
| | | | | | | | | | |
| | | Industrials (3.9%) | | | | |
| | 4,625 | | | | | Fortune Brands Home & Security, Inc. | | | 242,026 | |
| | 3,425 | | | | | Raytheon Company | | | 402,095 | |
| | 4,450 | | | | | United Parcel Service, Inc. - Class B^ | | | 458,439 | |
| | | | | | | | | | |
| | | | | | | | | 1,102,560 | |
| | | | | | | | | | |
| | | | | | Information Technology (36.9%) | |
| | 2,095 | | | | | Alphabet, Inc. - Class A# | | | 1,544,832 | |
| | | | | | | | | | |
NUMBER OF
SHARES | | | | | | | VALUE | |
| | 14,460 | | | | | Apple, Inc. | | $ | 1,727,970 | |
| | 6,425 | | | | | Cognizant Technology Solutions Corp. - Class A# | | | 437,607 | |
| | 2,130 | | | | | CoStar Group, Inc.# | | | 432,539 | |
| | 9,800 | | | | | Facebook, Inc. - Class A# | | | 999,306 | |
| | 10,100 | | | | | FireEye, Inc.#^ | | | 264,115 | |
| | 7,500 | | | | | IAC/InterActiveCorp | | | 502,575 | |
| | 21,450 | | | | | Microsoft Corp. | | | 1,129,128 | |
| | 5,500 | | | | | Red Hat, Inc.# | | | 435,105 | |
| | 9,700 | | | | | Sabre Corp. | | | 284,404 | |
| | 7,975 | | | | | Salesforce.com, Inc.# | | | 619,737 | |
| | 2,800 | | | | | Tableau Software Inc - Class A# | | | 235,088 | |
| | 6,850 | | | | | TE Connectivity, Ltd. | | | 441,414 | |
| | 12,660 | | | | | Visa, Inc. - Class A | | | 982,163 | |
| | 5,425 | | | | | Workday, Inc. - Class A# | | | 428,412 | |
| | | | | | | | | | |
| | | | | | | | | 10,464,395 | |
| | | | | | | | | | |
| | | | | | Telecommunication Services (2.2%) | |
| | 16,300 | | | | | T-Mobile USA, Inc.# | | | 617,607 | |
| | | | | | | | | | |
| | | | | | TOTAL COMMON STOCKS
(Cost $24,227,331) | | | 25,933,631 | |
| | | | | | | | | | |
| | SHORT TERM INVESTMENT (8.7%) | | | | |
| | 2,471,294 | | | | | Fidelity Prime Money Market Fund - Institutional Class (Cost $2,471,294) | | | 2,471,294 | |
| | | | | | | | | | |
| INVESTMENT OF CASH COLLATERAL FOR
SECURITIES LOANED (1.7%) | | | | |
| | 471,401 | | | | | J.P. Morgan U.S. Government Money Market Fund (Cost $471,401) | | | 471,401 | |
| | | | | | | | | | |
| TOTAL INVESTMENTS (101.9%)
(Cost $27,170,026) | | | 28,876,326 | |
| | | | | | | | | | |
| |
| PAYABLE UPON RETURN OF SECURITIES ON LOAN
(-1.7%) | | | (471,401 | ) |
| | | | | | | | | | |
| |
| | LIABILITIES, LESS OTHER ASSETS (-0.2%) | | | (58,559 | ) |
| | | | | | | | | | |
| |
| | NET ASSETS (100.0%) | | $ | 28,346,366 | |
| | | | | | | | | | |
NOTES TO SCHEDULE OF INVESTMENTS
| # | Non-income producing security. |
| ^ | Security, or portion of security, is on loan. |
| | | | | | |
| See accompanying Notes to Financial Statements | | CALAMOS FOCUS GROWTH ETF ANNUAL REPORT | | | 9 | |
Statement of Assets and Liabilities October 31, 2015
| | | | |
ASSETS | |
Investments in securities, at value (cost $27,170,026) | | $ | 28,876,326 | |
Due from investment advisor | | | 42,429 | |
Receivables: | | | | |
Accrued interest and dividends | | | 5,153 | |
Prepaid expenses | | | 792 | |
Other assets | | | 7,427 | |
Total assets | | | 28,932,127 | |
LIABILITIES | | | | |
Collateral for securities loaned | | | 471,401 | |
Payables: | | | | |
Affiliates: | | | | |
Investment advisory fees | | | 23,421 | |
Deferred compensation to trustees | | | 7,427 | |
Financial accounting fees | | | 270 | |
Trustees’ fees and officer compensation | | | 1,721 | |
Other accounts payable and accrued liabilities | | | 81,521 | |
Total liabilities | | | 585,761 | |
NET ASSETS | | $ | 28,346,366 | |
COMPOSITION OF NET ASSETS | | | | |
Paid in capital | | $ | 26,012,375 | |
Undistributed net investment income (loss) | | | 56,719 | |
Accumulated net realized gain (loss) on investments | | | 570,972 | |
Unrealized appreciation (depreciation) of investments | | | 1,706,300 | |
NET ASSETS | | $ | 28,346,366 | |
CLASS A SHARES | | | | |
Shares outstanding† | | | 2,610,000 | |
Net asset value and redemption price per share | | $ | 10.86 | |
| † | No par value; unlimited number of shares authorized. |
| | | | |
| 10 | | CALAMOS FOCUS GROWTH ETF ANNUAL REPORT | | See accompanying Notes to Financial Statements |
Statement of Operations Year Ended October 31, 2015
| | | | |
INVESTMENT INCOME | |
Dividends | | $ | 302,834 | |
Securities lending income | | | 5,317 | |
Total investment income | | | 308,151 | |
| |
EXPENSES | | | | |
Investment advisory fees | | | 280,139 | |
Audit fees | | | 65,795 | |
Legal fees | | | 46,320 | |
Printing and mailing fees | | | 34,177 | |
Accounting fees | | | 24,315 | |
Transfer agent fees | | | 23,460 | |
Custodian fees | | | 20,977 | |
Trustees’ fees and officer compensation | | | 13,847 | |
Registration fees | | | 9,473 | |
Financial accounting fees | | | 3,227 | |
Offering costs | | | 119,766 | |
Other | | | 14,796 | |
Total expenses | | | 656,292 | |
Less expense reductions | | | (404,167 | ) |
Net expenses | | | 252,125 | |
NET INVESTMENT INCOME (LOSS) | | | 56,026 | |
| |
REALIZED AND UNREALIZED GAIN (LOSS) | | | | |
Net realized gain (loss) from: | | | | |
Investments | | | 689,739 | |
Change in net unrealized appreciation/(depreciation) on: | | | | |
Investments | | | 677,258 | |
NET GAIN (LOSS) | | | 1,366,997 | |
NET INCREASE (DECREASE) IN NET ASSETS RESULTING FROM OPERATIONS | | $ | 1,423,023 | |
| | | | | | |
| See accompanying Notes to Financial Statements | | CALAMOS FOCUS GROWTH ETF ANNUAL REPORT | | | 11 | |
Statements of Changes in Net Assets
| | | | | | | | |
| | | YEAR
ENDED
OCTOBER 31,
2015 | | | PERIOD
ENDED
OCTOBER 31,
2014(a) | |
OPERATIONS | | | | | | | | |
Net investment income (loss) | | $ | 56,026 | | | $ | (559 | ) |
Net realized gain (loss) | | | 689,739 | | | | (123,618 | ) |
Change in unrealized appreciation/(depreciation) | | | 677,258 | | | | 1,029,042 | |
Net increase (decrease) in net assets resulting from operations | | | 1,423,023 | | | | 904,865 | |
| | |
DISTRIBUTIONS TO SHAREHOLDERS | | | | | | | | |
Net investment income | | | (7,424 | ) | | | — | |
Total distributions | | | (7,424 | ) | | | — | |
| | |
CAPITAL SHARE TRANSACTIONS | | | 525,272 | | | | 25,500,630 | |
TOTAL INCREASE (DECREASE) IN NET ASSETS | | | 1,940,871 | | | | 26,405,495 | |
| | |
NET ASSETS | | | | | | | | |
Beginning of year or period | | $ | 26,405,495 | | | $ | — | |
End of year | | | 28,346,366 | | | | 26,405,495 | |
| | |
SHARES CREATED AND REDEEMED | | | | | | | | |
Shares outstanding, beginning of period | | | 2,560,000 | | | | — | |
Shares created | | | 50,000 | | | | 2,560,000 | |
Shares outstanding, end of year or period | | | 2,610,000 | | | | 2,560,000 | |
Undistributed net investment income (loss) | | $ | 56,719 | | | $ | 12,968 | |
| (a) | Focus Growth ETF commenced operations on July 14, 2014. |
| | | | |
| 12 | | CALAMOS FOCUS GROWTH ETF ANNUAL REPORT | | See accompanying Notes to Financial Statements |
Notes to Financial Statements
Note 1 – Organization and Significant Accounting Policies
Organization. CALAMOS ETF TRUST, a Delaware statutory trust organized June 17, 2013, (the “Trust”), consists of a single series, Calamos Focus Growth ETF (the “Fund”), which commenced operations on July 14, 2014. The Trust is registered under the Investment Company Act of 1940 as amended (the “1940 Act”) as an open-end management investment company. The Fund seeks to achieve long-term capital growth.
Significant Accounting Policies. The financial statements have been prepared in conformity with accounting principles generally accepted in the United States of America (GAAP), which require management to make certain estimates and assumptions at the date of the financial statements. Actual results may differ from those estimates. Subsequent events, if any, through the date that the financial statements were issued have been evaluated in the preparation of the financial statements. The following summarizes the significant accounting policies of the Fund:
Fund Valuation. The valuation of the Fund’s investments is in accordance with policies and procedures adopted by and under the ultimate supervision of the board of trustees.
Fund securities that are traded on U.S. securities exchanges, except option securities, are valued at the official closing price, which is the last current reported sales price on its principal exchange at the time each Fund determines its net asset value (“NAV”). Securities traded in the over-the-counter market and quoted on The NASDAQ Stock Market are valued at the NASDAQ Official Closing Price, as determined by NASDAQ, or lacking a NASDAQ Official Closing Price, the last current reported sale price on NASDAQ at the time a Fund determines its NAV. When a last sale or closing price is not available, equity securities, other than option securities, that are traded on a U.S. securities exchange and other equity securities traded in the over-the-counter market are valued at the mean between the most recent bid and asked quotations on its principal exchange in accordance with guidelines adopted by the board of trustees. Each option security traded on a U.S. securities exchange is valued at the mid-point of the consolidated bid/ask quote for the option security, also in accordance with guidelines adopted by the board of trustees. Each over-the-counter option that is not traded through the Options Clearing Corporation is valued based on a quotation provided by the counterparty to such option under the ultimate supervision of the board of trustees.
Fixed income securities, certain convertible preferred securities, and non-exchange traded derivatives are normally valued by independent pricing services or by dealers or brokers who make markets in such securities. Valuations of such fixed income securities, certain convertible preferred securities, and non-exchange traded derivatives consider yield or price of equivalent securities of comparable quality, coupon rate, maturity, type of issue, trading characteristics and other market data and do not rely exclusively upon exchange or over-the-counter prices.
Trading on European and Far Eastern exchanges and over-the-counter markets is typically completed at various times before the close of business on each day on which the New York Stock Exchange (“NYSE”) is open. Each security trading on these exchanges or in over-the-counter markets may be valued utilizing a systematic fair valuation model provided by an independent pricing service approved by the board of trustees. The valuation of each security that meets certain criteria in relation to the valuation model is systematically adjusted to reflect the impact of movement in the U.S. market after the foreign markets close. Securities that do not meet the criteria, or that are principally traded in other foreign markets, are valued as of the last reported sale price at the time the Fund determines its NAV, or when reliable market prices or quotations are not readily available, at the mean between the most recent bid and asked quotations as of the close of the appropriate exchange or other designated time. Trading of foreign securities may not take place on every NYSE business day. In addition, trading may take place in various foreign markets on Saturdays or on other days when the NYSE is not open and on which the Fund’s NAV is not calculated.
If the pricing committee determines that the valuation of a security in accordance with the methods described above is not reflective of a fair value for such security, the security is valued at a fair value by the pricing committee, under the ultimate supervision of the board of trustees, following the guidelines and/or procedures adopted by the board of trustees.
The Fund also may use fair value pricing, pursuant to guidelines adopted by the board of trustees and under the ultimate supervision of the board of trustees, if trading in the security is halted or if the value of a security it holds is materially affected by events occurring before the Fund’s pricing time but after the close of the primary market or exchange on which the security is listed. Those procedures may utilize valuations furnished by pricing services approved by the board of trustees, which may be based on market transactions for comparable securities and various relationships between securities that are generally recognized by institutional
| | | | | | |
| | CALAMOS FOCUS GROWTH ETF ANNUAL REPORT | | | 13 | |
Notes to Financial Statements
traders, a computerized matrix system, or appraisals derived from information concerning the securities or similar securities received from recognized dealers in those securities.
When fair value pricing of securities is employed, the prices of securities used by the Fund to calculate its NAV may differ from market quotations or official closing prices. In light of the judgment involved in fair valuations, there can be no assurance that a fair value assigned to a particular security is accurate.
Investment Transactions. Investment transactions are recorded on a trade date basis as of October 31, 2015. Net realized gains and losses from investment transactions are reported on an identified cost basis. Interest income is recognized using the accrual method and includes accretion of original issue and market discount and amortization of premium. Dividend income is recognized on the ex-dividend date, except that certain dividends from foreign securities are recorded as soon as the information becomes available after the ex-dividend date.
Foreign Currency Translation. Values of investments and other assets and liabilities denominated in foreign currencies are translated into U.S. dollars using a rate quoted by a major bank or dealer in the particular currency market, as reported by a recognized quotation dissemination service.
The Fund does not isolate that portion of the results of operations resulting from changes in foreign exchange rates on investments from the fluctuations arising from changes in market prices of securities held. Such fluctuations are included with the net realized and unrealized gain or loss from investments.
Reported net realized foreign currency gains or losses arise from disposition of foreign currency, the difference in the foreign exchange rates between the trade and settlement dates on securities transactions, and the difference between the amounts of dividends, interest and foreign withholding taxes recorded on the ex-date or accrual date and the U.S. dollar equivalent of the amounts actually received or paid. Net unrealized foreign exchange gains and losses arise from changes (due to the changes in the exchange rate) in the value of foreign currency and other assets and liabilities denominated in foreign currencies held at year end.
Allocation of Expenses Among Funds. Expenses directly attributable to the Fund are charged to the Fund; certain other common expenses of Calamos Advisors Trust, Calamos Investment Trust, Calamos ETF Trust, Calamos Convertible Opportunities and Income Fund, Calamos Convertible and High Income Fund, Calamos Strategic Total Return Fund, Calamos Global Total Return Fund, Calamos Global Dynamic Income Fund and Calamos Dynamic Convertible and Income Fund are allocated proportionately among each Fund to which the expenses relate in relation to the net assets of each Fund or on another reasonable basis.
Income Taxes. No provision has been made for U.S. income taxes because the Trust’s policy is to continue to qualify as a regulated investment company under the Internal Revenue Code of 1986, as amended, and distribute to shareholders substantially all of the Fund’s taxable income and net realized gains.
Dividends and distributions paid to shareholders are recorded on the ex-dividend date. The amount of dividends and distributions from net investment income and net realized capital gains is determined in accordance with federal income tax regulations, which may differ from U.S. generally accepted accounting principles. To the extent these “book/tax” differences are permanent in nature, such amounts are reclassified within the capital accounts based on their federal tax-basis treatment. These differences are primarily due to differing treatments for foreign currency transactions, contingent payment debt instruments and methods of amortizing and accreting for fixed income securities. The financial statements are not adjusted for temporary differences.
The Fund recognized no liability for uncertain tax positions. A reconciliation is not provided as the beginning and ending amounts of unrecognized benefits are zero, with no interim additions, reductions or settlements.
Indemnifications. Under the Trust’s organizational documents, the Trust is obligated to indemnify its officers and trustees against certain liabilities incurred by them by reason of having been an officer or trustee of the Trust. In addition, in the normal course of business, the Trust may enter into contracts that provide general indemnifications to other parties. The Fund’s maximum exposure under these arrangements is unknown as this would involve future claims that may be made against the Fund that have not yet occurred. Currently, the Fund’s management expects the risk of material loss in connection to a potential claim to be remote.
| | | | |
| 14 | | CALAMOS FOCUS GROWTH ETF ANNUAL REPORT | | |
Notes to Financial Statements
Note 2 – Investment Adviser and Transactions With Affiliates or Certain Other Parties
Pursuant to an investment advisory agreement with Calamos Advisors LLC (“Calamos Advisors”), the Fund pays an annual fee, payable monthly, equal to 1.00% based on the average weekly managed assets.
Pursuant to a financial accounting services agreement, during the year the Fund paid Calamos Advisors a fee for financial accounting services payable monthly at the annual rate of 0.0175% on the first $1 billion of combined assets, 0.0150% on the next $1 billion of combined assets and 0.0110% on combined assets above $2 billion (for purposes of this calculation “combined assets” means the sum of the total average daily net assets of Calamos Advisors Trust, Calamos Investment Trust, Calamos ETF Trust and the total average weekly managed assets of Calamos Convertible and High Income Fund, Calamos Strategic Total Return Fund, Calamos Convertible Opportunities and Income Fund, Calamos Global Total Return Fund, Calamos Global Dynamic Income Fund and Calamos Dynamic Convertible and Income Fund). Financial accounting services include, but are not limited to, the following: managing expenses and expense payment processing; monitoring the calculation of expense accrual amounts; calculating, tracking and reporting tax adjustments on all assets; and monitoring trustee deferred compensation plan accruals and valuations. The Fund pays its pro rata share of the financial accounting services fee payable to Calamos Advisors based on its relative portion of combined assets used in calculating the fee.
The Fund reimburses Calamos Advisors for a portion of compensation paid to the Trust’s Chief Compliance Officer. This compensation is reported as part of the “Trustees’ fees and officer compensation” expense on the Statement of Operations.
A trustee and certain officers of the Trust are also officers and directors of CFS and Calamos Advisors. Such trustee and officers serve without direct compensation from the Trust.
The Trust has adopted a deferred compensation plan (the “Plan”). Under the Plan, a trustee who is not an “interested person” (as defined in the 1940 Act) and has elected to participate in the Plan (a “participating trustee”) may defer receipt of all or a portion of their compensation from the Trust. The deferred compensation payable to the participating trustee is credited to the trustee’s deferral account as of the business day such compensation would have been paid to the participating trustee. The value of amounts deferred for a participating trustee is determined by reference to the change in value of Class I shares of one or more funds of Calamos Investment Trust designated by the participant. The value of the account increases with contributions to the account or with increases in the value of the measuring shares, and the value of the account decreases with withdrawals from the account or with declines in the value of the measuring shares. Deferred compensation of $7,427 is included in “Other assets” on the Statement of Assets and Liabilities at October 31, 2015. The Fund obligation to make payments under the Plan is a general obligation of the Fund and is included in “Payable for deferred compensation to trustees” on the Statement of Assets and Liabilities at October 31, 2015.
Calamos Advisors has contractually agreed to limit the total annual fund operating expenses (excluding taxes, interest, short interest, short dividend expenses, brokerage commissions, acquired fund fees and expenses, and extraordinary expenses, if any) to 0.90% of average net assets. This expense limitation agreement is binding on Calamos Advisors through March 31, 2016. This agreement is not terminable by either party.
Note 3 – Investments
The cost of purchases and proceeds from sale of long-term investments for the year ended October 31, 2015 were as follows:
| | | | |
| Cost of purchases | | $ | 39,033,051 | |
| Proceeds from sales | | | 40,596,608 | |
The following information is presented on a federal income tax basis as of October 31, 2015. Differences between the cost basis under U.S. generally accepted accounting principles and federal income tax purposes are primarily due to temporary differences.
The cost basis of investments for federal income tax purposes at October 31, 2015 was as follows:
| | | | |
| Cost basis of investments | | $ | 27,194,732 | |
| | | | |
| Gross unrealized appreciation | | | 3,016,385 | |
| Gross unrealized depreciation | | | (1,334,791 | ) |
| | | | |
| Net unrealized appreciation (depreciation) | | $ | 1,681,594 | |
| | | | |
| | | | | | |
| | CALAMOS FOCUS GROWTH ETF ANNUAL REPORT | | | 15 | |
Notes to Financial Statements
Note 4 – Income Taxes
For the fiscal year ended October 31, 2015, the Fund recorded the following permanent reclassifications to reflect tax character. The results of operations and net assets were not affected by these reclassifications.
| | | | |
| Undistributed net investment income/(loss) | | $ | (4,851 | ) |
| Accumulated net realized gain/(loss) on investments | | | 4,851 | |
Distributions for the year/period ended October 31, 2015 and 2014 were characterized for federal income tax purposes as follows:
| | | | | | | | |
| | | YEAR ENDED
OCTOBER 31, 2015 | | | PERIOD ENDED
OCTOBER 31, 2014 | |
| Distributions paid from: | | | | | | | | |
| Ordinary income | | $ | 7,424 | | | $ | — | |
As of October 31, 2015, the components of accumulated earnings/(loss) on a tax basis were as follows:
| | | | |
| Undistributed ordinary income | | $ | 406,765 | |
| Undistributed capital gains | | | 253,280 | |
| | | | |
| Total undistributed earnings | | | 660,045 | |
| Accumulated capital and other losses | | | — | |
| Net unrealized gains/(losses) | | | 1,681,594 | |
| | | | |
| Total accumulated earnings/(losses) | | | 2,341,639 | |
| Other | | | (7,648 | ) |
| Paid-in capital | | | 26,012,375 | |
| | | | |
| Net assets applicable to common shareholders | | $ | 28,346,366 | |
| | | | |
Note 5 – Derivative Instruments
Foreign Currency Risk. The Fund may engage in portfolio hedging with respect to changes in currency exchange rates by entering into forward foreign currency contracts to purchase or sell currencies. A forward foreign currency contract is a commitment to purchase or sell a foreign currency at a future date at a negotiated forward rate. Risks associated with such contracts include, among other things, movement in the value of the foreign currency relative to the U.S. dollar and the ability of the counterparty to perform. To mitigate the counterparty risk, the Fund may enter into an International Swaps and Derivatives Association, Inc. Master Agreement (“ISDA Master Agreement”) or similar agreement with its derivative contract counterparties. An ISDA Master Agreement is a bilateral agreement between the Fund and a counterparty that governs over-the-counter derivatives and foreign exchange contracts and typically contains, among other things, collateral posting terms and netting provisions in the event of a default and/or termination event. Under an ISDA Master Agreement, the Fund may, under certain circumstances, offset with the counterparty certain derivative financial instrument’s payables and/or receivables with collateral held and/or posted and create one single net payment. The provisions of the ISDA Master Agreement typically permit a single net payment in the event of default (close-out netting), including the bankruptcy or insolvency of the counterparty. Generally, collateral is exchanged between the Fund and the counterparty and the amount of collateral due from the Fund or to a counterparty has to exceed a minimum transfer amount threshold before a transfer has to be made. To the extent amounts due to the Fund from its counterparties are not fully collateralized, contractually or otherwise, the Fund bears the risk of loss from counterparty nonperformance. For financial reporting purposes, the Fund does not offset derivative assets and derivative liabilities that are subject to netting arrangements in the Statement of Assets and Liabilities. The Fund’s net counterparty exposure is reflected in the counterparty table below. The net unrealized gain, if any, represents the credit risk to the Fund on a forward foreign currency contract. The contracts are valued daily at forward foreign exchange rates. The Fund realizes a gain or loss when a position is closed or upon settlement of the contracts. There were no open forward foreign currency contracts at October 31, 2015.
Equity Risk. The Fund may engage in option transactions and in doing so achieves similar objectives to what it would achieve through the sale or purchase of individual securities. A call option, upon payment of a premium, gives the purchaser of the option the right to buy, and the seller of the option the obligation to sell, the underlying security, index or other instrument at the exercise price. A put option gives the purchaser of the option, upon payment of a premium, the right to sell, and the seller the obligation to buy, the underlying security, index, or other instrument at the exercise price.
| | | | |
| 16 | | CALAMOS FOCUS GROWTH ETF ANNUAL REPORT | | |
Notes to Financial Statements
To seek to offset some of the risk of a potential decline in value of certain long positions, the Fund may also purchase put options on individual securities, broad-based securities indexes or certain exchange-traded funds (“ETFs”). The Fund may also seek to generate income from option premiums by writing (selling) options on a portion of the equity securities (including securities that are convertible into equity securities) in the Fund’s portfolio, on broad-based securities indexes, or certain ETFs.
When the Fund purchases an option, it pays a premium and an amount equal to that premium is recorded as an asset. When the Fund writes an option, it receives a premium and an amount equal to that premium is recorded as a liability. The asset or liability is adjusted daily to reflect the current market value of the option. If an option expires unexercised, the Fund realizes a gain or loss to the extent of the premium received or paid. If an option is exercised, the premium received or paid is recorded as an adjustment to the proceeds from the sale or the cost basis of the purchase. The difference between the premium and the amount received or paid on a closing purchase or sale transaction is also treated as a realized gain or loss. The cost of securities acquired through the exercise of call options is increased by premiums paid. The proceeds from securities sold through the exercise of put options are decreased by the premiums paid. Gain or loss on written options and purchased options is presented separately as net realized gain or loss on written options and net realized gain or loss on purchased options, respectively.
Options written by the Fund do not typically give rise to counterparty credit risk since options written obligate the Fund and not the counterparty to perform. Exchange traded purchased options have minimal counterparty credit risk to the Fund since the exchange’s clearinghouse, as counterparty to such instruments, guarantees against a possible default.
As of October 31, 2015, the Fund no had outstanding purchased options and/or written options during the fiscal year.
Note 6 – Securities Lending
The Fund may loan one or more of its securities to broker-dealers and banks. Any such loan must be secured by collateral in cash, cash equivalents, or securities maintained on a current basis in an amount at least equal to the value of the securities loaned by the Fund. Non-Cash collateral is generally comprised of securities issued or guaranteed by the U.S. government and its agencies. The Fund continues to receive the equivalent of the interest or dividends paid by the issuer on the securities loaned and also receive an additional return that may be in the form of a fixed fee or a percentage of the collateral. Upon receipt of cash collateral, the Fund’s securities lending agent invests the collateral into short term investments following investment guidelines approved by Calamos Advisors. The Fund records the investment of cash collateral as an asset and the value of the collateral as a liability on the Statement of Assets and Liabilities. If the value of the invested collateral declines below the value of the collateral deposited by the borrower, the Fund will record unrealized depreciation equal to the decline in value of the invested collateral. Non-cash collateral is accepted and held in accordance with the securities lending agreement and is not reinvested or included in the Statement of Asset and Liabilities, as the Fund does not exercise direct control over the securities.
The Fund may pay reasonable fees to persons unaffiliated with the Fund for services in arranging these loans. The Fund has the right to call a loan and obtain the securities loaned at any time. The Fund does not have the right to vote the securities during the existence of the loan but could call the loan in an attempt to permit voting of the securities in certain circumstances. Upon return of the securities loaned, the cash, cash equivalent, or securities collateral will be returned to the borrower. In the event of bankruptcy or other default of the borrower, the Fund could experience both delays in liquidating the loan collateral or recovering the loaned securities and losses, including (a) possible decline in the value of the collateral or in the value of the securities loaned during the year while the Fund seeks to enforce its rights thereto, (b) possible subnormal levels of income and lack of access to income during this year, and (c) the expenses of enforcing its rights. In an effort to reduce these risks, the Fund’s security lending agent monitors and reports to Calamos Advisors on the creditworthiness of the firms to which the Fund lends securities.
At October 31, 2015, the Fund held securities valued at $2,379,104 that were on loan to broker-dealers and banks. The Fund also held cash collateral that was invested in short term investments of $471,401 and reflected a corresponding liability for such collateral of $471,401, and held non-cash collateral valued at $1,979,606.
| | | | | | |
| | CALAMOS FOCUS GROWTH ETF ANNUAL REPORT | | | 17 | |
Notes to Financial Statements
Note 7 – Fair Value Measurement
Various inputs are used to determine the value of the Fund’s investments. These inputs are categorized into three broad levels as follows:
| | • | | Level 1 – Prices are determined using inputs from unadjusted quoted prices from active markets (including securities actively traded on a securities exchange) for identical assets. |
| | • | | Level 2 – Prices are determined using significant observable market inputs other than unadjusted quoted prices, including quoted prices of similar securities, fair value adjustments to quoted foreign securities, interest rates, credit risk, prepayment speeds, and other relevant data. |
| | • | | Level 3 – Prices reflect unobservable market inputs (including the Fund’s own judgments about assumptions market participants would use in determining fair value) when observable inputs are unavailable. |
Debt securities are valued based upon evaluated prices received from an independent pricing service or from a dealer or broker who makes markets in such securities. Pricing services utilize various observable market data and as such, debt securities are generally categorized as Level 2. The levels are not necessarily an indication of the risk or liquidity of the Fund’s investments. Transfers between the levels for investment securities or other financial instruments are measured at the end of the reporting period.
The following is a summary of the inputs used in valuing the Fund’s holdings at fair value:
| | | | | | | | | | | | | | | | |
| | | LEVEL 1 | | | LEVEL 2 | | | LEVEL 3 | | | TOTAL | |
| Assets: | | | | | | | | | | | | | | | | |
Common Stocks U.S. | | $ | 25,933,631 | | | $ | — | | | $ | — | | | $ | 25,933,631 | |
Short Term Investment | | | 2,471,294 | | | | — | | | | — | | | | 2,471,294 | |
Investment of Cash Collateral For Securities Loaned | | | 471,401 | | | | — | | | | — | | | | 471,401 | |
| | | | |
| Total | | $ | 28,876,326 | | | $ | — | | | $ | — | | | $ | 28,876,326 | |
| | | | |
| Liabilities: | | | | | | | | | | | | | | | | |
Collateral For Securities Loaned | | $ | 471,401 | | | $ | — | | | $ | — | | | $ | 471,401 | |
| | | | |
| Total | | $ | 471,401 | | | $ | — | | | $ | — | | | $ | 471,401 | |
| | | | |
Note 8 – Capital Share Transactions
Shares are issued and redeemed by the Fund only in creation units of 50,000 shares. Such transactions generally are on an in-kind basis with a specified amount of cash used to adjust the transaction to the net asset value of the Fund on the transaction date.
Investors purchasing and redeeming creation units may pay a purchase transaction fee and a redemption transaction fee directly to the Fund’s transfer agent, State Street Bank and Trust Company, to offset transfer and other transaction costs associated with the issuance and redemption.
Transactions in shares for the Fund are disclosed in detail in the Statement of Changes in Net Assets.
| | | | |
| 18 | | CALAMOS FOCUS GROWTH ETF ANNUAL REPORT | | |
Financial Highlights
Selected data for a share outstanding throughout each year were as follows:
| | | | | | | | |
| | | Year Ended
October 31, 2015 | | | July 14, 2014*
through
October 31, 2014 | |
Net asset value, beginning of year | | | $10.31 | | | | $10.00 | |
Income from investment operations: | | | | | | | | |
Net investment income (loss) | | | 0.02 | | | | – | (a) |
Net realized and unrealized gain (loss) | | | 0.53 | | | | 0.31 | |
Total from investment operations | | | 0.55 | | | | 0.31 | |
Less distributions to common shareholders from: | | | | | | | | |
Net investment income | | | – | (a) | | | – | |
Total distributions | | | – | (a) | | | – | |
Net asset value, end of year | | | $10.86 | | | | $10.31 | |
Market value, end of year | | | $10.86 | | | | $10.36 | |
Total investment return based on:(b) | | | | | | | | |
Net asset value | | | 5.36% | | | | 3.10% | |
Market value | | | 4.86% | | | | 3.60% | |
Net assets, end of year (000) | | | $28,346 | | | | $26,405 | |
Ratios to average net assets applicable to common shareholders: | | | | | | | | |
Net expenses | | | 0.90% | | | | 0.90% | (c) |
Gross expenses prior to expense reductions and earnings credits | | | 2.34% | | | | 2.50% | (c) |
Net investment income (loss) | | | 0.20% | | | | (0.01% | )(c) |
Portfolio turnover rate(d) | | | 147.3% | | | | 29.6% | |
| * | Commencement of operations. |
| (a) | Amount equated to less than $0.005 per common share. |
| (b) | Total investment return is calculated assuming a purchase of common stock on the opening of the first day and a sale on the closing of the last day of the year/period reported. Dividends and distributions are assumed, for purposes of this calculation, to be reinvested at prices obtained under the Fund’s dividend reinvestment plan. Total return is not annualized for year/period less than one year. Brokerage commissions are not reflected. NAV per share is determined by dividing the value of the Fund’s portfolio securities, cash and other assets, less all liabilities, by the total number of common shares outstanding. The common share market price is the price the market is willing to pay for shares of the Fund at a given time. Common share market price is influenced by a range of factors, including supply and demand and market conditions. |
| (d) | Portfolio turnover is calculated for the time year/period presented and is not annualized for year/period of less than a year and does not include securities received or delivered from processing creations or redemption in-kind transactions. |
| | | | | | |
| | CALAMOS FOCUS GROWTH ETF ANNUAL REPORT | | | 19 | |
Report of Independent Registered Public Accounting Firm
To the Shareholders and Board of Trustees of Calamos ETF Trust
We have audited the accompanying statement of assets and liabilities of Calamos Focus Growth ETF, the sole portfolio constituting Calamos ETF Trust (the “Trust”), including the schedule of investments, as of October 31, 2015, and the related statement of operations for the year then ended, the statements of changes in net assets and the financial highlights for the year ended October 31, 2015 and the period from July 14, 2014 (commencement of operations) through October 31, 2014. These financial statements and financial highlights are the responsibility of the Trust’s management. Our responsibility is to express an opinion on these financial statements and financial highlights based on our audits.
We conducted our audits in accordance with the standards of the Public Company Accounting Oversight Board (United States). Those standards require that we plan and perform the audit to obtain reasonable assurance about whether the financial statements and financial highlights are free of material misstatement. The Trust is not required to have, nor were we engaged to perform, an audit of its internal control over financial reporting. Our audits included consideration of internal control over financial reporting as a basis for designing audit procedures that are appropriate in the circumstances, but not for the purpose of expressing an opinion on the effectiveness of the Trust’s internal control over financial reporting. Accordingly, we express no such opinion. An audit also includes examining, on a test basis, evidence supporting the amounts and disclosures in the financial statements, assessing the accounting principles used and significant estimates made by management, as well as evaluating the overall financial statement presentation. Our procedures included confirmation of securities owned as of December 31, 2015, by correspondence with the custodian and brokers; when replies were not received from brokers, we performed other auditing procedures. We believe that our audits provide a reasonable basis for our opinion.
In our opinion, such financial statements and financial highlights referred to above present fairly, in all material respects, the financial position of Calamos Focus Growth ETF of the Calamos ETF Trust as of October 31, 2015, the results of its operations for the year then ended, and the changes in its net assets, and the financial highlights for the year ended October 31, 2015 and the period from July 14, 2014 (commencement of operations) through October 31, 2014, in conformity with accounting principles generally accepted in the United States of America.

Chicago, Illinois
December 16, 2015
| | | | |
| 20 | | CALAMOS FOCUS GROWTH ETF ANNUAL REPORT | | |
Trustee Approval of Management Agreement (Unaudited)
The Board of Trustees of the Fund oversees the management of the Fund, and, as required by law, determines annually whether to continue the Fund’s management agreement with Calamos Advisors (the “Adviser”) pursuant to which the Adviser serves as the investment manager and administrator for the Fund. The “Independent Trustees,” who comprise more than 80% of the Board, have never been affiliated with the Adviser.
In connection with their most recent consideration regarding the continuation of the management agreement, the Trustees received and reviewed a substantial amount of information provided by the Adviser in response to detailed requests of the Independent Trustees and their independent legal counsel. In the course of their consideration of the agreement, the Independent Trustees were advised by their counsel and, in addition to meeting with management of the Adviser, they met separately in executive session with their counsel.
At a meeting held on July 16-17, 2015, based on their evaluation of the information referred to above and other information, the Trustees determined that the overall arrangements between the Fund and the Adviser were fair and reasonable in light of the nature, extent and quality of the services provided by the Adviser and its affiliates, the fees charged for those services and other matters that the Trustees considered relevant in the exercise of their business judgment. At that meeting, the Trustees, including all of the Independent Trustees, approved the continuation of the management agreement through July 31, 2016, subject to possible earlier termination as provided in the agreement.
In connection with its consideration of the management agreement, the Board considered, among other things: (i) the nature, extend and quality of the Adviser’s services, (ii) the investment performance of the Fund as well as performance information for comparable funds and other comparable clients of the Adviser, (iii) the fees and other expenses paid by the Fund as well as expense information for comparable funds and for other, comparable clients of the Adviser, (iv) the profitability of the Adviser and its affiliates from their relationship with the Fund, (v) the extent to which economies of scale may apply, and (vi) other benefits to the Adviser from its relationship with the Fund. In the Board’s deliberations, no single factor was responsible for the Board’s decision to approve continuation of the management agreement, and each Trustee may have afforded different weight to the various factors.
Nature, Extent and Quality of Services. The Board’s consideration of the nature, extent and quality of the Adviser’s services to the Fund took into account the knowledge gained from the Board’s meetings with the Adviser throughout the years. In addition, the Board considered: the Adviser’s long-term history of managing the Fund; the consistency of investment approach; the background and experience of the Adviser’s investment personnel responsible for managing the Fund; and the Adviser’s performance as administrator of the Fund, including, among other things, in the areas of brokerage selection, trade execution, compliance and shareholder communications. The Board also reviewed the Adviser’s resources and key personnel involved in providing investment management services to the Fund. The Board noted the personal investments that the Adviser’s key investment personnel have made in the Fund, which further aligns the interests of the Adviser and its personnel with those of the Fund’s shareholders. In addition, the Board considered compliance reports about the Adviser from the Fund’s Chief Compliance Officer. The Board concluded that the nature, extent and quality of the services provided by the Adviser to the Fund were appropriate and consistent with the management agreements and that the Fund was likely to continue to benefit from services provided under its management agreement with the Adviser.
Investment Performance of the Fund. The Board considered the Fund’s investment performance over various time periods, including how the Fund performed compared to the median performance of a group of comparable funds (the Fund’s “Category”) selected by Morningstar, an independent third party service provider (“Morningstar”). The performance periods considered by the Board ended on March 31, 2015.
The Board considered that the Fund commenced operations only in July 2014 and that, as of March 31, 2015, the Fund did not have a full year of investment performance to consider.
For the reasons noted above, the Board concluded that continuation of the management agreement for the Fund was in the best interest of the Fund and its shareholders.
Costs of Services Provided and Profits Realized by the Adviser. Using information provided by Morningstar, the Board evaluated the Fund’s actual management fee rate compared to the median management fee rate for other mutual funds similar in size, character and investment strategy (the Fund’s “Expense Group”), and the Fund’s total expense ratio, which reflects the total fees paid by an investor, compared to the median total expense ratio of the Fund’s Expense Group.
| | | | | | |
| | CALAMOS FOCUS GROWTH ETF ANNUAL REPORT | | | 21 | |
Trustee Approval of Management Agreement (Unaudited)
The Board considered that the Fund’s management fee rate and total expense ratio are both higher than the respective medians of the Fund’s Expense Group.
The Board also reviewed the Adviser’s management fee rates for its institutional separate accounts and for its sub-advised funds (for which the Adviser provides portfolio management services only). The Board took into account the Adviser’s assertion that although, generally, the rates of fees paid by institutional clients were lower than the rates of fees paid by the Fund, the differences reflected the Adviser’s greater level of responsibilities and significantly broader scope of services regarding the Fund, the more extensive regulatory obligations and risks associated with managing the Fund, and other financial considerations with respect to the Fund.
The Board also considered the Adviser’s costs in serving as the Fund’s investment adviser and manager, including costs associated with technology, infrastructure and compliance necessary to manage the Fund. The Board reviewed the Adviser’s methodology for allocating costs among the Adviser’s lines of business. The Board also considered information regarding the structure of the Adviser’s compensation program for portfolio managers, analysts and certain other employees and the relationship of such compensation to the attraction and retention of quality personnel. Finally, the Board reviewed information on the profitability of the Adviser in serving as the Fund’s investment manager and of the Adviser and its affiliates in all of their relationships with the Fund, as well as an explanation of the methodology utilized in allocating various expenses among the Fund and the Adviser’s other business units. Data was provided to the Board with respect to profitability, both on a pre- and post-marketing cost basis. The Board also reviewed the annual report of the Adviser’s parent company and discussed its corporate structure.
After its review of all the matters addressed, including those outlined above, the Board concluded that the rate of management fee paid by the Fund to the Adviser, in light of the nature and quality of the services provided, was reasonable and in the best interests of the Fund’s shareholders.
Economies of Scale and Fee Levels Reflecting Those Economies. In reviewing the Fund’s fees and expenses, the Trustees examined the potential benefits of economies of scale and whether any economies of scale should be reflected in the Fund’s fee structure. They noted that the Fund is a closed-end fund, and has therefore had a relatively stable asset base since commencement of operations and that there do not appear to have been any significant economies of scale realized since that time.
Other Benefits Derived from the Relationship with the Fund. The Board considered other benefits that accrue to the Adviser and its affiliates from their relationship with the Fund. The Board also considered the Adviser’s use of a portion of the commissions paid by the Fund on its portfolio brokerage transactions to obtain research products and services benefiting the Fund and/or other clients of the Adviser.
After full consideration of the above factors as well as other factors that were instructive in their consideration, the Trustees, including all of the Independent Trustees, concluded that the continuation of the management agreement with the Adviser was in the best interest of the Fund and its shareholders.
| | | | |
| 22 | | CALAMOS FOCUS GROWTH ETF ANNUAL REPORT | | |
Tax Information (Unaudited)
We are providing this information as required by the Internal Revenue Code (Code). The amounts shown may differ from those elsewhere in this report due to differences between tax and financial reporting requirements. In February 2016, shareholders will receive Form 1099-DIV which will include their share of qualified dividends and capital gains distributed during the calendar year 2015. Shareholders are advised to check with their tax advisors for information on the treatment of these amounts on their individual income tax returns.
Under Section 854(b)(2) of the Code, the Fund hereby designates $216,737 or the maximum amount allowable under the Code, as qualified dividends for the fiscal year ended October 31, 2015.
Under Section 854(b)(2) of the Code, the Fund hereby designates 49.96% of the ordinary income dividends as income qualifying for the corporate dividends received deduction for the fiscal year ended October 31, 2015.
| | | | | | |
| | CALAMOS FOCUS GROWTH ETF ANNUAL REPORT | | | 23 | |
Trustees and Officers (Unaudited)
The management of the Fund, including general supervision of the duties performed for the Fund under the investment management agreement between the Fund and Calamos Advisors, is the responsibility of its board of trustees. Each trustee elected will hold office for the terms noted below or until such trustee’s earlier resignation, death or removal; however, each trustee who is not an interested person of the Fund shall retire as a trustee at the end of the calendar year in which the trustee attains the age of 75 years.
The following table sets forth each trustee’s name, age at October 31, 2015, position(s) with the Fund, number of portfolios in the Calamos Fund Complex overseen, principal occupation(s) during the past five years and other directorships held, and date first elected or appointed.
| | | | | | |
| NAME AND AGE | | POSITION(S) WITH FUND | | PORTFOLIOS IN
FUND COMPLEX^
OVERSEEN | | PRINCIPAL OCCUPATION(S) DURING THE PAST 5 YEARS AND OTHER DIRECTORSHIPS |
| Trustees who are interested persons of the Fund: |
| | | |
| John P. Calamos, Sr., 75* | | Trustee and President (since 2014) | | 27 | | Chairman, CEO, and Global Co-Chief Investment Officer, Calamos Asset Management, Inc. (“CAM”), Calamos Investments LLC (“CILLC”), Calamos Advisors LLC and its predecessor (“Calamos Advisors”) and Calamos Wealth Management LLC (“CWM”), and previously Chief Executive Officer, Calamos Financial Services LLC and its predecessor (“CFS”) (until 2013); Director, CAM |
|
| Trustees who are not interested persons of the Fund: |
| | | |
| John E. Neal, 65 | | Trustee (since 2014) | | 27 | | Private investor; Director, Equity Residential Trust (publicly-owned REIT) and Creation Investment (private international microfinance company); Partner, Linden LLC (health care private equity) |
| | | |
| William R. Rybak, 64 | | Trustee (since 2014) | | 27 | | Private investor; Director, Christian Brothers Investment Services Inc. (since February 2010); Director, Private Bancorp (since December 2003); formerly Executive Vice President and Chief Financial Officer, Van Kampen Investments, Inc. and subsidiaries (investment manager); Director, Howe Barnes Hoefer & Arnett (until March 2011); Trustee, JNL Series Trust, JNL Investors Series Trust and JNL Variable Fund LLC**; Trustee, Lewis University (since October 2012) |
| | | |
| Stephen B. Timbers, 71 | | Lead Independent Trustee (since 2014) | | 27 | | Private investor |
| | | |
| David D. Tripple, 71 | | Trustee (since 2014) | | 27 | | Private investor; Trustee, Century Growth Opportunities Fund (since 2010), Century Shares Trust and Century Small Cap Select Fund (since January 2004)*** |
| | | |
| Virginia G. Breen, 51 | | Trustee (since 2015) | | 27
| | Trustee, Neuberger, Berman Fund Complex (since 2015)****; Trustee, Jones Lang LaSalle Income Property Trust (since 2004); Director, UBS A&Q Fund Complex (since 2008)*****; Partner, Chelsea Partners (since 2011) (advisory services); Director, Bank of America/US Trust Company (until 2015); General Partner, Sienna Ventures (until 2011); General Partner, Blue Rock Capital (until 2011) (venture capital fund) |
| | | |
| Theresa A. Hamacher, 55 | | Trustee (since 2015) | | 27
| | President, Versanture Consulting, LLC (since 2015); President, NICSA, Inc. (non-profit association for investment management industry participants) (until 2015) |
| * | Mr. Calamos is an “interested person” of the Trust as defined in the 1940 Act because he is an officer of the Trust and an affiliate of Calamos Advisors and CFS. |
| ** | Overseeing 104 portfolios in fund complex. |
| *** | Overseeing three portfolios in fund complex. |
| **** | Overseeing six portfolios in fund complex. |
| ***** | Overseeing eight portfolios in fund complex. |
| ^ | The Fund Complex consists of CALAMOS Investment Trust, CALAMOS Advisors Trust, CALAMOS ETF Trust, CALAMOS Convertible Opportunities and Income Fund, CALAMOS Convertible and High Income Fund, CALAMOS Strategic Total Return Fund, CALAMOS Global Total Return Fund, CALAMOS Global Dynamic Income Fund and CALAMOS Dynamic Convertible and Income Fund. |
The address of each trustee is 2020 Calamos Court, Naperville, Illinois 60563.
| | | | |
| 24 | | CALAMOS FOCUS GROWTH ETF ANNUAL REPORT | | |
Trustees and Officers (Unaudited)
Officers. The preceding table gives information about John P. Calamos, Sr., who is President and CEO of the Fund. The following table sets forth each other officer’s name, age at October 31, 2015, position with the Fund and date first appointed to that position, and principal occupation(s) during the past five years. Each officer serves until his or her successor is chosen and qualified or until his or her resignation or removal by the board of trustees.
| | | | |
| NAME AND AGE | | POSITION(S) WITH FUND | | PRINCIPAL OCCUPATION(S)
DURING THE PAST 5 YEARS |
| Nimish S. Bhatt, 52 | | Vice President and Chief Financial Officer (since 2014) | | Senior Vice President (since 2004), Chief Financial Officer (since May 2011), Head of Fund Administration (since November 2011), CAM, CILLC, Calamos Advisors, CWM; Director, Calamos Global Funds plc (since 2007); prior thereto Director of Operations (2004-2011) |
| | |
| Curtis Holloway, 48 | | Treasurer (since 2014) | | Vice President, Fund Administration, (since 2013) Calamos Advisors; Vice President, Financial Operation Principal and Head of Fund Administration (since 2013), CFS; Treasurer of Calamos Investment Trust, Calamos Advisors Trust, CHI, CHY, CSQ, CGO and CHW (since June 2010); prior thereto Assistant Treasurer (2007-2010) |
| | |
| Robert Behan, 50 | | Vice President (since 2014) | | President (since 2015), Head of Global Distribution (since April 2013), CAM, CILLC, Calamos Advisors, and CFS; prior thereto Senior Vice President (2009-2013), Head of Global Distribution (March 2013-April 2013); prior thereto Head of US Intermediary Distribution (2010-2013); prior thereto Head of Strategic Partners Team (2010-2010); prior thereto National Accounts/Retirement Services (2009-2010); prior thereto Vice President, Director of Retirement Services (2008-2009) |
| | |
| J. Christopher Jackson, 64 | | Vice President and Secretary (since 2014) | | Senior Vice President, General Counsel and Secretary, CAM, CILLC, Calamos Advisors and CFS (since 2010); Director, Calamos Global Funds plc (since 2011); Director, Calamos Arista Strategic Master Fund Ltd. and Calamos Arista Strategic Fund Ltd. (since 2013); prior thereto Director, U.S. Head of Retail Legal and Co-Global Head of Retail Legal of Deutsche Bank AG (2006-2010); |
| | |
| Mark J. Mickey, 64 | | Chief Compliance Officer (since 2014) | | Chief Compliance Officer, Calamos Funds (since 2005) |
The address of each officer is 2020 Calamos Court, Naperville, Illinois 60563.
Results of Special Shareholder Meeting
The Fund held a special meeting of shareholders on July 16, 2015. The purpose of the special meeting was to elect seven trustees to the Fund’s board of trustees, or until the trustee’s successor is duly elected and qualified, and to conduct any other lawful business of the Fund. Messrs. John P. Calamos, Sr., John E. Neal, William R. Rybak, Stephen B. Timbers, and David D. Tripple were nominated for reelection as trustees, Ms. Virginia G. Breen and Ms. Theresa A. Hamacher were nominated for election as new trustees, and all were elected as such by a plurality vote as follows:
| | | | | | | | | | | | |
| TRUSTEE NOMINEE | | VOTES FOR | | | VOTES WITHHELD | | | BROKER NON-
VOTES AND ABSTENTIONS | |
| Virginia G. Breen | | | 2,536,932.993 | | | | 1.007 | | | | 0 | |
| John P. Calamos, Sr. | | | 2,536,932.993 | | | | 1.007 | | | | 0 | |
| Theresa A. Hamacher | | | 2,536,932.993 | | | | 1.007 | | | | 0 | |
| John E. Neal | | | 2,536,932.993 | | | | 1.007 | | | | 0 | |
| William R. Rybak | | | 2,536,932.993 | | | | 1.007 | | | | 0 | |
| Stephen B. Timbers | | | 2,536,932.993 | | | | 1.007 | | | | 0 | |
| David D. Tripple | | | 2,536,932.993 | | | | 1.007 | | | | 0 | |
| | | | | | |
| | CALAMOS FOCUS GROWTH ETF ANNUAL REPORT | | | 25 | |
Supplemental Information (Unaudited)
On September 22, 2015, the Board of Trustees of the Fund adopted an amendment to the Fund’s By-Laws to establish the courts of the State of Delaware as the exclusive forum for any derivative action or proceeding brought on behalf of the Fund, any action asserting a claim of breach of a fiduciary duty owed by any trustee, officer or other employee of the Fund, any action asserting a claim arising pursuant to any provision of the Delaware Statutory Trust Act or the Fund’s Trust Instrument or By-Laws, any action to interpret, apply, enforce or determine the validity of the Fund’s Trust Instrument or By-Laws or any action asserting a claim governed by the internal affairs doctrine. The text of the amendment to the Fund’s By-Laws is set forth below. A copy of the Fund’s By-Laws shall be filed as an exhibit to the Fund’s Annual Report on Form N-SAR, filed with the Securities and Exchange Commission on or about December 30, 2015.
* * *
ARTICLE IX
GENERAL MATTERS
Section 6. Forum for Adjudication of Disputes. Unless the Trust consents in writing to the selection of an alternative forum, the sole and exclusive forum for (i) any derivative action or proceeding brought on behalf of the Trust, (ii) any action asserting a claim of breach of a fiduciary duty owed by any Trustee, officer or other employee of the Trust to the Trust or the Trust’s Shareholders, (iii) any action asserting a claim arising pursuant to any provision of the Delaware Statutory Trust Act or the Trust Instrument or these By-laws, (iv) any action to interpret, apply, enforce or determine the validity of the Trust Instrument or these By-laws or (v) any action asserting a claim governed by the internal affairs doctrine shall be the Court of Chancery of the State of Delaware, or, if the Court of Chancery of the State of Delaware does not have jurisdiction, the Superior Court of the State of Delaware (each, a “Covered Action”). Any person purchasing or otherwise acquiring or holding any interest in shares of beneficial interest of the Trust shall be (i) deemed to have notice of and consented to the provisions of this Section 6, and (ii) deemed to have waived any argument relating to the inconvenience of the forums referenced above in connection with any action or proceeding described in this Section 6.
If any Covered Action is filed in a court other than the Court of Chancery of the State of Delaware or the Superior Court of the State of Delaware (a “Foreign Action”) in the name of any Shareholder, such Shareholder shall be deemed to have consented to (i) the personal jurisdiction of the Court of Chancery of the State of Delaware and the Superior Court of the State of Delaware in connection with any action brought in any such courts to enforce the first paragraph of this Section 6 (an “Enforcement Action”) and (ii) having service of process made upon such Shareholder in any such Enforcement Action by service upon such Shareholder’s counsel in the Foreign Action as agent for such Shareholder. Furthermore, except to the extent prohibited by any provision of the Delaware Statutory Trust Act or the Trust Instrument, if any Shareholder shall initiate or assert a Foreign Action without the written consent of the Trust, then each such Shareholder shall be obligated jointly and severally to reimburse the Trust and any officer or Trustee of the Trust made a party to such proceeding for all fees, costs and expenses of every kind and description (including, but not limited to, all reasonable attorneys’ fees and other litigation expenses) that the parties may incur in connection with any successful motion to dismiss, stay or transfer such Foreign Action based upon non-compliance with this Section 6.
If any provision or provisions of this Section 6 shall be held to be invalid, illegal or unenforceable as applied to any person or circumstance for any reason whatsoever, then, to the fullest extent permitted by law, the validity, legality and enforceability of such provision(s) in any other circumstance and of the remaining provisions of this Section 6 (including, without limitation, each portion of any sentence of this Section 6 containing any such provision held to be invalid, illegal or unenforceable that is not itself held to be invalid, illegal or unenforceable) and the application of such provision to other persons and circumstances shall not in any way be affected or impaired thereby.
| | | | |
| 26 | | CALAMOS FOCUS GROWTH ETF ANNUAL REPORT | | |
MANAGING YOUR CALAMOS FUNDS INVESTMENTS
Calamos Investments offers several convenient means to monitor, manage and feel confident about your Calamos investment choice.
PERSONAL ASSISTANCE: 800.582.6959
Dial this toll-free number to speak with a knowledgeable Client Services Representative who can help answer questions or address issues concerning your Calamos Fund.
YOUR FINANCIAL ADVISOR
We encourage you to talk to your financial advisor to determine how the Calamos Funds can benefit your investment portfolio based on your financial goals, risk tolerance, time horizon and income needs.
| | |

| | STAY CONNECTED www.calamos.com/connect |
|
Visit our Web site for timely fund performance, detailed fund profiles, fund news and insightful market commentary. |
This report, including the audited financial statements contained herein, is submitted for general information for the shareholders of the Fund. The report is not authorized for distribution to prospective investors in the Fund unless accompanied by a currently effective prospectus of the Fund and, after January 31, 2016, updated performance data for the most recently completed fiscal quarter. The views expressed in this report reflect those of Calamos Advisors LLC only through October 31, 2015. The managers’ views are subject to change at any time based on market and other conditions.
A description of the Calamos Proxy Voting Policies and Procedures and the Fund’s proxy voting record for the 12-month period ended June 30, 2015 are available free of charge upon calling 800.582.6959, by visiting the Calamos Web site at www.calamos.com, or by writing Calamos at: Calamos Investments, Attn: Client Services, 2020 Calamos Court, Naperville, IL 60563. The Fund’s proxy voting record is also available free of charge by visiting the SEC Web site at www.sec.gov.
The Fund files a complete list of their portfolio holdings with the SEC for the first and third quarters each fiscal year on Form N-Q. The Forms N-Q are available free of charge, upon request, by calling or writing Calamos Investments at the phone number or address provided above or by visiting the SEC Web site at www.sec.gov. You may also review or, for a fee, copy the forms at the SEC’s Public Reference Room in Washington, D.C. Information on the operation of the Public Reference Room may be obtained by calling 800.732.0330.
FOR 24-HOUR AUTOMATED SHAREHOLDER ASSISTANCE: 800.823.7386
TO OBTAIN INFORMATION ABOUT YOUR INVESTMENTS: 800.582.6959
VISIT OUR WEB SITE: www.calamos.com
INVESTMENT ADVISER:
Calamos Advisors LLC
2020 Calamos Court
Naperville, IL 60563-2787
CUSTODIAN AND FUND ACCOUNTING AGENT:
State Street Bank and Trust Company
Boston, MA
DISTRIBUTOR:
Foreside Fund Services, LLC
Three Canal Plaza, Suite 100
Portland, Maine 04101
844.922.5226
TRANSFER AGENT:
State Street Bank and Trust Company
Boston, MA
INDEPENDENT REGISTERED PUBLIC ACCOUNTING FIRM:
Deloitte & Touche LLP
Chicago, IL
LEGAL COUNSEL:
Ropes & Gray LLP
Chicago, IL

2020 Calamos Court
Naperville, IL 60563-2787
800.582.6959
www.calamos.com
© 2015 Calamos Investments LLC. All Rights Reserved.
Calamos® and Calamos Investments® are registered
trademarks of Calamos Investments LLC.
FGETFANR 56 2015
ITEM 2. CODE OF ETHICS.
(a) As of the end of the period covered by this report, the registrant has adopted a code of ethics (the “Code of Ethics”) that applies to its principal executive officer, principal financial officer, principal accounting officer or controller, or person performing similar functions.
(b) No response required.
(c) The registrant has not amended its Code of Ethics as it relates to any element of the code of ethics definition enumerated in paragraph (b) of this Item 2 during the period covered by this report.
(d) The registrant has not granted a waiver or an implicit waiver from its Code of Ethics during the period covered by this report.
(e) Not applicable.
(f) (1) The registrant’s Code of Ethics is attached as an Exhibit hereto.
ITEM 3. AUDIT COMMITTEE FINANCIAL EXPERT.
The registrant’s Board of Trustees has determined that, for the period covered by the shareholder report presented in Item 1 hereto, it has 6 audit committee financial experts serving on its audit committee, each of whom is an independent Trustee for purpose of this N-CSR item: John E. Neal, William R. Rybak, Virginia G. Breen, Theresa Hamacher, Stephen B. Timbers and David D. Tripple. Under applicable securities laws, a person who is determined to be an audit committee financial expert will not be deemed an “expert” for any purpose, including without limitation for the purposes of Section 11 of the Securities Act of 1933, as a result of being designated or identified as an audit committee financial expert pursuant to this Item. The designation or identification of a person as an audit committee financial expert does not impose on such person any duties, obligations, or liabilities that are greater than the duties, obligations and liabilities imposed on such person as a member of audit committee and board of directors in the absence of such designation or identification. The designation or identification of a person as an audit committee financial expert pursuant to this Item does not affect the duties, obligations, or liabilities of any other member of the audit committee or board of directors.
ITEM 4. PRINCIPAL ACCOUNTANT FEES AND SERVICES.
| | | | | | | | |
Fiscal Years Ended | | 10/31/2014 | | | 10/31/2015 | |
Audit Fees(a) | | $ | 27,270 | | | $ | 27,270 | |
Audit-Related Fees(b) | | $ | 6,210 | | | $ | 23,140 | |
Tax Fees(c) | | $ | — | | | $ | — | |
All Other Fees(d) | | $ | — | | | $ | — | |
| | | | | | | | |
Total | | $ | 33,480 | | | $ | 50,410 | |
| | | | | | | | |
(a) Audit fees are the aggregate fees billed in each of the last two fiscal years for professional services rendered by the principal accountant to the registrant for the audit of the registrant’s annual financial statements or services that are normally provided by the accountant in connection with statutory and regulatory filings or engagements for those fiscal years.
(b) Audit-related fees are the aggregate fees billed in each of the last two fiscal years for assurance and related services rendered by the principal accountant to the registrant that are reasonably related to the performance of the audit of the registrant’s financial statements and are not reported under paragraph (a) of this Item 4.
(c) Tax fees are the aggregate fees billed in each of the last two fiscal years for professional services rendered by the principal accountant to the registrant for tax compliance, tax advice and tax planning.
(d) All other fees are the aggregate fees billed in each of the last two fiscal years for products and services provided by the principal accountant to the registrant, other than the services reported in paragraph (a)-(c) of this Item 4.
ITEM 5. AUDIT COMMITTEE OF LISTED REGISTRANTS.
The registrant has a separately-designated standing audit committee. The members of the registrant’s audit committee are John E. Neal, William R. Rybak, Virginia G. Breen, Theresa Hamacher, Stephen B. Timbers, and David D. Tripple.
ITEM 6. SCHEDULE OF INVESTMENTS
Included in the Report to Shareholders in Item 1.
ITEM 7. DISCLOSURE OF PROXY VOTING POLICIES AND PROCEDURES FOR CLOSED-END MANAGEMENT INVESTMENT COMPANIES.
Not applicable.
ITEM 8. PORTFOLIO MANAGERS OF CLOSED-END MANAGEMENT INVESTMENT COMPANIES.
Not applicable.
ITEM 9. PURCHASES OF EQUITY SECURITIES BY CLOSED-END MANAGEMENT INVESTMENT COMPANY AND AFFILIATED PURCHASERS.
Not applicable
ITEM 10. SUBMISSION OF MATTERS TO A VOTE OF SECURITY HOLDERS.
No material changes.
ITEM 11. CONTROLS AND PROCEDURES.
a) The registrant’s principal executive officer and principal financial officer have evaluated the registrant’s disclosure controls and procedures within 90 days of this filing and have concluded that the registrant’s disclosure controls and procedures were effective, as of that date, in ensuring that information required to be disclosed by the registrant in this Form N-CSR was recorded, processed, summarized, and reported timely.
b) There were no changes in the registrant’s internal controls over financial reporting (as defined in Rule 30a-3(d) under the Investment Company Act of 1940) that occurred during the second fiscal quarter of the period covered by this report that has materially affected, or is reasonably likely to materially affect, the registrant’s internal control over financial reporting.
ITEM 12. EXHIBITS.
(a)(1) Code of Ethics
(a)(2)(i) Certification of Principal Executive Officer.
(a)(2)(ii) Certification of Principal Financial Officer.
SIGNATURES
Pursuant to the requirements of the Securities Exchange Act of 1934 and the Investment Company Act of 1940, the registrant has duly caused this report to be signed on its behalf by the undersigned, thereunto duly authorized.
| | |
| Calamos ETF Trust |
| |
| By: | | /s/ John P. Calamos, Sr. |
| Name: | | John P. Calamos, Sr. |
| Title: | | Principal Executive Officer |
| Date: | | December 22, 2015 |
| | |
| By: | | /s/ Nimish S. Bhatt |
| Name: | | Nimish S. Bhatt |
| Title: | | Principal Financial Officer |
| Date: | | December 22, 2015 |
Pursuant to the requirements of the Securities Exchange Act of 1934 and the Investment Company Act of 1940, this report has been signed by the following persons on behalf of the registrant and in the capacities and on the dates indicated.
| | |
| By: | | /s/ John P. Calamos, Sr. |
| Name: | | John P. Calamos, Sr. |
| Title: | | Principal Executive Officer |
| Date: | | December 22, 2015 |
| | |
| By: | | /s/ Nimish S. Bhatt |
| Name: | | Nimish S. Bhatt |
| Title: | | Principal Financial Officer |
| Date: | | December 22, 2015 |