| OMB APPROVAL |
OMB Number: 3235-0570 Expires: January 31, 2017 Estimated average burden hours per response: 20.6 |
| Investment Company Act file number | 811-22858 |
| WST Investment Trust |
| (Exact name of registrant as specified in charter) |
| 150 W. Main Street, Suite 1700 Norfolk, VA | 23510-1666 |
| (Address of principal executive offices) | (Zip code) |
| Ultimus Fund Solutions, LLC 225 Pictoria Drive, Suite 450 Cincinnati, Ohio 45246 |
| (Name and address of agent for service) |
| Registrant's telephone number, including area code: | (866) 515-4626 |
| Date of fiscal year end: | August 31 | |
| Date of reporting period: | February 29, 2016 |
| Item 1. | Reports to Stockholders. |
WST INVESTMENT TRUST
WST ASSET MANAGER – U.S. EQUITY FUND
WST ASSET MANAGER – U.S. BOND FUND
Semi-Annual Report
February 29, 2016
| |
Investment Adviser | Administrator
|

WST INVESTMENT TRUST | April 6, 2016 |
Dear Shareholder:
Thank you for being a shareholder of WST Asset Manager Funds. We value your investment in the Funds and your trust in our strategies.
The WST Asset Manager – U.S. Equity Fund’s (the “Equity Fund”) investment process is based on WST Asset Manager (“WSTAM”), a proprietary quantitative model designed to make investment decisions and allocate investments among the various primary sectors of the S&P 500® Index (“Sector Investments”), fixed income securities (“Fixed Income Investments”) and gold related securities (“Gold Investments”).
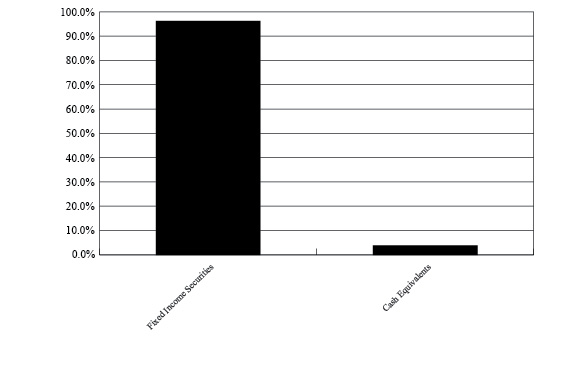
As of February 29, 2016, the Equity Fund had net assets of $17.69 million and they were allocated 0.0% to Sector Investments, 96.2% to Fixed Income Investments, 0% to Gold Investments and 3.8% to cash equivalents.
The Sector Investments are managed to provide systematic exposures to sectors that share the common characteristic of positive momentum. For example, a sector is considered to have positive momentum if it has performed well in the prior twelve months relative to other sectors in the Fund’s investment universe. The Fund’s Sector Investments universe consists of the nine primary sectors of the S&P 500® Index (i.e. consumer discretionary, consumer staples, energy, financials, health care, industrials, materials, information technology and utilities). The Equity Fund may take temporary defensive positions that are inconsistent with the Fund’s principal investment strategies in an attempt to respond to adverse market, economic, political or other conditions, which would allow the Fund to hold up to 100% of its portfolio in Fixed Income and Gold Investments, or solely in Fixed Income Investments or cash positions. The Equity Fund exercised this temporary defensive position as of February 29, 2016.
For the year ended February 29, 2016, the Institutional Shares of the Equity Fund had a total return of (6.60%). During this time, the S&P® 500 Index fell 6.19%. The decline in the S&P® 500 began in August of 2015. Due to the short term nature of the correction and the expenses of the Fund, the Equity Fund slightly underperformed the S&P® 500 during this period. During extended market declines, the Fund’s risk controls (i.e., Fixed Income Investments) are intended to help the Fund outperform the S&P 500® Index. This philosophy of seeking market participation but emphasizing risk controls first and foremost is one of the keys to the long term performance expectations of the strategy.
The WST Asset Manager – U.S. Bond Fund’s (the “Bond Fund”) investment process allocates assets between high-yield securities and investment grade securities using a proprietary quantitative model. This strategy employs a combination of short-, intermediate-, and long-term trend-following techniques to identify periods of favorable or unfavorable market conditions for high-yield and investment grade securities. In allocating portfolio investments between high-yield securities and investment grade securities, WST may consider multiple factors, including those related to credit,
1
duration, Federal Reserve policy and the its expectations for the future course of interest rates and the then-prevailing price and yield levels in the debt market. WST selects securities for their potential for interest income, capital appreciation, or both.
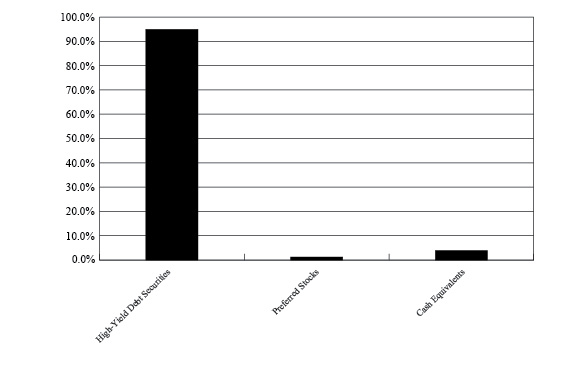
As of February 29, 2016, the Bond Fund had net assets of $55.38 million and they were allocated 94.9% to the high-yield securities, 0.0% to investment grade securities, 1.2% to preferred stocks and 3.8% to cash equivalents.
For the year ended February 29, 2016, the Institutional Shares of the Bond Fund had a total return of (1.94%). During this time, the Barclays U.S. Aggregate Bond Index gained 1.50% and the Barclays U.S. Corporate High Yield Bond Index fell 8.30%.
The Bond Fund lagged the Barclays U.S. Aggregate Bond Index due to a significant underweight in duration on the part of the Fund in anticipation of the Federal Reserve raising rates. The outperformance as measured against the Barclays U.S. Corporate High Yield Bond Index was due to a significant underweight to high-yield securities. The tactical nature of the Bond Fund can lead to underperformance in volatile markets with no clear trend.
In conclusion, markets change over time, and although we may not know when these changes will occur, we do know that changing markets bring new investment opportunities. The WST Asset Manager Funds aim to capitalize on these opportunities as they arise. We look forward to providing you with Funds that we believe will capture the benefits of rules-based investing founded on sound academic and industry research.
Sincerely,

Roger H. Scheffel Jr., Portfolio Manager
Wilbanks, Smith & Thomas Asset Management, LLC
Past performance is not predictive of future performance. Investment results and principal value will fluctuate so that shares, when redeemed, may be worth more or less than their original cost. Current performance may be higher or lower than the performance data quoted. For performance information current to the most recent month-end, please call 1-866-515-4626.
An investor should consider the investment objectives, risks, charges and expenses of the Funds carefully before investing. Each Fund’s prospectus contains this and other important information. To obtain a copy of each Fund’s prospectus please call 1-866-515-4626 and a copy will be sent to you free of charge. Please read the prospectus carefully before you invest. The Funds are distributed by Ultimus Fund Distributors, LLC.
The Letter to Shareholders seeks to describe some of the Advisor’s current opinions and views of the financial markets. Although the Advisor believes it has a reasonable basis for any opinions or views expressed, actual results may differ, sometimes significantly so, from those expected or expressed.
2
WST ASSET MANAGER – U.S. EQUITY FUND |
Comparison of the Change in Value of a $100,000 Investment in
WST Asset Manager - U.S. Equity Fund -
Institutional Class(a) and the S&P 500® Index
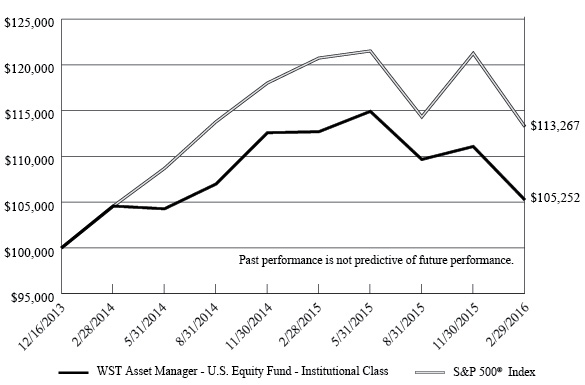
Average Annual Total Returns(b) (for the periods ended February 29, 2016) | ||
1 Year | Since Inception(c) | |
WST Asset Manager - U.S. Equity Fund - Institutional Class | (6.60%) | 2.35% |
WST Asset Manager - U.S. Equity Fund - Investor Class | (6.86%) | 2.10% |
S&P 500® Index | (6.19%) | 5.82% |
(a) | The line graph above represents performance of the Institutional Class only, which will vary from the performance of the Investor Class based on the difference in fees paid by shareholders in the different classes. |
(b) | Total return is a measure of the change in value of an investment in the Fund over the period covered, which assumes dividends or distributions, if any, are reinvested in the shares of the Fund. Returns do not reflect the deduction of taxes a shareholder would pay on Fund distributions or the redemptions of Fund shares. |
(c) | The Fund commenced operations on December 16, 2013. |
3
WST ASSET MANAGER – U.S. BOND FUND |
Comparison of the Change in Value of a $100,000 Investment in WST Asset
Manager - U.S. Bond Fund - Institutional Class(a), the Barclays U.S. Corporate
High Yield Bond Index* and the Barclays U.S. Aggregate Bond Index*
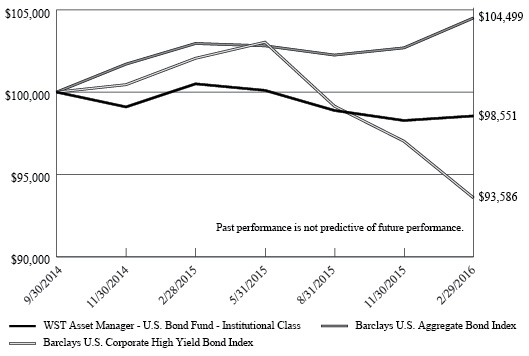
Total Returns(b) (for the period ended February 29, 2016) | ||
1 Year | Since | |
WST Asset Manager - U.S. Bond Fund - Institutional Class | (1.94%) | (1.03%) |
WST Asset Manager - U.S. Bond Fund - Investor Class | (2.16%) | (1.21%) |
Barclays U.S. Corporate High Yield Bond Index | (8.30%) | (4.58%) |
Barclays U.S. Aggregate Bond Index | 1.50% | 3.16% |
(a) | The line graph above represents performance of the Institutional Class only, which will vary from the performance of the Investor Class based on the difference in fees paid by shareholders in the different classes. |
(b) | Total return is a measure of the change in value of an investment in the Fund over the period covered, which assumes dividends or distributions, if any, are reinvested in shares of the Fund. Returns do not reflect the deduction of taxes a shareholder would pay on Fund distributions or the redemptions of Fund shares. |
(c) | The Fund commenced operations on September 30, 2014. |
* | The Barclays U.S. Corporate High Yield Bond Index is an unmanaged index generally representative of fixed-rate, non-investment-grade debt. Because the Fund has a tactical high yield strategy, this index is believed to be a more appropriate broad-based securities market index against which to compare the Fund’s performance than the Barclays U.S. Aggregate Bond Index, which represents a broader range of fixed-income securities and is not as representative of the Fund’s portfolio. |
4
WST ASSET MANAGER – U.S. EQUITY FUND |
Sector Diversification
(% of Total Investments)
5
WST ASSET MANAGER – U.S. BOND FUND |
Investment Strategy Allocation
(% of Total Investments)
6
WST ASSET MANAGER – U.S. EQUITY FUND |
EXCHANGE-TRADED FUNDS — 96.2% | Shares | Value | ||||||
iShares 3-7 Year Treasury Bond ETF | 67,700 | $ | 8,513,952 | |||||
iShares Core U.S. Aggregate Bond ETF | 77,300 | 8,509,957 | ||||||
Total Exchange-Traded Funds (Cost $16,845,751) | $ | 17,023,909 | ||||||
MONEY MARKET FUNDS — 3.7% | Shares | Value | ||||||
Fidelity Institutional Money Market Funds - Government Portfolio - Class I, 0.21% (a) | 220,319 | $ | 220,319 | |||||
First American Treasury Obligations Fund - Class Z, 0.00% (a) | 213,840 | 213,840 | ||||||
Invesco Short-Term Investments Trust - Treasury Portfolio - Institutional Shares, 0.23% (a) | 213,840 | 213,840 | ||||||
Total Money Market Funds (Cost $647,999) | $ | 647,999 | ||||||
Total Investments at Value — 99.9% (Cost $17,493,750) | $ | 17,671,908 | ||||||
Other Assets in Excess of Liabilities — 0.1% | 17,754 | |||||||
Net Assets — 100.0% | $ | 17,689,662 | ||||||
(a) | The rate shown is the 7-day effective yield as of February 29, 2016. |
See accompanying notes to financial statements. |
7
WST ASSET MANAGER – U.S. BOND FUND |
EXCHANGE-TRADED FUNDS — 40.8% | Shares | Value | ||||||
Guggenheim BulletShare 2018 High Yield Corporate Bond ETF | 117,570 | $ | 2,782,882 | |||||
Guggenheim BulletShare 2019 High Yield Corporate Bond ETF | 123,700 | 2,788,198 | ||||||
Guggenheim BulletShare 2020 High Yield Corporate Bond ETF | 124,830 | 2,778,716 | ||||||
iShares iBoxx $ High Yield Corporate Bond ETF | 72,000 | 5,765,760 | ||||||
PIMCO 0-5 Year High Yield Corporate Bond Index Exchange-Traded Fund | 30,740 | 2,785,659 | ||||||
SPDR® Barclays High Yield Bond ETF | 170,500 | 5,698,110 | ||||||
Total Exchange-Traded Funds (Cost $22,263,379) | $ | 22,599,325 | ||||||
OPEN-END MUTUAL FUNDS — 54.2% | Shares | Value | ||||||
AB High Income Fund, Inc. | 639,386 | $ | 5,000,000 | |||||
Franklin High Income Fund - Advisor Class | 3,125,000 | 5,000,000 | ||||||
Hartford High Yield Fund (The) - Class I | 296,296 | 2,000,000 | ||||||
Janus High-Yield Fund - Class I | 637,755 | 5,000,000 | ||||||
MFS ® Global High Yield Fund - Class I | 534,759 | 3,000,000 | ||||||
Principal High Yield Fund - Institutional Class | 762,195 | 5,000,000 | ||||||
Vanguard High-Yield Corporate Fund - Admiral Shares | 915,751 | 5,000,000 | ||||||
Total Open-End Mutual Funds (Cost $30,000,000) | $ | 30,000,000 | ||||||
PREFERRED STOCKS — 1.2% | Shares | Value | ||||||
HSBC Holdings plc, 8.125% (Cost $624,178) | 24,000 | $ | 636,240 | |||||
See accompanying notes to financial statements. |
8
WST ASSET MANAGER – U.S. BOND FUND |
MONEY MARKET FUNDS — 78.0% | Shares | Value | ||||||
Fidelity Institutional Money Market Funds - Government Portfolio - Class I, 0.21% (a) | 14,693,503 | $ | 14,693,503 | |||||
First American Treasury Obligations Fund - Class Z, 0.00% (a) | 14,261,341 | 14,261,341 | ||||||
Invesco Short-Term Investments Trust - Treasury Portfolio - Institutional Shares, 0.23% (a) | 14,261,342 | 14,261,342 | ||||||
Total Money Market Funds (Cost $43,216,186) | $ | 43,216,186 | ||||||
Total Investments at Value — 174.2% (Cost $96,103,743) | $ | 96,451,751 | ||||||
Liabilities in Excess of Other Assets — (74.2%) | (41,072,704 | ) | ||||||
Net Assets — 100.0% | $ | 55,379,047 | ||||||
(a) | The rate shown is the 7-day effective yield as of February 29, 2016. |
See accompanying notes to financial statements. |
9
WST INVESTMENT TRUST |
| U.S. Equity | U.S. Bond | ||||||
ASSETS | ||||||||
Investments in securities: | ||||||||
At acquisition cost | $ | 17,493,750 | $ | 96,103,743 | ||||
At value (Note 2) | $ | 17,671,908 | $ | 96,451,751 | ||||
Receivable for capital shares sold | — | 6,480 | ||||||
Dividends and interest receivable | 75 | 7,492 | ||||||
Other assets | 27,547 | 25,975 | ||||||
TOTAL ASSETS | 17,699,530 | 96,491,698 | ||||||
LIABILITIES | ||||||||
Payable for investment securities purchased | — | 41,058,531 | ||||||
Payable for capital shares redeemed | — | 7,867 | ||||||
Payable to Advisor (Note 4) | — | 26,180 | ||||||
Payable to administrator (Note 4) | 7,640 | 9,600 | ||||||
Accrued distribution fees (Note 4) | 185 | 7,776 | ||||||
Other accrued expenses | 2,043 | 2,697 | ||||||
TOTAL LIABILITIES | 9,868 | 41,112,651 | ||||||
NET ASSETS | $ | 17,689,662 | $ | 55,379,047 | ||||
NET ASSETS CONSIST OF: | ||||||||
Paid-in capital | $ | 18,547,521 | $ | 57,090,845 | ||||
Accumulated net investment loss | (8,435 | ) | (69,042 | ) | ||||
Accumulated net realized losses from security transactions | (1,027,582 | ) | (1,990,764 | ) | ||||
Net unrealized appreciation on investments | 178,158 | 348,008 | ||||||
NET ASSETS | $ | 17,689,662 | $ | 55,379,047 | ||||
PRICING OF INSTITUTIONAL SHARES | ||||||||
Net assets applicable to Institutional Shares | $ | 16,726,716 | $ | 14,646,027 | ||||
Shares of Institutional Shares outstanding (no par value, unlimited number of shares outstanding) | 1,661,552 | 1,513,609 | ||||||
Net asset value, offering and redemption price per share (Note 2) | $ | 10.07 | $ | 9.68 | ||||
PRICING OF INVESTOR SHARES | ||||||||
Net assets applicable to Investor Shares | $ | 962,946 | $ | 40,733,020 | ||||
Shares of Investor Shares outstanding (no par value, unlimited number of shares outstanding) | 95,852 | 4,213,810 | ||||||
Net asset value, offering and redemption price per share (Note 2) | $ | 10.05 | $ | 9.67 | ||||
See accompanying notes to financial statements. |
10
WST INVESTMENT TRUST |
| U.S. Equity | U.S. Bond | ||||||
INVESTMENT INCOME | ||||||||
Dividends | $ | 130,593 | $ | 277,203 | ||||
Interest | — | 7,679 | ||||||
TOTAL INVESTMENT INCOME | 130,593 | 284,882 | ||||||
EXPENSES | ||||||||
Investment advisory fees (Note 4) | 66,993 | 166,791 | ||||||
Distribution fees, Investor Class (Note 4) | 1,245 | 51,112 | ||||||
Professional fees | 21,699 | 21,699 | ||||||
Administration fees (Note 4) | 14,000 | 27,837 | ||||||
Fund accounting fees (Note 4) | 17,903 | 19,024 | ||||||
Registration and filing fees | 14,954 | 17,361 | ||||||
Transfer agent fees, Institutional Class (Note 4) | 6,000 | 6,000 | ||||||
Transfer agent fees, Investor Class (Note 4) | 6,000 | 6,000 | ||||||
Printing of shareholder reports | 4,795 | 3,711 | ||||||
Insurance expense | 3,762 | 3,762 | ||||||
Custodian and bank service fees | 3,005 | 4,441 | ||||||
Trustees’ fees (Note 4) | 3,000 | 3,000 | ||||||
Other expenses | 5,626 | 1,160 | ||||||
TOTAL EXPENSES | 168,982 | 331,898 | ||||||
Fee waivers and expense reimbursements by the Adviser (Note 4) | (56,082 | ) | — | |||||
NET EXPENSES | 112,900 | 331,898 | ||||||
NET INVESTMENT INCOME (LOSS) | 17,693 | (47,016 | ) | |||||
REALIZED AND UNREALIZED GAINS (LOSSES) ON INVESTMENTS | ||||||||
Net realized losses from investments | (703,351 | ) | (621,416 | ) | ||||
Net change in unrealized appreciation/ depreciation on investments | (55,918 | ) | 397,335 | |||||
NET REALIZED AND UNREALIZED LOSSES ON INVESTMENTS | (759,269 | ) | (224,081 | ) | ||||
NET DECREASE IN NET ASSETS RESULTING FROM OPERATIONS | $ | (741,576 | ) | $ | (271,097 | ) | ||
See accompanying notes to financial statements. |
11
WST ASSET MANAGER – U.S. EQUITY FUND |
| Six Months | Year | ||||||
FROM OPERATIONS | ||||||||
Net investment income | $ | 17,693 | $ | 4,353 | ||||
Net realized gains (losses) from investments | (703,351 | ) | 294,313 | |||||
Net change in unrealized appreciation/depreciation on investments | (55,918 | ) | (178,284 | ) | ||||
Net increase (decrease) in net assets resulting from operations | (741,576 | ) | 120,382 | |||||
DISTRIBUTIONS TO SHAREHOLDERS (Note 2) | ||||||||
Institutional Shares | ||||||||
From net investment income | (25,485 | ) | (41,293 | ) | ||||
From realized capital gains on security transactions | (545,687 | ) | (91,983 | ) | ||||
Investor Shares | ||||||||
From net investment income | (643 | ) | (585 | ) | ||||
From realized capital gains on security transactions | (31,942 | ) | (3,103 | ) | ||||
Decrease in net assets from distributions to shareholders | (603,757 | ) | (136,964 | ) | ||||
CAPITAL SHARE TRANSACTIONS | ||||||||
Institutional Shares | ||||||||
Proceeds from shares sold | 1,166,804 | 6,337,240 | ||||||
Net asset value of shares issued in reinvestment of distributions | 571,172 | 133,276 | ||||||
Payments for shares redeemed | (709,694 | ) | (532,958 | ) | ||||
Net increase in Institutional Shares net assets from capital share transactions | 1,028,282 | 5,937,558 | ||||||
Investor Shares | ||||||||
Proceeds from shares sold | 21,689 | 639,514 | ||||||
Net asset value of shares issued in reinvestment of distributions | 32,585 | 3,688 | ||||||
Payments for shares redeemed | (18,116 | ) | (37,749 | ) | ||||
Net increase in Investor Shares net assets from capital share transactions | 36,158 | 605,453 | ||||||
TOTAL INCREASE (DECREASE) IN NET ASSETS | (280,893 | ) | 6,526,429 | |||||
NET ASSETS | ||||||||
Beginning of period | 17,970,555 | 11,444,126 | ||||||
End of period | $ | 17,689,662 | $ | 17,970,555 | ||||
DISTRIBUTIONS IN EXCESS OF NET INVESTMENT INCOME | $ | (8,435 | ) | $ | — | |||
See accompanying notes to financial statements. |
12
WST ASSET MANAGER – U.S. EQUITY FUND |
| Six Months | Year | ||||||
CAPITAL SHARE ACTIVITY | ||||||||
Institutional Shares | ||||||||
Shares sold | 109,936 | 567,294 | ||||||
Shares reinvested | 54,398 | 12,007 | ||||||
Shares redeemed | (67,054 | ) | (47,673 | ) | ||||
Net increase in shares outstanding | 97,280 | 531,628 | ||||||
Shares outstanding, beginning of period | 1,564,272 | 1,032,644 | ||||||
Shares outstanding, end of period | 1,661,552 | 1,564,272 | ||||||
Investor Shares | ||||||||
Shares sold | 2,051 | 57,074 | ||||||
Shares reinvested | 3,109 | 332 | ||||||
Shares redeemed | (1,792 | ) | (3,370 | ) | ||||
Net increase in shares outstanding | 3,368 | 54,036 | ||||||
Shares outstanding, beginning of period | 92,484 | 38,448 | ||||||
Shares outstanding, end of period | 95,852 | 92,484 | ||||||
See accompanying notes to financial statements. |
13
WST ASSET MANAGER – U.S. BOND FUND |
| Six Months | Period | ||||||
FROM OPERATIONS | ||||||||
Net investment income (loss) | $ | (47,016 | ) | $ | 819,910 | |||
Net realized losses from investments | (621,416 | ) | (1,364,984 | ) | ||||
Net change in unrealized appreciation/depreciation on investments | 397,335 | (49,327 | ) | |||||
Net decrease in net assets resulting from operations | (271,097 | ) | (594,401 | ) | ||||
DISTRIBUTIONS TO SHAREHOLDERS (Note 2) | ||||||||
Institutional Shares | ||||||||
From net investment income | (10,588 | ) | (227,639 | ) | ||||
From realized capital gains on security transactions | — | (1,084 | ) | |||||
Return of capital | — | (22,106 | ) | |||||
Investor Shares | ||||||||
From net investment income | (11,438 | ) | (592,271 | ) | ||||
From realized capital gains on security transactions | — | (3,216 | ) | |||||
Return of capital | — | (59,301 | ) | |||||
Decrease in net assets from distributions to shareholders | (22,026 | ) | (905,617 | ) | ||||
CAPITAL SHARE TRANSACTIONS | ||||||||
Institutional Shares | ||||||||
Proceeds from shares sold | 1,167,195 | 16,570,790 | ||||||
Net asset value of shares issued in reinvestment of distributions | 10,588 | 250,829 | ||||||
Payments for shares redeemed | (1,412,176 | ) | (1,472,098 | ) | ||||
Net increase (decrease) in Institutional Shares net assets from capital share transactions | (234,393 | ) | 15,349,521 | |||||
Investor Shares | ||||||||
Proceeds from shares sold | 2,195,619 | 43,793,810 | ||||||
Net asset value of shares issued in reinvestment of distributions | 11,438 | 654,788 | ||||||
Payments for shares redeemed | (2,640,942 | ) | (1,957,653 | ) | ||||
Net increase (decrease) in Investor Shares net assets from capital share transactions | (433,885 | ) | 42,490,945 | |||||
TOTAL INCREASE (DECREASE) IN NET ASSETS | (961,401 | ) | 56,340,448 | |||||
NET ASSETS | ||||||||
Beginning of period | 56,340,448 | $ | — | |||||
End of period | $ | 55,379,047 | $ | 56,340,448 | ||||
ACCUMULATED NET INVESTMENT LOSS | $ | (69,042 | ) | $ | — | |||
(a) | Represents the period from the commencement of operations (September 30, 2014) through August 31, 2015. |
See accompanying notes to financial statements. |
14
WST ASSET MANAGER – U.S. BOND FUND |
| Six Months | Period | ||||||
CAPITAL SHARE ACTIVITY | ||||||||
Institutional Shares | ||||||||
Shares sold | 120,903 | 1,662,003 | ||||||
Shares reinvested | 1,097 | 25,632 | ||||||
Shares redeemed | (146,241 | ) | (149,785 | ) | ||||
Net increase (decrease) in shares outstanding | (24,241 | ) | 1,537,850 | |||||
Shares outstanding, beginning of period | 1,537,850 | — | ||||||
Shares outstanding, end of period | 1,513,609 | 1,537,850 | ||||||
Investor Shares | ||||||||
Shares sold | 226,992 | 4,390,352 | ||||||
Shares reinvested | 1,185 | 66,923 | ||||||
Shares redeemed | (273,257 | ) | (198,385 | ) | ||||
Net increase (decrease) in shares outstanding | (45,080 | ) | 4,258,890 | |||||
Shares outstanding, beginning of period | 4,258,890 | — | ||||||
Shares outstanding, end of period | 4,213,810 | 4,258,890 | ||||||
(a) | Represents the period from the commencement of operations (September 30, 2014) through August 31, 2015. |
See accompanying notes to financial statements. |
15
WST ASSET MANAGER – U.S. EQUITY FUND |
Per Share Data for a Share Outstanding Throughout Each Period | ||||||||||||
| Six Months | Year | Period | |||||||||
Net asset value at beginning of period | $ | 10.85 | $ | 10.68 | $ | 10.00 | ||||||
Income (loss) from investment operations: | ||||||||||||
Net investment income (b) | 0.01 | 0.01 | 0.01 | |||||||||
Net realized and unrealized gains (losses) on investments | (0.43 | ) | 0.26 | 0.69 | ||||||||
Total from investment operations | (0.42 | ) | 0.27 | 0.70 | ||||||||
Less distributions: | ||||||||||||
From net investment income | (0.02 | ) | (0.03 | ) | (0.02 | ) | ||||||
From net realized gains | (0.34 | ) | (0.07 | ) | — | |||||||
Total distributions | (0.36 | ) | (0.10 | ) | (0.02 | ) | ||||||
Net asset value at end of period | $ | 10.07 | $ | 10.85 | $ | 10.68 | ||||||
Total return (c) | (4.02 | %)(d) | 2.51 | % | 6.97 | %(d) | ||||||
Net assets at end of period | $ | 16,726,716 | $ | 16,968,909 | $ | 11,033,685 | ||||||
Ratios/supplementary data: | ||||||||||||
Ratio of total expenses to average net assets (e) | 1.75 | %(f) | 1.84 | % | 2.85 | %(f) | ||||||
Ratio of net expenses to average net assets (e)(g) | 1.25 | %(f) | 1.25 | % | 1.25 | %(f) | ||||||
Ratio of net investment income to average net assets (b)(g) | 0.21 | %(f) | 0.04 | % | 0.03 | %(f) | ||||||
Portfolio turnover rate | 408 | %(d) | 150 | % | 348 | %(d) | ||||||
(a) | Represents the period from the commencement of operations (December 16, 2013) through August 31, 2014. |
(b) | Recognition of net investment income by the Fund is affected by the timing of the declaration of the dividends by the underlying investment companies in which the Fund invests. The ratios do not include net investment income or loss of the investment companies in which the Fund invests. |
(c) | Total return is a measure of the change in value of an investment in the Fund over the periods covered, which assumes any dividends and capital gain distributions are reinvested in shares of the Fund. The returns shown do not reflect the deduction of taxes a shareholder would pay on Fund distributions, if any, or the redemption of Fund shares. |
(d) | Not annualized. |
(e) | Ratios do not include expenses of the investment companies in which the Fund invests. |
(f) | Annualized. |
(g) | Ratio was determined after advisory fee waivers and expense reimbursements (Note 4). |
See accompanying notes to financial statements. |
16
WST ASSET MANAGER – U.S. EQUITY FUND |
Per Share Data for a Share Outstanding Throughout Each Period | ||||||||||||
| Six Months | Year | Period | |||||||||
Net asset value at beginning of period | $ | 10.83 | $ | 10.68 | $ | 10.00 | ||||||
Income (loss) from investment operations: | ||||||||||||
Net investment loss (b) | (0.00 | )(c) | (0.01 | ) | (0.01 | ) | ||||||
Net realized and unrealized gains (losses) on investments | (0.43 | ) | 0.24 | 0.70 | ||||||||
Total from investment operations | (0.43 | ) | 0.23 | 0.69 | ||||||||
Less distributions: | ||||||||||||
From net investment income | (0.01 | ) | (0.01 | ) | (0.01 | ) | ||||||
From net realized gains | (0.34 | ) | (0.07 | ) | — | |||||||
Total distributions | (0.35 | ) | (0.08 | ) | (0.01 | ) | ||||||
Net asset value at end of period | $ | 10.05 | $ | 10.83 | $ | 10.68 | ||||||
Total return (d) | (4.11 | %)(e) | 2.16 | % | 6.86 | %(e) | ||||||
Net assets at end of period | $ | 962,946 | $ | 1,001,646 | $ | 410,441 | ||||||
Ratios/supplementary data: | ||||||||||||
Ratio of total expenses to average net assets (f) | 4.35 | %(g) | 5.96 | % | 15.21 | %(g) | ||||||
Ratio of net expenses to average net assets (f)(h) | 1.50 | %(g) | 1.50 | % | 1.50 | %(g) | ||||||
Ratio of net investment loss to average net assets (b)(h) | (0.05 | %)(g) | (0.23 | %) | (0.28 | %)(g) | ||||||
Portfolio turnover rate | 408 | %(e) | 150 | % | 348 | %(e) | ||||||
(a) | Represents the period from the commencement of operations (December 16, 2013) through August 31, 2014. |
(b) | Recognition of net investment loss by the Fund is affected by the timing of the declaration of the dividends by the underlying investment companies in which the Fund invests. The ratios do not include net investment income or loss of the investment companies in which the Fund invests. |
(c) | Amount rounds to less than $0.01 per share. |
(d) | Total return is a measure of the change in value of an investment in the Fund over the periods covered, which assumes any dividends and capital gain distributions are reinvested in shares of the Fund. The returns shown do not reflect the deduction of taxes a shareholder would pay on Fund distributions, if any, or the redemption of Fund shares. |
(e) | Not annualized. |
(f) | Ratios do not include expenses of the investment companies in which the Fund invests. |
(g) | Annualized. |
(h) | Ratio was determined after advisory fee waivers and expense reimbursements (Note 4). |
See accompanying notes to financial statements. |
17
WST ASSET MANAGER – U.S. BOND FUND |
Per Share Data for a Share Outstanding Throughout Each Period | ||||||||
Six Months | Period | |||||||
Net asset value at beginning of period | $ | 9.72 | $ | 10.00 | ||||
Income (loss) from investment operations: | ||||||||
Net investment income (loss) (b) | (0.00 | )(c) | 0.16 | |||||
Net realized and unrealized losses on investments | (0.03 | ) | (0.27 | ) | ||||
Total from investment operations | (0.03 | ) | (0.11 | ) | ||||
Less distributions: | ||||||||
From net investment income | (0.01 | ) | (0.15 | ) | ||||
From net realized gains | — | (0.00 | )(c) | |||||
Return of capital | — | (0.02 | ) | |||||
Total distributions | (0.01 | ) | (0.17 | ) | ||||
Net asset value at end of period | $ | 9.68 | $ | 9.72 | ||||
Total return (d) | (0.34 | %)(e) | (1.11 | %)(e) | ||||
Net assets at end of period | $ | 14,646,027 | $ | 14,951,286 | ||||
Ratios/supplementary data: | ||||||||
Ratio of total expenses to average net assets (f) | 1.03 | %(g) | 1.11 | %(g) | ||||
Ratio of net investment income (loss) to average net assets (b) | (0.22 | %)(g) | 1.89 | %(g) | ||||
Portfolio turnover rate | 357 | %(e) | 890 | %(e) | ||||
(a) | Represents the period from the commencement of operations (September 30, 2014) through August 31, 2015. |
(b) | Recognition of net investment income (loss) by the Fund is affected by the timing of the declaration of the dividends by the underlying investment companies in which the Fund invests. The ratios do not include net investment income or loss of the investment companies in which the Fund invests. |
(c) | Amount rounds to less than $0.01 per share. |
(d) | Total return is a measure of the change in value of an investment in the Fund over the periods covered, which assumes any dividends and capital gain distributions are reinvested in shares of the Fund. The returns shown do not reflect the deduction of taxes a shareholder would pay on Fund distributions, if any, or the redemption of Fund shares. |
(e) | Not annualized. |
(f) | Ratios do not include expenses of the investment companies in which the Fund invests. |
(g) | Annualized. |
See accompanying notes to financial statements. |
18
WST ASSET MANAGER – U.S. BOND FUND |
Per Share Data for a Share Outstanding Throughout Each Period | ||||||||
Six Months | Period | |||||||
Net asset value at beginning of period | $ | 9.72 | $ | 10.00 | ||||
Income (loss) from investment operations: | ||||||||
Net investment income (loss) (b) | (0.01 | ) | 0.14 | |||||
Net realized and unrealized losses on investments | (0.04 | ) | (0.26 | ) | ||||
Total from investment operations | (0.05 | ) | (0.12 | ) | ||||
Less distributions: | ||||||||
From net investment income | (0.00 | )(c) | (0.14 | ) | ||||
From net realized gains | — | (0.00 | )(c) | |||||
Return of capital | — | (0.02 | ) | |||||
Total distributions | (0.00 | )(c) | (0.16 | ) | ||||
Net asset value at end of period | $ | 9.67 | $ | 9.72 | ||||
Total return (d) | (0.49 | %)(e) | (1.22 | %)(e) | ||||
Net assets at end of period | $ | 40,733,020 | $ | 41,389,162 | ||||
Ratios/supplementary data: | ||||||||
Ratio of total expenses to average net assets (f) | 1.24 | %(g) | 1.27 | %(g) | ||||
Ratio of net investment income (loss) to average net assets (b) | (0.01 | %)(g) | 1.69 | %(g) | ||||
Portfolio turnover rate | 357 | %(e) | 890 | %(e) | ||||
(a) | Represents the period from the commencement of operations (September 30, 2014) through August 31, 2015. |
(b) | Recognition of net investment income (loss) by the Fund is affected by the timing of the declaration of the dividends by the underlying investment companies in which the Fund invests. The ratios do not include net investment income or loss of the investment companies in which the Fund invests. |
(c) | Amount rounds to less than $0.01 per share. |
(d) | Total return is a measure of the change in value of an investment in the Fund over the period covered, which assumes any dividends and capital gain distributions are reinvested in shares of the Fund. The returns shown do not reflect the deduction of taxes a shareholder would pay on Fund distributions, if any, or the redemption of Fund shares. |
(e) | Not annualized. |
(f) | Ratios do not include expenses of the investment companies in which the Fund invests. |
(g) | Annualized. |
See accompanying notes to financial statements. |
19
WST INVESTMENT TRUST
NOTES TO FINANCIAL STATEMENTS
February 29, 2016 (Unaudited)
1. Organization
WST Asset Manager – U.S. Equity Fund and WST Asset Manager – U.S. Bond Fund (individually, a “Fund” and collectively, the “Funds”) are each a non-diversified series of WST Investment Trust (the “Trust”), an open-end management investment company organized as a Delaware statutory trust and registered under the Investment Company Act of 1940 (the “1940 Act”).
WST Asset Manager – U.S. Equity Fund’s investment objective is to seek long-term capital appreciation, while maintaining a secondary emphasis on generating income.
WST Asset Manager – U.S. Bond Fund’s investment objective is to seek total return from income and capital appreciation.
Each Fund offers two classes of shares (each a “Class” and collectively the “Classes”): Institutional Shares (sold without any sales loads or distribution fees, but available only to institutional investors and certain broker-dealers and financial institutions that have entered into appropriate arrangements with the Fund) and Investor Shares (sold without any sales loads, but subject to a distribution fee of up to 0.25% of the average annual daily net assets attributable to Investor Shares). Each Class represents an ownership interest in the same investment portfolio.
2. Significant Accounting Policies
As an investment company, as defined in Financial Accounting Standards Board (“FASB”) Accounting Standards Update 2013-08, each Fund follows accounting and reporting guidance under FASB Accounting Standards Codification Topic 946, “Financial Services – Investment Companies.” The following is a description of the Funds’ significant accounting policies. The policies are in conformity with accounting principles generally accepted in the United States of America (“GAAP”).
Securities valuation – The Funds’ portfolio securities are valued as of the close of regular trading on the New York Stock Exchange (“NYSE”) (normally 4:00 p.m. Eastern Time) on each day that the NYSE is open for business. In determining the value of the Funds’ assets, portfolio securities are generally valued at market using quotations from the primary market in which they are traded. The Funds normally use third party pricing services to obtain market quotations. To the extent a Fund is invested in other open-end investment companies that are registered under the 1940 Act and are not traded on a market, the Fund’s net asset value per share (“NAV”) is calculated based upon the NAVs reported by such registered open-end investment companies, and the prospectuses for these companies explain the circumstances under which they will use fair value pricing and the effects of using fair value pricing. Securities and assets for which market quotations are not readily available or which cannot be accurately valued using the Funds’ normal pricing procedures are valued at fair value as determined in
20
WST INVESTMENT TRUST
NOTES TO FINANCIAL STATEMENTS (Continued)
good faith under policies established by, and under the direction of, the Trust’s Board of Trustees (the “Board”). Fair value pricing may be used, for example, in situations where (i) portfolio securities, such as securities with small capitalizations, are so thinly traded that there have been no transactions for that stock over an extended period of time; (ii) an event occurs after the close of the exchange on which the portfolio security is principally traded that is likely to change the value of the portfolio security prior to the calculation of the Funds’ NAVs; (iii) the exchange on which the portfolio security is principally traded closes early; or (iv) trading of the portfolio security is halted during the day and does not resume prior to the calculation of the Funds’ NAVs. In such cases, a portfolio security’s “fair value” price may differ from the price next available for that portfolio security using the Funds’ normal pricing procedures, and the fair value price may differ substantially from the price at which the security may ultimately be traded or sold. Fair valued securities will be classified as Level 2 or 3 within the fair value hierarchy (see below), depending on the inputs used.
GAAP establishes a single authoritative definition of fair value, sets out a framework for measuring fair value and requires additional disclosures about fair value measurements.
Various inputs are used in determining the value of the Funds’ investments. These inputs are summarized in the three broad levels listed below:
● | Level 1 – quoted prices in active markets for identical securities |
● | Level 2 – other significant observable inputs |
● | Level 3 – significant unobservable inputs |
The inputs or methodology used for valuing securities are not necessarily an indication of the risks associated with investing in those securities. The inputs used to measure fair value may fall into different levels of the fair value hierarchy. In such cases, for disclosure purposes, the level in the fair value hierarchy within which the fair value measurement falls in its entirety is determined based on the lowest level input that is significant to the fair value measurement.
The following is a summary of the inputs used to value each Fund’s investments as of February 29, 2016:
WST Asset Manager – U.S. Equity Fund | Level 1 | Level 2 | Level 3 | Total | ||||||||||||
Investments in Securities: | ||||||||||||||||
Exchange-Traded Funds | $ | 17,023,909 | $ | — | $ | — | $ | 17,023,909 | ||||||||
Money Market Funds | 647,999 | — | — | 647,999 | ||||||||||||
Total | $ | 17,671,908 | $ | — | $ | — | $ | 17,671,908 | ||||||||
21
WST INVESTMENT TRUST
NOTES TO FINANCIAL STATEMENTS (Continued)
WST Asset Manager – U.S. Bond Fund | Level 1 | Level 2 | Level 3 | Total | ||||||||||||
Investments in Securities: | ||||||||||||||||
Exchange-Traded Funds | $ | 22,599,325 | $ | — | $ | — | $ | 22,599,325 | ||||||||
Open-End Mutual Funds | 30,000,000 | — | — | 30,000,000 | ||||||||||||
Preferred Stocks | 636,240 | — | — | 636,240 | ||||||||||||
Money Market Funds | 43,216,186 | — | — | 43,216,186 | ||||||||||||
Total | $ | 96,451,751 | $ | — | $ | — | $ | 96,451,751 | ||||||||
As of February 29, 2016, the Funds did not have any transfers into and out of any Level. The Funds did not hold any derivatives or assets or liabilities that were measured at fair value on a recurring basis using significant unobservable inputs (Level 3) as of February 29, 2016. It is the Funds’ policy to recognize transfers into and out of any Level at the end of the reporting period.
Share valuation – The NAV per share of each Class of each Fund is calculated as of the close of trading on the NYSE (normally 4:00 p.m., Eastern Time) on each day the NYSE is open for business. The NAV of each Class of each Fund is calculated by dividing the total value of the assets attributable to that Class, less liabilities attributable to that Class, by the number of shares of that Class outstanding. The offering price and redemption price per share of each Class of each Fund is equal to the NAV of such Class.
Security transactions and investment income – Security transactions are accounted for on their trade date. Cost of securities sold is determined on a specific identification basis. Dividend income is recorded on the ex-dividend date. Interest income is accrued as earned and includes amortization of discounts and premiums.
Allocation between Classes – Investment income earned, realized capital gains and losses, and unrealized appreciation and depreciation are allocated daily to each Class of a Fund based upon its proportionate share of total net assets of that Fund. Class specific expenses are charged directly to the Class incurring the expense. Common expenses which are not attributable to a specific Class are allocated daily to each Class of shares of a Fund based upon its proportionate share of total net assets.
22
WST INVESTMENT TRUST
NOTES TO FINANCIAL STATEMENTS (Continued)
Distributions to shareholders – Dividends arising from net investment income are declared and paid annually to shareholders of the Funds. Net realized short-term capital gains, if any, may be distributed throughout the year and net realized long-term capital gains, if any, are distributed at least once each year. The amount of distributions from net investment income and net realized capital gains are determined in accordance with income tax regulations, which may differ from GAAP, and are recorded on the ex-dividend date. The tax character of distributions paid to shareholders of each Fund during the periods ended February 29, 2016 and August 31, 2015 was as follows:
Periods Ended | Ordinary | Long-Term | Return of | Total | ||||||||||||
WST Asset Manager – U.S. Equity Fund | ||||||||||||||||
Institutional Shares | ||||||||||||||||
February 29, 2016 | $ | 264,880 | $ | 306,292 | $ | — | $ | 571,172 | ||||||||
August 31, 2015 | $ | 133,276 | $ | — | $ | — | $ | 133,276 | ||||||||
Investor Shares | ||||||||||||||||
February 29, 2016 | $ | 14,656 | $ | 17,929 | $ | — | $ | 32,585 | ||||||||
August 31, 2015 | $ | 3,688 | $ | — | $ | — | $ | 3,688 | ||||||||
WST Asset Manager – U.S. Bond Fund | ||||||||||||||||
Institutional Shares | ||||||||||||||||
February 29, 2016 | $ | 10,588 | $ | — | $ | — | $ | 10,588 | ||||||||
August 31, 2015 | $ | 228,723 | $ | — | $ | 22,106 | $ | 250,829 | ||||||||
Investor Shares | ||||||||||||||||
February 29, 2016 | $ | 11,438 | $ | — | $ | — | $ | 11,438 | ||||||||
August 31, 2015 | $ | 595,487 | $ | — | $ | 59,301 | $ | 654,788 | ||||||||
Estimates – The preparation of financial statements in conformity with GAAP requires management to make estimates and assumptions that affect the reported amounts of assets and liabilities and the disclosure of contingent assets and liabilities as of the date of the financial statements and the reported amounts of income and expenses during the reporting period. Actual results could differ from those estimates.
Federal income tax – Each Fund has qualified and intends to continue to qualify each year as a “regulated investment company” under Subchapter M of the Internal Revenue Code of 1986 (the “Code”). Qualification generally will relieve each Fund of liability for federal income taxes to the extent 100% of its net investment income and net realized capital gains are distributed in accordance with the Code.
In order to avoid imposition of the excise tax applicable to regulated investment companies, it is also each Fund’s intention to declare as dividends in each calendar year at least 98% of its net investment income (earned during the calendar year) and 98.2% of its net realized capital gains (earned during the twelve months ended October 31) plus undistributed amounts from prior years.
23
WST INVESTMENT TRUST
NOTES TO FINANCIAL STATEMENTS (Continued)
The following information is computed on a tax basis for each item as of February 29, 2016:
| WST Asset | WST Asset | ||||||
Tax cost of portfolio investments | $ | 17,493,750 | $ | 96,103,746 | ||||
Gross unrealized appreciation | $ | 178,158 | $ | 348,005 | ||||
Gross unrealized depreciation | — | — | ||||||
Net unrealized appreciation on investments | 178,158 | 348,005 | ||||||
Other losses | (1,036,017 | ) | (2,059,803 | ) | ||||
Total accumulated deficit | $ | (857,859 | ) | $ | (1,711,798 | ) | ||
The difference between the federal income tax cost of portfolio investments and the financial statement cost of portfolio investments for WST Asset Manager – U.S. Bond Fund is due to certain timing differences in the recognition of capital gains or losses under income tax regulations and GAAP. These “book/tax” differences are temporary in nature and are due to the tax deferral of losses on wash sales.
The Funds recognize the tax benefits or expenses of uncertain tax positions only when the position is “more likely than not” to be sustained assuming examination by tax authorities. Management has reviewed the Funds’ tax positions for the current and all open tax years (tax years ended August 31, 2015 and August 31, 2014) and has concluded that no provision for unrecognized tax benefits or expenses is required in these financial statements.
During the six months ended February 29, 2016, the Funds did not incur any interest or penalties. Generally, tax authorities can examine tax returns filed during the last three years. Each Fund identifies its major tax jurisdiction as U.S. Federal.
3. Investment Transactions
During the six months ended February 29, 2016, the cost of purchases of investment securities and the proceeds from sales of investment securities, other than short-term investments, amounted to $72,076,466 and $72,000,030, respectively, for WST Asset Manager – U.S. Equity Fund and $112,645,058 and $62,513,482, respectively, for WST Asset Manager – U.S. Bond Fund.
4. Transactions with Related Parties
The Managing Principal and Chief Investment Officer of the Advisor and the chair of its Investment Committee is also the President and a Trustee of the Trust. Certain other officers of the Trust are also officers of the Advisor, or of Ultimus Fund Solutions, LLC
24
WST INVESTMENT TRUST
NOTES TO FINANCIAL STATEMENTS (Continued)
(“Ultimus”), the Trust’s administrator, transfer agent, and fund accounting agent, or of Ultimus Fund Distributors, LLC (“UFD”), the principal underwriter and exclusive agent for the distribution of shares of the Funds.
COMPENSATION OF TRUSTEES
Trustees of the Trust who are affiliated with the Advisor receive no salary from the Trust. Each Trustee who is not affiliated with the Advisor receives a fee of $2,000 each year plus $500 per meeting attended in person and $200 per meeting attended by telephone. The Funds reimburse each Trustee and officer of the Trust for his or her travel and other expenses related to attendance at Board or committee meetings.
INVESTMENT ADVISORY AGREEMENT
Each Fund’s investments are managed by the Advisor pursuant to the terms of an Investment Advisory Agreement. Under the Investment Advisory Agreement, WST Asset Manager – U.S. Equity Fund pays the Advisor an advisory fee, computed and accrued daily and paid monthly, at the annual rate of 0.75% of its average daily net assets and WST Asset Manager – U.S. Bond Fund pays the Advisor an advisory fee, computed and accrued daily and paid monthly, at the annual rate of 0.60% of its average daily net assets.
The Advisor has entered into an Expense Limitation Agreement with the Trust under which it has agreed to waive its fees and to assume other expenses of WST Asset Manager – U.S. Equity Fund, if necessary, in an amount that limits the annual operating expenses of the Fund (exclusive of interest, taxes, brokerage commissions, extraordinary expenses, acquired fund fees and expenses and payments, if any, under a Rule 12b-1 distribution plan) to not more than 1.25% of the average daily net assets allocable to each Class until January 1, 2018. Accordingly, during the six months ended February 29, 2016, the Advisor waived $30,910 of its advisory fees and reimbursed $12,669 of Institutional Shares expenses and $12,503 of Investor Shares expenses for WST Asset Manager – U.S. Equity Fund. The Advisor has entered into an Expense Limitation Agreement with the Trust under which it has agreed to waive its fees and to assume other expenses of WST Asset Manager – U.S. Bond Fund, if necessary, in an amount that limits the annual operating expenses of the Fund (exclusive of interest, taxes, brokerage commissions, extraordinary expenses, acquired fund fees and expenses and payments, if any, under a Rule 12b-1 distribution plan) to not more than 1.15% of the average daily net assets allocable to each Class until January 1, 2018. There were no fee waivers or expense reimbursements required for WST Asset Manager – U.S. Bond Fund during the six months ended February 29, 2016. Any fee waivers and expense reimbursements by the Advisor are not subject to recoupment. It is expected that each Fund’s Expense Limitation Agreement will continue from year-to-year provided such continuance is approved by the Board. The Board may terminate the Expense Limitation
25
WST INVESTMENT TRUST
NOTES TO FINANCIAL STATEMENTS (Continued)
Agreement of either Fund at any time. The Advisor may also terminate each Fund’s Expense Limitation Agreement at the end of the then-current term upon not less than 90 days’ notice to the Trust.
OTHER SERVICE PROVIDERS
Ultimus provides administration, accounting and transfer agency services to the Funds. The Funds pay Ultimus fees in accordance with the agreements for such services. In addition, the Funds pay out-of-pocket expenses including, but not limited to, postage, supplies and costs of pricing the Funds’ portfolio securities.
Under the terms of a Distribution Agreement with the Trust, UFD serves as the principal underwriter to the Funds. UFD is a wholly-owned subsidiary of Ultimus.
DISTRIBUTION PLAN
Each Fund has adopted a Distribution Plan (the “Plan”) in accordance with Rule 12b-1 under the 1940 Act that allows Investor Shares of each Fund to pay for certain expenses related to the distribution of such Shares, including, but not limited to, payments to securities dealers and other persons (including UFD and its affiliates) who are engaged in the sale of Investor Shares of the Funds or who render shareholder support services not otherwise provided by Ultimus. The annual limitation for payment of expenses pursuant to the Plan is 0.25% per annum of each Fund’s average daily net assets allocable to Investor Shares. During the six months ended February 29, 2016, $1,245 and $51,112 of expenses were incurred under the Plan by Investor Shares of WST Asset Manager – U.S. Equity Fund and WST Asset Manager – U.S. Bond, respectively.
5. Investment in Other Investment Companies
Each Fund may invest a significant portion of its assets in shares of one or more investment companies, including open-end mutual funds, money market mutual funds and exchange-traded funds (“ETFs”). The Funds will incur additional indirect expenses due to acquired fund fees and expenses to the extent it invests in shares of other investment companies. From time to time, each Fund may invest greater than 25% of its net assets in one or more investment companies. As of February 29, 2016, the iShares 3-7 Year Treasury Bond ETF and the iShares Core U.S. Aggregate Bond ETF each represented 48.1% of the WST Asset Manager – U.S. Equity Fund’s net assets. As of February 29, 2016, Fidelity Institutional Money Market Funds - Government Portfolio – Class I, First American Treasury Obligations Fund – Class Z and Invesco Short-Term Investments Trust – Treasury Portfolio – Institutional Shares represented 26.5%, 25.7% and 25.8%, respectively, of WST Asset Manager – U.S. Bond Fund’s net assets. Additional information for these securities, including their financial statements, is available from the Securities and Exchange Commission’s website at www.sec.gov. As of February 29, 2016, WST Asset Manager – U.S. Equity Fund and WST Asset
26
WST INVESTMENT TRUST
NOTES TO FINANCIAL STATEMENTS (Continued)
Manager – U.S. Bond Fund had 96.2% and 40.8%, respectively, of the value of their net assets invested in ETFs and WST Asset Manager – U.S. Bond Fund had 78.0% of the value of its net assets invested in money market mutual funds.
6. Contingencies and Commitments
The Funds indemnify the Trust’s officers and Trustees for certain liabilities that might arise from their performance of their duties to the Funds. Additionally, in the normal course of business, the Funds enter into contracts that contain a variety of representations and warranties and which provide general indemnifications. The maximum exposure under these arrangements is unknown, as this would involve future claims that may be made against the Funds that have not yet occurred.
7. Subsequent Events
The Funds are required to recognize in the financial statements the effects of all subsequent events that provide additional evidence about conditions that existed as of the date of the Statements of Assets and Liabilities. For non-recognized subsequent events that must be disclosed to keep the financial statements from being misleading, the Funds are required to disclose the nature of the event as well as an estimate of its financial effect, or a statement that such an estimate cannot be made. Management has evaluated subsequent events through the issuance of these financial statements and has noted no such events.
27
WST INVESTMENT TRUST
ABOUT YOUR FUNDS’ EXPENSES (Unaudited)
We believe it is important for you to understand the impact of costs on your investment. All mutual funds have operating expenses. As a shareholder of the Funds, you incur ongoing costs, including management fees, class specific expenses (such as Rule 12b-1 distribution fees) and other operating expenses. The following examples are intended to help you understand your ongoing costs (in dollars) of investing in the Funds and to compare these costs with the ongoing costs of investing in other mutual funds.
A mutual fund’s ongoing costs are expressed as a percentage of its average net assets. This figure is known as the expense ratio. The expenses in the table that follows are based on an investment of $1,000 made at the beginning of the most recent period (September 1, 2015) and held until the end of the period (February 29, 2016).
The table that follows illustrates each Fund’s ongoing costs in two ways:
Actual fund return – This section helps you to estimate the actual expenses that you paid over the period. The “Ending Account Value” shown is derived from each Fund’s actual return, and the fourth column shows the dollar amount of operating expenses that would have been paid by an investor who started with $1,000 in the Funds. You may use the information here, together with the amount you invested, to estimate the expenses that you paid over the period.
To do so, simply divide your account value by $1,000 (for example, an $8,600 account value divided by $1,000 = 8.6), then multiply the result by the number given for the Fund under the heading “Expenses Paid During Period.”
Hypothetical 5% return – This section is intended to help you compare each Fund’s ongoing costs with those of other mutual funds. It assumes that each Fund had an annual return of 5% before expenses during the period shown, but that the expense ratio is unchanged. In this case, because the return used is not the Funds’ actual return, the results do not apply to your investment. The example is useful in making comparisons because the SEC requires all mutual funds to calculate expenses based on a 5% return. You can assess each Fund’s ongoing costs by comparing this hypothetical example with the hypothetical examples that appear in shareholder reports of other funds.
Note that expenses shown in the table are meant to highlight and help you compare ongoing costs only. The Funds do not charge transaction fees, such as purchase or redemption fees, and do not charge a “sales load.” The calculations assume no shares were bought or sold during the period. Your actual costs may have been higher or lower, depending on the amount of your investment and the timing of any purchases or redemptions.
More information about each Fund’s expenses can be found in this report. For additional information on operating expenses and other shareholder costs, please refer to each Fund’s prospectus.
28
WST INVESTMENT TRUST
ABOUT YOUR FUNDS’ EXPENSES (Unaudited) (Continued)
WST Asset Manager - U.S. Equity Fund | Beginning | Ending | Net Expense | Expenses |
Institutional Class | ||||
Actual Fund Return | $1,000.00 | $959.80 | 1.25% | $6.09 |
Hypothetical 5% Return (before expenses) | $1,000.00 | $1,018.65 | 1.25% | $6.27 |
Investor Class | ||||
Actual Fund Return | $1,000.00 | $958.90 | 1.50% | $7.31 |
Hypothetical 5% Return (before expenses) | $1,000.00 | $1,017.40 | 1.50% | $7.52 |
WST Asset Manager - U.S. Bond Fund | Beginning | Ending | Net Expense | Expenses |
Institutional Class | ||||
Actual Fund Return | $1,000.00 | $996.60 | 1.03% | $5.11 |
Hypothetical 5% Return (before expenses) | $1,000.00 | $1,019.74 | 1.03% | $5.17 |
Investor Class | ||||
Actual Fund Return | $1,000.00 | $995.10 | 1.24% | $6.15 |
Hypothetical 5% Return (before expenses) | $1,000.00 | $1,018.70 | 1.24% | $6.22 |
(a) | Annualized, based on the Fund’s most recent one-half year expenses. |
(b) | Expenses are equal to each Fund’s annualized expense ratio multiplied by the average account value over the period, multiplied by 182/366 (to reflect the one-half year period). |
29
WST INVESTMENT TRUST
OTHER INFORMATION (Unaudited)
The Trust files a complete listing of each Fund’s portfolio holdings with the Securities and Exchange Commission (the “SEC”) as of the end of the first and third quarters of each fiscal year on Form N-Q. These filings are available free of charge upon request by calling the Trust toll-free at 1-866-515-4626. Furthermore, you may obtain a copy of these filings on the SEC’s website at http://www.sec.gov. The Trust’s Forms N-Q may also be reviewed and copied at the SEC’s Public Reference Room in Washington, DC, and information on the operation of the Public Reference Room may be obtained by calling 1-800-SEC-0330.
A description of the policies and procedures that the Funds use to determine how to vote proxies relating to portfolio securities is available without charge upon request by calling the Trust toll-free at 1-866-515-4626, or on the SEC’s website at http://www.sec.gov. Information regarding how the Funds voted proxies relating to portfolio securities during the most recent 12-month period ended June 30 is available without charge upon request by calling the Trust toll-free at 1-866-515-4626, or on the SEC’s website at http://www.sec.gov.
30
WST INVESTMENT TRUST
APPROVAL OF INVESTMENT ADVISORY
AGREEMENTS (Unaudited)
The Board of Trustees (the “Board”), including the Trustees who are not “interested persons,” as defined by the 1940 Act (the “Independent Trustees”), of the Trust voting separately, has reviewed and approved the continuance of the Investment Advisory Agreements (the “Advisory Agreements”) with Wilbanks, Smith and Thomas Asset Management, LLC (the “Advisor”) for the WST Asset Manager – U.S. Equity Fund (the “Equity Fund”) and the WST Asset Manager – U.S. Bond Fund (the “Bond Fund”) for an additional annual term. Approval took place at an in-person meeting held on October 28, 2015, at which a majority of the Trustees, including a majority of the Independent Trustees, were present.
In the course of their deliberations, the Board was advised by legal counsel. The Board received and reviewed a substantial amount of information provided by the Advisor in response to requests of the Board and counsel (the “Advisor Memorandum”).
In considering the Advisory Agreements for the Equity Fund and the Bond Fund and reaching their conclusions with respect thereto, the Board reviewed and analyzed various factors that it determined were relevant, including the factors described below.
The nature, extent, and quality of the services provided by the Advisor. In this regard, the Board reviewed the services being provided by the Advisor to each of the Equity Fund and the Bond Fund including, without limitation, its investment advisory services since the Fund’s inception, its coordination of services for the Fund among the Fund’s service providers, its compliance procedures and practices, and its efforts to promote the Fund and assist in its distribution. The Board also noted that the Trust’s president, chief compliance officer and principal executive officer are employees of the Advisor, and serve the Trust without additional compensation from the Funds. After reviewing the foregoing information and further information in the Advisor Memorandum (e.g., descriptions of the Advisor’s business and the Advisor’s Form ADV), the Board concluded that the quality, extent, and nature of the services provided by the Advisor are satisfactory and adequate for the Equity Fund and the Bond Fund.
The investment performance of the Equity Fund, the Bond Fund and the Advisor. In this regard, the Board compared the performance of each of the Equity Fund and the Bond Fund with the performance of its respective benchmark index, comparable funds managed by other advisors and comparable peer group indices. The Board noted that the Equity Fund and Bond Fund each outperformed their benchmarks and their peer groups for the twelve months ended September 30, 2015. The Board also considered the consistency of the Advisor’s management of the Equity Fund and the Bond Fund with each Fund’s investment objective and policies. Following discussion of the short- and long-term investment performance of the Equity Fund and the Bond Fund, the Advisor’s experience in managing each Fund and separate accounts, the Advisor’s historical investment performance and other factors, the Board concluded that the investment performance of the Equity Fund, the Bond Fund and the Advisor has been acceptable.
31
WST INVESTMENT TRUST
APPROVAL OF INVESTMENT ADVISORY
AGREEMENTS (Unaudited) (Continued)
The costs of the services provided and profits realized by the Advisor from its relationship with the Equity Fund and the Bond Fund. In this regard, the Board considered the Advisor’s staffing, personnel, and methods of operating; the Advisor’s compliance policies and procedures; the financial condition of the Advisor and the level of commitment to the Equity Fund and the Bond Fund by the Advisor and by the principals of the Advisor; the asset levels of the Equity Fund and the Bond Fund; the Advisor’s previous payment of startup costs for the Equity Fund and the Bond Fund; the overall expenses of the Equity Fund and the Bond Fund; and the differences in fees and services provided to the Advisor’s other clients that may be similar to the Equity Fund or the Bond Fund. The Board considered the Expense Limitation Agreements of the Equity Fund and the Bond Fund with the Advisor, and considered the Advisor’s current and past fee waivers and expense reimbursements with respect to the Equity Fund. The Board further took into account that the Advisor has represented that it intends to continue the Expense Limitation Agreements for the Equity Fund and the Bond Fund until at least January 1, 2018.
The Board also considered potential benefits to the Advisor in managing the Equity Fund and the Bond Fund, including promotion of the Advisor’s name and the ability of the Advisor to place small accounts into each Fund. The Board compared the fees and expenses of the Equity Fund and the Bond Fund (including each Fund’s management fee) to a peer group of other funds comparable to each Fund in terms of the type of fund, the style of investment management, the size of the fund and the nature of the investment strategy and markets invested in, among other factors. The Board noted that the management fee and net expense ratio of the Equity Fund was higher than the median and average of its peer group. The Board noted that although the Bond Fund’s expense ratio is higher than the median and average of its peer group, the management fee is lower than the median and average of the peer group. The Board considered the investment style and strategy of each Fund versus its peer group. The Board also compared the fees paid by each Fund to the fees paid by other clients of the Advisor, and considered the similarities and differences of services received by such clients as compared to the services being provided the Fund. Following these comparisons and upon further consideration and discussion of the foregoing, the Board concluded that the management fees paid to the Advisor by each of the Equity Fund and the Bond Fund are fair and reasonable.
The extent to which economies of scale would be realized as the Equity Fund and the Bond Fund grow and whether management fee levels reflect these economies of scale for the benefit of each Fund’s investors. In this regard, the Board considered that the fee arrangements of each of the Equity Fund and the Bond Fund with the Advisor involve both a management fee and an Expense Limitation Agreement. In connection with each of the Equity Fund and the Bond Fund, the Board determined that, while the management fee remains the same at all asset levels, each Fund may experience benefits
32
WST INVESTMENT TRUST
APPROVAL OF INVESTMENT ADVISORY
AGREEMENTS (Unaudited) (Continued)
from the Expense Limitation Agreement. In addition, the Board noted that the Equity Fund and the Bond Fund will each benefit from economies of scale under its agreements with service providers other than the Advisor. Following further consideration of the asset levels of the Equity Fund and the Bond Fund and expectations for growth and levels of fees, the Board determined that each Fund’s fee arrangements with the Advisor continue to provide benefits through the Expense Limitation Agreements and that, at the Funds’ current and projected asset levels for the next year, each Fund’s arrangements with the Advisor are fair and reasonable.
The Advisor’s practices regarding brokerage and portfolio transactions. In this regard, the Board considered the Advisor’s standards, and performance in utilizing those standards, to seek best execution for Fund portfolio transactions, including the use of alternative markets (e.g., direct purchases from issuers or underwriters or, as to equity securities, “third market” for listed securities and principal market makers for over-the counter securities). The Board considered the historical portfolio turnover rates for the Equity Fund and the Bond Fund; the process by which evaluations are made of the overall reasonableness of commissions paid; the method and basis for selecting and evaluating the broker-dealers used; any anticipated allocation of portfolio business to persons affiliated with the Advisor; and the extent to which the Funds allocate portfolio business to broker-dealers who provide research, statistical or other services (“soft dollars”). The Board determined that the Advisor’s practices regarding brokerage and portfolio transactions are satisfactory.
Possible conflicts of interest. In evaluating the possibility for conflicts of interest, the Board considered such matters as the experience and abilities of the advisory personnel assigned to the Equity Fund and the Bond Fund; the basis of decisions to buy or sell securities for the Funds and/or the Advisor’s other accounts; the method for bunching of portfolio securities transactions; and the substance and administration of the Advisor’s code of ethics. Following consideration of the foregoing, the Board found the Advisor’s standards and practices relating to the identification and mitigation of potential conflicts of interests to be satisfactory.
Conclusion
After full consideration of the above factors as well as other factors, the Board unanimously concluded that approval of the Advisory Agreements was in the best interests of each of the Equity Fund and the Bond Fund and its shareholders.
33
| Item 2. | Code of Ethics. |
| Item 3. | Audit Committee Financial Expert. |
| Item 4. | Principal Accountant Fees and Services. |
| Item 5. | Audit Committee of Listed Registrants. |
| Item 6. | Schedule of Investments. |
| (a) | Not applicable [schedule filed with Item 1] |
| (b) | Not applicable |
| Item 7. | Disclosure of Proxy Voting Policies and Procedures for Closed-End Management Investment Companies. |
| Item 8. | Portfolio Managers of Closed-End Management Investment Companies. |
| Item 9. | Purchases of Equity Securities by Closed-End Management Investment Company and Affiliated Purchasers. |
| Item 10. | Submission of Matters to a Vote of Security Holders. |
| Item 11. | Controls and Procedures. |
| Item 12. | Exhibits. |
| Exhibit 99.CERT | Certifications required by Rule 30a-2(a) under the Act |
| Exhibit 99.906CERT | Certifications required by Rule 30a-2(b) under the Act |
| (Registrant) | WST Investment Trust | ||
| By (Signature and Title)* | /s/ Wayne F. Wilbanks | ||
| Wayne F. Wilbanks, President | |||
| Date | April 21, 2016 | ||
| Pursuant to the requirements of the Securities Exchange Act of 1934 and the Investment Company Act of 1940, this report has been signed below by the following persons on behalf of the registrant and in the capacities and on the dates indicated. | |||
| By (Signature and Title)* | /s/ Wayne F. Wilbanks | ||
| Wayne F. Wilbanks, President | |||
| Date | April 21, 2016 | ||
| By (Signature and Title)* | /s/ Theresa M. Bridge | ||
| Theresa M. Bridge, Treasurer and Principal Financial Officer | |||
| Date | April 21, 2016 | ||
| * | Print the name and title of each signing officer under his or her signature. |