| OMB APPROVAL |
OMB Number: 3235-0570
Expires: August 31, 2020
Estimated average burden hours per response: 20.6 |
UNITED STATES
SECURITIES AND EXCHANGE COMMISSION
Washington, D.C. 20549
FORM N-CSR
CERTIFIED SHAREHOLDER REPORT OF REGISTERED
MANAGEMENT INVESTMENT COMPANIES
| Investment Company Act file number | 811-22858 |
| WST Investment Trust |
| (Exact name of registrant as specified in charter) |
| 150 W. Main Street, Suite 1700 Norfolk, VA | 23510-1666 |
| (Address of principal executive offices) | (Zip code) |
Simon H. Berry, Esq.
| Ultimus Fund Solutions, LLC 225 Pictoria Drive, Suite 450 Cincinnati, Ohio 45246 |
| (Name and address of agent for service) |
| Registrant's telephone number, including area code: | (866) 515-4626 |
| Date of fiscal year end: | August 31 | |
| Date of reporting period: | February 28, 2019 |
Form N-CSR is to be used by management investment companies to file reports with the Commission not later than 10 days after the transmission to stockholders of any report that is required to be transmitted to stockholders under Rule 30e-1 under the Investment Company Act of 1940 (17 CFR 270.30e-1). The Commission may use the information provided on Form N-CSR in its regulatory, disclosure review, inspection, and policymaking roles.
A registrant is required to disclose the information specified by Form N-CSR, and the Commission will make this information public. A registrant is not required to respond to the collection of information contained in Form N-CSR unless the Form displays a currently valid Office of Management and Budget ("OMB") control number. Please direct comments concerning the accuracy of the information collection burden estimate and any suggestions for reducing the burden to the Secretary, Securities and Exchange Commission, 450 Fifth Street, NW, Washington, DC 20549-0609. The OMB has reviewed this collection of information under the clearance requirements of 44 U.S.C. § 3507.
| Item 1. | Reports to Stockholders. |

WST INVESTMENT TRUST
WSTCM SECTOR SELECT
RISK-MANAGED FUND
WSTCM CREDIT SELECT
RISK-MANAGED FUND
Semi-Annual Report
February 28, 2019
(Unaudited)
Investment Adviser | Administrator |
Beginning on January 1, 2021, as permitted by regulations adopted by the U.S. Securities and Exchange Commission, paper copies of the Funds’ shareholder reports like this one will no longer be sent by mail, unless you specifically request paper copies of the reports from the Funds or from your financial intermediary, such as a broker-dealer or bank. Instead, the reports will be made available on a website, and you will be notified by mail each time a report is posted and provided with a website link to access the report.
If you already elected to receive shareholder reports electronically, you will not be affected by this change and you need not take any action. You may elect to receive shareholder reports and other communications from the Funds electronically by contacting the Funds at 1-866-515-4626 or, if you own these shares through a financial intermediary, by contacting your financial intermediary.
You may elect to receive all future reports in paper free of charge. You can inform the Funds that you wish to continue receiving paper copies of your shareholder reports by contacting the Funds at 1-866-515-4626. If you own shares through a financial intermediary, you may contact your financial intermediary or follow instructions included with this document to elect to continue to receive paper copies of your shareholder reports. Your election to receive reports in paper will apply to all Funds held with the Fund complex or at your financial intermediary.
WST INVESTMENT TRUST |
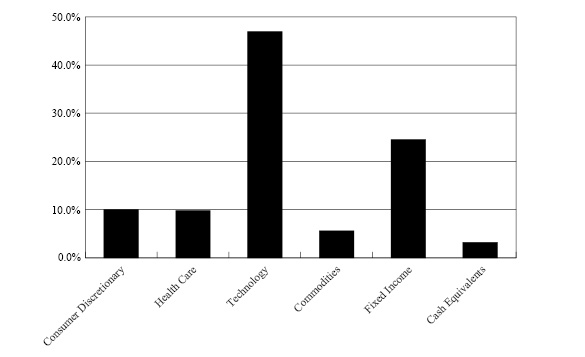
WSTCM Sector Select Risk-Managed Fund
Sector Diversification
(% of Net Assets)
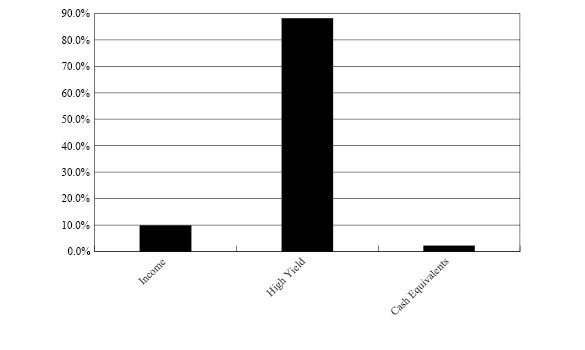
WSTCM Credit Select Risk-Managed Fund
Investment Strategy Allocation
(% of Net Assets)
1
WSTCM SECTOR SELECT RISK-MANAGED FUND | ||||||||
EXCHANGE-TRADED FUNDS — 96.8% | Shares | Value | ||||||
Invesco S&P 500 Equal Weight Consumer Discretionary ETF | 14,275 | $ | 1,469,611 | |||||
Invesco S&P 500 Equal Weight Health Care ETF | 7,313 | 1,443,513 | ||||||
Invesco S&P 500 Equal Weight Technology ETF (a) | 41,567 | 6,929,219 | ||||||
iShares 3-7 Year Treasury Bond ETF | 6,065 | 737,079 | ||||||
iShares Short Treasury Bond ETF | 12,903 | 1,426,298 | ||||||
Janus Henderson Short Duration Income ETF | 14,560 | 720,138 | ||||||
JPMorgan Ultra-Short Income ETF | 14,671 | 736,777 | ||||||
SPDR® Gold Shares (b) | 6,619 | 820,690 | ||||||
TOTAL EXCHANGE-TRADED FUNDS (Cost $14,200,955) | $ | 14,283,325 | ||||||
| ||||||||
MONEY MARKET FUNDS — 1.5% | Shares | Value | ||||||
Fidelity Institutional Money Market Government Portfolio - Class I, 2.29% (c) | 75,944 | $ | 75,944 | |||||
First American Treasury Obligations Fund - Class Z, 2.28% (c) | 73,711 | 73,711 | ||||||
Invesco Short-Term Investments Trust - Treasury Portfolio - Institutional Class, 2.29% (c) | 73,711 | 73,711 | ||||||
TOTAL MONEY MARKET FUNDS (Cost $223,366) | $ | 223,366 | ||||||
TOTAL INVESTMENTS AT VALUE — 98.3% (Cost $14,424,321) | $ | 14,506,691 | ||||||
OTHER ASSETS IN EXCESS OF LIABILITIES — 1.7% | 251,729 | |||||||
NET ASSETS — 100.0% | $ | 14,758,420 | ||||||
(a) | Represents 25% or more of net assets (Note 6). |
(b) | Non-income producing security. |
(c) | The rate shown is the 7-day effective yield as of February 28, 2019. |
See accompanying notes to financial statements. | |
2
WSTCM CREDIT SELECT RISK-MANAGED FUND | ||||||||
EXCHANGE-TRADED FUNDS — 37.5% | Shares | Value | ||||||
Invesco Fundamental High Yield Corporate Bond ETF | 409,612 | $ | 7,602,399 | |||||
iShares 0-5 Year High Yield Corporate Bond ETF | 86,348 | 4,023,817 | ||||||
PIMCO 0-5 Year High Yield Corporate Bond Index ETF | 40,395 | 4,028,997 | ||||||
VanEck Vectors Fallen Angel High Yield Bond ETF | 267,886 | 7,664,218 | ||||||
TOTAL EXCHANGE-TRADED FUNDS (Cost $23,075,450) | $ | 23,319,431 | ||||||
| ||||||||
OPEN-END FUNDS — 60.4% | Shares | Value | ||||||
American High-Income Trust - Class F-2 | 604,348 | $ | 6,103,917 | |||||
Fidelity Advisor Floating Rate High Income Fund - Class I | 1 | 6 | ||||||
First Eagle High Yield Fund - Class I | 231,481 | 2,023,148 | ||||||
Guggenheim Floating Rate Strategies Fund - Institutional Class | 1 | 4 | ||||||
Lord Abbett Floating Rate Fund - Class I | 1 | 9 | ||||||
MainStay MacKay Short Duration High Yield Fund - Class I | 617,688 | 6,059,521 | ||||||
PGIM High Yield Fund - Class Z | 943,150 | 5,074,148 | ||||||
PIMCO High Yield Spectrum Fund - Institutional Class | 421,331 | 4,074,276 | ||||||
Pioneer High Yield Fund - Class Y | 539,018 | 5,066,767 | ||||||
Transamerica High Yield Bond Fund - Class I | 338,693 | 3,044,851 | ||||||
Vanguard High-Yield Corporate Fund - Admiral Shares | 1,063,082 | 6,091,462 | ||||||
Voya Floating Rate Fund - Class I | 1 | 7 | ||||||
TOTAL OPEN-END FUNDS (Cost $37,050,165) | $ | 37,538,116 | ||||||
See accompanying notes to financial statements. |
3
WSTCM CREDIT SELECT RISK-MANAGED FUND | ||||||||
MONEY MARKET FUNDS — 2.4% | Shares | Value | ||||||
Fidelity Institutional Money Market Government Portfolio - Class I, 2.29% (a) | 505,780 | $ | 505,780 | |||||
First American Treasury Obligations Fund - Class Z, 2.28% (a) | 490,826 | 490,826 | ||||||
Invesco Short-Term Investments Trust - Treasury Portfolio - Institutional Class, 2.29% (a) | 490,746 | 490,746 | ||||||
TOTAL MONEY MARKET FUNDS (Cost $1,487,352) | $ | 1,487,352 | ||||||
TOTAL INVESTMENTS AT VALUE — 100.3% (Cost $61,612,967) | �� | $ | 62,344,899 | |||||
LIABILITIES IN EXCESS OF OTHER ASSETS — (0.3%) | (178,398 | ) | ||||||
NET ASSETS — 100.0% | $ | 62,166,501 | ||||||
(a) | The rate shown is the 7-day effective yield as of February 28, 2019. |
See accompanying notes to financial statements. | |
4
WST INVESTMENT TRUST | ||||||||
| Sector Select | Credit Select | ||||||
ASSETS | ||||||||
Investments in securities: | ||||||||
At cost | $ | 14,424,321 | $ | 61,612,967 | ||||
At value (Note 2) | $ | 14,506,691 | $ | 62,344,899 | ||||
Cash | — | 26,031 | ||||||
Receivable for capital shares sold | — | 30,456 | ||||||
Receivable for securities sold | 8,596,736 | — | ||||||
Dividends receivable | 5,380 | 159,963 | ||||||
Receivable from Adviser (Note 4) | 7,575 | — | ||||||
Other assets | 28,257 | 31,869 | ||||||
TOTAL ASSETS | 23,144,639 | 62,593,218 | ||||||
LIABILITIES | ||||||||
Payable for capital shares redeemed | — | 388,772 | ||||||
Payable for investment securities purchased | 8,372,872 | — | ||||||
Payable to Adviser (Note 4) | — | 11,673 | ||||||
Payable to Administrator (Note 4) | 7,610 | 10,840 | ||||||
Accrued distribution fees (Note 4) | 158 | 8,952 | ||||||
Other accrued expenses | 5,579 | 6,480 | ||||||
TOTAL LIABILITIES | 8,386,219 | 426,717 | ||||||
NET ASSETS | $ | 14,758,420 | $ | 62,166,501 | ||||
NET ASSETS CONSIT OF: | ||||||||
Paid-in capital | $ | 15,691,588 | $ | 64,876,874 | ||||
Accumulated deficit | (933,168 | ) | (2,710,373 | ) | ||||
NET ASSETS | $ | 14,758,420 | $ | 62,166,501 | ||||
PRICING OF INSTITUTIONAL SHARES | ||||||||
Net assets applicable to Institutional Shares | $ | 13,931,827 | $ | 16,331,530 | ||||
Shares of Institutional Shares outstanding (no par value, unlimited number of shares outstanding) | 1,418,990 | 1,641,141 | ||||||
Net asset value, offering and redemption price per share (Note 2) | $ | 9.82 | $ | 9.95 | ||||
PRICING OF INVESTOR SHARES | ||||||||
Net assets applicable to Investor Shares | $ | 826,593 | $ | 45,834,971 | ||||
Shares of Investor Shares outstanding (no par value, unlimited number of shares outstanding) | 85,017 | 4,621,322 | ||||||
Net asset value, offering and redemption price per share (Note 2) | $ | 9.72 | $ | 9.92 | ||||
See accompanying notes to financial statements. |
5
WST INVESTMENT TRUST | ||||||||
| Sector Select | Credit Select | ||||||
INVESTMENT INCOME | ||||||||
Dividends | $ | 148,955 | $ | 1,399,927 | ||||
EXPENSES | ||||||||
Investment advisory fees (Note 4) | 56,674 | 220,283 | ||||||
Distribution fees, Investor Class (Note 5) | 1,046 | 68,625 | ||||||
Professional fees | 27,302 | 27,302 | ||||||
Administration fees (Note 4) | 15,000 | 36,629 | ||||||
Registration and filing fees | 20,512 | 21,173 | ||||||
Fund accounting fees (Note 4) | 18,752 | 21,668 | ||||||
Transfer agent fees, Institutional Class (Note 4) | 6,000 | 6,000 | ||||||
Transfer agent fees, Investor Class (Note 4) | 6,000 | 9,000 | ||||||
Trustees’ fees and expenses (Note 4) | 4,792 | 4,792 | ||||||
Custodian and bank service fees | 2,750 | 5,973 | ||||||
Insurance expense | 3,762 | 3,762 | ||||||
Printing of shareholder reports | 2,395 | 5,118 | ||||||
Other expenses | 7,100 | 1,058 | ||||||
TOTAL EXPENSES | 172,085 | 431,383 | ||||||
Fee waivers and expense reimbursements by the Adviser (Note 4) | (76,584 | ) | — | |||||
NET EXPENSES | 95,501 | 431,383 | ||||||
NET INVESTMENT INCOME | 53,454 | 968,544 | ||||||
REALIZED AND UNREALIZED GAINS (LOSSES) ON INVESTMENTS | ||||||||
Net realized losses from investment transactions | (1,064,826 | ) | (1,661,976 | ) | ||||
Long-term capital gain distributions from regulated investment companies | — | 797 | ||||||
Net change in unrealized appreciation (depreciation) on investments | (362,986 | ) | 823,598 | |||||
NET REALIZED AND UNREALIZED LOSSES ON INVESTMENTS | (1,427,812 | ) | (837,581 | ) | ||||
NET INCREASE (DECREASE) IN NET ASSETS RESULTING FROM OPERATIONS | $ | (1,374,358 | ) | $ | 130,963 | |||
See accompanying notes to financial statements. |
6
WSTCM SECTOR SELECT RISK-MANAGED FUND | ||||||||
| Six Months | Year | ||||||
FROM OPERATIONS | ||||||||
Net investment income (loss) | $ | 53,454 | $ | (12,644 | ) | |||
Net realized gains (losses) from investments | (1,064,826 | ) | 1,664,791 | |||||
Net change in unrealized appreciation (depreciation) on investments | (362,986 | ) | 44,627 | |||||
Net increase (decrease) in net assets resulting from operations | (1,374,358 | ) | 1,696,774 | |||||
DISTRIBUTIONS TO SHAREHOLDERS (Note 2) | ||||||||
Institutional Shares | (1,510,149 | ) | (71,980 | ) | ||||
Investor Shares | (88,822 | ) | (3,996 | ) | ||||
Decrease in net assets from distributions to shareholders | (1,598,971 | ) | (75,976 | ) | ||||
CAPITAL SHARE TRANSACTIONS | ||||||||
Institutional Shares | ||||||||
Proceeds from shares sold | 84,955 | 46,700 | ||||||
Net asset value of shares issued in reinvestment of distributions | 1,510,149 | 71,980 | ||||||
Payments for shares redeemed | (537,893 | ) | (1,376,715 | ) | ||||
Net increase (decrease) in Institutional Shares net assets from capital share transactions | 1,057,211 | (1,258,035 | ) | |||||
Investor Shares | ||||||||
Proceeds from shares sold | 600 | 23,523 | ||||||
Net asset value of shares issued in reinvestment of distributions | 88,822 | 3,996 | ||||||
Payments for shares redeemed | (3,258 | ) | (15,536 | ) | ||||
Net increase in Investor Shares net assets from capital share transactions | 86,164 | 11,983 | ||||||
TOTAL INCREASE (DECREASE) IN NET ASSETS | (1,829,954 | ) | 374,746 | |||||
NET ASSETS | ||||||||
Beginning of period | 16,588,374 | 16,213,628 | ||||||
End of period | $ | 14,758,420 | $ | 16,588,374 | ||||
(a) | The presentation of Distributions to Shareholders has been updated to reflect the changes prescribed in amendments to Regulation S-X, effective November 5, 2018 (Note 2). For the year ended August 31, 2018, distributions to shareholders was from realized capital gains on investments for each class. Accumulated net investment loss as of August 31, 2018 was $0. |
See accompanying notes to financial statements. | |
7
WSTCM SECTOR SELECT RISK-MANAGED FUND | ||||||||
| Six Months | Year | ||||||
CAPITAL SHARE ACTIVITY | ||||||||
Institutional Shares | ||||||||
Shares sold | 8,740 | 4,145 | ||||||
Shares reinvested | 155,206 | 6,237 | ||||||
Shares redeemed | (52,425 | ) | (122,050 | ) | ||||
Net increase (decrease) in shares outstanding | 111,521 | (111,668 | ) | |||||
Shares outstanding, beginning of period | 1,307,469 | 1,419,137 | ||||||
Shares outstanding, end of period | 1,418,990 | 1,307,469 | ||||||
Investor Shares | ||||||||
Shares sold | 56 | 2,061 | ||||||
Shares reinvested | 9,214 | 348 | ||||||
Shares redeemed | (321 | ) | (1,348 | ) | ||||
Net increase in shares outstanding | 8,949 | 1,061 | ||||||
Shares outstanding, beginning of period | 76,068 | 75,007 | ||||||
Shares outstanding, end of period | 85,017 | 76,068 | ||||||
See accompanying notes to financial statements. |
8
WSTCM CREDIT SELECT RISK-MANAGED FUND | ||||||||
| Six Months | Year | ||||||
FROM OPERATIONS | ||||||||
Net investment income | $ | 968,544 | $ | 3,260,818 | ||||
Net realized losses from investments | (1,661,976 | ) | (1,863,566 | ) | ||||
Long term capital gain distributions from regulated investment companies | 797 | 4,325 | ||||||
Net change in unrealized appreciation (depreciation) on investments | 823,598 | (881,931 | ) | |||||
Net increase in net assets resulting from operations | 130,963 | 519,646 | ||||||
DISTRIBUTIONS TO SHAREHOLDERS (Note 2) | ||||||||
Institutional Shares | (629,594 | ) | (2,858,825 | ) | ||||
Investor Shares | (1,961,426 | ) | (3,548,487 | ) | ||||
Decrease in net assets from distributions to shareholders | (2,591,020 | ) | (6,407,312 | ) | ||||
CAPITAL SHARE TRANSACTIONS | ||||||||
Institutional Shares | ||||||||
Proceeds from shares sold | 1,119,658 | 17,763,209 | ||||||
Net asset value of shares issued in reinvestment of distributions | 628,182 | 2,858,484 | ||||||
Payments for shares redeemed | (9,946,370 | ) | (40,096,868 | ) | ||||
Net decrease in Institutional Shares net assets from capital share transactions | (8,198,530 | ) | (19,475,355 | ) | ||||
Investor Shares | ||||||||
Proceeds from shares sold | 1,127,828 | 10,017,839 | ||||||
Net asset value of shares issued in reinvestment of distributions | 1,961,180 | 3,548,487 | ||||||
Payments for shares redeemed | (18,199,310 | ) | (7,296,232 | ) | ||||
Net increase (decrease) in Investor Shares net assets from capital share transactions | (15,110,302 | ) | 6,270,094 | |||||
TOTAL DECREASE IN NET ASSETS | (25,768,889 | ) | (19,092,927 | ) | ||||
NET ASSETS | ||||||||
Beginning of period | 87,935,390 | 107,028,317 | ||||||
End of period | $ | 62,166,501 | $ | 87,935,390 | ||||
(a) | The presentation of Distributions to Shareholders has been updated to reflect the changes prescribed in amendments to Regulation S-X, effective November 5, 2018 (Note 2). For the year ended August 31, 2018, distributions to shareholders for Institutional Shares consisted of $1,638,144 of net investment income and $1,220,681 of realized capital gains on investments, and for the Investor Shares consisted of $1,975,165 of net investment income and $1,573,322 of realized capital gains on investments. Undistributed net investment income as of August 31, 2018 was $1,852,018. |
See accompanying notes to financial statements. | |
9
WSTCM CREDIT SELECT RISK-MANAGED FUND | ||||||||
| Six Months | Year | ||||||
CAPITAL SHARE ACTIVITY | ||||||||
Institutional Shares | ||||||||
Shares sold | 111,483 | 1,691,093 | ||||||
Shares reinvested | 64,165 | 280,518 | ||||||
Shares redeemed | (975,355 | ) | (3,898,150 | ) | ||||
Net decrease in shares outstanding | (799,707 | ) | (1,926,539 | ) | ||||
Shares outstanding, beginning of period | 2,440,848 | 4,367,387 | ||||||
Shares outstanding, end of period | 1,641,141 | 2,440,848 | ||||||
Investor Shares | ||||||||
Shares sold | 112,776 | 967,671 | ||||||
Shares reinvested | 200,941 | 348,917 | ||||||
Shares redeemed | (1,833,485 | ) | (708,870 | ) | ||||
Net increase (decrease) in shares outstanding | (1,519,768 | ) | 607,718 | |||||
Shares outstanding, beginning of period | 6,141,090 | 5,533,372 | ||||||
Shares outstanding, end of period | 4,621,322 | 6,141,090 | ||||||
See accompanying notes to financial statements. |
10
WSTCM SECTOR SELECT RISK-MANAGED FUND | ||||||||||||||||||||||||
Per Share Data for a Share Outstanding Throughout Each Period | ||||||||||||||||||||||||
| Six Months | Year | Year | Year | Year | Period | ||||||||||||||||||
Net asset value at beginning of period | $ | 11.99 | $ | 10.85 | $ | 10.36 | $ | 10.85 | $ | 10.68 | $ | 10.00 | ||||||||||||
Income (loss) from investment operations: | ||||||||||||||||||||||||
Net investment income (loss) (b) | 0.04 | (c) | (0.01 | )(c) | (0.01 | ) | 0.03 | 0.01 | 0.01 | |||||||||||||||
Net realized and unrealized gains (losses) on investments | (1.04 | ) | 1.20 | 0.52 | (0.16 | ) | 0.26 | 0.69 | ||||||||||||||||
Total from investment operations | (1.00 | ) | 1.19 | 0.51 | (0.13 | ) | 0.27 | 0.70 | ||||||||||||||||
Less distributions: | ||||||||||||||||||||||||
From net investment income | — | — | (0.02 | ) | (0.02 | ) | (0.03 | ) | (0.02 | ) | ||||||||||||||
From net realized capital gains | (1.17 | ) | (0.05 | ) | — | (0.34 | ) | (0.07 | ) | — | ||||||||||||||
Total distributions | (1.17 | ) | (0.05 | ) | (0.02 | ) | (0.36 | ) | (0.10 | ) | (0.02 | ) | ||||||||||||
Net asset value at end of period | $ | 9.82 | $ | 11.99 | $ | 10.85 | $ | 10.36 | $ | 10.85 | $ | 10.68 | ||||||||||||
Total return (d) | (8.26 | %)(e) | 11.02 | % | 4.96 | % | (1.26 | %) | 2.51 | % | 6.97 | %(e) | ||||||||||||
Net assets at end of period (000’s) | $ | 13,932 | $ | 15,683 | $ | 15,404 | $ | 16,805 | $ | 16,969 | $ | 11,034 | ||||||||||||
Ratios/supplementary data: | ||||||||||||||||||||||||
Ratio of total expenses to average net assets (f) | 2.14 | %(g) | 1.88 | % | 1.82 | % | 1.74 | % | 1.84 | % | 2.85 | %(g) | ||||||||||||
Ratio of net expenses to average net assets(f) (h) | 1.25 | %(g) | 1.25 | % | 1.25 | % | 1.25 | % | 1.25 | % | 1.25 | %(g) | ||||||||||||
Ratio of net investment income (loss) to average | 0.72 | %(g) | (0.06 | %) | (0.04 | %) | 0.24 | % | 0.04 | % | 0.03 | %(g) | ||||||||||||
Portfolio turnover rate | 341 | %(e) | 268 | % | 346 | % | 472 | % | 150 | % | 348 | %(e) | ||||||||||||
(a) | Represents the period from the commencement of operations (December 16, 2013) through August 31, 2014. |
(b) | Recognition of net investment income (loss) by the Fund is affected by the timing of the declaration of the dividends by the underlying investment companies in which the Fund invests. |
(c) | Net investment income (loss) loss per share has been calculated using the average daily shares outstanding during the period. |
(d) | Total return is a measure of the change in value of an investment in the Fund over the periods covered, which assumes any dividends and capital gain distributions are reinvested in shares of the Fund. The returns shown do not reflect the deduction of taxes a shareholder would pay on Fund distributions, if any, or the redemption of Fund shares. |
(e) | Not annualized. |
(f) | Ratio does not include expenses of the investment companies in which the Fund invests. |
(g) | Annualized. |
(h) | Ratio was determined after advisory fee waivers and expense reimbursements (Note 4). |
See accompanying notes to financial statements. | |
11
WSTCM SECTOR SELECT RISK-MANAGED FUND | ||||||||||||||||||||||||
Per Share Data for a Share Outstanding Throughout Each Period | ||||||||||||||||||||||||
| Six Months | Year | Year | Year | Year | Period | ||||||||||||||||||
Net asset value at beginning of period | $ | 11.90 | $ | 10.80 | $ | 10.33 | $ | 10.83 | $ | 10.68 | $ | 10.00 | ||||||||||||
Income (loss) from investment operations: | ||||||||||||||||||||||||
Net investment income (loss) (b) | 0.03 | (c) | (0.04 | )(c) | (0.04 | ) | (0.00 | )(d) | (0.01 | ) | (0.01 | ) | ||||||||||||
Net realized and unrealized gains (losses) on investments | (1.04 | ) | 1.19 | 0.52 | (0.15 | ) | 0.24 | 0.70 | ||||||||||||||||
Total from investment operations | (1.01 | ) | 1.15 | 0.48 | (0.15 | ) | 0.23 | 0.69 | ||||||||||||||||
Less distributions: | ||||||||||||||||||||||||
From net investment income | — | — | (0.01 | ) | (0.01 | ) | (0.01 | ) | (0.01 | ) | ||||||||||||||
From net realized capital gains | (1.17 | ) | (0.05 | ) | — | (0.34 | ) | (0.07 | ) | — | ||||||||||||||
Total distributions | (1.17 | ) | (0.05 | ) | (0.01 | ) | (0.35 | ) | (0.08 | ) | (0.01 | ) | ||||||||||||
Net asset value at end of period | $ | 9.72 | $ | 11.90 | $ | 10.80 | $ | 10.33 | $ | 10.83 | $ | 10.68 | ||||||||||||
Total return (e) | (8.41 | %)(f) | 10.70 | % | 4.69 | % | (1.44 | %) | 2.16 | % | 6.86 | %(f) | ||||||||||||
Net assets at end of period (000’s) | $ | 827 | $ | 906 | $ | 810 | $ | 945 | $ | 1,002 | $ | 410 | ||||||||||||
Ratios/supplementary data: | ||||||||||||||||||||||||
Ratio of total expenses to average net assets (g) | 4.70 | %(h) | 5.31 | % | 5.06 | % | 4.50 | % | 5.96 | % | 15.21 | %(h) | ||||||||||||
Ratio of net expenses to average net assets (g) (i) | 1.50 | %(h) | 1.50 | % | 1.50 | % | 1.50 | % | 1.50 | % | 1.50 | %(h) | ||||||||||||
Ratio of net investment income (loss) to average net assets (b) (i) | 0.47 | %(h) | (0.32 | %) | (0.28 | %) | (0.01 | %) | (0.23 | %) | (0.28 | %)(h) | ||||||||||||
Portfolio turnover rate | 341 | %(f) | 268 | % | 346 | % | 472 | % | 150 | % | 348 | %(f) | ||||||||||||
(a) | Represents the period from the commencement of operations (December 16, 2013) through August 31, 2014. |
(b) | Recognition of net investment income (loss) by the Fund is affected by the timing of the declaration of the dividends by the underlying investment companies in which the Fund invests. |
(c) | Net investment income (loss) per share has been calculated using the average daily shares outstanding during the period. |
(d) | Amount rounds to less than $0.01 per share. |
(e) | Total return is a measure of the change in value of an investment in the Fund over the periods covered, which assumes any dividends and capital gain distributions are reinvested in shares of the Fund. The returns shown do not reflect the deduction of taxes a shareholder would pay on Fund distributions, if any, or the redemption of Fund shares. |
(f) | Not annualized. |
(g) | Ratio does not include expenses of the investment companies in which the Fund invests. |
(h) | Annualized. |
(i) | Ratio was determined after advisory fee waivers and expense reimbursements (Note 4). |
See accompanying notes to financial statements. | |
12
WSTCM CREDIT SELECT RISK-MANAGED FUND | ||||||||||||||||||||
Per Share Data for a Share Outstanding Throughout Each Period | ||||||||||||||||||||
| Six Months | Year | Year | Year | Period | |||||||||||||||
Net asset value at beginning of period | $ | 10.28 | $ | 10.83 | $ | 10.71 | $ | 9.72 | $ | 10.00 | ||||||||||
Income (loss) from investment operations: | ||||||||||||||||||||
Net investment income (b) | 0.14 | (c) | 0.34 | (c) | 0.33 | 0.21 | 0.16 | |||||||||||||
Net realized and unrealized gains (losses) on investments | (0.10 | ) | (0.24 | ) | 0.13 | 0.79 | (0.27 | ) | ||||||||||||
Total from investment operations | 0.04 | 0.10 | 0.46 | 1.00 | (0.11 | ) | ||||||||||||||
Less distributions: | ||||||||||||||||||||
From net investment income | (0.37 | ) | (0.37 | ) | (0.34 | ) | (0.01 | ) | (0.15 | ) | ||||||||||
From net realized capital gains | — | (0.28 | ) | — | — | (0.00 | )(d) | |||||||||||||
From return of capital | — | — | — | — | (0.02 | ) | ||||||||||||||
Total distributions | (0.37 | ) | (0.65 | ) | (0.34 | ) | (0.01 | ) | (0.17 | ) | ||||||||||
Net asset value at end of period | $ | 9.95 | $ | 10.28 | $ | 10.83 | $ | 10.71 | $ | 9.72 | ||||||||||
Total return (e) | 0.49 | %(f) | 0.97 | % | 4.40 | % | 10.27 | % | (1.11 | %)(f) | ||||||||||
Net assets at end of period (000’s) | $ | 16,332 | $ | 25,085 | $ | 47,308 | $ | 20,152 | $ | 14,951 | ||||||||||
Ratios/supplementary data: | ||||||||||||||||||||
Ratio of total expenses to average net assets (g) | 1.02 | %(h) | 0.91 | % | 0.97 | % | 1.04 | % | 1.11 | %(h) | ||||||||||
Ratio of net investment income to average net assets (b) | 2.89 | %(h) | 3.17 | % | 3.84 | % | 2.50 | % | 1.89 | %(h) | ||||||||||
Portfolio turnover rate | 247 | %(f) | 507 | % | 414 | % | 326 | % | 890 | %(f) | ||||||||||
(a) | Represents the period from the commencement of operations (September 30, 2014) through August 31, 2015. |
(b) | Recognition of net investment income by the Fund is affected by the timing of the declaration of the dividends by the underlying investment companies in which the Fund invests. |
(c) | Net investment income per share has been calculated using the average daily shares outstanding during the period. |
(d) | Amount rounds to less than $0.01 per share. |
(e) | Total return is a measure of the change in value of an investment in the Fund over the periods covered, which assumes any dividends and capital gain distributions are reinvested in shares of the Fund. The returns shown do not reflect the deduction of taxes a shareholder would pay on Fund distributions, if any, or the redemption of Fund shares. |
(f) | Not annualized. |
(g) | Ratio does not include expenses of the investment companies in which the Fund invests. |
(h) | Annualized. |
See accompanying notes to financial statements. | |
13
WSTCM CREDIT SELECT RISK-MANAGED FUND | ||||||||||||||||||||
Per Share Data for a Share Outstanding Throughout Each Period | ||||||||||||||||||||
| Six Months | Year | Year | Year | Period | |||||||||||||||
Net asset value at beginning of period | $ | 10.23 | $ | 10.79 | $ | 10.68 | $ | 9.72 | $ | 10.00 | ||||||||||
Income (loss) from investment operations: | ||||||||||||||||||||
Net investment income (b) | 0.13 | (c) | 0.32 | (c) | 0.37 | 0.21 | 0.14 | |||||||||||||
Net realized and unrealized gains (losses) on investments | (0.09 | ) | (0.25 | ) | 0.07 | 0.75 | (0.26 | ) | ||||||||||||
Total from investment operations | 0.04 | 0.07 | 0.44 | 0.96 | (0.12 | ) | ||||||||||||||
Less distributions: | ||||||||||||||||||||
From net investment income | (0.35 | ) | (0.35 | ) | (0.33 | ) | (0.00 | )(d) | (0.14 | ) | ||||||||||
From net realized capital gains | — | (0.28 | ) | — | — | (0.00 | )(d) | |||||||||||||
From return of capital | — | — | — | — | (0.02 | ) | ||||||||||||||
Total distributions | (0.35 | ) | (0.63 | ) | (0.33 | ) | (0.00 | )(d) | (0.16 | ) | ||||||||||
Net asset value at end of period | $ | 9.92 | $ | 10.23 | $ | 10.79 | $ | 10.68 | $ | 9.72 | ||||||||||
Total return (e) | 0.48 | %(f) | 0.64 | % | 4.26 | % | 9.91 | % | (1.22 | %)(f) | ||||||||||
Net assets at end of period (000’s) | $ | 45,835 | $ | 62,851 | $ | 59,721 | $ | 49,785 | $ | 41,389 | ||||||||||
Ratios/supplementary data: | ||||||||||||||||||||
Ratio of total expenses to average net assets (g) | 1.23 | %(h) | 1.16 | % | 1.21 | % | 1.24 | % | 1.27 | %(h) | ||||||||||
Ratio of net investment income to average net assets (b) | 2.56 | %(h) | 3.04 | % | 3.63 | % | 2.22 | % | 1.69 | %(h) | ||||||||||
Portfolio turnover rate | 247 | %(f) | 507 | % | 414 | % | 326 | % | 890 | %(f) | ||||||||||
(a) | Represents the period from the commencement of operations (September 30, 2014) through August 31, 2015. |
(b) | Recognition of net investment income by the Fund is affected by the timing of the declaration of the dividends by the underlying investment companies in which the Fund invests. |
(c) | Net investment income per share has been calculated using the average daily shares outstanding during the period. |
(d) | Amount rounds to less than $0.01 per share. |
(e) | Total return is a measure of the change in value of an investment in the Fund over the periods covered, which assumes any dividends and capital gain distributions are reinvested in shares of the Fund. The returns shown do not reflect the deduction of taxes a shareholder would pay on Fund distributions, if any, or the redemption of Fund shares. |
(f) | Not annualized. |
(g) | Ratio does not include expenses of the investment companies in which the Fund invests. |
(h) | Annualized. |
See accompanying notes to financial statements. | |
14
WST INVESTMENT TRUST
NOTES TO FINANCIAL STATEMENTS
February 28, 2019 (Unaudited)
1. Organization
WSTCM Sector Select Risk-Managed Fund and WSTCM Credit Select Risk-Managed Fund (individually, a “Fund” and collectively, the “Funds”) are each a diversified series of WST Investment Trust (the “Trust”), an open-end management investment company organized as a Delaware statutory trust and registered under the Investment Company Act of 1940, as amended (the “1940 Act”).
WSTCM Sector Select Risk-Managed Fund’s investment objective is to seek long-term capital appreciation, while maintaining a secondary emphasis on generating income.
WSTCM Credit Select Risk-Managed Fund’s investment objective is to seek total return from income and capital appreciation.
Each Fund offers two classes of shares (each a “Class” and collectively the “Classes”): Institutional Shares (sold without any sales loads or distribution fees, but available only to institutional investors and certain broker-dealers and financial institutions that have entered into appropriate arrangements with the Fund) and Investor Shares (sold without any sales loads, but subject to a distribution fee of up to 0.25% per annum of the average daily net assets attributable to Investor Shares). Each Class represents an ownership interest in the same investment portfolio.
2. Significant Accounting Policies
In August 2018, the U.S. Securities and Exchange Commission (the “SEC”) adopted regulations that eliminated or amended disclosure requirements that were redundant or outdated in light of changes in SEC requirements, accounting principles generally accepted in the United States of America (“GAAP”), International Financial Reporting Standards or changes in technology or the business environment. These regulations were effective November 5, 2018, and the Funds are complying with them effective with these financial statements.
The Funds follow accounting and reporting guidance under Financial Accounting Standards Board (“FASB”) Accounting Standards Codification (“ASC”) Topic 946, “Financial Services – Investment Companies.” The following is a summary of the Funds’ significant accounting policies used in the preparation of its financial statements. These policies are in conformity with GAAP.
New Accounting Pronouncement – In August 2018, FASB issued Accounting Standards Update No. 2018-13 (“ASU 2018-13”), “Disclosure Framework – Changes to the Disclosure Requirements for Fair Value Measurement,” which amends the fair value measurement disclosure requirements of ASC Topic 820 (“ASC 820”), “Fair Value Measurement.” ASU 2018-13 includes new, eliminated, and modified disclosure requirements for ASC 820. In addition, ASU 2018-13 clarifies that materiality is an appropriate consideration when evaluating disclosure requirements. ASU 2018-13 is
15
WST INVESTMENT TRUST
NOTES TO FINANCIAL STATEMENTS (Continued)
effective for fiscal years beginning after December 15, 2019, including interim periods therein. Early adoption is permitted and the Funds have adopted ASU 2018-13 with these financial statements.
Securities valuation – The Funds’ portfolio securities are valued as of the close of regular trading on the New York Stock Exchange (“NYSE”) (normally 4:00 p.m. Eastern Time) on each day that the NYSE is open for business. In determining the value of the Funds’ assets, portfolio securities, including exchange-traded funds (“ETFs”), are generally valued at market using quotations from the primary market in which they are traded. The Funds normally use third party pricing services to obtain market quotations. To the extent a Fund is invested in other open-end investment companies, including money market funds, that are registered under the 1940 Act, the Fund’s net asset value per share (“NAV”) is calculated based upon the NAVs reported by such registered open-end investment companies, and the prospectuses for these companies explain the circumstances under which they will use fair value pricing and the effects of using fair value pricing. When using quoted prices or NAVs reported by underlying investment companies and when the market is considered to be active, securities will be classified as Level 1 (see below). Securities and assets for which market quotations are not readily available or which cannot be accurately valued using the Funds’ normal pricing procedures are valued at fair value as determined in good faith under policies established by, and under the direction of, the Trust’s Board of Trustees (the “Board”). Fair value pricing may be used, for example, in situations where (i) portfolio securities, such as securities with small capitalizations, are so thinly traded that there have been no transactions for that stock over an extended period of time; (ii) an event occurs after the close of the exchange on which the portfolio security is principally traded that is likely to change the value of the portfolio security prior to the calculation of the Funds’ NAVs; (iii) the exchange on which the portfolio security is principally traded closes early; or (iv) trading of the portfolio security is halted during the day and does not resume prior to the calculation of the Funds’ NAVs. In such cases, a portfolio security’s “fair value” price may differ from the price next available for that portfolio security using the Funds’ normal pricing procedures, and the fair value price may differ substantially from the price at which the security may ultimately be sold. Fair valued securities will be classified as Level 2 or 3 within the fair value hierarchy, depending on the inputs used.
GAAP establishes a single authoritative definition of fair value, sets out a framework for measuring fair value and requires additional disclosures about fair value measurements.
Various inputs are used in determining the value of the Funds’ investments. These inputs are summarized in the three broad levels listed below:
● | Level 1 – quoted prices in active markets for identical securities |
● | Level 2 – other significant observable inputs |
● | Level 3 – significant unobservable inputs |
16
WST INVESTMENT TRUST
NOTES TO FINANCIAL STATEMENTS (Continued)
The inputs or methodology used for valuing securities are not necessarily an indication of the risks associated with investing in those securities. The inputs used to measure fair value may fall into different levels of the fair value hierarchy. In such cases, for disclosure purposes, the level in the fair value hierarchy within which the fair value measurement falls in its entirety is determined based on the lowest level input that is significant to the fair value measurement.
The following is a summary of the inputs used to value each Fund’s investments as of February 28, 2019:
WSTCM Sector Select Risk-Managed Fund | Level 1 | Level 2 | Level 3 | Total | ||||||||||||
Exchange-Traded Funds | $ | 14,283,325 | $ | — | $ | — | $ | 14,283,325 | ||||||||
Money Market Funds | 223,366 | — | — | 223,366 | ||||||||||||
Total | $ | 14,506,691 | $ | — | $ | — | $ | 14,506,691 | ||||||||
WSTCM Credit Select Risk-Managed Fund | Level 1 | Level 2 | Level 3 | Total | ||||||||||||
Exchange-Traded Funds | $ | 23,319,431 | $ | — | $ | — | $ | 23,319,431 | ||||||||
Open-End Funds | 37,538,116 | — | — | 37,538,116 | ||||||||||||
Money Market Funds | 1,487,352 | — | — | 1,487,352 | ||||||||||||
Total | $ | 62,344,899 | $ | — | $ | — | $ | 62,344,899 | ||||||||
As of February 28, 2019, the Funds did not hold any derivatives or assets or liabilities that were measured at fair value on a recurring basis using significant unobservable inputs (Level 3).
Share valuation – The NAV per share of each Class of each Fund is calculated as of the close of trading on the NYSE (normally 4:00 p.m., Eastern Time) on each day the NYSE is open for business. The NAV of each Class of each Fund is calculated by dividing the total value of the assets attributable to that Class, less liabilities attributable to that Class, by the number of shares of that Class outstanding. The offering price and redemption price per share of each Class of each Fund is equal to the NAV of such Class.
Investment transactions and investment income – Investment transactions are accounted for on their trade date. Cost of investments sold is determined on a specific identification basis. Dividend income is recorded on the ex-dividend date. Interest income, if any, is accrued as earned and includes amortization of discounts and premiums.
Allocation between Classes – Investment income earned, realized capital gains and losses, and unrealized appreciation and depreciation are allocated daily to each Class of a Fund based upon its proportionate share of total net assets of that Fund. Class-specific
17
WST INVESTMENT TRUST
NOTES TO FINANCIAL STATEMENTS (Continued)
expenses are charged directly to the Class incurring the expense. Common expenses which are not attributable to a specific Class are allocated daily to each Class of shares of a Fund based upon its proportionate share of total net assets of that Fund.
Distributions to shareholders – Dividends arising from net investment income are declared and paid annually to shareholders of the Funds. Net realized short-term capital gains, if any, may be distributed throughout the year and net realized long-term capital gains, if any, are distributed at least once each year. The amount of distributions from net investment income and net realized capital gains are determined in accordance with income tax regulations, which may differ from GAAP, and are recorded on the ex-dividend date. The tax character of distributions paid to shareholders of each Fund during the periods ended February 28, 2019 and August 31, 2018 was as follows:
Period Ended | Ordinary | Long-Term | Total | |||||||||
WSTCM Sector Select Risk-Managed Fund | ||||||||||||
Institutional Shares | ||||||||||||
February 28, 2019 | $ | 960,781 | $ | 549,368 | $ | 1,510,149 | ||||||
August 31, 2018 | $ | — | $ | 71,980 | $ | 71,980 | ||||||
Investor Shares | ||||||||||||
February 28, 2019 | $ | 56,510 | $ | 32,312 | $ | 88,822 | ||||||
August 31, 2018 | $ | — | $ | 3,996 | $ | 3,996 | ||||||
WSTCM Credit Select Risk-Managed Fund | ||||||||||||
Institutional Shares | ||||||||||||
February 28, 2019 | $ | 629,594 | $ | — | $ | 629,594 | ||||||
August 31, 2018 | $ | 2,849,756 | $ | 9,069 | $ | 2,858,825 | ||||||
Investor Shares | ||||||||||||
February 28, 2019 | $ | 1,961,426 | $ | — | $ | 1,961,426 | ||||||
August 31, 2018 | $ | 3,536,798 | $ | 11,689 | $ | 3,548,487 | ||||||
Estimates – The preparation of financial statements in conformity with GAAP requires management to make estimates and assumptions that affect the reported amounts of assets and liabilities and the disclosure of contingent assets and liabilities as of the date of the financial statements and the reported amounts of income and expenses during the reporting period. Actual results could differ from those estimates.
Federal income tax – Each Fund has qualified and intends to continue to qualify each year as a “regulated investment company” under Subchapter M of the Internal Revenue Code of 1986, as amended (the “Code”). Qualification generally will relieve each Fund of liability for federal income taxes to the extent 100% of its net investment income and net realized capital gains are distributed in accordance with the Code.
18
WST INVESTMENT TRUST
NOTES TO FINANCIAL STATEMENTS (Continued)
In order to avoid imposition of the excise tax applicable to regulated investment companies, it is also each Fund’s intention to declare as dividends in each calendar year at least 98% of its net investment income (earned during the calendar year) and 98.2% of its net realized capital gains (earned during the twelve months ended October 31) plus undistributed amounts from prior years.
The following information is computed on a tax basis for each item as of February 28, 2019:
| WSTCM | WSTCM | ||||||
Tax cost of portfolio investments | $ | 14,424,321 | $ | 61,612,967 | ||||
Gross unrealized appreciation | $ | 83,682 | $ | 731,932 | ||||
Gross unrealized depreciation | (1,312 | ) | — | |||||
Net unrealized appreciation on investments | 82,370 | 731,932 | ||||||
Accumulated ordinary income | 53,454 | 229,542 | ||||||
Other losses | (1,068,992 | ) | (3,671,847 | ) | ||||
Accumulated deficit | $ | (933,168 | ) | $ | (2,710,373 | ) | ||
The Funds recognize the tax benefits or expenses of uncertain tax positions only when the position is “more likely than not” to be sustained assuming examination by tax authorities. Management has reviewed the Funds’ tax positions for the current and all open tax years (generally, three years) and has concluded that no provision for unrecognized tax benefits or expenses is required in these financial statements.
During the six months ended February 28, 2019, the Funds did not incur any interest or penalties. Generally, tax authorities can examine tax returns filed during the last three years. Each Fund identifies its major tax jurisdiction as U.S. Federal.
3. Investment Transactions
During the six months ended February 28, 2019, the cost of purchases of investment securities and the proceeds from sales of investment securities, other than short-term investments, amounted to $51,301,603 and $51,964,786, respectively, for WSTCM Sector Select Risk-Managed Fund and $140,060,512 and $166,084,403, respectively, for WSTCM Credit Select Risk-Managed Fund.
19
WST INVESTMENT TRUST
NOTES TO FINANCIAL STATEMENTS (Continued)
4. Transactions with Related Parties
The Managing Principal and Chief Investment Officer of Wilbanks, Smith & Thomas Asset Management, LLC, d/b/a WST Capital Management (the “Adviser”) and the chair of its Investment Committee is also the President and a Trustee of the Trust. Certain other officers of the Trust are also officers of the Adviser, or of Ultimus Fund Solutions, LLC (“Ultimus”), the Trust’s administrator, transfer agent, and fund accounting agent.
COMPENSATION OF TRUSTEES
Trustees of the Trust who are affiliated with the Adviser receive no fees from the Funds. Each Fund pays Trustees who are not affiliated with the Adviser a fee of $1,000 each year, plus $500 for each meeting attended in person and $250 for each meeting attended by telephone. The Funds reimburse each Trustee and officer of the Trust for his or her travel and other expenses related to attendance at Board or committee meetings, if any.
INVESTMENT ADVISORY AGREEMENT
Each Fund’s investments are managed by the Adviser pursuant to the terms of an Investment Advisory Agreement. Under the Investment Advisory Agreement, WSTCM Sector Select Risk-Managed Fund pays the Adviser an advisory fee, computed and accrued daily and paid monthly, at the annual rate of 0.75% of its average daily net assets and WSTCM Credit Select Risk-Managed Fund pays the Adviser an advisory fee, computed and accrued daily and paid monthly, at the annual rate of 0.60% of its average daily net assets.
The Adviser has entered into an Expense Limitation Agreement (“ELA”) with the Trust under which it has agreed to waive its fees and to assume other expenses of WSTCM Sector Select Risk-Managed Fund, if necessary, in an amount that limits the annual operating expenses of the Fund (exclusive of interest, taxes, brokerage fees and commissions, other expenditures that are capitalized in accordance with GAAP, acquired fund fees and expenses, other extraordinary expenses not incurred in the ordinary course of the Fund’s business, and payment, if any, under a Rule 12b-1 Distribution Plan) to not more than 1.25% of the average daily net assets allocable to each Class until January 1, 2020. Accordingly, during the six months ended February 28, 2019, the Adviser waived all of its advisory fees and reimbursed $19,910 of other expenses with respect to WSTCM Sector Select Risk-Managed Fund. The Adviser has entered into an ELA with the Trust under which it has agreed to waive its fees and to assume other expenses of WSTCM Credit Select Risk-Managed Fund, if necessary, in an amount that limits the annual operating expenses of the Fund (exclusive of interest, taxes, brokerage fees and commissions, extraordinary expenses, acquired fund fees and expenses and payments, if any, under a Rule 12b-1 distribution plan) to not more than 1.15% of the average daily net assets allocable to each Class until January 1, 2020. There were no fee waivers or expense reimbursements required with respect to WSTCM Credit Select Risk-Managed Fund during the six months ended February 28, 2019. Any fee waivers and expense reimbursements by the Adviser are not subject to recoupment. It is expected that each
20
WST INVESTMENT TRUST
NOTES TO FINANCIAL STATEMENTS (Continued)
Fund’s ELA will continue from year-to-year provided such continuance is approved by the Board. The Board may terminate the ELA of either Fund at any time. The Adviser may also terminate each Fund’s ELA at the end of the then-current term upon not less than 90 days’ notice to the Trust.
OTHER SERVICE PROVIDERS
Ultimus provides administration, accounting and transfer agency services to the Funds. The Funds pay Ultimus fees in accordance with the agreements for such services. In addition, the Funds pay out-of-pocket expenses including, but not limited to, postage, supplies and costs of pricing the Funds’ portfolio securities.
Under the terms of a Distribution Agreement with the Trust, Foreside Fund Services, LLC (“Foreside”) serves as the principal underwriter and exclusive agent for the distribution of shares of the Funds.
Pursuant to a Compliance Consulting Agreement with Graydon Compliance Solutions, LLC (“Graydon”), Graydon provides the Chief Compliance Officer and compliance services to the Trust. The Adviser, not the Funds, pays Graydon a fee for these services.
5. Distribution Plan
Each Fund has adopted a Distribution Plan (the “Plan”) in accordance with Rule 12b-1 under the 1940 Act that allows Investor Shares of each Fund to pay for certain expenses related to the distribution of such Shares, including, but not limited to, payments to securities dealers and other persons (including Foreside) who are engaged in the sale of Investor Shares of the Funds or who render shareholder support services not otherwise provided by Ultimus. The annual limitation for payment of expenses pursuant to the Plan is 0.25% per annum of each Fund’s average daily net assets allocable to Investor Shares. During the six months ended February 28, 2019, $1,046 and $68,625 of expenses were incurred under the Plan by Investor Shares of WSTCM Sector Select Risk-Managed Fund and WSTCM Credit Select Risk-Managed Fund, respectively.
6. Investment in Other Investment Companies
Each Fund may invest a significant portion of its assets in shares of one or more investment companies, including ETFs, open-end mutual funds and money market mutual funds. The Funds will incur additional indirect expenses (acquired fund fees and expenses) to the extent it invests in shares of other investment companies. As of February 28, 2019, WSTCM Sector Select Risk-Managed Fund had 96.8% of the value of its net assets invested in ETFs; in addition, 46.9% of the value of WSTCM Sector Select Risk-Managed Fund’s net assets is invested in Invesco S&P 500 Equal Weight Technology ETF (“RYT”) that invests in stocks of companies within the Information Technology sector. The financial statements of RYT can be found at www.sec.gov. As
21
WST INVESTMENT TRUST
NOTES TO FINANCIAL STATEMENTS (Continued)
of February 28, 2019, WST Credit Select Risk-Managed Fund had 37.5% of the value of its net assets invested in ETFs and had 60.4% of the value of its net assets invested in open-end mutual funds.
7. Contingencies and Commitments
The Funds indemnify the Trust’s officers and Trustees for certain liabilities that might arise from their performance of their duties to the Funds. Additionally, in the normal course of business, the Funds enter into contracts that contain a variety of representations and warranties and which provide general indemnifications. The maximum exposure under these arrangements is unknown, as this would involve future claims that may be made against the Funds that have not yet occurred.
8. Subsequent Events
The Funds are required to recognize in the financial statements the effects of all subsequent events that provide additional evidence about conditions that existed as of the date of the Statements of Assets and Liabilities. For non-recognized subsequent events that must be disclosed to keep the financial statements from being misleading, the Funds are required to disclose the nature of the event as well as an estimate of its financial effect, or a statement that such an estimate cannot be made. Management has evaluated subsequent events through the issuance of these financial statements and has noted no such events.
22
WST INVESTMENT TRUST
ABOUT YOUR FUNDS’ EXPENSES (Unaudited)
We believe it is important for you to understand the impact of costs on your investment. All mutual funds have operating expenses. As a shareholder of the Funds, you incur ongoing costs, including management fees, class specific expenses (such as Rule 12b-1 distribution fees) and other operating expenses. The following examples are intended to help you understand your ongoing costs (in dollars) of investing in the Funds and to compare these costs with the ongoing costs of investing in other mutual funds.
A mutual fund’s ongoing costs are expressed as a percentage of its average net assets. This figure is known as the expense ratio. The expenses in the table that follow are based on an investment of $1,000 made at the beginning of the most recent period (September 1, 2018) and held until the end of the period (February 28, 2019).
The table that follows illustrates each Fund’s ongoing costs in two ways:
Actual fund return – This section helps you to estimate the actual expenses that you paid over the period. The “Ending Account Value” shown is derived from each Fund’s actual return, and the fourth column shows the dollar amount of operating expenses that would have been paid by an investor who started with $1,000 in the Funds. You may use the information here, together with the amount you invested, to estimate the expenses that you paid over the period.
To do so, simply divide your account value by $1,000 (for example, an $8,600 account value divided by $1,000 = 8.6), then multiply the result by the number given for the Fund under the heading “Expenses Paid During Period.”
Hypothetical 5% return – This section is intended to help you compare each Fund’s ongoing costs with those of other mutual funds. It assumes that each Fund had an annual return of 5% before expenses during the period shown, but that the expense ratio is unchanged. In this case, because the return used is not the Funds’ actual return, the results do not apply to your investment. The example is useful in making comparisons because the SEC requires all mutual funds to calculate expenses based on a 5% return. You can assess each Fund’s ongoing costs by comparing this hypothetical example with the hypothetical examples that appear in shareholder reports of other funds.
Note that expenses shown in the table are meant to highlight and help you compare ongoing costs only. The Funds do not charge transaction fees, such as purchase or redemption fees, and do not charge a “sales load.” The calculations assume no shares were bought or sold during the period. Your actual costs may have been higher or lower, depending on the amount of your investment and the timing of any purchases or redemptions.
More information about each Fund’s expenses can be found in this report. For additional information on operating expenses and other shareholder costs, please refer to each Fund’s prospectus.
23
WST INVESTMENT TRUST
ABOUT YOUR FUNDS’ EXPENSES (Unaudited) (Continued)
WSTCM Sector Select Risk-Managed Fund | Beginning | Ending | Net | Expenses |
Institutional Class | ||||
Based on Actual Fund Return | $1,000.00 | $ 917.40 | 1.25% | $5.94 |
Based on Hypothetical 5% Return (before expenses) | $1,000.00 | $ 1,018.60 | 1.25% | $6.26 |
Investor Class | ||||
Based on Actual Fund Return | $1,000.00 | $ 915.90 | 1.50% | $7.13 |
Based on Hypothetical 5% Return (before expenses) | $1,000.00 | $ 1,017.36 | 1.50% | $7.50 |
WSTCM Credit Select | Beginning | Ending | Net | Expenses |
Institutional Class | ||||
Based on Actual Fund Return | $1,000.00 | $ 1,004.90 | 1.02% | $5.06 |
Based on Hypothetical 5% Return (before expenses) | $1,000.00 | $ 1,019.75 | 1.02% | $5.10 |
Investor Class | ||||
Based on Actual Fund Return | $1,000.00 | $ 1,004.80 | 1.23% | $6.11 |
Based on Hypothetical 5% Return (before expenses) | $1,000.00 | $ 1,018.70 | 1.23% | $6.15 |
(a) | Annualized, based on the Fund’s most recent one-half year expenses. |
(b) | Expenses are equal to each Fund’s annualized net expense ratio multiplied by the average account value over the period, multiplied by 181/365 (to reflect the one-half year period). |
24
WST INVESTMENT TRUST
OTHER INFORMATION (Unaudited)
The Trust files a complete listing of each Fund’s portfolio holdings with the SEC as of the end of the first and third quarters of each fiscal year on Form N-Q. These filings are available free of charge upon request by calling the Trust toll-free at 1-866-515-4626. Furthermore, you may obtain a copy of these filings on the SEC’s website at http://www.sec.gov.
A description of the policies and procedures that the Funds use to determine how to vote proxies relating to portfolio securities is available without charge upon request by calling the Trust toll-free at 1-866-515-4626, or on the SEC’s website at http://www.sec.gov. Information regarding how the Funds voted proxies relating to portfolio securities during the most recent 12-month period ended June 30 is available without charge upon request by calling the Trust toll-free at 1-866-515-4626, or on the SEC’s website at http://www.sec.gov.
This report and the financial statements contained herein are provided for the general information of the shareholders of the WSTCM Funds. This report is not authorized for distribution to prospective investors in the Fund unless preceded or accompanied by an effective prospectus.
WSTCM Funds are distributed by Foreside Fund Services, LLC
25
WST INVESTMENT TRUST
APPROVAL OF INVESTMENT ADVISORY
AGREEMENTS (Unaudited)
The Board, including the Trustees who are not “interested persons,” as defined by the 1940 Act, of the Trust (the “Independent Trustees”) voting separately, has reviewed and approved the continuance of the Investment Advisory Agreements (the “Advisory Agreements”) with Wilbanks, Smith and Thomas Asset Management, LLC, d/b/a WST Capital Management (the “Advisor”) for the WSTCM Sector Select Risk–Managed Fund (the “Sector Select RM Fund”) and the WSTCM Credit Select Risk–Managed Fund (the “Credit Select RM Fund”) for an additional annual term. Approval took place at an in-person meeting held on October 30, 2018, at which a majority of the Trustees, including a majority of the Independent Trustees, were present.
In the course of their deliberations, the Board was advised by legal counsel. The Board received and reviewed a substantial amount of information provided by the Advisor in response to requests of the Board and counsel (the “Advisor Memorandum”).
In considering the Advisory Agreement for the Sector Select RM Fund and the Credit Select RM Fund and reaching their conclusion with respect thereto, the Board recalled its review of the materials related to the Sector Select RM Fund and the Credit Select RM Fund and the Advisor during the preceding 12 months and its numerous discussions with management and the Advisor about the operation and performance of the Sector Select RM Fund and the Credit Select RM Fund during that period. The Board further considered those materials and discussions and numerous other factors, including the factors described below.
(i) | The nature, extent, and quality of the services provided by the Advisor. In this regard, the Board reviewed the services being provided by the Advisor to each of the Funds including, without limitation, its investment advisory services since each Fund’s inception, its coordination of services for the Funds among the Funds’ service providers, and its efforts to promote the Funds and assist in their distribution. The Board also noted that the Trust’s president, principal executive officer and vice president are employees of the Advisor and serve the Trust without additional compensation from the Funds. After reviewing the foregoing information and further information in the Advisor Memorandum (e.g., descriptions of the Advisor’s business and the Advisor’s Form ADV), the Board concluded that the quality, extent, and nature of the services provided by the Advisor are satisfactory and adequate for the Funds. |
(ii) | The investment performance of the Sector Select RM Fund, the Credit Select RM Fund and the Advisor. In this regard, the Board compared the performance of each of the Funds with the performance of each Fund’s respective benchmark index, comparable funds managed by other advisors, comparable separate accounts managed by the Advisor, and comparable peer group indices. The Board noted that while the Sector Select RM Fund had underperformed its benchmark (S&P 500 Index) for the one year period ended September 30, 2018 and outperformed |
26
WST INVESTMENT TRUST
APPROVAL OF INVESTMENT ADVISORY
AGREEMENTS (Unaudited) (Continued)
the average and underperformed the median of its Morningstar category (U.S. Funds Allocation 75% to 85% Equity - under $50 million) for the same one year period, the Advisor had satisfactorily explained its performance results for the Sector Select RM Fund. The Board also noted that while the Credit Select RM Fund had underperformed its benchmark (Bloomberg Barclays U.S. Corporate High Yield Bond Index) for the one year period ended September 30, 2018 and outperformed the average and underperformed the median of its Morningstar category (U.S. Funds Nontraditional Bond – over $75 million) for the same one year period, the Advisor had satisfactorily explained it performance results for the Credit Select RM Fund. The Board also considered the consistency of the Advisor’s management of the Sector Select RM Fund and the Credit Select RM Fund with each Fund’s investment objective and policies. Following discussion of the short- and long-term investment performance of the Funds, the Advisor’s experience in managing each Fund and separate accounts, the Advisor’s historical investment performance and other factors, the Board concluded that the investment performance of the Sector Select RM Fund, the Credit Select RM Fund and the Advisor has been acceptable.
(iii) | The costs of the services provided and profits to be realized by the Advisor from its relationship with the Funds. In this regard, the Board considered the Advisor’s staffing, personnel, and methods of operating; the financial condition of the Advisor and the level of commitment to the Funds by the Advisor and by the principals of the Advisor; the asset levels of the Funds; the Advisor’s previous payment of startup costs for the Funds; the overall expenses of the Funds, including the advisory fees; and the differences in fees and services provided to the Advisor’s other clients that may be similar to the Sector Select RM Fund or the Credit Select RM Fund. The Board considered its discussion with the Advisor regarding the Expense Limitation Agreements of the Sector Select RM Fund and the Credit Select RM Fund and considered the Advisor’s current and past fee waivers and expense reimbursements with respect to the Funds. The Board further took into account that the Advisor has represented that it intends to continue the Expense Limitation Agreements for the Funds until at least January 1, 2020. |
The Board also considered potential benefits to the Advisor in managing the Funds, including promotion of the Advisor’s name and the ability of the Advisor to place small accounts managed by the Advisor into each Fund. The Board compared the fees and expenses of each Fund (including the Fund’s management fee) to the average and median advisory fees and expense ratios of its Morningstar category and other funds within the Morningstar category comparable to each Fund. In considering the comparison of fees and expense ratios between the Funds and comparable funds, the Board looked at the differences in the types of funds being |
27
WST INVESTMENT TRUST
APPROVAL OF INVESTMENT ADVISORY
AGREEMENTS (Unaudited) (Continued)
compared, the style of investment management, the size of comparable funds and the nature of the investment strategies. With regard to the Sector Select RM Fund, the Board noted that the management fee of the Sector Select RM Fund was lower than the average and median of the funds in its Morningstar category (U.S. Funds Allocation 75% to 85% Equity - under $50 million). The Board also noted that its net expense ratio was higher than the average and median of the funds in its Morningstar category, but less than the highest net expense ratio in its Morningstar category. With regard to the Credit Select RM Fund, the Board noted that the management fee of the Credit Select RM Fund was lower than the average and equal to the median of the funds in its Morningstar category (U.S. Funds Nontraditional Bond over $75 million) and the Credit Select RM Fund’s net expense ratio was higher than the median and average of the funds in its Morningstar category, but less than the highest expense ratio in its Morningstar category. The Board also compared the fees paid by each Fund to the fees paid by other clients of the Advisor and considered the similarities and differences of services received by such clients as compared to the services being provided the Fund. The Board noted that the fee structures applicable to the Advisor’s other clients were not indicative of any unreasonableness with respect to the advisory fees being paid by each Fund under their respective Advisory Agreements. Following these comparisons and upon further consideration and discussion of the foregoing, the Board concluded that the management fees paid to the Advisor by the Funds are each fair and reasonable.
(iv) | The extent to which economies of scale would be realized as the Funds grow and whether management fee levels reflect these economies of scale for the benefit of each Fund’s investors. In this regard, the Board considered that the fee arrangements of the Sector Select RM Fund and the Credit Select RM Fund with the Advisor each involve both a management fee and an Expense Limitation Agreement. In connection with each Fund, the Board determined that, while the management fee remained the same at all asset levels, each Fund has experienced benefits from its Expense Limitation Agreement. In addition, the Board noted that the Funds will each benefit from economies of scale under the Trust’s agreements with service providers other than the Advisor. Following further discussion of the asset levels of the Funds and expectations for growth and levels of fees, the Board determined that each Fund’s fee arrangement with the Advisor is fair and reasonable. |
(v) | The Advisor’s practices regarding brokerage and portfolio transactions. In this regard, the Board considered the Advisor’s policies and procedures, and performance in utilizing those standards, to seek best execution for the Funds’ portfolio transactions. The Board considered the historical portfolio turnover rates for the Funds; the process by which evaluations are made of the overall |
28
WST INVESTMENT TRUST
APPROVAL OF INVESTMENT ADVISORY
AGREEMENTS (Unaudited) (Continued)
reasonableness of commissions paid; the method and basis for selecting and evaluating the broker-dealers used; any anticipated allocation of portfolio business to persons affiliated with the Advisor; and the extent to which the Funds allocate portfolio business to broker-dealers who provide research, statistical or other services (“soft dollars”). After further review and discussion, the Board determined that the Advisor’s practices regarding brokerage and portfolio transactions are satisfactory.
(vi) | Possible conflicts of interest. In evaluating the possibility for conflicts of interest, the Board considered such matters as the experience and abilities of the advisory personnel assigned to the Sector Select RM Fund and the Credit Select RM Fund; the basis of decisions to buy or sell securities for the Funds and/or the Advisor’s other accounts; the method for bunching of portfolio securities transactions; and the substance and administration of the Advisor’s code of ethics. Following further consideration and discussion, the Board found for each Fund that the Advisor’s standards and practices relating to the identification and mitigation of potential conflicts of interests to be satisfactory. |
(vii) | Other topics or issues. In this regard, the Board considered the Advisor’s compliance policies and procedures and the Advisor’s retention of Graydon Compliance Solutions, LLC to provide compliance services and a chief compliance officer for the Advisor and the Funds. The Board also considered the Advisor’s insurance coverage, its risk management program, and its regulatory history. After consideration and discussion, the Board found these topics and issues to be satisfactory. |
Conclusion
After full consideration of the above factors, as well as other factors, the Board, including the Independent Trustees, unanimously concluded that approval of the Advisory Agreements was in the best interests of the Sector Select RM Fund, the Credit Select RM Fund and each Fund’s shareholders. It was noted that in the Trustees’ deliberation regarding the approval of the renewal of the Advisory Agreements, the Trustees did not identify any particular information or factor that was all-important or controlling, and that each individual Trustee may have attributed different weights to the various factors listed above.
29
| Item 2. | Code of Ethics. |
Not required
| Item 3. | Audit Committee Financial Expert. |
Not required
| Item 4. | Principal Accountant Fees and Services. |
Not required
| Item 5. | Audit Committee of Listed Registrants. |
Not applicable
| Item 6. | Schedule of Investments. |
| (a) | Not applicable [schedule filed with Item 1] |
| (b) | Not applicable |
| Item 7. | Disclosure of Proxy Voting Policies and Procedures for Closed-End Management Investment Companies. |
Not applicable
| Item 8. | Portfolio Managers of Closed-End Management Investment Companies. |
Not applicable
| Item 9. | Purchases of Equity Securities by Closed-End Management Investment Company and Affiliated Purchasers. |
Not applicable
| Item 10. | Submission of Matters to a Vote of Security Holders. |
The registrant’s Committee of Independent Trustees shall review shareholder recommendations for nominations to fill vacancies on the registrant’s board of trustees if such recommendations are submitted in writing and addressed to the Committee at the registrant’s offices. The Committee may adopt, by resolution, a policy regarding its procedures for considering candidates for the board of trustees, including any recommended by shareholders.
| Item 11. | Controls and Procedures. |
(a) Based on their evaluation of the registrant’s disclosure controls and procedures (as defined in Rule 30a-3(c) under the Investment Company Act of 1940) as of a date within 90 days of the filing date of this report, the registrant’s principal executive officer and principal financial officer have concluded that such disclosure controls and procedures are reasonably designed and are operating effectively to ensure that material information relating to the registrant, including its consolidated subsidiaries, is made known to them by others within those entities, particularly during the period in which this report is being prepared, and that the information required in filings on Form N-CSR is recorded, processed, summarized, and reported on a timely basis.
(b) There were no changes in the registrant’s internal control over financial reporting (as defined in Rule 30a-3(d) under the Investment Company Act of 1940) that occurred during the second fiscal quarter of the period covered by this report that have materially affected, or are reasonably likely to materially affect, the registrant’s internal control over financial reporting.
| Item 12. | Disclosure of Securities Lending Activities for Closed-End Management Investment Companies. |
Not applicable
| Item 13. | Exhibits. |
File the exhibits listed below as part of this Form. Letter or number the exhibits in the sequence indicated.
(a)(1) Any code of ethics, or amendment thereto, that is the subject of the disclosure required by Item 2, to the extent that the registrant intends to satisfy the Item 2 requirements through filing of an exhibit: Not required
(a)(2) A separate certification for each principal executive officer and principal financial officer of the registrant as required by Rule 30a-2(a) under the Act (17 CFR 270.30a-2(a)): Attached hereto
(a)(3) Any written solicitation to purchase securities under Rule 23c-1 under the Act (17 CFR 270.23c-1) sent or given during the period covered by the report by or on behalf of the registrant to 10 or more persons: Not applicable
(a)(4) Change in the registrant’s independent public accountants: Not applicable
(b) Certifications required by Rule 30a-2(b) under the Act (17 CFR 270.30a-2(b)): Attached hereto
Exhibit 99.CERT Certifications required by Rule 30a-2(a) under the Act
Exhibit 99.906CERT Certifications required by Rule 30a-2(b) under the Act
SIGNATURES
Pursuant to the requirements of the Securities Exchange Act of 1934 and the Investment Company Act of 1940, the registrant has duly caused this report to be signed on its behalf by the undersigned, thereunto duly authorized.
| (Registrant) | WST Investment Trust | ||
| By (Signature and Title)* | /s/ Wayne F. Wilbanks | ||
| Wayne F. Wilbanks, President | |||
| Date | April 26, 2019 | ||
| Pursuant to the requirements of the Securities Exchange Act of 1934 and the Investment Company Act of 1940, this report has been signed below by the following persons on behalf of the registrant and in the capacities and on the dates indicated. | |||
| By (Signature and Title)* | /s/ Wayne F. Wilbanks | ||
| Wayne F. Wilbanks, President | |||
| Date | April 26, 2019 | ||
| By (Signature and Title)* | /s/ Theresa M. Bridge | ||
| Theresa M. Bridge, Treasurer and Principal Financial Officer | |||
| Date | April 26, 2019 | ||
| * | Print the name and title of each signing officer under his or her signature. |