UNITED STATES
SECURITIES AND EXCHANGE COMMISSION
Washington, D.C. 20549
FORM N-CSR
CERTIFIED SHAREHOLDER REPORT OF REGISTERED MANAGEMENT
INVESTMENT COMPANIES
Investment Company Act File Number 811-22882
BMO LGM Frontier Markets Equity Fund
(Exact name of registrant as specified in charter)
111 East Kilbourn Avenue, Suite 200
Milwaukee, WI 53202
(Address of principal executive offices) (Zip code)
John M. Blaser
BMO Asset Management Corp.
111 East Kilbourn Avenue, Suite 200
Milwaukee, WI 53202
(Name and address of agent for service)
Copies to:
Michael P. O’Hare, Esq.
Stradley, Ronon, Stevens & Young, LLP
2005 Market Street, Suite 2600
Philadelphia, PA 19103
Registrant’s telephone number, including area code: (800) 236-3863
Date of fiscal year end: August 31
Date of reporting period: August 31, 2014
Item 1. Reports to Stockholders.
The following is a copy of the report transmitted to shareholders pursuant to Rule 30e-1 under the Investment Company Act of 1940, as amended (the “Act”) (17 CFR 270.30e-1).
BMO LGM
Frontier Markets Equity Fund
Annual Report
August 31, 2014


Table of Contents
| | | | |
Not FDIC Insured | | No Bank Guarantee | | May Lose Value |
| | |
| Annual Report — Commentary | | BMO LGM Frontier Markets Equity Fund |
The BMO LGM Frontier Markets Equity Fund (the Fund) returned 4.60% for the period from inception (December 18, 2013) through August 31, 2014 versus the Blended Index, the Morgan Stanley Capital International (MSCI) Frontier Markets Index and the Lipper Emerging Markets Funds Index, which returned 16.03%, 21.20% and 10.96%, respectively. The Fund’s primary benchmark is a blended index comprised of 50% MSCI Frontier Markets Index and 50% MSCI Frontier Markets Index ex-Gulf Cooperation Council (GCC) countries.
A significant part of the underperformance this year came from the strong gains seen in Qatar and United Arab Emirates (UAE) prior to their reclassification to emerging markets at the end of May. We made a long-term decision to place less emphasis on the GCC markets which may not benefit from consumers’ rise in disposable income in the same way as traditional frontier markets would. In general, we have also found it difficult, outside of Saudi Arabia, to find many high quality companies in the GCC region to invest in.
Decisions made by benchmark providers and short-term relative performance will in no way affect our process, which is to invest with a long-term horizon and on a bottom-up basis in the highest quality companies we identify in frontier markets. Our approach to growing the absolute value of our investors’ capital is almost certainly going to lead to periods of relative weakness, some of which will be out of our control as we continue to stay firm to our process. As long as our companies continue to move in the right direction, we can live with this.
Over the course of the last six months, the Fund has made three new investments. Two of these have been within the Financials sector – First Gulf Bank PJSC (2.6% of the Fund, 13%) in the UAE and BBVA Banco Continental SA (1.9% of the Fund, -1%) in Peru. Both of these banks have historically demonstrated a very tight grip on efficiency and also a culture focused on generating strong returns and not asking shareholders for new capital to fund their growth. The other investment is in the Consumer Staples sector and is PriceSmart, Inc. (2.1% of the Fund, -13%), an operator of membership warehouse clubs across Central America, Colombia, and the Caribbean.
We strongly believe that investing is all about trust and an important part of building trust and ensuring our companies are evolving in the right direction, is to continue to meet the management of our companies over and over again. The primary reason for our travels is to meet the companies that we are already invested in, or their competitors, and in the last nine months the team has traveled to 19 countries.
| | | | |
Cumulative total returns (%) | |
| | | Since
inception | |
| Investor Class | | | 4.60 | |
| Blended Index (50% MSCI Frontier Markets Index and 50% MSCI Frontier Markets ex-GCC Countries Index) | | | 16.03 | |
| MSCI Frontier Markets Index | | | 21.20 | |
| Lipper Emerging Market Funds Index | | | 10.96 | |
The performance data quoted represents past performance which is no guarantee of future results. Investment return and principal value will fluctuate so that an investor's shares, when redeemend, may be worth more or less than their original costs. Mutual fund performance changes over time and current performance may be lower or higher than what is stated. To receive current performance to the most recent month-end, please call 1-800-236-3863 or visit www.bmofunds.com.
The Fund's benchmark is a blended benchmark consisting of 50% Morgan Stanley Capital International (MSCI) Frontier Markets Index and 50% MSCI Frontier Markets ex Gulf Cooperation Council (GCC) Countries Index. The MSCI Frontier Markets Index is a free float-adjusted market capitalization index that is designed to measure equity market performance of frontier markets. This index consists of the following 24 frontier market country indices: Argentina, Bahrain, Bangladesh, Bulgaria, Croatia, Estonia, Jordan, Kenya, Kuwait, Lebanon, Lithuania, Morocco, Kazakhstan, Mauritius, Nigeria, Oman, Pakistan, Romania, Serbia, Slovenia, Sri Lanka, Tunisia, Ukraine and Vietnam. The MSCI GCC Countries Index aims to represent the universe of companies in 6 GCC equity markets: Bahrain, Kuwait, Oman, Qatar, Saudi Arabia and United Arab Emirates.
Lipper indices measure the performance of the 30 largest mutual funds in each respective fund category.
Investment Adviser:
BMO Asset Management Corp.
Sub-adviser:
LGM Investments Limited
| | | | | | | | | | | | | | | | |
| | | | | | | | | Inception date | | | Expenses (%) |
Share
class | | Ticker | | | CUSIP | | | | Gross | | Net |
| Investor (Y) | | | BLGFX | | | | 05578V102 | | | | 12/18/2013 | | | 3.60 | | 2.00 |
The net expense ratio shown reflects contractual expense limitations made by the Adviser, currently through December 31, 2014. The Adviser has committed to continue this arrangement through December 31, 2015. The Fund's return would have been lower without these contractual expense limitations.
| | | | |
Portfolio Sector Allocation | |
| Sector | | Fund (%) | |
| Consumer Discretionary | | | 5.9 | |
| Consumer Staples | | | 28.3 | |
| Energy | | | 4.4 | |
| Financials | | | 36.9 | |
| Industrials | | | 2.9 | |
| Materials | | | 4.0 | |
| Telecommunication Services | | | 6.3 | |
| Participation Notes | | | 8.7 | |
| Other Assets & Liabilities, Net | | | 2.6 | |
| Total | | | 100.0 | |
Portfolio composition will change due to ongoing management of the Fund. The percentages are based on net assets as of August 31, 2014 and may not necessarily reflect adjustments that are routinely made when presenting net assets for formal financial statement processes.
Growth of an assumed $10,000 investment
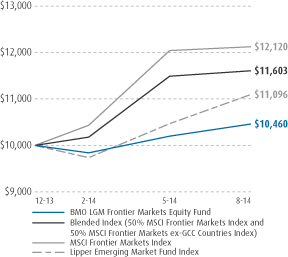
This graph illustrates the hypothetical investment of $10,000 from the Fund’s inception date, December 18, 2013, to August 31, 2014.
2
| | |
| Expense Example (Unaudited) | | |
For the Period March 1, 2014 through August 31, 2014
As a shareholder of the Fund, you may incur two types of costs: (1) transaction costs, which may include sales charges (loads) on purchase payments, reinvested dividends, or other distributions; redemption fees; and exchange fees; and (2) ongoing costs, including management fees; distribution and/or service (12b-1) fees; and other Fund expenses. This Example is intended to help you understand your ongoing costs (in dollars) of investing in the Funds and to compare these costs with the ongoing costs of investing in other mutual funds.
The Example is based on an investment of $1,000 invested at the beginning of the period and held for the entire period ended August 31, 2014 (3/1/14-8/31/14).
Actual Expenses
The first line of the table below provides information about actual account values and actual expenses. You may use the information in this line, together with the amount you invested, to estimate the expenses that you paid over the period. Simply divide your account value by $1,000 (for example, an $8,600 account value divided by $1,000 = 8.6), then multiply the result by the number in the first line under the heading entitled “Expenses Paid During Period” to estimate the expenses you paid on your account during this period.
Hypothetical Example for Comparison Purposes
The second line of the table below provides information about hypothetical account values and hypothetical expenses based on a Fund’s actual expense ratio and an assumed rate of return of 5% per year before expenses, which is not the Fund’s actual return. The hypothetical account values and expenses may not be used to estimate the actual ending account balance or expenses you paid for the period. You may use this information to compare the ongoing costs of investing in a Fund and other funds. To do so, compare this 5% hypothetical example with the 5% hypothetical examples that appear in the shareholder reports of the other funds.
Please note that the expenses shown in the table are meant to highlight your ongoing costs only and do not reflect any transaction costs, such as sales charges (loads), redemption fees, or exchange fees. Therefore, the second line of the table is useful in comparing ongoing costs only, and will not help you determine the relative total costs of owning different funds. In addition, if these transaction costs were included, your costs would have been higher.
| | | | | | | | | | | | | | | | |
| | | Investor | |
Fund | | Beginning
account
value
3/1/14 | | | Ending
account
value
8/31/14 | | | Annualized
Expense
Ratio(1) | | | Expenses
paid during
period
3/1/14-
8/31/14(1) | |
BMO LGM Frontier Markets Equity Fund | | | | | | | | | | | | |
| Actual | | $ | 1,000.00 | | | $ | 1,063.00 | | | | 2.00 | % | | $ | 10.40 | |
| Hypothetical (5% return before expenses) | | | 1,000.00 | | | | 1,014.92 | | | | 2.00 | | | | 10.16 | |
| (1) | Expenses are equal to the Fund’s annualized expense ratios for the period March 1, 2014 through August 31, 2014, multiplied by the average account value over the period, multiplied by 184/365 (to reflect the one-half year period). |
3
August 31, 2014
| | | | | | | | |
| Description | | Shares | | | Value | |
| Common Stocks — 83.9% | | | | | | |
| | |
| Bangladesh — 1.0% | | | | | | |
British American Tobacco Bangladesh Co., Ltd. | | | 10,200 | | | $ | 346,763 | |
| | |
| Botswana — 1.1% | | | | | | |
Letshego Holdings Ltd. | | | 1,297,110 | | | | 371,612 | |
| | |
| Cambodia — 3.3% | | | | | | |
NagaCorp Ltd. | | | 1,450,000 | | | | 1,130,057 | |
| | |
| Colombia — 3.5% | | | | | | |
Almacenes Exito SA | | | 50,994 | | | | 867,099 | |
Bolsa de Valores de Colombia | | | 25,618,510 | | | | 333,448 | |
| | | | | | | | |
| | | | | | | 1,200,547 | |
| | |
| Costa Rica — 0.6% | | | | | | |
Florida Ice & Farm Co. SA | | | 176,388 | | | | 226,943 | |
| | |
| Croatia — 1.1% | | | | | | |
Ledo DD | | | 242 | | | | 366,765 | |
| | |
| Egypt — 9.7% | | | | | | |
Commercial International Bank Egypt SAE GDR | | | 223,862 | | | | 1,421,524 | |
Eastern Tobacco | | | 37,565 | | | | 896,037 | |
Juhayna Food Industries (1) | | | 743,142 | | | | 1,035,195 | |
| | | | | | | | |
| | | | | | | 3,352,756 | |
| | |
| Georgia — 5.2% | | | | | | |
Bank of Georgia Holdings PLC | | | 43,950 | | | | 1,808,768 | |
| | |
| Ghana — 0.2% | | | | | | |
Fan Milk Ltd. | | | 50,900 | | | | 67,417 | |
| | |
| Kenya — 5.0% | | | | | | |
Barclays Bank of Kenya Ltd. | | | 1,800,400 | | | | 367,615 | |
British American Tobacco Kenya Ltd. | | | 50,400 | | | | 450,407 | |
East African Breweries Ltd. | | | 261,100 | | | | 818,153 | |
Uchumi Supermarkets Ltd. | | | 595,500 | | | | 83,532 | |
| | | | | | | | |
| | | | | | | 1,719,707 | |
| | |
| Mauritius — 1.9% | | | | | | |
MCB Group Ltd. | | | 96,510 | | | | 651,989 | |
| | |
| Netherlands — 1.7% | | | | | | |
OCI (1) (2) | | | 18,010 | | | | 602,018 | |
| | |
| Nigeria — 13.8% | | | | | | |
Access Bank PLC | | | 1,915,800 | | | | 116,889 | |
Afren PLC (1) | | | 211,714 | | | | 342,690 | |
Cadbury Nigeria PLC | | | 816,291 | | | | 289,520 | |
Guaranty Trust Bank PLC | | | 12,466,260 | | | | 2,297,185 | |
Nestle Nigeria PLC | | | 60,875 | | | | 384,924 | |
Nigerian Breweries PLC | | | 620,850 | | | | 681,075 | |
Zenith Bank PLC | | | 4,508,346 | | | | 683,504 | |
| | | | | | | | |
| | | | | | | 4,795,787 | |
| | |
| Oman — 4.7% | | | | | | |
BankMuscat SAOG | | | 387,780 | | | | 733,257 | |
Oman Telecommunications Co. SAOG | | | 195,770 | | | | 892,406 | |
| | | | | | | | |
| | | | | | | 1,625,663 | |
| | |
| Pakistan — 2.3% | | | | | | |
Lucky Cement Ltd. | | | 233,400 | | | | 794,247 | |
| | |
| Peru — 1.9% | | | | | | |
BBVA Banco Continental SA | | | 394,758 | | | | 673,080 | |
| | |
| Philippines — 3.0% | | | | | | |
Universal Robina Corp. | | | 276,480 | | | | 1,030,459 | |
| | |
| Senegal — 3.8% | | | | | | |
Sonatel | | | 27,291 | | | | 1,306,808 | |
| | | | | | | | |
| Description | | Shares or
Participation
Units | | | Value | |
| Common Stocks (continued) | | | | | | |
| | |
| Turkmenistan — 3.4% | | | | | | |
Dragon Oil PLC | | | 119,240 | | | $ | 1,187,738 | |
| | |
| United Arab Emirates — 5.4% | | | | | | |
Aramex PJSC | | | 1,159,893 | | | | 1,004,195 | |
First Gulf Bank PJSC | | | 178,257 | | | | 885,692 | |
| | | | | | | | |
| | | | | | | 1,889,887 | |
| | |
| United States — 2.1% | | | | | | |
PriceSmart, Inc. (2) | | | 8,081 | | | | 724,219 | |
| | |
| Vietnam — 7.0% | | | | | | |
Phu Nhuan Jewelry JSC | | | 20,800 | | | | 31,208 | |
Viet Nam Dairy Products JSC | | | 459,108 | | | | 2,404,387 | |
| | | | | | | | |
| | | | | | | 2,435,595 | |
| | |
| Zimbabwe — 2.2% | | | | | | |
Delta Corp. Ltd. | | | 564,665 | | | | 762,298 | |
| | | | | | | | |
Total Common Stocks
(identified cost $28,263,290) | | | | | | | 29,071,123 | |
| | |
| Mutual Funds — 4.8% | | | | | | |
| | |
| Romania — 4.8% | | | | | | |
Fondul Proprietatea SA | | | 6,316,600 | | | | 1,654,074 | |
| | | | | | | | |
Total Mutual Funds
(identified cost $1,594,627) | | | | | | | 1,654,074 | |
| | |
Participation Notes — 8.7% | | | | | | |
| | |
| Luxembourg — 3.8% | | | | | | |
Etihad Etisalat Co., Issued by Merrill Lynch International & Co., Maturity Date 3/2/2017 (1) (4) | | | 36,963 | | | | 893,765 | |
Jarir Marketing Co., Issued by Merrill Lynch International & Co., Maturity Date 3/2/2017 (1) (4) | | | 7,790 | | | | 425,568 | |
| | | | | | | | |
| | | | | | | 1,319,333 | |
| | |
| United Kingdom — 4.9% | | | | | | |
Herfy Food Services Co., Issued by HSBC Bank PLC, Maturity Date 10/8/2015 (1) (4) | | | 22,752 | | | | 639,111 | |
Herfy Food Services, Co., Issued by HSBC Bank PLC, Maturity Date 7/6/2017 (1) (4) | | | 9,101 | | | | 255,650 | |
Saudi Dairy & Foodstuff Co., Issued by HSBC Bank PLC, Maturity Date 6/26/2015 (1) (4) | | | 23,200 | | | | 786,860 | |
| | | | | | | | |
| | | | | | | 1,681,621 | |
Total Participation Notes
(identified cost $2,510,357) | | | | | | | 3,000,954 | |
|
| Short-Term Investments — 6.2% | |
|
| Collateral Investment for Securities on Loan — 3.9% | |
State Street Navigator Securities Lending Prime Portfolio Fund, 0.150% (3) | | | | | | | 1,347,369 | |
| | |
| Mutual Funds — 2.3% | | | | | | |
State Street Institutional Liquid Reserves Fund, 0.080% | | | 800,592 | | | | 800,592 | |
| | | | | | | | |
Total Short-Term Investments
(identified cost $2,147,961) | | | | 2,147,961 | |
| | | | | |
Total Investments — 103.6%
(identified cost $34,516,235) | | | | 35,874,112 | |
| Other Assets and Liabilities — (3.6)% | | | | (1,245,971 | ) |
| | | | | |
| Total Net Assets — 100.0% | | | $ | 34,628,141 | |
| | | | | | | | |
(See Notes which are an integral part of the Financial Statements)
4
| | |
| | | BMO LGM Frontier Markets Equity Fund |
| | | | | | | | |
| Industry Allocation | |
| Industry | | Value | | | % of
Total
Net Assets | |
Agriculture | | $ | 1,693,208 | | | | 4.9 | % |
Banks | | | 8,987,513 | | | | 26.0 | |
Beverages | | | 1,726,171 | | | | 5.0 | |
Building Materials | | | 794,248 | | | | 2.3 | |
Chemicals | | | 602,018 | | | | 1.7 | |
Diversified Financial Services | | | 705,060 | | | | 2.0 | |
Diversified Holding Companies | | | 1,414,287 | | | | 4.1 | |
Food | | | 5,662,198 | | | | 16.3 | |
Lodging | | | 1,130,057 | | | | 3.3 | |
Oil & Gas | | | 1,530,428 | | | | 4.4 | |
Retail | | | 1,622,526 | | | | 4.7 | |
Telecommunications | | | 2,199,214 | | | | 6.3 | |
Transportation | | | 1,004,195 | | | | 2.9 | |
| | | | | | | | |
Total Common Stocks | | | 29,071,123 | | | | 83.9 | |
Participation Notes | | | 3,000,954 | | | | 8.7 | |
Collateral Investment for
Securities on Loan | | | 1,347,369 | | | | 3.9 | |
Mutual Funds | | | 2,454,666 | | | | 7.1 | |
| | | | | | | | |
Total Investments | | | 35,874,112 | | | | 103.6 | |
Other Assets and Liabilities | | | (1,245,971 | ) | | | (3.6 | ) |
| | | | | | | | |
Total Net Assets | | $ | 34,628,141 | | | | 100.0 | % |
| | | | | | | | |
| | |
| Notes to Schedule of Investments |
The categories of investments are shown as a percentage of total net assets for the Fund as of August 31, 2014.
| (2) | Certain shares are temporarily on loan to unaffiliated brokers-dealers. |
| (3) | Please refer to Note 2, subsection Securities Lending, in the Notes to Financial Statements. |
| (4) | Participation notes are issued by banks or broker-dealers and are designed to offer a return linked to the performance of a particular underlying equity security or market. |
(See Notes which are an integral part of the Financial Statements)
5
August 31, 2014
| | |
| Statement of Assets and Liabilities | | BMO LGM Frontier Markets Equity Fund |
| | | | |
Assets: | | | | |
Investments in unaffiliated issuers, at value | | $ | 35,874,112 | (1) |
Cash denominated in foreign currencies | | | 85,655 | (2) |
Dividends and interest receivable | | | 77,720 | |
Prepaid expenses | | | 3,668 | |
Other receivables | | | 192 | |
| | | | |
Total assets | | | 36,041,347 | |
| |
Liabilities: | | | | |
Payable for return of securities lending collateral | | | 1,347,369 | |
Payable for foreign tax expense | | | 34,995 | |
Payable to affiliates, net (Note 5) | | | 2,643 | |
Other liabilities | | | 28,199 | |
| | | | |
Total liabilities | | | 1,413,206 | |
| | | | |
Total net assets | | $ | 34,628,141 | |
| | | | |
| |
Net assets consist of: | | | | |
Paid-in capital | | $ | 32,701,229 | |
Net unrealized appreciation on investments and foreign currency translation | | | 1,357,600 | |
Accumulated net realized gain on investments and foreign currency transactions | | | 168,832 | |
Undistributed net investment income | | | 400,480 | |
| | | | |
Total net assets | | $ | 34,628,141 | |
| | | | |
| |
Net asset value, offering price and redemption proceeds per investor class of share (unlimited shares authorized, no par value) | | $ | 10.46 | |
| | | | |
| |
Total investor class of shares outstanding | | | 3,309,084 | |
| | | | |
Total investments in unaffiliated issuers, at cost: | | $ | 34,516,235 | |
| | | | |
| (1) | Including $1,280,039 of securities on loan. |
| (2) | Identified cost of cash denominated in foreign currencies is $85,912. |
(See Notes which are an integral part of the Financial Statements)
6
For the Period December 18, 2013 (inception date) through August 31, 2014
| | |
| Statement of Operations | | BMO LGM Frontier Markets Equity Fund |
| | | | |
Investment income: | | | | |
Dividend income, unaffiliated issuers | | $ | 800,083 | (1) |
Interest income | | | 203 | |
Securities lending income | | | 372 | |
| | | | |
Total income | | | 800,658 | |
| |
Expenses: | | | | |
Investment advisory fees (Note 5) | | | 276,801 | |
Shareholder servicing fees (Note 5) | | | 46,133 | |
Administration fees (Note 5) | | | 17,069 | |
Portfolio accounting fees | | | 26,151 | |
Recordkeeping fees | | | 31,043 | |
Custodian fees (Note 5) | | | 91,810 | |
Registration fees | | | 2,386 | |
Professional fees | | | 27,301 | |
Printing and postage | | | 27,025 | |
Directors’ fees | | | 7,163 | |
Miscellaneous | | | 3,414 | |
| | | | |
Total expenses | | | 556,296 | |
| |
Deduct: | | | | |
Expense waivers (Note 5) | | | (186,581 | ) |
| | | | |
Net expenses | | | 369,715 | |
| | | | |
Net investment income | | | 430,943 | |
| |
Net realized and unrealized gain on investments and foreign currency: | | | | |
Net realized gain on investment transactions from unaffiliated issuers | | | 160,650 | (2) |
Net realized loss on foreign currency transactions | | | (34,751 | ) |
| | | | |
Total net realized gain | | | 125,899 | |
Net change in unrealized appreciation on investments in unaffiliated issuers and foreign currency translation | | | 1,357,600 | |
| | | | |
Net realized and unrealized gain on investments and foreign currency | | | 1,483,499 | |
| | | | |
Change in net assets resulting from operations | | $ | 1,914,442 | |
| | | | |
| (1) | Net of foreign taxes of $39,204. |
| (2) | Net of foreign taxes of $33,304, $25,122 of which is related to appreciated investments held at year end. |
(See Notes which are an integral part of the Financial Statements)
7
For the Period December 18, 2013 (inception date) through August 31, 2014
| | |
| Statement of Changes in Net Assets | | BMO LGM Frontier Markets Equity Fund |
| | | | |
Change in net assets resulting from: | | | | |
| |
Operations: | | | | |
Net investment income | | $ | 430,943 | |
Net realized gain on investments and foreign currency transactions | | | 125,899 | |
Net change in unrealized appreciation on investments and foreign currency translation | | | 1,357,600 | |
| | | | |
Change in net assets resulting from operations | | | 1,914,442 | |
| |
Capital stock transactions: | | | | |
Proceeds from sale of shares | | | 35,536,969 | |
Cost of shares redeemed | | | (2,982,929 | ) |
Redemption fees | | | 59,659 | |
| | | | |
Change in net assets resulting from capital stock transactions | | | 32,613,699 | |
| | | | |
Change in net assets | | | 34,528,141 | |
| |
Net assets: | | | | |
Beginning of period (1) | | | 100,000 | |
| | | | |
End of period | | $ | 34,628,141 | |
| | | | |
Undistributed net investment income included in net assets at end of period | | $ | 400,480 | |
| | | | |
| |
Capital stock transactions in shares: | | | | |
Sale of shares | | | 3,594,833 | |
Shares redeemed | | | (295,749 | ) |
| | | | |
Change resulting from fund share transactions in shares | | | 3,299,084 | |
| | | | |
| (1) | Prior to December 18, 2013, the Fund had been inactive except for matters relating to the Fund’s establishment, designation and planned registration of the Fund’s shares of beneficial interest under the Securities Act of 1933 and the sale of 10,000 shares for $100,000 to BMO Asset Management Corp. on December 6, 2013. |
(See Notes which are an integral part of the Financial Statements)
8
| | |
| Financial Highlights (For a share outstanding throughout the period) | | BMO LGM Frontier Markets Equity Fund |
| | | | | | | | | | | | | | | | | | | | | | | | | | | | | | | | | | | | | | | | | | | | | | | | | | | | | | | | | | | | | | | | | | | | | | | | | | | |
| | | | | | | | | | | | | |
Period
Ended
August 31, | | Net asset
value,
beginning
of period | | Net
investment
income | | Net realized
and unrealized
gain | | Total from
investment
operations | | Distributions to
shareholders
from net
investment
income | | Distributions to
shareholders from
net realized gain | | Total
distributions | | Redemption
fees | | Net asset
value, end
of period | | Total
return (1)(3) | | Ratios to Average Net Assets (4) | | Net assets,
end of period
(000 omitted) | | Portfolio
turnover
rate (3) |
| | | | | | | | | | | | Gross
Expenses | | Net
Expenses (2) | | Net
investment
income (2) | | |
| 2014 (5) | | | $ | 10.00 | | | | $ | 0.13 | | | | $ | 0.31 | | | | $ | 0.44 | | | | $ | — | | | | $ | — | | | | $ | — | | | | $ | 0.02 | | | | $ | 10.46 | | | | | 4.60 | % | | | | 3.01 | % | | | | 2.00 | % | | | | 2.33 | % | | | $ | 34,628 | | | | | 9 | % |
| (1) | Based on net asset value as of end of period date. |
| (2) | The contractual and voluntary expense waivers pursuant to Note 5 of the financial statements are reflected in both the expense and net investment income ratios. |
| (3) | Not annualized for periods less than one year. |
| (4) | Annualized for periods less than one year. |
| (5) | Reflects operations for the period from December 18, 2013 (inception date) through August 31, 2014. |
(See Notes which are an integral part of the Financial Statements)
9
August 31, 2014
| | |
| Notes to Financial Statements | | BMO LGM Frontier Markets Equity Fund |
BMO LGM Frontier Markets Equity Fund (the “Fund”) was established as a Delaware statutory trust on July 3, 2013. The Fund is registered with the Securities and Exchange Commission (the “SEC”) as a non-diversified, closed-end management investment company that operates as an “Interval Fund” under the Investment Company Act of 1940, as amended (the “1940 Act”). An Interval Fund continuously offers its shares to the public, but only offers to repurchase its shares at predetermined intervals. The Fund has set quarterly repurchase intervals. The Fund’s inception date is December 18, 2013. Effective July 29, 2014, the Fund’s name changed from the BMO Lloyd George Frontier Markets Equity Fund to the BMO LGM Frontier Markets Equity Fund.
The Fund’s investment objective is to provide capital appreciation. The Fund invests at least 80% of its assets in equity securities of foreign companies located in frontier markets or whose primary business activities or principal trading markets are in frontier markets. Frontier markets are considered to be those markets in any country that is included in the Morgan Stanley Capital International (“MSCI”) Frontier Markets Index, certain countries in the MSCI Emerging Markets Index, and certain other countries that are not included in those indices.
| 2. | | Significant Accounting Policies |
The Funds is an investment company and follows the accounting and reporting guidance under Financial Accounting Standards Board (“FASB”) Accounting Standards Codification (“ASC”) Topic 946, Financial Services—Investment Companies. The following is a summary of significant accounting policies consistently followed by the Fund in the preparation of its financial statements.
Use of Estimates—The preparation of financial statements in conformity with accounting principles generally accepted in the United States of America (“GAAP”) requires management to make estimates and assumptions that affect the reported amounts of assets and liabilities at the date of the financial statements and the reported amounts of increases and decreases in net assets from operations during the reporting period. Actual results could differ from these estimates.
Investment Valuations—Listed equity securities are valued each trading day at the last sale price or official closing price reported on a national securities exchange, including NASDAQ. Securities listed on a foreign exchange are valued each trading day at the last closing price on the principal exchange on which they are traded immediately prior to the time for determination of Net Asset Value (“NAV”) or at fair value as discussed below. Equity securities without a reported trade, U.S. government securities, listed corporate bonds, other fixed income and asset-backed securities with maturities of 60 days or more, unlisted securities, and private placement securities are generally valued at the mean of the latest bid and asked price as furnished by an independent pricing service. Fixed income securities that are not exchange traded are valued by an independent pricing service, taking into consideration yield, liquidity, risk, credit quality, coupon, maturity, type of issue, and any other factors or market data the pricing service deems relevant. Fixed income securities with remaining maturities of 60 days or less at the time of purchase are valued at amortized cost, which approximates fair value. Investments in other open-end registered investment companies are valued at net asset value.
Securities or other assets for which market valuations are not readily available, or are deemed to be inaccurate, are valued at fair value as determined in good faith using methods approved by the Board of Trustees (the “Trustees”). The Trustees have established a Pricing Committee, which is responsible for determinations of fair value, subject to the supervision of the Trustees. In determining fair value, the Pricing Committee takes into account all information available and any factors it deems appropriate. Consequently, the price of securities used by a Fund to calculate its NAV may differ from quoted or published prices for the same securities. Fair value pricing involves subjective judgments and it is possible that the fair value determined for a security is materially different than the value that would be realized upon the sale of that security and the differences may be material to the NAV of the respective Fund or the financial statements presented.
Securities held in the Fund may be listed on foreign exchanges that do not value their listed securities at the same time the Fund calculates its NAV. Most foreign markets close well before the Fund values its securities, generally 3:00 p.m. (Central Time). The earlier close of these foreign markets gives rise to the possibility that significant events, including broad market moves, may have occurred in the interim.
The Pricing Committee may determine that a security needs to be fair valued if, among other things, it believes the value of the security might have been materially affected by events occurring after the close of the market in which the security was principally traded, but before the time for determination of the NAV (“a subsequent event”). A subsequent event might include a company-specific development (for example, announcement of a merger that is made after the close of the foreign market), a development that might affect an entire market or region (for example, weather related events) or a potentially global development (such as a terrorist attack that may be expected to have an effect on investor expectations worldwide). The Fund has retained an independent fair value pricing service to assist in fair valuing foreign securities. The service utilizes statistical data based on historical performance of securities, markets, and other data in developing factors used to estimate a fair value.
Investment Income, Expenses, and Distributions—Interest income and expenses are accrued daily. Dividend income and distributions to shareholders are recorded on the ex-dividend date. Non-cash dividends included in dividend income, if any, are recorded at fair market value.
Federal Income Taxes—The policies and procedures of the Funds require compliance with Subchapter M of the Internal Revenue Code of 1986, as amended (the “Code”), and to distribute to shareholders each year substantially all of their income. Accordingly, no provisions for federal tax are necessary. Withholding taxes on foreign dividends have been provided for in accordance with the applicable country’s tax rules and rates.
10
| | |
| | | BMO LGM Frontier Markets Equity Fund |
Foreign Exchange Contracts—The Fund may enter into foreign currency exchange contracts as a way of managing foreign exchange rate risk. The Fund may enter into these contracts for the purchase or sale of a specific foreign currency at a fixed price on a future date as a hedge or cross hedge against either specific transactions or portfolio positions. The objective of the Fund’s foreign currency hedging transactions is to reduce the risk that the U.S. dollar value of the Fund’s foreign currency denominated securities will decline in value due to changes in foreign currency exchange rates. All foreign currency exchange contracts are marked-to-market daily at the applicable translation rates resulting in unrealized gains or losses. Realized gains or losses are recorded at the time the foreign currency exchange contract is offset by entering into a closing transaction or by the delivery or receipt of the currency. Risk may arise upon entering into these contracts from the potential inability of counterparties to meet the terms of their contracts and from unanticipated movements in the value of a foreign currency relative to the U.S. dollar.
The Fund did not hold any foreign currency exchange contracts during or at the period ended August 31, 2014.
Foreign Currency Translation—The accounting records of the Fund are maintained in U.S. dollars. All assets and liabilities denominated in foreign currencies are translated into U.S. dollars based on the rate of exchange of such currencies against U.S. dollars on the date of valuation. Purchases and sales of securities, income, and expenses are translated at the rate of exchange quoted on the respective date that such transactions are recorded. The Fund does not isolate that portion of the results of operations resulting from changes in foreign exchange rates on investments from the fluctuations arising from changes in market prices of securities held. Such fluctuations are included with the net realized and unrealized gain or loss from investments.
Reported net realized foreign exchange gains or losses arise from sales of portfolio securities, sales and maturities of short-term securities, sales of foreign currencies, currency gains or losses realized between the trade and settlement dates on securities transactions, and the difference between the amounts of dividends, interest, and foreign withholding taxes recorded on the Fund’s books and the U.S. dollar equivalent of the amounts actually received or paid. Net unrealized foreign exchange gains and losses arise from changes in the value of assets and liabilities other than investments in securities at each reporting period, resulting from changes in the exchange rate.
Restricted Securities—Restricted securities are securities that may be resold only upon registration under federal securities laws or in transactions exempt from such registration. In some cases, the issuer of restricted securities has agreed to register such securities for resale at the issuer’s expense either upon demand by the Fund or in connection with another registered offering of the securities. Many restricted securities may be resold in the secondary market in transactions exempt from registration. Such restricted securities may be determined to be liquid under criteria established by the Trustees. The restricted securities are valued at the price provided by dealers in the secondary market or, if no market prices are available, the fair value as determined in good faith using methods approved by the Trustees.
Securities Lending—The Fund participates in a securities lending program, providing for the lending of equity securities to qualified brokers, in exchange for the opportunity to earn additional income for participating. State Street Bank & Trust Company serves as the securities lending agent. The Fund receives cash as collateral in return for the securities and records a corresponding payable for collateral due to the respective broker. The amount of cash collateral received is maintained at a minimum level of 100% of the prior day’s market value on securities and accrued interest loaned. Collateral is reinvested in the State Street Navigator Securities Lending Prime Portfolio money market fund. The valuation of collateral is discussed in “Investment Valuations” in Note 2 of the Notes to the Financial Statements. When the Fund lends its portfolio securities, it is subject to the risk that it may not be able to get the portfolio securities back from the borrower on a timely basis, in which case the Fund may lose certain investment opportunities. The Fund also is subject to the risks associated with the investments of cash collateral received from the borrower. Cash collateral received as part of the Fund’s securities lending program invested in the State Street Navigator Securities Lending Prime Portfolio as of August 31, 2014 was $1,347,369.
Commitments and Contingencies—In the normal course of business, the Fund enters into contracts that provide general indemnifications to other parties. The Fund’s maximum exposure under these arrangements is unknown as this would involve future claims that may be made against the Fund that have not yet occurred. However, the Fund has not had prior claims or losses pursuant to these contracts and expects the risk of loss to be remote.
Other—Investment transactions are accounted for on a trade date basis. Net realized gains and losses on securities are computed on the basis of specific security lot identification.
| 3. | | Fair Value Measurements |
Fair Valuation Measurements and Disclosures defines fair value, establishes a framework for measuring fair value in accordance with GAAP, and expands disclosure about fair value measurements. It establishes a fair value hierarchy that distinguishes between (1) market participant assumptions developed based on market data obtained from sources independent of the reporting issuer (observable inputs), and (2) the reporting issuer’s own assumptions about market participant assumptions developed based on the best information available in the circumstances (unobservable inputs). It also provides guidance on determining when there has been a significant decrease in the volume and level of activity for an asset or liability, when a transaction is not orderly, and how that information must be incorporated into fair value measurement.
11
| | |
| Notes to Financial Statements (continued) | | |
Various inputs are used in determining the value of the Fund’s investments. The inputs or methodology used for valuing securities are not necessarily an indication of the risk associated with investing in those securities. These inputs are summarized in the three broad levels listed below:
Level 1—quoted prices in active markets for identical securities. An active market for the security is a market in which transactions occur with sufficient frequency and volume to provide pricing information on an ongoing basis. Common and preferred stocks, options and futures contracts, and U.S. registered mutual funds are generally categorized as Level 1.
Level 2—other significant observable inputs (including quoted prices for similar securities, interest rates, prepayment speeds, credit risk, etc.). Fixed income securities, repurchase agreements and securities valued by an independent fair value pricing service are generally categorized as Level 2.
Level 3—significant unobservable inputs, including management’s own assumptions in determining the fair value of investments.
The Fund has adopted Amendments to Achieve Common Fair Value Measurement and Disclosure Requirements in U.S. GAAP and International Financial Reporting Standards (“IFRS”) which amends Fair Value Measurements and Disclosures to establish common requirements for measuring fair value and for disclosing information about fair value measurements in accordance with U.S. GAAP and IFRS. Enhanced disclosure is required to detail any transfers into and out of Level 1 and Level 2 measurements and Level 2 and Level 3 measurements and the reasons for the transfers. For the period ended August 31, 2014, there were no transfers in and out of Level 1, Level 2 and Level 3. The Fund did not hold any Level 3 securities as of August 31, 2014. It is the Fund’s policy to recognize transfers between category levels at the end of the period.
The following is a summary of the inputs used, as of August 31, 2014, in valuing the Fund’s assets:
| | | | | | | | | | | | | | | | |
| | | Level 1 | | | Level 2 | | | Level 3 | | | Total | |
Common Stocks (1) | | $ | 30,725,197 | | | $ | — | | | $ | — | | | $ | 30,725,197 | |
Participation Notes | | | 1,319,333 | | | | 1,681,621 | | | | — | | | | 3,000,954 | |
Short-Term Investments | | | 2,147,961 | | | | — | | | | — | | | | 2,147,961 | |
| | | | | | | | | | | | | | | | |
Total | | $ | 34,192,491 | | | $ | 1,681,621 | | | $ | — | | | $ | 35,874,112 | |
| | | | | | | | | | | | | | | | |
| | (1) | All sub-categories within Common Stocks represent Level 1 evaluation status. |
The shares of beneficial interest of the Fund (the “Shares”) will be continuously offered under Rule 415 under the Securities Act of 1933, as amended. As of August 31, 2014, the Fund had registered a total of 11,200,000 shares with no par value. Investors may purchase shares each business day without any sales charge at a price equal to the NAV per share next determined after receipt of an order to purchase.
The Fund’s shares are not redeemable each business day, are not listed for trading on an exchange, and no secondary market currently exists for Fund shares. As an Interval Fund and as described in the Fund’s Prospectus, the Fund will make quarterly repurchase offers of between 5% and 25% of the Fund’s outstanding Shares. A repurchase fee equal to 2% of the value of the Shares repurchased will be applied to offset repurchase expenses.
| 5. | | Investment Adviser Fee and Other Transactions with Affiliates |
Investment Adviser Fee—The Fund has entered into an Investment Advisory Agreement with the Adviser, pursuant to which the Adviser will provide general investment advisory services for the Fund. As compensation for its advisory services under the investment advisory agreement with the Fund, the Fund pays the Adviser, on a monthly basis, an annual management fee equal to 1.50% of the average daily net assets of the Fund. The Fund’s sub-adviser is LGM Investments Limited, an affiliate of the Adviser. It is the Adviser’s responsibility to select sub-advisers for the Fund and to review each sub-adviser’s performance. The Adviser compensates the sub-adviser based on the level of average daily net assets of the Fund.
The Adviser has agreed to waive or reduce its investment advisory fee or reimburse expenses to the extent necessary to prevent total annual operating expenses (excluding taxes, interest, brokerage commissions, other investment related costs, Acquired Fund Fees and Expenses and extraordinary expenses, such as litigation and other expenses not incurred in the ordinary course of the Fund’s business) from exceeding 2.00% of the average daily net assets of the Fund. The Adviser may not terminate this arrangement prior to December 31, 2015 unless the investment advisory agreement is terminated. In addition, the Adviser may voluntarily waive any portion of its management fee for the Fund. Any such voluntary waiver by the Adviser may be terminated at any time in the Adviser’s sole discretion.
The Fund’s Adviser absorbed all organizational and initial offering costs. The Fund’s Expense Limitation Agreement does not include a recoupment provision and therefore organizational and initial offering costs paid by the Adviser will not be subject to reimbursement by the Fund.
Shareholder Servicing Fee—Under the terms of a Shareholder Services Agreement with the Adviser, the Fund pays the Adviser at the annual rate of 0.25% of average daily net assets for the period. The fee paid to the Adviser is used to finance certain services for shareholders and to maintain shareholder accounts. The Adviser also may voluntarily choose to waive any additional portion of its fee. The Adviser can modify or terminate this voluntary waiver at any time in its sole discretion.
12
| | |
| | | BMO LGM Frontier Markets Equity Fund |
Administration Fee—The fee paid to the Adviser is based on the Fund’s average daily net assets as listed below:
| | | | | |
Annual Rate | | Average Daily Net Assets |
| | | 0.0925 | % | | on the first $250 million |
| | | 0.0850 | | | on the next $250 million |
| | | 0.0800 | | | on the next $200 million |
| | | 0.0400 | | | on the next $100 million |
| | | 0.0200 | | | on the next $200 million |
| | | 0.0100 | | | in excess of $1.0 billion |
Investment Transactions—The Fund, on occasion, may purchase or sell a security with another fund or client of the Adviser pursuant to procedures approved by the Trustees.
General—Certain of the Officers and Trustees of the Fund are also Officers and Directors of one or more portfolios within the Fund complex, which are affiliates of the Fund. None of the Fund officers or interested trustees receives any compensation from the Fund. Certain officers and Trustees of the Fund are also officers of the Adviser.
| 6. | | Investment Transactions |
Purchases and sales of investments, excluding short-term U.S. government securities and short-term obligations, for the period ended August 31, 2014, were $34,467,949 and $2,293,630, respectively.
| 7. | | Federal Tax Information |
The timing and character of income and capital gain distributions are determined in accordance with income tax regulations, which may differ from GAAP. These differences are due in part to differing treatment of net operating loss and foreign currency transactions.
To the extent that differences arise that are permanent in nature, such amounts are reclassified within the capital accounts, on the Statement of Assets and Liabilities, based on their Federal tax basis treatment; temporary differences do not require reclassification and had no impact on the NAV of the Fund.
The Fund complied with the FASB interpretation Accounting for Uncertainty in Income Taxes, which provides guidance for how uncertain tax provisions should be recognized, measured, presented, and disclosed in the financial statements. Accounting for Uncertainty in Income Taxes requires the affirmative evaluation of tax positions taken or expected to be taken in the course of preparing the Fund’s tax returns to determine whether it is “more-likely-than-not,” (i.e., greater than 50 percent) of being sustained by the applicable tax authority. Tax positions not deemed to meet the more-likely-than-not threshold may result in a tax benefit or expense in the current year.
Accounting for Uncertainty in Income Taxes requires management of the Fund to analyze all open tax years, as defined by the statutes of limitations, for all major jurisdictions, which includes federal and certain states. Open tax years are those that are open for exam by the taxing authorities (i.e., the last four tax years and the interim tax period since then). The Fund had no examinations in progress. For all open tax years and all major taxing jurisdictions through the end of the reporting period, management of the Fund reviewed all tax positions taken or expected to be taken in the preparation of the Fund’s tax returns and concluded that Accounting for Uncertainty in Income Taxes resulted in no effect on the Fund’s reported net assets or results of operations as of and during the period ended August 31, 2014. Management of the Fund also is not aware of any tax positions for which it is reasonably possible that the total amounts of recognized tax benefits will significantly change in the next twelve months.
The difference between book basis and tax basis unrealized appreciation/depreciation is attributable in part to the tax deferral of losses on wash sales, the realization for tax purposes of unrealized gains on investments in passive foreign investment companies and foreign currency.
| | | | | | | | | | | | | | |
Cost of
Investments
for Federal
Tax Purposes | | | Gross
Unrealized
Appreciation
for Federal
Tax Purposes | | | Gross
Unrealized
Depreciation
for Federal
Tax Purposes | | | Net
Unrealized
Appreciation
for Federal
Tax Purposes | |
| $ | 34,600,803 | | | $ | 2,683,704 | | | $ | (1,410,395 | ) | | $ | 1,273,309 | |
As of August 31, 2014, the components of distributable earnings on a tax basis are as follows:
| | | | | | | | | | | | | | | | | | |
Undistributed
Ordinary
Income | | | Undistributed
Long-Term
Capital Gains | | | Accumulated
Capital and
Other Losses | | | Unrealized
Depreciation
on Securities | | | Unrealized
Appreciation
on Securities | |
| $ | 653,880 | | | $ | — | | | $ | — | | | $ | (277 | ) | | $ | 1,273,309 | |
| 8. | | Shareholder Tax Information (Unaudited) |
Of the ordinary income (including short-term capital gain) distributions made by the Fund during the period ended August 31, 2014, the percentage which qualifies for the dividend received deduction, available to corporate shareholders, is 0.40%.
13
| | |
| Notes to Financial Statements (continued) | | |
Of the ordinary income (including short-term capital gain) distributions made by the Fund during the period ended August 31, 2014, the percentage that is designated as qualified dividend income is 23.80%.
Pursuant to Section 853 of the Code, the Fund designates $546,722 of income derived from foreign sources and $46,421 of foreign taxes paid, or the amounts determined to be necessary, for the period ended August 31, 2014.
Of the ordinary income (including short-term capital gain) distributions made during the period ended August 31, 2014, the proportionate share of income derived from foreign source income was $0.1652 per share and the foreign taxes paid were $0.0140 per share.
On September 30, 2014, the Fund completed its next quarterly repurchase event. Shares totaling 130,954 were repurchased at a value of $1,359,306.
14
| | |
| | | Report of Independent Registered Public Accounting Firm |
The Shareholders and Board of Trustees of BMO LGM Frontier Markets Equity Fund:
We have audited the accompanying statement of assets and liabilities, including the schedule of investments, of BMO LGM Frontier Markets Equity Fund (the Fund) as of August 31, 2014, and the related statements of operations and changes in net assets and the financial highlights for the period from December 18, 2013 (inception) to August 31, 2014. These financial statements and financial highlights are the responsibility of the Fund’s management. Our responsibility is to express an opinion on these financial statements and financial highlights based on our audit.
We conducted our audit in accordance with the standards of the Public Company Accounting Oversight Board (United States). Those standards require that we plan and perform the audit to obtain reasonable assurance about whether the financial statements and financial highlights are free of material misstatement. An audit includes examining, on a test basis, evidence supporting the amounts and disclosures in the financial statements. Our procedures included confirmation of securities owned as of August 31, 2014, by correspondence with the custodian. An audit also includes assessing the accounting principles used and significant estimates made by management, as well as evaluating the overall financial statement presentation. We believe that our audit provides a reasonable basis for our opinion.
In our opinion, the financial statements and financial highlights referred to above present fairly, in all material respects, the financial position of the Fund as of August 31, 2014, the results of its operations, the changes in its net assets, and the financial highlights for the period from December 18, 2013 to August 31, 2014, in conformity with U.S. generally accepted accounting principles.
/s/ KPMG LLP
Milwaukee, WI
October 22, 2014
15
| | |
| Trustees and Officers of the Fund |
The following tables provide information about each trustee and officer of the Fund as of August 31, 2014. The address of each trustee is 111 East Kilbourn Avenue, Suite 200, Milwaukee, Wisconsin 53202. There are currently 47 separate portfolios or funds in the BMO Funds complex, of which 46 are registered as BMO Funds, Inc. and one is registered as BMO LGM Frontier Markets Equity Fund with the Securities and Exchange Commission. The Statement of Additional Information includes additional information about the trustees and is available, without charge and upon request, by calling 1-800-236-FUND (3863).
| | | | | | | | | | |
| INDEPENDENT TRUSTEES | | | | | | | | |
| Name and Age | | Position(s) Held with the Corporation | | Term of Office and Length of Time Served* | | Principal Occupation(s) During Past 5 Years | | Number of Portfolios in Fund Complex Overseen by Director | | Other Directorships Held by Director |
Larry D. Armel Age: 72 | | Independent Trustee | | Since
August 2013 | | Retired; formerly, Chairman,
Gold Bank Funds, from 2002
to 2005. | | 47 | | None |
Ridge A. Braunschweig Age: 61 | | Independent Trustee | | Since
August 2013 | | President and Chief Executive Officer, CPL Industries, Inc. (a manufacturing holding company prior to May 2009 and a family office since May 2009), since January 2012; Executive Vice President and Chief Financial Officer, CPL Industries, Inc., from 2000 to 2012. | | 47 | | None |
Benjamin M. Cutler Age: 69 | | Independent Trustee | | Since
August 2013 | | Chairman, CEO and President, USHEALTH Group, Inc. (a health insurance company), since September 2004. | | 47 | | None |
John A. Lubs Age: 66 | | Independent Trustee | | Since
August 2013 | | Retired; formerly, Vice Chairman, Mason Companies, Inc. (a footwear distributor), from 2004 to 2010 and Chief Operating Officer, from 2003 to 2010. | | 47 | | None |
James Mitchell Age: 67 | | Independent Trustee | | Since
August 2013 | | Chief Executive Officer, NOG, Inc. (a metal processing and consulting company), since 1999; Chairman, Ayrshire Precision Engineering (a precision machining company), since 1992; Chairman, Golner Precision Products, Inc. (a supplier of machine parts), from 2004 to 2008; Chief Executive Officer, General Automotive Manufacturing, LLC (an automotive parts manufacturing company), from 2001 to 2007. | | 47 | | None |
Barbara J. Pope Age: 66 | | Independent Trustee | | Since
August 2013 | | President of Barbara J. Pope, P.C. (a financial consulting firm), since 1992; President of Sedgwick Street Fund LLC (a private investment partnership), since 1996; formerly, Tax Partner, Price Waterhouse. | | 47 | | None |
| * | Each trustee serves an indefinite term until he or she retires or otherwise resigns, is removed, dies, or until his or her successor is duly elected. Retirement for a trustee occurs no later than August 31 following his or her 75th birthday. |
16
| | |
| | | Trustees and Officers of the Fund (continued) |
| | | | | | | | | | |
| INTERESTED TRUSTEES | | | | | | | | |
| Name and Age | | Position(s) Held with the Corporation | | Term of Office and Length of Time Served* | | Principal Occupation(s) During Past 5 Years | | Number of Portfolios in Fund Complex Overseen by Director | | Other Directorships Held by Director |
John M. Blaser** Age: 57 | | Trustee and President | | Since
August 2013 | | Managing Director of the Adviser, since June 2012; Vice President of the Adviser, from 1998 to 2012. | | 47 | | None |
Christopher B. Begy** Age: 60 | | Trustee | | Since
August 2013 | | President, CEO and a Director of BMO Financial Corp. and U.S. Country Head, since August 2013; Chair, BMO Harris Bank N.A., since August 2013; Director of the Adviser, since August 2013; Chief Auditor of BMO Financial Group, from 2001 to 2013. | | 47 | | None |
| * | Each trustee serves an indefinite term until he or she retires or otherwise resigns, is removed, dies or until his or her successor is duly elected. Retirement for a trustee occurs no later than August 31 following his or her 75th birthday. |
| ** | Mr. Blaser is an “interested person” of the Fund (as defined in the 1940 Act) due to the positions that he holds with the Fund and the Adviser. Mr. Begy is an “interested person” of the Fund due to the positions that he holds with the Adviser and BMO Financial Group. |
| | | | | | |
| PRINCIPAL OFFICERS | | | | |
| Name and Age | | Position(s) Held
with the Fund | | Term of Office and Length of Time Served | | Principal Occupation(s) During Past 5 Years |
Timothy M. Bonin Age: 41 | | Chief Financial Officer and Treasurer | | Elected by the Board annually; since August 2013 | | Vice President of the Adviser, since February 2006. |
John D. Boritzke Age: 58 | | Vice President | | Elected by the Board annually; since August 2013 | | Managing Director of the Adviser, since 2012; Vice President of BMO Harris Bank N.A., since 2008; Senior Vice President of the Adviser, 2008 to 2012. |
Stephen R. Oliver Age: 63 | | Chief Compliance Officer and Anti-Money Laundering Compliance Officer | | Elected by the Board annually; since August 2013 | | Vice President of BMO Harris Bank N.A, since March 2006, Vice President of BMO Investment Distributors, LLC (formerly M&I Distributors, LLC), since 2007. |
Michele L. Racadio Age: 39 | | Secretary | | Elected by the Board annually; since August 2013 | | Senior Counsel and Vice President of BMO Harris Bank N.A., since 2012; Associate, Godfrey & Kahn, S.C., 2006 to 2012. |
17
| | |
Shareholder Report Disclosure of Trustees’ Approval of
Continuation of Contracts |
Approval of Continuation of Advisory and Subadvisory Agreements
During the reporting period, the Board of Trustees (the “Board”) of BMO LGM Frontier Markets Equity Fund (the “Fund”), including the Trustees who are not “interested persons” of the Fund as defined in the Investment Company Act of 1940, as amended (the “Independent Trustees”), approved the continuation of the investment advisory agreement (the “Advisory Agreement”) between the Fund and BMO Asset Management Corp. (the “Adviser”) and the continuation of the sub-advisory agreement (the “Subadvisory Agreement”) with LGM Investments Limited (“LGM” or the “Sub-Adviser”) for an additional year ending August 31, 2015.
In connection with its consideration of the Advisory and Subadvisory Agreements, the Board requested and reviewed extensive information provided by the Adviser and the Sub-Adviser in response to requests of the Independent Trustees and their independent legal counsel. At Board meetings held on July 8-9 and August 12-13, 2014, the Board met with management of the Adviser and discussed the operations of the Fund and the nature, extent and quality of the advisory and other services provided to the Fund by the Adviser and the Sub-Adviser, as applicable. In evaluating the Advisory and Subadvisory Agreements, the Board members took into account their accumulated experience in working with the Adviser on matters related to the Fund and other funds overseen by the Board and their ongoing review of information and discussions with the Fund’s portfolio manager throughout the year at Board meetings. The Independent Trustees also met separately in executive session with their independent legal counsel to review and consider the information provided by the Adviser regarding the Advisory Agreement, and the information provided by the Sub-Adviser regarding the Subadvisory Agreement.
Based on their review, the Independent Trustees and the full Board concluded that it was in the best interests of the Fund to approve the continuation of the Advisory and Subadvisory Agreements. In reaching its decision, the Board considered materials relevant to its review of the Advisory and Subadvisory Agreements, including copies of the Advisory and Subadvisory Agreements, the fees paid to the Adviser and to the Subadviser, information regarding the Fund’s investment strategy, personnel, compliance program and operations, information regarding the Adviser’s and Subadviser’s financial condition, and other information provided in response to the requirements of Section 15(c) of the Investment Company Act of 1940, as amended. In their deliberations, the Board did not identify any single factor or group of factors as all-important or controlling but considered all factors together. The material factors and conclusions that formed the basis for the Board’s determinations are discussed below.
Nature, Extent and Quality of Services
In evaluating the nature, extent and quality of the services provided by the Adviser and Sub-Adviser to the Fund, the Board reviewed information describing the resources and key personnel of the Adviser and Sub-Adviser, including the personnel who provide investment management services to the Fund. The Board reviewed information concerning the advisory functions performed for the Fund, as well as other services performed by the Adviser and Sub-Adviser, including managing the execution of portfolio transactions, monitoring adherence to the Fund’s investment restrictions, compliance with Fund policies and procedures and with applicable securities laws and regulations, producing shareholder reports, providing support services for the Board and Board committees, communicating with shareholders and overseeing the activities of other service providers.
Review of Fund Performance
The Board reviewed the Fund’s performance against its benchmark. The Board considered the fact that the Fund had been in operations for less than six months. In light of the short performance history of the Fund, the Board determined that the performance of the Fund was adequate and that the Board would continue to monitor results.
Costs of Services Provided and Profits Realized by the Adviser and Sub-Adviser
The Board reviewed information provided by the Adviser from Strategic Insight’s Simfund database comparing the Fund’s advisory fee to the advisory fee of the comparable Morningstar, Inc. peer group. The Board noted that the contractual advisory fee was higher than the median, but that the funds in the Morningstar, Inc. peer group were emerging markets diversified funds and not specifically frontier markets funds. The Board considered the Adviser’s assessment that management of a frontier markets strategy is generally more costly than other strategies due to the nature of the strategy. In addition, the Board considered that the Adviser has agreed to a contractual expense limitation for the Fund (the “Expense Limitation”), and that the net expense ratio for the Fund takes into account the effect of the Expense Limitation.
In reviewing the information, the Board noted that the advisory fees and net expense ratios of the Fund were acceptable and the Board would continue to monitor the fees in comparison to the Fund’s peer group.
The Board considered the methodology used by the Adviser in determining compensation payable to its portfolio managers and the competitive environment for investment management talent. The Board also considered the financial condition of the Adviser and certain of its affiliates, and particularly focused on the financial strength of the ultimate parent company of the Advisor and Sub-Adviser, the Bank of Montreal (“BMO”), and BMO’s commitment, financial and otherwise, to the global asset management business and the Fund.
18
| | |
| | | BMO LGM Frontier Markets Equity Fund |
Economies of Scale
The Board considered the extent to which economies of scale would be realized as the Fund grows and whether the Fund’s fee levels reflect these economies of scale for the benefit of Fund shareholders. The Board considered the Fund’s fee structure, asset size and net expense ratio giving effect to the Fund’s Expense Limitation. The Board also considered the Adviser’s commitment to continue to evaluate advisory fee breakpoints in the future.
Other Benefits to the Adviser and Sub-Adviser
The Board considered benefits that accrue to the Adviser and its affiliates from their relationships with the Fund, including revenue in the form of administration fees and that the Sub-Adviser engages in soft dollar arrangements in connection with equity security brokerage transactions for the Fund and/or other clients. The Board noted that, other than the services provided by the Adviser and Sub-Adviser pursuant to the Advisory and Subadvisory Agreements and the related fees to be paid by the Fund, the Adviser and Sub-Adviser therefore may potentially benefit from their relationship with each other in other ways. The Board also considered that the success of the Fund could attract other business to the Adviser and that the success of the Adviser could enhance the Adviser’s ability to serve the Fund. The Board concluded that, taking into account these benefits, the Fund’s advisory fee was reasonable.
Overall Conclusions
Based on all of the information considered and the conclusions reached, the Board determined that the terms of the Advisory and Subadvisory Agreements are fair and reasonable and that the approval of the continuation of the Advisory Agreement and the Subadvisory Agreement is in the best interests of the Fund.
19
20
This report is authorized for distribution to prospective investors only when preceded or accompanied by the Fund’s prospectus, which contain facts concerning its objective and policies, management fees, expenses, and other information.
Proxy Voting
A description of the policies and procedures that the Fund uses to determine how to vote proxies relating to portfolio securities is available without charge, upon request, by calling toll free, 1-800-236-FUND (3863) and by accessing the Fund’s Statement of Additional Information, which is available on the Fund’s website at http://www.bmofunds.com and on the SEC’s website at http://www.sec.gov.
The Fund’s proxy voting record for the most recent 12-month period ended June 30 is available without charge, upon request, by calling toll free, 1-800-236-FUND (3863) and by accessing the SEC’s website at http://www.sec.gov.
Disclosure of Portfolio Holdings
The Fund files its complete schedule of portfolio holdings with the SEC for the first and third quarters of each fiscal year on Form N-Q. The Fund’s Form N-Q is available on the SEC’s website at http://www.sec.gov and may be reviewed and copied at the SEC’s Public Reference Room in Washington, D.C. Information on the operation of the Public Reference Room may be obtained by calling 1-800-SEC-0330.
Shares of the Fund are not bank deposits or other obligations of, or issued, endorsed or guaranteed by, BMO Harris Bank, NA, or any of its affiliates. Shares of the Fund, like shares of all mutual funds, are not insured or guaranteed by the U.S. government, the Federal Deposit Insurance Corporation, the Federal Reserve Board, or any other government agency. Investment in mutual funds involves investment risk, including the possible loss of principal.
BMO Funds U.S. Services
P.O. Box 55931
Boston, MA 02205-5931
1-800-236-FUND (3863)
414-287-8555
www.bmofunds.com
BMO Investment Distributors, LLC, Distributor
BMO Asset Management Corp., Investment Adviser
| | | | | | |
| © 2014 BMO Financial Group | | Investment Products are: Not FDIC Insured | | No Bank Guarantee | | May Lose Value |
Item 2. Code of Ethics.
The Registrant has a code of ethics (the “Code”) that applies to the Registrant’s principal executive officer and principal financial officer. During the period covered by this report, there were no amendments to the provisions of the Code, nor were there any implicit or explicit waivers to the provisions of the Code. The Code is filed herewith.
Item 3. Audit Committee Financial Expert.
The Registrant’s Board of Trustees has determined that the Registrant has four audit committee financial experts serving on its audit committee, each of whom is “independent” within the meaning of Form N-CSR: Ridge A. Braunschweig, Barbara J. Pope, John A. Lubs, and Benjamin M. Cutler. Under applicable securities laws, a person who is determined to be an audit committee financial expert will not be deemed an “expert” for any purpose, including without limitation for purposes of Section 11 of the Securities Act of 1933, as amended, as a result of being designated or identified as an audit committee financial expert. The designation or identification of a person as an audit committee financial expert does not impose on such person any duties, obligations, or liabilities that are greater than the duties, obligations, and liabilities imposed on such person as a member of the audit committee and Board of Trustees in the absence of such designation or identification.
Item 4. Principal Accountant Fees and Services.
The aggregate fees for professional services by KPMG LLP during the fiscal year 2014 and 2013 were as follows:
| (a) | Audit Fees for Registrant. |
| | |
Fiscal year ended August 31, 2014 | | $31,800 |
Fiscal year ended August 31, 2013 | | $0 |
| (b) | Audit-Related Fees for Registrant. These are fees by the Registrant’s independent auditors for assurance and related services that were reasonably related to the performance of the audit of the Registrant’s financial statements. |
| | |
Fiscal year ended August 31, 2014 | | $0 |
Fiscal year ended August 31, 2013 | | $0 |
| (c) | Tax Fees for Registrant. These are fees for professional services rendered by the Registrant’s independent auditors for tax compliance, tax advice, and tax planning. |
| | |
Fiscal year ended August 31, 2014 | | $3,500 |
Fiscal year ended August 31, 2013 | | $0 |
| | |
Fiscal year ended August 31, 2014 | | None |
Fiscal year ended August 31, 2013 | | None |
| (e) | Audit Committee’s pre-approval policies and procedures. |
| | (1) | The Audit Committee has adopted pre-approval policies and procedures that require the Audit Committee to pre-approve all audit and non-audit services of the Registrant, including services provided to the Registrant’s investment adviser or any entity controlling, controlled by or under common control with the Registrant’s investment adviser that provides ongoing services to the Registrant with respect to any engagement that directly relates to the operations and financial reporting of the Registrant. |
| | (2) | Services approved pursuant to paragraph (c)(7)(i)(C) of Rule 2-01 of Regulation S-X: 100% of these fees were approved by the Audit Committee as required pursuant to paragraph (c)(7)(ii) of Rule 2-01 of Regulation S-X. |
| (g) | During the last two fiscal years, there were no other non-audit services rendered by the Registrant’s independent auditors to the Registrant, its investment adviser or any entity controlling, controlled by or under the common control with the investment adviser that provides ongoing services to the Registrant. |
Item 5. Audit Committee of Listed Registrants.
Not applicable.
Item 6. Schedule of Investments.
Included as part of the report to shareholders filed under Item 1 of this Form N-CSR.
Item 7. Disclosure of Proxy Voting Policies and Procedures for Closed-End Management Investment Companies.
The Board of Trustees has delegated the authority to vote proxies relating to the securities held in the BMO LGM Frontier Markets Equity Fund’s (the “Fund) portfolio to BMO Asset Management Corp. (the “Adviser”) and has authorized the Adviser to delegate its authority to vote proxies to LGM Investments Limited (“LGM” or the “Sub-Adviser”) on behalf of the Fund. As used in this section, the term Adviser means Adviser or Sub-Adviser, as applicable. The Adviser will generally attempt to process every proxy it receives for all domestic and foreign securities. However, there may be situations in which the Adviser may be unable to vote a proxy, or may choose not to vote a proxy, such as where: (i) the proxy ballot was not received from the custodian bank; (ii) a meeting notice was received too late; (iii) there are fees imposed upon the exercise of a vote and it is determined that such fees outweigh the benefit of voting; (iv) there are legal encumbrances to voting, including blocking restrictions in certain markets that preclude the ability to dispose of a security if the Adviser votes a proxy or where the Adviser is prohibited from voting by applicable law or other regulatory or market requirements, including but not limited to, effective Powers of Attorney; (v) the Adviser held shares on the record date but has sold them prior to the meeting date; (vi) proxy voting service is not offered by the custodian in the market; or (vii) the Adviser believes it is not in the best interest of the Fund or its shareholders to vote the proxy for any other reason not enumerated herein.
Adviser’s Proxy Voting Policy and Guidelines
The Adviser has adopted proxy voting policies and procedures reasonably designed to ensure that proxies are voted in the best interest of clients. The policies and procedures were developed by a Proxy Advisory Committee established by the Adviser with certain affiliates of BMO Financial Corp. The proxy policies and procedures generally address issues related to boards of directors,
compensation plans, auditors and shareholder rights. In situations where there is a conflict of interest, the Adviser will obtain a proxy voting recommendation from an independent proxy voting advisory service and will ultimately vote proxies in the best economic interests of clients without consideration of any benefit to the Adviser or its affiliates.
LGM’s Proxy Voting Policies and Procedures
Unless a client specifies to the contrary in the client’s agreement with LGM, LGM is responsible for the proxy voting of stocks held in the client’s account. LGM has adopted and implemented proxy voting policies and procedures that it believes to be reasonably designed to ensure that proxies are voted in the best interest of its clients, and in accordance with its fiduciary duties, with Rule 206(4)-6 under the Investment Advisers Act of 1940, as amended and with the long-standing fiduciary standards and responsibilities for ERISA accounts set out in Department of Labor Bulletin 94-2 C.F.R. 2509.94-2 (July 29, 1994). LGM will normally vote proxies in accordance with these guidelines unless it determines that it is in the best economic interests of the clients to vote contrary to the guidelines. LGM’s voting guidelines generally address issues related to boards of directors, auditors, equity-based compensation plans, and shareholder rights. A conflict of interest may exist, for example, when an issuer who is soliciting proxy votes also has a client relationship with LGM. When a conflict of interest arises, in order to ensure that proxies are voted solely in the best interest of the clients, LGM will vote in accordance with its written guidelines or seek the client’s instructions before voting.
Item 8. Portfolio Managers of Closed-End Management Investment Companies.
(a)(1) Identification of Portfolio Manager(s) and Description of Role of Portfolio Manager(s)
The following provides biographical information about the Portfolio Managers, who are primarily responsible for the day-to-day portfolio management of the BMO LGM Frontier Markets Equity Fund (the “Fund”) as of August 31, 2014:
Thomas Vester and Dafydd Lewis co-manage the Fund.
Mr. Vester, Chief Investment Officer and Senior Portfolio Manager at LGM, joined LGM Investments (together with LGM and its subsidiaries, LGMI) in 2011 and has managed the Fund since its inception in December 2013. Previously, Mr. Vester was a portfolio manager with BankInvest in Copenhagen from 2005 to 2011.
Mr. Lewis, a Portfolio Manager at LGM, joined LGMI in 2011 and has co-managed the Fund since July 2014. Mr. Lewis previously was a member of HSBC’s emerging market equity strategy team from 2005 to 2008, and served as an investment analyst with GAM’s emerging market team focusing on global frontier markets from 2008 to 2011.
(a)(2) Other Accounts Managed by Portfolio Manager(s) or Management Team Member and Potential Conflicts of Interest
The following table provides information about portfolios and accounts, other than the Fund, for which the Portfolio Managers are primarily responsible for the day-to-day portfolio management as of August 31, 2014:
| | | | | | | | | | | | | | | | | | |
(i)Name of Portfolio Manager | | Type of Accounts | | (ii)Total
Number
of
Accounts
Managed | | | Total Assets | | | (iii)Number
of Accounts
Managed for
Which
Advisory Fee
is Based on
Performance | | | Total Assets for
Which Advisory
Fee is Based on
Performance | |
Thomas Vester | | Registered Investment Companies | | | 0 | | | $ | 0 | | | | 0 | | | $ | 0 | |
| | Other Pooled Investment Vehicles | | | 2 | | | $ | 847,980,000 | | | | 1 | | | $ | 379,330,000 | |
| | Other Accounts | | | 0 | | | $ | 0 | | | | 0 | | | $ | 0 | |
| | | | | |
Dafydd Lewis | | Registered Investment Companies | | | 0 | | | $ | 0 | | | | 0 | | | $ | 0 | |
| | Other Pooled Investment Vehicles | | | 2 | | | $ | 847,980,000 | | | | 1 | | | $ | 379,330,000 | |
| | Other Accounts | | | 0 | | | $ | 0 | | | | 0 | | | $ | 0 | |
Potential Conflicts of Interests
A conflict of interest may arise as a result of a portfolio manager being responsible for multiple accounts, including the Fund, which may have different investment guidelines and objectives. In addition to the Fund, these accounts may include other mutual funds managed on an advisory or subadvisory basis, separate accounts and collective trust accounts. An investment opportunity may be suitable for the Fund as well as for any of the other managed accounts. However, the investment may not be available in sufficient quantity for all of the accounts to participate fully. In addition, there may be limited opportunity to sell an investment held by the Fund and the other accounts. The other accounts may have similar investment objectives or strategies as the Fund, they may track the same benchmarks or indexes as the Fund tracks, and they may sell securities that are eligible to be held, sold or purchased by the Fund. A portfolio manager may be responsible for accounts that have different advisory fee schedules, which may create the incentive for the portfolio manager to favor one account over another in terms of access to investment opportunities. A portfolio manager also may manage accounts whose investment objectives and policies differ from those of the Fund, which may cause the portfolio manager to effect trading in one account that may have an adverse effect on the value of the holdings within another account, including the Fund.
To address and manage these potential conflicts of interest, the Adviser and LGM have each adopted compliance policies and procedures to allocate investment opportunities and to ensure that each of their clients is treated on a fair and equitable basis. Such policies and procedures include, but are not limited to, trade allocation and trade aggregation policies, cross trading policies, portfolio manager assignment practices and oversight by investment management and/or compliance departments.
(a)(3) Compensation Structure of Portfolio Manager(s)
Adviser
Compensation for the Adviser’s portfolio managers consists of base salary, which is monitored to ensure competitiveness in the external marketplace. In addition to base salary, portfolio managers have a portion of their compensation tied to the investment performance of client accounts. The formula for each professional varies according to their level of portfolio responsibility and seniority. Investment professionals may also receive bonuses of restricted share units or other units linked to the performance of BMO Financial Group.
LGM
Compensation for LGM’s portfolio managers consists of three components: (1) competitive base salary; (2) discretionary bonus; and (3) long-term incentive program (deferred stock units and/or stock options of BMO Financial Group). Each portfolio manager’s discretionary bonus is based on the performance of his or her portfolios, as well as his or her contribution to the team as a whole and the overall financial success of the firm. The long-term incentive program is structured so that portfolio managers earn an allocation tied to the firm’s results. This program has a rolling vesting feature designed to provide continuity within the senior professional group.
The compensation program has a dual mandate to align the investment team’s interests with those of the client, and to attract and retain high caliber investment professionals. Senior management relies on Human Resources professionals to conduct periodic industry surveys, typically on an annual basis, to determine appropriate market levels of base and total compensation for all investment professionals.
With respect to any perceived conflicts of interest relating to the payment model, the risk management focus of the investment process drives all key decision making. Likewise, individual compensation is weighted more toward long term profit from fee-based client relationships than it is on short term performance, which further motivates the team to achieve stable long-term fee-based relationships through consistent benchmark outperformance and capital preservation. Finally, the deferred equity-linked component of the incentive compensation plan promotes a long-term interest in firm value.
(a)(4) Disclosure of Securities Ownership
The following table sets forth the dollar range of equity securities beneficially owned by each Portfolio Manager in the Fund as of August 31, 2014:
| | |
Portfolio Manager | | Dollar Range of Fund Shares
Beneficially Owned |
Thomas Vester | | None |
Dafydd Lewis | | None |
Item 9. Purchases of Equity Securities by Closed-End Management Investment Company and Affiliated Purchasers.
REGISTRANT PURCHASES OF EQUITY SECURITIES
| | | | | | | | | | | | | | | | | | | | |
| Period | | (a) Total Number
of Shares (or
Units) Purchased | | | | | (b) Average
Price Paid per
Share (of
Unit) | | | | | (c) Total Number of Shares
(or Units) Purchased as Part of
Publicly Announced Plans or Programs | | | (d) Maximum Number (or Approximate Dollar
Value) of Shares (or Units) that May Yet Be Purchased Under the Plans or Programs | |
| | | | | | |
Dec. 18-31, 2013 | | | 0 | | | | | | 0 | | | | | | 0 | | | | 0 | |
| | | | | | |
Jan. 1-31, 2014 | | | 0 | | | | | | 0 | | | | | | 0 | | | | 0 | |
| | | | | | |
Feb. 1-28, 2014 | | | 0 | | | | | | 0 | | | | | | 0 | | | | 0 | |
| | | | | | |
Mar. 1-31, 2014 | | | 126,335 | | | | | | 9.96 | | | | | | 0 | | | | 0 | |
| | | | | | |
Apr. 1-30, 2014 | | | 0 | | | | | | 0 | | | | | | 0 | | | | 0 | |
| | | | | | |
May. 1-31, 2014 | | | 0 | | | | | | 0 | | | | | | 0 | | | | 0 | |
| | | | | | |
Jun. 1-30, 2014 | | | 169,414 | | | | | | 10.18 | | | | | | 0 | | | | 0 | |
| | | | | | |
Jul. 1-31, 2014 | | | 0 | | | | | | 0 | | | | | | 0 | | | | 0 | |
| | | | | | |
Aug. 1-31, 2014 | | | 0 | | | | | | 0 | | | | | | 0 | | | | 0 | |
| | | | | | |
Total | | | 0 | | | | | | 0 | | | | | | 0 | | | | 0 | |
*On February 18, 2014, and May 19, 2014, the Fund offered to repurchase up to 5% of the Fund’s total outstanding shares or 150,363 and 173,798 shares, respectively, pursuant to its periodic repurchase plans. Fund inception date is December 18, 2013.
Item 10. Submission of Matters to a Vote of Security Holders.
Not applicable.
Item 11. Controls and Procedures.
| (a) | The Registrant’s principal executive officer and principal financial officer have reviewed the Registrant’s disclosure controls and procedures (as defined in Rule 30a-3(c) under the Investment Company Act of 1940, as amended, (the “Act”)) as of a date within 90 days of the filing of this report, as required by Rule 30a-3(b) under the Act. Based on their review, such officers have concluded that the disclosure controls and procedures were effective in ensuring that information required to be disclosed in this report was appropriately recorded, processed, summarized and reported and made known to them by others within the Registrant and by the Registrant’s service providers. |
| (b) | There were no changes in the Registrant’s internal control over financial reporting (as defined in Rule 30a-3(d) under the Act (17 CFR 270.30a-3(d)) that occurred during the Registrant’s second fiscal quarter of the period covered by this report that materially affected, or were reasonably likely to materially affect, the Registrant’s internal control over financial reporting. |
Item 12. Exhibits.
(a) (1) Code of Ethics. Filed herewith.
(a) (2) Certifications required pursuant to Section 302 of the Sarbanes-Oxley Act of 2002. Filed herewith.
(a) (3) Not applicable.
| (b) | Certification pursuant to Section 906 of the Sarbanes-Oxley Act of 2002. Filed herewith. |
SIGNATURES
Pursuant to the requirements of the Securities Exchange Act of 1934 and the Investment Company Act of 1940, the Registrant has duly caused this report to be signed on its behalf by the undersigned, thereunto duly authorized.
BMO LGM Frontier Markets Equity Fund
/s/ John M. Blaser
By: John M. Blaser
President
October 22, 2014
Pursuant to the requirements of the Securities Exchange Act of 1934 and the Investment Company Act of 1940, this report has been signed below by the following persons on behalf of the Registrant and in the capacities and on the dates indicated.
/s/ John M. Blaser
By: John M. Blaser
President
(Principal Executive Officer)
October 22, 2014
/s/ Timothy M. Bonin
By: Timothy M. Bonin
Treasurer
(Principal Financial Officer)
October 22, 2014