UNITED STATES
SECURITIES AND EXCHANGE COMMISSION
Washington, D.C. 20549
FORMN-CSR
CERTIFIED SHAREHOLDER REPORT OF REGISTERED MANAGEMENT
INVESTMENT COMPANIES
Investment Company Act File Number811-22882
BMO LGM Frontier Markets Equity Fund
(Exact name of registrant as specified in charter)
111 East Kilbourn Avenue, Suite 200
Milwaukee, WI 53202
(Address of principal executive offices) (Zip code)
John M. Blaser
BMO Asset Management Corp.
111 East Kilbourn Avenue, Suite 200
Milwaukee, WI 53202
(Name and address of agent for service)
Copies to:
Michael P. O’Hare, Esq.
Stradley, Ronon, Stevens & Young, LLP
2005 Market Street, Suite 2600
Philadelphia, PA 19103
Registrant’s telephone number, including area code:(800)236-3863
Date of fiscal year end:August 31
Date of reporting period:August 31, 2019
Item 1. Reports to Stockholders.
The following is a copy of the report transmitted to shareholders pursuant to Rule30e-1 under the Investment Company Act of 1940, as amended (the “Act”).
Annualreport
LGM Frontier Markets Equity Fund
Notification of electronic delivery of shareholder materials
Beginning on January 1, 2021, as permitted by regulations adopted by the Securities and Exchange Commission, paper copies of the Fund’s shareholder reports will no longer be sent by mail, unless you specifically request paper copies of the reports from the Fund or from your broker/dealer, investment professional, or financial institution. Instead, the reports will be made available online at bmofunds.com/documents, and you will be notified by mail each time a report is posted and provided with a website link to access the report.
If you already elected to receive shareholder reports electronically, you will not be affected by this change and you need not take any action. You may elect to receive shareholder reports and other communications from the Fund electronically by calling1-800-236-FUND (3863), by sending an email request to bmofundsus.services@bmo.com, or by asking your broker/dealer, investment professional, or financial institution.
Beginning on January 1, 2019, you may elect to receive all future reports in paper free of charge. If you invest through a financial intermediary, you can contact your financial intermediary to request that you continue to receive paper copies of your shareholder reports. If you invest directly with the Fund, you can call the Fund toll-free at 1-800-236-FUND (3863) or send an email request to bmofundsus.services@bmo.com. Your election to receive reports in paper will apply to all funds held in your account if you invest through your financial intermediary or all funds held with the fund complex if you invest directly with the Fund.

Table of Contents
| | | | |
Not FDIC Insured | | No Bank Guarantee | | May Lose Value |
| | |
| | |
| Annual Report | | BMO LGM Frontier Markets Equity Fund |
| | | | | | | | |
Average annual total returns (%) | |
| | | 1-Year | | | Since
Inception | |
| BMO LGM Frontier Markets Equity Fund (the Fund) | | | (16.34 | ) | | | (1.93 | ) |
| Blended Index (50% Morgan Stanley Capital International Frontier Markets Index and 50% Morgan Stanley Capital International Frontier Marketsex-GCC Countries Index) | | | 3.83 | | | | 1.21 | |
| MSCI Frontier Markets Index | | | 7.92 | | | | 2.92 | |
| Lipper Emerging Market Fund Index | | | (1.65 | ) | | | 2.52 | |
The performance data quoted represents past performance which is no guarantee of future results. Investment return and principal value will fluctuate so that an investor’s shares, when redeemend, may be worth more or less than their original costs. Mutual fund performance changes over time and current performance may be lower or higher than what is stated. To receive current performance to the most recentmonth-end, please call1-800-236-3863 or visit www.bmofunds.com.
The Fund’s benchmark is a blended benchmark consisting of 50% Morgan Stanley Capital International (MSCI) Frontier Markets Index and 50% MSCI Frontier Markets ex Gulf Cooperation Council (GCC) Countires Index. The MSCI Frontier Markets Index is a free float-adjusted market capitalization index that is designed to measure equity market performance of frontier markets. This index consists of the following 29 frontier market country indices: Argentina, Bahrain, Bangladesh, Burkina Faso, Benin, Croatia, Estonia, Guinea-Bissau, Ivory Coast, Jordan, Kenya, Kuwait, Lebanon, Lithuania, Kazakhstan, Mauritius, Mali, Morocco, Niger, Nigeria, Oman, Romania, Serbia, Senegal, Slovenia, Sri Lanka, Togo, Tunisia and Vietnam. The MSCI GCC Countries Index aims to represent the universe of companies in 6 GCC equity markets: Bahrain, Kuwait, Oman, Qatar, Saudi Arabia and United Arab Emirates.
Lipper indices measure the performance of the 30 largest mutual funds in each respective fund category.
Commentary
The BMO LGM Frontier Markets Equity Fund (the Fund) returned-16.34% for the fiscal year ended August 31, 2019 versus the Blended Index (50% Morgan Stanley Capital International Frontier Markets and 50% Morgan Stanley Capital International Frontier Markets EX GCC) and the Lipper Emerging Markets Fund index, which returned 3.83% and-1.65%, respectively.
Performance over the last 12 months has not been good; however, we do not believe this has been due to deterioration in the fundamentals of the companies we are investing in. We are seeing this in the results coming from the companies held in the Fund.
Exposures in Puerto Rico, Nigeria (where the portfolio is underweight relative to the index) and Turkey added to the relative return while alpha was lost through exposures in Argentina (which was upgraded to emerging market status by MSCI in June of 2019), Pakistan, and Zimbabwe. In addition, the portfolio underweight in Kuwait also hurt relative performance.
The top performing stocks in the period were EVERTEC, Inc. (4.3% of the Fund, 46% return) and Coca-Cola Icecek As (3.3% of the Fund, 42% return). Icecek is aCoca-Cola bottler in Turkey operating in a number of Middle East and northern Asian markets. The company faced a challenging environment for the first half of 2018, largely due totop-down and political uncertainty in its country of listing, Turkey. The company continued to deliver decent results over the period and has benefited from stability in the macroeconomic situation.
Stocks that detracted from performance included Delta Corp., Ltd. (1.6% of the Fund,-94% return), Tanzania Breweries, Ltd. (3.4% of the Fund,-37% return) and Eastern Co. SAE (8% of the Fund,-14.7% return). During 2019, the Zimbabwean government took a number of steps to address the serious liquidity issues in the country; unfortunately, liquidity in the interbank market has not returned. As such, the pricing of Delta reflects this and the Fund’s restricted ability to repatriate U.S. dollars from Zimbabwe. We continue to believe that a number of the steps taken by the government are positive and, although painful, are necessary to address legacy problems within the country.
In Egypt, Eastern underperformed despite some very important changes for the company. The company has been in the process of transforming from a public sector company to one which, following the annual general meeting at the beginning of June, will operate under private sector laws. We have already seen a private sector CEO put in place and followed by a new board. This board is more private-sector focused and is empowered to enact much needed changes at the company which can drive significant value creation.
Investment Adviser:
BMO Asset Management Corp.
Sub-adviser:
LGM Investments Limited
Fund Managers; Investment Experience
Thomas Vester, CFA; since 2005
Dafydd Lewis, CFA; since 2005
| | | | | | | | | | | | | | | | | | | | |
| | | | | | | | | Inception
date | | | Expenses (%) | |
| Share class | | Ticker | | | Cusip | | | Gross | | | Net | |
| Institutional (I) | | | BLGFX | | | | 05578V102 | | | | 12/18/2013 | | | | 2.15 | | | | 2.01 | |
The above expense ratios are from the Fund’s Prospectus dated December 28, 2018, and are inclusive of Acquired Fund Fees and Expenses. See Note 5 in the Notes to Financial Statements for additional information. Net expense ratios reflect contractual fee waivers and/or expense reimbursements if applicable, made by BMO Asset Management Corp., the investment adviser (Adviser). The Adviser may not terminate these fee waivers and/or expense reimbursements prior to December 31, 2020 without the consent of the Board of Directors, unless the investment advisory agreement is terminated. Without these contractual waivers, the Fund’s returns would have been lower.
| | | | |
| Sector | | Fund (%) | |
| Communication Services | | | 5.0 | |
| Consumer Discretionary | | | 7.9 | |
| Consumer Staples | | | 37.8 | |
| Financials | | | 28.4 | |
| Healthcare | | | 0.9 | |
| Industrials | | | 3.3 | |
| Information Technology | | | 5.3 | |
| Participation Notes | | | 5.9 | |
| Other Assets & Liabilities, Net | | | 5.5 | |
| Total | | | 100.0 | |
Portfolio composition will change due to the ongoing management of the Fund. The percentages are based on net assets as of August 31, 2019 and may not necessarily reflect adjustments that are routinely made when presenting net assets for formal financial statement processes.
Growth of an assumed $10,000 investment
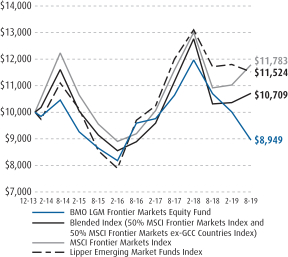
This graph illustrates the hypothetical investment of $10,000 from the Fund’s inception date, December 18, 2013, to August 31, 2019.
2
| | |
| | |
| | | Expense Example(Unaudited) |
For the Six Months Ended August 31, 2019
As a shareholder of the Fund, you may incur two types of costs: (1) transaction costs, which may include sales charges (loads) on purchase payments, reinvested dividends, or other distributions; redemption fees; and exchange fees; and (2) ongoing costs, including management fees; distribution and/or service(12b-1) fees; and other Fund expenses. This Example is intended to help you understand your ongoing costs (in dollars) of investing in the Funds and to compare these costs with the ongoing costs of investing in other mutual funds.
The Example is based on an investment of $1,000 invested at the beginning of the period and held for the entire six month period ended August 31, 2019(3/1/19-8/31/19).
Actual Expenses
The information in the table under the heading “Actual Expenses” information about actual account values and actual expenses. You may use the information in this line, together with the amount you invested, to estimate the expenses that you paid over the period. Simply divide your account value by $1,000 (for example, an $8,600 account value divided by $1,000 = 8.6), then multiply the result by the number in the first line under the heading entitled “Expenses Paid During Period” to estimate the expenses you paid on your account during this period.
Hypothetical Example for Comparison Purposes
The information in the table under the heading “Hypothetical Expenses” provides information about hypothetical account values and hypothetical expenses based on a Fund’s actual expense ratio and an assumed rate of return of 5% per year before expenses, which is not the Fund’s actual return. The hypothetical account values and expenses may not be used to estimate the actual ending account balance or expenses you paid for the period. You may use this information to compare the ongoing costs of investing in a Fund and other funds. To do so, compare this 5% hypothetical example with the 5% hypothetical examples that appear in the shareholder reports of the other funds.
Please note that the expenses shown in the table are meant to highlight your ongoing costs only and do not reflect any transaction costs, such as sales charges (loads), redemption fees, or exchange fees. Therefore, the information under the heading “Hypothetical Expenses” useful in comparing ongoing costs only, and will not help you determine the relative total costs of owning different funds. In addition, if these transaction costs were included, your costs would have been higher.
| | | | | | | | | | | | | | | | | | | | | | |
| | | | Actual Expenses | | | Hypothetical Expenses | | | | |
Beginning
account
value
3/1/19 | | | Ending
account
value
8/31/19 | | | Expenses
paid during
period
3/1/19-
8/31/19(1) | | | Ending
account
value
8/31/19 | | | Expenses
paid during
period
3/1/19-
8/31/19(1) | | | Annualized
Expense
Ratio(1) | |
| $ | 1,000.00 | | | $ | 893.70 | | | $ | 9.55 | | | $ | 1,015.10 | | | $ | 10.16 | | | | 2.00 | % |
| (1) | Expenses are equal to the Fund’s annualized expense ratios for the period March 1, 2019 through August 31, 2019, multiplied by the average account value over the period, multiplied by 184/365 (to reflect theone-half year period). These expenses and ratios are exclusive of acquired fund fees and expenses. |
3
August 31, 2019
| | | | | | | | |
| Description | | Shares | | | Value | |
| Common Stocks — 88.6% | | | | | | |
| | |
| Argentina — 2.7% | | | | | | |
Banco BBVA Argentina SA, ADR | | | 290,394 | | | $ | 1,225,463 | |
Despegar.com Corp. (1) (2) | | | 183,400 | | | | 2,006,396 | |
| | | | | | | | |
| | | | | | | 3,231,859 | |
| | |
| Botswana — 0.9% | | | | | | |
Letshego Holdings, Ltd. | | | 13,763,348 | | | | 1,057,576 | |
| | |
| Colombia — 1.3% | | | | | | |
Bolsa de Valores de Colombia | | | 448,275 | | | | 1,565,151 | |
| | |
| Costa Rica — 2.8% | | | | | | |
Florida Ice & Farm Co. SA | | | 2,813,131 | | | | 3,305,615 | |
| | |
| Croatia — 0.0% | | | | | | |
Ledo DD (1) | | | 632 | | | | — | |
| | |
| Egypt — 13.8% | | | | | | |
Alexandria Containers & Goods | | | 294,710 | | | | 201,222 | |
Commercial International Bank Egypt SAE, GDR | | | 1,161,206 | | | | 5,399,608 | |
Eastern Co. SAE | | | 11,585,946 | | | | 10,780,880 | |
| | | | | | | | |
| | | | | | | 16,381,710 | |
| | |
| Georgia — 4.5% | | | | | | |
Bank of Georgia Group PLC | | | 162,295 | | | | 2,687,710 | |
Georgia Capital PLC (1) | | | 175,473 | | | | 2,130,884 | |
Georgia Healthcare Group PLC (acquisition cost - $462,837; acquired 11/09/2015) (6) | | | 171,495 | | | | 473,692 | |
| | | | | | | | |
| | | | | | | 5,292,286 | |
| | |
| Ghana — 0.5% | | | | | | |
FAN Milk, Ltd. | | | 355,900 | | | | 356,875 | |
Unilever Ghana, Ltd. | | | 90,900 | | | | 278,926 | |
| | | | | | | | |
| | | | | | | 635,801 | |
| | |
| Kenya — 4.1% | | | | | | |
Barclays Bank of Kenya, Ltd. | | | 12,080,000 | | | | 1,295,536 | |
British American Tobacco Kenya, Ltd. | | | 283,393 | | | | 1,382,739 | |
East African Breweries, Ltd. | | | 1,151,400 | | | | 2,169,304 | |
Uchumi Supermarkets PLC (1) | | | 595,500 | | | | 1,726 | |
| | | | | | | | |
| | | | | | | 4,849,305 | |
| | |
| Kuwait — 1.0% | | | | | | |
Humansoft Holding Co. KSC | | | 111,364 | | | | 1,172,253 | |
| | |
| Mauritius — 2.5% | | | | | | |
MCB Group, Ltd. | | | 360,710 | | | | 2,964,330 | |
| | |
| Nigeria — 5.2% | | | | | | |
Guaranty Trust Bank PLC | | | 69,649,694 | | | | 5,248,868 | |
Guaranty Trust Bank PLC, GDR | | | 245,000 | | | | 906,500 | |
| | | | | | | | |
| | | | | | | 6,155,368 | |
| | |
| Pakistan — 5.0% | | | | | | |
Abbott Laboratories Pakistan, Ltd. | | | 515,345 | | | | 1,110,430 | |
United Bank, Ltd. | | | 5,817,900 | | | | 4,815,019 | |
| | | | | | | | |
| | | | | | | 5,925,449 | |
| | |
| Peru — 8.4% | | | | | | |
Alicorp SAA | | | 2,982,353 | | | | 8,348,760 | |
Credicorp, Ltd. | | | 7,766 | | | | 1,608,494 | |
| | | | | | | | |
| | | | | | | 9,957,254 | |
| | |
| Puerto Rico — 5.3% | | | | | | |
EVERTEC, Inc. | | | 180,800 | | | | 6,302,688 | |
| | |
| Senegal — 5.0% | | | | | | |
Sonatel SA | | | 215,858 | | | | 5,929,548 | |
| | |
| South Africa — 3.4% | | | | | | |
Famous Brands, Ltd. | | | 773,729 | | | | 4,022,498 | |
| | | | | | | | |
| Description | | Shares or
Participation
Units | | | Value | |
| Common Stocks (continued) | | | | | | |
| | |
| Sri Lanka — 2.4% | | | | | | |
Ceylon Tobacco Co. PLC | | | 244,387 | | | $ | 1,634,240 | |
Commercial Bank of Ceylon PLC | | | 1,943,439 | | | | 1,166,389 | |
| | | | | | | | |
| | | | | | | 2,800,629 | |
|
| Tanzania (United Republic Of) — 3.5% | |
Tanzania Breweries, Ltd. | | | 869,747 | | | | 4,119,158 | |
| | |
| Tunisia — 0.5% | | | | | | |
Delice Holding | | | 148,095 | | | | 566,014 | |
| | |
| Turkey — 3.7% | | | | | | |
Coca-Cola Icecek AS | | | 734,355 | | | | 4,343,238 | |
| | |
| United Arab Emirates — 3.1% | | | | | | |
Aramex PJSC | | | 3,218,511 | | | | 3,688,913 | |
| | |
| United Kingdom — 1.2% | | | | | | |
ASA International Group PLC (acquisition cost - $1,382,026; acquired 07/13/2018) (2) (6) | | | 320,630 | | | | 1,482,541 | |
| | |
| United States — 2.6% | | | | | | |
PriceSmart, Inc. | | | 50,416 | | | | 3,046,639 | |
| | |
| Vietnam — 4.7% | | | | | | |
Mobile World Investment Corp. | | | 105,000 | | | | 529,393 | |
Phu Nhuan Jewelry JSC | | | 470,080 | | | | 1,666,548 | |
Vietnam Dairy Products JSC | | | 625,119 | | | | 3,316,209 | |
| | | | | | | | |
| | | | | | | 5,512,150 | |
| | |
| Zimbabwe — 0.5% | | | | | | |
Delta Corp., Ltd. | | | 2,033,479 | | | | 569,397 | |
| | | | | | | | |
Total Common Stocks
(identified cost $120,704,410) | | | | | | | 104,877,370 | |
| | |
| Participation Notes — 5.9% | | | | | | |
| | |
| United Kingdom — 5.9% | | | | | | |
Humansoft Holding Co. KSC, Issued by HSBC Bank PLC, Maturity Date 8/03/2020 (3) | | | 560,457 | | | | 5,899,548 | |
Saudia Dairy & Foodstuff Co., Issued by HSBC Bank PLC, Maturity Date 5/10/2021 (3) | | | 32,202 | | | | 1,074,917 | |
| | | | | | | | |
Total Participation Notes
(identified cost $6,667,969) | | | | | | | 6,974,465 | |
| |
| Short-Term Investments — 7.5% | | | | |
|
| Collateral Investment for Securities on Loan — 1.8% | |
BMO Institutional Prime Money Market Fund — Premier Class, 2.097% (4) (5) | | | 2,145,290 | | | | 2,145,290 | |
| | |
| Mutual Funds — 5.7% | | | | | | |
BMO Institutional Prime Money Market Fund — Premier Class, 2.097% (5) | | | 6,644,242 | | | | 6,644,906 | |
| | | | | | | | |
Total Short-Term Investments
(identified cost $8,789,785) | | | | | | | 8,790,196 | |
| | | | | | | | |
Total Investments — 102.0%
(identified cost $136,162,164) | | | | | | | 120,642,031 | |
| Other Assets and Liabilities — (2.0)% | | | | (2,312,528 | ) |
| | | | | | | | |
| Total Net Assets — 100.0% | | | | | | $ | 118,329,503 | |
| | | | | | | | |
(See Notes which are an integral part of the Financial Statements)
4
| | |
| | |
| | | BMO LGM Frontier Markets Equity Fund |
| | | | | | | | |
|
| Industry Allocation as of August 31, 2019 | |
| Industry | | Value | | | % of
Total
Net Assets | |
Agriculture | | $ | 13,797,859 | | | | 11.7 | % |
Banks | | | 27,317,917 | | | | 23.1 | |
Beverages | | | 14,503,329 | | | | 12.3 | |
Commercial Services | | | 8,227,559 | | | | 6.9 | |
Diversified Financial Services | | | 4,105,268 | | | | 3.4 | |
Food | | | 12,023,570 | | | | 10.1 | |
Holding Companies-Diversified | | | 569,397 | | | | 0.5 | |
Internet | | | 2,006,396 | | | | 1.7 | |
Investment Companies | | | 2,130,884 | | | | 1.8 | |
Pharmaceuticals | | | 1,110,430 | | | | 0.9 | |
Retail | | | 9,265,078 | | | | 7.9 | |
Telecommunications | | | 5,929,548 | | | | 5.0 | |
Transportation | | | 3,890,135 | | | | 3.3 | |
| | | | | | | | |
Total Common Stocks | | | 104,877,370 | | | | 88.6 | |
Participation Notes | | | 6,974,465 | | | | 5.9 | |
Collateral Investment for Securities on Loan | | | 2,145,290 | | | | 1.8 | |
Mutual Funds | | | 6,644,906 | | | | 5.7 | |
| | | | | | | | |
Total Investments | | | 120,642,031 | | | | 102.0 | |
Other Assets and Liabilities | | | (2,312,528 | ) | | | (2.0 | ) |
| | | | | | | | |
Net Assets | | $ | 118,329,503 | | | | 100.0 | % |
| | | | | | | | |
| | |
| | |
| Notes to Schedule of Investments | | |
The categories of investments are shown as a percentage of total net assets for the Fund as of August 31, 2019.
| (2) | Certain shares or principal amounts are temporarily on loan to unaffiliated brokers-dealers. |
| (3) | Participation notes are issued by banks or broker-dealers and are designed to offer a return linked to the performance of a particular underlying equity security or market. |
| (4) | Please refer to Note 2, subsectionSecurities Lending, in the Notes to Financial Statements. |
| (5) | Denotes an investment in an affiliated entity. Please refer to Note 5, subsectionInvestments in Affiliated Issuers, in the Notes to Financial Statements. |
| (6) | Denotes a restricted security which is subject to restrictions on resale under federal securities laws. |
The following acronyms may be referenced throughout this report:
| ADR | — American Depository Receipt |
| FDIC | — Federal Depository Insurance Corporation |
| GDR | — Global Depository Receipt |
| LLC | — Limited Liability Corporation |
| PLC | — Public Limited Company |
(See Notes which are an integral part of the Financial Statements)
5
August 31, 2019
| | |
| | |
| Statement of Assets and Liabilities | | BMO LGM Frontier Markets Equity Fund |
| | | | |
Assets: | | | | |
Investments in unaffiliated issuers, at value | | $ | 111,851,835 | (1) |
Cash sweep investments in affiliated issuers, at value | | | 8,790,196 | |
Cash denominated in foreign currencies | | | 74,501 | (2) |
Dividends and interest receivable | | | 77,253 | |
Prepaid expenses and other receivables | | | 20,603 | |
| | | | |
Total assets | | | 120,814,388 | |
| |
Liabilities: | | | | |
Payable for return of securities lending collateral | | | 2,145,290 | |
Payable for foreign tax expense | | | 54,960 | |
Payable to affiliates, net (Note 5) | | | 164,408 | |
Other liabilities | | | 120,227 | |
| | | | |
Total liabilities | | | 2,484,885 | |
| | | | |
Total net assets | | $ | 118,329,503 | |
| | | | |
| |
Net assets consist of: | | | | |
Paid-in capital | | $ | 137,933,593 | |
Accumulated loss | | | (19,604,090 | ) |
| | | | |
Total net assets | | $ | 118,329,503 | |
| | | | |
Net asset value, offering price and redemption proceeds per Institutional class of shares (unlimited shares authorized, no par value) | | $ | 8.32 | |
| | | | |
| |
Total Institutional class of shares outstanding | | | 14,221,589 | |
| | | | |
| |
Investments, at cost: | | | | |
Investments in unaffiliated issuers | | $ | 127,372,379 | |
Cash sweep investments in affiliated issuers | | | 8,789,785 | |
| | | | |
Total investments, at cost | | $ | 136,162,164 | |
| | | | |
| (1) | Including $2,126,944 of securities on loan. |
| (2) | Identified cost of cash denominated in foreign currencies is $73,509. |
(See Notes which are an integral part of the Financial Statements)
6
August 31, 2019
| | |
| | |
| Statement of Operations | | BMO LGM Frontier Markets Equity Fund |
| | | | |
Investment Income: | | | | |
Dividend income from: | | | | |
Unaffiliated issuers | | $ | 4,827,940 | (1) |
Affiliated issuers | | | 97,977 | |
Net securities lending income from (Note 2): | | | | |
Unaffiliated issuers | | | 4,750 | |
Affiliated issuers | | | 1,365 | |
| | | | |
Total income: | | | 4,932,032 | |
| |
Expenses: | | | | |
Investment advisory fees (Note 5) | | | 1,946,435 | |
Shareholder servicing fees (Note 5) | | | 192,481 | |
Administration fees (Note 5) | | | 194,644 | |
Portfolio accounting fees | | | 4,209 | |
Recordkeeping fees | | | 61,925 | |
Custodian fees | | | 467,977 | |
Registration fees | | | 21,709 | |
Professional fees | | | 42,996 | |
Printing and postage | | | 24,143 | |
Trustees’ fees | | | 15,349 | |
Miscellaneous | | | 4,505 | |
| | | | |
Total Expenses: | | | 2,976,373 | |
| |
Deduct: | | | | |
Expense waivers (Note 5) | | | (378,277 | ) |
| | | | |
Net expenses | | | 2,598,096 | |
| | | | |
Net investment income | | | 2,333,936 | |
| |
Realized and unrealized gain (loss) on investments and foreign currency | | | | |
Net realized loss on transactions from: | | | | |
Investments in unaffiliated issuers | | | (3,951,822 | )(2) |
Investments in affiliated issuers | | | (309 | ) |
Foreign currency transactions | | | (224,787 | ) |
| | | | |
Total net realized loss | | | (4,176,918 | ) |
Net change in unrealized appreciation/depreciation on: | | | | |
Investments in unaffiliated issuers | | | (20,755,486 | ) |
Investments in affiliated issuers | | | 325 | |
Foreign currency transactions | | | (3,916 | ) |
| | | | |
Total net change in unrealized appreciation/depreciation | | | (20,759,077 | ) |
| | | | |
Net realized and unrealized loss | | | (24,935,995 | ) |
| | | | |
Change in net assets resulting from operations | | $ | (22,602,059 | ) |
| | | | |
| (1) | Net of foreign taxes withheld of $412,380. |
| (2) | Net of foreign taxes withheld of $114,789, $48,463 of which is related to appreciated investments held at period end. |
(See Notes which are an integral part of the Financial Statements)
7
August 31, 2019
| | |
| | |
| Statements of Changes in Net Assets | | BMO LGM Frontier Markets Equity Fund |
| | | | | | | | |
| | | Year Ended
August 31, 2019 | | | Year Ended
August 31, 2018 | |
Change in net assets resulting from: | | | | | | | | |
| | |
Operations: | | | | | | | | |
Net investment income | | $ | 2,333,936 | | | $ | 1,830,168 | |
Net realized gain (loss) on investments | | | (4,176,918 | ) | | | 1,855,201 | |
Net change in unrealized appreciation/depreciation on investments | | | (20,759,077 | ) | | | (3,971,860 | ) |
| | | | | | | | |
Change in net assets resulting from operations | | | (22,602,059 | ) | | | (286,491 | ) |
| | |
Distributions to shareholders: | | | | | | | | |
Distributable earnings | | | (2,706,754 | ) | | | (470,637 | )(1) |
| | | | | | | | |
Change in net assets resulting from distributions to shareholders | | | (2,706,754 | ) | | | (470,637 | ) |
| | |
Capital stock transactions: | | | | | | | | |
Proceeds from sale of shares | | | 25,000,000 | | | | 15,020,000 | |
Net asset value of shares issued to shareholders in payment of distributions declared | | | 2,641,790 | | | | 448,243 | |
Cost of shares redeemed | | | (2,839,549 | ) | | | (1,158,924 | ) |
Repurchase fees | | | 55,740 | | | | 23,178 | |
| | | | | | | | |
Change in net assets resulting from capital stock transactions | | | 24,857,981 | | | | 14,332,497 | |
| | | | | | | | |
Change in net assets | | | (450,832 | ) | | | 13,575,369 | |
| | |
Net assets: | | | | | | | | |
Beginning of period | | | 118,780,335 | | | | 105,204,966 | |
| | | | | | | | |
End of period | | $ | 118,329,503 | | | $ | 118,780,335 | (2) |
| | | | | | | | |
| | |
Capital stock transactions in shares: | | | | | | | | |
Sale of shares | | | 2,532,928 | | | | 1,386,814 | |
Shares issued to shareholders in payment of distributions declared | | | 283,150 | | | | 42,608 | |
Shares redeemed | | | (297,191 | ) | | | (105,045 | ) |
| | | | | | | | |
Net change resulting from fund share transactions in shares | | | 2,518,887 | | | | 1,324,377 | |
| | | | | | | | |
| (1) | The distribution information for the year ended August 31, 2018 presented above is presented for comparative purposes to the August 31, 2019 financial statements, which conform to the SEC Final Rule on Disclosure Update and Simplification which was effective November 5, 2018. Distributions to shareholders from net investment income for the year ended August 31, 2018, was $470,637. |
| (2) | Undistributed net investment income included in net assets at end of period for the year ended August 31, 2018 was $1,798,346. |
(See Notes which are an integral part of the Financial Statements)
8
| | | | |
| | |
| Financial Highlights (For a share outstanding throughout the period) | | BMO LGM Frontier Markets Equity Fund |
| | | | | | | | | | | | | | | | | | | | | | | | | | | | | | | | | | | | | | | | | | | | | | | | | | | | | | | | | | | | | | | | | | | | | | | | | | | |
Period
Ended
August 31, | | Net asset
value,
beginning
of period | | Net
investment
income | | Net realized
and unrealized
gain (loss) | | Total from
investment
operations | | Distributions to
shareholders
from net
investment
income | | Distributions to
shareholders
from net
realized gain | | Total
distributions | | Repurchase
fees | | Net asset
value, end
of period | | Total
return (1) | | Ratios to Average Net Assets | | Net assets,
end of period
(000 omitted) | | Portfolio
turnover
rate |
| | Gross
Expenses | | Net
Expenses (2) | | Net
investment
income (2) |
| 2019 | | | $ | 10.15 | | | | $ | 0.12 | | | | $ | (1.76 | ) | | | $ | (1.64 | ) | | | $ | (0.19 | ) | | | $ | — | | | | $ | (0.19 | ) | | | $ | 0.00 | (3) | | | $ | 8.32 | | | | | (16.34 | )% | | | | 2.29 | % | | | | 2.00 | % | | | | 1.80 | % | | | $ | 118,330 | | | | | 9 | % |
| 2018 | | | | 10.14 | | | | | 0.16 | | | | | (0.10 | ) | | | | 0.06 | | | | | (0.05 | ) | | | | — | | | | | (0.05 | ) | | | | 0.00 | (3) | | | | 10.15 | | | | | 0.53 | | | | | 2.39 | | | | | 2.00 | | | | | 1.49 | | | | | 118,780 | | | | | 17 | |
| 2017 | | | | 9.21 | | | | | 0.07 | | | | | 0.92 | | | | | 0.99 | | | | | (0.07 | ) | | | | — | | | | | (0.07 | ) | | | | 0.01 | | | | | 10.14 | | | | | 10.97 | | | | | 2.56 | | | | | 2.00 | | | | | 0.92 | | | | | 105,205 | | | | | 23 | |
| 2016 | | | | 8.44 | | | | | 0.09 | | | | | 0.79 | | | | | 0.88 | | | | | (0.13 | ) | | | | — | | | | | (0.13 | ) | | | | 0.02 | | | | | 9.21 | | | | | 10.89 | | | | | 2.82 | | | | | 2.00 | | | | | 1.74 | | | | | 72,127 | | | | | 24 | |
| 2015 | | | | 10.46 | | | | | 0.18 | | | | | (2.03 | ) | | | | (1.85 | ) | | | | (0.16 | ) | | | | (0.06 | ) | | | | (0.22 | ) | | | | 0.05 | | | | | 8.44 | | | | | (17.34 | ) | | | | 2.88 | | | | | 2.00 | | | | | 1.94 | | | | | 33,502 | | | | | 31 | |
| (1) | Based on net asset value as of end of period date. |
| (2) | The contractual and voluntary expense waivers pursuant to Note 5 of the financial statements are reflected in both the net expense and net investment income ratios. |
| (3) | Repurchase fees consisted of per share amounts less than $0.01. |
(See Notes which are an integral part of the Financial Statements)
9
August 31, 2019
| | |
| | |
| Notes to Financial Statements | | |
BMO LGM Frontier Markets Equity Fund (the “Fund”) was established as a Delaware statutory trust on July 3, 2013 with an inception date of December 18, 2013. The Fund is registered with the Securities and Exchange Commission (the “SEC”) as anon-diversified,closed-end management investment company that operates as an “Interval Fund” under the Investment Company Act of 1940, as amended (the “1940 Act”). An Interval Fund continuously offers its shares to the public, but only offers to repurchase its shares at predetermined intervals. The Fund has set quarterly repurchase intervals.
The Fund’s investment objective is to provide capital appreciation. The Fund invests at least 80% of its assets in equity securities of foreign companies located in frontier markets or whose primary business activities or principal trading markets are in frontier markets. Frontier markets are considered to be those markets in any country that is included in the Morgan Stanley Capital International (“MSCI”) Frontier Markets Index, certain countries in the MSCI Emerging Markets Index, and certain other countries that are not included in those indices, as described in the Fund’s Prospectus.
| 2. | | Significant Accounting Policies |
The Fund is an investment company and follows the accounting and reporting guidance under Financial Accounting Standards Board (“FASB”) Accounting Standards Codification (“ASC”) Topic 946,Financial Services—Investment Companies. The following is a summary of significant accounting policies consistently followed by the Fund in the preparation of its financial statements.
Use of Estimates—The preparation of financial statements in conformity with accounting principles generally accepted in the United States of America (“GAAP”) requires management to make estimates and assumptions that affect the reported amounts of assets and liabilities at the date of the financial statements and the reported amounts of increases and decreases in net assets from operations during the reporting period. Actual results may differ from those estimates.
Investment Valuations—Listed equity securities are valued each trading day at the last sale price or official closing price reported on a national securities exchange, including NASDAQ. Securities listed on a foreign exchange are valued each trading day at the last closing price on the principal exchange on which they are traded immediately prior to the time for determination of Net Asset Value (“NAV”) or at fair value as discussed below. Equity securities without a reported trade, U.S. government securities, listed corporate bonds, other fixed income and asset-backed securities with maturities of 60 days or more, unlisted securities, and private placement securities are generally valued at the mean of the latest bid and asked price as furnished by an independent pricing service. Fixed income securities that are not exchange traded are valued by an independent pricing service, taking into consideration yield, liquidity, risk, credit quality, coupon, maturity, type of issue, and any other factors or market data the pricing service deems relevant. Fixed income securities with remaining maturities of 60 days or less at the time of purchase and of sufficient credit quality, are valued at amortized cost, which approximates fair value. Investments inopen-end registered investment companies are valued at net asset value.
Securities or other assets for which market valuations are not readily available, or are deemed to be inaccurate, are valued at fair value as determined in good faith using methods approved by the Board of Trustees (the “Trustees”). The Trustees have established a Pricing Committee, which is responsible for determinations of fair value, subject to the supervision of the Trustees. In determining fair value, the Pricing Committee takes into account all information available and any factors it deems appropriate. Consequently, the price of securities used by the Fund to calculate its NAV may differ from quoted or published prices for the same securities. Fair value pricing involves subjective judgments and it is possible that the fair value determined for a security is materially different than the value that would be realized upon the sale of that security and the differences may be material to the NAV of the Fund or the financial statements presented.
Securities held in the Fund may be listed on foreign exchanges that do not value their listed securities at the same time the Fund calculates its NAV. Most foreign markets close well before the Fund values its securities, generally 3:00 p.m. (Central Time). The earlier close of these foreign markets gives rise to the possibility that significant events, including broad market moves, may have occurred in the interim.
The Pricing Committee may determine that a security needs to be fair valued if, among other things, it believes the value of the security might have been materially affected by events occurring after the close of the market in which the security was principally traded, but before the time for determination of the NAV (“a subsequent event”). A subsequent event might include a company-specific development (for example, announcement of a merger that is made after the close of the foreign market), a development that might affect an entire market or region (for example, weather related events) or a potentially global development (such as a terrorist attack that may be expected to have an effect on investor expectations worldwide). The Fund has retained an independent fair value pricing service to assist in fair valuing foreign securities. The service utilizes statistical data based on historical performance of securities, markets, and other data in developing factors used to estimate a fair value.
Investment Income, Expenses, and Distributions—Interest income and expenses are accrued daily. The Fund distributes net investment income, if any, and net realized gains (net of any capital loss carryovers) annually. Dividend income, realized gain distributions from underlying funds, and distributions to shareholders are recorded on theex-dividend date except in the case of certain foreign securities, in which dividends are recorded as soon after theex-dividend date as the Fund’s information agents become aware of such dividends.Non-cash dividends included in dividend income, if any, are recorded at fair market value.Paid-in-kind interest included in interest income, if any, is accrued daily.
Foreign Currency Translation—The accounting records of the Fund are maintained in U.S. dollars. All assets and liabilities denominated in foreign currencies are translated into U.S. dollars based on the rate of exchange of such currencies against
10
| | |
| | |
| | | BMO LGM Frontier Markets Equity Fund |
U.S. dollars on the date of valuation. Purchases and sales of securities, income, and expenses are translated at the rate of exchange quoted on the respective date that such transactions are recorded. The effect of changes in foreign exchange rates on realized and unrealized gains or losses on securities is reflected as a component of such gains or losses.
Reported net realized foreign exchange gains or losses arise from sales of foreign currencies, currency gains or losses realized between the trade and settlement dates on securities transactions, and the difference between the amounts of dividends, interest, and foreign withholding taxes recorded on the Fund’s books and the U.S. dollar equivalent of the amounts actually received or paid. Net unrealized foreign exchange gains and losses arise from changes in the value of assets and liabilities other than investments in securities at each reporting period, resulting from changes in the exchange rate.
Foreign Exchange Contracts—The Fund may enter into foreign currency exchange contracts as a way of managing foreign exchange rate risk. The Fund may enter into these contracts for the purchase or sale of a specific foreign currency at a fixed price on a future date as a hedge or cross hedge against either specific transactions or portfolio positions. The objective of foreign currency hedging transactions is to reduce the risk that the U.S. dollar value of the Fund’s foreign currency denominated securities will decline in value due to changes in foreign currency exchange rates. All foreign currency exchange contracts aremarked-to-market daily at the applicable translation rates resulting in unrealized gains or losses. Realized gains or losses are recorded at the time the foreign currency exchange contract is offset by entering into a closing transaction or by the delivery or receipt of the currency. Risk may arise upon entering into these contracts from the potential inability of counterparties to meet the terms of their contracts and from unanticipated movements in the value of a foreign currency relative to the U.S. dollar.
Restricted Securities—Restricted securities are securities that may be resold only upon registration under federal securities laws or in transactions exempt from such registration. In some cases, the issuer of restricted securities has agreed to register such securities for resale at the issuer’s expense either upon demand by the Fund or in connection with another registered offering of the securities. Many restricted securities may be resold in the secondary market in transactions exempt from registration. Such restricted securities may be determined to be liquid under criteria established by the Trustees. The restricted securities are valued at the price provided by dealers in the secondary market or, if no market prices are available, the fair value as determined in good faith using methods approved by the Trustees.
Securities Lending—The Fund participates in a securities lending program, providing for the lending of equity securities to qualified brokers, in exchange for the opportunity to earn additional income for participating. State Street Bank & Trust Company serves as the securities lending agent. The Fund receives cash as collateral in return for the securities and records a corresponding payable for collateral due to the respective broker. The amount of cash collateral received is maintained at a minimum level of 100% of the prior day’s fair value on securities and accrued interest loaned. Collateral was reinvested in the State Street Navigator Securities Lending Government Money Market Portfolio through December 16, 2018, and in the BMO Institutional Prime Money Market Fund thereafter. The valuation of collateral is discussed in “Investment Valuations” in Note 2 of the Notes to Financial Statements. When the Fund lends its portfolio securities, it is subject to the risk that it may not be able to get the portfolio securities back from the borrower on a timely basis, in which case the Fund may lose certain investment opportunities. The Fund also is subject to the risks associated with the investments of cash collateral received from the borrower. Cash collateral received as part of the Fund’s securities lending program invested in the BMO Institutional Prime Money Market Fund as of August 31, 2019 was $2,145,290. The value of securities loaned at August 31, 2019 was $2,126,944.
Federal Income Taxes—The policies and procedures of the Fund require compliance with Subchapter M of the Internal Revenue Code of 1986, as amended (the “Code”), and distribution to shareholders each year of substantially all of its income. Accordingly, no provision for federal tax is necessary. Withholding taxes on foreign dividends and unrealized appreciation on investments have been provided for in accordance with the applicable country’s tax rules and rates.
Commitments and Contingencies—In the normal course of business, the Fund enters into contracts that provide general indemnifications to other parties. The Fund’s maximum exposure under these arrangements is unknown as this would involve future claims that may be made against the Fund that have not yet occurred. However, the Fund has not had prior claims or losses pursuant to these contracts and expects the risk of loss to be remote.
Other—Investment transactions are accounted for on a trade date basis. Net realized gains and losses on securities are computed on the basis of specific security lot identification.
| 3. | | Fair Value Measurement |
Fair Valuation Measurement defines fair value, establishes a framework for measuring fair value in accordance with GAAP, and requires disclosure about fair value measurements. It establishes a fair value hierarchy that distinguishes between (1) market participant assumptions developed based on market data obtained from sources independent of the reporting issuer (observable inputs), and (2) the reporting issuer’s own assumptions about market participant assumptions developed based on the best information available in the circumstances (unobservable inputs). It also provides guidance on determining when there has been a significant decrease in the volume and level of activity for an asset or liability, when a transaction is not orderly and how that information must be incorporated into fair value measurement.
In August 2018, the FASB issued Accounting Standards Update2018-13,Fair Value Measurement (Topic 820)—Disclosures Framework—Changes to Disclosure Requirements of Fair Value Measurement(“ASU2018-13”) which introduces new fair value disclosure requirements as well as eliminates and modifies certain existing fair value disclosure requirements.ASU 2018-13 would be effective for fiscal years beginning after December 15, 2019 and for interim periods within those
11
| | |
| | |
| Notes to Financial Statements (continued) | | |
fiscal years; however, management has elected to early adopt ASU2018-13 effective with the current reporting period as permitted by the standard. The impact of the Fund’s adoption was limited to changes in the Fund’s financial statement disclosures regarding fair value, primarily those disclosures related to transfers between levels of the fair value hierarchy and disclosure of the range and weighted average used to develop significant unobservable inputs for Level 3 fair value measurements, when applicable.
Various inputs are used in determining the value of the Fund’s investments. The inputs or methodology used for valuing securities are not necessarily an indication of the risk associated with investing in those securities. These inputs are summarized in the three broad levels listed below:
Level 1—quoted prices in active markets for identical securities. An active market for the security is a market in which transactions occur with sufficient frequency and volume to provide pricing information on an ongoing basis. Common and preferred stocks, options and futures contracts, and U.S. registered mutual funds are generally categorized as Level 1.
Level 2—other significant observable inputs (including quoted prices for similar securities, interest rates, prepayment speeds, credit risk, etc.). Fixed income securities, repurchase agreements, and securities valued by an independent fair value pricing service are generally categorized as Level 2.
Level 3—significant unobservable inputs, including management’s own assumptions in determining the fair value of investments.
For the year ended August 31, 2019, the Fund had no investments in private investment funds, and there were no investments excluded from the fair value hierarchy. The Fund did not hold any Level 3 securities as of August 31, 2019.
The following is a summary of the inputs used, as of August 31, 2019, in valuing the Fund’s assets:
| | | | | | | | | | | | | | | | |
| | | Level 1 | | | Level 2 | | | Level 3 | | | Total | |
Common Stocks | | | | | | | | | | | | | | | | |
Argentina | | $ | 3,231,859 | | | $ | — | | | $ | — | | | $ | 3,231,859 | |
Botswana | | | 1,057,576 | | | | — | | | | — | | | | 1,057,576 | |
Colombia | | | — | | | | 1,565,151 | | | | — | | | | 1,565,151 | |
Costa Rica | | | 3,305,615 | | | | — | | | | — | | | | 3,305,615 | |
Croatia | | | — | (1) | | | — | | | | — | | | | — | (1) |
Egypt | | | 16,381,710 | | | | — | | | | — | | | | 16,381,710 | |
Georgia | | | 5,292,286 | | | | — | | | | — | | | | 5,292,286 | |
Ghana | | | 356,875 | | | | 278,926 | | | | — | | | | 635,801 | |
Kenya | | | 4,849,305 | | | | — | | | | — | | | | 4,849,305 | |
Kuwait | | | 1,172,253 | | | | — | | | | — | | | | 1,172,253 | |
Mauritius | | | 2,964,330 | | | | — | | | | — | | | | 2,964,330 | |
Nigeria | | | 6,155,368 | | | | — | | | | — | | | | 6,155,368 | |
Pakistan | | | 5,925,449 | | | | — | | | | — | | | | 5,925,449 | |
Peru | | | 9,957,254 | | | | — | | | | — | | | | 9,957,254 | |
Puerto Rico | | | 6,302,688 | | | | — | | | | — | | | | 6,302,688 | |
Senegal | | | 5,929,548 | | | | — | | | | — | | | | 5,929,548 | |
South Africa | | | 4,022,498 | | | | — | | | | — | | | | 4,022,498 | |
Sri Lanka | | | 2,800,629 | | | | — | | | | — | | | | 2,800,629 | |
Tanzania (United Republic Of) | | | — | | | | 4,119,158 | | | | — | | | | 4,119,158 | |
Tunisia | | | 566,014 | | | | — | | | | — | | | | 566,014 | |
Turkey | | | 4,343,238 | | | | — | | | | — | | | | 4,343,238 | |
United Arab Emirates | | | 3,688,913 | | | | — | | | | — | | | | 3,688,913 | |
United Kingdom | | | 1,482,541 | | | | — | | | | — | | | | 1,482,541 | |
United States | | | 3,046,639 | | | | — | | | | — | | | | 3,046,639 | |
Vietnam | | | 5,512,150 | | | | — | | | | — | | | | 5,512,150 | |
Zimbabwe | | | — | | | | 569,397 | | | | — | | | | 569,397 | |
Participation Notes | | | — | | | | 6,974,465 | | | | — | | | | 6,974,465 | |
Short-Term Investments | | | 8,790,196 | | | | — | | | | — | | | | 8,790,196 | |
| | | | | | | | | | | | | | | | |
Total | | $ | 107,134,934 | | | $ | 13,507,097 | | | $ | — | | | $ | 120,642,031 | |
| | | | | | | | | | | | | | | | |
| | (1) | Includes security which is valued at $0. |
It is the Fund’s policy to recognize transfers between category levels at the end of the year. As described in Note 2, the Fund has retained an independent pricing service to fair value foreign equity securities for events occurring after the close of the market in which the security is principally traded. Transfers between investment levels may occur as the markets fluctuate and/or the availability of data used in an investment’s valuation changes.
The shares of beneficial interest of the Fund (the “Shares”) were continuously offered under Rule 415 under the Securities Act of 1933, as amended. The Fund had been closed to new investors and wasre-opened to new investors on July 10, 2019. As of August 31, 2019, the Fund had registered a total of 13,200,000 shares with no par value. Investors may purchase shares each business day without any sales charge at a price equal to the NAV per share next determined after receipt of an order to purchase.
12
| | |
| | |
| | | BMO LGM Frontier Markets Equity Fund |
The Shares are not redeemable each business day, are not listed for trading on an exchange, and no secondary market currently exists for Fund shares.
Repurchase Offer Policy—The Fund has a policy of making quarterly repurchase offers of between 5% and 25% of the Fund’s outstanding Shares (“Repurchase Offers”) pursuant to Rule23c-3 of the 1940 Act. If shareholders tender more than the repurchase offer amount for any given Repurchase Offer, the Fund may repurchase up to an additional 2% of the outstanding Shares. If Fund shareholders tender more Shares than the amount of the repurchase offer, the Fund will repurchase the Shares on a pro rata basis, subject to limited exceptions. These periodic Repurchase Offers will be made in intervals of three calendar months with the repurchase pricing date occurring on the last business day of March, June, September and December. The maximum number of days between the repurchase request deadline and the repurchase pricing date shall be no more than 14 days (provided that if the 14th day of such period is not a business day, the repurchase pricing date shall occur on the next business day). A repurchase fee equal to 2% of the value of the Shares repurchased will be applied to offset repurchase expenses.
During the year ended August 31, 2019, the Fund had Repurchase Offers as follows:
| | | | | | | | | | | | |
Repurchase Date | | Repurchase
Offer
Amount | | | % of
Shares
Tendered | | | Number
of Shares
Tendered | |
| September 28, 2018 | | | 5 | % | | | 1.2 | % | | | 152,624 | |
| December 31, 2018 | | | 5 | | | | 0.9 | | | | 117,360 | |
| March 29, 2019 | | | 5 | | | | 0.1 | | | | 9,587 | |
| June 28, 2019 | | | 5 | | | | 0.1 | | | | 17,621 | |
| 5. | | Investment Adviser Fee and Other Transactions with Affiliates |
General—Certain of the Officers and Trustees of the Fund are also Officers and Directors of one or more portfolios within the Fund complex, which are affiliates of the Fund. None of the Fund Officers or interested Trustees receives any compensation from the Fund. Certain Officers and Trustees of the Fund are also Officers of the Adviser.
Investment Adviser Fee—The Fund has entered into an Investment Advisory Agreement with the Adviser, pursuant to which the Adviser will provide general investment advisory services for the Fund. As compensation for its advisory services under the investment advisory agreement with the Fund, the Fund pays the Adviser, on a monthly basis, an annual management fee equal to 1.50% of the average daily net assets of the Fund. The Fund’ssub-adviser is LGM Investments Limited, an affiliate of the Adviser. It is the Adviser’s responsibility to supervise thesub-adviser and review thesub-adviser’s performance, subject to the oversight of the Trustees. The Adviser compensates thesub-adviser based on the level of average daily net assets of the Fund.
The Adviser has agreed to waive or reduce its investment advisory fee or reimburse expenses to the extent necessary to prevent total annual operating expenses (excluding taxes, interest, brokerage commissions, other investment related costs, Acquired Fund Fees and Expenses and extraordinary expenses, such as litigation and other expenses not incurred in the ordinary course of the Fund’s business) from exceeding 2.00% of the average daily net assets of the Fund. The Adviser may not terminate this arrangement prior to December 31, 2020 unless the investment advisory agreement is terminated. In addition, the Adviser may voluntarily waive any portion of its management fee for the Fund. Any such voluntary waiver by the Adviser may be terminated at any time in the Adviser’s sole discretion. Additionally, the agreement does not provide for recoupment by the Adviser of waived fees or reimbursed expenses.
Shareholder Servicing Fee—Under the terms of a Shareholder Services Agreement with the Adviser that terminated on March 29, 2019, the Fund paid the Adviser at the annual rate of 0.25% of average daily net assets for the period. The fee paid to the Adviser was used to finance certain services for shareholders and to maintain shareholder accounts. The Agreement was terminated upon conversion of the Investor class of shares to Institutional class of shares.
Administration Fee—The fee paid by the Fund to the Adviser, as Administrator, is 0.15% of the Fund’s average daily net assets.
Investments in Affiliated Issuers—An affiliated issuer is an entity in which the Fund has ownership of at least 5% of the voting securities or any investment in a BMO Fund. Issuers that are affiliates of the Fund atperiod-end are noted in the Fund’s Schedule of Investments. Additional security purchases and the reduction of certain securities shares outstanding of existing portfolio holdings that were not considered affiliated in prior periods may result in the Fund owning in excess of 5% of the outstanding shares atperiod-end. The table below reflects transactions during the period with entities that are affiliates as of August 31, 2019 and may include acquisitions of new investments, prior period holdings that became affiliated during the period and prior period affiliated holdings that are no longer affiliated as ofperiod-end.
| | | | | | | | | | | | | | | | | | | | | | | | | | | | | | | | |
Security/Fund Description | | Value,
Beginning of
Period | | | Purchases | | | Sales
Proceeds | | | Change in
Unrealized
Appreciation | | | Net
Realized
Loss | | | Value, End of
Period | | | Dividends
Credited
to
Income | | | Net Realized
Gain on
Capital Gain
Distributions | |
Cash Sweep Investment in BMO Institutional Prime Money Market Fund, Premier Class, 2.097% | |
| | $ | 303,076 | | | $ | 40,580,763 | | | $ | 34,238,949 | | | $ | 325 | | | $ | (309 | ) | | $ | 6,644,906 | | | $ | 97,977 | | | $ | — | |
Collateral Investment for Securities on Loan in BMO Institutional Prime Money Market Fund, Premier Class 2.097% | | | | | |
| | $ | — | | | $ | 27,842,658 | | | $ | 25,697,368 | | | $ | — | | | $ | — | | | $ | 2,145,290 | | | $ | 1,365 | | | $ | — | |
Concentration of Shareholder—As of August 31, 2019, one shareholder held 43% of the outstanding shares of the Fund.
13
| | |
| | |
| Notes to Financial Statements (continued) | | |
The Fund participated in a $25 million unsecured, committed revolving line of credit (“LOC”) agreement with State Street Bank. The LOC was made available for extraordinary or emergency purposes, primarily for financing redemption payments. Borrowings currently are charged interest at a rate of the London Interbank Offering Rate (“LIBOR”) plus 1.25% and a commitment fee of 0.20% per annum on the daily unused portion with no administrative fee. No borrowings were outstanding under the LOC at August 31, 2019. For the year ended August 31, 2019, the average daily loan balance outstanding was $3,099 and the weighted average interest rate was 3.76%.
| 7. | | Investment Transactions |
Purchases and sales of investments, excluding short-term U.S. government securities and short-term obligations, for the year ended August 31, 2019, were $29,778,987 and $10,356,294, respectively.
| 8. | | Federal Tax Information |
The timing and character of income and capital gain distributions are determined in accordance with income tax regulations, which may differ from GAAP. These differences are due in part to differing treatments for net operating loss, foreign currency transactions, paydown gain or loss, market discount accretion, premium amortization and expiring capital loss carryforwards.
To the extent that differences arise that are permanent in nature, such amounts are reclassified within the capital accounts on the Statements of Assets and Liabilities based on their Federal tax basis treatment; temporary differences do not require reclassification and had no impact on the NAV of the Fund.
The Fund complied with FASB interpretationAccounting for Uncertainty in Income Taxes which provides guidance for how uncertain tax provisions should be recognized, measured, presented and disclosed in the financial statements.Accounting for Uncertainty in Income Taxes requires the affirmative evaluation of tax positions taken or expected to be taken in the course of preparing the Fund’s tax returns to determine whether it is“more-likely-than-not,” (i.e., greater than 50 percent) of being sustained by the applicable tax authority. Tax positions not deemed to meet themore-likely-than-not threshold may result in a tax benefit or expense in the current year.
Accounting for Uncertainty in Income Taxes requires management of the Fund to analyze all open tax years, as defined by the statutes of limitations, for all major jurisdictions, which includes federal and certain states. Open tax years are those that are open for exam by the taxing authorities (i.e., the last four tax years and the interim tax period since then). The Fund has no examinations in progress. For all open tax years and all major taxing jurisdictions through the end of the reporting period, management of the Fund reviewed all tax positions taken or expected to be taken in the preparation of the Fund’s tax returns and concluded thatAccounting for Uncertainty in Income Taxes resulted in no effect on the Fund’s reported net assets or results of operations as of and during the year ended August 31, 2019. Management of the Fund also is not aware of any tax positions for which it is reasonably possible that the total amounts of recognized tax benefits will significantly change in the next twelve months.
The difference between book basis and tax basis unrealized appreciation/depreciation is attributable in part to the tax deferral of losses on wash sales, the realization for tax purposes of unrealized gains on investments in passive foreign investment companies, unrealized foreign capital gains tax and foreign currency.
| | | | | | | | | | | | | | |
Cost of
Investments
for Federal
Tax Purposes | | | Gross
Unrealized
Appreciation
for Federal
Tax Purposes | | | Gross
Unrealized
Depreciation
for Federal
Tax Purposes | | | Net
Unrealized
Depreciation
for Federal
Tax Purposes | |
| $ | 137,123,277 | | | $ | 14,367,130 | | | $ | (30,848,376 | ) | | $ | (16,481,246 | ) |
The tax character of distributions reported on the Statements of Changes in Net Assets for the years ended August 31, 2019 and August 31, 2018, were as follows:
| | | | | | | | | | | | | | | | | | | | | | |
| 2019 | | | 2018 | |
Ordinary
Income (1) | | | Tax-Exempt
Income | | | Long-Term
Capital Gains | | | Ordinary
Income (1) | | | Tax-Exempt
Income | | | Long-Term
Capital Gains | |
| $ | 2,706,754 | | | $ | — | | | $ | — | | | $ | 470,637 | | | $ | — | | | $ | — | |
| | (1) | For tax purposes, short-term capital gain distributions are considered ordinary income. |
As of August 31, 2019, the components of distributable earnings on a tax basis are as follows:
| | | | | | | | | | | | | | | | | | | | | | |
Undistributed
Ordinary
Income | | | Undistributed
Tax-Exempt
Income | | | Undistributed
Long-Term
Capital Gains | | | Accumulated
Capital and
Other Losses | | | Other
Adjustments | | | Unrealized
Depreciation | |
| $ | 1,851,539 | | | $ | — | | | $ | — | | | $ | (4,974,694 | ) | | $ | — | | | $ | (16,480,935 | ) |
As of August 31, 2019, the Fund had anon-expiring, short-term capital loss carry forward of $472,873 and long-term capital loss carry forward of $4,501,821.
14
| | |
| | |
| | | BMO LGM Frontier Markets Equity Fund |
On September 30, 2019, the Fund completed its next quarterly repurchase event. Shares totaling 331,868, or 2.33% of the Fund, were repurchased at a value of $2,723,532.
| 10. | | Shareholder Tax Information (unaudited) |
Of the ordinary income (including short-term capital gain) distributions made by the Fund during the year ended August 31, 2019, the percentage which qualifies for the dividend received deduction, available to corporate shareholders, is 0.72%, and the percentage which is designated as qualified dividend income is 69.03%.
Pursuant to Section 853 of the Internal Revenue Code of 1986, the Fund designates $5,205,861 of income derived from foreign sources and $325,569 of foreign taxes paid, or the amounts determined to be necessary, for the year ended August 31, 2019.
Of the ordinary income (including short-term capital gain) distributions made during the year ended August 31, 2019, the proportionate share of income derived from foreign sources is $0.37 per share, and foreign taxes paid are $0.02 per share.
| 11. | | Recently Issued Accounting Pronouncements |
During August 2018, the Securities and Exchange Commission (the “SEC”) issued Final Rule Release No. 33-10532,Disclosure Update and Simplification (“Final Rule Release No. 33-10532”). Final Rule Release No. 33-10532 amends certain financial statement disclosure requirements to conform to U.S. GAAP. The amendments to Rule 6-04.17 of Regulation S-X (balance sheet) remove the requirement to separately state the book basis components of net assets: undistributed (over-distribution of) net investment income (“UNII”), accumulated undistributed net realized gains (losses), and net unrealized appreciation (depreciation) at the balance sheet date. Instead, consistent with U.S. GAAP, funds will be required to disclose total distributable earnings. The amendments to Rule 6-09 of Regulation S-X (statement of changes in net assets) remove the requirement to separately state the sources of distributions paid. Instead, consistent with U.S. GAAP, funds will be required to disclose the total amount of distributions paid, except that any tax return of capital must be separately disclosed. The amendments also remove the requirement to parenthetically state the book basis amount of UNII on the statement of changes in net assets.
The requirements of Final Rule Release No. 33-10532 were effective November 5, 2018, and the Fund’s Statement of Assets and Liabilities and Statement of Changes in Net Assets for the current reporting period have been modified accordingly. In addition, certain amounts within each Fund’s Statement of Changes in Net Assets for the prior fiscal period have been modified to conform to Final Rule Release No. 33-10532.
The Fund’s distributions from the prior fiscal period are disclosed in the Statement of Changes in Net Assets.
15
| | |
| | |
| Report of Independent Registered Public Accounting Firm | | |
To the Shareholders and Board of Trustees of BMO LGM Frontier Markets Equity Fund:
Opinion on the Financial Statements
We have audited the accompanying statement of assets and liabilities of BMO LGM Frontier Markets Equity Fund (the Fund), including the schedule of investments, as of August 31, 2019, the related statement of operations for the year then ended, the statements of changes in net assets for each of the years in the two-year period then ended, and the related notes (collectively, the financial statements) and the financial highlights for each of the years in the five-year period then ended. In our opinion, the financial statements and financial highlights present fairly, in all material respects, the financial position of the Fund as of August 31, 2019, the results of its operations for the year then ended, the changes in its net assets for each of the years in the two-year period then ended, and the financial highlights for each of the years in the five-year period then ended, in conformity with U.S. generally accepted accounting principles.
Basis for Opinion
These financial statements and financial highlights are the responsibility of the Fund’s management. Our responsibility is to express an opinion on these financial statements and financial highlights based on our audit. We are a public accounting firm registered with the Public Company Accounting Oversight Board (United States) (PCAOB) and are required to be independent with respect to the Fund in accordance with the U.S. federal securities laws and the applicable rules and regulations of the Securities and Exchange Commission and the PCAOB.
We conducted our audit in accordance with the standards of the PCAOB. Those standards require that we plan and perform the audit to obtain reasonable assurance about whether the financial statements and financial highlights are free of material misstatement, whether due to error or fraud. Our audit included performing procedures to assess the risks of material misstatement of the financial statements and financial highlights, whether due to error or fraud, and performing procedures that respond to those risks. Such procedures included examining, on a test basis, evidence regarding the amounts and disclosures in the financial statements and financial highlights. Such procedures also included confirmation of securities owned as of August 31, 2019 by correspondence with custodians and brokers or by other appropriate auditing procedures. Our audit also included evaluating the accounting principles used and significant estimates made by management, as well as evaluating the overall presentation of the financial statements and financial highlights. We believe that our audit provides a reasonable basis for our opinion.
/s/ KPMG LLP
We have served as the auditor of one or more BMO Funds, Inc. investment companies since 2011.
Columbus, Ohio
October 28, 2019
16
| | |
| | |
| | | Trustees and Officers of the Fund(Unaudited) |
The following tables provide information about each Trustee and Officer of the Fund as of August 31, 2019. The address of each Trustee is 111 East Kilbourn Avenue, Suite 200, Milwaukee, Wisconsin 53202. There are currently 33 separate portfolios or funds in the BMO Funds complex, of which 32 are registered as BMO Funds, Inc. and one is registered as BMO LGM Frontier Markets Equity Fund with the Securities and Exchange Commission. The Statement of Additional Information includes additional information about the trustees and is available, without charge and upon request, by calling1-800-236-FUND (3863).
| | | | | | | | | | |
| INDEPENDENT TRUSTEES |
| Name and Age | | Position(s) Held
with the Trust | | Term of
Office and
Length of
Time Served* | | Principal Occupation(s)
During Past 5 Years | | Number of
Portfolios in
Fund
Complex
Overseen by
Trustee | | Other
Directorships
Held by
Trustee |
| | | | | |
Ridge A. Braunschweig Age: 66 | | Independent Trustee | | Since
August 2013 | | President and Chief Executive Officer, CPL Industries, Inc. (a manufacturing holding company prior to May 2009 and a family office since May 2009), since January 2012. | | 33 | | None |
| | | | | |
Benjamin M. Cutler Age: 74 | | Independent Trustee | | Since
August 2013 | | Chairman, USHEALTH Group, Inc. (a health insurance company), since 2004; CEO and President, USHEALTH Group, Inc., from 2004 to 2016; Director, Freedom from Hunger (anon-profit organization), since 2016. | | 33 | | None |
| | | | | |
John A. Lubs Age: 71 | | Independent Trustee | | Since
August 2013 | | Retired; formerly, Vice Chairman, Mason Companies, Inc. (a footwear distributor), from 2004 to 2010 and Chief Operating Officer, from 2003 to 2010. | | 33 | | None |
| | | | | |
Vincent P. Lyles Age: 58 | | Independent Trustee | | Since
August 2013 | | Vice President of Community Relations, Advocate Aurora Health Care, since 2019; President and Chief Executive Officer, Boys & Girls Clubs of Greater Milwaukee, from 2012 to 2018. | | 33 | | None |
| | | | | |
James Mitchell Age: 72 | | Independent Trustee | | Since
August 2013 | | Chairman, Ayrshire Precision Engineering (a precision machining company), since 1992; Chief Executive Officer, NOG, Inc. (a metal processing and consulting company), from 1999 to 2015. | | 33 | | None |
| | | | | |
Barbara J. Pope Age: 71 | | Independent Trustee | | Since
August 2013 | | Retired; formerly, President of Barbara J. Pope, P.C. (a financial consulting firm), 1992-2015; President of Sedgwick Street Fund LLC (a private investment partnership), 1996-2015; Tax Partner, Price Waterhouse. | | 33 | | None |
| * | Each Trustee serves an indefinite term until he or she retires or otherwise resigns, is removed, dies or until his or her successor is duly elected. Retirement for a Trustee occurs no later than August 31 following his or her 75th birthday. |
17
| | |
| |
| Trustees and Officers of the Fund(Unaudited) (continued) |
| | | | | | | | | | |
| INTERESTED TRUSTEES |
| Name and Age | | Position(s) Held
with the Trust | | Term of
Office and
Length of
Time Served* | | Principal Occupation(s)
During Past 5 Years | | Number of
Portfolios in
Fund
Complex
Overseen by
Trustee | | Other
Directorships
Held by
Trustee |
| | | | | |
John M. Blaser** Age: 62 | | Trustee and President | | Since
August 2013 | | Managing Director of the Adviser, since June 2012. | | 33 | | None |
| | | | | |
Daniela O’Leary-Gill** Age: 54 | | Trustee | | Since
August 2018 | | Chief Operating Officer of BMO Financial Group, since February 1, 2018; Director of the Adviser, since June 1, 2018; Head, Communications, Government & Investor Relations 2016-2018; Head, AML Program Oversight 2014-2016; SVP, Personal Banking & Chief CRA Officer 2011-2014. | | 33 | | None |
| * | Each Trustee serves an indefinite term until he or she retires or otherwise resigns, is removed, dies or until his or her successor is duly elected. Retirement for a Trustee occurs no later than August 31 following his or her 75th birthday. |
| ** | Mr. Blaser is an “interested person” of the Fund (as defined in the 1940 Act) due to the positions that he holds with the Fund, and the Adviser. Ms. O’Leary-Gill is an “interested person” of the Fund due to the positions that she holds with the Adviser and BMO. |
| | | | | | |
| PRINCIPAL OFFICERS |
| Name and Age | | Position(s) Held with
the Fund | | Term of Office and
Length of Time Served | | Principal Occupation(s)
During Past Years |
| | | |
Brett Black Age: 47 | | Chief Compliance Officer and Anti Money Laundering Compliance Officer | | Elected by the Board annually; since November 2017 | | Vice President and Chief Compliance Officer of BMO Harris Bank, since 2017; Assistant Vice President, Deputy Chief Compliance Officer, since 2014; Senior Compliance Officer of BMO Harris Bank, since 2012. |
| | | |
Timothy M. Bonin Age: 46 | | Vice President, Chief Financial Officer and Treasurer | | Elected by the Board annually; since August 2013 | | Vice President of the Adviser, since February 2006. |
| | | |
Michael J. Murphy Age: 40 | | Secretary | | Elected by the Board annually; since May 2016 | | Senior Counsel and Vice President of BMO Harris Bank N.A., since 2014; Associate, Vedder Price P.C., 2010 to 2014. |
18
| | |
| |
Shareholder Report Disclosure of Trustees’ Approval of
Advisory and Subadvisory Contracts (Unaudited) |
Approval of Continuation of Advisory and Subadvisory Agreements
During the reporting period, the Board of Trustees (the “Board”) of BMO LGM Frontier Markets Equity Fund (the “Fund”), including the Trustees who are not “interested persons” of the Fund as defined in the Investment Company Act of 1940, as amended (the “Independent Trustees”), approved the continuation of the following agreements, each for an additional year ending August 31, 2020: (1) the investment advisory agreement (the “Advisory Agreement”) between the Fund and BMO Asset Management Corp. (the “Adviser”); and (2) the investment subadvisory agreement (the “Subadvisory Agreement”) with LGM Investments Limited (the “Subadviser”), an affiliate of the Adviser, on behalf of the Fund.
At Board meetings held on July 10, 2019 (“July Meeting”) and August6-7, 2019 (“August Meeting”), the Board met with management of the Adviser regarding the annual approval of the continuation of the Fund’s Advisory and Subadvisory Agreements. In connection with its consideration of the Advisory and Subadvisory Agreements, the Board considered the information furnished and discussed throughout the year at regularly scheduled Board and Committee meetings, as applicable, and the information provided specifically in relation to the annual consideration of the approval of the Advisory and Subadvisory Agreements in response to requests of the Independent Trustees and their independent legal counsel. Information furnished in connection with Board or Committee meetings throughout the year included, among other things, presentations given by the portfolio managers of the Fund on the Fund’s investment strategies, risks, absolute performance, and comparative performance of the Fund against its benchmark index; reports regarding the Fund’s asset levels including sales and repurchase activities; and various reports on the monitoring of the Fund’s compliance with the securities laws, regulations, policies, and procedures. In preparation for the Board’s annual consideration of the approval of the Advisory and Subadvisory Agreements, the Board requested and received a wide variety of information and reports concerning the Adviser (and its affiliates) and the Subadviser, including information on: (1) the nature, extent, and quality of services provided to the Fund by the Adviser (and its affiliates) and the Subadviser; (2) the investment performance of the Fund as compared to a group of comparable funds; (3) the level of the advisory and subadvisory fees charged to the Fund as compared to: (a) other clients of the Adviser and the Subadviser and (b) a group of comparable funds; (4) the expense ratios of the Fund as compared to a group of comparable funds; (5) the profitability of the Adviser; and (6) the Adviser’s and Subadviser’s compliance programs. The Board also considered information related to potential “fall out” or ancillary benefits enjoyed by the Adviser (and its affiliates) and the Subadviser as a result of their relationships with the Fund.
In addition to evaluating, among other things, the written information provided by the Adviser, the Board also considered the answers to questions posed by the Board to representatives of the Adviser at various meetings and took into account their accumulated experience in working with the Adviser on matters related to the Fund. The Independent Trustees also met separately in executive sessions with their independent legal counsel to review and consider the information provided regarding the Advisory and Subadvisory Agreements.
Based on their review, the Independent Trustees and the full Board concluded that it was in the best interests of the Fund to approve the continuation of the Advisory Agreement and the Subadvisory Agreement. In their deliberations, the Board did not identify any single factor or group of factors asall-important or controlling but considered all factors together. The material factors and conclusions that formed the basis for the Board’s determinations are discussed below.
Nature, Extent and Quality of Services
In evaluating the nature, extent, and quality of the services provided by the Adviser and the Subadviser to the Fund, the Board reviewed information describing the financial strength, experience, resources, and key personnel of the Adviser and the Subadviser, including the personnel who provide investment management services to the Fund. With respect to the Adviser, the Board considered the administrative services that are provided to the Fund, as well as other services performed by the Adviser, including the monitoring of the Subadviser; monitoring of the execution of portfolio transactions; monitoring adherence to the Fund’s investment restrictions; monitoring the Fund’s compliance with its compliance policies and procedures and with applicable securities laws and regulations; producing shareholder reports; providing support services for the Board and Board committees; communicating with shareholders; and overseeing the activities of other service providers. The Board also considered the Adviser’s experience in providing investment advisory services to funds and the differentiation of the advisory services provided by the management team versus the portfolio management services provided by the Subadviser. With respect to the Subadviser, the Board noted the Subadviser’s experience in managing the strategies of the Fund and the Subadviser’s compliance program as it relates to the Fund. The Board considered the other services provided by the Subadviser under the Subadvisory Agreement, including selecting broker-dealers for execution of portfolio transactions; monitoring adherence to the Fund’s investment restrictions; and assisting with portfolio compliance with securities laws, regulations, policies, and procedures.
Based upon this review, the Board concluded that the nature, quality, and extent of the services to be provided to the Fund by the Adviser and the Subadviser are expected to be satisfactory.
Review of Fund Performance
The Board reviewed the investment performance of the Fund. While consideration was given to performance reports provided in connection with, and discussions held at, regular Board meetings throughout the year, particular attention was given to the performance reports provided specifically in connection with the July and August Meetings. In particular, the Board noted the performance of the Fund relative to its Lipper Inc. (“Lipper”) peer universe. The Trustees also considered updated performance information for the Fund relative to its benchmark and its Morningstar, Inc. (“Morningstar”) ratings.
19
| | |
| |
Shareholder Report Disclosure of Trustees’ Approval of
Advisory and Subadvisory Contracts(continued) |
With respect to the Fund’s performance as compared to its Lipper peer universe (“peer group”), the Board reviewed the Fund’s performance percentile rankings over theyear-to-date andone-, three- and five-year trailing periods through May 31, 2019, as provided by the Adviser. The Board considered that the Fund’syear-to-date,one-year, three-year, and five-year performance was in the fourth quartile of its peer group. The Board noted the Fund’s performance returns relative to its benchmark over various periods and considered the Adviser’s explanation for the underperformance of the Fund. The Board also noted the Adviser’s explanation that the Fund’s ranking is largely a reflection of being compared against peers that are only invested in emerging markets equities. The Board considered that Fund management is closely monitoring the Fund.
The Board determined that it was generally satisfied with the Fund’s performance and would continue to monitor the Fund’s performance results.
Costs of Services Provided and Profits Realized by the Adviser and Subadviser
The Board considered the fees payable by the Fund under the Advisory Agreement and the Subadvisory Agreement. The Board first reviewed the management fees charged to comparable accounts managed by the Adviser and the Subadviser, taking into consideration differences in style, size, and services provided to such other accounts. The Board noted that, in some cases, the fees for certain accounts or average fees for certain investment strategies were lower than the fees charged to the Fund. The Board considered the Adviser’s explanation that registered investment companies generally require additional advisory and administrative services than other clients due to the enhanced regulatory structure and legal requirements with which investment companies must comply. The Board also considered the affiliation of the Subadviser with the Adviser.
The Board next reviewed information provided by the Adviser comparing the Fund’s contractual (gross) advisory fee to the median fee of its Morningstar peer category (“Morningstar peers”).In addition, the Board reviewed information provided by the Adviser comparing the Fund’s net expense ratio to the median net expense ratio of the comparable Morningstar peer group and Lipper peer group (“Lipper peers”). With respect to the Subadviser, the Board considered the fees payable under the Subadvisory Agreement, noting that the fees would be paid by the Adviser (not the Fund). The Board also considered the division of services provided and fee split between the Adviser and the Subadviser.
The Board considered that the Fund’s contractual investment advisory fees and net expense ratio were in the fourth quartile of its Morningstar peers and its net expense ratio was significantly higher than the median of its Lipper peers. The Board considered the Adviser’s explanation that the Morningstar and Lipper peer groups consist of emerging markets funds, rather than frontier markets funds, as Morningstar and Lipper do not have a frontier markets category. The Board also noted the Adviser’s explanation that research, custody and trading for frontier markets investments are more expensive than for more developed markets investments, which results in the Fund’s fees and expenses being higher than that of its emerging markets competitors. In addition, the Board considered the Adviser’s statement that the Fund’s investments are more focused on “pure” frontier markets countries (as opposed to those that are nearly emerging markets countries) than other frontier markets funds, which further increases the expenses for research, custody and trading for the Fund.
The Board considered that the Adviser has agreed to a contractual expense limitation for the Fund (the “Expense Limitation”), and that the net expense ratio for the Fund takes into account the effect of the Expense Limitation.
The Board considered the methodology used by the Adviser and the Subadviser in determining compensation payable to its portfolio managers and the competitive environment for investment management talent. The Board also considered the financial condition of the Adviser and certain of its affiliates and the Subadviser, and particularly focused on the financial strength of the ultimate parent company of the Adviser, and the parent company’s commitment, financial and otherwise, to the global asset management business and the BMO Fund complex.
The Board reviewed profitability information it received from the Adviser in connection with the services provided to the Fund. The materials provided in this regard showed, and the Trustees acknowledged, that the Adviser experienced a positive net margin with respect to the Fund. The Board also reviewed the comparative profitability information provided by the Adviser from Strategic Insight regarding other public investment advisory firms.
Economies of Scale
The Board considered the extent to which economies of scale would be realized as the Fund grows and whether the Fund’s fee levels reflect these economies of scale for the benefit of Fund shareholders. The Board considered the Fund’s fee structure, asset size, and net expense ratio giving effect to the Fund’s Expense Limitation. The Board was satisfied with the fee structures and also considered the Adviser’s commitment to continue to evaluate advisory fee breakpoints in the future.
Other Benefits to the Adviser and Subadviser
The Board considered benefits that accrue to the PAdviser and its affiliates from their relationships with the Fund, including revenue in the form of administration fees. In addition, the Board considered information relating to any soft dollar arrangements in connection with equity security brokerage transactions for the Fund and/or other clients. The Board noted that, other than the services provided by the Adviser and the Subadviser pursuant to the Advisory Agreement and Subadvisory Agreement, respectively, and the related fees to be paid by the Fund, the Adviser and the Subadviser may potentially benefit from their relationship with the Fund in other ways. The Board also considered that the success of the Fund could attract other business to the Adviser and that the success of the Adviser could enhance the Adviser’s ability to serve the Fund.
20
| | |
| | |
| | | BMO LGM Frontier Markets Equity Fund |
The Board concluded that, taking into account all of the information reviewed, the Fund’s advisory and subadvisory fee was reasonable.
Overall Conclusions
Based on all of the information considered and the conclusions reached, the Board determined that the terms of the Advisory and Subadvisory Agreements are fair and reasonable and that the approval of the continuation of the Advisory Agreement and the Subadvisory Agreement is in the best interests of the Fund.
21
22
23
24
This report is authorized for distribution to prospective investors only when preceded or accompanied by the Fund’s prospectus, which contain facts concerning its objective and policies, management fees, expenses, and other information.
Proxy Voting
A description of the policies and procedures that the Fund uses to determine how to vote proxies relating to portfolio securities is available without charge, upon request, by calling toll free,1-800-236-FUND (3863) and by accessing the Fund’s Statement of Additional Information, which is available on the Fund’s website at http://www.bmofunds.com and on the SEC’s website at http://www.sec.gov.
The Fund’s proxy voting record for the most recent12-month period ended June 30 is available without charge, upon request, by calling toll free,1-800-236-FUND (3863) and by accessing the SEC’s website at http://www.sec.gov.
Disclosure of Portfolio Holdings
The Fund files its complete schedule of portfolio holdings with the SEC for the first and third quarters of each fiscal year as an attachment to Form N-PORT. The Fund’sForm N-PORT is available on the SEC’s website at http://www.sec.gov and may be reviewed and copied at the SEC’s Public Reference Room in Washington, D.C. Information on the operation of the Public Reference Room may be obtained by calling1-800-SEC-0330.
Shares of the Fund are not bank deposits or other obligations of, or issued, endorsed or guaranteed by, BMO Harris Bank, NA, or any of its affiliates. Shares of the Fund, like shares of all mutual funds, are not insured or guaranteed by the U.S. government, the Federal Deposit Insurance Corporation, the Federal Reserve Board, or any other government agency. Investment in mutual funds involves investment risk, including the possible loss of principal.
| | |
 | | BMO Funds U.S. Services P.O. Box 55931 Boston, MA 02205-5931 |
| | |
 | | Contact us 1-800-236-FUND (3863) 414-287-8555 |
| | |
 | | Learn more bmofunds.com |
BMO Investment Distributors, LLC, Distributor
BMO Asset Management Corp., Investment Adviser
Investment products are:NOT FDIC INSURED — NO BANK GUARANTEE — MAY LOSE VALUE.
© 2019 BMO Financial Corp. (9/19)
Item 2. Code of Ethics.
The Registrant has a code of ethics (the “Code”) that applies to the Registrant’s principal executive officer and principal financial officer. During the period covered by this report, there were no amendments to the provisions of the Code, nor were there any implicit or explicit waivers to the provisions of the Code. The Code is filed herewith.
Item 3. Audit Committee Financial Expert.
The Registrant’s Board of Directors has determined that the Registrant has four audit committee financial experts serving on its audit committee, each of whom is “independent” within the meaning ofForm N-CSR: Ridge A. Braunschweig, Barbara J. Pope, John A. Lubs, and Benjamin M. Cutler. Under applicable securities laws, a person who is determined to be an audit committee financial expert will not be deemed an “expert” for any purpose, including without limitation for purposes of Section 11 of the Securities Act of 1933, as amended, as a result of being designated or identified as an audit committee financial expert. The designation or identification of a person as an audit committee financial expert does not impose on such person any duties, obligations, or liabilities that are greater than the duties, obligations, and liabilities imposed on such person as a member of the audit committee and Board of Directors in the absence of such designation or identification.
Item 4. Principal Accountant Fees and Services.
The aggregate fees for professional services by KPMG LLP during the fiscal year 2019 and 2018 were as follows:
| (a) | Audit Fees for Registrant. |
| | |
Fiscal year ended August 31, 2019 | | $24,390 |
Fiscal year ended August 31, 2018 | | $23,700 |
| (b) | Audit-Related Fees for Registrant. These are fees by the Registrant’s independent auditors for assurance and related services that were reasonably related to the performance of the audit of the Registrant’s financial statements that are not reported under “Audit Fees”. These fees would include amounts related to consents and FormN-17f-2 filings. |
| | |
Fiscal year ended August 31, 2019 | | $0 |
Fiscal year ended August 31, 2018 | | $3,000 |
| (c) | Tax Fees for Registrant. These are fees for professional services rendered by the Registrant’s independent auditors for tax compliance, tax advice, and tax planning. These fees include federal, excise and state tax reviews; performed by KPMG LLP. |
| | |
Fiscal year ended August 31, 2019 | | $3,935 |
Fiscal year ended August 31, 2018 | | $3,820 |
| | |
Fiscal year ended August 31, 2019 | | None |
Fiscal year ended August 31, 2018 | | None |
| (e) | Audit Committee’spre-approval policies and procedures. |
| | (1) | The Audit Committee has adoptedpre-approval policies and procedures that require the Audit Committee topre-approve all audit andnon-audit services of the Registrant, including services provided to the Registrant’s investment adviser or any entity controlling, controlled by or under common control with the Registrant’s investment adviser that provides ongoing services to the Registrant with respect to any engagement that directly relates to the operations and financial reporting of the Registrant. |
| | (2) | None of the services described in paragraphs (b) through (d) of this Item 4 were approved by the audit committee pursuant to paragraph (c)(7)(i)(C) of Rule2-01 of RegulationS-X. |
| (g) | During the last two fiscal years, there were no othernon-audit services rendered by the Registrant’s independent auditors to the Registrant, its investment adviser or any entity controlling, controlled by or under the common control with the investment adviser that provides ongoing services to the Registrant. |
Item 5. Audit Committee of Listed Registrants.
Not applicable.
Item 6. Investments.
Included as part of the report to shareholders filed under Item 1 of this FormN-CSR.
Item 7. Disclosure of Proxy Voting Policies and Procedures forClosed-End Management Investment Companies.
The Board of Trustees has delegated the authority to vote proxies relating to the securities held in the BMO LGM Frontier Markets Equity Fund’s (the “Fund) portfolio to BMO Asset Management Corp. (the “Adviser”) and has authorized the Adviser to delegate its authority to vote proxies to LGM Investments Limited (“LGM” or the“Sub-Adviser”) on behalf of the Fund. As used in this section, the term Adviser means Adviser orSub-Adviser, as applicable. The Adviser will generally attempt to process every proxy it receives for all domestic and foreign securities. However, there may be situations in which the Adviser may be unable to vote a proxy, or may choose not to vote a proxy, such as where: (i) the proxy ballot was not received from the custodian bank; (ii) a meeting notice was received too late; (iii) there are fees imposed upon the exercise of a vote and it is determined that such fees outweigh the benefit of voting; (iv) there are legal encumbrances to voting, including blocking restrictions in certain markets that preclude the ability to dispose of a security if the Adviser votes a proxy or where the Adviser is prohibited from voting by applicable law or other regulatory or market requirements, including but not limited to, effective Powers of Attorney; (v) the Adviser held shares on the record date but has sold them prior to the meeting date; (vi) proxy voting service is not offered by the custodian in the market; or (vii) the Adviser believes it is not in the best interest of the Fund or its shareholders to vote the proxy for any other reason not enumerated herein.
The Adviser’s proxy voting policies and procedures are reasonably designed to ensure that proxies are voted in the best interest of clients. The policies and procedures were developed by BMO’s Responsible Investment Committee established by the Adviser and affiliates of BMO Financial Corp., and BMO’s Governance & Sustainable Investment team administers the proxy voting framework. The Board reviews and approves all changes to the proxy policies and procedures.
The proxy policies and procedures seek to ensure, as applicable, that shareholder return and the value of Fund investments are maximized and that sound corporate governance is promoted. The proxy voting policies, procedures, and guidelines generally follow BMO’s Corporate Governance Guidelines which set out what BMO expects of companies in terms of good governance. Although the Adviser generally adheres to the guidelines and relies on an independent proxy voting advisory service to execute votes, any proxy issues that differ from our Corporate Governance Guidelines are considered by taking into account the particular circumstances involved. This provides needed flexibility in making prudent judgments in the proxy voting process.
In situations where a conflict of interest exists, the Adviser will obtain a proxy voting recommendation from an independent proxy voting advisory service and will ultimately vote proxies in the best economic interests of clients without consideration of any benefit to the Adviser or its affiliates.
Item 8. Portfolio Managers ofClosed-End Management Investment Companies.
| (a)(1) | Identification of Portfolio Manager(s) and Description of Role of Portfolio Manager(s) |
The following provides biographical information about the Portfolio Managers, who are primarily responsible for theday-to-day portfolio management of the BMO LGM Frontier Markets Equity Fund (the “Fund”) as of August 31, 2019:
Thomas Vester and Dafydd Lewisco-manage the Fund.
Mr. Vester, Chief Investment Officer and Senior Portfolio Manager at LGM, joined LGM in 2011 and has managed the Fund since its inception in December 2013.
Mr. Lewis, a Portfolio Manager at LGM, joined LGM in 2011 and hasco-managed the Fund since July 2014.
| (a)(2) | Other Accounts Managed by Portfolio Manager(s) or Management Team Member and Potential Conflicts of Interest |
The following table provides information about portfolios and accounts, other than the Fund, for which the Portfolio Managers are primarily responsible for theday-to-day portfolio management as of August 31, 2019:
| | | | | | | | | | |
(i)
Name of
Portfolio
Manager | | Type of Accounts | | (ii) Total Number of Accounts Managed | | Total Assets | | (iii) Number of
Accounts
Managed for
which Advisory
Fee is Based on
Performance | | Total Assets for
Which Advisory
Fee is Based on
Performance |
Thomas Vester | | Registered Investment Companies | | 0 | | $0 | | 0 | | $0 |
| | | | | | | | | | |
(i)
Name of
Portfolio
Manager | | Type of Accounts | | (ii) Total Number of Accounts Managed | | Total Assets | | (iii) Number of Accounts Managed for which Advisory Fee is Based on Performance | | Total Assets for Which Advisory Fee is Based on Performance |
| | | Other Pooled Investment Vehicles | | 3 | | $707.4 million | | 1 | | $559.5 million |
| | | Other Accounts | | 0 | | $0 | | 0 | | $0 |
Dafydd Lewis | | Registered Investment Companies | | 0 | | $0 | | 0 | | $0 |
| | | Other Pooled Investment Vehicles | | 3 | | $707.4 million | | 1 | | $559.5 million |
| | | Other Accounts | | 0 | | $0 | | 0 | | $0 |
Potential Conflicts of Interests
A conflict of interest may arise as a result of a portfolio manager being responsible for multiple accounts, including the Fund, which may have different investment guidelines and objectives. In addition to the Fund, these accounts may include other mutual funds managed on an advisory or subadvisory basis, separate accounts and collective trust accounts. An investment opportunity may be suitable for the Fund as well as for any of the other managed accounts. However, the investment may not be available in sufficient quantity for all of the accounts to participate fully. In addition, there may be limited opportunity to sell an investment held by the Fund and the other accounts. The other accounts may have similar investment objectives or strategies as the Fund, they may track the same benchmarks or indexes as the Fund tracks, and they may sell securities that are eligible to be held, sold or purchased by the Fund. A portfolio manager may be responsible for accounts that have different advisory fee schedules, which may create the incentive for the portfolio manager to favor one account over another in terms of access to investment opportunities. A portfolio manager also may manage accounts whose investment objectives and policies differ from those of the Fund, which may cause the portfolio manager to effect trading in one account that may have an adverse effect on the value of the holdings within another account, including the Fund.
To address and manage these potential conflicts of interest, the Adviser and LGM have each adopted compliance policies and procedures to allocate investment opportunities and to ensure that each of their clients is treated on a fair and equitable basis. Such policies and procedures include, but are not limited to, trade allocation and trade aggregation policies, cross trading policies, portfolio manager assignment practices and oversight by investment management and/or compliance departments.
(a)(3) Compensation Structure of Portfolio Manager(s)
Adviser
Compensation for the Adviser’s portfolio managers consists of base salary, which is monitored to ensure competitiveness in the external marketplace. In addition to base salary, portfolio managers have a portion of their compensation tied to the investment performance of client accounts. The formula for each professional varies according to their level of portfolio responsibility and seniority. Investment professionals may also receive bonuses of restricted share units or other units linked to the performance of BMO Financial Group.
LGM
Compensation for LGM’s portfolio managers consists of three components: (1) competitive base salary; (2) discretionary bonus; and (3) long-term incentive program (deferred stock units and/or stock options of BMO Financial Group). Base salaries are reviewed on an annual basis to ensure alignment with the external market. Discretionary performance bonuses vary according to business and individual performance and are provided in a combination of cash and deferred equity-based awards for employees at higher levels of compensation. Portfolio managers also may have a long-term incentive program consisting of restricted share units or other units linked to the performance of BMO.
BMO ensures that its compensation programs provide for clear alignment between pay and sustained business, client and individual performance as well as recognize behaviors which align to core values and contribute to the success of BMO and BMO clients. The compensation programs are designed to support and promote effective risk management, aligned to clients’ risk objectives and BMO’s corporate risk appetite and reflect local regulatory and legal requirements. The approach to compensation does not encourage excessive risk-taking that exceeds tolerated levels of risk.
With respect to any perceived conflicts of interest relating to the payment model, the risk management focus of the investment process drives all key decision making. Likewise, individual compensation is weighted more toward long term profit fromfee-based client relationships than it is on short term performance, which further motivates the team to achieve stable long-termfee-based relationships through consistent benchmark outperformance and capital preservation. Finally, the deferred equity-linked component of the incentive compensation plan promotes a long-term interest in firm value.
(a)(4) Disclosure of Securities Ownership
The following table sets forth the dollar range of equity securities beneficially owned by each Portfolio Manager in the Fund as of August 31, 2019:
| | |
| Portfolio Manager | | Dollar Range of Fund Shares Beneficially Owned |
Thomas Vester | | None |
Dafydd Lewis | | None |
Item 9. Purchases of Equity Securities byClosed-End Management Investment Company and Affiliated Purchasers.
| | | | | | | | | | | | | | | | |
| Period | | (a) Total Number of Shares Purchased | | | (b) Average Price Paid Per Share | | | (c) Total Number of Shares Purchased as Part of Publicly Announced Plans or Programs | | | (d) Maximum Number of Shares that May Yet Be Purchased Under the Plans or Programs | |
Sep.1-30, 2018 | | | 152,623.52 | | | | 10.00 | | | | 0 | | | | 0 | |
Oct.1-31, 2018 | | | 0 | | | | 0 | | | | 0 | | | | 0 | |
Nov.1-30, 2018 | | | 0 | | | | 0 | | | | 0 | | | | 0 | |
Dec.1-31, 2018 | | | 117,359.98 | | | | 9.12 | | | | 0 | | | | 0 | |
Jan.1-31, 2019 | | | 0 | | | | 0 | | | | 0 | | | | 0 | |
Feb.1-28, 2019 | | | 0 | | | | 0 | | | | 0 | | | | 0 | |
Mar.1-31, 2019 | | | 9587.0420 | | | | 9.19 | | | | 0 | | | | 0 | |
Apr.1-30, 2019 | | | 0 | | | | 0 | | | | 0 | | | | 0 | |
May1-31, 2019 | | | 0 | | | | 0 | | | | 0 | | | | 0 | |
Jun.1-30, 2019 | | | 17620.684 | | | | 8.79 | | | | 0 | | | | 0 | |
Jul.1-31, 2019 | | | 0 | | | | 0 | | | | 0 | | | | 0 | |
| | | | | | | | | | | | | | | | |
| Period | | (a) Total Number of Shares Purchased | | | (b) Average Price Paid Per Share | | | (c) Total Number of Shares Purchased as Part of Publicly Announced Plans or Programs | | | (d) Maximum Number of Shares that May Yet Be Purchased Under the Plans or Programs | |
Aug.1-31, 2019 | | | 0 | | | | 0 | | | | 0 | | | | 0 | |
Total | | | 297191.226 | | | | - | | | | | | | | | |
Item 10. Submission of Matters to a Vote of Security Holders.
Not applicable.
Item 11.��Controls and Procedures.
| (a) | The Registrant’s principal executive officer and principal financial officer have reviewed the Registrant’s disclosure controls and procedures (as defined in Rule30a-3(c) under the Investment Company Act of 1940, as amended, (the “Act”)) as of a date within 90 days of the filing of this report, as required by Rule30a-3(b) under the Act. Based on their review, such officers have concluded that the disclosure controls and procedures were effective in ensuring that information required to be disclosed in this report was appropriately recorded, processed, summarized and reported and made known to them by others within the Registrant and by the Registrant’s service providers. |
| (b) | There were no changes in the Registrant’s internal control over financial reporting (as defined in Rule30a-3(d) under the Act (17 CFR270.30a-3(d)) that occurred during the period covered by this report that materially affected, or were reasonably likely to materially affect, the Registrant’s internal control over financial reporting. |
Item 12. Disclosure of Securities Lending Activities forClosed-End Management Investment Companies.
| (a) | The following provides dollar amounts of income and fees/compensation related to securities lending activities of the Fund during the fiscal year ended August 31, 2019: |
| | | | |
Gross income earned by the fund from securities lending activities | | | $53,550.33 | |
| |
Fees and/or compensation paid by the fund for securities lending activities and related services | |
Fees paid to securities lending agent from a revenue split | | | $1,526.56 | |
Fees paid for any cash collateral management service (including fees deducted from a pooled cash collateral reinvestment vehicle) that are not included in a revenue split | | | $163.01 | |
Administrative fees not included in a revenue split | | | $0.00 | |
Indemnification fees not included in a revenue split | | | $0.00 | |
Rebate (paid to borrower) | | | $45,755.63 | |
Other fees not included in a revenue split, if applicable, including a description of those other fees | | | $0.00 | |
Aggregate fees/compensation paid by the fund for securities lending activities | | | $47,445.20 | |
Net income from securities lending activities | | | $6,105.13 | |
The Fund participates in a securities lending program, providing for the lending of equity securities to qualified brokers, in exchange for the opportunity to earn additional income for participation. State Street
Bank & Trust Company serves as the securities lending agent. The Fund receives cash as collateral in return for the securities and records a corresponding payable for collateral due to the respective broker. The amount of cash collateral received is maintained at a minimum level of 100% of the prior day’s market value on securities and accrued interest loaned. Collateral is reinvested in the State Street Navigator Securities Lending Prime Portfolio money market fund or the BMO Government Money Market Fund.
Item 13. Exhibits.
| | |
(a) (1) | | Code of Ethics. Filed herewith. |
| |
(a) (2) | | Certifications required pursuant to Section 302 of the Sarbanes-Oxley Act of 2002. Filed herewith. |
| |
(a) (3) | | Not applicable. |
| |
(a)(4) | | Not applicable. |
| |
(b) | | Certification pursuant to Section 906 of the Sarbanes-Oxley Act of 2002. Filed herewith. |
SIGNATURES
Pursuant to the requirements of the Securities Exchange Act of 1934 and the Investment Company Act of 1940, the Registrant has duly caused this report to be signed on its behalf by the undersigned, thereunto duly authorized.
BMO LGM Frontier Markets Equity Fund
| | |
By: | | /s/ John M. Blaser |
| | John M. Blaser |
| | President |
Date: November 8, 2019
Pursuant to the requirements of the Securities Exchange Act of 1934 and the Investment Company Act of 1940, this report has been signed below by the following persons on behalf of the Registrant and in the capacities and on the dates indicated.
| | |
By: | | /s/ John M. Blaser |
| | John M. Blaser |
| | President |
| | (Principal Executive Officer) |
Date: November 8, 2019
| | |
By: | | /s/ Timothy M. Bonin |
| | Timothy M. Bonin |
| | Treasurer |
| | (Principal Financial Officer) |
Date: November 8, 2019