As filed with the Securities and Exchange Commission on March 8, 2021
SECURITIES AND EXCHANGE COMMISSION
WASHINGTON, D.C. 20549
FORM N-CSR
CERTIFIED SHAREHOLDER REPORT OF
REGISTERED MANAGEMENT INVESTMENT COMPANIES
Investment Company Act file number: 811-23227
SYNTAX ETF TRUST
(Exact Name of Registrant as Specified in Charter)
One Liberty Plaza, 46th Floor
New York, NY 10006
(Address of Principal Executive Offices) (Zip Code)
Registrant’s Telephone Number, including Area Code: (212) 880-0200
Carly Arison, One Liberty Plaza, 46th Floor New York, NY 10006
(Name and Address of Agent for Service)
Copies to:
Kathleen H. Moriarty
Counsel to the Trust
Chapman & Cutler LLP
1270 Avenue of the Americas, 30th Floor
New York, New York 10020
Date of fiscal year end: December 31
Date of reporting period: December 31, 2020
| Item 1: | Report(s) to Shareholders. |
The Annual Report is attached.
ANNUAL REPORT
Syntax Stratified LargeCap ETF
Syntax Stratified MidCap ETF
Syntax Stratified SmallCap ETF
December 31, 2020
Beginning on January 1, 2021, as permitted by regulations adopted by the U.S. Securities and Exchange Commission, paper copies of a Fund’s annual and semi-annual shareholder reports will no longer be sent by mail, unless you specifically request paper copies of the reports from the Fund (or from your financial intermediary, such as a broker-dealer or bank). Instead, the reports will be made available on the Fund’s website (www.syntaxadvisors.com), and you will be notified by mail each time a report is posted, and provided with a website link to access the report. If you already elected to receive reports electronically, you will not be affected by this change and you need not take any action. You may elect to receive shareholder reports and other communications by contacting your financial intermediary.
You may elect to receive all future reports in paper free of charge. If you invest through a financial intermediary, you can contact your financial intermediary to request that you continue to receive paper copies of your shareholder reports. Your election to receive reports in paper will apply to all funds held in your account.
Syntax ETF Trust
Annual Report
December 31, 2020
Table of Contents
This report is not authorized for distribution to prospective investors in the Fund unless preceded or accompanied by an effective prospectus.
Dear Shareholder,
Enclosed is the report for the Syntax ETF Trust for the period ending December 31, 2020, together with Management's Discussion and Analysis for the Syntax Stratified LargeCap ETF, the Syntax Stratified MidCap ETF, and the Syntax Stratified SmallCap ETF. Also included is information about their respective indices - the Syntax Stratified LargeCap Index, the Syntax Stratified MidCap Index, and the Syntax Stratified SmallCap Index.
Syntax’s goal is to offer investors investment products that track Stratified Weight versions of major market indices. Our thesis is stratifying these indices provides diversification across business risks1. Accordingly, we are pleased to report that during 2020 we launched two new Stratified ETFs: The Syntax Stratified MidCap ETF (NYSE Arca Ticker: SMDY) began trading on January 16, 2020, and the Syntax Stratified SmallCap ETF (NYSE Arca Ticker: SSLY) began trading on May 28, 2020.
The first quarter of 2020 saw widespread selloffs in the domestic equity markets as the coronavirus (Covid-19) pandemic and resulting lockdowns sent shockwaves through the global economy. Investor fear and panic selling characterized the market’s mood. In the second quarter, despite the spread of the virus, investors returned to the equity markets, and we saw a broad-based recovery which included an unprecedented stimulus package enacted by Congress and the President. Late in the year, positive news regarding successful trials of several COVID-19 vaccines encouraged investors to shift towards riskier assets, leading to an equity market rally despite surging case numbers. 2020 ended much as it began, with volatility and uncertainty remaining as the U.S. Presidential election, civil unrest, and division left investors uncertain about the future.
Based on our analysis of market movements during the past year, we see the current market environment as one potentially favorable to investors using the Syntax Stratified Weight approach. Our research shows that the hardest hit sectors during a sell-off have generally been the best performers during the subsequent recovery. This is encouraging as the core of our Stratified Weight strategy is to spread exposure across business risk groups, instead of concentrating in the largest companies or most represented sectors and industries. In doing so, we believe our strategy will provide a more stable return by allowing investors to partake in the full economic opportunity of the reversal across sectors. Conversely, cap-weighted strategies fail to capture this reversal since they do not rebalance their weights, which leads to oversized positions in sectors with the lowest upside potential.
Although we are hopeful that 2021 brings less volatile economic and social conditions, we believe it prudent to note that the economic risks associated with the pandemic may continue. However, we are cautiously optimistic that the observed economic recovery will continue. We remain confident that the Stratified Weight approach is well positioned to benefit from continued expansion since it seeks to capture a fuller range of market opportunities by diversifying across business risks and avoiding concentrations in any one sector or industry.
We appreciate your investment in and support of The Syntax ETF Trust and look forward to serving your investment needs in the future.
1 Business risks are risks related to the nature of a company's business: what it does, who its customers are, what supplies it utilizes, and other such attributes.
Syntax Stratified LargeCap ETF (SSPY)
Manager’s Note
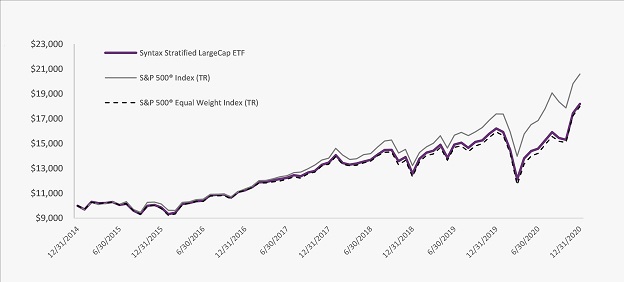
As an index fund, the Syntax Stratified LargeCap ETF (the “Fund”) seeks to track the returns (before fees and expenses) of its underlying index – the Syntax Stratified LargeCap Index (the “Index”). The Index reweights the constituents of the widely tracked S&P 500® to address the related business risk concentrations that occur in capitalization-weighted indices. Its goal is to deliver an unbiased return that is representative of all the business opportunities in the market, not just the largest ones.
When compared to capitalization-weighted and equal weighted strategies, the Stratified approach may provide the following potential advantages:
- Reduce the negative impact of a significant correction in an overweight sector.
- Increase the chance of participating in all sectors during a market rally.
- Capture a fuller range of market opportunities.
In accordance with its guidelines and procedures, Syntax, LLC (“Syntax” or the “Index Provider”) has contracted with S&P Opco, LLC (a subsidiary of S&P Dow Jones Indices LLC) to calculate and maintain the Index, which is a Stratified WeightTM version of the S&P 500 Index. Unlike the S&P 500 Index, which employs a market capitalization weighted methodology, the Index utilizes a patented investment technology to diversify the same constituents and use the same rebalancing schedule as the S&P 500, the primary difference is the weighting scheme applied. The Fund generally invests in all of the securities comprising the Index in proportion to their weightings in the Index.
For the year ending December 31, 2020, on a market price basis, the Fund returned 12.22%. On a net asset value (“NAV”) basis, the Fund returned 12.18%. During the same time period, the Index returned 12.38%. During the year, the Fund fully replicated the components of the Index; therefore, the Fund’s performance, on a NAV basis, differed from the return of the Index primarily due to fees and operating expenses that the Fund incurred during the period.
During this same time period, the S&P 500 Index returned 18.40% and the S&P 500 Equal Weight Index returned 12.83%. The S&P 500 is an unmanaged index weighted by market capitalization based on the average performance of approximately 505 equity securities. The S&P Equal Weight 500 is an unmanaged index and is the equal-weight
version of the S&P 500 Index. It includes the same companies as the S&P 500 Index, but each company is allocated an equal fixed weight of the index at each quarterly rebalance.
Both the S&P 500 Index and the S&P 500 Equal Weight Index were selected as performance comparators for their recognition in the marketplace. Their performance comparison is a useful measure for investors as a broad representation of the U.S. equity market using two different weighting methodologies: capitalization weighting and equal weighting. Both indices also use the same underlying universe as the Index. The performance of the Fund differed from the S&P 500 Index and the S&P 500 Equal Weight Index in part because the Fund employs a Stratified Weight methodology.
Syntax Stratified LargeCap ETF (SSPY)
Manager’s Note
| Top 10 Holdings and Portfolio Weights | |
Kroger Co.
| 0.77% |
Costco Wholesale Corp.
| 0.77% |
Walmart, Inc.
| 0.75% |
Sysco Corp.
| 0.75% |
Autodesk, Inc.
| 0.74% |
ANSYS, Inc.
| 0.74% |
Exxon Mobil Corp.
| 0.72% |
Adobe, Inc.
| 0.71% |
Microsoft Corp.
| 0.71% |
Chevron Corp.
| 0.70% |
| As of December 31, 2020. Holdings subject to change | |
| Sector Breakdown | |
Information Tools
| 12.82% |
Financials
| 12.75% |
Consumer Products Services
| 12.55% |
Healthcare
| 12.50% |
Information
| 12.49% |
Food
| 12.35% |
Industrials
| 12.27% |
Energy
| 12.03% |
Other Assets in Excess of Liabilities
| 0.24% |
| As of December 31, 2020. (% of the Fund’s Net Assets) |
Due to rounding, numbers presented may not add up precisely to the totals provided and percentages may not precisely reflect the absolute figures.
Syntax Stratified LargeCap ETF (SSPY)
Manager’s Note
Performance: Growth of $10,000
Performance Return (%) As of December 31, 2020
| | Cumulative | Annualized | Calendar Year |
| | YTD | 4Q20 | 1Y | 3Y | 5Y | Since Fund
Inception | 2015 | 2016 | 2017 | 2018 | 2019 | 2020 |
SSPY NAV (%)
| 12.18 | 17.77 | 12.18 | 10.56 | 13.04 | 10.49 | -1.44 | 14.11 | 19.73 | -6.57 | 28.93 | 12.18 |
SSPY Market Price (%)
| 12.22 | 17.60 | 12.22 | -- | -- | -- | -- | -- | -- | -- | 28.90 | 12.22 |
Syntax Stratified LargeCap Index (TR)
| 12.38 | 17.91 | 12.38 | 10.79 | -- | -- | -- | -- | 20.12 | -6.43 | 29.33 | 12.38 |
S&P 500 Index (TR)
| 18.40 | 12.15 | 18.40 | 14.18 | 15.22 | 12.79 | 1.38 | 11.96 | 21.83 | -4.38 | 31.49 | 18.40 |
S&P 500 Equal Weight Index (TR)
| 12.83 | 18.46 | 12.83 | 10.44 | 12.95 | 10.27 | -2.20 | 14.80 | 18.90 | -7.64 | 29.24 | 12.83 |
Past performance is no guarantee of future results. Performance results do not reflect the deduction of taxes that a shareholder would pay on fund distributions or on the redemption or sale of fund shares. The Growth of $10,000 chart represents a hypothetical investment based upon the historical performance of the Fund. It includes the reinvestment of dividends and capital gains at net asset value: actual returns may differ. Performance reflects contractual reimbursements in effect until May 1, 2021. In the absence of such reimbursements, performance would be reduced. The gross and net expense ratios of the Fund are 0.45% and 0.30%, respectively. Indexes are unmanaged and do not incur fees, expenses, and other costs. Investment return and principal value will fluctuate so that shares, when redeemed, may be worth more or less than their original cost. Current performance may be lower or higher than that shown here. Please see important disclosures relating to Portability of Performance on page 11. A privately offered fund managed by Syntax Advisors, LLC was reorganized into the Syntax Stratified Largecap ETF (“the Fund”) as of January 2, 2019 upon commencement of the ETF operations. For periods prior to the commencement of ETF operations, the Fund’s performance is that of the private fund. The Fund’s NAV price as of January 2, 2019 was used in calculating market price performance for January 2 and January 3, prior to the fund first trading on the New York Stock Exchange on January 4, 2019.
Syntax Stratified MidCap ETF (SMDY)
Manager’s Note
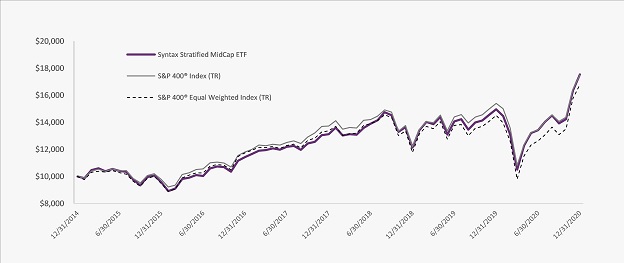
As an index fund, the Syntax Stratified MidCap ETF (the “Fund”) seeks to track the returns (before fees and expenses) of its underlying index – the Syntax Stratified MidCap Index (the “Index”). The Index reweights the constituents of the widely tracked S&P 400® to address the related business risk concentrations that occur in capitalization-weighted indices. Its goal is to deliver an unbiased return that is representative of all the business opportunities in the market, not just the largest ones.
When compared to capitalization-weighted and equal weighted strategies, the Stratified approach may provide the following potential advantages:
- Reduce the negative impact of a significant correction in an overweight sector.
- Increase the chance of participating in all sectors during a market rally.
- Capture a fuller range of market opportunities.
In accordance with its guidelines and procedures, Syntax, LLC (“Syntax” or the “Index Provider”) has contracted with S&P Opco, LLC (a subsidiary of S&P Dow Jones Indices LLC) to calculate and maintain the Index, which is a Stratified WeightTM version of the S&P 400 Index. Unlike the S&P 400 Index, which employs a market capitalization weighted methodology, the Index utilizes a patented investment technology to diversify the same constituents and use the same rebalancing schedule as the S&P 400, the primary difference is the weighting scheme applied. The Fund generally invests in all of the securities comprising the Index in proportion to their weightings in the Index.
Since inception on the close of January 16, 2020 through year-end December 31, 2020, on a net asset value (“NAV”) basis, the Fund returned 17.22%. During the same time period, the Index returned 17.79%. During the year, the Fund fully replicated the components of the Index; therefore, the Fund’s performance, on a NAV basis, differed from the return of the Index primarily due to fees and operating expenses that the Fund incurred during the period.
During this same time period, the S&P 400 Index returned 13.66% and the S&P 400 Equal Weight Index returned 15.77%. The S&P 400 is an unmanaged index weighted by market capitalization based on the average performance of approximately 400 equity securities. The S&P Equal Weight 400 is an unmanaged index and is the equal-weight
version of the S&P 400 Index. It includes the same companies as the S&P 400 Index, but each company is allocated an equal fixed weight of the index at each quarterly rebalance.
Both the S&P 400 Index and the S&P 400 Equal Weight Index were selected as performance comparators for their recognition in the marketplace. Their performance comparison is a useful measure for investors as a broad representation of the U.S. equity market using two different weighting methodologies: capitalization weighting and equal weighting. Both indices also use the same underlying universe as the Index. The performance of the Fund differed from the S&P 400 Index and the S&P 400 Equal Weight Index in part because the Fund seeks to track its Index that employs a Stratified Weight methodology.
Syntax Stratified MidCap ETF (SMDY)
Manager’s Note
| Top 10 Holdings and Portfolio Weights | |
Ciena Corp.
| 1.28% |
Lumentum Holdings, Inc.
| 1.27% |
Coherent, Inc.
| 0.86% |
Yelp, Inc.
| 0.86% |
National Instruments Corp.
| 0.85% |
Sabre Corp.
| 0.84% |
Grubhub, Inc.
| 0.82% |
PTC, Inc.
| 0.81% |
CMC Materials, Inc.
| 0.81% |
MKS Instruments, Inc.
| 0.79% |
| As of December 31, 2020. Holdings subject to change | |
| Sector Breakdown | |
Industrials
| 15.95% |
Healthcare
| 14.56% |
Financials
| 14.07% |
Information Tools
| 14.01% |
Information
| 13.83% |
Consumer Products Services
| 13.75% |
Food
| 6.95% |
Energy
| 6.62% |
Other Assets in Excess of Liabilities
| 0.26% |
| As of December 31, 2020. (% of the Fund’s Net Assets) |
Due to rounding, numbers presented may not add up precisely to the totals provided and percentages may not precisely reflect the absolute figures.
Syntax Stratified MidCap ETF (SMDY)
Manager’s Note
Performance: Growth of $10,000
Performance Return (%) As of December 31, 2020
| | Cumulative | Annualized | Calendar Year |
| | YTD | 4Q20 | 1Y | 3Y | 5Y | Since Fund
Inception | 2015 | 2016 | 2017 | 2018 | 2019 | 2020 |
SMDY NAV (%)
| 17.22 | 26.00 | 17.22 | 10.15 | 12.85 | 9.82 | -4.12 | 19.25 | 14.82 | -7.58 | 23.35 | 17.22 |
SMDY Market Price (%)
| -- | 26.16 | -- | -- | -- | -- | -- | -- | -- | -- | -- | -- |
Syntax Stratified MidCap ETF (TR)
| 17.79 | 26.20 | 17.79 | 10.56 | -- | -- | -- | -- | 15.13 | -7.33 | 23.81 | 17.79 |
S&P 400 Index (TR)
| 13.66 | 24.37 | 13.66 | 8.45 | 12.35 | 9.79 | -2.18 | 20.74 | 16.24 | -11.08 | 26.20 | 13.66 |
S&P 400 Equal Weight Index (TR)
| 15.77 | 28.34 | 15.77 | 7.92 | 12.15 | 9.04 | -5.24 | 23.95 | 13.87 | -11.94 | 23.29 | 15.77 |
Past performance is no guarantee of future results. Performance results do not reflect the deduction of taxes that a shareholder would pay on fund distributions or on the redemption or sale of fund shares. The Growth of $10,000 chart represents a hypothetical investment based upon the historical performance of the Fund. It includes the reinvestment of dividends and capital gains at net asset value: actual returns may differ. Performance reflects contractual reimbursements in effect until May 1, 2021. In the absence of such reimbursements, performance would be reduced. The gross and net expense ratios of the Fund are 0.45% and 0.30%, respectively. Indexes are unmanaged and do not incur fees, expenses, and other costs. Investment return and principal value will fluctuate so that shares, when redeemed, may be worth more or less than their original cost. Current performance may be lower or higher than that shown here. Please see important disclosures relating to Portability of Performance on page 11. A privately offered fund managed by Syntax Advisors, LLC was reorganized into the Syntax Stratified Midcap ETF (“the Fund”) as of January 16, 2020 upon commencement of the ETF operations. For periods prior to the commencement of ETF operations, the Fund’s performance is that of the private fund.
Syntax Stratified SmallCap ETF (SSLY)
Manager’s Note
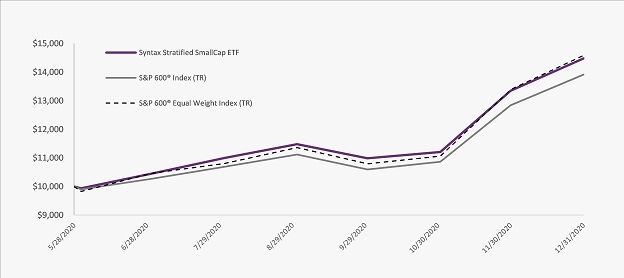
As an index fund, the Syntax Stratified SmallCap ETF (the “Fund”) seeks to track the returns (before fees and expenses) of its underlying index – the Syntax Stratified SmallCap Index (the “Index”). The Index reweights the constituents of the widely tracked S&P 600® to address the related business risk concentrations that occur in capitalization-weighted indices. Its goal is to deliver an unbiased return that is representative of all the business opportunities in the market, not just the largest ones.
When compared to capitalization-weighted and equal weighted strategies, the Stratified approach may provide the following potential advantages:
- Reduce the negative impact of a significant correction in an overweight sector.
- Increase the chance of participating in all sectors during a market rally.
- Capture a fuller range of market opportunities.
In accordance with its guidelines and procedures, Syntax, LLC (“Syntax” or the “Index Provider”) has contracted with S&P Opco, LLC (a subsidiary of S&P Dow Jones Indices LLC) to calculate and maintain the Index, which is a Stratified WeightTM version of the S&P 600 Index. Unlike the S&P 600 Index, which employs a market capitalization weighted methodology, the Index utilizes a patented investment technology to diversify the same constituents and use the same rebalancing schedule as the S&P 600, the primary difference is the weighting scheme applied. The Fund generally invests in all of the securities comprising the Index in proportion to their weightings in the Index.
Since inception on the close of May 28, 2020 through year-end December 31, 2020, on a market price basis, the Fund returned 45.10%. On a net asset value (“NAV”) basis, the Fund returned 44.82%. During the same time period, the Index returned 45.77%. The Fund’s performance, on a NAV basis, differed from the return of the Index due to differences in the securities that were used to seed the Fund, as well as fees and operating expenses.
During this same time period, the S&P 600 Index returned 39.11% and the S&P 600 Equal Weight Index returned 45.85%. The S&P 600 is an unmanaged index weighted by market capitalization based on the average performance of approximately 601 equity securities. The S&P Equal Weight 600 is an unmanaged index and is the equal-weight version of the S&P 600 Index. It includes the same
companies as the S&P 600 Index, but each company is allocated an equal fixed weight of the index at each quarterly rebalance.
Both the S&P 600 Index and the S&P 600 Equal Weight Index were selected as performance comparators for their recognition in the marketplace. Their performance comparison is a useful measure for investors as a broad representation of the U.S. equity market using two different weighting methodologies: capitalization weighting and equal weighting. Both indices also use the same underlying universe as the Index. The performance of the Fund differed from the S&P 600 Index and the S&P 600 Equal Weight Index in part because the Fund seeks to track its Index that employs a Stratified Weight methodology.
Syntax Stratified SmallCap ETF (SSLY)
Manager’s Note
| Top 10 Holdings and Portfolio Weights | |
Liquidity Services, Inc.
| 0.63% |
Covetrus, Inc.
| 0.62% |
Inter Parfums, Inc.
| 0.62% |
PetMed Express, Inc.
| 0.62% |
Shutterstock, Inc.
| 0.61% |
California Water Service Group
| 0.60% |
American States Water Co.
| 0.59% |
Avista Corp.
| 0.59% |
Chesapeake Utilities Corp.
| 0.59% |
Cogent Communications Holdings, Inc.
| 0.59% |
| As of December 31, 2020. Holdings subject to change | |
| Sector Breakdown | |
Information Tools
| 14.77% |
Healthcare
| 14.55% |
Financials
| 14.40% |
Industrials
| 14.28% |
Consumer Products Services
| 14.13% |
Information
| 13.91% |
Food
| 7.11% |
Energy
| 6.66% |
Other Assets in Excess of Liabilities
| 0.19% |
| As of December 31, 2020. (% of the Fund’s Net Assets) |
Due to rounding, numbers presented may not add up precisely to the totals provided and percentages may not precisely reflect the absolute figures.
Syntax Stratified SmallCap ETF (SSLY)
Manager’s Note
Performance: Growth of $10,000
Performance Return (%) As of December 31, 2020
| | YTD | 4Q20 | 1Y | 3Y | 5Y | Since Fund
Inception |
SSLY NAV (%)
| 44.82 | 31.78 | -- | -- | -- | 44.82 |
SSLY Market Price (%)
| 45.10 | 32.03 | -- | -- | -- | 45.10 |
Syntax Stratified SmallCap ETF (TR)
| 45.77 | 31.96 | -- | -- | -- | 45.77 |
S&P 600 Index (TR)
| 39.11 | 31.31 | -- | -- | -- | 39.11 |
S&P 600 Equal Weight Index (TR)
| 45.85 | 35.11 | -- | -- | -- | 45.85 |
Past performance is no guarantee of future results. Performance results do not reflect the deduction of taxes that a shareholder would pay on fund distributions or on the redemption or sale of fund shares. The Growth of $10,000 chart represents a hypothetical investment based upon the historical performance of the Fund. It includes the reinvestment of dividends and capital gains at net asset value: actual returns may differ. Performance reflects contractual reimbursements in effect until May 1, 2021. In the absence of such reimbursements, performance would be reduced. The gross and net expense ratios of the Fund are 0.45% and 0.30%, respectively. Indexes are unmanaged and do not incur fees, expenses, and other costs. Investment return and principal value will fluctuate so that shares, when redeemed, may be worth more or less than their original cost. Current performance may be lower or higher than that shown here. Please see important disclosures on below.Performance data current to the most recent month end is available by calling (866) 972-4492. The Fund is subject to certain risks, including but not limited to, equity securities risk, small-capitalization risk, index tracking risk, passive strategy/index risk, and market trading risk. Investing involves risk, including possible loss of principal.
Syntax Stratified SmallCap ETF (SSLY)
Manager’s Note
Shares are bought and sold at market price (not NAV) and are not individually redeemed from the Fund. Investors may purchase or sell individual shares on an exchange on which they are listed. Market returns are based upon the midpoint of the bid/ask spread at 4:00 p.m. Eastern time (when NAV is normally determined for most ETFs), and do not represent the returns you would receive if you traded shares at other times. Please see the prospectus for more details.
Portability of Performance: A privately offered fund managed by Syntax Advisors, LLC was reorganized into the Syntax Stratified LargeCap ETF (“the Fund”) as of January 2, 2019 upon commencement of the ETF operations. For periods prior to the commencement of ETF operations, the Fund’s performance is that of the private fund. The returns were calculated using the methodology the SEC requires of registered funds. However, since the private fund did not calculate its returns on a per share basis, its returns have been calculated on its total net asset value. While the performance of the private fund is net of all fees and expenses, the performance of the private fund has not been restated to reflect the management and fee waivers applicable to the Fund. The Fund may be subject to higher fees which would negatively impact performance. The private fund began operations on January 1, 2015 and, on January 2, 2019, was reorganized into the Fund. Prior to the reorganization, the private fund had investment objectives, policies and strategies that were, in all material respects, the same as those of the Fund, and was managed in a manner that, in all material respects, complied with the investment guidelines and restrictions of the Fund. However, as a registered investment company, the Fund is subject to certain restrictions under the Investment Company Act of 1940 (the “1940 Act”) and the Internal Revenue Code of 1986 (the “Internal Revenue Code”) which did not apply to the private fund. If the private fund had been subject to the provisions of the 1940 Act and the Internal Revenue Code, its performance could have been adversely affected. However, these restrictions are not expected to have a material effect on the Fund’s investment performance.
Portability of Performance: A privately offered fund managed by Syntax Advisors, LLC was reorganized into the Syntax Stratified MidCap ETF (“the Fund”) as of January 16, 2020 upon commencement of the ETF operations. For periods prior to the commencement of ETF operations, the Fund’s performance is that of the private fund. The returns were calculated using the methodology the SEC requires of registered funds. However, since the private fund did not calculate its returns on a per share basis, its returns have been calculated on its total net asset value. While the performance of the private fund is net of all fees and expenses, the performance of the private fund has not been restated to reflect the management and fee waivers applicable to the Fund. The Fund may be subject to higher fees which would negatively impact performance. The private fund began operations on January 1, 2015 and, on January 16, 2020, was reorganized into the Fund. Prior to the reorganization, the private fund had investment objectives, policies and strategies that were, in all material respects, the same as those of the Fund, and was managed in a manner that, in all material respects, complied with the investment guidelines and restrictions of the Fund. However, as a registered investment company, the Fund is subject to certain restrictions under the Investment Company Act of 1940 (the “1940 Act”) and the Internal Revenue Code of 1986 (the “Internal Revenue Code”) which did not apply to the private fund. If the private fund had been subject to the provisions of the 1940 Act and the Internal Revenue Code, its performance could have been adversely affected. However, these restrictions are not expected to have a material effect on the Fund’s investment performance.
The Syntax Stratified LargeCap Index, Syntax Stratified MidCap Index, and Syntax Stratified SmallCap Index™ (“the Indices”) are the property of Syntax, LLC, which has contracted with S&P Opco, LLC (a subsidiary of S&P Dow Jones Indices LLC) to calculate and maintain the Indices. The Indices are not sponsored by S&P Dow Jones Indices or its affiliates or its third-party licensors (collectively, “S&P Dow Jones Indices”). S&P Dow Jones Indices will not be liable for any errors or omissions in calculating the Index. “Calculated by S&P Dow Jones Indices” and the related stylized mark(s) are service marks of S&P Dow Jones Indices and have been licensed for use by Syntax, LLC, the parent company of Syntax Advisors, LLC. S&P® is a registered trademark of Standard & Poor’s Financial Services LLC (“SPFS”), and Dow Jones® is a registered trademark of Dow Jones Trademark Holdings LLC (“Dow Jones”).
The Syntax Stratified LargeCap Index, Syntax Stratified MidCap Index, and Syntax Stratified SmallCap Index™ are the property of Syntax, LLC, the Fund’s index provider. Syntax®, Stratified®, Stratified Indices®, Stratified Weight™, and FIS™ are trademarks or registered trademarks of Locus LP. Performance of an index is not illustrative of any particular investment. It is not possible to invest directly in an index.
This report is submitted for the general information of the shareholders of the Funds. It is not authorized for distribution to prospective investors unless preceded or accompanied by an effective prospectus, which includes information regarding the Funds’ risks, objectives, fees and expenses, experience of its management, and other information.
This report is only intended for the recipient it is addressed and delivered to by Syntax Advisors, LLC and may not be redistributed without prior written consent. The report is provided for informational purposes and is not intended to be, nor should it be construed or used as an offer to sell, or a solicitation of any offer to buy shares or limited partnership interests in any funds managed by Syntax Advisors, LLC. These securities shall not be offered or sold in any jurisdiction in which such offer, solicitation or sale would be unlawful until the requirements of the laws of such jurisdiction have been satisfied. If any offer is made, it shall be pursuant to the offering documents prepared by or on behalf of a specific fund which contains detailed information concerning the investment terms and the risks, fees and expenses associated with an investment in that fund. In the case of any inconsistency between the descriptions or terms in this document and the offering documents, the offering documents shall control.
Index performance does not represent actual fund or portfolio performance and such performance does not reflect the actual investment experience of any investor. An investor cannot invest directly in an index. In addition, the results actual investors might have achieved would have differed from those shown because of differences in the timing, amounts of their investments, and fees and expenses associated with an investment in a portfolio invested in accordance with an index. None of the Syntax Indices or the benchmark indices portrayed herein charge management fees or incur brokerage expenses, and no such fees or expenses were deducted from the performance shown; provided, however, that the returns of any investment portfolio invested in accordance with such indices would be net of such fees and expenses. Additionally, none of these indices lend securities, and no revenues from securities lending were added to the performance shown.
THESE MATERIALS DO NOT CONSTITUTE AN OFFER OR SOLICITATION TO BUY ANY SECURITIES OR TO PARTICIPATE IN ANY PARTICULAR TRADING STRATEGY.
Syntax Stratified LargeCap ETF
Schedule of Investments
December 31, 2020
| Security Description | Shares | Value |
| COMMON STOCK—99.8% | | |
3M Co.
| 350 | $61,177 |
A O Smith Corp.
| 950 | 52,079 |
Abbott Laboratories
| 1,333 | 145,950 |
AbbVie, Inc.
| 618 | 66,219 |
ABIOMED, Inc.(a)
| 84 | 27,233 |
Accenture PLC, Class A
| 193 | 50,414 |
Activision Blizzard, Inc.
| 1,705 | 158,309 |
Adobe, Inc.(a)
| 599 | 299,572 |
Advance Auto Parts, Inc.
| 406 | 63,949 |
Advanced Micro Devices, Inc.(a)
| 519 | 47,597 |
AES Corp.
| 10,116 | 237,726 |
Aflac, Inc.
| 1,589 | 70,663 |
Agilent Technologies, Inc.
| 601 | 71,212 |
Air Products and Chemicals, Inc.
| 75 | 20,492 |
Akamai Technologies, Inc.(a)
| 1,378 | 144,676 |
Alaska Air Group, Inc.
| 1,285 | 66,820 |
Albemarle Corp.
| 147 | 21,685 |
Alexandria Real Estate Equities, Inc., REIT
| 205 | 36,535 |
Alexion Pharmaceuticals, Inc.(a)
| 545 | 85,151 |
Align Technology, Inc.(a)
| 103 | 55,041 |
Allegion PLC
| 327 | 38,056 |
Alliant Energy Corp.
| 691 | 35,607 |
Allstate Corp.
| 685 | 75,302 |
Alphabet, Inc., Class A(a)
| 53 | 92,890 |
Alphabet, Inc., Class C(a)
| 53 | 92,850 |
Altria Group, Inc.
| 3,732 | 153,012 |
Amazon.com, Inc.(a)
| 22 | 71,652 |
Amcor PLC
| 3,116 | 36,675 |
Ameren Corp.
| 461 | 35,986 |
American Airlines Group, Inc.
| 3,768 | 59,421 |
American Electric Power Co., Inc.
| 1,293 | 107,668 |
American Express Co.
| 158 | 19,104 |
American International Group, Inc.
| 2,757 | 104,380 |
American Tower Corp., REIT
| 110 | 24,691 |
American Water Works Co., Inc.
| 963 | 147,792 |
Ameriprise Financial, Inc.
| 211 | 41,004 |
AmerisourceBergen Corp.
| 1,091 | 106,656 |
AMETEK, Inc.
| 302 | 36,524 |
Amgen, Inc.
| 288 | 66,217 |
Amphenol Corp., Class A
| 611 | 79,900 |
Analog Devices, Inc.
| 1,009 | 149,060 |
ANSYS, Inc.(a)
| 852 | 309,958 |
Anthem, Inc.
| 364 | 116,877 |
Aon PLC, Class A
| 94 | 19,859 |
Apache Corp.
| 1,480 | 21,001 |
Apple, Inc.
| 1,163 | 154,318 |
Applied Materials, Inc.
| 807 | 69,644 |
Aptiv PLC
| 1,313 | 171,071 |
Archer-Daniels-Midland Co.
| 4,293 | 216,410 |
Arista Networks, Inc.(a)
| 388 | 112,741 |
Arthur J Gallagher & Co.
| 159 | 19,670 |
| Security Description | Shares | Value |
Assurant, Inc.
| 537 | $73,150 |
AT&T, Inc.
| 3,453 | 99,308 |
Atmos Energy Corp.
| 1,441 | 137,515 |
Autodesk, Inc.(a)
| 1,022 | 312,057 |
Automatic Data Processing, Inc.
| 364 | 64,137 |
AutoZone, Inc.(a)
| 54 | 64,014 |
AvalonBay Communities, Inc., REIT
| 377 | 60,482 |
Avery Dennison Corp.
| 180 | 27,920 |
Baker Hughes Co.
| 4,720 | 98,412 |
Ball Corp.
| 385 | 35,874 |
Bank of America Corp.
| 1,872 | 56,740 |
Bank of New York Mellon Corp.
| 1,180 | 50,079 |
Baxter International, Inc.
| 269 | 21,585 |
Becton Dickinson and Co.
| 87 | 21,769 |
Berkshire Hathaway, Inc., Class B(a)
| 947 | 219,581 |
Best Buy Co., Inc.
| 1,065 | 106,276 |
Biogen, Inc.(a)
| 274 | 67,092 |
Bio-Rad Laboratories, Inc., Class A(a)
| 93 | 54,213 |
BlackRock, Inc.
| 61 | 44,014 |
Boeing Co.
| 312 | 66,787 |
Booking Holdings, Inc.(a)
| 48 | 106,909 |
BorgWarner, Inc.
| 4,391 | 169,668 |
Boston Properties, Inc., REIT
| 359 | 33,936 |
Boston Scientific Corp.(a)
| 1,593 | 57,268 |
Bristol-Myers Squibb Co.
| 1,085 | 67,303 |
Broadcom, Inc.
| 234 | 102,457 |
Broadridge Financial Solutions, Inc.
| 320 | 49,024 |
Brown-Forman Corp., Class B
| 1,402 | 111,361 |
Cabot Oil & Gas Corp.
| 6,291 | 102,417 |
Cadence Design Systems, Inc.(a)
| 1,205 | 164,398 |
Campbell Soup Co.
| 1,941 | 93,847 |
Capital One Financial Corp.
| 1,546 | 152,822 |
Cardinal Health, Inc.
| 1,972 | 105,620 |
CarMax, Inc.(a)
| 684 | 64,611 |
Carnival Corp.
| 1,674 | 36,259 |
Carrier Global Corp.
| 960 | 36,211 |
Catalent, Inc.(a)
| 1,499 | 156,001 |
Caterpillar, Inc.
| 396 | 72,080 |
Cboe Global Markets, Inc.
| 221 | 20,580 |
CBRE Group, Inc., Class A(a)
| 288 | 18,063 |
CDW Corp.
| 349 | 45,995 |
Celanese Corp.
| 216 | 28,067 |
Centene Corp.(a)
| 1,881 | 112,916 |
CenterPoint Energy, Inc.
| 4,922 | 106,512 |
CenturyLink, Inc.
| 13,986 | 136,363 |
Cerner Corp.
| 638 | 50,070 |
CF Industries Holdings, Inc.
| 906 | 35,071 |
CH Robinson Worldwide, Inc.
| 381 | 35,764 |
Charles Schwab Corp.
| 2,166 | 114,885 |
Charter Communications, Inc., Class A(a)
| 219 | 144,879 |
Chevron Corp.
| 3,474 | 293,379 |
Chipotle Mexican Grill, Inc.(a)
| 166 | 230,194 |
See accompanying notes to financial statements.
Syntax Stratified LargeCap ETF
Schedule of Investments (continued)
December 31, 2020
| Security Description | Shares | Value |
Chubb Ltd.
| 556 | $85,580 |
Church & Dwight Co., Inc.
| 2,493 | 217,464 |
Cigna Corp.
| 545 | 113,458 |
Cincinnati Financial Corp.
| 1,065 | 93,049 |
Cintas Corp.
| 229 | 80,942 |
Cisco Systems, Inc.
| 2,414 | 108,026 |
Citigroup, Inc.
| 907 | 55,926 |
Citizens Financial Group, Inc.
| 671 | 23,995 |
Citrix Systems, Inc.
| 487 | 63,359 |
Clorox Co.
| 1,062 | 214,439 |
CME Group, Inc.
| 108 | 19,661 |
CMS Energy Corp.
| 601 | 36,667 |
Coca-Cola Co.
| 3,007 | 164,904 |
Cognizant Technology Solutions Corp., Class A
| 605 | 49,580 |
Colgate-Palmolive Co.
| 2,528 | 216,169 |
Comcast Corp., Class A
| 2,801 | 146,772 |
Comerica, Inc.
| 1,624 | 90,717 |
Conagra Brands, Inc.
| 2,594 | 94,058 |
Concho Resources, Inc.
| 374 | 21,823 |
ConocoPhillips
| 546 | 21,835 |
Consolidated Edison, Inc.
| 1,462 | 105,659 |
Constellation Brands, Inc., Class A
| 522 | 114,344 |
Cooper Companies, Inc.
| 160 | 58,131 |
Copart, Inc.(a)
| 810 | 103,073 |
Corning, Inc.
| 2,250 | 81,000 |
Corteva, Inc.
| 928 | 35,932 |
Costco Wholesale Corp.
| 854 | 321,770 |
Crown Castle International Corp., REIT
| 151 | 24,038 |
CSX Corp.
| 295 | 26,771 |
Cummins, Inc.
| 161 | 36,563 |
CVS Health Corp.
| 3,987 | 272,312 |
Danaher Corp.
| 237 | 52,647 |
Darden Restaurants, Inc.
| 1,899 | 226,209 |
DaVita, Inc.(a)
| 437 | 51,304 |
Deere & Co.
| 278 | 74,796 |
Delta Air Lines, Inc.
| 1,537 | 61,803 |
DENTSPLY SIRONA, Inc.
| 406 | 21,258 |
Devon Energy Corp.
| 6,621 | 104,678 |
DexCom, Inc.(a)
| 153 | 56,567 |
Diamondback Energy, Inc.
| 474 | 22,942 |
Digital Realty Trust, Inc., REIT
| 1,093 | 152,484 |
Discover Financial Services
| 1,710 | 154,806 |
Discovery, Inc., Class A(a)
| 1,477 | 44,443 |
Discovery, Inc., Class C(a)
| 1,679 | 43,973 |
DISH Network Corp., Class A(a)
| 2,972 | 96,114 |
Dollar General Corp.
| 343 | 72,133 |
Dollar Tree, Inc.(a)
| 667 | 72,063 |
Dominion Energy, Inc.
| 1,430 | 107,536 |
Domino's Pizza, Inc.
| 559 | 214,354 |
Dover Corp.
| 503 | 63,504 |
Dow, Inc.
| 530 | 29,415 |
| Security Description | Shares | Value |
DR Horton, Inc.
| 1,530 | $105,448 |
DTE Energy Co.
| 853 | 103,563 |
Duke Energy Corp.
| 390 | 35,708 |
Duke Realty Corp., REIT
| 620 | 24,781 |
DuPont de Nemours, Inc.
| 305 | 21,689 |
DXC Technology Co.
| 1,986 | 51,140 |
Eastman Chemical Co.
| 201 | 20,156 |
Eaton Corp. PLC
| 694 | 83,377 |
eBay, Inc.
| 1,291 | 64,873 |
Ecolab, Inc.
| 93 | 20,121 |
Edison International
| 1,703 | 106,982 |
Edwards Lifesciences Corp.(a)
| 636 | 58,022 |
Electronic Arts, Inc.
| 1,053 | 151,211 |
Eli Lilly and Co.
| 413 | 69,731 |
Emerson Electric Co.
| 160 | 12,859 |
Entergy Corp.
| 1,040 | 103,834 |
EOG Resources, Inc.
| 446 | 22,242 |
Equifax, Inc.
| 154 | 29,697 |
Equinix, Inc., REIT
| 205 | 146,407 |
Equity Residential, REIT
| 1,038 | 61,533 |
Essex Property Trust, Inc., REIT
| 250 | 59,355 |
Estee Lauder Companies, Inc., Class A
| 873 | 232,384 |
Etsy, Inc.(a)
| 372 | 66,183 |
Everest Re Group Ltd.
| 370 | 86,613 |
Evergy, Inc.
| 647 | 35,915 |
Eversource Energy
| 414 | 35,815 |
Exelon Corp.
| 5,196 | 219,375 |
Expedia Group, Inc.
| 772 | 102,213 |
Expeditors International of Washington, Inc.
| 395 | 37,568 |
Extra Space Storage, Inc., REIT
| 553 | 64,071 |
Exxon Mobil Corp.
| 7,331 | 302,184 |
F5 Networks, Inc.(a)
| 621 | 109,259 |
Facebook, Inc., Class A(a)
| 697 | 190,393 |
Fastenal Co.
| 933 | 45,558 |
Federal Realty Investment Trust, REIT
| 317 | 26,983 |
FedEx Corp.
| 122 | 31,674 |
Fidelity National Information Services, Inc.
| 162 | 22,917 |
Fifth Third Bancorp
| 871 | 24,013 |
First Republic Bank
| 659 | 96,827 |
FirstEnergy Corp.
| 3,521 | 107,778 |
Fiserv, Inc.(a)
| 206 | 23,455 |
FleetCor Technologies, Inc.(a)
| 70 | 19,098 |
FLIR Systems, Inc.
| 3,834 | 168,044 |
Flowserve Corp.
| 1,731 | 63,787 |
FMC Corp.
| 305 | 35,054 |
Ford Motor Co.
| 11,859 | 104,241 |
Fortinet, Inc.(a)
| 495 | 73,522 |
Fortive Corp.
| 194 | 13,739 |
Fortune Brands Home & Security, Inc.
| 641 | 54,947 |
Fox Corp., Class A
| 1,462 | 42,573 |
Fox Corp., Class B(a)
| 1,491 | 43,060 |
Franklin Resources, Inc.
| 1,673 | 41,808 |
See accompanying notes to financial statements.
Syntax Stratified LargeCap ETF
Schedule of Investments (continued)
December 31, 2020
| Security Description | Shares | Value |
Freeport-McMoRan, Inc.
| 5,795 | $150,786 |
Gap, Inc.
| 4,104 | 82,860 |
Garmin Ltd.
| 1,197 | 143,233 |
Gartner, Inc.(a)
| 309 | 49,499 |
General Dynamics Corp.
| 473 | 70,392 |
General Electric Co.
| 5,477 | 59,152 |
General Mills, Inc.
| 1,545 | 90,846 |
General Motors Co.
| 2,550 | 106,182 |
Genuine Parts Co.
| 471 | 47,303 |
Gilead Sciences, Inc.
| 1,082 | 63,037 |
Global Payments, Inc.
| 101 | 21,757 |
Globe Life, Inc.
| 761 | 72,265 |
Goldman Sachs Group, Inc.
| 447 | 117,878 |
Halliburton Co.
| 3,598 | 68,002 |
Hanesbrands, Inc.
| 6,137 | 89,477 |
Hartford Financial Services Group, Inc.
| 2,317 | 113,487 |
Hasbro, Inc.
| 901 | 84,280 |
HCA Healthcare, Inc.
| 606 | 99,663 |
Healthpeak Properties, Inc., REIT
| 3,243 | 98,036 |
Henry Schein, Inc.(a)
| 1,529 | 102,229 |
Hershey Co.
| 540 | 82,258 |
Hess Corp.
| 420 | 22,172 |
Hewlett Packard Enterprise Co.
| 8,923 | 105,738 |
Hilton Worldwide Holdings, Inc.
| 455 | 50,623 |
HollyFrontier Corp.
| 5,838 | 150,912 |
Hologic, Inc.(a)
| 721 | 52,510 |
Home Depot, Inc.
| 404 | 107,310 |
Honeywell International, Inc.
| 285 | 60,620 |
Hormel Foods Corp.
| 4,530 | 211,143 |
Host Hotels & Resorts, Inc., REIT
| 3,276 | 47,928 |
Howmet Aerospace, Inc.
| 1,348 | 38,472 |
HP, Inc.
| 9,258 | 227,654 |
Humana, Inc.
| 291 | 119,389 |
Huntington Bancshares, Inc.
| 1,838 | 23,214 |
Huntington Ingalls Industries, Inc.
| 401 | 68,362 |
IDEX Corp.
| 331 | 65,935 |
IDEXX Laboratories, Inc.(a)
| 118 | 58,985 |
IHS Markit Ltd.
| 531 | 47,700 |
Illinois Tool Works, Inc.
| 300 | 61,164 |
Illumina, Inc.(a)
| 210 | 77,700 |
Incyte Corp.(a)
| 810 | 70,454 |
Ingersoll Rand, Inc.(a)
| 1,446 | 65,880 |
Intel Corp.
| 956 | 47,628 |
Intercontinental Exchange, Inc.
| 173 | 19,945 |
International Business Machines Corp.
| 382 | 48,086 |
International Flavors & Fragrances, Inc.
| 184 | 20,027 |
International Paper Co.
| 550 | 27,346 |
Interpublic Group of Companies, Inc.
| 1,986 | 46,711 |
Intuit, Inc.
| 173 | 65,714 |
Intuitive Surgical, Inc.(a)
| 27 | 22,089 |
Invesco Ltd.
| 2,282 | 39,775 |
IPG Photonics Corp.(a)
| 66 | 14,770 |
| Security Description | Shares | Value |
IQVIA Holdings, Inc.(a)
| 424 | $75,968 |
Iron Mountain, Inc., REIT
| 785 | 23,142 |
J M Smucker Co.
| 795 | 91,902 |
Jack Henry & Associates, Inc.
| 153 | 24,784 |
Jacobs Engineering Group, Inc.
| 1,477 | 160,934 |
JB Hunt Transport Services, Inc.
| 255 | 34,846 |
Johnson & Johnson
| 935 | 147,150 |
Johnson Controls International PLC
| 1,344 | 62,617 |
JPMorgan Chase & Co.
| 449 | 57,054 |
Juniper Networks, Inc.
| 4,882 | 109,894 |
Kansas City Southern
| 136 | 27,762 |
Kellogg Co.
| 1,292 | 80,401 |
KeyCorp
| 1,500 | 24,615 |
Keysight Technologies, Inc.(a)
| 283 | 37,381 |
Kimberly-Clark Corp.
| 1,573 | 212,088 |
Kimco Realty Corp., REIT
| 1,933 | 29,014 |
Kinder Morgan, Inc.
| 9,675 | 132,257 |
KLA Corp.
| 276 | 71,459 |
Kraft Heinz Co.
| 2,693 | 93,339 |
Kroger Co.
| 10,239 | 325,191 |
L Brands, Inc.
| 2,160 | 80,330 |
L3Harris Technologies, Inc.
| 846 | 159,911 |
Laboratory Corp. of America Holdings(a)
| 234 | 47,631 |
Lam Research Corp.
| 144 | 68,007 |
Lamb Weston Holdings, Inc.
| 1,188 | 93,543 |
Las Vegas Sands Corp.
| 839 | 50,004 |
Leggett & Platt, Inc.
| 1,298 | 57,501 |
Leidos Holdings, Inc.
| 453 | 47,619 |
Lennar Corp., Class A
| 1,472 | 112,211 |
Lincoln National Corp.
| 1,388 | 69,830 |
Linde PLC(a)
| 80 | 21,081 |
Live Nation Entertainment, Inc.(a)
| 504 | 37,034 |
LKQ Corp.(a)
| 1,748 | 61,600 |
Lockheed Martin Corp.
| 195 | 69,221 |
Loews Corp.
| 4,899 | 220,553 |
Lowe's Companies, Inc.
| 676 | 108,505 |
LyondellBasell Industries N.V., Class A
| 323 | 29,606 |
M&T Bank Corp.
| 187 | 23,805 |
Marathon Oil Corp.
| 3,369 | 22,471 |
Marathon Petroleum Corp.
| 3,740 | 154,686 |
MarketAxess Holdings, Inc.
| 36 | 20,540 |
Marriott International, Inc., Class A
| 372 | 49,074 |
Marsh & McLennan Companies, Inc.
| 166 | 19,422 |
Martin Marietta Materials, Inc.
| 265 | 75,252 |
Masco Corp.
| 986 | 54,161 |
Mastercard, Inc., Class A
| 60 | 21,416 |
Maxim Integrated Products, Inc.
| 1,694 | 150,173 |
McCormick & Co., Inc.
| 982 | 93,879 |
McDonald's Corp.
| 1,031 | 221,232 |
McKesson Corp.
| 613 | 106,613 |
Medtronic PLC
| 190 | 22,257 |
Merck & Co., Inc.
| 792 | 64,786 |
See accompanying notes to financial statements.
Syntax Stratified LargeCap ETF
Schedule of Investments (continued)
December 31, 2020
| Security Description | Shares | Value |
MetLife, Inc.
| 1,512 | $70,988 |
Mettler-Toledo International, Inc.(a)
| 13 | 14,816 |
MGM Resorts International
| 1,576 | 49,660 |
Microchip Technology, Inc.
| 338 | 46,681 |
Micron Technology, Inc.(a)
| 674 | 50,671 |
Microsoft Corp.
| 1,338 | 297,598 |
Mid-America Apartment Communities, Inc., REIT
| 503 | 63,725 |
Mohawk Industries, Inc.(a)
| 395 | 55,675 |
Molson Coors Beverage Co., Class B
| 2,261 | 102,175 |
Mondelez International, Inc., Class A
| 1,399 | 81,800 |
Monster Beverage Corp.(a)
| 1,825 | 168,776 |
Moody's Corp.
| 103 | 29,895 |
Morgan Stanley
| 1,691 | 115,884 |
Mosaic Co.
| 1,606 | 36,954 |
Motorola Solutions, Inc.
| 846 | 143,871 |
MSCI, Inc.
| 67 | 29,918 |
Nasdaq, Inc.
| 151 | 20,044 |
NetApp, Inc.
| 1,729 | 114,529 |
Netflix, Inc.(a)
| 191 | 103,279 |
Newell Brands, Inc.
| 3,915 | 83,115 |
Newmont Corp.
| 2,421 | 144,994 |
News Corp., Class A
| 2,382 | 42,805 |
News Corp., Class B
| 2,396 | 42,577 |
NextEra Energy, Inc.
| 1,449 | 111,790 |
Nielsen Holdings PLC
| 2,490 | 51,966 |
NIKE, Inc., Class B
| 624 | 88,277 |
NiSource, Inc.
| 6,230 | 142,916 |
Norfolk Southern Corp.
| 115 | 27,325 |
Northern Trust Corp.
| 453 | 42,192 |
Northrop Grumman Corp.
| 239 | 72,828 |
NortonLifeLock, Inc.
| 3,234 | 67,203 |
Norwegian Cruise Line Holdings Ltd.(a)
| 1,347 | 34,254 |
NOV, Inc.
| 7,467 | 102,522 |
NRG Energy, Inc.
| 6,445 | 242,010 |
Nucor Corp.
| 2,520 | 134,039 |
NVIDIA Corp.
| 92 | 48,042 |
NVR, Inc.(a)
| 29 | 118,316 |
Occidental Petroleum Corp.
| 1,140 | 19,733 |
Old Dominion Freight Line, Inc.
| 179 | 34,937 |
Omnicom Group, Inc.
| 737 | 45,967 |
ONEOK, Inc.
| 3,434 | 131,797 |
Oracle Corp.
| 1,048 | 67,795 |
O'Reilly Automotive, Inc.(a)
| 144 | 65,170 |
Otis Worldwide Corp.
| 558 | 37,693 |
PACCAR, Inc.
| 835 | 72,044 |
Packaging Corp. of America
| 195 | 26,892 |
Parker-Hannifin Corp.
| 130 | 35,413 |
Paychex, Inc.
| 688 | 64,108 |
Paycom Software, Inc.(a)
| 150 | 67,838 |
PayPal Holdings, Inc.(a)
| 112 | 26,230 |
Pentair PLC
| 1,247 | 66,203 |
| Security Description | Shares | Value |
People's United Financial, Inc.
| 6,566 | $84,898 |
PepsiCo, Inc.
| 555 | 82,307 |
PerkinElmer, Inc.
| 486 | 69,741 |
Perrigo Co. PLC
| 4,477 | 200,211 |
Pfizer, Inc.
| 1,600 | 58,896 |
Philip Morris International, Inc.
| 1,888 | 156,308 |
Phillips 66
| 2,307 | 161,352 |
Pinnacle West Capital Corp.
| 445 | 35,578 |
Pioneer Natural Resources Co.
| 205 | 23,347 |
PNC Financial Services Group, Inc.
| 164 | 24,436 |
Pool Corp.
| 136 | 50,660 |
PPG Industries, Inc.
| 199 | 28,700 |
PPL Corp.
| 1,270 | 35,814 |
Principal Financial Group, Inc.
| 836 | 41,474 |
Procter & Gamble Co.
| 1,568 | 218,172 |
Progressive Corp.
| 753 | 74,457 |
Prologis, Inc., REIT
| 243 | 24,217 |
Prudential Financial, Inc.
| 906 | 70,731 |
Public Service Enterprise Group, Inc.
| 1,892 | 110,304 |
Public Storage, REIT
| 278 | 64,199 |
PulteGroup, Inc.
| 2,525 | 108,878 |
PVH Corp.
| 906 | 85,064 |
Qorvo, Inc.(a)
| 624 | 103,752 |
QUALCOMM, Inc.
| 657 | 100,087 |
Quanta Services, Inc.
| 2,225 | 160,244 |
Quest Diagnostics, Inc.
| 392 | 46,715 |
Ralph Lauren Corp.
| 844 | 87,557 |
Raymond James Financial, Inc.
| 1,157 | 110,690 |
Raytheon Technologies Corp.
| 840 | 60,068 |
Realty Income Corp., REIT
| 470 | 29,220 |
Regency Centers Corp., REIT
| 608 | 27,719 |
Regeneron Pharmaceuticals, Inc.(a)
| 138 | 66,669 |
Regions Financial Corp.
| 1,528 | 24,631 |
Republic Services, Inc.
| 846 | 81,470 |
ResMed, Inc.
| 262 | 55,691 |
Robert Half International, Inc.
| 739 | 46,173 |
Rockwell Automation, Inc.
| 56 | 14,045 |
Rollins, Inc.
| 2,185 | 85,368 |
Roper Technologies, Inc.
| 32 | 13,795 |
Ross Stores, Inc.
| 1,893 | 232,479 |
Royal Caribbean Cruises Ltd.
| 468 | 34,955 |
S&P Global, Inc.
| 90 | 29,586 |
salesforce.com, Inc.(a)
| 286 | 63,644 |
SBA Communications Corp., REIT
| 87 | 24,545 |
Schlumberger N.V.
| 3,112 | 67,935 |
Seagate Technology PLC
| 1,652 | 102,688 |
Sealed Air Corp.
| 797 | 36,495 |
Sempra Energy
| 278 | 35,420 |
ServiceNow, Inc.(a)
| 119 | 65,501 |
Sherwin-Williams Co.
| 38 | 27,927 |
Simon Property Group, Inc., REIT
| 327 | 27,887 |
Skyworks Solutions, Inc.
| 1,025 | 156,702 |
See accompanying notes to financial statements.
Syntax Stratified LargeCap ETF
Schedule of Investments (continued)
December 31, 2020
| Security Description | Shares | Value |
SL Green Realty Corp., REIT
| 600 | $35,748 |
Snap-on, Inc.
| 444 | 75,986 |
Southern Co.
| 588 | 36,121 |
Southwest Airlines Co.
| 1,399 | 65,207 |
Stanley Black & Decker, Inc.
| 457 | 81,602 |
Starbucks Corp.
| 2,076 | 222,090 |
State Street Corp.
| 653 | 47,525 |
STERIS PLC
| 117 | 22,176 |
Stryker Corp.
| 231 | 56,604 |
SVB Financial Group(a)
| 243 | 94,243 |
Synchrony Financial
| 4,421 | 153,453 |
Synopsys, Inc.(a)
| 604 | 156,581 |
Sysco Corp.
| 4,230 | 314,120 |
T Rowe Price Group, Inc.
| 268 | 40,573 |
Take-Two Interactive Software, Inc.(a)
| 749 | 155,635 |
Tapestry, Inc.
| 2,919 | 90,723 |
Target Corp.
| 415 | 73,260 |
TE Connectivity Ltd.
| 678 | 82,085 |
TechnipFMC PLC
| 7,375 | 69,325 |
Teledyne Technologies, Inc.(a)
| 36 | 14,111 |
Teleflex, Inc.
| 57 | 23,459 |
Teradyne, Inc.
| 620 | 74,332 |
Tesla, Inc.(a)
| 175 | 123,492 |
Texas Instruments, Inc.
| 889 | 145,912 |
Textron, Inc.
| 1,499 | 72,447 |
Thermo Fisher Scientific, Inc.
| 152 | 70,799 |
Tiffany & Co.
| 653 | 85,837 |
TJX Companies, Inc.
| 3,236 | 220,986 |
T-Mobile US, Inc.(a)
| 816 | 110,038 |
Tractor Supply Co.
| 331 | 46,532 |
Trane Technologies PLC
| 254 | 36,871 |
TransDigm Group, Inc.(a)
| 57 | 35,274 |
Travelers Companies, Inc.
| 635 | 89,135 |
Truist Financial Corp.
| 504 | 24,157 |
Twitter, Inc.(a)
| 3,698 | 200,247 |
Tyler Technologies, Inc.(a)
| 143 | 62,422 |
Tyson Foods, Inc., Class A
| 3,091 | 199,184 |
UDR, Inc., REIT
| 1,606 | 61,719 |
Ulta Beauty, Inc.(a)
| 403 | 115,725 |
Under Armour, Inc., Class A(a)
| 2,493 | 42,805 |
Under Armour, Inc., Class C(a)
| 2,835 | 42,185 |
Union Pacific Corp.
| 130 | 27,069 |
United Airlines Holdings, Inc.(a)
| 1,329 | 57,479 |
United Parcel Service, Inc., Class B
| 210 | 35,364 |
United Rentals, Inc.(a)
| 190 | 44,063 |
UnitedHealth Group, Inc.
| 338 | 118,530 |
Universal Health Services, Inc., Class B
| 717 | 98,588 |
Unum Group
| 3,065 | 70,311 |
US Bancorp
| 517 | 24,087 |
Valero Energy Corp.
| 2,719 | 153,814 |
Varian Medical Systems, Inc.(a)
| 125 | 21,876 |
| Security Description | Shares | Value |
Ventas, Inc., REIT
| 1,938 | $95,040 |
VeriSign, Inc.(a)
| 678 | 146,719 |
Verisk Analytics, Inc.
| 148 | 30,723 |
Verizon Communications, Inc.
| 1,772 | 104,105 |
Vertex Pharmaceuticals, Inc.(a)
| 292 | 69,011 |
VF Corp.
| 987 | 84,300 |
ViacomCBS, Inc., Class B
| 2,402 | 89,499 |
Viatris, Inc.(a)
| 12,340 | 231,252 |
Visa, Inc., Class A
| 93 | 20,342 |
Vontier Corp.(a)
| 428 | 14,295 |
Vornado Realty Trust, REIT
| 919 | 34,315 |
Vulcan Materials Co.
| 515 | 76,380 |
W R Berkley Corp.
| 1,320 | 87,674 |
Walgreens Boots Alliance, Inc.
| 6,870 | 273,976 |
Walmart, Inc.
| 2,184 | 314,824 |
Walt Disney Co.(a)
| 487 | 88,235 |
Waste Management, Inc.
| 696 | 82,079 |
Waters Corp.(a)
| 298 | 73,731 |
WEC Energy Group, Inc.
| 386 | 35,524 |
Wells Fargo & Co.
| 1,837 | 55,441 |
Welltower, Inc., REIT
| 739 | 47,754 |
West Pharmaceutical Services, Inc.
| 83 | 23,515 |
Western Digital Corp.
| 2,095 | 116,042 |
Western Union Co.
| 2,866 | 62,880 |
Westinghouse Air Brake Technologies Corp.
| 478 | 34,990 |
Westrock Co.
| 616 | 26,814 |
Weyerhaeuser Co., REIT
| 2,229 | 74,738 |
Whirlpool Corp.
| 292 | 52,703 |
Williams Companies, Inc.
| 6,507 | 130,465 |
Willis Towers Watson PLC
| 92 | 19,383 |
WW Grainger, Inc.
| 111 | 45,326 |
Wynn Resorts Ltd.
| 430 | 48,517 |
Xcel Energy, Inc.
| 551 | 36,735 |
Xerox Holdings Corp.
| 9,400 | 217,986 |
Xilinx, Inc.
| 330 | 46,784 |
Xylem, Inc.
| 654 | 66,571 |
Yum! Brands, Inc.
| 2,017 | 218,966 |
Zebra Technologies Corp., Class A(a)
| 95 | 36,511 |
Zimmer Biomet Holdings, Inc.
| 377 | 58,092 |
Zions Bancorp NA
| 2,055 | 89,269 |
Zoetis, Inc.
| 410 | 67,855 |
INVESTMENTS IN
COMMON STOCK—99.8%
(Cost $33,789,937)
| | 41,890,187 |
OTHER ASSETS IN EXCESS OF LIABILITIES—0.2%
| | 98,878 |
NET ASSETS—100.0%
| | $41,989,065 |
| (a) | Non-income producing security. |
| PLC=Public Limited Company |
| REIT=Real Estate Investment Trust |
See accompanying notes to financial statements.
Syntax Stratified LargeCap ETF
Schedule of Investments (continued)
December 31, 2020
INDUSTRY BREAKDOWN
AS OF December 31, 2020*
| INDUSTRY | PERCENTAGE OF
NET ASSETS |
Business Software for Specific Uses
| 3.5% |
Electric Competitive
| 3.2 |
Restaurants
| 3.2 |
Branded Pharmaceuticals
| 3.1 |
Processed Foods
| 3.1 |
Food Distributors
| 3.0 |
Downstream
| 2.9 |
Consumer Insurance
| 2.2 |
Content Providers
| 2.2 |
End User Hardware
| 2.1 |
Operators and Developers
| 2.1 |
Commercial Insurance
| 2.1 |
Commercial Hardware
| 2.1 |
Rental
| 2.1 |
Electric Regulated
| 2.0 |
Telecommunication Networks
| 2.0 |
Upstream Energy
| 1.9 |
Non Real Estate Banking
| 1.8 |
Home Office and Consumer Equipment Manufacture
| 1.6 |
Mechanical Components
| 1.6 |
Capital Markets
| 1.6 |
Auto Products
| 1.6 |
Home Office and Consumer Equipment Retail
| 1.6 |
Information and Electrical Components
| 1.6 |
Specialty Services
| 1.6 |
Diversified Household and Personal Products
| 1.6 |
Distribution Services
| 1.5 |
Alcohol and Tobacco
| 1.5 |
Transportation Services
| 1.5 |
Primary Foods
| 1.5 |
Online Distribution Networks
| 1.5 |
Semiconductor Services and Equipment
| 1.4 |
Analog and Mixed Signal Integrated Circuits
| 1.4 |
Digital Integrated Circuits
| 1.4 |
Internet Services
| 1.4 |
Transaction Services
| 1.4 |
Management and IT Services
| 1.4 |
Healthcare Providers and Facilities
| 1.4 |
Healthcare Insurance
| 1.4 |
Search and Social Networks
| 1.4 |
Drugstores
| 1.3 |
Investment Services
| 1.3 |
| INDUSTRY | PERCENTAGE OF
NET ASSETS |
Transport Aerospace and Defense Equipment
| 1.2% |
Medical Devices
| 1.1 |
Medical Research Services and Equipment
| 1.1 |
Apparel Retailers
| 1.1 |
Diversified Drugs and Devices
| 1.1 |
Personal Products
| 1.1 |
Other Natural Resources
| 1.1 |
Accessories and Footwear
| 1.0 |
Chemicals
| 1.0 |
Metals
| 1.0 |
Midstream and Gas
| 1.0 |
Branded Apparel
| 1.0 |
Hospital Equipment
| 1.0 |
Healthcare Products Distribution
| 1.0 |
Midstream
| 0.9 |
Industrial Conglomerates
| 0.9 |
Production Equipment
| 0.8 |
Operating Systems and Middleware
| 0.7 |
Brokers and Dealers
| 0.5 |
Consumer Paper Products
| 0.5 |
Real Estate Banking
| 0.4 |
Business Software for Specific Industries
| 0.2 |
Other Assets in Excess of Liabilities
| 0.2 |
| Total | 100.0% |
* The Fund’s industry breakdown is expressed as a percentage of net assets and may change over time.
See accompanying notes to financial statements.
Syntax Stratified MidCap ETF
Schedule of Investments (continued)
December 31, 2020
| Security Description | Shares | Value |
| COMMON STOCK—99.7% | | |
Acadia Healthcare Co., Inc.(a)
| 282 | $14,173 |
ACI Worldwide, Inc.(a)
| 448 | 17,217 |
Acuity Brands, Inc.
| 52 | 6,297 |
Adient PLC(a)
| 83 | 2,886 |
Adtalem Global Education, Inc.(a)
| 155 | 5,262 |
AECOM(a)
| 101 | 5,028 |
Affiliated Managers Group, Inc.
| 75 | 7,627 |
AGCO Corp.
| 108 | 11,134 |
Alleghany Corp.
| 15 | 9,055 |
ALLETE, Inc.
| 143 | 8,857 |
Alliance Data Systems Corp.
| 90 | 6,669 |
Amedisys, Inc.(a)
| 50 | 14,666 |
American Campus Communities, Inc.
| 229 | 9,794 |
American Eagle Outfitters, Inc.
| 675 | 13,547 |
American Financial Group, Inc.
| 75 | 6,572 |
Antero Midstream Corp.
| 1,172 | 9,036 |
Apartment Income REIT Corp.(a)
| 240 | 9,218 |
AptarGroup, Inc.
| 25 | 3,422 |
Arrow Electronics, Inc.(a)
| 34 | 3,308 |
Arrowhead Pharmaceuticals, Inc.(a)
| 238 | 18,262 |
ASGN, Inc.(a)
| 81 | 6,766 |
Ashland Global Holdings, Inc.
| 42 | 3,326 |
Associated Banc-Corp
| 109 | 1,858 |
AutoNation, Inc.(a)
| 149 | 10,399 |
Avanos Medical, Inc.(a)
| 54 | 2,478 |
Avient Corp.
| 86 | 3,464 |
Avis Budget Group, Inc.(a)
| 253 | 9,437 |
Avnet, Inc.
| 104 | 3,651 |
Axon Enterprise, Inc.(a)
| 82 | 10,047 |
BancorpSouth Bank
| 66 | 1,811 |
Bank of Hawaii Corp.
| 99 | 7,585 |
Bank OZK
| 60 | 1,876 |
Belden, Inc.
| 87 | 3,645 |
Bio-Techne Corp.
| 30 | 9,526 |
BJ's Wholesale Club Holdings, Inc.(a)
| 351 | 13,085 |
Black Hills Corp.
| 127 | 7,804 |
Blackbaud, Inc.
| 105 | 6,044 |
Boston Beer Co., Inc., Class A(a)
| 14 | 13,920 |
Boyd Gaming Corp.
| 82 | 3,519 |
Brighthouse Financial, Inc.(a)
| 393 | 14,229 |
Brink's Co.
| 105 | 7,560 |
Brixmor Property Group, Inc.
| 81 | 1,341 |
Brown & Brown, Inc.
| 193 | 9,150 |
Brunswick Corp.
| 100 | 7,624 |
Builders FirstSource, Inc.(a)
| 168 | 6,856 |
Cable One, Inc.
| 12 | 26,733 |
Cabot Corp.
| 67 | 3,007 |
CACI International, Inc., Class A(a)
| 29 | 7,231 |
Caesars Entertainment, Inc.(a)
| 49 | 3,639 |
Camden Property Trust
| 101 | 10,092 |
Cantel Medical Corp.
| 59 | 4,653 |
| Security Description | Shares | Value |
Carlisle Companies, Inc.
| 21 | $3,280 |
Carter's, Inc.
| 146 | 13,734 |
Casey's General Stores, Inc.
| 55 | 9,824 |
Cathay General Bancorp
| 57 | 1,835 |
CDK Global, Inc.
| 345 | 17,881 |
Ceridian HCM Holding, Inc.(a)
| 59 | 6,287 |
ChampionX Corp.(a)
| 1,071 | 16,386 |
Charles River Laboratories International, Inc.(a)
| 38 | 9,495 |
Chemed Corp.
| 27 | 14,380 |
Chemours Co.
| 108 | 2,677 |
Choice Hotels International, Inc.
| 23 | 2,455 |
Churchill Downs, Inc.
| 17 | 3,311 |
Ciena Corp.(a)
| 829 | 43,813 |
Cimarex Energy Co.
| 149 | 5,589 |
Cinemark Holdings, Inc.
| 808 | 14,067 |
Cirrus Logic, Inc.(a)
| 167 | 13,727 |
CIT Group, Inc.
| 67 | 2,405 |
Clean Harbors, Inc.(a)
| 104 | 7,914 |
CMC Materials, Inc.
| 182 | 27,537 |
CNO Financial Group, Inc.
| 574 | 12,760 |
CNX Resources Corp.(a)
| 551 | 5,951 |
Cognex Corp.
| 131 | 10,517 |
Coherent, Inc.(a)
| 196 | 29,404 |
Colfax Corp.(a)
| 214 | 8,183 |
Columbia Sportswear Co.
| 160 | 13,981 |
Commerce Bancshares, Inc.
| 103 | 6,767 |
Commercial Metals Co.
| 330 | 6,778 |
CommVault Systems, Inc.(a)
| 114 | 6,312 |
Compass Minerals International, Inc.
| 108 | 6,666 |
Concentrix Corp.(a)
| 65 | 6,416 |
CoreLogic, Inc.
| 57 | 4,407 |
CoreSite Realty Corp.
| 149 | 18,667 |
Corporate Office Properties Trust
| 63 | 1,643 |
Coty, Inc., Class A
| 2,867 | 20,126 |
Cousins Properties, Inc.
| 48 | 1,608 |
Cracker Barrel Old Country Store, Inc.
| 99 | 13,060 |
Crane Co.
| 85 | 6,601 |
Cree, Inc.(a)
| 41 | 4,342 |
Cullen/Frost Bankers, Inc.
| 32 | 2,791 |
Curtiss-Wright Corp.
| 35 | 4,072 |
CyrusOne, Inc.
| 264 | 19,312 |
Dana, Inc.
| 157 | 3,065 |
Darling Ingredients, Inc.(a)
| 137 | 7,902 |
Deckers Outdoor Corp.(a)
| 43 | 12,332 |
Dick's Sporting Goods, Inc.
| 185 | 10,399 |
Domtar Corp.
| 107 | 3,387 |
Donaldson Co., Inc.
| 119 | 6,650 |
Douglas Emmett, Inc.
| 51 | 1,488 |
Dycom Industries, Inc.(a)
| 63 | 4,758 |
Eagle Materials, Inc.
| 65 | 6,588 |
East West Bancorp, Inc.
| 40 | 2,028 |
See accompanying notes to financial statements.
Syntax Stratified MidCap ETF
Schedule of Investments (continued)
December 31, 2020
| Security Description | Shares | Value |
EastGroup Properties, Inc.
| 27 | $3,728 |
Eaton Vance Corp.
| 118 | 8,016 |
Edgewell Personal Care Co.
| 543 | 18,777 |
EMCOR Group, Inc.
| 54 | 4,939 |
Emergent BioSolutions, Inc.(a)
| 211 | 18,906 |
Encompass Health Corp.
| 156 | 12,900 |
Energizer Holdings, Inc.
| 464 | 19,572 |
EnerSys
| 72 | 5,980 |
Enphase Energy, Inc.(a)
| 40 | 7,019 |
EPR Properties
| 39 | 1,268 |
EQT Corp.
| 426 | 5,414 |
Equitrans Midstream Corp.
| 1,128 | 9,069 |
Essent Group Ltd.
| 183 | 7,906 |
Essential Utilities, Inc.
| 154 | 7,283 |
Evercore, Inc., Class A
| 67 | 7,346 |
Exelixis, Inc.(a)
| 886 | 17,782 |
FactSet Research Systems, Inc.
| 21 | 6,982 |
Fair Isaac Corp.(a)
| 34 | 17,375 |
Federated Hermes, Inc.
| 254 | 7,338 |
First American Financial Corp.
| 83 | 4,285 |
First Financial Bankshares, Inc.
| 53 | 1,917 |
First Horizon Corp.
| 513 | 6,546 |
First Industrial Realty Trust, Inc.
| 79 | 3,328 |
First Solar, Inc.(a)
| 44 | 4,352 |
FirstCash, Inc.
| 92 | 6,444 |
Five Below, Inc.(a)
| 58 | 10,149 |
Flowers Foods, Inc.
| 657 | 14,868 |
Fluor Corp.
| 294 | 4,695 |
FNB Corp.
| 191 | 1,815 |
Foot Locker, Inc.
| 311 | 12,577 |
Fox Factory Holding Corp.(a)
| 31 | 3,277 |
FTI Consulting, Inc.(a)
| 58 | 6,480 |
Fulton Financial Corp.
| 134 | 1,704 |
GATX Corp.
| 60 | 4,991 |
Generac Holdings, Inc.(a)
| 18 | 4,093 |
Gentex Corp.
| 223 | 7,566 |
Genworth Financial, Inc., Class A(a)
| 3,047 | 11,518 |
Glacier Bancorp, Inc.
| 41 | 1,886 |
Globus Medical, Inc., Class A(a)
| 293 | 19,109 |
Goodyear Tire & Rubber Co.
| 285 | 3,109 |
Graco, Inc.
| 95 | 6,873 |
Graham Holdings Co., Class B
| 11 | 5,867 |
Grand Canyon Education, Inc.(a)
| 53 | 4,935 |
Greif, Inc., Class A
| 44 | 2,063 |
Grocery Outlet Holding Corp.(a)
| 345 | 13,541 |
Grubhub, Inc.(a)
| 378 | 28,074 |
H&R Block, Inc.
| 474 | 7,518 |
Haemonetics Corp.(a)
| 39 | 4,631 |
Hain Celestial Group, Inc.(a)
| 261 | 10,479 |
Halozyme Therapeutics, Inc.(a)
| 429 | 18,323 |
Hancock Whitney Corp.
| 86 | 2,926 |
Hanover Insurance Group, Inc.
| 57 | 6,664 |
| Security Description | Shares | Value |
Harley-Davidson, Inc.
| 193 | $7,083 |
Hawaiian Electric Industries, Inc.
| 227 | 8,034 |
Healthcare Realty Trust, Inc.
| 667 | 19,743 |
Healthcare Services Group, Inc.
| 304 | 8,542 |
HealthEquity, Inc.(a)
| 70 | 4,880 |
Helen of Troy Ltd.(a)
| 93 | 20,664 |
Herman Miller, Inc.
| 156 | 5,273 |
Hexcel Corp.
| 65 | 3,152 |
Highwoods Properties, Inc.
| 44 | 1,744 |
Hill-Rom Holdings, Inc.
| 46 | 4,507 |
HNI Corp.
| 159 | 5,479 |
Home BancShares, Inc.
| 94 | 1,831 |
Hubbell, Inc.
| 23 | 3,606 |
Hudson Pacific Properties, Inc.
| 63 | 1,513 |
IAA, Inc.(a)
| 161 | 10,462 |
ICU Medical, Inc.(a)
| 16 | 3,432 |
IDACORP, Inc.
| 89 | 8,547 |
II-VI, Inc.(a)
| 54 | 4,102 |
Ingevity Corp.(a)
| 38 | 2,878 |
Ingredion, Inc.
| 92 | 7,238 |
Insperity, Inc.
| 51 | 4,152 |
Integra LifeSciences Holdings Corp.(a)
| 45 | 2,921 |
Interactive Brokers Group, Inc., Class A
| 239 | 14,560 |
InterDigital, Inc.
| 215 | 13,046 |
International Bancshares Corp.
| 48 | 1,797 |
ITT, Inc.
| 52 | 4,005 |
J2 Global, Inc.(a)
| 175 | 17,096 |
Jabil, Inc.
| 501 | 21,308 |
Jack in the Box, Inc.
| 149 | 13,827 |
Janus Henderson Group PLC
| 229 | 7,445 |
Jazz Pharmaceuticals PLC(a)
| 119 | 19,641 |
JBG SMITH Properties
| 51 | 1,595 |
Jefferies Financial Group, Inc.
| 280 | 6,888 |
JetBlue Airways Corp.(a)
| 665 | 9,669 |
John Wiley & Sons, Inc., Class A
| 225 | 10,273 |
Jones Lang LaSalle, Inc.
| 58 | 8,605 |
KAR Auction Services, Inc.
| 526 | 9,789 |
KB Home
| 292 | 9,788 |
KBR, Inc.
| 176 | 5,444 |
Kemper Corp.
| 170 | 13,061 |
Kennametal, Inc.
| 206 | 7,465 |
Kilroy Realty Corp.
| 25 | 1,435 |
Kinsale Capital Group, Inc.
| 7 | 1,401 |
Kirby Corp.(a)
| 179 | 9,278 |
Knight-Swift Transportation Holdings, Inc.
| 180 | 7,528 |
Kohl's Corp.
| 343 | 13,957 |
Lamar Advertising Co., Class A
| 17 | 1,415 |
Lancaster Colony Corp.
| 85 | 15,617 |
Landstar System, Inc.
| 51 | 6,868 |
Lear Corp.
| 17 | 2,704 |
LendingTree, Inc.(a)
| 30 | 8,214 |
Lennox International, Inc.
| 23 | 6,301 |
See accompanying notes to financial statements.
Syntax Stratified MidCap ETF
Schedule of Investments (continued)
December 31, 2020
| Security Description | Shares | Value |
LHC Group, Inc.(a)
| 66 | $14,079 |
Life Storage, Inc.
| 85 | 10,148 |
Ligand Pharmaceuticals, Inc.(a)
| 190 | 18,895 |
Lincoln Electric Holdings, Inc.
| 65 | 7,556 |
Lithia Motors, Inc., Class A
| 34 | 9,951 |
Littelfuse, Inc.
| 23 | 5,857 |
LivaNova PLC(a)
| 291 | 19,267 |
LiveRamp Holdings, Inc.(a)
| 82 | 6,002 |
Louisiana-Pacific Corp.
| 85 | 3,159 |
Lumentum Holdings, Inc.(a)
| 457 | 43,324 |
Macerich Co.
| 113 | 1,206 |
Manhattan Associates, Inc.(a)
| 58 | 6,100 |
ManpowerGroup, Inc.
| 75 | 6,763 |
Marriott Vacations Worldwide Corp.
| 33 | 4,528 |
Masimo Corp.(a)
| 51 | 13,687 |
MasTec, Inc.(a)
| 75 | 5,114 |
Mattel, Inc.(a)
| 372 | 6,491 |
MAXIMUS, Inc.
| 61 | 4,465 |
MDU Resources Group, Inc.
| 268 | 7,059 |
Medical Properties Trust, Inc.
| 953 | 20,766 |
Medpace Holdings, Inc.(a)
| 62 | 8,630 |
Mercury General Corp.
| 282 | 14,723 |
Mercury Systems, Inc.(a)
| 46 | 4,051 |
MGIC Investment Corp.
| 655 | 8,220 |
Middleby Corp.(a)
| 58 | 7,477 |
Minerals Technologies, Inc.
| 46 | 2,858 |
MKS Instruments, Inc.
| 180 | 27,081 |
Molina Healthcare, Inc.(a)
| 64 | 13,612 |
Monolithic Power Systems, Inc.
| 41 | 15,015 |
MSA Safety, Inc.
| 63 | 9,412 |
MSC Industrial Direct Co., Inc., Class A
| 37 | 3,122 |
Murphy Oil Corp.
| 439 | 5,312 |
Murphy USA, Inc.
| 78 | 10,208 |
National Fuel Gas Co.
| 170 | 6,992 |
National Instruments Corp.
| 660 | 29,000 |
National Retail Properties, Inc.
| 34 | 1,391 |
Navient Corp.
| 694 | 6,815 |
NCR Corp.(a)
| 587 | 22,054 |
Nektar Therapeutics(a)
| 1,049 | 17,833 |
Neogen Corp.(a)
| 34 | 2,696 |
NetScout Systems, Inc.(a)
| 762 | 20,894 |
New Jersey Resources Corp.
| 223 | 7,928 |
New York Community Bancorp, Inc.
| 178 | 1,878 |
New York Times Co., Class A
| 195 | 10,095 |
NewMarket Corp.
| 6 | 2,390 |
Nordson Corp.
| 39 | 7,837 |
Nordstrom, Inc.
| 429 | 13,389 |
NorthWestern Corp.
| 153 | 8,921 |
Nu Skin Enterprises, Inc., Class A
| 382 | 20,869 |
NuVasive, Inc.(a)
| 386 | 21,743 |
nVent Electric PLC
| 252 | 5,869 |
OGE Energy Corp.
| 262 | 8,347 |
| Security Description | Shares | Value |
O-I Glass, Inc.
| 187 | $2,225 |
Old Republic International Corp.
| 351 | 6,918 |
Olin Corp.
| 139 | 3,414 |
Ollie's Bargain Outlet Holdings, Inc.(a)
| 127 | 10,385 |
Omega Healthcare Investors, Inc.
| 352 | 12,785 |
ONE Gas, Inc.
| 95 | 7,293 |
Oshkosh Corp.
| 77 | 6,627 |
Owens Corning
| 42 | 3,182 |
PacWest Bancorp
| 74 | 1,880 |
Papa John's International, Inc.
| 154 | 13,067 |
Park Hotels & Resorts, Inc.
| 150 | 2,573 |
Patterson Companies, Inc.
| 86 | 2,548 |
Paylocity Holding Corp.(a)
| 30 | 6,177 |
Pebblebrook Hotel Trust
| 144 | 2,707 |
Penn National Gaming, Inc.(a)
| 46 | 3,973 |
Penumbra, Inc.(a)
| 13 | 2,275 |
Perspecta, Inc.
| 281 | 6,766 |
Physicians Realty Trust
| 90 | 1,602 |
Pilgrim's Pride Corp.(a)
| 359 | 7,040 |
Pinnacle Financial Partners, Inc.
| 30 | 1,932 |
PNM Resources, Inc.
| 171 | 8,299 |
Polaris, Inc.
| 81 | 7,718 |
Post Holdings, Inc.(a)
| 103 | 10,404 |
PotlatchDeltic Corp.
| 70 | 3,501 |
PRA Health Sciences, Inc.(a)
| 75 | 9,408 |
Prestige Consumer Healthcare, Inc.(a)
| 476 | 16,598 |
Primerica, Inc.
| 96 | 12,857 |
PROG Holdings, Inc.
| 192 | 10,343 |
Prosperity Bancshares, Inc.
| 25 | 1,734 |
PS Business Parks, Inc.
| 24 | 3,189 |
PTC, Inc.(a)
| 233 | 27,869 |
Qualys, Inc.(a)
| 61 | 7,434 |
Quidel Corp.(a)
| 67 | 12,037 |
Rayonier, Inc.
| 107 | 3,144 |
Regal Beloit Corp.
| 33 | 4,053 |
Reinsurance Group of America, Inc.
| 65 | 7,533 |
Reliance Steel & Aluminum Co.
| 52 | 6,227 |
RenaissanceRe Holdings Ltd.
| 47 | 7,794 |
Repligen Corp.(a)
| 50 | 9,581 |
Rexford Industrial Realty, Inc.
| 72 | 3,536 |
RH(a)
| 13 | 5,818 |
RLI Corp.
| 64 | 6,666 |
Royal Gold, Inc.
| 62 | 6,594 |
RPM International, Inc.
| 40 | 3,631 |
Ryder System, Inc.
| 81 | 5,003 |
Sabra Health Care REIT, Inc.
| 754 | 13,097 |
Sabre Corp.
| 2,400 | 28,848 |
Sailpoint Technologies Holdings, Inc.(a)
| 120 | 6,389 |
Sanderson Farms, Inc.
| 50 | 6,610 |
Science Applications International Corp.
| 66 | 6,246 |
Scientific Games Corp., Class A(a)
| 489 | 20,289 |
Scotts Miracle-Gro Co.
| 102 | 20,312 |
See accompanying notes to financial statements.
Syntax Stratified MidCap ETF
Schedule of Investments (continued)
December 31, 2020
| Security Description | Shares | Value |
SEI Investments Co.
| 136 | $7,816 |
Selective Insurance Group, Inc.
| 99 | 6,631 |
Semtech Corp.(a)
| 189 | 13,625 |
Sensient Technologies Corp.
| 38 | 2,803 |
Service Corp. International/US
| 135 | 6,629 |
Service Properties Trust
| 221 | 2,539 |
Signature Bank
| 12 | 1,623 |
Silgan Holdings, Inc.
| 64 | 2,373 |
Silicon Laboratories, Inc.(a)
| 109 | 13,880 |
Simpson Manufacturing Co., Inc.
| 38 | 3,551 |
Six Flags Entertainment Corp.
| 140 | 4,774 |
Skechers USA, Inc., Class A(a)
| 374 | 13,442 |
SLM Corp.
| 547 | 6,777 |
SolarEdge Technologies, Inc.(a)
| 22 | 7,021 |
Sonoco Products Co.
| 52 | 3,081 |
Southwest Gas Holdings, Inc.
| 118 | 7,168 |
Spire, Inc.
| 111 | 7,108 |
Spirit Realty Capital, Inc.
| 34 | 1,366 |
Sprouts Farmers Market, Inc.(a)
| 671 | 13,487 |
Steel Dynamics, Inc.
| 170 | 6,268 |
Stericycle, Inc.(a)
| 105 | 7,280 |
Sterling Bancorp
| 106 | 1,906 |
Stifel Financial Corp.
| 264 | 13,321 |
STORE Capital Corp.
| 39 | 1,325 |
Strategic Education, Inc.
| 51 | 4,862 |
Sunrun, Inc.(a)
| 145 | 10,060 |
Synaptics, Inc.(a)
| 165 | 15,906 |
Syneos Health, Inc.(a)
| 136 | 9,266 |
SYNNEX Corp.
| 42 | 3,420 |
Synovus Financial Corp.
| 56 | 1,813 |
Taylor Morrison Home Corp.(a)
| 384 | 9,850 |
TCF Financial Corp.
| 227 | 8,404 |
TEGNA, Inc.
| 915 | 12,764 |
Telephone and Data Systems, Inc.
| 1,413 | 26,239 |
Tempur Sealy International, Inc.(a)
| 223 | 6,021 |
Tenet Healthcare Corp.(a)
| 322 | 12,857 |
Teradata Corp.(a)
| 251 | 5,640 |
Terex Corp.
| 184 | 6,420 |
Tetra Tech, Inc.
| 126 | 14,588 |
Texas Capital Bancshares, Inc.(a)
| 137 | 8,151 |
Texas Roadhouse, Inc.
| 169 | 13,209 |
Thor Industries, Inc.
| 76 | 7,067 |
Timken Co.
| 43 | 3,326 |
Toll Brothers, Inc.
| 223 | 9,694 |
Tootsie Roll Industries, Inc.
| 477 | 14,167 |
TopBuild Corp.(a)
| 36 | 6,627 |
Toro Co.
| 109 | 10,338 |
TreeHouse Foods, Inc.(a)
| 226 | 9,603 |
Trex Co., Inc.(a)
| 77 | 6,446 |
TRI Pointe Group, Inc.(a)
| 587 | 10,126 |
| Security Description | Shares | Value |
Trimble, Inc.(a)
| 157 | $10,483 |
Trinity Industries, Inc.
| 253 | 6,677 |
TripAdvisor, Inc.(a)
| 927 | 26,679 |
Trustmark Corp.
| 64 | 1,748 |
UGI Corp.
| 211 | 7,377 |
UMB Financial Corp.
| 38 | 2,622 |
Umpqua Holdings Corp.
| 123 | 1,862 |
United Bankshares, Inc.
| 58 | 1,879 |
United States Steel Corp.
| 361 | 6,054 |
United Therapeutics Corp.(a)
| 129 | 19,581 |
Univar Solutions, Inc.(a)
| 183 | 3,479 |
Universal Display Corp.
| 18 | 4,136 |
Urban Edge Properties
| 93 | 1,203 |
Urban Outfitters, Inc.(a)
| 492 | 12,595 |
Valley National Bancorp
| 183 | 1,784 |
Valmont Industries, Inc.
| 19 | 3,324 |
Valvoline, Inc.
| 141 | 3,263 |
ViaSat, Inc.(a)
| 755 | 24,651 |
Vishay Intertechnology, Inc.
| 190 | 3,935 |
Visteon Corp.(a)
| 59 | 7,406 |
Washington Federal, Inc.
| 311 | 8,005 |
Watsco, Inc.
| 16 | 3,625 |
Webster Financial Corp.
| 191 | 8,051 |
Weingarten Realty Investors
| 59 | 1,279 |
Wendy's Co.
| 599 | 13,130 |
Werner Enterprises, Inc.
| 184 | 7,216 |
WEX, Inc.(a)
| 22 | 4,478 |
Williams-Sonoma, Inc.
| 64 | 6,518 |
Wingstop, Inc.
| 101 | 13,388 |
Wintrust Financial Corp.
| 42 | 2,566 |
Woodward, Inc.
| 35 | 4,254 |
World Fuel Services Corp.
| 322 | 10,034 |
World Wrestling Entertainment, Inc., Class A
| 296 | 14,223 |
Worthington Industries, Inc.
| 65 | 3,337 |
WPX Energy, Inc.(a)
| 711 | 5,795 |
WW International, Inc.(a)
| 227 | 5,539 |
Wyndham Destinations, Inc.
| 100 | 4,486 |
Wyndham Hotels & Resorts, Inc.
| 46 | 2,734 |
XPO Logistics, Inc.(a)
| 60 | 7,152 |
Yelp, Inc.(a)
| 898 | 29,338 |
INVESTMENTS IN
COMMON STOCK—99.7%
(Cost $2,550,025)
| | 3,411,704 |
OTHER ASSETS IN EXCESS OF LIABILITIES—0.3%
| | 8,962 |
NET ASSETS—100.0%
| | $3,420,666 |
| (a) | Non-income producing security. |
| PLC=Public Limited Company |
| REIT=Real Estate Investment Trust |
See accompanying notes to financial statements.
Syntax Stratified MidCap ETF
Schedule of Investments (continued)
December 31, 2020
INDUSTRY BREAKDOWN
AS OF December 31, 2020*
| INDUSTRY | PERCENTAGE OF
NET ASSETS |
Commercial Hardware
| 4.4% |
Healthcare Providers and Facilities
| 4.4 |
Branded Pharmaceuticals
| 3.7 |
Business Software for Specific Uses
| 3.5 |
Production Equipment
| 3.0 |
Information and Electrical Components
| 2.6 |
Content Providers
| 2.4 |
Commercial Insurance
| 2.4 |
Operators and Developers
| 2.4 |
Real Estate Banking
| 2.4 |
Restaurants
| 2.3 |
Consumer Insurance
| 2.3 |
Rental
| 2.3 |
Home Office and Consumer Equipment Manufacture
| 2.2 |
Processed Foods
| 2.2 |
Specialty Services
| 2.1 |
Online Distribution Networks
| 2.0 |
Chemicals
| 2.0 |
Medical Devices
| 1.8 |
Personal Products
| 1.7 |
Transportation Services
| 1.7 |
Auto Products
| 1.7 |
Distribution Services
| 1.7 |
Midstream and Gas
| 1.7 |
Semiconductor Services and Equipment
| 1.7 |
Analog and Mixed Signal Integrated Circuits
| 1.6 |
Search and Social Networks
| 1.6 |
Medical Research Services and Equipment
| 1.6 |
Internet Services
| 1.6 |
Management and IT Services
| 1.6 |
Mechanical Components
| 1.6 |
Non Real Estate Banking
| 1.6 |
Telecommunication Networks
| 1.5 |
Investment Services
| 1.5 |
Transaction Services
| 1.5 |
Apparel Retailers
| 1.5 |
Hospital Equipment
| 1.5 |
Upstream Energy
| 1.4 |
Business Software for Specific Industries
| 1.4 |
Home Office and Consumer Equipment Retail
| 1.3 |
Electric Regulated
| 1.2 |
Branded Apparel
| 1.2 |
Other Natural Resources
| 1.2 |
| INDUSTRY | PERCENTAGE OF
NET ASSETS |
Food Distributors
| 1.2% |
Household Products
| 1.2 |
Metals
| 1.1 |
Diversified Drugs and Devices
| 1.1 |
Downstream
| 0.9 |
Digital Integrated Circuits
| 0.8 |
Primary Foods
| 0.8 |
Brokers and Dealers
| 0.8 |
Midstream
| 0.8 |
Accessories and Footwear
| 0.8 |
Contract Electronics Services
| 0.6 |
Electric Competitive
| 0.6 |
Transport Aerospace and Defense Equipment
| 0.5 |
Alcohol and Tobacco
| 0.4 |
Healthcare Insurance
| 0.4 |
Consumer Services
| 0.4 |
Industrial Conglomerates
| 0.2 |
Healthcare Products Distribution
| 0.1 |
Other Assets in Excess of Liabilities
| 0.3 |
| Total | 100.0% |
* The Fund’s industry breakdown is expressed as a percentage of net assets and may change over time.
See accompanying notes to financial statements.
Syntax Stratified SmallCap ETF
Schedule of Investments (continued)
December 31, 2020
| Security Description | Shares | Value |
| COMMON STOCK—99.8% | | |
3D Systems Corp.(a)
| 2,399 | $25,142 |
8x8, Inc.(a)
| 1,401 | 48,292 |
AAON, Inc.
| 226 | 15,058 |
AAR Corp.
| 365 | 13,220 |
Aaron's Co., Inc.(a)
| 1,492 | 28,288 |
Abercrombie & Fitch Co., Class A
| 801 | 16,308 |
ABM Industries, Inc.
| 922 | 34,888 |
Acadia Realty Trust, REIT
| 651 | 9,238 |
Addus HomeCare Corp.(a)
| 160 | 18,734 |
ADTRAN, Inc.
| 3,521 | 52,005 |
Advanced Energy Industries, Inc.(a)
| 505 | 48,970 |
AdvanSix, Inc.(a)
| 372 | 7,436 |
Aegion Corp.(a)
| 471 | 8,944 |
Aerojet Rocketdyne Holdings, Inc.(a)
| 325 | 17,176 |
AeroVironment, Inc.(a)
| 355 | 30,849 |
Agilysys, Inc.(a)
| 1,112 | 42,679 |
Agree Realty Corp., REIT
| 145 | 9,654 |
Alamo Group, Inc.
| 176 | 24,279 |
Alarm.com Holdings, Inc.(a)
| 566 | 58,553 |
Albany International Corp., Class A
| 184 | 13,509 |
Alexander & Baldwin, Inc.
| 584 | 10,033 |
Allegheny Technologies, Inc.(a)
| 921 | 15,445 |
Allegiance Bancshares, Inc.
| 102 | 3,481 |
Allegiant Travel Co.
| 380 | 71,911 |
Allscripts Healthcare Solutions, Inc.(a)
| 3,073 | 44,374 |
Ambac Financial Group, Inc.(a)
| 2,214 | 34,051 |
AMC Networks, Inc., Class A(a)
| 1,025 | 36,664 |
American Assets Trust, Inc., REIT
| 349 | 10,079 |
American Axle & Manufacturing Holdings, Inc.(a)
| 6,283 | 52,400 |
American Equity Investment Life Holding Co.
| 1,825 | 50,479 |
American Public Education, Inc.(a)
| 1,528 | 46,573 |
American States Water Co.
| 1,285 | 102,170 |
American Vanguard Corp.
| 405 | 6,286 |
American Woodmark Corp.(a)
| 177 | 16,611 |
America's Car-Mart, Inc.(a)
| 291 | 31,963 |
Ameris Bancorp
| 94 | 3,579 |
AMERISAFE, Inc.
| 694 | 39,856 |
AMN Healthcare Services, Inc.(a)
| 123 | 8,395 |
Amphastar Pharmaceuticals, Inc.(a)
| 3,532 | 71,029 |
Andersons, Inc.
| 1,228 | 30,098 |
AngioDynamics, Inc.(a)
| 853 | 13,076 |
ANI Pharmaceuticals, Inc.(a)
| 2,208 | 64,120 |
Anika Therapeutics, Inc.(a)
| 590 | 26,703 |
Apogee Enterprises, Inc.
| 573 | 18,153 |
Apollo Commercial Real Estate Finance, Inc., REIT
| 305 | 3,407 |
Applied Industrial Technologies, Inc.
| 162 | 12,634 |
Applied Optoelectronics, Inc.(a)
| 4,259 | 36,244 |
ArcBest Corp.
| 415 | 17,708 |
Archrock, Inc.
| 956 | 8,279 |
| Security Description | Shares | Value |
Arconic Corp.(a)
| 506 | $15,079 |
Arcosa, Inc.
| 258 | 14,172 |
Arlo Technologies, Inc.(a)
| 2,131 | 16,600 |
Armada Hoffler Properties, Inc., REIT
| 943 | 10,580 |
ARMOUR Residential REIT, Inc.
| 1,500 | 16,185 |
Asbury Automotive Group, Inc.(a)
| 231 | 33,666 |
Assured Guaranty Ltd.
| 1,256 | 39,551 |
Astec Industries, Inc.
| 389 | 22,515 |
Atlas Air Worldwide Holdings, Inc.(a)
| 268 | 14,617 |
ATN International, Inc.
| 853 | 35,621 |
Avista Corp.
| 2,542 | 102,036 |
Axcelis Technologies, Inc.(a)
| 387 | 11,269 |
Axos Financial, Inc.(a)
| 247 | 9,270 |
AZZ, Inc.
| 323 | 15,323 |
B&G Foods, Inc.
| 966 | 26,787 |
Badger Meter, Inc.
| 190 | 17,871 |
Balchem Corp.
| 98 | 11,292 |
Banc of California, Inc.
| 239 | 3,516 |
BancFirst Corp.
| 60 | 3,522 |
BankUnited, Inc.
| 108 | 3,756 |
Banner Corp.
| 80 | 3,727 |
Barnes & Noble Education, Inc.(a)
| 8,979 | 41,752 |
Barnes Group, Inc.
| 201 | 10,189 |
Bed Bath & Beyond, Inc.
| 1,383 | 24,562 |
Bel Fuse, Inc., Class B
| 3,553 | 53,402 |
Benchmark Electronics, Inc.
| 1,155 | 31,197 |
Berkshire Hills Bancorp, Inc.
| 187 | 3,201 |
Big Lots, Inc.
| 585 | 25,114 |
BioTelemetry, Inc.(a)
| 333 | 24,003 |
BJ's Restaurants, Inc.
| 567 | 21,824 |
Bloomin' Brands, Inc.
| 1,042 | 20,236 |
Blucora, Inc.(a)
| 4,289 | 68,238 |
Boise Cascade Co.
| 724 | 34,607 |
Bonanza Creek Energy, Inc.(a)
| 581 | 11,231 |
Boot Barn Holdings, Inc.(a)
| 495 | 21,463 |
Boston Private Financial Holdings, Inc.
| 1,135 | 9,591 |
Bottomline Technologies DE, Inc.(a)
| 894 | 47,150 |
Brady Corp., Class A
| 353 | 18,645 |
Brandywine Realty Trust, REIT
| 1,283 | 15,281 |
Brightsphere Investment Group, Inc.
| 2,943 | 56,741 |
Brinker International, Inc.
| 349 | 19,743 |
Bristow Group, Inc.(a)
| 302 | 7,949 |
Brookline Bancorp, Inc.
| 293 | 3,528 |
Brooks Automation, Inc.
| 155 | 10,517 |
Buckle, Inc.
| 1,021 | 29,813 |
Cadence BanCorp
| 1,914 | 31,428 |
CalAmp Corp.(a)
| 4,813 | 47,745 |
Calavo Growers, Inc.
| 379 | 26,314 |
Caleres, Inc.
| 1,561 | 24,430 |
California Water Service Group
| 1,896 | 102,441 |
Callaway Golf Co.
| 1,743 | 41,849 |
Callon Petroleum Co.(a)
| 926 | 12,186 |
See accompanying notes to financial statements.
Syntax Stratified SmallCap ETF
Schedule of Investments (continued)
December 31, 2020
| Security Description | Shares | Value |
Cal-Maine Foods, Inc.(a)
| 754 | $28,305 |
Capitol Federal Financial, Inc.
| 716 | 8,950 |
Capri Holdings Ltd.(a)
| 869 | 36,498 |
Capstead Mortgage Corp., REIT
| 2,798 | 16,256 |
Cardiovascular Systems, Inc.(a)
| 339 | 14,835 |
Cardtronics PLC, Class A(a)
| 1,829 | 64,564 |
CareTrust REIT, Inc.
| 2,990 | 66,318 |
Carpenter Technology Corp.
| 542 | 15,783 |
Cato Corp., Class A
| 1,990 | 19,084 |
Cavco Industries, Inc.(a)
| 186 | 32,634 |
Centerspace, REIT
| 138 | 9,748 |
Central Garden & Pet Co.(a)
| 373 | 14,402 |
Central Garden & Pet Co., Class A(a)
| 403 | 14,641 |
Central Pacific Financial Corp.
| 497 | 9,448 |
Century Aluminum Co.(a)
| 1,312 | 14,471 |
Century Communities, Inc.(a)
| 769 | 33,667 |
CEVA, Inc.(a)
| 1,693 | 77,031 |
Chart Industries, Inc.(a)
| 145 | 17,080 |
Chatham Lodging Trust, REIT
| 1,690 | 18,252 |
Cheesecake Factory, Inc.
| 499 | 18,493 |
Chefs' Warehouse, Inc.(a)
| 2,119 | 54,437 |
Chesapeake Utilities Corp.
| 939 | 101,609 |
Chico's FAS, Inc.
| 11,164 | 17,751 |
Children's Place, Inc.
| 381 | 19,088 |
Chuy's Holdings, Inc.(a)
| 738 | 19,550 |
Cincinnati Bell, Inc.(a)
| 2,602 | 39,759 |
CIRCOR International, Inc.(a)
| 452 | 17,375 |
City Holding Co.
| 124 | 8,624 |
Clearwater Paper Corp.(a)
| 2,681 | 101,208 |
Cleveland-Cliffs, Inc.
| 1,120 | 16,307 |
Coca-Cola Consolidated, Inc.
| 109 | 29,023 |
Cogent Communications Holdings, Inc.
| 1,697 | 101,599 |
Coherus Biosciences, Inc.(a)
| 3,712 | 64,515 |
Cohu, Inc.
| 593 | 22,641 |
Columbia Banking System, Inc.
| 104 | 3,734 |
Comfort Systems USA, Inc.
| 730 | 38,442 |
Community Bank System, Inc.
| 438 | 27,292 |
Community Health Systems, Inc.(a)
| 4,635 | 34,438 |
Community Healthcare Trust, Inc., REIT
| 1,401 | 66,001 |
Computer Programs and Systems, Inc.
| 1,218 | 32,691 |
Comtech Telecommunications Corp.
| 2,357 | 48,766 |
CONMED Corp.
| 476 | 53,312 |
Conn's, Inc.(a)
| 2,401 | 28,068 |
CONSOL Energy, Inc.(a)
| 2,342 | 16,886 |
Consolidated Communications Holdings, Inc.(a)
| 18,529 | 90,607 |
Cooper Tire & Rubber Co.
| 513 | 20,776 |
Cooper-Standard Holdings, Inc.(a)
| 565 | 19,589 |
Corcept Therapeutics, Inc.(a)
| 868 | 22,707 |
Core Laboratories N.V.
| 301 | 7,980 |
CoreCivic, Inc., REIT
| 3,290 | 21,549 |
Core-Mark Holding Co., Inc.
| 1,608 | 47,227 |
| Security Description | Shares | Value |
CorVel Corp.(a)
| 464 | $49,184 |
Covetrus, Inc.(a)
| 3,741 | 107,516 |
Crocs, Inc.(a)
| 531 | 33,272 |
Cross Country Healthcare, Inc.(a)
| 898 | 7,965 |
CryoLife, Inc.(a)
| 568 | 13,410 |
CSG Systems International, Inc.
| 766 | 34,524 |
CTS Corp.
| 754 | 25,885 |
Cubic Corp.
| 474 | 29,407 |
Customers Bancorp, Inc.(a)
| 191 | 3,472 |
Cutera, Inc.(a)
| 2,303 | 55,525 |
CVB Financial Corp.
| 177 | 3,452 |
Cytokinetics, Inc.(a)
| 3,248 | 67,493 |
Daktronics, Inc.
| 8,100 | 37,908 |
Dave & Buster's Entertainment, Inc.
| 990 | 29,720 |
Deluxe Corp.
| 1,361 | 39,741 |
Designer Brands, Inc., Class A
| 2,768 | 21,175 |
DiamondRock Hospitality Co., REIT
| 2,411 | 19,891 |
Diebold Nixdorf, Inc.(a)
| 9,126 | 97,283 |
Digi International, Inc.(a)
| 2,644 | 49,972 |
Dime Community Bancshares, Inc.
| 219 | 3,454 |
Dine Brands Global, Inc.
| 280 | 16,240 |
Diodes, Inc.(a)
| 978 | 68,949 |
Diversified Healthcare Trust, REIT
| 15,753 | 64,902 |
DMC Global, Inc.
| 212 | 9,169 |
Donnelley Financial Solutions, Inc.(a)
| 2,893 | 49,094 |
Dorian LPG Ltd.(a)
| 6,157 | 75,054 |
Dorman Products, Inc.(a)
| 203 | 17,624 |
Dril-Quip, Inc.(a)
| 269 | 7,968 |
DSP Group, Inc.(a)
| 4,089 | 67,837 |
DXP Enterprises, Inc.(a)
| 547 | 12,160 |
Eagle Bancorp, Inc.
| 87 | 3,593 |
Eagle Pharmaceuticals, Inc.(a)
| 485 | 22,586 |
Easterly Government Properties, Inc., REIT
| 475 | 10,759 |
Ebix, Inc.
| 1,215 | 46,134 |
Echo Global Logistics, Inc.(a)
| 505 | 13,544 |
eHealth, Inc.(a)
| 1,398 | 98,713 |
El Pollo Loco Holdings, Inc.(a)
| 2,783 | 50,372 |
Employers Holdings, Inc.
| 1,222 | 39,336 |
Enanta Pharmaceuticals, Inc.(a)
| 532 | 22,397 |
Encore Capital Group, Inc.(a)
| 725 | 28,239 |
Encore Wire Corp.
| 587 | 35,555 |
Endo International PLC(a)
| 12,447 | 89,369 |
Enerpac Tool Group Corp.
| 576 | 13,023 |
Enova International, Inc.(a)
| 1,256 | 31,111 |
EnPro Industries, Inc.
| 136 | 10,271 |
Ensign Group, Inc.
| 231 | 16,845 |
ePlus, Inc.(a)
| 395 | 34,740 |
ESCO Technologies, Inc.
| 163 | 16,825 |
Essential Properties Realty Trust, Inc., REIT
| 503 | 10,664 |
Ethan Allen Interiors, Inc.
| 1,051 | 21,241 |
EVERTEC, Inc.
| 819 | 32,203 |
EW Scripps Co., Class A
| 2,361 | 36,100 |
See accompanying notes to financial statements.
Syntax Stratified SmallCap ETF
Schedule of Investments (continued)
December 31, 2020
| Security Description | Shares | Value |
ExlService Holdings, Inc.(a)
| 474 | $40,352 |
Exponent, Inc.
| 130 | 11,704 |
Exterran Corp.(a)
| 1,974 | 8,725 |
Extreme Networks, Inc.(a)
| 6,294 | 43,366 |
EZCORP, Inc., Class A(a)
| 5,552 | 26,594 |
Fabrinet(a)
| 428 | 33,209 |
FARO Technologies, Inc.(a)
| 624 | 44,073 |
FB Financial Corp.
| 490 | 17,018 |
Federal Signal Corp.
| 903 | 29,953 |
Ferro Corp.(a)
| 525 | 7,681 |
Fiesta Restaurant Group, Inc.(a)
| 3,993 | 45,520 |
First BanCorp
| 395 | 3,642 |
First Bancorp/Southern Pines NC
| 106 | 3,586 |
First Commonwealth Financial Corp.
| 333 | 3,643 |
First Financial Bancorp
| 198 | 3,471 |
First Hawaiian, Inc.
| 383 | 9,031 |
First Midwest Bancorp, Inc.
| 1,887 | 30,041 |
Flagstar Bancorp, Inc.
| 241 | 9,823 |
FormFactor, Inc.(a)
| 526 | 22,629 |
Forrester Research, Inc.(a)
| 378 | 15,838 |
Forward Air Corp.
| 200 | 15,368 |
Fossil Group, Inc.(a)
| 1,864 | 16,161 |
Foundation Building Materials, Inc.(a)
| 646 | 12,410 |
Four Corners Property Trust, Inc., REIT
| 325 | 9,675 |
Franklin Electric Co., Inc.
| 234 | 16,195 |
Franklin Street Properties Corp., REIT
| 3,121 | 13,639 |
Fresh Del Monte Produce, Inc.
| 1,092 | 26,284 |
Fulgent Genetics, Inc.(a)
| 397 | 20,684 |
FutureFuel Corp.
| 3,081 | 39,129 |
GameStop Corp., Class A(a)
| 2,482 | 46,761 |
Gannett Co., Inc.(a)
| 11,802 | 39,655 |
GCP Applied Technologies, Inc.(a)
| 281 | 6,646 |
Genesco, Inc.(a)
| 665 | 20,010 |
Gentherm, Inc.(a)
| 391 | 25,501 |
GEO Group, Inc., REIT
| 2,626 | 23,266 |
Getty Realty Corp., REIT
| 328 | 9,033 |
Gibraltar Industries, Inc.(a)
| 146 | 10,503 |
G-III Apparel Group Ltd.(a)
| 1,091 | 25,900 |
Glatfelter Corp.
| 781 | 12,793 |
Glaukos Corp.(a)
| 978 | 73,604 |
Global Net Lease, Inc., REIT
| 870 | 14,912 |
Glu Mobile, Inc.(a)
| 3,610 | 32,526 |
GMS, Inc.(a)
| 441 | 13,442 |
Granite Construction, Inc.
| 1,377 | 36,780 |
Granite Point Mortgage Trust, Inc., REIT
| 1,654 | 16,523 |
Great Western Bancorp, Inc.
| 468 | 9,781 |
Green Dot Corp., Class A(a)
| 590 | 32,922 |
Green Plains, Inc.(a)
| 2,046 | 26,946 |
Greenbrier Companies, Inc.
| 680 | 24,738 |
Greenhill & Co., Inc.
| 796 | 9,663 |
Griffon Corp.
| 2,039 | 41,555 |
Group 1 Automotive, Inc.
| 269 | 35,277 |
| Security Description | Shares | Value |
Guess?, Inc.
| 852 | $19,272 |
Hanger, Inc.(a)
| 1,717 | 37,757 |
Hanmi Financial Corp.
| 315 | 3,572 |
Harmonic, Inc.(a)
| 7,068 | 52,233 |
Harsco Corp.(a)
| 567 | 10,195 |
Haverty Furniture Companies, Inc.
| 2,535 | 70,143 |
Hawaiian Holdings, Inc.
| 3,433 | 60,764 |
Hawkins, Inc.
| 321 | 16,792 |
Haynes International, Inc.
| 616 | 14,685 |
HB Fuller Co.
| 144 | 7,471 |
HCI Group, Inc.
| 972 | 50,836 |
HealthStream, Inc.(a)
| 2,175 | 47,502 |
Heartland Express, Inc.
| 990 | 17,919 |
Heidrick & Struggles International, Inc.
| 297 | 8,726 |
Helix Energy Solutions Group, Inc.(a)
| 2,088 | 8,770 |
Helmerich & Payne, Inc.
| 345 | 7,990 |
Heritage Financial Corp.
| 145 | 3,392 |
Hersha Hospitality Trust, REIT
| 2,354 | 18,573 |
Heska Corp.(a)
| 139 | 20,245 |
Hibbett Sports, Inc.(a)
| 573 | 26,461 |
Hillenbrand, Inc.
| 618 | 24,596 |
HMS Holdings Corp.(a)
| 1,038 | 38,146 |
HomeStreet, Inc.
| 494 | 16,672 |
Hope Bancorp, Inc.
| 328 | 3,578 |
Horace Mann Educators Corp.
| 1,160 | 48,766 |
Hub Group, Inc., Class A(a)
| 256 | 14,592 |
Ichor Holdings Ltd.(a)
| 345 | 10,400 |
Independence Realty Trust, Inc., REIT
| 769 | 10,328 |
Independent Bank Corp.
| 45 | 3,287 |
Independent Bank Group, Inc.
| 468 | 29,259 |
Industrial Logistics Properties Trust, REIT
| 445 | 10,364 |
Innospec, Inc.
| 78 | 7,077 |
Innovative Industrial Properties, Inc., REIT
| 62 | 11,354 |
Innoviva, Inc.(a)
| 2,143 | 26,552 |
Inogen, Inc.(a)
| 1,716 | 76,671 |
Insight Enterprises, Inc.(a)
| 173 | 13,164 |
Installed Building Products, Inc.(a)
| 174 | 17,736 |
Insteel Industries, Inc.
| 1,402 | 31,223 |
Integer Holdings Corp.(a)
| 158 | 12,828 |
Inter Parfums, Inc.
| 1,767 | 106,886 |
Interface, Inc.
| 1,123 | 11,791 |
Invacare Corp.
| 7,300 | 65,335 |
Invesco Mortgage Capital, Inc., REIT
| 2,684 | 9,072 |
Iridium Communications, Inc.(a)
| 1,195 | 46,993 |
iRobot Corp.(a)
| 265 | 21,277 |
iStar, Inc., REIT
| 1,002 | 14,880 |
Itron, Inc.(a)
| 201 | 19,276 |
J & J Snack Foods Corp.
| 185 | 28,743 |
James River Group Holdings Ltd.
| 848 | 41,679 |
John B Sanfilippo & Son, Inc.
| 368 | 29,020 |
John Bean Technologies Corp.
| 197 | 22,432 |
Kaiser Aluminum Corp.
| 103 | 10,187 |
See accompanying notes to financial statements.
Syntax Stratified SmallCap ETF
Schedule of Investments (continued)
December 31, 2020
| Security Description | Shares | Value |
Kaman Corp.
| 221 | $12,626 |
Kelly Services, Inc., Class A
| 374 | 7,693 |
Kite Realty Group Trust, REIT
| 625 | 9,350 |
KKR Real Estate Finance Trust, Inc., REIT
| 192 | 3,441 |
Knowles Corp.(a)
| 2,851 | 52,544 |
Kontoor Brands, Inc.(a)
| 565 | 22,916 |
Koppers Holdings, Inc.(a)
| 623 | 19,413 |
Korn Ferry
| 201 | 8,744 |
Kraton Corp.(a)
| 592 | 16,452 |
Kulicke & Soffa Industries, Inc.
| 327 | 10,402 |
Lannett Co., Inc.(a)
| 10,106 | 65,891 |
Lantheus Holdings, Inc.(a)
| 1,354 | 18,265 |
Laredo Petroleum, Inc.(a)
| 620 | 12,214 |
La-Z-Boy, Inc.
| 510 | 20,318 |
LCI Industries
| 153 | 19,841 |
LeMaitre Vascular, Inc.
| 359 | 14,539 |
Lexington Realty Trust, REIT
| 1,380 | 14,656 |
LGI Homes, Inc.(a)
| 308 | 32,602 |
Lindsay Corp.
| 200 | 25,692 |
Liquidity Services, Inc.(a)
| 6,769 | 107,695 |
Livent Corp.(a)
| 402 | 7,574 |
LivePerson, Inc.(a)
| 754 | 46,921 |
LTC Properties, Inc., REIT
| 426 | 16,576 |
Lumber Liquidators Holdings, Inc.(a)
| 2,157 | 66,306 |
Luminex Corp.
| 813 | 18,797 |
Lydall, Inc.(a)
| 826 | 24,805 |
M/I Homes, Inc.(a)
| 759 | 33,616 |
Mack-Cali Realty Corp., REIT
| 1,119 | 13,943 |
Macy's, Inc.
| 2,983 | 33,559 |
Magellan Health, Inc.(a)
| 497 | 41,171 |
ManTech International Corp., Class A
| 406 | 36,110 |
Marcus & Millichap, Inc.(a)
| 1,219 | 45,383 |
Marcus Corp.
| 2,615 | 35,250 |
MarineMax, Inc.(a)
| 1,074 | 37,622 |
Marten Transport Ltd.
| 1,052 | 18,126 |
Matador Resources Co.(a)
| 1,014 | 12,229 |
Materion Corp.
| 264 | 16,822 |
Matrix Service Co.(a)
| 913 | 10,061 |
Matson, Inc.
| 321 | 18,287 |
Matthews International Corp., Class A
| 716 | 21,050 |
MaxLinear, Inc.(a)
| 2,165 | 82,681 |
MDC Holdings, Inc.
| 688 | 33,437 |
Medifast, Inc.
| 267 | 52,423 |
MEDNAX, Inc.(a)
| 1,736 | 42,601 |
Mercer International, Inc.
| 1,317 | 13,499 |
Meredith Corp.
| 1,691 | 32,467 |
Meridian Bioscience, Inc.(a)
| 1,010 | 18,877 |
Merit Medical Systems, Inc.(a)
| 224 | 12,434 |
Meritage Homes Corp.(a)
| 384 | 31,803 |
Meritor, Inc.(a)
| 515 | 14,374 |
Mesa Laboratories, Inc.
| 71 | 20,351 |
Meta Financial Group, Inc.
| 1,675 | 61,238 |
| Security Description | Shares | Value |
Methode Electronics, Inc.
| 663 | $25,380 |
MGP Ingredients, Inc.
| 1,445 | 68,002 |
Michaels Companies, Inc.(a)
| 2,089 | 27,178 |
MicroStrategy, Inc., Class A(a)
| 153 | 59,448 |
Monarch Casino & Resort, Inc.(a)
| 472 | 28,896 |
Monro, Inc.
| 689 | 36,724 |
Moog, Inc., Class A
| 170 | 13,481 |
Motorcar Parts of America, Inc.(a)
| 2,066 | 40,535 |
Movado Group, Inc.
| 1,456 | 24,199 |
Mr Cooper Group, Inc.(a)
| 603 | 18,711 |
MTS Systems Corp.
| 294 | 17,099 |
Mueller Industries, Inc.
| 494 | 17,344 |
Myers Industries, Inc.
| 525 | 10,909 |
MYR Group, Inc.(a)
| 149 | 8,955 |
Myriad Genetics, Inc.(a)
| 1,258 | 24,877 |
Nabors Industries Ltd.
| 117 | 6,813 |
National Bank Holdings Corp., Class A
| 860 | 28,174 |
National Beverage Corp.
| 334 | 28,357 |
National Presto Industries, Inc.
| 330 | 29,182 |
National Storage Affiliates Trust, REIT
| 429 | 15,457 |
Natus Medical, Inc.(a)
| 954 | 19,118 |
NBT Bancorp, Inc.
| 273 | 8,763 |
Neenah, Inc.
| 241 | 13,332 |
NeoGenomics, Inc.(a)
| 327 | 17,606 |
NETGEAR, Inc.(a)
| 1,090 | 44,287 |
New York Mortgage Trust, Inc., REIT
| 2,349 | 8,668 |
NexPoint Residential Trust, Inc., REIT
| 237 | 10,027 |
NextGen Healthcare, Inc.(a)
| 2,508 | 45,746 |
NIC, Inc.
| 1,806 | 46,649 |
NMI Holdings, Inc., Class A(a)
| 1,687 | 38,211 |
Northfield Bancorp, Inc.
| 297 | 3,662 |
Northwest Bancshares, Inc.
| 709 | 9,033 |
Northwest Natural Holding Co.
| 2,032 | 93,452 |
NOW, Inc.(a)
| 1,962 | 14,087 |
Oceaneering International, Inc.(a)
| 1,065 | 8,467 |
ODP Corp.
| 996 | 29,183 |
Office Properties Income Trust, REIT
| 625 | 14,200 |
OFG Bancorp
| 1,630 | 30,220 |
Oil States International, Inc.(a)
| 1,662 | 8,343 |
Old National Bancorp
| 211 | 3,494 |
Olympic Steel, Inc.
| 1,006 | 13,410 |
Omnicell, Inc.(a)
| 383 | 45,968 |
OneSpan, Inc.(a)
| 4,846 | 100,215 |
Onto Innovation, Inc.(a)
| 468 | 22,253 |
OraSure Technologies, Inc.(a)
| 1,544 | 16,343 |
Orthofix Medical, Inc.(a)
| 1,746 | 75,043 |
OSI Systems, Inc.(a)
| 184 | 17,152 |
Owens & Minor, Inc.
| 453 | 12,254 |
Oxford Industries, Inc.
| 301 | 19,719 |
Pacific Premier Bancorp, Inc.
| 118 | 3,697 |
Pacira BioSciences, Inc.(a)
| 378 | 22,620 |
Palomar Holdings, Inc.(a)
| 682 | 60,589 |
See accompanying notes to financial statements.
Syntax Stratified SmallCap ETF
Schedule of Investments (continued)
December 31, 2020
| Security Description | Shares | Value |
Par Pacific Holdings, Inc.(a)
| 2,845 | $39,773 |
Park Aerospace Corp.
| 481 | 6,450 |
Park National Corp.
| 32 | 3,360 |
Patrick Industries, Inc.
| 287 | 19,616 |
Patterson-UTI Energy, Inc.
| 1,572 | 8,269 |
PBF Energy, Inc., Class A
| 4,535 | 32,198 |
PC Connection, Inc.
| 275 | 13,005 |
PDC Energy, Inc.(a)
| 690 | 14,166 |
PDF Solutions, Inc.(a)
| 1,344 | 29,030 |
Penn Virginia Corp.(a)
| 1,320 | 13,398 |
Pennant Group, Inc.(a)
| 294 | 17,070 |
PennyMac Mortgage Investment Trust, REIT
| 956 | 16,816 |
Perdoceo Education Corp.(a)
| 3,920 | 49,510 |
Perficient, Inc.(a)
| 708 | 33,736 |
PetMed Express, Inc.
| 3,317 | 106,343 |
PGT Innovations, Inc.(a)
| 842 | 17,126 |
Phibro Animal Health Corp., Class A
| 3,606 | 70,029 |
Photronics, Inc.(a)
| 982 | 10,959 |
Piper Sandler Companies
| 105 | 10,594 |
Pitney Bowes, Inc.
| 4,118 | 25,367 |
Plantronics, Inc.
| 1,548 | 41,842 |
Plexus Corp.(a)
| 1,288 | 100,734 |
Powell Industries, Inc.
| 502 | 14,804 |
Power Integrations, Inc.
| 910 | 74,493 |
PRA Group, Inc.(a)
| 655 | 25,977 |
Preferred Bank
| 77 | 3,886 |
PriceSmart, Inc.
| 566 | 51,557 |
ProAssurance Corp.
| 2,207 | 39,263 |
Progress Software Corp.
| 1,052 | 47,540 |
ProPetro Holding Corp.(a)
| 1,172 | 8,661 |
Proto Labs, Inc.(a)
| 252 | 38,657 |
Providence Service Corp.(a)
| 171 | 23,706 |
Provident Financial Services, Inc.
| 201 | 3,610 |
QEP Resources, Inc.
| 5,565 | 13,300 |
Quaker Chemical Corp.
| 63 | 15,964 |
Quanex Building Products Corp.
| 742 | 16,450 |
QuinStreet, Inc.(a)
| 788 | 16,895 |
R1 RCM, Inc.(a)
| 507 | 12,178 |
RadNet, Inc.(a)
| 1,323 | 25,891 |
Rambus, Inc.(a)
| 3,748 | 65,440 |
Range Resources Corp.
| 1,868 | 12,516 |
Raven Industries, Inc.
| 220 | 7,280 |
Rayonier Advanced Materials, Inc.(a)
| 1,661 | 10,830 |
RE/MAX Holdings, Inc., Class A
| 1,331 | 48,355 |
Ready Capital Corp., REIT
| 300 | 3,735 |
Realogy Holdings Corp.(a)
| 3,289 | 43,152 |
Red Robin Gourmet Burgers, Inc.(a)
| 948 | 18,230 |
Redwood Trust, Inc., REIT
| 1,001 | 8,789 |
REGENXBIO, Inc.(a)
| 1,652 | 74,935 |
Regis Corp.(a)
| 2,803 | 25,760 |
Renasant Corp.
| 263 | 8,858 |
Renewable Energy Group, Inc.(a)
| 600 | 42,492 |
| Security Description | Shares | Value |
Rent-A-Center, Inc.
| 775 | $29,675 |
Resideo Technologies, Inc.(a)
| 934 | 19,857 |
Resources Connection, Inc.
| 851 | 10,697 |
Retail Opportunity Investments Corp., REIT
| 700 | 9,373 |
Retail Properties of America, Inc., REIT, Class A
| 1,066 | 9,125 |
REX American Resources Corp.(a)
| 323 | 23,731 |
Rogers Corp.(a)
| 51 | 7,920 |
RPC, Inc.(a)
| 2,275 | 7,166 |
RPT Realty, REIT
| 1,146 | 9,913 |
Ruth's Hospitality Group, Inc.
| 1,140 | 20,212 |
S&T Bancorp, Inc.
| 145 | 3,602 |
Safehold, Inc., REIT
| 147 | 10,656 |
Safety Insurance Group, Inc.
| 640 | 49,856 |
Saia, Inc.(a)
| 80 | 14,464 |
Sally Beauty Holdings, Inc.(a)
| 2,263 | 29,510 |
Sanmina Corp.(a)
| 3,084 | 98,349 |
Saul Centers, Inc., REIT
| 284 | 8,997 |
ScanSource, Inc.(a)
| 459 | 12,108 |
Scholastic Corp.
| 1,277 | 31,925 |
Schweitzer-Mauduit International, Inc.
| 343 | 13,792 |
Seacoast Banking Corp. of Florida(a)
| 124 | 3,652 |
SEACOR Holdings, Inc.(a)
| 1,779 | 73,740 |
Select Medical Holdings Corp.(a)
| 1,560 | 43,150 |
Seneca Foods Corp., Class A(a)
| 700 | 27,930 |
ServisFirst Bancshares, Inc.
| 88 | 3,546 |
Shake Shack, Inc., Class A(a)
| 573 | 48,579 |
Shenandoah Telecommunications Co.
| 886 | 38,319 |
Shoe Carnival, Inc.
| 548 | 21,471 |
Shutterstock, Inc.
| 1,468 | 105,256 |
Signet Jewelers Ltd.
| 1,253 | 34,169 |
Simmons First National Corp., Class A
| 165 | 3,562 |
Simply Good Foods Co.(a)
| 1,146 | 35,939 |
Simulations Plus, Inc.
| 743 | 53,437 |
SITE Centers Corp., REIT
| 919 | 9,300 |
SkyWest, Inc.
| 1,536 | 61,916 |
Sleep Number Corp.(a)
| 242 | 19,810 |
SM Energy Co.
| 2,027 | 12,405 |
SMART Global Holdings, Inc.(a)
| 1,927 | 72,513 |
Sonic Automotive, Inc., Class A
| 797 | 30,740 |
South Jersey Industries, Inc.
| 4,318 | 93,053 |
Southside Bancshares, Inc.
| 111 | 3,444 |
Southwestern Energy Co.(a)
| 4,148 | 12,361 |
SpartanNash Co.
| 2,812 | 48,957 |
Spectrum Pharmaceuticals, Inc.(a)
| 4,666 | 15,911 |
Spok Holdings, Inc.
| 3,959 | 44,064 |
SPS Commerce, Inc.(a)
| 457 | 49,626 |
SPX Corp.(a)
| 606 | 33,051 |
SPX FLOW, Inc.(a)
| 284 | 16,461 |
St Joe Co.
| 278 | 11,801 |
Stamps.com, Inc.(a)
| 62 | 12,164 |
Standard Motor Products, Inc.
| 965 | 39,044 |
See accompanying notes to financial statements.
Syntax Stratified SmallCap ETF
Schedule of Investments (continued)
December 31, 2020
| Security Description | Shares | Value |
Standex International Corp.
| 505 | $39,148 |
Stepan Co.
| 92 | 10,977 |
Steven Madden Ltd.
| 1,009 | 35,638 |
Stewart Information Services Corp.
| 1,368 | 66,156 |
StoneX Group, Inc.(a)
| 1,047 | 60,621 |
Sturm Ruger & Co., Inc.
| 628 | 40,864 |
Summit Hotel Properties, Inc., REIT
| 2,147 | 19,344 |
SunCoke Energy, Inc.
| 3,039 | 13,220 |
Supernus Pharmaceuticals, Inc.(a)
| 1,014 | 25,512 |
Surmodics, Inc.(a)
| 324 | 14,100 |
Sykes Enterprises, Inc.(a)
| 210 | 7,911 |
Tabula Rasa HealthCare, Inc.(a)
| 1,173 | 50,251 |
Tactile Systems Technology, Inc.(a)
| 1,726 | 77,566 |
Talos Energy, Inc.(a)
| 1,465 | 12,072 |
Tanger Factory Outlet Centers, Inc., REIT
| 857 | 8,536 |
Team, Inc.(a)
| 992 | 10,813 |
TechTarget, Inc.(a)
| 276 | 16,314 |
Tennant Co.
| 340 | 23,858 |
Third Point Reinsurance Ltd.(a)
| 4,130 | 39,318 |
TimkenSteel Corp.(a)
| 2,771 | 12,941 |
Titan International, Inc.
| 1,891 | 9,190 |
Tivity Health, Inc.(a)
| 908 | 17,788 |
Tompkins Financial Corp.
| 52 | 3,671 |
Tredegar Corp.
| 354 | 5,912 |
Trinseo S.A.
| 172 | 8,808 |
Triumph Bancorp, Inc.(a)
| 589 | 28,596 |
Triumph Group, Inc.
| 703 | 8,830 |
TrueBlue, Inc.(a)
| 406 | 7,588 |
Trupanion, Inc.(a)
| 480 | 57,461 |
TrustCo Bank Corp. NY
| 1,391 | 9,278 |
TTEC Holdings, Inc.
| 112 | 8,168 |
TTM Technologies, Inc.(a)
| 3,741 | 51,607 |
Tupperware Brands Corp.(a)
| 1,212 | 39,257 |
UFP Industries, Inc.
| 610 | 33,885 |
Ultra Clean Holdings, Inc.(a)
| 321 | 9,999 |
Unifi, Inc.(a)
| 435 | 7,717 |
UniFirst Corp.
| 189 | 40,009 |
Unisys Corp.(a)
| 1,895 | 37,294 |
United Community Banks, Inc.
| 128 | 3,640 |
United Fire Group, Inc.
| 1,650 | 41,415 |
United Insurance Holdings Corp.
| 10,727 | 61,358 |
United Natural Foods, Inc.(a)
| 3,181 | 50,801 |
Uniti Group, Inc., REIT
| 924 | 10,839 |
Universal Corp.
| 1,334 | 64,846 |
Universal Electronics, Inc.(a)
| 757 | 39,712 |
Universal Health Realty Income Trust, REIT
| 147 | 9,448 |
Universal Insurance Holdings, Inc.
| 3,433 | 51,873 |
Urstadt Biddle Properties, Inc., REIT, Class A
| 654 | 9,241 |
| Security Description | Shares | Value |
US Concrete, Inc.(a)
| 926 | $37,012 |
US Ecology, Inc.
| 1,027 | 37,311 |
US Physical Therapy, Inc.
| 221 | 26,575 |
US Silica Holdings, Inc.
| 1,325 | 9,301 |
USANA Health Sciences, Inc.(a)
| 377 | 29,067 |
Vanda Pharmaceuticals, Inc.(a)
| 1,724 | 22,653 |
Varex Imaging Corp.(a)
| 1,227 | 20,466 |
Vector Group Ltd.
| 5,298 | 61,722 |
Veeco Instruments, Inc.(a)
| 630 | 10,937 |
Vera Bradley, Inc.(a)
| 4,560 | 36,298 |
Veritex Holdings, Inc.
| 147 | 3,772 |
Veritiv Corp.(a)
| 658 | 13,680 |
Viad Corp.
| 510 | 18,447 |
Viavi Solutions, Inc.(a)
| 1,648 | 24,679 |
Vicor Corp.(a)
| 792 | 73,038 |
Virtus Investment Partners, Inc.
| 269 | 58,373 |
Virtusa Corp.(a)
| 657 | 33,592 |
Vista Outdoor, Inc.(a)
| 2,038 | 48,423 |
Vonage Holdings Corp.(a)
| 7,397 | 95,236 |
Wabash National Corp.
| 1,311 | 22,589 |
Waddell & Reed Financial, Inc., Class A
| 2,243 | 57,129 |
Walker & Dunlop, Inc.
| 193 | 17,760 |
Warrior Met Coal, Inc.
| 783 | 16,694 |
Washington Real Estate Investment Trust, REIT
| 637 | 13,778 |
Watts Water Technologies, Inc., Class A
| 139 | 16,916 |
WD-40 Co.
| 28 | 7,439 |
Westamerica BanCorp
| 528 | 29,193 |
Whitestone REIT
| 1,173 | 9,349 |
Winnebago Industries, Inc.
| 844 | 50,589 |
WisdomTree Investments, Inc.
| 11,480 | 61,418 |
Wolverine World Wide, Inc.
| 1,079 | 33,719 |
World Acceptance Corp.(a)
| 247 | 25,248 |
Xencor, Inc.(a)
| 1,525 | 66,536 |
Xenia Hotels & Resorts, Inc., REIT
| 1,312 | 19,942 |
Xperi Holding Corp.
| 565 | 11,808 |
YETI Holdings, Inc.(a)
| 580 | 39,713 |
Zumiez, Inc.(a)
| 894 | 32,881 |
Zynex, Inc.(a)
| 5,068 | 68,215 |
INVESTMENTS IN
COMMON STOCK—99.8%
(Cost $13,317,365)
| | 17,193,870 |
OTHER ASSETS IN EXCESS OF LIABILITIES—0.2%
| | 32,236 |
NET ASSETS—100.0%
| | $17,226,106 |
| (a) | Non-income producing security. |
| PLC=Public Limited Company |
| REIT=Real Estate Investment Trust |
See accompanying notes to financial statements.
Syntax Stratified SmallCap ETF
Schedule of Investments (continued)
December 31, 2020
INDUSTRY BREAKDOWN
AS OF December 31, 2020*
| INDUSTRY | PERCENTAGE OF
NET ASSETS |
Branded Pharmaceuticals
| 4.9% |
Healthcare Providers and Facilities
| 3.5 |
Commercial Hardware
| 3.4 |
Business Software for Specific Uses
| 2.9 |
Midstream and Gas
| 2.9 |
Medical Devices
| 2.5 |
Non Real Estate Banking
| 2.5 |
Consumer Insurance
| 2.5 |
Content Providers
| 2.5 |
Home Office and Consumer Equipment Manufacture
| 2.4 |
Operators and Developers
| 2.4 |
Real Estate Banking
| 2.4 |
Management and IT Services
| 2.4 |
Transaction Services
| 2.4 |
Transportation Services
| 2.3 |
Telecommunication Networks
| 2.3 |
Rental
| 2.2 |
Home Office and Consumer Equipment Retail
| 2.2 |
Hospital Equipment
| 2.2 |
Auto Products
| 2.2 |
Business Software for Specific Industries
| 2.2 |
Commercial Insurance
| 2.0 |
Investment Services
| 2.0 |
Information and Electrical Components
| 2.0 |
Production Equipment
| 1.8 |
Food Distributors
| 1.8 |
Mechanical Components
| 1.8 |
Distribution Services
| 1.7 |
Analog and Mixed Signal Integrated Circuits
| 1.7 |
Restaurants
| 1.7 |
Upstream Energy
| 1.7 |
Digital Integrated Circuits
| 1.6 |
Specialty Services
| 1.6 |
Semiconductor Services and Equipment
| 1.6 |
Chemicals
| 1.4 |
Apparel Retailers
| 1.4 |
Online Distribution Networks
| 1.2 |
Processed Foods
| 1.2 |
Other Natural Resources
| 1.2 |
Branded Apparel
| 1.2 |
Contract Electronics Services
| 1.2 |
Alcohol and Tobacco
| 1.1 |
Primary Foods
| 1.1 |
| INDUSTRY | PERCENTAGE OF
NET ASSETS |
Metals
| 1.0% |
Accessories and Footwear
| 1.0 |
Transport Aerospace and Defense Equipment
| 1.0 |
Midstream
| 0.9 |
Industrial Conglomerates
| 0.7 |
Healthcare Products Distribution
| 0.7 |
Downstream
| 0.7 |
Personal Products
| 0.6 |
Drugstores
| 0.6 |
Electric Regulated
| 0.6 |
Consumer Paper Products
| 0.6 |
Search and Social Networks
| 0.6 |
Internet Services
| 0.6 |
Brokers and Dealers
| 0.4 |
End User Hardware
| 0.2 |
Vitamins and Nutritional Supplements
| 0.2 |
Consumer Services
| 0.1 |
Medical Research Services and Equipment
| 0.1 |
Other Assets in Excess of Liabilities
| 0.2 |
| Total | 100.0% |
* The Fund’s industry breakdown is expressed as a percentage of net assets and may change over time.
See accompanying notes to financial statements.
Syntax ETF Trust
Statements of Assets and Liabilities
December 31, 2020
| | Syntax Stratified
LargeCap ETF | | Syntax Stratified
MidCap ETF | | Syntax Stratified
SmallCap ETF |
| ASSETS | | | | | |
Investments in securities of unaffiliated issuers
| $41,890,187 | | $3,411,704 | | $17,193,870 |
Cash
| 64,400 | | 7,328 | | 26,964 |
Dividends receivable
| 44,950 | | 2,476 | | 9,600 |
Total Assets
| 41,999,537 | | 3,421,508 | | 17,230,434 |
| LIABILITIES | | | | | |
Accrued Management fee
| 10,468 | | 842 | | 4,311 |
Accrued Other fees
| 4 | | — | | 17 |
Total Liabilities
| 10,472 | | 842 | | 4,328 |
NET ASSETS
| $41,989,065 | | $3,420,666 | | $17,226,106 |
| NET ASSETS CONSISTS OF: | | | | | |
Paid in Capital
| 35,173,885 | | 2,554,449 | | 12,662,933 |
Distributable earnings
| 6,815,180 | | 866,217 | | 4,563,173 |
NET ASSETS
| $41,989,065 | | $3,420,666 | | $17,226,106 |
NET ASSET VALUE PER SHARE
| $55.99 | | $34.21 | | $43.07 |
SHARES OUTSTANDING (unlimited number of shares authorized, no par value)
| 750,000 | | 100,000 | | 400,000 |
COST OF INVESTMENTS
| $33,789,937 | | $2,550,025 | | $13,317,365 |
See accompanying notes to financial statements.
Syntax ETF Trust
Statements of Operations
| | Syntax Stratified
LargeCap ETF | | Syntax Stratified
MidCap ETF | | Syntax Stratified
SmallCap ETF |
| | Year Ended
12/31/20 | | For the Period 1/16/20(a)
to 12/31/20 | | For the Period 5/28/20(b)
to 12/31/20 |
| INVESTMENT INCOME | | | | | |
Dividend income (net of foreign taxes withheld of $0, $5 and $55, respectively)
| $671,585 | | $36,777 | | $103,808 |
Total Investment Income
| 671,585 | | 36,777 | | 103,808 |
| EXPENSES | | | | | |
Management fee
| 141,733 | | 11,793 | | 37,656 |
Other fees
| 1,376 | | 100 | | 356 |
Total Expenses
| 143,109 | | 11,893 | | 38,012 |
Expense Waiver/Reimbursement
| (47,244) | | (3,931) | | (12,552) |
Net Expenses
| 95,865 | | 7,962 | | 25,460 |
NET INVESTMENT INCOME (LOSS)
| 575,720 | | 28,815 | | 78,348 |
| REALIZED AND UNREALIZED GAIN (LOSS) | | | | | |
Net realized gain (loss) from transactions in investment securities
| (1,199,985) | | 9,085 | | 815,196 |
Net realized gain (loss) from in-kind redemptions of investments
| 9,352,080 | | — | | 1,881,789 |
Net realized gain (loss)
| 8,152,095 | | 9,085 | | 2,696,985 |
Net change in unrealized appreciation/depreciation on Investments
| (2,055,792) | | 412,868 | | 2,574,574 |
NET REALIZED AND UNREALIZED GAIN (LOSS)
| 6,096,303 | | 421,953 | | 5,271,559 |
NET INCREASE (DECREASE) IN NET ASSETS FROM OPERATIONS
| $6,672,023 | | $450,768 | | $5,349,907 |
| (a) | Fund commenced operations on January 16, 2020. |
| (b) | Fund commenced operations on May 28, 2020. |
See accompanying notes to financial statements.
Syntax ETF Trust
Statements of Changes in Net Assets
| | Syntax Stratified
LargeCap ETF | | Syntax Stratified
MidCap ETF | | Syntax Stratified
SmallCap ETF |
| | Year Ended
12/31/20 | | For the Period 1/2/19(a)
to 12/31/19 | | For the Period 1/16/20(b)
to 12/31/20 | | For the Period 5/28/20(c)
to 12/31/20 |
| INCREASE (DECREASE) IN NET ASSETS FROM OPERATIONS: | | | | | | | |
Net investment income (loss)
| $575,720 | | $942,339 | | $28,815 | | $78,348 |
Net realized gain (loss)
| 8,152,095 | | (428,382) | | 9,085 | | 2,696,985 |
Net change in unrealized appreciation/depreciation
| (2,055,792) | | 12,145,204 | | 412,868 | | 2,574,574 |
NET INCREASE (DECREASE) IN NET ASSETS RESULTING FROM OPERATIONS
| 6,672,023 | | 12,659,161 | | 450,768 | | 5,349,907 |
| DISTRIBUTIONS TO SHAREHOLDERS | | | | | | | |
Distributions to Shareholders
| (684,065) | | (964,675) | | (30,102) | | (149,507) |
| INCREASE (DECREASE) IN NET ASSETS FROM SHARE TRANSACTIONS: | | | | | | | |
Proceeds from Shares Sold
| 16,583,551 | | 56,595,018 | | 3,000,000 | | 16,028,533 |
Cost of Shares Redeemed
| (42,731,376) | | (6,240,572) | | — | | (4,002,827) |
INCREASE (DECREASE) IN NET ASSETS FROM SHARE TRANSACTIONS:
| (26,147,825) | | 50,354,446 | | 3,000,000 | | 12,025,706 |
NET INCREASE (DECREASE) IN NET ASSETS DURING THE PERIOD
| (20,159,867) | | 62,048,932 | | 3,420,666 | | 17,226,106 |
NET ASSETS AT BEGINNING OF PERIOD
| 62,148,932 | | 100,000 | | — | | — |
NET ASSETS AT END OF PERIOD
| $41,989,065 | | $62,148,932 | | $3,420,666 | | $17,226,106 |
| SHARE TRANSACTIONS: | | | | | | | |
Shares sold
| 375,000 | | 1,372,500 | | 100,000 | | 525,000 |
Shares redeemed
| (850,000) | | (150,000) | | — | | (125,000) |
NET INCREASE (DECREASE)
| (475,000) | | 1,222,500 | | 100,000 | | 400,000 |
| (a) | Fund commenced operations on January 2, 2019. |
| (b) | Fund commenced operations on January 16, 2020. |
| (c) | Fund commenced operations on May 28, 2020. |
See accompanying notes to financial statements.
Syntax ETF Trust
Financial Highlights
Selected data for a share outstanding throughout each period
| | Syntax Stratified
LargeCap ETF |
| | Year Ended
12/31/20 | | For the
Period
1/2/19(a)
to 12/31/19 |
Net asset value, beginning of period
| $50.73 | | $40.00 |
| Income (loss) from investment operations: | | | |
Net investment income (loss)(b)
| 0.88 | | 0.84 |
Net realized and unrealized gain (loss)
| 5.29 | | 10.68 |
Total from investment operations
| 6.17 | | 11.52 |
| Less Distributions from: | | | |
Net investment income
| (0.82) | | (0.79) |
Net realized gains
| (0.09) | | — |
Net asset value, end of period
| $55.99 | | $50.73 |
Total return(c)
| 12.18% | | 28.81%(d) |
| Ratios and Supplemental Data: | | | |
Net assets, end of period (000s)
| $41,989 | | $62,149 |
| Ratios to average net assets: | | | |
Total expenses
| 0.45% | | 0.80%(e) |
Net expenses(f)
| 0.30% | | 0.30%(e) |
Net investment income (loss)(f)
| 1.83% | | 1.80%(e) |
Portfolio turnover rate(g)
| 36% | | 34%(d) |
| (a) | Fund commenced operations on January 2, 2019. |
| (b) | Per Share numbers have been calculated using the average shares method. |
| (c) | Total return is calculated assuming a purchase of Shares at net asset value per Share on the first day and a sale at net asset value per Share on the last day of each period reported. Distributions are assumed, for the purposes of this calculation, to be reinvested at the net asset value per Share on the respective payment dates of the Fund. Total return for a period of less than one year is not annualized. Broker commission charges are not included in this calculation. Past performance is no guarantee of future results. Performance results do not reflect the deduction of taxes that a shareholder would pay on fund distributions or on the redemption or sale of fund shares. |
| (d) | Not annualized. |
| (e) | Annualized. |
| (f) | Net of expenses waived/reimbursed by the Advisor. |
| (g) | Portfolio turnover rate excludes securities received or delivered from in-kind processing of creations or redemptions of Shares. |
See accompanying notes to financial statements.
Syntax ETF Trust
Financial Highlights
Selected data for a share outstanding throughout this period
| | Syntax Stratified
MidCap ETF |
| | For the
Period
1/16/20(a)
to 12/31/20 |
Net asset value, beginning of period
| $30.00 |
| Income (loss) from investment operations: | |
Net investment income (loss)(b)
| 0.29 |
Net realized and unrealized gain (loss)
| 4.22 |
Total from investment operations
| 4.51 |
| Less Distributions from: | |
Net investment income
| (0.30) |
Net asset value, end of period
| $34.21 |
Total return(c)
| 15.04%(d) |
| Ratios and Supplemental Data: | |
Net assets, end of period (000s)
| $3,421 |
| Ratios to average net assets: | |
Total expenses
| 0.45%(e) |
Net expenses(f)
| 0.30%(e) |
Net investment income (loss)(f)
| 1.10%(e) |
Portfolio turnover rate(g)
| 52%(d) |
| (a) | Fund commenced operations on January 16, 2020. |
| (b) | Per Share numbers have been calculated using the average shares method. |
| (c) | Total return is calculated assuming a purchase of Shares at net asset value per Share on the first day and a sale at net asset value per Share on the last day of each period reported. Distributions are assumed, for the purposes of this calculation, to be reinvested at the net asset value per Share on the respective payment dates of the Fund. Total return for a period of less than one year is not annualized. Broker commission charges are not included in this calculation. Past performance is no guarantee of future results. Performance results do not reflect the deduction of taxes that a shareholder would pay on fund distributions or on the redemption or sale of fund shares. |
| (d) | Not annualized. |
| (e) | Annualized. |
| (f) | Net of expenses waived/reimbursed by the Advisor. |
| (g) | Portfolio turnover rate excludes securities received or delivered from in-kind processing of creations or redemptions of Shares. |
See accompanying notes to financial statements.
Syntax ETF Trust
Financial Highlights
Selected data for a share outstanding throughout this period
| | Syntax Stratified
SmallCap ETF |
| | For the
Period
5/28/20(a)
to 12/31/20 |
Net asset value, beginning of period
| $30.00 |
| Income (loss) from investment operations: | |
Net investment income (loss)(b)
| 0.20 |
Net realized and unrealized gain (loss)
| 13.24 |
Total from investment operations
| 13.44 |
| Less Distributions from: | |
Net investment income
| (0.19) |
Net realized gains
| (0.18) |
Net asset value, end of period
| $43.07 |
Total return(c)
| 44.82%(d) |
| Ratios and Supplemental Data: | |
Net assets, end of period (000s)
| $17,226 |
| Ratios to average net assets: | |
Total expenses
| 0.45%(e) |
Net expenses(f)
| 0.30%(e) |
Net investment income (loss)(f)
| 0.93%(e) |
Portfolio turnover rate(g)
| 40%(d) |
| (a) | Fund commenced operations on May 28, 2020. |
| (b) | Per Share numbers have been calculated using the average shares method. |
| (c) | Total return is calculated assuming a purchase of Shares at net asset value per Share on the first day and a sale at net asset value per Share on the last day of each period reported. Distributions are assumed, for the purposes of this calculation, to be reinvested at the net asset value per Share on the respective payment dates of the Fund. Total return for a period of less than one year is not annualized. Broker commission charges are not included in this calculation. Past performance is no guarantee of future results. Performance results do not reflect the deduction of taxes that a shareholder would pay on fund distributions or on the redemption or sale of fund shares. |
| (d) | Not annualized. |
| (e) | Annualized. |
| (f) | Net of expenses waived/reimbursed by the Advisor. |
| (g) | Portfolio turnover rate excludes securities received or delivered from in-kind processing of creations or redemptions of Shares. |
See accompanying notes to financial statements.
Syntax ETF Trust
Notes to Financial Statements
December 31, 2020
Note 1—Organization
Syntax ETF Trust (the “Trust”), was organized under the laws of the State of Delaware as a statutory trust on June 27, 2013 pursuant to an Agreement and Declaration of Trust (the “Trust Deed”). Syntax Stratified LargeCap ETF, Syntax Stratified MidCap ETF, and Syntax Stratified SmallCap ETF (each a “Fund”, and collectively, the "Funds"), are each a series of the Trust.
Each Fund is registered under the U.S. Investment Company Act of 1940, as amended (the “1940 Act”), as an open-end, diversified management investment company. The Funds have no fixed termination date and will continue unless the Fund is otherwise terminated under the terms of the Trust or unless and until required by law. Syntax Advisors, LLC (the “Advisor” or “Syntax Advisors”), a New York limited liability company, serves as the Funds’ investment adviser.
Investment Objectives:
The Funds seek to provide investment results that, before expenses, correspond generally to the total return performance of publicly traded equity securities of companies comprising the respective index listed below (each, an “Underlying Index”):
| Fund | | Underlying Index |
Syntax Stratified LargeCap ETF
| | Syntax Stratified LargeCap Index |
Syntax Stratified MidCap ETF
| | Syntax Stratified MidCap Index |
Syntax Stratified SmallCap ETF
| | Syntax Stratified SmallCap Index |
Each Fund’s investment objective is to provide long-term total investment returns (capital gains plus income). To achieve the investment objective for Syntax Stratified LargeCap ETF, Syntax Stratified MidCap ETF and Syntax Stratified SmallCap ETF, the Advisor will seek to track the performance of each Underlying Index, which are stratified-weight versions of the widely used S&P 500® Index, S&P MidCap 400® Index and S&P SmallCap 600® Index, respectively. In addition, the Funds may invest in cash and cash equivalents or money market instruments, such as repurchase agreements and money market funds.
Refer to the Additional Strategies Information section of each Fund’s prospectus for more information on the methodology of the Syntax Indices.
Note 2—Significant Accounting Policies
Each Fund is an investment company and accordingly follows the investment company accounting and reporting guidance of the Financial Accounting Standards Board (“FASB”) Accounting Standards Codification (“ASC”) Topic 946 Financial Services – Investment Companies. The accompanying financial statements of the Funds are prepared in accordance with accounting principles generally accepted in the United States (“GAAP”) and in accordance with ASC as set forth by the FASB. Each Fund maintains its financial records in U.S. dollars and follows the accrual basis of accounting.
In preparing the Funds’ financial statements in accordance with GAAP, estimates or assumptions (which could differ from actual results) may be used that affect reported amounts and disclosures.
The following is a summary of significant accounting policies followed by the Funds.
In-Kind Seeding
Syntax Stratified LargeCap ETF was seeded through the exchange of ETF Shares for the securities held by the Syntax 500 Series of Syntax Index Series LP on January 2, 2019, Syntax Stratified MidCap ETF was seeded through the exchange of ETF Shares for the securities held by the Syntax 400 Series of Syntax Index Series LP on January 16, 2020 and Syntax Stratified SmallCap ETF was seeded through the exchange of ETF Shares for the securities held by the following Series of Syntax Index LP on May 28, 2020 (the “Transactions”): Financial Products and Services Series,
Syntax ETF Trust
Notes to Financial Statements (continued)
December 31, 2020
Note 2—Significant Accounting Policies–(continued)
Energy Products and Services Series, Industrial Products and Services Series, Information Tools Series, Information Products and Services Series, Consumer Products and Services Series, Food Products and Services Series and Healthcare Products Series.
The Syntax 500 Series, the Syntax 400 Series and the 8 Sector Series of the Syntax Index LP (each a “Series”) were unregistered funds managed by the Advisor. The Transactions were structured as tax-free exchanges of shares. Accordingly, the Funds carried forward the historical cost basis of investments and cumulative unrealized gains and losses as reported by the respective Series prior to the Transactions. Investment companies carry substantially all their assets at fair market value for periodic and ongoing reporting. The primary use of historical cost basis is to determine both realized and unrealized gains and losses.
The Transactions were designed to more closely align subsequent reporting of realized gains or losses with actual tax-basis gains distributable to ETF shareholders. The Transactions resulted in the following:
| | Initial Market Value of Securities acquired by Fund | | Cost Basis | | Unrealized Gain (Loss) |
Syntax Stratified LargeCap ETF
| $33,554,457 | | $35,543,619 | | $(1,989,162) |
Syntax Stratified MidCap ETF
| 2,785,553 | | 2,336,742 | | 448,811 |
Syntax Stratified SmallCap ETF
| 11,391,517 | | 10,089,586 | | 1,301,931 |
Investment Valuation
The following methodologies are used to determine the market value or fair value of investments. Equity investments (including preferred stocks and registered investment companies that are exchange-traded funds) traded on a recognized securities exchange for which market quotations are readily available are valued at the last sale price or official closing price, as applicable, on the primary market or exchange on which they trade. Equity investments traded on a recognized exchange for which there were no sales on that day are valued at the last published sale price or at fair value.
Investments for which valuations or market quotations are not readily available or are deemed unreliable are valued at fair value using methods determined in good faith by or at the direction of the Trustees of the Fund in a manner that fairly reflects the security’s value, or the amount that the Fund might reasonably expect to receive for the security upon its current sale in the ordinary course. Each such determination is based on a consideration of relevant factors, which are likely to vary from one pricing context to another. These factors may include, but are not limited to, the type of security, the existence of any contractual restrictions on the security’s disposition, the price and extent of public trading in similar securities of the issuer or of comparable companies or entities, quotations or relevant information obtained from broker/dealers or other market participants, information obtained from the issuer, analysts, and/or the appropriate stock exchange (for exchange-traded securities), an analysis of the company’s or entity’s financial condition, and an evaluation of the forces that influence the issuer and the market(s) in which the security is purchased and sold.
Under generally accepted accounting principles for fair value measurements, a three-tier hierarchy to prioritize the assumptions, referred to as inputs, is used in valuation techniques to measure fair value. The three-tier hierarchy of inputs is summarized in the three broad levels listed below.
The three levels of the fair value hierarchy are as follows:
| • | Level 1 — Quoted prices in active markets for identical investments |
| • | Level 2 — Other significant observable inputs (including quoted prices for similar investments, interest rates, prepayment speeds, credit risk, etc.) |
Syntax ETF Trust
Notes to Financial Statements (continued)
December 31, 2020
Note 2—Significant Accounting Policies–(continued)
| • | Level 3 — Significant unobservable inputs (including a fund’s own assumptions in determining the fair value of investments) |
The following table summarizes the value of each Fund’s investments according to the fair value hierarchy as of December 31, 2020.
| Description | Level 1 | Level 2 | Level 3 | Total |
| Syntax Stratified LargeCap ETF | | | | |
| INVESTMENTS: | | | | |
Common Stock
| $41,890,187 | $— | $— | $41,890,187 |
| Total | $41,890,187 | $— | $— | $41,890,187 |
| Syntax Stratified MidCap ETF | | | | |
| INVESTMENTS: | | | | |
Common Stock
| $3,411,704 | $— | $— | $3,411,704 |
| Total | $3,411,704 | $— | $— | $3,411,704 |
| Syntax Stratified SmallCap ETF | | | | |
| INVESTMENTS: | | | | |
Common Stock
| $17,193,870 | $— | $— | $17,193,870 |
| Total | $17,193,870 | $— | $— | $17,193,870 |
Distributions: The Funds declare and distribute dividends from net investment income to its holders of Shares ("Shareholders"), if any, annually. Capital gain distributions, if any, are generally declared and paid annually. Additional distributions may be paid by the Funds to avoid imposition of federal income and excise tax on any remaining undistributed net investment income and capital gains. The amount and character of income and gains to be distributed are determined in accordance with federal tax regulations which may differ from net investment income and realized gains recognized for U.S. GAAP purposes.
Cash: Cash consists of cash held at the Funds’ custodian, State Street Bank and Trust Company.
Investment Transactions and Investment Income: Investment transactions for financial statement purposes are accounted for on a trade date basis. Realized gains and losses on investments sold are determined on the basis of identified cost. Dividend income, if any, is recorded on the ex-dividend date or, in the case of foreign securities, as soon as the Funds are informed of the ex-dividend dates, net of foreign taxes. Interest income, including accretion of discounts and amortization of premiums, is recorded on the accrual basis commencing on the settlement date.
Non-cash dividends received in the form of stock, if any, are recorded as dividend income at fair value. Distributions received by the Funds may include a return of capital that is estimated by the Advisor. Such amounts are recorded as a reduction of the cost of investments or reclassified to capital gains. The Funds may invest in real estate investment trusts (“REITs”) if they are part of the index. REITs determine the characterization of their income annually and may characterize a portion of their distributions as a return of capital or capital gain. The Funds' policy is to record all REIT distributions as dividend income initially and re-designate the prior calendar year’s return of capital or capital gain distributions at year end.
Organizational and Offering costs: Syntax Advisors has agreed to pay all of the Funds’ organizational and offering costs. The organizational and offering costs are not subject to repayment to Syntax Advisors by the Funds.
Syntax ETF Trust
Notes to Financial Statements (continued)
December 31, 2020
Note 2—Significant Accounting Policies–(continued)
Federal Income Taxes: For U.S. federal income tax purposes, each Fund intends to qualify as a “regulated investment company” under Sub-chapter M of the Internal Revenue Code of 1986, as amended (a “RIC”), and intends to continue to qualify as a RIC. As a RIC, each Fund will generally not be subject to U.S. federal income tax for any taxable year on income, including net capital gains, that it distributes to its Shareholders, provided that it distributes on a timely basis at least 90% of its “investment company taxable income” determined prior to the deduction for dividends paid by the Funds (generally, its taxable income other than net capital gain) for such taxable year. In addition, provided that the Funds distributes substantially all of its ordinary income and capital gains during each calendar year, the Funds will not be subject to U.S. federal excise tax. Income and capital gain distributions are determined in accordance with tax regulations which may differ from U.S. GAAP. These book-tax differences are primarily due to differing treatments for in-kind transactions, losses deferred due to wash sales, corporate actions, distributions in excess of current earnings and capital loss carryover. In addition, Syntax Stratified LargeCap ETF claimed a portion of the payments made to redeeming shareholders as a distribution for income tax purposes.
U.S. GAAP requires the evaluation of tax positions taken in the course of preparing the Funds’ tax returns to determine whether the tax positions are “more-likely-than-not” to be sustained by the applicable tax authority. For U.S. GAAP purposes, the Funds recognize the tax benefits of uncertain tax positions only when the position is more likely than not to be sustained, assuming examination by tax authorities.
Each Fund has reviewed its tax positions and has determined that no provision for income tax is required in the Fund’s financial statements. Generally, the Funds' tax returns for the prior three fiscal years remain subject to examinations by the Funds’ major tax jurisdictions, which include the United States of America, and the State of New York. The Funds recognize interest and penalties, if any, related to tax liabilities as income tax expense in the Statements of Operations. There were no such expenses for the period ended December 31, 2020.
No income tax returns are currently under examination. The Advisor has analyzed the relevant tax laws and regulations and their application to the Funds’ facts and circumstances and does not believe there are any uncertain tax positions that require recognition of any tax liabilities. Any potential tax liability is also subject to ongoing interpretation of laws by taxing authorities. The tax treatment of the Fund’s investments may change over time based on factors including, but not limited to, new tax laws, regulations and interpretations thereof.
During the year ended December 31, 2020, and the year ended December 31, 2019, the tax character of distributions paid were as follows:
| | Year Ended December 31, 2020 | | | | Year Ended December 31, 2019 | | |
| | Distributions Paid from Ordinary Income | | Distributions Paid from Long-Term Gain | | Distributions Paid from Ordinary Income | | Distributions Paid from Long-Term Gain |
Syntax Stratified LargeCap ETF
| $684,065 | | $— | | $964,675 | | $— |
Syntax Stratified MidCap ETF
| 30,102 | | — | | — | | — |
Syntax Stratified SmallCap ETF
| 149,507 | | — | | — | | — |
During the year ended December 31, 2020, the followings amounts were classified due to permanent differences between book and tax accounting:
| | Paid in Capital | | Distributable Earnings |
Syntax Stratified LargeCap ETF
| $8,490,111 | | $(8,490,111) |
Syntax Stratified MidCap ETF
| 3,260 | | (3,260) |
Syntax Stratified SmallCap ETF
| 1,939,158 | | (1,939,158) |
Syntax ETF Trust
Notes to Financial Statements (continued)
December 31, 2020
Note 2—Significant Accounting Policies–(continued)
At December 31, 2020, the components of distributable earnings on a tax basis were as follows:
| | Undistrbuted Ordinary Income | | Capital Loss Carryforward | | Unrealized Appreciation (Depreciation) |
Syntax Stratified LargeCap ETF
| $— | | $(1,197,831) | | $8,013,011 |
Syntax Stratified MidCap ETF
| 6,477 | | — | | 859,740 |
Syntax Stratified SmallCap ETF
| 692,908 | | — | | 3,870,265 |
The differences between components of distributable earnings (accumulated losses) on a tax basis and the amounts reflected in the Statements of Assets and Liabilities are primarily due to wash sales.
At December 31, 2020, the Funds had the following capital loss carryforwards that may be utilized to offset any net realized capital gains:
| | Long-Term | | Short-Term |
Syntax Stratified LargeCap ETF
| $1,197,831 | | $— |
At December 31, 2020, gross unrealized appreciation and gross unrealized depreciation of investment based on cost for federal income tax purposes were as follows:
| | Tax Cost | | Gross
Unrealized
Appreciation | | Gross
Unrealized
Depreciation | | Net Unrealized
Appreciation
(Depreciation) |
Syntax Stratified LargeCap ETF
| $33,877,176 | | $8,630,588 | | $(617,577) | | $8,013,011 |
Syntax Stratified MidCap ETF
| 2,551,964 | | 912,714 | | (52,974) | | 859,740 |
Syntax Stratified SmallCap ETF
| 13,323,605 | | 4,106,181 | | (235,916) | | 3,870,265 |
Note 3—Investment Transactions
Purchases and sales of investments (excluding in-kind transactions and short term investments) for the periods ended December 31, 2020, were as follows:
| | Purchases | | Sales |
Syntax Stratified LargeCap ETF
| $11,984,244 | | $11,986,289 |
Syntax Stratified MidCap ETF
| 1,646,778 | | 1,438,023 |
Syntax Stratified SmallCap ETF
| 6,039,245 | | 5,514,659 |
For the periods ended December 31, 2020, the following Funds had in-kind contributions, redemptions and net realized gains (losses) in the amounts as follows:
| | In-kind Contributions | | In-kind Redemptions | | In-kind Net Realized Gains (Losses) |
Syntax Stratified LargeCap ETF
| $16,512,531 | | $42,571,812 | | $9,352,080 |
Syntax Stratified MidCap ETF
| 2,336,742 | | — | | — |
Syntax Stratified SmallCap ETF
| 14,116,114 | | 4,007,577 | | 1,881,789 |
Note 4—Capital Share Transactions
Each Fund will issue or redeem capital shares to certain institutional investors (typically market makers or other broker dealers) on a continuous basis through the Distributor in large blocks of 25,000 capital shares (“Creation Units”). Creation Unit transactions are typically conducted in exchange for the deposit or delivery of a designated portfolio of
Syntax ETF Trust
Notes to Financial Statements (continued)
December 31, 2020
Note 4—Capital Share Transactions–(continued)
in-kind securities and/or cash constituting a substantial replication, or a representation, of the securities included in the Underlying Index.
Note 5—Fund Fees and Expenses
Investment Management Fees: Each Fund pays the Advisor monthly, in arrears, a unitary management fee based on a percentage of the Fund’s average daily net assets that is subject to an Expense Limitation Agreement. The management fee rate for each fund is as follows:
| | Annual Rate |
Syntax Stratified LargeCap ETF
| 0.45% |
Syntax Stratified MidCap ETF
| 0.45% |
Syntax Stratified SmallCap ETF
| 0.45% |
The Advisor provides investment advisory, supervisory and administration services under an investment management agreement. The Advisor has agreed to waive its fees and/or absorb expenses of the Funds to ensure that Total Annual Operating Expenses (excluding any (i) interest expense, (ii) taxes, (iii) acquired fund fees and expenses, (iv) brokerage expenses and other expenses (such as stamp taxes) connected with the execution of portfolio transactions or in connection with creation and redemption transactions, (v) expenses associated with shareholder meetings, (vi) compensation and expenses of the Independent Trustees, (vii) compensation and expenses of the Trust’s chief compliance officer and his or her staff, (viii) distribution fees and expenses paid by the Trust under any distribution plan adopted pursuant to Rule 12b-1 under the 1940 Act, (ix) legal fees or expenses in connection with any arbitration, litigation or pending or threatened arbitration or litigation, including any settlements in connection therewith, and (x) extraordinary expenses of the Fund) ("Excluded Expenses") do not exceed the following expense limitations:
| | Expense Limit |
Syntax Stratified LargeCap ETF
| 0.30% |
Syntax Stratified MidCap ETF
| 0.30% |
Syntax Stratified SmallCap ETF
| 0.30% |
In addition, the Adviser has agreed to waive its fees and/or absorb Excluded Expenses of each Fund to ensure that Total Annual Operating Expenses do not exceed 0.30%.
These arrangements cannot be terminated prior to one year from the effective date of the prospectus without the approval of the Board of Trustees. In connection with this arrangement, the Advisor has waived and reimbursed the following amounts in expenses for the periods ended December 31, 2020 as noted below.
| | Expenses Waived and Reimbursed |
Syntax Stratified LargeCap ETF
| $47,244 |
Syntax Stratified MidCap ETF
| 3,931 |
Syntax Stratified SmallCap ETF
| 12,552 |
Syntax ETF Trust
Notes to Financial Statements (continued)
December 31, 2020
Note 5—Fund Fees and Expenses–(continued)
Subject to approval by the Funds’ Board of Trustees, any waiver and/or reimbursement under the Expense Limitation Agreement is subject to repayment by the Fund within 36 months following the day on which fees are waived or reimbursed, if the Fund is able to make the payment without exceeding the applicable expense limitation. At December 31, 2020, the waivers and reimbursements subject to repayment is as follows:
| | 2022 | | 2023 |
Syntax Stratified LargeCap ETF
| $262,321 | | $47,244 |
Syntax Stratified MidCap ETF
| — | | 3,931 |
Syntax Stratified SmallCap ETF
| — | | 12,552 |
Distributor, Distribution and Service Fees: Foreside Fund Services, LLC (“Distributor”) is the Distributor of Fund shares. The Distributor will not distribute Fund shares in less than Creation Units and does not maintain a secondary market in Fund shares. The Distributor may enter into selected dealer agreements with other broker-dealers or other qualified financial institutions for the sale of Creation Units of Fund shares.
Each Fund has a distribution and service plan (“Distribution Plan”) pursuant to Rule 12b-1 under the 1940 Act, to which payments at an annual rate of up to 0.25% of the Fund’s average daily net assets may be made for the sale and distribution of its Fund shares. No payments pursuant to the Distribution Plan will be made through at least the next twelve (12) months of operations. Additionally, the implementation of any such payments would be approved by the Board prior to implementation.
Vantage Consulting Group, Inc. (“Vantage” or the “Sub-Adviser”) serves as the sub-adviser to the Funds and performs the day to day management of the Funds and places orders for the purchase and sale of securities for the Funds. For its services to the Funds, the Sub-Adviser is compensated by Syntax Advisors.
Note 6—Indemnifications
In the normal course of business, the Funds enter into contracts that contain a variety of representations and warranties which provide general indemnifications. The Funds’ maximum exposure under these arrangements is unknown, as this would involve future claims that may be made against the Funds that have not yet occurred. However, based on experience and knowledge of management, the Funds expect the risk of loss to be remote.
Note 7—Related Party Transactions
There are no related party transactions during the period except as previously disclosed.
Note 8—Market Risk
In the normal course of business, the Funds invest in securities and enters into transactions where risks exist due to fluctuations in the market (market risk). Due to the level of risk associated with certain investments, it is at least reasonably possible that changes in the values of investment securities will occur in the near term and that such changes could materially affect the amounts reported in the financial statements.
An investment in the Funds involves risks similar to those of investing in any fund of equity securities, such as market fluctuations caused by such factors as economic and political developments, changes in interest rates and perceived trends in stock prices. The value of a Share will increase or decline, more or less, in correlation with any increase or decline in value of the holdings of the Underlying Index. The values of equity securities could increase or decline generally or could over or under perform other investments.
Syntax ETF Trust
Notes to Financial Statements (continued)
December 31, 2020
Note 8—Market Risk–(continued)
Other Risks
Index Risk: Unlike many investment companies, Syntax Stratified LargeCap ETF, Syntax Stratified MidCap ETF and Syntax Stratified SmallCap ETF do not utilize an investing strategy that seeks returns in excess of its Underlying Index. Therefore, the Funds would not necessarily buy or sell a security unless that security is added or removed, respectively, from its Underlying Index, even if that security generally is underperforming.
Equity Risk: Equity risk is the risk that the value of the securities that the Funds hold will fall due to general market and economic conditions, perceptions regarding the industries in which the issuers of securities the Fund holds participate or factors relating to specific companies in which the Funds invest. For example, an adverse event, such as an unfavorable earnings report, may depress the value of securities the Funds hold; the price of securities may be particularly sensitive to general movements in the stock market; or a drop in the stock market may depress the price of most or all of the securities the Funds hold. In addition, securities of an issuer in the Funds’ portfolio may decline in price if the issuer fails to make anticipated dividend payments because, among other reasons, the issuer of the security experiences a decline in its financial condition.
Non-Correlation Risk: Each Fund’s return may not match the return of its Underlying Index for a number of reasons. For example, the Fund incurs operating expenses not applicable to its Underlying Index, and incurs costs in buying and selling securities, especially when rebalancing the Fund’s securities holdings to reflect changes in the composition of its Underlying Index. In addition, the performance of the Fund and its Underlying Index may vary due to asset valuation differences and differences between the Fund’s portfolio and its Underlying Index resulting from legal restrictions, cost or liquidity constraints.
Pandemic Risk: The onset of an infectious respiratory disease called COVID-19, caused by a novel coronavirus known as SARS-CoV-2, was first identified in China in December 2019 and now has been detected globally. Among other things, COVID-19 has led to travel restrictions, closed international borders, disruption of and delays in healthcare service preparation and delivery, prolonged quarantines, cancellations, supply chain disruptions, shuttering of offices, universities, schools, cultural institutions and sporting events, and lower consumer demand, as well as general anxiety and uncertainty. The impact of COVID-19, and other infectious disease outbreaks that may arise in the future, could adversely affect the economies of many nations or the entire global economy, individual issuers and capital markets in ways that cannot necessarily be foreseen. In addition, the impact of infectious diseases in emerging market countries may be greater due to generally less established healthcare systems. Public health crises caused by the COVID-19 spread may aggravate other pre-existing political, social and economic risks in certain countries or globally. The duration of the COVID-19 outbreak and its effects cannot be determined with certainty.
Note 9—Subsequent Events
Management has evaluated the impact of all subsequent events on the Funds through the date on which the financial statements were issued and has determined that there were no subsequent events requiring adjustment or disclosure in the financial statements.
Report of Independent Registered Public Accounting Firm
To the Shareholders of Syntax Stratified LargeCap ETF, Syntax Stratified MidCap ETF and Syntax Stratified SmallCap ETF and Board of Trustees of Syntax ETF Trust
Opinion on the Financial Statements
We have audited the accompanying statements of assets and liabilities of Syntax Stratified LargeCap ETF, Syntax Stratified MidCap ETF and Syntax Stratified SmallCap ETF (collectively referred to as the “Funds”) (three of the funds constituting the Syntax ETF Trust (the “Trust”)), including the schedules of investments, as of December 31, 2020, and the related statements of operations, the statements of changes in net assets, and the financial highlights for each of the periods indicated in the table below and the related notes (collectively referred to as the “financial statements”). In our opinion, the financial statements present fairly, in all material respects, the financial position of each of the Funds (three of the funds constituting Syntax ETF Trust) at December 31, 2020, the results of their operations, the changes in net assets and financial highlights for each of the periods indicated in the table below, in conformity with U.S. generally accepted accounting principles.
Individual Funds constituting Syntax ETF
Trust | Statement of
operations | Statements of changes in
net assets | Financial
highlights |
| Syntax Stratified LargeCap ETF | For the year ended December 31, 2020 | For the year ended December 31, 2020 and
the period from January 2, 2019
(commencement of operations) through
December 31, 2019 |
| Syntax Stratified MidCap ETF | For the period from January 16, 2020 (commencement of operations) through December 31, 2020 |
| Syntax Stratified SmallCap ETF | For the period from May 28, 2020 (commencement of operations) through December 31, 2020 |
Basis for Opinion
These financial statements are the responsibility of the Trust’s management. Our responsibility is to express an opinion on each of the Funds’ financial statements based on our audits. We are a public accounting firm registered with the Public Company Accounting Oversight Board (United States) ("PCAOB") and are required to be independent with respect to the Trust in accordance with the U.S. federal securities laws and the applicable rules and regulations of the Securities and Exchange Commission and the PCAOB.
We conducted our audits in accordance with the standards of the PCAOB. Those standards require that we plan and perform the audit to obtain reasonable assurance about whether the financial statements are free of material misstatement, whether due to error or fraud. The Trust is not required to have, nor were we engaged to perform, an audit of the Trust’s internal control over financial reporting. As part of our audits we are required to obtain an understanding of internal control over financial reporting but not for the purpose of expressing an opinion on the effectiveness of the Trust’s internal control over financial reporting. Accordingly, we express no such opinion.
Our audits included performing procedures to assess the risks of material misstatement of the financial statements, whether due to error or fraud, and performing procedures that respond to those risks. Such procedures included examining, on a test basis, evidence regarding the amounts and disclosures in the financial statements. Our procedures included confirmation of securities owned as of December 31, 2020, by correspondence with the custodian. Our audits also included evaluating the accounting principles used and significant estimates made by management, as well as evaluating the overall presentation of the financial statements. We believe that our audits provide a reasonable basis for our opinion.
We have served as the auditor of one or more Syntax investment companies since 2018.
Boston, Massachusetts
February 24, 2021
Syntax ETF Trust
Other Information
December 31, 2020 (Unaudited)
Federal Tax Information (Unaudited)
The Form 1099-DIV you received in February 2021 showed the tax status of all distributions paid to your account in calendar year 2020. Shareholders are advised to consult their own tax adviser with respect to the tax consequences of their investment in the Fund. As required by the Internal Revenue Code and/or regulations, shareholders must be notified regarding the status of qualified dividend income for individuals and the dividends received deduction for corporations.
Qualified Dividend Income: For the fiscal year ended December 31, 2020, Syntax Stratified LargeCap ETF, Syntax Stratified MidCap ETF and Syntax Stratified SmallCap ETF designate approximately $647,510, $32,394 and $88,085, respectively, or up to the maximum amount of such dividends allowable pursuant to the Internal Revenue Code, as qualified dividend income eligible for a tax rate not greater than 20%.
Dividends Received Deduction: Corporate shareholders are generally entitled to take the dividends received deduction on the portion of each Fund’s dividend distribution that qualifies under tax law. Of the fiscal 2020 ordinary income dividends for Syntax Stratified LargeCap ETF, Syntax Stratified MidCap ETF and Syntax Stratified SmallCap ETF, 98.58%, 85.97% and 9.78%, respectively, qualify for the corporate dividends received deduction.
Syntax ETF Trust
Other Information (continued)
December 31, 2020 (Unaudited)
Expense Example
As a shareholder of the Fund, you incur two types of costs: (1) transaction costs, including brokerage commissions on purchases and sales of Fund shares and (2) ongoing costs, including advisory fees and to the extent applicable, distribution (12b-1) and/or service fees; and other Fund expenses. This example is intended to help you understand your ongoing costs (in dollars) of investing in the Fund and to compare these costs with the ongoing costs of investing in other mutual funds. It is based on an investment of $1,000 made at the beginning of the period shown and held for the entire period from July 01, 2020 to December 31, 2020.
The table below illustrates your Fund’s cost in two ways:
Based on actual fund return ——This section helps you to estimate the actual expenses that you paid over the period. The “Ending Account Value” shown is derived from each Fund’s actual return, and the third column shows the dollar amount that would have been paid by an investor who started with $1,000 in the Fund. You may use the information here, together with the amount you invested, to estimate the expenses that you paid over the period. To do so, simply divide your account value by $1,000 (for example, an $8,600 account value divided by $1,000 = 8.6), then multiply the result by the number given for the Fund under the heading “Expenses Paid During Period”.
Based on hypothetical 5% return ——This section is intended to help you compare your Fund’s costs with those of other mutual funds. It assumes that the Funds had a yearly return of 5% before expenses, but that the expense ratio is unchanged. In this case, because the return used is not the Fund’s actual return, the results do not apply to your investment. The example is useful in making comparisons because the SEC requires all mutual funds to calculate expenses based on a 5% return. You can assess your Fund’s costs by comparing this hypothetical example with the hypothetical examples that appear in shareholder reports of other funds.
Please note that the expenses shown in the table are meant to highlight your ongoing costs only and do not reflect any transaction costs, such as brokerage commissions on purchases and sales of Fund shares. Therefore, the hypothetical 5% return section of the table is useful in comparing ongoing costs only, and will not help you determine the relative total costs of owning different funds. In addition, if these transaction costs were included, your costs would have been higher.
| | | Actual | | Hypothetical (assuming a 5%
return before expenses) |
| | Annualized
Expense Ratio | | Ending Account
Value | | Expenses Paid
During Period | | Ending Account
Value | | Expenses Paid
During Period(a) |
Syntax Stratified LargeCap ETF
| 0.30% | | $1,246.70 | | $1.69 | | $1,023.60 | | $1.53 |
| (a) | Expenses are equal to the Fund's annualized net expense ratio multiplied by the average account value of the period, multiplied by 184 for the Fund and the Hypothetical numbers shown, then divided by 366. |
| | | Actual | | Hypothetical (assuming a 5%
return before expenses) |
| | Annualized
Expense Ratio | | Ending Account
Value | | Expenses Paid
During Period | | Ending Account
Value | | Expenses Paid
During Period(a) |
Syntax Stratified MidCap ETF
| 0.30% | | $1,307.10 | | $1.74 | | $1,023.60 | | $1.53 |
| (a) | Expenses are equal to the Fund's annualized net expense ratio multiplied by the average account value of the period, multiplied by 184 for the Fund and the Hypothetical numbers shown, then divided by 366. |
Syntax ETF Trust
Other Information (continued)
December 31, 2020 (Unaudited)
| | | Actual | | Hypothetical (assuming a 5%
return before expenses) |
| | Annualized
Expense Ratio | | Ending Account
Value | | Expenses Paid
During Period | | Ending Account
Value | | Expenses Paid
During Period(a) |
Syntax Stratified SmallCap ETF
| 0.30% | | $1,385.50 | | $1.80 | | $1,023.60 | | $1.53 |
| (a) | Expenses are equal to the Fund's annualized net expense ratio multiplied by the average account value of the period, multiplied by 184 for the Fund and the Hypothetical numbers shown, then divided by 366. |
Syntax ETF Trust
Other Information (continued)
December 31, 2020 (Unaudited)
Premium/Discount Information
Information regarding how often the Shares of each Fund traded on the exchange at a price above (i.e., at a premium) or below (i.e., at a discount) the NAV of the Fund during the past calendar year can be found at www.syntaxadvisors.com.
Proxy Voting Policies and Procedures and Records
A description of the Funds' proxy voting policies and procedures that are used by the Funds' investment adviser to vote proxies relating to the Funds' portfolio of securities are available (i) without charge, upon request by calling 1-866-972-4492 (toll free) or (ii) on the SEC’s website at www.sec.gov. Information regarding how the investment adviser voted for the 12-month period ended June 30, is available by August 31 of each year by calling the same number, on the SEC’s website at www.sec.gov, and on the Funds' website at www.syntaxadvisors.com.
Quarterly Portfolio Schedule
Following the Funds' first and third fiscal quarter-ends, a complete schedule of investments is filed with the SEC as an exhibit on Form N-PORT, which can be found on the SEC’s website at www.sec.gov. The Funds' schedules of investments are available upon request, without charge, by calling 1-866-972-4492 (toll free) and on the Funds’ website at www.syntaxadvisors.com.
Other information regarding the Funds is available on the Funds’ website at www.syntaxadvisors.com as well as on the website of the Securities and Exchange Commission at www.sec.gov.
Trustees and Officers of the Trust
TRUSTEES
NAME, ADDRESS
AND YEAR OF BIRTH | POSITION(S)
WITH TRUST | TERM OF OFFICE
AND LENGTH
OF TIME SERVED | PRINCIPAL
OCCUPATION(S)
DURING PAST 5 YEARS | NUMBER OF
PORTFOLIOS
IN FUND
COMPLEX
OVERSEEN BY
TRUSTEE | OTHER
DIRECTORSHIPS
HELD BY
TRUSTEE DURING
THE LAST 5 YEARS |
| Independent Trustees | | | | | |
Deborah Fuhr
(1959) | Independent
Trustee | Term: Unlimited
Trustee since 2018 | Co-Founder and Managing
Partner, ETFGI LLP (research
and consulting) (2012 to
present); | 3 | Co-Founder and Board
Member, Women in
ETFs (Not for Profit)
(2014 to present); Co-
founder and Board
Member, Women in
ETFs Europe Limited
(Educational
Association) (2015 to
present); Director and
Board Member, 2
Culford Gardens RTM
(Property) (2011 to
present); Director and
Board Member (2
Culford Gardens
Freehold (Property)
(2011 to present) |
George Hornig
(1954) | Independent
Trustee and
Chairman of
the Audit
Committee | Term: Unlimited
Trustee since 2018 | Managing Member, George
Hornig, LLC (2017 to present)
(investments); Senior Managing
Director and Chief Operating
Officer, Pinebridge Investments
(investment adviser) (2010 to
2016). | 3 | Director, Forrester
Research, Inc.
(technology research
company) (1996 to
2018); Director, Daniel
J. Edelman Holding
(2016 to present)
(communications
marketing firm);
Director, Xometry
(advanced
manufacturing
platform business) (2014
to present); Director,
KBL Merger Corp IV
(2017 to present)
(healthcare). |
Trustees and Officers of the Trust (continued)
Richard Lyons
(1961) | Lead
Independent
Trustee and
Chairman of
the Nominating
and
Governance
Committee | Term: Unlimited
Trustee since 2018 | Chief Innovation and
Entrepreneurship Officer, UC
Berkeley (since 2020);
Professor and William & Janet
Cronk Chair in Innovative
Leadership (2019), Dean (2008-
19), Haas School of Business,
UC Berkeley; Chief
Learning Officer (2006 to 2008),
Goldman Sachs (investment
banking and investment
management); Executive
Associate Dean (2005 to 2006),
Acting Dean (2004 to 2005),
Professor (2000 to 2004),
Associate Professor (1996 to
2000), Assistant Professor
(1993 to 1996), Haas School of
Business, UC Berkeley. | 3 | Director (2013 to
2016), Matthews A
Share Selections Fund,
LLC (mutual funds). |
Stewart Myers
(1940) | Independent
Trustee | Term: Unlimited
Trustee since 2018 | Professor Emeritus and
Professor, MIT Sloan School of
Management (since 2015);
Principal, The Brattle Group,
Inc. (since 1991). | 3 | Director, Entergy
Corp. (2009 to 2015).
|
| Interested Trustees | | | | | |
Rory Riggs
(1953) | Trustee and
Chief
Executive
Officer | Term: Unlimited
Trustee since 2017 | Founder and Chief Executive
Officer, Locus Analytics, LLC
(since 2010); Founder and
Chief Executive Officer, Syntax
Advisors, LLC (Since 2013); and
Chief Executive Officer and
Founder of Syntax LLC (Since
2009). | 3 | Managing Member of
Balfour, LLC (since
2001); Board Member,
Nuredis, Inc. (2016 to
present); President,
Biomatrix Corporation
(1996 to 2000);
Director, Biomatrix
Corporation (1990 to 2000); Acting President
and Chief Exectutive
Officer of RF&P
Corporation (1991 to
1995); Managing
Director PaineWebber Incorporated
(1981 to 1990);
Co-Founder and
Chairman, RP
Management, LLC;
Chairman/Chairman
Emeritus and co-
founder, Royalty
Pharma (1996 to
present)
(biopharmaceuticals);
Chairman and Co-
Founder, Cibus
Global, Ltd. (2012 to
present) (gene editing
in agriculture);
Director GeneNews
Limited (2000 to
present); Director
Intra-Cellular
Therapies, Inc. (since
2014); Director,
FibroGen, Inc. (1993
to present). |
Trustees and Officers of the Trust (continued)
Kathy Cuocolo
(1952) | Trustee and
President | Term: Unlimited
Trustee since 2018 | President and Senior Vice
President, Syntax Advisors,
LLC and predecessor
companies (2014 to present);
Managing Director, Head of
Global ETF Services, BNY
Mellon (2008 to 2013);
Executive Vice President, State
Street (1982 to 2003). | 3 | Greenbacker
Renewable Energy
LLC, Audit Chair
(2013 to present);
Guardian Life Family
of Funds (2005 –
2007); Select Sector
Trust, Chairman (2000
to 2007); The China
Fund (1999 to 2003). |
The Statement of Additional Information contains further information about the trustees and is available without charge upon your request by calling (866) 972-4492 (toll-free) or by visiting www.syntaxadvisors.com.
OFFICERS
NAME, ADDRESS
AND YEAR OF BIRTH | POSITION(S)
WITH TRUST | TERM OF
OFFICE
AND LENGTH
OF TIME
SERVED | PRINCIPAL OCCUPATION(S)
DURING PAST 5 YEARS |
| OFFICERS | | | |
Rory Riggs
(1953) | Chief Executive | Since 2018 | See Trustee table above |
Kathy Cuocolo
(1952) | President | Since 2018 | See Trustee table above |
David Jaffin
(1954) | Treasurer | Since 2019 | Partner, B2B CFO® (January 2019 to present); Chief
Financial Officer, Poliwogg Holdings, Inc. (October 2012 to
August 2018). |
Carly Arison
(1990) | Secretary | Since 2018 | Senior Vice President, Vice President, and Manager, Syntax
Advisors, LLC and predecessor companies (2012 to present). |
Brandon Kipp
(1983) | Chief Compliance
Officer | Since 2019 | Director, Foreside Financial Group, LLC (since May 2019);
Senior Fund Compliance Officer, Ultimus Fund Solutions, LLC (from July 2017 to May 2019); Assistant Vice President
and Compliance Manager, UMB Fund Services, Inc. (March 2014 to July 2017). |
Syntax ETF Trust
(Unaudited)
Fund Advisor
Syntax Advisors, LLC
One Liberty Plaza 46th FI.
New York, NY 10006
Administrator, Custodian and Transfer Agent
State Street Bank and Trust Company
One Lincoln Street
Boston, MA 02111
Distributor
Foreside Fund Services, LLC
Three Canal Plaza, Suite 100
Portland, ME 04101
Independent Registered Public Accounting Firm
Ernst & Young LLP
200 Clarendon Street
Boston, MA 02116
| | (a) | The Registrant has adopted a code of ethics that applies to its principal executive officer, principal financial officer, and any other officers who serve a similar function. |
| | (b) | The Registrant’s code of ethics is reasonably designed as described in this Form N-CSR. |
| | (c) | During the period covered by the report no amendments were made to the provisions of this code of ethics. |
| | (d) | During the period covered by the report, the Registrant did not grant any waivers, including implicit waivers, from the provisions of this code of ethics. |
| | (f) | The Registrant has filed this code of ethics as an exhibit pursuant to Item 13(a)(1) of Form N-CSR. |
| Item 3: | Audit Committee Financial Experts. |
The Registrant’s Board of Trustees has determined that George Hornig, Richard Lyons and Stewart Myers are “audit committee financial experts,” as such term is defined in Item 3 of Form N-CSR. Messrs. Hornig, Lyons and Myers are “independent” under the standards set forth in Item 3 of Form N-CSR. The designation of Messrs. Hornig, Lyons and Myers as “audit committee financial experts” pursuant to Item 3 of Form N-CSR does not (i) impose upon them any duties, obligations, or liabilities that are greater than the duties, obligations and liabilities imposed upon them as a member of the Registrant’s audit committee or Board of Trustees in the absence of such designation; or (ii) affect the duties, obligations or liabilities of any other member of the Registrant’s audit committee or Board of Trustees..
| Item 4: | Principal Accountant Fees and Services. |
| | | | | Fiscal Year Ended 12/31 | | Fiscal Year Ended 12/31 |
| | | | | 2019 | | 2020 |
| (a) | | Audit Fees | | $28,500 | | $87,000 |
| (b) | | Audit Related Fees(1) | | $0 | | $0 |
| (c) | | Tax Fees(2) | | $8,000 | | $27,000 |
| (d) | | All Other Fees(3) | | $0 | | $0 |
| | | Total | | $36,500 | | $114,000 |
| | (1) | Audit-Related Fees represent assurance and related services provided that are reasonably related to the performance of the audit of the financial statements of the fund comprising the Registrant, specifically data verification and agreed-upon procedures related to asset securitizations and agreed-upon procedures engagements. |
| | (2) | Tax Fees represent tax compliance, tax planning and tax advice services provided in connection with the review of the distributions for excise tax purposes, fiscal year end taxable income calculations and certain fiscal year end shareholder reporting items on behalf of the fund comprising the Registrant. |
| | (3) | All Other Fees represent service fees for analysis of potential Passive Foreign Investment Company holdings and N-14 merger related items. |
| | (e)(1) | Audit Committee Pre-Approval Policies and Procedures. Generally, the Registrant’s Audit Committee must preapprove (i) all audit and non-audit services performed for the Registrant by the independent accountant and (ii) all non-audit services performed by the Registrant’s independent accountant for the Registrant’s investment adviser, and certain of the adviser’s affiliates that provide ongoing services to the Registrant, if the services to be provided by the accountant relate directly to the operations and financial reporting of the Registrant. |
The Audit Committee may delegate preapproval authority to one or more of its members. The member or members to whom such authority is delegated shall report any preapproval decisions to the Audit Committee at its next scheduled meeting.
In accordance with the Procedures, the annual audit services engagement terms and fees for the Registrant will be subject to the preapproval of the Audit Committee. In addition to the annual audit services engagement approved by the Audit Committee, the Audit Committee may grant preapproval for other audit services, which are those services that only the independent accountant reasonably can provide.
Requests or applications to provide services that require separate approval by the Audit Committee will be submitted to the Audit Committee by both the independent accountant and the Registrant’s treasurer, and must include a joint statement as to whether, in their view, the request or application is consistent with the Securities and Exchange Commissions’ rules on auditor independence.
Management will promptly report to the Chair of the Audit Committee any violation of this Procedure of which it becomes aware.
| | (e)(2) | The percentage of services described in paragraphs (b) through (d) of this Item that were approved by the audit committee pursuant to paragraph (c)(7)(i)(C) of Rule 2-01 of Regulation S-X for fiscal year ended 2020was 100%. |
| | (h) | The Registrant’s Audit Committee has considered whether the provision of non-audit services that were rendered to the Registrant’s Adviser, and any entity controlling, controlled by, or under common control with the Adviser that provides ongoing services to the Registrant that were not pre-approved pursuant to paragraph (c)(7)(ii) of Rule 2-01 of Regulation S-X is compatible with maintain the principal accountant’s independence. |
| Item 5: | Audit Committee of Listed Registrants. |
The following individuals comprise the standing Audit Committee: Deborah Fuhr, George Hornig, Richard Lyons and Stewart Myers.
| Item 6: | Schedule of Investments. |
| (a) | The schedules of investments are included in the Annual Report to shareholders filed under Item 1 of this Form N-CSR. |
| Item 7: | Disclosure of Proxy Voting Policies and Procedures for Closed-End Management Investment Companies. |
Not applicable.
| Item 8: | Portfolio Managers of Closed-End Management Investment Companies. |
Not applicable.
| Item 9: | Purchases of Equity Securities by Closed-End Management Investment Company and Affiliated Purchasers. |
Not Applicable
| Item 10: | Submission of Matters to a Vote of Security Holders. |
There have been no material changes to the procedures by which shareholders may recommend nominees to the Registrant’s Board of Trustees that have been implemented since the Registrant last provided disclosure in response to the requirements of this Item.
| Item 11: | Controls and Procedures. |
| (a) | The Registrant’s principal executive officer and principal financial officer evaluated the Registrant’s disclosure controls and procedures within 90 days of this filing and have concluded that the Registrant's disclosure controls and procedures (as defined in Rule 30a-3(c) under the Investment Company Act of 1940, as amended (the “1940 Act”)) are appropriately designed to ensure that information required to be disclosed by the Registrant in the reports that it files on Form N-CSR (a) is accumulated and communicated to Registrant's management, including its principal executive officer and principal financial officer, to allow timely decisions regarding required disclosure, and (b) is recorded, processed, summarized and reported, within the time periods specified in the rules and forms adopted by the U.S. Securities and Exchange Commission. |
| (b) | The Registrant’s principal executive officer and principal financial officer are aware of no change in the Registrant’s internal control over financial reporting that occurred during the Registrant’s most recent fiscal half-year that has materially affected, or is reasonably likely to materially affect, the Registrant’s internal control over financial reporting. |
| Item 12: | Disclosure of Securities Lending Activities for Closed-End Management Investment Companies. |
Not Applicable
| (a)(3) | Any written solicitation to purchase securities under Rule 23c 1 under the Act sent or given during the period covered by the report by or on behalf of the registrant to 10 or more persons. Not applicable. |
| (a)(4) | Change in the registrant’s independent public accountant. Not applicable. |
SIGNATURES
Pursuant to the requirements of the Securities Exchange Act of 1934 and the Investment Company Act of 1940, the Registrant has duly caused this report to be signed on its behalf by the undersigned, thereunto duly authorized.
| | Syntax ETF Trust |
| | (Registrant) |
| | |
| | |
| | By: | /s/ Rory Riggs |
| | | Rory Riggs |
| | | CEO |
| | | (Principal Executive Officer) |
| | Date: | March 8, 2021 |
Pursuant to the requirements of the Securities Exchange Act of 1934 and the Investment Company Act of 1940, this report has been signed below by the following persons on behalf of the Registrant and in the capacities and on the dates indicated.
| | | | |
| | | | |
| | By: | /s/ Rory Riggs | |
| | | Rory Riggs | |
| | | CEO | |
| | | (Principal Executive Officer) | |
| | Date: | March 8, 2021 | |
| | | | |
| | | | |
| | | | |
| | By: | /s/ David Jaffin | |
| | | David Jaffin | |
| | | Treasurer | |
| | | (Principal Financial Officer) | |
| | Date: | March 8, 2021 | |
EXHIBIT INDEX