Shares are bought and sold at market price (not NAV) and are not individually redeemed from a Fund. Investors may purchase or sell individual shares on an exchange on which they are listed. Market returns are based upon the midpoint of the bid/ask spread at 4:00 p.m. Eastern time (when NAV is normally determined for most ETFs), and do not represent the returns you would receive if you traded shares at other times. Please see the prospectus for more details.
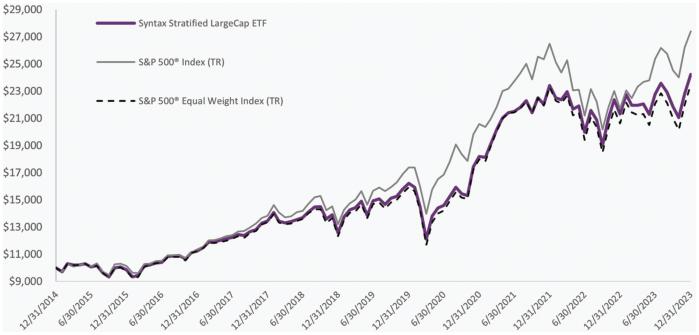
Portability of Performance: A privately offered fund managed by Syntax Advisors, LLC was reorganized into the Syntax Stratified LargeCap ETF (“the Fund”) as of January 2, 2019 upon commencement of the ETF operations. For periods prior to the commencement of ETF operations, the Fund’s performance is that of the private fund. The returns were calculated using the methodology the SEC requires of registered funds. However, since the private fund did not calculate its returns on a per share basis, its returns have been calculated on its total net asset value. While the performance of the private fund is net of all fees and expenses, the performance of the private fund has not been restated to reflect the management and fee waivers applicable to the Fund. The Fund may be subject to higher fees which would negatively impact performance. The private fund began operations on January 1, 2015 and, on January 2, 2019, was reorganized into the Fund. Prior to the reorganization, the private fund had investment objectives, policies and strategies that were, in all material respects, the same as those of the Fund, and was managed in a manner that, in all material respects, complied with the investment guidelines and restrictions of the Fund. However, as a registered investment company, the Fund is subject to certain restrictions under the Investment Company Act of 1940 (the “1940 Act”) and the Internal Revenue Code of 1986 (the “Internal Revenue Code”) which did not apply to the private fund. If the private fund had been subject to the provisions of the 1940 Act and the Internal Revenue Code, its performance could have been adversely affected. However, these restrictions are not expected to have a material effect on the Fund’s investment performance.
Portability of Performance: A privately offered fund managed by Syntax Advisors, LLC was reorganized into the Syntax Stratified MidCap ETF (“the Fund”) as of January 16, 2020 upon commencement of the ETF operations. For periods prior to the commencement of ETF operations, the Fund’s performance is that of the private fund. The returns were calculated using the methodology the SEC requires of registered funds. However, since the private fund did not calculate its returns on a per share basis, its returns have been calculated on its total net asset value. While the performance of the private fund is net of all fees and expenses, the performance of the private fund has not been restated to reflect the management and fee waivers applicable to the Fund. The Fund may be subject to higher fees which would negatively impact performance. The private fund began operations on January 1, 2015 and, on January 16, 2020, was reorganized into the Fund. Prior to the reorganization, the private fund had investment objectives, policies and strategies that were, in all material respects, the same as those of the Fund, and was managed in a manner that, in all material respects, complied with the investment guidelines and restrictions of the Fund. However, as a registered investment company, the Fund is subject to certain restrictions under the Investment Company Act of 1940 (the “1940 Act”) and the Internal Revenue Code of 1986 (the “Internal Revenue Code”) which did not apply to the private fund. If the private fund had been subject to the provisions of the 1940 Act and the Internal Revenue Code, its performance could have been adversely affected. However, these restrictions are not expected to have a material effect on the Fund’s investment performance.
The Syntax Stratified LargeCap Index, Syntax Stratified MidCap Index, and Syntax Stratified SmallCap Index™ (“the Indices”) are the property of Syntax, LLC, which has contracted with S&P Opco, LLC (a subsidiary of S&P Dow Jones Indices LLC) to calculate and maintain the Indices. The Indices are not sponsored by S&P Dow Jones Indices or its affiliates or its third-party licensors (collectively, “S&P Dow Jones Indices”). S&P Dow Jones Indices will not be liable for any errors or omissions in calculating the Index. “Calculated by S&P Dow Jones Indices” and the related stylized mark(s) are service marks of S&P Dow Jones Indices and have been licensed for use by Syntax, LLC, the parent company of Syntax Advisors, LLC. S&P® is a registered trademark of Standard & Poor’s Financial Services LLC (“SPFS”), and Dow Jones® is a registered trademark of Dow Jones Trademark Holdings LLC (“Dow Jones”).
The Syntax Stratified LargeCap Index, Syntax Stratified MidCap Index, and Syntax Stratified SmallCap Index™ are the property of Syntax, LLC, the Funds' index provider. Syntax®, Stratified®, Stratified Indices®, Stratified Weight™, and FIS™ are trademarks or registered trademarks of Locus LP. Performance of an index is not illustrative of any particular investment. It is not possible to invest directly in an index.
This report is submitted for the general information of the shareholders of the Funds. It is not authorized for distribution to prospective investors unless preceded or accompanied by an effective prospectus, which includes information regarding the Funds’ risks, objectives, fees and expenses, experience of its management, and other information.
This report is only intended for the recipient it is addressed and delivered to by Syntax Advisors, LLC and may not be redistributed without prior written consent. The report is provided for informational purposes and is not intended to be, nor should it be construed or used as an offer to sell, or a solicitation of any offer to buy shares or limited partnership interests in any funds managed by Syntax Advisors, LLC. These securities shall not be offered or sold in any jurisdiction in which such offer, solicitation or sale would be unlawful until the requirements of the laws of such jurisdiction have been satisfied. If any offer is made, it shall be pursuant to the offering documents prepared by or on behalf of a specific fund which contains detailed information concerning the investment terms and the risks, fees and expenses associated with an investment in that fund. In the case of any inconsistency between the descriptions or terms in this document and the offering documents, the offering documents shall control.
Index performance does not represent actual fund or portfolio performance and such performance does not reflect the actual investment experience of any investor. An investor cannot invest directly in an index. In addition, the results actual investors might have achieved would have differed from those shown because of differences in the timing, amounts of their investments, and fees and expenses associated with an investment in a portfolio invested in accordance with an index. None of the Syntax Indices or the benchmark indices portrayed herein charge management fees or incur brokerage expenses, and no such fees or expenses were deducted from the performance shown; provided, however, that the returns of any investment portfolio invested in accordance with such indices would be net of such fees and expenses. Additionally, none of these indices lend securities, and no revenues from securities lending were added to the performance shown. Foreside Fund Services, LLC is the distributor of the Syntax ETF Trust, and not affiliated with Syntax Advisors, LLC.
THESE MATERIALS DO NOT CONSTITUTE AN OFFER OR SOLICITATION TO BUY ANY SECURITIES OR TO PARTICIPATE IN ANY PARTICULAR TRADING STRATEGY.