S-11/Afalse0001585389Notional amounts shown are denominated in CAD. On January 16, 2024 we rolled this hedge without any cash settlement, effectively extending the maturity date to February 15, 2024 at a strike rate of 1.3781. Additionally, on February 16, 2024 we further rolled this hedge without any cash settlement at a strike rate of 1.3781. This hedge ultimately matured on March 7, 2024 whereby we owed and paid approximately $0.5 million at settlement. We paid our Dealer Manager an ongoing stockholder servicing fee that is payable monthly and accrues daily in an amount equal to 1/365th of 1% of the purchase price per share of the Class T Shares sold in the Primary Offering. The amount incurred during the year ended December 31, 2022 represents an adjustment to the estimated stockholder servicing fee recorded at the time of the sale of the Class T Shares, based on the cessation date of such stockholder servicing fee of March 31, 2022.On March 17, 2021, we acquired SST IV and no longer earn such fees. Additionally, the Tenant Protection Program revenue for SST IV is now included in ancillary operating revenue in our consolidated statements of operations.On June 1, 2022, we acquired SSGT II and no longer earn such fees. Additionally, the Tenant Protection Program revenue for SSGT II is now included in ancillary operating revenue in our consolidated statements of operations.Such revenue primarily includes other property management related fees, construction management fees, development fees, and other miscellaneous revenues.Pursuant to the Sponsor Funding Agreement, SmartStop funds certain costs of SST VI's share sales, and in return receives Series C Units in SST VI's OP. The excess of the funding over the value of the Series C Units received is accounted for as a reduction of Managed REIT Platform revenues from SST VI over the remaining estimated term of the management contracts with SST VI.As of December 31, 2023, $1.5 million was available to be drawn on the SSGT III Mezzanine Loan.The approximately $76.3 million in cash was primarily used to pay off approximately $75.1 million of SSGT II’s debt that we did not assume in the SSGT II Merger, as well as approximately $1.2 million in transaction costs.Upon our acquisition of SSGT II, we recorded a gain of approximately $16.1 million to record the then fair market value of our special limited partnership interest in SSGT II operating partnership.Liabilities assumed represents accounts payable and other liabilities.Approximately $8.0 million of the intangible assets acquired related to the intrinsic value of a purchase and sale agreement for the acquisition of a property in San Gabriel, CA that we assumed in the SSGT II Merger and acquired on July 13, 2023. The remainder of the intangible asset relates to value ascribed to the in-place leases on the properties acquired.The approximately $54.3 million in cash was primarily used to pay off approximately $54.0 million of SST IV debt that we did not assume in the SST IV Merger, as well as approximately $0.3 million in transaction costs.The allocation noted above is based on a determination of the relative fair value of the total consideration provided and represents the amount paid including capitalized acquisition costs.The operating results of the self storage property acquired have been included in our consolidated statements of operations since its acquisition date.Net operating loss excludes corporate general and administrative expenses, interest expenses, depreciation, amortization and acquisition related expenses.Net operating income excludes corporate general and administrative expenses, interest expense, depreciation, amortization and acquisition related expenses.The operating results of the self storage properties acquired have been included in our consolidated statements of operations since their acquisition dates.Included in the assets of the Self Storage segment as of December 31, 2023 and 2022 were approximately $52.2 million of goodwill. Additionally, as of December 31, 2023 and 2022 there were no accumulated impairment charges to goodwill within the Self Storage segment.Included in the assets of the Managed REIT Platform segment as of December 31, 2023 and 2022, was approximately $1.4 million of goodwill. Such goodwill is net of accumulated impairment charges in the Managed REIT Platform segment of approximately $24.7 million, which relates to the impairment charge recorded during the year ended December 31, 2020.Other than our investments in and advances to Managed REITs and investments in JV properties, substantially all of our investments in real estate facilities and intangible assets as of December 31, 2023 and 2022, respectively, were associated with our self storage platform.We deferred payment on this SOFR cap until its maturity. We deferred payment on this SOFR cap until January 2, 2025, at which point, monthly payments will become due on the first of each month until the date of its maturity. Notional amount shown is denominated in CAD. Included herein is the value of certain SOFR interest rate caps, net of approximately $8.2 million in deferred payments, as well as the fair value of our CORRA swap. These joint venture properties were acquired through the SSGT II Merger, which closed on June 1, 2022.These joint venture properties were acquired through the SST IV Merger, which closed on March 17, 2021.This property is currently leased as a single tenant industrial lease. The joint venture plans to develop this property into a self storage facility in the future.This property was acquired on January 12, 2023 in connection with a purchase agreement assumed in the SSGT II Merger.On April 15, 2021, we purchased the Oakville III Property. We partially financed the Oakville III Property acquisition with a loan from Bank of Montreal (the “Oakville III BMO Loan”), which was secured by a first lien on the Oakville III Property. The loan is denominated in Canadian dollars and the proceeds from the loan were approximately CAD $16.3 million. The interest only loan was prepayable at any time without penalty. On March 24, 2023, we fully paid off this loan, including all outstanding accrued interest.The amounts shown above are in USD based on the foreign exchange rate in effect as of the date presented. This fixed rate loan encumbers 29 properties (Whittier, La Verne, Santa Ana, Upland, La Habra, Monterey Park, Huntington Beach, Chico, Lancaster I, Riverside, Fairfield, Lompoc, Santa Rosa, Federal Heights,Aurora, Littleton, Bloomingdale, Crestwood, Forestville, Warren I, Sterling Heights, Troy, Warren II, Beverly, Everett, Foley, Tampa, Boynton Beach, and Lancaster II) with monthly interest only payments until September 2021, at which time both interest and principal payments became due monthly. The separate assets of these encumbered properties are not available to pay our other debts. As of March 31, 2023, a Total Leverage Ratio Event (as defined below) had occurred, and the interest rate on such Note increased to 5.28% prospectively. For additional information regarding this loan, see below. This fixed rate, interest only loan encumbers 10 properties (Myrtle Beach I, Myrtle Beach II, Port St. Lucie, Plantation, Sonoma, Las Vegas I, Las Vegas II, Las Vegas III, Ft Pierce, and Nantucket Island). The separate assets of these encumbered properties are not available to pay our other debts. This fixed rate loan encumbers five properties (Pompano Beach, Lake Worth, Jupiter, Royal Palm Beach, and Delray) with monthly interest only payments until June 2022, at which time both interest and principal payments became due monthly. The separate assets of these encumbered properties are not available to pay our other debts.On March 17, 2021, in connection with the SST IV Merger, we assumed a $40.5 million fixed rate CMBS financing with KeyBank as the initial lender pursuant to a mortgage loan (the “SST IV CMBS Loan”). This fixed rate loan encumbers seven properties owned by us (Jensen Beach, Texas City, Riverside, Las Vegas IV, Puyallup, Las Vegas V, and Plant City). The separate assets of these encumbered properties are not available to pay our other debt. The loan has a maturity date of February 1, 2030. Monthly payments due under the loan agreement (the “SST IV CMBS Loan Agreement”) are interest only, with the full principal amount becoming due and payable on the maturity date.Included in the assets of the Managed REIT Platform segment as of September 30, 2024 and December 31, 2023 was approximately $1.4 million of goodwill. Such goodwill is net of accumulated impairment charges in the Managed REIT Platform segment of approximately $24.7 million, which relates to the impairment charge recorded during the quarter ended March 31, 2020.Included in the assets of the Self Storage segment as of September 30, 2024 and December 31, 2023 was approximately $52.2 million of goodwill. Additionally, as of September 30, 2024 and December 31, 2023, there were no accumulated impairment charges to goodwill within the Self Storage segment.Other than our investments in and advances to Managed REITs and investments in joint ventures, substantially all of our investments in real estate facilities and intangible assets as of September 30, 2024 and December 31, 2023, respectively, were associated with our self storage platform.The SSGT III Mezzanine Loan expired on the maturity date of August 9, 2024, as such there is no further ability for SSGT III to borrow on this loan.As of September 30, 2024, these properties were encumbered by first mortgages pursuant to the RBC JV Term Loan (defined below).As of September 30, 2024, these properties were encumbered by first mortgages pursuant to the RBC JV Term Loan II (defined below).This property is encumbered by a first mortgage pursuant to the SmartCentres Financings (defined below).This property was leased as a single tenant industrial lease as of September 30, 2024. The joint venture plans to develop this property into a self storage facility in the future.This fixed rate loan encumbers 29 properties (Whittier, La Verne, Santa Ana, Upland, La Habra, Monterey Park, Huntington Beach, Chico, Lancaster I, Riverside, Fairfield, Lompoc, Santa Rosa, Federal Heights, Aurora, Littleton, Bloomingdale, Crestwood, Forestville, Warren I, Sterling Heights, Troy, Warren II, Beverly, Everett, Foley, Tampa, Boynton Beach, and Lancaster II) with monthly interest only payments until September 2021, at which time both interest and principal payments became due monthly. The separate assets of these encumbered properties are not available to pay our other debts. This loan incurs interest at an all in rate of CORRA (as defined further below under the section entitled “2027 NBC Loan”), plus a CORRA adjustment of approximately 0.30%, plus a spread of 2.20%. Theeffective interest rate on this loan is 6.42% when factoring the effects of a CORRA Swap which we entered into with the National Bank of Canada for the initial term of the loan. The Dufferin, Oakville II, Burlington II, Iroquois Shore Rd, and Stoney Creek I properties are encumbered by this loan. See Note 7 – Derivative Instruments for additional information. On November 16, 2023, we, through eight of our wholly-owned Canadian subsidiaries entered into a term loan (the “2028 Canadian Term Loan”) with affiliates of QuadReal Finance LP, receiving net proceeds of $110.0 million CAD on such date. The 2028 Canadian Term Loan is secured by eight Canadian properties, has a maturity date of December 1, 2028, and carries a fixed interest rate for the term of the loan of 6.41%. The first two years of the Canadian Term Loan are interest only, after which it requires monthly amortizing payments based on a 25-year amortization schedule. As of March 31, 2023, a Total Leverage Ratio Event (as defined below) had occurred, and the interest rate on such Note increased to 5.28% prospectively. For additional information regarding this loan, see 2032 Private Placement Notes below. The equity interest in these wholly-owned subsidiaries that directly own these unencumbered real estate assets comprise the borrowing base of the Credit Facility and the 2032 Private Placement Notes, and such equity interests were pledged as of December 31, 2023 for the benefit of the lenders thereunder.This property is located in Ontario, Canada.The change in cost at these self storage facilities are the net of the impact of foreign exchange rate changes and any actual additions.The aggregate cost of real estate for United States federal income tax purposes is approximately $1,921,347,528On March 2, 2023 the Compensation Committee of the board of directors approved the vesting of the 2020 performance grant at 200% of the targeted award. Accordingly, individuals who elected to receive performance based restricted stock were issued and immediately vested additional shares to equal 200% of their targeted award.Hurricane Helene caused record flooding in late September 2024 in Asheville, North Carolina. One of our 14 wholly-owned properties in this market was severely flooded. As a result of the storm event, flooding and related damage, we recorded a net casualty loss related to this property of approximately $4.6 million during the three and nine months ended September 30, 2024, to write-off the carrying value. We expect to rebuild and therefore we believe it is probable that we will receive insurance proceeds to offset the casualty loss and have recorded a receivable related to our pending insurance claims. Consequently the casualty loss was completely offset in our consolidated statements of operations by such recovery. Any amount of insurance recovery related to the property damage in excess of the casualty loss incurred is considered a gain contingency, and will be recognized upon final settlement of the claims.
As filed with the Securities and Exchange Commission on December 9, 2024
Registration No. 333-264449
SECURITIES AND EXCHANGE COMMISS
I
O
N
FOR REGISTRATION UNDER THE SECURITIES ACT OF 1933
OF SECURITIES OF CERTAIN REAL ESTATE COMPANIES
SMARTSTOP SELF STORAGE REIT, INC.
(Exact Name of Registrant as Specified in its Governing Instruments)
Ladera Ranch, California 92694
(Address, including Zip Code, and Telephone Number, including Area Code, of Registrant’s Principal Executive Offices)
General Counsel and Secretary
Ladera Ranch, California 92694
(Name, Address, including Zip Code, and Telephone Number, including Area Code, of Agent for Service)
| | |
Nelson Mullins Riley & Scarborough LLP 201 17 th Street NW, Suite 1700 | | 355 South Grand Avenue, Suite 100 Los Angeles, California 90071-1560 |
Approximate date of commencement of the proposed sale of the securities to the public:
As soon as practicable after this Registration Statement becomes effective.
If any of the Securities being registered on this Form are to be offered on a delayed or continuous basis pursuant to Rule 415 under the Securities Act, check the following box. ☐
If this Form is filed to register additional securities for an offering pursuant to Rule 462(b) under the Securities Act, check the following box and list the Securities Act registration statement number of the earlier effective registration statement for the same offering. ☐
If this form is a post-effective amendment filed pursuant to Rule 462(c) under the Securities Act, check the following box and list the Securities Act registration statement number of the earlier effective registration statement for the same offering. ☐
If this Form is a post-effective amendment filed pursuant to Rule 462(d) under the Securities Act, check the following box and list the Securities Act registration statement number of the earlier effective registration statement for the same offering. ☐
If delivery of the prospectus is expected to be made pursuant to Rule 434, check the following box. ☐
Indicate by check mark whether the registrant is a large accelerated filer, an accelerated filer, a
non-accelerated
filer, a smaller reporting company, or emerging growth company. See the definitions of “large accelerated filer,” “accelerated filer,” “smaller reporting company,” and “emerging growth company” in Rule
12b-2
of the Exchange Act. (Check one):
| | | | | | |
| Large accelerated filer | | ☐ | | Accelerated filer | | ☐ |
| | | |
| Non-accelerated filer | | ☒ | | Smaller reporting company | | ☐ |
| | | |
| | | | Emerging growth company | | ☐ |
If an emerging growth company, indicate by check mark if the registrant has elected not to use the extended transition period for complying with any new or revised financial accounting standards provided pursuant to Section 7(a)(2)(B) of the Securities Act. ☐
The Registrant hereby amends this Registration Statement on such date or dates as may be necessary to delay its effective date until the Registrant shall file a further amendment which specifically states that this Registration Statement shall thereafter become effective in accordance with Section 8(a) of the Securities Act, or until the Registration Statement shall become effective on such date as the Commission, acting pursuant to said Section 8(a), may determine.
The information in this preliminary prospectus is not complete and may be changed. We may not sell these securities until the registration statement filed with the United States Securities and Exchange Commission is effective. This preliminary prospectus is not an offer to sell these securities and we are not soliciting an offer to buy these securities in any state where the offer or sale is not permitted.
SUBJECT TO COMPLETION
PRELIMINARY PROSPECTUS DATED DECEMBER 9, 2024
Shares
SMARTSTOP SELF STORAGE REIT, INC.
Common Stock
SmartStop Self Storage REIT, Inc. is an internally-managed real estate investment trust, or REIT, and a premier owner and operator of self storage facilities in the United States and Canada. We are offering shares of our common stock as described in this prospectus. All of the shares of our common stock offered by this prospectus are being sold by us. We currently expect the public offering price to be between $ and $ per share. We intend to apply to have our common stock listed on the New York Stock Exchange, or NYSE, under the symbol “SMA.” Currently, our common stock is not traded on a national securities exchange, and this will be our first listed public offering.
We were formed as a Maryland corporation in January 2013 and have elected to be taxed as a REIT for U.S. federal income tax purposes beginning with our taxable year ended December 31, 2014. Shares of our common stock are subject to ownership limitations that are primarily intended to assist us in maintaining our qualification as a REIT. Our charter contains certain restrictions relating to the ownership and transfer of our common stock, including, subject to certain exceptions, a 9.8% ownership limit of common stock by value or number of shares, whichever is more restrictive. See “Description of Capital Stock—Restrictions on Ownership and Transfer” beginning on page 187 of this prospectus.
Investing in our common stock involves risk. See “Risk Factors” beginning on page 22 of this prospectus.
| | | | | | | | |
| | | Per Share | | | Total | |
Public offering price | | $ | | | | $ | | |
Underwriting discount(1) | | $ | | | | $ | | |
Proceeds, before expenses, to us | | $ | | | | $ | | |
| (1) | | See the section entitled “Underwriting” for a complete description of the compensation payable to the underwriters. |
At our request, the underwriters have reserved percent of the shares of common stock to be issued by us and offered by this prospectus for sale, at the initial public offering price, to (i) certain of our directors, officers and employees, and (ii) friends and family members of certain of our directors, officers and employees. The number of shares of common stock available for sale to the general public will be reduced to the extent these individuals purchase such reserved shares. Any reserved shares that are not so purchased will be offered by the underwriters to the general public on the same basis as the other shares offered by this prospectus. See “Underwriters—Directed Share Program” for additional information.
We have granted the underwriters the option to purchase an additional shares of our common stock on the same terms and conditions set forth above within 30 days after the date of this prospectus.
Neither the United States Securities and Exchange Commission nor any state securities commission has approved or disapproved of these securities or determined if this prospectus is truthful or complete. Any representation to the contrary is a criminal offense.
The underwriters expect to deliver the shares of our common stock on or about , 2025.
| | | | | | | | |
| J.P. Morgan | | Wells Fargo Securities | | KeyBanc Capital Markets | | BMO Capital Markets | | Truist Securities |
The date of this prospectus is , 2025
GENERAL DISCLAIMERS
You should rely only on the information contained in this prospectus or in any free writing prospectus prepared by us. We have not, and the underwriters have not, authorized anyone to provide you with different information. If anyone provides you with different or inconsistent information, you should not rely on it.
You should assume that the information appearing in this prospectus and in any free writing prospectus prepared by us is accurate only as of their respective dates or on the date or dates specified in these documents. Our assets, business, cash flows, financial condition, liquidity, results of operations, and prospects may have changed since those dates.
This prospectus describes the specific details regarding this offering and the terms and conditions of our common stock being offered hereby and the risks of investing in our common stock. For additional information, please see the section entitled “Where You Can Find More Information.”
You should not interpret the contents of this prospectus or any free writing prospectus to be legal, business, investment or tax advice. You should consult with your own advisors for that type of advice and consult with them about the legal, tax, business, financial and other issues that you should consider before investing in our common stock.
“SmartStop Self Storage” and its logos and other trademarks referred to and included in this prospectus belong to us. Solely for convenience, we refer to our trademarks in this prospectus without the ® or the ™ or symbols, but such references are not intended to indicate that we will not assert, to the fullest extent under applicable law, our rights to our trademarks. Other service marks, trademarks and trade names referred to in this prospectus, if any, are the property of their respective owners, although for presentational convenience we may not use the ® or the ™ symbols to identify such trademarks.
MARKET, INDUSTRY, AND OTHER DATA
We use market data throughout this prospectus which has generally obtained from publicly available information and industry publications. These sources generally state that the information they provide has been obtained from sources believed to be reliable, but the accuracy and completeness of the information are not guaranteed. The market data includes forecasts and projections that are based on industry surveys and the preparers’ experiences in the industry, and there is no assurance that any of the projections or forecasts will be achieved. We believe that the surveys and market research others have performed are reliable, but we have not independently verified this information.
Unless otherwise indicated, references in this prospectus to information reported by U.S. Listed Self Storage REITs refer to metrics and data publicly reported by the U.S. Listed Self Storage REITs. See “Certain Defined Terms Used in This Prospectus.” The U.S. Listed Self Storage REITs may define or calculate such metrics or data differently than we do. Accordingly, our metrics or data may differ from, or may not be comparable to, the metrics and data of the U.S. Listed Self Storage REITs.
CONVERSION OF CLASS A COMMON STOCK AND CLASS T COMMON STOCK
Our charter provides that, upon the six-month anniversary of the listing of shares of our common stock for trading on a national securities exchange or such earlier date as approved by our Board, each share of Class A common stock and Class T common stock will automatically, and without any stockholder action, convert into a number of shares of our common stock equal to a fraction, the numerator of which is the net asset value of the Company allocable to the shares of Class A common stock and shares of Class T common stock, as applicable, and the denominator of which is the net asset value of the Company allocable to the shares of our common stock, or the Conversion.
ii
Shares of our common stock issued as a result of the conversion of shares of our Class A common stock and shares of Class T common stock, as described in the preceding paragraph, will be listed on the NYSE upon such conversion, which shall occur upon the six-month anniversary of the listing of shares of our common stock sold in this offering or such earlier date as approved by our Board. We have agreed that, without the prior written consent of the representatives on behalf of the underwriters, we will not approve the conversion of any of the outstanding shares of Class A common stock or shares of Class T common stock into shares of our common stock before the six-month anniversary of the listing of our common stock for trading on a national securities exchange.
CERTAIN DEFINED TERMS USED IN THIS PROSPECTUS
adjusted gross margin percentage | Net operating income divided by gross revenue less revenue from the tenant protection program. |
Board | The board of directors of SmartStop. |
CAGR | Compound annual growth rate. |
Code | The Internal Revenue Code of 1986, as amended. |
economically stabilized | Having achieved market rents on a per-unit and overall store basis, without having material in-place discounts or concessions. |
Exchange Act | The Securities Exchange Act of 1934, as amended. |
GAAP | United States generally accepted accounting principles. |
GTA | The Greater Toronto Area of Ontario, Canada. |
LTIP unit | A unit of limited partnership interest in our operating partnership issued or to be issued as a form of equity compensation to our executive officers and directors, subject to vesting criteria, with the rights, preferences and other privileges set forth in our operating partnership agreement. |
Managed REIT platform | Our platform to sponsor non-traded REITs that will invest in, among other things, non-stabilized, growth-oriented assets, and development projects. |
Managed REITs | The various REITs sponsored by SmartStop REIT Advisors, LLC, our indirect subsidiary, which may include in certain contexts one or more of Strategic Storage Trust IV, Inc., Strategic Storage Growth Trust II, Inc., Strategic Storage Trust VI, Inc., Strategic Storage Growth Trust III, Inc., and any future sponsored REITs. |
MGCL | Maryland General Corporation Law or any successor statute. |
iii
NAREIT | The National Association of Real Estate Investment Trusts. |
NYSE | The New York Stock Exchange. |
operating partnership | Our operating partnership, SmartStop OP, L.P., a Delaware limited partnership. |
operating partnership agreement | The Third Amended and Restated Limited Partnership Agreement of our operating partnership, as amended from time to time. |
OP unit | A common unit of limited partnership interest of our operating partnership. |
physically stabilized | Assets have achieved greater than 80% occupancy as measured by net rentable square feet. |
REIT | A real estate investment trust within the meaning of Section 856 through 860 of the Code. |
RentPOF | Annualized rental revenue net of discounts and concessions, excluding late fees, administrative fees and parking income for the period indicated, divided by the associated occupied square feet of storage for the period indicated. |
SAM | Strategic Asset Management I, LLC (f/k/a SmartStop Asset Management, LLC), the former sponsor of SmartStop, SST IV, and SSGT II. |
same-store | Assets are included in the same-store pool when we have owned them since January 1 of the prior calendar year and they have been physically stabilized for at least one full year prior to the beginning of the prior calendar year. |
Securities Act | The Securities Act of 1933, as amended. |
self administration transaction | The self administration transaction that closed in June 2019 in which we acquired the self storage advisory, asset management and property management businesses and certain joint venture interests of SAM, along with certain other assets of SAM. |
tenant protection program | Tenant protection plan, tenant insurance plan, and similar arrangements with respect to the protection of customer goods at our properties. |
U.S. Listed Self Storage REITs | CubeSmart, Extra Space Storage Inc., National Storage Affiliates Trust and Public Storage. |
As used in this prospectus, unless the context otherwise requires, references to “SmartStop,” “we,” “us,” “our,” the “Company” and similar references refer to SmartStop Self Storage REIT, Inc., a Maryland corporation, together with its consolidated subsidiaries, including its operating partnership.
iv
PROSPECTUS SUMMARY
This summary highlights some of the information in this prospectus. It does not contain all of the information that you should consider before investing in shares of our common stock. You should read carefully the more detailed information set forth under the heading “Risk Factors,” “Management’s Discussion and Analysis of Financial Condition and Results of Operations,” our consolidated financial statements and related notes and the other information included in this prospectus. Unless otherwise indicated, information contained in this prospectus assumes that the underwriters do not exercise their option to purchase additional shares.
Our Company
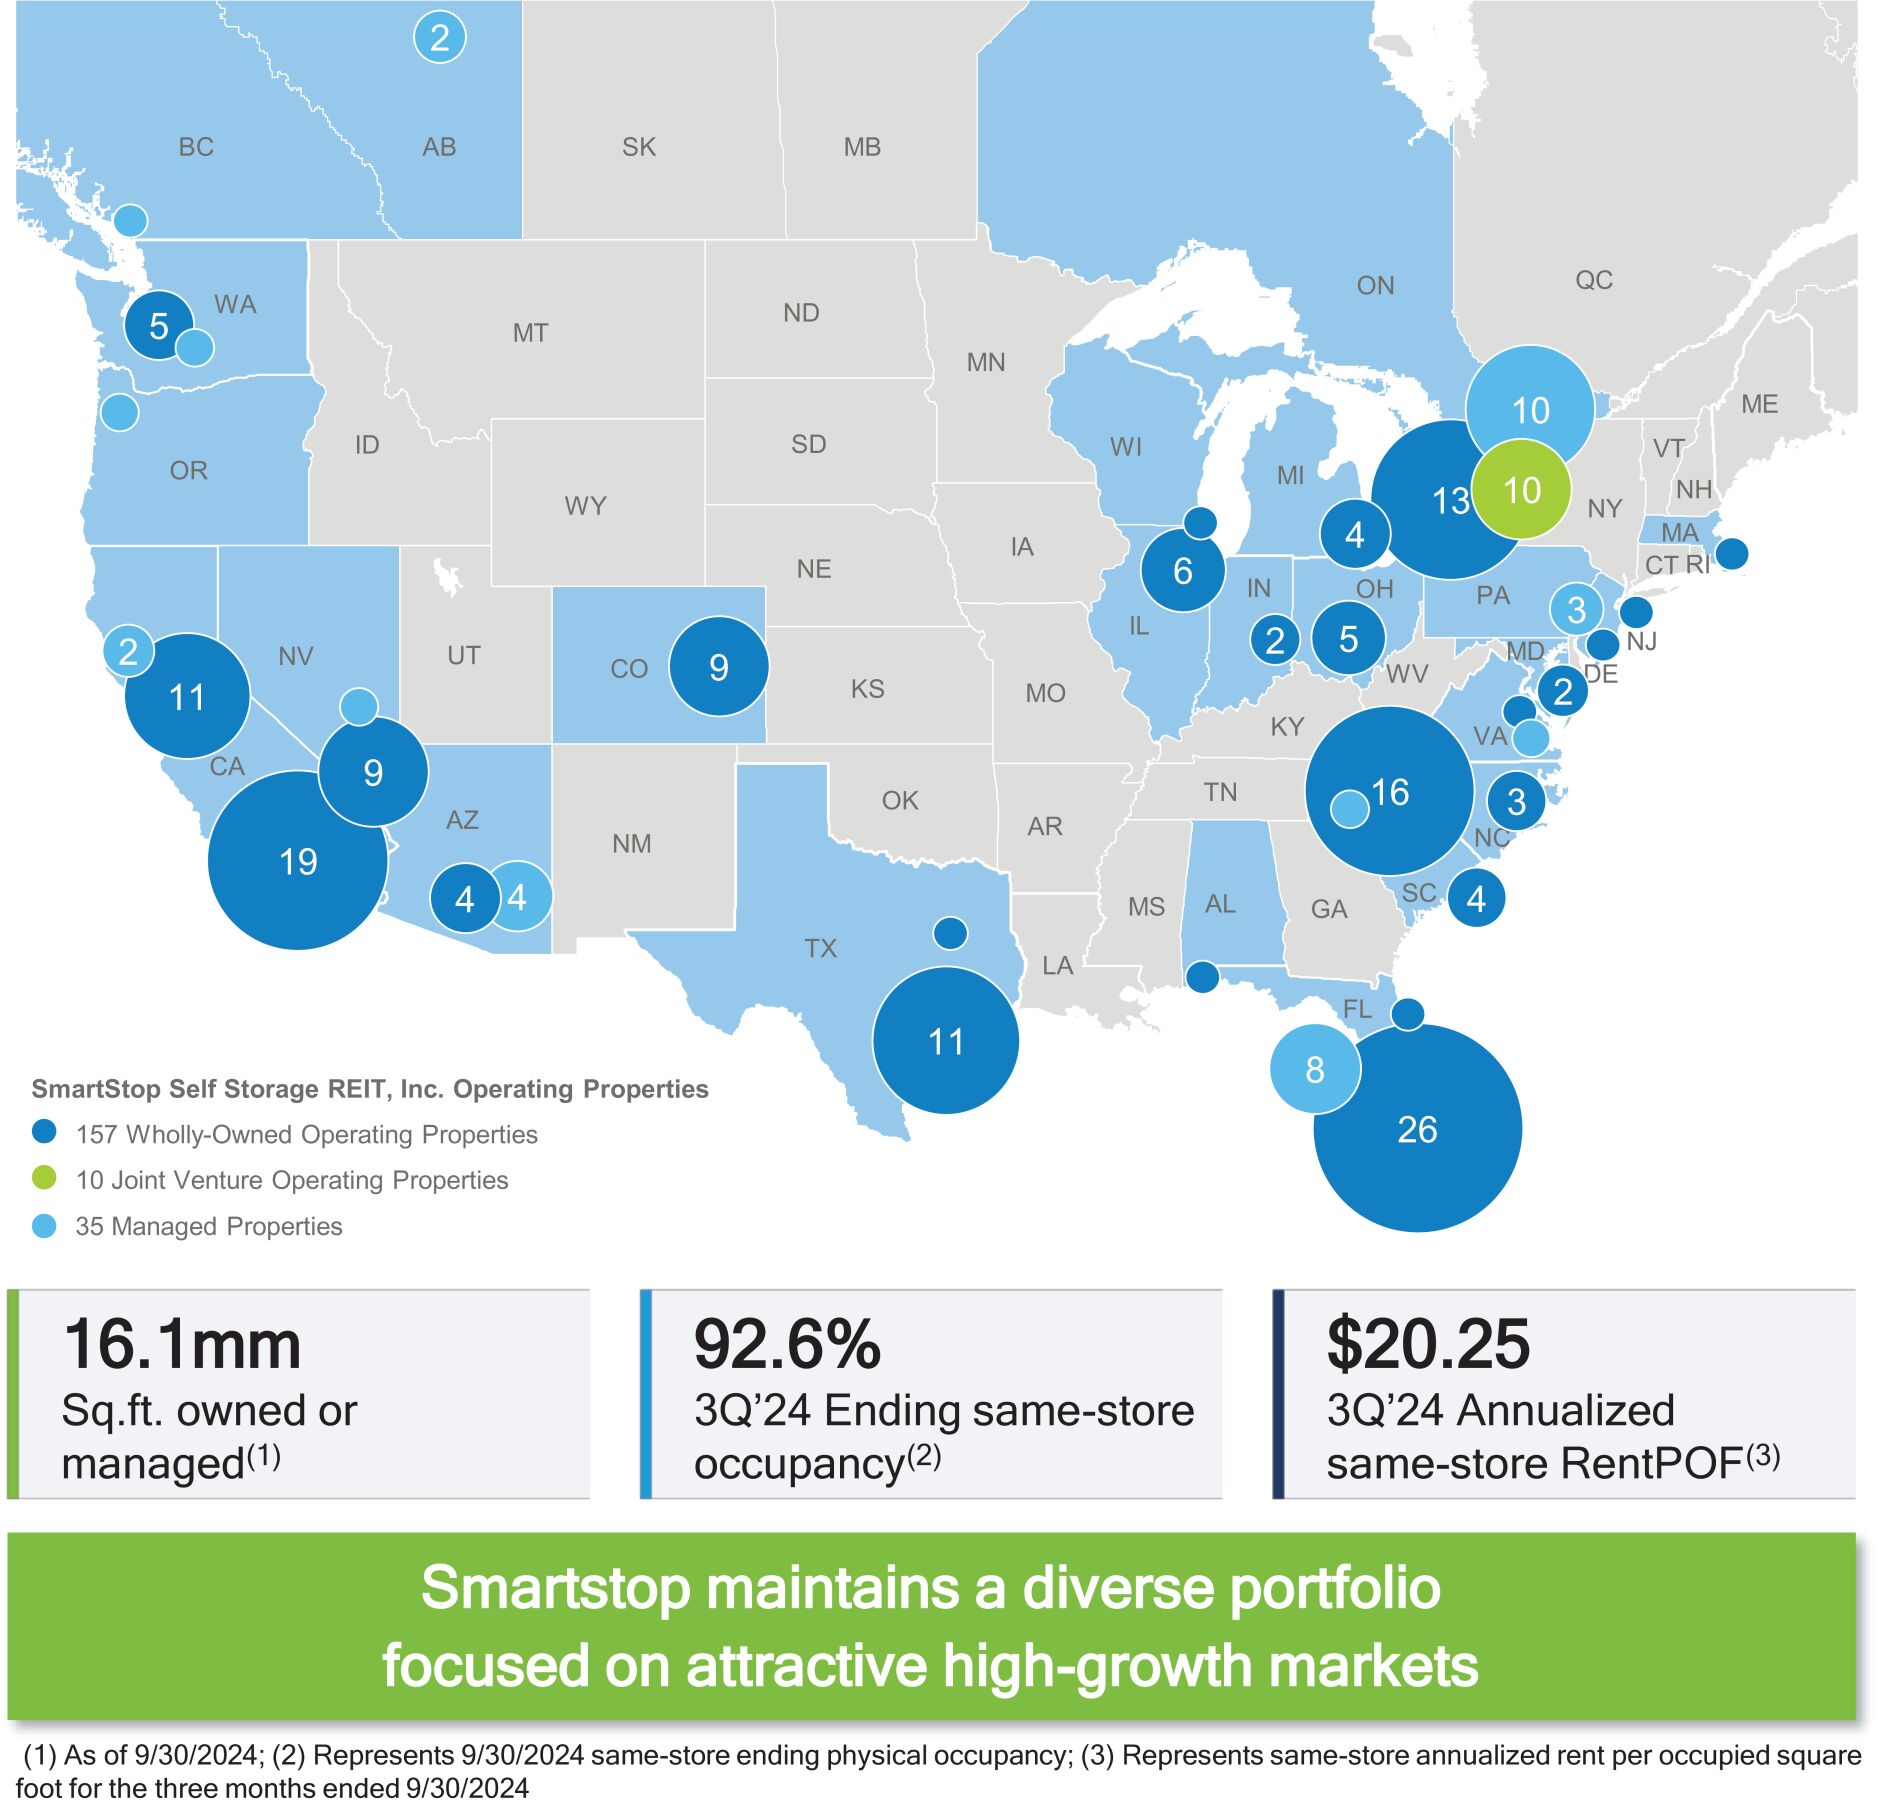
We are a premier owner and operator of self storage facilities in the United States and Canada. We are internally managed and have built a fully integrated, technology-enabled, data-driven, and scalable platform that is positioned for growth. We operate an institutional-quality portfolio of self storage properties that are located primarily within top metropolitan statistical areas, or MSAs, throughout the United States and within top census metropolitan areas, or CMAs, in Canada, including the Greater Toronto Area, or GTA. According to the Inside Self Storage Top-Operators List for 2024, we are the tenth largest owner and operator of self storage properties in the United States and according to Colliers, the largest in the GTA based on rentable square footage. As of September 30, 2024, we owned or managed 202 operating stores across 22 states and three provinces in Canada, comprising approximately 143,190 units and 16.1 million net rentable square feet.
The following table summarizes our owned and managed operating properties in our portfolio as of September 30, 2024:
| | | | | | | | | | | | | | | | |
Operating Portfolio Snapshot | | # of Stores | | | Net Rentable
Sq. Ft. | | | Units | | | 3Q24
Ending
Occupancy | |
Wholly-owned Stores | | | 157 | | | | 12,208,000 | | | | 106,300 | | | | 92.2 | % |
Joint Venture Stores | | | 10 | | | | 897,400 | | | | 9,440 | | | | 80.0 | % |
| | | | | | | | | | | | | | | | |
Total Owned Stores | | | 167 | | | | 13,105,400 | | | | 115,740 | | | | — | |
Managed Stores | | | 35 | | | | 3,040,200 | | | | 27,450 | | | | | |
| | | | | | | | | | | | | | | | |
Total Stores | | | 202 | | | | 16,145,600 | | | | 143,190 | | | | | |
We believe the self storage sector has distinguished itself as a core asset class with attractive long-term organic growth characteristics and strong free cash flow generation. We expect long-term self storage drivers, which include population growth, the percentage of renter occupied housing units and self storage supply constraints, to continue to underpin competitive risk adjusted returns relative to the broader real estate sector.
Since our founding, we have built a leading self storage brand in the United States and Canada, growing our total operating portfolio to 202 operating properties as of September 30, 2024. We have seen meaningful growth in our owned and managed portfolio, growing from 83 stores as of January 1, 2019 to 202 as of September 30, 2024 (representing a 16% CAGR). We maintain an investment strategy focused on acquiring or developing properties located in high quality sub-markets that offer our customers convenient, affordable and secure access to self storage units. Furthermore, we have created a scalable, leading technology-enabled platform that drives customer acquisition, customer service efficiencies and revenue management capabilities that optimize profitability across the portfolio.
A unique element to our growth story has been the successful expansion of our Canadian portfolio. Upon completion of this offering, we believe we will be the only U.S. listed self storage REIT with an owned portfolio
1
and operating platform in Canada (including in the GTA, one of the fastest growing and undersupplied markets in North America). Supported by strong demographic trends (according to Claritas, S&P Global, and Statistics Canada), GTA population growth from 2024 through 2029 is expected to be approximately 630 bps greater than the U.S. average. We believe Canada presents a compelling investment opportunity as home to several of the most attractive North American storage markets, highlighted by low supply per capita (2.3 square feet of existing self-storage space per capita in the GTA vs. 6.3 in the United States, according to Colliers and the 2024 Self-Storage Almanac), increasing product utilization, top-tier demographic trends, and limited institutional competition. Our joint venture in Canada with SmartCentres, one of the largest Toronto Stock Exchange-listed REITs, provides a pipeline of development opportunities at well trafficked locations within demographically advantaged CMAs. As of September 30, 2024, we owned or managed a portfolio of 33 operating properties comprising 3.1 million square feet in the GTA. This number included 13 wholly-owned facilities and 10 facilities in unconsolidated joint ventures in which we maintain a 50% equity interest. This number also included 10 facilities under management that were wholly-owned by the Managed REITs.
We employ a multi-pronged growth strategy focused on organic and external growth. We aim to grow the cash flow of our existing portfolio by utilizing our revenue management systems to grow revenue and leverage the scalability of our platform to increase expense efficiencies over time. Additionally, we expect to grow externally via acquisitions of newly built properties, ground up developments and strategic stabilized acquisitions, all of which we can execute either on-balance sheet or off-balance sheet through our Managed REITs. Our same-store portfolio, which represents 93.4% of our owned operating portfolio as measured by net rentable square feet, has averaged 8.3% NOI growth over the three-year period ended September 30, 2024. We have deep acquisition capabilities that allow us to focus on properties across the asset life cycle, from ground-up development to stabilized property acquisitions in many of the top MSAs in the United States and CMAs in Canada. Additionally, through a subsidiary, we serve as the sponsor of the Managed REITs. Our Managed REITs not only generate fees that offset our operating and general and administrative expenses but also enable us to strategically expand our platform off-balance sheet while providing potential future acquisition opportunities. Upon completion of this offering, we expect to have a fortified balance sheet with low leverage and ample liquidity that will position us to take advantage of growth opportunities.
Our Founder, Chairman and Chief Executive Officer, H. Michael Schwartz, founded our company in 2013, recognizing a market opportunity for a differentiated public self storage REIT focused on high quality self storage assets in high growth markets across the United States and Canada. Mr. Schwartz entered the self storage business in 2005 and has established a successful 20-year track record in the sector. In 2007, Mr. Schwartz founded Strategic Storage Trust, Inc., which became a fully integrated and self-managed self storage company that grew to own and/or operate 169 self storage properties and was ultimately sold to Extra Space Storage, Inc. for $1.4 billion in October 2015. In addition to Mr. Schwartz, we maintain a seasoned and multidisciplined executive management team with over 20 years of storage experience, on average.
We are organized as a Maryland corporation that has elected to be taxed as a REIT with operational headquarters in Ladera Ranch, CA. We generally will not be subject to U.S. federal income tax on our REIT taxable income to the extent that we distribute annually 100% of our REIT taxable income (including capital gains and computed without regard to the dividends paid deduction) to our stockholders and maintain our intended qualification as a REIT. We serve as the sole general partner of, and operate our business through, our operating partnership subsidiary, SmartStop OP, L.P., a Delaware limited partnership. Our operating partnership enables us to facilitate additional tax deferred acquisitions using OP units as consideration for these transactions.
Our Competitive Strengths
High-quality and Diversified Self Storage Portfolio. We own a large, geographically diversified portfolio comprised exclusively of self storage properties. Our portfolio consists of 167 wholly-owned and joint venture
2
operating self storage properties located in 19 states and Ontario, Canada. Our largest markets based on square footage owned include: Toronto, ON; Miami–Ft. Lauderdale, FL; Las Vegas, NV; Asheville, NC; Los Angeles, CA; and Houston, TX. Our properties are primarily located in high quality markets with attractive supply and demand characteristics. Many of these markets exhibit multiple barriers to entry against increased supply, including zoning restrictions that limit new self storage construction. Furthermore, we believe that our scale and the overall geographic diversification of our portfolio reduces risks associated with specific local or regional economic downturns or natural disasters.
The following map highlights the geographic diversification of our owned and managed operating properties in our portfolio, as of September 30, 2024:
3
The following table summarizes information about our wholly-owned and owned joint venture operating properties in our portfolio by MSA and the census metropolitan area, or CMA, as of September 30, 2024:
| | | | | | | | | | | | | | | | | | | | | | | | |
MSA/CMA(1) | | % of
Portfolio by
NRSF | | | Net
Rentable
Sq. Ft. | | | Units | | | # of
Stores | | | 3Q24
Ending
Occupancy | | | 3Q24
RentPOF | |
Toronto | | | 15.3 | % | | | 2,008,100 | | | | 20,050 | | | | 23 | | | | 86.8 | % | | $ | 20.47 | |
Miami - Fort Lauderdale | | | 9.3 | % | | | 1,221,100 | | | | 10,470 | | | | 12 | | | | 84.6 | % | | $ | 25.66 | |
Asheville | | | 6.6 | % | | | 869,900 | | | | 6,200 | | | | 14 | | | | 92.8 | % | | $ | 16.80 | |
Las Vegas | | | 6.6 | % | | | 865,000 | | | | 7,160 | | | | 9 | | | | 93.9 | % | | $ | 18.81 | |
Los Angeles | | | 5.6 | % | | | 738,500 | | | | 6,990 | | | | 11 | | | | 91.4 | % | | $ | 25.05 | |
Houston | | | 5.2 | % | | | 676,800 | | | | 5,130 | | | | 9 | | | | 93.2 | % | | $ | 19.02 | |
Tampa | | | 3.6 | % | | | 478,100 | | | | 3,890 | | | | 5 | | | | 93.8 | % | | $ | 18.46 | |
Denver | | | 3.3 | % | | | 437,300 | | | | 3,860 | | | | 7 | | | | 91.8 | % | | $ | 18.47 | |
Chicago | | | 3.3 | % | | | 432,450 | | | | 3,785 | | | | 6 | | | | 91.5 | % | | $ | 15.68 | |
Seattle - Tacoma | | | 3.0 | % | | | 390,550 | | | | 3,430 | | | | 5 | | | | 92.8 | % | | $ | 20.38 | |
Dayton | | | 2.9 | % | | | 375,800 | | | | 3,390 | | | | 7 | | | | 93.2 | % | | $ | 12.78 | |
Phoenix | | | 2.5 | % | | | 329,100 | | | | 3,130 | | | | 4 | | | | 93.0 | % | | $ | 17.50 | |
San Francisco - Oakland | | | 2.5 | % | | | 322,600 | | | | 2,920 | | | | 4 | | | | 90.0 | % | | $ | 23.90 | |
Port St. Lucie | | | 2.4 | % | | | 318,900 | | | | 2,610 | | | | 4 | | | | 93.6 | % | | $ | 19.53 | |
Sacramento | | | 2.4 | % | | | 308,100 | | | | 2,895 | | | | 4 | | | | 89.5 | % | | $ | 16.38 | |
Riverside - SB | | | 2.3 | % | | | 306,700 | | | | 2,690 | | | | 5 | | | | 94.0 | % | | $ | 21.67 | |
Detroit | | | 2.0 | % | | | 266,100 | | | | 2,220 | | | | 4 | | | | 93.3 | % | | $ | 15.83 | |
Myrtle Beach | | | 1.5 | % | | | 197,800 | | | | 1,450 | | | | 2 | | | | 90.8 | % | | $ | 14.55 | |
All Other(2) | | | 19.7 | % | | | 2,562,500 | | | | 23,470 | | | | 32 | | | | 87.4 | % | | $ | 20.79 | |
| | | | | | | | | | | | | | | | | | | | | | | | |
Total Stores(3) | | | 100.0 | % | | | 13,105,400 | | | | 115,740 | | | | 167 | | | | 90.7 | % | | $ | 19.93 | |
| (1) | | MSAs (Metropolitan Statistical Areas) as defined by the U.S. Census Bureau. Toronto CMA (Census Metropolitan Area) as defined by Statistics Canada. |
| (2) | | Other markets include: Baltimore, Charleston, Charlotte, Charlottesville, College Station, Colorado Springs, Dallas, Jacksonville, Milwaukee, Mobile, Nantucket, Naples, New York – Newark, Orlando, Punta Gorda, Raleigh – Cary, San Antonio, San Diego, Santa Maria – Santa Barbara, Santa Rosa – Petaluma, Sarasota, Stockton, Trenton – Princeton and Washington – Arlington. None of these markets represent more than 1.5% of the total portfolio by NRSF. |
| (3) | | Joint venture properties owned in our portfolio are included herein as if 100% owned. |
Our portfolio consists of a combination of recently constructed vertical facilities and early-generation facilities. The weighted average age of our portfolio by rentable square feet since initial construction or significant property redevelopment, whichever is more recent, is approximately 21 years. Our properties are designed to cater to the needs of both residential and commercial customers with features such as electronic gate entry, easy access, climate control, high quality security systems, keypad access, large truck accessibility and pest control. Some of our properties also offer outside storage for vehicles, boats and equipment.
Key Growth Markets and Sub-Markets with Strong Demographics. We seek to own properties that are conveniently located with highly accessible street access in high growth MSAs/CMAs and sub-markets. This includes markets with strong population and household income growth, high levels of population density and supply per capita that is below the U.S. national average. Approximately 65% of our portfolio is located in the top 25 MSAs and over 80% is located in the top 100 MSAs, based on net rentable square feet. While we have meaningful concentration in larger markets, we have also targeted specific smaller markets that exhibit underlying fundamentals that we believe are conducive to attractive risk-adjusted returns. We have invested in
4
smaller markets, including Asheville, NC and Dayton, OH, due to a combination of low supply per capita and limited competition from institutional operators, among other factors. According to statistics from Claritas and S&P Global, population growth for our top 10 markets is expected to grow approximately 120 bps faster (on a weighted average basis by rentable square feet) than the U.S. average from 2024 to 2029.
Differentiated Exposure to the Greater Toronto Area. Upon the completion of this offering, we believe we will be the only U.S. listed self storage REIT with an owned portfolio and operating platform in Canada and, more specifically, the GTA. As one of the world’s premier financial centers and sixth largest metro area in North America, the GTA has rapidly expanded its population of younger workers. Professionals are drawn to the GTA by its high quality, ubiquitous academic resources, which has resulted in the GTA becoming an emerging market for the digital economy. Supported by strong demographic trends (according to Claritas, S&P Global, and Statistics Canada, GTA population growth from 2024 through 2029 is expected to be approximately 630 bps greater than the U.S. average), we believe the GTA continues to represent a compelling market opportunity, highlighted by low supply per capita (according to Colliers and the 2024 Self-Storage Almanac, the GTA has 2.3x square feet per capita vs. 6.3x in the United States), increasing product utilization, and limited institutional competition. Below we highlight our management team’s history in the market, our existing portfolio and growth initiatives.
| | • | | Our Canadian Platform. Our management team has over 14 years of experience sourcing, developing, acquiring and operating in the GTA. During that time, we have built the local infrastructure to drive our future growth, with approximately 85 employees based in Canada, an executive vice president, or EVP, of Canada, and multi-lingual agents in our Canadian call center. We combine the institutional front and back office of the SmartStop platform with a unique Canadian-specific offering that includes a country specific website and domain, Canadian versions of the SmartStop branding package at all of our stores, and a dedicated and highly trained Canadian team of onsite professionals, all of whom are based in Canada. |
| | • | | Our Canadian Portfolio. We own or manage a portfolio of 33 operating properties in the GTA, comprising approximately 3.1 million square feet, which provides meaningful economies of scale within the GTA self storage market. This number includes 13 wholly-owned facilities and 10 facilities in unconsolidated joint ventures in which we maintain a 50% equity interest. This number also includes 10 facilities under management that were wholly-owned by the Managed REITs. We also manage two properties in Edmonton and one property in Vancouver. At September 30, 2024, we had 13 wholly-owned operating properties in the GTA accounting for approximately 1.1 million net rentable square feet, which accounted for 9.1% of our total wholly-owned portfolio as of September 30, 2024 and 11.4% of our net operating income, or NOI, for the quarter ended September 30, 2024. We have a joint venture with SmartCentres, which owns a diversified portfolio of real estate in Canada and is one of the largest Toronto Stock Exchange-listed REITs. The 50/50 joint venture affords each party a right of first offer to develop self storage facilities in certain CMAs in Canada. We owned 11 joint venture properties with SmartCentres as of September 30, 2024, of which 10 were operating self storage properties and an additional property which we intend to develop into a self storage facility in the future. We have a development pipeline of approximately 1.1 million net rentable square feet, which we believe we are capable of executing on over the next five years throughout multiple CMAs in Canada. |
Institutional-Quality, Technology-enabled, Data-driven Operations Focused on Customer Service. Over the past decade, we have made significant investments in technology, infrastructure, and human capital to support our operational and digital platforms and enable real-time decision making at scale. Digital tools, resources and enhancements are leveraged across our organization to jointly coordinate marketing and pricing activities, improve the customer experience, grow rental revenue and enhance expense efficiencies. Further, we have multiple data science-driven pricing automation systems that are proprietary to our operations platform. In 2022, we completed our transition to a new property management system, furthering our management
5
capabilities and facilitating continued property growth. Built on the latest cloud-based technology, the platform allows us greater flexibility in positioning competitive offerings in our customer pipeline. Aligned with this platform upgrade, SmartStop site managers are now using tablets as the primary tool when engaging with customers on new leasing opportunities. Store managers are no longer confined to the retail office in order to rent units, take payments, conduct lock checks, and conduct other business. We believe this system will help us compete as a top operator and foster continued property performance growth in the future. Today, our technology-driven operating platform includes:
| | • | | consistent and recognizable brand across store locations; |
| | • | | digital brand presence and protection; |
| | • | | highly sophisticated and responsive user-friendly website with mobile optimization; |
| | • | | proprietary data warehouse supported by a multitude of internal and external data sources, algorithmically driving pricing changes with over 18 billion data points; |
| | • | | dedicated, in-house call center; |
| | • | | ability to transact across a spectrum of mediums, including contactless, online rentals, call center rentals, reservations systems and in person rentals; |
| | • | | highly trained staff, focused on enhancing the customer experience; and |
| | • | | automated proprietary digital marketing algorithms driving near real time targeting and spend decisions. |
We are focused on creating a convenient and hassle-free customer experience with an emphasis on the leasing process, regardless of individual customer preferences. Accordingly, we offer website and call center reservations, in person leasing, call center leasing and website leasing, all from a variety of devices, including mobile phones and tablets. In the first nine months of 2024, approximately 35% of all rentals were executed in a contactless manner through our website, with another approximately 10–15% originating from our call center. Meeting the customer at their level has allowed us to bolster our digital marketing efforts, primarily driven by a combination of pay-per-click and search engine optimization campaigns, to continue to maintain attractive returns on invested marketing dollars. The technological backbone of our operating platform is further supported by a dedicated staff of operations professionals, including approximately 400 store-level employees. Our dedicated staff, institutional technology platform and branding presence led to Newsweek ranking us #1 in the self storage business for Best Customer Service in 2021, 2023 and 2024.
Scalable Platform and Asset Base to Drive Significant Growth. Our technology and human capital investments have resulted in a platform that we believe is capable of supporting a portfolio significantly larger than our existing operating portfolio. Our current back-office infrastructure—including accounting, acquisitions, operations and corporate finance—is well positioned to scale. We believe we can grow our portfolio at a rate significantly faster than our general and administrative expenses, which in turn should generate positive operating leverage and enhanced income growth. Additionally, we believe we have an opportunity to drive net operating income margin improvement on our same-store portfolio, as we continue to build out clusters in MSAs where we have less than 10 properties. Furthermore, with our smaller asset base relative to our publicly traded self storage peers, we believe we have an opportunity to achieve out-sized growth through manageable acquisition volumes.
Proven Acquisition Execution in the Self Storage Space. Our management team has significant experience acquiring self storage facilities across a broad spectrum of opportunities, including stabilized facilities, recently developed facilities in lease-up, facilities that have just received a certificate of occupancy, facilities in need of renovation and/or re-development and ground up development. Since the end of 2016, we have acquired over $1.7 billion in self-storage assets either on our balance sheet or on behalf of the Managed REITs. Our dedicated acquisitions team, located in both the United States and Canada, possesses an average of over 20 years of real
6
estate transaction experience and is responsible for executing all of our acquisitions through the use of our proprietary underwriting methodology. More importantly, our acquisitions team has cultivated relationships in the industry that are highly beneficial to our overall deal sourcing. We believe that we maintain a competitive advantage in acquiring facilities given the scale of our business, our experience and the networks of our team.
Further, we believe the acquisition environment has become more constructive. We maintain a disciplined approach to capital deployment and our underwriting standards. Since 2022, we have not observed many attractive opportunities to acquire assets accretively on our balance sheet. However, more recently, we have seen an improvement in seller expectations, coupled with an improved financing backdrop, resulting in an increase in self storage properties listed for sale across the United States and Canada. We have capitalized on the improving deal environment, as demonstrated by recently completed transactions, acquiring 17,350 net rentable square feet of self storage in attractive high-growth markets subsequent to September 30, 2024 (see External Growth Strategies for more detail), and have compiled a robust acquisition pipeline that we expect to close before March 31, 2025. We believe our platform is well positioned to pursue attractive and accretive acquisition opportunities.
Differentiated Capital Allocation Capability Through Managed REIT Platform Provides Additional Revenues and Potential Acquisition Pipeline. Our management team has an extensive track record of sponsoring and managing non-traded REITs. Since inception, our management team has raised approximately $2.4 billion across nine self storage programs. We currently sponsor and manage two non-traded REITs, Strategic Storage Trust VI, Inc., or SST VI, and Strategic Storage Growth Trust III, Inc., or SSGT III, from which we generate asset management fees, property management fees, acquisition fees, other fees and substantially all of the tenant protection program revenue. In the short-to-medium term, we plan to utilize our Managed REIT platform to sponsor non-traded REITs that will invest in, among other things, non-stabilized, growth-oriented assets, and development projects. We maintain an acquisition allocation policy that provides us the right of first allocation between us and the Managed REITs. As the assets under management in our Managed REITs grow, we will benefit from the additional management fees as well as the economies of scale that will reduce our operating expenses and improve our margins. Additionally, upon stabilization, our Managed REITs serve as potential accretive acquisition targets to drive our external growth. Since 2019, we have acquired or merged with three affiliated REITs. These include (i) the all-cash acquisition of Strategic Storage Growth Trust, Inc., or SSGT, in January 2019 whereby we acquired approximately $360 million in real estate related assets, (ii) the 100% stock-for-stock merger with Strategic Storage Trust IV, Inc., or SST IV, in March 2021 whereby we acquired approximately $375 million of real estate related assets, and (iii) the 100% stock-for-stock merger with Strategic Storage Growth Trust II, Inc., or SSGT II, in June 2022 whereby we acquired approximately $263 million of real estate related assets. With extensive start-up costs and the lack of established track records creating significant barriers to entry for others with respect to the non-traded REIT, we believe our Managed REIT platform provides us a competitive advantage relative to other U.S. Listed Self Storage REITs, which do not have such a platform.
Investment Grade Balance Sheet Well Positioned for Expansion. Upon completion of this offering, we will be well positioned to grow our portfolio by opportunistically pursuing acquisitions in a disciplined manner, while maintaining an attractive leverage profile and flexible balance sheet. Our leverage profile and significant liquidity is expected to position us to pursue attractive external growth opportunities in an accretive and prudently capitalized manner. Becoming a publicly traded REIT will enable us to access multiple forms of equity and debt capital currently not available to us, further enhancing our financial flexibility, cost of capital and external growth. In March 2022, we received an investment grade rating of BBB- with a Stable outlook from Kroll Bond Rating Agency, Inc. (KBRA), which we believe will be further enhanced upon completion of this offering and represents an important step towards our goal of becoming a fully unsecured issuer. KBRA reaffirmed this rating and outlook in April 2023. KBRA reaffirmed this rating again in April 2024 but downgraded the outlook to Negative.
7
Experienced and Aligned Management Team with Extensive Operating Expertise. Our management team has strong insight and operating acumen developed from decades of successfully operating self storage facilities and creating value while navigating through multiple real estate and economic cycles. Our Founder, Chairman and Chief Executive Officer, H. Michael Schwartz, has transacted more than $7.9 billion in commercial real estate, with more than $6.2 billion in the self storage industry. The other five members of our management team have extensive self storage experience with an average of 17 years in self storage roles. We benefit from the significant experience of our management team and its ability to effectively navigate changing market conditions and achieve sustained growth. In addition, we believe the interests of our management team are strongly aligned with our stockholders. As of the completion of this offering, we expect our management team to collectively own approximately % of our outstanding common stock and OP units, which represents $ million at the midpoint of the price range set forth on the front cover of this prospectus (assuming neither our Chief Executive Officer nor his affiliates purchase any shares of our common stock pursuant to the directed share program or in this offering).
Our Business Objectives and Growth Strategies
Our primary business objective is to deliver attractive risk-adjusted returns by investing in and operating a portfolio of newer generation self storage facilities and earlier generation self storage facilities, both primarily located in urban sub-markets. We intend to maximize cash flow to stockholders through both organic and external growth utilizing multiple levers and channels.
Organic Growth Strategies:
Leverage our Technology-Driven Operating Platform to Drive Optimal Asset Level Performance. We are highly focused on maximizing cash flows at our properties by leveraging the economies of scale provided by our technology-enabled platform and proprietary systems. As we continue to scale, we intend to utilize our revenue management capabilities which include digital marketing algorithms, data warehouse with algorithmic pricing, digital tools and a dedicated call center, among others, to position us to achieve optimal market rents and occupancy, reduce operating expenses and increase the sale of ancillary products and services. Our ability to drive enhanced revenue is highlighted by our three-year average same-store revenue growth, which was 7.3%, or approximately 10 bps higher than the U.S. Publicly Listed REITs over the same period.
Margin Expansion and Other Ancillary Revenue Opportunities. There is a substantial opportunity to grow our profitability and earnings through margin improvement. The adjusted gross margin percentage of our same-store portfolio was 67.6% for the quarter ended September 30, 2024, 530 basis points below that of the average of the U.S. Listed Self Storage REITs, and the adjusted gross margin percentage for our non-stabilized wholly-owned portfolio was 47.7%. Our ability to drive rental rate growth and the maturation of our wholly-owned portfolio (both same-store and non-same-store) will lead to expanded adjusted gross margin percentage at the property level. We have also focused on reducing operating expenses and are utilizing renewable energy to reduce our utility costs. As of September 30, 2024, we have installed solar panels on 49 properties in our owned portfolio and have additional projects underway at 13 of our facilities. Those projects are expected to yield a weighted average return in the low-teens on our investment. Furthermore, the sale of ancillary products and services that are complementary to our customers’ use of our self storage facilities, including, but not limited to, tenant protection programs, locks, boxes and other packing supplies present an additional area of potential organic net operating income growth. Lastly, expanding our presence in markets where we don’t currently have significant clustering of our properties, primarily through external growth, should enable cost efficiencies through expense line items such as payroll and advertising amongst others. As an example, among our same-store portfolio, for markets where we own 10 or more properties, our average adjusted gross margin is over 70%, or approximately 300 basis points higher than the same-store portfolio average. The combination of rental rate
8
growth, general maturation, increased clustering, expense control and ancillary sales should enable both our same-store and non-same-store portfolios to achieve higher adjusted gross margin percentages than they achieve today.
Maximize Property Level Cash Flow at Non-Stabilized Stores. As of September 30, 2024, approximately 6.6% of our wholly-owned stores, as measured by net rentable square feet, were characterized as non-stabilized, or not economically stabilized. This exposure includes certificate of occupancy and lease-up stores, which are generally dilutive to cash flow in the near-term but generally have higher longer-term yield potential than investments in physically stabilized self storage facilities. During the quarter ended September 30, 2024, the average RentPOF for what we consider our non-stabilized wholly-owned portfolio was $15.56 as compared to $20.25 for our same-store portfolio. Likewise, the physical occupancy of our non-stabilized wholly-owned portfolio was 86.4%, or 620 basis points below that of our same-store portfolio. Further, our adjusted gross margin percentage was 47.7% for our non-stabilized wholly-owned portfolio, 19.9% below that of our same-store portfolio and 25.2% below the average of the U.S. Listed Self Storage REITs’ same-store portfolios for the quarter ended September 30, 2024. We believe that by leveraging our operating platform and experience, this non-stabilized portfolio has the potential to produce higher revenue and net operating income growth than our same-store portfolio until economic stabilization.
The following table breaks out our owned operating stores as of September 30, 2024, by stabilized and non-stabilized classifications:
| | | | | | | | | | | | | | | | | | | | | | | | | | | | |
| | | | | | | | | | | | RentPOF
for the
Three Months
Ended
September 30,(1) | | | Ending Occupancy
as of
September 30, | |
Owned Operating Stores | | # of
Stores | | | Net Rentable
Sq. Ft. | | | Units | | | 2024 | | | 2023 | | | 2024 | | | 2023 | |
Same-Store Wholly-Owned | | | 148 | | | | 11,403,300 | | | | 98,675 | | | $ | 20.25 | | | $ | 20.14 | | | | 92.6 | % | | | 92.8 | % |
Non Stabilized Wholly-Owned | | | 9 | | | | 804,700 | | | | 7,625 | | | $ | 15.56 | | | | NM | | | | 86.4 | % | | | NM | |
Total Wholly-Owned Operating Stores | | | 157 | | | | 12,208,000 | | | | 106,300 | | | $ | 20.01 | | | | NM | | | | 92.2 | % | | | NM | |
Total Joint Venture Operating Stores | | | 10 | | | | 897,400 | | | | 9,440 | | | $ | 18.85 | | | | NM | | | | 80.0 | % | | | NM | |
Total All Owned Operating Stores | | | 167 | | | | 13,105,400 | | | | 115,740 | | | | | | | | | | | | | | | | | |
NM: Not meaningful comparison
| (1) | | RentPOF defined as annualized rental revenue net of discounts and concessions, excluding late fees, administrative fees and parking income, divided by occupied square feet of storage. Not in thousands. |
External Growth Strategies:
Our portfolio growth will primarily be driven through the acquisition of stabilized facilities, but we also intend to opportunistically acquire facilities in lease-up, facilities that have just received a certificate of occupancy, facilities in need of renovation, re-development or expansion and ground up development. As a publicly listed REIT, we believe we will have access to a more favorable cost of capital and broader capital markets solutions to help us execute on our external growth strategy. To date, we have not regularly utilized OP units as consideration for acquisitions; however, we may do so as a listed REIT using an umbrella partnership, or UPREIT, structure.
Our relative size is a key differentiator between us and the U.S. Listed Self Storage REITs. Our portfolio consists of 167 owned self storage facilities, encompassing 13.1 million net rentable square feet. By comparison, the average owned portfolio of the U.S. Listed Self Storage REITs is approximately 1,800 facilities, encompassing over 130 million net rentable square feet as of September 30, 2024, or approximately 10 times our
9
size by both metrics. We believe this dynamic will allow us to be more nimble and selective in our external growth strategy, while capitalizing on economies of scale as we grow. We intend to execute our external growth strategy in our existing markets and target markets that have comparably strong demographic and competitive trends.
| | • | | On-Balance Sheet Acquisitions. We expect to acquire stabilized and non-stabilized properties on-balance sheet in the United States and Canada in an accretive manner to FFO, as adjusted. In Canada specifically, we believe our scale and experience competitively positions us to capitalize on acquisition opportunities in a highly fragmented market that has relatively less sophisticated and smaller operators than are in the United States. |
| | • | | Embedded Acquisition Pipeline. Subsequent to the quarter ending September 30, 2024, we acquired one property for $9.5 million, totaling approximately 17,350 NRSF and 200 self storage units. Additionally, we have built a pipeline of acquisitions that we are scheduled to close before March 31, 2025 for approximately $225 million, totaling approximately 659,500 NRSF and 6,830 self storage units. This pipeline comprises deals that are either under contract or for which we have a letter of intent to acquire. Although we are scheduled to close these acquisitions prior to the end of the first quarter of 2025, the acquisitions are subject to customary closing conditions, and there is no assurance that these properties will be acquired or will be acquired at the time or pursuant to the terms currently contemplated. These assets are located in attractive high-growth submarkets within the top 25 U.S. MSA’s or the top 25 Canadian CMA’s. These acquisitions include the following: |
| | • | | Boston MSA: We closed on the acquisition of a property in the Boston, MA MSA on November 20, 2024 for approximately $9.5 million, totaling approximately 17,350 NRSF and 200 self storage units; |
| | • | | Denver MSA: We are under contract on the acquisition of a property in the Denver, CO MSA for approximately $14.7 million, totaling approximately 87,450 NRSF and 740 self storage units; |
| | • | | San Jose MSA: We are under contract on the acquisition of a property in the San Jose, CA MSA for approximately $19.4 million, totaling approximately 59,650 NRSF and 650 self storage units; |
| | • | | Los Angeles MSA: We are under contract on the acquisition of a property in the Los Angeles, CA MSA for $70.0 million, totaling approximately 136,300 NRSF and 1,300 self storage units; |
| | • | | Washington MSA: We are under contract on the acquisition of a property in the Washington-Arlington-Alexandria MSA for $18.0 million, totaling approximately 74,300 NRSF and 830 self storage units; |
| | • | | New York MSA: We are under contract on the acquisition of two properties in the New York, NY MSA for $74.5 million. These properties represent approximately 227,700 NRSF and 2,500 self storage units; |
| | • | | Kelowna CMA: We are under contract on the acquisition of a property in the Kelowna, BC CMA for approximately $28.1 million ($39.3 million CAD), totaling approximately 74,100 NRSF and 810 self storage units; |
| | • | | Canadian Platform Provides Growth Opportunities with Less Institutional Competition. According to Colliers, we are currently the fifth largest self storage operator in Canada based on rentable square footage and believe we will be the only U.S. Listed Self Storage REIT with an owned portfolio and operating platform in Canada. The percentage of self storage assets operated by sophisticated institutions is significantly lower in Canada than in the United States. This dynamic allows for a relatively lower level of operating competition while offering a range of acquisition opportunities. Our portfolio in Canada |
10
| | accounts for 15.6% of our total owned portfolio as measured by rentable square feet and is exclusively in the GTA. We intend to target investments in other CMAs in Canada, including, but not limited to, Vancouver, Montreal, Edmonton, Calgary, and Ottawa. As of September 30, 2024, we have a 50% interest in a joint venture, along with SmartCentres, which owns a property in the Vancouver CMA. The joint venture intends to develop this property into a self storage facility in the future. Also, as of September 30, 2024, the Managed REITs own an operating property in Vancouver, three properties in development in Vancouver, two operating properties in Edmonton, and three properties in development in Montreal. |
| | • | | Joint Ventures. We have a joint venture with SmartCentres, which owns a diversified portfolio of real estate in Canada and is one of the largest TSX-listed REITs. The 50/50 joint venture affords each party a right of first offer to develop self storage facilities in certain CMAs in Canada. As of September 30, 2024, the joint venture owned 10 operating properties in the GTA. Through this joint venture, we have a development pipeline of approximately 600,000 net rentable square feet, representing approximately 6,600 units across multiple CMAs in Canada. We expect to continue to utilize the joint venture to develop and redevelop in Canada. |
| | • | | Strategic Combinations of Affiliated Funds. With our management of the Managed REITs and our demonstrated track record of acquiring or merging with previous Managed REITs, we believe our Managed REIT platform provides a potential future pipeline of relatively large portfolio acquisitions for us, serving to enhance our external growth and cash flow to stockholders. As of September 30, 2024, the Managed REITs owned 34 assets, representing approximately 2.9 million of net rentable square feet across 26,500 units. |
| | • | | Redevelopment. Our team of seasoned professionals identifies opportunities to unlock additional value at our properties through selectively redeveloping certain properties. We plan to actively reinvest in our portfolio going forward. |
| | • | | Third-Party Management Platform. According to Colliers, the top 10 operators in Canada, as determined by square footage, account for only 20% of all self storage facilities across the country. The percentage of self storage assets operated by owners with only one or two stores in Canada is estimated at approximately 70% according to Colliers. We intend to capitalize on the nascent institutional competitive landscape by establishing a market leading third-party management platform in Canada, in which we manage and operate self storage properties owned by third parties in exchange for fees. We believe there is an opportunity to establish our third-party management platform in both Canada and the United States with nominal incremental investment, either through the development of our own third-party management platform or an investment in an existing third-party management platform. |
Post Quarter-End Operations Update:
Subsequent to the quarter ending September 30, 2024, we provided an update to the following metrics for our 2024 same-store pool:
| | • | | Physical occupancy as of October 31, 2024 and October 31, 2023 was 92.4% and 92.4%, respectively. Physical occupancy as of November 30, 2024 and November 30, 2023 was 92.3% and 92.2%, respectively. |
| | • | | Monthly web rates as of October 31, 2024 and October 31, 2023 were $1.08 and $1.18, respectively. Monthly web rates as of November 30, 2024 and November 30, 2023 were $0.97 and $1.17, respectively. |
| | • | | Monthly move-in rates as of October 31, 2024 and October 31, 2023 were $1.05 and $1.01, respectively. Monthly move-in rates as of November 30, 2024 and November 30, 2023 were $1.00 and $1.05, respectively. |
11
| | • | | Monthly in-place rates as of October 31, 2024 and October 31, 2023 were $1.64 and $1.62, respectively. Monthly in-place rates as of November 30, 2024 and November 30, 2023 were $1.64 and $1.60, respectively. |
Self Storage Industry Overview and Market Opportunity
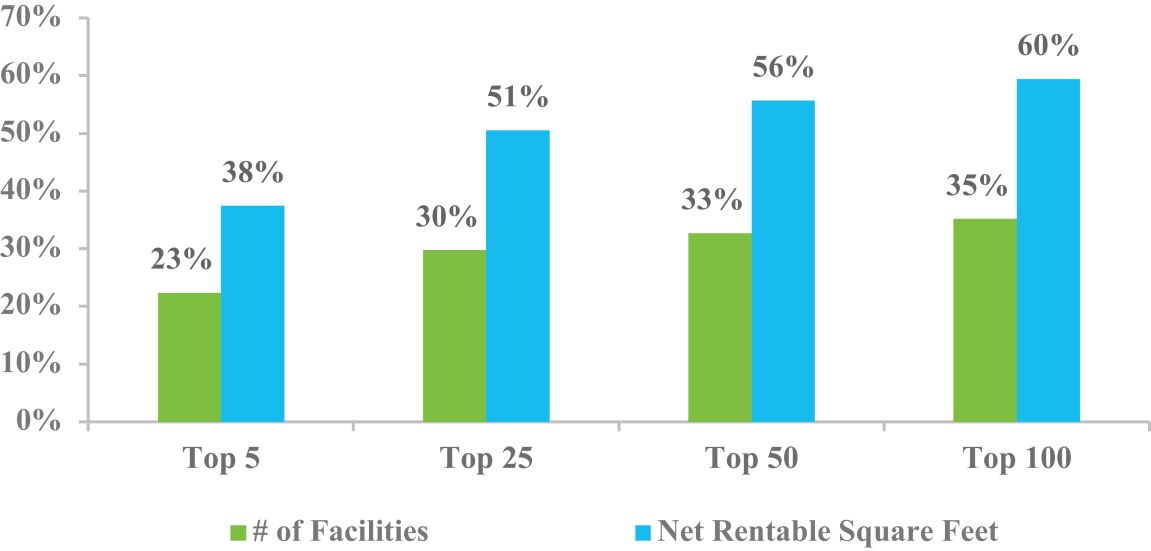
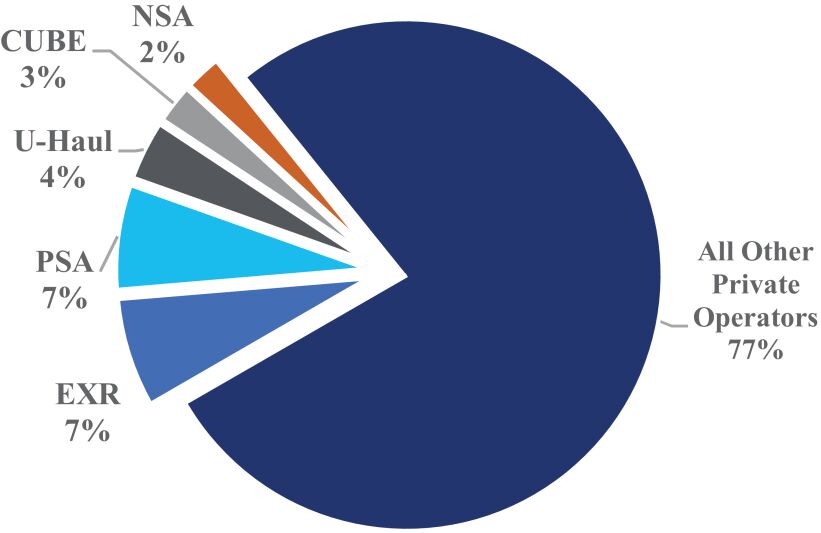
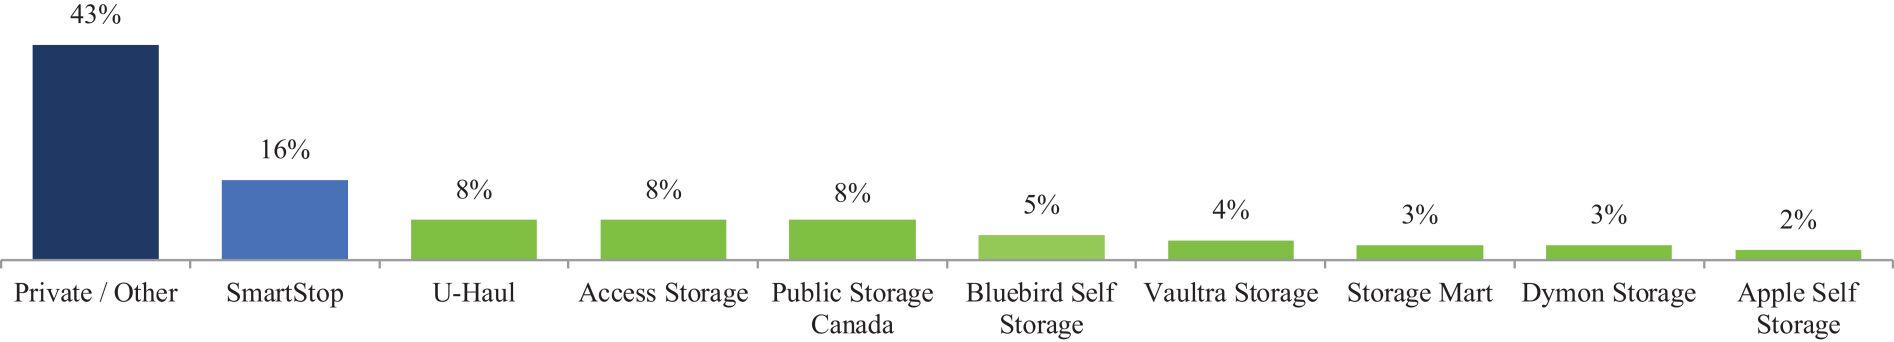
The self storage industry is highly fragmented, with owners and operators ranging from individual property owners to blue chip institutional investors and large, publicly traded REITs. According to the 2024 Self-Storage Almanac published by Mini-Storage Messenger and MiniCo Publishing, or the 2024 Self-Storage Almanac, there are approximately 52,300 primary self storage facilities in the United States representing a total of 2.1 billion rentable square feet. The largest 100 operators manage approximately 60% of net rentable square footage, but only 35% of all U.S.-based self storage properties. The U.S. Listed Self Storage REITs and AMERCO (NASDAQ: UHAL) operate approximately 23% of all U.S.-based self storage properties. Similar to the U.S. self storage market, the self storage market in Canada exhibits highly fragmented ownership, albeit to a much greater extent. Colliers estimates that approximately 70% of all self storage facilities in Canada are owned by individuals with only one or two stores. The top 10 operators in Canada, as determined by square footage, account for only 20% of all self storage facilities across the country. With the majority of the existing supply operated locally by non-institutional groups in the United States and Canada, there is a significant market opportunity to acquire existing facilities and increase revenue and profitability through professional management, technological platforms and physical expansion projects.
The combination of attractive fundamentals and superior operating performance has driven self storage to outperform other real estate sectors in both the private and public markets. According to NAREIT, the self storage sector has been one of the best performing REIT sectors since 1994. While past performance is not indicative of future results, a $100 investment in the self storage sector in 1994 would have yielded $6,941 through 2023, an approximately 6,900% total return. The second best performing NAREIT real estate sub-sector, residential, would have yielded a value of $2,036 over the same period, while a $100 investment in lodging / resorts would have only yielded $345. Furthermore, the self storage sector was the best performing real estate sector in 2021 and was the fifth best performing real estate sector in 2023.
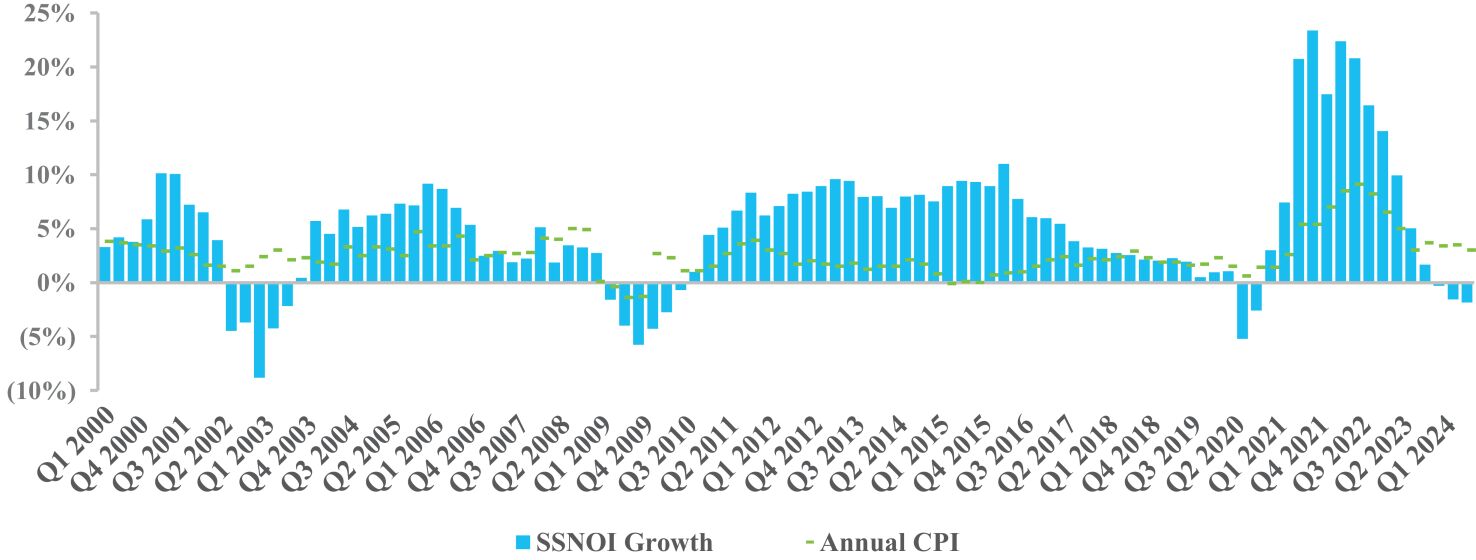
More recently, strength in housing markets and the ability for employees to work remotely has fueled demand for storage, leading to a record year of operating performance across the industry in 2021 and 2022. High occupancy levels, supply constraints and inelasticity in pricing, coupled with underlining demand drivers, position the sector for continued rent growth and accelerating profitability. These drivers allowed the self storage sector to achieve outsized rent growth relative to other REIT sectors in 2021 and 2022. While the work from home environment remains elevated over pre-COVID-19 pandemic levels, this trend began to wane in 2023, which we believe led to elevated move-outs. As a result, occupancy, same-store growth and overall results began normalizing. Further, the broader economy has been experiencing elevated levels of inflation, higher interest rates, tightening monetary policies and a slowdown in home price appreciation and home sales. This could result in less discretionary spending, weakening consumer balance sheets and reduced demand for self storage. Additionally, a prolonged period of elevated inflation and/or higher interest rates could result in a further contraction of self storage demand. However, demand for the self storage sector is dynamic, with drivers that function in a multitude of economic environments, both cyclically and counter-cyclically. Demand for self storage tends to be needs-based, with numerous factors that lead customers to renting and maintaining storage units. We believe the nimble rate and leasing strategies that sophisticated operators have executed on, coupled with the improving supply environment, should position self storage favorably to achieve incremental growth in a variety of economic environments, including an inflationary environment.
12
Our Structure
Share Classes and Conversion
Our charter authorizes us to issue up to 900,000,000 shares of stock, of which 700,000,000 shares are designated as common stock at $0.001 par value per share and 200,000,000 shares are designated as preferred stock at $0.001 par value per share. Of the 700,000,000 shares of common stock authorized, shares are classified as Class A common stock, shares are classified as Class T common stock, and shares are unclassified common stock.
Upon the six-month anniversary of the listing of shares of our common stock for trading on a national securities exchange or such earlier date as approved by our Board, each share of Class A common stock and Class T common stock will automatically, and without any stockholder action, convert into a number of shares of our common stock equal to a fraction, the numerator of which is the net asset value of the Company allocable to the shares of Class A common stock and shares of Class T common stock, as applicable, and the denominator of which is the net asset value of the Company allocable to the shares of our common stock, or the Conversion.
Our Operating Partnership
Substantially all of our business is conducted through our operating partnership. We will contribute the net proceeds received by us from this offering to our operating partnership in exchange for OP units. Our interest in our operating partnership generally entitles us to share in cash distributions from, and in the profits and losses of, our operating partnership in proportion to our percentage ownership. As the sole general partner of our operating partnership, we have the exclusive power to manage and conduct the business of our operating partnership. We conduct certain activities through SmartStop TRS, Inc., or other taxable REIT subsidiaries, which are directly or indirectly wholly-owned subsidiaries of our operating partnership. After giving effect to this offering and the Listing Equity Grants described herein, we would own or control % of the OP units and our executive officers would own or control % of the OP units, each as of , 2024.
Beginning on and after the date that is one year after the issuance of OP units to a limited partner, such limited partner has the right to require the operating partnership to redeem all or part of such OP units, subject to certain limitations, for cash, based upon the value of an equivalent number of shares of our common stock at the time of the redemption, or, at our election, shares of our common stock on a one-for-one basis, subject to certain adjustments and the restrictions on ownership and transfer of our stock set forth in our charter and described under the section entitled “Description of Capital Stock—Restrictions on Ownership and Transfer.” See “Our Operating Partnership Agreement” for more information.
13
Organizational Chart
The following chart sets forth information about our Company, the operating partnership and certain related parties upon completion of this offering. Ownership percentages below assume that the underwriters’ option to purchase additional shares of our common stock is not exercised and include the Listing Equity Grants, as defined below. However, the following chart does not include the shares of common stock that may be purchased in this offering or pursuant to our directed share program described under “Underwriting—Directed Share Program.” This chart is for illustrative purposes only and does not represent all legal entities affiliated with the entities depicted.
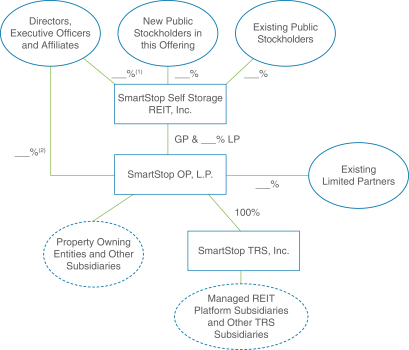
| (1) | | Includes shares of Class A common stock owned by a subsidiary of SAM, which shares are indirectly owned and controlled by Mr. Schwartz. Excludes shares of our common stock available for future issuance under our 2022 Long-Term Incentive Plan (the “Incentive Plan”). |
| (2) | | Includes (i) unvested time-based LTIP units, (ii) vested LTIP units and (iii) OP units and Class A-1 Units owned by subsidiaries of SAM, with certain units owned indirectly and controlled by Mr. Schwartz and other units owned by current and former employees and other current and former affiliates of SAM. Includes unvested performance-based LTIP units (such number of LTIP units assumes that such unvested performance-based awards vest at maximum levels for the performance conditions that have not yet been achieved; to the extent that performance does not meet maximum levels, the actual number of OP units which vest under those awards could be less than the amount reflected above). OP units are redeemable for cash or, at our election, shares of our common stock on a one-for-one basis, subject to adjustment in certain circumstances. For purposes of the foregoing, LTIP units are long-term equity incentive awards in the form of limited partnership units of the operating partnership that vest over time or based on performance. Upon the occurrence of certain events described in the operating partnership agreement, LTIP units may convert into an equal number of OP units. |
14
Listing Equity Grants
In connection with this offering, the Compensation Committee intends to authorize us to grant LTIP units and/or shares of Class A restricted stock, or the Listing Equity Grants, to our directors and our employee base, dependent on tenure and other factors. The intent of the Listing Equity Grants is to provide the majority of our employees with a vested interest in the performance of the Company. Additionally, no portion of the Listing Equity Grants will be allocated to our Chairman, Founder, and Chief Executive Officer, H. Michael Schwartz. The Listing Equity Grants will be subject to and become effective upon the listing of our common stock on the NYSE. The total amount of Listing Equity Grants is expected to be approximately 2% of the aggregate amount of shares of our common stock offered in this offering.
Our Tax Status
We elected to be taxed as a REIT for U.S. federal income tax purposes commencing with our taxable year ended December 31, 2014. To maintain REIT status, we must meet a number of organizational and operational requirements, including a requirement that we make distributions each taxable year equal to at least 90% of our REIT taxable income (excluding capital gains and computed without regard to the dividends paid deduction). See “Federal Income Tax Considerations.”
Distribution Policy
We intend to make distributions to holders of shares of our common stock offered in this offering, when, as and if authorized by our Board out of legally available funds, based on a distribution rate of $ per share of common stock beginning the first full month following this offering. On an annualized basis, this would be $ per share of common stock, or an annualized distribution rate of % based on the public offering price of $ per share, which is the midpoint of the price range set forth on the front cover of this prospectus. We estimate that this annual distribution rate will represent approximately % of our estimated cash available for distribution to stockholders for the 12 months ending September 30, 2025, assuming that the underwriters do not exercise their option to purchase up to an additional shares to cover overallotments, if any. We do not intend to reduce the annualized distribution per share of common stock if the underwriters exercise their option to purchase additional shares.
We cannot assure you that our estimated distributions will be made or sustained or that our Board will not change our distribution policy in the future. Any distributions will be at the sole discretion of our Board, and their form, timing and amount, if any, will depend upon a number of factors, including our actual and projected results of operations, FFO, FFO, as adjusted, liquidity, cash flows and financial condition, the revenue we actually receive from our properties, our operating expenses, our debt service requirements, our capital expenditures, prohibitions and other limitations under our financing arrangements, our REIT taxable income, the annual REIT distribution requirements, applicable law, including restrictions on distributions under Maryland law, and such other factors as our Board deems relevant.
Restrictions on Ownership and Transfer of Shares of our Common Stock
We may prohibit certain acquisitions and transfers of shares so as to ensure our continued qualification as a REIT under the Code. However, we cannot assure stockholders that this prohibition will be effective. Because we believe it is essential for us to qualify and continue to qualify as a REIT, our charter provides (subject to certain exceptions) that no stockholder may own, or be deemed to own by virtue of the attribution provisions of the Code, more than 9.8% in value of the outstanding shares of our stock or more than 9.8% of the number or value (whichever is more restrictive) of the outstanding shares of our common stock.
15
Our Board, in its sole discretion, may waive this ownership limit (prospectively or retroactively) if evidence satisfactory to our Board, including certain representations and undertakings required by our charter, is presented that such ownership will not then or in the future jeopardize our status as a REIT. Also, these restrictions on transferability and ownership will not apply if our Board determines that it is no longer in our best interests to continue to qualify as a REIT or that compliance is no longer required in order for us to qualify as a REIT. See “Description of Capital Stock—Restrictions on Ownership and Transfer.”
Corporate Information
SmartStop was formed as a Maryland corporation in January 2013. Our principal executive office is located at 10 Terrace Rd, Ladera Ranch, California 92694. Our telephone number is (866) 418-5144. We maintain a website at www.smartstopselfstorage.com. Information contained on, or accessible through, our website is not incorporated by reference into and does not constitute a part of this prospectus.
Summary Risk Factors
Investing in our common stock involves substantial risk. Our ability to execute our strategy is also subject to certain risks. The risks described under the heading “Risk Factors” included elsewhere in this prospectus may cause us not to realize the full benefits of our strengths or may cause us to be unable to successfully execute all or party of our strategy. The following list of risks and uncertainties is only a summary of some of the most important risks related to SmartStop, its operations, and the offering and is not intended to be exhaustive. This risk factor summary should be read together with the more detailed discussion of risks and uncertainties set forth under “Risk Factors.”
Risks Related to an Investment in SmartStop Self Storage REIT, Inc.
| | • | | Our future results may suffer as a result of the effect of recent affiliated mergers, acquisitions and other strategic transactions. |
| | • | | Certain of our officers and key personnel will face competing demands relating to their time and will face conflicts of interest related to the positions they hold with affiliated entities, which could cause our business to suffer. |
| | • | | Revenue and earnings from the Managed REIT platform are uncertain. |
Risks Related to the Self Storage Industry
| | • | | Because we are focused on the self storage industry, our rental revenues will be significantly influenced by demand for self storage space generally, and a decrease in such demand would likely have a greater adverse effect on our rental revenues than if we owned a more diversified real estate portfolio. |
| | • | | We may be unable to promptly re-let units within our facilities at satisfactory rental rates. |
Risks Related to Investments in Real Estate
| | • | | A high concentration of our properties in a particular geographic area would magnify the effects of downturns in that geographic area. |
| | • | | Our real estate assets may decline in value and be subject to significant impairment losses, which may reduce our net income. |
16
| | • | | Our inability to sell a property when we desire to do so could adversely impact our business and financial condition, and our inability to sell our properties at a price equal to, or greater than, the price for which we purchased such properties may lead to a decrease in the value of our assets. |
| | • | | Our joint venture investments could be adversely affected by our lack of sole decision-making authority. |
| | • | | Property taxes and insurance premiums may increase, which would adversely affect our net operating income and cash available for distributions. |
| | • | | Changes in the CAD/USD exchange rate could have a material adverse effect on our operating results and value of the investment of our stockholders. |
Risks Associated with Debt Financing
| | • | | We have incurred and intend to continue to incur, mortgage indebtedness and other borrowings, which may increase our business risks. |
| | • | | We are party to loans that are subject to variable interest rates. The rise in overall interest rates has increased our variable rate borrowing costs and our overall cost of capital, resulting in an increase in net interest expense, which may limit our ability to make accretive acquisitions of self storage properties, negatively impact our profitability, and affect our ability to comply with certain financial covenants. |
| | • | | If we or the other parties to our loans or secured notes payable, as applicable, breach covenants thereunder, such loan or loans or secured notes payable could be deemed in default, which could accelerate our repayment date and materially adversely affect the value of our stockholders’ investment in us. |
Federal Income Tax Risks
| | • | | Failure to continue to qualify as a REIT would adversely affect our operations and our ability to continue to pay distributions at our current level as we will incur additional tax liabilities. |
| | • | | If any of our partnerships fails to maintain its status as a partnership for federal income tax purposes, its income would be subject to taxation and our REIT status would be terminated. |
Risks Related to this Offering
| | • | | The estimated net asset value per share, or Estimated Per Share NAV, of our common stock is based on a number of assumptions that may not be accurate or complete and may not reflect the price at which shares of our common stock will trade when listed on a national securities exchange or the price a third party would pay to acquire us. |
| | • | | The market price and trading volume of shares of our common stock may be volatile. |
| | • | | Because we have a large number of stockholders and shares of our common stock have not been listed on a national securities exchange prior to this offering, there may be significant pent-up demand to sell shares of our common stock. Significant sales of shares of our common stock, or the perception that significant sales of such shares could occur, may cause the price of shares of our common stock to decline significantly. |
| | • | | We may be unable to raise additional capital needed to grow our business. |
| | • | | We have no operating history as a publicly traded company and may not be able to successfully operate as a publicly traded company. |
17
THE OFFERING
Common stock offered by us | shares (or shares if the underwriters exercise in full their option to purchase additional shares) |
Total common stock (including Class A common stock and Class T common stock) to be outstanding upon completion of this offering(1)(2) | shares (or shares if the underwriters exercise in full their option to purchase additional shares) |
Class A common stock(2) | shares |
Class T common stock(2) | shares |
Total common stock (including Class A common stock and Class T common stock)(1)(2) and OP units(3) to be outstanding upon completion of this offering | shares and OP units (or shares and OP units if the underwriters exercise in full their option to purchase additional shares) |
Conversion of Class A common stock and Class T common stock | Upon the six-month anniversary of the listing of shares of our common stock for trading on a national securities exchange or such earlier date as approved by our Board, each share of Class A common stock and Class T common stock will automatically, and without any stockholder action, convert into a number of shares of our common stock equal to a fraction, the numerator of which is the net asset value of the Company allocable to the shares of Class A common stock and shares of Class T common stock, as applicable, and the denominator of which is the net asset value of the Company allocable to the shares of our common stock. |
Distributions | We intend to make regular distributions to holders of shares of our common stock. Holders of our common stock, our Class A common stock and our Class T common stock will share equally in any dividends authorized by our Board and declared by us. |
| | Any distributions we make will be at the discretion of our Board. We cannot assure you that we will make any distributions to our stockholders. For more information, see “Distribution Policy.” |
Voting rights | Each share of our common stock, Class A common stock and Class T common stock will entitle its holder to one vote per share. |
Use of proceeds | We estimate that we will receive net proceeds from this offering of approximately $ million, or approximately $ million if the |
18
| | underwriters’ option to purchase additional shares is exercised in full, after deducting the underwriting discount and estimated expenses of this offering payable by us. |
| | We will use the net proceeds from the offering to redeem 100% of our issued and outstanding Series A Preferred Stock, pay down existing debt under our credit facility, or our 2024 Credit Facility, repay the Acquisition Facility, fund external growth with property acquisitions, and fund other general corporate uses. See “Use of Proceeds” and “Underwriting—Other Relationships.” |
Directed share program | At our request, the underwriters have reserved percent of the shares of common stock to be issued by us and offered by this prospectus for sale, at the public offering price, to (i) certain of our directors, officers and employees, and (ii) friends and family members of certain of our directors, officers and employees. The number of shares of common stock available for sale to the general public will be reduced to the extent these individuals purchase such reserved shares. Any reserved shares that are not so purchased will be offered by the underwriters to the general public on the same basis as the other shares offered by this prospectus. See “Underwriting—Directed Share Program” for additional information. |
Proposed ticker symbol | “SMA” |
Risk factors | An investment in shares of our common stock involves various risks. Before purchasing shares of our common stock, you should carefully consider the risk factors set forth under the heading “Risk Factors” beginning on page 19 of this prospectus together with all of the other information included in this prospectus. |
Restrictions on ownership and transfer | To help ensure our continued qualification as a REIT under the Code, our charter provides (subject to certain exceptions) that no stockholder may own, or be deemed to own by virtue of the attribution provisions of the Code, more than 9.8% in value of the outstanding shares of our stock or more than 9.8% of the number or value (whichever is more restrictive) of the outstanding shares of our common stock. |
| (1) | | As of , 2024. Includes shares of unvested time-based restricted stock. Excludes (i) up to shares of our common stock that may be issued by us upon exercise of the underwriters’ option to purchase additional shares, (ii) shares of our common stock (or LTIP units) available for future issuance under the Incentive Plan, and (iii) shares of common stock that may be acquired by redeeming OP units. |
| (2) | | As of , 2024. Includes shares of unvested time-based Class A restricted stock, including certain of the Listing Equity Grants. The amount of Class A restricted stock attributable to the Listing Equity Grants is . |
| (3) | | As of , 2024. Includes (i) unvested time-based LTIP units, including certain of the Listing Equity Grants, and (ii) vested LTIP units. Excludes (x) OP units held directly or indirectly by us and (y) unvested performance-based LTIP units (such number of LTIP units assumes that such |
19
| | unvested performance-based awards vest at maximum levels for the performance and market conditions that have not yet been achieved; to the extent that performance or market conditions do not meet maximum levels, the actual number of OP units which vest under those awards could be less than the amount reflected above). The amount of LTIP units attributable to the Listing Equity Grants is . OP units are redeemable for cash or, at our election, shares of our common stock on a one-for-one basis, subject to adjustment in certain circumstances. For purposes of the foregoing, LTIP units are long-term equity incentive awards in the form of limited partnership units of the operating partnership that vest over time or based on performance. Upon the occurrence of certain events described in the operating partnership agreement, LTIP units may convert into an equal number of OP units. |
20
SUMMARY SELECTED CONSOLIDATED FINANCIAL AND OTHER DATA
Our summary selected consolidated financial and other data as of and for the nine months ended September 30, 2024 and 2023 have been derived from our unaudited consolidated financial statements included elsewhere in this prospectus, and our summary selected consolidated financial and other data as of and for the years ended December 31, 2023, 2022 and 2021 have been derived from our audited consolidated financial statements included elsewhere in this prospectus. Our consolidated balance sheet data as of September 30, 2023 and December 31, 2021 has been derived from our consolidated financial statements not included in this prospectus. Our summary selected consolidated financial and other data set forth below and elsewhere in this prospectus are not necessarily indicative of our future performance.
You should read the following summary selected consolidated financial and other data together with “Management’s Discussion and Analysis of Financial Condition and Results of Operations,” “Our Business and Self Storage Properties” and our consolidated financial statements and related notes appearing elsewhere in this prospectus.
| | | | | | | | | | | | | | | | | | | | |
| | | As of and for the Nine Months
Ended September 30,(1) | | | As of and for the Year
Ended December 31,(1) | |
| | | 2024 | | | 2023 | | | 2023 | | | 2022 | | | 2021 | |
Income Statement Data | | | | | | | | | | | | | | | | | | | | |
Total revenues | | $ | 176,362 | | | $ | 175,430 | | | $ | 232,992 | | | $ | 212,643 | | | $ | 168,765 | |
Property operating expenses | | | 53,334 | | | | 49,333 | | | | 65,363 | | | | 58,437 | | | | 48,128 | |
General and administrative | | | 22,449 | | | | 19,996 | | | | 27,452 | | | | 28,254 | | | | 23,266 | |
Income from Operations | | | 51,377 | | | | 53,651 | | | | 70,625 | | | | 65,869 | | | | 16,508 | |
Net income (loss) attributable to common stockholders | | | (14,688 | ) | | | (1,632 | ) | | | (2,746 | ) | | | 6,322 | | | | (29,402 | ) |
Net income (loss) per share of common stock—basic and diluted | | | (0.16 | ) | | | (0.02 | ) | | | (0.03 | ) | | | 0.07 | | | | (0.37 | ) |
Weighted average shares of common stock outstanding—basic | | | 96,694,076 | | | | 96,824,500 | | | | 96,807,939 | | | | 91,939,172 | | | | 79,438,374 | |
Weighted average shares of common stock outstanding—diluted | | | 96,694,076 | | | | 96,824,500 | | | | 96,807,939 | | | | 92,056,438 | | | | 79,438,374 | |
Balance Sheet Data (as of period end) | | | | | | | | | | | | | | | | | | | | |
Real estate facilities, gross | | $ | 1,974,197 | | | $ | 1,918,681 | | | $ | 1,924,746 | | | $ | 1,887,206 | | | $ | 1,593,624 | |
Total assets | | | 1,937,206 | | | | 1,891,250 | | | | 1,895,641 | | | | 1,947,217 | | | | 1,618,293 | |
Debt, net | | | 1,179,904 | | | | 1,055,196 | | | | 1,087,401 | | | | 1,068,372 | | | | 873,867 | |
Total liabilities | | | 1,250,830 | | | | 1,111,327 | | | | 1,132,145 | | | | 1,112,464 | | | | 943,225 | |
Redeemable common stock | | | 58,356 | | | | 69,461 | | | | 71,277 | | | | 76,578 | | | | 71,335 | |
Series A Convertible Preferred Stock | | | 196,356 | | | | 196,356 | | | | 196,356 | | | | 196,356 | | | | 196,356 | |
Total equity | | | 431,664 | | | | 514,106 | | | | 495,863 | | | | 561,820 | | | | 407,377 | |
Ending shares of common stock outstanding | | | 96,622,072 | | | | 96,956,414 | | | | 96,874,962 | | | | 96,939,004 | | | | 85,113,941 | |
Cash Flow Data | | | | | | | | | | | | | | | | | | | | |
Net cash provided by operating activities | | $ | 53,422 | | | $ | 68,713 | | | $ | 73,191 | | | $ | 87,910 | | | $ | 58,765 | |
Net cash (used in) provided by investing activities | | | (80,301 | ) | | | 3,488 | | | | 261 | | | | (205,151 | ) | | | (120,215 | ) |
Net cash provided by (used in) financing activities | | | 19,112 | | | | (74,212 | ) | | | (66,099 | ) | | | 120,067 | | | | 25,675 | |
Other Data(2) | | | | | | | | | | | | | | | | | | | | |
Net operating income | | $ | 104,404 | | | $ | 107,157 | | | $ | 142,174 | | | $ | 134,302 | | | $ | 103,515 | |
Adjusted EBITDA | | | 103,738 | | | | 108,621 | | | | 144,229 | | | | 128,283 | | | | 94,462 | |
FFO, as adjusted (attributable to common stockholders and OP unit holders) | | | 35,174 | | | | 46,525 | | | | 60,506 | | | | 68,911 | | | | 45,429 | |
| (1) | | Amounts are presented in thousands, except share and per share data. |
| (2) | | For a reconciliation of each non-GAAP financial measure to its most directly comparable GAAP financial measure, see “Management’s Discussion and Analysis of Financial Condition and Results of Operations—Non-GAAP Financial Measures.” |
21
RISK FACTORS
An investment in our shares involves various risks and uncertainties. You should carefully consider the following risk factors in conjunction with the other information contained in this prospectus before purchasing our shares. The risks discussed in this prospectus can adversely affect our business, operating results, prospects, and financial condition. These risks could cause the market price of our common stock to decline significantly and could cause you to lose all or part of your investment.
Risks Related to an Investment in SmartStop Self Storage REIT, Inc.
If we lose or are unable to retain our executive officers, our business could be harmed.
Our success depends to a significant degree upon the contributions of our executive officers. While we have adopted an Executive Severance and Change of Control Plan which is applicable to each of these officers, we do not have an employment agreement with any of these key personnel and we cannot guarantee that all, or any particular one, will remain employed by us. If we lose or are unable to retain our executive officers, our operating results and our future growth could suffer.
Our Executive Severance and Change of Control Plan and the related agreements with our executive officers may result in significant expense for us and may deter a third party from engaging in a change of control transaction with us that might otherwise result in a premium price to our stockholders.
We have adopted an Executive Severance and Change of Control Plan that is applicable to our executive officers and have entered into an associated Severance Agreement with each of our executive officers. Pursuant to such documents, if the officer’s employment is terminated other than for cause or if the officer elects to terminate his employment with us for good reason, we will make a severance payment equal to the officer’s highest annual compensation in the prior two years plus the officer’s average cash performance bonus earned for the prior three years, multiplied by an amount specified in the Executive Severance and Change of Control Plan, together with continuation of medical coverage for a period of time specified in the Executive Severance and Change of Control Plan. In addition, certain outstanding equity awards may be subject to accelerated vesting or may remain eligible for vesting, as specified further in the Executive Severance and Change of Control Plan. These agreements may result in a significant expense for us if an executive officer’s employment is terminated for certain reasons, and may discourage a third party from engaging in a change of control transaction with us that might otherwise result in a premium price for our stockholders.
Impairment of goodwill or other intangible assets resulting from the self administration transaction may adversely affect our financial condition and results of operations.
During 2020, with the emergence of the COVID-19 pandemic and the resulting volatility and disruptions of the economy and capital markets, and the ability of our Managed REITs to raise additional equity in light of the foregoing, we recorded various impairments to goodwill and other intangible assets related to our Managed REITs. Potential additional future impairments of goodwill or other intangible assets, including trademarks and other acquired intangibles, resulting from the self administration transaction could adversely affect our financial condition and results of operations. We assess our goodwill and other intangible assets and long-lived assets for impairment at least annually or upon the occurrence of a triggering event, as required by GAAP. We are required to record an impairment charge if circumstances indicate that the asset carrying values exceed their fair values. Our assessment of goodwill, other intangible assets, or long-lived assets could indicate that an impairment of the carrying value of such assets may have occurred that could result in a material, non-cash write-down of such assets, which could have a material adverse effect on our results of operations and future earnings.
22
Our trademarks are important, and the loss of or our inability to enforce trademark and other proprietary intellectual property rights could harm our business.
We own trademarks and other intellectual property rights, including but not limited to the “SmartStop®” and “Strategic Storage®” brands, which are important to our success and competitive position, and the loss of or our inability to enforce trademark and other proprietary intellectual property rights could harm our business. We will devote substantial resources to the establishment and protection of our trademarks and other proprietary intellectual property rights.
Our efforts to protect our intellectual property may not be adequate. Third parties may misappropriate or infringe on our intellectual property. From time to time, we may engage in litigation to protect our intellectual property, which could result in substantial costs as well as diversion of management attention. The occurrence of any of these risks could adversely affect our business and results of operations.
We have historically incurred net losses, have an accumulated deficit, and it is possible that our operations may not be profitable, or maintain profitability, in the future.
We recorded a net loss attributable to our common stockholders of approximately $2.7 million and $14.7 million for the fiscal year ended December 31, 2023 and the nine months ended September 30, 2024, respectively. We have historically incurred net losses attributable to our common stockholders and cannot guarantee that we will not incur future operating losses. Our accumulated deficit was approximately $167.3 million as of December 31, 2023 and $182.0 million as of September 30, 2024. We expect our operating expenses to increase in the future as we continue to acquire properties, expand into new geographies and expand within our existing geographies, and in connection with legal, accounting and other expenses related to operating as a new publicly listed company. These efforts and additional expenses may be more costly than we expect, and we cannot guarantee that we will be able to increase our revenue to offset our operating expenses. Our revenue growth may slow or our revenue may decline for a number of other reasons, including increased competition, a decrease in the growth or reduction in size of our overall market or if we cannot capitalize on growth opportunities.
Our bylaws designate the Circuit Court for Baltimore City, Maryland as the sole and exclusive forum for certain types of actions and proceedings that may be initiated by our stockholders, which could limit our stockholders’ ability to obtain a favorable judicial forum for disputes with us or our directors, officers, or employees.
Our bylaws provide that, unless we consent in writing to the selection of an alternative forum, the Circuit Court for Baltimore City, Maryland, or, if that Court does not have jurisdiction, the United States District Court for the District of Maryland, Northern Division, shall be the sole and exclusive forum for certain types of actions and proceedings that may be initiated by our stockholders with respect to us, our directors, our officers, or our employees. This choice of forum provision may limit a stockholder’s ability to bring a claim in a judicial forum that the stockholder believes is favorable for disputes with us or our directors, officers, or employees, which may discourage meritorious claims from being asserted against us and our directors, officers, and employees. Alternatively, if a court were to find this provision of our bylaws inapplicable to, or unenforceable in respect of, one or more of the specified types of actions or proceedings, we may incur additional costs associated with resolving such matters in other jurisdictions, which could adversely affect our business, financial condition, or results of operations.
We are the subject of various claims and legal proceedings and may become the subject of claims, litigation or investigations, which could have a material adverse effect on our business, financial condition or results of operations.
In the ordinary course of business, we are the subject of various claims and legal proceedings and may become the subject of claims, litigation or investigations, including commercial disputes and employee claims, such as claims
23
of age discrimination, sexual harassment, gender discrimination, wage and hour, immigration violations or other local, state and federal labor law violations, and from time to time may be involved in governmental or regulatory investigations or similar matters arising out of our current or future business. While we have policies in place that are intended to prevent or address such issues, we cannot be assured that such policies will adequately prevent or mitigate the foregoing concerns and any associated harm. Any claims asserted against us or our management, regardless of merit or eventual outcome, could harm our reputation or the reputation of our management and have an adverse impact on our relationship with our clients, business partners and other third parties and could lead to additional related claims. In light of the potential cost and uncertainty involved in litigation, we have in the past settled and may in the future settle matters even when we believe we have a meritorious defense. Certain claims may seek injunctive relief, which could disrupt the ordinary conduct of our business and operations or increase our cost of doing business. Our insurance or indemnities may not cover all claims that may be asserted against us. Furthermore, there is no guarantee that we will be successful in defending ourselves in pending or future litigation or similar matters under various laws. Any judgments or settlements in any pending litigation or future claims, litigation or investigation could have a material adverse effect on our business, financial condition and results of operations.
Privacy concerns could result in regulatory changes that may harm our business.
The California Consumer Privacy Act (the “CCPA”) went into effect on January 1, 2020. The California Privacy Rights Act (the “CPRA”), which amends the CCPA, became effective on January 1, 2023, with a lookback period starting January 1, 2022. The CPRA established the California Privacy Protection Agency (the “CPPA”) to oversee enforcement of and compliance with the CCPA. The CCPA, as amended by the CPRA, is intended to protect consumer privacy rights, and, among other things, provide California residents with the ability to know what information companies collect about them, to request, in certain circumstances, the deletion of such information, and to affirmatively opt out of the sale or “sharing” of their personal information. The CPPA is currently in the process of issuing guidance and interpreting the regulations, and as such we cannot yet predict the full impact of the CCPA, as amended by the CPRA, or any rules or regulations promulgated thereunder, nor can we predict the full impact of any interpretations thereof. While we have developed processes and notices that are intended to comply in all material respects with applicable CCPA and CPRA requirements, a regulatory agency may not agree with certain of our implementation decisions, which could subject us to litigation, regulatory actions or changes to our business practices that could increase costs or reduce revenues. Eighteen other states have passed comprehensive privacy laws similar to the CCPA and the CPRA, and a federal consumer privacy law has also been proposed. Similar laws may be implemented in other jurisdictions that we do business in and in ways that may be more restrictive than the CCPA or the CPRA, increasing the cost of compliance, as well as the risk of noncompliance, on our business.
Certain of our officers and key personnel will face competing demands relating to their time and will face conflicts of interest related to the positions they hold with affiliated entities, which could cause our business to suffer.
Certain of our officers and key personnel and their respective affiliates are officers, key personnel, advisors, managers, and sponsors of other real estate programs having investment objectives and legal and financial obligations similar to ours, including the Managed REITs. In addition, our Chief Executive Officer remains (i) Chairman of the Board of Strategic Student & Senior Housing Trust, Inc. and (ii) the Chief Executive Officer of our former sponsor. Because these persons have competing demands on their time and resources, they may have conflicts of interest in allocating their time between our business and these other activities. Should these persons not balance these competing demands on their time and resources, our business could suffer. Furthermore, these persons owe fiduciary duties to these other entities and their owners, which fiduciary duties may conflict with the duties that they owe to our stockholders and us. Their loyalties to these other entities could result in actions or inactions that are detrimental to our business.
24
Our Chief Executive Officer has direct and indirect beneficial ownership in our operating partnership and shares of common stock, and therefore may face conflicts with regard to his fiduciary duties to us and his fiduciary duties to the entity which holds such interests, including conditions pertaining to redemption of our common stock or the limited partnership interests and voting matters related to such interests.
As of September 30, 2024, our Chief Executive Officer had direct and indirect beneficial ownership in units of our operating partnership and shares of common stock (including as a controlling person of SAM, our former sponsor) representing an approximately 9.5% interest in the operating partnership and 0.6% of our common stock, respectively. Immediately after this offering, our Chief Executive Officer and his affiliates will beneficially own approximately % of our outstanding shares of common stock and % of our outstanding OP units (assuming neither our Chief Executive Officer nor his affiliates purchase any shares of our common stock pursuant to the directed share program or in this offering). Such OP units may be exchanged for our common stock in the future. In addition, in certain circumstances such as a merger, sale of all or substantially all of our assets, share exchange, conversion, dissolution or amendment to our charter, in each case where the vote of our stockholders is required under Maryland law, the consent of our operating partnership will also be required, which could result in our Chief Executive Officer being able to influence such matters submitted to a vote of our stockholders. This may result in an outcome that may not be favorable to our stockholders. Our Chief Executive Officer may also make decisions on behalf of SAM related to redemptions of either its OP units or its common stock which may negatively impact our stockholders.
Revenue and earnings from the Managed REIT platform are uncertain.
Increasing our revenue from the Managed REIT platform is dependent in large part on the ability to raise capital in offerings for existing or future Managed REITs or other future programs, as well as on our ability to make investments that meet the investment criteria of existing and future entities, both of which are subject to uncertainty with respect to capital market and real estate market conditions. This uncertainty could have an adverse impact on our earnings. Moreover, revenue generated from asset management fees, property management fees, and other fees and distributions relating to the Managed REITs’ offerings and the investment and management of their respective assets may be affected by factors that include not only our ability to increase the Managed REITs’ portfolio of properties under management, but also changes in valuation of those properties, sales of the Managed REIT properties and assets and our ability to successfully operate the Managed REIT properties.
The Managed REITs may not generate sufficient revenue or may incur significant debt, which either due to liquidity problems or restrictive covenants contained in their borrowing agreements could restrict their ability to pay or reimburse fees and expenses owed to us when due. In addition, the revenue payable by the Managed REITs is subject to certain limits set forth in their respective advisory agreements, which may limit the growth of our revenue. Furthermore, our ability to earn certain subordinated distributions from the Managed REITs is tied to providing liquidity events for the Managed REITs. Our ability to provide such liquidity events, and to do so under circumstances that will satisfy the applicable subordination requirements, will depend on market conditions at the relevant time, which may vary considerably over a period of years. If we are unable to satisfy such subordination requirements, certain equity interests we hold in the Managed REITs may be impaired.
Because the revenue streams from the advisory agreements with the Managed REITs are subject to limitation or cancellation, any such termination could adversely affect our financial condition, cash flow and the amount available for distributions to our common stockholders.
Our advisory agreements with the Managed REITs are subject to the renewal terms thereof and each may generally be terminated by each Managed REIT, without cause or penalty, upon 60 days’ written notice. There can be no assurance that the advisory agreements will be renewed before they expire or that the advisory agreements will not be terminated. Any such non-renewal or termination could adversely affect our financial condition, cash flow and the amount available for distributions to our common stockholders.
25
We will face conflicts of interest relating to the purchase of properties, including conflicts with the Managed REITs, and there can be no assurance that our investment allocation policy will adequately address all of the conflicts that may arise or that it will address such conflicts in a manner that is more favorable to us than to the Managed REITs.
We own the entities that serve as the sponsor and advisor to the Managed REITs, which have investment objectives similar to ours, and we may be buying properties at the same time as one or more of the Managed REITs, or other programs managed by us, our officers, our key personnel or our subsidiaries (the “Other Programs”). Accordingly, we will have conflicts of interest in allocating potential properties, acquisition expenses, management time, services, and other functions between various existing enterprises or future enterprises with which the Managed REITs may be or become involved. SST VI is a public non-traded Managed REIT, which began operations in early 2021, that invests in self storage properties and had assets of approximately $552 million as of September 30, 2024, and SSGT III is a private Managed REIT, which began operations in May 2022, that invests in self storage properties and had assets of approximately $221 million as of September 30, 2024.
While we have adopted an acquisition allocation policy in an effort to appropriately allocate acquisitions among us, the Managed REITs and the Other Programs, there can be no assurance that such allocation policy will adequately address all of the conflicts that may arise or that it will address such conflicts in a manner that is more favorable to us than to the Managed REITs or the Other Programs. In addition, conflicts of interest may exist in the valuation of our investments and regarding decisions about the allocation of specific investment opportunities among us, the Managed REITs and the Other Programs and the allocation of fees and costs among us, the Managed REITs and the Other Programs. To the extent we fail to appropriately deal with any such conflicts, it could negatively impact our reputation and ability to raise additional funds or result in potential litigation against us.
If the Managed REITs are unable to repay certain loans or payables due to us, our liquidity, financial condition, cash flow, and the amount available for distributions to our common stockholders could be adversely affected.
We have provided and may continue to provide financial support to the Managed REITs in the form of outstanding payables, loans, preferred equity investments, or other strategic investments. As of September 30, 2024, we had an aggregate of $18.8 million in accounts receivable and $28.0 million in outstanding loans to the Managed REITs, and we originally invested an aggregate of approximately $10.0 million in the Managed REITs in the form of common units of the Managed REITs’ operating partnerships. If the Managed REITs are unable to raise sufficient additional capital or produce adequate funds from operations, they may not be able to repay such payables or loan amounts on a timely basis. As a result, the amounts loaned may remain unavailable to us longer than expected, which could have a negative impact on our liquidity and could result in us pursuing additional capital in the form of additional debt or equity issuances. If we are unable to acquire additional capital, our financial condition, cash flow, and the amount available for distributions to our common stockholders could be adversely affected.
We are obligated under a sponsor funding agreement to fund up to $70 million for the upfront sales load in the SST VI public offering, which may limit our ability to make investments and/or fund distributions to our stockholders or use such funds for other working capital purposes, and there is no guarantee that we will receive a return on this investment.
On November 1, 2023, we (through an indirect subsidiary) entered into a sponsor funding agreement with SST VI and its operating partnership, pursuant to which we agreed to fund the payment of (i) the upfront sales commission and the upfront dealer manager fee for the sale of shares of SST VI’s Class Y common stock (the “Class Y Shares”) sold in the SST VI public offering and (ii) the estimated organization and offering expenses for the sale of Class Y Shares and shares of SST VI’s Class Z common stock (the “Class Z Shares”) sold in the
26
SST VI public offering. As of September 30, 2024, the maximum remaining commitment pursuant to such Sponsor Funding Agreement is approximately $61.9 million if SST VI were to sell the maximum amount under its current offering of $1.0 billion.
In consideration for providing the funding for the front-end sales load described above, SST VI’s operating partnership will issue a number of Series C Subordinated Convertible Units of limited partnership interest in SST VI’s operating partnership (the “Series C Units”) to our indirect subsidiary equal to the dollar amount of such funding divided by the then-current offering price for the Class Y Shares and Class Z Shares sold in the SST VI public offering, which is currently $10.00 per share. The Series C Units shall automatically convert into class A units on a one-to-one basis upon SST VI’s disclosure of an estimated net asset value per share equal to at least $10.00 per share for each class of SST VI shares of common stock, including the Class Y Shares and Class Z Shares, calculated net of the value of the Series C Units to be converted. Upon conversion of the Series C Units to class A units, our indirect subsidiary will be entitled to distribution, liquidation, voting or other rights to participate in SST VI’s operating partnership.
Our obligations under the sponsor funding agreement may limit our ability to make other investments and/or fund distributions to our stockholders or use for other working capital purposes. In addition, there is no guarantee that the Series C Units will convert into class A units or that we will receive a return on this investment.
A subsidiary of ours is the sponsor of the Managed REITs and may sponsor additional future programs. As a result, we could be subject to any litigation that may arise by investors in those entities or the respective operations of those entities.
In the course of their operations, the Managed REITs and the other future programs may be subject to lawsuits. We may be named in such lawsuits as the sponsor of such entities and may, in some instances, be found to be subject to liability. In such an instance, our ability to seek reimbursement or indemnification from such programs may be limited. If we are subject to significant legal expenses, it could have an adverse effect on our financial condition.
Risks Related to Our Corporate Structure
The limit on the number of shares a person may own may discourage a takeover that could otherwise result in a premium price to our stockholders.
In order for us to qualify as a REIT, no more than 50% of our outstanding stock may be beneficially owned, directly or indirectly, by five or fewer individuals (including certain types of entities) at any time during the last half of each taxable year. To ensure that we do not fail to qualify as a REIT under this test, our charter restricts ownership by one person or entity to no more than 9.8% of the value of our then-outstanding capital stock or more than 9.8% of the value or number of shares, whichever is more restrictive, of our then outstanding common stock. This restriction may have the effect of delaying, deferring, or preventing a change in control of us, including an extraordinary transaction (such as a merger, tender offer, or sale of all or substantially all of our assets) that might provide a premium price for holders of our common stock.
We have opted out of provisions of the MGCL relating to deterring or defending hostile takeovers.
Under Maryland law, “business combinations” between a Maryland corporation and an interested stockholder (as defined in the statute) or an affiliate of an interested stockholder are prohibited for five years after the most recent date on which the interested stockholder becomes an interested stockholder. These business combinations include a merger, consolidation, share exchange, or, in circumstances specified in the statute, an asset transfer or issuance or reclassification of equity securities. An interested stockholder is defined as:
| | • | | any person who beneficially owns, directly or indirectly, 10% or more of the voting power of the corporation’s outstanding voting stock; or |
27
| | • | | an affiliate or associate of the corporation who, at any time within the two-year period prior to the date in question, was the beneficial owner, directly or indirectly, of 10% or more of the voting power of the then outstanding stock of the corporation. |
These prohibitions are intended to prevent a change of control by interested stockholders who do not have the support of our Board. Pursuant to the statute, our Board has by resolution exempted business combinations between us and any person, provided that the business combination is first approved by our Board.
Also, under Maryland law, control shares of a Maryland corporation acquired in a control share acquisition have no voting rights except to the extent approved by a vote of stockholders entitled to cast two-thirds of the votes entitled to be cast on the matter. Shares owned by the acquirer, an officer of the corporation, or an employee of the corporation who is also a director of the corporation, are excluded from the vote on whether to accord voting rights to the control shares. As permitted by the MGCL, our bylaws contain a provision exempting from the control share acquisition statute any and all acquisitions by any person of our stock.
Similarly, Title 3, Subtitle 8 of the MGCL provides certain other anti-takeover protections, including permitting a Maryland corporation with a class of equity securities registered under the Exchange Act and at least three independent directors to elect to have a classified board of directors. Our Board is not currently classified, and we have not elected to be subject to any of the provision of Subtitle 8 of the MGCL that would permit us to classify our Board without stockholder approval. Moreover, we expect to file Articles Supplementary to our charter to provide that, without the affirmative vote of a majority of the votes cast on the matter by stockholders entitled to vote generally in the election of directors, we may not elect to be subject to the provision of Subtitle 8 that would permit us to classify our Board without stockholder approval.
Our decision to opt out of the above provisions of the MGCL removes certain protections of the MGCL that may otherwise deter a hostile takeover or assist us in defending against a hostile takeover. There is no guarantee that the ownership limitations in our charter would provide the same measure of protection as the above provisions of the MGCL and prevent an undesired change of control by an interested stockholder.
Our rights and the rights of our stockholders to recover claims against our officers and directors are limited, which could reduce our stockholders’ and our recovery against them if they cause us to incur losses.
Maryland law provides that a director has no liability in that capacity if the director performs his or her duties in good faith, in a manner the director reasonably believes to be in the corporation’s best interests, and with the care that an ordinarily prudent person in a like position would use under similar circumstances. Our charter requires us to indemnify our directors and officers and permits us to indemnify our employees and agents for actions taken by them to the maximum extent permitted under Maryland law. Additionally, our charter limits the liability of our directors and officers for monetary damages to the maximum extent permitted under Maryland law. As a result, we and our stockholders may have more limited rights against our directors, officers, employees and agents than might otherwise exist under common law, which could reduce our stockholders’ and our recovery against them. We have also entered into indemnification agreements with each of our directors and executive officers, which obligate us to indemnify such persons in certain circumstances, including if they are or are threatened to be made a party to, or witness in, any proceeding by reason of their status as a present or former director or officer of us. In addition, we may be obligated to fund the defense costs incurred by our directors, officers, employees and agents in some cases which would decrease the cash otherwise available for distribution to our stockholders.
Risks Related to the Self Storage Industry
Because we are focused on the self storage industry, our rental revenues will be significantly influenced by demand for self storage space generally, and a decrease in such demand would likely have a greater adverse effect on our rental revenues than if we owned a more diversified real estate portfolio.
Because our portfolio of properties consists primarily of self storage facilities, we are subject to risks inherent in investments in a single industry. A decrease in the demand for self storage space would likely have a greater adverse effect on our rental revenues than if we owned a more diversified real estate portfolio. Demand
28
for self storage space has been and could be adversely affected by weakness in the national, regional, and local economies and changes in supply of or demand for similar or competing self storage facilities in an area. To the extent that any of these conditions occur, they are likely to affect demand, and market rents, for self storage space, which could cause a decrease in our rental revenue. Any such decrease could have a material adverse impact on our business, financial condition, and results of operations. We do not expect to invest in other real estate or businesses to hedge against the risk that industry trends might decrease the profitability of our self storage-related investments.
We face significant competition in the self storage industry, which may increase the cost of acquisitions or developments or impede our ability to retain customers or re-let space when existing customers vacate.
We face intense competition in every market in which we purchase self storage facilities. We compete with numerous national, regional, and local developers, owners and operators in the self storage industry, including the Managed REITs, publicly traded REITs, other REITs and institutional investment funds. Moreover, development of self storage facilities has increased in recent years, which has intensified competition, and we expect it will continue to do so as newly developed facilities are opened. In addition, competition for suitable investments may reduce the number of suitable investment opportunities available to us, may increase acquisition costs, and may reduce demand for self storage units in certain areas where our facilities are located, all of which may adversely affect our operating results. Additionally, an economic slowdown in a particular market could have a negative effect on our self storage revenues.
If competitors build new facilities that compete with our facilities or offer space at rental rates below the rental rates we charge our customers, we may lose potential or existing customers and we may be pressured to discount our rental rates to retain customers. In addition, increased competition for customers may require us to make capital improvements to facilities that we would not otherwise make. As a result, our rental income could decline, which could have a material adverse impact on our business, financial condition, and results of operations.
We may not be successful in identifying and consummating suitable acquisitions, or integrating and operating acquired properties, which may adversely impact our growth and results of operations.
We expect to make future acquisitions of self storage properties. We may not be successful in identifying and consummating suitable acquisitions that meet our criteria, which may impede our growth. We may encounter competition when we seek to acquire properties, especially for brokered portfolios. Aggressive bidding practices by prospective acquirers have been commonplace and this competition also may be a challenge for our acquisition strategy and potentially result in our paying higher prices for acquisitions, including, in some instances, paying consideration for certain properties that may be more than others are willing to pay for such properties. Should we pay higher prices for self storage properties or other assets, our operating results may suffer. Furthermore, when we acquire self storage properties, we will be required to integrate them into our then-existing portfolio. The acquired properties may turn out to be less compatible with our acquisition strategy than originally anticipated, may cause disruptions in our operations, or may divert management’s attention away from day-to-day operations, which could impair our results of operations. Our ability to acquire or integrate properties may also be constrained by the following additional risks:
| | • | | we face competition from national (e.g., large public and private self-storage companies, institutional investors and private equity funds), regional and local owners, operators and developers of self-storage properties, which may result in higher property acquisition prices and reduced yields; |
| | • | | the inability to achieve satisfactory completion of due diligence investigations and other customary closing conditions; |
| | • | | we may fail to finance an acquisition on favorable terms or at all; |
| | • | | spending more than the time and amounts budgeted to make necessary improvements or renovations to acquired properties; |
29
| | • | | the inability to accurately estimate physical occupancy levels, rental rates, operating costs or costs of improvements to bring an acquired property up to an acceptable level of quality to meet our expected standards; and |
| | • | | we may acquire properties subject to liabilities without any recourse, or with only limited recourse, with respect to unknown liabilities such as liabilities for clean-up of undisclosed environmental contamination, claims by persons dealing with the former owners of the properties and claims for indemnification by general partners, trustees, officers and others indemnified by the former owners of the properties. |
The acquisition of new properties may give rise to difficulties in predicting revenue potential.
New acquisitions could fail to perform in accordance with our expectations. If we fail to accurately estimate occupancy levels, rental rates, operating costs, or costs of improvements to bring an acquired facility up to our standards, the performance of the facility may be below expectations. Properties we acquire may have characteristics or deficiencies affecting their valuation or revenue potential that we have not yet discovered. We cannot assure our stockholders that the performance of properties we acquire will increase or be maintained under our management.
We depend on our on-site personnel to maximize customer satisfaction at each of our facilities, and any difficulties we encounter in hiring, training, and retaining skilled field personnel may adversely affect our rental revenues.
The customer service, marketing skills, knowledge of local market demand and competitive dynamics of our facility managers are contributing factors to our ability to maximize our rental income and to achieve the highest sustainable rent levels at each of our facilities. If we are unable to successfully recruit, train, and retain qualified field personnel, our rental incomes may be adversely affected, which could have a material adverse impact on our business, financial condition, and results of operations.
Delays in development and lease-up of our properties would reduce our profitability.
We may acquire properties that require repositioning or redeveloping such properties with the goal of increasing cash flow, value or both. Construction delays to new or existing self storage properties due to weather, unforeseen site conditions, personnel problems, and other factors could delay our anticipated customer occupancy plan which could adversely affect our profitability and cash flow. Furthermore, our estimate of the costs of repositioning or redeveloping an acquired property may prove to be inaccurate, which may result in our failure to meet our profitability goals. We have encountered in the past and we may also encounter unforeseen cost increases associated with building materials or construction services resulting from trade tensions, disruptions, tariffs, duties or restrictions or an epidemic, pandemic or other health crisis, such as the COVID-19 outbreak. Additionally, we may acquire a new property that has a relatively low physical occupancy, and the cash flow from existing operations may be insufficient to pay the operating expenses associated with that property until the property is adequately leased. If one or more of these properties do not perform as expected or we are unable to successfully integrate new properties into our existing operations, our financial performance may be adversely affected.
The risks associated with storage contents may increase our operating costs or expose us to potential liability that may not be covered by insurance, which may have adverse effects on our business, financial condition, and results of operations.
The self storage facilities we own and operate are leased directly to customers who store their belongings without any immediate inspections or oversight from us. We may unintentionally lease space to groups engaged in illegal and dangerous activities. Damage to storage contents may occur due to, among other occurrences, the following: war, acts of terrorism, earthquakes, floods, hurricanes, pollution, environmental matters, fires or events caused by fault of a customer, fault of a third party, or fault of our own. Such damage may or may not be
30
covered by insurance maintained by us, if any. We will determine the amounts and types of insurance coverage that we will maintain, including any coverage over the contents of any properties in which we may invest. Such determinations will be made on a case-by-case basis based on the type, value, location, and risks associated with each investment, as well as any lender requirements, among any other factors we may consider relevant. There is no guarantee as to the type of insurance that we will obtain for any investments that we may make and there is no guarantee that any particular damage to storage contents would be covered by such insurance, even if obtained. The costs associated with maintaining such insurance, as well as any liability imposed upon us due to damage to storage contents, may have a material adverse impact on our business, financial condition, and results of operations.
Additionally, although we require our customers to sign an agreement stating that they will not store flammable, hazardous, illegal, or dangerous contents in the self storage units, we cannot ensure that our customers will abide by such agreement or otherwise comply with applicable laws, including environmental, health and safety laws. The storage of such materials or violation of applicable laws might cause destruction to a facility or impose liability on us for the costs of removal or remediation if these various contents or substances are released on, from or in a facility, which may have a material adverse impact on our business, financial condition, and results of operations.
Our operating results may be affected by regulatory changes that have an adverse impact on our specific facilities, including our ability to obtain required permits and approvals, which may adversely affect our business, financial condition, and results of operations.
Certain regulatory changes may have a direct impact on our self storage facilities, including but not limited to, land use, zoning, and permitting requirements by governmental authorities at the local level, which can restrict the availability of land for development, and special zoning codes which omit certain uses of property from a zoning category. These special uses (i.e., hospitals, schools, and self storage facilities) are allowed in that particular zoning classification only by obtaining a special use permit and the permission of local zoning authority. If we are delayed in obtaining or unable to obtain a special use permit where one is required, new developments or expansion of existing developments could be delayed or reduced. Additionally, certain municipalities require holders of a special use permit to have higher levels of liability coverage than is normally required. The acquisition of, or the inability to obtain, a special use permit and the possibility of higher levels of insurance coverage associated therewith may have an adverse impact on our business, financial condition, and results of operations.
In certain cases, we protect our customers’ goods pursuant to our tenant protection program or other arrangements that may, in some cases, be subject to governmental regulation, which may adversely affect our results.
In certain cases, we provide a tenant protection program to customers at our properties, and in certain other cases, we protect our customers goods through other arrangements. We earn fees in connection with these arrangements. These arrangements, including the payments associated with these arrangements, may be subject to state-specific or provincial-specific governmental regulation. Such regulatory authorities generally have broad discretion to promulgate, interpret and implement regulations, to adopt new or additional licensing requirements, to grant, renew and revoke licenses and approvals, and to evaluate compliance with regulations through periodic examinations, audits, investigations and inquiries. In addition, there has been and may continue to be regulatory or private action in the jurisdictions in which we operate. Although the marketing of, and management procedures associated with, these arrangements were designed to navigate the regulatory environment in which we operate, as a result of regulatory or private action in any jurisdiction in which we operate, we may be temporarily or permanently suspended from generating revenue with respect to these arrangements, or otherwise fined or penalized or suffer an adverse judgment, which could adversely affect our business and results of operations.
31
A failure in, or breach of, our operational or security systems or infrastructure, or those of our third party vendors and other service providers or other third parties, including as a result of cyber attacks, could disrupt our businesses, result in the disclosure or misuse of confidential or proprietary information, damage our reputation, increase our costs, and cause losses.
We rely heavily on communications and information systems to conduct our business. Information security risks for our business have generally increased in recent years in part because of the proliferation of new technologies; the use of the Internet and telecommunications technologies to process, transmit and store electronic information, including the management and support of a variety of business processes, including financial transactions and records, personally identifiable information, and tenant and lease data; and the increased sophistication and activities of organized crime, hackers, and terrorists, activists, and other external parties. As customer, public, and regulatory expectations regarding operational and information security have increased, our operating systems and infrastructure must continue to be safeguarded and monitored for potential failures, disruptions, and breakdowns. Our business, financial, accounting, and data processing systems, or other operating systems and facilities, may stop operating properly or become disabled or damaged as a result of a number of factors, including events that are wholly or partially beyond our control. For example, there could be electrical or telecommunication outages; natural disasters such as earthquakes, tornadoes, and hurricanes; disease pandemics; events arising from local or larger scale political or social matters, including terrorist acts; and as described below, cyber attacks.
Our business relies on its digital technologies, computer and email systems, software and networks to conduct its operations. Although we have information security procedures and controls in place, our technologies, systems and networks and, because the nature of our business involves the receipt and retention of personal information about our customers, our customers’ personal accounts may become the target of cyber attacks or information security breaches that could result in the unauthorized release, gathering, monitoring, misuse, loss, or destruction of our or our customers’ or other third parties’ confidential information. Third parties with whom we do business or who facilitate our business activities, including intermediaries or vendors that provide service or security solutions for our operations, and other third parties, could also be sources of operational and information security risk to us, including from breakdowns or failures of their own systems or capacity constraints. In addition, hardware, software or applications we develop or procure from third parties may contain defects in design or manufacture or other problems that could unexpectedly compromise information security.
While we have disaster recovery and other policies and procedures designed to prevent or limit the effect of the failure, interruption or security breach of our information systems, there can be no assurance that any such failures, interruptions or security breaches will not occur or, if they do occur, that they will be adequately addressed. Our risk and exposure to these matters remain heightened because of the evolving nature of these threats. As a result, cyber security and the continued development and enhancement of our controls, processes, and practices designed to protect our systems, computers, software, data, and networks from attack, damage or unauthorized access remain a focus for us. As threats continue to evolve, we may be required to expend additional resources to continue to modify or enhance our protective measures or to investigate and remediate information security vulnerabilities. Disruptions or failures in the physical infrastructure or operating systems that support our businesses and customers, or cyber attacks or security breaches of the networks, systems or devices that our customers use to access our products and services, could result in customer attrition, regulatory fines, penalties or intervention, reputation damage, reimbursement or other compensation costs, and/or additional compliance costs, any of which could have a material effect on our business, financial condition, or results from operations. Furthermore, if such attacks are not detected immediately, their effect could be compounded.
We may be unable to promptly re-let units within our facilities at satisfactory rental rates.
Generally, our unit leases are on a month-to-month basis. Delays in re-letting units as vacancies arise would reduce our revenues and could adversely affect our operating performance. In addition, lower-than-expected rental rates and higher rental concessions upon re-letting could adversely affect our rental revenues and impede our growth.
32
We face risks related to an epidemic, pandemic or other health crisis, which could have a material adverse effect on our business, financial condition, liquidity, results of operations and prospects.
We face risks related to an epidemic, pandemic or other health crisis, which could have a material adverse effect on our business, financial condition, liquidity, results of operations and prospects. Our rental revenue and operating results depend significantly on the demand for self storage space. If such an event causes weakness in national, regional and local economies that negatively impact the demand for self storage space and/or increase bad debts, our business, financial condition, liquidity, results of operations and prospects could be adversely impacted. Additionally, we typically conduct aspects of our leasing activity at our facilities, as well as the offering of various ancillary products, including moving and packing supplies, such as locks and boxes, and other services, such as protection plans, tenant insurance or similar programs. Further, if such an event results in reductions in the ability and willingness of customers to visit our facilities, we could experience reduced rental revenue and ancillary operating revenue produced by our facilities. Concerns and changes in behavior as a result of such an event could also impact the availability of site-level personnel, which could adversely affect our ability to adequately manage our facilities. The ultimate extent of the impact of such an event on our business, financial condition, liquidity, results of operations and prospects will be driven primarily by the duration, spread, and severity of the event itself, as well as the duration of indirect economic impacts and potential longer term changes in consumer behavior, all of which are uncertain and difficult to predict. As a result, we are unable to estimate the effect of these factors on our business, financial condition, liquidity, results of operations and prospects at this time.
Risks Related to Investments in Real Estate
A high concentration of our properties in a particular geographic area would magnify the effects of downturns in that geographic area.
In the event that we have a concentration of properties in any particular geographic area, any adverse situation that disproportionately affects that geographic area would have a magnified adverse effect on our portfolio. For the nine months ended September 30, 2024, approximately 22.1%, 20.3%, and 10.3% of our rental income was concentrated in Florida, California, and the GTA, respectively.
We may obtain only limited warranties when we purchase a property.
The seller of a property will often sell such property in its “as is” condition on a “where is” basis and “with all faults,” without any warranties of merchantability or fitness for a particular use or purpose. In addition, purchase agreements may contain only limited warranties, representations, and indemnifications that will only survive for a limited period after the closing. Also, many sellers of real estate are single purpose entities without significant other assets. The purchase of properties with limited warranties or from undercapitalized sellers increases the risk that we may lose some or all of our invested capital in the property as well as rental income from that property.
We may acquire or finance properties with yield maintenance or defeasance provisions, which may restrict our operational and financial flexibility.
Yield maintenance or defeasance provisions are provisions that generally require the payment of a premium in connection with the prepayment of a loan balance. Such provisions are typically provided for by the terms of the agreement underlying a loan. Yield maintenance or defeasance provisions could materially restrict us from selling or otherwise disposing of or refinancing properties. These provisions would affect our ability to turn our investments into cash and thus affect cash available for distribution to our stockholders. Yield maintenance or defeasance provisions may increase the costs of reducing the outstanding indebtedness with respect to any properties or refinancing such indebtedness.
Yield maintenance or defeasance provisions could impair our ability to take actions that would otherwise be in our stockholders’ best interests and, therefore, may have an adverse impact on the value of the shares, relative to the value that would result if such provisions did not exist. In particular, yield maintenance or defeasance
33
provisions could preclude us from participating in major transactions that could result in a disposition of our assets or a change in control, even though that disposition or change in control might be in our stockholders’ best interests.
Rising expenses could reduce cash available for future acquisitions.
Any properties that we buy in the future will be subject to operating risks common to real estate in general, any or all of which may negatively affect us. If any property is not fully occupied or if rents are being paid in an amount that is insufficient to cover operating expenses, we could be required to expend funds for that property’s operating expenses. Our properties will be subject to increases in tax rates, utility costs, operating expenses, insurance costs, repairs and maintenance and administrative expenses.
If we are unable to offset such cost increases through rent increases, we could be required to fund those increases in operating costs which could adversely affect funds available for future acquisitions or cash available for distribution.
Our real estate assets may decline in value and be subject to significant impairment losses, which may reduce our net income.
We evaluate our real property assets for impairment based on events and changes in circumstances that may impact the carrying amounts of such assets. When indicators of potential impairment are present, we will assess the recoverability of the particular asset by determining whether the carrying value of the asset will be recovered, through an evaluation of the undiscounted future operating cash flows expected from the use of the asset and its eventual disposition. This evaluation is based on a number of estimates and assumptions. These key assumptions are subjective in nature and may differ materially from actual results. Based on this evaluation, if the expected undiscounted future cash flows do not exceed the carrying value, we will adjust the value of the real property asset and recognize an impairment loss. Additionally, changes in our disposition strategy or changes in the marketplace may alter the holding period of an asset or asset group, which may result in an impairment loss, and such loss may be material to our financial condition or operating performance.
The fair value of real estate assets is subjective and is determined through the use of comparable sales information and other market data if available. These subjective assessments have a direct effect on our net income because recording an impairment loss results in an immediate negative adjustment to net income, which may be material.
Adverse economic conditions will negatively affect our returns and profitability.
The following market and economic challenges may adversely affect our operating results:
| | • | | changes in national, regional, and local economic climates or demographics; |
| | • | | poor economic times resulting in customer defaults under leases or bankruptcy; |
| | • | | competition from other available properties and the attractiveness of our properties to our customers; |
| | • | | re-leasing may require reduced rental rates under the new leases; |
| | • | | increased competition for real estate assets targeted by our investment strategy; |
| | • | | increased costs to repair, renovate, and re-lease our storage units; |
| | • | | increased insurance premiums may reduce funds available for distribution; |
| | • | | increased inflation above our ability to pass along comparable rent increases to our customers; and |
| | • | | changes in interest rates and the availability of financing, which may render the sale or refinance of a property or loan difficult or unattractive. |
34
We are susceptible to the effects of adverse macro-economic events that can result in higher unemployment, shrinking demand for products, large-scale business failures, and tight credit markets, such as inflation, rising interest rates, or labor shortages. Because our portfolio of facilities consists of self storage facilities, we are subject to risks inherent in investments in a single industry, and our results of operations are sensitive to changes in overall economic conditions that impact consumer spending, including discretionary spending, as well as to increased bad debts. A continuation of, or slow recovery from, ongoing adverse economic conditions affecting disposable consumer income, such as employment levels, business conditions, interest rates, tax rates, and fuel and energy costs, could reduce consumer spending or cause consumers to shift their spending to other products and services. A general reduction in the level of discretionary spending or shifts in consumer discretionary spending could adversely affect our growth and profitability.
If market conditions worsen, the value of the properties we acquire may decline. Further, the results of operations for a property in any one period may not be indicative of results in future periods, and the long-term performance of such property generally may not be comparable to, and cash flows may not be as predictable as, other properties owned by third parties in the same or similar industry.
Our inability to sell a property when we desire to do so could adversely impact our business and financial condition, and our inability to sell our properties at a price equal to, or greater than, the price for which we purchased such properties may lead to a decrease in the value of our assets.
The real estate market is affected by many factors, such as general economic conditions, availability of financing, interest rates and other factors, including supply and demand, that are beyond our control. Our self storage facilities, including related tangible and intangible assets, represent the majority of our total consolidated assets and they may not be readily convertible to cash. As a result, our ability to sell one or more of our self storage facilities in response to changes in economic, industry, or other conditions, may be limited. We cannot predict whether we will be able to sell any property for the price or on the terms set by us, or whether any price or other terms offered by a prospective purchaser would be acceptable to us. We cannot predict the length of time needed to find a willing purchaser and to close the sale of a property. Real estate generally cannot be sold quickly. Also, the tax laws applicable to REITs require that we hold our facilities for investment, rather than for sale in the ordinary course of business, which may cause us to forego or defer sales of facilities that otherwise would be in our best interest. Therefore, we may not be able to dispose of facilities promptly, or on favorable terms, in response to economic or other market conditions, and this may adversely impact our business and financial condition.
In addition, we may be required to expend funds to correct defects or to make improvements before a property can be sold. We cannot assure our stockholders that we will have funds available to correct such defects or to make such improvements.
In acquiring a property, we may agree to restrictions that prohibit the sale of that property for a period of time or impose other restrictions, such as a limitation on the amount of debt that can be placed or repaid on that property. These provisions would also restrict our ability to sell a property. Additionally, we may acquire our properties at a time when capitalization rates are at historically low levels and purchase prices are high. Therefore, the value of our properties may not increase over time, which may restrict our ability to sell our properties, or in the event we are able to sell such property, may lead to a sale price less than the price that we paid to purchase the properties.
If we suffer losses that are not covered by insurance or that are in excess of insurance coverage, we could lose invested capital and anticipated profits.
Material losses may occur in excess of insurance proceeds with respect to any property, as insurance may not be sufficient to fund the losses. However, there are types of losses, generally of a catastrophic nature, such as losses due to wars, acts of terrorism, earthquakes, floods, fires, hurricanes, pollution or environmental matters,
35
which are either uninsurable or not economically insurable, or may be insured subject to limitations such as large deductibles or co-payments. These insurance risks could sharply increase the premiums we pay for coverage against property and casualty claims. Additionally, mortgage lenders in some cases require that commercial property owners purchase specific coverage against terrorism as a condition for providing mortgage loans. It is uncertain whether such insurance policies will be available, or available at reasonable cost, which could inhibit our ability to finance or refinance our potential properties. In these instances, we may be required to provide other financial support, either through financial assurances or self-insurance, to cover potential losses. We cannot assure our stockholders that we will have adequate coverage for such losses. If such an event damaged or destroyed one or more of our properties, we could lose both our invested capital and anticipated profits from such property.
Our joint venture investments could be adversely affected by our lack of sole decision-making authority.
We hold interests in certain properties through joint ventures. Some of these arrangements could be adversely affected by our lack of sole decision-making authority, our reliance on co-venturers financial conditions, and disputes between us and our co-venturers. We expect to continue our joint venture strategy by entering into more joint ventures for the purposes of developing new properties and acquiring properties with existing facilities. In such event, we would not be in a position to exercise sole decision-making authority regarding the property, partnership, joint venture, or other entity. In addition, investments in partnerships, joint ventures or other entities may, under certain circumstances, involve risks not present were a third party not involved, including the possibility that partners or co-venturers might become bankrupt or fail to fund their share of required capital contributions. Partners or co-venturers may have economic or other business interests or goals which are inconsistent with our business interests or goals, and may be in a position to take actions contrary to our policies or objectives. Such investments may also have the potential risk of impasses on decisions, such as a sale, because neither we nor the partner or co-venturer would have full control over the partnership or joint venture. Disputes between us and partners or co-venturers may result in litigation or arbitration that would increase our expenses and prevent our officers and/or directors from focusing their time and efforts on our business. Consequently, actions by or disputes with partners or co-venturers might result in subjecting properties owned by the partnership or joint venture to additional risk. In addition, we may in certain circumstances be liable for the actions of our third-party partners or co-venturers, which could harm our financial condition.
We disclose funds from operations and funds from operations, as adjusted, each a non-GAAP financial measure, in communications with investors, including documents filed with the SEC. However, funds from operations and funds from operations, as adjusted, are not equivalent to our net income or loss or cash flow from operations as determined under GAAP, and stockholders should consider GAAP measures to be more relevant to our operating performance.
We use, and we disclose to investors, funds from operations, or FFO, and FFO, as adjusted, which are non-GAAP financial measures. FFO and FFO, as adjusted, are not equivalent to our net income or loss or cash flow from operations as determined in accordance with GAAP, and investors should consider GAAP measures to be more relevant in evaluating our operating performance and ability to pay distributions. FFO and FFO, as adjusted, differ from GAAP net income because FFO and FFO, as adjusted, exclude gains or losses from sales of property and asset impairment write downs, plus depreciation and amortization, and after adjustments for unconsolidated partnerships and joint ventures. Adjustments for unconsolidated partnerships and joint ventures are calculated to reflect FFO on the same basis. In determining FFO, as adjusted, we make further adjustments to FFO to exclude the effects of non-real estate related asset impairments and intangible amortization, acquisition related costs, other write-offs incurred in connection with acquisitions, contingent earnout expenses, accretion of fair value of debt adjustments, amortization of debt issuance costs, gains or losses from extinguishment of debt, accretion of deferred tax liabilities, realized and unrealized gains/losses on foreign exchange transactions, and gains/losses on foreign exchange and interest rate derivatives not designated for hedge accounting. FFO, as adjusted, also reflects adjustments for unconsolidated partnerships and jointly owned investments.
Because of these differences, FFO and FFO, as adjusted, may not be accurate indicators of our operating performance, especially during periods in which we are acquiring properties. In addition, FFO and FFO, as
36
adjusted, are not indicative of cash flow available to fund cash needs and investors should not consider FFO and FFO, as adjusted, as alternatives to cash flows from operations or an indication of our liquidity or of funds available to fund our cash needs, including our ability to pay distributions to our stockholders.
Neither the SEC nor any other regulatory body has passed judgment on the acceptability of the adjustments that we use to calculate FFO and FFO, as adjusted. Also, because not all companies calculate FFO and FFO, as adjusted, the same way, comparisons with other companies may not be meaningful.
Costs of complying with governmental laws and regulations, including those relating to environmental matters, may adversely affect our income and the cash available for distribution.
All real property, including our self storage properties, and the operations conducted on real property are subject to federal, state, and local laws and regulations relating to environmental protection and human health and safety. These laws and regulations generally govern wastewater discharges, air emissions, the operation and removal of underground and above-ground storage tanks, the generation, use, storage, treatment, transportation, release, and disposal of solid and hazardous materials and wastes, and the remediation of contamination. Some of these laws and regulations may impose joint and several liability on customers, owners, or operators for the costs to investigate or remediate contaminated properties, regardless of fault or whether the acts causing the contamination were legal at the time. This liability could be substantial. In addition, the presence of hazardous substances (including asbestos or asbestos-containing materials and mold), or the failure to properly remediate these substances, may expose us to legal actions, and may adversely affect our ability to sell or rent a property, or to pledge such property as collateral for future borrowings.
Some of these laws and regulations have been amended so as to require compliance with new or more stringent standards as of future dates. Compliance with new or more stringent laws or regulations or stricter interpretation of existing laws may require us to incur material expenditures. Future laws, ordinances or regulations may impose material environmental liability. Additionally, our customers’ activities, the existing condition of land when we buy it, operations in the vicinity of our properties, such as the presence of underground storage tanks, or activities of unrelated third parties may affect our properties. In addition, there are various local, state, and federal fire, health, life-safety, and similar regulations with which we may be required to comply, and that may subject us to liability in the form of fines or damages for noncompliance. Any material expenditures, fines, or damages we must pay will reduce our ability to continue to pay distributions at the current rate to our stockholders and may reduce the value of our stockholders’ investments.
We cannot assure our stockholders that the independent third party environmental assessments we obtain prior to acquiring any properties we purchase will reveal all environmental liabilities, or that a prior owner, occupant, or neighbor of a property did not create a material environmental condition not known to us. We also cannot assure that the current environmental condition of our properties will not be affected by neighbors and occupants, by the condition of nearby properties, or by other unrelated third parties. We cannot predict what other environmental legislation or regulations will be enacted in the future, how existing or future laws or regulations will be administered or interpreted, or what environmental conditions may be found to exist in the future. Finally, we cannot assure our stockholders that our business, assets, results of operations, liquidity, or financial condition will not be adversely affected by these laws, which may adversely affect cash available for distribution, and the amount of distributions to our stockholders.
Climate change may adversely affect our business, financial condition, cash flows and results of operations.
Climate change creates physical and financial risks. Physical risks from climate change include an increase in sea levels and changes in weather conditions, such as an increase in storm intensity and severity of weather (e.g., floods, tornadoes or hurricanes) and extreme temperatures. The occurrence of sea level rise or one or more natural disasters, such as floods, tornadoes, hurricanes, tropical storms, wildfires, and earthquakes (whether or not caused by climate change), could cause considerable damage to our properties, disrupt our operations and negatively affect
37
our financial performance. To the extent any of these events results in significant damage to or closure of one or more of our properties, our operations and financial performance could be adversely affected through an inability to lease or re lease the property. In addition, these events could result in significant expenses to restore or remediate a property, increases in fuel or other energy costs or a fuel shortage, and increases in the costs of (or making unavailable) insurance on favorable terms if they result in significant loss of property or other insurable damage. In addition, transition risks associated with new or more stringent laws or regulations or stricter interpretations of existing laws or regulations may require material expenditures by us. For example, various federal, state, and regional laws and regulations have been implemented or are under consideration to mitigate the effects of climate change caused by greenhouse gas emissions. Among other things, “green” building codes may seek to reduce emissions through the imposition of standards for design, construction materials, water and energy usage and efficiency, and waste management. Such codes could require us to make improvements to our properties, increase the costs of maintaining or improving our properties or developing new properties, or increase taxes and fees assessed on us or our properties.
Costs of complying with governmental laws and regulations, including those relating to regulations accommodating disabilities, may affect cash available for distribution.
We are subject to various rules, regulations and standards with respect to accommodations we must make for individuals with disabilities. For example, in the United States, under the Americans with Disabilities Act of 1990, or ADA, all public accommodations and commercial facilities are required to meet certain federal requirements related to access and use by disabled persons. We are also subject to similar requirements in Ontario, Canada, under the Accessibility for Ontarians with Disabilities Act, or AODA. Under these regulations, places of public accommodation, which include our self storage facilities, are required to comply with certain requirements related to access and use by disabled persons. These requirements could require removal of access barriers and could result in the imposition of injunctive relief, monetary penalties, or, in some cases, an award of damages. We will attempt to acquire properties that comply with such regulations or place the burden on the seller or other third party to ensure compliance with such regulations. However, we cannot assure our stockholders that we will be able to acquire properties or allocate responsibilities in this manner. If we cannot, our funds used for such compliance may affect cash available for distribution and the amount of distributions to our stockholders.
Property taxes and insurance premiums may increase, which would adversely affect our net operating income and cash available for distributions.
Each of the properties we acquire will be subject to real property taxes and insurance premiums, including property insurance, liability insurance, and, in some cases, earthquake insurance. Some local real property tax assessors may seek to reassess some of our properties as a result of our acquisition of the property. From time to time, our property taxes may increase as property values or assessment rates change or for other reasons deemed relevant by the assessors. In addition, state or local governments may increase tax rates or assessment levels. Further, insurance premiums have recently increased and may continue to increase due to various factors, including inflation and natural disasters. Increases in real property taxes and insurance premiums will adversely affect our net operating income and cash available for distributions.
For example, a current California law commonly referred to as Proposition 13 generally limits annual real estate tax increases on California properties to 2% of assessed value. Accordingly, the assessed value and resulting property tax we pay is less than it would be if the properties were assessed at current values. If Proposition 13 is repealed or amended in a way that reduces its beneficial impact, our property tax expense could increase substantially for our properties located in California, adversely affecting our net operating income and cash available for distributions.
38
Investments in properties or other real estate investments outside the United States subject us to foreign currency risks, which may adversely affect distributions and our REIT status.
Revenues generated from any properties or other real estate investments we acquire or ventures we enter into relating to transactions involving assets located in markets outside the United States likely will be denominated in the local currency. Therefore, any investments we make outside the United States may subject us to foreign currency risk due to potential fluctuations in exchange rates between foreign currencies and the U.S. dollar. As a result, changes in exchange rates of any such foreign currency to U.S. dollars may affect our revenues, operating margins, and distributions and may also affect the book value of our assets and the amount of stockholders’ equity.
Changes in foreign currency exchange rates used to value a REIT’s foreign assets may be considered changes in the value of the REIT’s assets. These changes may adversely affect our ability to qualify as a REIT. Further, bank accounts in foreign currency which are not considered cash or cash equivalents may adversely affect our ability to qualify as a REIT.
Changes in the CAD/USD exchange rate could have a material adverse effect on our operating results and value of the investment of our stockholders.
We have purchased and may continue to purchase properties in Canada. In addition, our Managed REITs own properties in Canada where we, through our subsidiaries, serve as the property manager. As a result, our financial results may be adversely affected by fluctuations in the CAD/USD exchange rate. We cannot predict with any certainty changes in foreign currency exchange rates or our ability to mitigate these risks. Several factors may affect the CAD/USD exchange rate, including:
| | • | | sovereign debt levels and trade deficits; |
| | • | | domestic and foreign inflation rates and interest rates and investors’ expectations concerning those rates; |
| | • | | other currency exchange rates; |
| | • | | changing supply and demand for a particular currency; |
| | • | | monetary policies of governments; |
| | • | | changes in balances of payments and trade; |
| | • | | direct sovereign intervention, such as currency devaluations and revaluations; |
| | • | | investment and trading activities of mutual funds, hedge funds, and currency funds; and |
| | • | | other global or regional political, economic, or financial events and situations. |
These events and actions are unpredictable. In addition, the CAD may not maintain its long-term value in terms of purchasing power in the future. The resulting volatility in the CAD/USD exchange rate could materially and adversely affect our performance.
39
We are subject to additional risks due to the location of any of the properties that we either own or operate in Canada.
In addition to currency exchange rates, the value of any properties we purchase in Canada may be affected by factors peculiar to the laws and business practices of Canada. Canadian laws and business practices may expose us to risks that are different from and in addition to those commonly found in the United States. Ownership and operation of foreign assets pose several risks, including, but not limited to the following:
| | • | | the burden of complying with both Canadian and United States’ laws; |
| | • | | changing governmental rules and policies, including changes in land use and zoning laws, more stringent environmental laws or changes in such laws; |
| | • | | existing or new Canadian laws relating to the foreign ownership of real property or loans and laws restricting the ability of Canadian persons or companies to remove profits earned from activities within the country to the person’s or company’s country of origin; |
| | • | | the potential for expropriation; |
| | • | | possible currency transfer restrictions; |
| | • | | imposition of adverse or confiscatory taxes; |
| | • | | changes in real estate and other tax rates or laws and changes in other operating expenses in Canada; |
| | • | | possible challenges to the anticipated tax treatment of our revenue and our properties; |
| | • | | adverse market conditions caused by terrorism, civil unrest and changes in national or local governmental or economic conditions; |
| | • | | the potential difficulty of enforcing obligations in other countries; |
| | • | | changes in the availability, cost, and terms of loan funds resulting from varying Canadian economic policies; and |
| | • | | our limited experience and expertise in foreign countries relative to our experience and expertise in the United States. |
Risks Associated with Debt Financing
We have broad authority to incur debt, and high debt levels could hinder our ability to continue to pay distributions at the current rate and could decrease the value of our stockholders’ investments.
Our Board may approve unlimited levels of debt. High debt levels would cause us to incur higher interest charges, would result in higher debt service payments, and could be accompanied by restrictive covenants. These factors could limit the amount of cash we have available to distribute and could result in a decline in the value of our stockholders’ investments.
We have incurred and intend to continue to incur, mortgage indebtedness and other borrowings, which may increase our business risks.
We have placed, and intend to continue to place, permanent financing on our properties and we may obtain additional credit facilities or other similar financing arrangements in order to acquire additional properties. In particular, we have a credit facility with KeyBank, National Association of up to $650 million, of which approximately $603.9 million was outstanding as of September 30, 2024 (the “2024 Credit Facility”). We have the right to increase the amount available under the 2024 Credit Facility by an additional $850 million, for a total potential maximum aggregate amount of $1.5 billion, subject to certain conditions. We are also party to a Note Purchase Agreement, whereby we issued to the purchasers an aggregate of $150 million of 4.53% Senior Notes due April 19, 2032. The notes carried a fixed interest rate of 4.53%, which increased to 5.28% as a result of
40
certain leverage thresholds. The notes will continue to accrue interest at a rate of 5.28% until certain leverage thresholds are met for two consecutive fiscal quarters, at which point, the rate will revert to 4.53% and remain at that interest rate through maturity. The 2024 Credit Facility and the notes are subject to a series of financial and other covenants. See Note 5 – Debt of the notes to our consolidated financial statements for the nine months ended September 30, 2024 contained elsewhere in this prospectus for more information. We may also incur mortgage debt and pledge all or some of our real properties as security for that debt to obtain funds to acquire real properties. If we default on our secured indebtedness, the lender may foreclose and we could lose our entire investment in the properties securing such loan, which could adversely affect distributions to our stockholders. To the extent lenders require us to cross-collateralize our properties, or our loan agreements contain cross-default provisions, a default under a single loan agreement could subject multiple properties to foreclosure.
In addition, we may borrow if we need funds to pay a desired distribution rate to our stockholders. We may also borrow if we deem it necessary or advisable to assure that we maintain our qualification as a REIT for federal income tax purposes. If there is a shortfall between the cash flow from our properties and the cash flow needed to service mortgage debt, then the amount available for distribution to our stockholders may be reduced.
If we or the other parties to our loans or secured notes payable, as applicable, breach covenants thereunder, such loan or loans or secured notes payable could be deemed in default, which could accelerate our repayment date and materially adversely affect the value of our stockholders’ investment in us.
Certain of our loans are secured by first mortgages on some of our properties, and other loans and our secured notes payable are secured by pledges of equity interests in the entities that own certain of our properties. Such loans and our secured notes payable also impose a number of financial or other covenant requirements on us. If we, or the other parties to these loans or notes, should breach certain of those financial or other covenant requirements, or otherwise default on such loans or notes, then the respective lenders or noteholders, as the case may be, could accelerate our repayment dates. If we do not have sufficient cash to repay the applicable loan or note at that time, such lenders or noteholder could foreclose on the property securing the applicable loan or note or take control of the pledged collateral, as the case may be. Such foreclosure could result in a material loss for us and would adversely affect the value of our stockholders’ investment in us. In addition, certain of our loans are cross-collateralized and cross-defaulted with each other such that a default under one loan would cause a default under the other loans.
Our obligation to make balloon payments could increase the risk of default.
Our debt may have balloon payments of up to 100% of the principal amount of such loans due on the respective maturity dates. Thus, such debt will have a substantial payment due at the scheduled maturity date, unless previously prepaid or refinanced. Loans with a substantial remaining principal balance on their stated maturity involve greater degrees of risk of non-payment at stated maturity than fully amortizing loans. As a result, our ability to repay such loans on their respective maturity dates will largely depend upon our ability either to prepay such loans, refinance such loans or to sell, to the extent permitted, all or a portion of the properties encumbered by such loans, if any. Our ability to accomplish any of these goals will be affected by a number of factors at the time of attempted prepayment, refinancing, or sale, including, but not limited to: (i) the availability of, and competition for, credit for commercial real estate; (ii) prevailing interest rates; (iii) the net operating income generated by our properties; (iv) the fair market value of our properties; (v) our equity in our properties; (vi) our financial condition; (vii) the operating history and occupancy level of our properties; (viii) the tax laws; and (ix) the prevailing general and regional economic conditions.
Lenders have required and will likely continue to require us to enter into restrictive covenants relating to our operations, which could limit our ability to continue to pay distributions to our stockholders.
When providing financing, lenders often impose restrictions on us that affect our distribution and operating policies and our ability to incur additional debt. Loan documents we enter into may contain covenants that limit our ability to further mortgage the property or discontinue insurance coverage. We are also required to obtain the
41
affirmative vote of the holders of a majority of the Series A Convertible Preferred Stock before entering into certain transactions. These or other limitations may adversely affect our flexibility and limit our ability to continue to pay distributions at the current rate to our stockholders. If the limits set forth in these covenants prevent us from satisfying our distribution requirements, we could fail to qualify for federal income tax purposes as a REIT. If the limits set forth in these covenants do not jeopardize our qualification for taxation as a REIT, but prevent us from distributing 100% of our REIT taxable income, we will be subject to U.S. federal income tax, and potentially a nondeductible excise tax, on the retained amounts.
Increases in interest rates could increase the amount of our debt payments and adversely affect our ability to continue to pay distributions at the current rate to our stockholders.
We currently have outstanding debt payments which are indexed to variable interest rates. We may also incur additional debt or issue preferred equity in the future which rely on variable interest rates. Increases in these variable rates have occurred and may continue in the future which increases our interest costs and preferred equity distribution payments, which would likely reduce our cash flows and potentially negatively impact our ability to continue to pay distributions at the current rate to our stockholders. In addition, if we need to make payments on instruments which contain variable interest during periods of rising interest rates, we could be required to liquidate one or more of our investments in properties at times that may not permit realization of the maximum return on such investments.
Further, as a result of the discontinuation of the London Interbank Offered Rate, or LIBOR, beginning in 2021, our variable rate debt is currently indexed to the Secured Overnight Financing Rate, or SOFR. SOFR is a relatively new reference rate, has a very limited history and is based on short-term repurchase agreements, backed by Treasury securities. Changes in SOFR can be volatile and difficult to predict, and there can be no assurance that SOFR will perform similarly to the way LIBOR would have performed at any time. As a result, the amount of interest we may pay on our credit facilities is difficult to predict.
Disruptions in the credit markets could have a material adverse effect on our results of operations, financial condition, and ability to pay distributions to our stockholders.
Domestic and international financial markets have experienced significant disruptions in the past which were brought about in large part by failures in the U.S. banking system. These disruptions severely impacted the availability of credit and contributed to rising costs associated with obtaining credit. Future credit market disruptions may have similar effects or otherwise make obtaining additional and replacement external sources of liquidity more difficult and more costly, if available at all. If debt financing is not available on terms and conditions we find acceptable, we may not be able to obtain financing for investments. If these disruptions in the credit markets resurface, our ability to borrow monies to finance the purchase of, or other activities related to, real estate assets will be negatively impacted. If we are unable to borrow monies on terms and conditions that we find acceptable, we may be forced to use a greater proportion of our Offering proceeds to finance our acquisitions, reduce the number of properties we can purchase, and/or dispose of some of our assets. These disruptions could also adversely affect the return on the properties we do purchase. In addition, if we pay fees to lock in a favorable interest rate, falling interest rates or other factors could require us to forfeit these fees. All of these events would have a material adverse effect on our results of operations, financial condition, and ability to pay distributions.
Federal Income Tax Risks
Failure to continue to qualify as a REIT would adversely affect our operations and our ability to continue to pay distributions at our current level as we will incur additional tax liabilities.
We elected to be taxed as a REIT for U.S. federal income tax purposes commencing with our taxable year ended December 31, 2014. We believe that our organization and method of operation has enabled and will continue to enable us to meet the requirements for qualification and taxation as a REIT for U.S. federal income
42
tax purposes. Qualification as a REIT involves highly technical and complex Code provisions for which there are only limited judicial and administrative interpretations. Our qualification as a REIT will depend upon our ability to meet, through investments, actual operating results, distributions and satisfaction of specific stockholder rules, the various tests imposed by the Code.
If we fail to qualify as a REIT for any taxable year, we will be subject to federal income tax on our taxable income at the regular corporate rate, which would reduce our net earnings available for investment or distribution to stockholders. If our REIT status is terminated for any reason, we would generally be disqualified from treatment as a REIT for the four taxable years following the year of such termination. In addition, we would no longer be required to make distributions to stockholders, and distributions we do make would no longer qualify for the dividends paid deduction. In addition, if we fail to qualify as a REIT, we may be required to repurchase the Series A Convertible Preferred Stock. If this occurs, we may be required to borrow funds or liquidate some investments in order to pay the applicable tax and redeem holders of the Series A Convertible Preferred Stock.
In the event that any REIT we have acquired in a nontaxable merger transaction, including SST IV or SSGT II, is found to have failed to qualify as a REIT for any period prior to our acquisition, we may be liable for certain entity level taxes of such acquired REIT for such tax periods as a result of such acquisition, that could substantially reduce our cash available for distribution, including cash available to pay dividends to our stockholders, because the acquired REIT would be subject to U.S. federal corporate income tax on its net income for the years it did not qualify for taxation as a REIT (and, for such years, would not be allowed a deduction for dividends paid to stockholders in computing its taxable income).
In addition, if any such acquired REIT, including SST IV or SSGT II, failed to qualify as a REIT for any taxable period prior to our acquisition, in the event of a taxable disposition of an asset formerly held by such acquired REIT during a period of up to five years following our acquisition, we would be subject to U.S. federal corporate income tax with respect to any built-in gain inherent in such asset as of the closing of our acquisition.
Qualification as a REIT is subject to the satisfaction of tax requirements and various factual matters and circumstances that are not entirely within our control. New legislation, regulations, administrative interpretations or court decisions could change the tax laws with respect to qualification as a REIT or the federal income tax consequences of being a REIT. Our failure to continue to qualify as a REIT would adversely affect the return of our stockholders’ investment.
To qualify as a REIT, and to avoid the payment of U.S. federal income and excise taxes and maintain our REIT status, we may be forced to borrow funds, use proceeds from the issuance of securities, or sell assets to pay distributions, which may result in our distributing amounts that may otherwise be used for our operations.
To obtain the favorable tax treatment accorded to REITs, we normally will be required each year to distribute to our stockholders at least 90% of our REIT taxable income, determined without regard to the deduction for dividends paid and by excluding net capital gains. We will be subject to federal income tax on our undistributed REIT taxable income and net capital gain and subject to a 4% nondeductible excise tax on any amount by which dividends we pay with respect to any calendar year are less than the sum of (1) 85% of our ordinary income, (2) 95% of our capital gain net income, and (3) 100% of our undistributed income from prior years. These requirements could cause us to distribute amounts that otherwise would be spent on the acquisition, maintenance or development of properties and it is possible that we might be required to borrow funds, use proceeds from the issuance of securities or sell assets in order to distribute enough of our taxable income to maintain our REIT status and to avoid the payment of federal income and excise taxes. We may be required to make distributions to stockholders at times it would be more advantageous to reinvest cash in our business or when we do not have cash readily available for distribution, and we may be forced to liquidate assets on terms and at times unfavorable to us. These methods of obtaining funding could affect future distributions by increasing operating costs and decreasing available cash.
43
Our stockholders may have tax liability on distributions they elect to reinvest in our common stock.
If our stockholders participate in our distribution reinvestment plan, our stockholders will be deemed to have received, and for income tax purposes will be taxed on, the amount reinvested in common stock to the extent the amount reinvested was not a tax-free return of capital. As a result, unless our stockholders are tax-exempt entities our stockholders may have to use funds from other sources to pay their tax liability on the value of the common stock received.
If any of our partnerships fails to maintain its status as a partnership for federal income tax purposes, its income would be subject to taxation and our REIT status may be terminated.
We intend to maintain the status of our partnerships, including our operating partnership, as partnerships for federal income tax purposes. However, if the Internal Revenue Service (IRS) were to successfully challenge the status of any of our partnerships as a partnership, it would be taxable as a corporation. Such an event would reduce the amount of distributions that such partnership could make to us. This would substantially reduce our cash available to pay distributions and the return on our stockholders’ investments. In addition, if any of the entities through which any of our partnerships owns its properties, in whole or in part, loses its characterization as a partnership for federal income tax purposes, it generally would be subject to taxation as a corporation, thereby reducing distributions to such partnership. Such a recharacterization of any of our partnerships or an underlying property owner could also cause us to fail to qualify as a REIT, which would substantially reduce our cash available to pay distributions and the return on our stockholders’ investments.
In certain circumstances, we may be subject to federal and state income taxes as a REIT, which would reduce our cash available for distribution to our stockholders.
Even if we qualify and maintain our status as a REIT, we may be subject to federal income taxes or state taxes. For example, net income from a “prohibited transaction” will be subject to a 100% tax. We may not be able to make sufficient distributions to avoid excise taxes applicable to REITs. We may also decide to retain income we earn from the sale or other disposition of our property and pay income tax directly on such income. In that event, our stockholders would be treated as if they earned that income and paid the tax on it directly. However, stockholders that are tax-exempt, such as charities or qualified pension plans, would have no benefit from their deemed payment of such tax liability. We may also be subject to state and local taxes on our income or property, either directly, at the level of our operating partnership, or at the level of any other companies through which we indirectly own our assets. Any federal or state taxes we pay will reduce our cash available for distribution to our stockholders.
We may be required to pay some taxes due to actions of our taxable REIT subsidiaries, which would reduce our cash available for distribution to our stockholders.
Any net taxable income earned by our taxable REIT subsidiaries, or TRSs, will be subject to federal and possibly state corporate income tax. We have elected to treat SmartStop TRS, Inc. as a TRS, and we may elect to treat other subsidiaries as TRSs in the future. In this regard, several provisions of the laws applicable to REITs and their subsidiaries ensure that a TRS will be subject to an appropriate level of federal income taxation. For example, the REIT has to pay a 100% penalty tax on some payments that it receives or on some deductions taken by a TRS if the economic arrangements between the REIT, the REIT’s customers, and the TRS are not comparable to similar arrangements between unrelated parties. Finally, some state and local jurisdictions may tax some of our income even though as a REIT we are not subject to federal income tax on that income, because not all states and localities follow the federal income tax treatment of REITs. To the extent that we and our affiliates are required to pay federal, state, and local taxes, we will have less cash available for distributions to our stockholders.
44
Distributions to tax-exempt investors may be classified as unrelated business taxable income.
Neither ordinary nor capital gain distributions with respect to our common stock, nor gain from the sale of common stock, should generally constitute unrelated business taxable income, or UBTI, to a tax-exempt investor. However, there are certain exceptions to this rule. In particular:
| | • | | part of the income and gain recognized by certain qualified employee pension trusts with respect to our common stock may be treated as UBTI if shares of our common stock are predominately held by qualified employee pension trusts, and we are required to rely on a special look-through rule for purposes of meeting one of the REIT share ownership tests, and we are not operated in a manner to avoid treatment of such income or gain as UBTI; |
| | • | | part of the income and gain recognized by a tax-exempt investor with respect to our common stock would constitute UBTI if the investor incurs debt in order to acquire the common stock; and |
| | • | | part or all of the income or gain recognized with respect to our common stock by social clubs, voluntary employee benefit associations and supplemental unemployment benefit trusts which are exempt from federal income taxation under Sections 501(c)(7), (9), or (17) of the Code may be treated as UBTI. |
Complying with the REIT requirements may cause us to forego otherwise attractive opportunities.
To qualify as a REIT for federal income tax purposes, we must continually satisfy tests concerning, among other things, the sources of our income, the nature and diversification of our assets, the amounts we distribute to our stockholders and the ownership of shares of our stock. We may be required to make distributions to stockholders at disadvantageous times or when we do not have funds readily available for distribution, or we may be required to liquidate otherwise attractive investments in order to comply with the REIT tests. Thus, compliance with the REIT requirements may hinder our ability to operate solely on the basis of maximizing profits.
To maintain our REIT qualification, we may be forced to borrow funds during unfavorable market conditions.
In order to maintain our REIT qualification and avoid the payment of income and excise taxes, we may need to borrow funds to meet the REIT distribution requirements even if the then prevailing market conditions are not favorable for these borrowings. These borrowing needs could result from, among other things, timing differences between the actual receipt of cash and inclusion of income for U.S. federal income tax purposes, or the effect of non-deductible capital expenditures, the creation of reserves or required debt or amortization payments. These sources, however, may not be available on favorable terms or at all. Our access to third-party sources of capital depends on a number of factors, including the market’s perception of our growth potential, current debt levels, and our current and potential future earnings. We cannot assure you that we will have access to such capital on favorable terms at the desired times, or at all, which may cause us to curtail investment activities and/or to dispose of assets at inopportune times, and could adversely affect our financial condition, results of operations, cash flows, and our ability to pay distributions to our stockholders.
Dividends payable by REITs do not qualify for the reduced tax rates available for some dividends.
Individuals with incomes below certain thresholds are subject to taxation at a 15% qualified dividend rate for federal income tax purposes. For those with income above such thresholds, the qualified dividend rate is 20%. These tax rates are generally not applicable to dividends paid by a REIT, unless such dividends represent earnings on which the REIT itself has been taxed. As a result, dividends (other than capital gain dividends) we pay to individual investors generally will be subject to the tax rates that are otherwise applicable to ordinary income for federal income tax purposes, subject to a deduction for REIT dividends of up to 20%. This disparity in tax treatment may make an investment in our shares comparatively less attractive to individual investors than an investment in the shares of non-REIT corporations, and could have an adverse effect on the value of our common stock.
45
Foreign purchasers of our common stock may be subject to FIRPTA tax upon the sale of their shares.
A foreign person disposing of a U.S. real property interest, including shares of a U.S. corporation whose assets consist principally of U.S. real property interests, is generally subject to a tax, known as FIRPTA tax, on the gain recognized on the disposition. Such FIRPTA tax does not apply, however, to the disposition of stock in a REIT if the REIT is “domestically controlled.” A REIT is “domestically controlled” if less than 50% of the REIT’s stock, by value, has been owned directly or indirectly by persons who are not qualifying U.S. persons during a continuous five-year period ending on the date of disposition or, if shorter, during the entire period of the REIT’s existence.
We believe, but cannot guarantee, that we will be a “domestically controlled” REIT. Because our common stock will be publicly traded upon completion of this offering of our common stock (and, we anticipate will continue to be publicly traded), no assurance can be given that we will be a “domestically controlled” REIT. If we were to fail to so qualify, gain realized by foreign investors on a sale of our shares would be subject to FIRPTA tax, unless our shares were traded on an established securities market and the foreign investor did not at any time during a specified testing period directly or indirectly own more than 10% of the value of our outstanding common stock.
Legislative or other actions affecting REITs materially and adversely affect our stockholders and us.
The rules dealing with federal income taxation are constantly under review by persons involved in the legislative process and by the IRS and the U.S. Department of the Treasury. Changes to the tax laws, with or without retroactive application, could materially and adversely affect our stockholders and us. We cannot predict how changes in the tax laws might affect our investors or us. New legislation, Treasury Regulations, administrative interpretations or court decisions could significantly and negatively affect our ability to qualify as a REIT or the federal income tax consequences of such qualification, or the federal income tax consequences of an investment in us. Also, the law relating to the tax treatment of other entities, or an investment in other entities, could change, making an investment in other entities more attractive relative to an investment in a REIT.
ERISA Risks
If our assets are deemed to be plan assets, we may be exposed to liabilities under Title I of Employee Retirement Income Security Act of 1974, or ERISA, and the Code.
In some circumstances where an ERISA plan holds an interest in an entity, the assets of the entity are deemed to be ERISA plan assets unless an exception applies. This is known as the “look-through rule.” Under those circumstances, the obligations and other responsibilities of plan sponsors, plan fiduciaries and plan administrators, and of parties in interest and disqualified persons, under Title I of ERISA or Section 4975 of the Code, may be applicable, and there may be liability under these and other provisions of ERISA and the Code. We believe that we will meet the “publicly-offered securities” exception and the “operating company” exception under the plan asset regulations. We note, however, that because certain limitations are imposed upon the transferability of shares of our common stock so that we may qualify as a REIT, and perhaps for other reasons, it is possible that these exceptions may not apply. If that is the case, and if we are exposed to liability under ERISA or the Code, our performance and results of operations could be adversely affected.
There are special considerations that apply to qualified pension or profit-sharing trusts or IRAs investing in our shares which could cause an investment in our company to be a prohibited transaction and could result in additional tax consequences.
If our stockholders are investing the assets of a qualified pension, profit-sharing, 401(k), Keogh, or other qualified retirement plan or the assets of an IRA in our common stock, they should satisfy themselves that, among other things:
| | • | | their investment is consistent with their fiduciary obligations under ERISA and the Code; |
| | • | | their investment is made in accordance with the documents and instruments governing their plan or IRA, including their plan’s investment policy; |
46
| | • | | their investment satisfies the prudence and diversification requirements of ERISA; |
| | • | | their investment will not impair the liquidity of the plan or IRA; |
| | • | | their investment will not produce UBTI for the plan or IRA; |
| | • | | they will be able to value the assets of the plan annually in accordance with ERISA requirements; and |
| | • | | their investment will not constitute a prohibited transaction under Section 406 of ERISA or Section 4975 of the Code. |
Persons investing the assets of employee benefit plans, IRAs, and other tax-favored benefit accounts should consider ERISA and related risks of investing in the shares.
ERISA and Code Section 4975 prohibit certain transactions that involve (1) certain pension, profit-sharing, employee benefit, or retirement plans or individual retirement accounts and Keogh plans, and (2) any person who is a “party-in-interest” or “disqualified person” with respect to such a plan. Consequently, the fiduciary of a plan contemplating an investment in the shares should consider whether we, any other person associated with the issuance of the shares, or any of their affiliates is or might become a “party-in-interest” or “disqualified person” with respect to the plan and, if so, whether an exemption from such prohibited transaction rules is applicable. In addition, the Department of Labor, or DOL, plan asset regulations provide that, subject to certain exceptions, the assets of an entity in which a plan holds an equity interest may be treated as assets of an investing plan, in which event the underlying assets of such entity (and transactions involving such assets) would be subject to the prohibited transaction provisions. We intend to take such steps as may be necessary to qualify us for one or more of the exemptions available, and thereby prevent our assets as being treated as assets of any investing plan.
Risks Related to this Offering
There is currently no public market for shares of our common stock, and we cannot assure you that a public market will develop.
Prior to this offering, there has been no public market for shares of our common stock, and we cannot assure you that an active trading market will develop or be sustained. In the absence of a public trading market, a stockholder may be unable to liquidate an investment in shares of our common stock. The initial public offering price for shares of our common stock will be determined by agreement among us and the underwriters, and we cannot assure you that shares of our common stock will not trade below the initial public offering price following the completion of this offering. Whether a public market for shares of our common stock will develop will depend on a number of factors including the extent of institutional investor interest in us, the general reputation of REITs and the attractiveness of their equity securities in comparison to other equity securities (including securities issued by other real estate based companies), our financial performance and general stock and bond market conditions. If a robust public market for shares of our common stock does not develop, you may have difficulty selling shares of our common stock, which could adversely affect the price that you receive for such shares.
The estimated net asset value per share, or Estimated Per Share NAV, of our common stock is based on a number of assumptions that may not be accurate or complete and may not reflect the price at which shares of our common stock will trade when listed on a national securities exchange or the price a third party would pay to acquire us.
On January 15, 2024, our Board approved an Estimated Per Share NAV of each of our Class A common stock and Class T common stock of $15.25 as of September 30, 2023 based on an estimated value range of our assets less the estimated value of our liabilities, divided by the approximate number of shares outstanding on a fully diluted basis. We engaged a third-party valuation firm, Robert A. Stanger & Co, Inc., in part, to provide a net asset value report, which estimated the net asset value range per share of each of our Class A common stock and Class T common stock as of September 30, 2023. Our Estimated Per Share NAV is based upon a number of estimates and assumptions that may not be accurate or complete. Different parties with different assumptions and estimates could derive a different Estimated Per Share NAV, and this difference could be significant. The Estimated Per Share NAV is not audited and does not represent a determination of the fair value of our assets or liabilities according to GAAP.
47
In determining the Estimated Per Share NAV, we primarily relied upon an appraisal report that provided an appraised value range for our portfolio of properties as of September 30, 2023. Valuations and appraisals of our properties are estimates of fair value and may not necessarily correspond to realizable value upon the sale of such properties; therefore our Estimated Per Share NAV may not reflect the amount that would be realized upon a sale of each of our properties.
Accordingly, with respect to the Estimated Per Share NAV, we can give no assurance that, (i) a stockholder would be able to resell his or her shares at the Estimated Per Share NAV; (ii) a stockholder would ultimately realize distributions per share equal to the Estimated Per Share NAV upon a liquidation of our assets and settlement of our liabilities; (iii) our common stock would trade at the Estimated Per Share NAV on a national securities exchange; (iv) a different independent third-party appraiser or other third-party valuation firm would agree with our Estimated Per Share NAV; or (v) the Estimated Per Share NAV, or the methodologies used to estimate our Estimated Per Share NAV, will be found by any regulatory authority to comply with the Employee Retirement Income Security Act (ERISA), the Code, or other regulatory requirements.
The market price and trading volume of shares of our common stock may be volatile.
The U.S. stock markets, including the NYSE, on which we intend to list our common stock, subject to official notice of issuance, have experienced significant price and volume fluctuations. As a result, the market price of shares of our common stock is likely to be similarly volatile, and investors in shares of our common stock may experience a decrease in the value of their shares, including decreases unrelated to our operating performance or prospects. We cannot assure you that the market price of shares of our common stock will not fluctuate or decline significantly in the future.
In addition to the risks listed in this “Risk Factors” section, a number of factors could negatively affect the share price of our common stock or result in fluctuations in the price or trading volume of shares of our common stock, including:
| | • | | the annual yield from distributions on shares of our common stock as compared to yields on other financial instruments; |
| | • | | equity issuances by us, or future sales of substantial amounts of shares of our common stock by our existing or future stockholders, or the perception that such issuances or future sales may occur; |
| | • | | increases in market interest rates or a decrease in our distributions to stockholders that lead purchasers of shares of our common stock to demand a higher yield; |
| | • | | changes in market valuations of similar companies; |
| | • | | fluctuations in stock market prices and volumes; |
| | • | | additions or departures of key management personnel; |
| | • | | our operating performance and the performance of other similar companies; |
| | • | | actual or anticipated differences in our quarterly operating results; |
| | • | | changes in expectations of future financial performance or changes in estimates of securities analysts; |
| | • | | publication of research reports about us or the self storage industry by securities analysts; |
| | • | | our failure to qualify as a REIT; |
| | • | | adverse market reaction to any indebtedness we incur in the future; |
| | • | | strategic decisions by us or our competitors, such as acquisitions, divestments, spin offs, joint ventures, strategic investments or changes in business strategy; |
| | • | | the passage of legislation or other regulatory developments that adversely affect us or the self storage industry; |
48
| | • | | speculation in the press or investment community; |
| | • | | changes in our actual or projected revenues, operating expenses and occupancy levels relating to our existing self storage properties; |
| | • | | failure to satisfy the listing requirements of the NYSE; |
| | • | | failure to comply with the requirements of the Sarbanes-Oxley Act; |
| | • | | actions by institutional stockholders; |
| | • | | changes in accounting principles; and |
| | • | | general market conditions, including factors unrelated to our performance. |
In the past, securities class action litigation has often been instituted against companies following periods of volatility in the price of their common stock. This type of litigation could result in substantial costs and divert our management’s attention and resources, which could have a material adverse effect on our cash flows, our ability to execute our business strategy and our ability to make distributions to our stockholders.
Broad market fluctuations could negatively impact the market price of shares of our common stock.
The stock market has recently experienced and may continue to experience extreme price and volume fluctuations that have affected the market price of many companies in industries similar or related to ours and that have been unrelated to these companies’ operating performances. The changes frequently appear to occur without regard to the operating performance of the affected companies. Hence, the price of our common stock could fluctuate based upon factors that have little or nothing to do with us in particular. These broad market fluctuations could reduce the market price of shares of our common stock. Furthermore, our operating results and prospects may be below the expectations of public market analysts and investors or may be lower than those of companies with comparable market capitalizations. Either of these factors could lead to a material decline in the per share trading price of our common stock.
Continued increases in market interest rates may result in a decrease in the value of shares of our common stock.
One of the factors that will influence the price of shares of our common stock will be the distribution yield on shares of our common stock (as a percentage of the price of shares of our common stock) relative to market interest rates. Market interest rates have recently increased, which may lead prospective purchasers of shares of our common stock to expect a higher distribution yield and higher interest rates have increased our borrowing costs and decreased funds available for distribution. Thus, continuing higher market interest rates could cause the per share trading price of our common stock to decrease.
Because we have a large number of stockholders and shares of our common stock have not been listed on a national securities exchange prior to this offering, there may be significant pent-up demand to sell shares of our common stock. Significant sales of shares of our common stock, or the perception that significant sales of such shares could occur, may cause the price of shares of our common stock to decline significantly.
As of , 2025, we had an aggregate of approximately million shares of our Class A common stock and Class T common stock issued and outstanding. Prior to this offering, our common stock was not listed on any national securities exchange and the ability of stockholders to liquidate their investments was limited. Additionally, our share redemption program, which, in any event, only allowed us to repurchase up to 5% of the weighted average number of shares of our common stock outstanding during the prior calendar year in any 12-month period, has been effectively suspended since August 2019, with only limited exceptions for death, qualifying disability, confinement to a long-term care facility or other exigent circumstances. On November 25, 2024, our Board approved the full suspension of the share redemption program. Further, our Class A common
49
stock and Class T common stock will not convert into shares of our listed common stock until the six-month anniversary of the listing of shares of our common stock for trading on a national securities exchange or such earlier date as approved by our Board and will remain subject to certain ownership and transfer restrictions contained in our charter until such conversion. As a result, there may be significant pent-up demand to sell shares of our common stock. A large volume of sales of shares of our common stock could decrease the prevailing market price of shares of our common stock and could impair our ability to raise additional capital through the sale of equity securities in the future. Even if a substantial number of sales of shares of our common stock are not effected, the mere perception of the possibility of these sales could depress the market price of shares of our common stock and have a negative effect on our ability to raise capital in the future.
Although shares of our Class A common stock and Class T common stock will not be listed on a national securities exchange following the closing of this offering, sales of such shares or the perception that such sales could occur could have a material adverse effect on the per share trading price of shares of our common stock.
As of , 2025, we had an aggregate of approximately million shares of our Class A common stock and Class T common stock issued and outstanding. Although shares of our Class A common stock and Class T common stock will not be listed on a national securities exchange, these shares are not subject to transfer restrictions (other than the restrictions on ownership and transfer of stock set forth in our charter); therefore, such stock will be freely tradable, to extent that a market exists for such stock. As a result, it is possible that a market may develop for shares of our Class A common stock and Class T common stock, and sales of such shares, or the perception that such sales could occur, could have a material adverse effect on the per share trading price of shares of our common stock.
Additionally, all of the shares of our Class A common stock and Class T common stock will convert automatically into common stock upon the six-month anniversary of the listing of shares of our common stock for trading on a national securities exchange, or earlier as approved by our Board. As a result, holders of shares of our Class A common stock and Class T common stock seeking to immediately liquidate their investment in our common stock could engage in immediate short sales of shares of our common stock prior to the date on which the shares of our Class A common stock and Class T common stock convert into shares of our common stock and use the shares of our common stock that they receive upon conversion of their Class A common stock and Class T common stock to cover these short sales in the future. Such short sales could depress the market price of shares of our common stock and limit the effectiveness of the six-month lock-up strategy for limiting the number of shares of our common stock held by our stockholders prior to this offering that may be sold shortly after this offering.
We may allocate the net proceeds from this offering in ways that you and other stockholders may not approve.
We intend to use a portion of the net proceeds received from this offering to redeem the Series A Convertible Preferred Stock, or Series A Preferred Stock, and pay off approximately $ million of our debt. We expect to use any remaining net proceeds to fund external growth with property acquisitions and for general corporate purposes. However, we have not yet committed to acquire any specific properties with the net proceeds from this offering, and you will be unable to evaluate the economic merits of such investments before making an investment decision to purchase shares of our common stock in this offering. We have broad authority to invest in real estate investments that we may identify in the future, and we may make investments with which you do not agree. In addition, our investment policies may be amended or revised from time to time without a vote of our stockholders. Our management could have broad discretion in the use of certain of the net proceeds from this offering and could spend the proceeds in ways that do not necessarily improve our operating results or enhance the value of shares of our common stock. These factors increase the uncertainty, and thus the risk, of an investment in shares of our common stock.
50
We may be unable to raise additional capital needed to grow our business.
We may not be able to increase our capital resources by engaging in additional debt or equity financings. Even if we complete such financings, they may not be on favorable terms, which could impair our growth and adversely affect our existing operations. Additionally, we may be required to accept terms that restrict our ability to incur additional indebtedness, take other actions including terms that require us to maintain specified liquidity, or other ratios that could otherwise not be in the best interests of our stockholders. Further, we and our directors and officers have agreed with the underwriters of this offering that, subject to limited exceptions, we and our directors and officers may not, directly or indirectly, without the prior written consent of the representatives on behalf of the underwriters, offer to sell, sell, contract to sell, pledge or otherwise dispose of any shares of our common stock or any securities convertible into, or exercisable or exchangeable for such common stock, or publicly announce an intention to effect any such transaction, for a period from the date hereof until 180 days after the date of this prospectus.
Future offerings of debt securities, which would be senior to our common stock, or equity securities, which would dilute our existing stockholders and may be senior to our common stock, may adversely affect our stockholders, and our stockholders’ interests in us will be diluted as we issue additional shares.
We may in the future attempt to increase our capital resources by offering debt or equity securities, including notes and classes of preferred or common stock. Debt securities or shares of preferred stock will generally be entitled to receive interest payments or distributions, both current and in connection with any liquidation or sale, prior to the holders of our common stock. We are not required to offer any such additional debt or equity securities to existing common stockholders on a preemptive basis. Therefore, offerings of common stock or other equity securities may dilute the holdings of our existing stockholders. Because we may generally issue any such debt or equity securities in the future without obtaining the consent of our stockholders, you will bear the risk of our future offerings reducing the market price of our common stock and diluting your proportionate ownership.
In addition, subject to any limitations set forth under Maryland law, our Board may amend our charter to increase or decrease the number of authorized shares of stock (currently 900,000,000 shares), or the number of shares of any class or series of stock designated, or reclassify any unissued shares into other classes or series of stock without the necessity of obtaining stockholder approval. All such shares may be issued in the discretion of our Board. In addition, we have granted, and expect to grant in the future, equity awards to our independent directors and certain of our employees, including our executive officers, which to date consist of our restricted stock and LTIP units, which are exchangeable into shares of our common stock subject to satisfaction of certain conditions. Finally, we have OP units outstanding which are exchangeable into shares of our Class A common stock under certain circumstances.
Therefore, existing stockholders will experience dilution of their equity investment in us as we (1) sell additional shares in the future, (2) sell securities that are convertible into shares of our common stock, (3) issue shares of our common stock in a private offering of securities, (4) issue restricted shares of our common stock, LTIP units or other equity-based securities to our independent directors and executive officers, or (5) issue shares of our common stock in a merger or to sellers of properties acquired by us in connection with an exchange of OP units.
Because the OP units may, in the discretion of our Board, be exchanged for shares of our common stock, any merger, exchange or conversion between our operating partnership and another entity ultimately could result in the issuance of a substantial number of shares of our common stock, thereby diluting the percentage ownership interest of other stockholders. Because of these and other reasons, our stockholders may experience substantial dilution in their percentage ownership of our stock.
51
We have paid, and may continue to pay, distributions from sources other than cash flow from operations; therefore, we will have fewer funds available for the acquisition of properties, and our stockholders’ overall return may be reduced.
We have paid all or a portion of distributions from sources other than cash flow from operations in the past and are not prohibited from doing so again in the future. In the future we may borrow funds, issue additional securities, or sell assets in order to fund our distributions. We are not prohibited from undertaking such activities by our charter, bylaws or investment policies, and we may use an unlimited amount from any source to pay our distributions. If we fund distributions from financings, then such financings will need to be repaid, and if we fund distributions from sources other than cash flow from operations, then we will have fewer funds available for acquisition of properties or working capital, which may affect our ability to generate future cash flows from operations and may reduce our stockholders’ overall returns. Additionally, to the extent distributions exceed cash flow from operations, a stockholder’s basis in our stock may be reduced and, to the extent distributions exceed a stockholder’s basis, the stockholder may recognize a capital gain.
Our distributions to stockholders may change, which could adversely affect the market price of shares of our common stock.
All distributions will be at the sole discretion of our Board and will depend upon our actual and projected financial condition, results of operations, cash flows, liquidity and FFO, as adjusted, maintenance of our REIT qualification and such other matters as our Board may deem relevant from time to time. We intend to evaluate distributions on a regular basis, and it is possible that stockholders may not receive distributions equivalent to those previously paid by us for various reasons, including the following: we may not have enough cash to pay such distributions due to changes in our cash requirements, indebtedness, capital spending plans, operating cash flows, or financial position; decisions on whether, when, and in what amounts to make any future distributions will remain at all times entirely at the discretion of the Board, which reserves the right to change our distribution practices at any time and for any reason; our Board may elect to retain cash for investment purposes, working capital reserves or other purposes, or to maintain or improve our credit ratings; and the amount of distributions that our subsidiaries may distribute to us may be subject to restrictions imposed by state law, state regulators, and/or the terms of any current or future indebtedness that these subsidiaries may incur. Stockholders have no contractual or other legal right to distributions that have not been authorized by the Board and declared by us. We cannot assure our stockholders that we will be able to pay or maintain distributions or that distributions will increase over time, nor can we give any assurance that rents from the properties will increase, that the properties we buy will increase in value or provide constant or increased distributions over time, or that future acquisitions of real properties will increase our cash available for distribution to stockholders. We may need to fund such distributions from external sources, as to which no assurances can be given. In addition, as noted above, we may choose to retain operating cash flow, and these retained funds, although increasing the value of our underlying assets, may not correspondingly increase the market price of shares of our common stock. Our failure to meet the market’s expectations with regard to future cash distributions likely would adversely affect the market price of shares of our common stock.
The underwriters of this offering may waive or release parties to the lock-up agreements entered into in connection with this offering, which could adversely affect the market price of our common stock.
We, all of our directors that will own equity in us following the completion of this offering, and all of our executive officers have entered or will enter into lock-up agreements pursuant to which we and they will be subject to certain restrictions with respect to the sale or other disposition of shares of our common stock for a period of 180 days following the date of this prospectus. The underwriters, at any time and without notice, may release all or any portion of the shares of common stock subject to the foregoing lock-up agreements. See “Underwriting” for more information on these agreements. If the restrictions under the lock-up agreements are waived, then the shares of common stock, subject to compliance with the Securities Act or exceptions therefrom, will be available for sale into the public markets, which could cause the market price of shares of our common stock to decline and impair our ability to raise capital.
52
If we fail to maintain an effective system of internal control over financial reporting and disclosure controls, we may not be able to accurately and timely report our financial results.
Effective internal control over financial reporting and disclosure controls are necessary for us to provide reliable financial reports, effectively prevent fraud, and to operate successfully as a public company. If we cannot provide reliable financial reports or prevent fraud, our reputation and operating results would be harmed. We are currently required to perform system and process evaluation and testing of our internal control over financial reporting to allow management to report on the effectiveness of our internal control over financial reporting, and, if the offering is successfully completed and we become an accelerated filer or large accelerated filer, we will be required to have our independent registered public accounting firm attest to the same, as required by Section 404 of the Sarbanes-Oxley Act of 2002. To date, the audit of our consolidated financial statements by our independent registered public accounting firm has included a consideration of internal control over financial reporting as a basis of designing their audit procedures, but not for the purpose of expressing an opinion (as will be required pursuant to Section 404(b) of the Sarbanes-Oxley Act of 2002) on the effectiveness of our internal control over financial reporting. If a material weakness or significant deficiency was to be identified in our internal control over financial reporting, we may also identify deficiencies in some of our disclosure controls and procedures that we believe require remediation. If we or our independent registered public accounting firm discover weaknesses, we will make efforts to improve our internal control over financial reporting and disclosure controls. However, there is no assurance that we will be successful. Any failure to maintain effective controls or timely effect any necessary improvement of our internal control over financial reporting and disclosure controls could harm operating results or cause us to fail to meet our reporting obligations, which could affect the listing of our common stock on NYSE. Ineffective internal control over financial reporting and disclosure controls could also cause investors to lose confidence in our reported financial information, which would likely have a negative effect on the per share trading price of our common stock.
We have no operating history as a publicly traded company and may not be able to successfully operate as a publicly traded company.
We have no operating history as a publicly traded company. We cannot assure you that the past experience of our senior management team will be sufficient for us to successfully operate as a publicly traded company. Upon completion of this offering, we will be required to comply with NYSE listing standards, and this transition could place a significant strain on our management systems, infrastructure and other resources. Failure to operate successfully as a publicly traded company would have an adverse effect on our financial condition, results of operations, cash flow and per share trading price of our common stock.
In addition to the underwriting discounts and commissions to be received by the underwriters, they may receive other benefits from this offering.
In addition to the underwriting discounts and commissions to be received by the underwriters, certain of the underwriters and/or their respective affiliates are lenders under our 2024 Credit Facility and our Acquisition Facility, and we intend to use a portion of the net proceeds from this offering to repay amounts outstanding under the 2024 Credit Facility and also to repay in full our Acquisition Facility, which relationship and intended use of proceeds may present a conflict of interest on the part of such underwriters and/or their respective affiliates with respect to their involvement in this offering. Additionally, the underwriters and/or their affiliates may engage in commercial and investment banking transactions with us and/or our affiliates in the ordinary course of their business. They expect to receive customary compensation and expense reimbursement for these commercial and investment banking transactions.
If securities or industry analysts do not publish research or publish unfavorable research about our business, our stock price and trading volume could decline.
The trading market for our common stock will be influenced by the research and reports that industry or securities analysts publish about us or our business. If one or more of these analysts ceases coverage of our
53
company or fails to publish reports on us regularly, we could lose visibility in the financial markets, which in turn could cause our stock price or trading volume to decline. Moreover, if our operating results do not meet the expectations of the investor community, one or more of the analysts who cover our company may change their recommendations regarding our company, and our stock price could decline.
54
CAUTIONARY STATEMENT CONCERNING FORWARD LOOKING STATEMENTS
Certain statements contained in this prospectus, other than historical facts, may be considered forward-looking statements within the meaning of the Section 27A of the Securities Act, Section 21E of the Exchange Act, and the Private Securities Litigation Reform Act of 1995 (collectively with the Securities Act and Exchange Act, the “Acts”). We intend for all such forward-looking statements to be covered by the applicable safe harbor provisions for forward-looking statements contained in the Acts. Such forward-looking statements generally can be identified by the use of forward-looking terminology such as “may,” “will,” “can,” “expect,” “intend,” “anticipate,” “estimate,” “believe,” “continue,” “possible,” “seek,” “objective,” “goal,” “strategy,” “plan,” “potential,” “projected,” “future,” “long-term,” “should,” “could,” “would,” “might,” “uncertainty,” or other similar words.
Any such forward-looking statements are based on current expectations, estimates and projections about the industry and markets in which we operate, and beliefs of, and assumptions made by, our management and involve uncertainties that could significantly affect our financial results. Such statements include, but are not limited to: (i) statements about our plans, strategies, initiatives, and prospects; and (ii) statements about our future results of operations, capital expenditures, and liquidity. Such statements are subject to known and unknown risks and uncertainties, which could cause actual results to differ materially from those projected or anticipated, including, without limitation:
| | • | | changes in international, national, regional, or local economic markets; |
| | • | | the effects of global geopolitical events, including pandemics and military conflicts, on general economic conditions; |
| | • | | use of proceeds of this offering; |
| | • | | our business and investment strategy; |
| | • | | the acquisition of properties, including the timing of acquisitions; |
| | • | | our operating performance and projected operating results, including our ability to achieve market rents and occupancy levels, reduce operating expenditures and increase the sale of ancillary products and services; |
| | • | | changes in the value of our assets; |
| | • | | projected capital expenditures; |
| | • | | damage to our properties from catastrophic weather and other natural events, and the physical effects of climate change; |
| | • | | our ability to pay down, refinance, restructure, or extend our indebtedness as it becomes due; |
| | • | | increases in our borrowing costs as a result of changes in interest rates and other factors; |
| | • | | general volatility of the securities markets in which we participate; |
| | • | | the impact of technology on our products, operations, and business; |
| | • | | our ability to qualify, and maintain our qualification, as a REIT for U.S. federal income tax purposes; |
| | • | | changes in tax, real estate, environmental, and zoning laws; |
| | • | | information technology security breaches; |
| | • | | loss of key executives; |
| | • | | availability of qualified personnel; and |
55
| | • | | additional factors described in this prospectus under the headings “Prospectus Summary,” “Risk Factors,” “Management’s Discussion and Analysis of Financial Condition and Results of Operations” and “Our Business and Self Storage Properties.” |
Should one or more of the risks or uncertainties described above or elsewhere in this prospectus occur, or should underlying assumptions prove incorrect, actual results and plans could differ materially from those expressed in any forward-looking statements. You are cautioned not to place undue reliance on these statements, which speak only as of the date of this prospectus.
All forward-looking statements, expressed or implied, included in this prospectus are expressly qualified in their entirety by this cautionary statement. This cautionary statement should also be considered in connection with any subsequent written or oral forward-looking statements that we or persons acting on our behalf may issue.
Except as required by law, we do not undertake any obligation to update or revise any forward-looking statements contained in this prospectus.
56
USE OF PROCEEDS
We estimate that the net proceeds we will receive from this offering, after deducting the underwriting discount and our estimated offering expenses, will be approximately $ (or approximately $ if the underwriters exercise their option to purchase additional shares in full), assuming a public offering price of $ per share, which is the midpoint of the price range set forth on the front cover of this prospectus.
We will contribute the net proceeds from this offering to our operating partnership in exchange for OP units. We expect our operating partnership to use the net proceeds received from us to:
| | • | | redeem 100% of the issued and outstanding Series A Preferred Stock in an amount equal to $ , which is equal to the value per share the holder of the Series A Preferred Stock would receive upon our initial listing if it had converted such shares of Series A Preferred Stock into common stock (based on a conversion price of $10.66 per share) immediately prior to our initial listing and sold such shares at the initial listing price; |
| | • | | pay approximately $ million on indebtedness, including (i) the 2024 Credit Facility maturing in February 2027, subject to a one-year extension to February 2028 at our election, which currently bears interest at SOFR plus % and is fully prepayable without penalty, (ii) the Acquisition Facility, and (iii) and other debt subject to near-term maturities; |
| | • | | fund external growth with property acquisitions; and |
| | • | | fund other general corporate uses. |
Pending the permanent use of the net proceeds from this offering, we intend to invest the net proceeds in interest-bearing, short-term investment-grade securities, money-market accounts or other investments that are consistent with our intention to qualify for taxation as a REIT for U.S. federal income tax purposes.
Certain of the underwriters and/or their respective affiliates are lenders under our 2024 Credit Facility and the Acquisition Facility, and we intend to use a portion of the net proceeds from this offering used to repay amounts outstanding under the 2024 Credit Facility. See “Underwriting—Other Relationships.”
57
DISTRIBUTION POLICY
We elected to be taxed as a REIT for U.S. federal income tax purposes commencing with our taxable year ended December 31, 2014. As a REIT, we have made, and intend to continue to make, distributions each taxable year equal to at least 90% of our REIT taxable income (excluding capital gains and computed without regard to the dividends paid deduction). Since our inception, through September 30, 2024, we have made an aggregate of approximately $362.3 million of distributions to our common stockholders. On November 21, 2024, our Board declared a monthly distribution to our common stockholders of record as of December 31, 2024 at the rate of $0.0508 per share, or $0.60 annualized. Purchasers of shares of common stock in this offering will not receive the distribution payable , 2025 on such shares.
We intend to make distributions to holders of our common stock offered in this offering, when, as and if authorized by our Board out of legally available funds, based on a distribution rate of $ per share of common stock beginning immediately following this offering. On an annualized basis, this would be $ per share of common stock, or an annualized distribution rate of % based on the public offering price of $ per share, which is the midpoint of the price range set forth on the front cover of this prospectus. We estimate that this annual distribution rate will represent approximately % of our estimated cash available for distribution to stockholders for the 12 months ending September 30, 2025, assuming that the underwriters do not exercise their option to purchase up to an additional shares. We do not intend to reduce the annualized distribution per share of common stock if the underwriters exercise their option to purchase additional shares. Our intended annual distribution rate has been established based on our estimate of cash available for distribution for the 12 months ending September 30, 2025, which we have calculated based on adjustments to our net income for the 12 months ended September 30, 2024. This estimate was based on our historical operating results and does not take into account our long-term business and growth strategies, nor does it take into account any unanticipated expenditures we may have to make or any financings for such expenditures. In estimating our cash available for distribution for the 12 months ending September 30, 2025, we have made certain assumptions as reflected in the table and footnotes below.
Our estimate of cash available for distribution does not include the effect of any changes in our working capital resulting from changes in our working capital accounts. It also does not reflect the amount of cash estimated to be used for investing activities, financing activities or other activities, other than estimates of recurring and non-recurring capital expenditures, joint venture funding, and scheduled principal payments on debt. Any such investing and/or financing activities may have a material and adverse effect on our estimate of cash available for distribution. Because we have made the assumptions described herein in estimating cash available for distribution, we do not intend this estimate to be a projection or forecast of our actual results of operations, FFO, FFO, as adjusted, liquidity or financial condition, and we have estimated cash available for distribution for the sole purpose of determining our estimated annual distribution amount. Our estimate of cash available for distribution should not be considered as an alternative to cash flow from operating activities (computed in accordance with GAAP) or as an indicator of our liquidity or our ability to make distributions. In addition, the methodology upon which we made the adjustments described herein is not necessarily intended to be a basis for determining future distributions.
We intend to maintain or increase our distribution rate for the 12 months following the completion of this offering unless our results of operations, FFO, FFO, as adjusted, liquidity, cash flows, financial condition, prospects, economic conditions or other factors differ materially from the assumptions used in projecting our distribution rate. We believe that our estimate of cash available for distribution constitutes a reasonable basis for setting the distribution rate. However, we cannot assure you that our estimate will prove accurate, and actual distributions may therefore be significantly below the expected distributions. Our actual results of operations will be affected by several factors, including the revenue received from our properties, our operating expenses, interest expense and unanticipated capital expenditures. We may, from time to time, be required, or elect, to borrow under our 2024 Credit Facility or otherwise to pay distributions.
58
We cannot assure you that our estimated distributions will be made or sustained or that our Board will not change our distribution policy in the future. Any distributions will be at the sole discretion of our Board, and their form, timing and amount, if any, will depend upon a number of factors, including our actual and projected results of operations, FFO, FFO, as adjusted, liquidity, cash flows and financial condition, the revenue we actually receive from our properties, our operating expenses, our debt service requirements, our capital expenditures, prohibitions and other limitations under our financing arrangements, our REIT taxable income, the annual REIT distribution requirements, applicable law, including restrictions on distributions under Maryland law, and such other factors as our Board deems relevant. For more information regarding risk factors that could materially and adversely affect us and our ability to make cash distributions, see “Risk Factors.” If our operations do not generate sufficient cash flow to enable us to pay our intended or required distributions, we may be required to fund distributions from working capital, borrow or raise equity, or reduce such distributions. In addition, our charter allows us to issue preferred stock that could have a preference on distributions and could limit our ability to make distributions to our stockholders. Additionally, under certain circumstances, agreements relating to our indebtedness could limit our ability to make distributions to our stockholders.
Federal income tax law requires that a REIT distribute annually at least 90% of its REIT taxable income (excluding capital gains and computed without regard to the dividends paid deduction) and that it pay tax at the corporate rate to the extent that it annually distributes less than 100% of its REIT taxable income (including capital gains and computed without regard to the dividends paid deduction). In addition, a REIT will be required to pay a 4% nondeductible excise tax on the amount, if any, by which the distributions it makes in a calendar year are less than the sum of 85% of its ordinary income, 95% of its capital gain net income and 100% of its undistributed income from prior years. For more information, see “Federal Income Tax Considerations.” We anticipate that our estimated cash available for distribution will be sufficient to enable us to meet the annual distribution requirements applicable to REITs and to avoid or minimize the imposition of corporate and excise taxes.
However, under some circumstances, we may be required to make distributions in excess of cash available for distribution in order to meet these distribution requirements or to avoid or minimize the imposition of tax and we may need to borrow funds to make certain distributions.
The following table sets forth calculations relating to the estimated initial distribution after this offering based on our net income for the 12 months ended September 30, 2024 and is provided solely for the purpose of illustrating the estimated initial distribution after this offering and is not intended to be a basis for future distributions (amounts presented in thousands, except per share data).
| | | | |
Net income for the year ended December 31, 2023 | | | | |
Less: Net income for the nine months ended September 30, 2023 | | | | |
Add: Net loss for the nine months ended September 30, 2024 | | | | |
| | | | |
Net loss for the 12 months ended September 30, 2024 | | | | |
Add: Depreciation and amortization | | | | |
Add: Hurricane Helene related charges | | | | |
Add: Net adjustment related to equity method investments (1) | | | | |
Add: Non-cash equity based compensation expense (2) | | | | |
Add: Amortization of debt issuance costs (3) | | | | |
Add: Acquisition activity (4) | | | | |
Add: Existing portfolio expansion activity (5) | | | | |
Add: Managed REIT platform adjustments (6) | | | | |
Add: Non-cash Sponsor funding income reduction (7) | | | | |
Add: Estimated net change in general and administrative expenses (8) | | | | |
Add: Interest expense associated with repayment of debt (9) | | | | |
59
| | | | |
Add: Interest expense associated with changes in borrowing costs (10) | | | | |
Add: Estimated incremental impact of in-place leases (11) | | | | |
Add: Estimated incremental impact of contractual rent from rate increases (12) | | | | |
Add: Estimated savings from solar installations (13) | | | | |
Add: Estimated incremental impact of revenue adjustments related to joint venture entities (14) | | | | |
| | | | |
Estimated cash flow from operating activities for the 12 months ending September 30, 2025 | | | | |
| | | | |
Less: Estimated provision for recurring capital expenditures (15) | | | | |
Less: Estimated provision for non-recurring capital expenditures (16) | | | | |
Less: Unconsolidated joint venture funding (17) | | | | |
Less: Scheduled principal payments on debt (18) | | | | |
Estimated cash available for distribution for the 12 months ending September 30, 2025 (19) | | | | |
| | | | |
Non-controlling interests’ share of estimated cash available for distribution | | | | |
Common stockholders’ share of estimated cash available for distribution | | | | |
Total estimated initial annual distribution to our common stockholders (20) | | | | |
| | | | |
Estimated initial annual distribution per share of common equity and non-controlling interests | | | | |
Payout ratio (21) | | | | |
| (1) | | Represents the elimination of non-cash net loss related to equity method investments, net of cash distributions received on such investments. |
| (2) | | Represents the elimination of non-cash equity-based compensation expense related to equity-based awards. |
| (3) | | Represents the elimination of non-cash charges related to amortization of debt issuance costs. |
| (4) | | Represents the estimated contribution to cash available for distribution for the 12 months ending September 30, 2025 from (i) property acquisitions that were consummated during the 12 months ended September 30, 2024 and were therefore not fully reflected in our operating results for the full 12 month period, representing approximately $ , and (ii) property acquisitions that (a) were consummated after September 30, 2024, representing approximately $ , and (b) are subject to executed purchase and sale agreements prior to the date of this prospectus and are scheduled to be consummated during the 12 months ending September 30, 2025, representing approximately $ . |
| (5) | | Represents the estimated incremental contribution to cash available for distribution from adding an aggregate of approximately 65,500 net rentable square feet at three of our Ohio properties, all of which are expected to be fully open by December 31, 2024. The aggregate incremental investment made to expand those sites is estimated at $6.3 million, and as of September 30, 2024, we estimate a remaining aggregate cost to complete of $ million. |
| (6) | | Represents our adjustment to annualize the incremental property management, advisory and tenant protection program revenues from the Managed REITs less Managed REIT Platform expenses for the 12 months ended September 30, 2025 based on their current assets under management as of September 30, 2024. |
| (7) | | Pursuant to our sponsor funding agreement, we fund the payment of the front-end sales load for the sale of SST VI’s Class Y and Class Z shares sold in their offering. In exchange, we receive Series C convertible units in SST VI’s operating partnership equal to the dollar amount of such funding divided by the then-current offering price for such Class Y and Z shares. The Series C units are subordinated such that we are not entitled to distribution, voting or other rights to participate in SST VI’s operating partnership, unless and until such units are converted into Class A units of SST VI’s operating partnership. The amount by which our funding exceeds the fair value of the Series C units received is accounted for as a payment to a customer and is therefore recorded as a reduction to the transaction price for the services we provide to such customer. Each payment is initially included in the Other assets line-item in our consolidated balance sheet |
60
| | and subsequently recorded as a reduction of Managed REIT Platform revenues ratably over the remaining estimated life of our management contracts with SST VI. This adjustment eliminates such non-cash reduction to our net income in the operating section of the above table based upon the historical amounts incurred for the period ended September 30, 2024. The portion of the funding associated with the fair value of the Series C units is recorded as the purchase of an equity method investment. Future payments pursuant to such sponsor funding agreement have not been deducted in the table above as the payments represent working capital amounts and other investments. |
| (8) | | Reflects the estimated net changes in general and administrative expenses for the 12 months ended September 30, 2025 relative to the 12 months ended September 30, 2024. Included in this adjustment is the removal of approximately $ million of expenses related to this offering. Furthermore, this adjustment reflects changes to certain expenses, such as, but not limited to, increased public company compliance costs and increased director and officer insurance, offset by decreased transfer agent fees. |
| (9) | | Reflects the reduction in interest expense associated with the repayment of a portion of our 2024 Credit Facility with the net proceeds of this offering. |
| (10) | | Reflects the reduction to interest expense associated with changes in our borrowing costs under the 2032 Private Placement Notes (a reduction in rate as we decrease leverage with the net proceeds of this offering) and the 2024 Credit Facility (a reduction in borrowing spread as we progress to our goal of becoming a fully unsecured borrower). |
| (11) | | Represents the estimated incremental rent for the 12 months ended September 30, 2025 based on current contractual rents due under in-place leases across all of our wholly-owned properties as of September 30, 2024. |
| (12) | | Represents estimated incremental contractual rent from rate increases that have been issued to customers at our wholly-owned properties with effective dates of and , net of the impact of estimated attrition associated with such rent rate increases based on historical company attrition rates over the trailing 12 months. |
| (13) | | Reflects the full-year impact of expense savings associated with the installation and operation of solar panels at various wholly-owned properties during the 12 months ended September 30, 2024. Furthermore, reflects estimated partial-year impact of expense savings expected to be recognized during the 12 months ending September 30, 2025 on solar projects that are expected to be operational before September 30, 2025. |
| (14) | | Reflects the estimated incremental impact to unconsolidated joint venture entities from in-place leases, contractual rent from rate increases and savings from solar installations based on the same adjustment methodology described in notes 11 and 12 above. |
| (15) | | Reflects estimated cash outflows for recurring capital expenditures anticipated over the 12 months ending September 30, 2025. The calculation is based on management’s internal cost estimates of $ per square foot for recurring property related capital expenditures multiplied by our net rentable square feet as of September 30, 2024. Recurring property-related capital expenditures are costs to maintain the properties, including new roofs, roof maintenance, paving of parking lots and other general upkeep items. We have also included an estimate of recurring corporate capital expenditures of $ million, which primarily represent costs related to computer, software and equipment. The adjustment for recurring corporate capital expenditures was estimated based on a historical annual average of our corporate capital expenditures. |
| (16) | | Reflects estimated cash outflows for non-recurring capital expenditures anticipated over the 12 months ending September 30, 2025. Non-recurring capital expenditures primarily consists of property expansions and solar initiatives. |
| (17) | | Reflects estimated cash outflows for SmartStop’s funding our 50% share of the development and construction of the SmartCentres unconsolidated joint venture properties, net of expected debt financing. |
| (18) | | Represents recurring amortizing principal payments of mortgage loan principal due during the 12 months ending September 30, 2025. |
| (19) | | Represents the estimated cash available for distribution for the 12 months ending September 30, 2025 that is attributable to common stockholders and non-controlling interests. Allocation to common stockholders and non-controlling interests are based on an estimated ownership of the company of approximately % and %, respectively. |
| (20) | | Based on a total of shares of our common stock and OP units to be outstanding after this offering (assuming that the underwriters do not exercise their option to purchase up to an additional shares |
61
| | to cover overallotments, if any). If the underwriters exercise their overallotment option in full, (i) a total of shares of our common stock would be outstanding after this offering and (ii) the total estimated initial annual distribution to our stockholders and to holders of OP units would increase to approximately $ million, approximately $ million of which would be attributable to the estimated initial annual distribution to our stockholders. |
| (21) | | Calculated as total estimated initial annual distribution to our stockholders divided by our stockholders’ share of estimated cash available for distribution for the 12 months ending September 30, 2025. If the underwriters exercise in full their option to purchase additional shares, our total estimated initial annual distribution would be $ million and our payout ratio would be %. |
62
CAPITALIZATION
The following table sets forth our capitalization as of September 30, 2024:
| | • | | on a historical basis; and |
| | • | | on an as adjusted basis to give effect to (i) the issuance by us of shares of common stock in this offering (assuming that the underwriters do not exercise their option to purchase up to an additional shares) at the public offering price of $ per share, which is the midpoint of the price range set forth on the front cover of this prospectus, (ii) the Listing Equity Grants, and (iii) the use of the net proceeds from this offering as set forth in “Use of Proceeds.” |
You should read this table together with “Use of Proceeds,” “Summary Selected Consolidated Historical Financial and Operating Data,” “Management’s Discussion and Analysis of Financial Condition and Results of Operations” and our consolidated financial statements and notes thereto included elsewhere in this prospectus.
| | | | | | | | |
| | | As of September 30,
2024(6) | |
| | | Historical | | | As Adjusted | |
Cash, cash equivalents and restricted cash | | | | | | | | |
Cash and cash equivalents | | $ | 36,701 | | | $ | | |
Restricted cash | | | 8,337 | | | | | |
| | | | | | | | |
Total cash, cash equivalents and restricted cash | | $ | 45,038 | | | $ | | |
| | | | | | | | |
Debt | | | | | | | | |
KeyBank Bridge Loan | | $ | 5,000 | | | | | |
KeyBank CMBS Loan | | $ | 89,702 | | | | | |
Ladera Office Loan | | | 3,761 | | | | | |
2024 Credit Facility | | | 603,881 | | | | | |
2027 NBC Loan | | | 54,896 | | | | | |
KeyBank Florida CMBS Loan | | | 50,131 | | | | | |
2028 Canadian Term Loan | | | 81,378 | | | | | |
CMBS Loan | | | 104,000 | | | | | |
SST IV CMBS Loan | | | 40,500 | | | | | |
2032 Private Placement Notes | | | 150,000 | | | | | |
| | | | | | | | |
Total Debt | | $ | 1,183,249 | | | $ | | |
| | | | | | | | |
Redeemable common stock(5) | | | 58,356 | | | | | |
Series A Convertible Preferred Stock, $0.001 par value; 200,000 shares authorized; 200,000 shares issued and outstanding, with aggregate liquidation preferences of $203,142 at September 30, 2024(1) | | | 196,356 | | | | — | |
Equity | | | | | | | | |
Class A common stock, $0.001 par value; 350,000,000 shares authorized; 88,477,687 shares issued and outstanding at September 30, 2024(2)(3) | | | 89 | | | | | |
Class T common stock, $0.001 par value; 350,000,000 shares authorized; 8,144,385 shares issued and outstanding at September 30, 2024(2)(3) | | | 8 | | | | | |
Common stock, $0.001 par value per share | | | — | | | | | |
Additional paid-in capital(2) | | | 894,960 | | | | | |
Distributions | | | (367,640 | ) | | | | |
Accumulated deficit | | | (181,958 | ) | | | | |
Accumulated other comprehensive income | | | (1,583 | ) | | | | |
| | | | | | | | |
Total stockholders’ equity | | | 343,876 | | | | | |
Noncontrolling interests in our operating partnership(4) | | | 87,432 | | | | | |
Other noncontrolling interests | | | 356 | | | | | |
| | | | | | | | |
Total noncontrolling interests | | | 87,788 | | | | | |
| | | | | | | | |
Total equity | | | 431,664 | | | | | |
| | | | | | | | |
Total capitalization | | $ | 1,869,625 | | | $ | | |
| | | | | | | | |
63
| (1) | | All of the issued and outstanding shares of the Series A Preferred Stock will be redeemed with the proceeds of this offering. See “Use of Proceeds.” |
| (2) | | Excludes shares of common stock or LTIP units available for future issuance under the Incentive Plan. |
| (3) | | Includes shares of unvested time-based restricted stock and shares of stock underlying unvested performance-based restricted stock awards (such number of shares assumes that we issue shares of common stock underlying such unvested performance-based restricted stock awards at target levels for the performance conditions that have not yet been achieved; to the extent that performance conditions do not meet the specified levels, the actual number of shares issued could be more or less than the amount reflected above). |
| (4) | | As adjusted includes unvested time-based LTIP units. Historical and as adjusted exclude (x) OP units held directly or indirectly by us, and (y) unvested performance-based LTIP units (such number of LTIP units assumes that such unvested performance-based awards vest at maximum levels for the performance conditions that have not yet been achieved; to the extent that performance conditions do not meet maximum levels, the actual number of LTIP units which vest under those awards could be less than the amount reflected above). |
| | | OP units are redeemable for cash or, at our election, shares of our common stock on a one-for-one basis, subject to adjustment in certain circumstances. For purposes of the foregoing, LTIP units are long-term equity incentive awards in the form of limited partnership units of the operating partnership, that vest over time or based on performance. Upon the occurrence of certain events described in the operating partnership agreement, LTIP units may convert into an equal number of OP units. |
| (5) | | Redeemable Common Stock represents common stock that is redeemable at the option of the holder, pursuant to the terms of our share redemption program. As such redemption is outside our control, accounting guidance considers this equity to be temporary equity and requires it to be presented as redeemable common stock. Upon the termination of our share redemption program, such amount would no longer be redeemable and this balance will be re-classified to additional paid-in capital. |
| (6) | | Amounts are represented in thousands, except share and per share data. |
64
DILUTION
If you invest in shares of our common stock, your interest will be diluted immediately to the extent of the difference between the public offering price per share you will pay in this offering and the net tangible book value per share of our common stock immediately after this offering. References to “common stock” in this section include our common stock being offered in this offering as well as our Class A common stock and Class T common stock, collectively.
Our net tangible book value as of September 30, 2024 was approximately $402.2 million, or $4.16 per share. Net tangible book value per share represents the amount of our total tangible assets minus total tangible liabilities, divided by the total number of shares of our common stock outstanding as of September 30, 2024.
After giving further effect to the issuance and sale of shares of common stock in this offering at an assumed public offering price of $ per share, which is the midpoint of the price range set forth on the front cover of this prospectus, and after deducting the underwriting discount and our estimated offering expenses, our pro forma as adjusted net tangible book value as of September 30, 2024 would have been approximately $ , or $ per share. This represents an immediate decrease in pro forma net tangible book value of $ per share and an immediate dilution of $ per share to new investors. The following table illustrates this calculation on a per share basis:
| | | | |
Assumed public offering price per share of our common stock | | $ | | |
Net tangible book value per share of our common stock as of September 30, 2024 | | | | |
per share attributable to this offering | | | | |
Pro forma as adjusted net tangible book value per share of our common stock after this offering | | | | |
| | | | |
Dilution per share to new investors | | $ | | |
| | | | |
If the underwriters exercise their option to purchase additional shares in full, our pro forma as adjusted net tangible book value will be $ per share, representing a decrease to existing holders of $ per share, and an immediate dilution of $ per share to new investors.
The table and calculations above are based on shares of our common stock outstanding as of September 30, 2024 on an actual basis and exclude:
| | • | | shares of common stock or LTIP units available for future issuance under the Incentive Plan as of September 30, 2024; and |
| | • | | (i) unvested time-based LTIP units, (ii) OP units held directly or indirectly by us, and (iii) unvested performance-based LTIP units (such number of LTIP units assumes that such unvested performance-based awards vest at maximum levels for the performance conditions that have not yet been achieved; to the extent that performance conditions do not meet maximum levels, the actual number of LTIP units which vest under those awards could be less than the amount reflected above). |
65
MANAGEMENT’S DISCUSSION AND ANALYSIS OF FINANCIAL CONDITION AND RESULTS OF OPERATIONS
This prospectus contains forward-looking statements that involve risks and uncertainties. Our actual results could differ materially from those anticipated in forward-looking statements for many reasons, including the risks described in “Risk Factors” and elsewhere in this prospectus. You should read the following discussion with “Cautionary Statement Concerning Forward-Looking Statements,” “Our Business and Self Storage Properties” and the financial statements and related notes included elsewhere in this prospectus.
Overview
We are a self-managed and fully-integrated self storage REIT. Our year end is December 31. As used herein, “we,” “us,” “our,” and “Company” refer to SmartStop and each of our subsidiaries.
We focus on the acquisition, ownership, and operation of self storage properties located primarily within the top 100 MSAs throughout the United States and the GTA in Canada. According to the Inside Self Storage Top- Operators List ranking for 2024, we are the tenth largest owner and operator of self storage properties in the United States based on number of properties, units, and rentable square footage. As of September 30, 2024, our wholly owned portfolio consisted of 157 operating self storage properties, diversified across 19 states and Ontario, Canada comprising approximately 106,300 units and 12.1 million net rentable square feet. Additionally, we owned a 50% equity interest in 11 unconsolidated real estate ventures located in the GTA, which consisted of 10 operating self storage properties, and one single tenant industrial building, which we plan to convert into a self storage property over the long term. Further, through our Managed REIT platform, we serve as the sponsor of two Managed REITs: SST VI and SSGT III, which pay us fees to manage these programs and manage their 34 operating self storage properties as of September 30, 2024.
Our primary business model is focused on owning and operating high quality self storage properties in high growth markets in the United States and Canada. We finance our portfolio through a diverse capital strategy which includes cash generated from operations, borrowings under our syndicated revolving line of credit, secured debt financing, equity offerings and joint ventures. Our business model is designed to maximize cash flow available for distribution to our stockholders and to achieve sustainable long-term growth in cash flow in order to maximize long- term stockholder value at acceptable levels of risk. We execute our organic growth strategy by pursuing revenue- optimizing and expense-minimizing opportunities in the operations of our existing portfolio. We execute our external growth strategy by developing, redeveloping, acquiring and managing self storage facilities in the United States and Canada both internally and through our Managed REITs, and we look to acquire properties that are physically stabilized, recently developed, in various stages of lease-up or at certificate of occupancy. We seek to acquire undermanaged facilities that are not operated by institutional operators, where we can implement our proprietary management and technology to maximize net operating income.
As discussed herein, we, through our subsidiaries, currently serve as the sponsor of SST VI and SSGT III. We also served as the sponsor of SST IV through March 17, 2021 and SSGT II through June 1, 2022 (SST VI, SSGT III, and prior to March 17, 2021, SST IV, and prior to June 1, 2022, SSGT II, the “Managed REITs”), and operate the properties owned by the Managed REITs, which together with one other self storage property we manage consist of, as of September 30, 2024, 35 operating properties and contain approximately 27,500 units and 3.0 million rentable square feet. In addition, we have the internal capability to originate, structure and manage additional self storage investment programs through our Managed REIT platform, which would be sponsored by SmartStop REIT Advisors, LLC (“SRA”), our indirect subsidiary. Through the Managed REIT platform, we generate asset management fees, property management fees, acquisition fees, and other fees, and also receive substantially all of the tenant protection program revenue earned by our Managed REITs. For the property management and advisory services that we provide, we are reimbursed for certain expenses that otherwise helps to offset our net operating expense burden.
66
REIT Qualification
We made an election under Section 856(c) of the Code to be taxed as a REIT under the Code, commencing with the taxable year ended December 31, 2014. By qualifying as a REIT for federal income tax purposes, we generally will not be subject to federal income tax on income that we distribute to our stockholders. If we fail to qualify as a REIT in any taxable year, we will be subject to federal income tax on our taxable income at regular corporate rates and will not be permitted to qualify for treatment as a REIT for federal income tax purposes for four years following the year in which our qualification is denied. Such an event could materially and adversely affect our net income and could have a material adverse impact on our financial condition and results of operations. However, we believe that we are organized and operate in a manner that will enable us to continue to qualify for treatment as a REIT for federal income tax purposes, and we intend to continue to operate as to remain qualified as a REIT for federal income tax purposes.
Current Market and Economic Conditions
Our rental revenue and operating results depend significantly on the demand for self storage space. Since the beginning of the COVID-19 pandemic in late March 2020, the broader shift of people working from home, elevated migration patterns and strength in the housing market helped drive growth in self storage demand, which generally contributed to our results since the onset of COVID-19, and through calendar year 2022. In addition to the sector’s numerous historical demand drivers, one demand driver that developed and has continued as a result of the COVID-19 pandemic is the trend towards working from home, or a hybrid work environment. While the work from home environment remains elevated over pre-COVID-19 pandemic levels, this trend began to wane in 2023, which we believe led to elevated move-outs. As a result, occupancy, same-store growth and overall results began normalizing.
Further, the broader economy has been experiencing elevated levels of inflation, higher interest rates, tightening monetary and fiscal policies and a slowdown in home sales and population mobility. This could result in less discretionary spending, weakening consumer balance sheets and reduced demand for self storage. Additionally, a prolonged period of elevated inflation and/or higher interest rates could result in a further contraction of self storage demand. However, demand for the self storage sector is dynamic with drivers that function in a multitude of economic environments, both cyclically and counter-cyclically. Demand for self storage tends to be needs-based, with numerous factors that lead customers to renting and maintaining storage units.
Additionally, the broader interest rate and inflationary environment has moderated since the beginning of 2024. These factors could lead to increasing levels of population mobility, specifically amongst single family home buyers and sellers, which could increase demand for self storage. Certain property operating expenses have experienced elevated pressures to date, namely property insurance, property taxes and payroll have seen above average increases, primarily due to inflation and natural disasters. As a result, we have experienced a year-over-year decrease in gross margins for the year ended December 31, 2023 and the first three quarters of 2024.
In 2022, the Federal Reserve began increasing its targeted range for the federal funds rate, leading to increased interest rates. This approach to monetary policy was mirrored by other central banks across the world, to similar effect. We currently have fixed or capped interest rates of varying durations for the majority of our loans, either directly or indirectly through our use of interest rate hedges. The rise in overall interest rates has caused an increase in our variable rate borrowing costs and our overall cost of capital, resulting in an increase in net interest expense. Capitalization rates on acquisitions did not increase at the same magnitude as interest rates in 2022 and 2023, which limited our ability to make accretive acquisitions of self storage properties. However, with anticipation of the Federal Reserve lowering its target range for the federal funds rate, interest rates across the curve began to decrease in the first half of 2024. In September 2024, the Federal Reserve lowered its targeted range for the federal funds rate by 50 basis points. In November 2024, the Federal Reserve lowered its targeted range for the federal funds rate by an additional 25 basis points.
67
Factors that May Influence Our Operating Results
Over the past decade, we have made significant investments in technology, infrastructure, and human capital to support our operational and digital platforms and enable real-time decision making at scale. Today, our technology-driven operating platform includes a consistent and recognizable brand across store locations, a sophisticated and user-friendly website with mobile optimization, a proprietary data warehouse and real-time pricing algorithms and a customer-focused service platform, including our dedicated call center and highly trained staff. Our digital tools, resources and enhancements are leveraged across our organization to jointly coordinate marketing and pricing activities, improve the customer experience, grow rental revenue and enhance expense efficiencies. Additionally, we intend to execute our external growth strategy in our target markets or new markets that have comparably strong demographic and competitive trends, capitalizing on economies of scale as we grow. The following describes various factors that may influence our operating results.
Growth Strategy. We intend to grow our portfolio primarily through the acquisition of stabilized facilities, but we also intend to occasionally acquire facilities in lease-up, facilities that have just received a certificate of occupancy, facilities in need of renovation, re-development or expansion and ground up development. We believe becoming a publicly listed REIT will provide us with a more favorable cost of capital and broader access to capital markets solutions to help us execute on our external growth strategy.
General Economic and Regional Market Conditions. The following market and economic challenges may adversely affect our operating results:
| | • | | changes in national, regional, and local economic climates or demographics; |
| | • | | poor economic conditions resulting in customer delinquency under leases or bankruptcy; |
| | • | | competition from other available properties and the attractiveness of our properties to our customers; |
| | • | | re-leasing may require reduced rental rates under the new leases; |
| | • | | increased competition for self storage assets targeted by our investment strategy; |
| | • | | increased costs to repair, renovate, and re-lease our storage units; |
| | • | | increased insurance premiums may reduce funds available for distribution; |
| | • | | increased inflation above our ability to pass along comparable rent increases to our customers; and |
| | • | | changes in interest rates and the availability of financing, which may render the sale of a property or refinance of a loan difficult or unattractive. |
We are susceptible to the effects of adverse macro-economic events that can result in higher unemployment, shrinking demand for products, large-scale business failures, tight credit markets, and other economic trends such as inflation, rising interest rates, or labor shortages. Because our portfolio of facilities consists of self storage facilities, we are subject to risks inherent in investments in a single industry, and our results of operations are sensitive to changes in overall economic conditions that impact consumer spending, including discretionary spending, as well as to increased delinquency. A continuation of, or slow recovery from, ongoing adverse economic conditions affecting disposable consumer income, such as employment levels, business conditions, interest rates, tax rates, and inflation in key categories such as fuel and energy, could reduce consumer spending or cause consumers to shift their spending to other products and services. A general reduction in the level of discretionary spending or shifts in consumer discretionary spending could adversely affect our growth and profitability.
Competition. We operate in competitive markets, often where tenants have multiple self storage properties from which to choose. Actions by our competitors, such as increased development, may decrease or prevent increases in our occupancy and rental rates, while increasing the operating expenses of our properties. These competitors may also drive up the price we pay for self storage properties or other assets we seek to acquire or may succeed in acquiring those properties or assets themselves. Specifically in Canada, the percentage of self
68
storage assets operated by sophisticated institutions is significantly lower than in the United States. This dynamic allows for a relatively lower level of operating competition while offering a range of acquisition opportunities. New sophisticated operators could enter the Canadian market, which could result in a more competitive operating environment.
Rental Revenue. We derive revenues principally from rents received from tenants who rent units at our self storage properties on a month-to-month basis. Therefore, our operating results substantially depend on our ability to retain our existing tenants and lease our available self storage units to new tenants. As of September 30, 2024, our occupancy rate across our wholly-owned portfolio was approximately 92.2%. We experience minor seasonal fluctuations in occupancy levels, with occupancy levels generally higher in the summer months due to increased household migration activity. Based on our results of operations for the nine months ended September 30, 2024, we would expect a similar increase in NOI, subject to marginal increases in operating expenses. The amount of rental revenue generated by us also depends on our ability to maintain or increase rental rates at our properties. We believe that the RentPOF for our properties generally is slightly below the current average realized market rates of the U.S. Listed Self Storage REITs in most of our markets. Negative trends in our occupancy levels or rental rates could adversely affect our rental revenue in future periods. In addition, growth in rental revenue will also partially depend on our ability to acquire additional properties that meet our investment criteria.
Operating Expenses. The majority of our operating expenses consist of the following:
| | • | | Property Operating Expenses. Property operating expenses include salaries and wages for personnel assigned to manage and operate our properties, as well as property taxes, property insurance, digital advertising, repairs and maintenance, utilities and other property-level costs. |
| | • | | General and Administrative Expenses. General and administrative expenses include compensation related costs, including equity-based compensation for our corporate employees, legal and accounting expenses, board of directors-related expenses, and other administrative expenses primarily related to our corporate operations. As a listed public company, we estimate our annual general and administrative expenses will increase due to increased legal, insurance, accounting and other expenses related to corporate governance. |
| | • | | Depreciation and Amortization. When we acquire a property, a portion of the purchase price is allocated to an intangible asset attributed to the value of customer in-place leases. This intangible asset is amortized on a straight-line basis generally over a period of 18 months after the acquisition date. The amount of depreciation and amortization we recognize in the future will partially depend on our ability to acquire additional properties that meet our investment criteria and the depreciable cost basis of those properties. |
Interest Expense. Since we have relied heavily on debt to finance our activities to date, interest expense has a significant impact on our results of operations. A portion of our debt financing provides for interest at variable rates, now based on SOFR. Historically, we have reduced our exposure to variable rates through the use of derivatives and fixed rate debt, and we intend to hedge a portion of our variable-rate debt in the future, but we will remain subject to interest rate risk on the unhedged portion.
Results of Operations
Overview
We derive revenues principally from: (i) rents received from our self storage tenant leases; (ii) fees generated from our Managed REITs; (iii) our tenant protection programs; and (iv) sales of packing and storage- related supplies at our storage facilities. Therefore, our operating results depend significantly on our ability to retain our existing tenants and lease our available self storage units to new tenants, while maintaining and, where possible, increasing the prices for our self storage units.
Competition in the market areas in which we operate is significant and affects the occupancy levels, rental rates, rental revenues and operating expenses of our facilities. Development of any new self storage facilities would intensify competition of self storage operators in markets in which we operate.
69
As of September 30, 2024 and 2023, we wholly-owned 157 and 153 operating self storage facilities, respectively. Our operating results for the nine months ended September 30, 2024 included a full nine months results for 154 self storage facilities. Our operating results for the nine months ended September 30, 2023 included a full nine months of results for 153 self storage facilities. Operating results in future periods will depend on the results of operations of these properties and of the real estate properties that we acquire in the future.
As of December 31, 2023 and 2022, we wholly-owned 154 and 153 operating self storage facilities, respectively. Our operating results for the year ended December 31, 2023 included full year period results for 153 operating self storage facilities and partial period results for one operating self storage facility acquired during the year ended December 31, 2023. Our operating results for the year ended December 31, 2022 included full year period results for 139 operating self storage facilities and partial period results for 14 operating self storage facilities acquired during the year ended December 31, 2022. Operating results in future periods will depend on the results of operations of these properties and of the real estate properties that we acquire in the future.
As discussed further below, the results of operations presented herein cover, in part, a period of time prior to the SSGT II merger. Our 2022 and 2023 operating results were significantly impacted by this merger as a result of collectively acquiring 10 operating self storage facilities and 50% equity interests in three unconsolidated real estate ventures, as well as the elimination of management fees that we previously earned from SSGT II. Over time we expect the SSGT II merger to be accretive to FFO, as adjusted, primarily as the former SSGT II properties eventually reach higher levels of either physical or economic occupancy or both.
Comparison of the nine months ended September 30, 2024 and 2023
Total Self Storage Revenues
Total self storage related revenues for the nine months ended September 30, 2024 and 2023 were approximately $163.0 million and $162.1 million, respectively. The increase in total self storage revenues of approximately $0.9 million, or approximately 0.6%, is primarily attributable to an increase in non same-store revenues of approximately $1.0 million, largely as a result of three property acquisitions during the nine months ended September 30, 2024.
We expect self storage revenues to primarily fluctuate based on the performance of our same-store pool, which will be influenced by the overall economic environment and increases in self storage supply, amongst other things.
Managed REIT Platform Revenues
Managed REIT platform revenues for the nine months ended September 30, 2024 and 2023 were approximately $8.3 million and $9.1 million, respectively. The decrease in Managed REIT platform revenues of approximately $0.8 million is primarily attributable to decreased acquisition fees as compared to the same period in the prior year. We earned approximately $1.9 million in acquisition fees from SST VI in June 2023 as a result of a multi-property portfolio acquisition. Managed REIT platform revenues were also reduced as compared to the prior year to a lesser extent by the effect of sponsor funding reductions recorded to revenue only in the current year. Such decreases in Managed REIT platform revenues were partially offset by increased Tenant Protection Program fees, property management and asset management fees as a result of increased assets under management.
We expect Managed REIT platform revenue to fluctuate commensurate with our Managed REITs’ increase in operations and assets under management, as well as additional reductions recorded to such revenue in connection with the Sponsor Funding Agreement as SST VI continues to sell shares in its public offering and such reductions increase commensurately.
70
Reimbursable Costs from Managed REITs
Reimbursable costs from Managed REITs for the nine months ended September 30, 2024 and 2023 were approximately $5.0 million and $4.2 million, respectively. Such revenues consist of costs incurred by us as we provide property management and advisory services to the Managed REITs, which are reimbursed by the Managed REITs, pursuant to our related contracts with the Managed REITs. The increase in reimbursable costs from Managed REITs is primarily related to the growth in the Managed REITs’ assets under management. We expect reimbursable costs from Managed REITs to increase in future periods as a result of additional acquisitions by our Managed REITs. We further expect reimbursable costs from Managed REITs to generally fluctuate commensurate with our Managed REITs’ increase in operations as we receive reimbursement for providing such services.
Property Operating Expenses
Property operating expenses for the nine months ended September 30, 2024 and 2023 were approximately $53.3 million (or 33% of self storage revenue) and $49.3 million (or 30% of self storage revenue), respectively. Property operating expenses include the costs to operate our facilities including compensation related expenses, utilities, insurance, real estate taxes, and property related marketing. The increase in property operating expenses of approximately $4.0 million is largely attributable to increased property operating expenses of approximately $1.5 million related to our non same-store properties and the balance related to increased insurance costs, payroll costs, repairs and maintenance expenses, and advertising expenses on our same-store properties. We expect property operating expenses to fluctuate commensurate with inflationary pressures and any future acquisitions.
Managed REIT Platform Expenses
Managed REIT platform expenses for the nine months ended September 30, 2024 and 2023 were approximately $2.6 million and $2.5 million, respectively. Such expenses primarily consisted of expenses related to non-reimbursable costs associated with the operation of the Managed REIT platform incurred directly and indirectly through the Administrative Services Agreement (see Note 10 – Related Party Transactions of the notes to our consolidated financial statements for the nine months ended September 30, 2024 contained elsewhere in this prospectus for more information). The increase in Managed REIT platform expenses is primarily related to growth in the Managed REITs’ assets under management. We expect Managed REIT platform expenses to fluctuate in future periods commensurate with our level of activity related to the Managed REITs.
Reimbursable Costs from Managed REITs
Reimbursable costs from Managed REITs for the nine months ended September 30, 2024 and 2023 were approximately $5.0 million and $4.2 million, respectively. Such expenses consist of costs incurred by us as we provide property management and advisory services to the Managed REITs, which are reimbursed by the Managed REITs, pursuant to our related contracts with the Managed REITs. The increase in reimbursable costs from Managed REITs is primarily related to the growth in the Managed REITs’ assets under management. We expect reimbursable costs from the Managed REITs to fluctuate commensurate with our Managed REITs’ increase in operations as we receive reimbursement for providing such services.
General and Administrative Expenses
General and administrative expenses for the nine months ended September 30, 2024 and 2023 were approximately $22.4 million and $20.0 million, respectively. Such expenses consist primarily of compensation related costs, marketing related costs, legal expenses, accounting expenses, transfer agent fees, directors and officers’ insurance expense and board of directors related costs. During the nine months ended September 30, 2024 and 2023, we recorded expenses of approximately $0.3 million and none, respectively, related to our filing of an amendment to our registration statement on Form S-11 and related costs in pursuit of a potential offering of our common stock. The remaining increase in general and administrative expenses was primarily attributable to
71
increased legal expenses, marketing related expenses, and compensation related costs incurred during the nine months ended September 30, 2024. We expect general and administrative expenses to decrease as a percentage of total revenues over time.
Depreciation and Amortization Expenses
Depreciation and amortization expenses for the nine months ended September 30, 2024 and 2023 were approximately $41.5 million and $45.6 million, respectively. Depreciation expense consists primarily of depreciation on the buildings and site improvements at our properties. Amortization expense consists of the amortization of our in place lease intangible assets resulting from our self storage acquisitions and amortization of certain intangible assets acquired in the self administration transaction. The decrease in depreciation and amortization expense is primarily attributable to the intangible amortization expense related to our in place lease intangible assets recorded in connection with the SSGT II merger which became fully amortized in November 2023.
Acquisition Expenses
Acquisition expenses for the nine months ended September 30, 2024 and 2023 were approximately $121,000 and $118,000, respectively. These acquisition expenses were incurred prior to acquisitions becoming probable in accordance with our capitalization policy.
Equity in earnings (losses) from investments in joint ventures
Losses from our equity method investments in our joint ventures for the nine months ended September 30, 2024 and 2023 were approximately $1.1 million and $1.2 million, respectively. Losses from our equity method investments in our joint ventures consists of our allocation of earnings and losses from our joint ventures with SmartCentres.
Equity in earnings (losses) from investments in Managed REITs
Losses from our equity method investments in the Managed REITs for the nine months ended September 30, 2024 and 2023 were approximately $1.0 million and $0.9 million, respectively. Losses from our equity method investments in the Managed REITs consists primarily of our allocation of earnings and losses from our investments in SST VI and SSGT III.
Other, Net
Other, net for the nine months ended September 30, 2024 and 2023 was approximately $2.9 million and $0.2 million of expense, respectively. Other, net consists primarily of certain state tax expenses, foreign currency fluctuations, changes in value related to our foreign currency and interest rate hedges not designated for hedge accounting, and other miscellaneous items. The unfavorable variance of approximately $2.7 million is primarily due to unfavorable fair value adjustments associated with our SOFR interest rate hedges not designated for hedge accounting during the nine months ended September 30, 2024.
Interest Income
Interest Income for the nine months ended September 30, 2024 and 2023 was approximately $2.4 million and $2.5 million, respectively. Interest income includes interest income on loans to the Managed REITs, accretion of financing fee revenues associated with such loans, and interest earned on cash held at financial institutions. We expect interest income from the Managed REITs to fluctuate commensurate with their borrowings, as well as changes to benchmark interest rates on such borrowings.
72
Interest Expense
Interest expense for the nine months ended September 30, 2024 and 2023 was approximately $52.9 million and $45.5 million, respectively. Interest expense includes interest expense on our debt, accretion of fair market value adjustments of our debt, amortization of debt issuance costs, and the impact of our interest rate derivatives designated for hedge accounting. The increase of approximately $7.4 million as compared to the same period in the prior year is primarily attributable to increased borrowings, increases to our net effective interest rates, as well as increased amortization of debt issuance costs of approximately $0.9 million primarily due to increased debt issuance costs associated with the 2024 Credit Facility. The increase in net effective interest rates as compared to the same period in the prior year is attributable to two beneficial interest rate hedges which capped SOFR at 1.75% and 2.0% for $125 million of our debt, each, which expired on June 30, 2023 and June 28, 2024, respectively. We expect interest expense to fluctuate in future periods commensurate with our future debt levels and fluctuations in net effective interest rates.
Loss on Debt Extinguishment
Loss on debt extinguishment for the nine months ended September 30, 2024 and 2023 was approximately $0.5 million, and none, respectively. Loss on debt extinguishment for the nine months ended September 30, 2024 was related to certain unamortized debt issuance costs associated with the 2021 Credit Facility which were expensed in connection with the execution of the new 2024 Credit Facility. Please see Note 5 – Debt, of the notes to our consolidated financial statements for the nine months ended September 30, 2024 contained elsewhere in this prospectus for more information.
Income Tax (Expense) Benefit
Income tax (expense) benefit for the nine months ended September 30, 2024 and 2023 was approximately $1.1 million of expense and $0.9 million of benefit, respectively. Income tax consists primarily of state, federal, and Canadian income tax. The change is primarily due to the release of a valuation allowance during the nine months ended September 30, 2023 on certain of our deferred tax assets related to our non-capital losses at some of our Canadian properties, resulting in a net income tax benefit for such period. We expect our income tax expense to increase in future periods primarily related to our operations in Canada.
Same-Store Facility Results - nine months ended September 30, 2024 and 2023
We consider the data below to be meaningful as this allows for the comparison of results without the effects of acquisition, lease up, or development activity. The following table sets forth operating data for our same-store facilities (stabilized and comparable properties that have been included in the consolidated results of operations since January 1, 2023, excluding five other properties) for the nine months ended September 30, 2024 and 2023 (in thousands unless otherwise noted).
| | | | | | | | | | | | | | | | | | | | | | | | | | | | | | | | | | | | |
| | | Same-Store Facilities | | | Non Same-Store Facilities | | | Total | |
| | | 2024 | | | 2023 | | | %
Change | | | 2024 | | | 2023 | | | %
Change | | | 2024 | | | 2023 | | | %
Change | |
Revenue (1) | | $ | 151,489 | | | $ | 151,882 | | | | (0.3 | )% | | $ | 5,383 | | | $ | 4,375 | | | | N/M | | | $ | 156,872 | | | $ | 156,257 | | | | 0.4 | % |
Property operating expenses (2) | | | 49,427 | | | | 47,080 | | | | 5.0 | % | | | 3,041 | | | | 2,020 | | | | N/M | | | | 52,468 | | | | 49,100 | | | | 6.9 | % |
| | | | | | | | | | | | | | | | | | | | | | | | | | | | | | | | | | | | |
Net operating income | | $ | 102,062 | | | $ | 104,802 | | | | (2.6 | )% | | $ | 2,342 | | | $ | 2,355 | | | | N/M | | | $ | 104,404 | | | $ | 107,157 | | | | (2.6 | )% |
| | | | | | | | | | | | | | | | | | | | | | | | | | | | | | | | | | | | |
Number of facilities | | | 148 | | | | 148 | | | | | | | | 9 | | | | 6 | | | | | | | | 157 | | | | 154 | | | | | |
Rentable square feet (3) | | | 11,403,300 | | | | 11,404,485 | | | | | | | | 804,700 | | | | 486,700 | | | | | | | | 12,208,000 | | | | 11,891,185 | | | | | |
Average physical occupancy (4) | | | 92.4 | % | | | 93.1 | % | | | (0.7 | )% | | | 83.1 | % | | | NM | | | | NM | | | | 91.8 | % | | | 92.8 | % | | | (1.0 | )% |
Annualized rent per occupied square foot (5) | | $ | 19.96 | | | $ | 19.86 | | | | 0.5 | % | | $ | 15.25 | | | | NM | | | | NM | | | $ | 19.72 | | | $ | 19.82 | | | | (0.5 | )% |
73
| (1) | | Revenue includes rental revenue, certain ancillary revenue, administrative and late fees, and excludes Tenant Protection Program revenue. |
| (2) | | Property operating expenses excludes Tenant Protection Program related expense. Please see the reconciliation of net operating income to net income (loss) below for the full detail of adjustments to reconcile net operating income to net income (loss). |
| (3) | | Of the total rentable square feet, parking represented approximately 1,040,000 square feet as of September 30, 2024 and approximately 1,017,000 square feet as 2023, respectively. On a same-store basis, parking represented approximately 960,000 square feet. Amount not in thousands. |
| (4) | | Determined by dividing the sum of the month-end occupied square feet for the applicable group of facilities for each applicable period by the sum of their month-end rentable square feet for the period. |
| (5) | | Determined by dividing the aggregate realized rental income for each applicable period by the aggregate of the month-end occupied square feet for the period. Properties are included in the respective calculations in their first full month of operations, as appropriate. We have excluded the realized rental revenue and occupied square feet related to parking herein for the purpose of calculating annualized rent per occupied square foot. Amount not in thousands. |
Our same-store revenue decreased by approximately $0.4 million, or approximately 0.3%, for the nine months ended September 30, 2024 compared to the nine months ended September 30, 2023 due to an approximately 0.7% decrease in average occupancy, partially offset by an approximately 0.5% increase in annualized rent per occupied square foot. The increase in property operating expenses is primarily attributable to increased property insurance costs, payroll costs, repairs and maintenance expenses, and advertising expenses.
Comparison of the Years Ended December 31, 2023 and 2022
Total Self Storage Revenues
Total self storage related revenues for the years ended December 31, 2023 and 2022 were approximately $215.3 million and $200.2 million, respectively. The increase in total self storage revenues of approximately $15.1 million, or 7.6% is primarily attributable to higher average rent charged per occupied square foot at our self storage properties and a full year of operations for the properties we acquired in 2022, offset slightly by modest declines in average physical occupancy.
We believe self storage revenues will increase in future periods as our lease-up or newly acquired properties increase occupancy and/or rates, and to otherwise primarily fluctuate based on the performance of our same-store pool, which will be influenced by the overall economic environment and increases in self storage supply, amongst other things. Additionally, we expect to see increases in self storage revenues from any future acquisitions.
Managed REIT Platform Revenues
Managed REIT platform revenues for the years ended December 31, 2023 and 2022 was approximately $11.9 million and $7.8 million, respectively. The increase in Managed REIT platform revenue of approximately $4.1 million is primarily attributable to increased asset management fees generated from SST VI and SSGT III of approximately $2.9 million, and increased property management revenues from the Managed REITs and JV Properties (as defined below in Note 4 – Investments in Unconsolidated Real Estate Ventures of the notes to our consolidated financial statements for the year ended December 31, 2023 contained elsewhere in this prospectus) of approximately $0.9 million, as well as increased tenant protection program fees of approximately $0.5 million. We expect Managed REIT platform revenue to fluctuate commensurate with our Managed REITs’ increase in operations and assets under management, as well as reductions to such revenue in connection with the Sponsor Funding Agreement as SST VI continues to sell shares in its public offering.
Reimbursable Costs from Managed REITs
Reimbursable costs from Managed REITs for the years ended December 31, 2023 and 2022 were approximately $5.8 million and $4.6 million, respectively. Such revenues consist of costs incurred by us as we
74
provide property management and advisory services to the Managed REITs, which are reimbursed by the Managed REITs, pursuant to our related contracts with the Managed REITs. The increase in reimbursable costs from Managed REITs is primarily related to the growth in the Managed REITs assets under management. We expect reimbursable costs from Managed REITs to increase in future periods as a result of additional acquisitions by our Managed REITs. We further expect reimbursable costs from Managed REITs to generally fluctuate commensurate with our Managed REITs’ increase in operations as we receive reimbursement for providing such services.
Property Operating Expenses
Property operating expenses for the years ended December 31, 2023 and 2022 were approximately $65.4 million (or 30.4% of self storage revenue) and $58.4 million (or 29.2% of self storage revenue), respectively. Property operating expenses include the costs to operate our facilities including compensation related expenses, utilities, insurance, real estate taxes, and property related marketing. The increase in property operating expenses of approximately $6.9 million is largely attributable to a full year of operations for the properties acquired in 2022, plus increased compensation related expenses, property insurance costs, and property tax. We expect property operating expenses to fluctuate commensurate with inflationary pressures and any future acquisitions.
Managed REIT Platform Expenses
Managed REIT platform expenses for the years ended December 31, 2023 and 2022 were approximately $3.4 million and $2.5 million, respectively. Such expenses primarily consisted of expenses related to non-reimbursable costs associated with the operation of the Managed REIT platform and the Administrative Services Agreement (see Note 10 – Related Party Transactions of the notes to our consolidated financial statements for the year ended December 31, 2023 contained elsewhere in this prospectus for more information). The increase in Managed REIT platform expenses is primarily related to the growth in the Managed REITs’ operations. We expect Managed REIT platform expenses to fluctuate in future periods commensurate with our level of activity related to the Managed REITs.
Reimbursable Costs from Managed REITs
Reimbursable costs from Managed REITs for the years ended December 31, 2023 and 2022 were approximately $5.8 million and $4.6 million, respectively. Such expenses consist of costs incurred by us as we provide property management and advisory services to the Managed REITs, which are reimbursed by our Managed REITs, pursuant to our related contracts with the Managed REITs. The increase in reimbursable costs from Managed REITs is primarily related to the growth in the Managed REITs’ assets under management. We expect reimbursable costs from Managed REITs to fluctuate commensurate with our Managed REITs’ increase in operations as we receive reimbursement for providing such services.
General and Administrative Expenses
General and administrative expenses for the years ended December 31, 2023 and 2022 were approximately $27.5 million and $28.3 million, respectively. Such expenses consist primarily of compensation-related costs, legal expenses, accounting expenses, transfer agent fees, directors’ and officers’ insurance expense and board of directors related costs. Additionally, during the years ended December 31, 2023 and 2022, we recorded expenses of approximately $0.8 million and $1.8 million, respectively, related to our filing of an S-11 registration statement (including subsequent amendments) and related costs in pursuit of a potential offering of our common stock. We expect general and administrative expenses to decrease as a percentage of total revenues over time.
Depreciation and Amortization Expenses
Depreciation and amortization expenses for the years ended December 31, 2023 and 2022 were approximately $60.2 million and $64.6 million, respectively. Depreciation expense consists primarily of
75
depreciation on the buildings and site improvements at our properties. Amortization expense consists of the amortization of our in place lease intangible assets resulting from our self storage acquisitions and amortization of certain intangible assets acquired in the self administration transaction. The decrease in depreciation and amortization expense is primarily attributable to amortization incurred during the year ended December 31, 2022 on the intangible assets acquired in the SST IV Merger on March 17, 2021 which became fully amortized as of the third quarter of 2022. This was partially offset by increased depreciation and amortization expense on the properties and intangible assets acquired in the SSGT II Merger on June 1, 2022 which were being amortized during the majority of the year ended 2023, and only a portion of 2022.
Acquisition Expenses
Acquisition expenses for the years ended December 31, 2023 and 2022 were approximately $0.2 million and $0.9 million, respectively. These acquisition expenses were incurred prior to acquisitions becoming probable in accordance with our capitalization policy. The decrease in acquisition expenses of approximately $0.7 million is related to reduced acquisition activity.
Contingent Earnout Adjustment
There were no contingent earnout adjustments during the year ended December 31, 2023. The contingent earnout adjustment for the year ended December 31, 2022 reflects an increase in the contingent earnout liability of approximately $1.5 million as the third and final tranche of the contingent earnout was earned during the year ended December 31, 2022. No future adjustments related to the self administration transaction earnout will be recorded.
Write-off of equity interest and preexisting relationships upon acquisition of control
Write-off of equity interest and preexisting relationships upon acquisition of control for the year ended December 31, 2023 and 2022 was none and approximately $2.0 million, respectively. Such expenses in 2022 represents the write-off of the intangible assets related to the SSGT II advisory agreement and property management contracts due to the termination of such contracts with the SSGT II Merger.
Gain On Equity Interests Upon Acquisition
Gain on equity interests upon acquisition for the year ended December 31, 2023 and 2022 was none and approximately $16.1 million, respectively. The gain was related to recording the fair value of our preexisting special limited partnership interest in SSGT II in connection with the SSGT II Merger.
Equity in earnings (losses) from investments in JV Properties
Losses from our equity method investments in the JV Properties for the years ended December 31, 2023 and 2022 were approximately $1.6 million and $0.8 million, respectively. Losses from our equity method investments in the JV Properties consists of our allocation of earnings and losses from our joint ventures with SmartCentres. The increase in losses from our equity method investments in JV Properties is due to the additional operational JV properties, which are in their respective lease-up phase compared to the prior year.
Equity in earnings (losses) from investments in Managed REITs
Losses from our equity method investments in the Managed REITs for the years ended December 31, 2023 and 2022 were approximately $1.3 million and $0.9 million, respectively. Losses from our equity method investments in Managed REITs consists primarily of our allocation of earnings and losses from our investments in SST VI and SSGT III.
76
Other, Net
Other, net for the years ended December 31, 2023 and 2022 was approximately $3.1 million and $0.8 million of income, respectively. Other, net consists primarily of certain state tax expenses, foreign currency fluctuations, changes in value related to our foreign currency hedges not designated for hedge accounting, and interest income from loans issued to our Managed REITs, and other miscellaneous items. The change of approximately $2.3 million is largely due to increased interest income from our loans to SSGT III and SST VI, as the interest rate and average outstanding balance on such investments increased year over year, along with favorable foreign currency related adjustments as compared to the prior year.
Interest Expense
Interest expense for the years ended December 31, 2023 and 2022 was approximately $61.8 million and $41.5 million, respectively. Interest expense includes interest expense on our debt, accretion of fair market value adjustments of our debt, amortization of debt issuance costs, and the impact of our interest rate hedging derivatives. The increase of approximately $20.3 million is primarily attributable to an increase in the effective interest rates on our variable rate debt, inclusive of the impact of our interest rate hedges. We expect interest expense to fluctuate in future periods commensurate with our future debt levels and fluctuations in interest rates.
Net Loss on Extinguishment of Debt
Net loss on extinguishment of debt for the years ended December 31, 2023 and 2022 was none and approximately $2.4 million, respectively. The net loss on debt extinguishment for the year ended December 31, 2022 is attributable to the write-off of unamortized debt issuance costs and debt defeasance costs for the Midland North Carolina CMBS Loan which was defeased on May 19, 2022.
Income Tax (Expense) Benefit
Income tax for the years ended December 31, 2023 and 2022 was approximately $2.6 million and $0.6 million of benefit, respectively. Income tax consists primarily of adjustments to deferred tax liabilities, state, federal, and Canadian income tax. The change is primarily due to the release of a valuation allowance on certain of our deferred tax assets related to non-capital losses at certain of our Canadian properties. We expect our income tax expense to increase in future periods primarily related to our operations in Canada.
77
Same-Store Facility Results — Years Ended December 31, 2023 and 2022
The following table sets forth operating data for our same-store facilities (stabilized and comparable properties that have been included in the consolidated results of operations since January 1, 2022, excluding two other properties) for the years ended December 31, 2023 and 2022. We consider the following data to be meaningful as this allows for the comparison of results without the effects of acquisition, lease-up, or development activity (in thousands unless otherwise noted).
| | | | | | | | | | | | | | | | | | | | | | | | | | | | | | | | | | | | |
| | | Same-Store Facilities | | | Non Same-Store Facilities | | | Total | |
| | | 2023 | | | 2022 | | | %
Change | | | 2023 | | | 2022(6) | | | %
Change | | | 2023 | | | 2022 | | | %
Change | |
Revenue (1) | | $ | 184,822 | | | $ | 177,539 | | | | 4.1 | % | | $ | 22,715 | | | $ | 15,200 | | | | N/M | | | $ | 207,537 | | | $ | 192,739 | | | | 7.7 | % |
Property operating expenses (2) | | $ | 56,210 | | | | 52,736 | | | | 6.6 | % | | $ | 9,153 | | | | 5,701 | | | | N/M | | | | 65,363 | | | | 58,437 | | | | 11.9 | % |
| | | | | | | | | | | | | | | | | | | | | | | | | | | | | | | | | | | | |
Net operating income | | $ | 128,612 | | | $ | 124,803 | | | | 3.1 | % | | $ | 13,562 | | | $ | 9,499 | | | | N/M | | | $ | 142,174 | | | $ | 134,302 | | | | 5.9 | % |
| | | | | | | | | | | | | | | | | | | | | | | | | | | | | | | | | | | | |
Number of
facilities (3) | | | 137 | | | | 137 | | | | | | | | 17 | | | | 16 | | | | | | | | 154 | | | | 153 | | | | | |
Rentable square feet (4) | | | 10,397,440 | | | | 10,366,585 | | | | | | | | 1,506,245 | | | | 1,428,145 | | | | | | | | 11,903,685 | | | | 11,794,730 | | | | | |
Average physical occupancy (5) | | | 92.9 | % | | | 94.6 | % | | | -1.7 | % | | | N/M | | | | N/M | | | | | | | | 92.1 | % | | | 94.0 | % | | | -1.9 | % |
Annualized rent per occupied square foot (6) | | $ | 20.04 | | | $ | 18.87 | | | | 6.2 | % | | | N/M | | | | N/M | | | | | | | $ | 19.77 | | | $ | 18.76 | | | | 5.4 | % |
| (1) | | Revenue includes rental revenue, certain ancillary revenue, administrative and late fees, and excludes Tenant Protection Program revenue. |
| (2) | | Property operating expenses excludes corporate general and administrative expenses, interest expense, depreciation, amortization expense, and acquisition expenses. |
| (3) | | Amount not in thousands. |
| (4) | | Of the total rentable square feet, parking represented approximately 1,017,000 square feet and 1,016,000 square feet as of December 31, 2023 and 2022, respectively. On a same-store basis, for the same periods, parking represented approximately 949,000 square feet. Amount not in thousands. |
| (5) | | Determined by dividing the sum of the month-end occupied square feet for the applicable group of facilities for each applicable period by the sum of their month-end rentable square feet for the period. |
| (6) | | Determined by dividing the aggregate realized rental income for each applicable period by the aggregate of the month-end occupied square feet for the period. Properties are included in the respective calculations in their first full month of operations, as appropriate. We have excluded the realized rental revenue and occupied square feet related to parking herein for the purpose of calculating annualized rent per occupied square foot. Amount not in thousands. |
Our same-store revenue increased by approximately $7.3 million for the year ended December 31, 2023 compared to the year ended December 31, 2022 due to higher annualized rent per occupied square foot, slightly offset by decreased occupancy.
Non-GAAP Financial Measures
Funds from Operations
Funds from operations, or FFO, is a non-GAAP financial metric promulgated by NAREIT that we believe is an appropriate supplemental measure to reflect our operating performance.
We define FFO consistent with the standards established by the White Paper on FFO approved by the Board of Governors of NAREIT, or the White Paper. The White Paper defines FFO as net income (loss) computed in accordance with GAAP, excluding gains or losses from sales of property and real estate related asset impairment write downs, plus depreciation and amortization and after adjustments for unconsolidated partnerships and joint ventures. Additionally, gains and losses from change in control are excluded from the determination of FFO.
78
Adjustments for unconsolidated partnerships and joint ventures are calculated to reflect FFO on the same basis. Our FFO calculation complies with NAREIT’s policy described above.
FFO, as Adjusted
We use FFO, as adjusted, as an additional non-GAAP financial measure to evaluate our operating performance. FFO, as adjusted, provides investors with supplemental performance information that is consistent with the performance models and analysis used by management. In addition, FFO, as adjusted, is a measure used among our peer group, which includes publicly traded REITs. Further, we believe FFO, as adjusted, is useful in comparing the sustainability of our operating performance with the sustainability of the operating performance of other real estate companies.
In determining FFO, as adjusted, we make further adjustments to the NAREIT computation of FFO to exclude the effects of non-real estate related asset impairments and intangible amortization, acquisition related costs, other write-offs incurred in connection with acquisitions, contingent earnout expenses, accretion of fair value of debt adjustments, amortization of debt issuance costs, gains or losses from extinguishment of debt, adjustments of deferred tax assets and liabilities, realized and unrealized gains/losses on foreign exchange transactions, gains/losses on foreign exchange and interest rate derivatives not designated for hedge accounting, and other select non-recurring income or expense items which we believe are not indicative of our overall long-term operating performance. We exclude these items from GAAP net income (loss) to arrive at FFO, as adjusted, as they are not the primary drivers in our decision-making process and excluding these items provides investors a view of our continuing operating portfolio performance over time, which in any respective period may experience fluctuations in such acquisition, merger or other similar activities that are not of a long-term operating performance nature. FFO, as adjusted, also reflects adjustments for unconsolidated partnerships and jointly owned investments. We use FFO, as adjusted, as one measure of our operating performance when we formulate corporate goals and evaluate the effectiveness of our strategies.
Presentation of FFO and FFO, as adjusted, is intended to provide useful information to investors as they compare the operating performance of different REITs. However, not all REITs calculate FFO and FFO, as adjusted, the same way, so comparisons with other REITs may not be meaningful. Furthermore, FFO and FFO, as adjusted, are not necessarily indicative of cash flow available to fund cash needs and should not be considered as an alternative to net income (loss) as an indication of our performance, as an alternative to cash flows from operations as an indication of our liquidity or indicative of funds available to fund our cash needs including our ability to make distributions to our stockholders. FFO and FFO, as adjusted, should be reviewed in conjunction with other measurements as an indication of our performance. The following table is a reconciliation of net income (loss) (attributable to common stockholders), which is the most directly comparable GAAP financial measure, to FFO and FFO, as adjusted (attributable to common stockholders), and FFO and FFO, as adjusted (attributable to common stockholders and OP unit holders) for each of the periods presented below (in thousands):
| | | | | | | | |
| | | Nine Months
Ended
September 30,
2024 | | | Nine Months
Ended
September 30,
2023 | |
Net (loss) income (attributable to common stockholders) | | $ | (14,688 | ) | | $ | (1,632 | ) |
Add: | | | | | | | | |
Depreciation of real estate | | | 40,189 | | | | 39,331 | |
Amortization of real estate related intangible assets | | | 278 | | | | 5,268 | |
Depreciation and amortization of real estate and intangible assets from unconsolidated entities | | | 1,914 | | | | 1,748 | |
Deduct: | | | | | | | | |
Adjustment for noncontrolling interests in our operating partnership (1) | | | (5,086 | ) | | | (5,411 | ) |
| | | | | | | | |
FFO (attributable to common stockholders) | | $ | 22,607 | | | $ | 39,304 | |
79
| | | | | | | | |
| | | Nine Months
Ended
September 30,
2024 | | | Nine Months
Ended
September 30,
2023 | |
Other Adjustments: | | | | | | | | |
Intangible amortization expense - contracts (2) | | | 183 | | | | 219 | |
Acquisition expenses (3) | | | 121 | | | | 118 | |
Acquisition expenses and foreign currency (gains) losses, net from unconsolidated entities | | | 42 | | | | 94 | |
Accretion of fair market value of secured debt | | | 80 | | | | 10 | |
Foreign currency and interest rate derivative losses (gains), net (4) | | | 2,308 | | | | (227 | ) |
Offering related expenses (5) | | | 330 | | | | — | |
Adjustment of deferred tax assets and liabilities (2) | | | 602 | | | | (1,527 | ) |
Sponsor funding reduction (6) | | | 598 | | | | — | |
Amortization of debt issuance costs (2) | | | 2,975 | | | | 2,026 | |
Net loss on extinguishment of debt (7) | | | 471 | | | | — | |
Loss due to hurricane (8) | | | 500 | | | | — | |
Adjustment for noncontrolling interests in our operating partnership (1) | | | (987 | ) | | | (82 | ) |
| | | | | | | | |
FFO, as adjusted (attributable to common stockholders) (9) | | $ | 29,830 | | | $ | 39,935 | |
| | | | | | | | |
FFO (attributable to common stockholders) | | $ | 22,607 | | | $ | 39,304 | |
Net (loss) income attributable to the noncontrolling interests in our operating partnership | | | (729 | ) | | | 1,097 | |
Adjustment for noncontrolling interests in our operating partnership(1) | | | 5,086 | | | | 5,411 | |
| | | | | | | | |
FFO (attributable to common stockholders and OP unit holders) | | $ | 26,964 | | | $ | 45,812 | |
| | | | | | | | |
FFO, as adjusted (attributable to common stockholders) | | $ | 29,830 | | | $ | 39,935 | |
Net (loss) income attributable to the noncontrolling interests in our operating partnership | | | (729 | ) | | | 1,097 | |
Adjustment for noncontrolling interests in our operating partnership(1) | | | 6,073 | | | | 5,493 | |
| | | | | | | | |
FFO, as adjusted (attributable to common stockholders and OP unit holders) (9) | | $ | 35,174 | | | $ | 46,525 | |
| | | | | | | | |
| (1) | | This represents the portion of the above stated adjustments in the calculations of FFO and FFO, as adjusted, that are attributable to our noncontrolling interests in our operating partnership. |
| (2) | | These items represent the amortization, accretion, or adjustment of intangible assets, debt issuance costs, or deferred tax assets and liabilities. |
| (3) | | This represents acquisition expenses associated with investments in real estate that were incurred prior to the acquisitions becoming probable and therefore not capitalized in accordance with our capitalization policy. |
| (4) | | This represents the mark-to-market adjustment for our derivative instruments not designated for hedge accounting and the ineffective portion of the change in fair value of derivatives recognized in earnings, as well as changes in foreign currency related to our foreign equity investments not classified as long term. |
| (5) | | Such costs relate to our filing of a registration statement on Form S-11 and our pursuit of a potential offering of our common stock. As this item is non-recurring and not a primary driver in our decision-making process, FFO is adjusted for its effect to arrive at FFO, as adjusted, as a means of determining a comparable sustainable operating performance metric. |
| (6) | | Pursuant to the Sponsor Funding Agreement, SmartStop funds certain costs of SST VI’s share sales, and in return receives Series C Units in Strategic Storage Operating Partnership VI, L.P. The excess of the funding over the value of the Series C Units received is accounted for as a reduction of Managed REIT Platform revenues from SST VI over the remaining estimated term of the management contracts with SST VI. See Note 2 – Summary of Significant Accounting Policies to our consolidated financial statements for the nine months ended September 30, 2024 contained elsewhere in this prospectus for more information. FFO is adjusted for its effect to arrive at FFO, as adjusted, as a means of determining a comparable sustainable operating performance metric. |
80
| (7) | | The net loss associated with the extinguishment of debt includes prepayment penalties, defeasance costs, the write-off of unamortized deferred financing fees, and other fees incurred. |
| (8) | | Such losses related to Hurricane Helene, which occurred in September 2024. |
| (9) | | Our calculation of FFO, as adjusted was modified beginning in the period ended March 31, 2024, to add back the amortization of debt issuance costs. Accordingly, the prior periods have been presented here based on the current calculation, which differs from what was previously reported for such periods. This modification was made to reflect what management believes is a more appropriate calculation in light of recently completed debt refinancings. |
FFO, as adjusted declined compared to the same period in the prior year primarily as a result of the effects of increased interest expense on net income, and to a lesser extent, a reduction in property net operating income.
| | | | | | | | | | | | |
| | | Year
Ended
December
31, 2023 | | | Year
Ended
December
31, 2022 | | | Year
Ended
December
31, 2021 | |
Net income (loss) (attributable to common stockholders) | | $
|
(2,746 |
) | | $ | 6,322 | | | $ | (29,402 | ) |
Add: | | | | | | | | | | | | |
Depreciation of real estate | | | 52,620 | | | | 48,400 | | | | 40,158 | |
Amortization of real estate related intangible assets | | | 6,303 | | | | 14,628 | | | | 11,030 | |
Depreciation and amortization of real estate and intangible assets from unconsolidated entities | | | 2,375 | | | | 1,535 | | | | 756 | |
Deduct: | | | | | | | | | | | | |
Gain on deconsolidation | | | — | | | | — | | | | (170 | ) |
Gain on sale of real estate | | | — | | | | — | | | | (178 | ) |
Gain on equity interests upon acquisition(1) | | | — | | | | (16,101 | ) | | | — | |
Adjustment for noncontrolling interests(2) | | | (7,166 | ) | | | (5,279 | ) | | | (5,728 | ) |
| | | | | | | | | | | | |
FFO (attributable to common stockholders) | | | 51,386 | | | | 49,505 | | | | 16,466 | |
Other Adjustments: | | | | | | | | | | | | |
Intangible amortization expense - contracts(3) | | | 292 | | | | 573 | | | | 1,392 | |
Acquisition expenses(4) | | | 192 | | | | 888 | | | | 935 | |
Acquisition expenses and foreign currency (gains) losses, net from unconsolidated entities | | | 69 | | | | 149 | | | | 210 | |
Casualty loss due to hurricane(5) | | | — | | | | 661 | | | | — | |
Contingent earnout adjustment(6) | | | — | | | | 1,514 | | | | 12,620 | |
Write-off of equity interest and preexisting relationships upon acquisition of control | | | — | | | | 2,050 | | | | 8,390 | |
Accretion of fair market value of secured debt | | | 13 | | | | (36 | ) | | | (111 | ) |
Net loss on extinguishment of debt(7) | | | — | | | | 2,393 | | | | 2,445 | |
Foreign currency and interest rate derivative (gains) losses, net(8) | | | (178 | ) | | | 75 | | | | 367 | |
Offering related expenses(9) | | | 792 | | | | 1,803 | | | | — | |
Adjustment of deferred tax assets and liabilities(3) | | | (3,301 | ) | | | (1,073 | ) | | | (2,026 | ) |
Sponsor funding reduction(10) | | | 34 | | | | — | | | | — | |
Amortization of debt issuance costs(3) | | | 2,728 | | | | 2,594 | | | | 1,676 | |
Adjustment for noncontrolling interests in our Operating Partnership | | | (73 | ) | | | (1,306 | ) | | | (2,914 | ) |
| | | | | | | | | | | | |
FFO, as adjusted (attributable to common stockholders)(11) | | $ | 51,954 | | | $ | 59,790 | | | $ | 39,450 | |
| | | | | | | | | | | | |
FFO (attributable to common stockholders) | | $ | 51,386 | | | $ | 49,505 | | | $ | 16,466 | |
Net income (loss) attributable to the noncontrolling interests in our Operating Partnership | | | 1,314 | | | | 2,536 | | | | (2,663 | ) |
Adjustment for noncontrolling interests in our Operating Partnership(2) | | | 7,165 | | | | 5,279 | | | | 5,728 | |
| | | | | | | | | | | | |
FFO (attributable to common stockholders and OP unit holders) | | $ | 59,865 | | | $ | 57,320 | | | $ | 19,531 | |
| | | | | | | | | | | | |
81
| | | | | | | | | | | | |
| | | Year
Ended
December
31, 2023 | | | Year
Ended
December
31, 2022 | | | Year
Ended
December
31, 2021 | |
FFO, as adjusted (attributable to common stockholders)(11) | | $ | 51,954 | | | $ | 59,790 | | | $ | 39,450 | |
Net income (loss) attributable to the noncontrolling interests in our Operating Partnership | | | 1,314 | | | | 2,536 | | | | (2,663 | ) |
Adjustment for noncontrolling interests in our Operating Partnership(2) | | | 7,238 | | | | 6,585 | | | | 8,642 | |
| | | | | | | | | | | | |
FFO, as adjusted (attributable to common stockholders and OP unit holders) | | $ | 60,506 | | | $ | 68,911 | | | $ | 45,429 | |
| | | | | | | | | | | | |
| (1) | | This gain relates to the mark up in fair value of our preexisting equity interests in SSGT II as a result of our acquisition of control in the SSGT II Merger. |
| (2) | | This represents the portion of the above stated adjustments in the calculations of FFO and FFO, as adjusted, that are attributable to our noncontrolling interests in our Operating Partnership. |
| (3) | | These items represent the amortization, accretion, or adjustment of intangible assets, debt issuance costs, or deferred tax assets and liabilities. |
| (4) | | This represents acquisition expenses associated with investments in real estate that were incurred prior to the acquisitions becoming probable and therefore not capitalized in accordance with our capitalization policy. |
| (5) | | Such casualty losses relate to Hurricane Ian, which occurred in September 2022. |
| (6) | | The contingent earnout adjustment represents the adjustment to the fair value during the period of the Class A-2 Units issued in connection with the self administration transaction. |
| (7) | | The net loss associated with the extinguishment of debt includes prepayment penalties, defeasance costs, the write-off of unamortized deferred financing fees, and other fees incurred. |
| (8) | | This represents the mark-to-market adjustment for our derivative instruments not designated for hedge accounting and the ineffective portion of the change in fair value of derivatives recognized in earnings, as well as changes in foreign currency related to our foreign equity investments not classified as long term. |
| (9) | | Such costs relate to our filing of an S-11 registration statement and our pursuit of a potential offering of our common stock. As this item is non-recurring and not a primary driver in our decision-making process, FFO is adjusted for its effect to arrive at FFO, as adjusted, as a means of determining a comparable sustainable operating performance metric. |
| (10) | | Pursuant to the Sponsor Funding Agreement, SmartStop funds certain costs of SST VI’s share sales, and in return receives Series C Units in SST VI’s OP. The excess of the funding over the value of the Series C Units received is accounted for as a reduction of Managed REIT platform revenues from SST VI over the remaining estimated term of the management contracts with SST VI. See Note 2 – Summary of Significant Accounting Policies to our consolidated financial statements for the year ended December 31, 2023 contained elsewhere in this prospectus for more information. FFO is adjusted for its effect to arrive at FFO, as adjusted, as a means of determining a comparable sustainable operating performance metric. |
| (11) | | Our calculation of FFO, as adjusted was modified to add back the amortization of debt issuance costs. Accordingly, the prior periods have been presented here based on the current calculation, which differs from what was previously reported for such periods. This modification was made to reflect what management believes is a more appropriate calculation in light of recently completed debt refinancings. |
FFO, as adjusted for the year ended December 31, 2023 declined compared to the same period in the prior year primarily as a result of the effects of increased interest expense on net income. The reduction was partially offset by increased property net operating income, and to a lesser extent, increased fees from our Managed REITs and increased interest income from loans to our Managed REITs.
Net Operating Income
Net operating income, or NOI, is a non-GAAP measure that we define as net income (loss), computed in accordance with GAAP, generated from properties before corporate general and administrative expenses, asset
82
management fees, interest expense, depreciation, amortization, acquisition expenses and other non-property related expenses. We believe that NOI is useful for investors as it provides a measure of the operating performance of our operating assets because NOI excludes certain items that are not associated with the ongoing operation of the properties. Additionally, we believe that NOI (sometimes referred to as property operating income) is a widely accepted measure of comparative operating performance in the real estate community. However, our use of the term NOI may not be comparable to that of other real estate companies as they may have different methodologies for computing this amount. In addition, NOI is not a substitute for net income (loss), cash flows from operations, or other related financial measures, in evaluating our operating performance.
The following tables present a reconciliation of net income (loss) as presented on our consolidated statements of operations to net operating income, as stated above, for the periods indicated (in thousands):
| | | | | | | | |
| | | For the Nine Months Ended
September 30, | |
| | | 2024 | | | 2023 | |
Net (loss) income | | $ | (5,735 | ) | | $ | 9,291 | |
Adjusted to exclude: | | | | | | | | |
Tenant Protection Program revenue(1) | | | (6,152 | ) | | | (5,826 | ) |
Tenant Protection Program related expense | | | 867 | | | | 233 | |
Managed REIT Platform revenue | | | (8,328 | ) | | | (9,115 | ) |
Managed REIT Platform expenses | | | 2,552 | | | | 2,538 | |
General and administrative | | | 22,449 | | | | 19,996 | |
Depreciation | | | 41,057 | | | | 40,075 | |
Intangible amortization expense | | | 461 | | | | 5,487 | |
Acquisition expenses | | | 121 | | | | 118 | |
Equity in (earnings) losses from investments in joint ventures | | | 1,068 | | | | 1,215 | |
Equity in (earnings) losses from investments in Managed REITs | | | 957 | | | | 894 | |
Other, net | | | 2,949 | | | | 161 | |
Interest income | | | (2,375 | ) | | | (2,537 | ) |
Interest expense | | | 52,949 | | | | 45,534 | |
Loss on debt extinguishment | | | 471 | | | | — | |
Income tax (expense) benefit | | | 1,093 | | | | (907 | ) |
| | | | | | | | |
Total net operating income | | $ | 104,404 | | | $ | 107,157 | |
| | | | | | | | |
| (1) | | Included within ancillary operating revenue within our consolidated statements of operations, approximately $5.8 million and $5.6 million of Tenant Protection Program revenue was earned at same store facilities during the nine months ended September 30, 2024 and 2023, respectively, with the remaining approximately $0.3 million and $0.3 million earned at non same-store facilities during the nine months ended September 30, 2024 and 2023, respectively. |
| | | | | | | | |
| | | For the Year Ended
December 31, | |
| | | 2023 | | | 2022 | |
Net income | | $ | 11,647 | | | $ | 21,669 | |
Adjusted to exclude: | | | | | | | | |
Tenant Protection Program revenue (1) | | | (7,784 | ) | | | (7,456 | ) |
Managed REIT Platform revenue | | | (11,906 | ) | | | (7,819 | ) |
Managed REIT Platform expenses | | | 3,365 | | | | 2,485 | |
General and administrative | | | 27,452 | | | | 28,254 | |
Depreciation | | | 53,636 | | | | 49,418 | |
Intangible amortization expense | | | 6,594 | | | | 15,201 | |
Acquisition expenses | | | 192 | | | | 888 | |
Contingent earnout adjustment | | | — | | | | 1,514 | |
83
| | | | | | | | |
| | | For the Year Ended
December 31, | |
| | | 2023 | | | 2022 | |
Write-off of equity interest and preexisting relationships upon acquisition of control | | | — | | | | 2,050 | |
Gain on equity interest upon acquisition | | | — | | | | (16,101 | ) |
(Earnings) losses from our equity method investments in JV Properties | | | 1,625 | | | | 760 | |
(Earnings) losses from our equity method investments in Managed REITs | | | 1.273 | | | | 930 | |
Other, net | | | (3,129 | ) | | | (841 | ) |
Interest expense | | | 61,805 | | | | 41,512 | |
Net loss on extinguishment of debt | | | — | | | | 2,393 | |
Income tax expense (benefit) | | | (2,596 | ) | | | (555 | ) |
| | | | | | | | |
Total net operating income | | $ | 142,174 | | | $ | 134,302 | |
| | | | | | | | |
| (1) | | Approximately $6.8 million and $6.8 million of Tenant Protection Program revenue was earned at same store facilities during the years ended December 31, 2023 and 2022, respectively, with the remaining approximately $1.0 million and $0.7 million earned at non same-store facilities during the years ended December 31, 2023 and 2022, respectively. |
Adjusted Earnings Before Interest, Taxes, Depreciation and Amortization
Adjusted earnings before interest, taxes, depreciation and amortization, or Adjusted EBITDA, is a non-GAAP measure that we define as net income (loss) computed in accordance with GAAP before: (i) interest expense and net loss on extinguishment of debt; (ii) tax related expenses; (iii) depreciation and amortization; (iv) adjustments to reflect EBITDA related to our unconsolidated entities; (v) changes in the fair value of our contingent earn-out liability; (vi) acquisition and transaction expenses; (vii) impairment charges related to goodwill, intangible assets, and equity investments; (viii) equity based compensation expense; (ix) gains or losses from disposition of depreciable property; (x) gains or losses from the acquisition of previously unconsolidated affiliates; (xi) sponsor funding revenue reduction; (xii) offering related expenses; and (xiii) gains or losses from foreign currency and interest rate derivatives. We use Adjusted EBITDA as an additional metric by which we measure our operational performance independent of the impact of our capital structure. Additionally, we believe Adjusted EBITDA is a useful indicator of our ability to support our debt obligations. Presentation of Adjusted EBITDA is intended to provide useful information to investors as they compare the operating performance of different REITs. However, not all REITs calculate Adjusted EBITDA or on the same basis, so comparisons with other REITs may not be meaningful. Furthermore, Adjusted EBITDA is not necessarily indicative of cash flow available to fund cash needs and should not be considered as an alternative to net income (loss) as an indication of our performance, as an alternative to cash flows from operations as an indication of our liquidity or indicative of funds available to fund our cash needs including our ability to make distributions to our stockholders or support our debt obligations. Adjusted EBITDA should be reviewed in conjunction with other measurements as an indication of our performance. The following are reconciliations of net income (loss), which is the most directly comparable GAAP financial measure, to Adjusted EBITDA for each of the periods presented below (in thousands):
| | | | | | | | |
| | | Nine Months Ended
September 30, | |
| | | 2024 | | | 2023 | |
Net income (loss) | | $ | (5,735 | ) | | $ | 9,291 | |
Adjustments: | | | | | | | | |
Interest expense and net loss on extinguishment of debt | | | 53,421 | | | | 45,533 | |
Tax related (expense) benefit(1) | | | 1,973 | | | | (349 | ) |
Depreciation and amortization | | | 41,517 | | | | 45,563 | |
Adjustments to reflect EBITDA related to our unconsolidated entities | | | 4,841 | | | | 4,613 | |
Acquisition expenses(2) | | | 121 | | | | 118 | |
Equity based compensation expense | | | 3,863 | | | | 4,079 | |
Sponsor funding revenue reduction | | | 598 | | | | — | |
84
| | | | | | | | |
| | | Nine Months Ended
September 30, | |
| | | 2024 | | | 2023 | |
Losses incurred due to hurricane | | | 500 | | | | — | |
Foreign currency and interest rate derivative (gains) losses, net | | | 2,309 | | | | (227 | ) |
Offering related expenses | | | 330 | | | | — | |
| | | | | | | | |
Adjusted EBITDA(3) | | $ | 103,738 | | | $ | 108,621 | |
| | | | | | | | |
| (1) | | Tax related (expense) benefit consists primarily of adjustments to deferred tax liabilities and assets, state, federal, and Canadian income tax, as well as state franchise taxes. |
| (2) | | This represents acquisition expenses associated with investments in real estate that were incurred prior to the acquisitions becoming probable and therefore not capitalized in accordance with our capitalization policy. |
| (3) | | Our calculation of Adjusted EBITDA was modified beginning in the period ended September 30, 2024, to add back foreign currency and interest rate derivative (gains) losses. Accordingly, the prior periods have been presented here based on the current calculation, which differs from what was previously reported for such periods. |
| | | | | | | | | | | | |
| | | For the Year Ended December 31, | |
| | | 2023 | | | 2022 | | | 2021 | |
Net income (loss) | | $ | 11,647 | | | $ | 21,669 | | | $ | (19,565 | ) |
Adjustments: | | | | | | | | | | | | |
Interest expense and net loss on extinguishment of debt(1) | | | 61,804 | | | | 43,905 | | | | 35,828 | |
Tax related (expense) benefit(2) | | | (1,852 | ) | | | 112 | | | | (1,374 | ) |
Depreciation and amortization | | | 60,230 | | | | 64,619 | | | | 53,369 | |
Adjustments to reflect EBITDA related to our unconsolidated entities | | | 6,302 | | | | 3,120 | | | | 1,163 | |
Acquisition expenses(3) | | | 192 | | | | 888 | | | | 935 | |
Equity based compensation expense | | | 5,258 | | | | 3,968 | | | | 2,908 | |
Sponsor funding revenue reduction . . . . . . . . . . . . . . . . . . . | | | 34 | | | | — | | | | — | |
Losses incurred due to hurricane . . . . . . . . . . . . . . . . . . . | | | — | | | | 661 | | | | — | |
Foreign currency and interest rate derivative (gains) losses, net | | | (178 | ) | | | 75 | | | | 367 | |
Contingent earnout expense(4) | | | — | | | | 1,514 | | | | 12,620 | |
Write-off of equity interest and preexisting relationships in SST IV upon consolidation | | | — | | | | 2,050 | | | | 8,390 | |
Gain on equity interests upon acquisition | | | — | | | | (16,101 | ) | | | — | |
Gain on sale of real estate | | | — | | | | — | | | | (179 | ) |
Offering related expenses | | | 792 | | | | 1,803 | | | | — | |
| | | | | | | | | | | | |
Adjusted EBITDA(5) | | | 144,229 | | | $ | 128,283 | | | $ | 94,462 | |
| | | | | | | | | | | | |
| (1) | | Included herein is approximately $0, $2.4 million, $2.4 million of net loss on extinguishment of debt for the years ended December 31, 2023, 2022, and 2021 respectively. |
| (2) | | Tax related (expense) benefit consists of adjustments to deferred tax liabilities and assets, state, federal and Canadian income tax, as well as state franchise taxes. |
| (3) | | This represents acquisition expenses associated with investments in real estate that were incurred prior to the acquisitions becoming probable and therefore not capitalized in accordance with our capitalization policy. |
| (4) | | The contingent earnout adjustment represents the adjustment to the fair value of the Class A-2 Units issued in connection with the self administration transaction. |
| (5) | | Our calculation of Adjusted EBITDA was modified beginning in the period ended September 30, 2024, to add back foreign currency and interest rate derivative (gains) losses. Accordingly, the prior periods have been presented here based on the current calculation, which differs from what was previously reported for such periods. |
85
Cash Flows
A comparison of cash flows for operating, investing and financing activities for the nine months ended September 30, 2024 and 2023 are as follows (in thousands):
| | | | | | | | | | | | |
| | | Nine Months Ended | |
| | | September 30,
2024 | | | September 30,
2023 | | | Change | |
Net cash flow provided by (used in): | | | | | | | | | | | | |
Operating activities | | $ | 53,422 | | | $ | 68,713 | | | $ | (15,291 | ) |
Investing activities | | $ | (80,301 | ) | | $ | 3,488 | | | $ | (83,789 | ) |
Financing activities | | $ | 19,112 | | | $ | (74,212 | ) | | $ | 93,324 | |
Cash flows provided by operating activities for the nine months ended September 30, 2024 and 2023 were approximately $53.4 million and $68.7 million, respectively, a decrease of approximately $15.3 million. The decrease in cash provided by our operating activities is primarily the result of a decrease of approximately $9.7 million in net income when excluding the impact of non-cash items and unfavorable changes in working capital of approximately $5.6 million as compared to the same period in the prior year. The change in net income was primarily as a result of increased property operating expenses and interest expense. The change in working capital was primarily a result of an increase in Managed REIT receivables, and an increase in accounts payable and accrued liabilities.
Cash flows used in investing activities for the nine months ended September 30, 2024 were approximately $80.3 million and cash flows provided by investing activities for the nine months ended September 30, 2023 were approximately $3.5 million, respectively, a change of approximately $83.8 million. The net increase in cash used in investing activities primarily relates to a net change of approximately $41.5 million in cash flows related to our debt investments in the Managed REITs and a net change of approximately $38.7 million in cash flows related to acquisitions and additions to real estate during the nine months ended September 30, 2024 as compared to the same period in the prior year.
Cash flows provided by financing activities for the nine months ended September 30, 2024 were approximately $19.1 million, and cash flows used by financing activities for the nine months ended September 30, 2023 were approximately $74.2 million, respectively, a change of approximately $93.3 million. The change in cash used in financing activities is primarily attributable to net debt proceeds, inclusive of debt issuance costs, received of approximately $83.6 million during the nine months ended September 30, 2024, as compared to net debt cash outflows of approximately $14.0 million during the nine months ended September 30, 2023.
A comparison of cash flows for operating, investing and financing activities for the years ended December 31, 2023 and 2022 are as follows (in thousands):
| | | | | | | | | | | | |
| | | Year Ended
December 31, 2023 | | | Year Ended
December 31, 2022 | | | Change | |
Net cash flow provided by (used in): | | | | | | | | | | | | |
Operating activities | | $ | 73,191 | | | $ | 87,910 | | | $ | (14,719 | ) |
Investing activities | | $ | 261 | | | $ | (205,151 | ) | | $ | 205,412 | |
Financing activities | | $ | (66,099 | ) | | $ | 120,067 | | | $ | (186,166 | ) |
Cash flows provided by operating activities for the years ended December 31, 2023 and 2022 were approximately $73.2 million and $87.9 million, respectively, a decrease of approximately $14.7 million. The decrease in cash provided by our operating activities is primarily the result of a decrease in net income of approximately $10.0 million largely due to higher interest expense, offset by approximately $1.1 million of cash used related to changes in working capital.
Cash flows provided by investing activities for the year ended December 31, 2023 was approximately $0.3 million and cash flows used for investing activities for the year ended December 31, 2022 was approximately
86
$205.2 million, a reduction in the use of cash of approximately $205.4 million. The reduction in the use of cash for investing activities primarily relates to approximately $26.1 million of real estate related acquisitions and additions during the year ended December 31, 2023, compared to approximately $148.4 million for the year ended December 31, 2022, a net decrease in the use of cash of approximately $122.4 million. The reduction in the use of cash for investing activities is to a lesser extent related to net cash inflows of approximately $33.5 million, as compared to net cash outflows of approximately $45.7 million related to loans to the Managed REIT’s for the years ended December 31, 2023 and 2022, respectively.
Cash flows used in financing activities for the year ended December 31, 2023 was approximately $66.1 million, and cash flows provided by financing activities for the year ended December 31, 2022 was approximately $120.1 million, a change of approximately $186.2 million. The change in financing activities is primarily attributable to the effect of cash inflows from debt borrowings, net of paydowns of approximately $16.0 million during the year ended December 31, 2023 compared to approximately $196.3 million of net debt financing provided during the year ended December 31, 2022, which resulted in a reduction of such cash inflows of approximately $180.3 million. Additionally, contributing to the use of cash in financing activities for the year ended December 31, 2023, was an incremental amount of cash used for redemptions of approximately $17.2 million when compared to the prior year. Offsetting such amounts was a reduction of approximately $8.8 million in cash distributions paid to common stockholders due to the cessation of our distribution reinvestment plan during 2022 and reinstatement of our distribution reinvestment plan during 2023.
Liquidity and Capital Resources
Short-Term Liquidity and Capital Resources
Our liquidity needs consist primarily of our property operating expenses, general and administrative expenses, Managed REIT Platform expenses, debt service payments, capital expenditures, property acquisitions, property developments and improvements, investments in our Managed REITs, required payments pursuant to our Sponsor Funding Agreement, and distributions to our Series A Convertible Preferred stockholder, limited partners in our Operating Partnership, and our stockholders, as necessary to maintain our REIT qualification. We generally expect that we will meet our short-term liquidity requirements from the combination of existing cash balances and net cash provided from property operations and the Managed REIT Platform and further supported by our 2024 Credit Facility. Alternatively, we may issue additional secured or unsecured financing from banks or other lenders, or we may enter into various other forms of financing.
In April 2022, we received our initial investment grade credit rating of BBB- from Kroll Bond Rating Agency, Inc. (“KBRA”). In accordance with the Note Purchase Agreement, we intend to maintain a credit rating on an annual basis. This rating was reaffirmed by KBRA in April 2024.
Our 2024 Credit Facility contains a borrowing base requirement, which is impacted by treasury yields. Increases to treasury yields could negatively impact our borrowing base calculation and limit our ability to borrow pursuant to the 2024 Credit Facility. Volatility in the debt and equity markets and continued and/or further impact of rising treasury yields, interest rates, inflation and other economic events will depend on future developments, which are highly uncertain. Such events may have an impact on our current liquidity in the short-term. If such events were to occur in the short-term we would expect to take certain steps, including but not limited to refinancing certain of our current loans, and adding additional properties onto our 2024 Credit Facility, each of which we expect would increase our borrowing availability. Moreover , continued uncertainty or deterioration in the debt and equity markets, or continued increases in treasury yields and interest rates, over an extended period of time, could also potentially impact our liquidity over the long-term. If such events were to occur in the long-term, we would expect to take other additional steps, including but not limited to other sources of capital such as proceeds from secured or unsecured financings from banks or other lenders, issuance of equity instruments, and additional public or private offerings.
Distribution Policy and Distributions
On December 20, 2021, our Board declared a distribution rate for the first quarter of 2022 of approximately $0.00164 per day per share on the outstanding shares of common stock payable to both Class A and Class T stockholders of record of such shares as shown on our books at the close of business on each day during the period commencing on January 1, 2022 and continuing on each day thereafter through and including March 31,
87
2022. In connection with these distributions, after the stockholder servicing fee was paid, approximately $0.0014 per day was paid per share of Class T common stock. Commencing in March 2022 for distributions payable in April 2022, our Board changed our distribution declarations from quarterly to monthly in connection with our process for reviewing alternatives to provide liquidity to our stockholders. We continued to declare monthly distributions through December 2023. On November 21, 2024, our Board authorized a monthly distribution to our common stockholders of record as of December 31, 2024 at the monthly rate of $0.0508 per share, or $0.60 annualized. Pursuant to the selling agreements we entered into with respect to the sale of shares of Class T common stock, no further stockholder servicing fees have been paid on shares of Class T common stock subsequent to April 2022. Distributions payable to each stockholder of record during a month will be paid the following month.
Federal income tax law requires that a REIT distribute annually at least 90% of its REIT taxable income (excluding capital gains and computed without regard to the dividends paid deduction) and that it pay tax at the corporate rate to the extent that it annually distributes less than 100% of its REIT taxable income (including capital gains and computed without regard to the dividends paid deduction). In addition, a REIT will be required to pay a 4% nondeductible excise tax on the amount, if any, by which the distributions it makes in a calendar year are less than the sum of 85% of its ordinary income, 95% of its capital gain net income and 100% of its undistributed income from prior years. For more information, see “Federal Income Tax Considerations.” We anticipate that our estimated cash available for distribution will be sufficient to enable us to meet the annual distribution requirements applicable to REITs and to avoid or minimize the imposition of corporate and excise taxes.
However, under some circumstances, we may be required to make distributions in excess of cash available for distribution in order to meet these distribution requirements or to avoid or minimize the imposition of tax and we may need to borrow funds to make certain distributions.
Any distributions will be at the sole discretion of our Board, and their form, timing and amount, if any, will depend upon a number of factors, including our actual and projected results of operations, FFO, FFO, as adjusted, liquidity, cash flows and financial condition, the revenue we actually receive from our properties, our operating expenses, our debt service requirements, our capital expenditures, prohibitions and other limitations under our financing arrangements, our REIT taxable income, the annual REIT distribution requirements, applicable law, including restrictions on distributions under Maryland law, and such other factors as our Board deems relevant. See “Distribution Policy.”
Long-Term Liquidity and Capital Resources
On a long-term basis, our principal demands for funds will be for our property operating expenses, general and administrative expenses, Managed REIT Platform expenses, debt service payments, capital expenditures, property acquisitions, investments in our Managed REITs, required payments pursuant to our Sponsor Funding Agreement, and distributions to our Series A Convertible Preferred stockholder, limited partners in our Operating Partnership, and our stockholders, as necessary to maintain our REIT qualification.
Long-term potential future sources of capital include proceeds from secured or unsecured financings from banks or other lenders, issuance of equity instruments, undistributed funds from operations, and additional public or private offerings. To the extent we are not able to secure requisite financing in the form of a credit facility or other debt, we will be dependent upon proceeds from the issuance of equity securities and cash flows from operating activities in order to meet our long-term liquidity requirements and to fund our distributions.
Our material cash requirements from contractual and other obligations primarily relate to our debt obligations. The expected timing of those outstanding principal payments are shown in the table below. The information in this section should be read in conjunction with Note 5 – Debt and Note 12 – Commitments and Contingencies of the notes to our consolidated financial statements for the nine months ended September 30, 2024, and Note 5 – Debt, and Note 12 – Commitments and Contingencies, of the notes to our consolidated financial statements for the year ended December 31, 2023, each contained elsewhere in this prospectus.
88
The table below presents the future principal payments required on our outstanding debt as of September 30, 2024 (in thousands):
| | | | |
2024 | | $ | 915 | |
2025 | | | 8,948 | |
2026 | | | 94,333 | |
2027 | | | 706,122 | |
2028 | | | 78,431 | |
2029 and thereafter. . . . . . . . . . . . . . . . . . . . . . . . . . . . . . . . . . . . . . . . . . . . . . . . . . . . . . . | | | 294,500 | |
| | | | |
Total payments. . . . . . . . . . . . . . . . . . . . . . . . . . . . . . . . . . . . . . . . . . . . . . . . . . . . . . . . . . | | $ | 1,183,249 | |
| | | | |
As of September 30, 2024, pursuant to various contractual relationships, we are required to make other payments in the amounts of approximately $3.0 million, $11.2 million, $4.2 million, and $3.9 million during the years ending December 31, 2024, 2025, 2026, and 2027, respectively.
Through September 30, 2024, we have incurred approximately $8.7 million in connection with the Sponsor Funding Agreement, representing approximately 928,000 subordinated units. During the three and nine months ended September 30, 2024 we incurred approximately $0.6 million and $1.8 million, respectively, of which approximately $0.2 million was accrued as a payable pursuant to the Sponsor Funding Agreement.
As of September 30, 2024, the maximum remaining commitment of SRA pursuant to the Sponsor Funding Agreement is approximately $61.9 million if SST VI were to sell the maximum amount under its current offering of $1.0 billion.
See Note 10 – Related Party Transactions of the notes to our consolidated financial statements for the nine months ended September 30, 2024 contained elsewhere in this prospectus for more information about our obligations under these agreements.
For cash requirements related to potential acquisitions currently under contract, please see Note 3 – Real Estate Facilities and Note 4 – Investments in Unconsolidated Real Estate Ventures of the notes to our consolidated financial statements for the nine months ended September 30, 2024 contained elsewhere in this prospectus for more information.
The table below presents our future principal payments required on outstanding debt as of December 31, 2023 (in thousands):
| | | | |
| | | Principal Payments due
during the years ending
December 31: | |
| | | Total | |
2024 | | $ | 321,423 | |
2025 | | | 2,988 | |
2026 | | | 343,313 | |
2027 | | | 49,595 | |
2028 | | | 79,969 | |
2029 and thereafter | | | 294,500 | |
| | | | |
Total payments | | $ | 1,091,788 | |
| | | | |
On February 22, 2024, we entered into an amended and restated revolving credit facility with KeyBank. The 2024 Credit Facility replaces the Credit Facility we entered into on March 17, 2021, and has a maturity date of February 22, 2027. Additionally, on March 7, 2024, we entered into a $75 million CAD term loan with National Bank of Canada (the “2027 NBC Loan”), which has a maturity date of March 7, 2027. See Note 14 – Subsequent Events of the notes to our consolidated financial statements for the year ended December 31, 2023, contained elsewhere in this prospectus for more information.
89
As of December 31, 2023, pursuant to various contractual relationships, we are required to make other non-cancellable payments in the amounts of approximately $3.1 million during the year ending December 31, 2024.
As of December 31, 2023, pursuant to the SSGT III Mezzanine Loan, we were potentially required to fund an additional $1.5 million in debt to SSGT III at their option.
Through December 31, 2023, we have paid SST VI approximately $6.6 million in connection with the Sponsor Funding Agreement. As of December 31, 2023, approximately $0.2 million was accrued as a payable pursuant to the Sponsor Funding Agreement. If SST VI were to sell the maximum amount under its offering of $1.0 billion, assuming the sale of all Class Y Shares consisting of a 7% front end sales load, our maximum commitment pursuant to the Sponsor Funding Agreement is approximately $70 million, excluding the reimbursement for the one-time stock dividend of approximately $6.6 million.
See Note 10 – Related Party Transactions of the notes to our consolidated financial statements for the year ended December 31, 2023 contained elsewhere in this prospectus for more information about our obligations under these agreements.
For cash requirements related to potential acquisitions currently under contract, see Note 3 – Real Estate Facilities of the notes to our consolidated financial statements for the nine months ended September 30, 2024, and Note 3 – Real Estate Facilities and Note 4 – Investments in Unconsolidated Real Estate Ventures of the Notes to the Consolidated Financial Statements for the year ended December 31, 2023, each contained elsewhere in this prospectus.
Indebtedness
As of September 30, 2024, our net debt was approximately $1,180 million, which included approximately $519 million in fixed rate debt and approximately $664 million in variable rate debt, less approximately $3.3 million in debt issuance costs. See Note 5 – Debt of the notes to our consolidated financial statements for the nine months ended September 30, 2024 contained elsewhere in this prospectus for more information about our indebtedness.
As of December 31, 2023, our net debt was approximately $1,087.4 million, which included approximately $523.1 million in fixed rate debt, and $568.7 million in variable rate debt, less approximately $0.1 million in debt discount, and approximately $4.3 million in net debt issuance costs. See Note 5 – Debt and Note 14 – Subsequent Events of the notes to our consolidated financial statements for the year ended December 31, 2023 contained elsewhere in this prospectus for more information about our indebtedness.
Additionally, we are party to a CAD $70 million term loan (the “RBC JV Term Loan”) with Royal Bank of Canada (“RBC”) pursuant to which five of our joint venture subsidiaries that each own 50% of a Joint Venture property serve as borrowers (the “RBC Borrowers”). We and SmartCentres each serve as a full recourse guarantor with respect to 50% of the secured obligations under the RBC JV Term Loan.
We are also party to a master mortgage commitment agreement (the “SmartCentres Financing”) with SmartCentres Storage Finance LP (the “SmartCentres Lender”). The SmartCentres Lender is an affiliate of SmartCentres Real Estate Investment Trust, an unaffiliated third party (“SmartCentres”), that owns the other 50% of our unconsolidated real estate joint ventures located in the Greater Toronto Area of Canada. The proceeds of the SmartCentres Financing have been and will be used to finance the development and construction of the SmartCentres joint venture properties.
As of September 30, 2024, approximately CAD $70.0 million (approximately $51.8 million) was outstanding on the RBC JV Term Loan, approximately CAD $46.0 million (approximately $34.0 million) was outstanding on the RBC JV Term Loan II, and approximately CAD $17.3 million (approximately $12.8 million)
90
was outstanding on the SmartCentres Financing. See Note 4 – Investments in Unconsolidated Real Estate Ventures of the notes to our consolidated financial statements for the nine months ended September 30, 2024 contained elsewhere in this prospectus for more information.
As of December 31, 2023, approximately CAD $70.0 million or approximately $52.8 million, was outstanding on the RBC JV term Loan, and approximately CAD $57.3 million (approximately $43.3 million) was outstanding on the SmartCentres Financing. See Note 4 – Investments in Unconsolidated Real Estate Ventures of the notes to our consolidated financial statements for the year ended December 31, 2023 contained elsewhere in this prospectus for more information.
2024 Credit Facility
On February 22, 2024, we, through our operating partnership, entered into an amended and restated revolving credit facility with KeyBank, National Association, as administrative agent and collateral agent, certain others listed as joint book runners, joint lead arrangers, syndication agents and documentation agents, and certain other lenders party thereto, (the “2024 Credit Facility”). The 2024 Credit Facility replaced the Credit Facility (defined below) the Company entered into on March 17, 2021, and has a maturity date of February 22, 2027.
The aggregate commitment of the 2024 Credit Facility is $650 million. We have the right to request to increase the commitment amount available under the 2024 Credit Facility by an additional $850 million, for a total potential maximum aggregate amount of $1.5 billion, subject to certain conditions. The 2024 Credit Facility also includes sublimits of (a) up to $25 million for letters of credit and (b) up to $25 million for swingline loans; each of these sublimits are part of, and not in addition to, the amounts available under the 2024 Credit Facility. Borrowings under the 2024 Credit Facility may be in either USD or CAD. Upon the closing of the 2024 Credit Facility, we immediately drew down an aggregate amount of $576 million, which was used primarily to pay off the amounts outstanding under the Credit Facility.
The maturity date of the 2024 Credit Facility is February 22, 2027, subject to a one-year extension option, subject to the payment of an extension fee of 0.20% on the aggregate amount of the then-outstanding revolving commitments for such extension, and it may be prepaid or terminated at any time without penalty; provided, however, that the lenders shall be indemnified for certain breakage costs.
Amounts borrowed under the 2024 Credit Facility bear interest based on the type of borrowing (either Base Rate Loans, Daily Simple SOFR Loans, Term SOFR Loans or CORRA Loans, each as defined in the 2024 Credit Facility). Base Rate Loans bear interest at the lesser of (x) the Base Rate (as defined in the 2024 Credit Facility) plus the applicable rate, or (y) the maximum rate. Daily Simple SOFR Loans bear interest at the lesser of (a) Adjusted Daily Simple SOFR (as defined in the 2024 Credit Facility) plus the applicable rate, or (b) the maximum rate. Term SOFR Loans bear interest at the lesser of (a) Term SOFR (as defined in the 2024 Credit Facility) for the interest period in effect plus the applicable rate, or (b) the maximum rate. CORRA Loans bear interest at the lesser of (a) Adjusted Daily Simple CORRA (as defined in the 2024 Credit Facility) plus the applicable rate, or (b) the maximum rate. The corresponding applicable rate varies between (i) prior to a Security Interest Termination Event (defined below), 165 basis points to 230 basis points for Daily Simple SOFR Loans, Term SOFR Loans and CORRA Loans and between 65 basis points and 130 basis points for Base Rate Loans, in each case of this clause (i), depending on our consolidated leverage ratio and (ii) following a Security Interest Termination Event, 140 basis points to 225 basis points for Daily Simple SOFR Loans, Term SOFR Loans and CORRA Loans and between 40 basis points and 125 basis points for Base Rate Loans, in each case of this clause (ii), depending on our consolidated capitalization rate leverage ratio. Initial advances under the 2024 Credit Facility are Daily Simple SOFR Loans that bear interest at 175 basis points over Adjusted Daily Simple SOFR. The 2024 Credit Facility is also subject to an annual unused fee based upon the average amount of the unused portion of the 2024 Credit Facility, which varies from 15 bps to 25 bps, depending on the size of the unused amount, as well as whether a Security Interest Termination Event has occurred.
As of September 30, 2024, borrowings under the 2024 Credit Facility only bore interest based on Daily Simple SOFR. The rate spread above Daily Simple SOFR at which the 2024 Credit Facility incurs interest is
91
subject to increase based on the consolidated leverage ratio. There are five leverage tiers under the 2024 Credit Facility, with the highest tier limited to a maximum leverage of 60% and a maximum spread of 230 basis points on the 2024 Credit Facility. During the three months ended September 30, 2024, our consolidated leverage ratio was within the second leverage tier, and this loan incurred interest at daily simple SOFR plus a spread of 1.85% and the SOFR Index Adjustment of 0.10%.
The 2024 Credit Facility is fully recourse, jointly and severally, to us, our operating partnership, and certain of our subsidiaries (the “Subsidiary Guarantors”). In connection with the 2024 Credit Facility, we, our operating partnership, and the Subsidiary Guarantors executed guarantees in favor of the lenders. It is an event of default under the 2024 Credit Facility if (a) there is a payment default by us, our operating partnership, or any Subsidiary Guarantor under any recourse debt for borrowed money, (b) there is a payment default by us or any of its subsidiaries under any non-recourse debt of at least $75 million or (c) prior to a Security Interest Termination Event, an event of default occurs under the Notes (as defined below).
The 2024 Credit Facility is initially secured by a pledge of equity interests in the Subsidiary Guarantors. However, upon the achievement of certain security interest termination conditions, the pledges shall be released and the 2024 Credit Facility shall become unsecured (the “Security Interest Termination Event”). The Security Interest Termination Event occurs at our operating partnership’s election, once our operating partnership satisfies all of the following security interest termination conditions: (i) a fixed charge coverage ratio of no less than 1.50:1.00; (ii) an unsecured interest coverage ratio of not less than 2.00:1.00; (iii) a consolidated capitalization rate leverage ratio of not greater than 60%; and (iv) a secured debt ratio of no greater than 40%. Following the occurrence of the Security Interest Termination Event, certain terms and conditions of the 2024 Credit Facility are modified, including, but not limited to: (i) in certain circumstances, a reduction in the applicable rate under the 2024 Credit Facility, (ii) the modification or addition of certain financial covenants, (iii) the addition of a floor of at least $25 million for any cross-defaulted recourse debt of us, our operating partnership, or any Subsidiary Guarantor, and (iv) in certain circumstances, a reduction in the annual unused fee for the 2024 Credit Facility. The outstanding Notes previously issued by us remain pari passu with the 2024 Credit Facility.
The 2024 Credit Facility contains certain customary representations and warranties, affirmative, negative and financial covenants, borrowing conditions, and events of default. In particular, the financial covenants imposed on us include: a maximum leverage ratio, a minimum fixed charge coverage ratio, a minimum tangible net worth, certain limits on both secured debt and secured recourse debt, certain payout ratios of dividends paid to adjusted funds from operations, limits on unhedged variable rate debt, and minimum liquidity. If an event of default occurs and continues, our operating partnership is subject to certain actions by the administrative agent, including, without limitation, the acceleration of repayment of all amounts outstanding under the 2024 Credit Facility.
Subsequent to the initial draw on the 2024 Credit Facility, during the three months ended September 30, 2024, we borrowed an additional $67.5 million in order to fund our acquisitions of the Spartanburg and Miami Properties, to lend to the Managed REITs, and to fund other general corporate activities.
Subsequent to the initial draw on the 2024 Credit Facility, during the nine months ended September 30, 2024, we borrowed an additional $83.0 million in order to fund our acquisitions of the Colorado Springs II, Spartanburg and Miami Properties, to lend to the Managed REITs, and to fund other general corporate activities.
During the nine months ended September 30, 2024, the Colorado Springs II Property was added to the borrowing base of the 2024 Credit Facility.
As of September 30, 2024, 90 of our wholly-owned properties were encumbered by the 2024 Credit Facility, and we had borrowed approximately $604 million of the $650 million maximum potential current commitment of the 2024 Credit Facility. The availability of the Credit Facility is subject to certain calculations, including a debt service coverage ratio (“DSCR”) calculation which utilizes prevailing treasury rates within the calculation.
92
As of September 30, 2024, based on the aforementioned and other borrowing base calculations, we had the ability to draw up to an additional approximately $46.1 million on the current capacity of the revolver.
2027 NBC Loan
On March 7, 2024, we, through five of our wholly-owned Canadian subsidiaries (the “2027 NBC Loan Borrowers”), entered into a loan with National Bank of Canada (“NBC”) as administrative agent, National Bank Financial as lead arranger and sole bookrunner, and certain other lenders party thereto (the “2027 NBC Loan”). On such date, we drew the maximum aggregate borrowing of $75 million CAD pursuant to the 2027 NBC Loan. This loan is secured by the five properties owned by the 2027 NBC Loan Borrowers (the “Secured NBC Properties”).
Previously, four of the Secured NBC Properties were included in the borrowing base of the 2024 Credit Facility, and the other property was unencumbered. The net proceeds from the 2027 NBC Loan were used to pay down the 2024 Credit Facility by approximately $55.1 million, and accordingly, the respective four properties were released as collateral from the 2024 Credit Facility.
The 2027 NBC Loan has a maturity date of March 7, 2027, which may be extended for additional one-year periods in the discretion of the lenders. The 2027 NBC Loan carries a variable interest rate based on either the Canadian Overnight Repo Rate Average (“CORRA”) or the Canadian Prime Rate. As of September 30, 2024, borrowings under the 2027 NBC Loan were subject to interest at the CORRA rate, plus a CORRA adjustment of approximately 0.30%, plus a spread of 2.20%.
On March 12, 2024, we entered into an interest rate swap agreement based on CORRA with NBC whereby, inclusive of the swap we fixed the interest rate on the NBC Loan at 6.42% for the initial three-year term of the loan. The 2027 NBC Loan requires monthly amortizing principal and interest payments, which are based on a 25-year amortization schedule. The 2027 NBC Loan may be prepaid, in whole or in part, at any time upon prior written notice to the lenders, subject to interest rate swap breakage costs. We and the 2027 NBC Loan Borrowers provided an ordinary course environmental indemnity in favor of NBC and the lenders. We serve as a non-recourse guarantor, and each borrower provided a limited recourse guaranty up to the amount of the collateral pledged by it, under the 2027 NBC Loan.
Notes Offering
On April 19, 2022, we, as guarantor, and our operating partnership, as issuer, entered into a Note Purchase Agreement, or the Note Purchase Agreement, with the purchasers named therein. The Note Purchase Agreement provided for the private placement of $150 million of 4.53% Senior Notes due April 19, 2032, or the Notes. The sale and purchase of the Notes, or the Notes Offering, occurred in two closings, with the first of such closings having occurred on April 19, 2022 with $75,000,000 aggregate principal amount of the Notes having been issued on such date and the second of such closings having occurred on May 25, 2022 with $75,000,000 aggregate principal amount of the Notes having been issued on such date. Interest on each series of Notes will be payable semiannually on the nineteenth day of April and October in each year, beginning on October 19, 2022, until maturity.
Interest payable on the Notes was originally subject to a prospective 75 basis points increase, if, as of March 31, 2023, the ratio of total indebtedness to EBITDA, or the Total Leverage Ratio, of us and our subsidiaries, on a consolidated basis, was greater than 7.00 to 1.00, or a Total Leverage Ratio Event.
As of March 31, 2023, such Total Leverage Ratio Event occurred, and our Notes began accruing interest at a rate of 5.28%. The interest accruing on the Notes will continue to accrue at 5.28% until such time as the Total Leverage Ratio is less than or equal to 7.00 to 1.00 for two consecutive fiscal quarters. Upon such achievement, the applicable interest rate will revert to 4.53% and remain at that interest rate through maturity, regardless of our future Total Leverage Ratio.
93
We are permitted to prepay at any time all, or from time to time, any part of the Notes in amounts not less than 5% of the Notes then outstanding at (i) 100% of the principal amount so prepaid and (ii) the make-whole amount (as defined in the Note Purchase Agreement). The “Make-Whole Amount” is equal to the excess, if any, of the discounted value of the remaining scheduled payments with respect to the Notes being prepaid over the amount of such Notes. In addition, in connection with a change of control (as defined in the Note Purchase Agreement), our operating partnership is required to offer to prepay the Notes at 100% of the principal amount plus accrued and unpaid interest thereon, but without the Make Whole Amount or any other prepayment premium or penalty of any kind. We must also maintain a debt rating of the Notes by a rating agency.
The Note Purchase Agreement contains certain customary representations and warranties, affirmative, negative and financial covenants, and events of default that were substantially similar to the previously existing Credit Facility. The Notes were issued on a pari passu basis with the previously existing Credit Facility and are pari passu with the 2024 Credit Facility. As such, we and the Subsidiary Guarantors fully and unconditionally guarantee our operating partnership’s obligations under the Notes. The Notes were initially secured by a pledge of equity interests in the Subsidiary Guarantors on similar terms as the previously existing Credit Facility.
On April 26, 2024, we amended the Note Purchase Agreement (the “NPA Amendment”). The primary purpose of the NPA Amendment was to make certain conforming changes between the Note Purchase Agreement and the 2024 Credit Facility. In particular, the NPA Amendment conformed certain of the definitions related to the financial tests that we are required to maintain, as well as certain of the property pool covenants we are required to satisfy, in the Note Purchase Agreement during the term thereof to those in the 2024 Credit Facility.
Acquisition Facility
On November 19, 2024, we, through our operating partnership, entered into a credit facility with KeyBank, National Association, as administrative agent, and KeyBanc Capital Markets, Inc. as book runner and lead arranger, and certain other lenders that may become party thereto (the “Acquisition Facility”).
The initial commitment under the Acquisition Facility is $35 million, which may be increased by us up to a maximum total commitment of $175 million. Upon the closing of the Acquisition Facility, we immediately drew down an aggregate amount of approximately $15 million, which was used to fund the acquisition of a self storage facility. We intend to use the proceeds of the Acquisition Facility to fund future self storage facility acquisitions. As we make draw requests under the Acquisition Facility for such future acquisitions, each subsidiary of ours that owns such self storage facility will become a Subsidiary Guarantor under the Acquisition Facility.
The maturity date of the Acquisition Facility is November 19, 2025, subject to a six-month extension option, subject to the payment of an extension fee of 0.20% on the aggregate amount of the then-outstanding commitments for such extension, and it may be prepaid or terminated at any time without penalty; provided, however, that the lenders under the Acquisition Facility shall be indemnified for certain breakage costs.
Amounts borrowed under the Acquisition Facility bear interest based on the type of borrowing (either Base Rate Loans, Daily Simple SOFR Loans, or Term SOFR Loans, each as defined in the Acquisition Facility). Base Rate Loans bear interest at the lesser of (x) the Base Rate (as defined in the Acquisition Facility) plus the applicable rate, or (y) the maximum rate. Daily Simple SOFR Loans bear interest at the lesser of (a) Adjusted Daily Simple SOFR (as defined in the Acquisition Facility) plus the applicable rate, or (b) the maximum rate. Term SOFR Loans bear interest at the lesser of (a) Term SOFR (as defined in the Acquisition Facility) for the interest period in effect plus the applicable rate, or (b) the maximum rate. The corresponding applicable rate is (i) prior to the extension period, if any (A) 275 basis points for Daily Simple SOFR Loans and Term SOFR Loans and (B) 175 basis points for Base Rate Loans, and (ii) after the extension period, if any (A) 325 basis points for Daily Simple SOFR Loans and Term SOFR Loans and (B) 225 basis points for Base Rate Loans. The initial advance under the Acquisition Facility was a Daily Simple SOFR Loan that bears interest at 275 basis points over Adjusted Daily Simple SOFR.
94
The Acquisition Facility is fully recourse, jointly and severally, to us, our operating partnership, and certain of its subsidiaries (each, a “Subsidiary Guarantor”). In connection with the Acquisition Facility, each of us and any Subsidiary Guarantor executed a guaranty in favor of the lenders under the Acquisition Facility. It is an event of default under the Acquisition Facility if (a) there is a payment default by us, our operating partnership or any Subsidiary Guarantor under any recourse debt for borrowed money, or (b) there is a payment default by us or any of our subsidiaries under any non-recourse debt of at least $75 million.
The Acquisition Facility is initially secured by: (i) a pledge of equity interests in each Subsidiary Guarantor and (ii) a pledge of all net proceeds from any capital event of us or our subsidiaries, which includes equity issuances, sales of properties and refinancing of indebtedness, including this Offering.
The Acquisition Facility contains certain customary representations and warranties, affirmative, negative and financial covenants, borrowing conditions, and events of default. The financial covenants imposed on us are the same as the financial covenants imposed by the 2024 Credit Facility. The negative covenants include, among other things, a restriction on our ability to obtain additional recourse financing in the future with limited exceptions. If an event of default occurs and continues, our operating partnership is subject to certain actions by the administrative agent, including, without limitation, the acceleration of repayment of all amounts outstanding under the Acquisition Facility.
Credit Facility
On March 17, 2021, we, through our operating partnership, entered into a credit facility with KeyBank, National Association, as administrative agent, KeyBanc Capital Markets, Inc., Wells Fargo Securities, Citibank, N.A., and BMO Capital Markets, Corp., as joint book runners and joint lead arrangers, and certain other lenders party thereto (the “Credit Facility”).
The initial aggregate amount of the Credit Facility was $500 million, which consisted of a $250 million revolving credit facility (the “Credit Facility Revolver”) and a $250 million term loan (the “Credit Facility Term Loan”).
On October 7, 2021, our operating partnership and lenders who were party to the Credit Facility amended the Credit Facility to increase the commitment on the Credit Facility by $200 million. In connection with the increased commitment, additional lenders were added to the Credit Facility. As a result of this amendment, the aggregate commitment on the Credit Facility was $700 million.
The Credit Facility was repaid in full on February 22, 2024 in connection with the establishment of the 2024 Credit Facility.
Seasonality
We believe that we will experience minor seasonal fluctuations in the occupancy levels of our facilities, which we believe will be slightly higher over the summer months due to increased moving activity.
Critical Accounting Policies
We have established accounting policies which conform to GAAP. Preparing financial statements in conformity with GAAP requires management to use judgment in the application of accounting policies, including making estimates and assumptions. Following is a discussion of the estimates and assumptions used in setting accounting policies that we consider critical in the presentation of our consolidated financial statements. Many estimates and assumptions involved in the application of GAAP may have a material impact on our financial condition or operating performance, or on the comparability of such information to amounts reported for other periods, because of the subjectivity and judgment required to account for highly uncertain items or the
95
susceptibility of such items to change. These estimates and assumptions affect our reported amounts of assets and liabilities, our disclosure of contingent assets and liabilities at the dates of the financial statements and our reported amounts of revenue and expenses during the period covered by the financial statements contained in this prospectus. If management’s judgment or interpretation of the facts and circumstances relating to various transactions had been different, it is possible that different accounting policies would have been applied or different amounts of assets, liabilities, revenues and expenses would have been recorded, thus resulting in a materially different presentation of the financial statements or materially different amounts being reported in the financial statements. Additionally, other companies may use different estimates and assumptions that may impact the comparability of our financial condition and results of operations to those companies.
We believe that our critical accounting policies include the following: real estate acquisition valuation; the evaluation of whether any of our long-lived assets have been impaired; the valuation of goodwill and related impairment considerations, the valuation of our trademarks and related impairment considerations, the determination of the useful lives of our long-lived assets; and the evaluation of the consolidation of our interests in joint ventures. The following discussion of these policies supplements, but does not supplant the description of our significant accounting policies, as contained in Note 2 – Summary of Significant Accounting Policies of the Notes to the Consolidated Financial Statements for the year ended December 31, 2023 contained elsewhere in this prospectus, and is intended to present our analysis of the uncertainties involved in arriving upon and applying each policy.
Real Estate Purchase Price Allocation
We account for asset acquisitions in accordance with GAAP which requires that we allocate the purchase price of a property to the tangible and intangible assets acquired and the liabilities assumed based on their relative fair values. This guidance requires us to make significant estimates and assumptions, including fair value estimates, which requires the use of significant unobservable inputs as of the acquisition date.
The value of the tangible assets, consisting of land and buildings is determined as if vacant. Because we believe that substantially all of the leases in place at properties we will acquire will be at market rates, as the majority of the leases are month-to-month contracts, we do not expect to allocate any portion of the purchase prices to above or below market leases. We also consider whether in-place, market leases represent an intangible asset. Acquisitions of portfolios of facilities are allocated to the individual facilities based upon an income approach or a cash flow analysis using appropriate risk adjusted capitalization rates which take into account the relative size, age, and location of the individual facility along with current and projected occupancy and rental rate levels or appraised values, if available.
Our allocations of purchase prices are based on certain significant estimates and assumptions, variations in such estimates and assumptions could result in a materially different presentation of the consolidated financial statements or materially different amounts being reported in the consolidated financial statements.
Real Property Assets Valuation
We evaluate our real property assets for impairment based on events and changes in circumstances that may arise in the future and that may impact the carrying amounts of such assets. When indicators of potential impairment are present, we will assess the recoverability of the particular asset by determining whether the carrying value of the asset will be recovered, through an evaluation of the undiscounted future operating cash flows expected from the use of the asset and its eventual disposition. This evaluation is based on a number of estimates and assumptions, such as, but not limited to, comparative sales, estimated cash flow, and other similar valuation techniques. Based on this evaluation, if the expected undiscounted future cash flows do not exceed the carrying value, we will adjust the value of the real property asset and recognize an impairment loss. Our evaluation of the impairment of real property assets could result in a materially different presentation of the
96
financial statements or materially different amounts being reported in the financial statements, as the amount of impairment loss, if any, recognized may vary based on the estimates and assumptions we use.
Intangible Assets Valuation
In connection with the acquisition of the self storage advisory, asset management and property management businesses and certain joint venture interests of Strategic Asset Management I, LLC (f/k/a SmartStop Asset Management, LLC), our former sponsor (“SAM”), along with certain other assets of SAM (collectively, the “Self Administration Transaction”), we allocated a portion of the consideration to the contracts that we acquired related to the Managed REITs and the customer relationships related to our tenant insurance, tenant protection plans or similar programs (the “Tenant Protection Programs”). For these intangibles, we are amortizing such amounts on a straight-line basis over the estimated benefit period of the contracts and customer relationships. We evaluate these intangible assets for impairment when an event occurs or circumstances change that indicate the carrying value may not be recoverable. In such an event, an impairment charge is recognized and the intangible asset is marked down to its fair value.
Goodwill Valuation
Goodwill is recorded as the difference, if any, between the aggregate consideration paid for an acquisition and the fair value of the net tangible assets and other intangible assets acquired. Goodwill is allocated to various reporting units, as applicable, and is not amortized. We perform an annual qualitative impairment assessment as of December 31 for goodwill; between annual tests we evaluate the recoverability of goodwill whenever events or changes in circumstances indicate that the carrying amount of goodwill may not be fully recoverable. If circumstances indicate the carrying amount may not be fully recoverable, we perform a quantitative impairment test of goodwill to compare the fair value of each reporting unit to its respective carrying amount. If the carrying amount of goodwill exceeds its fair value, an impairment charge will be recognized. No impairment charges were recognized during the years ended December 31, 2023, 2022 or 2021 or during the nine months ended September 30, 2024.
Trademarks Valuation
Trademarks are based on the value of our brands. Trademarks are valued using the relief from royalty method, which presumes that without ownership of such trademarks, we would have to make a stream of payments to a brand or franchise owner in return for the right to use their name. By virtue of this asset, we avoid any such payments and record the related intangible value of our ownership of the brand name.
We qualitatively evaluate whether any triggering events or changes in circumstances have occurred subsequent to our annual impairment test that would indicate an impairment condition may exist. If any change in circumstance or triggering event occurs, and results in a significant impact to our revenue and profitability projections, or any significant assumption in our valuation methods is adversely impacted, the impact could result in a material impairment charge in the future.
Estimated Useful Lives of Real Property Assets
We assess the useful lives of the assets underlying our properties based upon a subjective determination of the period of future benefit for each asset. We record depreciation expense with respect to these assets based upon the estimated useful lives we determine. Our determinations of the useful lives of the assets could result in a materially different presentation of the consolidated financial statements or materially different amounts being reported in the financial statements, as such determinations, and the corresponding amount of depreciation expense, may vary dramatically based on the estimates and assumptions we use.
97
Consolidation Considerations
Current accounting guidance provides a framework for identifying a variable interest entity (“VIE”) and determining when a company should include the assets, liabilities, noncontrolling interests, and results of activities of a VIE in its consolidated financial statements. In general, a VIE is an entity or other legal structure used to conduct activities or hold assets that either (1) has an insufficient amount of equity to carry out its principal activities without additional subordinated financial support, (2) has a group of equity owners that are unable to make significant decisions about its activities, or (3) has a group of equity owners that do not have the obligation to absorb losses or the right to receive returns generated by its operations. Generally, a VIE should be consolidated if a party with an ownership, contractual, or other financial interest in the VIE (a variable interest holder) has the power to direct the VIE’s most significant activities and the obligation to absorb losses or right to receive benefits of the VIE that could be significant to the VIE. A variable interest holder that consolidates the VIE is called the primary beneficiary. Upon consolidation, the primary beneficiary generally must initially record all of the VIE’s assets, liabilities, and noncontrolling interest at fair value and subsequently account for the VIE as if it were consolidated based on majority voting interest.
We evaluate the consolidation of our investments in VIE’s in accordance with relevant accounting guidance. This evaluation requires us to determine whether we have a controlling interest in a VIE through a means other than voting rights, and, if so, such VIE may be required to be consolidated in our financial statements. Our evaluation of our VIE’s under such accounting guidance could result in a materially different presentation of the financial statements or materially different amounts being reported in the financial statements, as the VIE’s included in our consolidated financial statements may vary based on the estimates and assumptions we use.
Quantitative and Qualitative Disclosures About Market Risk
Market risk includes risks that arise from changes in interest rates, foreign currency exchange rates, commodity prices, equity prices and other market changes that affect market sensitive instruments. In pursuing our business plan, we expect that the primary market risk to which we will be exposed is interest rate risk and to a lesser extent, foreign currency risk. We may be exposed to the effects of interest rate changes primarily as a result of borrowings used to maintain liquidity and fund acquisition, expansion, and financing of our real estate investment portfolio and operations. Our interest rate risk management objectives will be to limit the impact of interest rate changes on earnings and cash flows and to lower overall borrowing costs. To achieve our objectives, we may borrow at fixed rates or variable rates. We may also enter into derivative financial instruments such as interest rate swaps and caps in order to mitigate our interest rate risk on a related financial instrument. We will not enter into derivative or interest rate transactions for speculative purposes.
As of September 30, 2024, our net debt was approximately $1,180 million, which included approximately $519 million in fixed rate debt and approximately $664 million in variable rate debt, less approximately $3.3 million in net debt issuance costs. As of December 31, 2023, our net debt was approximately $1,087.4 million, which included approximately $523.1 million in fixed rate debt, and $568.7 million in variable rate debt, less approximately $0.1 million in debt discount, and approximately $4.3 million in net debt issuance costs. As of December 31, 2022, our net debt was approximately $1,068.4 million, which included approximately $442.8 million in fixed rate debt, and $630.2 million in variable rate debt, less approximately $0.1 million in debt discount, and approximately $4.5 million in net debt issuance costs. Our debt instruments were entered into for other than trading purposes.
Changes in interest rates have different impacts on the fixed and variable debt. A change in interest rates on fixed rate debt impacts its fair value but has no impact on interest incurred or cash flows. A change in interest rates on variable debt could impact the interest incurred and cash flows and its fair value. As of September 30, 2024, if the underlying rate of the related index on our variable rate debt were to increase by 100 basis points, the increase in interest, net of our interest rate derivatives, would decrease future earnings and cash flows by approximately $2.6 million annually.
98
Interest rate risk amounts were determined by considering the impact of hypothetical interest rates on our financial instruments. These analyses do not consider the effect of any change in overall economic activity that could occur. Further, in the event of a change of that magnitude, we may take actions to further mitigate our exposure to the change. However, due to the uncertainty of the specific actions that would be taken and their possible effects, these analyses assume no changes in our financial structure.
The following table summarizes annual debt maturities and average interest rates on our outstanding debt as of September 30, 2024 (in thousands):
| | | | | | | | | | | | | | | | | | | | | | | | | | | | |
| | | 2024 | | | 2025 | | | 2026 | | | 2027 | | | 2028 | | | Thereafter | | | Total | |
Fixed rate debt | | $ | 703 | | | $ | 2,985 | | | $ | 93,286 | | | $ | 49,566 | | | $ | 78,431 | | | $ | 294,500 | | | $ | 519,471 | |
Average interest rate(1) | | | 4.96 | % | | | 4.96 | % | | | 5.05 | % | | | 5.23 | % | | | 5.23 | % | | | 5.14 | % | | | | |
Variable rate debt | | $ | 212 | | | $ | 5,963 | | | $ | 1,047 | | | $ | 656,556 | | | $ | — | | | $ | — | | | $ | 663,778 | |
Average interest rate(1) | | | 6.91 | % | | | 6.90 | % | | | 6.90 | % | | | 6.90 | % | | | — | | | | — | | | | | |
| (1) | | Interest expense for fixed rate debt was calculated based upon the contractual rate and the interest expense on variable rate debt was calculated based on the rate in effect on September 30, 2024, excluding the impact of interest rate derivatives. (See Note 5 – Debt Of the notes to our consolidated financial statements for the nine months ended September 30, 2024 contained elsewhere in this prospectus for more information.) Debt denominated in foreign currency has been converted based on the rate in effect as of September 30, 2024. |
Currently, our only foreign exchange rate risk comes from our Canadian properties and the CAD. Our existing foreign currency hedges mitigate most of our foreign currency exposure of our net CAD denominated investments; however, we generate all of our revenues and expend essentially all of our operating expenses and third party CAD-denominated debt service costs related to our Canadian Properties in CAD. As a result of fluctuations in currency exchange, our cash flows and results of operations could be affected.
99
THE SELF STORAGE INDUSTRY AND MARKET DATA
U.S. Self Storage Industry Overview
Product and Customer Overview
Self storage refers to properties that offer month-to-month storage unit rental for personal or business use. Self storage facilities offer a cost-effective and flexible storage alternative in which customers rent fully enclosed and secure spaces. The short-term nature of self storage leases creates the opportunity for real-time rate increases, which has led well-positioned facilities to achieve substantial rate growth in a rising cost environment. In addition to primary self storage operations, facilities tend to have a number of other ancillary products that provide incremental revenues. This includes, but is not limited to, tenant insurance, protection or insurance plans, truck rentals, moving and packing supplies, locks and boxes and other services. Sophisticated operators have the opportunity to substantially increase profitability of under-managed facilities post acquisition. The customer base of self storage operators includes both local residential customers, typically within a 3- to 5-mile radius of the facility, as well as commercial users. According to the 2024 Self-Storage Almanac, self storage facilities
generally have a customer mix of approximately 80% residential, 13% commercial, 4% military and 3% students.
Sector Investment Highlights
We believe relatively low capital expenditures, proven resistance to economic downturns and tenant diversification at the property-level present compelling risk adjusted investment characteristics. Additionally, the growing importance of technology implementation benefits operators with substantial scale and access to capital.
| | • | | Operators typically budget a small portion of capital expenditures as a percentage of net operating income (approximately 5%). |
| | • | | The self storage industry has displayed resilience through previous economic downturns. The increased storage demand in the event of homeowner and renter “downsizing” represents an embedded counter- cyclical demand driver, improving the risk adjusted return profile of the sector. |
| | • | | The broad and diversified rental profile for self storage has created sustained demand, which has allowed operators to achieve high occupancy levels while increasing rental rates. |
| | • | | The implementation of smart technology has driven accelerating performance for large or sophisticated operators. Online rental processing, online marketing and revenue management data analytics have driven increased top-line performance. The need for a comprehensive technology offering benefits large scale and well-capitalized operators in the competitive landscape. |
| | • | | Large operators typically benefit from economies of scale spreading costs more efficiently related to call centers, internet marketing, software, umbrella insurance policies and other economies of scale that are spread across the operator’s platform. |
| | • | | There are few substitutions for the self storage industry. Home storage is often impractical and portable storage containers are often prohibited by zoning restrictions. Valet storage has had limited adoption from customers. |
Long-Term Market Performance
The combination of attractive fundamentals and superior operating performance has driven self storage to outperform other real estate sectors in both the private and public markets. According to NAREIT, the self storage sector has been one of the best performing REIT sectors since 1994. While past performance is not indicative of future results, as depicted in Figure 1, a $100 investment in the self storage sector in 1994 would have yielded $6,941 through 2023, a total return of approximately 6,900%. The second best performing NAREIT real estate sub-sector, residential, would have yielded a value of $2,036 over the same period, while a $100 investment in lodging / resorts would have only yielded $345. Furthermore, the self storage sector was the best performing real estate sector in 2021 and was the fifth best performing real estate sector in 2023. The sector is well-positioned for continued growth, as self storage fundamentals remain favorable.
100
Figure 1: Historical Return of $100 Invested in the REIT Sector (Since 1994)
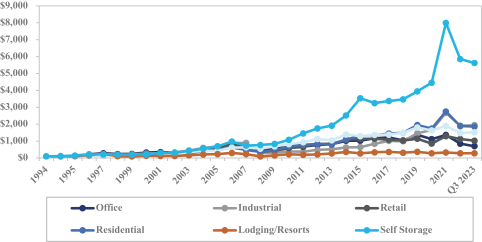
Source: NAREIT
Furthermore, according to NAREIT and as depicted in Figure 2, the self storage REIT sector has produced an average total return on investment since 1994 that was nearly 5.6% higher than the average across other real estate sectors. In addition, the sector has experienced approximately 0.7% less volatility than the average across other real estate sectors since 1994, as measured by the standard deviation of total return.
Figure 2: REIT Average Total Return and Standard Deviation (Since 1994)
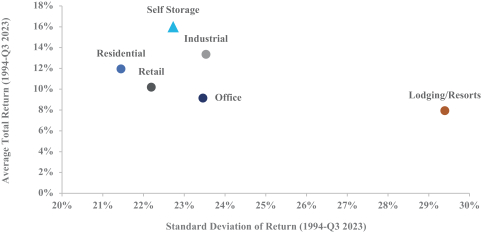
Source: NAREIT
101
Size and Fragmentation
The self storage industry is highly fragmented, with owners and operators ranging from individual property owners to blue chip institutional investors and large, publicly traded REITs. According to the 2024 Self-Storage Almanac, there are approximately 52,300 primary self storage facilities in the United States representing a total of 2.1 billion rentable square feet. As depicted in Figure 3, the largest 100 operators manage approximately 60% of net rentable square footage, but only 35% of all U.S.-based self storage properties. The U.S. Listed Self Storage REITs and AMERCO (NASDAQ: UHAL) operate approximately 23% of all U.S.-based self storage net rentable square feet. With approximately half of the existing supply operated locally by non-institutional groups, there is a significant market opportunity to acquire existing facilities and increase revenue and profitability through professional management, technological platforms and physical expansion projects.
Figure 3: Market Share of Largest Self Storage Operators(1)
Source: 2024 Self-Storage Almanac
| (1) | | Market share by largest public self storage operators and all other private operators based on number of facilities. |
Customer Proximity
Historical trends show that renters have placed significant emphasis on location when choosing a self storage facility. As depicted in Figure 4, over 69% of renters pick a facility within 20 minutes of their location and nearly 88% of renters choose a facility within 30 minutes. High-density, high-traffic population centers tend to be ideal locations for self storage properties and often demand a higher rental rate as a result. We believe well- positioned portfolios in higher-density and/or higher growth locations should continue to enjoy strong demand.
102
Figure 4: Renter Proximity from Storage Unit
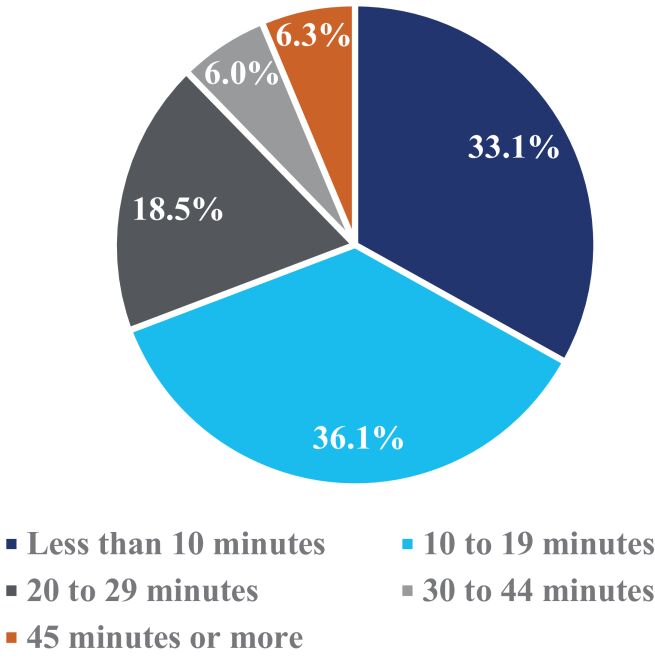
Source: 2024 Self-Storage Almanac
Technology and Marketing
While customers still opt for self storage facilities within a nearby proximity, the buying process has shifted, as more technology has been implemented across the business. According to the 2024 Self-Storage Almanac, only 39% of customers began the buying process by physically going to a self storage location. Customers are much more likely to seek pricing or reviews either online or over the phone. Call centers and websites are becoming important tools for finding and maintaining customers, giving larger and more sophisticated operators a potential advantage over smaller operators due to high customer acquisition costs. In addition to marketing, technology is becoming more widely used in all aspects of operating self storage facilities. Revenue management software can provide operators with market conditions and customer data that can assist in setting rental rates and maximizing revenue. The implementation of technology in the industry is ongoing and could factor into the customer decision making process.
Population Growth
Both millennials and the aging baby boomer generation are expected to drive population and migration growth. Urbanization trends, popular among millennials over the last decade, have created incremental demand for storage as renters downsize to smaller living spaces. More frequent move patterns, in addition to delays in home ownership among younger generations suggests continued increases in demand for self storage space. Additionally, as baby boomers continue to age and retire, the likely corresponding downsizing and/or relocation will continue to drive increased demand for storage units from renters with significant physical possessions and a need for space. Large amounts of wealth among the baby boomer generation built through home equity is also expected to contribute to rental rate growth.
Self Storage Fundamentals
Strength in housing markets and the ability for employees to work remotely has fueled demand for storage, leading to record periods of operating performance across the industry in both 2021 and 2022 and the first nine months of 2023. High occupancy levels, supply constraints and inelasticity in pricing, coupled with underlining demand drivers, position the sector for continued rent growth and accelerating profitability. These drivers have allowed the self storage sector to achieve outsized rent growth relative to other REIT sectors in 2021 and 2022 and the first nine months of 2023. While the work from home environment remains elevated over pre-COVID-19 pandemic levels, this trend began to wane in 2023, which we believe has led to elevated move-outs. As a result,
103
occupancy, same-store growth and overall results have been normalizing. Further, the broader economy has been experiencing elevated levels of inflation, higher interest rates, tightening monetary policies and a slowdown in home price appreciation and home sales. This could result in less discretionary spending, weakening consumer balance sheets and reduced demand for self storage. Additionally, a prolonged period of elevated inflation and/or higher interest rates could result in a further contraction of self storage demand. However, demand for the self storage sector is dynamic with drivers that function in a multitude of economic environments, both cyclically and counter-cyclically. Demand for self storage tends to be needs-based, with numerous factors that lead customers to renting and maintaining storage units. We believe the nimble rate and leasing strategies that sophisticated operators have executed on, coupled with the improving supply environment, should position self storage favorably to achieve incremental growth in a variety of economic environments, including an inflationary environment.
High Industry Occupancy
As demand for storage space has outpaced new supply, the sector has experienced strong occupancy with limited vacant space available. According to the 2024 Self-Storage Almanac, recent and continuing trends among renters converting in-home storage space to office and workout rooms as remote work becomes more widely adopted is expected to continue to drive demand for space. Additionally, comprehensive online marketing platforms have allowed sophisticated operators to reach more customers and achieve high occupancy levels in the sector relative to historical averages. As depicted by Figure 5, while self storage operators have achieved a strong average occupancy of more than 91% from 2015 through the second quarter of 2023, occupancy has accelerated in the current cycle with the existing stock nearly fully occupied.
Figure 5: Historical Quarterly National Occupancy Rate
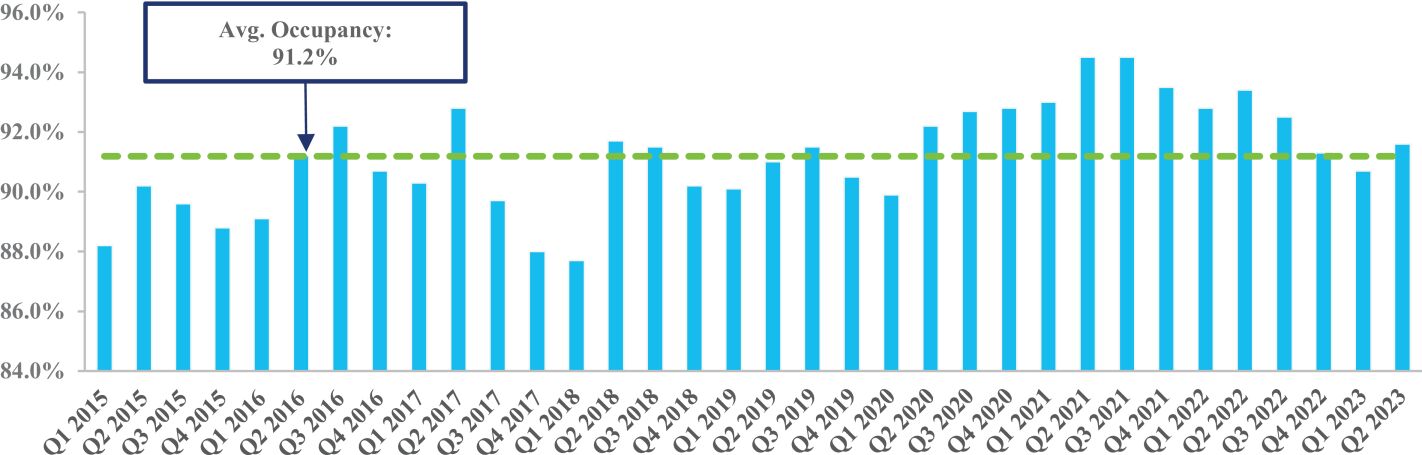
Source: 2024 Self Storage Almanac
Price Inelasticity
Demand for self storage tends to be price inelastic. Self storage operators have capitalized on shifts in demand drivers in order to assign appropriate and accelerating rental rates. Larger operators have utilized software programs to maximize operational efficiencies and set real-time pricing strategies adjusting for seasonality and shifts in demand. Figure 6 depicts the relationship between average physical occupancy and the national average asking rent for a climate controlled 10x10 foot unit. While asking rent has increased since the height of the COVID-19 pandemic, occupancy has typically increased proportionally, demonstrating the ability for operators to raise rents without sacrificing occupancy.
104
Figure 6: Average Asking Rent vs. Average Physical Occupancy
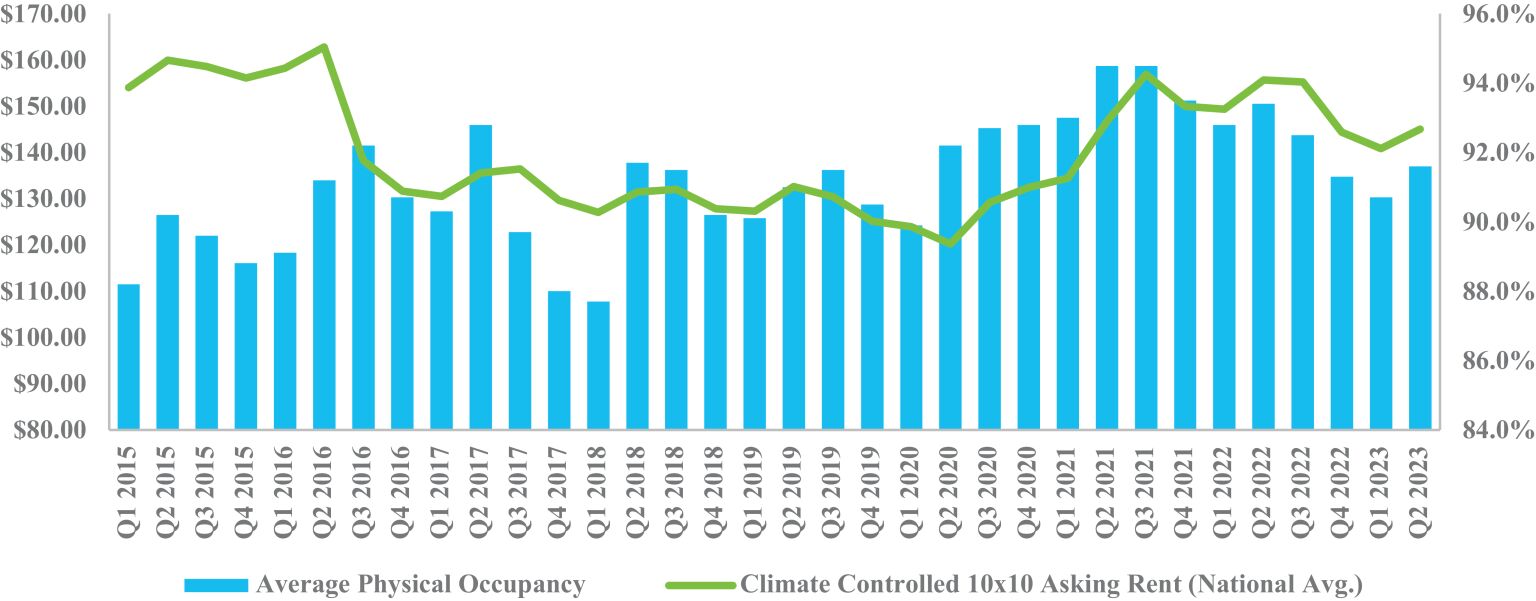
Source: 2024 Self-Storage Almanac
Rent Growth
High occupancy, limited new supply and price inelasticity have all driven the self storage sector to achieve rent growth above historical averages. We believe the real-time, data driven rate and leasing strategies that sophisticated operators have executed on, coupled with the current supply and demand environment, should position self storage favorably to achieve superior rental and net operating income growth. Figure 7 depicts rental rates from 2013 through the second quarter of 2023. The U.S. Listed Self Storage REITs reported an average of (0.7%) same-store revenue growth in the second quarter of 2024. Rate growth has leveled off from then, however, from a period of outsized growth. According to Cushman & Wakefield, asking rental rates decreased (4.5%) in the first quarter of 2024 compared to the first quarter of 2023.
Figure 7: Increased Rental Growth since the COVID-19 Pandemic
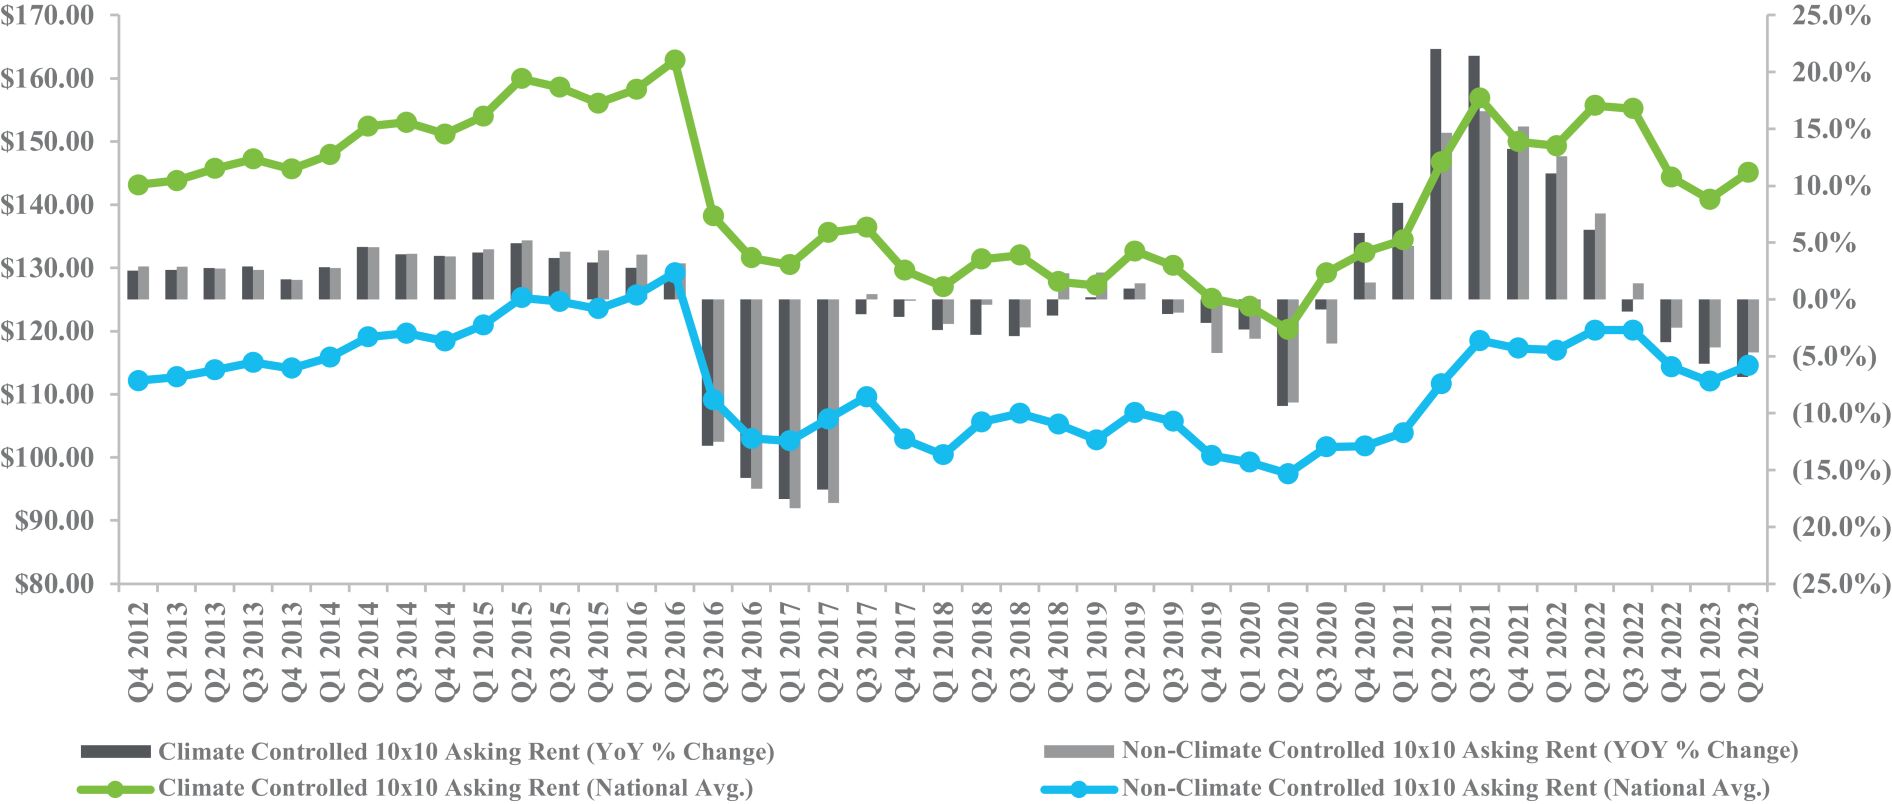
Source: 2024 Self-Storage Almanac
105
Accelerating Profitability
Net operating income growth among U.S. Listed Self Storage REITs materially outpaced annual CPI immediately after the COVID-19 pandemic. According to NAREIT, the U.S. Listed Self Storage REITs experienced Same-Store NOI, or SSNOI, growth during the first and second quarters of 2024 of (1.5%) and (1.8%), with inflation dropping to levels of 3.0%. Figure 8 highlights SSNOI growth versus annual CPI since the first quarter of 2000.
Figure 8: Same-Store NOI Growth vs. Inflation
Source: NAREIT, U.S. Bureau of Labor Statistics
Canadian Self Storage and Market Overview
According to Colliers, there are approximately 3,390 self storage facilities in Canada totaling approximately 90 million square feet. In comparison to the U.S. self storage market, which totals approximately 52,300 stores and 2.1 billion rentable square feet according the 2024 Self-Storage Almanac, the Canadian self storage market is less than one-twentieth the size by square feet and less than one-fifteenth the size by store count. Colliers estimates Canada has roughly 2.3x square feet of self storage space per capita. Having grown from roughly 2.5x square feet per capita in the mid-1990s according to Green Street, the United States currently has 6.3x square feet per capita according to the 2024 Self-Storage Almanac, suggesting the Canadian self storage market is relatively under-penetrated with a long runway for growth.
The three largest self storage markets in Canada are Toronto, Montreal, and Vancouver, which collectively account for over 570 stores, or approximately 17% of total supply by store count, and 32 million square feet, or approximately 36% of total supply by square feet. The three other primary markets—Calgary, Edmonton and Ottawa—comprise of over 240 stores and approximately 10 million square feet. Collectively, the six primary Canadian markets are home to just over 24% of the total stores in Canada, and just under 50% of total square feet in Canada.
106
Figure 9: Primary Canadian Market Supply Ratios
| | | | |
CMA | | Supply Ratio | |
Toronto | | | 2.3x | |
Montreal | | | 2.0x | |
Vancouver | | | 2.5x | |
Edmonton | | | 2.8x | |
Calgary | | | 2.3x | |
Ottawa / Gatineau | | | 2.2x | |
| | | | |
Canada | | | 2.3x | |
U.S. | | | 6.3x | |
| | | | |
Source: Colliers, SNL, 2024 Self-Storage Almanac
Similar to the United States, the self storage market in Canada exhibits highly fragmented ownership, albeit to a much greater extent. Colliers estimates that approximately 70% of all stores in Canada are owned by individuals with one or two stores. The top 10 operators in Canada have roughly 20% market share by store count, as compared to 26% market share for the top 10 operators in the United States.
Supply & Demand
There has been significant growth in demand for storage space in Canada over the past decade, largely attributable to population growth, densification of living areas and workspaces, e-commerce and last-mile solutions. These trends are expected to continue into 2024 and future years.
The Canadian self storage market has remained resilient despite experiencing significant growth over recent years. National occupancy levels continue to be in excess of 80% and remain persistent due to absorption of pent-up demand. High population growth has, and will continue to, prop up demand for self storage space across the country. Barriers to entry have historically, and are expected to continue to, moderate the pace of new developments. Namely, these barriers are in the form of increasing development costs, zoning challenges, and extended project timelines. Per Colliers, the costs of critical materials needed for storage development continue to rise, with prices for concrete, equipment, metal fabrications, and structural steel all having risen over 50% since 2017.
As a result of fewer zoning and development challenges, supply growth in the United States has increasingly stemmed from building larger stores. According to Green Street, the average store size for new developments in the top U.S. MSAs is roughly 75,000 square feet versus 65,000 square feet for existing same-store supply, or roughly a 15% increase. This compares to an average store size in the GTA of roughly 67,000 square feet. Based on Canada’s current national supply ratio of approximately 2.3x and StatCan’s June 2024 medium growth projection for Canada’s population over the next five years, the total Canadian storage market would need to add approximately 9.5 million square feet of new supply annually over the next five years to increase the supply ratio from 2.3x to 3.3x. This equates to a 53% increase to current supply, or 47.7 million total square feet.
Greater Toronto Area Self Storage and Market Overview
As Canada’s largest metro area, the GTA, is rapidly expanding its population of younger workers. Professionals are drawn to the GTA by its sustained focus on immigration and high quality, ubiquitous academic resources, which has resulted in the GTA quickly becoming an emerging market for the digital economy. Supported by strong demographic trends (according to Claritas, S&P Global, and Statistics Canada, GTA population growth from 2024 through 2029 is expected to be approximately 630 bps greater than the U.S. average), we believe the GTA continues to represent a compelling market opportunity, highlighted by low supply per capita (according to Colliers and the 2024 Self-Storage Almanac, the GTA has 2.3x square feet per capita vs. 6.3x in the United States), increasing product utilization and limited institutional competition.
107
Toronto is home to approximately 2.8 million people and the GTA has an estimated 7.7 million people, which would make it the third largest U.S. city and sixth largest MSA. Toronto is one of the world’s premier financial centers and home to the Toronto Stock Exchange (TSX). Despite strong roots in the financial services and asset management industries, Toronto is quickly becoming one of the premier technology hubs in the world. According to Statistics Canada, there were a total of 314,100 tech jobs, as well as an additional 543,100 supporting roles at tech firms, in Toronto in 2023. According to CBRE and Statistics Canada, since 2018, the number of tech jobs in the city has grown by 44.0%. Average wages for tech workers in Toronto currently sit at nearly CAD $106,000 having grown 26.2% over the same period. In aggregate, Toronto was the #4 market across the U.S. and Canada for tech talent growth, adding 95,900 jobs between 2018 and 2023.
Toronto exhibits many favorable characteristics for the self storage business. The city has a very dense population with a strong tenant base and high levels of rentership. Likewise, given the high cost of rentership and ownership, residents tend to live in relatively small dwellings with less areas to store goods. Per Colliers, the average condo unit size in Toronto has shrunk 35% since the 1990s. Potential cost of living pressures coupled with this continued reduction in space may result in renters downsizing their living quarters and increasing the demand for storage. According to the Toronto Regional Real Estate Board, the average selling price for a home in the GTA was $1.1 million in for 2024, representing a 37% increases since 2019 driven primarily by lack of supply. Moreover, there is strong population growth with the GTA expected to grow by 8.8% through 2029 versus a weighted average of 2.4% expected in the top 25 U.S. MSA’s over the same period. There is also a very low supply per capita of storage, at around 2.3x square feet per person as opposed to approximately 6.3x square feet per person in the United States.
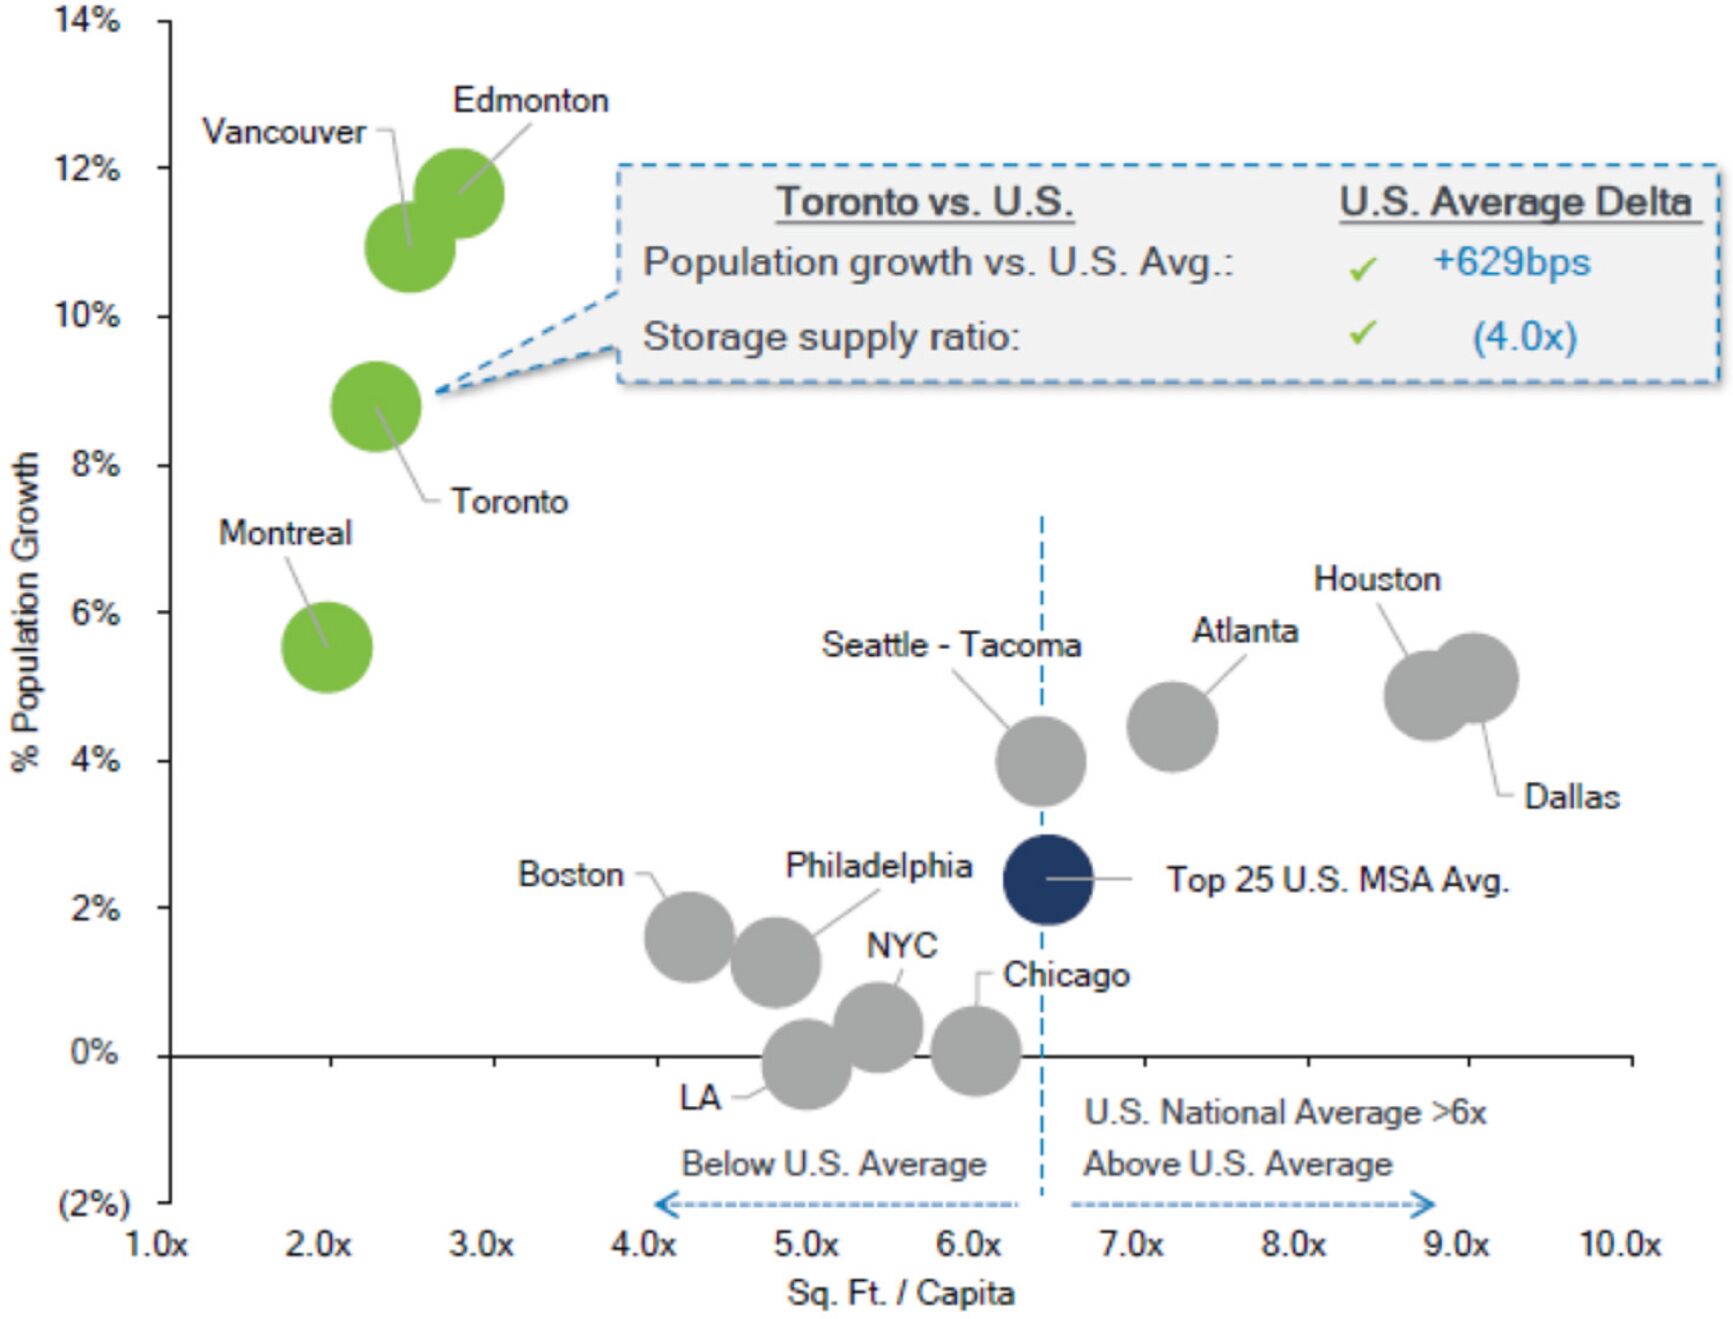
Source: StatCan, SNL Financial, and 2024 Self Storage Almanac
108
Self storage is a relatively new and bourgeoning product in Toronto and the utilization of the product is increasing at a faster pace than in the United States. Finally, self storage ownership in the GTA is also highly fragmented, albeit to a lesser degree than the overall Canadian market. As depicted in Figure 10, as the largest institutional owner in the GTA by square footage, we, alongside the second largest, U-Haul, have an estimated 24% market share, with the next seven owners representing an incremental 33%. The remaining roughly 43% of self storage facilities in the GTA are owned by local and regional owners.
Figure 10: Self Storage Ownership in GTA
Source: Colliers
Based on the GTA’s current supply ratio of 2.3x and projected population growth over the next five years, the GTA market would need to absorb approximately 2.0 million square feet of new supply annually over the next five years to increase the supply ratio from 2.3x to 3.3x. This equates to a 59% increase to current supply, or 10.0 million total square feet.
109
OUR BUSINESS AND SELF STORAGE PROPERTIES
Our Company
We are a premier owner and operator of self storage facilities in the United States and Canada. We are internally managed and have built a fully integrated, technology-enabled, data-driven, and scalable platform that is positioned for growth. We operate an institutional-quality portfolio of self storage properties that are located primarily within top metropolitan statistical areas, or MSAs, throughout the United States and within top census metropolitan areas, or CMAs, in Canada, including the Greater Toronto Area, or GTA. According to the Inside Self Storage Top- Operators List for 2024, we are the tenth largest owner and operator of self storage properties in the United States and, according to Colliers, the largest in the GTA based on rentable square footage. As of September 30, 2024, we owned or managed 202 operating stores across 22 states and three provinces in Canada, comprising approximately 143,190 units and 16.1 million net rentable square feet.
The following table summarizes our owned and managed operating properties in our portfolio as of September 30, 2024:
| | | | | | | | | | | | | | | | |
Operating Portfolio Snapshot | | # of
Stores | | | Net Rentable
Sq. Ft. | | | Units | | | 3Q24
Ending
Occupancy | |
Wholly-owned Stores | | | 157 | | | | 12,208,000 | | | | 106,300 | | | | 92.2 | % |
Joint Venture Stores | | | 10 | | | | 897,400 | | | | 9,440 | | | | 80.0 | % |
| | | | | | | | | | | | | | | | |
Total Owned Stores | | | 167 | | | | 13,105,400 | | | | 115,740 | | | | | |
Managed Stores | | | 35 | | | | 3,040,200 | | | | 27,450 | | | | | |
| | | | | | | | | | | | | | | | |
Total Stores | | | 202 | | | | 16,145,600 | | | | 143,190 | | | | | |
We believe the self storage sector has distinguished itself as a core asset class with attractive long-term organic growth characteristics and strong free cash flow generation. We expect long-term self storage drivers, which include population growth, the percentage of renter occupied housing units and self storage supply constraints, to continue to underpin competitive risk adjusted returns relative to the broader real estate sector.
Since our founding, we have built a leading self storage brand in the United States and Canada, growing our total operating portfolio to 202 operating properties as of September 30, 2024. We have seen meaningful growth in our owned and managed portfolio, growing from 83 stores as of January 1, 2019 to 202 as of September 30, 2024 (representing a 16% CAGR). We maintain an investment strategy focused on acquiring or developing properties located in high quality sub-markets that offer our customers convenient, affordable and secure access to self storage units. Furthermore, we have created a scalable, leading technology-enabled platform that drives customer acquisition, customer service efficiencies and revenue management capabilities that optimize profitability across the portfolio.
A unique element to our growth story has been the successful expansion of our Canadian portfolio. Upon completion of this offering, we believe we will be the only U.S. listed self storage REIT with an owned portfolio and operating platform in Canada (including in the GTA, one of the fastest growing and undersupplied markets in North America). Supported by strong demographic trends (according to Claritas, S&P Global, and Statistics Canada), GTA population growth from 2024 through 2029 is expected to be approximately 630 bps greater than the U.S. average. We believe Canada presents a compelling investment opportunity as home to several of the most attractive North American storage markets, highlighted by low supply per capita (2.3 square feet of existing self-storage space per capita in the GTA vs. 6.3 in the United States, according to Colliers and the 2024 Self-Storage Almanac), increasing product utilization, top-tier demographic trends, and limited institutional competition. Our joint venture in Canada with SmartCentres, one of the largest Toronto Stock Exchange-listed REITs, provides a pipeline of development opportunities at well-trafficked locations within demographically advantaged CMAs. As of September 30, 2024, we owned or managed a portfolio of 33 operating properties comprising 3.1 million square feet in the GTA. This number included 13 wholly-owned facilities and 10 facilities in unconsolidated joint ventures, in which we maintain a 50% equity interest. This number also included 10 facilities under management that were wholly-owned by the Managed REITs.
110
We employ a multi-pronged growth strategy focused on organic and external growth. We aim to grow the cash flow of our existing portfolio by utilizing our revenue management systems to grow revenue and leverage the scalability of our platform to increase expense efficiencies over time. Additionally, we expect to grow externally via acquisitions of newly built properties, ground up developments and strategic stabilized acquisitions, all of which we can execute either on-balance sheet or off-balance sheet through our Managed REITs. Our same-store portfolio, which represents 93.4% of our owned operating portfolio as measured by net rentable square feet, has averaged 8.3% NOI growth over the three-year period ended September 30, 2024. We have deep acquisition capabilities that allow us to focus on properties across the asset life cycle, from ground-up development to stabilized property acquisitions in many of the top MSAs in the United States and CMAs in Canada. Additionally, through a subsidiary, we serve as the sponsor of the Managed REITs. Our Managed REITs not only generate fees that offset our operating and general and administrative expenses but also enable us to strategically expand our platform off-balance sheet while providing potential future acquisition opportunities. Upon completion of this offering, we expect to have a fortified balance sheet with low leverage and ample liquidity that will position us to take advantage of growth opportunities.
Our Founder, Chairman and Chief Executive Officer, H. Michael Schwartz, founded our company in 2013, recognizing a market opportunity for a differentiated public self storage REIT focused on high quality self storage assets in high growth markets across the United States and Canada. Mr. Schwartz entered the self storage business in 2005 and has established a successful 20-year track record in the sector. In 2007, Mr. Schwartz founded Strategic Storage Trust, Inc., which became a fully integrated and self-managed self storage company that grew to own and/or operate 169 self storage properties and was ultimately sold to Extra Space Storage, Inc. for $1.4 billion in October 2015. In addition to Mr. Schwartz, we maintain a seasoned and multidisciplined executive management team with over 20 years of storage experience, on average.
We are organized as a Maryland corporation that has elected to be taxed as a REIT with operational headquarters in Ladera Ranch, CA. We generally will not be subject to U.S. federal income tax on our REIT taxable income to the extent that we distribute annually 100% of our REIT taxable income (including capital gains and computed without regard to the dividends paid deduction) to our stockholders and maintain our intended qualification as a REIT. We serve as the sole general partner of, and operate our business through, our operating partnership subsidiary, SmartStop OP, L.P., a Delaware limited partnership. Our operating partnership enables us to facilitate additional tax deferred acquisitions using OP units as consideration for these transactions.
Our Competitive Strengths
High-quality and Diversified Self Storage Portfolio. We own a large, geographically diversified portfolio comprised exclusively of self storage properties. Our portfolio consists of 167 wholly-owned and joint venture operating self storage properties located in 19 states and Ontario, Canada. Our largest markets based on square footage owned include: Toronto, ON; Miami–Ft. Lauderdale, FL; Las Vegas, NV; Asheville, NC; Los Angeles, CA; and Houston, TX. Our properties are primarily located in high quality markets with attractive supply and demand characteristics. Many of these markets exhibit multiple barriers to entry against increased supply, including zoning restrictions that limit new self storage construction. Furthermore, we believe that our scale and the overall geographic diversification of our portfolio reduces risks associated with specific local or regional economic downturns or natural disasters.
111
The following map highlights the geographic diversification of our owned and managed operating
properties in our portfolio, as of September 30, 2024:

112
The following table summarizes information about our wholly-owned and owned joint venture operating properties in our portfolio by MSA and the census metropolitan area, or CMA, as of September 30, 2024:
| | | | | | | | | | | | | | | | | | | | | | | | |
MSA/CMA(1) | | % of
Portfolio
by
NRSF | | | Net
Rentable
Sq. Ft. | | | Units | | | # of
Stores | | | 3Q24 Ending
Occupancy | | | 3Q24
RentPOF | |
Toronto | | | 15.3 | % | | | 2,008,100 | | | | 20,050 | | | | 23 | | | | 86.8 | % | | $ | 20.47 | |
Miami – Fort Lauderdale | | | 9.3 | % | | | 1,221,100 | | | | 10,470 | | | | 12 | | | | 84.6 | % | | $ | 25.66 | |
Asheville | | | 6.6 | % | | | 869,900 | | | | 6,200 | | | | 14 | | | | 92.8 | % | | $ | 16.80 | |
Las Vegas | | | 6.6 | % | | | 865,000 | | | | 7,160 | | | | 9 | | | | 93.9 | % | | $ | 18.81 | |
Los Angeles | | | 5.6 | % | | | 738,500 | | | | 6,990 | | | | 11 | | | | 91.4 | % | | $ | 25.05 | |
Houston | | | 5.2 | % | | | 676,800 | | | | 5,130 | | | | 9 | | | | 93.2 | % | | $ | 19.02 | |
Tampa | | | 3.6 | % | | | 478,100 | | | | 3,890 | | | | 5 | | | | 93.8 | % | | $ | 18.46 | |
Denver | | | 3.3 | % | | | 437,300 | | | | 3,860 | | | | 7 | | | | 91.8 | % | | $ | 18.47 | |
Chicago | | | 3.3 | % | | | 432,450 | | | | 3,785 | | | | 6 | | | | 91.5 | % | | $ | 15.68 | |
Seattle - Tacoma | | | 3.0 | % | | | 390,550 | | | | 3,430 | | | | 5 | | | | 92.8 | % | | $ | 20.38 | |
Dayton | | | 2.9 | % | | | 375,800 | | | | 3,390 | | | | 7 | | | | 93.2 | % | | $ | 12.78 | |
Phoenix | | | 2.5 | % | | | 329,100 | | | | 3,130 | | | | 4 | | | | 93.0 | % | | $ | 17.50 | |
San Francisco - Oakland | | | 2.5 | % | | | 322,600 | | | | 2,920 | | | | 4 | | | | 90.0 | % | | $ | 23.90 | |
Port St. Lucie | | | 2.4 | % | | | 318,900 | | | | 2,610 | | | | 4 | | | | 93.6 | % | | $ | 19.53 | |
Sacramento | | | 2.4 | % | | | 308,100 | | | | 2,895 | | | | 4 | | | | 89.5 | % | | $ | 16.38 | |
Riverside - SB | | | 2.3 | % | | | 306,700 | | | | 2,690 | | | | 5 | | | | 94.0 | % | | $ | 21.67 | |
Detroit | | | 2.0 | % | | | 266,100 | | | | 2,220 | | | | 4 | | | | 93.3 | % | | $ | 15.83 | |
Myrtle Beach | | | 1.5 | % | | | 197,800 | | | | 1,450 | | | | 2 | | | | 90.8 | % | | $ | 14.55 | |
All Other(2) | | | 19.7 | % | | | 2,562,500 | | | | 23,470 | | | | 32 | | | | 87.4 | % | | $ | 20.79 | |
| | | | | | | | | | | | | | | | | | | | | | | | |
Total Stores(3) | | | 100.0 | % | | | 13,105,400 | | | | 115,740 | | | | 167 | | | | 90.7 | % | | $ | 19.93 | |
| (1) | | MSAs (Metropolitan Statistical Areas) as defined by the U.S. Census Bureau. Toronto CMA (Census Metropolitan Area) as defined by Statistics Canada. |
| (2) | | Other markets include: Baltimore, Charleston, Charlotte, Charlottesville, College Station, Colorado Springs, Dallas, Jacksonville, Milwaukee, Mobile, Nantucket, Naples, New York – Newark, Orlando, Punta Gorda, Raleigh – Cary, San Antonio, San Diego, Santa Maria – Santa Barbara, Santa Rosa – Petaluma, Sarasota, Stockton, Trenton – Princeton and Washington – Arlington. None of these markets represent more than 1.5% of the total portfolio by NRSF. |
| (3) | | Joint venture properties owned in our portfolio are included herein as if 100% owned. |
Our portfolio consists of a combination of recently constructed vertical facilities and early-generation facilities. The weighted average age of our portfolio by rentable square feet since initial construction or significant property redevelopment, whichever is more recent, is approximately 21 years. Our properties are designed to cater to the needs of both residential and commercial customers with features such as electronic gate entry, easy access, climate control, high quality security systems, keypad access, large truck accessibility and pest control. Some of our properties also offer outside storage for vehicles, boats and equipment.
Key Growth Markets and Sub-Markets with Strong Demographics. We seek to own properties that are conveniently located with highly accessible street access in high growth MSAs/CMAs and sub-markets. This includes markets with strong population and household income growth, high levels of population density and supply per capita that is below the U.S. national average. Approximately 65% of our portfolio is located in the top 25 MSAs and over 80% is located in the top 100 MSAs, based on net rentable square feet. While we have meaningful concentration in larger markets, we have also targeted specific smaller markets that exhibit underlying fundamentals that we believe are conducive to attractive risk-adjusted returns. We have invested in smaller markets, including Asheville, NC and Dayton, OH, due to a combination of low supply per capita and limited competition from institutional operators, among other factors. According to statistics from Claritas and S&P Global, population growth for our top 10 markets is expected to grow approximately 120 bps faster (on a weighted average basis by rentable square feet) than the U.S. average from 2024 to 2029.
113
Differentiated Exposure to the Greater Toronto Area. Upon the completion of this offering, we believe we will be the only U.S. listed self storage REIT with an owned portfolio and operating platform in Canada and, more specifically, the GTA. As one of the world’s premier financial centers and sixth largest metro area in North America, the GTA has rapidly expanded its population of younger workers. Professionals are drawn to the GTA by its high quality, ubiquitous academic resources, which has resulted in the GTA becoming an emerging market for the digital economy. Supported by strong demographic trends (according to Claritas, S&P Global, and Statistics Canada, GTA population growth from 2024 through 2029 is expected to be approximately 630 bps greater than the U.S. average), we believe the GTA continues to represent a compelling market opportunity, highlighted by low supply per capita (according to Colliers and the 2024 Self-Storage Almanac, the GTA has 2.3x square feet per capita vs. 6.3x in the United States), increasing product utilization, and limited institutional competition. Below we highlight our management team’s history in the market, our existing portfolio and growth initiatives.
| | • | | Our Canadian platform. Our management team has over 14 years of experience sourcing, developing, acquiring and operating in the GTA. During that time, we have built the local infrastructure to drive our future growth, with approximately 85 employees based in Canada, an executive vice president, or EVP, of Canada, and multi-lingual agents in our Canadian call center. We combine the institutional front and back office of the SmartStop platform with a unique Canadian-specific offering that includes a country specific website and domain, Canadian versions of the SmartStop branding package at all of our stores, and a dedicated and highly trained Canadian team of onsite professionals, all of whom are based in Canada. |
| | • | | Our Canadian portfolio. We own or manage a portfolio of 33 operating properties in the GTA, comprising approximately 3.1 million square feet, which provides meaningful economies of scale within the GTA self storage market. This number includes 13 wholly-owned facilities and 10 facilities in unconsolidated joint ventures in which we maintain a 50% equity interest. This number also includes 10 facilities under management that were wholly-owned by the Managed REITs. We also manage two properties in Edmonton and one property in Vancouver. At September 30, 2024, we had 13 wholly-owned operating properties in the GTA accounting for approximately 1.1 million net rentable square feet, which accounted for 9.1% of our total wholly-owned portfolio as of September 30, 2024 and 11.4% of our net operating income, or NOI, for the quarter ended September 30, 2024. We have a joint venture with SmartCentres, which owns a diversified portfolio of real estate in Canada and is one of the largest Toronto Stock Exchange-listed REITs. The 50/50 joint venture affords each party a right of first offer to develop self storage facilities in certain CMAs in Canada. We owned 11 joint venture properties with SmartCentres as of September 30, 2024, of which 10 were operating self storage properties and an additional property which we intend to develop into a self storage facility in the future. We have a development pipeline of approximately 1.1 million net rentable square feet, which we believe we are capable of executing on over the next five years throughout multiple CMAs in Canada. |
Institutional-Quality, Technology-enabled, Data-driven Operations Focused on Customer Service. Over the past decade, we have made significant investments in technology, infrastructure, and human capital to support our operational and digital platforms and enable real-time decision making at scale. Digital tools, resources and enhancements are leveraged across our organization to jointly coordinate marketing and pricing activities, improve the customer experience, grow rental revenue and enhance expense efficiencies. Further, we have multiple data science driven pricing automation systems that are proprietary to our operations platform. In 2022, we completed our transition to a new property management system, furthering our management capabilities and facilitating continued property growth. Built on the latest cloud-based technology, the platform allows us greater flexibility in positioning competitive offerings in our customer pipeline. Aligned with this platform upgrade, SmartStop site managers are now using tablets as the primary tool when engaging with customers on new leasing opportunities. Store managers are no longer confined to the retail office in order to rent units, take payments, conduct lock checks and conduct other business. We believe this system will help us compete as a top operator and foster continued property performance growth in the future. Today, our technology-driven operating platform includes:
| | • | | consistent and recognizable brand across store locations; |
114
| | • | | digital brand presence and protection; |
| | • | | highly sophisticated and responsive user-friendly website with mobile optimization; |
| | • | | proprietary data warehouse, supported by a multitude of internal and external data sources, algorithmically driving pricing changes with over 18 billion data points; |
| | • | | dedicated, in-house call center; |
| | • | | ability to transact across a spectrum of mediums, including contactless, online rentals, call center rentals, reservations systems and in person rentals; |
| | • | | highly trained staff, focused on enhancing the customer experience; and |
| | • | | automated proprietary digital marketing algorithms driving near real time targeting and spend decisions. |
We are focused on creating a convenient and hassle-free customer experience with an emphasis on the leasing process, regardless of individual customer preferences. Accordingly, we offer website and call center reservations, in person leasing, call center leasing and website leasing, all from a variety of devices, including mobile phones and tablets. In the first nine months of 2024, approximately 35% of all rentals were executed in a contactless manner through our website, with another approximately 10—15% originating from our call center. Meeting the customer at their level has allowed us to bolster our digital marketing efforts, primarily driven by a combination of pay-per-click and search engine optimization campaigns, to continue to maintain attractive returns on invested marketing dollars. The technological backbone of our operating platform is further supported by a dedicated staff of operations professionals, including approximately 400 store- level employees. Our dedicated staff, institutional technology platform and branding presence led to Newsweek ranking us #1 in the self storage business for Best Customer Service in 2021, 2023, and 2024.
Scalable Platform and Asset Base to Drive Significant Growth. Our technology and human capital investments have resulted in a platform that we believe is capable of supporting a portfolio significantly larger than our existing operating portfolio. Our current back-office infrastructure—including accounting, acquisitions, operations and corporate finance—is well positioned to scale. We believe we can grow our portfolio at a rate significantly faster than our general and administrative expenses, which in turn should generate positive operating leverage and enhanced income growth. Additionally, we believe we have an opportunity to drive net operating income margin improvement on our same-store portfolio, as we continue to build out clusters in MSAs where we have less than 10 properties. Furthermore, with our smaller asset base relative to our publicly traded self storage peers, we believe we have an opportunity to achieve out-sized growth through manageable acquisition volumes.
Proven Acquisition Execution in the Self Storage Space. Our management team has significant experience acquiring self storage facilities across a broad spectrum of opportunities, including stabilized facilities, recently developed facilities in lease-up, facilities that have just received a certificate of occupancy, facilities in need of renovation and/or re-development and ground up development. Since the end of 2016, we have acquired over $1.7 billion in self-storage assets either on our balance sheet or on behalf of the Managed REITs. Our dedicated acquisitions team, located in both the United States and Canada, possesses an average of over 20 years of real estate transaction experience and is responsible for executing all of our acquisitions through the use of our proprietary underwriting methodology. More importantly, our acquisitions team has cultivated relationships in the industry that are highly beneficial to our overall deal sourcing. We believe that we maintain a competitive advantage in acquiring facilities given the scale of our business, our experience and the networks of our team. Further, we believe the acquisition environment has become more constructive. We maintain a disciplined approach to capital deployment and our underwriting standards. Since 2022, we have not observed many attractive opportunities to acquire assets accretively on our balance sheet. However, more recently, we have seen an improvement in seller expectations, coupled with an improved financing backdrop, resulting in an increase in self storage properties listed for sale across the United States and Canada. We have capitalized on the improving deal environment, as demonstrated by recently completed transactions, acquiring 17,350 net rentable square feet of self storage in attractive high-growth
115
markets subsequent to September 30, 2024 (see External Growth Strategies for more detail), and have compiled a robust acquisition pipeline that we expect to close before March 31, 2025. We believe our platform is well positioned to pursue attractive and accretive acquisition opportunities.
Differentiated Capital Allocation Capability Through Managed REIT Platform Provides Additional Revenues and Potential Acquisition Pipeline. Our management team has an extensive track record of sponsoring and managing non-traded REITs. Since inception, our management team has raised approximately $2.4 billion across nine self storage programs. We currently sponsor and manage two non-traded REITs, Strategic Storage Trust VI, Inc., or SST VI, and Strategic Storage Growth Trust III, Inc., or SSGT III, from which we generate asset management fees, property management fees, acquisition fees, other fees and substantially all of the tenant protection program revenue. In the short-to-medium term, we plan to utilize our Managed REIT platform to sponsor non-traded REITs that will invest in, among other things, non-stabilized, growth-oriented assets, and development projects. We maintain an acquisition allocation policy that provides us the right of first allocation between us and the Managed REITs. As the assets under management in our Managed REITs grow, we will benefit from the additional management fees as well as the economies of scale that will reduce our operating expenses and improve our margins. Additionally, upon stabilization, our Managed REITs serve as potential accretive acquisition targets to drive our external growth. Since 2019, we have acquired or merged with three affiliated REITs. These include (i) the all-cash acquisition of Strategic Storage Growth Trust, Inc., or SSGT, in January 2019 whereby we acquired approximately $360 million in real estate related assets, (ii) the 100% stock-for-stock merger with Strategic Storage Trust IV, Inc., or SST IV, in March 2021 whereby we acquired approximately $375 million of real estate related assets, and (iii) the 100% stock-for-stock merger with Strategic Storage Growth Trust II, Inc., or SSGT II, in June 2022 whereby we acquired approximately $263 million of real estate related assets. With extensive start-up costs and the lack of established track records creating significant barriers to entry for others with respect to the non-traded REIT, we believe our Managed REIT platform provides us a competitive advantage relative to other U.S. Listed Self Storage REITs, which do not have such a platform.
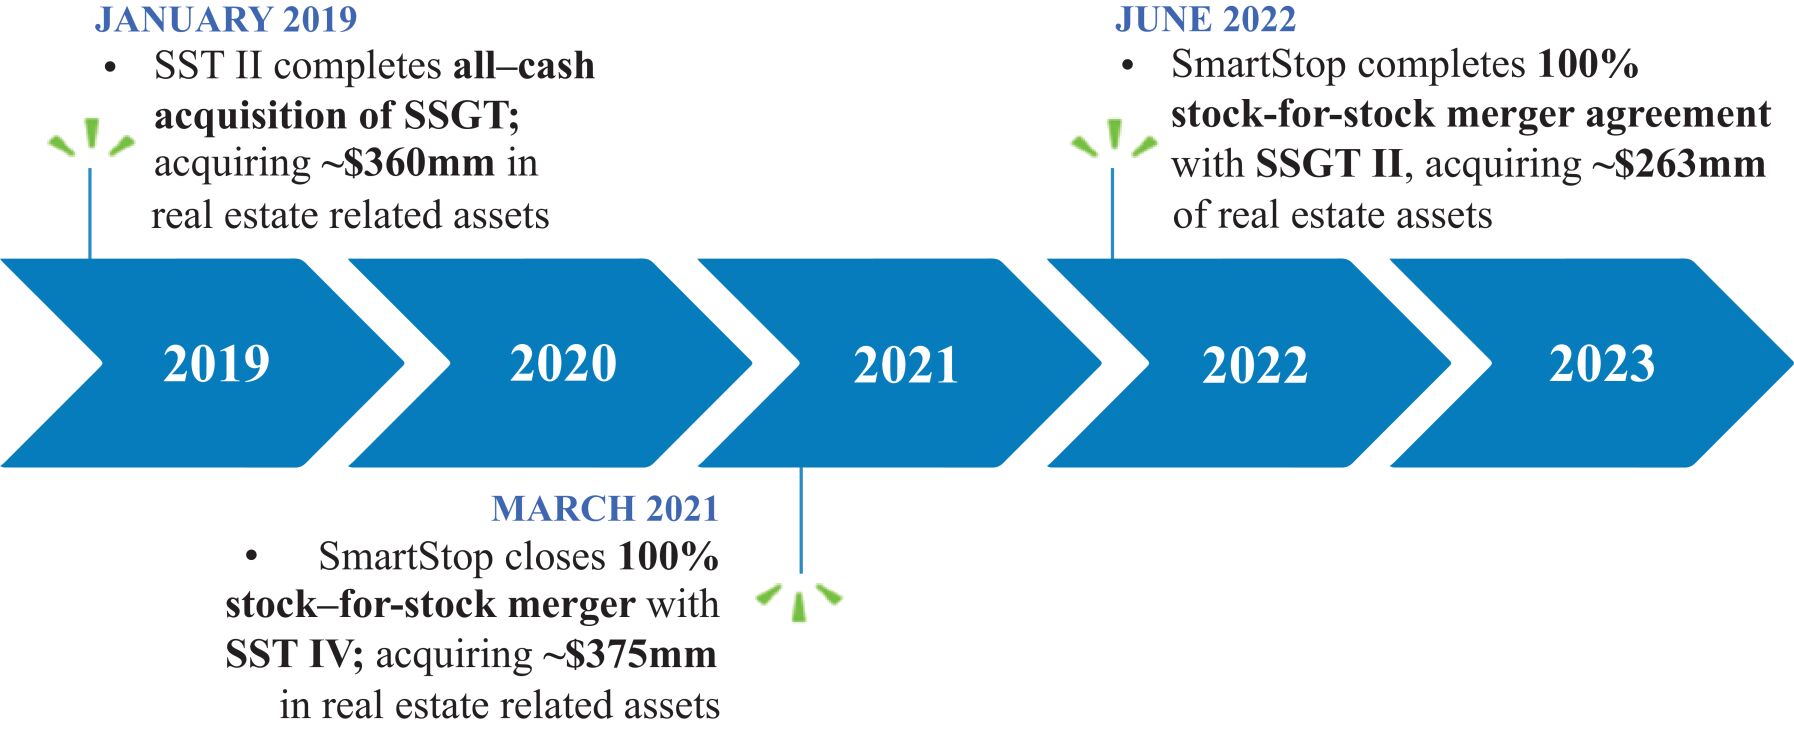
Investment Grade Balance Sheet well Positioned for Expansion. Upon completion of this offering, we will be well positioned to grow our portfolio by opportunistically pursuing acquisitions in a disciplined manner, while maintaining an attractive leverage profile and flexible balance sheet. Our leverage profile and significant liquidity is expected to position us to pursue attractive external growth opportunities in an accretive and prudently capitalized manner. Becoming a publicly traded REIT will enable us to access multiple forms of equity and debt capital currently not available to us, further enhancing our financial flexibility, cost of capital and external growth. In March 2022, we received an investment grade rating of BBB-with a Stable outlook from Kroll Bond Rating Agency, Inc. (KBRA), which we believe will be further enhanced upon completion of this offering and represents an important step towards our goal of becoming a fully unsecured issuer. KBRA reaffirmed this rating and outlook in April 2023. KBRA reaffirmed this rating again in April 2024 but downgraded the outlook to Negative.
116
Experienced and Aligned Management Team with Extensive Operating Expertise. Our management team has strong insight and operating acumen developed from decades of successfully operating self storage facilities and creating value while navigating through multiple real estate and economic cycles. Our Founder, Chairman and Chief Executive Officer, H. Michael Schwartz, has transacted more than $7.9 billion in commercial real estate, with more than $6.2 billion in the self storage industry. The other five members of our management team have extensive self storage experience with an average of 17 years in self storage roles. We benefit from the significant experience of our management team and its ability to effectively navigate changing market conditions and achieve sustained growth. In addition, we believe the interests of our management team are strongly aligned with our stockholders. As of the completion of this offering, we expect our management team to collectively own approximately % of our outstanding common stock and OP units, which represents $ at the midpoint of the price range set forth on the front cover of this prospectus (assuming neither our Chief Executive Officer nor his affiliates purchase any shares of our common stock pursuant to the directed share program or in this offering).
Our Business Objectives and Growth Strategies
Our primary business objective is to deliver attractive risk-adjusted returns by investing in and operating a portfolio of newer generation self storage facilities and earlier generation self storage facilities, both primarily located in urban submarkets. We intend to maximize cash flow to stockholders through both organic and external growth utilizing multiple levers and channels.
Organic Growth Strategies:
Leverage our Technology-Driven Operating Platform to Drive Optimal Asset Level Performance. We are highly focused on maximizing cash flows at our properties by leveraging the economies of scale provided by our technology-enabled platform and proprietary systems. As we continue to scale, we intend to utilize our revenue management capabilities which include digital marketing algorithms, data warehouse with algorithmic pricing, digital tools and a dedicated call center, among others, to position us to achieve optimal market rents and
occupancy, reduce operating expenses and increase the sale of ancillary products and services. Our ability to drive enhanced revenue is highlighted by our three-year average same-store revenue growth, which was 7.3%, or approximately 10 bps higher than the U.S. Publicly Listed REITs over the same period.
Margin Expansion and Other Ancillary Revenue Opportunities. There is a substantial opportunity to grow our profitability and earnings through margin improvement. The adjusted gross margin percentage of our same-store portfolio was 67.6% for the quarter ended September 30, 2024, 530 basis points below that of the average of the U.S. Listed Self Storage REITs, and the adjusted gross margin percentage for our non-stabilized wholly-owned portfolio was 47.7%. Our ability to drive rental rate growth and the maturation of our in-place portfolio (both same-store and non-same-store) will lead to expanded adjusted gross margin percentage at the property level. We have also focused on reducing operating expenses and are utilizing renewable energy to reduce our utility costs. As of September 30, 2024, we have installed solar panels on 49 properties in our owned portfolio and have additional projects underway at 13 of our facilities. Those projects are expected to yield a weighted average return in the low-teens on our investment. Furthermore, the sale of ancillary products and services that are complementary to our customers’ use of our self storage facilities, including, but not limited to, tenant protection programs, locks, boxes and other packing supplies present an additional area of potential organic net operating income growth. Lastly, expanding our presence in markets where we don’t currently have significant clustering of our properties, primarily through external growth, should enable cost efficiencies through expense line items such as payroll and advertising amongst others. As an example, among our same-store portfolio, for markets where we own 10 or more properties, our average adjusted gross margin is over 70%, or approximately 300 basis points higher than the same-store portfolio average. The combination of rental rate growth, general maturation, increased clustering, expense control and ancillary sales should enable both our same-store and non-same-store portfolios to achieve higher adjusted gross margin percentages than they achieve today.
117
Maximize Property Level Cash Flow at Non-Stabilized Stores. As of September 30, 2024, approximately 6.6% of our wholly-owned stores, as measured by net rentable square feet, were characterized as non-stabilized, or not economically stabilized. This exposure includes certificate of occupancy and lease-up stores, which are generally dilutive to cash flow in the near-term but generally have higher longer-term yield potential than investments in physically stabilized self storage facilities. During the quarter ended September 30, 2024, the average RentPOF for what we consider our non-stabilized wholly-owned portfolio was $15.56 as compared to $20.25 for our same store portfolio. Likewise, the physical occupancy of our non-stabilized wholly-owned stabilized portfolio was 86.4%, or 620 basis points below that of our same store portfolio. Further, our adjusted gross margin percentage was 47.7% for our non-stabilized wholly-owned portfolio, 19.9% below that of our same-store portfolio and 25.2% below the average of the U.S. Listed Self Storage REITs’ same-store portfolios for the quarter ended September 30, 2024. We believe that by leveraging our operating platform and experience, this non-stabilized portfolio has the potential to produce higher revenue and net operating income growth than our same-store portfolio until economic stabilization.
The following table breaks out our owned operating stores as of September 30, 2024, by stabilized and non-stabilized classifications:
| | | | | | | | | | | | | | | | | | | | | | | | | | | | |
| | | | | | | | | | | | RentPOF
for the
Three Months
Ended
September 30,(1) | | | Ending Occupancy
as of
September 30, | |
Owned Operating Stores | | # of
Stores | | | Net Rentable
Sq. Ft. | | | Units | | | 2024 | | | 2023 | | | 2024 | | | 2023 | |
Same-Store Wholly-Owned | | | 148 | | | | 11,403,300 | | | | 98,675 | | | $ | 20.25 | | | $ | 20.14 | | | | 92.6 | % | | | 92.8 | % |
Non Stabilized Wholly-owned | | | 9 | | | | 804,700 | | | | 7,625 | | | $ | 15.56 | | | | NM | | | | 86.4 | % | | | NM | |
Total Wholly-Owned Operating Stores | | | 157 | | | | 12,208,000 | | | | 106,300 | | | $ | 20.01 | | | | NM | | | | 92.2 | % | | | NM | |
Total Joint Venture Operating Stores | | | 10 | | | | 897,400 | | | | 9,440 | | | $ | 18.85 | | | | NM | | | | 80.0 | % | | | NM | |
Total All Owned Operating Stores | | | 167 | | | | 13,105,400 | | | | 115,740 | | | | | | | | | | | | | | | | | |
| NM: | | Not meaningful comparison |
| (1) | | RentPOF defined as annualized rental revenue net of discounts and concessions, excluding late fees, administrative fees and parking income, divided by occupied square feet of storage. Not in thousands. |
External Growth Strategies:
Our portfolio growth will primarily be driven through the acquisition of stabilized facilities, but we also intend to opportunistically acquire facilities in lease-up, facilities that have just received a certificate of occupancy, facilities in need of renovation, re-development or expansion and ground up development. As a publicly listed REIT, we believe we will have access to a more favorable cost of capital and broader capital markets solutions to help us execute on our external growth strategy. To date, we have not regularly utilized OP units as consideration for acquisitions; however, we may do so as a listed REIT using an umbrella partnership, or UPREIT, structure.
Our relative size is a key differentiator between us and the U.S. Listed Self Storage REITs. Our portfolio consists of 167 owned self storage facilities, encompassing 13.1 million net rentable square feet. By comparison, the average owned portfolio of the U.S. Listed Self Storage REITs is approximately 1,800 facilities, encompassing over 130 million net rentable square feet as of September 30, 2024, or approximately 10 times our size by both metrics. We believe this dynamic will allow us to be more nimble and selective in our external growth strategy, while capitalizing on economies of scale as we grow. We intend to execute our external growth strategy in our existing markets and target markets that have comparably strong demographic and competitive trends.
| | • | | On-Balance Sheet Acquisitions. We expect to acquire stabilized and non-stabilized properties on-balance sheet in the United States and Canada in an accretive manner to FFO, as adjusted. In Canada |
118
| | specifically, we believe our scale and experience competitively positions us to capitalize on acquisition opportunities in a highly fragmented market that has relatively less sophisticated and smaller operators than are in the United States. |
| | • | | Embedded Acquisition Pipeline. Subsequent to the quarter ending September 30, 2024, we acquired one property for $9.5 million, totaling approximately 17,350 NRSF and 200 self storage units. Additionally, we have built a pipeline of acquisitions that we are scheduled to close on before March 31, 2025 for approximately $225 million, totaling approximately 659,500 NRSF and 6,830 self storage units. This pipeline comprises deals that are either under contract or for which we have a letter of intent to acquire. Although we are scheduled to close these acquisitions prior to the end of the first quarter of 2025, the acquisitions are subject to customary closing conditions, and there is no assurance that these properties will be acquired or will be acquired at the time or pursuant to the terms currently contemplated. These assets are located in attractive high-growth submarkets within the top 25 U.S. MSA’s or the top 25 Canadian CMA’s. These acquisitions include the following: |
| | • | | Boston MSA: We closed on the acquisition of a property in the Boston, MA MSA on November 20, 2024 for approximately $9.5 million, totaling approximately 17,350 NRSF and 200 self storage units; |
| | • | | Denver MSA: We are under contract on the acquisition of a property in the Denver, CO MSA for approximately $14.7 million, totaling approximately 87,450 NRSF and 740 self storage units; |
| | • | | San Jose MSA: We are under contract on the acquisition of a property in the San Jose, CA MSA for approximately $19.4 million, totaling approximately 59,650 NRSF and 650 self storage units; |
| | • | | Los Angeles MSA: We are under contract on the acquisition of a property in the Los Angeles, CA MSA for $70.0 million, totaling approximately 136,300 NRSF and 1,300 self storage units; |
| | • | | Washington MSA: We are under contract on the acquisition of a property in the Washington-Arlington-Alexandria MSA for $18.0 million, totaling approximately 74,300 NRSF and 830 self storage units; |
| | • | | New York MSA: We are under contract on the acquisition of two properties in the New York, NY MSA for $74.5 million. These properties represent approximately 227,700 NRSF and 2,500 self storage units; |
| | • | | Kelowna CMA: We are under contract on the acquisition of a property in the Kelowna, BC CMA for approximately $28.1 million ($39.3 million CAD)], totaling approximately 74,100 NRSF and 810 self storage units; |
| | • | | Canadian Platform Provides Growth Opportunities with less Institutional Competition. According to Colliers, we are currently the fifth largest self storage operator in Canada based on rentable square footage and believe we will be the only U.S. Listed Self Storage REIT with an owned portfolio and operating platform in Canada. The percentage of self storage assets operated by sophisticated institutions is significantly lower in Canada than in the United States. This dynamic allows for a relatively lower level of operating competition while offering a range of acquisition opportunities. Our portfolio in Canada accounts for 15.6% of our total owned portfolio as measured by rentable square feet and is exclusively in the GTA. We intend to target investments in other CMAs in Canada, including, but not limited to, Vancouver, Montreal, Edmonton, Calgary, and Ottawa. As of September 30, 2024, we have a 50% interest in a joint venture, along with SmartCentres, which owns a property in the Vancouver CMA. The joint venture intends to develop this property into a self storage facility in the future. Also, as of September 30, 2024, the Managed REITs own an operating property in Vancouver, three properties in development in Vancouver, two operating properties in Edmonton, and three properties in development in Montreal. |
| | • | | Joint Ventures. We have a joint venture with SmartCentres, which owns a diversified portfolio of real estate in Canada and is one of the largest TSX-listed REITs. The 50/50 joint venture affords each party a right of first offer to develop self storage facilities in certain CMAs in Canada. As of September 30, 2024, |
119
| | the joint venture owned 10 operating properties in the GTA. Through this joint venture, we have a development pipeline of approximately 600,000 net rentable square feet, representing approximately 6,600 units across multiple CMAs in Canada. We expect to continue to utilize the joint venture to develop and redevelop in Canada. |
| | • | | Strategic Combinations of Affiliated Funds. With our management of the Managed REITs and our demonstrated track record of acquiring or merging with previous Managed REITs, we believe our Managed REIT platform provides a potential future pipeline of relatively large portfolio acquisitions for us, serving to enhance our external growth and cash flow to stockholders. As of September 30, 2024, the Managed REITs owned 34 assets, representing approximately 2.9 million of net rentable square feet across 26,500 units. |
| | • | | Redevelopment. Our team of seasoned professionals identifies opportunities to unlock additional value at our properties through selectively redeveloping certain properties. We plan to actively reinvest in our portfolio going forward. |
| | • | | Third-Party Management Platform. According to Colliers, the top 10 operators in Canada, as determined by square footage, account for only 20% of all self storage facilities across the country. The percentage of self storage assets operated by owners with only one or two stores in Canada is estimated at approximately 70%, according to Colliers. We intend to capitalize on the nascent institutional competitive landscape by establishing a market leading third-party management platform in Canada, in which we manage and operate self storage properties owned by third parties in exchange for fees. We believe there is an opportunity to establish our third-party management platform in both Canada and the United States with nominal incremental investment, either through the development of our own third-party management platform or an investment in an existing third-party management platform. |
Post Quarter-End Operations Update:
Subsequent to the quarter ending September 30, 2024, we provided an update to the following metrics for our 2024 same-store pool:
| | • | | Physical occupancy as of October 31, 2024 and October 31, 2023 was 92.4% and 92.4%, respectively. Physical occupancy as of November 30, 2024 and November 30, 2023 was 92.3% and 92.2%, respectively. |
| | • | | Monthly web rates as of October 31, 2024 and October 31, 2023 were $1.08 and $1.18, respectively. Monthly web rates as of November 30, 2024 and November 30, 2023 were $0.97 and $1.17, respectively. |
| | • | | Monthly move-in rates as of October 31, 2024 and October 31, 2023 were $1.05 and $1.01, respectively. Monthly move-in rates as of November 30, 2024 and November 30, 2023 were $1.00 and $1.05, respectively. |
| | • | | Monthly in-place rates as of October 31, 2024 and October 31, 2023 were $1.64 and $1.62, respectively. Monthly in-place rates as of November 30, 2024 and November 30, 2023 were $1.64 and $1.60, respectively. |
Our Self Storage Properties
We own a large, geographically diversified portfolio comprised exclusively of self storage properties. Our portfolio consists of 167 wholly-owned and joint venture self storage properties located in 19 states and Ontario, Canada. Our largest state and provincial exposures based on square footage owned include Florida, California, Ontario, North Carolina and Texas. Our largest MSAs and CMAs exposures based on square footage owned include: Toronto, ON; Miami–Ft. Lauderdale, FL; Las Vegas, NV; Asheville, NC; Los Angeles, CA; and Houston, TX. We believe that our scale and the overall geographic diversification of our portfolio reduces risks associated with specific local or regional economic downturns or natural disasters. See Note 5—Debt of the notes to our consolidated financial statements for the nine months ended September 30, 2024 and Note 5—Debt of the
120
notes to our consolidated financial statements for the year ended December 31, 2023, each contained elsewhere in this prospectus for more information about our indebtedness secured by our properties. We believe that our real estate properties are suitable for their intended purposes and adequately covered by insurance.
The following table summarizes information about our wholly-owned and owned joint venture operating properties in our portfolio by state and province, as of September 30, 2024:
| | | | | | | | | | | | | | | | |
State/ Province | | % of
Portfolio by
NRSF | | | Net Rentable
Sq. Ft. | | | Units | | | # of
Stores | |
Florida | | | 19.7 | % | | | 3,177,800 | | | | 26,950 | | | | 35 | |
Ontario, CAN | | | 18.9 | % | | | 3,047,300 | | | | 29,605 | | | | 33 | |
California | | | 14.3 | % | | | 2,315,700 | | | | 21,905 | | | | 32 | |
North Carolina | | | 7.9 | % | | | 1,274,500 | | | | 9,670 | | | | 20 | |
Texas | | | 5.7 | % | | | 919,300 | | | | 6,960 | | | | 12 | |
Nevada | | | 5.7 | % | | | 916,900 | | | | 7,495 | | | | 10 | |
Arizona | | | 4.4 | % | | | 707,400 | | | | 5,980 | | | | 8 | |
Colorado | | | 3.7 | % | | | 596,100 | | | | 5,130 | | | | 9 | |
Washington | | | 3.0 | % | | | 490,350 | | | | 4,525 | | | | 6 | |
Illinois | | | 2.7 | % | | | 432,450 | | | | 3,785 | | | | 6 | |
South Carolina | | | 2.2 | % | | | 355,700 | | | | 2,890 | | | | 4 | |
New Jersey | | | 1.7 | % | | | 271,000 | | | | 3,080 | | | | 3 | |
Michigan | | | 1.6 | % | | | 266,000 | | | | 2,220 | | | | 4 | |
Ohio | | | 1.6 | % | | | 263,100 | | | | 2,360 | | | | 5 | |
Maryland | | | 1.0 | % | | | 169,500 | | | | 1,610 | | | | 2 | |
Alabama | | | 1.0 | % | | | 163,300 | | | | 1,090 | | | | 1 | |
Virginia | | | 0.8 | % | | | 130,000 | | | | 1,390 | | | | 2 | |
Indiana | | | 0.7 | % | | | 112,700 | | | | 1,030 | | | | 2 | |
Massachusetts | | | 0.6 | % | | | 93,200 | | | | 840 | | | | 1 | |
Alberta, CAN | | | 0.5 | % | | | 86,300 | | | | 805 | | | | 2 | |
Wisconsin | | | 0.5 | % | | | 83,400 | | | | 780 | | | | 1 | |
Delaware | | | 0.5 | % | | | 80,600 | | | | 830 | | | | 1 | |
Pennsylvania | | | 0.5 | % | | | 78,000 | | | | 810 | | | | 1 | |
British Columbia, CAN | | | 0.4 | % | | | 59,200 | | | | 930 | | | | 1 | |
Oregon | | | 0.4 | % | | | 55,800 | | | | 520 | | | | 1 | |
| | | | | | | | | | | | | | | | |
Total Stores(1) | | | 100.0 | % | | | 16,145,600 | | | | 143,190 | | | | 202 | |
| (1) | | Joint venture properties owned in our portfolio are included herein as if 100% owned. |
121
The following table summarizes information about our wholly-owned and owned joint venture operating properties in our portfolio by MSA and CMA, as of September 30, 2024:
| | | | | | | | | | | | | | | | | | | | | | | | |
MSA/CMA(1) | | % of
Portfolio by
NRSF | | | Net
Rentable
Sq. Ft. | | | Units | | | # of
Stores | | | 3Q24
Ending
Occupancy | | | 3Q24
RentPOF | |
Toronto | | | 15.3 | % | | | 2,008,100 | | | | 20,050 | | | | 23 | | | | 86.8 | % | | $ | 20.47 | |
Miami - Fort Lauderdale | | | 9.3 | % | | | 1,221,100 | | | | 10,470 | | | | 12 | | | | 84.6 | % | | $ | 25.66 | |
Asheville | | | 6.6 | % | | | 869,900 | | | | 6,200 | | | | 14 | | | | 92.8 | % | | $ | 16.80 | |
Las Vegas | | | 6.6 | % | | | 865,000 | | | | 7,160 | | | | 9 | | | | 93.9 | % | | $ | 18.81 | |
Los Angeles | | | 5.6 | % | | | 738,500 | | | | 6,990 | | | | 11 | | | | 91.4 | % | | $ | 25.05 | |
Houston | | | 5.2 | % | | | 676,800 | | | | 5,130 | | | | 9 | | | | 93.2 | % | | $ | 19.02 | |
Tampa | | | 3.6 | % | | | 478,100 | | | | 3,890 | | | | 5 | | | | 93.8 | % | | $ | 18.46 | |
Denver | | | 3.3 | % | | | 437,300 | | | | 3,860 | | | | 7 | | | | 91.8 | % | | $ | 18.47 | |
Chicago | | | 3.3 | % | | | 432,450 | | | | 3,785 | | | | 6 | | | | 91.5 | % | | $ | 15.68 | |
Seattle - Tacoma | | | 3.0 | % | | | 390,550 | | | | 3,430 | | | | 5 | | | | 92.8 | % | | $ | 20.38 | |
Dayton | | | 2.9 | % | | | 375,800 | | | | 3,390 | | | | 7 | | | | 93.2 | % | | $ | 12.78 | |
Phoenix | | | 2.5 | % | | | 329,100 | | | | 3,130 | | | | 4 | | | | 93.0 | % | | $ | 17.50 | |
San Francisco - Oakland | | | 2.5 | % | | | 322,600 | | | | 2,920 | | | | 4 | | | | 90.0 | % | | $ | 23.90 | |
Port St. Lucie | | | 2.4 | % | | | 318,900 | | | | 2,610 | | | | 4 | | | | 93.6 | % | | $ | 19.53 | |
Sacramento | | | 2.4 | % | | | 308,100 | | | | 2,895 | | | | 4 | | | | 89.5 | % | | $ | 16.38 | |
Riverside - SB | | | 2.3 | % | | | 306,700 | | | | 2,690 | | | | 5 | | | | 94.0 | % | | $ | 21.67 | |
Detroit | | | 2.0 | % | | | 266,100 | | | | 2,220 | | | | 4 | | | | 93.3 | % | | $ | 15.83 | |
Myrtle Beach | | | 1.5 | % | | | 197,800 | | | | 1,450 | | | | 2 | | | | 90.8 | % | | $ | 14.55 | |
All Other(2) | | | 19.7 | % | | | 2,562,500 | | | | 23,470 | | | | 32 | | | | 87.4 | % | | $ | 20.79 | |
| | | | | | | | | | | | | | | | | | | | | | | | |
Total Stores(3) | | | 100.0 | % | | | 13,105,400 | | | | 115,740 | | | | 167 | | | | 90.7 | % | | $ | 19.93 | |
| (1) | | MSAs (Metropolitan Statistical Areas) as defined by the U.S. Census Bureau. Toronto CMA (Census Metropolitan Area) as defined by Statistics Canada. |
| (2) | | Other markets include: Baltimore, Charleston, Charlotte, Charlottesville, College Station, Colorado Springs, Dallas, Jacksonville, Milwaukee, Mobile, Nantucket, Naples, New York – Newark, Orlando, Punta Gorda, Raleigh – Cary, San Antonio, San Diego, Santa Maria – Santa Barbara, Santa Rosa – Petaluma, Sarasota, Stockton, Trenton – Princeton and Washington – Arlington. None of these markets represent more than 1.5% of the total portfolio by NRSF. |
| (3) | | Joint venture properties owned in our portfolio are included herein as if 100% owned. |
Joint Venture Properties. We have a 50/50 joint venture with SmartCentres, which owns a diversified portfolio of real estate in Canada and is one of the largest Toronto Stock Exchange-listed REITs. Through this joint venture, in our portfolio, we own 10 operating properties in the GTA representing approximately 897,400 rentable square feet that are all in various stages of lease-up and stabilization. The joint venture affords each party a right of first offer to develop self storage facilities in certain areas of Canada including Montreal, Calgary, Vancouver and Southern Ontario. Within the joint venture, we have one property under construction and a development pipeline of six projects representing approximately 600,000 net rentable square feet, which we believe we are capable of executing on over the next five years throughout multiple CMAs in Canada. While we may decide to allocate the joint venture ownership of certain of these development properties among us and the Managed REITs, all such development projects will be branded SmartStop® Self Storage and operated by us once opened. These development properties are in multiple CMAs throughout Canada.
122
Currently, the Managed REITs have six properties under construction in tandem with SmartCentres throughout multiple CMAs, representing 640,000 net rentable square feet. The following table summarizes the 10 joint venture operating properties owned in the 50/50 joint venture with SmartCentres:
| | | | | | | | | | | | | | | | | | | | |
JV Owned Operating Properties | | CMA(1) | | | SmartStop %
Ownership | | | Net
Rentable
Sq. Ft. | | | Units | | | Date
Opened | |
Dupont | | | Toronto | | | | 50.0 | % | | | 46,090 | | | | 730 | | | | Oct-19 | |
East York—Laird | | | Toronto | | | | 50.0 | % | | | 99,530 | | | | 1,000 | | | | Jun-20 | |
Brampton | | | Toronto | | | | 50.0 | % | | | 100,210 | | | | 1,050 | | | | Nov-20 | |
Vaughan | | | Toronto | | | | 50.0 | % | | | 84,900 | | | | 880 | | | | Jan-21 | |
Oshawa—Champlain | | | Toronto | | | | 50.0 | % | | | 92,650 | | | | 950 | | | | Aug-21 | |
Scarborough | | | Toronto | | | | 50.0 | % | | | 97,980 | | | | 1,000 | | | | Nov-21 | |
Aurora | | | Toronto | | | | 50.0 | % | | | 99,490 | | | | 960 | | | | Dec-22 | |
Kingspoint—Brampton | | | Toronto | | | | 50.0 | % | | | 97,010 | | | | 1,070 | | | | Mar-23 | |
Whitby | | | Toronto | | | | 50.0 | % | | | 84,540 | | | | 870 | | | | Jan-24 | |
Markham Boxgrove | | | Toronto | | | | 50.0 | % | | | 95,000 | | | | 930 | | | | May-24 | |
| | | | | | | | | | | | | | | | | | | | |
Total JV Operating Properties | | | | | | | | | | | 897,400 | | | | 9,440 | | | | | |
| (1) | | Toronto CMA (Census Metropolitan Area) as defined by Statistics Canada. |
Population Growth. According to statistics from Claritas and S&P Global, the markets in which our portfolio is located are expected to grow approximately 1.0% (on a weighted average basis by rentable square feet) faster than the U.S. average for population from 2024 to 2029. Our top three markets, including Toronto, Miami- Fort Lauderdale and Las Vegas are expected to grow 4.0% faster than the U.S. average from 2024 to 2029.
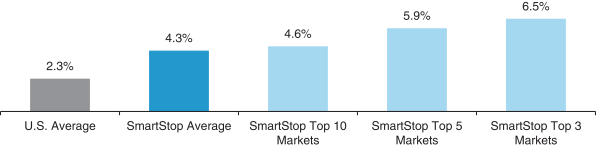
Sources: Claritas, SNL Financial, Statistics Canada. All figures represent weighted averages based on NRSF. U.S. Average weighted by MSA population.
High Quality Properties. We seek to own properties that are conveniently located with highly accessible street access within high quality sub-markets. Our portfolio consists of a combination of recently constructed vertical facilities, which tend to be three to five stories and primarily feature interior units, and early-generation facilities, which tend to be one to two floors featuring a blend of interior and exterior units. Our properties are designed to offer customers convenient, affordable and secure storage units. Generally, our properties are designed to cater to the needs of both residential and commercial tenants with features such as electronic gate entry, easy access, climate control, state-of-the-art security systems, keypad access, large truck accessibility and pest control. Our properties generally offer customers a blend of interior, climate controlled units as well as non-climate controlled, typically drive-up units. Some of our properties also offer outside storage for vehicles, boats and equipment. The average age of our portfolio since initial construction or significant property redevelopment, whichever is the most recent, is approximately 20 years.
Portfolio Growth Strategy and Track Record. We intend to target markets in which we can expand or establish further clustering and economies of scale. Additionally, we will look to grow our presence in select Canadian markets including the GTA and other major Canadian CMAs. Our portfolio growth will primarily be driven through the acquisition of stabilized facilities, but we also intend to occasionally acquire non-stabilized facilities. Our management
123
team has significant experience acquiring self storage facilities across a broad spectrum of opportunities, including stabilized facilities, recently developed facilities in lease-up, facilities that have just received a certificate of occupancy, facilities in need of renovation and/or re-development and ground up development. Below are select case studies exemplifying some of these acquisitions by SmartStop and its affiliated programs:
| | • | | Re-Development: Mississauga, Toronto, ONT. In 2011, our affiliated program acquired a vacant industrial property in the Mississauga sub-market of Toronto for CAD $5.5 million. The existing structure was redeveloped and supplemented with additional ground up construction of drive up units, with a total unit count of 800 across 101,000 rentable square feet. The property opened in 2012. Solar panels were also added in 2014 to capitalize on the Ontario Power Authority Feed-In Tariff Program. Including total development and construction costs, our affiliated program developed the property for CAD $15.2 million. In February 2017, we acquired the property for CAD $25.0 million. The property was 91.6% occupied as of the quarter ended September 30, 2024. For the quarter ended September 30, 2024, the property generated approximately $433,000 of NOI, or approximately CAD $590,000 of net operating income. The table below outlines the historical annual revenues (in CAD) and average occupancy for the trailing 12 years ended December 31, 2023: |
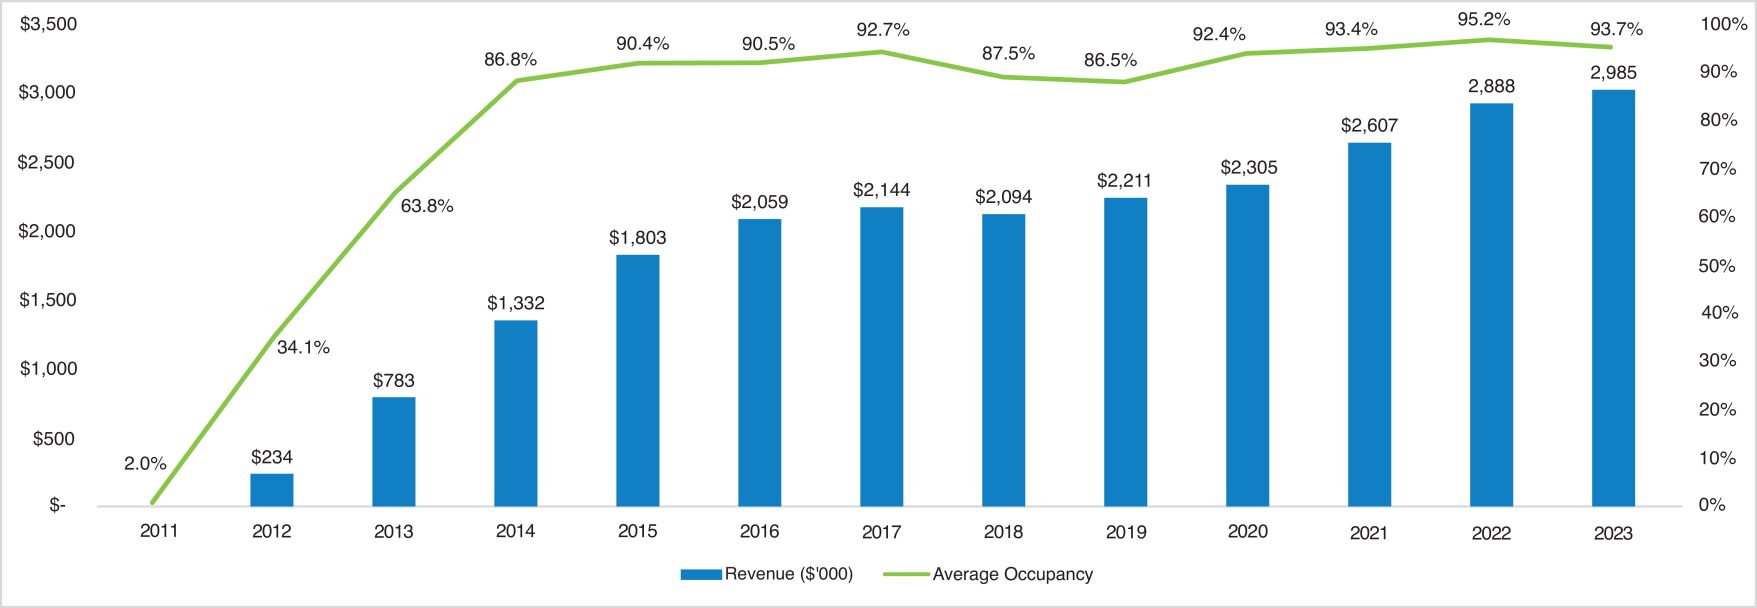
| | • | | Development: Vaughan, Toronto, ONT. In tandem with SmartCentres, SST IV developed a four story, purpose built self storage facility in the Vaughan sub-market of Toronto for total development costs of CAD $17.3 million. The property sits on a 1.6 acre lot connected to the SmartCentres Vaughan shopping center and is located in between a Home Depot and a Walmart Supercenter, a prime retail location that provides direct visibility from Highway 400. With 880 climate controlled units across 101,000 rentable square feet, the property opened in February of 2021 and was 90.9% occupied as of the quarter ended September 30, 2024. We acquired SST IV’s joint venture interest in the property through the SST IV merger in March 2021. Based on underwriting for the property, the estimated stabilized yield on the project is 7.9%, as determined by dividing the underwritten stabilized full-year net operating income by the total development cost. We can provide no assurance that the actual stabilized yield on this project will be consistent with the estimated stabilized yield set forth above. |
124
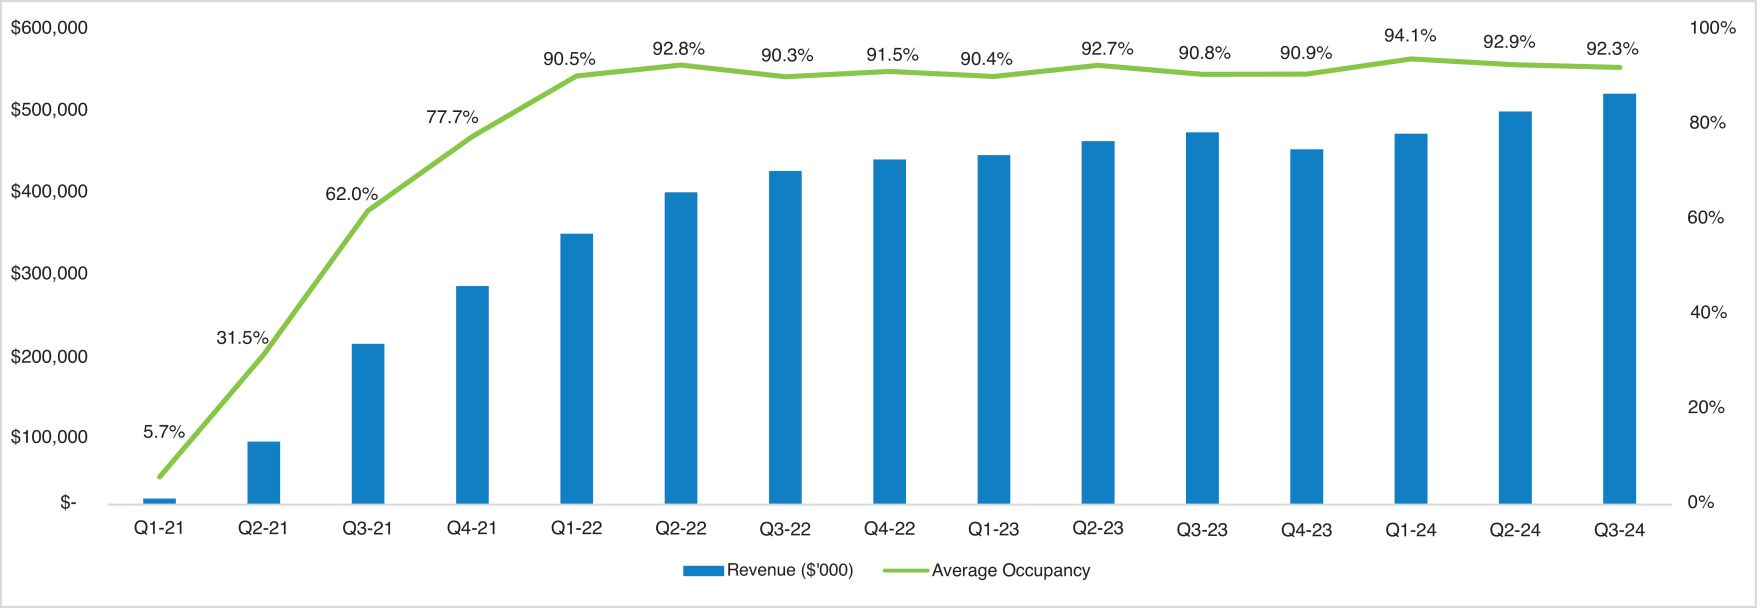
| | • | | Certificate of Occupancy: Phoenix, AZ. In May 2016, SSGT purchased a purpose built self storage facility in Phoenix, AZ for $7.2 million. The property offers a blend of interior climate controlled units and exterior access non-climate controlled units, in addition to vehicle storage. The property’s 840 units span across approximately 90,000 rentable square feet. We acquired the property through the SSGT merger in January 2019, for an allocated purchase price of $13.2 million. In addition, we added solar panels to the facility in 2021. The property became physically stabilized in approximately two years and was 91.5% occupied as of the quarter ended September 30, 2024. For the quarter ended September 30, 2024, the property generated approximately $310,000 of net operating income. The table below outlines the historical annual revenues and average occupancy for the trailing seven years ended December 31, 2023: |
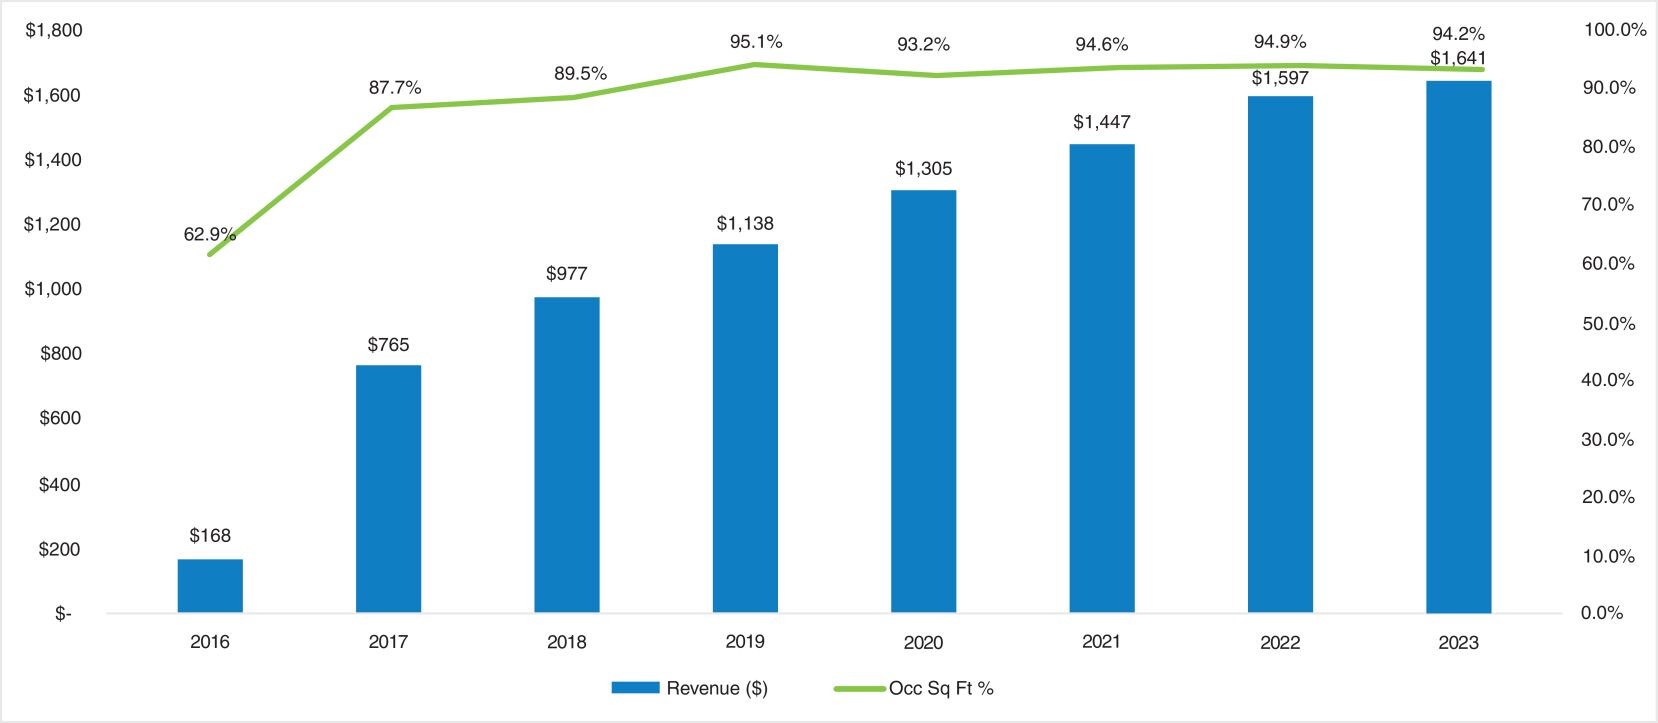
| | • | | Lease-Up: Punta Gorda, FL. In June 2020, SST IV purchased a purpose built self storage facility in Punta Gorda, FL for $16.9 million. The property had opened the prior year and had a physical occupancy of 46.0% when we acquired it. The property offers a blend of interior climate controlled units drive up interior units via a drive-through. The property’s 800 units span across approximately 106,400 rentable square feet. We acquired the property through the SST IV merger in March 2021, for an allocated purchase price of $18.5 million. The property leased up to 90% physical occupancy in 12 months and was 94.6% occupied as of the quarter ended September 30, 2024. For the quarter ended September 30, 2024, the property generated approximately $292,000 of net operating income. In addition, solar panels were added in October 2023, launching the production of renewable energy at the property. |
125
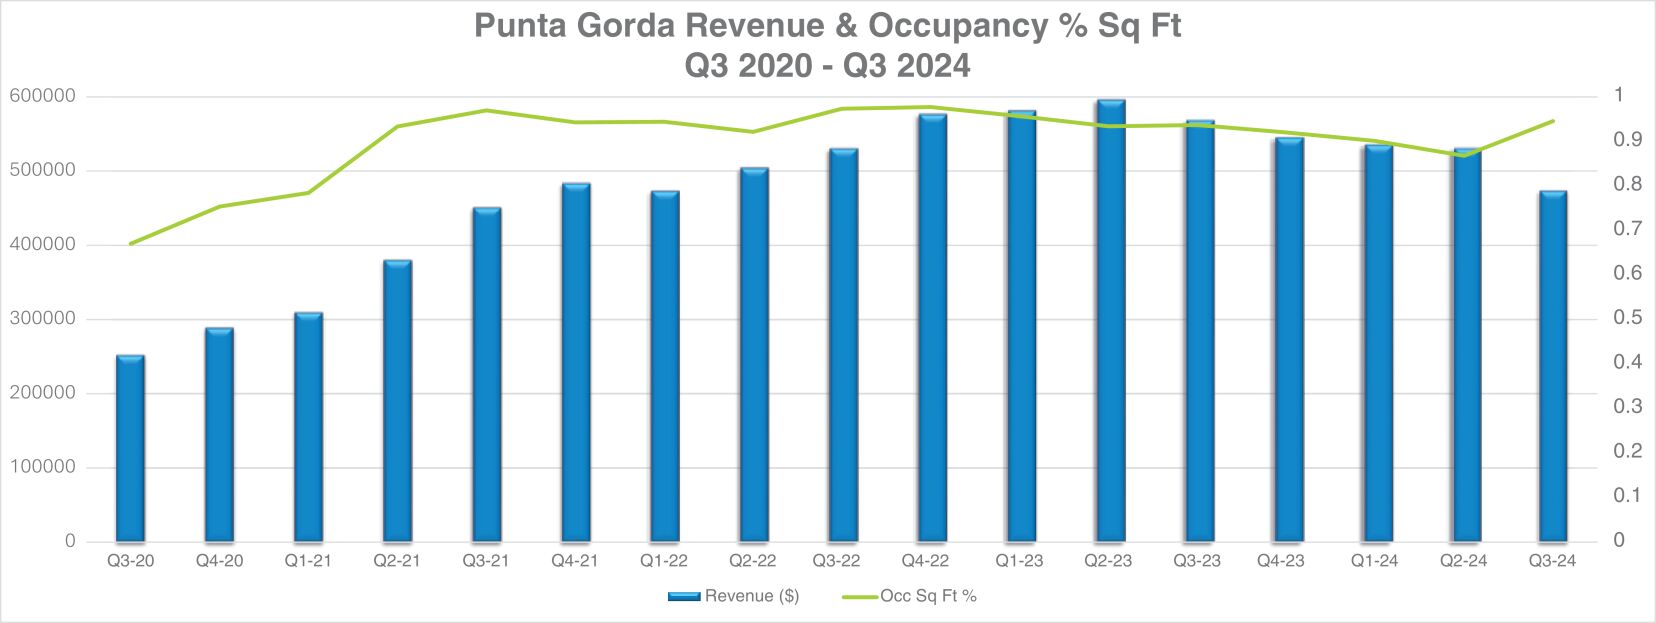
| | • | | Physically Stabilized: Sacramento, CA. In May 2016, we purchased a self storage facility Sacramento, CA for $8.2 million. The property had been open for several years, with physical occupancy of 92.7% when we acquired it, but rents were well below market. The property’s 540 units span across approximately 62,600 rentable square feet. Since the acquisition of the property, rental revenue has increased by over 50%, and solar panels were added in July of 2023, for additional electricity savings. The property was 93.2% occupied as of the quarter ended September 30, 2024. For the quarter ended September 30, 2024, the property generated approximately $152,000 of net operating income. |
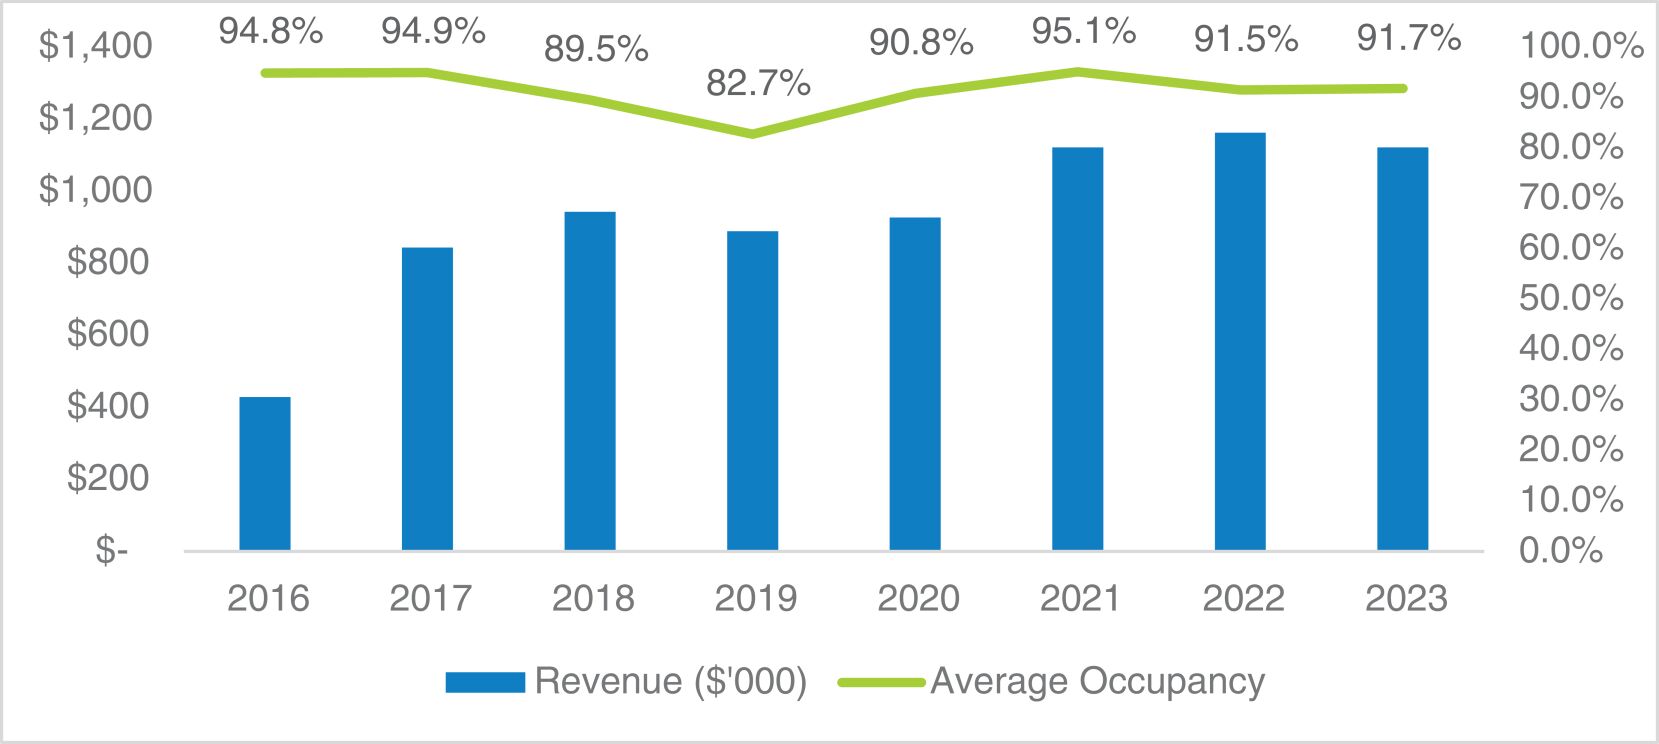
| | • | | Expansion: Greenville, OH. In June 2024, we completed the expansion of an existing facility in Greenville, OH. The development cost of the expansion units was approximately $0.7 million. The expansion added 7,050 NRSF of climate-controlled self storage units. As of September 30, 2024, the expansion units were approximately 91.5% occupied, with contract rent of approximately $63,000 on an annualized basis. |
The following table summarizes information about our wholly-owned and owned joint venture operating properties in our portfolio as of September 30, 2024:
| | | | | | | | | | | | | | | | | | | | | | | | | | |
Name | | Address | | City | | State | | MSA(1) | | Country | | %
Owned | | | Total
NRSF | | | Total
Units | | | Acquisition
Date | |
Milton | | 530 Martin St | | Milton | | ONT | | Toronto | | Canada | | | 100 | % | | | 69,300 | | | | 780 | | | | 2/11/2016 | |
Burlington I | | 1207 Appleby Line | | Burlington | | ONT | | Toronto | | Canada | | | 100 | % | | | 81,300 | | | | 830 | | | | 2/11/2016 | |
Oakville I | | 2055 Cornwall Rd | | Oakville | | ONT | | Toronto | | Canada | | | 100 | % | | | 100,300 | | | | 830 | | | | 2/11/2016 | |
Oakville II | | 480 S. Service Rd. W | | Oakville | | ONT | | Toronto | | Canada | | | 100 | % | | | 92,700 | | | | 810 | | | | 2/29/2016 | |
Burlington II | | 4491 Mainway Dr | | Burlington | | ONT | | Toronto | | Canada | | | 100 | % | | | 55,100 | | | | 470 | | | | 2/29/2016 | |
126
| | | | | | | | | | | | | | | | | | | | | | | | | | |
Name | | Address | | City | | State | | MSA(1) | | Country | | %
Owned | | | Total
NRSF | | | Total
Units | | | Acquisition
Date | |
Dufferin | | 4548 Dufferin Street | | North York | | ONT | | Toronto | | Canada | | | 100 | % | | | 124,600 | | | | 1,080 | | | | 2/1/2017 | |
Mavis | | 3136 Mavis Road | | Mississauga | | ONT | | Toronto | | Canada | | | 100 | % | | | 101,000 | | | | 810 | | | | 2/1/2017 | |
Brewster | | 8 Brewster Rd | | Brampton | | ONT | | Toronto | | Canada | | | 100 | % | | | 91,700 | | | | 780 | | | | 2/1/2017 | |
Granite | | 600 Granite Ct. | | Pickering | | ONT | | Toronto | | Canada | | | 100 | % | | | 82,800 | | | | 770 | | | | 2/1/2017 | |
Centennial | | 515 Centennial Road | | Scarborough | | ONT | | Toronto | | Canada | | | 100 | % | | | 69,200 | | | | 640 | | | | 2/1/2017 | |
Leaside | | 145 Wicksteed Ave | | East York | | ONT | | Toronto | | Canada | | | 50 | % | | | 99,530 | | | | 1,000 | | | | 3/17/2021 | |
Bramport | | 9910 Airport Road | | Brampton | | ONT | | Toronto | | Canada | | | 50 | % | | | 100,210 | | | | 1,050 | | |
| 3/17/2021
|
|
Oshawa | | 600 Fox Street | | Oshawa | | ONT | | Toronto | | Canada | | | 50 | % | | | 92,650 | | | | 950 | | |
| 3/17/2021
|
|
Stoney Creek I | | 365 Fruitland Rd | | Stoney Creek
| | ONT | | Toronto | | Canada | | | 100 | % | | | 76,500 | | | | 910 | | | | 1/24/2019 | |
Torbarrie | | 69 Torbarrie Rd | | North York
| | ONT | | Toronto | | Canada | | | 100 | % | | | 84,700 | | | | 830 | | | | 1/24/2019 | |
Vaughan | | 50 Cityview Blvd | | Vaughan | | ONT | | Toronto | | Canada | | | 50 | % | | | 84,900 | | | | 880 | | |
| 3/17/2021
|
|
Dupont | | 1120 Dupont Street | | Toronto | | ONT | | Toronto | | Canada | | | 50 | % | | | 46,090 | | | | 730 | | | | 6/1/2022 | |
Aurora | | 87 Goulding | | Aurora | | ONT | | Toronto | | Canada | | | 50 | % | | | 99,490 | | | | 960 | | |
| 6/1/2022
|
|
Kingspoint | | 24 Vodden St E | | Brampton | | ONT | | Toronto | | Canada | | | 50 | % | | | 97,010 | | | | 1,070 | | | | 3/17/2021 | |
Scarborough | | 801 Milner Ave | | Scarborough | | ONT | | Toronto | | Canada | | | 50 | % | | | 97,980 | | | | 1,000 | | | | 3/17/2021 | |
Iroquois Shore Rd, Oakville | | 450 Iroquois Shore Rd | | Oakville | | ONT | | Toronto | | Canada | | | 100 | % | | | 81,500 | | | | 1,070 | | | | 4/16/2021 | |
Whitby | | 60 Taunton Rd E | | Whitby | | ONT | | Toronto | | Canada | | | 50 | % | | | 84,540 | | | | 870 | | | | 1/12/2023 | |
Markham | | 506 Copper Creek Dr | | Markham | | ONT | | Toronto | | Canada | | | 50 | % | | | 95,000 | | | | 930 | | | | 6/1/2022 | |
Asheville I | | 1130 Sweeten Creek Rd | | Asheville | | NC | | Asheville | | US | | | 100 | % | | | 101,700 | | | | 600 | | | | 12/30/2016 | |
Asheville II | | 127 Sweeten Creek Rd | | Asheville | | NC | | Asheville | | US | | | 100 | % | | | 44,800 | | | | 340 | | | | 12/30/2016 | |
Hendersonville I | | 1931 Spartanburg Hwy | | Hendersonville | | NC | | Asheville | | US | | | 100 | % | | | 40,800 | | | | 350 | | | | 12/30/2016 | |
Asheville III | | 600 Patton Ave | | Asheville | | NC | | Asheville | | US | | | 100 | % | | | 55,900 | | | | 420 | | | | 12/30/2016 | |
Arden | | 3909 Sweeten Creek Rd | | Arden | | NC | | Asheville | | US | | | 100 | % | | | 74,600 | | | | 560 | | | | 12/30/2016 | |
Asheville IV | | 40 Wilmington St | | Asheville | | NC | | Asheville | | US | | | 100 | % | | | 58,300 | | | | 480 | | | | 12/30/2016 | |
Asheville V | | 90 Highlands Center Blvd | | Asheville | | NC | | Asheville | | US | | | 100 | % | | | 86,700 | | | | 450 | | | | 12/30/2016 | |
Asheville VI | | 21 Sardis Rd | | Asheville | | NC | | Asheville | | US | | | 100 | % | | | 45,400 | | | | 380 | | | | 12/30/2016 | |
Asheville VIII | | 550 Swannanoa Rvr Rd | | Asheville | | NC | | Asheville | | US | | | 100 | % | | | 66,400 | | | | 390 | | | | 12/30/2016 | |
Hendersonville II | | 102 Glover St | | Hendersonville | | NC | | Asheville | | US | | | 100 | % | | | 70,800 | | | | 490 | | | | 12/30/2016 | |
Asheville VII | | 2594 Sweeten Creek Rd | | Asheville | | NC | | Asheville | | US | | | 100 | % | | | 26,700 | | | | 210 | | | | 12/30/2016 | |
3173 Sweeten Creek Rd, Asheville | | 3173 Sweeten Creek Rd | | Asheville | | NC | | Asheville | | US | | | 100 | % | | | 71,700 | | | | 670 | | | | 1/24/2019 | |
Deaverview Rd, Asheville | | 197 Deaverview Rd | | Asheville | | NC | | Asheville | | US | | | 100 | % | | | 59,900 | | | | 370 | | | | 1/24/2019 | |
Highland Center Blvd, Asheville | | 75 Highland Center Blvd | | Asheville | | NC | | Asheville | | US | | | 100 | % | | | 66,200 | | | | 490 | | | | 1/24/2019 | |
Boynton Beach | | 3101 S Federal Highway | | Boynton
Beach | | FL | | Miami -Fort
Lauderdale | | US | | | 100 | % | | | 75,100 | | | | 840 | | | | 1/7/2016 | |
Pompano Beach | | 2320 NE 5th Ave | | Pompano
Beach | | FL | | Miami -Fort
Lauderdale | | US | | | 100 | % | | | 115,400 | | | | 860 | | | | 6/1/2016 | |
Lake Worth | | 8135 Lake Worth Rd | | Lake Worth | | FL | | Miami -Fort
Lauderdale | | US | | | 100 | % | | | 127,100 | | | | 830 | | | | 6/1/2016 | |
Jupiter | | 2581 Jupiter Park Dr | | Jupiter | | FL | | Miami -Fort
Lauderdale | | US | | | 100 | % | | | 92,700 | | | | 830 | | | | 6/1/2016 | |
Royal Palm Beach | | 10719 Southern Blvd | | Royal Palm
Beach | | FL | | Miami -Fort
Lauderdale | | US | | | 100 | % | | | 115,200 | | | | 850 | | | | 6/1/2016 | |
Wellington | | 1341 S State Rd 7 | | Wellington | | FL | | Miami -Fort
Lauderdale | | US | | | 100 | % | | | 86,900 | | | | 730 | | | | 6/1/2016 | |
127
| | | | | | | | | | | | | | | | | | | | | | | | | | |
Name | | Address | | City | | State | | MSA(1) | | Country | | %
Owned | | | Total
NRSF | | | Total
Units | | | Acquisition
Date | |
Doral | | 10451 NW 33rd St | | Doral | | FL | | Miami -Fort
Lauderdale | | US | | | 100 | % | | | 107,500 | | | | 1,000 | | | | 6/1/2016 | |
Plantation | | 10325 W Broward Blvd | | Plantation | | FL | | Miami -Fort
Lauderdale | | US | | | 100 | % | | | 89,900 | | | | 910 | | | | 6/1/2016 | |
Delray | | 189 W Linton Blvd | | Delray Bch | | FL | | Miami -Fort
Lauderdale | | US | | | 100 | % | | | 136,000 | | | | 900 | | | | 6/1/2016 | |
Pembroke Pines | | 18804 Pines Blvd | | Pembroke
Pines | | FL | | Miami -Fort
Lauderdale | | US | | | 100 | % | | | 83,900 | | | | 870 | | | | 1/24/2019 | |
NE 12th Ave, Homestead | | 1235 NE 12th Ave | | Homestead | | FL | | Miami -Fort
Lauderdale | | US | | | 100 | % | | | 96,200 | | | | 800 | | | | 6/1/2022 | |
Miami | | 250 NE 135th St | | Miami | | FL | | Miami -Fort
Lauderdale | | US | | | 100 | % | | | 95,200 | | | | 1,050 | | | | 9/24/2024 | |
La Verne | | 2234 Arrow Hwy | | La Verne | | CA | | Los Angeles | | US | | | 100 | % | | | 52,400 | | | | 520 | | | | 1/23/2015 | |
Lancaster | | 43745 Sierra Hwy | | Lancaster | | CA | | Los Angeles | | US | | | 100 | % | | | 59,200 | | | | 690 | | | | 1/29/2015 | |
Santa Ana | | 4200 Westminster Ave | | Santa Ana | | CA | | Los Angeles | | US | | | 100 | % | | | 84,700 | | | | 830 | | | | 2/5/2015 | |
La Habra | | 580 E Lambert Rd | | La Habra | | CA | | Los Angeles | | US | | | 100 | % | | | 51,900 | | | | 420 | | | | 2/5/2015 | |
Monterey Park | | 404 Potrero Grande | | Monterey Park | | CA | | Los Angeles | | US | | | 100 | % | | | 31,200 | | | | 390 | | | | 2/5/2015 | |
Huntington Beach | | 7611 Talbert Avenue | | Huntington
Beach | | CA | | Los Angeles | | US | | | 100 | % | | | 60,500 | | | | 610 | | | | 2/5/2015 | |
Whittier | | 10231 S. Colima Rd | | Whittier | | CA | | Los Angeles | | US | | | 100 | % | | | 58,300 | | | | 520 | | | | 2/19/2015 | |
Lancaster II | | 43707 N. Sierra HWY | | Lancaster | | CA | | Los Angeles | | US | | | 100 | % | | | 87,100 | | | | 600 | | | | 1/11/2016 | |
Azusa | | 1111 W. Gladstone | | Azusa | | CA | | Los Angeles | | US | | | 100 | % | | | 64,000 | | | | 660 | | | | 1/24/2019 | |
Garden Grove | | 12321 Western Ave | | Garden Grove | | CA | | Los Angeles | | US | | | 100 | % | | | 111,100 | | | | 960 | | | | 1/24/2019 | |
San Gabriel | | 5216 Walnut Grove Ave | | San Gabriel | | CA | | Los Angeles | | US | | | 100 | % | | | 78,100 | | | | 790 | | | | 7/13/2023 | |
Kingwood | | 1671 Northpark Dr | | Kingwood | | TX | | Houston | | US | | | 100 | % | | | 59,900 | | | | 470 | | | | 1/24/2019 | |
West Rd, Houston | | 10830 West Road | | Houston | | TX | | Houston | | US | | | 100 | % | | | 74,700 | | | | 640 | | | | 6/1/2022 | |
Emmett F Lowry Expy, Texas City | | 3730 Emmett F Lowry Expwy | | Texas City | | TX | | Houston | | US | | | 100 | % | | | 60,200 | | | | 480 | | | | 3/17/2021 | |
Westheimer Pkwy, Katy | | 23250 Westheimer Pkwy | | Katy | | TX | | Houston | | US | | | 100 | % | | | 61,200 | | | | 570 | | | | 3/17/2021 | |
FM 1488, The Woodlands II | | 3750 FM 1488 | | Conroe | | TX | | Houston | | US | | | 100 | % | | | 89,600 | | | | 630 | | | | 3/17/2021 | |
Hwy 290, Cypress | | 27236 US Highway 290 | | Cypress | | TX | | Houston | | US | | | 100 | % | | | 90,300 | | | | 580 | | | | 3/17/2021 | |
Lake Houston Pkwy, Humble | | 20535 W. Lake Houston Pkwy | | Humble | | TX | | Houston | | US | | | 100 | % | | | 115,700 | | | | 660 | | | | 3/17/2021 | |
Gosling Rd, The Woodlands | | 7474 Gosling Rd | | The
Woodlands | | TX | | Houston | | US | | | 100 | % | | | 61,900 | | | | 560 | | | | 3/17/2021 | |
Queenston Blvd, Houston | | 8415 Queenston Blvd. | | Houston | | TX | | Houston | | US | | | 100 | % | | | 63,300 | | | | 540 | | | | 3/17/2021 | |
Las Vegas I | | 590 E Silverado Ranch Blvd | | Las Vegas | | NV | | Las Vegas | | US | | | 100 | % | | | 107,300 | | | | 770 | | | | 7/28/2016 | |
Las Vegas II | | 9890 Pollock Dr | | Las Vegas | | NV | | Las Vegas | | US | | | 100 | % | | | 100,700 | | | | 810 | | | | 9/23/2016 | |
Las Vegas III | | 6318 W Sahara Ave | | Las Vegas | | NV | | Las Vegas | | US | | | 100 | % | | | 81,900 | | | | 640 | | | | 9/27/2016 | |
Jones Blvd, Las Vegas I | | 4349 S. Jones Blvd. | | Las Vegas | | NV | | Las Vegas | | US | | | 100 | % | | | 91,300 | | | | 1,000 | | | | 1/24/2019 | |
Russell Blvd, Las Vegas II | | 4866 E. Russell Rd. | | Las Vegas | | NV | | Las Vegas | | US | | | 100 | % | | | 171,300 | | | | 1,160 | | | | 1/24/2019 | |
Hualapai Way, Las Vegas | | 6888 N Hualapai Way | | Las Vegas | | NV | | Las Vegas | | US | | | 100 | % | | | 73,300 | | | | 570 | | | | 1/24/2019 | |
Durango Dr, Las Vegas | | 5730 Durango Drive | | Las Vegas | | NV | | Las Vegas | | US | | | 100 | % | | | 107,900 | | | | 950 | | | | 6/1/2022 | |
128
| | | | | | | | | | | | | | | | | | | | | | | | | | |
Name | | Address | | City | | State | | MSA(1) | | Country | | %
Owned | | | Total
NRSF | | | Total
Units | | | Acquisition
Date | |
Las Vegas Blvd, Las Vegas | | 8020 Las Vegas Blvd S | | Las Vegas | | NV | | Las Vegas | | US | | | 100 | % | | | 55,300 | | | | 620 | | | | 3/17/2021 | |
Centennial Pkwy, LV II | | 2555 W Centennial Pkwy | | N Las Vegas | | NV | | Las Vegas | | US | | | 100 | % | | | 76,000 | | | | 640 | | | | 3/17/2021 | |
Xenia | | 1900 Bellbrook Ave | | Xenia | | OH | | Dayton | | US | | | 100 | % | | | 59,200 | | | | 490 | | | | 4/20/2016 | |
Sidney | | 700 W Russell Rd | | Sidney | | OH | | Dayton | | US | | | 100 | % | | | 46,600 | | | | 440 | | | | 4/20/2016 | |
Troy | | 21 Kings Chapel Dr N | | Troy | | OH | | Dayton | | US | | | 100 | % | | | 52,700 | | | | 510 | | | | 4/20/2016 | |
Greenville | | 1325 Benden Way | | Greenville | | OH | | Dayton | | US | | | 100 | % | | | 50,400 | | | | 450 | | | | 4/20/2016 | |
Washington Court House | | 1840 Victoria St | | Washington
Court House | | OH | | Dayton | | US | | | 100 | % | | | 54,200 | | | | 470 | | | | 4/20/2016 | |
Richmond | | 1880 Williamsburg Pike | | Richmond | | IN | | Dayton | | US | | | 100 | % | | | 64,700 | | | | 660 | | | | 4/20/2016 | |
Connersville | | 4950 N Western Ave | | Connersville | | IN | | Dayton | | US | | | 100 | % | | | 48,000 | | | | 370 | | | | 4/20/2016 | |
Littleton | | 3757 Norwood Dr | | Littleton | | CO | | Denver | | US | | | 100 | % | | | 39,900 | | | | 380 | | | | 1/23/2015 | |
Federal Heights | | 8920 Federal Blvd | | Federal
Heights | | CO | | Denver | | US | | | 100 | % | | | 41,400 | | | | 450 | | | | 1/29/2015 | |
Aurora | | 435 Airport Blvd | | Aurora | | CO | | Denver | | US | | | 100 | % | | | 87,800 | | | | 840 | | | | 2/5/2015 | |
Aurora II | | 6950 S Gartrell Rd | | Aurora | | CO | | Denver | | US | | | 100 | % | | | 57,500 | | | | 410 | | | | 1/11/2017 | |
Aurora III | | 500 Laredo St | | Aurora | | CO | | Denver | | US | | | 100 | % | | | 67,700 | | | | 470 | | | | 1/24/2019 | |
Alameda Pkwy, Lakewood | | 12750 W Alameda Parkway | | Lakewood | | CO | | Denver | | US | | | 100 | % | | | 88,000 | | | | 770 | | | | 10/19/2021 | |
Gartrell Rd, Aurora | | 7411 S Gartrell Rd | | Aurora | | CO | | Denver | | US | | | 100 | % | | | 55,000 | | | | 540 | | | | 6/28/2022 | |
Crestwood | | 4747 W Calumet-Sag Rd | | Crestwood | | IL | | Chicago | | US | | | 100 | % | | | 49,300 | | | | 450 | | | | 1/23/2015 | |
Bloomingdale | | 240 W. Army Trail Rd | | Bloomingdale | | IL | | Chicago | | US | | | 100 | % | | | 58,400 | | | | 570 | | | | 2/19/2015 | |
Romeoville | | 1302 Marquette Dr | | Romeoville | | IL | | Chicago | | US | | | 100 | % | | | 67,300 | | | | 670 | | | | 1/24/2019 | |
Elgin | | 1001 Toll Gate Rd | | Elgin | | IL | | Chicago | | US | | | 100 | % | | | 48,300 | | | | 410 | | | | 1/24/2019 | |
Elk Grove | | 1600 Busse Rd | | Elk Grove
Village | | IL | | Chicago | | US | | | 100 | % | | | 95,250 | | | | 780 | | | | 1/24/2019 | |
Algonquin Rd, Algonquin | | 1910 E Algonquin Rd | | Algonquin | | IL | | Chicago | | US | | | 100 | % | | | 113,900 | | | | 905 | | | | 2/8/2022 | |
Riverside | | 6667 Van Buren Blvd | | Riverside | | CA | | Riverside - SB | | US | | | 100 | % | | | 61,500 | | | | 570 | | | | 1/23/2015 | |
Upland | | 1571 W Foothill Blvd | | Upland | | CA | | Riverside - SB | | US | | | 100 | % | | | 57,900 | | | | 620 | | | | 1/29/2015 | |
Riverside | | 7211 Arlington Ave | | Riverside | | CA | | Riverside - SB | | US | | | 100 | % | | | 61,300 | | | | 580 | | | | 1/24/2019 | |
Van Buren Blvd, Riverside II | | 3167 Van Buren Blvd. | | Riverside | | CA | | Riverside - SB | | US | | | 100 | % | | | 57,300 | | | | 470 | | | | 3/17/2021 | |
Van Buren Blvd, Riverside III | | 6637 Van Buren Blvd | | Riverside | | CA | | Riverside - SB | | US | | | 100 | % | | | 68,700 | | | | 450 | | | | 5/27/2021 | |
Everett | | 10919 Evergreen Way | | Everett | | WA | | Seattle - Tacoma | | US | | | 100 | % | | | 48,500 | | | | 490 | | | | 2/5/2015 | |
Bothell Everett, Mill Creek | | 16618 Bothell Everett Hwy | | Mill Creek | | WA | | Seattle - Tacoma | | US | | | 100 | % | | | 101,450 | | | | 1,090 | | | | 6/1/2022 | |
93rd Ave SW, Olympia | | 2900 93rd Ave. SW | | Olympia | | WA | | Seattle - Tacoma | | US | | | 100 | % | | | 92,500 | | | | 660 | | | | 6/1/2022 | |
Meridian Ave, Puyallup | | 1401 N Meridian Ave | | Puyallup | | WA | | Seattle - Tacoma | | US | | | 100 | % | | | 97,900 | | | | 830 | | | | 3/17/2021 | |
Redmond Fall City Rd, Redmond | | 23316 Redmond-Fall City Rd NE | | Redmond | | WA | | Seattle - Tacoma | | US | | | 100 | % | | | 50,200 | | | | 360 | | | | 3/17/2021 | |
Tampa | | 9823 W Hillsborough Ave | | Tampa | | FL | | Tampa | | US | | | 100 | % | | | 50,100 | | | | 520 | | | | 11/3/2015 | |
129
| | | | | | | | | | | | | | | | | | | | | | | | | | |
Name | | Address | | City | | State | | MSA(1) | | Country | | %
Owned | | | Total
NRSF | | | Total
Units | | | Acquisition
Date | |
Riverview | | 9811 Progress Blvd. | | Riverview | | FL | | Tampa | | US | | | 100 | % | | | 77,300 | | | | 830 | | | | 1/24/2019 | |
State Rd 54, Lutz | | 16900 FL-54 | | Lutz | | FL | | Tampa | | US | | | 100 | % | | | 87,300 | | | | 790 | | | | 6/1/2022 | |
34th St N, St. Petersburg | | 289 34th St N | | St. Petersburg | | FL | | Tampa | | US | | | 100 | % | | | 74,400 | | | | 790 | | | | 6/1/2022 | |
Jim Johnson Rd, Plant City | | 1610 Jim Johnson Rd | | Plant City | | FL | | Tampa | | US | | | 100 | % | | | 189,000 | | | | 960 | | | | 3/17/2021 | |
Warren I | | 27203 Groesbeck Hwy | | Warren | | MI | | Detroit | | US | | | 100 | % | | | 64,600 | | | | 510 | | | | 5/8/2015 | |
Troy | | 262 E. Maple Road | | Troy | | MI | | Detroit | | US | | | 100 | % | | | 82,300 | | | | 740 | | | | 5/8/2015 | |
Warren II | | 24623 Ryan Road | | Warren | | MI | | Detroit | | US | | | 100 | % | | | 52,100 | | | | 490 | | | | 5/8/2015 | |
Sterling Heights | | 42557 Van Dyke Avenue | | Sterling
Heights | | MI | | Detroit | | US | | | 100 | % | | | 67,100 | | | | 480 | | | | 5/21/2015 | |
Baseline | | 1500 E Baseline Rd | | Phoenix | | AZ | | Phoenix | | US | | | 100 | % | | | 89,800 | | | | 840 | | | | 1/24/2019 | |
Happy Valley Rd, Phoenix | | 1740 W. Happy Valley Road | | Phoenix | | AZ | | Phoenix | | US | | | 100 | % | | | 64,100 | | | | 590 | | | | 6/1/2022 | |
Gilbert | | 2845 E. Riggs Rd | | Gilbert | | AZ | | Phoenix | | US | | | 100 | % | | | 96,500 | | | | 980 | | | | 7/11/2019 | |
Greenway Rd, Surprise | | 13788 W Greenway Rd | | Surprise | | AZ | | Phoenix | | US | | | 100 | % | | | 78,700 | | | | 720 | | | | 3/17/2021 | |
Port St. Lucie I | | 525 SW S Macedo Blvd. | | Port St Lucie | | FL | | Port St. Lucie | | US | | | 100 | % | | | 57,700 | | | | 530 | | | | 4/29/2016 | |
Port St. Lucie II | | 501 NW Business Center Dr | | Port St Lucie | | FL | | Port St. Lucie | | US | | | 100 | % | | | 108,600 | | | | 720 | | | | 6/1/2016 | |
Ft. Pierce | | 3252 N. Us Hwy 1 | | Fort Pierce | | FL | | Port St. Lucie | | US | | | 100 | % | | | 85,300 | | | | 760 | | | | 1/24/2019 | |
Industrial, Jensen Beach | | 1105 NE Industrial Blvd | | Jensen Beach | | FL | | Port St. Lucie | | US | | | 100 | % | | | 67,300 | | | | 600 | | | | 3/17/2021 | |
Chico | | 3860 Benatar Way | | Chico | | CA | | Sacramento | | US | | | 100 | % | | | 39,900 | | | | 350 | | | | 1/23/2015 | |
Sacramento | | 660 Garden Highway | | Sacramento | | CA | | Sacramento | | US | | | 100 | % | | | 62,600 | | | | 540 | | | | 5/9/2016 | |
Mills Station Rd, Sacramento | | 9950 Mills Station Rd | | Sacramento | | CA | | Sacramento | | US | | | 100 | % | | | 108,000 | | | | 1,080 | | | | 6/1/2022 | |
Pell Circle, Sacramento | | 3970 Pell Circle | | Sacramento | | CA | | Sacramento | | US | | | 100 | % | | | 97,600 | | | | 925 | | | | 5/10/2022 | |
Fairfield | | 2998 Rockville Rd | | Fairfield | | CA | | San Francisco -
Oakland | | US | | | 100 | % | | | 41,000 | | | | 430 | | | | 1/23/2015 | |
Vallejo | | 1401 Enterprise St | | Vallejo | | CA | | San Francisco -
Oakland | | US | | | 100 | % | | | 56,400 | | | | 530 | | | | 1/29/2015 | |
Concord | | 1597 Market St | | Concord | | CA | | San Francisco -
Oakland | | US | | | 100 | % | | | 157,800 | | | | 1,360 | | | | 5/18/2016 | |
Oakland | | 5200 Coliseum Way | | Oakland | | CA | | San Francisco -
Oakland | | US | | | 100 | % | | | 67,400 | | | | 600 | | | | 5/18/2016 | |
Morrisville | | 150 Airport Blvd | | Morrisville | | NC | | Raleigh - Cary | | US | | | 100 | % | | | 37,600 | | | | 320 | | | | 11/3/2014 | |
Cary | | 120 Centrewest Ct | | Cary | | NC | | Raleigh - Cary | | US | | | 100 | % | | | 65,300 | | | | 330 | | | | 11/3/2014 | |
Raleigh | | 5012 New Bern Ave | | Raleigh | | NC | | Raleigh - Cary | | US | | | 100 | % | | | 60,900 | | | | 440 | | | | 11/3/2014 | |
Ardrey Kell Rd, Charlotte | | 9800 Ardrey Kell Rd | | Charlotte | | NC | | Charlotte | | US | | | 100 | % | | | 97,800 | | | | 1,090 | | | | 3/17/2021 | |
University City Blvd, Charlotte II | | 7307 University City Blvd | | Charlotte | | NC | | Charlotte | | US | | | 100 | % | | | 78,900 | | | | 810 | | | | 3/17/2021 | |
Airport Rd, Colorado Springs | | 3850 Airport Rd | | Colorado
Springs | | CO | | Colorado
Springs | | US | | | 100 | % | | | 58,300 | | | | 690 | | | | 1/24/2019 | |
Colorado Springs II | | 3150 Boychuck Ave | | Colorado
Springs | | CO | | Colorado Springs | | US | | | 100 | % | | | 100,500 | | | | 580 | | | | 4/10/2024 | |
Myrtle Beach I | | 338 Jessie St | | Myrtle Beach | | SC | | Myrtle Beach | | US | | | 100 | % | | | 102,100 | | | | 780 | | | | 11/3/2014 | |
Myrtle Beach II | | 4630 Dick Pond Rd | | Myrtle Beach | | SC | | Myrtle Beach | | US | | | 100 | % | | | 95,700 | | | | 670 | | | | 11/3/2014 | |
Naples | | 7755 Preserve Ln | | Naples | | FL | | Naples | | US | | | 100 | % | | | 79,700 | | | | 720 | | | | 6/1/2016 | |
Goodlette Rd, Naples | | 275 Goodlette-Frank Rd | | Naples | | FL | | Naples | | US | | | 100 | % | | | 77,700 | | | | 700 | | | | 3/17/2021 | |
130
| | | | | | | | | | | | | | | | | | | | | | | | | | |
Name | | Address | | City | | State | | MSA(1) | | Country | | %
Owned | | | Total
NRSF | | | Total
Units | | | Acquisition
Date | |
Eastlake | | 2380 Fenton St | | Chula Vista | | CA | | San Diego | | US | | | 100 | % | | | 85,000 | | | | 870 | | | | 1/24/2019 | |
Metcalf St, Escondido | | 852 Metcalf St. | | Escondido | | CA | | San Diego | | US | | | 100 | % | | | 96,400 | | | | 1,150 | | | | 3/17/2021 | |
Santa Rosa | | 3937 Santa Rosa Ave | | Santa Rosa | | CA | | Santa Rosa -
Petaluma | | US | | | 100 | % | | | 116,600 | | | | 1,140 | | | | 1/29/2015 | |
Sonoma | | 19240 Highway 12 | | Sonoma | | CA | | Santa Rosa -
Petaluma | | US | | | 100 | % | | | 37,900 | | | | 340 | | | | 6/14/2016 | |
Baltimore | | 7989 Rossville Blvd | | Nottingham | | MD | | Baltimore | | US | | | 100 | % | | | 114,300 | | | | 1,080 | | | | 6/1/2016 | |
Mount Pleasant | | 701 Wando Park Blvd | | Mt Pleasant | | SC | | Charleston | | US | | | 100 | % | | | 48,200 | | | | 490 | | | | 1/24/2019 | |
Hydraulic Rd, Charlottesville | | 2307 Hydraulic Rd | | Charlottesville | | VA | | Charlottesville | | US | | | 100 | % | | | 71,100 | | | | 830 | | | | 3/17/2021 | |
Texas Ave, College Station | | 3101 Texas Avenue S. | | College
Station | | TX | | College Station | | US | | | 100 | % | | | 71,900 | | | | 600 | | | | 3/17/2021 | |
McKinney | | 2280 N Custer Rd | | McKinney | | TX | | Dallas | | US | | | 100 | % | | | 94,100 | | | | 730 | | | | 1/24/2019 | |
St Johns Commons Rd, St Johns | | 124 St Johns Commons Road | | St Johns | | FL | | Jacksonville | | US | | | 100 | % | | | 55,400 | | | | 480 | | | | 5/17/2022 | |
Capitol Dr, Milwaukee | | 3420 W. Capitol Drive | | Milwaukee | | WI | | Milwaukee | | US | | | 100 | % | | | 83,400 | | | | 780 | | | | 6/1/2022 | |
Foley | | 8141 Highway 59 South | | Foley | | AL | | Mobile | | US | | | 100 | % | | | 163,300 | | | | 1,090 | | | | 9/11/2015 | |
Nantucket | | 6 Sun Island Rd | | Nantucket | | MA | | Nantucket | | US | | | 100 | % | | | 93,200 | | | | 840 | | | | 1/24/2019 | |
Frelinghuysen Ave, Newark | | 99 Evergreen Ave | | Newark | | NJ | | New York -
Newark | | US | | | 100 | % | | | 158,000 | | | | 1,900 | | | | 3/17/2021 | |
Marshall Farms Rd, Ocoee | | 1071 Marshall Farms Rd | | Ocoee | | FL | | Orlando | | US | | | 100 | % | | | 78,800 | | | | 780 | | | | 3/17/2021 | |
Tamiami Trail, Punta Gorda | | 3811 Tamiami Trail | | Punta Gorda | | FL | | Punta Gorda | | US | | | 100 | % | | | 106,400 | | | | 800 | | | | 3/17/2021 | |
San Antonio I | | 8239 Broadway St | | San Antonio | | TX | | San Antonio | | US | | | 100 | % | | | 76,500 | | | | 500 | | | | 1/24/2019 | |
Lompoc | | 517 N. 8th Street | | Lompoc | | CA | | Santa Maria-
Santa Barbara | | US | | | 100 | % | | | 47,500 | | | | 430 | | | | 2/5/2015 | |
Sarasota | | 1027 N Washington Blvd | | Sarasota | | FL | | Sarasota | | US | | | 100 | % | | | 46,600 | | | | 470 | | | | 1/24/2019 | |
Spartanburg | | 2119 E Main St | | Spartanburg | | SC | | Spartanburg | | US | | | 100 | % | | | 109,800 | | | | 950 | | | | 7/16/2024 | |
Stockton | | 7760 Lorraine Ave | | Stockton | | CA | | Stockton | | US | | | 100 | % | | | 49,100 | | | | 560 | | | | 1/24/2019 | |
Beverly | | 4233 Route 130 South | | Beverly | | NJ | | Trenton-
Princeton | | US | | | 100 | % | | | 47,100 | | | | 450 | | | | 5/28/2015 | |
Forestville | | 4100 Forestville Rd | | Forestville | | MD | | Washington-
Arlington | | US | | | 100 | % | | | 55,200 | | | | 530 | | | | 1/23/2015 | |
| | | | | | | | | | | | | | | | | | | | | | | | | | |
| | | | | | | | | | | | | | | | | 13,105,400 | | | | 115,740 | | | | | |
| | | | | | | | | | | | | | | | | | | | | | | | | | |
| (1) | | MSAs (Metropolitan Statistical Areas) as defined by the U.S. Census Bureau. Toronto CMA (Census Metropolitan Area) as defined by Statistics Canada. |
Employees and Human Capital
As of September 30, 2024, we had approximately 525 employees, none of whom are represented by a collective bargaining agreement. We continually assess and strive to enhance employee satisfaction and engagement. We believe our relationship with our employees is good and that we provide them with adequate flexibility to meet personal and family needs. We also appreciate the importance of retention, growth and development of our employees and we believe we offer competitive compensation (including salary and bonuses) and benefits packages to our employees. Further, from professional development opportunities to leadership training, we have development programs and on-demand opportunities to cultivate talent throughout our organization.
131
We strive to foster an inclusive work environment, composed of top talent and high performing employees. We maintain policies that strive to protect our employees from discrimination or harassment on the basis of color, race, sex, national origin, ethnicity, religion, age, disability, sexual orientation, gender identification or expression or any other status protected by applicable law. To that end, we conduct annual training to raise awareness of (and with the goal of preventing) all forms of harassment and discrimination.
SmartStop Values
SmartStop is committed to providing an exemplary experience for our customers and our employees. From our corporate offices to our properties, we all focus on our three corporate pillars to help ensure a successful and growing business:
| | • | | Lead Together: SmartStop has a fully integrated operations team of approximately 525 self storage professionals. We are influencers, doers and motivators. Each person brings unique experience and talent to their position, but we realize that our true strength comes from collaborating and supporting one another. It is when we work as a team and lead together that we can achieve extraordinary results. |
| | • | | Embrace Change: The world is constantly changing. Whether it’s relocating for work, a military deployment, a change in family structure, or preserving precious heirlooms, these and other life events affect our customers and our industry. We know these may be stressful, uncertain times for our customers so we are committed to supporting them in a warm and welcoming way. We also recognize the importance of change as an organization expanding into new markets and embracing new technologies. |
| | • | | Enhance Everyone’s Journey: Change may sometimes be difficult, but it is a necessary part of the process for our company to evolve and grow. We are committed to enhancing the journeys of everyone we meet. We serve our customers in the manner that best suits them, whether that be through our easy-to-use web site, our dedicated SmartStop call center, or on-site with our highly trained staff members. We support our employees by providing positive work environments and embracing their outside pursuits, whether it be competing as an amateur athlete or pursuing education goals. We contribute to the communities where we live and work through charitable initiatives and other projects. Finally, we care for our world by reducing our carbon footprint through our solar initiatives and other sustainability programs. |
Corporate Responsibility
Equally important to the above values that we hold here at SmartStop is our commitment to what we call corporate responsibility. Corporate responsibility comprises a multi-pronged approach across various focus areas, including environmental, social, and corporate governance, and has always been integral to our operating strategy. Our goal is to center our corporate responsibility on our three corporate pillars to propel our long-term success and have a positive impact for all stakeholders.
To help carry out our commitment to corporate responsibility, we formed an internal committee composed of senior management and key personnel across a broad discipline of practice areas, including human resources, legal, finance, investor relations, operations, marketing, and property acquisitions. Working with an external advisor, this committee has completed a materiality assessment that was consistent with the Global Reporting Initiative (GRI) sustainability reporting standards. The goal of the assessment was to identify preliminary material topics to further guide our sustainability planning and reporting efforts and help hone our focus with respect to environmental stewardship, social responsibility and corporate governance.
Environmental Stewardship
We have a history of implementing environmentally sustainable projects across our portfolio. These projects have included, but are not limited to, installing solar panel systems at our corporate headquarters and many of our
132
self storage facilities, operating out of our LEED Certified corporate headquarters, implementing LED lighting installation throughout our portfolio, and adopting xeriscape landscaping projects in water-sensitive locations.
In addition, our solar projects to date have produced a significant amount of kWh of electricity, nearly offsetting all electricity usage at those properties. The table below shows the growth in electricity production as more solar arrays have commenced operations during our Solar 2.0 initiative:
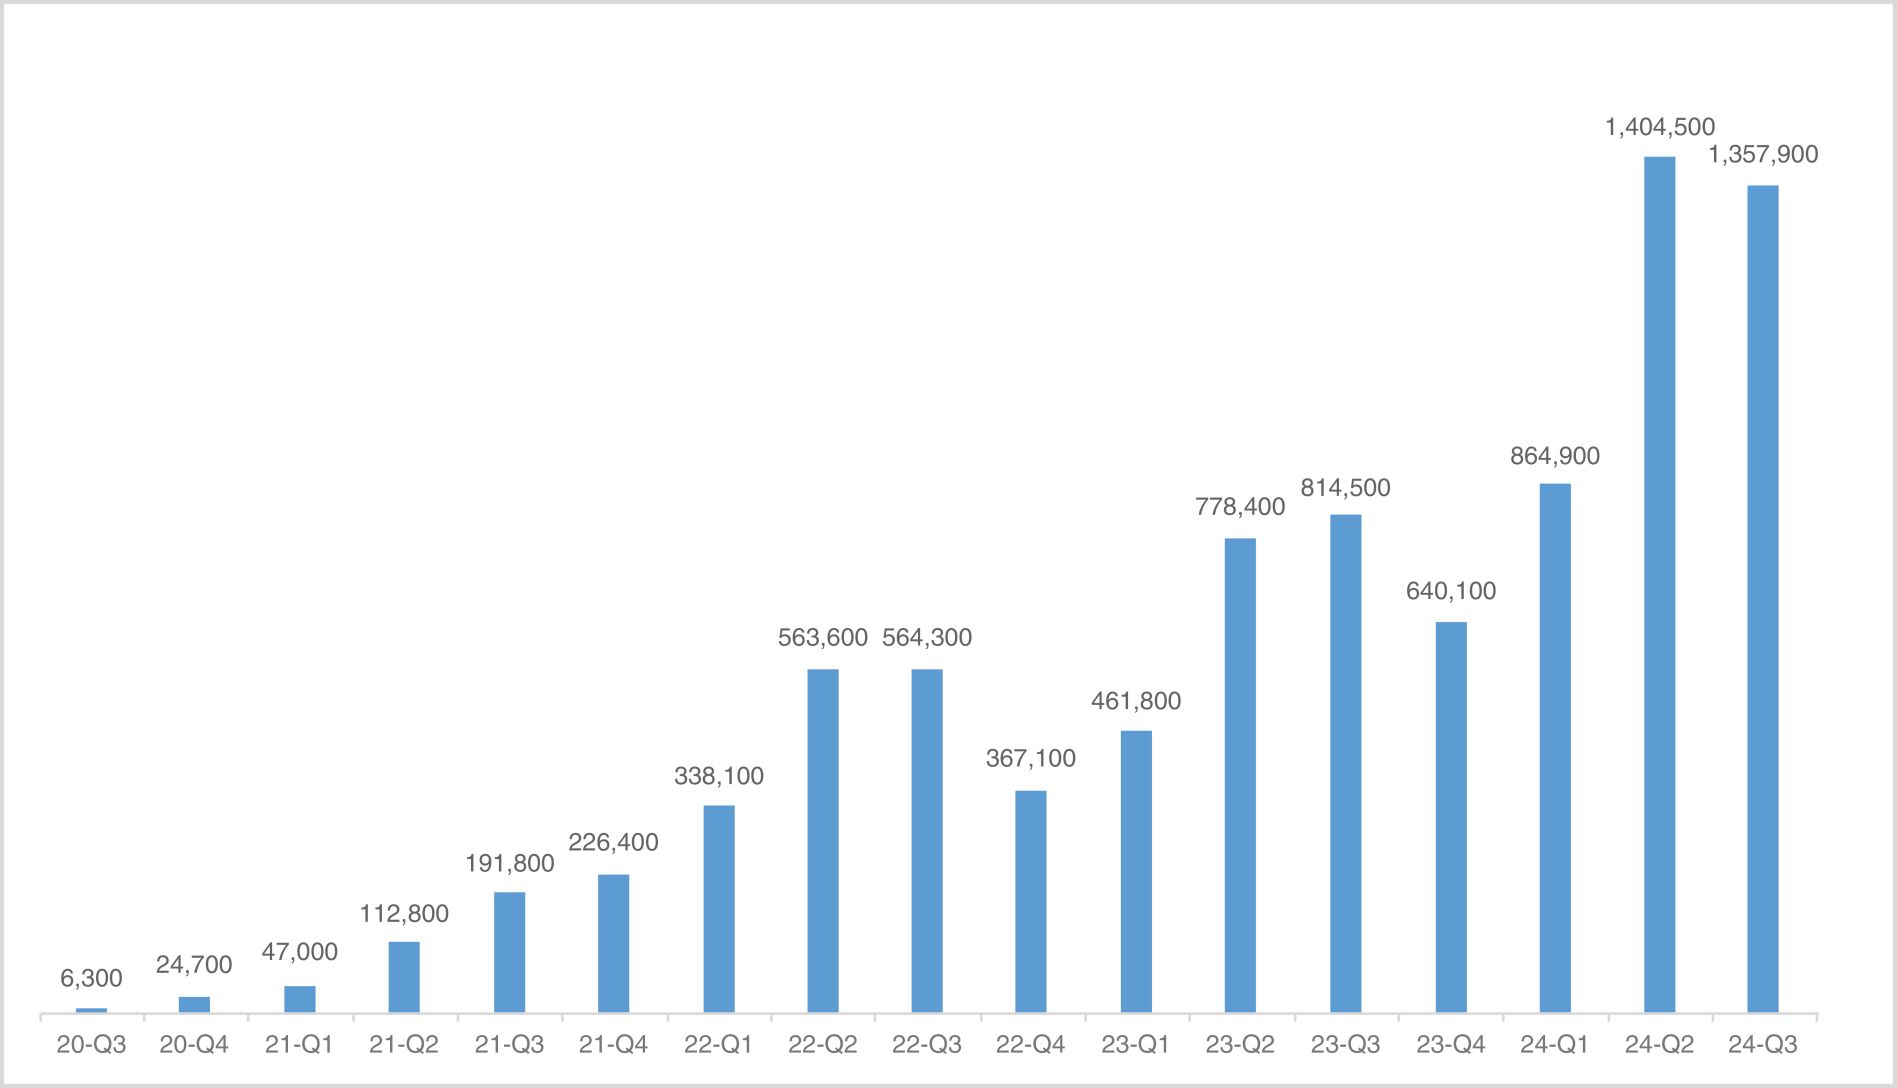
We intend to further expand our environmental initiatives, as demonstrated by our recently implemented Solar 2.0 initiative. Solar 2.0 is a broad initiative that we launched in 2019 to expand the number of properties in our portfolio that are powered by renewable solar energy. These projects are sized to approximately net meter each property such that they utilize little to no power from the electrical grid. In addition to reducing our reliance on the electrical grid and non-renewable sources of energy, the projects typically have a strong financial return, with the majority of projects producing an annual return of greater than 10% of our investment. Upon the completion of our Solar 2.0 initiative, we expect to achieve the following:
| | • | | 62 self-storage sites (or approximately 37% of our current portfolio) will be equipped with solar panels; |
| | • | | $10.3 million aggregate investment which is expected to reduce our property utility expense by approximately $1.1 million annually; and |
| | • | | Offset the equivalent of: |
| | • | | approximately 79,600 tree seedlings planted and grown over 10 years; |
| | • | | approximately 1,120 passenger vehicles driven for one year; or |
| | • | | electricity for approximately 1,000 homes for one year. |
In addition to our solar initiatives, our team has also has been implementing LED lighting throughout our portfolio and is expanding our xeriscape landscaping projects to additional drought or water-conscious markets.
133
Social Responsibility
Our culture is driven by our three corporate pillars, which help propel our employees’ commitment to making a difference in the communities where we operate and with fellow team members who we work with every day. We actively seek opportunities to give back to the communities in which we operate through a wide range of charitable programs, including:
| | • | | Maintaining a long-standing partnership with the Breast Cancer Research Foundation where we match employee and customer donations and donate $5 for every new until rental in the month of October. Over the last seven years, we have raised over $237,168 to fund life-saving research. |
| | • | | Sponsoring a regional Wounded Warrior Project Carry Forward 5k and hosting a Wounded Warrior and guest at the Long Beach Grand Prix. |
| | • | | Supporting a mentorship program for underserved youth through a donation to the Lantern Network. |
| | • | | Providing monetary donations to middle and high school sports programs and extracurricular activities. |
| | • | | Contributing to NBA player Paul George’s PG-13 Foundation to send Los Angeles area students to space camp. |
Moreover, we believe our commitment to social responsibility has led to the creation of a diverse company where the opinions, experiences and insights of people from a wide range of gender, racial and national backgrounds are valued and welcomed.
We believe that our commitment to social responsibility enables our employees to build long-term careers with us and affects positive change in the communities in which we operate.
Corporate Governance
We believe we have a well-established commitment to conducting business with the highest levels of integrity and controls. With over 10 years of experience as an SEC reporting company, solidified corporate governance policies and procedures are in our DNA.
Our existing corporate governance structure includes, among other constructs, having (i) a majority of independent board members since our inception, (ii) established and independent audit, compensation, and nominating and corporate governance board committees that comply with the requisite independence requirements under the NYSE and SEC rules and regulations, (iii) non-staggered board elections, (iv) established governance policies such as a code of ethics and business conduct, whistleblower policies, corporate governance guidelines, and insider trading policies, and (v) a lead independent director.
As we continue to grow and evolve, we are looking at ways in which we can further enhance our corporate governance position. Concurrently with the consummation of this listing, we expect to take additional steps such as having our board members elected by a majority vote in uncontested elections, providing our stockholders with a concurrent right to amend our bylaws, and removing our board’s ability to classify itself without stockholder approval.
For more information on our corporate governance profile, see “Management – Corporate Governance Profile.”
Legal Proceedings
From time to time, we are party to legal, regulatory and other proceedings that arise in the ordinary course of our business. In accordance with applicable accounting guidance, management accrues an estimated liability when those matters present loss contingencies that are both probable and reasonably estimable. In such cases,
134
there may be an exposure to loss in excess of any amounts accrued. We are not aware of any such proceedings of which the outcome is reasonably likely to have a material adverse effect on our results of operations or financial condition.
135
MANAGEMENT
General
We operate under the direction of our Board. Our Board is responsible for the management and control of our affairs. Our Board consists of H. Michael Schwartz, our Founder, Chief Executive Officer and Chairman of our Board, Paula Mathews, and three independent directors, Harold “Skip” Perry (lead independent director), Timothy S. Morris, and David J. Mueller. For more detailed information on our directors, see the “Executive Officers and Directors” section below. Our Board has formed the following three committees: the Audit Committee, the Nominating and Corporate Governance Committee, and the Compensation Committee.
Executive Officers and Directors
Included below is certain information regarding our current executive officers and directors. All of our executive officers serve at the pleasure of our Board.
| | | | | | |
Name | | Age | | | Position(s) |
H. Michael Schwartz | | | 57 | | | Chairman of the Board of Directors and Chief Executive Officer |
Wayne Johnson | | | 67 | | | President and Chief Investment Officer |
Joe Robinson | | | 50 | | | Chief Operations Officer |
James R. Barry | | | 35 | | | Chief Financial Officer and Treasurer |
Michael O. Terjung | | | 48 | | | Chief Accounting Officer |
Nicholas M. Look | | | 42 | | | General Counsel and Secretary |
Paula Mathews | | | 73 | | | Independent Director |
Timothy S. Morris | | | 64 | | | Independent Director |
David J. Mueller | | | 71 | | | Independent Director |
Harold “Skip” Perry | | | 78 | | | Lead Independent Director |
H. Michael Schwartz. Mr. Schwartz is the Chairman of our board of directors and our Chief Executive Officer. Mr. Schwartz has been an officer and director since our initial formation in January 2013; he served as our Chief Executive Officer from January 2013 to June 2019, our Executive Chairman from June 2019 to April 2021, and again as our Chief Executive Officer starting in April 2021. Mr. Schwartz is also the Chief Executive Officer of Strategic Asset Management I, LLC (f/k/a SmartStop Asset Management, LLC), our former sponsor (“SAM”), our former sponsor. He also serves as Chief Executive Officer, President and Chairman of the board of directors of each of the following self storage REITs sponsored by our subsidiary: Strategic Storage Growth Trust III, Inc., or SSGT III, and Strategic Storage Trust VI, Inc., or SST VI. He also serves as the Chief Executive Officer and President of the sponsor, advisor and property manager entities for SSGT III and SST VI. In addition, Mr. Schwartz serves as Chairman of the Board of Strategic Student & Senior Housing Trust, Inc., or SSSHT, a public non-traded student and senior housing REIT sponsored by SAM. Previously, Mr. Schwartz served as Chief Executive Officer and Chairman of the board of directors of each of Strategic Storage Growth Trust, Inc., or SSGT, and Strategic Storage Trust IV, Inc., or SST IV, each a public non-traded self storage REIT, as well as Chief Executive Officer, President, and Chairman of the board of directors of Strategic Storage Growth Trust II, Inc., or SSGT II, a private REIT. We acquired each of SSGT, SST IV, and SSGT II by way of a merger into subsidiaries of ours on January 24, 2019, March 17, 2021, and June 1, 2022, respectively. Mr. Schwartz also served as Chief Executive Officer, President, and Chairman of the board of directors of SmartStop Self Storage, Inc., or SST I, from August 2007 until the merger of SST I with Extra Space Storage, Inc., or Extra Space, on October 1, 2015. Since February 2008, Mr. Schwartz has also served as Chief Executive Officer and President of Strategic Storage Holdings, LLC, or SSH, the sponsor of SST I. Prior to this time, Mr. Schwartz held various roles in the real estate and financial services industry, which includes more than 30 years of real estate, securities and corporate financial management experience. Mr. Schwartz holds a B.S. in Business Administration with an emphasis in Finance from the University of Southern California.
136
We believe Mr. Schwartz’s active participation in the management of our operations and his experience in the self storage industry supports his appointment to our Board.
Wayne Johnson. Mr. Johnson is our President and Chief Investment Officer. He has served as one of our executive officers since our initial formation in January 2013. Since June 2015, he has served as our Chief Investment Officer, and since June 2019 he has also served as our President. In addition, Mr. Johnson serves as the Chief Investment Officer of SSGT III and SST VI, as well as President and Chief Investment Officer of the sponsor, advisor and property management entities for SSGT III and SST VI. Mr. Johnson also served in various roles at SSGT, SST IV, and SSGT II, including most recently as Chief Investment Officer until their respective mergers with us on January 24, 2019, March 17, 2021, and June 1, 2022, respectively. Mr. Johnson served as Senior Vice President-Acquisitions for SST I from August 2007 until January 2015 when he was elected Chief Investment Officer until the merger of SST I with Extra Space on October 1, 2015. Mr. Johnson’s prior experience involved all aspects of commercial development and leasing, including office, office warehouse, retail and self storage facilities. Mr. Johnson served on the board and is the past President of the Texas Self Storage Association (TSSA), which is the trade organization for self-storage developers, owners, and management groups. Mr. Johnson entered the commercial real estate business in 1979 after graduating from Southern Methodist University with a B.B.A. in Finance and Real Estate.
Joe Robinson. Mr. Robinson is our Chief Operations Officer, a position he has held since October 2019. Mr. Robinson also serves as Chief Operations Officer of the sponsor, advisors and property managers of our sponsored real estate programs. Prior to joining SmartStop, Mr. Robinson served as Chief Marketing Officer and Executive Vice President of Simply Self Storage Management LLC from April 2016 until September 2019. At Simply, Mr. Robinson led various functions including all marketing, pricing, information technology, and training. From 2010 to 2016, Mr. Robinson served in several pricing and marketing capacities at Extra Space. Most recently, he was Vice President, Marketing where he led revenue management, data analytics, and the call center. Prior to that, Mr. Robinson served as Director of Revenue Management, where he led the development of multiple industry first centralized pricing models for self storage. Mr. Robinson is a respected authority on Revenue Management in the self storage industry. He has delivered multiple speaking engagements on pricing and has had multiple articles distributed in several industry trade publications. Mr. Robinson holds a B.S. in Computer Science with a Business Minor from Brigham Young University, and a Masters of Business Administration from Rice University.
James R. Barry. Mr. Barry is our Chief Financial Officer and Treasurer, positions he has held since June 2019. Mr. Barry also serves as Chief Financial Officer and Treasurer of the sponsor, advisors and property managers of our sponsored real estate programs. Mr. Barry served as our Senior Vice President - Finance from August 2018 to June 2019. Prior to being our Senior Vice President - Finance, Mr. Barry served in various positions for SAM, including Senior Vice President – Finance from August 2018 to July 2019 and Director of Finance from October 2015 to August 2018. Mr. Barry was also a director on the board of directors of Strategic Storage Growth Trust II, Inc. from March 2021 until its merger with a subsidiary ours in June 2022. From 2012 to 2015, Mr. Barry held the title of Financial Analyst at SmartStop Self Storage Inc., and was highly involved in the negotiations, calculations, and communications for the merger with Extra Space on October 1, 2015. From 2009 to 2012, Mr. Barry served as a Corporate Accountant and Senior Financial Analyst at Thompson National Properties, LLC, a sponsor of commercial real estate offerings. From 2007 to 2009, Mr. Barry worked in various accounting functions at Grubb & Ellis Co. Mr. Barry holds a B.S. in Business Administration with an emphasis in Finance from California State University, Fullerton, and a Masters of Business Administration with an emphasis in Finance from Chapman University, where he graduated with honors.
Michael O. Terjung. Mr. Terjung is our Chief Accounting Officer, a position he has held since June 2019. Mr. Terjung also serves as Chief Accounting Officer of the sponsor, advisors and property managers of our sponsored real estate programs. From January 2017 until December 2019, Mr. Terjung served as the Chief Financial Officer and Treasurer for SSSHT. Mr. Terjung was also the Chief Financial Officer and Treasurer of SSGT until that company merged with and into a wholly-owned subsidiary of SST II in January 2019.
137
Mr. Terjung was Chief Financial Officer and Treasurer of SSGT II from July 2018 until June 2019. Mr. Terjung also served as the Chief Financial Officer and Treasurer of SAM from January 2017 until April 2022. Previously, from October 2015 to January 2017, Mr. Terjung served as a Controller for SAM. He also served as the Controller of SST I from September 2014 until its merger with Extra Space on October 1, 2015 and served as a Controller of SSH assigned to SST I from September 2009 to September 2014. From July 2004 to September 2009, Mr. Terjung held various positions with NYSE listed Fleetwood Enterprises, Inc., including Corporate Controller responsible for financial reporting and corporate accounting. Mr. Terjung gained public accounting and auditing experience while employed with PricewaterhouseCoopers LLP and Arthur Andersen LLP from September 2000 to July 2004, where he worked on the audits of a variety of both public and private entities, registration statements and public offerings. Mr. Terjung is a Certified Public Accountant, licensed in California, and graduated cum laude with a B.S.B.A. degree from California State University, Fullerton.
Nicholas M. Look. Mr. Look is our General Counsel and Secretary, positions he has held since June 2019. Mr. Look also serves as General Counsel and Secretary of the sponsor, advisors and property managers of our sponsored real estate programs. He also serves as the Secretary of each of SSGT III and SST VI since their formation. Mr. Look also served as the Secretary of SST IV and SSGT II, positions he held until their respective mergers with us in March 2021 and June 2022, respectively. Mr. Look was previously Senior Corporate Counsel of SAM, a position he held from June 2017 until June 2019. From September 2017 to June 2019, Mr. Look served as Assistant Secretary of SSSHT. Prior to that, Mr. Look worked with the law firms of K&L Gates LLP, from April 2014 to June 2017, and Latham & Watkins LLP, from October 2010 to April 2014, where he served as corporate counsel to a variety of public and private companies, and where his practice focused on securities matters, capital markets transactions, mergers and acquisitions and general corporate governance and compliance. Mr. Look holds a B.S. in Computer Science from the University of California, Irvine and a J.D. from the Pepperdine University School of Law. He is a member of the State Bar of California.
Paula Mathews. Ms. Mathews is one of our independent directors and has been a member of our board of directors since January 2016. Previously, Ms. Mathews served as our Secretary and an Executive Vice President from our formation until June 2018. She previously served as an Executive Vice President of SSSHT until April 2020 and as Secretary of SSSHT until June 2018. In addition, she served as an Executive Vice President and Secretary of SSGT and SST IV until June 2018. Ms. Mathews was an Executive Vice President of SAM from January 2013 through April 2020. Ms. Mathews served as an Executive Vice President and Assistant Secretary for SST I, positions she held from August 2007 and June 2011, respectively, until the merger of SST I with Extra Space on October 1, 2015. Ms. Mathews has also served as Executive Vice President for SSH from February 2008 through April 2020. Ms. Mathews was a private consultant from 2003 to 2005 providing due diligence services on the acquisition and disposition of assets for real estate firms. Prior to that, Ms. Mathews held senior level executive positions with several pension investment advisors, including the following: a real estate company specializing in 1031 transactions from 2002 to 2003 where she was the Director of Operations; KBS Realty Advisors from 1995 to 2001 where she was responsible for the management of $600 million in “value added” commercial assets in seven states; TCW Realty Advisors (now CBRE Investors) from 1985 to 1992 as a Senior Vice President where her focus was retail assets within closed end equity funds; and PMRealty Advisors from 1983 to 1985 in a portfolio management role. She began her real estate career in 1977 with The Irvine Company, the largest land holder in Orange County, California, where she held several positions within the Commercial/Industrial Division structuring industrial build-to-suits, ground leases and land sales. Ms. Mathews holds a B.S. degree from the University of North Carolina, Chapel Hill.
We believe Ms. Mathews’s extensive real estate management experience, and particularly self storage experience, across multiple organizations, including SmartStop and SAM, supports her appointment to our Board.
Timothy S. Morris. Mr. Morris is one of our independent directors and is a member and Chairman of the Compensation Committee and a member of the Audit Committee and the Nominating and Corporate Governance Committee. Mr. Morris previously served as an independent director of SmartStop Self Storage, Inc. from February 2008 until the merger of SmartStop Self Storage, Inc. with Extra Space on October 1, 2015. Mr. Morris has more than 35 years of financial and management experience with several international organizations. In
138
2008, Mr. Morris founded AMDG Worldwide Ltd., a consultancy business for the philanthropic sector. Through this entity, Mr. Morris continues to serve an eclectic range of philanthropic clients. From March 2019 until July 2021, Mr. Morris served as the finance director of the English-Speaking Union, a global charity which helps underprivileged children with speaking and listening skills. From 2014 to 2017, Mr. Morris assumed a part-time executive position as finance director of Tomorrow’s Company, a London-based global think tank focusing on business leadership. From June 2007 to April 2008, Mr. Morris was the Chief Financial Officer for Geneva Global, Inc., a philanthropic advisor and broker which invests funds into developing countries. Prior to joining Geneva Global, Inc., from 2002 to 2007, Mr. Morris was the director of corporate services for Care International UK Ltd., where he was responsible for the finance, internal audit, risk management, human resources, legal insurance and information technology functions during the financial turnaround of that organization. From 2000 to 2002, Mr. Morris was the Controller for Royal Society Mencap, a learning disability charity. From 1996 to 1999, Mr. Morris was the head of global management reporting for Adidas Group AG in Germany and was later the International Controller for Taylor Made Golf Company, Inc., in Carlsbad, California, a subsidiary of Adidas Group AG. Prior to 1996, Mr. Morris held various management and senior finance roles within organizations such as the International Leisure Group, Halliburton/KBR and the Bank for International Settlements in Basel, Switzerland. Mr. Morris has his Bachelor of Science in Economics from Bristol University in the United Kingdom, his MBA from the Cranfield School of Management in the United Kingdom, and he is a Chartered Management Accountant (CIMA, CGMA).
We believe that Mr. Morris’s extensive financial and management experience across multiple organizations over more than 30 years supports his appointment to our Board.
David J. Mueller. Mr. Mueller is one of our independent directors and is a member and Chairman of the Audit Committee and a member of the Compensation Committee and Nominating and Corporate Governance Committee. Mr. Mueller has more than 35 years of financial management experience with several firms in the financial services industry. In June 2009, Mr. Mueller founded his own CPA firm, specializing in consulting, audit, and tax services for small businesses and non-profits, where he continues to serve as Managing Partner. From June 2001 to May 2009, he worked for Manulife Financial Corporation, serving in several capacities including Controller of Annuities and Chief Financial Officer of Distribution for Manulife Wood Logan, where he was heavily involved in the company’s due diligence and subsequent integration with John Hancock Financial Services. Prior to his time with Manulife Financial Corporation, Mr. Mueller served as Chief Financial Officer of Allmerica Financial Services, the insurance and investment arm of Allmerica Financial Corporation. He began his career in the Boston office of Coopers and Lybrand, specializing in financial services, real estate, and non-profits. Mr. Mueller is a CPA and graduated from the University of Wisconsin-Green Bay with a degree in Finance.
We believe that Mr. Mueller’s more than 25 years of financial management experience supports his appointment to our Board.
Harold “Skip” Perry. Mr. Perry is one of our independent directors and, since April 2022, he has served as our lead independent director. Mr. Perry is a member and Chairman of the Nominating and Corporate Governance Committee and a member of the Audit Committee and Compensation Committee. Mr. Perry previously served as one of our independent directors from October 2013 until June 2014 and served as an independent director of SmartStop Self Storage, Inc. from February 2008 until the merger of SmartStop Self Storage, Inc. with Extra Space on October 1, 2015. Mr. Perry has over 50 years of financial accounting, management and consulting experience for domestic and international organizations in the real estate industry. He is currently the Executive Managing Director of Real Globe Advisors, LLC, a commercial real estate advisory firm which he founded. Mr. Perry also held the same position with Real Globe Advisors, LLC from July 2007 to June 2009. From June 2009 to March 2011, he was the Managing Director of Alvarez & Marsal Real Estate Advisory Services. From 1995 to June 2007, Mr. Perry was a national partner in Ernst & Young LLP’s Transactional Real Estate Advisory Services Group and held a number of leadership positions within Ernst & Young. While at Ernst & Young, he handled complex acquisition and disposition due diligence matters for
139
private equity funds and corporate clients, complex real estate portfolio optimization studies, and monetization strategies within the capital markets arena, including valuation of self storage facilities. Prior to 1995, Mr. Perry headed the Real Estate Consulting Practice of the Chicago office of Kenneth Leventhal & Co. Prior to his time with Kenneth Leventhal & Co., Mr. Perry was a senior principal with Pannell Kerr Forester, a national accounting and consulting firm specializing in the hospitality industry. He is a CPA and holds an MAI designation with the Appraisal Institute and a CRE designation with the Counselors of Real Estate. He graduated with a Bachelor of Arts in Russian and Economics from the University of Illinois, and has a Masters of Business Administration with a concentration in finance from Loyola University in Illinois.
We believe that Mr. Perry’s more than 40 years of financial accounting, management and consulting experience in the real estate industry supports his appointment to our Board.
Director Independence
As required by our Charter and NYSE rules, a majority of the members of our Board and each committee of our Board are “independent” as defined by the rules of NYSE. The NYSE independence standards provide that to qualify as an independent director, in addition to satisfying certain bright-line criteria, our Board must affirmatively determine that a director does not have a material relationship with us that would interfere with the exercise of independent judgment in carrying out the responsibilities of a director. Our Board has determined that Messrs. Morris, Mueller, and Perry and Ms. Mathews are each “independent,” as defined by NYSE.
Corporate Governance Profile
We have structured our corporate governance in a manner we believe closely aligns our interests with those of our stockholders. Notable features of our current corporate governance structure include the following:
| | • | | our Board is not classified and each of our directors will be subject to election annually; |
| | • | | we have fully independent audit, compensation and nominating and corporate governance committees; |
| | • | | we have a lead independent director; |
| | • | | at least one of our directors qualifies as an “audit committee financial expert” by applicable SEC regulations and all members of the Audit Committee are “financially literate” within the meaning of the NYSE listing standards; |
| | • | | we have opted out of the business combination and control share acquisition statutes in the MGCL; |
| | • | | we will not have a stockholder rights plan, and we will not adopt a stockholder rights plan in the future without (i) the approval of our stockholders or (ii) seeking ratification from our stockholders within 12 months of adoption of the plan if the Board determines, in the exercise of its duties under applicable law, that it is in our best interest to adopt a rights plan without the delay of seeking prior stockholder approval; and |
| | • | | while holders of OP units have certain approval rights for extraordinary matters at the Company, we do not have any separate insider blocking power. After giving effect to this offering, we would have directly or indirectly controlled % of the OP units as of . |
Notable features of current corporate governance that will take effect upon our listing include the following:
| | • | | our charter will provide that we may not elect to be subject to the provision of the MGCL that would permit us to classify our Board, unless we receive prior approval from stockholders; |
| | • | | we will have majority voting for directors in uncontested elections; and |
| | • | | our stockholders will have a concurrent right to amend our bylaws. |
140
Our directors stay informed about our business by attending meetings of our Board and the committees on which they serve and through supplemental reports and communications. Our independent directors are expected to meet regularly in executive sessions without the presence of our corporate officers or non-independent directors.
Leadership Structure
We do not currently have a policy to separate the roles of Chief Executive Officer and Chairman of the Board, or Chairman. Rather, our Board makes this determination based on relevant facts and circumstances in order to establish a structure that meets our needs at the given time, including, but not limited to, our current size, the size of our Board, the participation of our independent directors in the oversight of our operations and strategy, and our position and direction. However, our Board has a lead independent director to provide for an independent leadership role on the Board when the roles of Chief Executive Officer and Chairman are combined. The role of the lead independent director includes, among other things: (i) presiding over executive sessions of the independent directors; (ii) calling meetings of the independent directors as appropriate and setting the agenda; (iii) acting as liaison between the independent directors and the Chairman and Chief Executive Officer; (iv) leading the evaluation of our Chairman and Chief Executive Officer; and (v) responding to and communicating with stockholders on inquiries when appropriate, following consultation with the Chairman and Chief Executive Officer. Our lead independent director is Harold “Skip” Perry, who was appointed as such in April 2022.
Committees of the Board of Directors
Our bylaws provide that our Board may establish such committees as the Board believes appropriate. Our Board appoints the members of each committee in its discretion. Our charter and NYSE rules require that a majority of the members of each committee of our Board be composed of independent directors. We currently have three standing committees: an Audit Committee, a Compensation Committee and a Nominating and Corporate Governance Committee. The principal functions of each committee are briefly described below. Additionally, our Board may from time to time establish other committees to facilitate our Board’s oversight of management of our business and affairs. Each committee’s charter is available on our website at www.smartstopselfstorage.com under About Us—Investor Relations—Governance. Information contained on, or accessible through, our website is not incorporated by reference into and does not constitute a part of this prospectus.
Audit Committee
Our Audit Committee is composed of three of our independent directors, David J. Mueller, Timothy S. Morris and Harold “Skip” Perry, with Mr. Mueller currently serving as Chairman of the Audit Committee. Our Board has determined that Mr. Mueller satisfies the requirements for an “Audit Committee financial expert” and has designated Mr. Mueller as the audit committee financial expert in accordance with applicable SEC rules.
In connection with the consummation of this listing, our Board adopted an amended charter for the Audit Committee, or the Audit Committee Charter. The Audit Committee assists our Board by: (1) selecting an independent registered public accounting firm to audit our annual financial statements; (2) reviewing with the independent registered public accounting firm the plans and results of the audit engagement; (3) approving the audit and non-audit services provided by the independent registered public accounting firm; (4) reviewing the independence of the independent registered public accounting firm; and (5) considering the range of audit and non-audit fees and reviewing the adequacy of our internal accounting controls. The Audit Committee fulfills these responsibilities primarily by carrying out the activities enumerated in the Audit Committee Charter and in accordance with current laws, rules and regulations.
Compensation Committee
Our Compensation Committee is composed of three of our independent directors, Timothy S. Morris, David J. Mueller and Harold “Skip” Perry, with Mr. Morris currently serving as Chairman of the Compensation Committee.
141
In connection with the consummation of this listing, our Board adopted an amended charter for the Compensation Committee, or the Compensation Committee Charter. The Compensation Committee’s primary focus is to assist our Board in fulfilling its responsibilities with respect to officer and director compensation. The Compensation Committee assists our Board in this regard when necessary by: (1) reviewing and approving our corporate goals with respect to compensation of officers and directors; (2) recommending to our Board compensation for all non-employee directors, including Board and committee retainers, meeting fees and equity-based compensation; (2) administering and granting equity-based compensation to our employees; and (4) setting the terms and conditions of such equity-based compensation in accordance with the Incentive Plan. The Compensation Committee fulfills these responsibilities in accordance with current laws, rules and regulations.
Nominating and Corporate Governance Committee
Our Nominating and Corporate Governance Committee is composed of three of our independent directors, Harold “Skip” Perry, David J. Mueller and Timothy S. Morris, with Mr. Perry currently serving as Chairman of the Nominating and Corporate Governance Committee.
In connection with the consummation of this listing, our Board adopted an amended charter for the Nominating and Corporate Governance Committee, or the Nominating and Corporate Governance Committee Charter. The Nominating and Corporate Governance Committee’s primary focus is to assist our Board in fulfilling its responsibilities with respect to director nominations, corporate governance, Board and committee evaluations and conflict resolutions. The Nominating and Corporate Governance Committee assists our Board in this regard by: (1) identifying individuals qualified to serve on our Board, consistent with criteria approved by our Board, and recommending that our Board select a slate of director nominees for election by our stockholders at the annual meeting of our stockholders; (2) developing and implementing the process necessary to identify prospective members of our Board; (3) determining the advisability of retaining any search firm or consultant to assist in the identification and evaluation of candidates for membership on our Board; (4) overseeing an annual evaluation of our Board, each of the committees of our Board and management; (5) developing and recommending to our Board a set of corporate governance principles and policies; (6) periodically reviewing our corporate governance principles and policies and suggesting improvements thereto to our Board; and (7) reviewing and approving all transactions between us and any other party that may give rise to a conflict of interest in accordance with Maryland law, except where our charter or Maryland law would require the approval of our Board. The Nominating and Corporate Governance Committee fulfills these responsibilities primarily by carrying out the activities enumerated in the Nominating and Corporate Governance Committee Charter and in accordance with current laws, rules, and regulations.
Corporate Governance Guidelines
Pursuant to the Nominating and Corporate Governance Committee Charter, the Nominating and Corporate Governance Committee developed and recommended a set of formal, written guidelines for corporate governance, which was amended by our Board in connection with the consummation of this listing. The Nominating and Corporate Governance Committee also, from time to time, reviews our governance structures and procedures and suggests improvements thereto to our full Board. Such improvements, if adopted by the full Board, will be incorporated into the written guidelines.
Code of Ethics
In connection with the consummation of this listing, our Board adopted an amended Code of Ethics and Business Conduct, or the Code of Ethics, which contains general guidelines applicable to our executive officers, including our principal executive officer, principal financial officer and principal accounting officer, our directors and our employees. We adopted our Code of Ethics with the purpose of promoting the following: (1) honest and ethical conduct, including the ethical handling of actual or apparent conflicts of interest between personal and professional relationships; (2) full, fair, accurate, timely and understandable disclosure in reports
142
and documents that we file with or submit to the SEC and in other public communications made by us; (3) compliance with applicable laws and governmental rules and regulations; (4) the prompt internal reporting of violations of the Code of Ethics to our Code of Ethics Compliance Officer; and (5) accountability for adherence to the Code of Ethics. A copy of the Code of Ethics is available on our website www.smartstopselfstorage.com under About Us—Investor Relations—Governance.
Board’s Role in Risk Oversight
As part of its oversight role, our Board actively supervises the members of our management that are directly responsible for our day-to-day risk management. The Board’s risk management role has no impact on its leadership structure. The Audit Committee, which consists of three of our independent directors, annually reviews with management our policies with respect to risk assessment and risk management.
Compensation Committee Interlocks and Insider Participation
No member of the Compensation Committee served as an officer or employee of us or any of our affiliates during 2023, and none had any relationship requiring disclosure by us under Item 404 of Regulation S-K under the Exchange Act. None of our executive officers has served on the board of directors or compensation committee of any other entity that has or has had one or more executive officers who served as a member of our Board or our Compensation Committee during the fiscal year ended December 31, 2023.
Director Compensation
Our director compensation program is intended to provide a total compensation package that enables us to attract and retain qualified and experienced directors and to align our directors’ interests with those of our stockholders. Non-employee director compensation is set by the Compensation Committee.
During 2023, each of our non-employee directors was entitled to a cash retainer of $62,500 per year and an award of restricted stock with a market value of $80,000, which vests one year from the date of the director’s re-election, for membership on our Board. Our lead independent director receives additional annual cash compensation of $10,000 for such role. In addition, the chairperson of the Audit Committee receives an annual retainer of $20,000, the chairperson of the Nominating and Corporate Governance Committee receives an annual retainer of $15,000, and the chairperson of the Compensation Committee receives an annual retainer of $15,000. The other members of the Audit Committee receive an annual retainer of $10,000 for membership on the Audit Committee and the other members of the Nominating and Corporate Governance Committee and the Compensation Committee receive an annual retainer of $7,500 for membership on the Nominating and Corporate Governance Committee and the Compensation Committee, respectively. In the event that the Board or any committee thereof meets more than 10 times per year, a per meeting fee of $1,500 will be paid for each meeting thereafter. Membership on our committees is comprised solely of independent directors.
Director Compensation for the Year Ended December 31, 2023
| | | | | | | | | | | | | | | | | | | | | | | | | | | | |
Name | | Fees
Earned or
Paid
in Cash | | | Stock
Awards(1) | | | Option
Awards | | | Non-Equity
Incentive Plan
Compensation | | | Change in
Pension Value
and
Nonqualified
Deferred
Compensation | | | All Other
Compensation(2) | | | Total | |
H. Michael Schwartz | | $ | — | | | $ | — | | | $ | — | | | $ | — | | | $ | — | | | $ | 245 | | | $ | 245 | |
Paula M. Mathews | | $ | 62,500 | (3) | | $ | 80,000 | | | $ | — | | | $ | — | | | $ | — | | | $ | 393 | | | $ | 142,893 | |
Timothy S. Morris | | $ | 95,000 | (3) | | $ | 80,000 | | | $ | — | | | $ | — | | | $ | — | | | $ | 982 | | | $ | 175,982 | |
David J. Mueller | | $ | 97,500 | (3) | | $ | 80,000 | | | $ | — | | | $ | — | | | $ | — | | | $ | 393 | | | $ | 177,893 | |
Harold “Skip” Perry | | $ | 105,000 | (3) | | $ | 80,000 | | | $ | — | | | $ | — | | | $ | — | | | $ | 245 | | | $ | 185,245 | |
| (1) | | This column represents the full grant date fair value in accordance with FASB ASC Topic 718. |
143
| (2) | | Represents payment of life insurance premiums covering each of the members of our Board for the benefit of such director’s beneficiaries. |
| (3) | | Amount includes total fees earned or paid during the year ended December 31, 2023. |
Each of our non-employee directors may also receive certain equity awards pursuant to the Incentive Plan, as described in further detail in the “—SmartStop Self Storage REIT, Inc. 2022 Long-Term Incentive Plan” section below. We have also purchased life insurance policies covering each of the members of our Board for the benefit of such director’s beneficiaries.
2022 Long-Term Incentive Plan
In March 2022, following the recommendation of the Compensation Committee, our Board approved the SmartStop Self Storage REIT, Inc. 2022 Long-Term Incentive Plan, or the Incentive Plan, which was approved by our stockholders at our 2022 annual meeting of stockholders. The Incentive Plan became effective when it was approved by our stockholders, and it replaced our prior incentive plan, known as the Employee and Director Long-Term Incentive Plan (the “Prior Plan”). From and after the effective date of the Incentive Plan, no further awards have been or will be made under the Prior Plan. The types of awards permitted under the Incentive Plan include stock options, stock appreciation rights, restricted stock unit awards, restricted stock awards, restricted stock unit awards, unrestricted stock awards, dividend equivalent rights, LTIP units, other equity-based awards and cash-based awards.
The administrator of the Incentive Plan, which shall initially be the Compensation Committee, has full power and authority, among other things, to: select the individuals to whom awards may from time to time be granted; determine the time or times of grant, and the type of award, or any combination of types of awards, granted to any one or more grantees; determine the number of shares of stock or LTIP units to be covered by any award; determine the specific terms and conditions of each award, subject to the provisions of the Incentive Plan, accelerate the exercisability or vesting of any award, interpret the Incentive Plan and awards granted thereunder, and otherwise administer the Incentive Plan and the awards granted thereunder. Please see the “—SmartStop Self Storage REIT, Inc. 2022 Long-Term Incentive Plan” section below for more information on the Incentive Plan.
144
COMPENSATION DISCUSSION AND ANALYSIS
This Compensation Discussion and Analysis describes our compensation program as it relates to our named executive officers, or NEOs. Our NEOs for 2023 and their titles were:
| | |
NAME | | TITLE |
H. Michael Schwartz | | Chief Executive Officer |
James R. Barry | | Chief Financial Officer |
Joe Robinson | | Chief Operations Officer |
Wayne Johnson | | President and Chief Investment Officer |
Michael O. Terjung | | Chief Accounting Officer |
Philosophy and Objectives of Our Executive Compensation Program
The philosophy underlying our executive compensation program is to provide an attractive, flexible and market-based total compensation program tied to performance and aligned with the interests of our stockholders. Our objective is to recruit and retain the caliber of executive officers and other key employees necessary to deliver sustained high performance for our stockholders. Our compensation system has been designed to accomplish the following:
| | • | | Retain and hire top-caliber executives: Executives will have market competitive compensation that will allow us to both hire and retain high-caliber individuals. |
| | • | | Reward growth and profitability: Executives will be rewarded for achieving both short- and long-term results, particularly focused on sustained growth and profitability that culminates in longer-term value creation for our stockholders. |
| | • | | Align compensation with stockholder interests: Fostering an ownership mentality, a meaningful portion of the interests of our executives will be linked with those of our stockholders through the risks and rewards of ownership of our stock. |
The following is an overview of the highlights of our compensation structure, and the fundamental compensation policies and practices we do and do not use.
WHAT WE DO
| | |

| | Pay for Performance. We provide alignment between pay and performance by linking a meaningful portion of total compensation to the achievement of multiple operational and strategic goals through our short-term incentive program, as well as relative performance against our direct self storage peers through our long-term incentive program. |
| |
| | Balanced Compensation. We balance overall compensation by linking portions of pay to both annual performance goals as well as multi- year performance goals. |
| |
| | Forward-Looking Long-Term Incentive Compensation Structure. We have implemented a long-term incentive compensation structure that includes forward-looking performance over a multi-year performance period. |
| |
| | Executive Severance Policy. In light of market best practices, we adopted an Executive Severance and Change of Control Plan (as opposed to employment agreements) covering our executives which is overseen by our Compensation Committee. |
145
| | |
| | Independent Compensation Consultant. Our Compensation Committee retained Ferguson Partners Consulting (“FPC”), a nationally recognized compensation consulting firm, to review and provide recommendations regarding our executive compensation program. |
| |
| | Compensation Risk Assessments. With the assistance of FPC, we conduct annual compensation risk assessments to ensure our compensation program does not encourage excessively risky behaviors. |
WHAT WE DON’T DO
| | |

| | No Guaranteed Annual Salary Increases. We do not guarantee annual salary increases (salary increases are made only in the discretion of the Compensation Committee). |
| |
| | No Minimum Bonuses or Uncapped Bonus Payouts. We do not pay guaranteed minimum bonuses, nor do we have uncapped bonus payouts. |
| |
| | No Excessive Perquisites. We provide limited perquisites to our NEOs that we believe are reasonable and consistent with the philosophy and objectives of our executive compensation program. |
| |
| | No Guaranteed Employment. We do not guarantee terms of employment or base salaries for our NEOs. |
Compensation Methodology and Process
Independent Review and Approval of Executive Compensation
Our Compensation Committee is responsible for reviewing and approving corporate goals and objectives related to compensation for our NEOs. The Compensation Committee does not delegate any substantive responsibility related to the compensation of our NEOs and exercises its independent judgment when approving executive compensation. No member of the Compensation Committee is a former or current officer of us or any of our subsidiaries, and all members are independent under current NYSE listing standards.
Our Compensation Committee annually reviews compensation to ensure its alignment with our business strategy, performance, and the interests of our employees and stockholders. In addition, the Compensation Committee reviews market practices for all elements of executive compensation and approves necessary adjustments to remain competitive.
Our Compensation Committee takes into account the aggregate amount and mix of all components of compensation when considering compensation decisions affecting the Chief Executive Officer and the other NEOs. The Compensation Committee considers whether any components of executive compensation might lead to excessive risk taking by management and whether features of the executive compensation program appropriately mitigate risks.
The Role of the Compensation Committee’s Consultant
Our Compensation Committee has sole authority under its committee charter to retain advisors and consultants as it deems appropriate. The Compensation Committee has retained FPC, which specializes in the REIT industry, as its compensation consultant.
FPC attends meetings of the Compensation Committee, reviews compensation data with the committee, and participates in general discussions regarding executive compensation issues. Management works with FPC, at the Compensation Committee’s direction, to develop materials and analysis essential to the committee’s compensation evaluations and determination. FPC regularly participates in executive sessions with the Compensation Committee (without any of our personnel or executives present) to discuss compensation matters.
146
Role of the Chief Executive Officer
Each year our Chief Executive Officer meets with the Compensation Committee to discuss specific recommendations regarding the base salary, short-term incentive compensation and long-term incentive compensation of each of our NEOs (other than the Chief Executive Officer) and provides further insight into and details of each executive officer’s performance. The other NEOs are not present during these discussions. The Compensation Committee believes it is valuable to consider the recommendations of the Chief Executive Officer with respect to these matters because, given his knowledge of our operations and the day-to-day responsibilities of such NEOs, he is in a unique position to provide the Compensation Committee with added perspective into the most appropriate measures and goals in light of our business at a given point in time. However, the Compensation Committee has the discretion to accept, reject, or modify these recommendations and makes all final determinations on issues within the scope of its authority, including with respect to executive officer compensation. The Chief Executive Officer does not provide his recommendations to the Compensation Committee regarding his own compensation.
Use of Peer Group
To ensure that our executive compensation programs are reasonable and competitive in the marketplace, we compare our compensation programs to the compensation programs of two distinct sets of peers. We examine pay practices across a peer set of public REITs that are (i) similarly sized to us and operate across a range of property types (Size-Based Peer Group) as well as (ii) a smaller peer set of direct competitors focused in the self storage industry of which there are only four (Direct Competitor Peer Group).
| | | | |
PEER GROUP | | DESCRIPTION | | PURPOSE |
Size-Based Peer Group (13 companies) | | Represents public real estate investment trusts of similar size in terms of total capitalization that also have active operations. | | To periodically reference and compare our overall compensation practices and amounts against a broader mix of companies to ensure that our compensation practices are reasonable in light of the size of the organization. |
| | |
Direct Competitor Peer Group (4 companies) | | Represents public real estate investment trusts within the self storage sector with operations that most nearly approximate our business. | | To understand how each NEO’s total compensation compares with the total compensation for reasonably similar positions at our most direct competitors in the self storage industry and to assess and calculate performance for certain relative metrics. |
147
The Size-Based Peer Group currently consists of the following companies (sorted by capitalization):
| | | | | | | | |
Peer* | | Ticker | | | 2023 Total
Capitalization ($M) | |
National Storage Affiliates Trust | | | NSA | | | $ | 10,315 | |
Independence Realty Trust, Inc. | | | IRT | | | $ | 6,081 | |
Essential Properties Realty Trust, Inc. | | | EPRT | | | $ | 5,901 | |
American Healthcare REIT, Inc. | | | AHR | | | $ | 4,486 | |
Acadia Realty Trust | | | AKR | | | $ | 4,055 | |
Brandywine Realty Trust | | | BDN | | | $ | 3,091 | |
Armada Hoffler Properties, Inc. | | | AHH | | | $ | 2,795 | |
Easterly Government Properties, Inc. Corp. | | | DEA | | | $ | 2,745 | |
InvenTrust Properties Corp. | | | IVT | | | $ | 2,536 | |
LTC Properties, Inc. | | | LTC | | | $ | 2,308 | |
UMH Properties, Inc. | | | UMH | | | $ | 2,027 | |
Centerspace | | | CSR | | | $ | 1,951 | |
SmartStop Self Storage REIT, Inc. | | | n/a | | | $ | 3,048 | |
| * | | Source: S&P Global. Note that we utilized Sila Realty Trust, Inc. in our size-based peer group, though as Sila is a non-traded REIT, they have been excluded from the table above. Additionally, as American Healthcare REIT, Inc. had its initial public offering on February 7, 2024, AHR’s total capitalization figure above reflects Q3 2023 estimated total capitalization per S&P Global. |
The Direct Competitor Peer Group currently consists of the following companies (sorted by capitalization):
| | | | | | | | |
Peer* | | Ticker | | | 2023 Total
Capitalization ($M) | |
Public Storage | | | PSA | | | $ | 67,279 | |
Extra Space Storage Inc. | | | EXR | | | $ | 46,927 | |
CubeSmart | | | CUBE | | | $ | 13,546 | |
National Storage Affiliates Trust | | | NSA | | | $ | 10,315 | |
SmartStop Self Storage REIT, Inc. | | | n/a | | | $ | 3,048 | |
| * | | Note that Life Storage, Inc. was part of the competitor-based peer group that was used for setting compensation in 2023; however, Life Storage was acquired and we have not included them in the table above. |
Our Compensation Committee evaluates the median levels of the size-based peer group for compensation as an initial point of reference for setting pay and thereafter considers various qualitative factors for each NEO, such as years of experience, tenure, and historical performance, in arriving at a competitive pay package. Actual compensation paid may fluctuate above or below the median of the peer group based on our performance and the achievement of the goals established by the Compensation Committee for the NEO. The Compensation Committee reviews the peer group annually and make changes as warranted and deemed appropriate by the Compensation Committee.
148
Alignment of Pay
Our executive compensation program provides significant alignment between pay and performance by linking a meaningful portion of total target compensation to the achievement of financial, operational and strategic goals through our short-term incentive program, as well as rigorous relative portfolio goals through our long-term incentive program. Approximately 88% of the total target compensation delivered to our Chief Executive Officer and 61% delivered to our other NEOs is at risk. The following charts present the allocation of 2023 total target compensation among different components for our Chief Executive Officer and the weighted average of each component for our other NEOs as a group.
| | |
CEO Total Target Compensation | | Other NEOs Total Target Compensation |
| |
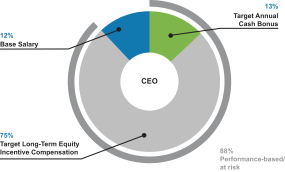
| | 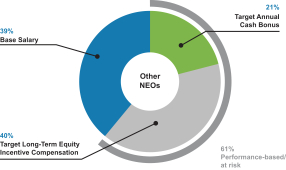 |
149
Overview of Compensation
On June 28, 2019, we acquired the self storage advisory, asset management, property management and certain joint venture interests of SAM, which included the self storage management team and self storage employees (the “Self Administration Transaction”). During the first full fiscal year following the Self Administration Transaction, we formally adopted our executive compensation program for our executive officers, which was later immaterially revised in connection with fiscal years 2021, 2022 and 2023 (the “Executive Compensation Program”). The following table summarizes the specific elements in our Executive Compensation Program, along with the primary objectives of each element. A more detailed discussion of these elements follows this table.
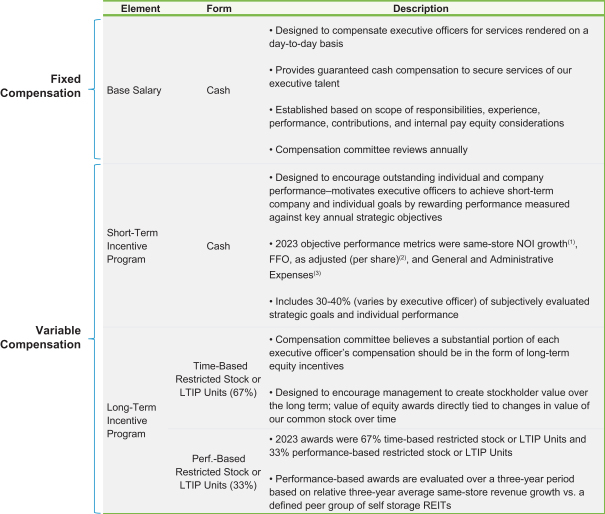
| (1) | | NOI is defined as rental and related revenues, less property level operating expenses. |
| (2) | | Funds from operations, or FFO, is widely used as a key measure of financial performance by REITs. The National Association of Real Estate Investment Trusts, or Nareit, defines FFO as net income (loss) computed in accordance with GAAP, excluding gains or losses from sales of property and real estate related asset impairment write-downs, plus depreciation and amortization, and after adjustments for unconsolidated partnerships and joint ventures. In determining FFO, as adjusted, we make further adjustments to the Nareit computation of FFO to exclude the effects of non-real estate related intangible amortization, acquisition related costs, other write-offs incurred in connection with acquisitions, contingent earnout expenses, accretion of fair value of debt adjustments, amortization of debt issuance costs, gains or losses from |
150
| | extinguishment of debt, accretion of deferred tax liabilities, realized and unrealized gains/losses on foreign exchange transactions, gains/losses on foreign exchange and interest rate derivatives not designated for hedge accounting, and to reflect adjustments for unconsolidated partnerships and jointly owned investments. For a reconciliation of FFO and FFO, as adjusted, to net loss, see “Management’s Discussion and Analysis of Financial Condition and Results of Operations-Non-GAAP Financial Measures” in our Annual Report on Form 10-K for the year ended December 31, 2023. Management FFO, as adjusted, is defined as FFO, as adjusted, plus adjustments for amortization of debt issuance costs. |
| (3) | | General and Administrative Expenses (“G&A Expense”) primarily include all expenses not directly related to our properties, including compensation related costs, legal expenses, transfer agent fees, directors and officers insurance expense and board of directors related costs. |
Base Salary
Base salary is a portion of the overall compensation package and determined by considering the relative importance of the position, the competitive marketplace and the individual’s performance and contributions based on responsibilities, skills and experience. Base salaries are reviewed annually in light of market practices and changes in responsibilities. Base salaries were established for our executives at the time of the Self Administration Transaction in June 2019 and were maintained in 2020. Base salaries for 2021, 2022 and 2023 were updated based on the results of a peer analysis and the approval of the Compensation Committee, which were further updated subsequent to fiscal year end by the Compensation Committee. This Compensation Discussion and Analysis section focuses on the compensation in place during fiscal year 2023.
| | | | | | | | | | | | | | |
NEO | | TITLE | | 2021
BASE
SALARY
($) | | | 2022
BASE
SALARY
($) | | | 2023
BASE
SALARY
($) | |
H. Michael Schwartz | | Chief Executive Officer | | | 625,000 | | | | 625,000 | | | | 625,000 | |
James R. Barry | | Chief Financial Officer | | | 275,000 | | | | 300,000 | | | | 350,000 | |
Joe Robinson | | Chief Operations Officer | | | 350,000 | | | | 375,000 | | | | 375,000 | |
Wayne Johnson | | President and Chief Investment Officer | | | 250,000 | | | | 290,000 | | | | 315,000 | |
Michael O. Terjung | | Chief Accounting Officer | | | 250,000 | | | | 275,000 | | | | 290,000 | |
Annual Cash Incentive Awards
The goal of our variable cash incentive program (the “Short-Term Incentive Program”) is to motivate executive officers to achieve strong performance across various financial, operating and strategic goals with the ultimate objective of contributing to longer-term stockholder value based on our annual performance. The Short-Term Incentive Program includes an objective portion that comprises the majority of the overall program and is based on three performance-based metrics with pre-defined hurdles. For purposes of the 2023 Short-Term Incentive Program, same-store NOI, a measure of Funds From Operations as adjusted, per share, and G&A Expense were included as quantitative metrics.
While it is important for the majority of the NEO’s annual cash compensation to be determined objectively, we also believe that it is important to have a degree of flexibility and assess performance against goals that may not be precise or quantifiable in nature. Therefore, a relatively smaller portion of the Short-Term Incentive Program is subjectively assessed based on various strategic and individual goals. We provide a range of performance outcomes across each metric. In fiscal year 2023, the performance-based metrics had the potential to be paid at 50%, 100% and 150% of target for the threshold, target and maximum criteria for each metric, which was the same as fiscal years 2022 and 2021. For strategic and individual goals, the threshold, target, and maximum levels were set at 75%, 100%, and 125% of target, respectively, for each of fiscal years 2023, 2022 and 2021. To the extent that the level of actual achievement for strategic and individual goals as well as performance goals falls between the established Threshold, Target and Maximum levels, calculation of the amount of the award is interpolated on a straight-line basis.
151
| | |
2023 | | 2023 |
Short-Term Incentive Program
CEO and Executive Chairman | | Short-Term Incentive Program
Other NEOs |
| |
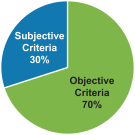
| | 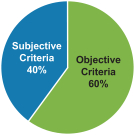
|
The actual bonuses awarded reflect the following components for the Chief Executive Officer and other NEOs:
| | | | | | | | | | | | | | | | |
| | | METRICS & WEIGHTINGS | |
NAME | | SAME-STORE
NOI GROWTH, | | | FFO, AS
ADJUSTED
PER SHARE | | | G&A
EXPENSE | | | STRATEGIC/
INDIVIDUAL
GOALS | |
H. Michael Schwartz | | | 30 | % | | | 30 | % | | | 10 | % | | | 30 | % |
James R. Barry | | | 25 | % | | | 25 | % | | | 10 | % | | | 40 | % |
Joe Robinson | | | 30 | % | | | 20 | % | | | 10 | % | | | 40 | % |
Wayne Johnson | | | 25 | % | | | 25 | % | | | 10 | % | | | 40 | % |
Michael O. Terjung | | | 25 | % | | | 25 | % | | | 10 | % | | | 40 | % |
Based on the weightings of each criteria, and each NEO’s respective allocations, the threshold, target, and maximum potential bonuses for 2023 were as follows:
| | | | | | | | | | | | |
NAME | | THRESHOLD
($) | | | TARGET
($) | | | MAXIMUM
($) | |
H. Michael Schwartz | | | 388,125 | | | | 675,000 | | | | 961,875 | |
James R. Barry | | | 126,000 | | | | 210,000 | | | | 294,000 | |
Joe Robinson | | | 120,000 | | | | 200,000 | | | | 280,000 | |
Wayne Johnson | | | 114,000 | | | | 190,000 | | | | 266,000 | |
Michael O. Terjung | | | 81,000 | | | | 135,000 | | | | 189,000 | |
Financial Goals
As shown and noted above, the financial goals component of the 2023 Short-Term Incentive Program included three categories of performance goals. The financial goals established for 2023, the Compensation Committee’s rationale for establishing them, and the performance level approved for each goal are described below:
| | | | | | | | | | | | | | | | |
Financial Goals | | Threshold | | | Target | | | Maximum | | | Actual | |
Same-Store NOI Growth | | | 3.75 | % | | | 4.75 | % | | | 5.75 | % | | | 3.1 | % |
FFO, as adjusted (per share) | | $ | 0.56 | | | $ | 0.58 | | | $ | 0.60 | | | $ | 0.52 | |
G&A Expense (millions) | | $ | 30.45 | | | $ | 29.00 | | | $ | 27.55 | | | $ | 27.45 | |
Same-store NOI growth on an absolute basis was set at:
| | | | |
Threshold | | | 3.75 | % |
Target | | | 4.75 | % |
Maximum | | | 5.75 | % |
Actual | | | 3.1 | % |
152
Rationale: The Compensation Committee considers same-store NOI to be an important driver of real estate property values and stockholder value. It also is a metric typically evaluated by investors and analysts and is used by many of our peers to evaluate operating performance. This goal was established by our Board based on our budget for 2023 and was discussed with management.
FFO, as adjusted (per share) was set at:
| | | | |
Threshold | | $ | 0.56 | |
Target | | $ | 0.58 | |
Maximum | | $ | 0.60 | |
Actual | | $ | 0.52 | |
Rationale: The Compensation Committee considers FFO, as adjusted, to be an important indicator of our overall financial performance. FFO, as adjusted, is a metric typically evaluated by investors and analysts and is used by many of our peers to evaluate performance. See “Management’s Discussion and Analysis of Financial Condition and Results of Operations-Non-GAAP Financial Measures.” This goal was established by our Board at the beginning of 2023 based on management’s forecast for 2023 and was discussed with management.
G&A Expense (millions) was set at:
| | | | |
Threshold | | $ | 30.45 | |
Target | | $ | 29.00 | |
Maximum | | $ | 27.55 | |
Actual | | $ | 27.45 | |
Rationale: The Compensation Committee considers General and Administrative Expenses, or G&A Expense, to be an important indicator of our overall financial performance. G&A Expense measures management’s ability to manage our business in a cost-efficient manner, with cost-efficiency being correlated with increased stockholder value. G&A Expense is a metric typically evaluated by investors and analysts and is used by many of our peers to evaluate performance. This goal was established by our Board at the beginning of 2023 based on management’s forecast for 2023 and was discussed with management.
Strategic Goals
Strategic goals are collective operational goals which were recommended by the Chief Executive Officer for approval by the Compensation Committee and the full board of directors. These goals are developed in connection with the annual strategic planning process and represent key plans and initiatives that the Chief Executive Officer believes will drive short-term performance while adding long-term value. The goals and achievement levels are qualitative by nature and are subjectively evaluated by the Compensation Committee at the end of the performance period.
For 2023, the strategic goals for the Company were to maintain internal growth through institutional management of the portfolio, execute on strategic transactions, implement technology across the storage platform, continued expansion in the Canadian market, and Managed REIT growth. SmartStop was able to grow its operational scale, primarily through Managed REIT growth and the management of more than 10 assets in the GTA during 2023, which is a key market and area for growth for SmartStop’s strategy.
Individual Goals
The Chief Executive Officer recommended individual goals for 2023, which were then submitted for approval by the Compensation Committee and the full board of directors. Individual goals for the NEOs were set at the beginning of 2023 and included the following:
| | • | | H. Michael Schwartz: Explore and evaluate liquidity strategies for stockholders; oversee development and implementation of technology across the Company; Canadian platform expansion; executive team development; and Managed REIT Platform equity raise and asset growth. |
153
| | • | | James R. Barry, Joe Robinson, Wayne Johnson and Michael O. Terjung: Execute on the Company’s business plan; maintain operational performance across the portfolio; individual team development and succession planning; oversee implementation of technology; and facilitate external growth strategies of the Company. |
The following table sets forth the Target annual bonus levels established in February 2023, along with the final determination for fiscal year 2023 actual bonus payments.
| | | | | | | | | | | | |
NAME | | TARGET
($) | | | ACTUAL
CASH
BONUS ($) | | | % OF
TARGET | |
H. Michael Schwartz | | | 675,000 | | | | 303,750 | | | | 45 | % |
James R. Barry | | | 210,000 | | | | 115,500 | | | | 55 | % |
Joe Robinson | | | 200,000 | | | | 110,000 | | | | 55 | % |
Wayne Johnson | | | 190,000 | | | | 104,500 | | | | 55 | % |
Michael O. Terjung | | | 135,000 | | | | 87,750 | | | | 65 | % |
Long-Term Stock Based Compensation
We adopted our long-term incentive program (the “Long-Term Incentive Program”) with the goal of both retaining and motivating our executive officers over a longer-term period. We provide equity incentive awards in order to foster ownership and alignment with stockholders, which is intended to motivate our executive officers to enhance the long-term value of the Company. At the election of each individual executive, such equity awards may come in the form of either long-term incentive plan units (“LTIP Units”) of SmartStop OP, L.P., our operating partnership (our “Operating Partnership”) or restricted stock awards consisting of shares of our common stock (“RSAs”). Although the Compensation Committee does not target a specific mix of equity versus cash compensation when setting awards each year, it does strive to deliver a relatively large portion of the executive officer’s overall compensation in the form of equity.
Key Highlights of the Long-Term Incentive Program are as follows:
| | • | | Forward-looking program containing a multi-year performance period and to be awarded on a rolling basis. |
| | • | | Awards are determined based upon a fixed dollar amount that is then converted to equity based upon a fair value determination of such equity. |
| | • | | Introduces a performance-based element with an award that ranges from 0% to a maximum of 200% of target, with such percentage being determined based upon our relative same-store revenue growth versus our direct self storage competitors over a three-year period. |
| | • | | Includes a time-based component, otherwise known as service-vested and subject to continued employment with the Company, which vests pro-rata over four years. |
| | • | | For fiscal year 2022 and prior years, awards under the Long-Term Incentive Program were granted with 75% of such award being time-based and 25% being performance-based. Subsequent to fiscal year end 2022, our Compensation Committee approved changes to the Long-Term Incentive Program such that awards were granted with two-thirds of such award being time-based and one-third being performance-based. |
154
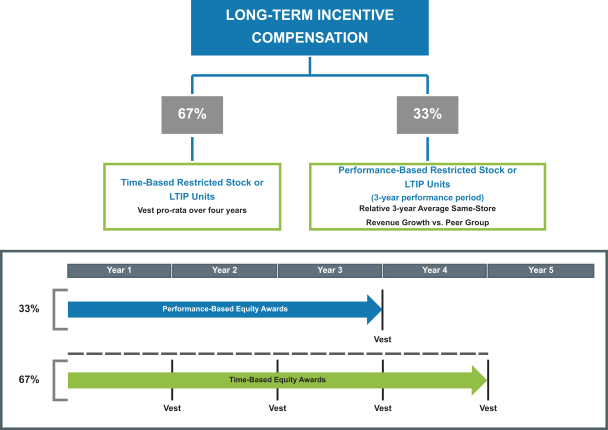
The approved grant levels for the NEOs for the 2023-2025 performance period are as follows:
| | | | | | | | | | | | | | | | | | | | | | | | |
| | | TIME-
BASED
AWARDS
(67%) ($) | | | 2023-2025 PERFORMANCE-BASED
AWARDS (33%) | | | TOTAL
LTIP
AWARD
AT
TARGET
($) | |
NAME | | Last Place
($) | | | 5th Place
(Threshold)
($) | | | 3rd Place
(Target)
($) | | | 1st Place
(Maximum)
($) | |
H. Michael Schwartz | | | 2,546,000 | | | | 0 | | | | 313,500 | | | | 1,254,000 | | | | 2,508,000 | | | | 3,800,000 | |
James R. Barry | | | 294,800 | | | | 0 | | | | 36,300 | | | | 145,200 | | | | 290,400 | | | | 440,000 | |
Joe Robinson | | | 284,750 | | | | 0 | | | | 35,063 | | | | 140,250 | | | | 280,500 | | | | 425,000 | |
Wayne Johnson | | | 207,700 | | | | 0 | | | | 25,575 | | | | 102,300 | | | | 204,600 | | | | 310,000 | |
Michael O. Terjung | | | 134,000 | | | | 0 | | | | 16,500 | | | | 66,000 | | | | 132,000 | | | | 200,000 | |
These approved grant levels were updated subsequent to fiscal year end by the Compensation Committee for fiscal year 2024. However, this Compensation Discussion and Analysis section focuses on the compensation in place during fiscal year 2023. NEOs can elect to receive their Long-Term Incentive Program awards as restricted stock or LTIP Units. During 2023, all NEOs elected to receive all of their awards in LTIP Units.
The metric approved for the 2023-2025 performance period was a relative 3-year average same-store revenue growth when ranked against a peer group, as follows:
| | | | | | | | | | | | | | | | | | | | | | | | |
METRIC | | 0%
PAYOUT | | | 25% PAYOUT
(THRESHOLD) | | | 65%
PAYOUT | | | 100%
PAYOUT
(TARGET) | | | 150%
PAYOUT | | | 200%
PAYOUT
(MAXIMUM) | |
Relative 3-Year Average Same-Store Revenue Growth vs. Peer Group | | | Last Place | | | | 5th Place | | | | 4th Place | | | | 3rd Place | | | | 2nd Place | | | | 1st Place | |
155
Per the terms of the 2023 performance-based awards, the peers by which we are to be compared against for the 2023-2025 period are: CubeSmart, Extra Space Storage Inc., Life Storage, Inc., National Storage Affiliates Trust, and Public Storage. In order to be counted in the ranking calculation above, a company must be publicly traded for the entire performance period. In the event that one or more of the peer group companies ceases to exist as a separate company or fails to report same store revenues during the performance period, our Compensation Committee may adjust the ranking tiers and/or measure the average annual same store revenue growth for such companies for a period shorter than the performance period in its sole discretion.
During the performance period from January 1, 2021 through December 31, 2023, the Company’s relative 3-year average same-store revenue growth ranked 1st place in the corresponding peer group for that period. The following table summarizes the actual number of performance-based LTIP Units that vested on March 1, 2024 as a result of performance during the performance period from January 1, 2021 through December 31, 2023.
| | | | |
NAME | | LTIP Units | |
H. Michael Schwartz | | | 99,462.40 | |
James R. Barry | | | 8,064.50 | |
Joe Robinson | | | 8,602.20 | |
Wayne Johnson | | | 13,440.90 | |
Michael O. Terjung | | | 8,064.50 | |
Other Elements of Compensation
Our Compensation Committee does not view benefits and perquisites for the NEOs as a key component of our executive compensation program. Accordingly, we do not provide any significant perquisites to our NEOs. We provide the following benefits to all employees: medical, dental, vision and disability insurance, employer contributions toward medical insurance premiums, 401(k) employer match and group life insurance premiums. The NEOs participate in benefit plans on similar terms as our other participating employees, although we pay a larger percentage of NEOs’ medical insurance premiums. However, the total value of these benefit plan premiums remains a small percentage of each NEO’s total compensation package. Under our tax-qualified 401(k) plan, we make a matching contribution on behalf of each participant equal to 100% match on the first 4% of compensation contributed to the plan by the participant up to the federally mandated maximum. The NEOs may participate in the plan on substantially the same terms as our other participating employees. We do not maintain any defined benefit or supplemental retirement plans.
Our Compensation Committee periodically reviews the levels of perquisites and other personal benefits provided to the NEOs and may revise, amend or add to the benefits and perquisites made available to the NEOs in the future if it deems advisable.
Severance Benefits
In order to achieve our compensation objective of attracting, retaining and motivating qualified executives, we believe that we need to provide the NEOs with severance protection. Furthermore, we seek to utilize best practices in developing appropriate protection. As such, in connection with the Self Administration Transaction in June 2019, we adopted an Executive Severance and Change of Control Plan (the “Severance Plan”), rather than using individual employment agreements. Pursuant to the plan, each NEO is entitled to certain severance benefits based on the nature of their termination. See “-Executive Compensation-Severance Plan and Potential Payments Upon Termination or a Change of Control” below for complete details of severance benefits payable to the NEOs upon termination or change of control.
Evaluation of the Risk in Compensation Program
Our Compensation Committee oversees the design of our executive compensation program to ensure that the program does not incentivize our NEOs, either individually or as a group, to make excessively risky business
156
decisions that could maximize short-term results at the expense of long-term value. The Compensation Committee assesses our executive and other compensation and benefits programs to determine if the programs’ provisions and operations promote or create material risks. The Compensation Committee, in consultation with its independent compensation consultant, has established a number of protective features including but not limited to: (1) we do not have uncapped bonus potential, (2) we use multiple metrics in evaluating performance, (3) performance includes both absolute and relative performance, (4) the Compensation Committee retains flexibility and subjectivity in evaluating performance, (5) a meaningful portion of compensation is delivered in equity that vests over time, and (6) the performance portion of our Long-Term Incentive Program is measured on a multi-year basis.
Based on the foregoing, we do not believe that our compensation policies and practices create risks that are reasonably likely to have a material adverse effect on us.
Tax Limits on Executive Compensation
In general, Section 162(m) of the Code places a limit on the amount of compensation that may be deducted annually by a publicly traded entity with respect to certain of its executive officers. The IRS has previously issued private letter rulings holding that Section 162(m) does not apply to compensation paid to employees of a REIT’s operating partnership. We have therefore determined that compensation paid to our executive officers by our Operating Partnership or a subsidiary of our Operating Partnership for services to it should not be subject to the deduction limit. Since we operate as a REIT under the Code and are generally not subject to U.S. federal income tax on our taxable income to the extent that we annually distribute all of our taxable income to stockholders and maintain our qualification as a REIT, if compensation were required to (but did not) qualify for deduction under Section 162(m), the payment of compensation that fails to satisfy the requirements of Section 162(m) would not have a material adverse consequence to us, provided we continue to distribute 100% of our taxable income without taking into account the disallowed deduction. However, if we make compensation payments subject to Section 162(m) limitations on deductibility, we may be required to make additional distributions to stockholders to comply with its REIT annual distribution requirement and eliminate our U.S. federal income tax liability. As a consequence of additional taxable income, a larger portion of stockholder distributions that would otherwise have been treated as return of capital may be subject to U.S. federal income tax as dividend income. Any such compensation allocated to our TRSs, whose income is subject to U.S. federal income tax, would result in an increase in income taxes due to the inability to deduct such compensation.
157
Executive Compensation
The following tables and narrative summarize the compensation for the years ended December 31, 2021, 2022 and 2023 paid to or earned by our named executive officers.
Summary Compensation Table
| | | | | | | | | | | | | | | | | | | | | | | | | | | | |
Name and Principal Position | | Year | | | Salary | | | Bonus(1) | | | Non-Equity
Incentive Plan
Compensation | | | Stock
Awards(2) | | | All Other
Compensation(3) | | | Total | |
H. Michael Schwartz, | | | 2023 | | | $ | 625,000 | | | | — | | | $ | 303,750 | | | $ | 3,800,000 | | | $ | 13,997 | | | $ | 4,742,747 | |
Chief Executive Officer | | | 2022 | | | $ | 625,000 | | | | — | | | $ | 961,875 | | | $ | 1,900,000 | | | $ | 12,997 | | | $ | 3,499,872 | |
| | | 2021 | | | $ | 625,000 | | | | — | | | $ | 961,875 | | | $ | 1,850,000 | | | $ | 17,395 | | | $ | 3,454,270 | |
| | | | | | | |
James R. Barry, | | | 2023 | | | $ | 350,000 | | | | — | | | $ | 115,500 | | | $ | 440,000 | | | $ | 26,011 | | | $ | 931,511 | |
Chief Financial Officer | | | 2022 | | | $ | 300,000 | | | | — | | | $ | 210,000 | | | $ | 200,000 | | | $ | 32,317 | | | $ | 742,317 | |
| | | 2021 | | | $ | 275,000 | | | $ | 25,000 | | | $ | 175,000 | | | $ | 150,000 | | | $ | 25,684 | | | $ | 650,684 | |
| | | | | | | |
Joe Robinson, | | | 2023 | | | $ | 375,000 | | | | — | | | $ | 110,000 | | | $ | 425,000 | | | $ | 31,482 | | | $ | 941,482 | |
Chief Operations Officer | | | 2022 | | | $ | 375,000 | | | | — | | | $ | 245,000 | | | $ | 200,000 | | | $ | 42,426 | | | $ | 862,426 | |
| | | 2021 | | | $ | 350,000 | | | $ | 25,000 | | | $ | 210,000 | | | $ | 160,000 | | | $ | 33,038 | | | $ | 778,038 | |
| | | | | | | |
Wayne Johnson, | | | 2023 | | | $ | 315,000 | | | | — | | | $ | 104,500 | | | $ | 310,000 | | | $ | 27,919 | | | $ | 757,419 | |
President and Chief Investment Officer | | | 2022 | | | $ | 290,000 | | | | — | | | $ | 210,000 | | | $ | 275,000 | | | $ | 34,021 | | | $ | 809,021 | |
| | | 2021 | | | $ | 250,000 | | | | — | | | $ | 196,000 | | | $ | 250,000 | | | $ | 32,961 | | | $ | 728,961 | |
| | | | | | | |
Michael Terjung | | | 2023 | | | $ | 290,000 | | | | — | | | $ | 87,750 | | | $ | 200,000 | | | $ | 31,417 | | | $ | 609,167 | |
Chief Accounting Officer | | | 2022 | | | $ | 275,000 | | | | — | | | $ | 161,000 | | | $ | 175,000 | | | $ | 42,385 | | | $ | 653,385 | |
| | | 2021 | | | $ | 250,000 | | | $ | 25,000 | | | $ | 140,000 | | | $ | 150,000 | | | $ | 31,758 | | | $ | 596,758 | |
| (1) | | Amounts shown in the “Bonus” column for 2021 reflect special non-plan bonuses that were awarded to certain individuals in recognition of their significant contributions to certain strategic projects undertaken by the Company in 2021. Annual bonuses are payable pursuant to our incentive plan and are included in the “Non-Equity Incentive Plan Compensation” column above. |
| (2) | | Represents the aggregate grant date fair value of each share of restricted stock and each LTIP Unit computed in accordance with FASB ASC Topic 718. The grant date fair values of performance-based awards included in this table were calculated based on the outcome of performance measured at target levels since that was the probable outcome at the time of grant. Assuming achievement of the maximum performance level, the grant date fair value for awards granted in 2023 would have been $5,054,000, $585,200, $565,250, $412,300, and $266,000 for Messrs. Schwartz, Barry, Robinson, Johnson, and Terjung, respectively. For purposes of this table, the market value per restricted share and LTIP Unit was assumed to be $15.21 (the estimated net asset value per share of our Class A common stock calculated as of September 30, 2022). |
| (3) | | The table below sets forth the components of the “All Other Compensation” column for 2023: |
| | | | | | | | | | | | | | | | |
Name | | Incremental
Cost
of Medical
Insurance
Premiums | | | 401(k)
Company
Match | | | Life/AD&D/
Short Term Disability
Insurance Premiums | | | Total | |
H. Michael Schwartz | | $ | — | | | $ | 13,200 | | | $ | 797 | | | $ | 13,997 | |
James R. Barry | | $ | 12,014 | | | $ | 13,200 | | | $ | 797 | | | $ | 26,011 | |
Joe Robinson | | $ | 17,420 | | | $ | 13,200 | | | $ | 862 | | | $ | 31,482 | |
Wayne Johnson | | $ | 12,014 | | | $ | 13,200 | | | $ | 2,705 | | | $ | 27,919 | |
Michael Terjung | | $ | 17,420 | | | $ | 13,200 | | | $ | 797 | | | $ | 31,417 | |
158
Grants of Plan-Based Awards
The following table sets forth information with respect to plan-based awards granted to the NEOs in 2023.
| | | | | | | | | | | | | | | | | | | | | | | | | | | | | | | | | | | | |
| | | | | | Estimated future payouts under
non-
equity incentive plan awards(1) | | | Estimated future payouts under
equity incentive plan awards(2) | | | | | | | |
Name | | Grant
Date | | | Threshold
($) | | | Target
($) | | | Maximum
($) | | | Threshold
(#) | | | Target
(#) | | | Maximum
(#) | | | All Other
Share
Awards:
Number
of Shares/
Units(3) | | | Grant
Date Fair
Value(4) | |
H. Michael Schwartz | | | | | | | | | | | | | | | | | | | | | | | | | | | | | | | | | | | | |
Annual Cash Incentive Bonus | | | | | | $ | 388,125 | | | $ | 675,000 | | | $ | 961,875 | | | | | | | | | | | | | | | | | | | | | |
Time-Based Equity | | | 2/24/2023 | | | | | | | | | | | | | | | | | | | | | | | | | | | | 191,429 | | | $ | 2,546,000 | |
Performance-Based Equity | | | 2/24/2023 | | | | | | | | | | | | | | | | 23,572 | | | | 94,286 | | | | 188,572 | | | | | | | $ | 1,254,000 | |
James R. Barry | | | | | | | | | | | | | | | | | | | | | | | | | | | | | | | | | | | | |
Annual Cash Incentive Bonus | | | | | | $ | 126,000 | | | $ | 210,000 | | | $ | 294,000 | | | | | | | | | | | | | | | | | | | | | |
Time-Based Equity | | | 2/24/2023 | | | | | | | | | | | | | | | | | | | | | | | | | | | | 22,166 | | | $ | 294,800 | |
Performance-Based Equity | | | 2/24/2023 | | | | | | | | | | | | | | | | 2,729 | | | | 10,918 | | | | 21,835 | | | | | | | $ | 145,200 | |
Joe Robinson | | | | | | | | | | | | | | | | | | | | | | | | | | | | | | | | | | | | |
Annual Cash Incentive Bonus | | | | | | $ | 120,000 | | | $ | 200,000 | | | $ | 280,000 | | | | | | | | | | | | | | | | | | | | | |
Time-Based Equity | | | 2/24/2023 | | | | | | | | | | | | | | | | | | | | | | | | | | | | 21,410 | | | $ | 284,750 | |
Performance-Based Equity | | | 2/24/2023 | | | | | | | | | | | | | | | | 2,636 | | | | 10,546 | | | | 21,091 | | | | | | | $ | 140,250 | |
Wayne Johnson | | | | | | | | | | | | | | | | | | | | | | | | | | | | | | | | | | | | |
Annual Cash Incentive Bonus | | | | | | $ | 114,000 | | | $ | 190,000 | | | $ | 266,000 | | | | | | | | | | | | | | | | | | | | | |
Time-Based Equity | | | 2/24/2023 | | | | | | | | | | | | | | | | | | | | | | | | | | | | 15,617 | | | $ | 207,700 | |
Performance-Based Equity | | | 2/24/2023 | | | | | | | | | | | | | | | | 1,923 | | | | 7,692 | | | | 15,384 | | | | | | | $ | 102,300 | |
Michael Terjung | | | | | | | | | | | | | | | | | | | | | | | | | | | | | | | | | | | | |
Annual Cash Incentive Bonus | | | | | | $ | 81,000 | | | $ | 135,000 | | | $ | 189,000 | | | | | | | | | | | | | | | | | | | | | |
Time-Based Equity | | | 2/24/2023 | | | | | | | | | | | | | | | | | | | | | | | | | | | | 10,076 | | | $ | 134,000 | |
Performance-Based Equity | | | 2/24/2023 | | | | | | | | | | | | | | | | 1,241 | | | | 4,963 | | | | 9,925 | | | | | | | $ | 66,000 | |
| (1) | | Represents annual incentive awards at the threshold, target and maximum amounts. See the “Non-Equity Incentive Plan Compensation” column of the Summary Compensation Table above for additional discussion regarding bonuses based on 2023 performance. |
| (2) | | Represents performance-based awards, consisting of either restricted stock or LTIP Units, awarded in 2023 to our NEOs. Indicated threshold, target and maximum amounts correspond to the number of restricted shares or LTIP Units, as applicable, that would be earned in the event that specified threshold, target and maximum performance levels, respectively, were achieved. In the event that our performance does not meet the threshold requirements for a performance measure, no payment will be made on the quantitative portion of the award based on that performance measure. Performance-based awards vest following the conclusion of a three-year performance period, based on our performance ranked amongst a peer group of companies, conducted using a performance measure of average annual same-store revenue growth, analyzed over the performance period. |
| (3) | | Represents time-based awards, consisting of LTIP Units, awarded in 2023 to our NEOs. Time-based awards vest ratably over four years with the first tranche vesting on December 31st of the year of grant, subject to the recipient’s continued employment or service through the applicable vesting date. |
| (4) | | Calculated in accordance with FASB ASC Topic 718. The grant date fair values of performance-based awards were calculated based on the probable outcome of performance measured at target levels at the time of the grant. |
Narrative Explanation of Certain Aspects of Summary Compensation Table and Grants of Plan-Based Awards Table
Our executive compensation program consists of the following elements: (1) base salaries, (2) a Short-Term Incentive Program, pursuant to which executive officers are entitled to a performance-based cash bonus, and (3) a Long-Term Incentive Program, pursuant to which executive officers are entitled to equity awards, which will be both time-based and performance-based.
Amounts shown in the “Stock Awards” column of the Summary Compensation Table and awards disclosed in the Grants of Plan-Based Awards table may consist of RSAs or LTIP Units, depending on the executive’s election.
Recipients of time-based RSAs granted prior to 2020 are entitled to distributions paid on the underlying shares of restricted stock but only as and when the restricted shares to which the dividends or other distributions are attributable become vested. Dividends or distributions made prior to such date will be held by us and
159
transferred to the recipient on the date that the restricted shares become vested. Recipients of time-based RSAs granted in or subsequent to 2020 are entitled to distributions paid on the underlying shares of restricted stock effective as of the effective date of the award. Recipients of performance-based RSAs will accrue distributions during the performance period, and such distributions will only be payable on the date that any such shares of restricted stock vest, based upon the performance level attained.
Recipients of time-based LTIP Units are entitled to distributions and allocations of profits and losses effective as of the effective date of the award. Recipients of performance-based LTIP Units will be entitled to receive distributions and allocations of profits and losses with respect to the performance-based LTIP Units as of the effective date of January 1 of the year of grant, in an amount equal to 10% of the distributions and allocations available on the maximum amount of LTIP Units that may be issued under an award, until the Distribution Participation Date (as defined in the operating partnership agreement). The remaining 90% of distributions will accrue and will be payable on the Distribution Participation Date based upon the performance level attained and number of performance-based LTIP Units that vest. Following the Distribution Participation Date, recipients will be entitled to receive the full amount of distributions and allocations of profits and losses with respect to the vested performance-based LTIP Units. LTIP Units are designed to qualify as “profits interests” in our operating partnership for federal income tax purposes, and as a result, initially they will not be treated as economically equivalent in value to a common unit, and the issuance of LTIP Units will not be a taxable event to our operating partnership or the recipient. If and when certain events occur pursuant to applicable tax regulations and in accordance with the operating partnership agreement, LTIP Units may become equivalent to common units of our operating partnership on a one-for-one basis.
Outstanding Equity Awards at Fiscal Year-End
The following table sets forth information regarding outstanding RSAs and LTIP Units held by each of our NEOs as of December 31, 2023. The applicable vesting provisions are described in the footnote following the table. For a description of the acceleration of vesting provisions applicable to the RSAs and LTIP Units held by our NEOs, please see the subsection titled “Severance Plan and Potential Payments Upon Termination or a Change of Control” below.
| | | | | | | | | | | | | | | | | | | | |
| | | Stock Awards | |
Name | | Grant
Date | | | Number of
Shares or
Units of
Stock that
Have Not
Vested | | | Market Value
of Shares or
Units of Stock
that Have Not
Vested(4) | | | Number of
Unearned
Shares,
Units or
Other
Rights
that
Have Not
Vested | | | Market or
Payout
Value of
Unearned
Shares,
Units or
Other
Rights that
Have Not
Vested(4) | |
H. Michael Schwartz | | | 4/16/2021 | | | | 37,298 | (1) | | $ | 568,800 | | | | 99,462 | (5) | | $ | 1,516,801 | |
| | | 2/2/2022 | | | | 54,059 | (2) | | $ | 824,403 | | | | 36,039 | (6) | | $ | 549,602 | |
| | | 2/24/2023 | | | | 143,572 | (3) | | $ | 2,189,469 | | | | 94,286 | (7) | | $ | 1,437,862 | |
James R. Barry | | | 4/16/2021 | | | | 3,024 | (1) | | $ | 46,119 | | | | 8,065 | (5) | | $ | 122,984 | |
| | | 2/2/2022 | | | | 5,690 | (2) | | $ | 86,779 | | | | 3,794 | (6) | | $ | 57,853 | |
| | | 2/24/2023 | | | | 16,625 | (3) | | $ | 253,524 | | | | 10,918 | (7) | | $ | 166,492 | |
Joe Robinson | | | 4/16/2021 | | | | 3,226 | (1) | | $ | 49,194 | | | | 8,602 | (5) | | $ | 131,183 | |
| | | 2/2/2022 | | | | 5,690 | (2) | | $ | 86,779 | | | | 3,794 | (6) | | $ | 57,853 | |
| | | 2/24/2023 | | | | 16,058 | (3) | | $ | 244,877 | | | | 10,546 | (7) | | $ | 160,819 | |
Wayne Johnson | | | 4/16/2021 | | | | 5,040 | (1) | | $ | 76,865 | | | | 13,441 | (5) | | $ | 204,973 | |
| | | 2/2/2022 | | | | 7,824 | (2) | | $ | 119,321 | | | | 5,216 | (6) | | $ | 79,548 | |
| | | 2/24/2023 | | | | 11,713 | (3) | | $ | 178,619 | | | | 7,692 | (7) | | $ | 117,303 | |
Michael Terjung | | | 4/16/2021 | | | | 3,024 | (1) | | $ | 46,119 | | | | 8,065 | (5) | | $ | 122,984 | |
| | | 2/2/2022 | | | | 4,979 | (2) | | $ | 75,932 | | | | 3,319 | (6) | | $ | 50,621 | |
| | | 2/24/2023 | | | | 7,557 | (3) | | $ | 115,244 | | | | 4,963 | (7) | | $ | 75,678 | |
| (1) | | Represents LTIP Units which vest ratably over a period of four years, with the first vesting occurring on December 31, 2021. |
160
| (2) | | Represents LTIP Units which vest ratably over a period of four years, with the first vesting occurring on December 31, 2022. |
| (3) | | Represents LTIP Units which vest ratably over a period of four years, with the first vesting occurring on December 31, 2023. |
| (4) | | There is no public market for our shares. Amount is calculated as the net asset value of a share of our common stock at the end of the last completed fiscal year (calculated as of September 30, 2023) multiplied by the number of shares of stock or LTIP Units, as applicable. |
| (5) | | Represents unearned performance-based LTIP Units as of December 31, 2023, based on actual performance as of December 31, 2023, i.e., maximum, as such Awards subsequently vested at the maximum level on March 1, 2024. |
| (6) | | Represents unearned performance-based LTIP Units as of December 31, 2023, based on expected estimated current performance as of December 31, 2023, i.e., target. Awards shown will vest no later than March 31, 2025. |
| (7) | | Represents unearned performance-based LTIP Units as of December 31, 2023, based on expected estimated current performance as of December 31, 2023, i.e., target. Awards shown will vest no later than March 31, 2026. |
Option Exercises and Stock Vested
The following table summarizes vesting of stock applicable to our NEOs during the year ended December 31, 2023 (none of the NEOs held any options during 2023):
| | | | | | | | |
| | | Stock Based Awards | |
Name | | Number
of Shares
or LTIP Units
Acquired
on
Vesting | | | Value
Realized on
Vesting(1) | |
H. Michael Schwartz | | | 236,041 | | | $ | 3,599,627 | |
James R. Barry | | | 20,931 | | | $ | 319,202 | |
Joe Robinson | | | 21,125 | | | $ | 322,162 | |
Wayne Johnson | | | 37,628 | | | $ | 573,826 | |
Michael Terjung | | | 17,941 | | | $ | 273,604 | |
| (1) | | Amount is calculated based on the net asset value of a share (calculated as of September 30, 2023) of our common stock multiplied by the number of shares of stock/LTIP Units that vested. |
161
Severance Plan and Potential Payments Upon Termination or a Change of Control
On June 28, 2019, the Compensation Committee adopted and approved our Executive Severance and Change of Control Plan and designated certain of our executives, including our NEOs, as participants (each, a “Participant” and together, the “Participants”) in our Executive Severance and Change of Control Plan. Assuming a termination of employment occurred on December 31, 2023 and a price per share of our common stock on the date of termination of $15.25 (the estimated net asset value per share of our Class A common stock as of the end of the last completed fiscal year, calculated as of September 30, 2023), the amount of compensation that would have been payable to each NEO in each situation is listed in the table below. The amounts shown in the table below are for illustrative purposes only. Actual amounts that would be paid on any termination of employment can only be determined at the time of any actual separation from us.
| | | | | | | | | | | | | | | | | | | | | | | | |
| | | Estimated Potential Payments Upon Termination | |
Name and Termination Scenario | | Severance
Payment(1) | | | Healthcare
Continuation
Coverage(2) | | | Equity Awards
Subject to Vesting(3) | | | Other
Compensation(4) | | | Excise Tax
Gross Up(9) | | | Total(10) | |
| | | | | | |
H. Michael Schwartz | | | | | | | | | | | | | | | | | | | | | | | | |
• Without Cause or for Good Reason | | $ | 2,989,896 | | | $ | — | | | $ | 4,262,168 | (5) | | $ | 72,115 | | | $ | — | | | $ | 7,324,179 | |
• Change of control | | $ | 4,484,844 | | | $ | — | | | $ | 6,134,015 | (6) | | $ | 72,115 | | | $ | 4,878,701 | | | $ | 15,569,675 | |
• Death or disability(7) | | $ | 675,000 | | | $ | — | | | $ | 6,134,015 | | | $ | 272,115 | (8) | | $ | — | | | $ | 7,081,130 | |
• Cause or Resignation | | $ | — | | | $ | — | | | $ | — | | | $ | 72,115 | | | $ | — | | | $ | 72,115 | |
| | | | | | |
James Barry | | | | | | | | | | | | | | | | | | | | | | | | |
• Without Cause or for Good Reason | | $ | 526,158 | | | $ | 25,500 | | | $ | 407,128 | (5) | | $ | 38,113 | | | $ | — | | | $ | 996,899 | |
• Change of control | | $ | 1,052,317 | | | $ | 50,999 | | | $ | 619,534 | (6) | | $ | 38,113 | | | $ | 794,860 | | | $ | 2,555,823 | |
• Death or disability(7) | | $ | 210,000 | | | $ | — | | | $ | 619,534 | | | $ | 38,113 | | | $ | — | | | $ | 867,647 | |
• Cause or Resignation | | $ | — | | | $ | — | | | $ | — | | | $ | 38,113 | | | $ | — | | | $ | 38,113 | |
| | | | | | |
Joe Robinson | | | | | | | | | | | | | | | | | | | | | | | | |
• Without Cause or for Good Reason | | $ | 595,325 | | | $ | 36,258 | | | $ | 414,470 | (5) | | $ | 35,436 | | | $ | — | | | $ | 1,081,489 | |
• Change of control | | $ | 1,190,650 | | | $ | 72,516 | | | $ | 621,112 | (6) | | $ | 35,436 | | | $ | — | | | $ | 1,919,714 | |
• Death of disability(7) | | $ | 200,000 | | | $ | — | | | $ | 621,112 | | | $ | 35,436 | | | $ | — | | | $ | 856,548 | |
• Cause or Resignation | | $ | — | | | $ | — | | | $ | — | | | $ | 35,436 | | | $ | — | | | $ | 35,436 | |
| | | | | | |
Wayne Johnson | | | | | | | | | | | | | | | | | | | | | | | | |
• Without Cause or for Good Reason | | $ | 732,969 | | | $ | 38,249 | | | $ | 518,482 | (5) | | $ | 36,346 | | | $ | — | | | $ | 1,326,046 | |
• Change of control | | $ | 977,292 | | | $ | 50,999 | | | $ | 697,222 | (6) | | $ | 36,346 | | | $ | 489,716 | | | $ | 2,251,575 | |
• Death or disability(7) | | $ | 190,000 | | | $ | — | | | $ | 697,222 | | | $ | 36,346 | | | $ | — | | | $ | 923,568 | |
• Cause or Resignation | | $ | — | | | $ | — | | | $ | — | | | $ | 36,346 | | | $ | — | | | $ | 36,346 | |
| | | | | | |
Michael Terjung | | | | | | | | | | | | | | | | | | | | | | | | |
• Without Cause or for Good Reason | | $ | 648,000 | | | $ | 54,387 | | | $ | 319,777 | (5) | | $ | 31,224 | | | $ | — | | | $ | 1,053,388 | |
• Change of control | | $ | 864,000 | | | $ | 72,516 | | | $ | 434,572 | (6) | | $ | 31,224 | | | $ | 610,581 | | | $ | 2,012,893 | |
• Death or disability(7) | | $ | 135,000 | | | $ | — | | | $ | 434,572 | | | $ | 31,224 | | | $ | — | | | $ | 600,796 | |
• Cause or Resignation | | $ | — | | | $ | — | | | $ | — | | | $ | 31,224 | | | $ | — | | | $ | 31,224 | |
| (1) | | The Severance Payment will be due in the event that the NEO’s employment is terminated (i) by the NEO for Good Reason or (ii) by us or any of our subsidiaries without Cause. The Severance Payment is based upon a multiple of the sum of such NEO’s (i) highest annual salary within the prior two years and (ii) the average annual cash performance bonus earned for the prior three years. The multiple is equal to 2.0x for the Chief Executive Officer, 1.5x for the Chief Investment Officer and Chief Accounting Officer and 1.0x for |
162
| | all other executive officers. Such Severance Payments are paid in equal installments over an annual period |
| | equal to the multiple (i.e., 2 years, 1.5 years, 1 year). If a NEO is terminated without Cause or resigns for Good Reason and this occurs during the 12-month period following a Change of Control, then the multiple increases to 3.0x for the Chief Executive Officer and 2.0x for all other executive officers, and such Severance Payment is paid in a lump sum. |
| (2) | | Represents the cost of medical insurance coverage for each NEO at the same annual level as in effect immediately preceding December 31, 2023 for a period of time equal to the applicable multiple set forth in footnote 1, above. Such amounts are paid in equal installments over an annual period equal to the respective severance multiple (i.e., two years, 1.5 years, one year). A lesser amount may be due if the NEO becomes eligible to receive healthcare coverage from a subsequent employer. |
| (3) | | For purposes of this table, the market value per restricted share and LTIP Unit is assumed to be $15.25 (the estimated net asset value per share of our Class A common stock as of the end of the last completed fiscal year, calculated as of September 30, 2023). Such amounts include accrued and unpaid distributions due upon vesting. For performance-based awards such amounts were determined assuming targeted (100%) performance was achieved for the 2022 and 2023 grants and at maximum (200%) for the 2021 grant. |
| (4) | | Consists of accrued and unused paid time off, pursuant to the definition of “Accrued Obligations” contained in our Executive Severance and Change of Control Plan. |
| (5) | | With respect to the treatment of equity awards upon termination not involving a Change of Control: (i) any unvested time-based equity awards that would have otherwise vested over the 12-month period following the date of termination will immediately vest; and (ii) any unvested performance-based equity awards that remain outstanding on the date of termination shall remain outstanding and eligible to be earned following the completion of the performance period based on achievement of performance goals, vesting pro rata if such award becomes earned based on days employed during the performance period. For such performance-based awards, the table above assumes that performance-based awards for 2023 and 2022, performance goals were achieved at target, and all 2021 performance goals were achieved at maximum. |
| (6) | | With respect to the treatment of equity awards in the case of termination following a Change of Control: (i) all unvested time-based equity awards vest and become exercisable immediately prior to the Change of Control; and (ii) any performance-based awards that were assumed in connection with the Change of Control and remain unvested on a termination date that occurs within 12 months following the Change of Control shall (a) to the extent only subject to time-based vesting as of the termination date, immediately vest on the termination date, or (b) to the extent subject to performance-based vesting as of the termination date, remain outstanding and eligible to be earned following completion of the performance period based on achievement of performance goals, and to the extent earned (if at all) shall vest on a pro rata basis based on days employed during the performance period through the termination date. The table above assumes that performance-based awards for 2023 and 2022, performance goals were achieved at target, and all 2021 performance goals were achieved at maximum. |
| (7) | | In the event of a termination due to death or disability, such NEO is entitled to: (i) a pro rata portion of his annual cash performance bonus, as determined by the Compensation Committee based on actual performance for the performance period and number of days employed during such period, (ii) the immediate vesting of all unvested time-based equity awards, and (iii) any unvested performance awards that remain outstanding on the date of termination shall remain outstanding and eligible to be earned following the completion of the performance period based on achievement of performance goals, vesting pro rata if such award becomes earned based on days employed during the performance period. The amounts herein make the following assumptions: (i) the performance components of the cash bonuses were achieved at target for 2023, (ii) the performance goals for the performance-based equity awards for 2023 and 2022 were achieved at target, and (iii) the performance goals for the performance-based equity awards for 2021 were achieved at maximum. |
| (8) | | Includes $200,000 in proceeds from a life insurance policy purchased by us, which benefits are payable to Mr. Schwartz’s beneficiary upon his death. |
| (9) | | Under Sections 280G and 4999 of the Internal Revenue Code of 1986, as amended, a 20% excise tax is imposed upon certain individuals who receive payments in connection with a “change in control” if the payments received by them equal or exceed an amount generally approximating 3x their average annual |
163
| | compensation. The excise tax may be imposed on all such payments generally exceeding 1x an individual’s average annual compensation. The Executive Severance and Change of Control Plan provides that for certain “change in control” events, the participant will be entitled to an associated tax “gross-up” payment to cover the cost of this excise tax and related income taxes. The table above assumes that such a “change in control” event occurred. |
| (10) | | A NEO will not be entitled to receive any of these payments or benefits, other than the Accrued Obligations, unless the NEO has entered into a general release in favor of us and our affiliates, and the NEO will be entitled to receive such payments or benefits only so long as such NEO has not materially breached any of the provisions of the general release or the non-competition, non-solicitation, non-disclosure, non-disparagement and other similar restrictive covenants set forth in the NEO’s letter agreement entered into pursuant to the Executive Severance and Change of Control Plan, which contains various obligations by the NEO to us such as (a) a confidentiality covenant that extends indefinitely, (b) a non-compete provision while the executive is employed by us, (c) certain employee, investor and customer non-solicitation covenants that extend during the executive’s employment and for a period of time after separation (18 months for Chief Executive Officer, or President, 12 months for Chief Investment Officer or Chief Accounting Officer, or 9 months for all other NEOs), and (d) a non-disparagement provision. |
The terms “Cause,” “Good Reason,” and “Change of Control” have the following definitions as set forth in our Executive Severance and Change of Control Plan:
| | • | | “Cause” is generally defined to mean: (i) willful fraud or material dishonesty in the performance of the executive’s duties; (ii) deliberate or intentional failure by the executive to substantially perform his duties (other than due to incapacity) after a written notice is delivered describing such failures; (iii) willful misconduct by the executive that is materially detrimental to our or our affiliates’ reputation, goodwill or business operations; (iv) willful disclosure of our confidential information or trade secrets; (v) a breach of any restrictive covenants contained within the Participant’s letter agreement entered into pursuant to our Executive Severance and Change of Control Plan, which contains various obligations by the executive to us such as (a) a confidentiality covenant that extends indefinitely, (b) a non-compete provision while the executive is employed by us, (c) certain employee, investor and customer non-solicitation covenants that extend during the executives employment and for a period of time after separation (18 months for Chief Executive Officer or President, 12 months for Chief Investment Officer or Chief Accounting Officer, or nine months for all other NEOs), and (d) a non-disparagement provision; or (vi) the conviction of, or a plea of no contest to a charge of, a felony or crime of moral turpitude. |
| | • | | “Good Reason” is generally defined to mean, without the Participant’s consent: (i) a material diminution of base salary, target bonus, target annual equity compensation opportunity, or other annual incentive opportunity; (ii) a material reduction in authority, title, duties or responsibilities; (iii) relocation of principal place of employment greater than thirty (30) miles; or (iv) failure of any successor to us following a Change of Control to assume our Executive Severance and Change of Control Plan and its obligations. |
| | • | | “Change of Control” is generally defined to mean: (i) any person acquiring our securities representing at least 50% of the voting power; (ii) certain mergers (unless our stockholders continue to own at least 50% of the combined voting power of the resulting entity at the time of the merger); (iii) a change in the majority of our Board during any 12-month period that is not approved by a majority of directors; (iv) a sale of all or substantially all of our assets; or (v) adoption of a plan of liquidation. |
Our Executive Severance and Change of Control Plan provides the following payments upon the occurrence of a Change of Control:
| | • | | All unvested time-based equity awards vest and become exercisable immediately prior to the Change of Control; and |
| | • | | All unvested performance-based equity awards that are not continued or assumed by the successor entity in connection with the Change of Control vest and become exercisable immediately prior to the Change of |
164
| | Control based on actual achievement of the applicable performance goals through the date of the Change of Control, as determined in the sole discretion of the Compensation Committee. |
| | | | | | | | | | | | | | | | |
Name | | Time-Based
Equity
Awards | | | Performance-
Based
Equity
Awards | | | Dividends | | | Total | |
H. Michael Schwartz | | $ | 3,582,672 | | | $ | 2,362,489 | | | $ | 188,854 | | | $ | 6,134,015 | |
James Barry | | $ | 386,422 | | | $ | 217,050 | | | $ | 16,062 | | | $ | 619,534 | |
Wayne Johnson | | $ | 374,806 | | | $ | 297,106 | | | $ | 25,311 | | | $ | 697,223 | |
Joe Robinson | | $ | 380,850 | | | $ | 223,358 | | | $ | 16,904 | | | $ | 621,112 | |
Michael Terjung | | $ | 237,295 | | | $ | 181,957 | | | $ | 15,320 | | | $ | 434,572 | |
The above table assumes a change of control as of December 31, 2023 and a price per share of our common stock of $15.25 (the estimated net asset value per share of our Class A common stock as of the end of the last completed fiscal year, calculated as of September 30, 2023). This table also assumes that (i) no performance-based awards were continued or assumed by the successor entity in connection with the Change of Control, and (ii) all applicable performance goals were achieved at target. Included in the table above are the accrued distributions due based on the assumed achievement of the performance-based equity awards, as applicable.
CEO Pay Ratio
Pursuant to SEC rules, we are disclosing the ratio of the annual total compensation of our Chief Executive Officer, which as of December 31, 2023 was H. Michael Schwartz, to the annual total compensation of our median employee.
To identify our median employee, we examined annual total compensation consisting of all cash compensation, including bonuses for all of our employees for 2023. We did not make any assumptions, adjustments (including cost of living adjustments), or estimates with respect to such total compensation, and we did not annualize the compensation for any full-time employees who were not employed by us for all of 2023.
The 2023 annual total compensation for our median employee as determined based on SEC rules was $38,232. The 2023 annual total compensation for our Chief Executive Officer as determined based on SEC rules was $4,742,747. Based on this information, the ratio of our Chief Executive Officer’s annual total compensation to our median employee’s annual total compensation for fiscal year 2023 is 124 to 1.
Director Compensation for the Year Ended December 31, 2023
Summary
The following table provides a summary of the compensation earned by or paid to our directors for the year ended December 31, 2023:
| | | | | | | | | | | | | | | | | | | | | | | | | | | | |
Name | | Fees
Earned or
Paid
in Cash | | | Stock
Awards(1) | | | Option
Awards | | | Non-Equity
Incentive Plan
Compensation | | | Change in
Pension Value
and
Nonqualified
Deferred
Compensation | | | All Other
Compensation(2) | | | Total | |
H. Michael Schwartz | | $ | — | | | $ | — | | | $ | — | | | $ | — | | | $ | — | | | $ | 245 | | | $ | 245 | |
Paula M. Mathews | | $ | 62,500 | (3) | | $ | 80,000 | | | $ | — | | | $ | — | | | $ | — | | | $ | 393 | | | $ | 142,893 | |
Timothy S. Morris | | $ | 95,000 | (3) | | $ | 80,000 | | | $ | — | | | $ | — | | | $ | — | | | $ | 982 | | | $ | 175,982 | |
David J. Mueller | | $ | 97,500 | (3) | | $ | 80,000 | | | $ | — | | | $ | — | | | $ | — | | | $ | 393 | | | $ | 177,893 | |
Harold “Skip” Perry | | $ | 105,000 | (3) | | $ | 80,000 | | | $ | — | | | $ | — | | | $ | — | | | $ | 245 | | | $ | 185,245 | |
165
| (1) | | This column represents the full grant date fair value in accordance with FASB ASC Topic 718. |
| (2) | | Represents payment of life insurance premiums covering each of the members of our Board for the benefit of such director’s beneficiaries. |
| (3) | | Amount includes total fees earned or paid during the year ended December 31, 2023. |
Terms of Director Compensation
Each of our non-employee directors receive compensation for their service in the form of both cash and equity, as described below. Membership on our committees is comprised solely of independent directors.
| | | | |
Role | | Amount | |
Director Cash Retainer | | $ | 62,500 | |
Lead Independent Director (supplemental) | | $ | 10,000 | |
Audit Committee Chair (supplemental) | | $ | 20,000 | |
Nominating and Corporate Governance Committee Chair (supplemental) | | $ | 15,000 | |
Compensation Committee Chair (supplemental) | | $ | 15,000 | |
Audit Committee Non-Chair (supplemental) | | $ | 10,000 | |
Nominating and Corporate Governance Committee Non-Chair (supplemental) | | $ | 7,500 | |
Compensation Committee Non-Chair (supplemental) | | $ | 7,500 | |
Potential Additional Per Meeting Fees* | | $ | 1,500 | |
| * | | In the event that the board of directors or any committee thereof meets more than 10 times per year, a per meeting fee of $1,500 will be paid for each meeting thereafter. |
Upon re-election for membership on our board of directors, our non-employee directors receive an annual equity award with a market value of $80,000, which vests one year from the date of the director’s re-election.
2022 Long-Term Incentive Plan Awards to Independent Directors
In March 2022, following the recommendation of the Compensation Committee, our board of directors approved the Equity Incentive Plan, which was approved by our stockholders at our 2022 annual meeting of stockholders. The Equity Incentive Plan became effective when it was approved by our stockholders, and it replaced our prior incentive plan, known as the Employee and Director Long-Term Incentive Plan (the “Prior Plan”). From and after the effective date of the Equity Incentive Plan, no further awards have been or will be made under the Prior Plan.
The purpose of the Equity Incentive Plan is to encourage and enable our and our subsidiaries’ eligible employees, directors, consultants, and other key persons, upon whose judgment, initiative, and efforts we largely depend for the successful conduct of our business, to acquire a proprietary interest in us. Pursuant to the Equity Incentive Plan, we may issue stock options, stock appreciation rights, restricted stock unit awards, restricted stock awards, restricted stock unit awards, unrestricted stock awards, dividend equivalent rights, LTIP Units, other equity-based awards, and cash-based awards.
The total number of shares of our Class A common stock and our Class T common stock, in the aggregate, authorized and reserved for issuance under the Equity Incentive Plan is equal to 10,000,000 shares. As of December 31, 2023, there were approximately 9,367,118 million shares available for issuance under the Equity Incentive Plan. The term of the Equity Incentive Plan is 10 years. In the event of a consolidation or merger in which we are not the surviving corporation, or a sale of all or substantially all of our assets, in which outstanding shares of our stock are exchanged for securities, cash, or other property of an unrelated corporation or business entity, or in the event of our liquidation, the board of directors of any corporation assuming our obligations, may, in its discretion, take any one or more of the following actions as to outstanding awards under the Equity Incentive Plan: (i) provide that the awards may be assumed or substituted or (ii) upon written notice to
166
participants, provide that all awards will terminate upon consummation of such a transaction. In the event that awards are not assumed or substituted, except as otherwise provided by the Compensation Committee in the award agreement or other agreement between the holder of an award and us, upon the effective time of such transaction, all awards will become vested and exercisable and vested awards, other than stock options, shall be fully settled in cash or in kind at such appropriate consideration as determined by the Compensation Committee in its sole discretion after taking into account the consideration payable per share pursuant to such transaction, or the “merger price,” and all stock options shall be fully settled in cash or in kind in an amount equal to the difference between the merger price and the exercise price of the options; provided that each participant may be permitted to exercise all outstanding options within a specified period determined by the Compensation Committee prior to such.
In the event the board of directors or the Compensation Committee determines that any distribution, recapitalization, stock split, reorganization, merger, liquidation, dissolution or sale, transfer, exchange or other disposition of all or substantially all of our assets, or other similar corporate transaction or event, affects our stock such that an adjustment is appropriate in order to prevent dilution or enlargement of the benefits or potential benefits intended to be made available under the Equity Incentive Plan or with respect to an award, then our board of directors or Compensation Committee shall, in such manner as it may deem equitable, adjust the number and kind of shares or the exercise price with respect to any award.
As of December 31, 2023, (i) Mr. Mueller has received a total of 40,539 shares of restricted stock or LTIP Units, of which 34,523 shares or LTIP Units have vested, and (ii) Mr. Morris has received a total of 38,463 shares of restricted stock of which 32,868 shares have vested, and (iii) Mr. Perry has received a total of 38,884 shares of restricted stock of which 32,868 shares have vested and (iv) Ms. Mathews has received a total of 29,539 shares of restricted stock or LTIP Units, of which 23,523 shares or LTIP Units have vested.
Director Life Insurance Policies
We purchased life insurance policies covering each of the members of our board of directors for the benefit of such director’s beneficiaries. For the year ended December 31, 2023, we paid total premiums of $2,258 on such life insurance policies. Of this amount, $245 was attributed to the policy covering H. Michael Schwartz, $393 was attributed to the policy covering Paula M. Mathews, $982 was attributed to the policy covering Timothy S. Morris, $393 was attributed to the policy covering David J. Mueller, and $245 was attributed to the policy covering Harold “Skip” Perry.
2022 Long-Term Incentive Plan
On March 25, 2022, following the recommendation of the Compensation Committee, our Board approved the Incentive Plan, which was approved by our stockholders at our annual meeting of stockholders. The Incentive Plan became effective when it was approved by our stockholders, and it replaced the Prior Plan. From and after the effective date of the Incentive Plan, no further awards have been or will be made under the Prior Plan.
Shares of Common Stock Available
The maximum number of shares of common stock available for issuance for new awards is 10,000,000 shares. Following the effective date of the Incentive Plan, no awards may be granted under the Prior Plan.
Shares of common stock underlying awards granted under the Incentive Plan or the Prior Plan that are forfeited, canceled or otherwise terminated (other than by exercise) will be added back to the shares of common stock available for issuance under the Incentive Plan. Additionally, with respect to full-value awards under the Incentive Plan or the Prior Plan (i.e., an award other than a stock option, stock appreciation right or partnership unit with an economic structure similar to that of a stock option or stock appreciation right), shares tendered, held back or otherwise reacquired to cover tax withholding and shares previously reserved for issuance pursuant to
167
such an award to the extent that such shares are not issued and are no longer issuable pursuant to such an award (e.g., in the event that a full-value award that may be settled in cash or by issuance of shares of stock is settled in cash) will be added back to the shares available for issuance under the Incentive Plan. Shares of common stock tendered or held back for taxes or to cover the exercise price of an option or stock appreciation right will not be added back to the reserved pool under the Incentive Plan. Upon the exercise of a stock appreciation right that is settled in shares of common stock, the full number of shares of common stock underlying the award will be charged to the reserved pool. In the event we repurchase shares of common stock on the open market, the shares shall not be added to the shares of common stock available for issuance under the Incentive Plan.
In addition, in connection with the acquisition of another company, we may assume outstanding awards granted by another company as if they had been granted under the Incentive Plan or grant awards under the Incentive Plan in substitution of such outstanding awards, in each case, to the extent the applicable award recipient is eligible to be granted such an award under the Incentive Plan. Any shares of common stock issued pursuant to such assumed or substituted awards will not reduce the number of shares authorized for grant under the Incentive Plan.
Plan Administration
The Incentive Plan may be administered by either our Board, the Compensation Committee, or a similar committee performing the functions of the Compensation Committee that is designated by our Board (in either case, the “Administrator”). Our Board appointed the Compensation Committee as the initial Administrator. The Administrator has full power and authority, among other things, to: select the individuals to whom awards may from time to time be granted; determine the time or times of grant, and the type of award, or any combination of types of awards, granted to any one or more grantees; determine the number of shares of stock or LTIP units to be covered by any award; determine the specific terms and conditions of each award, subject to the provisions of the Incentive Plan, accelerate the exercisability or vesting of any award, interpret the Incentive Plan and awards granted thereunder, and otherwise administer the Incentive Plan and the awards granted thereunder. Subject to applicable law, the Administrator, in its sole discretion, may delegate to our Chief Executive Officer, all or part of the Administrator’s authority and duties with respect to the granting of awards to individuals who are not subject to the reporting and other provisions of Section 16 of the Exchange Act, subject to certain limitations.
Types of Awards
The types of awards permitted under the Incentive Plan include stock options, stock appreciation rights, restricted stock unit awards, restricted stock awards, restricted stock unit awards, unrestricted stock awards, dividend equivalent rights, LTIP units, other equity-based awards and cash-based awards. Subject to the overall limit on the number of shares that may be issued under the Incentive Plan, shares of common stock may be issued up to such maximum number pursuant to any type of award; provided that no more than 10,000,000 shares of common stock (plus, to the extent permitted by the Code, any shares added back to the Incentive Plan as described above) may be issued in the form of incentive stock options.
Eligibility
All full- or part-time employees, non-employee directors and consultants of us or any subsidiary as are selected from time to time by the Administrator in its sole discretion are eligible to receive awards under the Incentive Plan. As of , 2024, approximately individuals are eligible to participate in the Incentive Plan. All persons who are eligible to receive awards form a single class under the Incentive Plan, as awards are made on a discretionary basis and the terms of the Incentive Plan do not distinguish among various eligible persons.
Adjustments for Stock Dividends, Stock Splits, Etc.
The Incentive Plan requires the Administrator to make appropriate equitable adjustments to the number and kind of shares of common stock that are subject to issuance under the Incentive Plan, to certain limits in the Incentive Plan,
168
and to any outstanding awards under the Incentive Plan, as well as equitable adjustments to the purchase price or exercise price, as applicable, of outstanding awards under the Incentive Plan, to reflect any reorganization, recapitalization, reclassification, stock dividend, stock split, reverse stock split or similar change in our capital stock, including as a result of any merger or consolidation or sale of all or substantially all of our assets.
Treatment of Awards in Certain Transactions
In the event of a “Transaction,” as defined in the Incentive Plan, the board of directors of any corporation assuming our obligations, may, in its discretion, take any one or more of the following actions as to outstanding awards under the Incentive Plan: provide that the awards may be assumed or substituted, or upon written notice to participants provide that all awards will terminate upon consummation of the Transaction. In the event that awards are not assumed or substituted, except as otherwise provided by the Compensation Committee in the award agreement or other agreement between the holder of an award and us, upon the effective time of the Transaction, all awards will become vested and exercisable and vested awards, other than stock options, shall be fully settled in cash or in kind at such appropriate consideration as determined by the Compensation Committee in its sole discretion after taking into account the consideration payable per share pursuant to the Transaction, or the “merger price,” and all stock options shall be fully settled in cash or in kind in an amount equal to the difference between the merger price and the exercise price of the options; provided that each participant may be permitted to exercise all outstanding options within a specified period determined by the Compensation Committee prior to the Transaction.
Term
No awards may be granted under the Incentive Plan 10 years or more after the date of stockholder approval, and no incentive stock options may be granted after the tenth anniversary of the date the Incentive Plan was approved by the Board.
Repricing
The Administrator may not, without stockholder approval, reduce the exercise price of outstanding stock options or stock appreciation rights or effect repricing through cancellation and re-grants or cancellation of stock options or stock appreciation rights in exchange for cash or other awards, other than as a result of a proportionate adjustment made in connection with a reorganization, recapitalization, reclassification, stock dividend, stock split, reverse stock split, or other similar event.
Stock Options
The Incentive Plan permits the granting of (1) options intended to qualify as incentive stock options under Section 422 of the Code and (2) options that do not so qualify. Options granted under the Incentive Plan will be non-qualified stock options if they fail to qualify as incentive stock options or exceed the annual limit on incentive stock options. Non-qualified stock options may be granted to any persons eligible to receive incentive stock options and to non-employee directors and consultants. Incentive stock options may be granted only to employees of the Company or any subsidiary. To qualify as incentive stock options, options must meet additional federal tax requirements, including a $100,000 limit on the value of shares of common stock subject to incentive stock options that first become exercisable by a participant in any one calendar year.
The exercise price of each option will be determined by the Administrator but may not be less than 100% of the fair market value of our shares of common stock on the date of grant, subject to certain exceptions set forth in the Incentive Plan. The term of each option will be fixed by the Administrator and may not exceed 10 years from the date of grant. The Administrator will determine at what time or times each option may be exercised. Options may be made exercisable in installments and the exercisability of options may be accelerated by the Administrator. Options may be exercised in whole or in part by giving written or electronic notice to us. Upon exercise of options, the option exercise price must be paid in full either in cash, by certified or bank check or
169
other instrument acceptable to the Administrator or by delivery (or attestation to the ownership following such procedures as we may prescribe) of shares of common stock that are not subject to restrictions under any plan. Subject to applicable law, the exercise price may also be delivered to us by a broker pursuant to irrevocable instructions to the broker from the optionee. In addition, the Administrator may permit non-qualified stock options to be exercised using a net exercise feature which reduces the number of shares of common stock issued to the optionee by the number of shares of common stock with a fair market value equal to the exercise price.
Stock Appreciation Rights
The Administrator may award stock appreciation rights to participants subject to such conditions and restrictions as the Administrator may determine, provided that the exercise price may not be less than 100% of the fair market value of our shares of common stock on the date of grant, subject to certain exceptions set forth in the Incentive Plan. Stock appreciation rights are settled in cash or shares of common stock. In addition, no stock appreciation right shall be exercisable more than 10 years after the date the stock appreciation right is granted.
Restricted Stock
The Administrator may award shares of common stock to participants subject to such conditions and restrictions as the Administrator may determine. These conditions and restrictions may include the achievement of certain pre-established performance goals and/or continued employment or service through a specified restriction period. If the lapse of restrictions with respect to the shares of common stock is tied to attainment of vesting conditions, any cash dividends paid by us during the vesting period will be retained by, or repaid by the grantee to, us until and to the extent the vesting conditions are met with respect to the award; provided, that to the extent provided for in the applicable award agreement or by the Administrator, an amount equal to such cash dividends retained or repaid by the grantee may be paid by the grantee upon the lapsing of such restrictions.
Restricted Stock Units
Restricted stock unit awards are payable in the form of shares of common stock (or cash, to the extent explicitly provided in the award agreement) and may be subject to such conditions and restrictions as the Administrator may determine. These conditions and restrictions may be based on, among other things, the achievement of certain performance goals and/or continued employment or service with us through a specified vesting period. To the extent permitted by the Administrator, restricted stock units may be deferred to one or more dates specified in the applicable award certificate or elected by the grantee.
Unrestricted Stock
The Incentive Plan gives the Administrator discretion to grant stock awards free of any restrictions. Unrestricted stock may be granted to any participant in recognition of past services or other valid consideration and may be issued in lieu of cash compensation due to such participant.
Dividend Equivalent Rights
Dividend equivalent rights are awards entitling the grantee to current or deferred payments equal to cash dividends on a specified number of shares of common stock. Dividend equivalent rights may be settled in cash or stock and are subject to other conditions as the Administrator shall determine. Dividend equivalent rights may be granted to any grantee as a component of an award or as a freestanding award. Unless provided by the Administrator, dividend equivalent rights may be paid currently, be deemed reinvested in additional shares of stock, which may thereafter accrue additional dividend equivalents, or may otherwise accrue.
LTIP Units
The Administrator may grant LTIP units to a grantee in such amounts and subject to such terms and conditions as may be determined by the Administrator; provided, however, that LTIP units may only be issued to
170
a grantee for the performance of services to or for the benefit of our operating partnership (i) in the grantee’s capacity as a partner of our operating partnership, (ii) in anticipation of the grantee becoming a partner of our operating partnership, or (iii) as otherwise determined by the Administrator.
Other Equity-Based Awards
The Administrator may grant other awards based upon the stock having such terms and conditions as the Administrator may determine, including, without limitation, the grant of convertible preferred stock, convertible debentures and other exchangeable or redeemable securities or equity interests, as well as the grant of units in the operating partnership or other units or any other membership or ownership interests (which may be expressed as units or otherwise) in a subsidiary, with any stock being issued in connection with the conversion of (or other distribution on account of) an interest granted under the provisions of the Incentive Plan.
Cash-Based Awards
The Administrator may grant cash-based awards, such as annual cash bonuses, under the Incentive Plan. The cash-based awards may be subject to the achievement of one or more performance criteria selected by the Administrator, including those specifically referenced in the definition of Performance Criteria in the Incentive Plan. Cash-based awards may be paid in cash or shares of common stock, as the Administrator may determine. Cash-based awards that are only payable or actually paid in cash are not subject to and will have no impact on the number of shares of common stock available for issuance under the Incentive Plan.
Tax Withholding
Participants in the Incentive Plan are responsible for the payment of any federal, foreign, state or local taxes that we are required by law to withhold upon any exercise, vesting or settlement of awards, as applicable. Subject to approval by the Administrator, participants may elect to have the tax withholding obligations satisfied by authorizing us to withhold shares of common stock to be issued (or, in the case of a restricted stock award, to reacquire shares previously issued pursuant to such award). Additionally, the Administrator may provide for mandatory share withholding up to the required withholding amount. The Administrator may also require tax withholding obligations to be satisfied by an arrangement where shares issued pursuant to an award are immediately sold and proceeds from such sale are remitted to us in an amount to satisfy such tax withholding obligations.
Cash Compensation in Lieu of Award
In addition, in the Administrator’s sole discretion, and subject to the participant’s compliance with the procedures established by the Administrator, it may permit a participant to make an advance election to receive cash compensation otherwise due in the form of an award.
Amendments and Termination
Our Board may, at any time, amend or discontinue the Incentive Plan, and the Administrator may, at any time, amend or cancel any outstanding award for any other lawful purpose, but no such action shall materially and adversely affect rights under any outstanding award without applicable grantee’s consent except to the extent required to comply with changes in law. Our Board may determine to make amendments subject to the approval of the common stockholders for purposes of complying with the rules of any securities exchange or market system on which the stock is listed or to preserve the qualified status of incentive stock options. Otherwise, our Board may amend or discontinue the Incentive Plan at any time, provided that no such action will materially and adversely affect the rights under any outstanding awards without the holder’s consent.
171
United States Federal Income Tax Consequences—Options and Stock Appreciation Rights
The following is a summary of the principal federal income tax consequences of certain transactions under the Incentive Plan relating to options and stock appreciation rights. It does not describe all federal tax consequences under the Incentive Plan, nor does it describe state or local tax consequences.
Incentive Stock Options. No taxable income is generally realized by the optionee upon the grant or exercise of an incentive stock option. If shares of common stock issued to an optionee pursuant to the exercise of an incentive stock option are sold or transferred after two years from the date of grant and after one year from the date of exercise, then (1) upon sale of such shares of common stock, any amount realized in excess of the option price (the amount paid for the shares of common stock) will be taxed to the optionee as a long-term capital gain, and any loss sustained will be a long-term capital loss, and (2) we will not be entitled to any deduction for federal income tax purposes. The exercise of an incentive stock option will give rise to an item of tax preference that may result in alternative minimum tax liability for the optionee.
If shares of common stock acquired upon the exercise of an incentive stock option are disposed of prior to the expiration of the two-year and one-year holding periods described above, generally: (1) the optionee will realize ordinary income in the year of disposition in an amount equal to the excess (if any) of the fair market value of the shares of common stock at exercise (or, if less, the amount realized on a sale of such shares of common stock) over the option price thereof; and (2) we will be entitled to deduct such amount. Special rules will apply where all or a portion of the exercise price of the incentive stock option is paid by tendering shares of common stock.
If an incentive option is exercised at a time when it no longer qualifies for the tax treatment described above, the option is treated as a non-qualified option. Generally, an incentive option will not be eligible for the tax treatment described above if it is exercised more than three months following termination of employment (or one year in the case of termination of employment by reason of disability). In the case of termination of employment by reason of death, the three-month rule does not apply.
Non-Qualified Stock Options. No taxable income is generally realized by the optionee upon the grant of a non-qualified stock option. Generally: (1) at exercise, ordinary income is realized by the optionee in an amount equal to the difference between the option exercise price and the fair market value of the shares of common stock on the date of exercise, and we receive a tax deduction for the same amount; and (2) at disposition, appreciation or depreciation after the date of exercise is treated as either short-term or long-term capital gain or loss depending on how long the shares of common stock have been held. Special rules will apply where all or a portion of the exercise price of the non-qualified stock option is paid by tendering shares of common stock. Upon exercise, the optionee will also be subject to Social Security taxes on the excess of the fair market value over the exercise price of the option.
Stock Appreciation Rights. No income will be recognized by a recipient upon the grant of either tandem or freestanding stock appreciation rights. For the year in which the stock appreciation right is exercised, the recipient will generally be taxed at ordinary income rates on the amount equal to the cash received plus the fair market value of any unrestricted shares received on the exercise.
Parachute Payments. The vesting of any portion of an option or stock appreciation right that is accelerated due to the occurrence of a change in control may cause a portion of the payments with respect to such accelerated awards to be treated as “parachute payments,” as defined in the Code. Any such parachute payments may be non-deductible to us, in whole or in part, and may subject the recipient to a non-deductible 20% federal excise tax on all or a portion of such payment (in addition to other taxes ordinarily payable).
Limitation on Deductions. Under Section 162(m) of the Code, our deduction for awards under the Incentive Plan may be limited to the extent that any “covered employee” (as defined in Section 162(m) of the Code) receives compensation in excess of $1 million a year.
172
New Plan Benefits
Because the grant of awards under the Incentive Plan is within the discretion of the Administrator, we cannot determine the dollar value or number of shares of common stock that will in the future be received by or allocated to any participant in the Incentive Plan.
Clawback Policy
In connection with the consummation of this listing, our Board will adopt a clawback policy (the “Clawback Policy”) to comply with the finalized and effective SEC and NYSE rules (Section 10D of the Exchange Act, Rule 10D-1 of the Dodd Frank Wall Street Reform and Consumer Protection Act promulgated thereunder and Section 303A.14 of the NYSE Listed Company Manual). Such Clawback Policy will provide that, in the event of an accounting restatement, certain individuals, including our executive officers, must reimburse us for any erroneously awarded incentive-based compensation. The Compensation Committee will have the authority to interpret and make all determinations under the Clawback Policy.
Listing Equity Grants
In connection with this offering, the Compensation Committee intends to authorize us to grant time-based LTIP units and shares of Class A restricted stock, or the Listing Equity Grants, to our directors and our employee base, dependent on tenure. The intent of the Listing Equity Grants is to provide the majority of our employees with a vested interest in the performance of the Company. Additionally, no portion of the Listing Equity Grants will be allocated to our Chairman, Founder, and Chief Executive Officer. The Listing Equity Grants will be subject to and become effective upon the listing of our common stock on the NYSE. The total amount of Listing Equity Grants is expected to be approximately 2% of the aggregate amount of shares of our common stock offered in this offering.
173
PRINCIPAL STOCKHOLDERS
The following table sets forth, as of , 2024, the amount of our common stock and OP units beneficially owned by: (1) any person who is known by us to be the beneficial owner of more than 5% of any class of the outstanding shares of our common stock; (2) each of our directors; (3) each of our executive officers; and (4) our directors and executive officers as a group.
The number and percentage of our common stock include as outstanding (i) the shares of our common stock to be sold in this offering, but assume that the underwriters do not exercise their option to purchase up to an additional shares of our common stock, and (ii) the Listing Equity Grants. However, the following table does not include the shares of common stock that may be purchased in this offering or pursuant to our directed share program described under “Underwriting—Directed Share Program.”
Unless otherwise indicated, the address of the stockholders listed below is c/o SmartStop Self Storage REIT, Inc., 10 Terrace Road, Ladera Ranch, California 92694.
| | | | | | | | | | | | | | | | |
Name of Beneficial Owner(1) | | Number of
Shares of
Common
Stock
Beneficially
Owned | | | Number
of OP
Units | | | Total | | | Percentage
of All
Shares of
Common
Stock and
OP Units(2) | |
H. Michael Schwartz | | | | (3) | | | | (4) | | | | | | | | |
Wayne Johnson | | | | | | | | | | | | | | | | |
Joe Robinson | | | | | | | | | | | | | | | | |
James R. Barry | | | | | | | | | | | | | | | | |
Michael O. Terjung | | | | | | | | | | | | | | | | |
Nicholas M. Look | | | | | | | | | | | | | | | | |
Paula Mathews | | | | | | | | | | | | | | | | |
David J. Mueller | | | | | | | | | | | | | | | | |
Timothy S. Morris | | | | | | | | | | | | | | | | |
Harold “Skip” Perry | | | | | | | | | | | | | | | | |
All directors and executive officers as a group (11 persons) | | | | | | | | | | | | | | | | |
5% or Greater Stockholders | | | | | | | | | | | | | | | | |
Extra Space Storage LP(5) | | | | | | | | | | | | | | | | |
| * | | Represents less than 1% of our outstanding common stock as of , 2024. |
| (1) | | Beneficial ownership is determined in accordance with SEC rules and generally includes voting or investment power with respect to securities and shares issuable pursuant to options, warrants and similar rights held by the respective person or group that may be exercised within 60 days following , 2024. Except as otherwise indicated by footnote, and subject to community property laws where applicable, the persons named in the table above have sole voting and investment power with respect to all shares of common stock shown as beneficially owned by them. |
| (2) | | Based on approximately million shares of common stock outstanding as of , 2024, which includes restricted stock and LTIP units that will vest within 60 days following , 2024 but excludes up to shares of common stock that may be issued by us upon exercise of the underwriters’ option to purchase additional shares. OP units may be redeemed for cash, or at our option, an equal number of shares of common stock, subject to certain restrictions. Once vested, LTIP units are convertible into OP units. This table assumes conversion of such LTIP units and issuance of shares of common stock in exchange for OP units. |
| (3) | | Includes shares of Class A common stock owned by SmartStop OP Holdings, LLC, which is indirectly owned and controlled by Mr. Schwartz. This also includes shares of Class A common stock held by a family trust, as to which Mr. Schwartz has shared voting and dispositive power. |
| (4) | | Includes OP units owned by SmartStop OP Holdings, LLC, which is indirectly owned and controlled by Mr. Schwartz. |
| (5) | | The address of Extra Space Storage LP is 2795 East Cottonwood Parkway, Suite 300, Salt Lake City, Utah 84121. This information is based solely on Extra Space Storage LP’s ownership of our Series A Convertible Preferred Stock. The holders of the Series A Convertible Preferred Stock have the right to convert any or all of the Series A Convertible Preferred Stock into shares of our common stock. As of , 2024, we had $200 million of Series A Convertible Preferred Stock outstanding which are convertible using a conversion price of $10.66; such conversion price may be adjusted in connection with stock splits, stock dividends and other similar transactions. |
174
CERTAIN RELATIONSHIPS AND RELATED PARTY TRANSACTIONS
Certain of our executive officers and two of our directors hold ownership interests in and/or are officers of SAM, our Former Dealer Manager (as defined below), and other affiliated entities. Accordingly, any agreements or transactions we have entered into with such entities may present a conflict of interest. However, none of SAM and its affiliates or our directors or executive officers receive any compensation, fees or reimbursements from our Managed REITs, other than as disclosed in this prospectus and as described in this section.
Set forth below is a description of certain related party transactions, other than equity and compensation, termination, change in control, and other arrangements which are described under the sections of this prospectus entitled “Management—Director Compensation,” “Compensation Discussion and Analysis” and “Executive Compensation Tables.” Our independent directors reviewed and approved the material transactions between us and our affiliates arising out of the agreements described below.
Terminated Agreement with Former Dealer Manager
SAM indirectly owned a 15% beneficial non-voting equity interest in Select Capital Corporation, our former dealer manager (our “Former Dealer Manager”) in our non-traded REIT public offering, which terminated in January 2017 (the “NTR Offering”). Our Former Dealer Manager served as our dealer manager and received certain fees for our NTR Offering pursuant to our Dealer Manager Agreement, which also terminated in 2017. Our Former Dealer Manager was no longer entitled to any fees after March 31, 2022.
Terminated Agreement with Former Transfer Agent
SAM is the manager and sole member of Strategic Transfer Agent Services, LLC, our former transfer agent. Pursuant to a Transfer Agent Agreement with our former transfer agent, our former transfer agent provided transfer agent and registrar services to us. These services were substantially similar to what a third-party transfer agent would provide in the ordinary course of performing its functions as a transfer agent, including, but not limited to: providing customer service to our stockholders, processing the distributions and any servicing fees with respect to our shares, and issuing regular reports to our stockholders. On April 29, 2024, we transitioned to a new unaffiliated third-party transfer agent, SS&C GIDS, Inc. In connection with such transfer, we simultaneously terminated the transfer agent agreement our former transfer agent. In lieu of a termination fee and in recognition of the additional cost and expenses incurred by our former transfer agent in connection with the transition, we paid our former transfer agent a transition fee of $150,000 in May 2024.
Administrative Services Agreement
On June 28, 2019, we, along with our operating partnership and certain other subsidiaries of ours (collectively, the “Company Parties”), entered into an Administrative Services Agreement with SAM (the “Administrative Services Agreement”), which, as amended, requires that the Company Parties will be reimbursed for providing certain operational and administrative services to SAM which may include, without limitation, accounting and financial support, IT support, HR support, advisory services and operations support, administrative support and other miscellaneous reimbursements as set forth in the Administrative Services Agreement and SAM will be reimbursed for providing certain operational and administrative services to the Company Parties which may include, without limitation, due diligence support, marketing, fulfillment and offering support, events support, insurance support, and administrative and facilities support. SAM and the Company Parties will reimburse one another based on the actual costs of providing their respective services. Additionally, SAM paid the Company Parties an allocation of rent and overhead for the portion of the Ladera Office that it occupied until October 2022, at which time SAM relocated to a separate office. Such agreement had an initial term of three years, with automatic one-year renewals, and is subject to certain adjustments as defined in the agreement.
175
For the three and nine months ended September 30, 2024, we incurred reimbursements payable to SAM under the Administrative Services Agreement of approximately $276,000 and approximately $634,000, respectively, which were included in Managed REIT platform expenses in our consolidated statements of operations. We also recorded reimbursements from SAM of approximately $39,000 and $160,000 during the three and nine months ended September 30, 2024, respectively, related to services provided to SAM, which were included in Managed REIT platform revenue in our consolidated statements of operations.
For the year ended December 31, 2023, we incurred reimbursements payable to SAM under the Administrative Services Agreement of approximately $0.5 million. We also recorded reimbursements from SAM of approximately $0.7 million during the year ended December 31, 2023 related to services provided to SAM as well as reimbursements of rent and overhead for the portion of the Ladera Office occupied by SAM. As of December 31, 2023, a receivable of approximately $11,000 was due from SAM related to the Administrative Services Agreement.
Sponsor Funding Agreement
On November 1, 2023, SRA entered into a sponsor funding agreement with SST VI and SST VI OP, in connection with certain changes to the public offering of SST VI.
Pursuant to the sponsor funding agreement, SRA, as sponsor of the SST VI offering, has agreed to fund the payment of (i) the upfront 3% sales commission for the sale of shares of SST VI’s Class Y common stock sold in the SST VI offering, (ii) the upfront 3% dealer manager fee for the Class Y Shares sold in the SST VI offering, and (iii) the estimated 1% organization and offering expenses for the sale of Class Y Shares and shares of SST VI’s Class Z common stock sold in the SST VI offering. SRA also agreed to reimburse SST VI in cash to cover the dilution from certain one-time stock dividends which were issued by SST VI to existing stockholders in connection with the sponsor funding changes to the SST VI offering. On December 15, 2023, we paid SST VI approximately $6.6 million for the reimbursement of the aforementioned stock dividend.
In consideration for SRA providing the funding for the front-end sales load and the cash to cover the dilution from the stock dividends described above, SST VI OP will issue a number of Series C Subordinated Convertible Units of limited partnership interest in SST VI OP (the “Series C Units”) to SRA equal to the dollar amount of such funding divided by the then-current offering price for the Class Y Shares and Class Z Shares sold in the SST VI offering, which will initially be $9.30 per share. Pursuant to the sponsor funding agreement, SRA will reimburse SST VI monthly for the applicable front-end sales load it has agreed to fund, and SST VI OP will issue the Series C Units on a monthly basis upon such reimbursement.
On August 7, 2024, SST VI declared an estimated net asset value per share of $10.00. Since the Series C Units that could be converted would result in the net asset value falling below $10.00 per share, none of the Series C Units we own were converted into Class A units of SST VI OP, and our future purchases will be determined based on the current estimated net asset value at such time. Subsequent to SST VI declaring an estimated net asset value of $10.00 per share, the number of Series C Units SmartStop receives in exchange for funding the front-end sales load of the sale of SST VI’s Class Y and Class Z shares is calculated as the dollar amount of such sponsor funding divided by the current offering price of $10.00 per share for such Class Y and Z shares. The Sponsor Funding Agreement will terminate immediately upon the date that SST VI ceases to offer the Class Y shares and Class Z shares in the SST VI offering. The SST VI offering was set to expire on March 17, 2024, and was extended to March 17, 2025 upon the approval of SST VI’s board of directors on February 1, 2024. Inclusive of all extension options available to SST VI, its current offering could not extend beyond September 12, 2025.
On November 1, 2023, SRA entered into Amendment No. 3 to the Second Amended and Restated Limited Partnership Agreement of SST VI OP with SST VI and SST VI OP containing, among other things, the terms of the Series C Units. The Series C Units shall initially have no distribution, liquidation, voting, or other rights to
176
participate in SST VI OP unless and until such Series C Units are converted into Class A Units of SST VI OP. The Series C Units shall automatically convert into Class A Units on a one-to-one basis upon SST VI’s disclosure of an estimated net asset value per share equal to at least $10.00 per share for each class of SST VI shares of common stock, including the Class Y Shares and Class Z Shares, calculated net of the value of the Series C Units to be converted.
Through September 30, 2024, we have incurred approximately $8.7 million in connection with the Sponsor Funding Agreement, representing approximately 928,000 subordinated units. During the three and nine months ended September 30, 2024 we incurred approximately $0.6 million and $1.8 million, respectively, of which approximately $0.2 million was accrued as a payable pursuant to the Sponsor Funding Agreement.
As of September 30, 2024, the maximum remaining commitment of SRA pursuant to the Sponsor Funding Agreement is approximately $61.9 million if SST VI were to sell the maximum amount under its current offering of $1.0 billion.
Property Management Agreement
We serve as the property manager for a self storage property in which SAM holds a minority interest. For the year ended December 31, 2023, we earned approximately $127,000 in property management fees for providing such management services.
Purchases in Directed Share Program
Certain of our directors, officers and employees, and friends and family members of certain of our directors, officers, and employees will be able to purchase shares of our common stock in the directed share program. See the section captioned “Underwriting” in this prospectus for more information. All purchases of common stock in the directed share program will be at the public offering price. Purchases by any related persons participating in the directed share program may individually exceed $120,000.
Fees Paid to our Affiliates
Pursuant to the terms of the agreements described above, the following table summarizes related party costs incurred and paid by us for the year ended December 31, 2023 and the nine months ended September 30, 2024, as well as any related amounts payable as of December 31, 2023 and September 30, 2024 (in thousands):
| | | | | | | | | | | | | | | | | | | | | | | | |
| | | Year Ended December 31,
2023 | | | Nine Months Ended
September 30, 2024 | |
| | | Incurred | | | Paid | | | Payable | | | Incurred | | | Paid | | | Payable | |
Expensed | | | | | | | | | | | | | | | | | | | | | | | | |
Transfer Agent fees | | $ | 1,479 | | | $ | 1,473 | | | $ | 75 | | | $ | 648 | | | $ | 693 | | | $ | 30 | |
Additional paid-in capital | | | | | | | | | | | | | | | | | | | | | | | | |
Transfer Agent expenses | | | — | | | | — | | | | — | | | | — | | | | — | | | | — | |
Other | | | | | | | | | | | | | | | | | | | | | | | | |
Other | | | — | | | | — | | | | 341 | | | | — | | | | — | | | | 341 | |
| | | | | | | | | | | | | | | | | | | | | | | | |
Total | | $ | 1,479 | | | $ | 1,473 | | | $ | 416 | | | $ | 648 | | | $ | 693 | | | $ | 371 | |
| | | | | | | | | | | | | | | | | | | | | | | | |
177
Pursuant to the terms of the agreements described above, the following table summarizes certain related party costs incurred and paid by us for the years ended December 31, 2022 and 2023, and any related amounts payable as of December 31, 2022 and 2023 (in thousands):
| | | | | | | | | | | | | | | | | | | | | | | | |
| | | Year Ended December 31, 2022 | | | Year Ended December 31, 2023 | |
| | | Incurred | | | Paid | | | Payable | | | Incurred | | | Paid | | | Payable | |
| Expensed | | | | | | | | | | | | | | | | | | | | | | | | |
Transfer Agent fees | | $ | 1,243 | | | $ | 1,261 | | | $ | 69 | | | $ | 1,479 | | | $ | 1,473 | | | $ | 75 | |
| Additional paid-in capital | | | | | | | | | | | | | | | | | | | | | | | | |
Transfer Agent expenses | | | 100 | | | | 100 | | | | — | | | | — | | | | — | | | | — | |
Stockholder servicing fee(1) | | | 54 | | | | 210 | | | | — | | | | — | | | | — | | | | — | |
| Other | | | | | | | | | | | | | | | | | | | | | | | | |
Other | | | — | | | | — | | | | 341 | | | | — | | | | — | | | | 341 | |
| | | | | | | | | | | | | | | | | | | | | | | | |
Total | | $ | 1,397 | | | $ | 1,571 | | | $ | 410 | | | $ | 1,479 | | | $ | 1,473 | | | $ | 416 | |
| | | | | | | | | | | | | | | | | | | | | | | | |
| (1) | | We paid our former dealer manager an ongoing stockholder servicing fee that was payable monthly and accrued daily in an amount equal to 1/365th of 1% of the purchase price per share of the Class T Shares sold in the Primary Offering. The amount incurred during the year ended December 31, 2022. Represents an adjustment to the estimated stockholder servicing fee recorded at the time of the sale of the Class T Shares, based on the then estimated cessation date of such stockholder servicing fee of March 31, 2022. |
178
POLICIES WITH RESPECT TO CERTAIN ACTIVITIES
The following is a discussion of certain of our investment, financing, and other policies that will be in place following the completion of this offering. These policies have been determined by our Board and management and, in general, may be amended and revised from time to time at the discretion of our Board and management without notice to or a vote of our stockholders. See “Business and Properties” and “Management’s Discussion and Analysis of Financial Condition and Results of Operations” for more information regarding our business and operations.
Investment Policies
Investment in Real Estate or Interests in Real Estate
Our primary business objective is to deliver attractive risk-adjusted returns by investing in and operating a portfolio of newer generation self storage facilities and earlier generation self storage facilities, both primarily located in urban sub-markets. We intend to maximize cash flow to stockholders through both organic and external growth utilizing multiple levers and channels. While we focus our investment strategy on self storage facilities and related self storage real estate investments, we may invest in other storage-related investments such as storage facilities for automobiles, recreation vehicles and boats. We may additionally invest in other types of commercial real estate properties if our Board deems appropriate. We seek to make investments that will satisfy the business objective of maximizing cash flow to our stockholders. However, because a significant factor in the valuation of income-producing real property is its potential for future appreciation, we anticipate that some properties we acquire may have the potential for both growth in value and for maximizing cash flows to our stockholders. We have not established a specific policy regarding the relative priority of our investment objectives. For a more detailed discussion of our self storage facilities and our acquisition and other strategic objectives, see “Our Business and Self Storage Properties.”
All of our acquisitions are reviewed, and must be approved, by our Investment Committee, which is composed of, among others, (i) our Chief Executive Officer, (ii) our President and Chief Investment Officer, (iii) our Chief Financial Officer, (iv) our Chief Operations Officer, (v) our Chief Accounting Officer, and (vi) our General Counsel.
Future investment activities will not be limited to any geographic area, product type, or specified percentage of our assets. While we may diversify in terms of property location, size, and market or sub-market, we do not have any limit on the amount or percentage of our assets that may be invested in any one property or any one geographic area. We intend to engage in such future investment or development activities in a manner that is consistent with our qualification as a REIT for U.S. federal income tax purposes. We do not have a specific policy to acquire assets primarily for capital gain or primarily for income.
We may acquire real estate or interests in real estate in exchange for the issuance of common stock, preferred stock, or options to purchase stock or interests in our subsidiaries, including our operating partnership.
Equity investments in acquired self storage facilities may be subject to existing mortgage financing and other indebtedness or to new indebtedness which may be incurred in connection with acquiring or refinancing these investments. Principal and interest on our debt will have a priority over any dividends with respect to our common stock.
Investments in Real Estate Mortgages
Although not our primary focus, we may elect, in our discretion, to invest in mortgages and other types of real estate interests, including, without limitation, participating or convertible mortgages, provided, in each case, that such investment is consistent with our qualification as a REIT. Investments in real estate mortgages run the risk that one or more borrowers may default under certain mortgages and that the collateral securing certain mortgages may not be sufficient to enable us to recoup our full investment.
179
Securities of or Interests in Persons Primarily Engaged in Real Estate Activities and Other Issuers
Subject to the asset tests and gross income tests necessary for REIT qualification, we may invest in securities of other REITs, other entities engaged in real estate activities, or securities of other issuers, including for the purpose of exercising control over such entities. We do not currently have any policy limiting the types of entities in which we may invest or the proportion of assets to be so invested, whether through acquisition of an entity’s common stock, limited liability company or limited partnership interests, interests in another REIT, or through entry into a joint venture. As of September 30, 2024, we have not invested in any marketable securities.
We may enter into joint ventures, general partnerships, co-tenancies and other participations with real estate developers, owners and others for the purpose of owning and leasing real properties. Among other reasons, we may want to acquire properties through a joint venture with third parties or affiliates in order to diversify our portfolio of properties in terms of geographic region or property type or to co-invest with one of our development partners. Joint ventures may also allow us to acquire an interest in a property without requiring that we fund the entire purchase price. In addition, certain properties may be available to us only through joint ventures. For example, we have a joint venture with SmartCentres, which owns a diversified portfolio of real estate in Canada and is one of the largest TSX-listed REITs. The 50/50 joint venture affords each party a right of first offer to develop self storage facilities in certain CMAs in Canada. Generally, SmartCentres has been responsible for the development of the properties and we have been responsible for the operation of the self storage facilities upon completion. We have no current plans to make material additional investments in entities that are not engaged in real estate activities.
Investment in Other Securities
Other than as described above, we do not intend to invest in any additional securities such as bonds, preferred stocks, or common stock.
Dispositions
We generally intend to hold each property we acquire for an extended period. However, we may sell a property at any time if, in our judgment, the sale of the property is in our best interests.
The determination of whether a particular property should be sold or otherwise disposed of will generally be made after consideration of relevant factors, including prevailing economic conditions, other investment opportunities and considerations specific to the condition, value and financial performance of the property. In connection with sales of properties, we may lend the purchaser all or a portion of the purchase price. In these instances, our taxable income may exceed the cash received in the sale.
Financing Policies
We expect to employ leverage in our capital structure in amounts determined from time to time by our Board. Although our Board has not adopted a policy that limits the total amount of indebtedness that we may incur, it will consider a number of factors in evaluating our level of indebtedness from time to time, as well as the amount of such indebtedness that will be either fixed or variable rate. Our charter and bylaws do not limit the amount or percentage of indebtedness that we may incur, nor do they restrict the form in which our indebtedness is taken (including recourse or non-recourse debt, cross collateralized debt, etc.). Our Board may from time to time modify our debt policy in light of the then-current economic conditions, relative costs of debt and equity capital, market values of our self storage facilities, general market conditions for debt and equity securities, fluctuations in the market price of our common stock, growth and acquisition opportunities, and other factors.
To the extent our Board decides to obtain additional capital, we may, without stockholder approval, issue debt or equity securities, retain earnings (subject to the REIT distribution requirements for U.S. federal income tax purposes), or pursue a combination of these methods.
180
Conflict of Interest Policies
We have adopted certain policies designed to eliminate or minimize certain potential conflicts of interest. Specifically, our Code of Ethics and Business Conduct prohibits our officers, directors, and employees from improperly placing their personal interests before the interests of our company. However, we cannot assure you these policies or similar provisions of law will always succeed in eliminating the influence of such conflicts. If they are not successful, decisions could be made that might fail to reflect fully the interests of stockholders. Our Nominating and Corporate Governance Committee is responsible for reviewing any related party transactions and procedures for evaluating and approving such transactions, in accordance with the MGCL.
The following information reflects the current acquisition allocation policy among us, SST VI, SSGT III and any other future programs sponsored by SmartStop REIT Advisors, LLC, or SRA, our indirect subsidiary.
In the event that an investment opportunity becomes available, SRA will first allocate such investment opportunity to us (through our management team). For portfolios of properties with an aggregate purchase price of $250 million or more, SRA will present the opportunity for consideration by our Board. If we decline or fail to take action with respect to the investment opportunity, SRA will allocate such investment opportunity to another program sponsored by SRA based on the following factors:
| | • | | the investment objectives of each program; |
| | • | | the amount of funds available to each program; |
| | • | | the financial and investment characteristics of each program, including investment size, potential leverage, transaction structure and anticipated cash flows; |
| | • | | the strategic location of the investment in relationship to existing properties owned by each program; |
| | • | | the effect of the investment on the diversification of each program’s investments; and |
| | • | | the impact of the financial metrics of the investment on each program. |
If, after consideration of the foregoing factors, SRA determines that an investment opportunity is suitable for two or more entities sponsored by SRA, then SRA will allocate such investment opportunity among the entities in its sole and absolute discretion. Any amendments to our acquisition allocation policy requires approval of our Nominating and Corporate Governance Committee.
However, we cannot assure you these policies or similar provisions of law will always succeed in eliminating the influence of such conflicts. If they are not successful, decisions could be made that might fail to reflect fully the interests of all stockholders.
Policies with Respect to Other Activities
We have authority to offer common stock, preferred stock, options to purchase stock, or other securities in exchange for property, and to repurchase or otherwise acquire our common stock or other securities in the open market or otherwise, and we may engage in such activities in the future. Our Board has no present intention of causing us to repurchase any common stock, although we may do so in the future. We may issue preferred stock from time to time, in one or more series, as authorized by our Board without the need for stockholder approval. See “Description of Capital Stock.” We have not engaged in trading, underwriting, or agency distribution or sale of securities of other issuers and do not intend to do so. At all times, we intend to make investments in such a manner as to qualify as a REIT, unless because of circumstances or changes in the Code or the applicable Treasury Regulations our Board determines that it is no longer in our best interest to qualify as a REIT. We may make loans to third parties or our Managed REITs, including, without limitation, to joint ventures in which we participate. We intend to make our real estate and other investments in such a way that we will not be treated as an investment company under the Investment Company Act of 1940, as amended.
181
OUR OPERATING PARTNERSHIP AGREEMENT
A summary of the material terms and provisions of the operating partnership agreement is set forth below. This summary is not complete and is subject to and qualified in its entirety by reference to the applicable provisions of Delaware law and the operating partnership agreement. For more detail, please refer to the operating partnership agreement itself, a copy of which is filed as an exhibit to the registration statement of which this prospectus is a part. For purposes of this section, references to “we,” “our” and “us” refer to SmartStop.
General
SmartStop OP, L.P., our operating partnership, was formed in January 2013 to acquire, own and operate properties on our behalf. We hold substantially all of our assets through our operating partnership or in single purpose entity subsidiaries of our operating partnership. We are the sole general partner of our operating partnership, and we control our operating partnership. This structure is commonly known as an Umbrella Partnership Real Estate Investment Trust, or UPREIT, which structure is utilized generally to provide for the acquisition of real property from owners who desire to defer taxable gain that would otherwise be recognized by them upon the disposition of their property.
A property owner may contribute property to our operating partnership in exchange for OP units on a tax-free basis. In addition, our operating partnership is structured to make distributions with respect to OP units that will be equivalent to the distributions made to holders of our common stock. Finally, a limited partner in our operating partnership may later exchange his or her OP units for shares of our common stock in a taxable transaction.
The Third Amended and Restated Limited Partnership Agreement of our operating partnership, as amended, or our operating partnership agreement, contains provisions that would allow, under certain circumstances, other persons to merge into or cause the exchange or conversion of their interests for interests of our operating partnership. In the event of such a merger, exchange or conversion, our operating partnership would issue additional limited partnership interests, which would be entitled to the same exchange rights as other limited partnership interests of our operating partnership. As a result, any such merger, exchange or conversion ultimately could result in the issuance of a substantial number of shares of our common stock, thereby diluting the percentage ownership interest of other stockholders.
After giving effect to this offering, we will own or control approximately % of the OP units and our executive officers will own or control approximately % of the OP units (exclusive of unvested time- based and performance-based LTIP units). As the sole general partner of our operating partnership, we have the exclusive power to manage and conduct the business of our operating partnership.
Class A-1 Units
On June 28, 2019, in connection with the self administration transaction, our operating partnership issued 8,698,956 Class A-1 limited partnership units of our operating partnership, or the Class A-1 Units, and 3,283,302 Class A-2 limited partnership units of our operating partnership, or the Class A-2 Units. The Class A-1 Units are entitled to all rights and duties of the Class A limited partnership units in our operating partnership, including cash distributions and the allocation of any profits or losses in our operating partnership. The Class A-2 Units were convertible into Class A-1 Units as earn-out consideration, in connection with the self administration transaction. The Class A-2 Units were not entitled to cash distributions or the allocation of any profits or losses in our operating partnership until the Class A-2 Units were converted into Class A-1 Units.
On October 19, 2021, the Nominating and Corporate Governance Committee of our Board and our Board approved resolutions providing that the denominator in the calculation of the earn-out exchange ratio would be $10.66 (the value of the Class A common stock at the time of the self administration transaction, pursuant to
182
which the earn-out was established) for the next 12 months, until October 19, 2022. Thereafter, the denominator in the calculation of the earn-out exchange ratio would be as provided in our operating partnership agreement. On March 29, 2022, 1,094,434 Class A-2 Units were converted into 1,094,434 Class A-1 Units pursuant to the achievement of the second tier of earn-out consideration. On August 9, 2022, the final 1,094,434 Class A-2 Units were converted into 1,094,434 Class A-1 Units pursuant to the achievement of the third tier of earn-out consideration.
Operating Partnership Consent for Certain REIT Matters
In the event that we submit an Extraordinary Matter for a vote of our stockholders, we have agreed that the consent of our operating partnership will be required. Such consent will be determined by a vote of the partners of our operating partnership, and we have agreed that our vote on such consent will be voted in proportion to the votes cast by our stockholders on the Extraordinary Matter. The term “Extraordinary Matter” for purposes of this consent means any merger, sale of all or substantially all of our assets, share exchange, conversion, dissolution or charter amendment, in each case where the vote of our stockholders is required under Maryland law.
Additional Limited Partners
We are authorized to cause our operating partnership to issue such additional partnership interests in the form of limited partnership units for any partnership purpose at any time or from time to time, to the partners (including us as the general partner) or to other persons for such consideration and on such terms and conditions as shall be established by us in our sole and absolute discretion, all without the approval of any limited partner. Any additional partnership interests issued thereby may be issued in one or more classes, or one or more series of any of such classes, with such designations, preferences and relative, participating, optional or other special rights, powers and duties, including rights, powers and duties senior to any common units, all as shall be determined by us in our sole and absolute discretion and without the approval of any limited partner, subject to Delaware law, including, without limitation: (i) the allocations of items of partnership income, gain, loss, deduction and credit to each such class or series of partnership interests; (ii) the right of each such class or series of partnership interests to share in partnership distributions; and (iii) the rights of each such class or series of partnership interests upon dissolution and liquidation of our operating partnership. In addition, we are authorized to cause our operating partnership to issue partnership interests for less than fair market value if we conclude in good faith that such issuance is in the best interests of our operating partnership and us.
Operations
Our operating partnership agreement requires that our operating partnership be operated in a manner that will enable us to (i) satisfy the requirements for being classified as a REIT for tax purposes, (ii) avoid any federal income or excise tax liability, and (iii) ensure that our operating partnership will not be classified as a “publicly traded partnership” for purposes of Section 7704 of the Code, which classification could result in our operating partnership being taxed as a corporation, rather than as a partnership. See “Federal Income Tax Considerations—Tax Aspects of Our Ownership of Interests in Entities Taxable as Partnerships—Classification as Partnerships.”
Distributions and Allocations of Profits and Losses
Our operating partnership agreement provides that our operating partnership will distribute cash flow from operations to its partners in accordance with their relative percentage interests on at least a quarterly basis in amounts we, as general partner, determine. The effect of these distributions will be that a holder of one unit of limited partnership interest in our operating partnership will receive the same amount of annual cash flow distributions as the amount of annual distributions made to the holder of one of our shares.
Similarly, our operating partnership agreement provides that profits and taxable income are allocated to the partners of our operating partnership in accordance with their relative percentage interests. Subject to compliance with the provisions of Sections 704(b) and 704(c) of the Code and corresponding Treasury Regulations, the effect
183
of these allocations will be that a holder of one unit of limited partnership interest in our operating partnership will be allocated, to the extent possible, taxable income for each taxable year in an amount equal to the amount of taxable income to be recognized by a holder of one of our shares. Losses, if any, will generally be allocated among the partners in accordance with their respective percentage interests in our operating partnership.
If our operating partnership liquidates, debts and other obligations must be satisfied before the partners may receive any distributions. Any distributions to partners then will be made to partners in accordance with their respective positive capital account balances. If we were to have a negative balance in our capital account following a liquidation, we would be obligated to contribute cash to our operating partnership equal to such negative balance for distribution to other partners, if any, having positive balances in such capital accounts.
Rights, Obligations and Powers of the General Partner
As our operating partnership’s general partner, we generally have complete and exclusive discretion to manage and control our operating partnership’s business and to make all decisions affecting its assets. This authority generally includes, among other things, the authority to:
| | • | | acquire, purchase, own, operate, lease and dispose of any real property and any other property; |
| | • | | construct buildings and make other improvements on owned or leased properties; |
| | • | | authorize, issue, sell, redeem or otherwise purchase any debt or other securities; |
| | • | | make or revoke any tax election; |
| | • | | maintain insurance coverage in amounts and types as we determine is necessary; |
| | • | | retain employees or other service providers; |
| | • | | form or acquire interests in joint ventures; and |
| | • | | merge, consolidate or combine our operating partnership with another entity. |
In addition to the administrative and operating costs and expenses incurred by our operating partnership in acquiring and operating real properties, our operating partnership pays or causes our advisor or property manager to be reimbursed for all of our administrative and operating costs and expenses, and such expenses are treated as expenses of our operating partnership. Such expenses include:
| | • | | all expenses relating to the formation and continuity of our existence; |
| | • | | all expenses relating to any offering and registration of securities by us; |
| | • | | all expenses associated with the preparation and filing of any periodic reports by us under federal, state or local laws or regulations; |
| | • | | all expenses associated with compliance by us with applicable laws, rules and regulations; |
| | • | | all costs and expenses relating to any issuance or redemption of partnership interests; and |
| | • | | all of our other operating or administrative costs incurred in the ordinary course of our business on behalf of the operating partnership. |
Exchange Rights
The limited partners of our operating partnership have the right to cause their OP units to be redeemed by our operating partnership or purchased by us for cash. In either event, the cash amount to be paid will be equal to the cash value of the number of our shares that would be issuable if the OP units were exchanged for our shares based on the conversion ratio set forth in our operating partnership agreement. Alternatively, we may elect to
184
purchase the OP units by issuing shares of our common stock for OP units exchanged based on the conversion ratio set forth in our operating partnership agreement. The conversion ratio is initially one to one, but is adjusted based on certain events including: (i) if we declare or pay a distribution in shares on our outstanding shares, (ii) if we subdivide our outstanding shares, or (iii) if we combine our outstanding shares into a smaller number of shares. These exchange rights may not be exercised, however, if and to the extent that the delivery of shares upon exercise would (1) result in any person owning shares in excess of our ownership limits, (2) result in shares being owned by fewer than 100 persons (determined without reference to any rules of attribution), (3) cause us to be “closely held” within the meaning of Section 856(h) of the Code, or (4) cause us to own 9.9% or more of the ownership interests in a tenant within the meaning of Section 856(d)(2)(B) of the Code.
Subject to the foregoing, limited partners of our operating partnership may exercise their exchange rights at any time after one year following the date of issuance of their OP units. However, a limited partner may not deliver more than two exchange notices each calendar year and may not exercise an exchange right for less than 1,000 OP units, unless such limited partner holds less than 1,000 OP units, in which case, it must exercise his exchange right for all of its OP units. We do not expect to issue any of the shares of common stock offered hereby to limited partners of the operating partnership in exchange for their OP units. Rather, in the event a limited partner of our operating partnership exercises its exchange rights, and we elect to purchase the OP units with shares of our common stock, we expect to issue unregistered shares of common stock, or subsequently registered shares of common stock, in connection with such transaction.
Amendments to Our Operating Partnership Agreement
Our consent, as the general partner of our operating partnership, is required for any amendment to our operating partnership agreement. We, as the general partner of our operating partnership, and without the consent of any limited partner, may amend our operating partnership agreement in any manner, provided, however, that the consent of partners holding more than 50% of the partnership interests (other than partnership interests held by us, our advisor and other affiliates of our sponsor) is required for the following:
| | • | | any amendment affecting the conversion factor or the exchange right in a manner adverse to the limited partners; |
| | • | | any amendment that would adversely affect the rights of the limited partners to receive the distributions payable to them pursuant to our operating partnership agreement (other than the issuance of additional limited partnership interests); |
| | • | | any amendment that would alter the allocations of our operating partnership’s profit and loss to the limited partners (other than the issuance of additional limited partnership interests); and |
| | • | | any amendment that would impose on the limited partners any obligation to make additional capital contributions to our operating partnership. |
Termination of Our Operating Partnership
Our operating partnership will have perpetual duration, unless it is dissolved earlier upon the first to occur of the following:
| | • | | we file a petition for bankruptcy or withdraw from the partnership, provided, however, that the remaining partners may decide to continue the business; |
| | • | | 90 days after the sale or other disposition of all or substantially all of the assets of the partnership; |
| | • | | the exchange of all limited partnership interests (other than such interests we, or our affiliates, hold) for our common stock or the securities of any other entity; or |
| | • | | we elect, as the general partner, to dissolve our operating partnership. |
185
Transferability of Interests
We may not (1) voluntarily withdraw as the general partner of our operating partnership, (2) engage in any merger, consolidation or other business combination, or (3) transfer our general partnership interest in our operating partnership (except to a wholly-owned subsidiary), unless the transaction in which such withdrawal, business combination or transfer occurs results in the limited partners receiving or having the right to receive an amount of cash, securities or other property equal in value to the amount they would have received if they had exercised their exchange rights immediately prior to such transaction or unless, in the case of a merger or other business combination, the successor entity contributes substantially all of its assets to our operating partnership in return for an interest in our operating partnership and agrees to assume all obligations of the general partner of our operating partnership. We may also enter into any merger, consolidation or other business combination upon the receipt of the consent of partners holding more than 50% of the partnership interests, including partnership interests held by us, our advisor and other affiliates of our sponsor. If we voluntarily seek protection under bankruptcy or state insolvency laws, or if we are involuntarily placed under such protection for more than 90 days, we would be deemed to be automatically removed as the general partner. Otherwise, the limited partners have no right to remove us as general partner. With certain exceptions, a limited partner may not transfer its interests in our operating partnership, in whole or in part, without our written consent as general partner.
186
DESCRIPTION OF CAPITAL STOCK
The following is a summary of the general terms of our capital stock as in effect upon completion of this offering. You should read our charter and bylaws and the applicable provisions of Maryland law for complete information on our capital stock. The following summary is not complete and is subject to, and qualified in its entirety by reference to, the provisions of our charter and bylaws, as they will be in effect upon completion of this offering, which are filed as exhibits to the registration statement of which this prospectus is a part, and the applicable provisions of the Maryland General Corporation Law, or the MGCL. See “Where You Can Find More Information.”
General
Our charter authorizes us to issue up to 900,000,000 shares of stock, of which 700,000,000 shares are designated as common stock at $0.001 par value per share and 200,000,000 shares are designated as preferred stock at $0.001 par value per share. Of the 700,000,000 shares of common stock authorized, shares are classified as Class A common stock, shares are classified as Class T common stock, and shares are unclassified common stock. Of the 200,000,000 shares of preferred stock authorized, 200,000 shares are classified and designated as Series A Preferred Stock. Our Board, with the approval of a majority of the entire Board and without any action by our stockholders, may amend our charter from time to time to increase or decrease the aggregate number of authorized shares of stock or the number of shares of stock of any class or series that we have authority to issue. Our charter also contains a provision permitting our Board, with the approval of a majority of the Board and without any action by our stockholders, to classify or reclassify any unissued common stock or preferred stock into one or more classes or series by setting or changing the preferences, conversion or other rights, voting powers, restrictions, limitations as to dividends or other distributions, qualifications, or terms or conditions of redemption of any new class or series of stock, subject to certain restrictions, including the express terms of any class or series of stock outstanding at the time.
Upon completion of this offering, shares of our common stock, shares of our Class A common stock, shares of our Class T common stock, and no shares of our preferred stock will be issued and outstanding. As described in the “Use of Proceeds” section of this prospectus, we, through our operating partnership, intend to use a portion of the net proceeds from this offering to redeem 100% of the issued and outstanding shares of Series A Preferred Stock.
Under Maryland law, our stockholders generally are not liable for our debts or obligations solely as a result of the stockholder’s status as a stockholder.
Common Stock
All of the shares of common stock offered by this prospectus will, upon issuance, be duly authorized, fully paid and nonassessable. Subject to any preferential rights of any other class or series of stock and to the provisions of our charter regarding the restriction on the transfer of common stock, the holders of common stock are entitled to such distributions as may be authorized from time to time by our Board out of legally available funds and declared by us and, upon our liquidation, are entitled to receive all assets available for distribution to our stockholders, and will be entitled to share ratably in our assets legally available for distribution to our stockholders in the event of our liquidation, dissolution or winding up, after payment of or adequate provision for all of our known debts and liabilities. Holders of common stock will not have preemptive rights, which means that they will not have an automatic option to purchase any new shares that we issue, or preference, conversion, exchange, cumulative, sinking fund, redemption or appraisal rights (unless, in the case of appraisal rights, our Board, upon such terms and conditions as may be specified by our Board, determines that appraisal rights apply, with respect to all or any classes or series of stock, to one or more transactions occurring after the date of such determination in connection with which holders of such stock would otherwise be entitled to exercise appraisal rights).
187
Subject to our charter restrictions on transfer of our stock, and except as may otherwise be specified in our charter, each holder of common stock is entitled at each meeting of stockholders to one vote per share owned by such stockholder on all matters submitted to a vote of stockholders, including the election of directors. There is no cumulative voting in the election of our Board, which means that the holders of a majority of shares of our outstanding common stock can elect all of the directors then standing for election and the holders of the remaining shares of common stock will not be able to elect any directors. In uncontested elections, directors are elected by the affirmative vote of a majority of all the votes cast “for” and “against” each director nominee. In contested elections, a plurality of all votes cast at a meeting of stockholders duly called and at which a quorum is present is sufficient to elect a director. See “Certain Provisions of Maryland Law and of Our Charter and Bylaws—Election and Removal of Directors; Board of Directors.”
Under Maryland law, a Maryland corporation generally cannot dissolve, amend its charter, merge, convert, sell all or substantially all of its assets, engage in a share exchange or engage in similar transactions outside the ordinary course of business, unless approved by the affirmative vote of stockholders entitled to cast at least two-thirds of the votes entitled to be cast on the matter. However, a Maryland corporation may provide in its charter for approval of these matters by a lesser percentage, but not less than a majority of all of the votes entitled to be cast on the matter. Our charter provides for approval of these matters by the affirmative vote of a majority of the votes entitled to be cast.
However, under the MGCL and our charter, the following events do not require stockholder approval:
| | • | | stock exchanges in which we are the successor; |
| | • | | mergers with or into a 90% or more owned subsidiary, provided that the charter of the successor is not amended and that the contract rights of any stock issued in the merger are identical to those of the stock that was exchanged; |
| | • | | mergers in which we do not: |
| | • | | reclassify or change the terms of any stock that is outstanding immediately before the effective time of the merger; |
| | • | | result in the issuance of more than 20% of the number of shares of any class or series of stock outstanding immediately before the merger; and |
| | • | | transfers of less than substantially all of our assets. |
Also, our operating assets are held by our subsidiaries and these subsidiaries may be able to merge or sell all or substantially all of their assets without the approval of our stockholders; provided, however, the merger or sale of all or substantially all of the operating assets held by our operating partnership will require the approval of our stockholders. In addition, in the event that we seek to engage in an extraordinary transaction requiring the vote of our stockholders, the consent of our operating partnership will be required. Such consent by our operating partnership will be determined by a vote of the holders of OP units, with us voting our OP units in proportion to the votes cast by our stockholders on the extraordinary transaction.
Class A Common Stock and Class T Common Stock
Except as described below, shares of our Class A common stock and shares of our Class T common stock will have identical preferences, rights, voting powers, restrictions, limitations as to dividends and other distributions, qualifications, and terms and conditions of redemption as all other shares of our common stock.
Upon the six-month anniversary of the listing of our common stock for trading on a national securities exchange or such earlier date as approved by our Board, each share of Class A common stock and share of
188
Class T common stock will automatically, and without any stockholder action, convert into one share of listed common stock. We have agreed that, without the prior written consent of the representatives on behalf of the underwriters, we will not approve the conversion of any of the outstanding shares of Class A common stock and shares of Class T common stock into shares of our common stock before the six-month anniversary of the listing of our common stock for trading on a national securities exchange.
There will be no public market for shares of our Class A common stock and shares of our Class T common stock. Until shares of our Class A common stock and shares of our Class T common stock convert into listed common stock and become listed on a national securities exchange, they cannot be traded on a national securities exchange. As a result, holders of shares of our Class A common stock and shares of our Class T common stock will have very limited, if any, liquidity options with respect to their shares of Class A common stock and shares of Class T common stock until such conversion.
Preferred Stock
Our charter authorizes our Board to designate and issue one or more classes or series of preferred stock without stockholder approval and to fix the voting rights, liquidation preferences, distribution rates, conversion rights, redemption rights and terms, including sinking fund provisions, and certain other rights and preferences with respect to such preferred stock. Because our Board has the power to establish the preferences and rights of each class or series of preferred stock, it may afford the holders of any series or class of preferred stock preferences, powers, and rights senior to the rights of holders of common stock.
If we issue additional preferred stock with a distribution preference over common stock, payment of any distribution preferences of outstanding preferred stock would further reduce the amount of funds available for the payment of distributions on the common stock. Further, holders of preferred stock are normally entitled (and holders of the Series A Preferred Stock are entitled, as described below) to receive a preference payment in the event we liquidate, dissolve, or wind up before any payment is made to the common stockholders, likely reducing the amount common stockholders would otherwise receive upon such an occurrence.
Series A Convertible Preferred Stock
We have issued Series A Preferred Stock that ranks senior to all other shares of our capital stock with respect to rights to receive dividends and to participate in distributions or payments upon our voluntary or involuntary liquidation, dissolution or winding up. As noted above, we, through our operating partnership, intend to use a portion of the net proceeds from this offering to redeem 100% of the issued and outstanding shares of Series A Preferred Stock.
Conversion Upon Listing
Our charter provides that, upon the listing of shares of common stock for trading on a national securities exchange, each share of the class or classes of common stock that are not so listed will automatically and without any action on the part of the holder thereof convert into a number of shares of common stock that are listed equal to a fraction, the numerator of which is the net asset value allocable to the shares of the applicable non-listed class of common stock and the denominator of which is the net asset value allocable to the shares of common stock that are listed.
Restrictions on Ownership and Transfer
In order for us to qualify as a REIT under the Code, we must meet the following criteria regarding our stockholders’ ownership of our stock:
| | • | | five or fewer individuals (as defined in the Code to include certain tax-exempt organizations and trusts) may not own, directly or indirectly, more than 50% in value of our outstanding stock during the last half of a taxable year; and |
189
| | • | | 100 or more persons must beneficially own our stock during at least 335 days of a taxable year of 12 months or during a proportionate part of a shorter taxable year. |
We may prohibit certain acquisitions and transfers of shares of stock so as to ensure our initial and continued qualification as a REIT under the Code. However, we cannot assure stockholders that this prohibition will be effective. Our charter provides (subject to certain exceptions) that no person may own, or be deemed to own by virtue of the attribution provisions of the Code, more than 9.8% in value of the outstanding shares of our stock or more than 9.8% of the number or value (whichever is more restrictive) of the outstanding shares of our common stock. For those purposes, our charter includes a “group” as that term is used for purposes of Section 13(d)(3) of the Exchange Act in the definition of “person.”
Our Board, in its sole discretion, may waive this ownership limit (prospectively or retroactively) if evidence satisfactory to our Board, including certain representations and undertakings required by our charter, is presented that such ownership will not then or in the future jeopardize our status as a REIT. Also, these restrictions on transferability and ownership will not apply if our directors determine that it is no longer in our best interests to continue to qualify as a REIT or that compliance is no longer required in order for us to qualify as a REIT.
Additionally, our charter further prohibits the transfer or issuance of our stock if such transfer or issuance:
| | • | | with respect to transfers only, results in our stock being beneficially owned by fewer than 100 persons; |
| | • | | results in our being “closely held” within the meaning of Section 856(h) of the Code; |
| | • | | results in our owning, directly or indirectly, more than 9.9% of the ownership interests in any tenant; or |
| | • | | otherwise results in our disqualification as a REIT. |
Any attempted transfer of our stock which, if effective, would result in our stock being beneficially owned by fewer than 100 persons will be null and void. In the event of any attempted transfer of our stock which, if effective, would result in (1) violation of the ownership limit discussed above, (2) in our being “closely held” under Section 856(h) of the Code, (3) our owning (directly or indirectly) more than 9.9% of the ownership interests in any tenant, or (4) our otherwise failing to qualify as a REIT, then the number of shares causing the violation (rounded to the nearest whole share) will be automatically transferred to one or more trusts for the exclusive benefit of one or more charitable beneficiaries, and the proposed transferee will not acquire any rights in the shares. The automatic transfer will be deemed to be effective as of the close of business on the business day prior to the date of the transfer. Shares held in trust will remain issued and outstanding shares. The proposed transferee will not benefit economically from ownership of any shares of stock held in the trust, will have no rights to dividends and no rights to vote or other rights attributable to the shares of stock held in the trust. The trustee of the trust will have all voting rights and rights to dividends or other distributions with respect to shares held in the trust. These rights will be exercised for the exclusive benefit of the charitable beneficiaries. Any dividend or other distribution paid prior to our discovery that shares of stock have been transferred to the trust will be paid by the recipient to the trustee upon demand. Any dividend or other distribution authorized but unpaid will be paid when due to the trustee. Any dividend or distribution paid to the trustee will be held in trust for the charitable beneficiaries. Subject to Maryland law, the trustee will have the authority to rescind as void any vote cast by the proposed transferee prior to our discovery that the shares have been transferred to the trust and to recast the vote in accordance with the desires of the trustee acting for the benefit of the charitable beneficiaries. However, if we have already taken irreversible corporate action, then the trustee will not have the authority to rescind and recast the vote.
Within 20 days of receiving notice from us that shares of stock have been transferred to the trust, the trustee of the beneficial trust will sell the shares to a person designated by the trustee, whose ownership of the shares will not violate the 9.8% ownership limit or the other restrictions on transfer. Upon sale of the shares held in trust, the interest of the charitable beneficiaries in the shares sold will terminate and the trustee will distribute the net proceeds of the sale to the intended transferee (the transferee of the shares held in trust whose ownership
190
would violate the 9.8% ownership limit or the other restrictions on transfer) as follows. The intended transferee will receive the lesser of (1) the price paid by the intended transferee for the shares or, if the intended transferee did not give value for the shares in connection with the event causing the shares to be held in the trust, such as a gift, devise or other similar transaction, the market price, as defined in our charter, of the shares on the day of the event causing the shares to be held in the trust and (2) the price per share received by the trustee from the sale or other disposition of the shares. The trustee may reduce the amount payable to the intended transferee by the amount of dividends and other distributions which have been paid to the intended transferee and are owed by the intended transferee to the trustee. Any net sale proceeds in excess of the amount payable per share to the intended transferee will be paid immediately to the charitable beneficiaries. If, prior to our discovery that shares of stock have been transferred to the trust, the shares are sold by the intended transferee, then the shares will be deemed to have been sold on behalf of the trust and, to the extent that the intended transferee received an amount for the shares that exceeds the amount such intended transferee was entitled to receive, the excess will be paid to the trustee upon demand.
In addition, shares of stock held in the trust will be deemed to have been offered for sale to us, or our designee, at a price per share equal to the lesser of (1) the price per share paid in the transfer that created the shares held in trust or, in the case of a devise or gift, the market price at the time of the devise or gift, or (2) the market price on the date we, or our designee, accepts the offer. We will have the right to accept the offer until the shares held in trust are sold by the trustee of the beneficial trust. Upon a sale to us, the interest of the charitable beneficiaries in the shares sold will terminate and the trustee will distribute the net proceeds of the sale to the intended transferee. We may reduce the amount payable to the intended transferee by the amount of dividends and other distributions which have been paid to the intended transferee and are owed by the intended transferee to the trustee. We may pay the amount of such reduction to the trustee for the benefit of the charitable beneficiaries.
If the transfer to the trust as described above is not automatically effective for any reason to prevent violation of the above limitations or our failing to qualify as a REIT, then the transfer of the number of shares that otherwise cause any person to violate the above limitations will be null and void and the intended transferee will acquire no rights in such shares.
Any person who acquires or attempts to acquire shares of our stock in violation of the foregoing limitations or would have owned shares that resulted in a transfer to a charitable trust must immediately give notice to us of such event or, in the case of a proposed or attempted transaction, give at least 15 days’ prior written notice to us. In both cases, such persons must provide to us such other information as we may request in order to determine the effect, if any, of such transfer on our status as a REIT. The foregoing restrictions will continue to apply until our Board determines it is no longer in our best interest to continue to qualify as a REIT or that compliance is no longer required for REIT qualification.
The ownership restriction does not apply to the underwriters in this offering, or to any underwriter in any public offering of our shares, or to a person or persons exempted (prospectively or retroactively) from the ownership limit by our Board based upon appropriate assurances that our qualification as a REIT is not jeopardized. Any person who owns 5% or more of the outstanding shares of our stock during any taxable year will be asked to deliver a statement or affidavit setting forth the number of shares beneficially owned, directly or indirectly.
Listing
We intend to apply to list shares of our common stock on the NYSE under the symbol “SMA.”
Transfer Agent and Registrar
Upon completion of this offering, the transfer agent and registrar for shares of our common stock will be SS&C GIDS, Inc.
191
MARKET PRICE OF AND DIVIDENDS ON THE REGISTRANT’S COMMON EQUITY AND RELATED STOCKHOLDER MATTERS
Market Information
As of , 2024, we had approximately shares of Class A common stock and shares of Class T common stock issued and outstanding, held by a total of stockholders of record. The number of stockholders is based on the records of our Transfer Agent. None of our shares of Class A common stock or shares of Class T common stock is currently traded on an exchange, and there is no established trading market for our shares of Class A common stock or shares of Class T common stock.
Therefore, there is a risk that a stockholder may not be able to sell shares of our stock at a time or price acceptable to the stockholder or at all. As of December 31, 2023, we only offered shares of our Class A common stock and shares of our Class T common stock pursuant to our distribution reinvestment plan, both of which were offered at a price of $15.21 per share. Pursuant to the terms of our charter, certain restrictions are imposed on the ownership and transfer of shares. On March 7, 2022, our Board approved the suspension of our distribution reinvestment plan and share redemption program such that distributions for the month of March 2022, which were paid on April 15, 2022, were paid in cash. However, on March 16, 2023, the distribution reinvestment plan was fully reinstated and the share redemption program was partially reinstated to allow for redemptions solely sought in connection with a stockholder’s death, “qualifying disability” (as that term is defined in the share redemption program), confinement to a long-term care facility, or other exigent circumstances. See Note 12 – Commitments and Contingencies, of the notes to our consolidated financial statements for the nine months ended September 30, 2024, and Note 12 – Commitments and Contingencies of the notes to our consolidated financial statements for the year ended December 31, 2023, each included elsewhere in this prospectus for more information. On November 25, 2024, in anticipation of this offering, our Board approved the full suspension of (i) our distribution reinvestment plan, such that distributions for the month of November 2024, which would ordinarily be paid in December 2024, will be paid in cash, and (ii) our share redemption program, effective immediately.
Determination of Estimated Per Share Net Asset Value
On January 15, 2024, our Board, at the recommendation of our Nominating and Corporate Governance Committee, unanimously approved and established our estimated net asset value per share, or Estimated Per Share NAV. The Estimated Per Share NAV is based on the estimated value of our assets less the estimated value of our liabilities, divided by the number of shares outstanding on a fully diluted basis, calculated as of September 30, 2023. We provided this Estimated Per Share NAV to assist broker-dealers in connection with their obligations under FINRA Rule 2231 with respect to customer account statements. This valuation was performed in accordance with the provisions of the Institute for Portfolio Alternatives Practice Guideline 2013-01, Valuations of Publicly Registered Non-Listed REITs, issued in April 2013, or the IPA Valuation Guidelines.
The Nominating and Corporate Governance Committee, which is composed solely of independent directors, was responsible for the oversight of the valuation process, including the review and approval of the valuation process and methodology used to determine the Estimated Per Share NAV, the consistency of the valuation and appraisal methodologies with real estate industry standards and practices, and the reasonableness of the assumptions used in the valuations and appraisals.
The Estimated Per Share NAV was determined after consultation with our management and Robert A. Stanger & Co, Inc., or Stanger, an independent third-party valuation firm. The engagement of Stanger was approved by the Nominating and Corporate Governance Committee. Stanger prepared an appraisal report, which we refer to as the Stanger Appraisal Report, summarizing key information and assumptions and providing an appraised value range on 156 wholly-owned properties and eight properties held in unconsolidated joint ventures, or the Stanger Appraised Properties, in our portfolio as of September 30, 2023. Stanger also prepared a net asset value report, or the Stanger NAV Report, which estimates the net asset value range per share of each of our shares of Class A common stock and Class T common stock as of September 30, 2023. The Stanger NAV Report
192
relied upon: (i) the Stanger Appraisal Report for the Stanger Appraised Properties; (ii) Stanger’s estimated value range of the Managed REIT platform; (iii) Stanger’s estimated fair market value of our secured mortgage debt and other debt outstanding; (iv) Stanger’s estimated value range of our unconsolidated joint ventures and (v) our estimate of the value of our cash, other assets, and liabilities, to calculate an estimated net asset value range per share of our common stock. The process for estimating the value of our assets and liabilities was performed in accordance with the provisions of the IPA Valuation Guidelines.
After considering all information provided, including the Nominating and Corporate Governance Committee’s receipt and review of the Stanger Appraisal Report and the Stanger NAV Report, collectively, the Reports, and based on the Nominating and Corporate Governance Committee’s extensive knowledge of our assets and liabilities, the Nominating and Corporate Governance Committee concluded that the range in estimated value per share of $14.14 to $16.46, with a mid-point estimated value per share of $15.25, as indicated in the Stanger NAV Report was reasonable and recommended to the Board that it adopt $15.25 as the Estimated Per Share NAV for our shares of Class A common stock and Class T common stock as of September 30, 2023.
The table below sets forth the calculation of our Estimated Per Share NAV as of September 30, 2023 and our previous estimated value per share as of September 30, 2022 (amounts in thousands, except share and per share data).
| | | | | | | | |
| | | 9/30/2023 | | | 9/30/2022 | |
Assets | | | | | | | | |
Real Estate Properties | | $ | 2,726,669 | | | $ | 2,713,719 | |
Additional Assets: | | | | | | | | |
Cash | | | 34,239 | | | | 41,194 | |
Restricted Cash | | | 9,573 | | | | 8,673 | |
Investments in Unconsolidated Joint Ventures | | | 77,773 | | | | 53,382 | |
Other Assets | | | 53,381 | | | | 68,192 | |
Managed REIT Platform | | | 146,800 | | | | 124,780 | |
| | | | | | | | |
Total Assets | | $ | 3,048,435 | | | $ | 3,009,940 | |
| | | | | | | | |
Liabilities | | | | | | | | |
Debt | | $ | 1,059,001 | | | $ | 1,043,439 | |
Mark-to-Market Adjustment on Debt | | | (38,510 | ) | | | (37,005 | ) |
Accounts Payable and Accrued Liabilities | | | 40,711 | | | | 29,982 | |
Due to Affiliates | | | 84 | | | | 410 | |
Distributions Payable | | | 8,928 | | | | 9,089 | |
| | | | | | | | |
Total Liabilities | | $ | 1,070,214 | | | $ | 1,045,915 | |
| | | | | | | | |
Net Asset Value | | | 1,978,221 | | | | 1,964,025 | |
Preferred Equity(1) | | | 0 | | | | 0 | |
| | | | | | | | |
Net Asset Value to Common | | $ | 1,978,221 | | | $ | 1,964,025 | |
Net Asset Value for Class A Shares | | $ | 1,854,366 | | | $ | 1,841,027 | |
Number of Class A Shares Outstanding (1)(2) | | | 121,589,335 | | | | 121,023,898 | |
Estimated Value Per Class A Share | | $ | 15.25 | | | $ | 15.21 | |
| | | | | | | | |
Net Asset Value for Class T Shares | | $ | 123,854 | | | $ | 122,998 | |
Number of Class T Shares Outstanding | | | 8,121,031 | | | | 8,085,550 | |
Estimated Value Per Class T Share | | $ | 15.25 | | | $ | 15.21 | |
| | | | | | | | |
| (1) | | The outstanding shares of our Series A Preferred Stock are convertible into shares of our Class A common stock on or after the second anniversary of the effective date (October 29, 2021) of that certain preferred stock purchase agreement by and between us and Extra Space Storage LP. For purposes of this analysis, Stanger assumed the conversion of the Series A Preferred Stock into shares of our Class A common stock based on the conversion rate, as described in the Articles Supplementary, of $10.66. |
| (2) | | Includes outstanding OP Units and unvested restricted stock and unvested OP Units issued to our directors and management. |
193
Methodology and Key Assumptions
In determining the Estimated Per Share NAV, the Board considered the recommendation of the Nominating and Corporate Governance Committee, the Reports provided by Stanger and information provided by us. Our goal in calculating the Estimated Per Share NAV is to arrive at a value that is reasonable and supportable using what the Nominating and Corporate Governance Committee and the Board each deems to be appropriate valuation methodologies and assumptions.
FINRA’s current rules provide no guidance on the methodology an issuer must use to determine its Estimated Per Share NAV. As with any valuation methodology, the methodologies used are based upon a number of estimates and assumptions that may not be accurate or complete. Different parties with different assumptions and estimates could derive a different Estimated Per Share NAV, and these differences could be significant. The Estimated Per Share NAV is not audited and does not represent the fair value of our assets less our liabilities according to GAAP, nor does it represent a liquidation value of our assets and liabilities or the amount our shares of common stock would trade at on a national securities exchange. The estimated asset values may not, however, represent current market value or book value. The estimated value range of the Stanger Appraised Properties does not necessarily represent the value we would receive or accept if the assets were marketed for sale. The Estimated Per Share NAV does not reflect a real estate portfolio premium or discount compared to the sum of the individual property values. The Estimated Per Share NAV also does not take into account estimated disposition costs and fees for real estate properties that are not held for sale.
Independent Valuation Firm
Stanger was selected by the Nominating and Corporate Governance Committee to appraise and provide a value on the 164 Stanger Appraised Properties. Stanger is engaged in the business of appraising commercial real estate properties and is not affiliated with us. The compensation we paid to Stanger related to the valuation is based on the scope of work and not on the appraised values of our real estate properties. The appraisals were performed in accordance with the Code of Ethics and the Uniform Standards of Professional Appraisal Practice, or USPAP, the real estate appraisal industry standards created by The Appraisal Foundation. The Stanger Appraisal Report was reviewed, approved, and signed by an individual with the professional designation of MAI licensed in the state where each real property is located. The use of the reports is subject to the requirements of the Appraisal Institute relating to review by its duly authorized representatives. In preparing its Reports, Stanger did not, and was not requested to, solicit third-party indications of interest for our common stock in connection with possible purchases thereof or the acquisition of all or any part of us.
Stanger collected reasonably available material information that it deemed relevant in appraising our real estate properties. Stanger relied in part on property-level information provided by us, including: (i) historical and projected operating revenues and expenses; (ii) unit mixes; (iii) rent rolls; and (iv) information regarding recent or planned capital expenditures.
In conducting its investigation and analyses, Stanger took into account customary and accepted financial and commercial procedures and considerations as it deemed relevant. Although Stanger reviewed information supplied or otherwise made available by us for reasonableness, Stanger assumed and relied upon the accuracy and completeness of all such information and of all information supplied or otherwise made available to Stanger by any other party and did not independently verify any such information. Stanger has assumed that any operating or financial forecasts and other information and data provided to or otherwise reviewed by or discussed with Stanger were reasonably prepared in good faith on the basis of reflecting the best currently available estimates and judgments of our management and/or the Board. Stanger relied on us to advise it promptly if any information previously provided became inaccurate or was required to be updated during the period of their review.
In performing its analyses, Stanger made numerous assumptions using various points in time with respect to industry performance, general business, economic, and regulatory conditions, and other matters, many of which are beyond its control and our control. Stanger also made assumptions with respect to certain factual matters. For
194
example, unless specifically informed to the contrary, Stanger assumed that we have clear and marketable title to each real estate property appraised, that no title defects exist, that any improvements were made in accordance with law, that no hazardous materials are present or were present previously, that no significant deed restrictions exist, and that no changes to zoning ordinances or regulations governing use, density, or shape are pending or being considered. Furthermore, Stanger’s analyses, opinions, and conclusions were necessarily based upon market, economic, financial, and other circumstances and conditions existing as of or prior to the date of the Stanger Appraisal Report, and any material change in such circumstances and conditions may affect Stanger’s analyses and conclusions. The Stanger Appraisal Report contains other assumptions, qualifications, and limitations that qualify the analyses, opinions, and conclusions set forth therein. Furthermore, the prices at which our real estate properties may actually be sold could differ from Stanger’s analyses.
Stanger is actively engaged in the business of appraising commercial real estate properties similar to those owned by us in connection with public securities offerings, private placements, business combinations, and similar transactions. We do not believe that there are any material conflicts of interest between Stanger, on the one hand, and us and our affiliates, on the other hand. We engaged Stanger, with approval from the Nominating and Corporate Governance Committee, to deliver its Reports to assist in the net asset value calculation and Stanger received compensation for those efforts. In addition, we have agreed to indemnify Stanger against certain liabilities arising out of this engagement. A special committee of the Board previously engaged Stanger to serve as a financial advisor in connection with our acquisition of SSGT, SST IV, SSGT II, and the Managed REIT platform acquired from SAM and Stanger provided fairness opinions in connection with certain of those transactions, for which Stanger was paid usual and customary fees. In addition, Stanger was previously engaged by the Nominating and Corporate Governance Committee and performed a net asset value calculation for us for the periods ended September 30, 2022, June 30, 2021, and December 31, 2019 and was paid usual and customary fees. In 2021, Stanger was also engaged to provide other financial advisory services to us. Finally, in 2019 Stanger served as a financial advisor in the negotiation and closing of the preferred equity investment in us by Extra Space Storage, LP, a subsidiary of Extra Space Storage Inc. Stanger has in the past and may from time to time in the future perform other services for us or the Managed REITs, so long as such other services do not adversely affect the independence of Stanger as certified in the applicable Stanger Appraisal Report.
Although Stanger considered any comments received from us relating to their Reports, the final appraised value ranges of our real estate properties were determined by Stanger for the Stanger Appraised Properties. The Reports are addressed solely to the Nominating and Corporate Governance Committee to assist it in calculating and recommending to the Board an Estimated Per Share NAV of our common stock. The Reports are not addressed to the public, may not be relied upon by any other person to establish an Estimated Per Share NAV of our common stock, and do not constitute a recommendation to any person to purchase or sell any shares of our common stock.
The foregoing is a summary of the standard assumptions, qualifications, and limitations that generally apply to the Reports. The Reports, including the analysis, opinions, and conclusions set forth in such reports, are qualified by the assumptions, qualifications, and limitations set forth in the respective reports.
Real Estate Valuation
As described above, we engaged Stanger to provide an appraisal containing a range of market value of the Stanger Appraised Properties consisting of 156 wholly-owned properties and eight properties held in unconsolidated joint ventures in our portfolio as of September 30, 2023. In preparing the Stanger Appraisal Report, Stanger, among other things:
| | • | | performed a site visit of the Stanger Appraised Properties in the context of this assignment or prior assignments; |
| | • | | interviewed our officers to obtain information relating to the physical condition of each Stanger Appraised Property, including known environmental conditions, status of ongoing or planned property additions and reconfigurations, and other factors for such properties; |
195
| | • | | reviewed historical operating statements, asking rental rates by unit type, achieved rental rates, market rental rates, occupancy for the subject properties and competing properties, current tax information and a review of tax comparable properties, where appropriate, and capitalization rates for self storage properties observed in the marketplace based on investor surveys and general discussions in the market, and extracted from recent sales of self storage properties in each property’s region. |
Stanger employed the income approach to estimate the value range of the Stanger Appraised Properties (other than the office condominium located in Ladera Ranch, CA), which involves an economic analysis of the property based on its potential to provide future net annual income. A direct capitalization analysis was used to determine the value range of the portfolio by valuing each Stanger Appraised Property in the portfolio. The direct capitalization analysis was based upon the stabilized net operating income of each property capitalized at an appropriate capitalization rate for each property based upon property characteristics and competitive position and market conditions at the date of the appraisal. Stanger deducted estimated lease-up costs for properties that were not considered stabilized and adjusted the value conclusion of properties for any that identified deferred maintenance. Stanger employed the sales comparison approach to value the office condominium located in Ladera Ranch, CA, which utilizes indices of value derived from actual or proposed sales of comparable properties to estimate the value of the subject property.
Stanger prepared the Stanger Appraisal Report, which summarizes key inputs and assumptions, providing a value for each of the Stanger Appraised Properties it appraised using financial information provided by us. From such review, Stanger selected the appropriate direct capitalization rate in its direct capitalization analysis.
The total aggregate purchase price of the wholly-owned appraised properties in the Stanger Appraisal Report was approximately $1.9 billion. In addition, through the valuation date, we had invested approximately $90 million in capital improvements on these real estate assets since inception. As of the valuation date, the total value range of the wholly-owned appraised properties was approximately $2.6 billion to $2.9 billion. The mid-point appraised value of approximately $2.7 billion represents an approximately 35.5% increase in the total value of the real estate assets over the aggregate purchase price and aggregate improvements. The following summarizes the key assumptions that were used in the direct capitalization models to arrive at the mid-point appraised value of the Stanger Appraised Properties:
| | | | | | | | |
| | | Range | | | Weighted
Average | |
Direct Capitalization Rate | | | 4.00%-6.00% | | | | 4.95 | % |
While we believe that Stanger’s assumptions and inputs are reasonable, a change in these assumptions and inputs would significantly impact the calculation of the appraised value of the Stanger Appraised Properties and thus, the Estimated Per Share NAV. The table below illustrates the impact on the Estimated Per Share NAV if the direct capitalization rates were adjusted by 25 basis points or 5%, assuming the mid-point value conclusion for each Stanger Appraised Property is based on the method being sensitized and all other factors remain unchanged:
| | | | | | | | | | | | | | | | |
| | | Estimated Per Share NAV due to: | |
| | | Increase 25
Basis Points | | | Decrease 25
Basis Points | | | Increase 5.0% | | | Decrease 5.0% | |
Direct Capitalization Rate | | $ | 14.14 | | | $ | 16.46 | | | $ | 14.21 | | | $ | 16.40 | |
Debt
Values for our secured mortgage debt and other debt outstanding (the “Outstanding Debt”) were estimated by Stanger using a discounted cash flow analysis, which used inputs based on the remaining loan terms and estimated current market interest rates for debt with similar characteristics, including remaining loan term, loan-to-value ratios, debt-service-coverage ratios, customary affirmative and negative covenants, prepayment terms, and collateral attributes. The current market interest rate was generally determined based on market rates
196
for available comparable debt. The estimated current market interest rates ranged from 5.70% to 7.90% for the Outstanding Debt.
As of September 30, 2023, Stanger’s estimated fair value of our consolidated Outstanding Debt was approximately $1.0 billion. The weighted-average discount rate applied to the future estimated debt payments of the Outstanding Debt was approximately 6.72%.
While we believe that Stanger’s assumptions and inputs are reasonable, a change in these assumptions and inputs would significantly impact the calculation of the estimated value of the Outstanding Debt and thus, the Estimated Per Share NAV. The table below illustrates the impact on the Estimated Per Share NAV if the market interest rate of the Outstanding Debt were adjusted by 25 basis points or 5%, and assuming all other factors remain unchanged:
| | | | | | |
| Estimated Per Share NAV due to: |
Decrease 25 Basis Points | | Increase 25 Basis Points | | Decrease 5.0% | | Increase 5.0% |
$15.21 | | $15.31 | | $15.20 | | $15.32 |
Cash, Other Assets, Other Liabilities and Preferred Equity
The fair value of our cash, other assets, and other liabilities were estimated by us to approximate carrying value as of the valuation date. In estimating the fair value of the Series A Preferred Stock, Stanger considered the conversion feature of the Series A Preferred Stock, as described above, and determined that as of the valuation date it would have been dilutive since the conversion value of $10.66 per share is at a lower value than the Estimated Per Share NAV determined by the Board as of the valuation date. Therefore, Stanger assumed the Series A Preferred Stock was converted into common shares and was included in the fully diluted share count as of the valuation date. The carrying value of a majority of our other assets and liabilities are considered to equal their fair value due to their short maturities or liquid nature. These amounts include investments in and advances to our Managed REITs. Certain balances, such as intangible assets and liabilities and deferred financing costs, have been eliminated for the purpose of the valuation due to the fact that the value of those balances were already considered in the valuation of the respective investments.
Managed REIT Platform Value
To derive the estimated value range of the Managed REIT platform, Stanger estimated the market value associated with our asset management and property management contracts (the “Management Contracts”) with us, SSGT III, and SST VI using a comparable transactions analysis. Stanger considered the projected fee income from the Management Contracts and the associated reasonable expenses to support such activities to derive an EBITDA projection for the 12-month period (the “Projected EBITDA”) following the valuation date. Stanger then applied a range of EBITDA multiples to the Projected EBITDA to derive an estimated value range associated with the Management Contracts.
To derive the estimated value range of the Managed REIT platform, Stanger also estimated the market value associated with the agreements between us, SSGT III and SST VI related to the tenant protection programs using a direct capitalization approach. Stanger considered the projected Tenant Program income and related reasonable expenses to derive an EBITDA projection for the 12-month period (the “Projected TP EBITDA”) following the valuation date. Stanger then applied a range of capitalization rates to the Projected TP EBITDA to derive an estimated value range associated with the Tenant Programs.
Unconsolidated Joint Ventures Value
We hold interests in unconsolidated entities in joint ventures with SmartCentres Real Estate Investment Trust, which own self storage properties or properties in various stages of planning and development into self
197
storage properties located in Canada. Stanger estimated the fair market value range of the Unconsolidated Joint Ventures by: (i) utilizing the value range of the properties owned by the Unconsolidated Joint Ventures based upon the Stanger Appraisal Report; (ii) adding the other tangible assets held by the Unconsolidated Joint Ventures; (iii) deducting the other tangible liabilities held by the Unconsolidated Joint Ventures; and (iv) taking the resulting equity from the Unconsolidated Joint Ventures and processing such equity through the Unconsolidated Joint Venture agreement as it pertains to capital distribution allocations, to determine the amount of equity attributable to us.
Different parties using different assumptions and estimates could derive a different Estimated Per Share NAV, and these differences could be significant. The value of our shares will fluctuate over time in response to developments related to individual assets in our portfolio and the management of those assets and in response to the real estate and finance markets.
The Board’s Determination of the Estimated Per Share NAV
Based upon a review of the Reports provided by Stanger, upon the recommendation of the Nominating and Corporate Governance Committee, the Board declared the Estimated Per Share NAV for each of the Class A common stock and Class T common stock to be $15.25.
Limitations of Estimated Per Share NAV
The various factors considered by the Board in determining the Estimated Per Share NAV were based on a number of assumptions and estimates that may not be accurate or complete. As disclosed above, we are providing the Estimated Per Share NAV to assist broker-dealers that participate, or participated, in our prior NTR Offering in meeting their customer account statement reporting obligations. As with any valuation methodology, the methodologies used are based upon a number of estimates and assumptions that may not be accurate or complete. Different parties with different assumptions and estimates could derive a different Estimated Per Share NAV. The Estimated Per Share NAV is not audited and does not represent the fair value of our assets or liabilities according to GAAP.
Accordingly, with respect to the Estimated Per Share NAV, we can give no assurance that:
| | • | | a stockholder would be able to resell such stockholder’s shares at the Estimated Per Share NAV; |
| | • | | a stockholder would ultimately realize distributions per share equal to the Estimated Per Share NAV upon liquidation of our assets and settlement of its liabilities or a sale of our company; |
| | • | | our shares of Class A common stock and Class T common stock would trade at the Estimated Per Share NAV on a national securities exchange; |
| | • | | a different independent third-party appraiser or other third-party valuation firm would agree with the Estimated Per Share NAV; or |
| | • | | the Estimated Per Share NAV, or the methodology used to estimate the Estimated Per Share NAV, will be found by any regulatory authority to comply with the Employee Retirement Income Security Act (ERISA), the Internal Revenue Code of 1986, as amended, or other regulatory requirements. |
Similarly, the amount a stockholder may receive upon repurchase of their shares, if they participate in our share redemption program and such redemption program is available, may be greater than or less than the amount a stockholder paid for the shares, regardless of any increase in the underlying value of any assets owned by us.
The Estimated Per Share NAV is based on the estimated value of our assets less the estimated value of our liabilities divided by the number of shares outstanding on an adjusted fully diluted basis, calculated as of September 30, 2023. The Estimated Per Share NAV was based upon 129,710,366 shares of common equity or equivalent interests outstanding as of September 30, 2023, which comprised (i) 88,835,383 shares of Class A
198
common stock, plus (ii) 8,121,031 outstanding shares of Class T common stock, plus (iii) 18,761,726 shares related to the assumed conversion of the Series A Preferred Stock into common shares, plus (iv) 13,992,226 OP Units, of which 1,128,052 are unvested OP Units issued to our directors and management. Such OP Units are, or will be upon vesting (as applicable), exchangeable on a one-for-one basis into shares of Class A common stock.
Further, the value of our shares will fluctuate over time as a result of, among other things, developments related to individual assets and responses to the real estate and capital markets. The Estimated Per Share NAV does not reflect a real estate portfolio premium or discount versus the sum of the individual property values. The Estimated Per Share NAV also does not take into account estimated disposition costs and fees for real estate properties that are not held for sale or other windup costs.
Distribution Reinvestment Plan
Pursuant to the Company’s distribution reinvestment plan, as amended (the “Plan”), the price per share pursuant to the Plan is equal to the estimated value per share approved by the Board and in effect on the date of purchase of shares under the Plan. In connection with the determination of the Estimated Per Share NAV described in this Current Report, the Board approved a share price for the purchase of shares under the Plan equal to the Estimated Per Share NAV of $15.25 for both Class A shares and Class T shares, to be effective for distribution payments being paid beginning in January 2024. On November 25, 2024, in anticipation of this offering, our Board approved the full suspension of our distribution reinvestment plan, such that distributions for the month of November 2024, which would ordinarily be paid in December 2024, will be paid in cash.
Share Redemption Program
Pursuant to the Company’s share redemption program (the “SRP”), the redemption price for shares the Company repurchases under the SRP is equal to the most recently published estimated net asset value of the applicable share class. In connection with the determination of the Estimated Per Share NAV described in this Current Report, the redemption price under the SRP is equal to the Estimated Per Share NAV of $15.25 for both Class A shares and Class T shares, effective beginning with redemption requests submitted during the first quarter of 2024, which will be redeemed in April 2024. On November 25, 2024, in anticipation of this offering, our Board approved the full suspension of our share redemption program, effective immediately.
Distributions
We elected to be taxed as a REIT under Sections 856 through 860 of the Code beginning with the taxable year ended December 31, 2014. By qualifying as a REIT, we generally will not be subject to U.S. federal income tax on taxable income that we distribute to our stockholders. If we fail to qualify as a REIT in any taxable year, we will then be subject to U.S. federal income taxes on our taxable income at regular corporate rates and will not be permitted to qualify for treatment as a REIT for U.S. federal income tax purposes for four years following the year during which qualification is lost unless the IRS grants us relief under certain statutory provisions. Such an event could materially adversely affect our net income and net cash available for distribution to stockholders. However, we believe that we are organized and operate in such a manner as to qualify for treatment as a REIT and intend to operate in the foreseeable future in such a manner that we will remain qualified as a REIT for U.S. federal income tax purposes.
For income tax purposes, distributions to common stockholders are characterized as ordinary dividends, capital gain dividends, or as nontaxable distributions. To the extent that we make a distribution in excess of our current or accumulated earnings and profits, the distribution will be a non-taxable return of capital, reducing the tax basis in each U.S. stockholder’s shares, and the amount of each distribution in excess of a U.S. stockholder’s tax basis in its shares will be taxable as gain realized from the sale of its shares. See “Federal Income Tax Considerations” contained elsewhere in this prospectus for additional information.
We intend to make distributions to holders of shares of our common stock offered in this offering, when, as and if authorized by our Board out of legally available funds. We cannot assure you that our estimated distributions will be made or sustained or that our Board will not change our distribution policy in the future. Any distributions
199
will be at the sole discretion of our Board, and their form, timing and amount, if any, will depend upon a number of factors, including our actual and projected results of operations, FFO, FFO, as adjusted, liquidity, cash flows and financial condition, the revenue we actually receive from our properties, our operating expenses, our debt service requirements, our capital expenditures, prohibitions and other limitations under our financing arrangements, our REIT taxable income, the annual REIT distribution requirements, applicable law, including restrictions on distributions under Maryland law, and such other factors as our Board deems relevant.
For 2022, we paid a total of approximately $74.4 million in distributions, which consisted of approximately $54.6 million to our common stockholders, approximately $7.3 million to our OP unit holders, and approximately $12.5 million to our preferred stockholder. Approximately $28.0 million of the 2022 total distributions, comprising approximately 51.3% of our common stockholder distributions and none of our preferred stockholder distributions, constituted a non-taxable return of capital. For 2023, we paid a total of approximately $79.0 million in distributions, which consisted of approximately $58.2 million to our common stockholders, approximately $8.3 million to our OP Unit holders, and approximately $12.5 million to our preferred stockholder. Approximately $41.2 million of the 2023 total distributions, composed of approximately 70.9% of our common stockholder distributions and none of our preferred stockholder distributions, constituted a non-taxable return of capital. For the nine months ended September 30, 2024, we paid a total of approximately $59.9 million in distributions, which consisted of approximately $43.7 million to our common stockholders and approximately $9.4 million to our preferred stockholders.
The following table shows the distributions we have paid in cash and through our distribution reinvestment plan from January 1, 2022 through September 30, 2024:
| | | | | | | | | | | | | | | | |
Quarter | | OP Unit
Holders(1) | | | Preferred
Stockholder(2) | | | Common
Stockholders(1) | | | Distributions
Declared per
Common Share | |
1st Quarter 2022 | | $ | 1,597,751 | | | $ | 3,150,685 | | | $ | 12,424,264 | | | $ | 0.15 | |
2nd Quarter 2022 | | $ | 1,763,224 | | | $ | 3,082,192 | | | $ | 13,020,126 | | | $ | 0.15 | |
3rd Quarter 2022 | | $ | 1,903,553 | | | $ | 3,116,438 | | | $ | 14,710,548 | | | $ | 0.15 | |
4th Quarter 2022 | | $ | 2,036,687 | | | $ | 3,150,685 | | | $ | 14,480,242 | | | $ | 0.15 | |
1st Quarter 2023 | | $ | 2,005,649 | | | $ | 3,150,685 | | | $ | 14,684,560 | | | $ | 0.15 | |
2nd Quarter 2023 | | $ | 2,138,485 | | | $ | 3,082,192 | | | $ | 14,746,039 | | | $ | 0.15 | |
3rd Quarter 2023 | | $ | 2,106,602 | | | $ | 3,116,438 | | | $ | 14,339,518 | | | $ | 0.15 | |
4th Quarter 2023 | | $ | 2,022,160 | | | $ | 3,150,685 | | | $ | 14,464,023 | | | $ | 0.15 | |
1st Quarter 2024 | | $ | 2,304,031 | | | $ | 3,150,685 | | | $ | 14,500,939 | | | $ | 0.15 | |
2nd Quarter 2024 | | $ | 2,107,434 | | | $ | 3,107,924 | | | $ | 14,608,575 | | | $ | 0.15 | |
3rd Quarter 2024 | | $ | 2,109,820 | | | $ | 3,107,924 | | | $ | 14,552,804 | | | $ | 0.15 | |
| (1) | | Declared distributions are paid monthly in arrears. |
| (2) | | Declared distributions are paid quarterly in arrears. See Note 6 – Preferred Equity of the notes to our consolidated financial statements for the nine months ended September 30, 2024, and Note 6 – Preferred Equity of the notes to our consolidated financial statements for the year ended December 31, 2023, each included elsewhere in this prospectus for information. |
The payment of distributions from sources other than cash flows from operations may reduce the amount of proceeds available for investment and operations or cause us to incur additional interest expense as a result of borrowed funds.
Over the long-term, we expect that a greater percentage of our distributions will be paid from cash flows from operations. However, our operating performance cannot be accurately predicted and may deteriorate in the future due to numerous factors, including our ability to invest capital at favorable yields, the financial performance of our investments in the current real estate and financial environment and the types and mix of investments in our portfolio. As a result, future distributions declared and paid may exceed cash flow from operations.
200
CERTAIN PROVISIONS OF MARYLAND LAW AND OF OUR CHARTER AND BYLAWS
The following is a summary of some of the general terms of our charter and bylaws that we expect to be in effect upon completion of this offering. You should read our charter and bylaws and the applicable provisions of Maryland law for complete information on our charter and bylaws. The following summary is not complete and is subject to, and qualified in its entirety by reference to, the provisions of our charter and bylaws, as they will be in effect upon completion of this offering, which are filed as exhibits to the registration statement of which this prospectus is a part, and the applicable provisions of the Maryland General Corporation Law, or the MGCL. See “Where You Can Find More Information.”
Election and Removal of Directors; Board of Directors
Our charter provides that the number of our directors may be established pursuant to our bylaws but may not be fewer than the minimum number required by the MGCL. Our charter requires that a majority of our directors be “independent” in accordance with the rules and regulations of the NYSE.
At each annual meeting of our stockholders, our stockholders will elect each of our directors to serve until the next annual meeting of our stockholders and until his or her successor is duly elected and qualifies. Holders of shares of our common stock will have no right to cumulative voting in the election of directors. In uncontested elections, directors are elected by the affirmative vote of a majority of all the votes cast “for” and “against” each director nominee. In contested elections, directors are elected by a plurality of the votes cast. An election will be considered to be contested if: (i) our secretary has received notice that a stockholder has nominated one or more individuals for election as a director, which notice complies with the requirements for advance notice of stockholder nominees for director set forth in our bylaws; and (ii) the nomination has not been withdrawn on or before the close of business on the tenth day prior to the date that our definitive proxy statement with respect to the meeting at which such nomination would be made is filed with the SEC, and, as a result of which, the number of nominees exceeds the number of directors to be elected at the meeting.
A director may be removed at any meeting of stockholders called expressly for such purpose, but only for cause and then only by the affirmative vote of at least a majority of the votes entitled to be cast generally in the election of directors. “Cause” means, with respect to any particular director, conviction of a felony or a final judgment of a court of competent jurisdiction holding that such director caused demonstrable, material harm to us through bad faith or active and deliberate dishonesty.
Except as may be provided by our Board in setting the terms of any class or series of our preferred stock, vacancies on our Board may be filled only by the remaining directors, even if the remaining directors do not constitute a quorum, and any individual elected to fill a vacancy will serve for the remainder of the full term of the directorship in which the vacancy occurred and until his or her successor is duly elected and qualifies.
Business Combinations
Under Maryland law, “business combinations” between a Maryland corporation and an interested stockholder or an affiliate of an interested stockholder are prohibited for five years after the most recent date on which the interested stockholder becomes an interested stockholder. These business combinations include a merger, consolidation, share exchange, or, in circumstances specified in the statute, an asset transfer or issuance or reclassification of equity securities. An interested stockholder is defined as:
| | • | | any person who beneficially owns, directly or indirectly, 10% or more of the voting power of the corporation’s outstanding voting stock; or |
| | • | | an affiliate or associate of the corporation who, at any time within the two-year period prior to the date in question, was the beneficial owner, directly or indirectly, of 10% or more of the voting power of the then- outstanding stock of the corporation. |
201
A person is not an interested stockholder under the statute if the board of directors approved in advance the transaction by which such person otherwise would have become an interested stockholder. However, in approving a transaction, the board of directors may provide that its approval is subject to compliance, at or after the time of approval, with any terms and conditions determined by the board of directors.
After the five-year prohibition, any business combination between the Maryland corporation and an interested stockholder generally must be recommended by the board of directors of the corporation and approved by the affirmative vote of at least:
| | • | | 80% of the votes entitled to be cast by holders of outstanding shares voting stock of the corporation; and |
| | • | | two-thirds of the votes entitled to be cast by holders of voting stock of the corporation other than shares held by the interested stockholder with whom or with whose affiliate the business combination is to be effected or held by an affiliate or associate of the interested stockholder. |
These super-majority voting requirements do not apply if the corporation’s stockholders receive a minimum price, as defined under Maryland law, for their shares in the form of cash or other consideration in the same form as previously paid by the interested stockholder for its shares.
The statute permits various exemptions from its provisions, including business combinations that are exempted by the board of directors before the time that the interested stockholder becomes an interested stockholder. As permitted by the MGCL, our Board has by resolution exempted business combinations between us and any person, provided that the business combination is first approved by our Board.
Control Share Acquisitions
With some exceptions, Maryland law provides that control shares of a Maryland corporation acquired in a control share acquisition have no voting rights except to the extent approved by a vote of stockholders entitled to cast two-thirds of the votes entitled to be cast on the matter, excluding “control shares”:
| | • | | owned by the acquiring person; |
| | • | | owned by our officers; and |
| | • | | owned by our employees who are also directors. |
“Control shares” mean voting shares which, if aggregated with all other voting shares owned by an acquiring person or shares for which the acquiring person can exercise or direct the exercise of voting power, would entitle the acquiring person to exercise voting power in electing directors within one of the following ranges of voting power:
| | • | | one-tenth or more but less than one-third; |
| | • | | one-third or more but less than a majority; or |
| | • | | a majority or more of all voting power. |
Control shares do not include shares the acquiring person is then entitled to vote as a result of having previously obtained stockholder approval. A control share acquisition occurs when, subject to some exceptions, a person directly or indirectly acquires ownership or the power to direct the exercise of voting power (except solely by virtue of a revocable proxy) of issued and outstanding control shares. A person who has made or proposes to make a control share acquisition, upon satisfaction of some specific conditions, including an undertaking to pay expenses, may compel our Board to call a special meeting of our stockholders to be held within 50 days of a demand to consider the voting rights of the control shares. If no request for a meeting is made, we may present the question at any stockholders’ meeting.
202
If voting rights are not approved at the meeting or if the acquiring person does not deliver an acquiring person statement as required by the statute, then, subject to some restrictions and limitations, we may redeem any or all of the control shares (except those for which voting rights have been previously approved) for fair value determined, without regard to the absence of voting rights for the control shares, as of the date of any meeting of stockholders at which the voting rights of such shares are considered and not approved or, if no such meeting is held, as of the date of the last control share acquisition by the acquiror. If voting rights for control shares are approved at a stockholders meeting and the acquiror becomes entitled to vote a majority of the shares entitled to vote, all other stockholders may exercise appraisal rights. The fair value of the shares as determined for purposes of such appraisal rights may not be less than the highest price per share paid by the acquiror in the control share acquisition. The control share acquisition statute does not apply to shares acquired in a merger, consolidation, or share exchange if we are a party to the transaction or to acquisitions approved or exempted by our charter or bylaws.
As permitted by the MGCL, our bylaws contain a provision exempting from the control share acquisition statute any and all acquisitions by any person of our stock.
Subtitle 8
Subtitle 8 of Title 3 of the MGCL permits a Maryland corporation with a class of equity securities registered under the Exchange Act and at least three independent directors to elect to be subject, by provision in its charter or bylaws or a resolution of its board of directors and notwithstanding any contrary provision in the charter or bylaws, to any or all of the following five provisions:
| | • | | a classified board of directors; |
| | • | | a two-thirds vote requirement for removing a director; |
| | • | | a requirement that the number of directors be fixed only by vote of the directors; |
| | • | | a requirement that a vacancy on the board of directors be filled only by the remaining directors and for the remainder of the full term of the class of directors in which the vacancy occurred; and |
| | • | | a majority requirement for the calling of a stockholder-requested special meeting of stockholders. |
Our charter sets forth our election pursuant to Subtitle 8 that, except as may be provided by our Board in setting the terms of any class or series of preferred stock, vacancies on our Board may be filled only by the remaining directors, even if the remaining directors do not constitute a quorum, and that any individual elected to fill a vacancy will serve for the remainder of the full term of the directorship in which the vacancy occurred and until his or her successor is duly elected and qualifies. Our Board is not currently classified, and we have not elected to be subject to any of the other provisions of Subtitle 8, including the provision that would permit us to classify our Board without stockholder approval. Moreover, we expect to file Articles Supplementary to our charter to provide that, without the affirmative vote of a majority of the votes cast on the matter by stockholders entitled to vote generally in the election of directors, we may not elect to be subject to the provision of Subtitle 8 that would permit us to classify our Board without stockholder approval. Through a provision unrelated to Subtitle 8, our bylaws require, unless called by the Chairman of our Board, our Chief Executive Officer or President or our Board, the written request of stockholders entitled to cast not less than a majority of all votes entitled to be cast on any matter that may properly be considered at a meeting of stockholders to call a special meeting to act on such matter.
Stockholder Rights Plan
We do not currently have a stockholder rights plan, and we will not adopt a stockholder rights plan in the future without (i) the approval of our stockholders by a majority of the votes cast on the matter or (ii) seeking ratification from our stockholders by a majority of the votes cast on the matter within 12 months of adoption of the plan if our Board determines, in the exercise of the directors’ duties under applicable law, that it is in our best interest to adopt a rights plan without the delay of seeking prior stockholder approval.
203
Special Meetings of Stockholders
The Chairman of our Board, our Chief Executive Officer, our President, or our Board may call special meetings of our stockholders. A special meeting of our stockholders to act on any matter that may properly be considered at a meeting of our stockholders must also be called by our secretary upon the written request of stockholders entitled to cast a majority of all the votes entitled to be cast on such matter at the meeting and containing the information required by our bylaws. Our secretary will inform the requesting stockholders of the reasonably estimated cost of preparing and mailing the notice of the special meeting (including our proxy materials), and the requesting stockholder must pay such estimated cost before our secretary may prepare and mail the notice of the special meeting.
Advance Notice of Director Nomination and New Business
Our bylaws provide that with respect to an annual meeting of stockholders, nominations of individuals for election to the Board and the proposal of business to be considered by stockholders may be made only (1) pursuant to our notice of the meeting, (2) by or at the direction of the Board, or (3) by a stockholder who is a stockholder of record at the record date set by our Board for the purpose of determining stockholders entitled to vote at the annual meeting, at the time of giving the advance notice required by our bylaws and at the time of the meeting (and any postponement or adjournment thereof), who is entitled to vote at the meeting in the election of each individual nominated or on such other business and who has complied with the advance notice procedures of the bylaws. Stockholders generally must provide notice to our secretary not before the 150th day or after 5:00 p.m., local time, on the 120th day before the first anniversary of the date of the mailing of the notice for the preceding year’s annual meeting.
With respect to special meetings of stockholders, only the business specified in our notice of the meeting may be brought before the meeting. Nominations of individuals for election to the Board at a special meeting may be made only (1) by or at the direction of the Board or (2) provided that the meeting has been called in accordance with our bylaws for the purpose of electing directors, by a stockholder who is a stockholder of record at the record date set by our Board for the purpose of determining stockholders entitled to vote at the special meeting, at the time of giving the advance notice required by our bylaws and at the time of the meeting (and any postponement or adjournment thereof), who is entitled to vote at the meeting in the election of each individual nominated and who has complied with the advance notice provisions of the bylaws. Stockholders generally must provide notice to our secretary not before the 120th day before such special meeting and after 5:00 p.m., local time, on the later of the 90th day before the special meeting or the tenth day after public announcement of the date of the special meeting and the nominees of our Board to be elected at the meeting.
Forum for Certain Litigation
Our bylaws provide that, unless we consent in writing to the selection of an alternative forum, the Circuit Court for Baltimore City, Maryland or, if that Court does not have jurisdiction, the United States District Court for the District of Maryland, Northern Division, will be the sole and exclusive forum for (a) any derivative action or proceeding brought on behalf of us, (b) any action asserting a claim of breach of any duty owed by any director or officer or other employee of us to us or to our stockholders, (c) any action asserting a claim against us or any director or officer or other employee of us arising pursuant to any provision of the MGCL, the charter, or the bylaws, or (d) any action asserting a claim against us or any director or officer or other employee of us that is governed by the internal affairs doctrine.
Effect of Certain Provisions of Maryland Law and our Charter and Bylaws
The restrictions on ownership and transfer of our stock discussed under the caption “Description of Capital Stock—Restrictions on Ownership and Transfer” prevent any person from acquiring more than 9.8% of the number or value (whichever is more restrictive) of our outstanding common stock or 9.8% in value of our
204
outstanding stock without the prior approval of our Board. These provisions, as well as the business combination statute and control share statute discussed above under the captions “—Business Combinations” and “—Control Share Acquisitions” may delay, defer or prevent a change in control of us. For those purposes, our charter includes a “group” as that term is used for purposes of Section 13(d)(3) of the Exchange Act in the definition of “person.” Our Board has the power to amend our charter from time to time to increase the aggregate number of authorized shares of stock or the number of authorized shares of stock of any class or series and to classify and reclassify any unissued shares of our common stock or preferred stock into other classes or series of stock, and to authorize us to issue the newly classified shares, as discussed under the captions “Description of Capital Stock—General” and could authorize the issuance of shares of common stock or a series of preferred stock that could have the effect of delaying, deferring or preventing a change in control of us. We believe that the power to amend our charter to increase the aggregate number of authorized shares of stock or the number of authorized shares of stock of any class or series and to classify or reclassify unissued shares of common or preferred stock, without stockholder approval, provides us with increased flexibility in structuring possible future financings and acquisitions and in meeting other needs that might arise.
The provisions of our bylaws discussed above under the captions “—Special Meetings of Stockholders” and “—Advance Notice of Director Nomination and New Business” require stockholders seeking to call a special meeting, nominate an individual for election as a director or propose other business at an annual meeting to comply with certain notice and information requirements. We believe that these provisions will help to assure the continuity and stability of our business strategies and policies as determined by our Board and promote good corporate governance by providing us with clear procedures for calling special meetings, information about a stockholder proponent’s interest in us and adequate time to consider stockholder nominees and other business proposals. However, these provisions, alone or in combination, could make it more difficult for our stockholders to remove incumbent directors and could delay, defer or prevent a change in control, including a proxy contest or tender offer that might involve a premium price for our common stockholders or otherwise be in the best interest of our stockholders.
Amendment of our Bylaws
Our Board has the power to adopt, alter, amend or repeal any provision of our bylaws and to make new bylaws. Our bylaws are expected to further provide that, pursuant to a binding proposal submitted for approval of the stockholders at a duly called annual meeting or special meeting of stockholders by a stockholder that (a) delivers to our secretary a timely notice of such proposal that (i) satisfies the notice procedures and all other relevant provisions of our bylaws discussed above under the caption “—Advance Notice of Director Nomination and New Business” and, with respect to a special meeting, under the caption “—Special Meetings of Stockholders” and (ii) is otherwise permitted by applicable law and (b) satisfies the ownership and other eligibility requirements Rule 14a-8 under the Exchange Act for the periods and as of the dates specified therein, our stockholders may adopt, alter, amend or repeal any provision of our bylaws and make new bylaws so long as such adoption, alteration, amendment or repeal is approved by the affirmative vote of a majority of the votes entitled to be cast on the matter and does not alter, amend or repeal or result in the adoption of any provision inconsistent with the Board’s concurrent power to amend our bylaws.
Limitation of Liability and Indemnification
Maryland law permits a Maryland corporation to include in its charter a provision eliminating the liability of its directors and officers to the corporation and its stockholders for money damages except for liability resulting from:
| | • | | actual receipt of an improper benefit or profit in money, property, or services; or |
| | • | | active and deliberate dishonesty that is established by a final judgment and is material to the cause of action. |
205
Our charter contains a provision that eliminates the liability of our directors and officers to the maximum extent permitted by Maryland law.
Maryland law requires a Maryland corporation (unless its charter provides otherwise, which our charter does not) to indemnify a director or officer who has been successful, on the merits or otherwise, in the defense of any proceeding to which he or she is made a party by reason of his or her service in that capacity. Maryland law permits a Maryland corporation to indemnify its present and former directors and officers, among others, against judgments, penalties, fines, settlements, and reasonable expenses actually incurred by them in connection with any proceeding to which they may be made or threatened to be made a party by reason of their service in those or other capacities unless it is established that:
| | • | | the act or omission of the director or officer was material to the matter giving rise to the proceeding and (i) was committed in bad faith or (ii) was the result of active and deliberate dishonesty; |
| | • | | the director or officer actually received an improper personal benefit in money, property, or services; or |
| | • | | in the case of any criminal proceeding, the director or officer had reasonable cause to believe that the act or omission was unlawful. |
Under Maryland law, a Maryland corporation also may not indemnify a director or officer in a suit by or on behalf of the corporation in which the director or officer was adjudged liable to the corporation or for a judgment of liability on the basis that personal benefit was improperly received. A court may order indemnification if it determines that the director or officer is fairly and reasonably entitled to indemnification, even though the director or officer did not meet the prescribed standard of conduct; however, indemnification for an adverse judgment in a suit by the corporation or on its behalf, or for a judgment of liability on the basis that personal benefit was improperly received, is limited to expenses.
In addition, the MGCL permits a Maryland corporation to advance reasonable expenses to a director or officer upon the corporation’s receipt of:
| | • | | a written affirmation by the director or officer of his or her good faith belief that he or she has met the standard of conduct necessary for indemnification by the corporation; and |
| | • | | a written undertaking by the director or officer or on his or her behalf to repay the amount paid or reimbursed by the corporation if it is ultimately determined that he or she did not meet the standard of conduct necessary for indemnification by the corporation. |
To the maximum extent permitted by Maryland law in effect from time to time, our charter requires us to indemnify and, without requiring a preliminary determination of the ultimate entitlement to indemnification, to pay or reimburse reasonable expenses in advance of the final disposition of a proceeding to (i) any individual who is a present or former director or officer and who is made or threatened to be made a party to, or witness in, the proceeding by reason of his or her service in such capacity or (ii) any individual who, while a director or officer and at our request, serves or has served as a director, officer, member, manager, partner or trustee of another corporation, real estate investment trust, limited liability company, partnership, joint venture, trust, employee benefit plan or any other enterprise and who is made or threatened to be made a party to, or witness in, the proceeding by reason of his or her service in such capacity. Our charter also permits us, with the approval of our Board, to indemnify and advance expenses to any individual who served a predecessor of our Company in any of the capacities described above and any employee or agent of our Company or a predecessor of our Company.
We have entered into indemnification agreements with each of our directors and executive officers (each, an “Indemnitee”). The indemnification agreements obligate us, if an Indemnitee is or is threatened to be made a party to, or witness in, any proceeding by reason of such Indemnitee’s status as a present or former director or officer of us, or as a director, trustee, officer, partner, manager, managing member, fiduciary, employee or agent of another entity that the Indemnitee served in such capacity at our request, to indemnify such Indemnitee, and advance expenses actually and reasonably incurred by him or her, subject to certain exceptions and conditions.
206
We also maintain insurance on behalf of all of our directors and executive officers against liability asserted against or incurred by them in their official capacities with us.
Insofar as the foregoing provisions permit indemnification of directors, officers or persons controlling us for liability arising under the Securities Act, we have been informed that, in the opinion of the SEC, this indemnification is against public policy as expressed in the Securities Act and is therefore unenforceable.
207
SHARES ELIGIBLE FOR FUTURE SALE
General
Trading of shares of our common stock on the NYSE is expected to commence immediately following the completion of this offering. We cannot predict the effect, if any, that sales of shares or the availability of shares for sale will have on the market price of shares of our common stock prevailing from time to time. Sales of substantial amounts of shares of our common stock in the public market, or the perception that such sales could occur, could adversely affect the prevailing market price of shares of our common stock. See “Risk Factors—Risks Related to this Offering” in this prospectus for more information.
As of September 30, 2024, we had an aggregate of shares of Class A common stock and shares of Class T common stock issued and outstanding, consisting of no shares of our common stock, shares of Class A common stock and shares of Class T common stock. Upon completion of this offering, we will have outstanding an aggregate of shares of our common stock ( shares if the underwriters’ option to purchase additional shares is exercised in full), excluding shares of our common stock issuable upon conversion of our shares of Class A common stock and shares of Class T common stock six months after the listing and shares of our common stock issuable upon conversion of our OP units.
All of the shares of our common stock to be sold in this offering ( shares if the underwriters’ option to purchase additional shares is exercised in full) will be freely tradable without restriction or further registration under the Securities Act, subject to the restrictions on ownership and transfer set forth in our charter, and except for the shares that are held by any of our “affiliates,” as that term is defined in Rule 144 under the Securities Act.
As of September 30, 2024, shares of Class A common stock and shares of Class T common stock have previously been registered under the Securities Act. However, none of the shares of our Class A common stock and Class T common stock have been or will be listed on a national stock exchange, and we do not expect a market to develop for shares of our Class A common stock or Class T common stock. Upon the six-month anniversary of the listing of our common stock for trading on a national securities exchange (or such earlier date as approved by our Board), each share of our Class A common stock and Class T common stock will automatically, and without any stockholder action, convert into one share of our listed common stock. We have agreed that, without the prior written consent of the representatives on behalf of the underwriters, we will not approve the conversion of any of the outstanding shares of Class A common stock or shares of Class T common stock into shares of our common stock before the six-month anniversary of the listing of our common stock for trading on a national securities exchange.
For a description of certain restrictions set forth in our charter regarding the ownership and transfer of shares of our common stock, see “Description of Capital Stock—Restrictions on Ownership and Transfer.”
Rule 144
Rule 144(b)(1) provides a safe harbor pursuant to which certain persons may sell shares of our stock that constitute restricted securities without registration under the Securities Act. “Restricted securities” include, among other things, securities acquired directly or indirectly from the issuer, or from an affiliate of the issuer, in a transaction or chain of transactions not involving any public offering. In general, the conditions that must be met for a person to sell shares of our stock pursuant to Rule 144(b)(1) are as follows: (i) the person selling the shares must not be an affiliate of ours at the time of the sale, and must not have been an affiliate of ours during the preceding three months; and (ii) either (A) at least one year must have elapsed since the date of acquisition of the restricted securities from us or any of our affiliates, or (B) if we satisfy the current public information requirements set forth in Rule 144, at least six months must have elapsed since the date of acquisition of the restricted securities from us or any of our affiliates.
208
Rule 144(b)(2) provides a safe harbor pursuant to which persons who are affiliates of ours may sell shares of our stock, whether restricted securities or not, without registration under the Securities Act if certain conditions are met. In general, the conditions that must be met for a person who is an affiliate of ours (or has been within three months prior to the date of sale) to sell shares of our stock pursuant to Rule 144(b)(2) are as follows: (i) at least six months must have elapsed since the date of acquisition of the shares of stock from us or any of our affiliates; (ii) the seller must comply with volume limitations, manner of sale restrictions and notice requirements; and (iii) we must satisfy the current public information requirements set forth in Rule 144. In order to comply with the volume limitations, a seller may not sell, in any three-month period, more than the following number of shares:
| | • | | 1% of the shares of the class outstanding as shown by the most recent report or statement published by us; |
| | • | | the average weekly reported volume of trading in such securities on all national securities exchanges and/or reported through the automated quotation system of a registered securities association during the four calendar weeks preceding the filing of the notice required to be filed by the seller under Rule 144 or, if no such notice is required, the date of receipt of the order to execute the transaction by the broker or the date of execution of the transaction directly with a market maker; or |
| | • | | the average weekly volume of trading in such securities reported pursuant to an effective transaction report plan or an effective national market system plan, as defined in Regulation NMS under the Exchange Act during the four-week period described in the preceding bullet. |
For information regarding the shares of our common stock, Class A common stock and Class T common stock held by our directors and executive officers, see “Principal Stockholders” in this prospectus.
Conversion and Redemption Rights
As of September 30, 2024, we had million outstanding OP units. Additionally, certain of our outstanding LTIP units will convert into OP units upon vesting in future periods. OP units are redeemable for cash or, at our election, shares of our common stock on a one-for-one basis, subject to adjustment in certain circumstances.
As described in “Our Operating Partnership Agreement,” in connection with the self administration transaction, our operating partnership issued 8,698,956 Class A-1 Units and 3,283,302 Class A-2 Units. On March 24, 2021, 1,094,434 of such Class A-2 Units were converted into 1,121,795 Class A-1 Units pursuant to the achievement of the first tier of earn-out consideration. On March 29, 2022, 1,094,434 of such Class A-2 Units were converted into 1,094,434 Class A-1 Units pursuant to the achievement of the second tier of earn-out consideration. On August 9, 2022, the final 1,094,434 of such Class A-2 Units were converted into 1,094,434 Class A-1 Units pursuant to the achievement of the third tier of earn-out consideration. See “Our Operating Partnership Agreement—Class A-1 Units” for a description of the rights, duties, privileges and conversion features of the Class A-1 Units.
Registration Rights
On June 28, 2019, in connection with the self administration transaction, we and our operating partnership entered into a registration rights agreement with SmartStop OP Holdings, LLC and certain other parties (collectively, the “Holders”). Pursuant to the registration rights agreement, the Holders have the right to request that we register for resale under the Securities Act shares of our common stock issued or issuable to such Holder. We are required to use commercially reasonable efforts to file a registration statement on Form S-3 within 30 days of such request and within 60 days of such request in the case of a registration statement on Form S-11 or such other appropriate form. Upon any such filing, we will seek to cause such registration statement to become effective as soon as reasonably practicable thereafter. The registration rights agreement also grants the Holders certain “piggyback” registration rights.
209
In addition, on October 29, 2019, we entered into a preferred stock purchase agreement with Extra Space Storage LP, a subsidiary of Extra Space Storage Inc., pursuant to which Extra Space Storage LP committed to purchase up to $200 million in shares of our Series A Preferred Stock. The initial closing in the amount of $150 million occurred on October 29, 2019, and the second and final closing in the amount of $50 million occurred on October 26, 2020. See “Description of Capital Stock—Series A Convertible Preferred Stock” in this prospectus for more information regarding the terms of our Series A Preferred Stock.
As of September 30, 2024, there were 200,000 shares of Series A Preferred Stock outstanding, and we intend to redeem all of the Series A Preferred Stock in connection with this offering. See “Use of Proceeds” in this prospectus for more information.
Our Long-Term Incentive Plan
As of September 30, 2024, there were approximately 8.8 million shares available for issuance under our Incentive Plan. As described above, upon the six-month anniversary of the listing of our common stock for trading on a national securities exchange (or such earlier date as approved by our Board), each of these shares of Class A common stock will automatically convert into one share of our listed common stock.
Among other things, the Incentive Plan provides for the following:
| | • | | the number of shares of common stock to be available for issuance under the Incentive Plan is 10,000,000 shares; |
| | • | | following the effective date of the Incentive Plan, no awards may be granted under the Prior Plan. |
See “Management—Compensation Discussion and Analysis—2022 Long-Term Incentive Plan” for more information regarding our Incentive Plan.
Lock-Up Agreements
We and our directors and officers have agreed with the underwriters that, subject to limited exceptions, we and our directors and officers may not, directly or indirectly, without the prior written consent of the representatives on behalf of the underwriters, offer to sell, sell, contract to sell, pledge or otherwise dispose of, including the filing of a registration statement with the SEC in respect of, or the establishment or the increase of a put equivalent position or the liquidation or the decrease of a call equivalent position with respect to, any shares of our common stock or any securities convertible into, or exercisable or exchangeable for such common stock, or publicly announce an intention to effect any such transaction, for a period from the date hereof until 180 days after the date of this prospectus.
See the section captioned “Underwriting” in this prospectus for more information.
210
FEDERAL INCOME TAX CONSIDERATIONS
The following is a summary of the material U.S. federal income tax considerations regarding our election to be taxed as a real estate investment trust, or REIT, and this offering of common stock.
This summary is for general information only and is not tax advice. This summary assumes that holders of common stock hold such common stock as a capital asset within the meaning of Section 1221 of the Code. This summary is based upon the Code, Treasury Regulations promulgated under the Code, referred to herein as Treasury Regulations, judicial decisions and published administrative rulings, all as currently in effect and all of which are subject to change, possibly with retroactive effect. This discussion does not address (i) U.S. federal taxes other than income taxes and certain excise taxes applicable to REITs, (ii) state, local or non-U.S. taxes or (iii) tax reporting requirements applicable to the ownership and disposition of shares of common stock. In addition, this discussion does not address U.S. federal income tax considerations applicable to persons or entities that are subject to special treatment under U.S. federal income tax law, such as insurance companies, tax-exempt organizations, financial institutions or broker-dealers.
Our REIT Qualification
Tax Opinions from Counsel Regarding REIT Qualification
Nelson Mullins has acted as our tax counsel in connection with this offering of common stock and our election to be taxed as a REIT. Nelson Mullins has rendered an opinion to us to the effect that, commencing with our taxable year ended December 31, 2014, we have been organized and operated in conformity with the requirements for qualification and taxation as a REIT pursuant to Sections 856 through 860 of the Code, and our proposed method of operation will enable us to continue to meet the requirements for qualification and taxation as a REIT under the Code, which opinion will be subject to customary exceptions, assumptions and qualifications and will be based on customary representations made by us. This opinion will not be binding on the IRS or the courts. We intend to continue to operate in a manner to qualify as a REIT following the offering of common stock, but there is no guarantee that we will qualify or remain qualified as a REIT. Moreover, our qualification and taxation as a REIT depends upon our ability to meet, through actual annual (or, in some cases, quarterly) operating results, requirements relating to income, asset ownership, distribution levels and diversity of share ownership, and the various REIT qualification requirements imposed under the Code. Given the complex nature of the REIT qualification requirements, the ongoing importance of factual determinations and the possibility of future changes in our circumstances, there can be no assurance that our actual operating results will satisfy the requirements for taxation as a REIT under the Code for any particular tax year.
No ruling from the IRS has been or is expected to be requested regarding our qualification as a REIT.
Taxation of Our Company
We have elected to be taxed as a REIT under Sections 856 through 860 of the Code commencing with our taxable year ended December 31, 2014. We believe that we have been organized and have operated in conformity with the requirements for qualification and taxation as a REIT under the Code beginning with our taxable year ended December 31, 2014, and that our intended manner of operation will enable us to continue to meet the requirements for qualification as a REIT for U.S. federal income tax purposes. However, qualification and taxation as a REIT depend upon our ability to meet the various qualification tests imposed under the Code, including through actual operating results, asset composition, distribution levels and diversity of stock ownership. Accordingly, no assurance can be given that we have been organized and have operated, or that we will continue to be organized and operate, in a manner so as to qualify or remain qualified as a REIT. See “—Failure to Qualify” for potential tax consequences if we fail to qualify as a REIT.
Provided we qualify for taxation as a REIT, we generally will not be required to pay U.S. federal corporate income taxes on our REIT taxable income that is currently distributed to our stockholders. This treatment
211
substantially eliminates the “double taxation” (i.e. taxation at both the corporate and the stockholder levels) that generally results from investment in a C corporation. We will, however, be subject to U.S. federal income taxes as follows:
| | • | | First, we will be required to pay regular U.S. federal corporate income tax on any REIT taxable income, including net capital gain, that we do not distribute to our stockholders during, or within a specified time period after, the calendar year in which the income is earned. |
| | • | | Second, if we have (1) net income from the sale or other disposition of “foreclosure property” held primarily for sale to customers in the ordinary course of business or (2) other nonqualifying income from foreclosure property, we will be required to pay regular U.S. federal corporate income tax on this income. To the extent that income from foreclosure property is otherwise qualifying income for purposes of the 75% gross income test, this tax is not applicable. Subject to certain other requirements, foreclosure property generally is defined as property we acquired through foreclosure or after a default on a loan secured by the property or a lease of the property. See “—Foreclosure Property.” |
| | • | | Third, we will be required to pay a 100% tax on any net income from prohibited transactions. Prohibited transactions are, in general, sales or other taxable dispositions of property, other than foreclosure property, held as inventory or primarily for sale to customers in the ordinary course of business. |
| | • | | Fourth, if we fail to satisfy the 75% gross income test or the 95% gross income test, as described below, but have otherwise maintained our qualification as a REIT because certain other requirements are met, we will be required to pay a tax equal to (1) the greater of (A) the amount by which we fail to satisfy the 75% gross income test and (B) the amount by which we fail to satisfy the 95% gross income test, multiplied by (2) a fraction intended to reflect our profitability. |
| | • | | Fifth, if we fail to satisfy any of the asset tests (other than a de minimis failure of the 5% or 10% asset tests), as described below, due to reasonable cause and not due to willful neglect, and we nonetheless maintains our REIT qualification because of specified cure provisions, we will be required to pay a tax equal to the greater of $50,000 or the highest U.S. federal corporate income tax rate multiplied by the net income generated by the nonqualifying assets that caused us to fail such test. |
| | • | | Sixth, if we fail to satisfy any provision of the Code that would result in our failure to qualify as a REIT (other than a violation of the gross income tests or certain violations of the asset tests, as described below) and the violation is due to reasonable cause and not due to willful neglect, we may retain our REIT qualification, but we will be required to pay a penalty of $50,000 for each such failure. |
| | • | | Seventh, we will be required to pay a 4% nondeductible excise tax to the extent we fail to distribute during each calendar year at least the sum of (1) 85% of our ordinary income for the year, (2) 95% of our capital gain net income for the year, and (3) any undistributed taxable income from prior periods. |
| | • | | Eighth, if we acquire any asset from a corporation that is or has been a C corporation in a transaction in which our tax basis in the asset is less than the fair market value of the asset, in each case determined as of the date on which we acquired the asset, and we subsequently recognize gain on the disposition of the asset during the five-year period beginning on the date on which we acquired the asset, then we generally will be required to pay regular U.S. federal corporate income tax on this gain to the extent of the excess of (1) the fair market value of the asset over (2) our adjusted tax basis in the asset, in each case determined as of the date on which we acquired the asset. |
| | • | | Ninth, our subsidiaries that are C corporations, including any TRS, as described below, generally will be required to pay regular U.S. federal corporate income tax on their earnings. |
| | • | | Tenth, we will be required to pay a 100% excise tax on transactions with our TRSs that are not conducted on an arm’s-length basis. |
| | • | | Eleventh, if we fail to comply with the requirement to send annual letters to our stockholders holding at least a certain percentage of our stock, as determined under applicable Treasury Regulations, requesting |
212
| | information regarding the actual ownership of our stock, and the failure is not due to reasonable cause or is due to willful neglect, we will be subject to a $25,000 penalty, or if the failure is intentional, a $50,000 penalty. |
We and our subsidiaries may be subject to a variety of taxes other than U.S. federal income tax, including payroll taxes and state and local income, property and other taxes on our assets and operations.
Requirements for Qualification as a REIT
The Code defines a REIT as a corporation, trust or association that satisfied each of the following requirements:
| | (1) | | It is managed by one or more trustees or directors; |
| | (2) | | Its beneficial ownership is evidenced by transferable shares of stock, or by transferable shares or certificates of beneficial ownership; |
| | (3) | | It would be taxable as a domestic corporation, but for its qualification as a REIT; |
| | (4) | | It is not a financial institution or an insurance company within the meaning of certain provisions of the Code; |
| | (5) | | It is beneficially owned by 100 or more persons; |
| | (6) | | Not more than 50% in value of the outstanding stock or shares of beneficial interest of which are owned, actually or constructively, by five or fewer individuals, which the U.S. federal income tax laws define to include certain entities, during the last half of each taxable year; |
| | (7) | | It elects to be a REIT, or has made such election for a previous taxable year, and satisfies all relevant filing and other administrative requirements established by the IRS that must be met to qualify to be taxed as a REIT for U.S. federal income tax purposes; |
| | (8) | | It uses a calendar year for U.S. federal income tax purposes and complies with the recordkeeping requirements of the U.S. federal income tax laws; and |
| | (9) | | It meets certain other requirements, described below, regarding the sources of its gross income, the nature and diversification of its assets and the distribution of its income. |
The Code provides that requirements (1) through (4), and (8) must be satisfied during the entire taxable year and that condition (5) must be met during at least 335 days of a taxable year of 12 months, or during a proportionate part of a taxable year of less than 12 months. Conditions (5) and (6) do not apply until after the first taxable year for which an election is made to be taxed as a REIT (which, in our case, was 2014). For purposes of condition (6), the term “individual” includes a supplemental unemployment compensation benefit plan, a private foundation or a portion of a trust permanently set aside or used exclusively for charitable purposes, but generally does not include a qualified pension plan or profit sharing trust. For purposes of requirement (8) above, we have and we will continue to have a calendar taxable year, and thereby satisfy this requirement.
We believe that we have been organized and have operated in a manner that has allowed us, and will continue to allow us, to satisfy conditions (1) through (9) during the relevant time periods. In addition, our charter provides for restrictions regarding ownership and transfer of our shares that are intended to assist us in continuing to satisfy the share ownership requirements described in conditions (5) and (6) above. A description of the share ownership and transfer restrictions relating to our common stock is contained in the discussion in this prospectus under the heading “Description of Capital Stock—Restrictions on Ownership and Transfer.” These restrictions, however, do not ensure that we have previously satisfied, and may not ensure that we will, in all cases, be able to continue to satisfy, the share ownership requirements described in conditions (5) and (6) above. If we fail to satisfy these share ownership requirements, except as provided in the next sentence, our status as a
213
REIT will terminate. If, however, we comply with the rules contained in applicable Treasury Regulations that require us to ascertain the actual ownership of our shares and we do not know, or would not have known through the exercise of reasonable diligence, that we failed to meet the requirement described in condition (6) above, we will be treated as having met this requirement. See “—Failure to Qualify.”
Ownership of Interests in Partnerships and Limited Liability Companies
We own various direct and indirect interests in entities that are partnerships and limited liability companies for state law purposes. A partnership or limited liability company that has a single owner, as determined under U.S. federal income tax laws, generally is disregarded from its owner for U.S. federal income tax purposes. Many of the partnerships and limited liability companies owned by us currently are disregarded from their owners for U.S. federal income tax purposes because such entities are treated as having a single owner for U.S. federal income tax purposes. Consequently, the assets and liabilities, and items of income, deduction, and credit, of such entities will be treated as our assets and liabilities, and items of income, deduction, and credit, for U.S. federal income tax purposes, including the application of the various REIT qualification requirements. An unincorporated domestic entity with two or more owners, as determined under the U.S. federal income tax laws, generally is taxed as a partnership for U.S. federal income tax purposes. In the case of a REIT that is an owner in an entity that is taxed as a partnership for U.S. federal income tax purposes, the REIT is treated as owning its proportionate share of the assets of the entity and as earning our allocable share of the gross income of the entity for purposes of the applicable REIT qualification tests. Thus, our proportionate share of the assets and items of gross income of any partnership, joint venture, or limited liability company that is taxed as a partnership for U.S. federal income tax purposes is treated as the assets and items of gross income of us for purposes of applying the various REIT qualification tests. For purposes of the 10% value test (described in “—Asset Tests”), our proportionate share is based on our proportionate interest in the equity interests and certain debt securities issued by the entity. For all of the other asset and income tests, our proportionate share is based on our proportionate interest in the capital of the entity. A brief summary of the rules governing the U.S. federal income taxation of partnerships and limited liability companies is set forth below in “—Tax Aspects of Our Ownership of Interests in Entities Taxable as Partnerships.”
We have control of our operating partnership and the subsidiary partnerships and limited liability companies and intend to operate them in a manner consistent with the requirements for our qualification as a REIT. If we become a limited partner or non-managing member in any partnership or limited liability company and such entity takes or expects to take actions that could jeopardize our status as a REIT or require us to pay tax, we may be forced to dispose of our interest in such entity. In addition, it is possible that a partnership or limited liability company could take an action which could cause us to fail a gross income or asset test, and that we would not become aware of such action in time to dispose of our interest in the partnership or limited liability company or take other corrective action on a timely basis. In such a case, we could fail to qualify as a REIT unless we were entitled to relief, as described below.
Ownership of Interests in Qualified REIT Subsidiaries
We may from time to time own and operate certain properties through wholly-owned subsidiaries that we intend to be treated as “qualified REIT subsidiaries” under the Code. A corporation will qualify as our qualified REIT subsidiary if we own 100% of the corporation’s outstanding stock and do not elect with the subsidiary to treat it as a TRS, as described below. A qualified REIT subsidiary is not treated as a separate corporation, and all assets, liabilities and items of income, gain, loss, deduction and credit of a qualified REIT subsidiary are treated as assets, liabilities and items of income, gain, loss, deduction and credit of the parent REIT for all purposes under the Code, including all REIT qualification tests. Thus, in applying the U.S. federal income tax requirements described in this discussion, any qualified REIT subsidiaries we own are ignored, and all assets, liabilities and items of income, gain, loss, deduction and credit of such corporations are treated as our assets, liabilities and items of income, gain, loss, deduction and credit. A qualified REIT subsidiary is not subject to U.S. federal income tax, and our ownership of the stock of a qualified REIT subsidiary will not violate the restrictions on ownership of securities, as described below under “—Asset Tests.”
214
Ownership of Interests in TRSs
We and our operating partnership may own interests in companies that elect or have elected, together with us, to be treated as our TRSs, including but not limited to, SmartStop TRS, Inc., SS Growth TRS, Inc., SS Growth TRS II, Inc., Strategic Storage TRS IV, Inc. and certain entities organized as corporations under Canadian law that hold title to properties in a nominee capacity for which TRS elections were made by us. We may acquire securities in additional TRSs in the future. A TRS is a corporation (or other entity treated as a corporation for U.S. federal income tax purposes) other than a REIT in which a REIT directly or indirectly holds stock, and that has made a joint election with such REIT to be treated as a TRS. If a TRS owns more than 35% of the total voting power or value of the outstanding securities of another corporation, such other corporation will also be treated as a TRS. Other than some activities relating to lodging and health care facilities, a TRS may generally engage in any business, including the provision of customary or non-customary services to tenants of its parent REIT.
Restrictions imposed on REITs and their TRSs are intended to ensure that TRSs will be subject to appropriate levels of U.S. federal income taxation. These restrictions impose a 100% excise tax on transactions between a TRS and its parent REIT or the REIT’s tenants that are not conducted on an arm’s-length basis, such as any redetermined rents, redetermined deductions, excess interest or redetermined TRS service income. In general, redetermined rents are rents from real property that are overstated as a result of any services furnished to any of a REIT’s tenants by its TRS, redetermined deductions and excess interest represent any amounts that are deducted by a TRS for amounts paid to its parent REIT that are in excess of the amounts that would have been deducted based on arm’s length negotiations, and redetermined TRS service income is income of a TRS that is understated as a result of services provided to its parent REIT or on its behalf. Rents will not constitute redetermined rents if they qualify for certain safe harbor provisions contained in the Code. Dividends paid to a parent REIT from a TRS will be treated as dividend income received from a corporation. The corporate income tax liability of our TRSs may reduce the cash flow generated by us and our subsidiaries in the aggregate and limit our ability to make distributions to our stockholders and may affect our compliance with the gross income tests and asset tests.
A TRS generally may be used by a REIT to undertake indirectly activities that the REIT requirements might otherwise preclude the REIT from doing directly, such as the provision of noncustomary tenant services or the disposition of property held for sale to customers. See “—Gross Income Tests—Rents from Real Property” and “—Gross Income Tests—Prohibited Transaction Income.” A TRS is subject to U.S. federal income tax as a regular C corporation. A REIT’s ownership of securities of a TRS is not subject to the 5% or 10% asset test described below. See “—Asset Tests.”
Gross Income Tests
We must satisfy two gross income tests annually to qualify and maintain our qualification as a REIT. First, at least 75% of our gross income for each taxable year generally must consist of the following:
| | • | | rents from real property; |
| | • | | interest on debt secured by mortgages on real property or on interests in real property and interest on debt secured by mortgages on both real and personal property if the fair market value of such personal property does not exceed 15% of the total fair market value of all such property; |
| | • | | dividends or other distributions on, and gain from the sale of, stock or shares of beneficial interest in other REITs; |
| | • | | gain from the sale of real estate assets (other than gain from prohibited transactions); |
| | • | | income and gain derived from foreclosure property; and |
| | • | | income derived from the temporary investment of new capital attributable to the issuance of its stock or a public offering of its debt with a maturity date of at least five years and that we received during the one-year period beginning on the date on which we received such new capital. |
215
Second, in general, at least 95% of our gross income for each taxable year must consist of income that is qualifying for purposes of the 75% gross income test, other types of interest and dividends, gain from the sale or disposition of stock or securities (including interest and gain from debt instruments of “publicly offered REITs” to the extent those debt instruments are not secured by real property or an interest in real property, or Nonqualified Publicly Offered REIT Debt Instruments) or any combination of these.
Cancellation of indebtedness income and gross income from a sale of property that we hold primarily for sale to customers in the ordinary course of business will be excluded from gross income for purposes of the 75% and 95% gross income tests. In addition, gains from “hedging transactions,” as defined in “—Hedging Transactions,” that are clearly and timely identified as such will be excluded from gross income for purposes of the 75% and 95% gross income tests. Finally, certain foreign currency gains will be excluded from gross income for purposes of one or both of the gross income tests.
The following paragraphs discuss the specific application of certain relevant aspects of the gross income tests to rent received by us.
Rents from Real Property. Rents we receive from a tenant will qualify as “rents from real property” for the purpose of satisfying the gross income requirements for a REIT described above only if all of the following conditions are met:
| | • | | The amount of rent is not based in whole or in part on the income or profits of any person. However, an amount we receive or accrue generally will not be excluded from the term “rents from real property” solely because it is based on a fixed percentage or percentages of receipts or sales; |
| | • | | Neither we nor an actual or constructive owner of 10% or more of our capital stock actually or constructively owns 10% or more of the interests in the assets or net profits of a non-corporate tenant, or, if the tenant is a corporation, 10% or more of the total combined voting power of all classes of stock entitled to vote or 10% or more of the total value of all classes of stock of the tenant. Rents we receive from such a tenant that is our TRS, however, will not be excluded from the definition of “rents from real property” as a result of excess ownership by us if at least 90% of the space at the property to which the rents relate is leased to third parties, and the rents paid by the TRS are substantially comparable to rents paid by our other tenants for comparable space. Whether rents paid by a TRS are substantially comparable to rents paid by other tenants is determined at the time the lease with the TRS is entered into, extended, and modified, if such modification increases the rents due under such lease; |
| | • | | Rent attributable to personal property, leased in connection with a lease of real property, is not greater than 15% of the total rent received under the lease. If this condition is not met, then the portion of the rent attributable to personal property will not qualify as “rents from real property.” To the extent that rent attributable to personal property, leased in connection with a lease of real property, exceeds 15% of the total rent received under the lease, we may transfer a portion of such personal property to a TRS; and |
| | • | | We generally may not operate or manage the property or furnish or render noncustomary services to our tenants, subject to a 1% de minimis exception and except as provided below. We may, however, perform services that are “usually or customarily rendered” in connection with the rental of space for occupancy only and are not otherwise considered “rendered to the occupant” of the property. Examples of these services include the provision of light, heat, or other utilities, trash removal and general maintenance of common areas. In addition, we may employ an independent contractor from whom we derive no revenue to provide customary services to our tenants, or a TRS (which may be wholly or partially owned by us) to provide both customary and non-customary services to our tenants without causing the rent we receive from those tenants to fail to qualify as “rents from real property.” |
We generally do not intend to take actions we believe will cause us to fail to satisfy the rental conditions described above. However, there can be no assurance that the IRS would not challenge our conclusions, including the calculation of its personal property ratios, or that a court would agree with our conclusions. If such a challenge were successful, we could fail to satisfy the 75% or 95% gross income test and thus potentially lose our REIT status.
216
Interest. For purposes of the 75% and 95% gross income tests, the term “interest” generally does not include any amount received or accrued, directly or indirectly, if the determination of such amount depends in whole or in part on the income or profits of any person. However, an amount received or accrued generally will not be excluded from the term “interest” solely because it is based on a fixed percentage or percentages of receipts or sales. In addition, an amount that is based on the income or profits of a debtor will be qualifying interest income as long as the debtor derives substantially all of its income from the real property securing the debt from leasing substantially all of its interest in such real property, but only to the extent that the amounts received by the debtor would be qualifying “rents from real property” if received directly by a REIT.
Interest on debt secured by mortgages on real property or on interests in real property generally is qualifying income for purposes of the 75% gross income test. Except as provided below, in cases where a mortgage loan is secured by both real property and other property, if the outstanding principal balance of a mortgage loan during the year exceeds the value of the real property securing the loan at the time we committed to acquire the loan. Notwithstanding the foregoing, a mortgage loan secured by both real property and personal property shall be treated as a wholly qualifying real estate asset and all interest shall be qualifying income for purposes of the 75% income test if the fair market value of such personal property does not exceed 15% of the total fair market value of all such property, even if the real property collateral value is less than the outstanding principal balance of the loan.
In the event a mortgage loan is modified, we may be required to retest the loan under the apportionment rules discussed above by comparing the outstanding balance of the modified loan to the fair market value of the collateral real property at the time of modification.
Prohibited Transaction Income. The Code imposes a tax of 100% on net income derived by a REIT from a “prohibited transaction,” which is generally a sale or other disposition of property, other than foreclosure property, held primarily for sale to customers in the ordinary course of a trade or business. Such property is also frequently referred to as “dealer property.” Any losses incurred on sales of dealer property may not be used to offset gains from other prohibited transactions. The Code sets forth a safe harbor for REITs that wish to sell property without risking the imposition of the 100% tax (the “Safe Harbor”). In general, under the Safe Harbor, a sale of property will not be treated as a sale of dealer property subject to the 100% tax if: (a) the REIT held the property for at least two years, (b) the aggregate expenditures made by the REIT during the two years preceding the date of sale that are includible in the basis of the property do not exceed 30% of the net selling price, (c) in the case of land or improvements, the REIT has held the property for at least two years for production of rental income, and (d) one of the following is true: (1) during the taxable year the REIT does not make more than seven sales of properties, (2) the aggregate adjusted bases of properties sold during the year does not exceed 10% of the aggregate bases of all of the properties of the REIT at the beginning of the year, (3) the fair market value of properties sold during the year does not exceed 10% of the fair market value of all of the properties of the REIT at the beginning of the year, (4) the aggregate adjusted bases of properties sold during the year does not exceed 20% of the aggregate bases of all of the properties of the REIT at the beginning of the year, provided that the “3-year average adjusted bases percentage” (generally, the aggregate adjusted bases of properties sold in the three years ending during the year of sale divided by the sum of the aggregate adjusted bases of all properties as of the beginning of each such year) for the taxable year does not exceed 10%, or (5) the fair market value of properties sold during the year does not exceed 20% of the fair market value of all of the properties of the REIT at the beginning of the year, provided that the “3-year average fair market value percentage” (defined similarly to the 3-year average adjusted bases percentage but using fair market values) for the taxable year does not exceed 10%. Additionally, if clauses (d)(2) through (5) are relied upon, substantially all of the marketing and development expenditures with respect to the properties sold were made through an independent contractor from whom the REIT does not itself derive or receive any income or through a TRS.
As the general partner of our operating partnership, we intend to cause our operating partnership to hold its properties for investment with a view to long-term appreciation, to engage in the business of acquiring, developing and owning its properties and to make occasional sales of the properties as are consistent with our investment objectives. We do not intend, and do not intend to permit our operating partnership or its subsidiary
217
partnerships, to enter into any sales that are prohibited transactions. However, the IRS may successfully contend that some or all of the sales made by our operating partnership or its subsidiary partnerships are prohibited transactions. We would be required to pay the 100% penalty tax on our allocable share of the gains resulting from any such sales. The 100% penalty tax will not apply to gains from the sale of assets that are held through a TRS, but such income will be subject to regular U.S. federal corporate income tax.
Hedging Transactions. From time to time, we may enter into hedging transactions with respect to one or more of our assets or liabilities. Our hedging activities may include entering into interest rate swaps, caps, and floors, options to purchase these items, and futures and forward contracts. Income from a hedging transaction, including gain from the sale or disposition of such a transaction, that is clearly identified as a hedging transaction as specified in the Code will not constitute gross income under, and thus will be exempt from, the 75% and 95% gross income tests. The term “hedging transaction,” as used above, generally means (A) any transaction we enter into in the normal course of our business primarily to manage risk of (1) interest rate changes or fluctuations with respect to borrowings made or to be made by us to acquire or carry real estate assets, or (2) currency fluctuations with respect to an item of qualifying income under the 75% or 95% gross income test or any property which generates such income and (B) new transactions entered into to hedge the income or loss from prior hedging transactions, where the property or indebtedness which was the subject of the prior hedging transaction was extinguished or disposed of. To the extent that we do not properly identify such transactions as hedges or we hedge with other types of financial instruments, the income from those transactions is not likely to be treated as qualifying income for purposes of the gross income tests. We intend to structure any hedging transactions in a manner that does not jeopardize our status as a REIT.
Foreign Currency Gain. Certain foreign currency gains will be excluded from gross income for purposes of one or both of the gross income tests. “Real estate foreign exchange gain” will be excluded from gross income for purposes of the 75% gross income test. Real estate foreign exchange gain generally includes foreign currency gain attributable to any item of income or gain that is qualifying income for purposes of the 75% and 95% gross income tests, foreign currency gain attributable to the acquisition or ownership of (or becoming or being the obligor under) obligations secured by mortgages on real property or an interest in real property and certain foreign currency gain attributable to certain “qualified business units” of a REIT. “Passive foreign exchange gain” will be excluded from gross income for purposes of the 95% gross income test. Passive foreign exchange gain generally includes real estate foreign exchange gain as described above, and also includes foreign currency gain attributable to any item of income or gain that is qualifying income for purposes of the 95% gross income test and foreign currency gain attributable to the acquisition or ownership of (or becoming or being the obligor under) obligations. These exclusions for real estate foreign exchange gain and passive foreign exchange gain do not apply to certain foreign currency gain derived from dealing, or engaging in substantial and regular trading, in securities. Such gain is treated as nonqualifying income for purposes of both the 75% and 95% gross income tests.
TRS Income. To the extent our TRSs pay dividends or interest, its allocable share of such dividend or interest income will qualify under the 95%, but not the 75%, gross income test (except to the extent the interest is paid on a loan that is adequately secured by real property). We will monitor the amount of the dividend and other income from our TRSs and will take actions intended to keep this income, and any other nonqualifying income, within the limitations of the gross income tests. Although we expect these actions will be sufficient to prevent a violation of the gross income tests, we cannot guarantee that such actions will in all cases prevent such a violation.
Failure to Satisfy Gross Income Tests. We intend to monitor our sources of income, including any non-qualifying income received by us, and manage our assets so as to ensure our compliance with the gross income tests. If we fail to satisfy one or both of the 75% or 95% gross income tests for any taxable year, we may nevertheless qualify as a REIT for the year if we are entitled to relief under certain provisions of the Code. We generally may make use of the relief provisions if: (1) our failure to meet these tests was due to reasonable cause and not due to willful neglect; and (2) following our identification of the failure to meet the 75% or 95% gross income tests for any taxable year, we file a schedule with the IRS setting forth each item of our gross income for purposes of the 75% or 95% gross income tests for such taxable year in accordance with Treasury Regulations to be issued.
218
It is not possible, however, to state whether in all circumstances we would be entitled to the benefit of these relief provisions. As discussed above, even if these relief provisions apply, and we retain our status as a REIT, a tax would be imposed with respect to our nonqualifying income.
Asset Tests
At the close of each calendar quarter of our taxable year, we must also satisfy certain tests relating to the nature and diversification of our assets. First, at least 75% of the value of our total assets must generally consist of:
| | • | | Cash or cash items, including certain receivables and shares in certain money market funds; |
| | • | | Interests in real property, including leaseholds and options to acquire real property and leaseholds; |
| | • | | Interests in mortgage loans secured by real property, and interests in mortgage loans secured by both real property and personal property if the fair market value of such personal property does not exceed 15% of the total fair market value of all such property; |
| | • | | Stock or shares of beneficial interest in other REITs; |
| | • | | Investments in stock or debt instruments during the one-year period following its receipt of new capital that we raise through equity offerings or public offerings of debt with at least a five-year term; |
| | • | | Debt instruments of publicly offered REITs; and |
| | • | | Personal property leased in connection with a lease of real property for which the rent attributable to personal property is not greater than 15% of the total rent received under the lease. |
Second, under the “5% asset test,” of our assets that are not qualifying assets for purposes of the 75% asset test described above, the value of our interest in any one issuer’s securities may not exceed 5% of the value of our total assets.
Third, of our assets that are not qualifying assets for purposes of the 75% asset test described above, we may not own more than 10% of the voting power of any one issuer’s outstanding securities, or the “10% vote test,” or more than 10% of the value of any one issuer’s outstanding securities, or the “10% value test.”
Fourth, no more than 20% of the value of our total assets may consist of the securities of one or more TRSs.
Fifth, no more than 25% of the value of our total assets may consist of the securities of TRSs and other assets that are not qualifying assets for purposes of the 75% asset test.
Sixth, not more than 25% of the value of our total assets may be represented by Nonqualified Publicly Offered REIT Debt Instruments.
For purposes of the 5% asset test, the 10% vote test and the 10% value test, the term “securities” does not include securities that qualify under the 75% asset test, securities of a TRS and equity interests in an entity taxed as a partnership for U.S. federal income tax purposes. For purposes of the 10% value test, the term “securities” also does not include: certain “straight debt” securities; any loan to an individual or an estate; most rental agreements and obligations to pay rent; any debt instrument issued by an entity taxed as a partnership for U.S. federal income tax purposes in which we are an owner to the extent of our proportionate interest in the debt and equity securities of the entity; and any debt instrument issued by an entity taxed as a partnership for U.S. federal income tax purposes if at least 75% of the entity’s gross income, excluding income from prohibited transactions, is qualifying income for purposes of the 75% gross income test described above in “—Gross Income Tests.”
219
From time to time we may own securities (including debt securities) of issuers that do not qualify as a REIT, a qualified REIT subsidiary or a TRS. We intend that our ownership of any such securities will be structured in a manner that allows us to comply with the asset tests described above. We believe that the assets that we hold satisfy the foregoing asset test requirements. We will not obtain, nor are we required to obtain under the U.S. federal income tax laws, independent appraisals to support our conclusions as to the value of our assets and securities. Moreover, the values of some assets may not be susceptible to a precise determination. As a result, there can be no assurance that the IRS will not contend that our ownership of securities and other assets violates one or more of the asset tests applicable to REITs.
Failure to Satisfy Asset Tests. We will monitor the status of our assets for purposes of the various asset tests and will manage our portfolio in order to comply at all times with such tests. Nevertheless, if we fail to satisfy the asset tests at the end of a calendar quarter, we will not lose our REIT status if: (1) we satisfied the asset tests at the end of the preceding calendar quarter; and (2) the discrepancy between the value of our assets and the asset test requirements arose from changes in the market values of our assets and was not caused, in part or in whole, by the acquisition of one or more non-qualifying assets. If we did not satisfy the second condition described in the preceding sentence, we still could avoid REIT disqualification by eliminating any discrepancy within 30 days after the close of the calendar quarter in which the discrepancy arose.
In the event that we violate the 5% asset test, the 10% vote test or the 10% value test described above, we will not lose our REIT status if (1) the failure is de minimis (up to the lesser of 1% of our assets or $10 million) and (2) we dispose of assets causing the failure or otherwise comply with the asset tests within six months after the last day of the quarter in which we identify such failure. In the event of a failure of any of such asset tests other than a de minimis failure, as described in the preceding sentence, we will not lose our REIT status if (1) the failure was due to reasonable cause and not to willful neglect, (2) we file a description of each asset causing the failure with the IRS, and (3) we dispose of assets causing the failure or otherwise complies with the asset tests within six months after the last day of the quarter in which we identify the failure. In such case, we must pay a tax equal to the greater of $50,000 or the highest U.S. federal corporate income tax rate multiplied by the net income from the non-qualifying assets during the period in which we failed to satisfy the asset tests.
Annual Distribution Requirement
To maintain our qualification as a REIT, each taxable year we are required to distribute dividends, other than capital gain dividends, to our stockholders in an amount at least equal to the sum of:
| | • | | 90% of our REIT taxable income; plus |
| | • | | 90% of our after-tax net income, if any, from foreclosure property; minus |
| | • | | the excess of the sum of certain items of non-cash income over 5% of our REIT taxable income. |
For these purposes, our REIT taxable income is computed without regard to the dividends paid deduction and our net capital gain. In addition, for purposes of this test, non-cash income generally means income attributable to leveled stepped rents, original issue discount, cancellation of indebtedness, or a like-kind exchange that is later determined to be taxable.
We generally must pay, or be treated as paying, the distributions described above in the taxable year to which they relate. Dividends declared during the last three months of the taxable year, payable to stockholders of record on a specified date during such period and paid during January of the following year, will be treated as paid by us and received by our stockholders on December 31 of the year in which they are declared. Additionally, at our election, a distribution will be treated as paid in a taxable year if it is declared before we timely file our tax return for such year and paid on or before the first regular dividend payment after such declaration, provided such payment is made during the 12-month period following the close of such year. These distributions are treated as received by our stockholders in the year in which they are paid. This is so even though these distributions relate to the prior year for purposes of the annual distribution requirement.
220
In order to be taken into account for purposes of annual distribution requirement, except as provided below, the amount distributed must not be preferential—i.e., every stockholder of the class of stock to which a distribution is made must be treated the same as every other stockholder of that class, and no class of stock may be treated other than according to its dividend rights as a class. This preferential limitation will not apply to distributions made by us, provided we qualify as a “publicly offered REIT.” We believe that we are, and expect we will continue to be, a publicly offered REIT. To the extent that we do not distribute all of our net capital gain, or distributes at least 90%, but less than 100%, of our REIT taxable income, we will be required to pay regular U.S. federal corporate income tax on the undistributed amount. We believe that we have made, and we intend to continue to make, timely distributions sufficient to satisfy the annual distribution requirement and to minimize our corporate tax obligations. In this regard, our operating partnership agreement authorizes us to take such steps as may be necessary to cause our operating partnership to distribute to its partners an amount sufficient to permit us to meet the annual distribution requirement and to minimize our corporate tax obligation.
Under some circumstances, we may be able to rectify an inadvertent failure to meet the annual distribution requirement for a year by paying “deficiency dividends” to our stockholders in a later year, which may be included in our deduction for dividends paid for the earlier year. In that case, we may be able to avoid being taxed on amounts distributed as deficiency dividends, subject to the 4% excise tax described below. However, we will be required to pay interest to the IRS based upon the amount of any deduction claimed for deficiency dividends. While the payment of a deficiency dividend will apply to a prior year for purposes of the annual distribution requirement, it will be treated as an additional distribution to our stockholders in the year such dividend is paid. In addition, if a dividend we have paid with respect to a period for which we are not a publicly offered REIT is treated as a preferential dividend, in lieu of treating the dividend as not counting toward satisfying the annual distribution requirement, the IRS may provide a remedy to cure such failure if the IRS determines that such failure is (or is of a type that is) inadvertent or due to reasonable cause and not due to willful neglect.
Furthermore, we will be required to pay a 4% excise tax to the extent we fail to distribute during each calendar year at least the sum of 85% of our ordinary income for such year, 95% of our capital gain net income for the year and any undistributed taxable income from prior periods. Any ordinary income and net capital gain on which corporate income tax is imposed for any year is treated as an amount distributed during that year for purposes of calculating this excise tax.
We expect that our REIT taxable income will be less than our cash flow because of depreciation and other non-cash charges included in computing REIT taxable income. Accordingly, we anticipate that we generally will have sufficient cash or liquid assets to enable us to satisfy the annual distribution requirement described above. However, from time to time, we may not have sufficient cash or other liquid assets to meet the annual distribution requirement due to timing differences between the actual receipt of income and actual payment of deductible expenses, and the inclusion of income and deduction of expenses in determining our taxable income. In addition, we may decide to retain our cash, rather than distribute it, in order to repay debt or for other reasons. If these timing differences occur, we may borrow funds to pay dividends or pay dividends in the form of taxable stock distributions in order to meet the annual distribution requirement, while preserving our cash.
Like-Kind Exchanges
We may dispose of real property that is not held primarily for sale in transactions intended to qualify as like- kind exchanges under the Code. Such like-kind exchanges are intended to result in the deferral of gain for U.S. federal income tax purposes. The failure of any such transaction to qualify as a like-kind exchange could require us to pay U.S. federal income tax, possibly including the 100% prohibited transaction tax, or deficiency dividends, depending on the facts and circumstances surrounding the particular transaction.
221
Foreclosure Property
The foreclosure property rules permit us (by our election) to foreclose or repossess properties without being disqualified as a REIT as a result of receiving income that does not qualify under the gross income tests. However, in such a case, we would be subject to the U.S. federal corporate income tax on the net non-qualifying income from “foreclosure property,” and the after-tax amount would increase the dividends we would be required to distribute to our stockholders. See “—Annual Distribution Requirement.” This corporate tax would not apply to income that qualifies under the REIT 75% income test.
Foreclosure property treatment will end on the first day on which we enter into a lease of the applicable property that will give rise to income that does not qualify under the REIT 75% income test, but will not end if the lease will give rise only to qualifying income under such test. Foreclosure property treatment also will end if any construction takes place on the property (other than completion of a building or other improvement that was more than 10% complete before default became imminent). Foreclosure property treatment (other than for qualified health care property) is available for an initial period of three years and may, in certain circumstances, be extended for an additional three years. Foreclosure property treatment for qualified health care property is available for an initial period of two years and may, in certain circumstances, be extended for an additional four years.
Failure to Qualify
If we discover a violation of a provision of the Code that would result in our failure to qualify as a REIT, certain specified cure provisions may be available to us. Except with respect to violations of the gross income tests and asset tests (for which the cure provisions are described above), and provided the violation is due to reasonable cause and not due to willful neglect, these cure provisions generally impose a $50,000 penalty for each violation in lieu of a loss of REIT status. If we fail to satisfy the requirements for taxation as a REIT in any taxable year, and the relief provisions do not apply, we will be required to pay regular U.S. federal corporate income tax, including any applicable alternative minimum tax for taxable years beginning before January 1, 2018, on our taxable income. Distributions to our stockholders in any year in which we fail to qualify as a REIT will not be deductible by us. As a result, we anticipate that our failure to qualify as a REIT would reduce the cash available for distribution by us to our stockholders. In addition, if we fail to qualify as a REIT, we will not be required to distribute any amounts to our stockholders and all distributions to our stockholders will be taxable as regular corporate dividends to the extent of our current and accumulated earnings and profits. In such event, corporate distributees may be eligible for the dividends-received deduction. In addition, non-corporate stockholders, including individuals, may be eligible for the preferential tax rates on qualified dividend income. Non-corporate stockholders, including individuals, generally may deduct up to 20% of dividends from a REIT, other than capital gain dividends and dividends treated as qualified dividend income, for taxable years beginning after December 31, 2017 and before January 1, 2026. If we fail to qualify as a REIT, such stockholders may not claim this deduction with respect to dividends paid by us. Unless entitled to relief under specific statutory provisions, we would also be ineligible to elect to be treated as a REIT for the four taxable years following the year for which we lose our REIT qualification. It is not possible to state whether in all circumstances we would be entitled to this statutory relief.
Tax Aspects of Our Ownership of Interests in Entities Taxable as Partnerships
The following discussion summarizes the material U.S. federal income tax considerations that are applicable to our direct and indirect investments in entities that are treated as partnerships for U.S. federal income tax purposes. The following discussion does not address state or local tax laws or any U.S. federal tax laws other than income tax laws.
Classification as Partnerships
We are required to include in our income our distributive share of each partnership’s income and are allowed to deduct our distributive share of each partnership’s losses, but only if the partnership is classified for
222
U.S. federal income tax purposes as a partnership rather than as a corporation or an association treated as a corporation. An unincorporated entity with at least two owners, as determined for U.S. federal income tax purposes, will be classified as a partnership, rather than as a corporation, for U.S. federal income tax purposes if it: (1) is treated as a partnership under the Treasury Regulations relating to entity classification, or the “check-the-box regulations;” and (2) is not a “publicly traded partnership.”
Under the check-the-box regulations, an unincorporated entity with at least two owners may elect to be classified either as an association treated as a corporation or as a partnership for U.S. federal income tax purposes. If such an entity does not make an election, it generally will be taxed as a partnership for U.S. federal income tax purposes.
A publicly traded partnership is a partnership whose interests are traded on an established securities market or are readily tradable on a secondary market or the substantial equivalent thereof. A publicly traded partnership generally is treated as a corporation for U.S. federal income tax purposes, but will not be so treated if, for each taxable year beginning after December 31, 1987 in which it was classified as a publicly traded partnership, at least 90% of the partnership’s gross income consisted of specified passive income, including real property rents, gains from the sale or other disposition of real property, interest, and dividends, or the “90% passive income exception.” The Treasury Regulations provide limited safe harbors from treatment as a publicly traded partnership. Pursuant to one of those safe harbors, interests in a partnership will not be treated as readily tradable on a secondary market or the substantial equivalent thereof if (1) all interests in the partnership were issued in a transaction or transactions that were not required to be registered under the Securities Act, and (2) the partnership does not have more than 100 partners at any time during the partnership’s taxable year. In determining the number of partners in a partnership, a person owning an interest in a partnership, grantor trust, or S corporation that owns an interest in the partnership is treated as a partner in the partnership only if (1) substantially all of the value of the owner’s interest in the entity is attributable to the entity’s direct or indirect interest in the partnership and (2) a principal purpose of the use of the entity is to permit the partnership to satisfy the 100-partner limitation. If any partnership does not qualify for any safe harbor and is treated as a publicly traded partnership, we believe that such partnership would have sufficient qualifying income to satisfy the 90% passive income exception and, therefore, would not be treated as a corporation for U.S. federal income tax purposes.
We have not requested, and do not intend to request, a ruling from the IRS that any of our subsidiary partnerships is or will be classified as a partnership for U.S. federal income tax purposes. If, for any reason, a subsidiary partnership were treated as a corporation, rather than as a partnership, for U.S. federal income tax purposes, we may not be able to qualify as a REIT, unless we qualify for certain statutory relief provisions. See “—Gross Income Tests” and “—Asset Tests.” In addition, any change in a subsidiary partnership’s status for U.S. federal income tax purposes might be treated as a taxable event, in which case we might incur tax liability without any related cash distribution. See “—Annual Distribution Requirement.” Further, items of income and deduction of the subsidiary partnership would not pass through to us, and we would be treated as a stockholder for U.S. federal income tax purposes. Consequently, the subsidiary partnership would be required to pay income tax at U.S. federal corporate income tax rates on its net income, and distributions to us would constitute dividends that would not be deductible in computing the partnership’s taxable income.
Allocations of Income, Gain, Loss and Deduction
Although a partnership agreement (or limited liability company agreement) generally will determine the allocation of income and losses among partners, the allocations will be disregarded for tax purposes if they do not comply with the provisions of the U.S. federal income tax laws governing partnership allocations. If an allocation is not recognized for U.S. federal income tax purposes, the item subject to the allocation will be reallocated in accordance with the partners’ interests in the partnership, which will be determined by taking into account all of the facts and circumstances relating to the economic arrangement of the partners with respect to such item.
223
Tax Allocations With Respect to Contributed Properties
Under Section 704(c) of the Code, income, gain, loss and deduction attributable to appreciated or depreciated property that is contributed to a partnership in exchange for an interest in the partnership must be allocated in a manner so that the contributing partner is charged with the unrealized gain or benefits from the unrealized loss associated with the property at the time of the contribution. The amount of the unrealized gain or unrealized loss generally is equal to the difference between the fair market value or book value and the adjusted tax basis of the contributed property at the time of contribution (this difference is referred to as a book-tax difference), as adjusted from time to time. These allocations are solely for U.S. federal income tax purposes and do not affect the book capital accounts or other economic or legal arrangements among the partners.
Our partnerships may, from time to time, acquire interests in property in exchange for interests in the acquiring partnership. In that case, the tax basis of these property interests generally will carry over to the acquiring partnership, notwithstanding their different book (i.e., fair market) value. Our operating partnership agreement requires that income and loss allocations with respect to these properties be made in a manner consistent with Section 704(c) of the Code. Treasury Regulations issued under Section 704(c) of the Code provide partnerships with a choice of several methods of accounting for book-tax differences. Depending on the method we choose or have agreed to in connection with any particular contribution, the carryover basis of each of the contributed interests in the properties in the hands of our operating partnership (1) could cause us to be allocated lower amounts of depreciation deductions for tax purposes than would be allocated to us if any of the contributed properties were to have a tax basis equal to its respective fair market value at the time of the contribution and (2) could cause us to be allocated taxable gain in the event of a sale of such contributed interests or properties in excess of the economic or book income allocated to it as a result of such sale, with a corresponding benefit to the other partners in our operating partnership. An allocation described in clause (1) or (2) above might cause us or the other partners to recognize additional taxable income, including taxable income in excess of cash proceeds in the event of a sale or other disposition of property, which might adversely affect our ability to comply with the REIT distribution requirements. See “—Taxation of Our Company—Requirements for Qualification as a REIT” and “—Annual Distribution Requirement.”
Any property acquired by a partnership in a taxable transaction will initially have a tax basis equal to its fair market value, and Section 704(c) of the Code generally will not apply.
Material U.S. Federal Income Tax Consequences to Holders of Common Stock
The following summary describes the material U.S. federal income tax consequences of owning and disposing of common stock. For purposes of this summary, a “holder” means a beneficial owner of shares of common stock, and a “U.S. holder” means a holder that, for U.S. federal income tax purposes, is or is treated as:
| | • | | an individual who is a citizen or resident of the United States; |
| | • | | a corporation (or other entity taxable as a corporation) created or organized under the laws of the United States, any state thereof, or the District of Columbia; |
| | • | | an estate, the income of which is subject to U.S. federal income taxation regardless of its source; or |
| | • | | a trust that (i) is subject to the primary supervision of a United States court and the control of one or more “United States persons” (within the meaning of Section 7701(a)(30) of the Code), or (ii) has a valid election in effect under applicable Treasury Regulations to be treated as a United States person for U.S. federal income tax purposes. |
For purposes of this summary, a “non-U.S. holder” means a holder that is not a “U.S. holder” and not a partnership.
If an entity or arrangement treated as a partnership for U.S. federal income tax purposes holds shares of common stock, the tax treatment of an owner of such entity or arrangement generally will depend on the status of
224
the owner, the activities of the entity or arrangement and certain tax determinations made at the owner level. Accordingly, entities or arrangements treated as partnerships for U.S. federal income tax purposes holding shares of common stock and the owners of such entities or arrangements should consult their own tax advisors regarding the U.S. federal income tax consequences to them.
This discussion of material U.S. federal income tax consequences of the ownership and disposition of common stock is not binding on the IRS. No assurance can be given that the IRS would not assert, or that a court would not sustain, a position contrary to any described herein.
THIS DISCUSSION IS FOR INFORMATIONAL PURPOSES ONLY AND IS NOT TAX ADVICE. YOU SHOULD CONSULT YOUR TAX ADVISOR WITH RESPECT TO THE APPLICATION OF THE U.S. FEDERAL INCOME TAX LAWS TO YOUR PARTICULAR CIRCUMSTANCES AS WELL AS THE OWNERSHIP AND DISPOSITION OF COMMON STOCK ARISING UNDER THE U.S. FEDERAL ESTATE OR GIFT TAX LAWS OR UNDER THE LAWS OF ANY STATE, LOCAL OR NON-U.S. TAXING JURISDICTION OR UNDER ANY APPLICABLE INCOME TAX TREATY.
Taxation of Taxable U.S. Holders of Common Stock
Distributions Generally. If we qualify as a REIT, distributions made out of our current or accumulated earnings and profits that we do not designate as capital gain dividends will be ordinary dividend income to taxable U.S. holders when actually or constructively received. A corporate U.S. holder will not qualify for the dividends-received deduction generally available to corporations. Ordinary dividends paid by us also generally will not qualify for the preferential long-term capital gain tax rate applicable to “qualified dividends” unless certain holding period requirements are met and such dividends are attributable to (i) qualified dividends received by us from non-REIT corporations, such as any TRSs, or (ii) income recognized by us and on which we have paid U.S. federal corporate income tax. We do not expect a meaningful portion of our ordinary dividends to be eligible for taxation as qualified dividends. However, under the Tax Cuts and Jobs Act, for taxable years beginning after December 31, 2017 and before January 1, 2026, stockholders that are individuals, trusts or estates generally may deduct up to 20% of certain qualified business income, including “qualified REIT dividends” (generally, dividends received by a REIT stockholder that are not designated as capital gain dividends or qualified dividend income), subject to certain limitations.
Any distribution declared by us in October, November or December of any year on a specified date in any such month shall be treated as both paid by us and received by our stockholders on December 31 of that year, provided that the distribution is actually paid by us no later than January 31 of the following year. Distributions made by us in excess of accumulated earnings and profits will be treated as a nontaxable return of capital to the extent of a U.S. holder’s basis and will reduce the basis of the U.S. holder’s shares. Any distributions by us in excess of accumulated earnings and profits and in excess of a U.S. holder’s basis in the U.S. holder’s shares of our stock will be treated as gain from the sale of such shares. See “Dispositions of Common Stock” below.
Capital Gain Dividends. Distributions to U.S. holders that we properly designate as capital gain dividends will be taxed as long term capital gains (to the extent they do not exceed our actual net capital gain for the taxable year), without regard to the period for which a U.S. holder held our shares. However, U.S. holders that are corporations may be required to treat up to 20% of certain capital gain dividends as ordinary income.
Retention of Net Capital Gains. If we elect to retain and pay income tax on any net long-term capital gain, each of our U.S. holders would include in income, as long-term capital gain, its proportionate share of this net long-term capital gain. Each of our U.S. holders would also receive a refundable tax credit for its proportionate share of the tax paid by us on such retained capital gains and increase the basis of its shares of our stock in an amount equal to the amount of includable capital gains reduced by the share of refundable tax credit.
Dispositions of Common Stock. If a U.S. holder sells or disposes of shares of common stock, the holder will recognize gain or loss for U.S. federal income tax purposes in an amount equal to the difference between the
225
amount of cash and the fair market value of any property received on the sale or other disposition and the holder’s adjusted tax basis in the shares. This gain or loss, except as provided below, will be long-term capital gain or loss if the holder’s holding period for such common stock exceeds one year. However, if a U.S. holder recognizes a loss upon the sale or other disposition of common stock that it has held for six months or less, after applying certain holding period rules, the loss recognized will be treated as a long-term capital loss to the extent the U.S. holder received distributions from us which were required to be treated as long-term capital gains. If a U.S. holder recognizes a loss upon a subsequent disposition of common stock in an amount that exceeds a prescribed threshold, it is possible that the provisions of Treasury Regulations involving “reportable transactions” could apply, with a resulting requirement to separately disclose the loss generating transactions to the IRS. While these regulations are directed towards “tax shelters,” they are written quite broadly, and apply to transactions that would not typically be considered tax shelters. Significant penalties apply for failure to comply with these requirements. U.S. holders should consult their tax advisors concerning any possible disclosure obligation with respect to the receipt or disposition of common stock, or transactions that might be undertaken directly or indirectly by us. Moreover, U.S. holders should be aware that we and other participants in transactions involving us (including its advisors) might be subject to disclosure or other requirements pursuant to these regulations.
Passive Activity Losses and Investment Interest Limitations. Distributions made by us and gain arising from the sale or exchange by a U.S. holder of common stock will not be treated as passive activity income. As a result, U.S. holders will not be able to apply any “passive losses” against income or gain relating to common stock. Distributions made by us, to the extent they do not constitute a return of capital, generally will be treated as investment income for purposes of computing the investment interest limitation. A U.S. holder that elects to treat capital gain dividends, qualified dividend income or capital gains from the disposition of common stock as investment income for purposes of the investment interest limitation will be taxed at ordinary income rates on such amounts.
Taxation of Tax-Exempt Holders of Common Stock
Tax-exempt entities are generally exempt from U.S. federal income taxation. However, they are subject to taxation on their UBTI. Distributions made by us and gain arising upon a sale of shares of common stock generally should not be UBTI to a tax-exempt holder, except as described below. This income or gain will be UBTI, however, to the extent a tax-exempt holder holds its shares as “debt-financed property” within the meaning of the Code or to the extent of the tax-exempt holder’s allocable shares of our “excess inclusion income,” if any. Generally, “debt-financed property” is property the acquisition or holding of which was financed through a borrowing by the tax-exempt holder.
For tax-exempt holders that are social clubs, voluntary employee benefit associations or supplemental unemployment benefit trusts exempt from U.S. federal income taxation under Sections 501(c)(7), (c)(9) or (c)(17) of the Code, respectively, income from an investment in our shares will constitute UBTI unless the organization is able to properly claim a deduction for amounts set aside or placed in reserve for specific purposes so as to offset the income generated by its investment in our shares. These prospective investors should consult their own tax advisors concerning these “set aside” and reserve requirements.
Notwithstanding the above, however, a portion of the dividends paid by a “pension-held REIT” may be treated as UBTI as to certain trusts that hold more than 10%, by value, of the interests in the REIT. A REIT will not be a “pension-held REIT” if it is able to satisfy the “not closely held” requirement without relying on the “look-through” exception with respect to certain trusts or if such REIT is not “predominantly held” by “qualified trusts.” As a result of restrictions on ownership and transfer of our stock contained in our charter, we do not expect to be classified as a “pension-held REIT,” and as a result, the tax treatment described above should be inapplicable to our holders.
226
Taxation of Non-U.S. Holders of Common Stock
The rules governing non-U.S. holders are complex, and no attempt is made herein to provide more than a brief summary of such rules. We urge non-U.S. holders to consult their own tax advisors to determine the impact of U.S. federal, state, local and non-U.S. income and other tax laws and any applicable tax treaty on the acquisition, ownership and disposition of shares of our common stock, including any reporting requirements.
Distributions Generally. Distributions made by us to non-U.S. holders that are not attributable to gains from sales or exchanges by us of United States real property interests, or USRPIs, and that are not designated by us as capital gain dividends will be treated as ordinary dividends to the extent that they are made out of our current or accumulated earnings and profits. Such distributions ordinarily will be subject to withholding of U.S. federal income tax at a 30% rate on the gross amount of the dividend paid, unless reduced or eliminated by an applicable income tax treaty. Any portion of the dividends paid to non-U.S. holders that are treated as excess inclusion income will not be eligible for exemption from the 30% withholding tax or a reduced treaty rate.
If the investment in our stock is treated as effectively connected with the conduct by the non-U.S. holder of a U.S. trade or business (and, if required by an applicable income tax treaty, the non-U.S. holder maintains a permanent establishment in the United States to which such dividends are attributable), the non-U.S. holder generally will be subject to a tax at the rates applicable to ordinary income, in the same manner as a U.S. holders is taxed with respect to ordinary dividend income (and also may be subject to the 30% branch profits tax in the case of a non-U.S. holder that is a foreign corporation that is not entitled to any treaty exemption or reduction in rate). In general, a non-U.S. holder will not be considered to be engaged in a U.S. trade or business solely as a result of its ownership of our stock, and we will not withhold on the basis of a non-U.S. holder being so engaged unless such non-U.S. holder has filed an IRS Form W-8ECI with us. Distributions in excess of our current and accumulated earnings and profits will not be taxable to a non-U.S. holder to the extent that such distributions do not exceed the adjusted tax basis of the holder’s common stock. Instead, the excess portion of such distribution will reduce the non-U.S. holder’s tax basis in our common stock. To the extent that such distributions exceed the non-U.S. holder’s adjusted tax basis in such common stock, they generally will give rise to gain from the sale or exchange of such stock, the tax treatment of which is described below. However, such excess distributions may be treated as dividend income for certain non-U.S. holders.
For withholding purposes, we expect to treat all distributions as made out of our current or accumulated earnings and profits. Thus, we expect to withhold U.S. federal income tax at the rate of 30% on the gross amount of any distributions paid to a non-U.S. holder unless a lower treaty rate applies and the non-U.S. holder has filed an applicable IRS Form W-8 with us, certifying the non-U.S. holder’s entitlement to treaty benefits. However, amounts withheld may be refundable if it is subsequently determined that the distribution was, in fact, in excess of our current and accumulated earnings and profits, provided that certain conditions are met.
Capital Gain Dividends and Distributions Attributable to a Sale or Exchange of United States Real Property Interests. Distributions to a non-U.S. holder that we properly designate as capital gain dividends, other than those arising from the disposition of a USRPI, generally should not be subject to U.S. federal income taxation, unless:
| | • | | the investment in common stock is treated as effectively connected with the conduct by the non-U.S. holder of a trade or business within the United States (and, if required by an applicable income tax treaty, the non-U.S. holder maintains a permanent establishment in the United States to which such dividends are attributable), in which case the non-U.S. holder will be subject to the same treatment as U.S. holders with respect to such gain, except that a non-U.S. holder that is a corporation may also be subject to a branch profits tax of up to 30%, as discussed above; or |
| | • | | the non-U.S. holder is a nonresident alien individual who is present in the United States for 183 days or more during the taxable year and certain other conditions are met, in which case the non-U.S. holder will be subject to U.S. federal income tax at a rate of 30% on the non-U.S. holder’s capital gains (or such |
227
| | lower rate specified by an applicable income tax treaty), which may be offset by U.S. source capital losses of such non-U.S. holder (even though the individual is not considered a resident of the United States), provided the non-U.S. holder has timely filed U.S. federal income tax returns with respect to such losses. |
Pursuant to the Foreign Investment in Real Property Tax Act, or FIRPTA, distributions to a non-U.S. holder that are attributable to gain from sales or exchanges by us of USRPIs, whether or not designated as capital gain dividends, will cause the non-U.S. holder to be treated as recognizing such gain as income effectively connected with a U.S. trade or business. Non-U.S. holders generally would be taxed at the regular graduated rates applicable to U.S. holders, subject to any applicable alternative minimum tax and a special alternative minimum tax in the case of nonresident alien individuals. We also will be required to withhold and to remit to the IRS 21% of any distribution to non-U.S. holders attributable to gain from sales or exchanges by us of USRPIs. Distributions subject to FIRPTA may also be subject to a 30% branch profits tax in the hands of a non-U.S. holder that is a corporation. The amount withheld is creditable against the non-U.S. holder’s U.S. federal income tax liability. However, any distribution with respect to any class of stock that is “regularly traded,” as defined by applicable Treasury Regulations, on an established securities market located in the United States is not subject to FIRPTA, and therefore, not subject to the 21% U.S. withholding tax described above, if the non-U.S. holder did not own more than 10% of such class of stock at any time during the one-year period ending on the date of the distribution. Instead, such distributions generally will be treated as ordinary dividend distributions and subject to withholding in the manner described above with respect to ordinary dividends. In addition, distributions to certain non-U.S. publicly traded stockholders that meet certain record-keeping and other requirements, or qualified stockholders, are exempt from FIRPTA, except to the extent owners of such qualified stockholders that are not also qualified stockholders own, actually or constructively, more than 10% of our capital stock. Furthermore, distributions to certain “qualified foreign pension funds” or entities all of the interests of which are held by such “qualified foreign pension funds” are exempt from FIRPTA. Non-U.S. holders should consult their own tax advisors regarding the application of these rules.
Retention of Net Capital Gains. Although the law is not clear on the matter, it appears that amounts we designate as retained net capital gains in respect of our common stock should be treated with respect to non-U.S. holders as actual distributions of capital gain dividends. Under this approach, the non-U.S. holders may be able to offset as a credit against their U.S. federal income tax liability their proportionate share of the tax paid by us on such retained net capital gains and to receive from the IRS a refund to the extent their proportionate share of such tax paid by us exceeds their actual U.S. federal income tax liability. If we were to designate any portion of our net capital gain as retained net capital gain, non-U.S. holders should consult their own tax advisors regarding the taxation of such retained net capital gain.
Dispositions of Common Stock. Gain realized by a non-U.S. holder upon the sale, exchange or other taxable disposition of common stock generally will not be subject to U.S. federal income tax unless such stock constitutes a USRPI. Our common stock will not constitute a USRPI so long as it is a “domestically controlled qualified investment entity.” A “domestically controlled qualified investment entity” includes a REIT in which at all times during a five-year testing period less than 50% in value of its stock is held directly or indirectly by non-United States persons, subject to certain rules. We believe, but cannot guarantee, that we will be a “domestically controlled qualified investment entity.”
In addition, dispositions of common stock by qualified stockholders are exempt from FIRPTA, except to the extent owners of such qualified stockholders that are not also qualified stockholders own, actually or constructively, more than 10% of our capital stock. Furthermore, dispositions of common stock by certain “qualified foreign pension funds” or entities all of the interests of which are held by such “qualified foreign pension funds” are exempt from FIRPTA. Non-U.S. holders should consult their own tax advisors regarding the application of these rules. Notwithstanding the foregoing, gain from the sale, exchange or other taxable disposition of common stock not otherwise subject to FIRPTA will be taxable to a non-U.S. holder if either:
| | • | | the gain is treated as effectively connected with the conduct by the non-U.S. holder of a trade or business within the United States (and, if required by an applicable income tax treaty, the non-U.S. holder |
228
| | maintains a permanent establishment in the United States to which such gain is attributable), in which case the non-U.S. holder will be subject to the same treatment as U.S. holders with respect to such gain, except that a non-U.S. holder that is a corporation may also be subject to the 30% branch profits tax (or such lower rate as may be specified by an applicable income tax treaty) on such gain, as adjusted for certain items; or |
| | • | | the non-U.S. holder is a nonresident alien individual who is present in the United States for 183 days or more during the taxable year and certain other conditions are met, in which case the non-U.S. holder will be subject to a 30% tax on its capital gains (or such lower rate specified by an applicable income tax treaty), which may be offset by U.S. source capital losses of such non-U.S. holder (even though the individual is not considered a resident of the United States), provided the non-U.S. holder has timely filed U.S. federal income tax returns with respect to such losses, subject to the application of certain wash sale rules. |
If gain on the sale, exchange or other taxable disposition of common stock were subject to taxation under FIRPTA, the non-U.S. holder would be required to file a U.S. federal income tax return and would be subject to regular U.S. federal income tax with respect to such gain in the same manner as a taxable U.S. holder (subject to any applicable alternative minimum tax and a special alternative minimum tax in the case of nonresident alien individuals). In addition, if the sale, exchange or other taxable disposition of common stock were subject to taxation under FIRPTA, and if shares of common stock were not “regularly traded” on an established securities market, the purchaser of such common stock generally would be required to withhold and remit to the IRS 15% of the purchase price.
Information Reporting and Backup Withholding
U.S. Holders
We will report to our U.S. holders and to the IRS the amount of distributions paid during each calendar year and the amount of tax withheld, if any, with respect thereto. A U.S. holder may be subject to information reporting and backup withholding when such holder receives payments on common stock or proceeds from the sale or other taxable disposition of such stock. Certain U.S. holders are exempt from backup withholding, including corporations and certain tax-exempt organizations. A U.S. holder will be subject to backup withholding if such holder is not otherwise exempt and:
| | • | | the holder fails to furnish the holder’s taxpayer identification number, which for an individual is ordinarily his or her social security number; |
| | • | | the holder furnishes an incorrect taxpayer identification number; |
| | • | | the applicable withholding agent is notified by the IRS that the holder previously failed to properly report payments of interest or dividends; or |
| | • | | the holder fails to certify under penalties of perjury that the holder has furnished a correct taxpayer identification number and that the IRS has not notified the holder that the holder is subject to backup withholding. |
A holder who does not provide us with its correct taxpayer identification number also may be subject to penalties imposed by the IRS. Backup withholding is not an additional tax. Any amounts withheld under the backup withholding rules may be allowed as a refund or a credit against a U.S. holder’s U.S. federal income tax liability, provided the required information is timely furnished to the IRS. U.S. holders should consult their own tax advisors regarding their qualification for an exemption from backup withholding and the procedures for obtaining such an exemption.
Non-U.S. Holders
Payments of dividends on common stock generally will not be subject to backup withholding, provided the applicable withholding agent does not have actual knowledge or reason to know the holder is a United States
229
person and the holder either certifies its non-U.S. status, such as by furnishing a valid IRS Form W-8BEN, W-8BEN-E or W-8ECI, or otherwise establishes an exemption. However, information returns are required to be filed with the IRS in connection with any distributions on common stock paid to the non-U.S. holder, regardless of whether such distributions constitute a dividend or any tax was actually withheld. In addition, proceeds of the sale or other taxable disposition of such stock within the United States or conducted through certain U.S.-related brokers generally will not be subject to backup withholding or information reporting, if the applicable withholding agent receives the certification described above and does not have actual knowledge or reason to know that such holder is a United States person, or the holder otherwise establishes an exemption. Proceeds of a disposition of such stock conducted through a non-U.S. office of a non-U.S. broker generally will not be subject to backup withholding or information reporting.
Copies of information returns that are filed with the IRS may also be made available under the provisions of an applicable treaty or agreement to the tax authorities of the country in which the non-U.S. holder resides or is established.
Backup withholding is not an additional tax. Any amounts withheld under the backup withholding rules may be allowed as a refund or a credit against a non-U.S. holder’s U.S. federal income tax liability, provided the required information is timely furnished to the IRS.
Medicare Contribution Tax on Unearned Income
U.S. holders that are individuals, estates or trusts that have taxable income in excess of certain thresholds are required to pay an additional 3.8% tax on, among other things, dividends on stock and capital gains from the sale or other disposition of stock, subject to certain limitations. U.S. holders should consult their own tax advisors regarding the effect, if any, of these rules on their ownership and disposition of common stock.
Additional Withholding Tax on Payments Made to Foreign Accounts
Withholding taxes may be imposed under Sections 1471 to 1474 of the Code (such sections commonly referred to as the Foreign Account Tax Compliance Act, or FATCA) on certain types of payments made to non-U.S. financial institutions and certain other non-U.S. entities. Specifically, a 30% withholding tax may be imposed on dividends on common stock paid to a “foreign financial institution” or a “non-financial foreign entity” (each as defined in the Code), unless (1) the foreign financial institution undertakes certain diligence and reporting obligations, (2) the non-financial foreign entity either certifies it does not have any “substantial United States owners” (as defined in the Code) or furnishes identifying information regarding each substantial United States owner, or (3) the foreign financial institution or non-financial foreign entity otherwise qualifies for an exemption from these rules. If the payee is a foreign financial institution and is subject to the diligence and reporting requirements in clause (1) above, it must enter into an agreement with the U.S. Department of the Treasury requiring, among other things, that it undertake to identify accounts held by certain “specified United States persons” or “United States owned foreign entities” (each as defined in the Code), annually report certain information about such accounts, and withhold 30% on certain payments to non-compliant foreign financial institutions and certain other account holders. Foreign financial institutions located in jurisdictions that have an intergovernmental agreement with the United States governing FATCA may be subject to different rules.
Under the applicable Treasury Regulations and administrative guidance, withholding under FATCA generally applies to payments of dividends on common stock and to payments of gross proceeds from a sale or redemption of common stock. However, under proposed Treasury Regulations that may be relied on pending finalization, the withholding tax on gross proceeds would be eliminated and, consequently, FATCA withholding on gross proceeds is not currently expected to apply. Because we may not know the extent to which a distribution is a dividend for U.S. federal income tax purposes at the time it is made, for purposes of these withholding rules we may treat the entire distribution as a dividend.
230
Prospective investors should consult their own tax advisors regarding the potential application of withholding under FATCA to their investment in common stock.
Statement of Stock Ownership
REITs are required to demand annual written statements from the record holders of designated percentages of REIT shares disclosing the actual owners of the shares. Any record stockholder who, upon request, does not provide the required information concerning actual ownership of the shares is required to include specified information relating to his or her shares in his or her federal income tax return. A REIT also must maintain, within the Internal Revenue District in which it is required to file federal income tax returns, permanent records showing the information it has received about the actual ownership of shares and a list of those persons failing or refusing to comply with its information request. We intend to comply with these requirements.
Other Tax Consequences
State, local and non-U.S. income tax laws may differ substantially from the corresponding U.S. federal income tax laws, and this discussion does not purport to describe any aspect of the tax laws of any state, local or non-U.S. jurisdiction, or any U.S. federal tax other than U.S. federal income tax. You should consult your own tax advisor regarding the effect of state, local and non-U.S. tax laws with respect to our tax treatment as a REIT and on an investment in common stock.
231
INVESTMENT BY TAX-EXEMPT ENTITIES AND ERISA CONSIDERATIONS
General ERISA Considerations
A fiduciary of a pension, profit sharing, retirement or other “employee benefit plan” (as defined in Section 3(3) of the Employee Retirement Income Security Act of 1974, as amended (ERISA)), referred to herein as an ERISA Plan, should consider the fiduciary standards under ERISA and the ERISA Plan’s particular circumstances before authorizing an investment of a portion of such ERISA Plan’s assets in our common stock. Any person who exercises any authority or control with respect to the management or disposition of the assets of an ERISA Plan is considered to be a fiduciary of such ERISA Plan under ERISA. Among other things, such a fiduciary should consider (a) whether the investment satisfies the diversification requirements of Section 404(a)(1)(C) of ERISA, (b) whether the investment is in accordance with the documents and instruments governing the ERISA Plan as required by Section 404(a)(1)(D) of ERISA, and (c) whether the investment is prudent under ERISA. In addition, ERISA also requires that the assets of ERISA Plans be held in trust and that the trustee, or a duly authorized investment manager, have exclusive authority and discretion to manage and control the assets of the ERISA Plan.
Prohibited Transactions
In addition to the foregoing general fiduciary standards applicable to ERISA Plan fiduciaries, ERISA and the corresponding provisions of the Code prohibit a variety of transactions involving the assets of (i) an ERISA Plan, (ii) a plan, individual retirement account, “Keogh” plan or other arrangement subject to Section 4975 of the Code, or provisions under any federal, state, local, non-U.S. or other laws or regulations that are similar to such provisions of the Code or ERISA, (iii) any entity whose underlying assets are considered to include “plan assets” by reason of a plan’s investment in such entity (see explanation under Plan Assets below), and (iv) any entity that otherwise constitutes a “benefit plan investor” within the meaning of the Plan Asset Regulations set forth in 29 C.F.R. Section 2510.3-101 promulgated under ERISA by the U.S. Department of Labor, or the DOL, as modified by Section 3(42) of ERISA of the DOL Plan Asset Regulations (as explained under Plan Assets below), in each case referred to herein as a ‘Plan,’ and persons who have certain special relationships to the Plan (known as “parties in interest” under ERISA or “disqualified persons” under the Code). A Plan fiduciary or other individual considering an investment in our common stock by a Plan should consider whether the acquisition or the continued holding of the common stock by the Plan might constitute or result in a direct or indirect prohibited transaction that does not qualify for an exemption issued by the U.S. Department of Labor (DOL). Engaging in a non-exempt prohibited transaction may cause a party in interest or disqualified person with respect to such Plan to be subject to excise taxes and other penalties and liabilities under ERISA and/or the Code, and in the case of a Plan that is an IRA may trigger the disqualification of the IRA. In addition, the fiduciary of an ERISA Plan that engages in such a non-exempt prohibited transaction may be subject to penalties and liabilities under ERISA.
The acquisition and/or holding of our common stock by a Plan with respect to which we or an underwriter is considered a party in interest or a disqualified person may constitute or result in a direct or indirect prohibited transaction under Section 406 of ERISA and/or Section 4975 of the Code, unless the investment is acquired and is held in accordance with an applicable statutory, class or individual prohibited transaction exemption. In this regard, the DOL has issued prohibited transaction class exemptions (PTCEs) that may apply to the acquisition and holding of our common stock. These class exemptions include, without limitation, PTCE 84-14 which exempts transactions determined by independent qualified professional asset managers, PTCE 90-1 which exempts insurance company pooled separate accounts, PTCE 91-38 which exempts bank collective investment funds, PTCE 95-60 which exempts life insurance company general accounts, and PTCE 96-23 which exempts transactions determined by in-house asset managers. In addition, Section 408(b)(17) of ERISA and Section 4975(d)(20) of the Code provide an exemption for certain transactions where neither the issuer of the securities nor any of its affiliates (directly or indirectly) has or exercises any discretionary authority or control or renders any investment advice with respect to the assets of any Plan involved in the transaction, and the Plan receives no less, and pays no more, than adequate consideration in connection with the transaction. There can be
232
no assurance that all of the conditions of any such exemptions will be satisfied or that any such exemptions will be available with respect to investments by a Plan in our common stock.
Plan Assets
All types of investors should be aware that if our assets are deemed to constitute “plan assets” (within the meaning of ERISA), the operation and administration of our company would become subject to the requirements of ERISA, including the fiduciary duty rules and the “prohibited transaction” prohibitions described above. If we become subject to these regulations, unless appropriate administrative exemptions are available (and there can be no assurance that they would be), we could, among other things, be restricted from acquiring otherwise desirable investments and from entering into otherwise favorable transactions, and certain transactions entered into by us in the ordinary course of business could constitute non-exempt prohibited transactions and/or breaches of applicable fiduciary duties under ERISA and/or the Code, which could, in turn, result in potentially substantial excise taxes and other penalties and liabilities under ERISA and the Code.
The DOL regulations (29 C.F.R. §2510.3-101) define what constitutes the plan assets (collectively, the “Plan Asset Regulation”). The Plan Asset Regulation provides that, as a general rule, the underlying assets and properties of corporations, partnerships, trusts and certain other entities in which a Plan purchases an “equity interest” will be deemed, for purposes of ERISA, to be assets of the investing Plan, unless certain exceptions apply. The Plan Asset Regulation defines an “equity interest” as any interest in an entity other than an instrument that is treated as indebtedness under applicable local law, and which has no substantial equity features. Generally, the exceptions to the Plan Asset Regulation require that the investment in the entity be an investment (a) in securities issued by an investment company registered under the 1940 Act; (b) in “publicly offered securities,” defined generally as interests that are “freely transferable,” “widely held” and registered with the SEC; (c) in an “operating company,” which includes “venture capital operating companies” and “real estate operating companies;” or (d) in which equity participation by “benefit plan investors” is not significant.
We anticipate that we will meet the “publicly offered securities” exception under the Plan Asset Regulation. The Plan Asset Regulation provides that “whether a security is ‘freely transferable’ is a factual question to be determined on the basis of all relevant facts and circumstances.” We anticipate that our shares will be “freely transferable” under the Plan Asset Regulation although no assurance can be given in this regard. A class of securities will be “widely held” if it is held by 100 or more persons independent of the issuer and of one another. A security will note fail to be “widely held” because the number of independent investors falls below 100 subsequent to the initial offering thereof as a result of events beyond the control of the issuer. It is anticipated that our common stock will be “widely held,” although no assurance can be given in this regard. Under the Plan Asset Regulation, securities will meet the registration requirements under federal securities laws if they are (i) part of a class of securities registered under section 12(b) or 12(g) of the Exchange Act or (ii) sold to the plan as part of an offering of securities to the public pursuant to an effective registration statement under the Securities Act and the class of securities of which such securities are a part is registered under the Exchange Act within 120 days (or such later time as may be allowed by the SEC) after the end of the fiscal year of the issuer during which the offering of such securities to the public occurred. Our shares are intended to satisfy the registration requirements under this definition. Accordingly, we anticipate our shares to satisfy the exception for publicly offered securities and to not be considered plan assets.
We also anticipate that we will meet the “operating company” exception under the Plan Asset Regulation. For purposes of this exception, an “operating company” may include a “venture capital operating company” or a “real estate operating company.” To constitute a venture capital operating company, 50% of more of the assets of the entity must be invested in “venture capital investments.” A venture capital investment is an investment in an operating company (other than a venture capital operating company) as to which the entity has or obtains direct management rights. To constitute a real estate operating company, 50% or more of the assets of an entity must be invested in real estate that is managed or developed and with respect to which such entity has the right to substantially participate directly in the management or development activities. While the Plan Asset Regulation
233
and relevant opinions issued by the DOL regarding real estate operating companies are not entirely clear as to whether an investment in real estate must be “direct,” it is common practice to ensure that an investment is made either (i) ”directly” into real estate, (ii) through wholly-owned subsidiaries, or (iii) through entities in which all but a de minimis interest is separately held by an affiliate solely to comply with the minimum safe harbor requirements established by the IRS for classification as a partnership for federal tax purposes. We have structured ourselves and our operating partnership in this manner in order to enable us to meet the real estate operating company exception. However, it should still be noted that 50% of our or our operating partnership’s investment, as applicable, must be in real estate over which we maintain the right to substantially participate in the management and development activities. An example in the Plan Asset Regulation indicates that if 50% or more of an entity’s properties are subject to long-term leases under which substantially all management and maintenance activities with respect to the properties are the responsibility of the lessee, such that the entity merely assumes the risk of ownership of income-producing real property, then the entity may not be eligible for the “real estate operating company” exception. By contrast, a second example in the Plan Asset Regulation indicates that if 50% or more of an entity’s investments are in shopping centers in which individual stores are leased for relatively short periods to various merchants, as opposed to long-term leases where substantially all management and maintenance activities are the responsibility of the lessee, then the entity will likely qualify as a real estate operating company. The second example further provides that the entity may retain contractors, including affiliates, to conduct the management of the properties so long as the entity has the responsibility to supervise and the authority to terminate the contractors. We intend to use contractors over which we have the right to supervise and the authority to terminate. Due to the uncertainty of the application of the standards set forth in the Plan Asset Regulation, there can be no assurance as to our ability to structure our operations, or the operations of our operating partnership, as applicable, to qualify for the “real estate operating company” exception.
To the extent interests in our operating partnership are obtained by third-party investors, it is possible that the real estate operating company exception will cease to apply to us. However, in such an event we believe that we are structured in a manner which would allow us to meet the venture capital operating company exception because our investment in our operating partnership, an entity investing directly in real estate over which we maintain substantially all of the control over the management and development activities, would constitute a venture capital investment.
Representation
Each holder of our shares will be deemed to have represented and agreed that its purchase and holding of such shares (or any interest therein) will not constitute or result in a non-exempt prohibited transaction under ERISA or Code Section 4975.
The foregoing discussion is general in nature and is not intended to be all-inclusive. Such discussion should not be construed as legal advice. Due to the complexity of these rules and the penalties that may be imposed upon persons involved in non-exempt prohibited transactions, it is particularly important that fiduciaries or other persons considering investing in our company on behalf of, or with the assets of, any Plan consult with counsel regarding the potential applicability of ERISA and Code Section 4975 to such investment and whether an exemption would be applicable to the acquisition and/or holding of our shares.
234
UNDERWRITING
J.P. Morgan Securities LLC, Wells Fargo Securities, LLC, KeyBanc Capital Markets Inc., BMO Capital Markets Corp. and Truist Securities, Inc., are acting as joint book-running managers of the offering and as representatives of the underwriters named below. Subject to the terms and conditions stated in the underwriting agreement dated the date of this prospectus, each underwriter named below has severally agreed to purchase, and we have agreed to sell to that underwriter, the number of shares set forth opposite the underwriter’s name.
| | | | |
Underwriter | | Number
of Shares | |
J.P. Morgan Securities LLC | | | | |
Wells Fargo Securities, LLC | | | | |
KeyBanc Capital Markets Inc. | | | | |
BMO Capital Markets Corp. | | | | |
Truist Securities, Inc. | | | | |
| | | | |
Total | | | | |
| | | | |
The underwriting agreement provides that the obligations of the underwriters to purchase the shares included in this offering are subject to approval of legal matters by counsel and to other conditions. The underwriters are obligated to purchase all the shares (other than those covered by the option to purchase additional shares described below) if they purchase any of the shares.
Shares sold by the underwriters to the public will initially be offered at the initial public offering price set forth on the cover of this prospectus. Any shares sold by the underwriters to securities dealers may be sold at a discount from the initial public offering price not to exceed $ per share. If all the shares are not sold at the initial offering price, the underwriters may change the offering price and the other selling terms. The representatives have advised us that the underwriters do not intend to make sales to discretionary accounts. Sales of any shares made outside of the United States may be made by affiliates of the underwriters.
If the underwriters sell more shares than the total number set forth in the table above, we have granted to the underwriters an option, exercisable for 30 days from the date of this prospectus, to purchase up to additional shares at the public offering price less the underwriting discount. The underwriters may exercise the option solely for the purpose of covering over-allotments, if any, in connection with this offering. To the extent the option is exercised, each underwriter must purchase a number of additional shares approximately proportionate to that underwriter’s initial purchase commitment. Any shares issued or sold under the option will be issued and sold on the same terms and conditions as the other shares that are the subject of this offering.
We, our officers and our directors have agreed that, for a period of 180 days from the date of this prospectus (the “Restricted Period”), we and they will not, without the prior written consent of the representatives, dispose of or hedge any shares or any securities convertible into or exchangeable for our common stock (the “Lock-Up Agreement” and such securities, the “Lock-Up Securities”). The representatives in their sole discretion may release any of the securities subject to these lock-up agreements at any time, which, in the case of officers and directors, shall be with notice. Any shares purchased by our directors or officers pursuant to the directed share program shall also be subject to the Lock-Up Agreements.
The restrictions applicable to our officers and our directors described above do not apply to:
| | a. | | as a bona fide gift or gifts or charitable contribution, or for bona fide estate planning purposes, |
| | b. | | by will, other testamentary document or intestacy, |
| | c. | | to any trust for the direct or indirect benefit of the transferor or the immediate family of the transferor, or if the transferor is a trust, to a trustor or beneficiary of the trust or to the estate of a beneficiary of |
235
| | such trust (for purposes of the Lock-Up Agreement, “immediate family” shall mean any relationship by blood, current or former marriage, domestic partnership or adoption, not more remote than first cousin), |
| | d. | | by operation of law, such as pursuant to a qualified domestic order, divorce settlement, divorce decree or separation agreement, |
| | e. | | as part of a sale of shares acquired in open market transactions after the closing date of the public offering, |
| | f. | | to us pursuant to any redemption or conversion right relating to OP Units, LTIP Units and Class A-1 Units in the Operating Partnership, provided that, in the case of a conversion, any shares of common stock received by the transferor upon such conversion shall be subject to the terms of the Lock-Up Agreement; further provided that, in the case of conversion, fractional shares shall not be issued and the transferor shall receive cash in lieu thereof, |
| | g. | | to us in connection with the vesting, settlement, or exercise of restricted stock, restricted stock units, options, warrants or other rights to purchase shares of common stock (including, in each case, by way of “net” or “cashless” exercise), including for the payment of exercise price and tax and remittance payments due as a result of the vesting, settlement, or exercise of such restricted stock, restricted stock units, options, warrants or rights, provided that any such shares of common stock received upon such exercise, vesting or settlement shall be subject to the terms of the Lock-Up Agreement, and provided further that any such restricted stock, restricted stock units, options, warrants or rights are held by the transferor pursuant to an agreement or equity awards granted under a stock incentive plan or other equity award plan, each such agreement or plan which is described in this prospectus, |
| | h. | | to us in connection with the cash-out redemption of odd lot or fractional shares of common stock held by the transferor, or |
| | i. | | pursuant to a bona fide third-party tender offer, merger, consolidation or other similar transaction that is approved by our Board of Directors and made to all holders of our capital stock involving a Change of Control (as defined below) (for purposes hereof, “Change of Control” shall mean the transfer (whether by tender offer, merger, consolidation or other similar transaction), in one transaction or a series of related transactions, to a person or group of affiliated persons, of shares of capital stock if, after such transfer, such person or group of affiliated persons would hold at least a majority of our outstanding voting securities (or the surviving entity)); provided that in the event that such tender offer, merger, consolidation or other similar transaction is not completed, the transferor’s Lock-Up Securities shall remain subject to the provisions of the Lock-Up Agreement; |
| (ii) | | the establishment of trading plans pursuant to Rule 10b5-1 under the Exchange Act for the transfer of Lock-Up Securities; provided that (1) such plans do not provide for the transfer of Lock-Up Securities during the Restricted Period and (2) any public announcement or filing under the Exchange Act made by any person regarding the establishment of such plan during the Restricted Period shall include a statement that the transferor is not permitted to transfer, sell or otherwise dispose of securities under such plan during the Restricted Period in contravention of the Lock-Up Agreement. |
In addition, we have agreed that, without the prior written consent of the representatives on behalf of the underwriters, we will not approve the conversion of any of the outstanding shares of Class A common stock or shares of Class T common stock into shares of our common stock before the six-month anniversary of the listing of our common stock for trading on a national securities exchange. See “Shares Eligible for Future Sale—General.”
Prior to this offering, there has been no public market for our shares. Consequently, the initial public offering price for the shares was determined by negotiations between us and the representatives. Among the factors considered in determining the initial public offering price were our results of operations, our current financial condition, our future prospects, our markets, the economic conditions in and future prospects for the
236
industry in which we compete, our management, and currently prevailing general conditions in the equity securities markets, including current market valuations of publicly traded companies considered comparable to our company. We cannot assure you, however, that the price at which the shares will sell in the public market after this offering will not be lower than the initial public offering price or that an active trading market in our shares will develop and continue after this offering.
We intend to apply to have our shares listed on the NYSE under the symbol “SMA.”
The following table shows the underwriting discounts and commissions that we are to pay to the underwriters in connection with this offering. These amounts are shown assuming both no exercise and full exercise of the underwriters’ option to purchase additional shares.
| | | | | | | | |
| | | Paid by SmartStop | |
| | | No
Exercise | | | Full
Exercise | |
Per share | | $ | | | | $ | | |
Total | | $ | | | | $ | | |
We estimate that our portion of the total expenses of this offering will be approximately $ . We have agreed to reimburse the underwriters for certain of their expenses in an amount of up to $ .
In connection with this offering, the underwriters may engage in stabilizing transactions, which involves making bids for, purchasing and selling shares of common stock in the open market for the purpose of preventing or retarding a decline in the market price of the common stock while this offering is in progress. These stabilizing transactions may include making short sales of common stock, which involves the sale by the underwriters of a greater number of shares of common stock than they are required to purchase in this offering, and purchasing shares of common stock on the open market to cover positions created by short sales. Short sales may be “covered” shorts, which are short positions in an amount not greater than the underwriters’ option to purchase additional shares referred to above, or may be “naked” shorts, which are short positions in excess of that amount. The underwriters may close out any covered short position either by exercising their option to purchase additional shares, in whole or in part, or by purchasing shares in the open market. In making this determination, the underwriters will consider, among other things, the price of shares available for purchase in the open market compared to the price at which the underwriters may purchase shares through the option to purchase additional shares. A naked short position is more likely to be created if the underwriters are concerned that there may be downward pressure on the price of the common stock in the open market that could adversely affect investors who purchase in this offering. To the extent that the underwriters create a naked short position, they will purchase shares in the open market to cover the position.
The underwriters have advised us that, pursuant to Regulation M of the Securities Act of 1933, they may also engage in other activities that stabilize, maintain or otherwise affect the price of the common stock, including the imposition of penalty bids. This means that if the representatives of the underwriters purchase common stock in the open market in stabilizing transactions or to cover short sales, the representatives can require the underwriters that sold those shares as part of this offering to repay the underwriting discount received by them.
These activities may have the effect of raising or maintaining the market price of the common stock or preventing or retarding a decline in the market price of the common stock, and, as a result, the price of the common stock may be higher than the price that otherwise might exist in the open market. If the underwriters commence these activities, they may discontinue them at any time. The underwriters may carry out these transactions on the NYSE, in the over-the-counter market or otherwise.
237
Other Relationships
The underwriters are full service financial institutions engaged in various activities, which may include securities trading, commercial and investment banking, financial advisory, investment management, principal investment, hedging, financing and brokerage activities. The underwriters and their respective affiliates have in the past performed commercial banking, investment banking and advisory services for us from time to time for which they have received customary fees and reimbursement of expenses and may, from time to time, engage in transactions with and perform services for us in the ordinary course of their business for which they may receive customary fees and reimbursement of expenses.
In the ordinary course of their various business activities, the underwriters and their respective affiliates may make or hold a broad array of investments and actively trade debt and equity securities (or related derivative securities) and financial instruments (which may include bank loans and/or credit default swaps) for their own account and for the accounts of their customers and may at any time hold long and short positions in such securities and instruments. Such investments and securities activities may involve securities and/or instruments of ours or our affiliates. The underwriters and their affiliates may also make investment recommendations and/or publish or express independent research views in respect of such securities or financial instruments and may hold, or recommend to clients that they acquire, long and/or short positions in such securities and instruments.
Other than in the United States, no action has been taken by us or the underwriters that would permit a public offering of the securities offered by this prospectus in any jurisdiction where action for that purpose is required. The securities offered by this prospectus may not be offered or sold, directly or indirectly, nor may this prospectus or any other offering material or advertisements in connection with the offer and sale of any such securities be distributed or published in any jurisdiction, except under circumstances that will result in compliance with the applicable rules and regulations of that jurisdiction. Persons into whose possession this prospectus comes are advised to inform themselves about and to observe any restrictions relating to the offering and the distribution of this prospectus. This prospectus does not constitute an offer to sell or a solicitation of an offer to buy any securities offered by this prospectus in any jurisdiction in which such an offer or a solicitation is unlawful.
Certain of the underwriters and/or their respective affiliates are lenders under our 2024 Credit Facility and our Acquisition Facility, and we intend to use a portion of the net proceeds from this offering to repay amounts outstanding under the 2024 Credit Facility and to repay in full the Acquisition Facility. Further, certain of the underwriters and/or their respective affiliates served as joint lead placement agents for the Notes issued in the Notes Offering.
We have agreed to indemnify the underwriters against certain liabilities, including liabilities under the Securities Act, or to contribute to payments the underwriters may be required to make because of any of those liabilities.
Directed Share Program
At our request, the underwriters have reserved percent of the shares of common stock to be issued by us and offered by this prospectus for sale, at the public offering price, to (i) certain of our directors, officers and employees, and (ii) friends and family members of certain of our directors, officers, and employees. If these persons purchase reserved shares, it will reduce the number of shares available for sale to the general public. Any reserved shares that are not so purchased will be offered by the underwriters to the general public on the same terms as the other shares offered by this prospectus. Sales pursuant to the directed share program will be made by J.P. Morgan Securities LLC (the “DSP Underwriter”). We have agreed to indemnify the DSP Underwriter in connection with the directed share program, including for the failure of any participant to pay for its shares. Other than the underwriting discounts and commissions listed on the cover of this prospectus, the underwriters will not be entitled to any commissions with respect to shares of common stock sold pursuant to the directed
238
share program. To the extent such shares are purchased by any of our existing directors or officers who have entered into lock-up agreements with the underwriters, such shares will be subject to the restrictions contained in such agreements.
Notice to Prospective Investors in Canada
The common stock may be sold in Canada only to purchasers purchasing, or deemed to be purchasing, as principal that are accredited investors, as defined in National Instrument 45-106 Prospectus Exemptions or subsection 73.3(1) of the Securities Act (Ontario), and are permitted clients, as defined in National Instrument 31-103 Registration Requirements, Exemptions, and Ongoing Registrant Obligations. Any resale of the common stock must be made in accordance with an exemption form, or in a transaction not subject to, the prospectus requirements of applicable securities laws.
Securities legislation in certain provinces or territories of Canada may provide a purchaser with remedies for rescission or damages if this prospectus (including any amendment thereto) contains a misrepresentation, provided that the remedies for rescission or damages are exercised by the purchaser within the time limit prescribed by the securities legislation of the purchaser’s province or territory. The purchaser should refer to any applicable provisions of the securities legislation of the purchaser’s province or territory of these rights or consult with a legal advisor.
Pursuant to section 3A.3 of National Instrument 33-105 Underwriting Conflicts (NI 33-105), the underwriters are not required to comply with the disclosure requirements of NI 33-105 regarding underwriter conflicts of interest in connection with this offering.
Notice to Prospective Investors in Australia
No placement document, prospectus, product disclosure statement or other disclosure document has been lodged with the Australian Securities and Investments Commission (“ASIC”), in relation to the offering. This prospectus does not constitute a prospectus, product disclosure statement or other disclosure document under the Corporations Act 2001 (the “Corporations Act”), and does not purport to include the information required for a prospectus, product disclosure statement or other disclosure document under the Corporations Act.
Any offer in Australia of the common stock may only be made to persons (the “Exempt Investors”) who are “sophisticated investors” (within the meaning of section 708(8) of the Corporations Act), “professional investors” (within the meaning of section 708(11) of the Corporations Act) or otherwise pursuant to one or more exemptions contained in section 708 of the Corporations Act so that it is lawful to offer the common stock without disclosure to investors under Chapter 6D of the Corporations Act.
The common stock applied for by Exempt Investors in Australia must not be offered for sale in Australia in the period of 12 months after the date of allotment under the offering, except in circumstances where disclosure to investors under Chapter 6D of the Corporations Act would not be required pursuant to an exemption under section 708 of the Corporations Act or otherwise or where the offer is pursuant to a disclosure document which complies with Chapter 6D of the Corporations Act. Any person acquiring the common stock must observe such Australian on-sale restrictions.
This prospectus contains general information only and does not take account of the investment objectives, financial situation or particular needs of any particular person. It does not contain any securities recommendations or financial product advice. Before making an investment decision, investors need to consider whether the information in this prospectus is appropriate to their needs, objectives and circumstances, and, if necessary, seek expert advice on those matters.
239
Notice to Prospective Investors in Hong Kong
The common stock has not been offered or sold and will not be offered or sold in Hong Kong, by means of any document, other than (1) to “professional investors” as defined in the Securities and Futures Ordinance (Cap. 571) of Hong Kong and any rules made under that Ordinance; or (2) in other circumstances which do not result in the document being a “prospectus” as defined in the Companies Ordinance (Cap. 32) of Hong Kong or which do not constitute an offer to the public within the meaning of that Ordinance. No advertisement, invitation or document relating to the common stock has been or may be issued or has been or may be in the possession of any person for the purposes of issue, whether in Hong Kong or elsewhere, which is directed at, or the contents of which are likely to be accessed or read by, the public of Hong Kong (except if permitted to do so under the securities laws of Hong Kong) other than with respect to the common stock which are or are intended to be disposed of only to persons outside Hong Kong or only to “professional investors” as defined in the Securities and Futures Ordinance and any rules made under that Ordinance.
Notice to Prospective Investors in Singapore
This prospectus supplement and the accompanying prospectus has not been registered as a prospectus under the Securities and Futures Act, 2001 Singapore (“SFA”) by the Monetary Authority of Singapore, and the offer of the shares is made primarily pursuant to the exemption under Section 304 of the SFA. Accordingly, the shares may not be offered or sold, or made the subject of an invitation for subscription or purchase, nor may this prospectus or any other document or material in connection with the offer or sale, or invitation for subscription or purchase of the shares be circulated or distributed, whether directly or indirectly, to any person in Singapore other than: (a) to an institutional investor (as defined in Section 4A of the SFA) pursuant to Section 304 of the SFA; or (b) otherwise pursuant to, and in accordance with, the conditions of any other applicable exemption or provision of the SFA.
Notice to Prospective Investors in Dubai International Financial Centre (“DIFC”)
This prospectus relates to an Exempt Offer in accordance with the Markets Rules 2012 of the Dubai Financial Services Authority (“DFSA”). This prospectus is intended for distribution only to persons of a type specified in the Offered Securities Rules of the DFSA. It must not be delivered to, or relied on by, any other person. The DFSA has no responsibility for reviewing or verifying any documents in connection with Exempt Offers. The DFSA has not approved this prospectus nor taken steps to verify the information set forth herein and has no responsibility for this prospectus. The common stock to which this prospectus relates may be illiquid and/or subject to restrictions on their resale. Prospective purchasers of the common stock offered should conduct their own due diligence on the common stock. If you do not understand the contents of this prospectus you should consult an authorized financial advisor.
240
LEGAL MATTERS
Certain legal matters, including certain tax matters, will be passed upon for us by Nelson Mullins Riley & Scarborough LLP. Latham & Watkins LLP will act as counsel to the underwriters. Venable LLP will pass upon the validity of the shares of our common stock sold in this offering and certain other matters under Maryland law.
EXPERTS
The consolidated financial statements and schedule as of December 31, 2023 and 2022, and for each of the three years in the period ended December 31, 2023, included in this prospectus and in the registration statement have been so included in reliance on the report of BDO USA, P.C., an independent registered public accounting firm, appearing elsewhere herein, given on the authority of said firm as experts in auditing and accounting.
The statements included in our prospectus under the caption “Market Price of and Dividends on the Registrant’s Common Equity and Related Stockholder Matters-Valuation Overview,” relating to the role of Robert A. Stanger & Co, Inc., or Stanger, have been reviewed by Stanger, an independent third-party valuation firm, and are included in our prospectus given the authority of such firm as experts in property valuation and appraisals.
WHERE YOU CAN FIND MORE INFORMATION
We have filed a registration statement on Form S-11 with the SEC with respect to the shares of our common stock to be issued in this offering. This prospectus is a part of that registration statement and, as permitted by SEC rules, does not include all of the information you can find in the registration statement or the exhibits to the registration statement. For additional information relating to us, we refer you to the registration statement and the exhibits to the registration statement. Statements contained in this prospectus as to the contents of any contract or document are necessarily summaries of such contract or document and in each instance, if we have filed the contract or document as an exhibit to the registration statement, we refer you to the copy of the contract or document filed as an exhibit to the registration statement.
We are subject to the information requirements of the Exchange Act, and in accordance with the Exchange Act, we file annual, quarterly and current reports, proxy statements and other information with the SEC. We furnish our stockholders by mail (or, where permitted, by electronic delivery and notification) with annual reports containing consolidated financial statements certified by an independent registered public accounting firm. The registration statement is, and all of these filings with the SEC are, available to the public over the internet at the SEC’s website at www.sec.gov. Information contained on, or accessible through, the SEC’s website is not incorporated by reference into and does not constitute a part of this prospectus.
Our website at www.smartstopselfstorage.com contains additional information about our business. Information contained on, or accessible through, our website is not incorporated by reference into and does not constitute a part of this prospectus.
241
INDEX TO FINANCIAL INFORMATION
SMARTSTOP SELF STORAGE REIT, INC.
AS OF DECEMBER 31, 2023 AND 2022 AND FOR THE YEARS ENDED DECEMBER 31, 2023, 2022 AND 2021
| | | | |
| | | F-2 | |
| | | F-4 | |
| | | F-5 | |
| | | F-6 | |
| | | F-7 | |
| | | F-10 | |
| | | F-12 | |
| | | F-73 | |
|
AS OF SEPTEMBER 30, 2024 AND FOR THE NINE MONTHS ENDED SEPTEMBER 30, 2024 AND 2023 (UNAUDITED) | |
| | | F-78 | |
| | | F-79 | |
| | | F-80 | |
| | | F-81 | |
| | | F-83 | |
| | | F-85 | |
| | | F-87 | |
REPORT OF INDEPENDENT REGISTERED PUBLIC ACCOUNTING FIRM
Board of Directors and Stockholders
SmartStop Self Storage REIT, Inc.
Opinion on the Consolidated Financial Statements
We have audited the accompanying consolidated balance sheets of SmartStop Self Storage REIT, Inc. (the “Company”) as of December 31, 2023 and 2022, the related consolidated statements of operations, comprehensive income (loss), equity and temporary equity, and cash flows for each of the three years in the period ended December 31, 2023, and the related notes and financial statement schedule listed in the accompanying index (collectively referred to as the “consolidated financial statements”). In our opinion, the consolidated financial statements present fairly, in all material respects, the financial position of the Company at December 31, 2023 and 2022, and the results of its operations and its cash flows for each of the three years in the period ended December 31, 2023, in conformity with accounting principles generally accepted in the United States of America.
These consolidated financial statements are the responsibility of the Company’s management. Our responsibility is to express an opinion on the Company’s consolidated financial statements based on our audits. We are a public accounting firm registered with the Public Company Accounting Oversight Board (United States) (“PCAOB”) and are required to be independent with respect to the Company in accordance with the U.S. federal securities laws and the applicable rules and regulations of the Securities and Exchange Commission and the PCAOB.
We conducted our audits in accordance with the standards of the PCAOB. Those standards require that we plan and perform the audit to obtain reasonable assurance about whether the consolidated financial statements are free of material misstatement, whether due to error or fraud. The Company is not required to have, nor were we engaged to perform, an audit of its internal control over financial reporting. As part of our audits we are required to obtain an understanding of internal control over financial reporting but not for the purpose of expressing an opinion on the effectiveness of the Company’s internal control over financial reporting. Accordingly, we express no such opinion.
Our audits included performing procedures to assess the risks of material misstatement of the consolidated financial statements, whether due to error or fraud, and performing procedures that respond to those risks. Such procedures included examining, on a test basis, evidence regarding the amounts and disclosures in the consolidated financial statements. Our audits also included evaluating the accounting principles used and significant estimates made by management, as well as evaluating the overall presentation of the consolidated financial statements. We believe that our audits provide a reasonable basis for our opinion.
The critical audit matter communicated below is a matter arising from the current period audit of the consolidated financial statements that was communicated or required to be communicated to the audit committee and that: (i) relates to accounts or disclosures that are material to the consolidated financial statements and (ii) involved our especially challenging, subjective, or complex judgments. The communication of a critical audit matter does not alter in any way our opinion on the consolidated financial statements, taken as a whole, and we are not, by communicating the critical audit matter below, providing separate opinions on the critical audit matter or on the accounts or disclosures to which it relates.
Real Estate Purchase Price Allocation
As described in Note 3, for the year ended December 31, 2023, the Company completed the acquisition of one self-storage property and recorded $23.7 million to real estate facilities. The Company allocates the purchase price of a property to the tangible and intangible assets acquired and liabilities assumed based on their relative fair values as of the acquisition date, using valuation techniques, including (i) a discounted cash flow analysis, which considers, among other things, leasing assumptions, growth rates, discount rates and terminal capitalization rates and (ii) a market approach, which considers comparable sales activity.
We identified the estimation of the fair values of the land, and buildings and improvements used in the real estate purchase price allocation as a critical audit matter, because of the level of judgment required to estimate the fair values of the acquired land, and building and improvements, including the identification of comparable sales activity and the terminal capitalization and discount rate assumptions. Auditing these elements involved especially subjective auditor judgments due to the nature and extent of audit effort required to address these matters, including the extent of specialized skills or knowledge needed.
The primary procedures we performed to address this critical audit matter included:
| | • | | Evaluating the reasonableness of the terminal capitalization and discount rates used in the valuation models by comparing the rates used to third party market data. |
| | • | | Utilizing personnel with specialized knowledge and skills in valuation to assist in evaluating the reasonableness of management’s selected comparable land sales by comparing to third party market data. |
We have served as the Company’s auditor since 2017.
SMARTSTOP SELF STORAGE REIT, INC. AND SUBSIDIARIES
CONSOLIDATED BALANCE SHEETS
December 31, 2023 and 2022
| | | | | | | | |
| | | | |
| | | | | | | |
| | | | | | | | |
| | | | | | | | |
| | $ | 430,868,563 | | | $ | 420,522,591 | |
| | | 1,401,981,394 | | | | 1,377,311,421 | |
| | | 91,896,415 | | | | 89,371,633 | |
| | | | | | | | |
| | | 1,924,746,372 | | | | 1,887,205,645 | |
| | | (255,844,284 | ) | | | (202,682,688 | ) |
| | | | | | | | |
| | | 1,668,902,088 | | | | 1,684,522,957 | |
| | | 5,976,946 | | | | 4,490,926 | |
Real estate facilities, net | | | 1,674,879,034 | | | | 1,689,013,883 | |
Cash and cash equivalents | | | 45,079,371 | | | | 39,486,588 | |
| | | 8,347,805 | | | | 6,551,803 | |
Investments in unconsolidated real estate ventures (Note 4) | | | 35,831,600 | | | | 28,522,082 | |
Investments in and advances to Managed REITs | | | 34,390,866 | | | | 62,371,167 | |
| | | 4,449,665 | | | | — | |
| | | 21,701,107 | | | | 34,131,543 | |
Intangible assets, net of accumulated amortization | | | 1,170,100 | | | | 15,553,303 | |
Trademarks, net of accumulated amortization | | | 15,770,588 | | | | 15,911,765 | |
| | | 53,643,331 | | | | 53,643,331 | |
Debt issuance costs, net of accumulated amortization | | | 377,258 | | | | 2,031,922 | |
| | | | | | | | |
| | | | | | | | |
| | | | | | | | |
LIABILITIES, TEMPORARY EQUITY, AND EQUITY | | | | | | | | |
| | $ | 1,087,401,334 | | | $ | 1,068,371,956 | |
Accounts payable and accrued liabilities | | | 28,977,714 | | | | 28,151,741 | |
| | | 415,980 | | | | 409,730 | |
| | | 9,155,808 | | | | 9,324,453 | |
| | | 6,193,675 | | | | 6,205,620 | |
| | | | | | | | |
| | | | | | | | |
| | | | | | | | |
Commitments and contingencies (Note 12) | | | | | | | | |
| | | 71,277,195 | | | | 76,578,073 | |
Preferred stock, $0.001 par value; 200,000,000 shares authorized: | | | | | | | | |
Series A Convertible Preferred Stock, $0.001 par value; 200,000 shares authorized; 200,000 and 200,000 shares issued and outstanding at December 31, 2023 and December 31, 2022, respectively, with aggregate liquidation preferences of $203,150,685 and $203,150,685 at December 31, 2023 and December 31, 2022, respectively | | | 196,356,107 | | | | 196,356,107 | |
| | | | | | | | |
SmartStop Self Storage REIT, Inc.: | | | | | | | | |
Class A common stock, $0.001 par value; 350,000,000 shares authorized; 88,761,135 and 88,853,454 shares issued and outstanding at December 31, 2023 and December 31, 2022, respectively | | | 88,762 | | | | 88,853 | |
Class T common stock, $0.001 par value; 350,000,000 shares authorized; 8,113,827 and 8,085,550 shares issued and outstanding at December 31, 2023 and December 31, 2022, respectively | | | 8,114 | | | | 8,085 | |
| | | 894,856,554 | | | | 894,283,954 | |
| | | (324,190,556 | ) | | | (266,151,517 | ) |
| | | (167,270,293 | ) | | | (164,524,595 | ) |
Accumulated other comprehensive income | | | 847,183 | | | | 3,654,682 | |
| | | | | | | | |
Total SmartStop Self Storage REIT, Inc. equity | | | 404,339,764 | | | | 467,359,462 | |
| | | | | | | | |
Noncontrolling interests in our Operating Partnership | | | 91,488,207 | | | | 94,405,766 | |
Other noncontrolling interests | | | 34,941 | | | | 54,479 | |
| | | | | | | | |
Total noncontrolling interests | | | 91,523,148 | | | | 94,460,245 | |
| | | | | | | | |
| | | | | | | | |
| | | | | | | | |
Total liabilities, temporary equity and equity | | | | | | | | |
| | | | | | | | |
See notes to consolidated financial statements.
F-4
SMARTSTOP SELF STORAGE REIT, INC. AND SUBSIDIARIES
CONSOLIDATED STATEMENTS OF OPERATIONS
Years Ended December 31, 2023, 2022 and 2021
| | | | | | | | | | | | |
| | | Year Ended
December 31,
2023 | | | Year Ended
December 31,
2022 | | | Year Ended
December 31,
2021 | |
| | | | | | | | | | | | |
Self storage rental revenue | | $ | 206,494,202 | | | $ | 191,749,578 | | | $ | 150,610,337 | |
Ancillary operating revenue | | | 8,826,868 | | | | 8,445,803 | | | | 7,552,597 | |
Managed REIT Platform revenues | | | 11,906,311 | | | | 7,819,216 | | | | 6,322,970 | |
Reimbursable costs from Managed REITs | | | 5,764,363 | | | | 4,628,497 | | | | 4,278,667 | |
| | | | | | | | | | | | |
| | | 232,991,744 | | | | 212,643,094 | | | | 168,764,571 | |
| | | | | | | | | | | | |
| | | | | | | | | | | | |
Property operating expenses | | | 65,362,857 | | | | 58,437,110 | | | | 48,127,657 | |
Managed REIT Platform expenses | | | 3,365,491 | | | | 2,485,290 | | | | 1,451,166 | |
Reimbursable costs from Managed REITs | | | 5,764,363 | | | | 4,628,497 | | | | 4,278,667 | |
General and administrative | | | 27,451,533 | | | | 28,253,905 | | | | 23,265,196 | |
| | | 53,636,353 | | | | 49,417,679 | | | | 40,946,406 | |
Intangible amortization expense | | | 6,593,853 | | | | 15,200,854 | | | | 12,422,205 | |
| | | 192,358 | | | | 888,009 | | | | 934,838 | |
Contingent earnout adjustment | | | — | | | | 1,514,447 | | | | 12,619,744 | |
Write-off of equity interest and preexisting relationships upon acquisition of control | | | — | | | | 2,049,682 | | | | 8,389,573 | |
| | | | | | | | | | | | |
| | | 162,366,808 | | | | 162,875,473 | | | | 152,435,452 | |
Gain on equity interests upon acquisition | | | — | | | | 16,101,237 | | | | — | |
Gain on sale of real estate | | | — | | | | — | | | | 178,631 | |
| | | | | | | | | | | | |
| | | 70,624,936 | | | | 65,868,858 | | | | 16,507,750 | |
| | | | | | | | | | | | |
Equity in earnings (losses) from Investments in JV Properties | | | (1,625,135 | ) | | | (760,005 | ) | | | (494,327 | ) |
Equity in earnings (losses) from Investments in Managed REITs | | | (1,273,143 | ) | | | (930,201 | ) | | | (623,393 | ) |
| | | 3,128,867 | | | | 841,401 | | | | (937,631 | ) |
| | | (61,804,621 | ) | | | (41,511,911 | ) | | | (33,383,604 | ) |
Net loss on extinguishment of debt | | | — | | | | (2,393,475 | ) | | | (2,444,788 | ) |
Income tax (expense) benefit | | | 2,595,856 | | | | 554,785 | | | | 1,811,275 | |
| | | | | | | | | | | | |
| | | 11,646,760 | | | | 21,669,452 | | | | (19,564,718 | ) |
Net (income) loss attributable to noncontrolling interests | | | (1,892,458 | ) | | | (2,847,572 | ) | | | 2,663,123 | |
Less: Distributions to preferred stockholders | | | (12,500,000 | ) | | | (12,500,000 | ) | | | (12,500,000 | ) |
| | | | | | | | | | | | |
Net income (loss) attributable to SmartStop Self Storage REIT, Inc. common stockholders | | $ | (2,745,698 | ) | | $ | 6,321,880 | | | $ | (29,401,595 | ) |
| | | | | | | | | | | | |
Net income (loss) per Class A & Class T share – basic | | $ | (0.03 | ) | | $ | 0.07 | | | $ | (0.37 | ) |
Net income (loss) per Class A & Class T share – diluted | | $ | (0.03 | ) | | $ | 0.07 | | | $ | (0.37 | ) |
| | | | | | | | | | | | |
Weighted average Class A shares outstanding – basic | | | 88,706,340 | | | | 83,857,222 | | | | 71,454,798 | |
Weighted average Class A shares outstanding – diluted | | | 88,706,340 | | | | 83,974,488 | | | | 71,454,798 | |
Weighted average Class T shares outstanding – basic | | | 8,101,599 | | | | 8,081,950 | | | | 7,983,576 | |
Weighted average Class T shares outstanding – diluted | | | 8,101,599 | | | | 8,081,950 | | | | 7,983,576 | |
See notes to consolidated financial statements.
F-5
SMARTSTOP SELF STORAGE REIT, INC. AND SUBSIDIARIES
CONSOLIDATED STATEMENTS OF COMPREHENSIVE INCOME (LOSS)
Years Ended December 31, 2023, 2022 and 2021
| | | | | | | | | | | | |
| | | Year Ended
December 31,
2023 | | | Year Ended
December 31,
2022 | | | Year Ended
December 31,
2021 | |
| | $ | 11,646,760 | | | $ | 21,669,452 | | | $ | (19,564,718 | ) |
Other comprehensive income (loss): | | | | | | | | | | | | |
Foreign currency translation adjustment | | | 1,480,720 | | | | (3,832,344 | ) | | | 65,261 | |
Foreign currency hedge contract gains (losses) | | | (1,065,910 | ) | | | 3,354,899 | | | | (394,417 | ) |
Interest rate swap and cap contract gains (losses) | | | (3,593,569 | ) | | | 4,906,784 | | | | 4,335,323 | |
| | | | | | | | | | | | |
Other comprehensive income (loss) | | | (3,178,759 | ) | | | 4,429,339 | | | | 4,006,167 | |
| | | | | | | | | | | | |
Comprehensive income (loss) | | | 8,468,001 | | | | 26,098,791 | | | | (15,558,551 | ) |
Comprehensive (income) loss attributable to noncontrolling interests: | | | | | | | | | | | | |
Comprehensive (income) loss attributable to noncontrolling interests | | | (1,521,198 | ) | | | (3,342,254 | ) | | | 2,211,209 | |
| | | | | | | | | | | | |
Comprehensive income (loss) attributable to SmartStop Self Storage REIT, Inc. stockholders | | | | | | | | | | | | |
| | | | | | | | | | | | |
See notes to consolidated financial statements.
F-6
SMARTSTOP SELF STORAGE REIT, INC. AND SUBSIDIARIES
CONSOLIDATED STATEMENTS OF EQUITY AND TEMPORARY EQUITY
Years Ended December 31, 2023, 2022 and 2021
| | | | | | | | | | | | | | | | | | | | | | | | | | | | | | | | | | | | | | | | | | | | | | | | | | | | |
| | | | | | | | | | | | | | | | | | | | | | | | | | | | | | | |
| | | | | | | | | | | | | | | | | | | | | | | | | | | | | | | | | | |
| | | | | | | | | | | | | | | | | | | | | | | | Accumulated
Other
Comprehensive
Income (Loss) | | | Total
SmartStop
Self
Storage
REIT, Inc.
Equity | | | | | | | | | | | | | |
Balance as of December 31, 2020 | | | 52,660,402 | | | $ | 52,661 | | | | 7,903,911 | | | $ | 7,904 | | | $ | 492,408,006 | | | $ | (163,953,169 | ) | | $ | (141,444,880 | ) | | $ | (3,834,228 | ) | | $ | 183,236,294 | | | $ | 60,003,911 | | | $ | 243,240,205 | | | $ | 196,356,107 | | | $ | 57,335,575 | |
Gross proceeds from issuance of operating partnership units in SST VI OP | | | — | | | | — | | | | — | | | | — | | | | — | | | | — | | | | — | | | | — | | | | — | | | | 4,761,315 | | | | 4,761,315 | | | | — | | | | — | |
Offering Costs of SST VI OP | | | — | | | | — | | | | — | | | | — | | | | — | | | | — | | | | — | | | | — | | | | — | | | | (1,239,194 | ) | | | (1,239,194 | ) | | | — | | | | — | |
Issuance of common stock in connection with SST IV Merger | | | 23,137,540 | | | | 23,138 | | | | — | | | | — | | | | 231,389,332 | | | | — | | | | — | | | | — | | | | 231,412,470 | | | | — | | | | 231,412,470 | | | | — | | | | — | |
Issuance of Class A-1 Units in our Operating Partnership in connection with the contingent earnout related to the Self Administration Transaction | | | — | | | | — | | | | — | | | | — | | | | — | | | | — | | | | — | | | | — | | | | — | | | | 11,219,744 | | | | 11,219,744 | | | | — | | | | — | |
Acquisition of noncontrolling interest related to the Tenant Protection Programs joint ventures | | | — | | | | — | | | | — | | | | — | | | | — | | | | — | | | | — | | | | — | | | | — | | | | (10,900 | ) | | | (10,900 | ) | | | — | | | | — | |
| | | — | | | | — | | | | — | | | | — | | | | (335,175 | ) | | | — | | | | — | | | | — | | | | (335,175 | ) | | | — | | | | (335,175 | ) | | | — | | | | — | |
Changes to redeemable common stock | | | — | | | | — | | | | — | | | | — | | | | (19,564,929 | ) | | | — | | | | — | | | | — | | | | (19,564,929 | ) | | | — | | | | (19,564,929 | ) | | | — | | | | 19,564,929 | |
Redemptions of common stock | | | (359,976 | ) | | | (360 | ) | | | (30,158 | ) | | | (30 | ) | | | — | | | | — | | | | — | | | | — | | | | (390 | ) | | | — | | | | (390 | ) | | | — | | | | (5,565,829 | ) |
Issuance of restricted stock | | | 78,192 | | | | 78 | | | | — | | | | — | | | | — | | | | — | | | | — | | | | — | | | | 78 | | | | — | | | | 78 | | | | — | | | | — | |
Distributions ($0.60 per share) | | | — | | | | — | | | | — | | | | — | | | | — | | | | (47,011,295 | ) | | | — | | | | — | | | | (47,011,295 | ) | | | — | | | | (47,011,295 | ) | | | — | | | | — | |
Distributions to noncontrolling interests | | | — | | | | — | | | | — | | | | — | | | | — | | | | — | | | | — | | | | — | | | | — | | | | (6,338,488 | ) | | | (6,338,488 | ) | | | — | | | | — | |
Issuance of shares for distribution reinvestment plan | | | 1,541,585 | | | | 1,541 | | | | 182,445 | | | | 182 | | | | 19,563,206 | | | | — | | | | — | | | | — | | | | 19,564,929 | | | | — | | | | 19,564,929 | | | | — | | | | — | |
Equity based compensation expense | | | — | | | | — | | | | — | | | | — | | | | 1,279,432 | | | | — | | | | — | | | | — | | | | 1,279,432 | | | | 1,628,376 | | | | 2,907,808 | | | | — | | | | — | |
Net loss attributable to SmartStop Self Storage REIT, Inc. common stockholders | | | — | | | | — | | | | — | | | | — | | | | — | | | | — | | | | (29,401,595 | ) | | | — | | | | (29,401,595 | ) | | | — | | | | (29,401,595 | ) | | | — | | | | — | |
Deconsolidation of SST VI OP | | | — | | | | — | | | | — | | | | — | | | | — | | | | — | | | | — | | | | — | | | | — | | | | (3,170,238 | ) | | | (3,170,238 | ) | | | — | | | | — | |
Net loss attributable to the noncontrolling interests in our Operating Partnership | | | — | | | | — | | | | — | | | | — | | | | — | | | | — | | | | — | | | | — | | | | — | | | | (2,663,123 | ) | | | (2,663,123 | ) | | | — | | | | — | |
Foreign currency translation adjustment | | | — | | | | — | | | | — | | | | — | | | | — | | | | — | | | | — | | | | 47,424 | | | | 47,424 | | | | 17,837 | | | | 65,261 | | | | — | | | | — | |
Foreign currency hedge contract loss | | | — | | | | — | | | | — | | | | — | | | | — | | | | — | | | | — | | | | (337,219 | ) | | | (337,219 | ) | | | (57,198 | ) | | | (394,417 | ) | | | — | | | | — | |
Interest rate swap and cap contract gain | | | — | | | | — | | | | — | | | | — | | | | — | | | | — | | | | — | | | | 3,844,048 | | | | 3,844,048 | | | | 491,275 | | | | 4,335,323 | | | | — | | | | — | |
| | | | | | | | | | | | | | | | | | | | | | | | | | | | | | | | | | | | | | | | | | | | | | | | | | | | |
Balance as of December 31, 2021 | | | 77,057,743 | | | $ | 77,058 | | | | 8,056,198 | | | $ | 8,056 | | | $ | 724,739,872 | | | $ | (210,964,464 | ) | | $ | (170,846,475 | ) | | $ | (279,975 | ) | | $ | 342,734,072 | | | $ | 64,643,317 | | | $ | 407,377,389 | | | $ | 196,356,107 | | | $ | 71,334,675 | |
| | | | | | | | | | | | | | | | | | | | | | | | | | | | | | | | | | | | | | | | | | | | | | | | | | | | |
See notes to consolidated financial statements.
F-7
| | | | | | | | | | | | | | | | | | | | | | | | | | | | | | | | | | | | | | | | | | | | | | | | | | | | |
| | | | | | | | | | | | | | | | | | | | | | | | | | | | | | | |
| | | | | | | | | | | | | | | | | | | | | | | | | | | | | | | | | | |
| | | | | | | | | | | | | | | | | | | | | | | | Accumulated
Other
Comprehensive
Income (Loss) | | | Total
SmartStop
Self Storage
REIT, Inc.
Equity | | | | | | | | | | | | | |
Balance as of December 31, 2021 | | | 77,057,743 | | | $ | 77,058 | | | | 8,056,198 | | | $ | 8,056 | | | $ | 724,739,872 | | | $ | (210,964,464 | ) | | $ | (170,846,475 | ) | | $ | (279,975 | ) | | $ | 342,734,072 | | | $ | 64,643,317 | | | $ | 407,377,389 | | | $ | 196,356,107 | | | $ | 71,334,675 | |
| | | — | | | | — | | | | — | | | | — | | | | (445,149 | ) | | | — | | | | — | | | | — | | | | (445,149 | ) | | | — | | | | (445,149 | ) | | | — | | | | — | |
Tax withholding (net settlement) related to vesting of restricted stock | | | (8,910 | ) | | | (9 | ) | | | — | | | | — | | | | (86,348 | ) | | | — | | | | — | | | | — | | | | (86,357 | ) | | | — | | | | (86,357 | ) | | | — | | | | — | |
Issuance of Class A-1 Units in our Operating Partnership in connection with the contingent earnout related to the Self Administration Transaction | | | — | | | | — | | | | — | | | | — | | | | — | | | | — | | | | — | | | | — | | | | — | | | | 31,514,447 | | | | 31,514,447 | | | | — | | | | — | |
Issuance of noncontrolling interest in SST VI Advisor | | | — | | | | — | | | | — | | | | — | | | | — | | | | — | | | | — | | | | — | | | | — | | | | 1,000 | | | | 1,000 | | | | — | | | | — | |
Changes to redeemable common stock | | | — | | | | — | | | | — | | | | — | | | | (5,243,398 | ) | | | — | | | | — | | | | — | | | | (5,243,398 | ) | | | — | | | | (5,243,398 | ) | | | — | | | | 5,243,398 | |
Redemptions of common stock | | | (106,502 | ) | | | (107 | ) | | | (4,696 | ) | | | (5 | ) | | | — | | | | — | | | | — | | | | — | | | | (112 | ) | | | — | | | | (112 | ) | | | — | | | | — | |
Issuance of common stock in connection with the SSGT II Merger | | | 11,542,062 | | | | 11,542 | | | | — | | | | — | | | | 168,778,332 | | | | — | | | | — | | | | — | | | | 168,789,874 | | | | — | | | | 168,789,874 | | | | — | | | | — | |
Issuance of OP Units in connection with SSGT II Merger | | | — | | | | — | | | | — | | | | — | | | | — | | | | — | | | | — | | | | — | | | | — | | | | 1,703 | | | | 1,703 | | | | — | | | | — | |
Issuance of restricted stock, net of forfeitures | | | 55,403 | | | | 55 | | | | — | | | | — | | | | — | | | | — | | | | — | | | | — | | | | 55 | | | | — | | | | 55 | | | | — | | | | — | |
Distributions ($0.60 per share) | | | — | | | | — | | | | — | | | | — | | | | — | | | | (55,187,053 | ) | | | — | | | | — | | | | (55,187,053 | ) | | | — | | | | (55,187,053 | ) | | | — | | | | — | |
Distributions to noncontrolling interests in our Operating Partnership | | | — | | | | — | | | | — | | | | — | | | | — | | | | — | | | | — | | | | — | | | | — | | | | (7,444,680 | ) | | | (7,444,680 | ) | | | — | | | | — | |
Distributions to other noncontrolling interests | | | — | | | | — | | | | — | | | | — | | | | — | | | | — | | | | — | | | | — | | | | — | | | | (268,695 | ) | | | (268,695 | ) | | | — | | | | — | |
Issuance of shares for distribution reinvestment plan | | | 313,658 | | | | 314 | | | | 34,048 | | | | 34 | | | | 5,243,050 | | | | — | | | | — | | | | — | | | | 5,243,398 | | | | — | | | | 5,243,398 | | | | — | | | | — | |
Equity based compensation expense | | | — | | | | — | | | | — | | | | — | | | | 1,297,595 | | | | — | | | | — | | | | — | | | | 1,297,595 | | | | 2,670,899 | | | | 3,968,494 | | | | — | | | | — | |
Net income attributable to SmartStop Self Storage REIT, Inc. common stockholders | | | — | | | | — | | | | — | | | | — | | | | — | | | | — | | | | 6,321,880 | | | | — | | | | 6,321,880 | | | | — | | | | 6,321,880 | | | | — | | | | — | |
Net income attributable to the noncontrolling interests in our Operating Partnership | | | — | | | | — | | | | — | | | | — | | | | — | | | | — | | | | — | | | | — | | | | — | | | | 2,536,296 | | | | 2,536,296 | | | | — | | | | — | |
Net income attributable to other noncontrolling interests | | | — | | | | — | | | | — | | | | — | | | | — | | | | — | | | | — | | | | — | | | | — | | | | 311,276 | | | | 311,276 | | | | — | | | | — | |
Foreign currency translation adjustment | | | — | | | | — | | | | — | | | | — | | | | — | | | | — | | | | — | | | | (3,400,645 | ) | | | (3,400,645 | ) | | | (431,699 | ) | | | (3,832,344 | ) | | | — | | | | — | |
Foreign currency forward contract gain | | | — | | | | — | | | | — | | | | — | | | | — | | | | — | | | | — | | | | 2,977,385 | | | | 2,977,385 | | | | 377,514 | | | | 3,354,899 | | | | — | | | | — | |
Interest rate swap and cap contract gain | | | — | | | | — | | | | — | | | | — | | | | — | | | | — | | | | — | | | | 4,357,917 | | | | 4,357,917 | | | | 548,867 | | | | 4,906,784 | | | | — | | | | — | |
| | | | | | | | | | | | | | | | | | | | | | | | | | | | | | | | | | | | | | | | | | | | | | | | | | | | |
Balance as of December 31, 2022 | | | 88,853,454 | | | $ | 88,853 | | | | 8,085,550 | | | $ | 8,085 | | | $ | 894,283,954 | | | $ | (266,151,517 | ) | | $ | (164,524,595 | ) | | $ | 3,654,682 | | | $ | 467,359,462 | | | $ | 94,460,245 | | | $ | 561,819,707 | | | $ | 196,356,107 | | | $ | 76,578,073 | |
| | | | | | | | | | | | | | | | | | | | | | | | | | | | | | | | | | | | | | | | | | | | | | | | | | | | |
See notes to consolidated financial statements.
F-8
| | | | | | | | | | | | | | | | | | | | | | | | | | | | | | | | | | | | | | | | | | | | | | | | | | | | |
| | | | | | | | | | | | | | | | | | | | | | | | | | | | | | | |
| | | | | | | | | | | | | | | | | | | | | | | | | | | | | | | | | | |
| | | | | | | | | | | | | | | | | | | | | | | | Accumulated
Other
Comprehensive
Income (Loss) | | | Total
SmartStop
Self Storage
REIT, Inc.
Equity | | | | | | | | | | | | | |
Balance as of December 31, 2022 | | | 88,853,454 | | | $ | 88,853 | | | | 8,085,550 | | | $ | 8,085 | | | $ | 894,283,954 | | | $ | (266,151,517 | ) | | $ | (164,524,595 | ) | | $ | 3,654,682 | | | $ | 467,359,462 | | | $ | 94,460,245 | | | $ | 561,819,707 | | | $ | 196,356,107 | | | $ | 76,578,073 | |
| | | — | | | | — | | | | — | | | | — | | | | (10,412 | ) | | | — | | | | — | | | | — | | | | (10,412 | ) | | | — | | | | (10,412 | ) | | | — | | | | — | |
Tax withholding (net settlement) related to vesting of restricted stock | | | (17,422 | ) | | | (17 | ) | | | — | | | | — | | | | (246,645 | ) | | | — | | | | — | | | | — | | | | (246,662 | ) | | | — | | | | (246,662 | ) | | | — | | | | — | |
Changes to redeemable common
stock | | | — | | | | — | | | | — | | | | — | | | | (17,636,337 | ) | | | — | | | | — | | | | — | | | | (17,636,337 | ) | | | — | | | | (17,636,337 | ) | | | — | | | | 17,636,337 | |
Redemptions of common
stock | | | (1,160,283 | ) | | | (1,160 | ) | | | (88,382 | ) | | | (88 | ) | | | — | | | | — | | | | — | | | | — | | | | (1,248 | ) | | | — | | | | (1,248 | ) | | | — | | | | (22,937,215 | ) |
Issuance of restricted stock, net of forfeitures | | | 42,566 | | | | 43 | | | | — | | | | — | | | | — | | | | — | | | | — | | | | — | | | | 43 | | | | — | | | | 43 | | | | — | | | | — | |
Distributions ($0.60 per share) | | | — | | | | — | | | | — | | | | — | | | | — | | | | (58,039,039 | ) | | | — | | | | — | | | | (58,039,039 | ) | | | — | | | | (58,039,039 | ) | | | — | | | | — | |
Distributions to noncontrolling interests in our Operating Partnership | | | — | | | | — | | | | — | | | | — | | | | — | | | | — | | | | — | | | | — | | | | — | | | | (8,298,194 | ) | | | (8,298,194 | ) | | | — | | | | — | |
Distributions to other noncontrolling interests | | | — | | | | — | | | | — | | | | — | | | | — | | | | — | | | | — | | | | — | | | | — | | | | (587,530 | ) | | | (587,530 | ) | | | — | | | | — | |
Issuance of shares for distribution reinvestment plan | | | 1,042,820 | | | | 1,043 | | | | 116,659 | | | | 117 | | | | 17,635,177 | | | | — | | | | — | | | | — | | | | 17,636,337 | | | | — | | | | 17,636,337 | | | | — | | | | — | |
Equity based compensation expense | | | — | | | | — | | | | — | | | | — | | | | 830,817 | | | | — | | | | — | | | | — | | | | 830,817 | | | | 4,427,429 | | | | 5,258,246 | | | | — | | | | — | |
Net income attributable to SmartStop Self Storage REIT, Inc. common stockholders | | | — | | | | — | | | | — | | | | — | | | | — | | | | — | | | | (2,745,698 | ) | | | — | | | | (2,745,698 | ) | | | — | | | | (2,745,698 | ) | | | — | | | | — | |
Net income attributable to the noncontrolling interests in our Operating Partnership | | | — | | | | — | | | | — | | | | — | | | | — | | | | — | | | | — | | | | — | | | | — | | | | 1,313,566 | | | | 1,313,566 | | | | — | | | | — | |
Net income attributable to other noncontrolling interests | | | — | | | | — | | | | — | | | | — | | | | — | | | | — | | | | — | | | | — | | | | — | | | | 578,892 | | | | 578,892 | | | | — | | | | — | |
Foreign currency translation adjustment | | | — | | | | — | | | | — | | | | — | | | | — | | | | — | | | | — | | | | 1,307,400 | | | | 1,307,400 | | | | 173,320 | | | | 1,480,720 | | | | — | | | | — | |
Foreign currency hedge contract loss | | | — | | | | — | | | | — | | | | — | | | | — | | | | — | | | | — | | | | (941,025 | ) | | | (941,025 | ) | | | (124,885 | ) | | | (1,065,910 | ) | | | — | | | | — | |
Interest rate hedge contract loss | | | — | | | | — | | | | — | | | | — | | | | — | | | | — | | | | — | | | | (3,173,874 | ) | | | (3,173,874 | ) | | | (419,695 | ) | | | (3,593,569 | ) | | | — | | | | — | |
| | | | | | | | | | | | | | | | | | | | | | | | | | | | | | | | | | | | | | | | | | | | | | | | | | | | |
Balance as of December 31, 2023 | | | 88,761,135 | | | $ | 88,762 | | | | 8,113,827 | | | $ | 8,114 | | | $ | 894,856,554 | | | $ | (324,190,556 | ) | | $ | (167,270,293 | ) | | $ | 847,183 | | | $ | 404,339,764 | | | $ | 91,523,148 | | | $ | 495,862,912 | | | $ | 196,356,107 | | | $ | 71,277,195 | |
| | | | | | | | | | | | | | | | | | | | | | | | | | | | | | | | | | | | | | | | | | | | | | | | | | | | |
See notes to consolidated financial statements.
F-9
SMARTSTOP SELF STORAGE REIT, INC. AND SUBSIDIARIES
CONSOLIDATED STATEMENTS OF CASH FLOWS
Years Ended December 31, 2023, 2022 and 2021
| | | | | | | | | | | | |
| | | Year Ended
December 31,
2023 | | | Year Ended
December 31,
2022 | | | Year Ended
December 31,
2021 | |
Cash flows from operating activities: | | | | | | | | | | | | |
| | $ | | | | $ | | | | $ | | ) |
Adjustments to reconcile net income (loss) to net cash provided by operating activities: | | | | | | | | | | | | |
Depreciation and amortization | | | | | | | | | | | | |
Change in deferred tax assets and liabilities | | | | ) | | | | ) | | | | ) |
Accretion of fair market value adjustment of secured debt | | | | | | | | ) | | | | ) |
Amortization of debt issuance costs | | | | | | | | | | | | |
Equity based compensation expense | | | | | | | | | | | | |
Non-cash adjustment from equity method investments in JV Properties | | | 1,625,135 | | | | 760,005 | | | | 560,451 | |
Non-cash adjustment from equity method investments in Managed REITs | | | 1,694,393 | | | | 930,200 | | | | 489,799 | |
Accretion of financing fee revenues | | | (664,078 | ) | | | (681,151 | ) | | | — | |
Contingent earnout adjustment | | | | | | | | | | | | |
Unrealized foreign currency and derivative (gains) losses | | | | ) | | | | | | | | |
Net loss on extinguishment of debt | | | | | | | | | | | | |
Gain on equity interests upon acquisition | | | | | | | | ) | | | | |
Write-off of equity interest and preexisting relationships upon acquisition of control | | | | | | | | | | | | |
Gain on deconsolidation of SST VI OP | | | | | | | | | | | | ) |
Gain on sale of real estate | | | | | | | | | | | | ) |
Increase (decrease) in cash from changes in assets and liabilities: | | | | | | | | | | | | |
| | | | | | | | ) | | | | ) |
Purchase of SOFR interest rate caps | | | | | | | | ) | | | | |
Accounts payable and accrued liabilities | | | | ) | | | | | | | | |
Managed REITs receivables | | | | ) | | | | | | | | ) |
| | | | | | | | ) | | | | ) |
| | | | | | | | | | | | |
Net cash provided by operating activities | | | | | | | | | | | | |
| | | | | | | | | | | | |
Cash flows from investing activities: | | | | | | | | | | | | |
SSGT II Merger, net of cash acquired | | | | | | | | ) | | | | |
SST IV Merger, net of cash acquired | | | | | | | | | | | | ) |
| | | | ) | | | | ) | | | | ) |
| | | | ) | | | | ) | | | | ) |
Insurance proceeds on insured property damage | | | 1,725,967 | | | | — | | | | — | |
Deposits on acquisition of real estate | | | | ) | | | | ) | | | | ) |
Redemption of preferred equity investment in SSGT II | | | | | | | | | | | | |
Settlement of foreign currency hedges designated for hedge accounting | | | | | | | | | | | | ) |
Investments in Managed REITs | | | | | | | | ) | | | | |
Capital distributions from Managed REITs | | | 597,364 | | | | — | | | | — | |
Investments in unconsolidated JV Properties | | | | ) | | | | ) | | | | ) |
Capital distributions from unconsolidated JV Properties | | | 1,320,865 | | | | — | | | | — | |
Deconsolidation of SST VI OP | | | | | | | | | | | | ) |
SST VI OP repayment of debt | | | | | | | | | | | | |
SST VI Mezzanine Loan funding | | | | ) | | | | ) | | | | ) |
SST VI Mezzanine Loan repayment | | | 50,000,000 | | | | — | | | | — | |
SSGT III Mezzanine Loan funding | | | | ) | | | | ) | | | | |
SSGT III Mezzanine Loan repayment | | | | | | | | | | | | |
SST VI preferred equity investment | | | (15,000,000 | ) | | | — | | | | — | |
SST VI preferred equity investment redemption | | | 15,000,000 | | | | — | | | | — | |
F-10
| | | | | | | | | | | | |
| | | Year Ended
December 31,
2023 | | | Year Ended
December 31,
2022 | | | Year Ended
December 31,
2021 | |
SST VI promissory note funding | | | (15,000,000 | ) | | | — | | | | — | |
Purchase of SST VI Subordinated Class C Units | | | (3,197,083 | ) | | | — | | | | — | |
| | | | ) | | | | | | | | ) |
Net proceeds from the sale of real estate | | | | | | | | | | | | |
Settlement of company owned life insurance | | | | | | | | | | | | |
| | | | | | | | | | | | |
Net cash used in investing activities | | | | | | | | ) | | | | ) |
| | | | | | | | | | | | |
Cash flows from financing activities: | | | | | | | | | | | | |
Gross proceeds from issuance of non-revolver debt | | | | | | | | | | | | |
Repayment of non-revolver debt | | | (12,016,875 | ) | | | (86,237,235 | ) | | | (422,190,754 | ) |
Scheduled principal payments on non-revolver debt | | | (2,639,399 | ) | | | (2,512,634 | ) | | | (1,294,637 | ) |
Proceeds from issuance of revolver debt | | | 135,000,000 | | | | 318,000,000 | | | | 246,505,250 | |
Repayment of revolver debt | | | (184,512,859 | ) | | | (183,000,000 | ) | | | (15,000,000 | ) |
| | | | ) | | | | ) | | | | ) |
| | | | | | | | ) | | | | ) |
| | | | ) | | | | ) | | | | ) |
Redemption of common stock | | | | ) | | | | ) | | | | ) |
Restricted stock withholding for payroll taxes | | | (246,662 | ) | | | — | | | | — | |
Gross proceeds from issuance of equity in SST VI OP | | | | | | | | | | | | |
Offering costs related to issuance of equity in SST VI OP | | | | | | | | | | | | ) |
Gross proceeds from issuance of equity in other non controlling interests | | | — | | | | 1,000 | | | | — | |
Distributions paid to preferred stockholders | | | (12,500,000 | ) | | | (12,500,000 | ) | | | (12,277,935 | ) |
Distributions paid to common stockholders | | | (40,597,803 | ) | | | (49,391,782 | ) | | | (26,157,045 | ) |
Distributions paid to noncontrolling interests in our OP | | | (8,272,896 | ) | | | (7,032,520 | ) | | | (6,139,772 | ) |
Distributions paid to other noncontrolling interests | | | (587,530 | ) | | | (268,695 | ) | | | — | |
| | | | | | | | | | | | |
Net cash provided by financing activities | | | | ) | | | | | | | | |
| | | | | | | | | | | | |
Impact of foreign exchange rate changes on cash and restricted cash | | | | | | | | ) | | | | ) |
| | | | | | | | | | | | |
Change in cash, cash equivalents, and restricted cash | | | | | | | | | | | | ) |
Cash, cash equivalents, and restricted cash beginning of year | | | | | | | | | | | | |
| | | | | | | | | | | | |
Cash, cash equivalents, and restricted cash end of year | | $ | | | | $ | | | | $ | | |
| | | | | | | | | | | | |
Supplemental disclosures and non-cash transactions: | | | | | | | | | | | | |
Cash paid for interest, net of capitalized interest | | $ | 55,647,072 | | | $ | 36,523,574 | | | $ | 27,220,673 | |
Cash paid for income taxes | | $ | 406,728 | | | $ | 265,930 | | | $ | — | |
Supplemental disclosure of noncash activities: | | | | | | | | | | | | |
Issuance of shares pursuant to distribution reinvestment plan | | $ | 17,636,337 | | | $ | 5,243,398 | | | $ | 19,564,929 | |
Intangible assets applied to the purchase of real estate | | $ | | | | $ | | | | $ | | |
| | $ | 9,155,808 | | | $ | 9,324,453 | | | $ | 8,360,420 | |
Redemption of common stock included in accounts payable and accrued liabilities | | $ | 3,945,126 | | | $ | — | | | $ | 1,676,874 | |
Earnest deposits on acquisitions assigned to the Managed REITs, amounts reclassified to Managed REIT’s receivables | | $ | 1,194,942 | | | $ | — | | | $ | — | |
Deposit applied to the purchase of real estate | | $ | | | | $ | | | | $ | | |
Conversion of A-2 Units into A-1 Units | | $ | — | | | $ | 31,514,447 | | | $ | 11,219,744 | |
Real estate and construction in process included in accounts payable and accrued liabilities | | $ | 433,039 | | | $ | 515,898 | | | $ | 19,056 | |
Issuance of common stock and OP Units in connection with the mergers | | $ | — | | | $ | 168,791,577 | | | $ | 231,412,470 | |
| | $ | — | | | $ | — | | | $ | 81,165,978 | |
See notes to consolidated financial statements.
F-11
SMARTSTOP SELF STORAGE REIT, INC. AND SUBSIDIARIES
NOTES TO CONSOLIDATED FINANCIAL STATEMENTS
December 31, 2023, 2022 and 2021
SmartStop Self Storage REIT, Inc., a Maryland corporation (the “Company”), is a self-managed and fully-integrated self storage real estate investment trust (“REIT”), formed on January 8, 2013 under the Maryland General Corporation Law. Our
year-end
is December 31. As used in this report, “we,” “us,” “our,” and “Company” refer to SmartStop Self Storage REIT, Inc. and each of our subsidiaries.
We acquire and own self storage facilities; we also operate self storage facilities owned by us as well as those owned by the entities sponsored by us. As of December 31, 2023, we wholly-owned 154 self storage facilities located in 19 states (Alabama, Arizona, California, Colorado, Florida, Illinois, Indiana, Maryland, Massachusetts, Michigan, New Jersey, Nevada, North Carolina, Ohio, South Carolina, Texas, Virginia, Washington, and Wisconsin) and the Greater Toronto Area of Ontario, Canada.
As discussed herein, we, through our subsidiaries, currently serve as the sponsor of Strategic Storage Trust VI, Inc., a publicly-registered
non-traded
REIT (“SST VI”), and Strategic Storage Growth Trust III, Inc., a private REIT (“SSGT III” and together with SST VI, the “Managed REITs”). We also served as the sponsor of Strategic Storage Trust IV, Inc., a public
non-traded
REIT (“SST IV”) through March 17, 2021, and Strategic Storage Growth Trust II, Inc., a private REIT (“SSGT II”) through June 1, 2022, the dates on which we closed on the mergers of SST IV (the “SST IV Merger”) and SSGT II (the “SSGT II Merger”), respectively, as defined in Note 3 - Real Estate Facilities. Prior to March 17, 2021 and June 1, 2022, SST IV and SSGT II respectively, were also included in the “Managed REITs.”
We operate the properties owned by the Managed REITs, which together with one other self storage property we manage, as of December 31, 2023, represented 32 operating properties and approximately 25,400 units and 2.8 million rentable square feet. Through our Managed REIT Platform (as defined below), we originate, structure, and manage additional self storage investment products.
SmartStop OP, L.P. (the “Operating Partnership”) owns, directly or indirectly through one or more subsidiaries, all of the self storage properties that we own. As of December 31, 2023, we owned approximately 88.1% of the common units of limited partnership interests of our Operating Partnership. The remaining approximately 11.9% of the common units are owned by current and former employees, members of our executive management team, board members, or indirectly by Strategic Asset Management I, LLC (f/k/a SmartStop Asset Management, LLC), our former sponsor (“SAM”), its affiliates, and affiliates of Select Capital Corporation, the former dealer manager of our offering (the “Former Dealer Manager”). As the sole general partner of our Operating Partnership, we have the exclusive power to manage and conduct the business of our Operating Partnership.
We commenced our initial public offering in January 2014, in which we offered a maximum of $1.0 billion in common shares for sale to the public (the “Primary Offering”) and $95.0 million in common shares for sale pursuant to our distribution reinvestment plan (collectively, the “Offering”). At the termination of our Offering in January 2017, we had sold approximately 48 million Class A Shares and approximately 7 million Class T Shares for approximately $493 million and $73 million respectively.
In November 2016, we filed with the SEC a Registration Statement on Form
S-3,
which registered up to an additional $100.9 million in shares under our distribution reinvestment plan (our “DRP Offering”). The DRP Offering may be terminated at any time upon 10 days’ prior written notice to stockholders. As of December 31, 2023, we had sold approximately 8.2 million Class A Shares and approximately 1.1 million Class T Shares through our DRP Offering.
F-12
SMARTSTOP SELF STORAGE REIT, INC. AND SUBSIDIARIES
NOTES TO CONSOLIDATED FINANCIAL STATEMENTS
December 31, 2023, 2022 and 2021
On January 15, 2024, our board of directors, (the “Board”), upon recommendation of our Nominating and Corporate Governance Committee, approved an Estimated Per Share NAV of our common stock of $15.25 for our Class A Shares and Class T Shares based on the estimated value of our assets less the estimated value of our liabilities, or net asset value, divided by the number of shares outstanding on a fully diluted basis, calculated as of September 30, 2023.
Note 2. Summary of Significant Accounting Policies
The accompanying consolidated financial statements have been prepared in accordance with U.S. generally accepted accounting principles (“GAAP”) as contained within the Financial Accounting Standards Board (“FASB”) Accounting Standards Codification (“ASC”) and the rules and regulations of the SEC.
The square footage, unit count, and occupancy percentage data and related disclosures included in these notes to the consolidated financial statements are unaudited.
Principles of Consolidation
Our financial statements, and the financial statements of our Operating Partnership, including its wholly-owned subsidiaries, are consolidated in the accompanying consolidated financial statements. The portion of these entities not wholly-owned by us is presented as noncontrolling interests. All intercompany accounts and transactions have been eliminated in consolidation.
Strategic Storage Operating Partnership VI, L.P. (“SST VI OP”), the operating partnership of SST VI, and its wholly-owned subsidiaries, were consolidated by us from March 10, 2021 (the date of our initial investment in SST VI OP) until May 1, 2021. The portion not wholly-owned by us was presented as noncontrolling interests, and all intercompany accounts and transactions were eliminated when they were consolidated by us.
Consolidation Considerations
Current accounting guidance provides a framework for identifying a variable interest entity (“VIE”) and determining when a company should include the assets, liabilities, noncontrolling interests, and results of activities of a VIE in its consolidated financial statements. In general, a VIE is an entity or other legal structure used to conduct activities or hold assets that either (1) has an insufficient amount of equity to carry out its principal activities without additional subordinated financial support, (2) has a group of equity owners that are unable to make significant decisions about its activities, or (3) has a group of equity owners that do not have the obligation to absorb losses or the right to receive returns generated by its operations. Generally, a VIE should be consolidated if a party with an ownership, contractual, or other financial interest in the VIE (a variable interest holder) has the power to direct the VIE’s most significant activities and the obligation to absorb losses or right to receive benefits of the VIE that could be significant to the VIE. A variable interest holder that consolidates the VIE is called the primary beneficiary. Upon consolidation, the primary beneficiary generally must initially record all of the VIE’s assets, liabilities, and noncontrolling interest at fair value and subsequently account for the VIE as if it were consolidated based on majority voting interest.
Our Operating Partnership is deemed to be a VIE and is consolidated by the Company as we are currently the primary beneficiary. Our sole significant asset is our investment in our Operating Partnership; as a result, substantially all of our assets and liabilities represent those assets and liabilities of our Operating Partnership and its wholly-owned subsidiaries.
F-13
SMARTSTOP SELF STORAGE REIT, INC. AND SUBSIDIARIES
NOTES TO CONSOLIDATED FINANCIAL STATEMENTS
December 31, 2023, 2022 and 2021
From March 10, 2021 until May 1, 2021, we were deemed to be the primary beneficiary of SST VI OP, and their operations were therefore consolidated by us. Subsequent to May 1, 2021, we are no longer the primary beneficiary, and their operations are no longer consolidated by us.
On March 1, 2022, Pacific Oak Holding Group, LLC, the parent company of Pacific Oak Capital Markets, LLC, the dealer manager for the public offering of SST VI, became a 10%
non-voting
member of Strategic Storage Advisor VI, LLC, our advisor to SST VI (the “SST VI Advisor”). We continue to be the primary beneficiary of SST VI Advisor, and their operations therefore continue to be consolidated by us.
As of December 31, 2023, we were not a party to any other material contracts or interests that would be deemed variable interests in VIEs other than our joint ventures with SmartCentres and our equity investments in the Managed REIT’s, which are all accounted for under the equity method of accounting (see Note 4 – Investments in Unconsolidated Real Estate Ventures and Note 10 - Related Party Transactions for additional information), and our joint venture programs through which we offer our tenant insurance, tenant protection plans or similar programs (the “Tenant Protection Programs”) with SST VI, SSGT III, and SSGT II (through June 1, 2022) which are consolidated.
Under the equity method, our investments are stated at cost and adjusted for our share of net earnings or losses and reduced by distributions and impairments, as applicable. Equity in earnings will generally be recognized based on our ownership interest in the earnings of each of the unconsolidated investments and recorded within our consolidated statements of operations. Our share of earnings and losses from our equity method investments in the JV Properties (as defined in Note 4 - Investments in Unconsolidated Real Estate Ventures) was previously included in Other, net within our consolidated statements of operations, but has been reclassified to Equity in earnings (losses) from investments in JV Properties within the current consolidated statements of operations included herein.
Investments in and Advances to Managed REITs
As of December 31, 2023, and 2022, we owned equity and debt investments in the Managed REITs; such amounts are included in Investments in and advances to Managed REITs within our consolidated balance sheets. We account for the equity investments using the equity method of accounting as we have the ability to exercise significant influence, but not control, over the Managed REITs’ operating and financial policies through our advisory and property management agreements with the respective Managed REITs. The equity method of accounting requires the investment to be initially recorded at cost and subsequently adjusted for our share of equity in the respective Managed REIT’s earnings and reduced by distributions. Our share of earnings and losses from our equity method investments in the Managed REITs was previously included in Other, net within our consolidated statements of operations, but has been reclassified to Equity in earnings (losses) from investments in Managed REITs within our current consolidated statements of operations included herein.
We record the interest on our debt investments on the accrual basis and such income is included in Other, net, within Other income (expense) of our consolidated statements of operations. While we do make loans periodically, we do not consider that to be part of our ordinary operating activity, and therefore do not report income from loans as operating income.
See Note 10 – Related Party Transactions for additional information.
F-14
SMARTSTOP SELF STORAGE REIT, INC. AND SUBSIDIARIES
NOTES TO CONSOLIDATED FINANCIAL STATEMENTS
December 31, 2023, 2022 and 2021
Noncontrolling Interests in Consolidated Entities
We account for the noncontrolling interests in our Operating Partnership and the noncontrolling interests in SST VI Advisor and our Tenant Protection Programs joint ventures with SST VI, SSGT III, and SSGT II (prior to the SSGT II Merger on June 1, 2022) in accordance with the related accounting guidance. Due to our control through our general partnership interest in our Operating Partnership and the limited rights of the limited partners, our Operating Partnership, including its wholly-owned subsidiaries, are consolidated with the Company and the limited partner interests are reflected as noncontrolling interests in the accompanying consolidated balance sheets. We also consolidate our interests in the SSGT III and SST VI Tenant Protection Programs and present the minority interests as noncontrolling interests in the accompanying consolidated balance sheets. The noncontrolling interests shall be attributed their share of income and losses, even if that attribution results in a deficit noncontrolling interests balance.
The preparation of the consolidated financial statements in conformity with GAAP requires management to make estimates and assumptions that affect the amounts reported in the consolidated financial statements and accompanying notes. The current economic environment has increased the degree of uncertainty inherent in these estimates and assumptions. Management will adjust such estimates when facts and circumstances dictate. Actual results could materially differ from those estimates. The most significant estimates made include that of real estate acquisition valuation and the allocation of property purchase price to tangible and intangible assets acquired and liabilities assumed at relative fair value, the evaluation of potential impairment of indefinite and long-lived assets and goodwill, and the estimated useful lives of real estate assets and intangibles.
Cash and Cash Equivalents
We consider all short-term, highly liquid investments that are readily convertible to cash with a maturity of three months or less at the time of purchase to be cash equivalents.
We may maintain cash and cash equivalents in financial institutions in excess of insured limits. In an effort to mitigate this risk, we only invest in or through major financial institutions.
Restricted cash consists primarily of impound reserve accounts for property taxes, insurance and capital improvements in connection with the requirements of certain of our loan agreements.
Real Estate Purchase Price Allocation and Treatment of Acquisition Costs
We account for asset acquisitions in accordance with GAAP which requires that we allocate the purchase price of a property to the tangible and intangible assets acquired and the liabilities assumed based on their relative fair values as of the date of acquisition. This guidance requires us to make significant estimates and assumptions, including fair value estimates, which requires the use of significant unobservable inputs as of the acquisition date. We engage third-party valuation specialists to assist in the determination of significant estimates and market-based assumptions used in the valuation models.
The value of the tangible assets, consisting of land and buildings, is determined as if vacant. Substantially all of the leases in place at acquired properties are at market rates, as the majority of the leases are
F-15
SMARTSTOP SELF STORAGE REIT, INC. AND SUBSIDIARIES
NOTES TO CONSOLIDATED FINANCIAL STATEMENTS
December 31, 2023, 2022 and 2021
contracts. We also consider whether
in-place,
market leases represent an intangible asset. We recorded none, approximately $10.5 million, and $21.5 million in intangible assets to recognize the value of
in-place
leases related to our acquisitions during the years ended December 31, 2023, 2022, and 2021, respectively. We do not expect, nor to date have we recorded, intangible assets for the value of customer relationships because we expect we will not have concentrations of significant customers and the average customer turnover will be fairly frequent.
Allocation of purchase price to acquisitions of portfolios of facilities are allocated to the individual facilities based upon an income approach or a cash flow analysis using appropriate risk adjusted capitalization rates which take into account the relative size, age, and location of the individual facility along with current and projected occupancy and rental rate levels or appraised values, if available.
Acquisitions that do not meet the definition of a business, as defined under current GAAP, are accounted for as asset acquisitions. During the years ended December 31, 2023, 2022, and 2021, our property acquisitions, including the SST IV Merger and the SSGT II Merger, did not meet the definition of a business because substantially all of the fair value was concentrated in a single identifiable asset or group of similar identifiable assets (i.e. land, buildings, and related intangible assets) and because the acquisitions did not include a substantive process in the form of an acquired workforce or an acquired contract that cannot be replaced without significant cost, effort or delay. As a result, once an acquisition is deemed probable, acquisition related transaction costs are capitalized rather than expensed.
During the years ended December 31, 2023, 2022, and 2021 we expensed approximately $0.2 million, $0.9 million, and $0.9 million, respectively, of acquisition-related transaction costs that did not meet our capitalization policy during the respective periods.
Evaluation of Possible Impairment of Real Property Assets
Management monitors events and changes in circumstances that could indicate that the carrying amounts of our real property assets may not be recoverable. When indicators of potential impairment are present that indicate that the carrying amounts of the assets may not be recoverable, we will assess the recoverability of the assets by determining whether the carrying value of the real property assets will be recovered through the undiscounted future operating cash flows expected from the use of the asset and its eventual disposition. In the event that such expected undiscounted future cash flows do not exceed the carrying value, we will adjust the value of the real property assets to the fair value and recognize an impairment loss. For the years ended December 31, 2023, 2022, and 2021, no real property asset impairment losses were recognized.
We initially recorded goodwill as a result of the Self Administration Transaction (as defined in Note 10 – Related Party Transactions), which occurred in 2019. Goodwill is recorded as the difference, if any, between the aggregate consideration paid for an acquisition and the fair value of the net tangible assets and other intangible assets acquired. Goodwill is allocated to various reporting units, as applicable, and is not amortized. We perform an annual qualitative impairment assessment as of December 31 for goodwill; between annual tests we evaluate the recoverability of goodwill whenever events or changes in circumstances indicate that the carrying amount of goodwill may not be fully recoverable. If circumstances indicate the carrying amount may not be fully recoverable, we perform a quantitative analysis to compare the fair value of each reporting unit to its respective carrying amount. If the carrying amount of goodwill exceeds its fair value, an impairment charge will be recognized.
F-16
SMARTSTOP SELF STORAGE REIT, INC. AND SUBSIDIARIES
NOTES TO CONSOLIDATED FINANCIAL STATEMENTS
December 31, 2023, 2022 and 2021
See Note 10 – Related Party Transactions for additional information.
In connection with the Self Administration Transaction, we recorded the fair value associated with the two primary trademarks acquired therein.
Trademarks are based on the value of our brands. Trademarks are valued using the relief from royalty method, which presumes that without ownership of such trademarks, we would have to make a stream of payments to a brand or franchise owner in return for the right to use their name. By virtue of this asset, we avoid any such payments and record the related intangible fair value of our ownership of the brand name.
As of December 31, 2023 and December 31, 2022, $15.7 million was recorded related to the SmartStop
®
Self Storage trademark, which is an indefinite lived trademark. As of December 31, 2023 and December 31, 2022, approximately $71,000 and $211,000, respectively, was recorded to the “Strategic Storage
®
”
trademark, which is a definite lived trademark. The total estimated future amortization expense of the “Strategic Storage
®
” trademark asset for the year ending December 31, 2024 is approximately $71,000.
We qualitatively evaluate whether any triggering events or changes in circumstances have occurred in addition to our annual impairment test that would indicate an impairment condition may exist. If any change in circumstance or triggering event occurs, and results in a significant impact to our revenue and profitability projections, or any significant assumption in our valuation methods is adversely impacted, the impact could result in a material impairment charge in the future.
Management believes that all of our leases are operating leases. Rental income is recognized in accordance with the terms of the leases, which generally are
Revenues from any long-term operating leases are recognized on a straight-line basis over the term of the lease. The excess of rents received over amounts contractually due pursuant to the underlying leases is included in accounts payable and accrued liabilities in our consolidated balance sheets, and contractually due but unpaid rent is included in other assets.
In accordance with ASC 842, we review the collectability of lease payments on an ongoing basis. We consider collectability indicators when analyzing accounts receivable and historical bad debt levels, including current economic trends, all of which assist in evaluating the probability of outstanding and future rental income collections.
Additionally, we earn ancillary revenue by selling tenant insurance or tenant protection plans to customers at our properties through our Tenant Protection Programs, and to a lesser extent, through the sale of various moving and packing supplies such as locks and boxes. We recognize such revenue in the Ancillary operating revenue line within our consolidated statements of operations as the services are performed and as the goods are delivered.
We earn property management and asset management revenue, pursuant to the respective property management and advisory agreement contracts, in connection with providing services to the Managed REITs.
F-17
SMARTSTOP SELF STORAGE REIT, INC. AND SUBSIDIARIES
NOTES TO CONSOLIDATED FINANCIAL STATEMENTS
December 31, 2023, 2022 and 2021
We have determined under ASC 606 – Revenue from Contracts with Customers (“ASC 606”), that the performance obligation for the property management services and asset management services are satisfied as the services are rendered. While we are compensated for our services on a monthly basis, these services represent a series of distinct daily services in accordance with ASC 606. Such revenue is recorded in the Managed REIT Platform revenue line within our consolidated statements of operations.
The Managed REITs’ advisory agreements also provide for reimbursement to us of our direct and indirect costs of providing administrative and management services to the Managed REITs. These reimbursements include costs incurred in relation to organization and offering services provided to the Managed REITs and the reimbursement of salaries, bonuses, and other expenses related to benefits paid to our employees while performing services for the Managed REITs. The Managed REITs’ property management agreements also provide reimbursement to us for the property manager’s costs of managing the properties. Reimbursable costs include wages and salaries and other expenses that arise in operating, managing and maintaining the Managed REITs’ properties.
Under ASC 606, direct reimbursement of such costs does not represent a separate performance obligation from our obligation to perform property management and asset management services. The reimbursement income is considered variable consideration, and is recognized as the costs are incurred, subject to limitations on the Managed REIT Platform’s ability to incur offering costs or limitations imposed by the advisory agreements. We have elected to separately record such revenue in the Reimbursable costs from Managed REITs line within our consolidated statements of operations.
Additionally, we earn revenue in connection with our Tenant Protection Programs joint ventures with our Managed REITs. We also earn development and construction management revenue from services we provide in connection with the project design, coordination and oversite of development and certain capital improvement projects undertaken by the Managed REITs. We recognize such revenue in the Managed REIT Platform revenue line within our consolidated statements of operations as the services are performed or delivered. See Note 10 – Related Party Transactions, for additional information regarding revenue generated from our Managed REIT Platform.
Sponsor Funding Agreement
On November 1, 2023, SmartStop REIT Advisors, LLC, a subsidiary of SmartStop OP entered into a sponsor funding agreement with SST VI and SST VI OP (the “Sponsor Funding Agreement”), in connection with certain changes to the public offering of SST VI (see Note 10 - Related Party for additional information).
Pursuant to the Sponsor Funding Agreement, SmartStop, through a wholly-owned subsidiary, is required to fund the payment of the front-end sales load for the sale of SST VI’s class Y and class Z shares sold in their offering. In exchange, SmartStop receives a number of series C convertible units (“Series C Units”) in SST VI’s operating partnership calculated as the dollar amount of such funding divided by the then-current offering price for such class Y and Z shares. The Series C Units convert into class A units of SST VI OP if the estimated net asset value of SST VI, as declared by SST VI, exceeds $10.00 per share. Such conversion is limited such that the dilution caused by the conversion may not reduce the diluted estimated net asset value below $10.00 per share.
In accordance with ASC 606, the amount by which our funding exceeds the fair value of the Series C Units received is accounted for as a payment to a customer and is therefore recorded as a reduction to the transaction price for the services we provide to such customer. Each payment is initially included in the Other assets line-item in our consolidated balance sheet and subsequently recorded as a reduction of Managed REIT Platform
F-18
SMARTSTOP SELF STORAGE REIT, INC. AND SUBSIDIARIES
NOTES TO CONSOLIDATED FINANCIAL STATEMENTS
December 31, 2023, 2022 and 2021
revenues ratably over the remaining estimated life of our management contracts with SST VI. Below is a summary of the portion of sponsorship funding payments which exceeds the fair value of the Series C Units received, and is recorded pursuant to ASC 606 as described above:
| | | | |
Balance as of December 31, 2022 | | $ | — | |
| | | 3,526,927 | |
Recorded sponsor funding reduction | | | (33,643 | ) |
| | | | |
Balance as of December 31, 2023 | | $ | 3,493,284 | |
| | | | |
Allowance for Doubtful Accounts
Tenant accounts receivable is reported net of an allowance for doubtful accounts. Management records this general allowance estimate based upon a review of the current status of accounts receivable. It is reasonably possible that management’s estimate of the allowance will change in the future. As of December 31, 2023 and 2022, approximately $0.9 million and $0.7 million, respectively, were recorded to allowance for doubtful accounts, and are included within other assets in the accompanying consolidated balance sheets.
Advertising costs are expensed in the period in which the cost is incurred and are included in property operating expenses and general and administrative lines within our consolidated statements of operations, depending on the nature of the expense. We incurred advertising costs of approximately $2.2 million, $1.3 million, and $0.7 million for the years ended December 31, 2023, 2022, and 2021, respectively, within general and administrative. We incurred advertising costs of approximately $4.8 million, $4.4 million, and $3.7 million for the years ended December 31, 2023, 2022, and 2021, respectively, within property operating expenses.
We capitalize costs incurred to develop, construct, renovate and improve properties, including interest and property taxes incurred during the construction period. The construction period begins when expenditures for the real estate assets have been made and activities that are necessary to prepare the asset for its intended use are in progress. The construction period ends when the asset is substantially complete and ready for its intended use.
Depreciation of Real Property Assets
Our management is required to make subjective assessments as to the useful lives of our depreciable assets. We consider the period of future benefit of the asset to determine the appropriate useful lives.
Depreciation of our real property assets is charged to expense on a straight-line basis over the estimated useful lives as follows:
| | |
| | |
| Land | | |
| Buildings | | 30-40 years |
| Site Improvements | | |
F-19
SMARTSTOP SELF STORAGE REIT, INC. AND SUBSIDIARIES
NOTES TO CONSOLIDATED FINANCIAL STATEMENTS
December 31, 2023, 2022 and 2021
Depreciation of Personal Property Assets
Personal property assets consist primarily of furniture, fixtures and equipment and are depreciated on a straight-line basis over the estimated useful lives, generally ranging from 3 to 5 years, and are included in other assets on our consolidated balance sheets.
We have allocated a portion of our real estate purchase price to
in-place
lease intangibles, which amortize on a straight-line basis over the estimated future benefit period. Additionally, we have other contract related intangible assets. As of December 31, 2023, the gross amount of the intangible assets was approximately $80.7 million, and accumulated amortization was approximately $79.5 million. As of December 31, 2022, the gross amounts of the intangible assets was approximately $88.5 million and accumulated amortization was approximately $72.9 million. See Note 10 - Related Party Transactions for additional information.
The total estimated future amortization expense related to intangible assets for the years ending December 31, 2024, 2025, 2026, 2027, 2028, and thereafter is approximately $0.2 million, $0.1 million, $0.1 million, $0.1 million, $0.1 million, and $0.6 million thereafter, respectively.
The weighted-average amortization period on our remaining intangible assets with a net book value of approximately $1.2 million was approximately 5.8 years as of December 31, 2023.
We evaluate whether any triggering events or changes in circumstances have occurred subsequent to our annual impairment test that would indicate an impairment condition may exist. If any change in circumstance or triggering event occurs, and results in a significant impact to our revenue and profitability projections, or any significant assumption in our valuations methods is adversely impacted, the impact could result in an impairment charge in the future.
Costs incurred in connection with obtaining non revolving debt are presented on the balance sheet as a deduction from debt; amounts incurred related to obtaining revolving debt are included in the debt issuance costs line on our consolidated balance sheet (see Note 5 – Debt). Debt issuance costs are amortized using the effective interest method.
As of December 31, 2023, the gross amount of debt issuance costs related to our revolving credit facility totaled approximately $4.5 million and accumulated amortization of debt issuance costs related to our revolving credit facility totaled approximately $4.1 million. As of December 31, 2022, the gross amount of debt issuance costs related to our revolving credit facility totaled approximately $4.5 million, and accumulated amortization of debt issuance costs related to our revolving credit facility totaled approximately $2.4 million.
As of December 31, 2023, the gross amount allocated to debt issuance costs related to non-revolving debt totaled approximately $7.7 million and accumulated amortization of debt issuance costs related to non-revolving debt totaled approximately $3.4 million. As of December 31, 2022, the gross amount allocated to debt issuance costs related to
non-revolving
debt totaled approximately $7.0 million and accumulated amortization of debt issuance costs related to
non-revolving
debt totaled approximately $2.5 million.
Organizational and Offering Costs
Through March 31, 2022, we paid our Former Dealer Manager an ongoing stockholder servicing fee that was payable monthly and accrued daily in an amount equal to 1/365th of 1% of the purchase price per share of
F-20
SMARTSTOP SELF STORAGE REIT, INC. AND SUBSIDIARIES
NOTES TO CONSOLIDATED FINANCIAL STATEMENTS
December 31, 2023, 2022 and 2021
the Class T Shares sold in the Primary Offering. In accordance with the selling agreements we entered into with respect to the sale of Class T Shares, we ceased paying the stockholder servicing fee with respect to the Class T Shares sold in the Primary Offering on the fifth anniversary of the last day of the fiscal quarter in which our Primary Offering (i.e., excluding our distribution reinvestment plan offering) terminated (March 31, 2022). Our Former Dealer Manager entered into participating dealer agreements with certain other broker-dealers which authorized them to sell our shares. Upon sale of our shares by such broker-dealers, our Former Dealer Manager
re-allowed
all of the sales commissions and, subject to certain limitations, the stockholder servicing fees paid in connection with sales made by these broker-dealers. Our Former Dealer Manager was also permitted to
re-allow
to these broker-dealers a portion of their dealer manager fee as marketing fees, reimbursement of certain costs and expenses of attending training and education meetings sponsored by our Former Dealer Manager, payment of attendance fees required for employees of our Former Dealer Manager or other affiliates to attend retail seminars and public seminars sponsored by these broker-dealers, or to defray other distribution-related expenses. We recorded a liability within due to affiliates for the future estimated stockholder servicing fees at the time of sale of Class T Shares as an offering cost.
Foreign Currency Translation
For
non-U.S.
functional currency operations, assets and liabilities are translated to U.S. dollars at current exchange rates as of the reporting date. Revenues and expenses are translated at the average rates for the period. All adjustments related to amounts classified as long term net investments are recorded in accumulated other comprehensive income (loss) as a separate component of equity. Transactions denominated in a currency other than the functional currency of the related operation are recorded at rates of exchange in effect at the date of the transaction. Changes in investments not classified as long term are recorded in other income (expense) and represented a gain of approximately $0.2 million and a loss of approximately $9.6 million for the years ended December 31, 2023 and 2022, respectively.
We adopted a share redemption program (“SRP”) that enables stockholders to sell their shares to us in limited circumstances.
We have evaluated the terms of our SRP, and we classify amounts that are redeemable under the SRP as redeemable common stock in the accompanying consolidated balance sheets. The maximum amount of redeemable shares under our SRP is limited to the net proceeds from the distribution reinvestment plan. However, accounting guidance states that determinable amounts that can become redeemable should be presented as redeemable when such amount is known. Therefore, the net proceeds from the distribution reinvestment plan are considered to be temporary equity and are presented as redeemable common stock in the accompanying consolidated balance sheets.
In addition, current accounting guidance requires, among other things, that financial instruments that represent a mandatory obligation of us to repurchase shares be classified as liabilities and reported at settlement value. When we determine we have a mandatory obligation to repurchase shares under the SRP, we reclassify such obligations from temporary equity to a liability based upon their respective settlement values.
See Note 12 – Commitments and Contingencies for additional information on our SRP.
Accounting for Equity Awards
We issue equity based awards in two forms: (1) restricted stock awards consisting of shares of our common stock and (2) long-term incentive plan units of our Operating Partnership (“LTIP Units”), both of which may be
F-21
SMARTSTOP SELF STORAGE REIT, INC. AND SUBSIDIARIES
NOTES TO CONSOLIDATED FINANCIAL STATEMENTS
December 31, 2023, 2022 and 2021
issued subject to either time based vesting criteria or performance based vesting criteria restrictions. For time based awards granted which contain a graded vesting schedule, compensation cost is recognized as an expense on a straight-line basis over the requisite service period as if the award was, in substance, a single award. For performance based awards, compensation cost is recognized over the requisite service period if and when we determine the performance condition is probable of being achieved. We record the cost of such equity based awards based on the grant date fair value, and have elected to record forfeitures as they occur.
The Company terminated its relationship with a professional employer organization and began maintaining its own retirement savings plan during the year ended December 31, 2021 under Section 401(k) of the Internal Revenue Code under which eligible employees can contribute up to 100% of their annual salary, subject to a statutory prescribed annual limit. For the year ended December 31, 2023 and 2022, the Company made matching contributions to such plan of approximately $0.5 million and $0.5 million, respectively, based on a company match of 100% on the first 4% of an employee’s compensation.
Under GAAP, we are required to measure certain financial instruments at fair value on a recurring basis. In addition, we are required to measure other financial instruments and balances at fair value on a
non-recurring
basis. Fair value is defined by the accounting standard for fair value measurements and disclosures as the exchange price that would be received for an asset or paid to transfer a liability (an exit price) in the principal or most advantageous market for the asset or liability in an orderly transaction between market participants on the measurement date. It also establishes a fair value hierarchy that prioritizes observable and unobservable inputs used to measure fair value into three levels. The following summarizes the three levels of inputs and hierarchy of fair value we use when measuring fair value:
| | • | | Level 1 inputs utilize quoted prices (unadjusted) in active markets for identical assets or liabilities that we have the ability to access; |
| | • | | Level 2 inputs may include quoted prices for similar assets and liabilities in active markets, as well as interest rates and yield curves that are observable at commonly quoted intervals; and |
| | • | | Level 3 inputs are unobservable inputs for the assets or liabilities that are typically based on an entity’s own assumptions as there is little, if any, related market activity. |
In instances where the determination of the fair value measurement is based on inputs from different levels of the fair value hierarchy, the fair value measurement will fall within the lowest level that is significant to the fair value measurement in its entirety.
The accounting guidance for fair value measurements and disclosures provides a framework for measuring fair value and establishes a fair value hierarchy which requires an entity to maximize the use of observable inputs and minimize the use of unobservable inputs when measuring fair value. In determining fair value, we will utilize valuation techniques that maximize the use of observable inputs and minimize the use of unobservable inputs to the extent possible as well as consider counterparty credit risk in our assessment of fair value. Considerable judgment will be necessary to interpret Level 2 and 3 inputs in determining fair value of our financial and
non-financial
assets and liabilities. Accordingly, there can be no assurance that the fair values we will present will be indicative of amounts that may ultimately be realized upon sale or other disposition of these assets.
Financial and
non-financial
assets and liabilities measured at fair value on a
non-recurring
basis in our consolidated financial statements consist of real estate and related liabilities assumed related to our acquisitions
F-22
SMARTSTOP SELF STORAGE REIT, INC. AND SUBSIDIARIES
NOTES TO CONSOLIDATED FINANCIAL STATEMENTS
December 31, 2023, 2022 and 2021
along with the assets and liabilities described in Note 3 – Real Estate Facilities. The fair values of these assets and liabilities were determined as of the acquisition dates using widely accepted valuation techniques, including (i) discounted cash flow analysis, which considers, among other things, leasing assumptions, growth rates, discount rates and terminal capitalization rates, (ii) income capitalization approach, which considers prevailing market capitalization rates, and (iii) market approach, which considers comparable sales activity. Additionally, certain such assets and liabilities are required to be fair valued periodically or valued pursuant to ongoing fair value requirements and impairment analyses and have been valued subsequently utilizing the same techniques noted above. In general, we consider multiple valuation techniques when measuring fair values. However, in certain circumstances, a single valuation technique may be appropriate. All of the fair values of the assets and liabilities as of the acquisition dates were derived using Level 3 inputs.
The Series C Units (categorized within Level 3 of the fair value hierarchy) acquired in connection with the Sponsor Funding Agreement are measured at fair value at the time of acquisition, and are recorded using the equity method of accounting as described in Note 10 - Related Parties. The fair value of these units were determined using a valuation model which considered the following key assumptions: the projected distribution rate of SST VI, implied share price volatility, risk free interest rate, and the estimated effective life of the Series C Units.
The carrying amounts of cash and cash equivalents, restricted cash, other assets, accounts payable and accrued liabilities, distributions payable and amounts due to affiliates approximate fair value (categorized within Level 1 of the fair value hierarchy).
The table below summarizes the carrying amounts and fair values of financial instruments that are not carried at fair value as of December 31, 2023 and 2022. The estimated fair value of financial instruments is subjective in nature and is dependent on a number of important assumptions, including discount rates and relevant comparable market information associated with each financial instrument. The fair value of our fixed and variable rate debt was estimated by discounting the future cash flows using the current rates at which similar loans would be made to borrowers with similar credit ratings and for the same remaining maturities (categorized within Level 2 of the fair value hierarchy). The use of different market assumptions and estimation methodologies may have a material effect on the reported estimated fair value amounts. As of December 31, 2023 and 2022, we believe the carrying amounts of our variable rate debt are reasonably estimated at their notional amounts as there have been minimal changes to the fixed spread portion of interest rates for similar loans observed in the market, and as the variable portion of our interest rates fluctuate with the associated market indices.
| | | | | | | | | | | | | | | | |
| | | | | | | |
| | | | | | | | | | | | | |
| | $ | 505,700,000 | | | $ | 523,018,512 | | | $ | 410,600,000 | | | $ | 442,672,020 | |
During the years ended December 31, 2023 and 2022, we held interest rate cash flow hedges and foreign currency net investment hedges to hedge our interest rate and foreign currency exposure (See Notes 5 – Debt and 7 – Derivative Instruments). The fair value analyses of these instruments reflect the contractual terms of the derivatives, including the period to maturity, and used observable market-based inputs, including interest rate curves, foreign exchange rates, and implied volatilities, as applicable. The fair value of the interest rate swap and cap agreements are determined using widely accepted valuation techniques, including discounted cash flow analyses on the expected cash flows of the instruments. Our fair values of our net investment hedges are based primarily on the change in the spot rate at the end of the period as compared with the strike price at inception.
To comply with GAAP, we incorporate credit valuation adjustments to appropriately reflect both our own nonperformance risk and the respective counterparty’s nonperformance risk in the fair value measurements. In
F-23
SMARTSTOP SELF STORAGE REIT, INC. AND SUBSIDIARIES
NOTES TO CONSOLIDATED FINANCIAL STATEMENTS
December 31, 2023, 2022 and 2021
adjusting the fair value of derivative contracts for the effect of
non-performance
risk, we consider the impact of netting and any applicable credit enhancements, such as collateral postings, thresholds, mutual puts, and guarantees.
Although we had determined that the majority of the inputs used to value our derivatives were within Level 2 of the fair value hierarchy, the credit valuation adjustments associated with our derivatives utilized Level 3 inputs, such as estimates of current credit spreads, to evaluate the likelihood of default by us and our counterparties. However, through December 31, 2023, we had assessed the significance of the impact of the credit valuation adjustments on the overall valuation of our derivative positions and determined that the credit valuation adjustments were not significant to the overall valuation of our derivatives. As a result, we determined that our derivative valuations in their entirety were classified in Level 2 of the fair value hierarchy.
The table below presents the Company’s assets and liabilities measured at fair value on a recurring basis as of December 31, 2023, aggregated by the level in the fair value hierarchy within which those measurements fall:
| | | | | | | | | | | | |
| | | Fair Value Measurements at Reporting Date Using | |
| | Quoted Prices in
Active Markets
for Identical
Assets
| | | Significant
Other
Observable
Inputs
(Level 2) | | | Significant
unobservable
Inputs
(Level 3) | |
Other assets - interest rate derivatives | | $ | — | | | $ | 3,485,281 | | | $ | — | |
Accounts payable and accrued liabilities - foreign currency hedges | | $ | — | | | $ | 985,412 | | | $ | — | |
Derivative Instruments and Hedging Activities
We record all derivatives on our balance sheet at fair value. The accounting for changes in the fair value of derivatives depends on the intended use of the derivative, whether we have elected to designate a derivative in a hedging relationship and apply hedge accounting and whether the hedging relationship has satisfied the criteria necessary to apply hedge accounting. Derivatives designated and qualifying as a hedge of the exposure to changes in the fair value of an asset, liability, or firm commitment attributable to a particular risk, such as interest rate risk, are considered fair value hedges. Derivatives designated and qualifying as a hedge of the exposure to variability in expected future cash flows, or other types of forecasted transactions, are considered cash flow hedges. Derivatives may also be designated as hedges of the foreign currency exposure of a net investment in a foreign operation. We may enter into derivative contracts that are intended to economically hedge certain of our risks, even though hedge accounting does not apply or we elect not to apply hedge accounting.
For derivatives designated as net investment hedges, the effective portion of changes in the fair value of the derivatives are reported in accumulated other comprehensive income (loss). The ineffective portion of the change in fair value of the derivatives is recognized in Other, net, within our consolidated statements of operations. Amounts are reclassified out of other comprehensive (loss) income (“OCI”) into earnings (loss) when the hedged net investment is either sold or substantially liquidated.
We made an election to be taxed as a Real Estate Investment Trust (“REIT”), under Sections 856 through 860 of the Internal Revenue Code of 1986, as amended (the “Code”), commencing with our taxable year ended
F-24
SMARTSTOP SELF STORAGE REIT, INC. AND SUBSIDIARIES
NOTES TO CONSOLIDATED FINANCIAL STATEMENTS
December 31, 2023, 2022 and 2021
December 31, 2014. To qualify as a REIT, we must continue to meet certain organizational and operational requirements, including a requirement to distribute at least 90% of the REIT’s taxable income to stockholders (which is computed without regard to the dividends paid deduction or net capital gains and which does not equal net income as calculated in accordance with GAAP).
For income tax purposes, distributions to common stockholders are characterized as ordinary dividends, capital gain dividends, or as nontaxable distributions. To the extent that we make a distribution in excess of our current or accumulated earnings and profits, the distribution will be a
non-taxable
return of capital, reducing the tax basis in each U.S. stockholder’s shares, and the amount of each distribution in excess of a U.S. stockholder’s tax basis in its shares will be taxable as gain realized from the sale of its shares.
As a REIT, we generally will not be subject to U.S. federal income tax on taxable income that we distribute to our stockholders. If we fail to qualify as a REIT in any taxable year, we will then be subject to U.S. federal income taxes on our taxable income at regular corporate rates and will not be permitted to qualify for treatment as a REIT for U.S. federal income tax purposes for four years following the year during which qualification is lost unless the IRS grants us relief under certain statutory provisions. Such an event could materially adversely affect our net income and net cash available for distribution to stockholders. However, we believe that we are organized and operate in such a manner as to qualify for treatment as a REIT and intend to operate in the foreseeable future in such a manner that we will remain qualified as a REIT for U.S. federal income tax purposes.
Even if we continue to qualify for taxation as a REIT, we may be subject to certain state, local, and foreign taxes on our income and property, and federal income and excise taxes on our undistributed income.
We filed an election to treat our primary taxable REIT subsidiary (“TRS”) as a taxable REIT subsidiary effective January 1, 2014. In general, our TRS performs additional services for our customers and provides the advisory and property management services to the Managed REITs and otherwise generally engages in
non-real
estate related business. The TRS is subject to corporate federal and state income tax.
We account for deferred income taxes using the asset and liability method and recognize deferred tax assets and liabilities for the expected future tax consequences of events that have been included in our financial statements or tax returns. Deferred tax assets and liabilities are determined based on differences between financial reporting and tax bases of assets and liabilities using enacted tax rates in effect for the year in which the differences are expected to reverse. Our deferred tax assets (as further discussed in Note 8 - Income Taxes) were previously included in Other assets, net in our consolidated balance sheets, but have been reclassified to Deferred tax assets within the current consolidated balance sheets included herein.
Any increase or decrease in the deferred tax liability that results from a change in circumstances, and that causes a change in our judgment about expected future tax consequences of events, is included in the tax provision when such changes occur. Deferred income taxes also reflect the impact of operating loss and tax credit carryforwards. A valuation allowance is provided if we believe it is more likely than not that all or some portion of the deferred tax asset will not be realized. Any increase or decrease in the valuation allowance that results from a change in circumstances, and that causes a change in our judgment about the realizability of the related deferred tax asset, is included in the tax provision when such changes occur.
Uncertain tax positions may arise where tax laws may allow for alternative interpretations or where the timing of recognition of income is subject to judgment. Under ASC Topic 740, tax positions are evaluated for recognition using a more–likely–than–not threshold, and those tax positions requiring recognition are measured at the largest amount of tax benefit that is greater than 50 percent likely of being realized upon ultimate
F-25
SMARTSTOP SELF STORAGE REIT, INC. AND SUBSIDIARIES
NOTES TO CONSOLIDATED FINANCIAL STATEMENTS
December 31, 2023, 2022 and 2021
settlement with a taxing authority that has full knowledge of all relevant information. Interest and penalties relating to uncertain tax positions will be recognized in income tax expense when incurred. As of December 31, 2023 and 2022, the Company had no uncertain tax positions. Income taxes payable are classified within accounts payable and accrued liabilities in the consolidated balance sheets.
No single self storage customer represents a significant concentration of our revenues. For 2023, approximately 23%, 20%, and 10% of our rental income was concentrated in Florida, California, and the Greater Toronto Area of Canada, respectively. Our properties within the aforementioned geographic areas are dispersed therein, operating in multiple different regions and
sub-markets.
Our business is composed of two reportable segments: (i) self storage operations and (ii) the Managed REIT Platform business. Please see Note 9 – Segment Disclosures for additional detail.
Convertible Preferred Stock
We classify our Series A Convertible Preferred Stock (as defined in Note 6 – Preferred Equity) on our consolidated balance sheets using the guidance in ASC 480-10-S99. Our Series A Convertible Preferred Stock can be redeemed by us on or after the fifth anniversary of its issuance (October 29, 2024), or if certain events occur, such as the listing of our common stock on a national securities exchange, a change in control, or if a redemption would be required to maintain our REIT status. Additionally, if we do not maintain our REIT status the holder can require redemption. As the shares are contingently redeemable, and under certain circumstances not solely within our control, we have classified our Series A Convertible Preferred Stock as temporary equity.
We have analyzed whether the conversion features in our Series A Convertible Preferred Stock should be bifurcated under the guidance in ASC 815-10 and have determined that bifurcation is not necessary.
Basic earnings per share attributable to our common stockholders for all periods presented are computed by dividing net income (loss) attributable to our common stockholders by the weighted average number of common shares outstanding during the period, excluding unvested restricted stock.
Diluted earnings per share is computed by including the dilutive effect of the conversion of all potential common stock equivalents (which includes unvested restricted stock, Series A Convertible Preferred Stock, Class A and
Class A-1
OP Units, and unvested LTIP Units) and accordingly, as applicable, adjusting net income to add back any changes in earnings that reduce earnings per common share in the period associated with the potential common stock equivalents.
F-26
SMARTSTOP SELF STORAGE REIT, INC. AND SUBSIDIARIES
NOTES TO CONSOLIDATED FINANCIAL STATEMENTS
December 31, 2023, 2022 and 2021
The computation of earnings per common share is as follows for the periods presented:
| | | | | | | | | | | | |
| | | For the Year Ended December 31, | |
| | | | | | | | | | |
| | $ | 11,646,760 | | | $ | 21,669,452 | | | $ | (19,564,718 | ) |
Net (income) loss attributable to noncontrolling interests | | | (1,892,458 | ) | | | (2,847,572 | ) | | | 2,663,123 | |
| | | | | | | | | | | | |
Net income (loss) attributable to SmartStop Self Storage REIT, Inc. | | | | | | | | | | | | |
Less: Distributions to preferred stockholders | | | (12,500,000 | ) | | | (12,500,000 | ) | | | (12,500,000 | ) |
Less: Distributions to participating securities | | | (368,854 | ) | | | (285,796 | ) | | | (246,109 | ) |
| | | | | | | | | | | | |
Net income (loss) attributable to common stockholders for basic computations: | | | | | | | | | | | | |
| | | | | | | | | | | | |
Net income (loss) attributable to common stockholders for diluted computations: | | | | | | | | | | | | |
| | | | | | | | | | | | |
Weighted average Class A and Class T shares outstanding: | | | | | | | | | | | | |
Average number of Class A and Class T shares outstanding-basic | | | | | | | | | | | | |
| | | — | | | | — | | | | — | |
Unvested restricted stock awards | | | — | | | | 117,266 | | | | — | |
| | | | | | | | | | | | |
Average number of Class A and Class T shares outstanding - diluted | | | | | | | | | | | | |
Earnings per common share: | | | | | | | | | | | | |
| | $ | (0.03 | ) | | $ | 0.07 | | | $ | (0.37 | ) |
| | $ | (0.03 | ) | | $ | 0.07 | | | $ | (0.37 | ) |
The following table presents the weighted average Series A Convertible Preferred Stock, Class A and
Class A-1
OP Units, unvested LTIP Units, and unvested restricted stock awards, that were excluded from the computation of diluted earnings per share above as their effect would have been antidilutive for the respective periods, and was calculated using the
two-class,
treasury stock or
if-converted
method, as applicable:
| | | | | | | | | | | | |
| | | For the Year Ended December 31, | |
| | | | | | | | | | | | |
| | | | | | | | | |
| | | Equivalent Shares
(if converted) | | | Equivalent Shares
(if converted) | | | Equivalent Shares
(if converted) | |
Series A Convertible Preferred Stock | | | 18,761,726 | | | | 18,761,726 | | | | 18,761,726 | |
Class A and Class A-1 OP Units | | | 12,840,007 | | | | 11,667,696 | | | | 10,097,549 | |
| | | 413,538 | | | | 392,856 | | | | 179,344 | |
Unvested restricted stock awards | | | 59,973 | | | | — | | | | 105,476 | |
| | | | | | | | | | | | |
| | | 32,075,244 | | | | 30,822,278 | | | | 29,144,095 | |
| | | | | | | | | | | | |
Recently Adopted Accounting Guidance
In December 2022, the FASB issued ASU
2022-06,
“Reference Rate Reform (Topic 848).” ASU
2022-06
contains practical expedients for reference rate reform related activities that impact debt, leases, derivatives and other contracts. We elected to apply expedients related to contract modifications, changes in critical terms, and our assessments of effectiveness for designated hedged risks as qualifying changes are made to applicable debt and derivative contracts. Application of these expedients on such qualifying changes maintains the consistency of our presentation of debt and derivative contracts. ASU 2022-06 was adopted during the year ended December 31, 2022, and had no material impact on our consolidated financial statements.
F-27
SMARTSTOP SELF STORAGE REIT, INC. AND SUBSIDIARIES
NOTES TO CONSOLIDATED FINANCIAL STATEMENTS
December 31, 2023, 2022 and 2021
Recently Issued Accounting Guidance
In November 2023, the FASB issued ASU 2023-07, “Segment Reporting (Topic 280).” The guidance in ASU 2023-07 was issued to improve reportable segment disclosure requirements, primarily through enhanced disclosures about significant segment expenses. The amendment becomes effective for fiscal years beginning after December 15, 2023, and interim periods within fiscal years beginning after December 15, 2024. We are currently evaluating the impact upon adoption of the new standard on its consolidated financial statements and related disclosures.
In December 2023, the FASB issued ASU 2023-09, “Income Taxes (Topic 740).” The guidance in ASU 2023-09 was issued to provide investors with information to better assess how an entity’s operations and related tax risks, tax planning and operational opportunities affect its tax rate and prospects for future cash flows. The amendment becomes effective for fiscal years beginning after December 15, 2024. We are currently evaluating the impact upon adoption of the new standard on its consolidated financial statements and related disclosures.
Note 3. Real Estate Facilities
The following summarizes the activity in real estate facilities during the years ended December 31, 2023 and 2022:
| | | | |
| | | | |
Balance at December 31, 2021 | | $ | 1,593,623,628 | |
Facilities acquired through merger with SSGT II | | | 228,359,718 | |
Other facility acquisitions | | | 69,981,850 | |
Impact of foreign exchange rate changes | | | (12,984,154 | ) |
Improvements and additions | | | 8,224,603 | |
| | | | |
Balance at December 31, 2022 | | | 1,887,205,645 | |
| | | 23,696,536 | |
Impact of foreign exchange rate changes and other | | | 4,342,673 | |
Improvements and additions | | | 9,501,518 | |
| | | | |
Balance at December 31, 2023 | | | | |
| | | | |
| |
Balance at December 31, 2021 | | $ | (155,926,875 | ) |
| | | (48,400,073 | ) |
Impact of foreign exchange rate changes | | | 1,644,260 | |
| | | | |
Balance at December 31, 2022 | | | (202,682,688 | ) |
| | | (52,619,881 | ) |
Impact of foreign exchange rate changes and other | | | (541,715 | ) |
| | | | |
Balance at December 31, 2023 | | | | |
| | | | |
On June 1, 2022, we closed on our merger with SSGT II (the “SSGT II Merger”). On such date, (the “SSGT II Merger Date”), each share of SSGT II’s common stock, $0.001 par value per share (“SSGT II Common
F-28
SMARTSTOP SELF STORAGE REIT, INC. AND SUBSIDIARIES
NOTES TO CONSOLIDATED FINANCIAL STATEMENTS
December 31, 2023, 2022 and 2021
Stock”), issued and outstanding immediately prior to the effective time of the SSGT II Merger (other than shares owned by us, any subsidiary of ours, or any subsidiary of SSGT II) was automatically converted into the right to receive 0.9118 shares of our Class A Shares, subject to the treatment of fractional shares in accordance with the SSGT II merger agreement (the “SSGT II Merger Consideration”).
As a result, we acquired all of the real estate owned by SSGT II, consisting of (i) 10 wholly-owned self storage facilities located in seven states comprising approximately 7,740 self storage units and approximately 853,900 net rentable square feet, and (ii) SSGT II’s 50% equity interest in three unconsolidated real estate ventures located in the Greater Toronto Area of Ontario, Canada. As of the SSGT II Merger Date, the unconsolidated real estate ventures (collectively, the “SSGT II JV Properties”) consisted of one operating self storage property and two parcels of land being developed into self storage facilities, with subsidiaries of SmartCentres Real Estate Investment Trust, an unaffiliated third party (“SmartCentres”) owning the other 50% of such entities. Additionally, we obtained SSGT II’s rights to acquire (i) one parcel of land being developed into a self storage facility in an unconsolidated joint venture with SmartCentres, and (ii) a self storage property under development located in Southern California, which we acquired on July 13, 2023. On January 12, 2023, we acquired the aforementioned parcel of land in an unconsolidated joint venture that we and SmartCentres intend to develop into a self storage facility in the future. As of December 31, 2023, one of the development joint venture properties had been completed and had begun operations.
The following table reconciles the total consideration transferred in the SSGT II Merger:
| | | | |
Fair value of consideration: | | | | |
| Common stock issued | | $ | 168,791,577 | |
| | | 76,300,006 | |
Preexisting investments in and advances to SSGT II (2) | | | 16,066,930 | |
| | | | |
| | | | |
| | | | |
| (1) | The approximately $76.3 million in cash was primarily used to pay off approximately $75.1 million of SSGT II’s debt that we did not assume in the SSGT II Merger, as well as approximately $1.2 million in transaction costs. |
| (2) | Upon our acquisition of SSGT II, we recorded a gain of approximately $16.1 million to record the then fair market value of our special limited partnership interest in SSGT II operating partnership. |
We issued approximately 11.5 million Class A Shares to the former SSGT II stockholders in connection with the SSGT II Merger. The estimated fair value of our common stock issued was determined by third party valuation specialists primarily based on an income approach to value our properties as well as our Managed REIT Platform, adjusted for market related adjustments and illiquidity discounts, less the estimated fair value of our debt and other liabilities.
These fair value measurements are based on significant inputs not observable in the market and thus represent a Level 3 measurement as discussed in Note 2 – Summary of Significant Accounting Policies. The key assumptions used in estimating the fair value of our common stock included a marketability discount of 6%, projected annual net operating income, land sales comparisons, growth rates, discount rates, and capitalization rates.
F-29
SMARTSTOP SELF STORAGE REIT, INC. AND SUBSIDIARIES
NOTES TO CONSOLIDATED FINANCIAL STATEMENTS
December 31, 2023, 2022 and 2021
The following table summarizes the relative fair values of the assets acquired and liabilities assumed in the SSGT II Merger:
| | | | |
| | | | |
| Land | | $ | 21,111,616 | |
| Buildings | | | 201,026,974 | |
| Site improvements | | | 6,221,128 | |
| Construction in process | | | 252,925 | |
| | | 15,688,002 | |
| Investments in real estate joint ventures | | | 7,394,539 | |
| Cash and cash equivalents, and restricted cash | | | 10,759,283 | |
| Other assets | | | 847,359 | |
| | | | |
| | | | |
| | | | |
Total liabilities assumed (2) | | | | |
| | | | |
Total net assets acquired | | | | |
| | | | |
| (1) | Approximately $8.0 million of the intangible assets acquired related to the intrinsic value of a purchase and sale agreement for the acquisition of a property in San Gabriel, CA that we assumed in the SSGT II Merger and acquired on July 13, 2023. The remainder of the intangible asset relates to value ascribed to the in-place leases on the properties acquired. |
| (2) | Liabilities assumed represents accounts payable and other liabilities. |
As a result of our acquiring SSGT II and terminating the preexisting advisory and property management agreements with SSGT II, we expensed approximately $2.0 million related to such assets on the acquisition date.
On March 17, 2021, we closed on our merger with SST IV (the “SST IV Merger”). On such date, (the “SST IV Merger Date”), we acquired all of the real estate owned by SST IV, consisting of (i) 24 self storage facilities located in nine states comprising approximately 18,000 self storage units and approximately 2.0 million net rentable square feet, and (ii) SST IV’s 50% equity interest in six unconsolidated real estate ventures located in the Greater Toronto Area of Ontario, Canada (collectively the “SST IV JV Properties”). The SST IV JV Properties consisted of three operating self storage properties and three parcels of land in various stages of development into self storage facilities as of the SST IV Merger Date, jointly owned with subsidiaries of SmartCentres. The three development joint venture properties have subsequently been completed and have begun operations.
The following table reconciles the total consideration transferred in the SST IV Merger:
| | | | |
| Fair Value of Consideration Transferred: | | | | |
| Common stock issued | | $ | 231,412,470 | |
| | | 54,250,000 | |
| Other | | | 365,703 | |
| | | | |
Total Consideration Transferred | | $ | 286,028,173 | |
| | | | |
| (1) | The approximately $54.3 million in cash was primarily used to pay off approximately $54.0 million of SST IV debt that we did not assume in the SST IV Merger, as well as approximately $0.3 million in transaction costs. |
F-30
SMARTSTOP SELF STORAGE REIT, INC. AND SUBSIDIARIES
NOTES TO CONSOLIDATED FINANCIAL STATEMENTS
December 31, 2023, 2022 and 2021
As a result of the SST IV Merger, approximately 23.1 million Class A Shares were issued in exchange for approximately 10.6 million shares of SST IV common stock. The estimated fair value of our common stock issued was determined by third party valuation specialists primarily based on an income approach to value the properties as well as our Managed REIT Platform, adjusted for market related adjustments and illiquidity discounts, less the estimated fair value of our debt and other liabilities.
These fair value measurements are based on significant inputs not observable in the market and thus represent a Level 3 measurement as discussed in Note 2 – Summary of Significant Accounting Policies. The key assumptions used in estimating the fair value of our common stock included a marketability discount of 6%, projected annual net operating income, land sales comparisons, growth rates, discount rates, and capitalization rates.
The following table summarizes the relative fair values of the assets acquired and liabilities assumed in the SST IV Merger:
| | | | |
| | | | |
| | $ | 54,385,560 | |
| | | 257,618,228 | |
| | | 12,340,848 | |
| | | 1,467,090 | |
| | | 20,052,449 | |
Investments in real estate joint ventures | | | 17,495,254 | |
Cash and cash equivalents, and restricted cash | | | 7,763,490 | |
| | | 4,145,394 | |
| | | | |
| | $ | 375,268,313 | |
| | | | |
| | $ | 81,165,978 | |
Accounts payable and other liabilities | | | 8,074,162 | |
| | | | |
Total liabilities assumed | | $ | 89,240,140 | |
| | | | |
Total net assets acquired | | $ | 286,028,173 | |
| | | | |
As a result of our acquiring SST IV and terminating the preexisting advisory and property management agreements with SST IV, and the write off of a special limited partnership interest we had related to SST IV, we expensed approximately $8.4 million related to such assets on the acquisition date.
Self Storage Facility Acquisitions
In connection with the SSGT II Merger, we recorded an intangible asset of approximately $8.0 million related to the intrinsic value of a purchase and sale agreement for the San Gabriel Property which was being developed by the seller into a self storage facility. On July 5, 2023, we entered into an approximately $10.4 million first mortgage bridge loan to the seller, and on July 13, 2023, we closed on the San Gabriel Property and the seller repaid the bridge loan in full. We recorded approximately $23.7 million to Real estate facilities related to the San Gabriel Property, which consisted of the contractual purchase price of approximately $15.5 million, as well as approximately $8.0 million which was previously recorded as an intangible asset.
F-31
SMARTSTOP SELF STORAGE REIT, INC. AND SUBSIDIARIES
NOTES TO CONSOLIDATED FINANCIAL STATEMENTS
December 31, 2023, 2022 and 2021
The following table summarizes the purchase price allocation for the real estate related assets acquired during the year ended December 31, 2023:
| | | | | | | | | | | | | | | | | | | | | | | | |
| | | | | | | | | | | | | | | | |
| |
| | | 7/13/2023 | | | $ | 23,696,536 | | | $ | — | | | $ | 23,696,536 | | | $ | 22,964 | | | $ | (157,676 | ) |
| | | | | | | | | | | | | | | | | | | | | | | | |
| | | | | | | | | | | | | | | | | | | | | | | | |
| | | | | | | | | | | | | | | | | | | | | | | | |
| (1) | The allocation noted above is based on a determination of the relative fair value of the total consideration provided and represents the amount paid including capitalized acquisition costs. |
| (2) | The operating results of the self storage property acquired have been included in our consolidated statements of operations since its acquisition date. |
| (3) | Net operating loss excludes corporate general and administrative expenses, interest expenses, depreciation, amortization and acquisition related expenses. |
We, through our wholly-owned subsidiaries were party to a purchase and sale agreement with an unaffiliated third party for the acquisition of a self storage facility located in the U.S. which had not yet closed as of December 31, 2023. The total purchase price for this property was approximately $10.5 million, plus closing costs. There can be no assurance that we will complete this acquisition. If we fail to acquire this property, in addition to the incurred acquisition costs, we may also forfeit earnest money of approximately $0.2 million as a result.
We may assign the above purchase and sale agreement to one of our Managed REITs.
Note 4. Investments in Unconsolidated Real Estate Ventures
As a result of the SST IV Merger, we acquired six self storage real estate joint ventures located in the Greater Toronto Area of Ontario, Canada, all of which were operating properties as of December 31, 2023. As a result of the SSGT II Merger, we acquired three self storage real estate joint ventures located in the Greater Toronto Area of Ontario, Canada, two of which were operating properties and one of which was under development as of December 31, 2023.
On May 25, 2022, we, as 50% owner and SmartCentres as the other 50% owner of a joint venture subsidiary, purchased a single tenant industrial building located in the city of Burnaby, British Columbia (the “Regent Property”), that we and SmartCentres intend to develop into a self storage facility in the future. Our 50% of the total purchase price for the Regent Property was approximately $3.5 million CAD (or approximately $2.7 million USD), plus closing costs.
On January 12, 2023, we as 50% owner and SmartCentres as the other 50% owner of a joint venture subsidiary, purchased a parcel of land in Whitby, Ontario, (the “Whitby Property”), that we and SmartCentres are developing into a self storage facility in the future. Our 50% of the initial investment at closing for the Whitby Property was approximately $2.7 million CAD (or approximately $2.0 million USD), plus closing costs.
These joint venture agreements are with a subsidiary of SmartCentres, an unaffiliated third party, to acquire, develop, and operate self storage facilities.
F-32
SMARTSTOP SELF STORAGE REIT, INC. AND SUBSIDIARIES
NOTES TO CONSOLIDATED FINANCIAL STATEMENTS
December 31, 2023, 2022 and 2021
We account for these investments using the equity method of accounting and they are stated at cost and adjusted for our share of net earnings or losses and reduced by distributions and increased for contributions. Equity in earnings (loss) will generally be recognized based on our ownership interest in the earnings (loss) of each of the unconsolidated investments, and is recorded in Equity in earnings (losses) from investments in JV Properties in the accompanying consolidated statements of operations. For the years ended December 31, 2023 and 2022, we recorded net aggregate loss of approximately $1.6 million and $0.8 million respectively, from our equity in earnings related to our unconsolidated real estate ventures in Canada.
The following table summarizes our 50% ownership interests in investments in unconsolidated real estate ventures in Canada (the “JV Properties”):
| | | | | | | | | | |
| | Date Real Estate Venture Became Operational | | Carrying Value
of Investment as of
December 31, 2023 | | | Carrying Value
of Investment as of
December 31, 2022 | |
| | October 2019 | | $ | 3,974,813 | | | $ | 4,245,434 | |
| | June 2020 | | | 5,662,757 | | | | 6,039,951 | |
| | November 2020 | | | 1,974,811 | | | | 2,166,186 | |
| | January 2021 | | | 2,297,273 | | | | 2,625,089 | |
| | August 2021 | | | 1,274,680 | | | | 1,506,798 | |
| | November 2021 | | | 2,342,720 | | | | 2,364,175 | |
| | December 2022 | | | 2,480,800 | | | | 2,546,407 | |
| | March 2023 | | | 3,947,014 | | | | 3,342,969 | |
| | Under Development | | | 2,063,919 | | | | 1,038,541 | |
| | Under Development | | | 2,737,202 | | | | 2,646,532 | |
| | Under Development | | | 7,075,611 | | | | — | |
| | | | | | | | | | |
| | | | | | | | | | |
| | | | | | | | | | |
| (1) | These joint venture properties were acquired through the SSGT II Merger, which closed on June 1, 2022. |
| (2) | These joint venture properties were acquired through the SST IV Merger, which closed on March 17, 2021. |
| (3) | This property is currently leased as a single tenant industrial lease. The joint venture plans to develop this property into a self storage facility in the future. |
| (4) | This property was acquired on January 12, 2023 in connection with a purchase agreement assumed in the SSGT II Merger. |
Potential Future Joint Ventures
We as 50% owner and SmartCentres as the other 50% owner of a joint venture subsidiary were party to two purchase and sale agreements for the acquisition of land in Canada intended to be developed into self storage facilities which had not yet closed. Our 50% portion of the total purchase price for these properties was approximately USD $7.6 million, plus closing costs. There can be no assurance that we will complete these acquisitions. Additionally, we may assign some or all of such purchase and sale agreements to the Managed REITs. If we fail to acquire these properties, in addition to the incurred acquisition costs, we may also forfeit earnest money of approximately USD $1.1 million as a result.
On November 3, 2023, we closed on a $70 million CAD term loan (the “RBC JV Term Loan”) with Royal Bank of Canada (“RBC”) pursuant to which five of our joint venture subsidiaries that each own 50% of a Joint Venture property serve as borrowers (the “RBC Borrowers”). The RBC JV Term Loan is secured by first
F-33
SMARTSTOP SELF STORAGE REIT, INC. AND SUBSIDIARIES
NOTES TO CONSOLIDATED FINANCIAL STATEMENTS
December 31, 2023, 2022 and 2021
mortgages on five of the JV Properties which were previously encumbered by the SmartCentres Financings (as defined below). The maturity date of the RBC JV Term Loan is November 2, 2025, which may be requested to be extended by one additional year by the RBC Borrowers, subject to the approval of RBC in its sole and absolute discretion. Interest on the RBC JV Term Loan is a fixed annual rate of 6.21%, and payments are interest only during the term of the loan.
We and SmartCentres each serve as a full recourse guarantor with respect to 50% of the secured obligations under the RBC JV Term Loan. The RBC JV Term Loan contains certain customary representations and warranties, affirmative, negative and financial covenants, and events of
default
. Pursuant to the terms of the RBC JV Term Loan, a failure by either us or SmartCentres to observe any negative covenant under each of our respective (and separate) credit facilities (“Separate Credit Facilities”) would be an event of default under the RBC JV Term Loan; in addition, certain actions by either us or SmartCentres may trigger an event of default under the RBC JV Term Loan. We and SmartCentres entered into a separate Cross-Indemnity Agreement pursuant to which we and SmartCentres have each agreed to indemnify the other party with respect to any claims arising from a breach or default of the other party pursuant to the RBC JV Term Loan or the Separate Credit Facilities.
The majority of net proceeds from the RBC JV Term Loan were used to fully repay the allocated loan amounts of approximately $68.9 million CAD under the SmartCentres Financings (as defined below) for each of the five JV Properties.
As of December 31, 2023, $
70.0
million CAD or approximately $
52.8
million in USD, was outstanding on the RBC JV Term Loan.
In connection with the SST IV Merger, we, through our acquisition of the Oshawa, East York, Brampton, Vaughan, and Sc
arbo
rough joint venture partnerships, also became party to a master mortgage commitment agreement (the “MMCA I”) with SmartCentres Storage Finance LP (the “SmartCentres Lender”) (the “SmartCentres Loan I”). The SmartCentres Lender is an affiliate of SmartCentres.
On August 18, 2021, the Kingspoint Property was added to the MMCA I, increasing the available capacity.
On June 1, 2022, in connection with the SSGT II Merger, we assumed another loan with the SmartCentres Lender. SSGT II had previously entered into a master mortgage commitment agreement on April 30, 2021, which was subsequently modified on October 22, 2021 (the “MMCA II”), with the SmartCentres Lender in the amount of up to approximately $34.3 million CAD (the “SmartCentres Loan II”) (collectively with SmartCentres Loan I, the “SmartCentres Financings”). The borrowers under the SmartCentres Loan II are the joint venture entities in which we (SSGT II prior to June 1, 2022), and SmartCentres each hold a 50% limited partnership interest with respect to the Dupont and Aurora joint venture properties. In connection with the SmartCentres Loan II assumption, we became a recourse guarantor for 50% of the SmartCentres Financings. On September 13, 2022, the Markham Property was added to the MMCA II, increasing the available capacity.
The SmartCentres Loan I and SmartCentres Loan II have an accordion feature such that borrowings pursuant thereto may be increased up to approximately $120 million CAD each, subject to certain conditions set forth in the MMCA I and MMCA II agreements. Additionally, pursuant to the MMCA agreements, the collective borrowings between all SmartCentres Financings, and loans made by the SmartCentres Lender to our affiliates, are limited to an overall combined capacity of $120 million CAD.
F-34
SMARTSTOP SELF STORAGE REIT, INC. AND SUBSIDIARIES
NOTES TO CONSOLIDATED FINANCIAL STATEMENTS
December 31, 2023, 2022 and 2021
In connection with the execution of the RBC JV Term Loan, the Dupont, Bramport, East York, Vaughan, and Oshawa properties are no longer encumbered by or subject to the SmartCentres Financings.
As of December 31, 2023, the Aurora, Scarborough, Kingspoint, and Markham properties were encumbered by
th
e SmartCentres
Financing
s.
As of December 31, 2023, approximately $
57.3
million CAD or approximately $
43.3
million in USD, was outstanding on the SmartCentres
Financings. As of December 31, 2022, approximately $
116.7 million CAD or approximately $86.1 million USD was outstanding on the SmartCentres Financings. The proceeds of the SmartCentres Financings have been and will generally be used to finance the acquisition, development, and construction of the JV Properties.
The SmartCentres Financings are secured by first mortgages. Interest on the SmartCentres Financings is a variable annual rate equal to the aggregate of: (i) the BA Equivalent Rate, plus: (ii) a margin based on the External Credit Rating, plus (iii) a margin under the Senior Credit Facility, each as defined and described further in the MMCA I and MMCA II. As of December 31, 2023, the total interest rate was approximately 7.9%.
The SmartCentres Financings, as amended, have a maturity date of May 11, 2024, the MMCA II contains two one year extension options. Monthly interest payments initially increase the outstanding principal balance. Upon a JV Property generating sufficient net cash flow, the SmartCentres Financings provide for the commencement of quarterly payments of interest. The borrowings advanced pursuant to the SmartCentres Financings m
ay
be prepaid without penalty, subject to certain conditions set forth in the MMCA I and MMCA II.
The SmartCentres Financings contain customary affirmative and negative covenants, agreements, representations, warranties and borrowing conditions (including a loan to value ratio of no greater than 70% with respect to each JV Property) and events of default, all as set forth in the MMCA I and MMCA II. We serve as a full recourse guarantor with respect to 50% of the SmartCentres Financings. As of December 31, 2023, the joint ventures were in compliance with all such covenants.
Our debt is summarized as follows:
| | | | | | | | | | | | | | | | |
| | | | | | | | | | | | |
| | $ | 91,041,968 | | | $ | 92,784,412 | | | | 3.89 | % | | | 8/1/2026 | |
KeyBank Florida CMBS Loan (2) | | | 50,750,997 | | | | 51,555,279 | | | | 4.65 | % | | | 5/1/2027 | |
| | | 104,000,000 | | | | 104,000,000 | | | | 5.00 | % | | | 2/1/2029 | |
| | | 40,500,000 | | | | 40,500,000 | | | | 3.56 | % | | | 2/1/2030 | |
Credit Facility Term Loan - USD | | | 250,000,000 | | | | 250,000,000 | | | | 7.08 | % | | | 3/17/2026 | |
Credit Facility Revolver - USD | | | 318,688,429 | | | | 368,201,288 | | | | 7.13 | % | | | 3/17/2024 | |
2032 Private Placement Notes (5) | | | 150,000,000 | | | | 150,000,000 | | | | 5.28 | % | | | 4/19/2032 | |
Oakville III BMO Loan (6) (7) | | | — | | | | 11,992,500 | | | | | | | | | |
| | | 3,832,774 | | | | 3,925,448 | | | | 4.29 | % | | | 11/1/2026 | |
2028 Canadian Term Loan (7) | | | 82,973,000 | | | | — | | | | 6.41 | % | | | 12/1/2028 | |
Discount on secured debt, net | | | (80,227 | ) | | | (93,147 | ) | | | | | | | | |
| | | (4,305,607 | ) | | | (4,493,824 | ) | | | | | | | | |
| | | | | | | | | | | | | | | | |
| | | | | | | | | | | | | | | | |
| | | | | | | | | | | | | | | | |
| (1) | This fixed rate loan encumbers 29 properties (Whittier, La Verne, Santa Ana, Upland, La Habra, Monterey Park, Huntington Beach, Chico, Lancaster I, Riverside, Fairfield, Lompoc, Santa Rosa, Federal Heights, |
F-35
SMARTSTOP SELF STORAGE REIT, INC. AND SUBSIDIARIES
NOTES TO CONSOLIDATED FINANCIAL STATEMENTS
December 31, 2023, 2022 and 2021
| | Aurora, Littleton, Bloomingdale, Crestwood, Forestville, Warren I, Sterling Heights, Troy, Warren II, Beverly, Everett, Foley, Tampa, Boynton Beach, and Lancaster II) with monthly interest only payments until September 2021, at which time both interest and principal payments became due monthly. The separate assets of these encumbered properties are not available to pay our other debts. |
| (2) | This fixed rate loan encumbers five properties (Pompano Beach, Lake Worth, Jupiter, Royal Palm Beach, and Delray) with monthly interest only payments until June 2022, at which time both interest and principal payments became due monthly. The separate assets of these encumbered properties are not available to pay our other debts. |
| (3) | This fixed rate, interest only loan encumbers 10 properties (Myrtle Beach I, Myrtle Beach II, Port St. Lucie, Plantation, Sonoma, Las Vegas I, Las Vegas II, Las Vegas III, Ft Pierce, and Nantucket Island). The separate assets of these encumbered properties are not available to pay our other debts. |
| (4) | On March 17, 2021, in connection with the SST IV Merger, we assumed a $40.5 million fixed rate CMBS financing with KeyBank as the initial lender pursuant to a mortgage loan (the “SST IV CMBS Loan”). This fixed rate loan encumbers seven properties owned by us (Jensen Beach, Texas City, Riverside, Las Vegas IV, Puyallup, Las Vegas V, and Plant City). The separate assets of these encumbered properties are not available to pay our other debt. The loan has a maturity date of February 1, 2030. Monthly payments due under the loan agreement (the “SST IV CMBS Loan Agreement”) are interest only, with the full principal amount becoming due and payable on the maturity date. |
| (5) | As of March 31, 2023, a Total Leverage Ratio Event (as defined below) had occurred, and the interest rate on such Note increased to 5.28% prospectively. For additional information regarding this loan, see below. |
| (6) | On April 15, 2021, we purchased the Oakville III Property. We partially financed the Oakville III Property acquisition with a loan from Bank of Montreal (the “Oakville III BMO Loan”), which was secured by a first lien on the Oakville III Property. The loan is denominated in and the proceeds from the loan were approximately CAD $16.3 million. The interest only loan was prepayable at any time without penalty. On March 24, 2023, we fully paid off this loan, including all outstanding accrued interest. |
| (7) | The amounts shown above are in USD based on the foreign exchange rate in effect as of the date presented. |
The weighted average interest rate on our consolidated debt, excluding the impact of our interest rate hedging activities, as of December 31, 2023 was approximately 6.1%. We are subject to certain restrictive covenants relating to the outstanding debt, and as of December 31, 2023, we were in compliance with all such covenants.
On November 16, 2023, we, through eight of our wholly-owned Canadian subsidiaries (the “Canadian Term Loan Borrowers”), entered into a term loan (the “2028 Canadian Term Loan”) with affiliates of QuadReal Finance LP (“QuadReal”). The 2028 Canadian Term Loan has an aggregate borrowing capacity of $110 million CAD and is secured by the eight properties owned by the Canadian Term Loan Borrowers (the “Canadian Term Loan Secured Properties”). Previously, the Canadian Term Loan Secured Properties were included in the borrowing base of the Credit Facility (defined below). The net proceeds of approximately $110 million CAD from the 2028 Canadian Term Loan were used to pay down the revolving portion of the Credit Facility, and accordingly, the eight Canadian Term Loan Secured Properties were released from the borrowing base of the Credit Facility.
The 2028 Canadian Term Loan has a maturity date of December 1, 2028, and carries a fixed interest rate for the term of the loan of 6.41%. The first two years of the Canadian Term Loan are interest only, after which it requires monthly amortizing payments based on a 25-year amortization schedule. If the Canadian Term Loan is prepaid prior to the third anniversary, the Company must make a yield maintenance payment. After the third
F-36
SMARTSTOP SELF STORAGE REIT, INC. AND SUBSIDIARIES
NOTES TO CONSOLIDATED FINANCIAL STATEMENTS
December 31, 2023, 2022 and 2021
anniversary, any prepayment of the loan are subject to an exit fee, which is equal to a percentage of the then outstanding principal amount, as follows: (i) 100 bps if the prepayment occurs between the third and fourth anniversaries; and (ii) 75 bps if the prepayment occurs after the fourth anniversary
. We provided an indemnity in favor of QuadReal for certain environmental matters and pursuant to which we also provided a non-recourse carveout guaranty.
2032 Private Placement Notes
On April 19, 2022, we as guarantor, and our Operating Partnership as issuer, entered into a note purchase agreement (“The Note Purchase Agreement”) which provides for the private placement of $150 million of 4.53% Senior Notes due April 19, 2032 (the “2032 Private Placement Notes”). The sale and purchase of the 2032 Private Placement Notes occurred in two closings, with the first of such closings having occurred on April 19, 2022 with $75 million aggregate principal amount of the 2032 Private Placement Notes having been issued on such date (the “First Closing”) and the second of such closings having occurred on May 25, 2022 with $75 million aggregate principal amount of the 2032 Private Placement Notes having been issued on such date (the “Second Closing”). Interest on each series of the 2032 Private Placement Notes will be payable semiannually on the nineteenth day of April and October in each year.
Interest payable on the Notes was originally subject to a prospective 75 basis points increase, if, as of March 31, 2023, the ratio of total indebtedness to EBITDA (the “Total Leverage Ratio”) of the Company and its subsidiaries, on a consolidated basis, was greater than 7.00 to 1.00 (a “Total Leverage Ratio Event”).
As of March 31, 2023, such Total Leverage Ratio Event occurred, and our 2032 Private Placement Notes began accruing interest at a rate of 5.28%. The interest accruing on the 2032 Private Placement Notes will
to accrue at 5.28% until such time as the Total Leverage Ratio is less than or equal to 7.00 to 1.00 for two consecutive fiscal quarters, upon such achievement, the applicable fixed interest rate will revert to 4.53% and remain at that interest rate through maturity, regardless of our future Total Leverage Ratio.
We are permitted to prepay at any time all, or from time to time any part of the Notes in amounts not less than 5% of the 2032 Private Placement Notes then outstanding at (i) 100% of the principal amount so prepaid and (ii) the make-whole amount (as defined in the Note Purchase Agreement). The “Make-Whole Amount” is equal to the excess, if any, of the discounted value of the remaining scheduled payments with respect to the 2032 Private Placement Notes being prepaid over the amount of such 2032 Private Placement Notes. In addition, in connection with a change of control (as defined in the Note Purchase Agreement), the Operating Partnership is required to offer to prepay the 2032 Private Placement Notes at 100% of the principal amount plus accrued and unpaid interest thereon, but without the Make Whole Amount or any other prepayment premium or penalty of any kind. The Company must also maintain a debt rating of the 2032 Private Placement Notes by a rating agency.
The Note Purchase Agreement contains certain customary representations and warranties, affirmative, negative and financial covenants, and events of default that are substantially similar to our existing Credit Facility (defined below). The 2032 Private Placement Notes have been issued on a pari passu basis with the Credit Facility, and as such, the Company and certain of its subsidiaries (the “Subsidiary Guarantors”) fully and unconditionally guarantee the Operating Partnership’s obligations under the 2032 Private Placement Notes. The 2032 Private Placement Notes are initially secured by a pledge of equity interests in the Subsidiary Guarantors on similar terms as the Credit Facility.
The proceeds from the 2032 Private Placement Notes were used primarily to pay off existing debt and to pay off certain existing indebtedness of SSGT II in connection with the SSGT II Merger.
F-37
SMARTSTOP SELF STORAGE REIT, INC. AND SUBSIDIARIES
NOTES TO CONSOLIDATED FINANCIAL STATEMENTS
December 31, 2023, 2022 and 2021
On March 17, 2021, we, through our Operating Partnership (the “Borrower”), entered into a credit facility with KeyBank, National Association, as administrative agent, KeyBanc Capital Markets, Inc., Wells Fargo Securities, Citibank, N.A., and BMO Capital Markets Corp., as joint book runners and joint lead arrangers, and certain other lenders party thereto (the “Credit Facility”).
The initial aggregate amount of the Credit Facility was $500 million, which consisted of a $250 million revolving credit facility (the “Credit Facility Revolver”) and a $250 million term loan (the “Credit Facility Term Loan”). The Borrower had the right to increase the amount available under the Credit Facility by an additional $350 million (the “Accordion Feature”), for an aggregate amount of $850 million, subject to certain conditions. The Credit Facility also includes sublimits of (a) up to $25 million for letters of credit and (b) up to $25
million for swingline loans; each of these sublimits are part of, and not in addition to, the amounts available under the Credit Facility Revolver. Borrowings under the Credit Facility may be in either U.S. dollars or Canadian dollars.
The maturity date of the Credit Facility Revolver is March 17, 2024, subject to a
one-year
extension option, at our election. The maturity date of the Credit Facility Term Loan is March 17, 2026, which can
no
t be extended. The Credit Facility may be prepaid or terminated at any time without penalty; provided, however, that the lenders shall be indemnified for certain breakage costs.
On October 7, 2021, the Borrower and lenders who were party to the Credit Facility amended the Credit Facility to increase the commitment on the Credit Facility Revolver by $200 million for a total commitment of $450 million. In connection with the increased commitments, additional lenders were added to the Credit Facility. The commitments on the Credit Facility Term Loan remain unchanged. As a result of this amendment, the aggregate commitment on the Credit Facility is now $700 million. In addition, the Accordion Feature was also amended such that Borrower has the right to increase the aggregate amount of the Credit Facility by an additional $350 million, for an aggregate amount of up to $1.05 billion, subject to certain conditions.
On April 19, 2022, we amended the Credit Facility (the “Credit Facility Amendment”). The primary purpose of the Credit Facility Amendment was to: (i) facilitate the issuance of the 2032 Private Placement Notes, (ii) make conforming changes between the Note Purchase Agreement and the Credit Facility, and (iii) modify the Credit Facility to reflect a transition from London Interbank Offer Rate (“LIBOR”) to secured overnight financing rate (“SOFR”) for floating rate borrowings.
As of December 31, 2023, advances under the Credit Facility Term Loan incurred interest at a 160 basis points spread over daily simple SOFR plus an additional 10 basis points (the “SOFR Index Adjustment”) or
30-day
Canadian dollar offered rate (“CDOR”), while advances under the Credit Facility Revolver incurred interest at a 165 basis points spread over daily simple SOFR plus an additional 10 basis points (the SOFR Index Adjustment) or
30-day
CDOR. The Credit Facility is also subject to an annual unused fee based upon the average amount of the unused portion of the Credit Facility Revolver, which varies from 15 bps to 25 bps, depending on the size of the unused amount, as well as whether a Security Interest Termination Event (defined below) has occurred.
The rate spreads above daily simple SOFR plus the SOFR Index Adjustment or CDOR at which the Credit Facility incurs interest are subject to increase based on the consolidated leverage ratio. There are five leverage tiers under the Credit Facility, with the highest tier limited to a maximum leverage of 60% and maximum spreads of 225 basis points and 230
basis points on the Term Loan and the Credit Facility Revolver, respectively. As of December 31, 2023, the consolidated leverage ratio was within the first (i.e. the lowest) leverage tier.
F-38
SMARTSTOP SELF STORAGE REIT, INC. AND SUBSIDIARIES
NOTES TO CONSOLIDATED FINANCIAL STATEMENTS
December 31, 2023, 2022 and 2021
The Credit Facility is fully recourse, jointly and severally, to us, our Operating Partnership, and certain of our subsidiaries (the “Subsidiary Guarantors”). In connection with this, we, our Operating Partnership, and our Subsidiary Guarantors executed guarantees in favor of the lenders. The Credit Facility is also cross-defaulted to (i) any recourse debt of ours, our Operating Partnership, or the Subsidiary Guarantors and (ii) any
non-recourse
debt of ours, our Operating Partnership, or the Subsidiary Guarantors of at least $75 million.
The Credit Facility is initially secured by a pledge of equity interests in the Subsidiary Guarantors. However, upon the achievement of certain security interest termination conditions, the pledges shall be released and the Credit Facility shall become unsecured.
The Credit Facility contains certain customary representations and warranties, affirmative, negative and financial covenants, borrowing conditions, and events of default. In particular, the financial covenants imposed include: a maximum leverage ratio, a minimum fixed charge coverage ratio, a minimum tangible net worth, certain limits on both secured debt and secured recourse debt, certain payout ratios of dividends paid to core funds from operations, limits on unhedged variable rate debt, and minimum liquidity. If an event of default occurs and continues, the Borrower is subject to certain actions by the administrative agent, including, without limitation, the acceleration of repayment of all amounts outstanding under the Credit Facility.
In connection with the 2028 Canadian Term Loan, on November 16, 2023, eight properties were released from the borrowing base of the Credit Facility, and two properties were added to the borrowing base of the Credit Facility.
As of December 31, 2023, 93 of our wholly-owned properties were encumbered by the Credit Facility.
As of December 31, 2023, we had borrowed approximately $318.7 million of the $450 million maximum potential current capacity of the Credit Facility Revolver and all $250 million of the $250 million capacity on the Credit Facility Term Loan. The availability of the Credit Facility is subject to certain calculations, including a debt service coverage ratio (“DSCR”) calculation which utilizes prevailing treasury rates within the calculation. As of December 31, 2023, based on the aforementioned and other borrowing base calculations, we had the ability to draw up to an additional approximately $87.2 million on the Credit Facility Revolver.
The following table presents the future principal payments required on outstanding debt as of December 31, 2023:
| | | | |
| | $ | 321,423,329 | |
| | | 2,987,627 | |
| | | 343,312,927 | |
| | | 49,594,599 | |
| | | 79,968,686 | |
| | | 294,500,000 | |
| | | | |
| | | 1,091,787,168 | |
| | | (80,227 | ) |
| | | (4,305,607 | ) |
| | | | |
| | $ | 1,087,401,334 | |
| | | | |
F-39
SMARTSTOP SELF STORAGE REIT, INC. AND SUBSIDIARIES
NOTES TO CONSOLIDATED FINANCIAL STATEMENTS
December 31, 2023, 2022 and 2021
On February 22, 2024, we entered into an amended and restated revolving credit facility with KeyBank (the “2024 Credit Facility”). The 2024 Credit Facility replaces the Credit Facility we entered into on March 17, 2021, and has a maturity date of February 22, 2027. Additionally, on March 7, 2024, we entered into a $75 million CAD term loan with National Bank of Canada (the “2027 NBC Loan”), which has a maturity date of March 7, 2027. See Note 14 - Subsequent Events of the Notes to the Consolidated Financial Statements, for more information.
The following table presents the future principal payments required on outstanding debt as of March 7, 2024:
| | | | |
| | $ | 2,790,644 | |
| | | 3,973,713 | |
| | | 94,331,054 | |
| | | 623,272,061 | |
| | | 78,579,863 | |
| | | 294,500,000 | |
| | | | |
| | $ | 1,097,447,335 | |
| | | | |
Series A Convertible Preferred Stock
On October 29, 2019 (the “Commitment Date”), we entered into a preferred stock purchase agreement (the “Purchase Agreement”) with Extra Space Storage LP (the “Investor”), a subsidiary of Extra Space Storage Inc. (NYSE: EXR), pursuant to which the Investor committed to purchase up to $200 million in preferred shares (the aggregate shares to be purchased, the “Preferred Shares”) of our new Series A Convertible Preferred Stock (the “Series A Convertible Preferred Stock”), in one or more closings (each, a “Closing,” and collectively, the “Closings”). The initial closing (the “Initial Closing”) in the amount of $150 million occurred on the Commitment Date, and the second and final closing in the amount of $50 million occurred on October 26, 2020. We incurred approximately $3.6 million in issuance costs related to the Series A Convertible Preferred Stock, which were recorded as a reduction to Series A Convertible Preferred stock on our consolidated balance sheets.
The shares of Series A Convertible Preferred Stock rank senior to all other shares of our capital stock, including our common stock, with respect to rights to receive dividends and to participate in distributions or payments upon any voluntary or involuntary liquidation, dissolution or winding up of the Company. Dividends payable on each share of Series A Convertible Preferred Stock will initially be equal to a rate of 6.25% per annum. If the Series A Convertible Preferred Stock has not been redeemed on or prior to the fifth anniversary date of the Initial Closing (October 29, 2024), the dividend rate will increase an additional 0.75% per annum each year thereafter to a maximum of 9.0% per annum until the tenth anniversary of the Initial Closing, at which time the dividend rate shall increase 0.75% per annum each year thereafter until the Series A Convertible Preferred Stock is redeemed or repurchased in full. The dividends are payable in arrears for the prior calendar quarter on or before the 15
th
day of March, June, September and December of each year.
Upon any voluntary or involuntary liquidation, dissolution or winding up of the Company, the holders of Series A Convertible Preferred Stock will be entitled to receive a payment equal to the greater of (i) aggregate purchase price of all outstanding Preferred Shares, plus any accrued and unpaid dividends (the “Liquidation Amount”) and (ii) the amount that would have been payable had the Preferred Shares been converted into common stock pursuant to the terms of the Purchase Agreement immediately prior to such liquidation.
F-40
SMARTSTOP SELF STORAGE REIT, INC. AND SUBSIDIARIES
NOTES TO CONSOLIDATED FINANCIAL STATEMENTS
December 31, 2023, 2022 and 2021
Subject to certain additional redemption rights, as described herein, we have the right to redeem the Series A Convertible Preferred Stock for cash at any time following the fifth anniversary of the Initial Closing. The amount of such redemption will be equal to the Liquidation Amount. Upon the listing of our common stock on a national securities exchange (the “Listing”), we have the right to redeem any or all outstanding Series A Convertible Preferred Stock at an amount equal to the greater of (i) the amount that would have been payable had such Preferred Shares been converted into common stock pursuant to the terms of the Purchase Agreement immediately prior to the Listing, and then all of such Preferred Shares were sold in the Listing, or (ii) the Liquidation Amount, plus a premium amount (the “Premium Amount”) of 10%, 8%, 6%, 4%, or 2% if redeemed prior to the first, second, third, fourth, or fifth anniversary dates of issuance, respectively, or 0% if redeemed thereafter, as set forth in the Articles Supplementary. Upon a change of control event, we have the right to redeem any or all outstanding Series A Convertible Preferred Stock at an amount equal to the greater of (i) the amount that would have been payable had the Preferred Shares been converted into common stock pursuant to the terms of the Purchase Agreement immediately prior to such change of control or (ii) the Liquidation Amount, plus the Premium Amount, as set forth in the Articles Supplementary. In addition, subject to certain cure provisions, if we fail to maintain our status as a real estate investment trust, the holders of Series A Convertible Preferred Stock have the right to require us to repurchase the Series A Convertible Preferred Stock at an amount equal to the Liquidation Amount with no Premium Amount.
Subject to our redemption rights in the event of a listing or change of control described above, upon the earlier to occur of (i) the second anniversary of the Initial Closing or (ii) 180 days after a Listing, the holders of Series A Convertible Preferred Stock have the right to convert any or all of the Series A Convertible Preferred Stock held by such holders into common stock at a rate per share equal to the quotient obtained by dividing the Liquidation Amount by the conversion price. The conversion price is $10.66, as may be adjusted in connection with stock splits, stock dividends and other similar transactions.
The holders of Series A Convertible Preferred Stock are not entitled to vote on any matter submitted to a vote of our stockholders, except that in the event that the dividend for the Series A Convertible Preferred Stock has not been paid for at least four quarters (whether or not consecutive), the holders of Series A Convertible Preferred Stock have the right to vote together with our stockholders on any matter submitted to a vote of our stockholders, upon which the holders of the Series A Convertible Preferred Stock and holders of common stock shall vote together as a single class. The number of votes applicable to a share of Series A Convertible Preferred Stock will be equal to the number of shares of common stock a share of Series A Convertible Preferred Stock could have been converted into as of the record date set for purposes of such stockholder vote. This foregoing limited voting right shall cease when all past dividend periods have been paid in full. In addition, the affirmative vote of the holders of a majority of the outstanding shares of Series A Convertible Preferred Stock is required in certain customary circumstances, as well as other circumstances, such as (i) our real estate portfolio exceeding a leverage ratio of 60%
(ii) entering into certain transactions with our Executive Chairman as of the Commitment Date, or his affiliates, (iii) effecting a merger (or similar) transaction with an entity whose assets are not at least 80% self storage related and (iv) entering into any line of business other than self storage and ancillary businesses, unless such ancillary business represents revenues of less than 10% of our revenues for our last fiscal year.
In connection with the issuance of the Series A Convertible Preferred Stock, we and the Investor also entered into an investors’ rights agreement (the “Investors’ Rights Agreement”) which provides the Investor with certain customary protections, including demand registration rights and “piggyback” registration rights with respect to our common stock issued to the Investor upon conversion of the Preferred Shares.
F-41
SMARTSTOP SELF STORAGE REIT, INC. AND SUBSIDIARIES
NOTES TO CONSOLIDATED FINANCIAL STATEMENTS
December 31, 2023, 2022 and 2021
As of December 31, 2023, there were 200,000 Preferred Shares outstanding with an aggregate liquidation preference of approximately $203.2 million, which consists of $150 million from the Initial Closing, $50 million from a closing on October 26, 2020 and approximately $3.2 million of accumulated and unpaid distributions.
As of December 31, 2022, there were 200,000 Preferred Shares outstanding with an aggregate liquidation preference of approximately $203.2 million, which consists of $150 million from the Initial Closing, $50 million from a closing on October 26, 2020 and approximately $3.2 million of accumulated and unpaid distributions.
Note 7. Derivative Instruments
Interest Rate Derivatives
Our objectives in using interest rate derivatives are to add stability to interest expense and to manage our exposure to interest rate movements. To accomplish this objective, we have used interest rate swaps and caps as part of our interest rate risk management strategy.
For interest rate derivatives designated and qualified as a hedge for GAAP purposes, the change in the fair value of the effective portion of the derivative is recorded in accumulated other comprehensive income (loss) (“AOCI”) and is subsequently reclassified into earnings in the period that the hedged forecasted transaction affects earnings. Amounts reported in AOCI related to such derivatives will be reclassified to interest expense as interest payments are made on our variable rate debt. In addition, we classify cash flows from qualifying cash flow hedging relationships in the same category as the cash flows from the hedged items in our consolidated statements of cash flows. We do not use interest rate derivatives for trading or speculative purposes.
Interest rate derivatives not designated as hedges for GAAP are not speculative and are used to manage our exposure to interest rate movements and other identified risks but we have elected not to apply hedge accounting. Changes in the fair value of interest rate derivatives not designated in hedging relationships are recorded in other income (expense) within our consolidated statements of operations.
Our objectives in using foreign currency derivatives are to add stability to potential fluctuations in exchange rates between foreign currencies and the U.S. dollar and to manage our exposure to exchange rate movements. To accomplish this objective, we have used foreign currency forwards and foreign currency options as part of our exchange rate risk management strategy. A foreign currency forward contract is a commitment to deliver a certain amount of currency at a certain price on a specific date in the future. By entering into the forward contract and holding it to maturity, we are locked into a future currency exchange rate in an amount equal to and for the term of the forward contract. A foreign currency option contract is a commitment by the seller of the option to deliver, solely at the option of the buyer, a certain amount of currency at a certain price on a specific date. For derivatives designated as net investment hedges for GAAP purposes, the changes in the fair value of the derivatives are reported in accumulated other comprehensive income. Amounts are reclassified out of accumulated other comprehensive income (loss) into earnings when the hedged net investment is either sold or substantially liquidated. The change in the value of the designated portion of our settled and unsettled foreign currency hedges is recorded net in foreign currency hedge contract gain (loss) in our consolidated statements of comprehensive income (loss) in the related period.
The change in the value of the portion of our settled and unsettled foreign currency hedges that is not designated for hedge accounting for GAAP is recorded in other income (expense) within our consolidated statements of operations and represented a gain of approximately $0.1 million and $9.5 million for the years ended December 31, 2023 and 2022, respectively.
F-42
SMARTSTOP SELF STORAGE REIT, INC. AND SUBSIDIARIES
NOTES TO CONSOLIDATED FINANCIAL STATEMENTS
December 31, 2023, 2022 and 2021
On April 12, 2021, we entered into an approximately $125.9 million CAD currency forward with a settlement date of April 12, 2023. On April 12, 2023, we settled this foreign currency forward and received approximately USD $6.4 million, and simultaneously entered into a new approximately $134.4 million CAD currency forward with a maturity date of July 6, 2023. On July 5, 2023, we settled this foreign currency forward and paid approximately USD $1.2 million, and simultaneously entered into a new approximately $132.4 million CAD currency forward with a settlement date of April 12, 2024.
On April 12, 2022, we settled a $122 million CAD foreign currency forward, receiving a net settlement of approximately USD $3.2 million, and simultaneously entered into a new $126.2 million CAD currency forward with a settlement date of October 12, 2022. On October 12, 2022, we settled this foreign currency forward, receiving a net settlement of approximately $8.7 million, and simultaneously entered into a new $137.7 million CAD currency forward with a settlement date of October 12, 2023. On October 11, 2023, we rolled this hedge without any cash settlement, extending the maturity date to November 9, 2023 at a strike rate of 1.3766, and notional of $137,664,000 CAD. On November 9, 2023, we rolled this hedge without any cash settlement, extending the maturity date to November 16, 2023 at a strike rate of 1.3767, and notional of $137,669,000 CAD. On November 16, 2023, this hedge matured, and without any cash settlement, we simultaneously entered into a new $30.0 million CAD currency forward with a maturity date of January 16, 2024, and a strike rate of 1.3782.
The following table summarizes the terms of our derivative financial instruments as of December 31, 2023:
| | | | | | | | | | | | |
| | | | | | | | | | | |
Interest Rate Derivatives: | | | | | | | | | | | | |
| | $ | 125,000,000 | | | | 2.00 | % | | June 1, 2022 | | June 28, 2024 |
| | $ | 100,000,000 | | | | 4.75 | % | | December 1, 2022 | | December 1, 2025 |
| | $ | 100,000,000 | | | | 4.75 | % | | December 1, 2022 | | December 2, 2024 |
| | $ | 100,000,000 | | | | 4.75 | % | | December 1, 2022 | | December 2, 2024 |
Foreign Currency Forwards: | | | | | | | | | | | | |
| | $ | 132,350,000 | | | | 1.3273 | | | July 5, 2023 | | April 12, 2024 |
| | $ | 30,000,000 | | | | 1.3782 | | | November 16, 2023 | | January 16, 2024 |
| (1) | Notional amounts shown are denominated in CAD. |
| (2) | On January 16, 2024 we rolled this hedge without any cash settlement, effectively extending the maturity date to February 15, 2024 at a strike rate of 1.3781. Additionally, on February 16, 2024 we further rolled this hedge without any cash settlement at a strike rate of 1.3781. This hedge ultimately matured on March 7, 2024 whereby we owed and paid approximately $0.5 million at settlement. |
F-43
SMARTSTOP SELF STORAGE REIT, INC. AND SUBSIDIARIES
NOTES TO CONSOLIDATED FINANCIAL STATEMENTS
December 31, 2023, 2022 and 2021
The following table summarizes the terms of our derivative financial instruments as of December 31, 2022:
| | | | | | | | | | | | | | | | |
| | | | | | | | | Effective Date or
Date Assumed | | | | |
Interest Rate Derivatives: | | | | | | | | | | | | | | | | |
| | $ | 125,000,000 | | | | 1.75 | % | | | June 1, 2022 | | | | June 30, 2023 | |
| | $ | 125,000,000 | | | | 2.00 | % | | | June 1, 2022 | | | | June 28, 2024 | |
| | $ | 100,000,000 | | | | 4.75 | % | | | December 1, 2022 | | | | December 1, 2025 | |
| | $ | 100,000,000 | | | | 4.75 | % | | | December 1, 2022 | | | | December 2, 2024 | |
| | $ | 100,000,000 | | | | 4.75 | % | | | December 1, 2022 | | | | December 2, 2024 | |
Foreign Currency Forwards: | | | | | | | | | | | | | | | | |
| | $ | 125,925,000 | | | | 1.2593 | | | | April 12, 2021 | | | | April 12, 2023 | |
| | $ | 137,680,000 | | | | 1.3768 | | | | October 12, 2022 | | | | October 12, 2023 | |
| (1) | Notional amounts shown are denominated in CAD. |
The following table presents a gross presentation of the fair value of our derivative financial instruments as well as their classification on our consolidated balance sheets as of December 31, 2023 and 2022:
| | | | | | | | |
| | | Asset/Liability Derivatives
| |
| | | | | | |
Interest Rate Derivatives | | | | | | | | |
| | $ | 3,485,281 | | | $ | 9,681,298 | |
Accounts payable and accrued liabilities | | $ | — | | | $ | — | |
| | | | | | | | |
| | $ | — | | | $ | 6,971,265 | |
Accounts payable and accrued liabilities | | $ | (985,412 | ) | | $ | (1,776,371 | ) |
The following tables present the effect of our derivative financial instruments on our consolidated statements of operations for the periods presented:
| | | | | | | | | | | | | | | | | | | | | | |
| | | Gain (loss) recognized in OCI | | | Location of amounts reclassified from OCI into income | | Gain (loss) reclassified from accumulated
other comprehensive income | |
| | | For the Year Ended December 31, | |
| | | | | | | | | | | | | | | | | |
| | $ | — | | | $ | (2,793 | ) | | Interest expense | | $ | 50,587 | | | $ | (304,670 | ) | | $ | (3,818,917 | ) |
| | | 409,990 | | | | 4,480,001 | | | Interest expense | | | 3,952,972 | | | | (139,888 | ) | | | (473,148 | ) |
Foreign Currency Forwards | | | (1,065,910 | ) | | | 3,354,899 | | | N/A | | | — | | | | — | | | | — | |
| | | | | | | | | | | | | | | | | | | | | | |
| | $ | (655,920 | ) | | $ | 7,832,107 | | | | | $ | 4,003,559 | | | $ | (444,558 | ) | | $ | (4,292,065 | ) |
| | | | | | | | | | | | | | | | | | | | | | |
Based on the forward rates in effect as of December 31, 2023, we estimate that approximately $1.0 million related to our qualifying cash flow hedges will be reclassified to reduce interest expense during the next 12 months.
F-44
SMARTSTOP SELF STORAGE REIT, INC. AND SUBSIDIARIES
NOTES TO CONSOLIDATED FINANCIAL STATEMENTS
December 31, 2023, 2022 and 2021
As a REIT, we generally will not be subject to U.S. federal income tax on taxable income that we distribute to our stockholders. However, certain of our consolidated subsidiaries are taxable REIT subsidiaries, which are subject to federal, state and foreign income taxes. We have filed an election to treat our primary TRS as a taxable REIT subsidiary effective January 1, 2014. In general, our TRS performs additional services for our customers and provides the advisory and property management services to the Managed REITs and otherwise generally engages in
non-real
estate related business. The TRS is subject to corporate U.S. federal and state income tax. Additionally, we own and operate a number of self storage properties located throughout Canada, the income of which is generally subject to income taxes under the laws of Canada.
The domestic and international components of income (loss) before income taxes are presented for the years ended December 31, 2023, 2022, and 2021:
| | | | | | | | | | | | |
| | | | |
| | | | | | | | | | |
| | $ | 6,993,316 | | | $ | 20,546,466 | | | $ | (19,784,397 | ) |
| | | 2,057,588 | | | | 568,201 | | | | (1,591,596 | ) |
| | | | | | | | | | | | |
Income (loss) before income taxes | | $ | 9,050,904 | | | $ | 21,114,667 | | | $ | (21,375,993 | ) |
| | | | | | | | | | | | |
The following is a summary of our income tax expense (benefit) for the years ended December 31, 2023, 2022, and 2021:
| | | | | | | | | | | | | | | | |
| | | For the year ended December 31, 2023 | |
| | | | | | | | | | | | | |
| | $ | 191,115 | | | $ | 33,326 | | | $ | 480,391 | | | $ | 704,832 | |
| | | (10,477 | ) | | | (1,596 | ) | | | (3,288,615 | ) | | | (3,300,688 | ) |
| | | | | | | | | | | | | | | | |
| | $ | 180,638 | | | $ | 31,730 | | | $ | (2,808,224 | ) | | $ | (2,595,856 | ) |
| | | | | | | | | | | | | | | | |
| | | | | | | | | | | | | | | | |
| | | For the year ended December 31, 2022 | |
| | | | | | | | | | | | | |
| | $ | 170,874 | | | $ | 27,020 | | | $ | 320,639 | | | $ | 518,533 | |
| | | (499,077 | ) | | | (76,050 | ) | | | (498,191 | ) | | | (1,073,318 | ) |
| | | | | | | | | | | | | | | | |
| | $ | (328,203 | ) | | $ | (49,030 | ) | | $ | (177,552 | ) | | $ | (554,785 | ) |
| | | | | | | | | | | | | | | | |
| | | | | | | | | | | | | | | | |
| | | For the year ended December 31, 2021 | |
| | | | | | | | | | | | | |
| | $ | 182,034 | | | $ | 32,559 | | | $ | — | | | $ | 214,593 | |
| | | (1,750,248 | ) | | | (266,704 | ) | | | (8,916 | ) | | | (2,025,868 | ) |
| | | | | | | | | | | | | | | | |
| | $ | (1,568,214 | ) | | $ | (234,145 | ) | | $ | (8,916 | ) | | $ | (1,811,275 | ) |
| | | | | | | | | | | | | | | | |
F-45
SMARTSTOP SELF STORAGE REIT, INC. AND SUBSIDIARIES
NOTES TO CONSOLIDATED FINANCIAL STATEMENTS
December 31, 2023, 2022 and 2021
Income tax expense (benefit) is reconciled to the hypothetical amounts computed at the U.S. federal statutory income tax rate for the years ended December 31, 2023, 2022, and 2021:
| | | | | | | | |
| | |
| | | | |
Expected tax at statutory rate | | $ | 1,900,690 | | | | 21.0 | % |
Non-taxable REIT (income) loss | | | (1,243,204 | ) | | | | % |
State and local income tax expense - net of federal benefit | | | 25,066 | | | | 0.3 | % |
Foreign income taxed at different rates | | | 132,010 | | | | 1.5 | % |
Change in valuation allowance | | | (3,410,418 | ) | | | | % |
| | | | | | | | |
Total income tax expense (benefit) | | | | | | | | |
| | | | | | | | |
| | | | | | | | |
| | |
| | | | |
Expected tax at statutory rate | | $ | 4,434,080 | | | | 21.0 | % |
Non-taxable REIT (income) loss | | | (4,610,750 | ) | | | | % |
State and local income tax expense - net of federal benefit | | | (38,734 | ) | | | | % |
Foreign income taxed at different rates | | | 47,180 | | | | 0.2 | % |
Change in valuation allowance | | | (416,953 | ) | | | | % |
| | | 30,392 | | | | 0.1 | % |
| | | | | | | | |
Total income tax expense (benefit) | | | | | | | | |
| | | | | | | | |
| | | | | | | | |
| | |
| | | | |
Expected tax at statutory rate | | $ | (4,489,427 | ) | | | 21.0 | % |
Non-taxable REIT (income) loss | | | 2,655,349 | | | | -12.4 | % |
State and local income tax expense - net of federal benefit | | | (185,137 | ) | | | 0.9 | % |
Foreign income taxed at different rates | | | (69,318 | ) | | | 0.3 | % |
Change in valuation allowance | | | 400,146 | | | | -1.9 | % |
| | | (122,888 | ) | | | 0.6 | % |
| | | | | | | | |
Total income tax expense (benefit) | | | | | | | | |
| | | | | | | | |
The major sources of temporary differences that give rise to the deferred tax effects are shown below:
| | | | | | | | |
| | | | | | | |
Deferred tax liabilities: | | | | | | | | |
Intangible contract assets | | $ | (18,111 | ) | | $ | (30,184 | ) |
| | | (9,887,050 | ) | | | (10,123,376 | ) |
| | | | | | | | |
Total deferred tax liability | | | (9,905,161 | ) | | | (10,153,560 | ) |
| | | | | | | | |
| | | | | | | | |
| | | 1,267,292 | | | | 90,563 | |
Canadian real estate and non-capital losses | | | 7,561,373 | | | | 7,935,309 | |
| | | | | | | | |
Total deferred tax assets | | | 8,828,665 | | | | 8,025,872 | |
| | | | | | | | |
| | | (667,514 | ) | | | (4,077,932 | ) |
| | | | | | | | |
Net deferred tax liabilities | | | | | | | | |
| | | | | | | | |
F-46
SMARTSTOP SELF STORAGE REIT, INC. AND SUBSIDIARIES
NOTES TO CONSOLIDATED FINANCIAL STATEMENTS
December 31, 2023, 2022 and 2021
The Canadian
non-capital
losses expire between 2032 and 2043. As of December 31, 2023 and December 31, 2022, the Company had Canadian
non-capital
loss carry forwards of approximately $24.9 million and $27.4 million, respectively. As of December 31, 2023 and 2022, we had a valuation allowance of approximately $0.7 million and $4.1 million, respectively, related to non-capital loss carry-forwards at certain of our Canadian properties.
As of December 31, 2023 and 2022, we had no interest or penalties related to uncertain tax positions. The tax years 2019-2022 remain open to examination by the major taxing jurisdictions to which we are subject.
Note 9. Segment Disclosures
We operate in two reportable business segments: (i) self storage operations and (ii) our Managed REIT Platform business.
Management evaluates performance based upon property net operating income (“NOI”). For our self storage operations, NOI is defined as leasing and related revenues, less property level operating expenses. NOI for the Company’s Managed REIT Platform business represents Managed REIT Platform revenues less Managed REIT Platform expenses.
F-47
SMARTSTOP SELF STORAGE REIT, INC. AND SUBSIDIARIES
NOTES TO CONSOLIDATED FINANCIAL STATEMENTS
December 31, 2023, 2022 and 2021
The following tables summarize information for the reportable segments for the periods presented:
| | | | | | | | | | | | | | | | |
| | | Year Ended December 31, 2023 | |
| | | | | | | | | | | | | |
| | | | | | | | | | | | | | | | |
Self storage rental revenue | | $ | 206,494,202 | | | $ | — | | | $ | — | | | $ | 206,494,202 | |
Ancillary operating revenue | | | 8,826,868 | | | | — | | | | — | | | | 8,826,868 | |
Managed REIT Platform revenue | | | — | | | | 11,906,311 | | | | — | | | | 11,906,311 | |
Reimbursable costs from Managed REITs | | | — | | | | 5,764,363 | | | | — | | | | 5,764,363 | |
| | | | | | | | | | | | | | | | |
| | | 215,321,070 | | | | 17,670,674 | | | | — | | | | 232,991,744 | |
| | | | | | | | | | | | | | | | |
| | | | | | | | | | | | | | | | |
Property operating expenses | | | 65,362,857 | | | | — | | | | — | | | | 65,362,857 | |
Managed REIT Platform expense | | | — | | | | 3,365,491 | | | | — | | | | 3,365,491 | |
Reimbursable costs from Managed REITs | | | — | | | | 5,764,363 | | | | — | | | | 5,764,363 | |
General and administrative | | | — | | | | — | | | | 27,451,533 | | | | 27,451,533 | |
| | | 52,754,196 | | | | — | | | | 882,157 | | | | 53,636,353 | |
Intangible amortization expense | | | 6,398,131 | | | | 195,722 | | | | — | | | | 6,593,853 | |
| | | 192,358 | | | | — | | | | — | | | | 192,358 | |
| | | | | | | | | | | | | | | | |
| | | 124,707,542 | | | | 9,325,576 | | | | 28,333,690 | | | | 162,366,808 | |
| | | | | | | | | | | | | | | | |
Income (loss) from operations | | | 90,613,528 | | | | 8,345,098 | | | | (28,333,690 | ) | | | 70,624,936 | |
| | | | | | | | | | | | | | | | |
Equity in earnings (losses) from investments in JV Properties | | | — | | | | — | | | | (1,625,135 | ) | | | (1,625,135 | ) |
Equity in earnings (losses) from investments in Managed REITs | | | — | | | | (1,273,143 | ) | | | — | | | | (1,273,143 | ) |
| | | 217,807 | | | | 3,359,875 | | | | (448,815 | ) | | | 3,128,867 | |
| | | (61,636,064 | ) | | | — | | | | (168,557 | ) | | | (61,804,621 | ) |
Income tax (expense) benefit | | | 2,400,878 | | | | (196,599 | ) | | | 391,577 | | | | 2,595,856 | |
| | | | | | | | | | | | | | | | |
| | | | | | | | | | | | | | | | |
| | | | | | | | | | | | | | | | |
F-48
SMARTSTOP SELF STORAGE REIT, INC. AND SUBSIDIARIES
NOTES TO CONSOLIDATED FINANCIAL STATEMENTS
December 31, 2023, 2022 and 2021
| | | | | | | | | | | | | | | | |
| | | Year Ended December 31, 2022 | |
| | | | | | | | | | | | | |
| | | | | | | | | | | | | | | | |
Self storage rental revenue | | $ | 191,749,578 | | | $ | — | | | $ | — | | | $ | 191,749,578 | |
Ancillary operating revenue | | | 8,445,803 | | | | — | | | | — | | | | 8,445,803 | |
Managed REIT Platform revenue | | | — | | | | 7,819,216 | | | | — | | | | 7,819,216 | |
Reimbursable costs from Managed REITs | | | — | | | | 4,628,497 | | | | — | | | | 4,628,497 | |
| | | | | | | | | | | | | | | | |
| | | 200,195,381 | | | | 12,447,713 | | | | — | | | | 212,643,094 | |
| | | | | | | | | | | | | | | | |
| | | | | | | | | | | | | | | | |
Property operating expenses | | | 58,437,110 | | | | — | | | | — | | | | 58,437,110 | |
Managed REIT Platform expense | | | — | | | | 2,485,290 | | | | — | | | | 2,485,290 | |
Reimbursable costs from Managed REITs | | | — | | | | 4,628,497 | | | | — | | | | 4,628,497 | |
General and administrative | | | — | | | | — | | | | 28,253,905 | | | | 28,253,905 | |
| | | 48,503,743 | | | | — | | | | 913,936 | | | | 49,417,679 | |
Intangible amortization expense | | | 14,728,148 | | | | 472,706 | | | | — | | | | 15,200,854 | |
| | | 888,009 | | | | — | | | | — | | | | 888,009 | |
Contingent earnout adjustment | | | — | | | | 1,514,447 | | | | — | | | | 1,514,447 | |
Write-off of equity interest and preexisting relationships upon acquisition of control | | | — | | | | 2,049,682 | | | | — | | | | 2,049,682 | |
| | | | | | | | | | | | | | | | |
| | | 122,557,010 | | | | 11,150,622 | | | | 29,167,841 | | | | 162,875,473 | |
| | | | | | | | | | | | | | | | |
Gain on equity interests upon acquisition | | | — | | | | 16,101,237 | | | | — | | | | 16,101,237 | |
| | | | | | | | | | | | | | | | |
Income (loss) from operations | | | 77,638,371 | | | | 17,398,328 | | | | (29,167,841 | ) | | | 65,868,858 | |
| | | | | | | | | | | | | | | | |
Equity in earnings (losses) from investments in JV Properties | | | — | | | | — | | | | (760,005 | ) | | | (760,005 | ) |
Equity in earnings (losses) from investments in Managed REITs | | | — | | | | (930,201 | ) | | | — | | | | (930,201 | ) |
| | | (209,578 | ) | | | 1,085,533 | | | | (34,554 | ) | | | 841,401 | |
| | | (41,339,401 | ) | | | — | | | | (172,510 | ) | | | (41,511,911 | ) |
Net loss on extinguishment of debt | | | (2,393,475 | ) | | | — | | | | — | | | | (2,393,475 | ) |
Income tax (expense) benefit | | | 36,197 | | | | 563,053 | | | | (44,465 | ) | | | 554,785 | |
| | | | | | | | | | | | | | | | |
| | | | | | | | | | | | | | | | |
| | | | | | | | | | | | | | | | |
F-49
SMARTSTOP SELF STORAGE REIT, INC. AND SUBSIDIARIES
NOTES TO CONSOLIDATED FINANCIAL STATEMENTS
December 31, 2023, 2022 and 2021
| | | | | | | | | | | | | | | | |
| | | Year Ended December 31, 2021 | |
| | | | | | | | | | | | | |
| | | | | | | | | | | | | | | | |
Self storage rental revenue | | $ | 150,610,337 | | | $ | — | | | $ | — | | | $ | 150,610,337 | |
Ancillary operating revenue | | | 7,552,597 | | | | — | | | | — | | | | 7,552,597 | |
Managed REIT Platform revenue | | | — | | | | 6,322,970 | | | | — | | | | 6,322,970 | |
Reimbursable costs from Managed REITs | | | — | | | | 4,278,667 | | | | — | | | | 4,278,667 | |
| | | | | | | | | | | | | | | | |
| | | 158,162,934 | | | | 10,601,637 | | | | — | | | | 168,764,571 | |
| | | | | | | | | | | | | | | | |
| | | | | | | | | | | | | | | | |
Property operating expenses | | | 48,127,657 | | | | — | | | | — | | | | 48,127,657 | |
Managed REIT Platform expense | | | — | | | | 1,451,166 | | | | — | | | | 1,451,166 | |
Reimbursable costs from Managed REITs | | | — | | | | 4,278,667 | | | | — | | | | 4,278,667 | |
General and administrative | | | — | | | | — | | | | 23,265,196 | | | | 23,265,196 | |
| | | 40,203,484 | | | | — | | | | 742,922 | | | | 40,946,406 | |
Intangible amortization expense | | | 11,134,100 | | | | 1,288,105 | | | | — | | | | 12,422,205 | |
| | | 934,838 | | | | — | | | | — | | | | 934,838 | |
Contingent earnout adjustment | | | — | | | | 12,619,744 | | | | — | | | | 12,619,744 | |
Write-off of equity interest and preexisting relationships in SST IV upon acquisition of control | | | — | | | | 8,389,573 | | | | — | | | | 8,389,573 | |
| | | | | | | | | | | | | | | | |
| | | 100,400,079 | | | | 28,027,255 | | | | 24,008,118 | | | | 152,435,452 | |
| | | | | | | | | | | | | | | | |
Gain on sale of real estate | | | 178,631 | | | | — | | | | — | | | | 178,631 | |
| | | | | | | | | | | | | | | | |
Income (loss) from operations | | | 57,941,486 | | | | (17,425,618 | ) | | | (24,008,118 | ) | | | 16,507,750 | |
| | | | | | | | | | | | | | | | |
Equity in earnings (losses) from investments in JV Properties | | | — | | | | — | | | | (494,327 | ) | | | (494,327 | ) |
Equity in earnings (losses) from investments in Managed REITs | | | — | | | | (623,393 | ) | | | — | | | | (623,393 | ) |
| | | (173,245 | ) | | | 20,990 | | | | (785,376 | ) | | | (937,631 | ) |
| | | (33,207,310 | ) | | | — | | | | (176,294 | ) | | | (33,383,604 | ) |
Net loss on extinguishment of debt | | | (2,444,788 | ) | | | — | | | | — | | | | (2,444,788 | ) |
Income tax (expense) benefit | | | (193,604 | ) | | | 2,004,879 | | | | — | | | | 1,811,275 | |
| | | | | | | | | | | | | | | | |
| | | | | | | | | | | | | | | | |
| | | | | | | | | | | | | | | | |
The following table summarizes our total assets by segment:
| | | | | | | | |
| | | | | | |
| | $ | 1,798,510,325 | | | $ | 1,820,922,309 | |
| | | 41,761,259 | | | | 65,433,006 | |
| | | 55,369,141 | | | | 60,862,072 | |
| | | | | | | | |
| | $ | 1,895,640,725 | | | $ | 1,947,217,387 | |
| | | | | | | | |
| (1) | Included in the assets of the Self Storage segment as of December 31, 2023 and 2022 were approximately $52.2 million of goodwill. Additionally, as of December 31, 2023 and 2022 there were no accumulated impairment charges to goodwill within the Self Storage segment. |
F-50
SMARTSTOP SELF STORAGE REIT, INC. AND SUBSIDIARIES
NOTES TO CONSOLIDATED FINANCIAL STATEMENTS
December 31, 2023, 2022 and 2021
| (2) | Included in the assets of the Managed REIT Platform segment as of December 31, 2023 and 2022, was approximately $1.4 million of goodwill. Such goodwill is net of accumulated impairment charges in the Managed REIT Platform segment of approximately $24.7 million, which relates to the impairment charge recorded during the year ended December 31, 2020. |
| (3) | Other than our investments in and advances to Managed REITs and investments in JV properties, substantially all of our investments in real estate facilities and intangible assets as of December 31, 2023 and 2022, respectively, were associated with our self storage platform. |
As of December 31, 2023 and 2022, approximately $174 million and $170 million, respectively, of our assets in the self storage segment related to our operations in Canada. For the years ended December 31, 2023, 2022, and 2021, approximately $22.1 million, $21.5 million, and $19.2 million, respectively, of our revenues in the self storage segment related to our operations in Canada. Substantially all of our operations related to the management fees we generate through our management contracts with the Managed REITs are performed in the U.S.; accordingly substantially all of our assets and revenues related to our Managed REIT segment are based in the U.S. as well.
As of December 31, 2023 and 2022, approximately $35.8 million and $28.5 million, respectively, of our assets in the Corporate and Other segment table above relate to our JV Properties which operate in Canada. For the years ended December 31, 2023 and 2022, approximately $1.6 million and $0.8 million of losses, respectively, relate to these JV Properties’ operations in Canada.
Note 10. Related Party Transactions
Self Administration Transaction
On June 28, 2019, we, our Operating Partnership and SmartStop TRS entered into a series of transactions, agreements, and amendments to our existing agreements and arrangements with our then-sponsor, SAM, and SmartStop OP Holdings, LLC (“SS OP Holdings”), a subsidiary of SAM, pursuant to which, effective June 28, 2019, we acquired the self storage advisory, asset management and property management businesses and certain joint venture interests of SAM, along with certain other assets of SAM (collectively, the “Self Administration Transaction”).
As a result of the Self Administration Transaction, we became self-managed and succeeded to the advisory, asset management and property management businesses and certain joint ventures previously in place for us, SST IV (until the SST IV Merger Date), and SSGT II (until the SSGT II Merger Date), and we acquired the internal capability to originate, structure and manage additional future self storage investment products which would be sponsored by SmartStop REIT Advisors, LLC (“SRA”), our indirect subsidiary. The transfer agent agreement described below was not impacted by the Self Administration Transaction.
Our Chief Executive Officer, who is also the Chairman of our board of directors, holds ownership interests in and is an officer of SAM, and other affiliated entities. Our Chief Executive Officer also previously indirectly held an ownership interest in our former dealer manager. Previously, certain of our executive officers and another member of our board of directors held ownership interests in and/or were officers of SAM, and other affiliated entities. Accordingly, any agreements or transactions we have entered into with such entities may present a conflict of interest. None of SAM and its affiliates or our directors or executive officers receive any compensation, fees or reimbursements from our Managed REITs, other than with respect to fees and reimbursements in accordance with the Administrative Services Agreement and the transfer agent agreement, or as otherwise described in this section.
F-51
SMARTSTOP SELF STORAGE REIT, INC. AND SUBSIDIARIES
NOTES TO CONSOLIDATED FINANCIAL STATEMENTS
December 31, 2023, 2022 and 2021
Former Dealer Manager Agreement
In connection with our Primary Offering, our Former Dealer Manager received a sales commission of up to 7.0% of gross proceeds from sales of Class A Shares and up to 2.0% of gross proceeds from the sales of Class T Shares in the Primary Offering and a dealer manager fee of up to 3.0% of gross proceeds from sales of both Class A Shares and Class T Shares in the Primary Offering under the terms of the Former Dealer Manager Agreement. In addition, our Former Dealer Manager received an ongoing stockholder servicing fee as discussed in Note 2 – Summary of Significant Accounting Policies – Organization and Offering Costs.
Affiliated Former Dealer Manager
SAM previously indirectly held a 15%
non-voting
equity interest in our Former Dealer Manager. Affiliates of our Former Dealer Manager own limited partnership interests in our Operating Partnership.
SAM owns 100% of the membership interests of Strategic Transfer Agent Services, LLC, our transfer agent (“Transfer Agent”), which is a registered transfer agent with the SEC. Pursuant to our transfer agent agreement, our Transfer Agent provides transfer agent and registrar services to us. These services are substantially similar to what a third party transfer agent would provide in the ordinary course of performing its functions as a transfer agent, including, but not limited to: providing customer service to our stockholders, processing the distributions and any servicing fees with respect to our shares and issuing regular reports to our stockholder. Our Transfer Agent may retain and supervise third party vendors in its efforts to administer certain services. We believe that our Transfer Agent, through its knowledge and understanding of the direct participation program industry which includes
non-traded
REITs, is particularly suited to provide us with transfer agent and registrar services. Our Transfer Agent also conducts transfer agent and registrar services for our Managed REITs and other affiliates.
Fees paid to our Transfer Agent include a fixed quarterly fee,
one-time
account setup fees, monthly open account fees and fees for investor inquiries. In addition, we will reimburse our Transfer Agent for all reasonable expenses or other changes incurred by it in connection with the provision of its services to us, and we will pay our Transfer Agent fees for any additional services we may request from time to time, in accordance with its rates then in effect. Upon the request of our Transfer Agent, we may also advance payment for substantial reasonable
expenditures to be incurred by it.
The initial term of the transfer agent agreement was three years, which term is automatically renewed for one year successive terms, but either party may terminate the transfer agent agreement upon 90 days’ prior written notice. In the event that we terminate the transfer agent agreement, other than for cause, we will pay our transfer agent all amounts that would have otherwise accrued during the remaining term of the transfer agent agreement; provided, however, that when calculating the remaining months in the term for such purposes, such term is deemed to be a 12 month period starting from the date of the most recent annual anniversary date.
F-52
SMARTSTOP SELF STORAGE REIT, INC. AND SUBSIDIARIES
NOTES TO CONSOLIDATED FINANCIAL STATEMENTS
December 31, 2023, 2022 and 2021
Pursuant to the terms of the agreements described above, the following table summarizes related party costs incurred and paid by us for the years ended December 31, 2023 and 2022, as well as any related amounts payable as of December 31, 2023 and 2022.
| | | | | | | | | | | | | | | | | | | | | | | | |
| | | Year Ended December 31, 2022 | | | Year Ended December 31, 2023 | |
| | | | | | | | | | | | | | | | | | | |
| | | | | | | | | | | | | | | | | | | | | | | | |
| | $ | 1,242,655 | | | $ | 1,260,896 | | | $ | 68,751 | | | $ | 1,479,254 | | | $ | 1,473,005 | | | $ | 75,000 | |
| | | | | | | | | | | | | | | | | | | | | | | | |
| | | 100,000 | | | | 100,000 | | | | — | | | | — | | | | — | | | | — | |
Stockholder servicing fee (1) | | | 53,660 | | | | 209,980 | | | | — | | | | — | | | | — | | | | — | |
| | | | | | | | | | | | | | | | | | | | | | | | |
| | | — | | | | — | | | | 340,979 | | | | — | | | | — | | | | 340,980 | |
| | | | | | | | | | | | | | | | | | | | | | | | |
| | $ | 1,396,315 | | | $ | 1,570,876 | | | $ | 409,730 | | | $ | 1,479,254 | | | $ | 1,473,005 | | | $ | 415,980 | |
| | | | | | | | | | | | | | | | | | | | | | | | |
| (1) | We paid our Dealer Manager an ongoing stockholder servicing fee that is payable monthly and accrues daily in an amount equal to 1/365 th of 1% of the purchase price per share of the Class T Shares sold in the Primary Offering. The amount incurred during the year ended December 31, 2022 represents an adjustment to the estimated stockholder servicing fee recorded at the time of the sale of the Class T Shares, based on the cessation date of such stockholder servicing fee of March 31, 2022. |
Acquisition of Self Storage Platform from SAM and Other Transactions
As a result of the Self Administration Transaction, we acquired the self storage sponsorship platform of SAM. Accordingly, the advisor and property manager entities of SST IV and SSGT II became our indirect subsidiaries, and we became entitled to receive various fees and expense reimbursements under the terms of the SST IV and SSGT II advisory and property management agreements as described below. In addition, we now also own the advisor and property manager entities of SST VI and SSGT III and are entitled to receive various fees and expense reimbursements under the terms of the SST VI and SSGT III advisory and property management agreements as described below.
Our indirect subsidiaries, Strategic Storage Advisor IV, LLC, the advisor to SST IV (the “SST IV Advisor”), SS Growth Advisor II, LLC, the advisor to SSGT II (the “SSGT II Advisor”), the SST VI Advisor, and the SSGT III Advisor are or were entitled to receive various fees and expense reimbursements under the terms of the SST IV, SSGT II, SST VI, and SSGT III advisory agreements.
SST IV Advisory Agreement
The SST IV Advisor provided acquisition and advisory services to SST IV pursuant to an advisory agreement (the “SST IV Advisory Agreement”) with SST IV up until the SST IV Merger on March 17, 2021.
Effective March 17, 2021, in connection with the SST IV Merger, the SST IV Advisory Agreement was terminated and none of the aforementioned subordinated distributions or fees were paid. As a result of us acquiring SST IV and terminating such contracts, we recorded a
write-off
of approximately $5.3 million related to the carrying value of the SST IV Advisory Agreement contract. Similarly, we recorded a
write-off
of approximately $1.2 million related to our special limited partnership interest, which per the terms of the SST IV Merger Agreement, terminated without consideration.
F-53
SMARTSTOP SELF STORAGE REIT, INC. AND SUBSIDIARIES
NOTES TO CONSOLIDATED FINANCIAL STATEMENTS
December 31, 2023, 2022 and 2021
As a result of the Self Administration Transaction, we recorded a deferred tax liability, which was the result of the difference between the GAAP carrying value of the SST IV Advisory Agreement and its carrying value for tax purposes. As we reduced the GAAP carrying value of such intangible asset, as noted above, we adjusted the corresponding value of our related deferred tax liability by approximately $1.4 million during the year ended December 31, 2021, and recorded such benefit to the income tax (expense) benefit line-item in our consolidated statements of operations.
SSGT II Advisory Agreement
The SSGT II Advisor provided acquisition and advisory services to SSGT II pursuant to an advisory agreement (the “SSGT II Advisory Agreement”) with SSGT II up until the SSGT II Merger on June 1, 2022.
Effective June 1, 2022, in connection with the SSGT II Merger, the SSGT II Advisory Agreement was terminated and pursuant to the SSGT II operating partnership agreement, subordinated distribution of approximately $16.1 million was otherwise due. As a result, we recorded a gain of approximately $16.1 million related to our special limited partnership interest and recorded this within gain on preexisting equity interests upon acquisition of control in our consolidated statements of operations. As a result of our acquisition of SSGT II and terminating the SSGT II Advisory Agreement, we recorded a
write-off
of approximately $1.4 million related to the carrying value of the SSGT II Advisory Agreement contract.
As a result of the Self Administration Transaction, we recorded a deferred tax liability, which was the result of the difference between the GAAP carrying value of the SSGT II Advisory Agreement and its carrying value for tax purposes. As we reduced the GAAP carrying value of such intangible asset, as noted above, we adjusted the corresponding value of our related deferred tax liability by approximately $0.3 million on June 1, 2022, and recorded such benefit to the income tax (expense) benefit line-item in our consolidated statements of operations.
SST VI Advisory Agreement
The SST VI Advisor provides acquisition and advisory services to SST VI pursuant to an advisory agreement (the “SST VI Advisory Agreement”). In connection with the SST VI private placement offering, SST VI was required to reimburse the SST VI Advisor for organization and offering costs from the SST VI private offering pursuant to the SST VI private offering advisory agreement.
Pursuant to the SST VI Advisory Agreement, the SST VI Advisor receives acquisition fees equal to 1.00% of the contract purchase price of each property SST VI acquires plus reimbursement of any acquisition expenses that SST VI Advisor incurs. The SST VI Advisor also receives a monthly asset management fee equal to 0.0625%, which is
one-twelfth
of 0.75%, of SST VI’s aggregate asset value, as defined.
A subsidiary of our Operating Partnership may also be potentially entitled to a subordinated distribution through its ownership of a special limited partnership in SST VI’s operating partnership agreement if SST VI (1) lists its shares of common stock on a national exchange, (2) terminates the SST VI Advisory Agreement, (3) liquidates its portfolio, or (4) merges with another entity or enters into an Extraordinary Transaction, as defined in the SST VI operating partnership agreement.
The SST VI Advisory Agreement provides for reimbursement of the SST VI Advisor’s direct and indirect costs of providing administrative and management services to SST VI. Beginning four fiscal quarters after commencement of SST VI’s public offering, which was declared effective March 17, 2022, the SST VI Advisor was required to pay or reimburse SST VI the amount by which SST VI’s aggregate annual operating expenses, as
F-54
SMARTSTOP SELF STORAGE REIT, INC. AND SUBSIDIARIES
NOTES TO CONSOLIDATED FINANCIAL STATEMENTS
December 31, 2023, 2022 and 2021
defined, exceed the greater of 2% of SST VI’s average invested assets or 25% of SST VI’s net income, as defined, unless a majority of SST VI’s independent directors determine that such excess expenses were justified based on unusual and
non-recurring
factors.
On March 1, 2022, Pacific Oak Holding Group, LLC, became a 10%
non-voting
member of the SST VI Advisor. Pacific Oak Capital Markets, LLC (a subsidiary of Pacific Oak Holding Group, LLC) is SST VI’s dealer manager, and as such, is responsible for the marketing of SST VI shares being offered pursuant to SST VI’s private offering, and subsequent to March 17, 2022, SST VI’s public offering. On October 25, 2022, we, through one of our subsidiaries also agreed to pay SST VI’s dealer manager an amount equal to 1.5% of the gross offering proceeds from the sale of Class W shares sold in their public offering. As such, for the years ended December 31, 2023 and 2022, we had incurred approximately $59,000 and $11,000, respectively, to SST VI’s dealer manager associated with the Class W Shares sold in their public offering.
On October 17, 2023, in connection with an amendment to SST VI’s dealer manager agreement, SST VI ceased the sale of Class W shares in its public offering, and subsequently began selling Class Z shares. Separately, we through one of our subsidiaries agreed to pay SST VI’s dealer manager an amount equal to 1.5% of the gross offering proceeds from the sale of Class Z shares sold in their public offering. As such, for the year ended December 31, 2023, we had incurred approximately $5,000 to SST VI’s dealer manager associated with the Class Z Shares sold in their public offering.
Additionally, in connection with the commencement of SST VI’s public offering, the SST VI Advisor or its affiliates agreed that it would fund on behalf of SST VI, an amount equal to 1% of the gross offering proceeds from the sale of Class W shares sold in their initial public offering, which amount shall be used by SST VI towards the payment of its offering expenses. For the years ended December 31, 2023 and 2022, we funded SST VI such costs in the amount of approximately $39,000 and $20,000, respectively.
SSGT III Advisory Agreement
The SSGT III Advisor provides acquisition and advisory services to SSGT III pursuant to an advisory agreement (the “SSGT III Advisory Agreement”). In connection with the SSGT III private placement offering, which became effective on May 18, 2022, SSGT III is required to reimburse the SSGT III Advisor for organization and offering costs from the SSGT III private offering pursuant to the SSGT III Advisory Agreement.
Pursuant to the SSGT III Advisory Agreement, the SSGT III Advisor will receive acquisition fees equal to 1.00% of the contract purchase price of each property SSGT III acquires plus reimbursement of acquisition expenses that SSGT III Advisor incurs, provided, however, that no reimbursement shall be made for costs of personnel to the extent that such personnel perform services in transactions for which the Advisor receives the Acquisition Fee. The SSGT III Advisor also receives a monthly asset management fee equal to 0.0625%, which is
one-twelfth
of 0.75%, of SSGT III’s aggregate asset value, as defined. The SSGT III Advisor is also entitled to receive a disposition fee equal to 1.5% of the contract sale price for any properties sold inclusive of any real estate commissions paid to third party real estate brokers.
Through a separate agreement, Pacific Oak Holding Group, LLC, the parent company of Pacific Oak Capital Markets, LLC, the dealer manager for the SSGT III private offering, is entitled to receive 10% of the acquisition fees, asset management fees and disposition fees SSGT III Advisor earns pursuant to the SSGT III Advisory Agreement.
F-55
SMARTSTOP SELF STORAGE REIT, INC. AND SUBSIDIARIES
NOTES TO CONSOLIDATED FINANCIAL STATEMENTS
December 31, 2023, 2022 and 2021
A subsidiary of our Operating Partnership may also be potentially entitled to various subordinated distributions through its ownership of a special limited partnership in SSGT III’s operating partnership agreement if SSGT III (1) lists its shares of common stock on a national exchange, (2) terminates the SSGT III Advisory Agreement, (3) liquidates its portfolio, or (4) merges with another entity or enters into an Extraordinary Transaction, as defined in the SSGT III operating partnership agreement.
The SSGT III Advisory Agreement provides for reimbursement of the SSGT III Advisor’s direct and indirect costs of providing administrative and management services to SSGT III.
Managed REIT Property Management Agreements
Our indirect subsidiaries, Strategic Storage Property Management IV, LLC, SS Growth Property Management II, LLC, Strategic Storage Property Management VI, LLC, and SS Growth Property Management III, LLC, (collectively the “Managed REITs Property Managers”), are or were entitled to receive fees for their services in managing the properties owned by the Managed REITs pursuant to property management agreements entered into between the owner of the property and the applicable Managed REIT’s Property Manager.
The Managed REITs’ Property Managers receive a property management fee equal to 6% of the gross revenues from the properties, generally subject to a monthly minimum of $3,000 per property, plus reimbursement of the costs of managing the properties, and a
one-time
fee of $3,750 for each property acquired that would be managed by the Managed REITs’ Property Managers. Reimbursable costs and expenses include wages and salaries and other expenses of employees engaged in operating, managing and maintaining such properties. Pursuant to the property management agreements, we through our Operating Partnership employ the
on-site
staff for the Managed REITs’ properties.
The SST IV, SST VI, and SSGT III property managers are or were entitled to a construction management fee equal to 5% of the cost of a related construction or capital improvement work project in excess of $10,000.
Effective March 17, 2021, in connection with the SST IV Merger, the SST IV property management contracts were terminated. As a result of us acquiring SST IV and terminating such contracts, we recorded a
write-off
of approximately $1.9 million related to the carrying value of the SST IV property management contracts.
Effective June 1, 2022, in connection with the SSGT II Merger, the SSGT II property management contracts were terminated. As a result of us acquiring SSGT II and terminating such contracts, we recorded a
write-off
of approximately $0.6 million related to the carrying value of the SSGT II property management contracts.
In connection with the Self Administration Transaction, we previously recorded a deferred tax liability, which was the result of the difference between the GAAP carrying value of the SST IV and SSGT II property management contracts and their carrying values for tax purposes. As we reduced the GAAP carrying value of such intangible assets, we adjusted the value of our deferred tax liability on a
pro-rata
basis, reducing the deferred tax liability by approximately $0.5 million during the three months ended March 31, 2021 related to the SST IV Merger and $0.2 million during the three months ended June 30, 2022 related to the SSGT II Merger and the related aforementioned write-offs, and recorded such benefits within the income tax (expense) benefit line-item in our consolidated statements of operations.
F-56
SMARTSTOP SELF STORAGE REIT, INC. AND SUBSIDIARIES
NOTES TO CONSOLIDATED FINANCIAL STATEMENTS
December 31, 2023, 2022 and 2021
Summary of Fees and Revenue Related to the Managed REITs
Pursuant to the terms of the various agreements described above for the Managed REITs, the following summarizes the related party fees for the years ended December 31, 2023, 2022, and 2021:
| | | | | | | | | | | | |
Managed REIT Platform Revenues | | Year Ended
December 31,
2023 | | | Year Ended
December 31,
2022 | | | Year Ended
December 31,
2021 | |
| | | | | | | | | | | | |
| | $ | — | | | $ | — | | | $ | 716,278 | |
| | | — | | | | 798,395 | | | | 1,843,769 | |
| | | 3,420,040 | | | | 1,348,314 | | | | 178,282 | |
| | | 1,017,194 | | | | 145,622 | | | | — | |
| | | | | | | | | | | | |
| | | | | | | | | | | | |
Property Management Fees: | | | | | | | | | | | | |
| | | — | | | | — | | | | 346,179 | |
| | | — | | | | 407,706 | | | | 709,533 | |
| | | 1,243,056 | | | | 551,493 | | | | 99,602 | |
| | | 358,494 | | | | 62,426 | | | | — | |
| | | 738,408 | | | | 432,944 | | | | 116,984 | |
| | | | | | | | | | | | |
| | | | | | | | | | | | |
Tenant Protection Program Fees: | | | | | | | | | | | | |
| | | — | | | | — | | | | 285,959 | |
| | | — | | | | 250,156 | | | | 636,671 | |
| | | 841,582 | | | | 396,758 | | | | 158,662 | |
| | | 186,109 | | | | 8,119 | | | | — | |
| | | 271,221 | | | | 186,658 | | | | 51,185 | |
| | | | | | | | | | | | |
| | | | | | | | | | | | |
| | | | | | | | | | | | |
| | | 2,470,497 | | | | 1,846,168 | | | | 649,623 | |
| | | 837,000 | | | | 846,000 | | | | — | |
| | | | | | | | | | | | |
| | | | | | | | | | | | |
Other Managed REIT Fees (3) | | | 556,353 | | | | 538,457 | | | | 530,243 | |
| | | | | | | | | | | | |
Managed REIT Platform Fees | | | 11,939,954 | | | | 7,819,216 | | | | 6,322,970 | |
| | | | | | | | | | | | |
Sponsor funding reduction (4) | | | (33,643 | ) | | | — | | | | — | |
| | | | | | | | | | | | |
Total Managed REIT Platform Revenues | | | | | | | | | | | | |
| | | | | | | | | | | | |
| (1) | On March 17, 2021, we acquired SST IV and no longer earn such fees. Additionally, the Tenant Protection Program revenue for SST IV is now included in ancillary operating revenue in our consolidated statements of operations. |
| (2) | On June 1, 2022, we acquired SSGT II and no longer earn such fees. Additionally, the Tenant Protection Program revenue for SSGT II is now included in ancillary operating revenue in our consolidated statements of operations. |
| (3) | Such revenue primarily includes other property management related fees, construction management fees, development fees, and other miscellaneous revenues. |
| (4) | Pursuant to the Sponsor Funding Agreement, SmartStop funds certain costs of SST VI’s share sales, and in return receives Series C Units in SST VI’s OP. The excess of the funding over the value of the Series C |
F-57
SMARTSTOP SELF STORAGE REIT, INC. AND SUBSIDIARIES
NOTES TO CONSOLIDATED FINANCIAL STATEMENTS
December 31, 2023, 2022 and 2021
| | Units received is accounted for as a reduction of Managed REIT Platform revenues from SST VI over the remaining estimated term of the management contracts with SST VI. |
We offer tenant insurance or tenant protection programs to customers at our Managed REITs’ properties pursuant to which we, as the property manager and majority shareholder of the Tenant Protection Program joint ventures, are entitled to substantially all of the net revenue attributable to the sale of such tenant programs.
In order to protect our interest in receiving these revenues in light of the fact that the Managed REITs control the properties, we and the Managed REITs transferred our respective rights in such arrangements to a joint venture entity owned 99.9% by us through a TRS subsidiary and 0.1% by the Managed REIT. Under the terms of the operating agreements of the joint venture entities, we receive 99.9% of the net revenues generated from such Tenant Protection Programs and the Managed REIT receives the other 0.1% of such net revenues. Subsequent to the SST IV Merger and the SSGT II Merger, the SST IV and SSGT II Tenant Protection Programs joint ventures are wholly-owned by us and such revenue is generated at our now wholly-owned self storage properties and is recorded within ancillary operating revenue in our consolidated statements of operations.
Reimbursable costs from Managed REITs includes reimbursement of SST IV (until the SST IV Merger Date), SSGT II, (until the SSGT II Merger Date), SST VI and SSGT III’s Advisors’ direct and indirect costs of providing administrative and management services to the Managed REITs. Additionally, reimbursable costs includes reimbursement pursuant to the property management agreements for reimbursement of the costs of managing the Managed REITs’ properties, including wages and salaries and other expenses of employees engaged in operating, managing and maintaining such properties.
As of December 31, 2023 and 2022, we had receivables due from the Managed REITs totaling approximately $6.5 million, and $2.0 million, respectively. Such amounts are included in investments in and advances to the Managed REITs line-item in our consolidated balance sheets. Such amounts included unpaid amounts relative to the above table, in addition to other direct routine reimbursable expenditures of the Managed REITs that we directly funded.
Investments in and advances to SST VI OP
On March 10, 2021, SmartStop OP made an investment of $5.0 million in SST VI OP, in exchange for common units of limited partnership interest in SST VI OP. Additionally, a subsidiary of SmartStop OP owns a special limited partnership interest (the “SST VI SLP”) in SST VI OP.
For the years ended December 31, 2023 and 2022, we recorded a loss related to our equity interest, excluding our preferred investment discussed below, in SST VI OP of approximately $0.9 million and $1.8 million, respectively, and received distributions in the amount of approximately $341,000 and $315,000, respectively.
On January 30, 2023, a subsidiary of SmartStop made a preferred investment of 600,000 Series A Cumulative Redeemable Preferred units of limited partnership interest in SST VI OP for an aggregate of $15 million. Upon closing of the preferred investment, an investment fee equal to 1% of the investment amount was owed and paid by SST VI OP. SmartStop, through its subsidiary, received distributions, payable monthly in arrears, at a rate of 7.0% per annum from the date of issuance until the second anniversary of the date of issuance, 8.0% per annum commencing thereafter until the third anniversary of the date of issuance, 9.0% per
F-58
SMARTSTOP SELF STORAGE REIT, INC. AND SUBSIDIARIES
NOTES TO CONSOLIDATED FINANCIAL STATEMENTS
December 31, 2023, 2022 and 2021
annum commencing thereafter until the fourth anniversary of the date of issuance, and 10% per annum thereafter, payable monthly. On May 2, 2023, SST VI fully redeemed SmartStop’s preferred investment of 600,000 Series A Cumulative Redeemable Preferred units of limited partnership interest in SST VI OP, and repaid accrued distributions due as of the date of redemption for a total amount of approximately $15.1 million.
As discussed in Note 2 – Summary of Significant Accounting Policies, due to our equity interest in SST VI OP, we consolidated this investment from March 10, 2021 (the date of our initial investment in SST VI OP) until May 1, 2021.
Sponsor Funding Agreement
On November 1, 2023, SRA, a subsidiary of SmartStop OP entered into a Sponsor Funding Agreement with SST VI and SST VI OP, in connection with certain changes to the public offering of SST VI.
Pursuant to the Sponsor Funding Agreement, SRA, as sponsor of the SST VI offering, has agreed to fund the payment of (i) the upfront 3% sales commission for the sale of shares of SST VI’s Class Y common stock sold in the SST VI offering, (ii) the upfront 3% dealer manager fee for the Class Y Shares sold in the SST VI offering, and (iii) the estimated 1% organization and offering expenses for the sale of Class Y Shares and shares of SST VI’s Class Z common stock sold in the SST VI offering. SRA also agreed to reimburse SST VI in cash to cover the dilution from certain one-time stock dividends which were issued by SST VI to existing stockholders in connection with the sponsor funding changes to the SST VI offering. On December 15, 2023, we paid SST VI approximately $6.6 million for the reimbursement of the aforementioned stock dividend.
In consideration for SRA providing the funding for the front-end sales load and the cash to cover the dilution from the stock dividends described above, SST VI OP will issue a number of Series C Units to SRA equal to the dollar amount of such funding divided by the then-current offering price for the Class Y Shares and Class Z Shares sold in the SST VI offering, which will initially be $9.30 per share. Pursuant to the Sponsor Funding Agreement, SRA will reimburse SST VI monthly for the applicable front-end sales load it has agreed to fund, and SST VI OP will issue the Series C Units on a monthly basis upon such reimbursement. The Sponsor Funding Agreement will terminate immediately upon the date that SST VI ceases to offer the Class Y Shares and Class Z Shares in the SST VI offering. The SST VI offering was set to expire on March 17, 2024, and was extended to March 17, 2025 upon the approval of SST VI’s board of directors on February 1, 2024. Inclusive of all extension options available to SST VI, their offering could not extend beyond September 12, 2025.
On November 1, 2023, SRA entered into Amendment No. 3 to the Second Amended and Restated Limited Partnership Agreement of SST VI OP with SST VI and SST VI OP containing, among other things, the terms of the Series C Units. The Series C Units shall initially have no distribution, liquidation, voting, or other rights to participate in SST VI OP unless and until such Series C Units are converted into class A units of SST VI OP. The Series C Units shall automatically convert into class A units on a one-to-one basis upon SST VI’s disclosure of an estimated net asset value per share equal to at least $10.00 per share for each class of SST VI shares of common stock, including the Class Y Shares and Class Z Shares, calculated net of the value of the Series C Units to be converted.
Through December 31, 2023, we have paid SST VI approximately $6.6 million in connection with the Sponsor Funding Agreement, and have received approximately 710,000 subordinated units. Additionally, as of December 31, 2023, approximately $0.2 million was accrued as a payable pursuant to the Sponsor Funding Agreement.
F-59
SMARTSTOP SELF STORAGE REIT, INC. AND SUBSIDIARIES
NOTES TO CONSOLIDATED FINANCIAL STATEMENTS
December 31, 2023, 2022 and 2021
If SST VI were to sell the maximum amount under its offering of $1.0 billion, assuming the sale of all Class Y Shares consisting of a 7% front end sales load, the maximum commitment of SRA pursuant to the Sponsor Funding Agreement is approximately $70 million, excluding the reimbursement for the one time stock dividend of approximately $6.6 million.
On March 11, 2021, SST VI OP, through a wholly-owned subsidiary, used the funds from our $5.0 million investment described above, in part, to acquire its first self storage facility in Phoenix, Arizona for approximately $16 million. In connection with SST VI OP’s acquisition of the Phoenix property, we provided a $3.5 million mezzanine loan to a wholly-owned subsidiary of SST VI OP with an initial interest rate of 8.5% and term of six months; as well as a 180 day extension option which was exercised and increased the interest rate to 9.25% for the remainder of the term.
On April 16, 2021, in connection with SST VI OP’s investment in a real estate joint venture property located in North York, Ontario Canada, we provided a $2.1 million term loan with similar terms as the mezzanine loan discussed above.
On November 12, 2021, a wholly-owned subsidiary of SST VI OP repaid the outstanding balance on the $3.5 million mezzanine loan and the $2.1 million term loan along with all accrued interest. The loans were terminated in accordance with the mezzanine loan agreement and the term loan agreement without fees or penalties.
On December 30, 2021, in connection with SST VI’s acquisition of two self storage facilities, SmartStop OP entered into a mezzanine loan agreement with a wholly-owned subsidiary of SST VI OP for up to $45 million (the “SST VI Mezzanine Loan”). The SST VI Mezzanine Loan required a commitment fee equal to 1.0% of the amount drawn at closing of the SST VI Mezzanine Loan, and each subsequent draw. Interest on this loan accrued at LIBOR plus 3.0%.
The SST VI Mezzanine Loan was amended on December 20, 2022, such amendment increased the principal borrowing amount from a maximum of $45 million to $55 million. Pursuant to this amendment, the interest rate on the SST VI Mezzanine Loan was converted to a variable rate equal to SOFR plus 3.0%. Additionally, in such amendment, SST VI exercised the existing extension option; payments on the SST VI Mezzanine Loan were interest only until the due date of December 30, 2023. As of December 31, 2022, a wholly-owned subsidiary of SST VI OP had $35.0 million outstanding, pursuant to the SST VI Mezzanine Loan. On May 2, 2023, SST VI fully repaid the outstanding principal, plus all applicable accrued interest due on the SST VI Mezzanine Loan as of such date for a total amount of approximately $51.7 million. On such date, the SST VI Mezzanine Loan agreement was terminated.
On June 13, 2023 SmartStop OP entered into a promissory note agreement with SST VI OP ( the “SST VI Note”), where SST VI OP borrowed $15.0 million. Interest on the loan accrued at SOFR plus 3.0%. Payments on the SST VI Note are interest only. The loan was extended to December 31, 2024 at the borrower’s option. As such, the interest rate on the loan increased to SOFR plus 4.0%, and a fee equal to 0.25% of the outstanding principal balance was due as a result of SST VI exercising the extension option. The SST VI Note required a commitment fee equal to 1.0% of the aggregate principal amount of the loan. As of December 31, 2023, SST VI OP had $15.0 million borrowed and outstanding pursuant to the SST VI Note.
F-60
SMARTSTOP SELF STORAGE REIT, INC. AND SUBSIDIARIES
NOTES TO CONSOLIDATED FINANCIAL STATEMENTS
December 31, 2023, 2022 and 2021
The following table summarizes the carrying value of our investments in and advances to SST VI as of December 31, 2023 and 2022:
| | | | | | | | |
| | | | |
| | | | | | |
Receivables and advances due | | $ | 5,861,326 | | | $ | 1,828,990 | |
| | | | | | | | |
| | | — | | | | 35,000,000 | |
| | | 15,000,000 | | | | — | |
| | | | | | | | |
SST VI OP Units and SST VI SLP | | | 1,932,357 | | | | 3,221,410 | |
SST VI Class C Subordinated Units | | | 3,306,494 | | | | — | |
| | | | | | | | |
Total investments in and advances | | | | | | | | |
| | | | | | | | |
Investments in and advances to SSGT III OP
On August 29, 2022, SmartStop OP made an investment of $5.0 million in SS Growth Operating Partnership III, L.P., the operating partnership of SSGT III (“SSGT III OP”), in exchange for common units of limited partnership interest in SSGT III OP. Additionally, a subsidiary of SmartStop OP owns a special limited partnership interest (the “SSGT III SLP”) in SSGT III OP.
For the years ended December 31, 2023 and 2022, we recorded a loss related to our equity interest in SSGT III OP of approximately $0.7 million and $0.3 million, respectively, and received distributions in the amount of approximately $257,000 and $55,000, respectively.
On August 9, 2022, in connection with SSGT III’s acquisition of two self storage facilities, SmartStop OP, L.P. entered into a mezzanine loan agreement with a wholly-owned subsidiary of SSGT III, for up to $50.0 million (the “SSGT III Mezzanine Loan”), of which $42.0 million was funded as an initial draw at the time of closing. The SSGT III Mezzanine Loan requires a commitment fee equal to 1.0% of the amount drawn at closing of the SSGT III Mezzanine Loan, and subsequent draws.
The SSGT III Mezzanine Loan was amended on December 20, 2022, such amendment increased the principal borrowing amount from up to $50 million to $77 million. Pursuant to this amendment, the interest rate on the SSGT III Mezzanine Loan became a variable rate equal to SOFR plus 3.0%. Payments on the SSGT III Mezzanine Loan are interest only, and it had an initial maturity date of August 9, 2023. SSGT III extended the ultimate maturity date of the SSGT III Mezzanine Loan until August 9, 2024, as such, the interest rate of the SSGT III Mezzanine Loan increased to SOFR plus 4.0% per annum, pursuant to the December 20, 2022 amendment. The SSGT III Mezzanine Loan may be prepaid in whole or in part at any time without fees or penalty and, in certain circumstances, equity interests securing the SSGT III Mezzanine Loan may be released from the pledge of collateral. The SSGT III Mezzanine Loan is secured by a pledge of the equity interest in the indirect, wholly-owned subsidiaries of SSGT III, that owned seven operating self storage facilities as of December 31, 2023. SSGT III OP, also serves as a
non-recourse
guarantor.
As of December 31, 2023 and 2022, a wholly-owned subsidiary of SSGT III OP had $4.0 million and $17.5 million, respectively, borrowed and outstanding pursuant to the SSGT III Mezzanine Loan.
F-61
SMARTSTOP SELF STORAGE REIT, INC. AND SUBSIDIARIES
NOTES TO CONSOLIDATED FINANCIAL STATEMENTS
December 31, 2023, 2022 and 2021
The following table summarizes the carrying value of our investments in and advances to SSGT III OP as of December 31, 2023 and 2022:
| | | | | | | | |
| | | | |
| | | | | | |
Receivables and advances due | | $ | 628,710 | | | $ | 156,082 | |
| | | | | | | | |
SSGT III Mezzanine Loan (1) | | | 4,000,000 | | | | 17,500,000 | |
| | | | | | | | |
SSGT III OP Units and SSGT III SLP | | | 3,661,978 | | | | 4,664,687 | |
| | | | | | | | |
Total investments in and advances | | | | | | | | |
| | | | | | | | |
| (1) | As of December 31, 2023, $1.5 million was available to be drawn on the SSGT III Mezzanine Loan. |
Administrative Services Agreement
On June 28, 2019, we along with our Operating Partnership, SmartStop TRS and SmartStop Storage Advisors, LLC (collectively, the “Company Parties”) entered into an Administrative Services Agreement with SAM (the “Administrative Services Agreement”), which, as amended, requires that the Company Parties will be reimbursed for providing certain operational and administrative services to SAM which may include, without limitation, accounting and financial support, IT support, HR support, advisory services and operations support, and administrative support and other miscellaneous reimbursements as set forth in the Administrative Services Agreement and SAM will be reimbursed for providing certain operational and administrative services to the Company Parties which may include, without limitation, due diligence support, marketing, fulfillment and offering support, events support, insurance support, and administrative and facilities support. SAM and the Company Parties will reimburse one another based on the actual costs of providing their respective services. Additionally, SAM paid the Company Parties an allocation of rent and overhead for the portion of the Ladera Office that it occupied until October 2022, at which time SAM relocated to a separate office. Such agreement had an initial term of three years, with automatic
one-year
renewals, and is subject to certain adjustments as defined in the agreement.
For the years ended December 31, 2023 and 2022, we incurred reimbursements payable to SAM under the Administrative Services Agreement of approximately $0.5 million and approximately $0.3 million, respectively, which were recorded in the Managed REIT Platform expenses line item in our consolidated statements of operations.
We recorded reimbursements from SAM of approximately $0.7 million and $0.7 million during the years ended December 31, 2023 and 2022, respectively, related to services provided to SAM as well as reimbursements of rent and overhead for the portion of the Ladera Office occupied by SAM, which were included in Managed REIT Platform revenue in our consolidated statements of operations and other miscellaneous reimbursements.
As of December 31, 2023 and 2022, a payable of approximately $11,000 and a receivable of approximately $15,000, respectively, was due to/from SAM related to the Administrative Services Agreement.
Note 11. Equity Based Compensation
Prior to June 15, 2022, we issued equity based compensation pursuant to the Company’s Employee and Director Long-Term Incentive Plan (the “Prior Plan”). On June 15, 2022, our stockholders approved the 2022
F-62
SMARTSTOP SELF STORAGE REIT, INC. AND SUBSIDIARIES
NOTES TO CONSOLIDATED FINANCIAL STATEMENTS
December 31, 2023, 2022 and 2021
Long-Term Incentive Plan (the “Plan”) and we no longer issue equity under the Prior Plan. Pursuant to the Plan, we are able to issue various forms of equity based compensation. Through December 31, 2023, we have generally issued equity based awards in two forms: (1) restricted stock awards consisting of shares of our common stock and (2) long-term incentive plan units of our Operating Partnership (“LTIP Units”).
Through March 2020, we had only issued restricted stock, which shares are subject to a time based vesting period. In April 2020, the Compensation Committee of the board of directors approved awards for our executive officers, which include (1) performance based awards, and (2) time based awards. For both such type of awards, the recipient can choose either LTIP Units or restricted stock consisting of shares of our common stock. Effective June 2022, certain other recipients of time based awards were also allowed to choose either LTIP Units or restricted stock shares of our common stock.
The fair value of restricted stock is determined on the grant date based on an estimated value per share. The estimated fair value of our restricted stock was determined with the assistance of third party valuation specialists primarily based on an income approach to value our properties as well as the Managed REIT Platform, l
ess the estimated fair value of our debt and other liabilities. The key assumptions used in estimating the fair value of our restricted stock were projected annual net operating income, projected growth rates, discount rates, capitalization rates and an illiquidity discount. The fair value of LTIP Units were further adjusted by applying an additional discount as the LTIP Units ar
e not initially economically equivalent to our restricted stock. For performance based awards, a fair value was determined for each performance ranking scenario, with stock compensation expense recorded using the fair value of the scenario determined to be probable of achievement as of the end of the respective period.
We have granted various time based awards, which generally vest ratably over either
one
,
three
, or four years commencing in the year of grant, subject to the recipient’s continued employment or service through the applicable vesting date. All grants of time based restricted stock have limitations on transferability during the vesting period, and the grantee does not have the ability to vote any unvested shares. Transferability during the vesting period depends upon when the grant was made, as follows (i) with respect to grants of time based restricted stock made prior to April 2020, the restriction on transfers applies to the entirety of the grant, regardless of vesting, and (ii) with respect to grants of time based restricted stock made in or subsequent to April 2020, the restriction on transfer applies only to the unvested portion of the restricted stock.
With respect to grants of time based LTIP Units, distributions accrue based on the effective date of each grant, and are payable as distributions are paid on our Class A Shares without regard to whether the underlying awards have vested. With respect to time based restricted stock issued to our board of directors in or after June 2022, distributions accrue as of the effective date of each grant and are payable as distributions are paid on our Class A Shares without regard to whether the underlying awards have vested. With respect to all other existing time based restricted stock, distributions accrue on
non-vested
shares granted and are paid when the underlying restricted shares vest.
Holders of time based LTIP Units receive allocations of profits and losses with respect to the LTIP Units as of the effective date, distributions from the effective date in an amount equivalent to the distributions declared and paid on our Class A Shares, and the same voting rights as holders of common units, voting as a class with each LTIP Unit holder having one vote per LTIP Unit held. Prior to vesting, time based LTIP Units generally may not be transferred, other than by laws of descent and distribution.
F-63
SMARTSTOP SELF STORAGE REIT, INC. AND SUBSIDIARIES
NOTES TO CONSOLIDATED FINANCIAL STATEMENTS
December 31, 2023, 2022 and 2021
The following table summarizes the activity related to our time based awards:
| | | | | | | | | | | | | | | | |
| | | | | | | |
| | | | | Weighted-Average Grant-Date Fair Value | | | | | | Weighted-Average Grant-Date Fair Value | |
Unvested at December 31, 2021 | | | 219,946 | | | $ | 9.64 | | | | 274,196 | | | $ | 9.22 | |
| | | 60,032 | | | | 14.33 | | | | 181,664 | | | | 13.23 | |
| | | (129,498 | ) | | | 9.64 | | | | (165,219 | ) | | | 10.21 | |
| | | (4,630 | ) | | | 11.76 | | | | — | | | | — | |
| | | | | | | | | | | | | | | | |
Unvested at December 31, 2022 | | | 145,850 | | | | 11.50 | | | | 290,641 | | | | 11.16 | |
| | | 43,720 | | | | 14.30 | | | | 315,915 | | | | 13.30 | |
| | | (96,295 | ) | | | 10.86 | | | | (226,271 | ) | | | 11.58 | |
| | | (7,960 | ) | | | 13.92 | | | | — | | | | — | |
| | | | | | | | | | | | | | | | |
Unvested at December 31, 2023 | | | 85,315 | | | $ | 13.44 | | | | 380,285 | | | $ | 12.69 | |
| | | | | | | | | | | | | | | | |
With respect to performance based awards, the number of shares of restricted stock granted as of the grant date equaled 100% of the targeted award, whereas the number of LTIP Units granted as of the grant date equaled 200% of the targeted amount of the award. The targeted award for each executive was determined and approved by the Compensation Committee of our board of directors. The actual number of shares of restricted stock or LTIP Units, as applicable, to be issued upon vesting may range from 0% to 200% of the targeted award, such determination being based upon the results of the performance measure. Performance based awards vest based upon our performance as ranked amongst a peer group of self storage related companies. This comparison will be conducted using a performance measure of average annual same-store revenue growth, analyzed over a three-year period. Earned awards for the 2021, 2022 and 2023 grants will vest, as applicable, no later than March 31, 2024,
, and
, respectively.
Recipients of performance based restricted stock accrue distributions during the performance period, and such distributions will only be payable on the date that any such shares of restricted stock vest, based upon the performance level attained. Recipients of performance based LTIP Units are issued LTIP Units at 200% of the targeted award and are entitled to receive distributions and allocations of profits and losses with respect to the performance based LTIP Units as of the effective date of each award in an amount equal to 10% of the distributions and allocations available to such LTIP Units, until the Distribution Participation Date (as defined in the Operating Partnership Agreement). The remaining 90% of distributions will accrue and will be payable on the Distribution Participation Date based upon the performance level attained and number of performance based LTIP Units that vest. Following the Distribution Participation Date, recipients will be entitled to receive the full amount of distributions and allocations of profits and losses with respect to the vested performance-based LTIP Units, such amount being equivalent to distributions declared and paid on our Class A Shares.
F-64
SMARTSTOP SELF STORAGE REIT, INC. AND SUBSIDIARIES
NOTES TO CONSOLIDATED FINANCIAL STATEMENTS
December 31, 2023, 2022 and 2021
The following table summarizes our activity related to our performance based awards:
| | | | | | | | | | | | | | | | |
| | | | | | | |
Performance Based Award Grants | | | | | Weighted-Average Grant-Date Fair Value | | | | | | Weighted-Average Grant-Date Fair Value | |
Unvested at December 31, 2021 | | | 5,752 | | | $ | 9.78 | | | | 267,107 | | | $ | 9.21 | |
| | | — | | | | — | | | | 113,429 | | | | 13.18 | |
| | | — | | | | — | | | | — | | | | — | |
| | | — | | | | — | | | | — | | | | — | |
| | | | | | | | | | | | | | | | |
Unvested at December 31, 2022 | | | 5,752 | | | | 9.78 | | | | 380,536 | | | | 10.39 | |
| | | 5,752 | (1) | | | 9.78 | | | | 271,199 | | | | 13.30 | |
| | | (11,504 | ) | | | 9.78 | | | | (118,720 | ) | | | 9.09 | |
| | | — | | | | | | | | — | | | | — | |
| | | | | | | | | | | | | | | | |
Unvested at December 31, 2023 | | | — | | | $ | — | | | | 533,015 | | | $ | 12.16 | |
| | | | | | | | | | | | | | | | |
| (1) | On March 2, 2023 the Compensation Committee of the board of directors approved the vesting of the 2020 performance grant at 200% of the targeted award. Accordingly, individuals who elected to receive performance based restricted stock were issued and immediately vested additional shares to equal 200% of their targeted award. |
Holders of performance based restricted stock do not have any rights as a stockholder with respect to the unvested portion of such restricted stock awards. Prior to vesting, shares of performance based restricted stock generally may not be transferred, other than by laws of descent and distribution.
Holders of performance based LTIP Units have the same voting rights as holders of common units, voting as a class with each LTIP Unit holder having one vote per LTIP Unit held. Prior to vesting, performance based LTIP Units generally may not be transferred, other than by laws of descent and distribution.
LTIP Units are designed to qualify as “profits interests” in the Operating Partnership for federal income tax purposes. The profits interests’ characteristics of the LTIP Units mean that initially they will not be treated as economically equivalent in value to a common unit and the issuance of LTIP Units will not be a taxable event to the Operating Partnership or the recipient. If and when certain events occur pursuant to applicable tax regulations and in accordance with the Operating Partnership Agreement, LTIP Units may become economically equivalent to common units of limited partnership interest of our Operating Partnership on a
basis.
As of December 31, 2023, 9,367,118 shares of stock were available for issuance under the Plan.
We recorded approximately $5.1 million, $3.8 million, and $2.8 million of equity based compensation expense in general and administrative expense during the years ended December 31, 2023, 2022, and 2021, respectively. We recorded approximately $186,000, $155,000, and $80,000 of equity based compensation expense in property operating expenses, within our consolidated statements of operations for the years ended December 31, 2023, 2022, and 2021, respectively. As of December 31, 2023, and 2022, there was approximately $6.8 million and $4.8 million of total unrecognized compensation expense related to
non-vested
equity awards, respectively. As of December 31, 2023 and 2022, such cost was expected to be recognized over a weighted-average period of approximately 2.2 years and 2.1 years, respectively.
F-65
SMARTSTOP SELF STORAGE REIT, INC. AND SUBSIDIARIES
NOTES TO CONSOLIDATED FINANCIAL STATEMENTS
December 31, 2023, 2022 and 2021
In February 2023, the compensation committee of our board of directors approved the 2023 executive compensation terms for our executives, which included (1) performance-based equity grants in the form of either, at the election of the executive, restricted stock awards or LTIP Units, and (2) time-based equity grants in the form of either, at the election of the executive, restricted stock awards or LTIP Units.
In February 2023, an aggregate of 271,199 performance-based LTIP Units and approximately 275,308 time-based LTIP Units were issued to our executive officers. The performance-based LTIP Units vest after the three year performance period, based upon the performance level attained. The time-based LTIP Units vest ratably over four years, with the first tranche vesting on December 31, 2023, subject to the recipient’s continued employment through the applicable vesting date.
Note 12. Commitments and Contingencies
On June 28, 2019, in relation to the Self Administration Transaction, 3,283,302
Class A-2
limited partnership units of the Operating Partnership ("Class
A-2
Units"), were issued to SS OP Holdings as consideration.
Class A-2
Units could convert into
Class A-1
Units as earnout consideration, as described below. The
Class A-2
Units were not entitled to cash distributions or the allocation of any profits or losses in the Operating Partnership until the
Class A-2
Unit into
Class A-1
Units.
The conversion features of the
Class A-2
Units were as follows: (A) the first time the aggregate incremental assets under management, as amended (“AUM”) (as defined in the Operating Partnership Agreement) of the Operating Partnership equals or exceeds $300,000,000,
one-third
of the
Class A-2
Units would automatically convert into
Class A-1
Units, (B) the first time the incremental AUM of the Operating Partnership equaled or exceeded $500,000,000, an additional
one-third
of the
Class A-2
Units would automatically convert into
Class A-1
Units, and (C) the first time the incremental AUM equals or exceeds $700,000,000, the remaining
one-third
of the
Class A-2
Units would automatically convert into
Class A-1
Units (each an “Earnout Achievement Date”). On each Earnout Achievement Date, the
Class A-2
Units would automatically convert into
Class A-1
Units based on an earnout exchange ratio, which is equal to $10.66 divided by the then current value of our
Class A-1
Units, as provided in the Operating Partnership Agreement.
On March 24, 2021, we, as the general partner of our Operating Partnership, entered into Amendment No. 3 (the “Amendment”) to the Operating Partnership Agreement, to make certain revisions to Exhibit D (Description of
Class A-2
Units) to the Operating Partnership Agreement.
The Amendment (i) revised the definition of “AUM” in connection with the earnout of the
Class A-2
Units so that it (A) included assets acquired by us and our affiliates and (B) included 100% of any joint venture assets, rather than a pro rata percentage, and (ii) clarifies that the
Class A-2
Units may be transferred after the
two-year
holding period.
On March 24, 2021, 1,094,434
Class A-2
Units held by SS OP Holdings, were converted into 1,121,795
Class A-1
Units pursuant to the achievement of the first tier of earnout consideration. The fair value of the contingent earnout liability was reduced as the
Class A-2
Units were converted into
Class A-1
Units in our Operating Partnership and the fair value of such units was reclassified to the noncontrolling interest in our Operating Partnership line in the equity section of our consolidated balance sheet.
On October 19, 2021, the Nominating and Corporate Governance Committee of our board of directors and our board of directors approved resolutions providing that the denominator in the calculation of the earnout
F-66
SMARTSTOP SELF STORAGE REIT, INC. AND SUBSIDIARIES
NOTES TO CONSOLIDATED FINANCIAL STATEMENTS
December 31, 2023, 2022 and 2021
exchange ratio will be $10.66 (the value of the Class A common stock at the time of the Self Administration Transaction, pursuant to which the earnout was established) for the subsequent 12 months, until October 19, 2022. Thereafter the denominator in the calculation of the earnout exchange ratio would be as provided in the Operating Partnership Agreement.
On March 29, 2022, 1,094,434
Class A-2
Units were converted into 1,094,434
Class A-1
Units pursuant to the achievement of the second tier of earnout consideration. The fair value of the contingent earnout liability was reduced as the
Class A-2
Units were converted into
Class A-1
Units in our Operating Partnership and the fair value of such units was reclassified to the noncontrolling interest in our Operating Partnership line in the equity section of our consolidated balance sheet.
On August 9, 2022, pursuant to the revised definition of AUM as described above, we reached the incremental assets under management threshold of $700 million, and 1,094,434
Class A-2
Units were converted into 1,094,434
Class A-1
Units pursuant to the achievement of the third and final tier of earnout consideration. The fair value of the contingent earnout liability was eliminated as the
Class A-2
Units were converted into
Class A-1
Units in our Operating Partnership and the fair value of such units was reclassified to the noncontrolling interest in our Operating Partnership line in the equity section of our consolidated balance sheet.
Distribution Reinvestment Plan
We have adopted an amended and restated distribution reinvestment plan (our “DRP”) that allows both our Class A and Class T stockholders to have distributions otherwise distributable to them invested in additional shares of our Class A and Class T Shares, respectively. Under our DRP, the Board may amend, modify, suspend, or terminate our plan for any reason upon 10 days’ written notice to the participants. The purchase price per share pursuant to our DRP is equivalent to the estimated value per share approved by our board of directors and in effect on the date of purchase of shares under the plan. In conjunction with the board of directors’ declaration of a new estimated value per share of our common stock on January 15, 2024, any shares sold pursuant to our distribution reinvestment plan will be sold at our new estimated value per share of $15.25 per Class A Share and Class T Share. Please see the section below titled “Suspension and Partial Resumption of DRP and SRP” for additional information. As of December 31, 2023, we had sold approximately 8.2 million Class A Shares and approximately 1.1 million Class T Shares through our DRP Offering.
As described in Note 2 – Summary of Significant Accounting Policies- Redeemable Common Stock, we have an SRP. Please refer to that section for additional details. Pursuant to the SRP, we may redeem the shares of stock presented for redemption for cash to the extent that such requests comply with the below terms of our SRP and we have sufficient funds available to fund such redemption. All redemption requests received, and not withdrawn, on or prior to the last day of the applicable quarter are processed on the last business day of the month following the end of the quarter in which the redemption requests were received.
Our board of directors may amend, suspend or terminate the SRP with 30 days’ notice to our stockholders. We may provide this notice by including such information in a Current Report on Form
8-K
or in our annual or quarterly reports, all publicly filed with the SEC, or by a separate mailing to our stockholders.
On August 20, 2020, our board of directors amended the terms of the SRP to revise the redemption price per share for all redemptions under the SRP to be equal to the most recently published estimated net asset value per share of the applicable share class (the “SRP Amendment”). Prior to the SRP Amendment, the redemption
F-67
SMARTSTOP SELF STORAGE REIT, INC. AND SUBSIDIARIES
NOTES TO CONSOLIDATED FINANCIAL STATEMENTS
December 31, 2023, 2022 and 2021
amount was the lesser of the amount the stockholders paid for their shares or the price per share in the current offering. On January 15, 2024, we declared a new estimated net asset value per share and the redemption price under our SRP immediately changed to $15.25 (our current estimated net asset value per share).
There are several limitations in addition to those noted above on our ability to redeem shares under the SRP including, but not limited to:
| | • | | During any calendar year, we will not redeem in excess of 5% of the weighted-average number of shares outstanding during the prior calendar year. |
| | • | | The amount available for redemption is limited to the proceeds from the sale of shares pursuant to our distribution reinvestment plan, less any prior redemptions. |
| | • | | We have no obligation to redeem shares if the redemption would violate the restrictions on distributions under Maryland law, which prohibits distributions that would cause a corporation to fail to meet statutory tests of solvency. |
During the year ended December 31, 2023, approximately 1.5 million shares or $22.9 million of requests that met the eligibility criteria were requested to be redeemed; approximately $19.0 million of which were fulfilled during the year ended December 31, 2023, and approximately $3.9 million of which were included in accounts payable and accrued liabilities within our consolidated balance sheets as of December 31, 2023 and fulfilled in January 2024.
For the year ended December 31, 2022, we received redemption requests totaling approximately $2.4 million (approximately 0.2 million shares). Due to the complete suspension of our SRP at such time we were unable to honor redemption requests made during the year ended December 31, 2022.
For the year ended December 31, 2021, we received redemption requests totaling approximately $5.6 million (approximately 0.4 million shares), approximately $3.9 million of which were fulfilled during the year ended December 31, 2021, with the remaining approximately $1.7 million included in accounts payable and accrued liabilities as of December 31, 2021 and fulfilled in January 2022.
Please see the section below titled “Suspension and Partial Resumption of DRP and SRP” for additional information.
Suspension and Partial Resumption of DRP and SRP
In connection with a review of liquidity alternatives by the Board, on March 7, 2022, the Board approved the full suspension of our DRP and SRP. However, on March 16, 2023, the DRP was fully reinstated and the SRP was partially reinstated to allow for redemptions solely sought in connection with a stockholder’s death, “qualifying disability” (as that term is defined in the SRP), confinement to a long-term care facility, or other exigent circumstances. All other redemptions remain suspended at this time. All previously received and reconfirmed redemption requests, along with such requests received during the three months ended March 31, 2023 that correctly met the eligibility criteria above, were redeemed in April 2023, in accordance with the SRP.
For those stockholders that had elected to participate in the DRP prior to its suspension in March 2022, distributions automatically reverted back to being reinvested through the DRP effective for the month of March 2023 (to the extent we are qualified to offer shares pursuant to the DRP in accordance with applicable state laws).
F-68
SMARTSTOP SELF STORAGE REIT, INC. AND SUBSIDIARIES
NOTES TO CONSOLIDATED FINANCIAL STATEMENTS
December 31, 2023, 2022 and 2021
Operating Partnership Redemption Rights
Generally, the limited partners of our Operating Partnership, have the right to cause our Operating Partnership to redeem their limited partnership units for cash equal to the value of an equivalent number of our shares, or, at our option, we may purchase their limited partnership units by issuing one share of our common stock for each limited partnership unit redeemed. These rights may not be exercised under certain circumstances that could cause us to lose our REIT election. Furthermore, limited partners may exercise their redemption rights only after their limited partnership units have been outstanding for one year.
Additionally, the
Class A-1
Units issued in connection with the Self Administration Transaction are subject to the general restrictions on transfer contained in the Operating Partnership Agreement. The
Class A-1
Units are otherwise entitled to all rights and duties of the Class A limited partnership units in the Operating Partnership, including cash distributions and the allocation of any profits or losses in the Operating Partnership.
Other Contingencies and Commitments
We have severance arrangements which cover certain members of our management team; these provide for severance payments upon certain events, including after a change of control.
See Note 10 – Related Party Transactions related to our debt investments in the Managed REITs and our Sponsor Funding Agreement with SST VI for more information about our contingent obligations under these agreements.
As of December 31, 2023, pursuant to various contractual relationships, we are required to make other
non-cancellable
payments in the amounts of approximately $3.1 million during the year ending December 31, 2024.
From time to time, we are party to legal, regulatory and other proceedings that arise in the ordinary course of our business. In accordance with applicable accounting guidance, management accrues an estimated liability when those matters present loss contingencies that are both probable and reasonably estimable. In such cases, there may be an exposure to loss in excess of any amounts accrued. For such proceedings, we are not aware of any for which the outcome is reasonably likely to have a material adverse effect on our results of operations or financial condition.
In connection with a fire that occurred at one of our properties, a neighboring property was also damaged. In December 2023, we, along with our insurance carrier, received a subrogation demand letter from an attorney representing the insurance company for the neighboring property owner for approximately $8.3 million alleging that we were responsible for their damages. We intend to vigorously defend this matter. We believe we have adequate insurance coverage for this matter.
Note 13. Declaration of Distributions
On January 26, 2024, our board of directors declared a distribution rate for the month of February 2024 of approximately $0.0475 per share on the outstanding shares of common stock payable to Class A and Class T stockholders of record of such shares as shown on our books at the close of business on February 29, 2024. Such distributions payable to each stockholder of record will be paid the following month.
On February 28, 2024, our board of directors declared a distribution rate for the month of March 2024 of approximately $0.0508 per share on the outstanding shares of common stock payable to Class A and Class T stockholders of record of such shares as shown on our books at the close of business on March 31, 2024. Such distributions payable to each stockholder of record will be paid the following month.
F-69
SMARTSTOP SELF STORAGE REIT, INC. AND SUBSIDIARIES
NOTES TO CONSOLIDATED FINANCIAL STATEMENTS
December 31, 2023, 2022 and 2021
Note 14. Subsequent Events
In addition to the subsequent events discussed elsewhere in the notes to the financial statements, the following events occurred subsequent to December 31, 2023:
Subsequent to December 31, 2023, the compensation committee of our board of directors approved the 2024 executive compensation terms for our executives, which included (1) performance-based equity grants in the form of either, at the election of the executive, restricted stock awards or LTIP Units, and (2) time-based equity grants in the form of either, at the election of the executive, restricted stock awards or LTIP Units.
In March 2024, an aggregate of 270,096 LTIP Units were issued to our executive officers in connection with performance-based equity grants. With respect to performance-based equity grants, the number of LTIP Units granted as of the grant date was equal 200% of the targeted award. These are
non-vested
grants which shall vest based on ranges from a threshold of 0% to a maximum of 200% of the targeted equity award set for each executive by the compensation committee, with such percentage being determined based upon our ranking as compared to a peer group of publicly traded self storage REITs in terms of the average same-store revenue growth, analyzed over a three-year period.
Similarly, in March 2024, an aggregate of 274,183 LTIP Units were issued to our executive officers in connection with time-based equity grants. These are
non-vested
grants which shall vest ratably over four years, with the first tranche vesting on December 31, 2024, subject to the recipient’s continued employment through the applicable vesting date.
On February 22, 2024, we through our Operating Partnership (the “Borrower”), entered into an amended and restated revolving credit facility with KeyBank, National Association, as administrative agent and collateral agent, certain others listed as joint book runners, joint lead arrangers, syndication agents and documentation agents, and certain other lenders party thereto. The 2024 Credit Facility replaces the credit facility the Company entered into on March 17, 2021, and has a maturity date of February 22, 2027.
The aggregate amount of the 2024 Credit Facility is $650 million. The Borrower has the right to increase the amount available under the 2024 Credit Facility by an additional $850 million, for a total potential maximum aggregate amount of $1.5 billion, subject to certain conditions. The 2024 Credit Facility also includes sublimits of (a) up to $25 million for letters of credit and (b) up to $25
million for swingline loans; each of these sublimits are part of, and not in addition to, the amounts available under the 2024 Credit Facility. Borrowings under the 2024 Credit Facility may be in either U.S. dollars or Canadian dollars. Upon the closing of the 2024 Credit Facility, we immediately drew down an aggregate amount of $
576
million, which was used primarily to pay off the amounts outstanding under the Credit Facility.
The maturity date of the 2024 Credit Facility is February 22, 2027, subject to a one-year extension option, subject to the payment of an extension fee of 0.20% on the aggregate amount of the then-outstanding revolving commitments for such extension, and it may be prepaid or terminated at any time without penalty; provided, however, that the lenders shall be indemnified for certain breakage costs.
Amounts borrowed under the 2024 Credit Facility bear interest based on the type of borrowing (either Base Rate Loans, Daily Simple SOFR Loans, Term SOFR Loans or CORRA Loans, each as defined in the 2024 Credit
F-70
SMARTSTOP SELF STORAGE REIT, INC. AND SUBSIDIARIES
NOTES TO CONSOLIDATED FINANCIAL STATEMENTS
December 31, 2023, 2022 and 2021
Facility). Base Rate Loans bear interest at the lesser of (x) the Base Rate (as defined in the 2024 Credit Facility) plus the applicable rate, or (y) the maximum rate. Daily Simple SOFR Loans bear interest at the lesser of (a) Adjusted Daily Simple SOFR (as defined in the 2024 Credit Facility) plus the applicable rate, or (b) the maximum rate. Term SOFR Loans bear interest at the lesser of (a) Term SOFR (as defined in the 2024 Credit Facility) for the interest period in effect plus the applicable rate, or (b) the maximum rate. CORRA Loans bear interest at the lesser of (a) Adjusted Daily Simple CORRA (as defined in the 2024 Credit Facility) plus the applicable rate, or (b) the maximum rate. The corresponding applicable rate varies between (i) prior to a Security Interest Termination Event (defined below), 165 basis points to 230 basis points for Daily Simple SOFR Loans, Term SOFR Loans and CORRA Loans and between 65 basis points and 130 basis points for Base Rate Loans, in each case of this clause (i), depending on the consolidated leverage ratio of the Company and (ii) following a Security Interest Termination Event, 140 basis points to 225 basis points for Daily Simple SOFR Loans, Term SOFR Loans and CORRA Loans and between 40 basis points and 125 basis points for Base Rate Loans, in each case of this clause (ii), depending on the consolidated capitalization rate leverage ratio of the Company. Initial advances under the 2024 Credit Facility are Daily Simple SOFR Loans that bear interest at 175 basis points over Adjusted Daily Simple SOFR. The 2024 Credit Facility is also subject to an annual unused fee based upon the average amount of the unused portion of the 2024 Credit Facility, which varies from 15 bps to 25 bps, depending on the size of the unused amount, as well as whether a Security Interest Termination Event has occurred.
The 2024 Credit Facility is fully recourse, jointly and severally, to us, the Borrower, and certain of our subsidiaries (the “Subsidiary Guarantors”). In connection with the 2024 Credit Facility, we, the Borrower and the Subsidiary Guarantors executed guarantees in favor of the lenders. It is an event of default under the 2024 Credit Facility if (a) there is a payment default by us, the Borrower or any Subsidiary Guarantor under any recourse debt for borrowed money, (b) there is a payment default by us or any of its subsidiaries under any non-recourse debt of at least $75 million or (c) prior to a Security Interest Termination Event, an event of default occurs under the 2032 Private Placement Notes.
The 2024 Credit Facility is initially secured by a pledge of equity interests in the Subsidiary Guarantors. However, upon the achievement of certain security interest termination conditions, the pledges shall be released and the 2024 Credit Facility shall become unsecured (the “Security Interest Termination Event”). The Security Interest Termination Event occurs at the Borrower’s election, once the Borrower satisfies all of the following security interest termination conditions: (i) a fixed charge coverage ratio of no less than 1.50:1.00; (ii) an unsecured interest coverage ratio of not less than 2.00:1.00; (iii) a consolidated capitalization rate leverage ratio of not greater than 60%; and (iv) a secured debt ratio of no greater than 40%. Following the occurrence of the Security Interest Termination Event, certain terms and conditions of the 2024 Credit Facility are modified, including, but not limited to: (i) in certain circumstances, a reduction in the applicable rate under the 2024 Credit Facility, (ii) the modification or addition of certain financial covenants, (iii) the addition of a floor of at least $25 million for any cross-defaulted recourse debt of us, Borrower or any Subsidiary Guarantor, and (iv) in certain circumstances, a reduction in the annual unused fee for the 2024 Credit Facility. The outstanding 2032 Private Placement Notes previously issued by us remain pari passu with the 2024 Credit Facility.
The 2024 Credit Facility contains certain customary representations and warranties, affirmative, negative and financial covenants, borrowing conditions, and events of default. In particular, the financial covenants imposed on us include: a maximum leverage ratio, a minimum fixed charge coverage ratio, a minimum tangible net worth, certain limits on both secured debt and secured recourse debt, certain payout ratios of dividends paid to adjusted funds from operations, limits on unhedged variable rate debt, and minimum liquidity. If an event of default occurs and continues, the Borrower is subject to certain actions by the administrative agent, including, without limitation, the acceleration of repayment of all amounts outstanding under the 2024 Credit Facility.
F-71
SMARTSTOP SELF STORAGE REIT, INC. AND SUBSIDIARIES
NOTES TO CONSOLIDATED FINANCIAL STATEMENTS
December 31, 2023, 2022 and 2021
On March 7, 2024, we, through five of our wholly-owned Canadian subsidiaries (the “2027 NBC Loan Borrowers”), entered into the 2027 NBC Loan with National Bank of Canada (“NBC”) as administrative agent, National Bank Financial as lead arranger and sole bookrunner, and certain other lenders party thereto. The 2027 NBC Loan has aggregate borrowings of $75 million CAD and is secured by the five properties owned by the 2027 NBC Loan Borrowers (the “Secured NBC Properties”). Previously, four of the Secured NBC Properties were included in the borrowing base of the 2024 Credit Facility, and the other property was previously unencumbered. The net proceeds from the 2027 NBC Loan were used to pay down the 2024 Credit Facility by approximately $55.1 million USD, and accordingly, the respective four properties were released as collateral from the 2024 Credit Facility.
The 2027 NBC Loan has a maturity date of March 7, 2027, which may be extended for additional one-year periods in the sole discretion of the lenders. The 2027 NBC Loan carries a variable interest rate based on either the Canadian Overnight Repo Rate Average (“CORRA”) or the Canadian Prime Rate. Subsequent to the closing of the loan, we entered into an interest rate swap agreement based on CORRA with NBC whereby, inclusive of the swap we fixed the interest rate on the NBC loan at 6.42% for the initial three-year term of the loan. The 2027 NBC Loan requires monthly amortizing principal and interest payments, which are based on a 25-year
amortization schedule. The 2027 NBC Loan may be prepaid, in whole or in part, at any time upon prior written notice to the lenders, subject to interest rate swap breakage costs. SmartStop and the 2027 NBC Loan Borrowers provided an indemnity in favor of NBC and the lenders for certain environmental matters. SmartStop serves as a non-recourse guarantor, and each borrower provided a limited recourse guaranty up to the amount of the collateral pledged by it, under the 2027 NBC Loan.
F-72
SMARTSTOP SELF STORAGE REIT, INC. AND SUBSIDIARIES
REAL ESTATE AND ACCUMULATED DEPRECIATION
| | | | | | | | | | | | | | | | | | | | | | | | | | | | | | | | | | | | | | | | | | | | | | | | | | | | |
| | | | | | | | | | | | | | | | | Gross Carrying Amount at December 31, 2023 | | | | | | |
| | | | | | | | | | | | | | | | | | | Cost
Capitalized
Subsequent
to Acquisition | | | | | | | | | | | | | | | | | | | | | |
| | NC | | $ | — | | | | (4 | ) | | $ | 531,000 | | | $ | 1,891,000 | | | $ | 2,422,000 | | | $ | 204,262 | | | | | | | $ | 531,000 | | | $ | 2,095,262 | | | $ | 2,626,262 | | | $ | 737,615 | | | 2004 | | | 11/3/2014 | |
| | NC | | | — | | | | (4 | ) | | | 1,064,000 | | | | 3,301,000 | | | | 4,365,000 | | | | 246,799 | | | | | | | | 1,064,000 | | | | 3,547,799 | | | | 4,611,799 | | | | 1,193,325 | | | 1998/2005/2006 | | | 11/3/2014 | |
| | NC | | | — | | | | (4 | ) | | | 1,186,000 | | | | 2,540,000 | | | | 3,726,000 | | | | 406,388 | | | | | | | | 1,186,000 | | | | 2,946,388 | | | | 4,132,388 | | | | 1,186,621 | | | 1999 | | | 11/3/2014 | |
| | SC | | | 8,491,387 | | | | | | | | 1,482,000 | | | | 4,476,000 | | | | 5,958,000 | | | | 594,921 | | | | | | | | 1,482,000 | | | | 5,070,921 | | | | 6,552,921 | | | | 1,803,902 | | | 1998/2005-2007 | | | 11/3/2014 | |
| | SC | | | 6,736,055 | | | | | | | | 1,690,000 | | | | 3,654,000 | | | | 5,344,000 | | | | 417,346 | | | | | | | | 1,690,000 | | | | 4,071,346 | | | | 5,761,346 | | | | 1,481,757 | | | 1999/2006 | | | 11/3/2014 | |
| | CA | | | 4,410,797 | | | | | | | | 2,730,000 | | | | 2,916,875 | | | | 5,646,875 | | | | 798,587 | | | | | | | | 2,730,000 | | | | 3,715,462 | | | | 6,445,462 | | | | 1,459,349 | | | 1989 | | | 2/19/2015 | |
| | CA | | | 3,035,690 | | | | | | | | 1,950,000 | | | | 2,036,875 | | | | 3,986,875 | | | | 347,921 | | | | | | | | 1,950,000 | | | | 2,384,796 | | | | 4,334,796 | | | | 997,415 | | | 1986 | | | 1/23/2015 | |
| | CA | | | 4,980,162 | | | | | | | | 4,890,000 | | | | 4,006,875 | | | | 8,896,875 | | | | 773,196 | | | | | | | | 4,890,000 | | | | 4,780,071 | | | | 9,670,071 | | | | 1,874,392 | | | 1978 | | | 2/5/2015 | |
| | CA | | | 3,462,515 | | | | | | | | 2,950,000 | | | | 3,016,875 | | | | 5,966,875 | | | | 671,720 | | | | | | | | 2,950,000 | | | | 3,688,595 | | | | 6,638,595 | | | | 1,481,899 | | | 1979 | | | 1/29/2015 | |
| | CA | | | 3,509,632 | | | | | | | | 2,060,000 | | | | 2,356,875 | | | | 4,416,875 | | | | 652,209 | | | | | | | | 2,060,000 | | | | 3,009,084 | | | | 5,069,084 | | | | 1,083,270 | | | 1981 | | | 2/5/2015 | |
| | CA | | | 2,466,324 | | | | | | | | 2,020,000 | | | | 2,216,875 | | | | 4,236,875 | | | | 409,452 | | | | | | | | 2,020,000 | | | | 2,626,327 | | | | 4,646,327 | | | | 915,642 | | | 1987 | | | 2/5/2015 | |
| | CA | | | 6,687,464 | | | | | | | | 5,460,000 | | | | 4,856,875 | | | | 10,316,875 | | | | 584,318 | | | | | | | | 5,460,000 | | | | 5,441,193 | | | | 10,901,193 | | | | 2,022,602 | | | 1986 | | | 2/5/2015 | |
| | CA | | | 1,114,775 | | | | | | | | 400,000 | | | | 1,336,875 | | | | 1,736,875 | | | | 381,448 | | | | | | | | 400,000 | | | | 1,718,323 | | | | 2,118,323 | | | | 681,919 | | | 1984 | | | 1/23/2015 | |
| | CA | | | 1,612,673 | | | | | | | | 200,000 | | | | 1,516,875 | | | | 1,716,875 | | | | 544,234 | | | | | | | | 200,000 | | | | 2,061,109 | | | | 2,261,109 | | | | 892,759 | | | 1980 | | | 1/29/2015 | |
| | CA | | | 2,229,155 | | | | | | | | 370,000 | | | | 2,326,875 | | | | 2,696,875 | | | | 748,493 | | | | | | | | 370,000 | | | | 3,075,368 | | | | 3,445,368 | | | | 1,176,983 | | | 1985 | | | 1/23/2015 | |
| | CA | | | 2,632,422 | | | | | | | | 730,000 | | | | 2,946,875 | | | | 3,676,875 | | | | 341,851 | | | | | | | | 730,000 | | | | 3,288,726 | | | | 4,018,726 | | | | 1,184,547 | | | 1984 | | | 1/23/2015 | |
| | CA | | | 2,703,494 | | | | | | | | 1,000,000 | | | | 2,746,875 | | | | 3,746,875 | | | | 390,081 | | | | | | | | 1,000,000 | | | | 3,136,956 | | | | 4,136,956 | | | | 1,098,707 | | | 1982 | | | 2/5/2015 | |
| | CA | | | 7,019,659 | | | | | | | | 3,150,000 | | | | 6,716,875 | | | | 9,866,875 | | | | 856,964 | | | | | | | | 3,150,000 | | | | 7,573,839 | | | | 10,723,839 | | | | 2,751,264 | | | 1979-1981 | | | 1/29/2015 | |
| | CA | | | — | | | | (4 | ) | | | 990,000 | | | | 3,946,875 | | | | 4,936,875 | | | | 541,542 | | | | | | | | 990,000 | | | | 4,488,417 | | | | 5,478,417 | | | | 1,573,334 | | | 1981 | | | 1/29/2015 | |
| | CO | | | 2,276,668 | | | | | | | | 1,100,000 | | | | 3,346,875 | | | | 4,446,875 | | | | 418,963 | | | | | | | | 1,100,000 | | | | 3,765,838 | | | | 4,865,838 | | | | 1,595,901 | | | 1983 | | | 1/29/2015 | |
| | CO | | | 4,600,849 | | | | | | | | 810,000 | | | | 5,906,875 | | | | 6,716,875 | | | | 951,997 | | | | | | | | 810,000 | | | | 6,858,872 | | | | 7,668,872 | | | | 2,526,863 | | | 1984 | | | 2/5/2015 | |
| | CO | | | 2,087,011 | | | | | | | | 1,680,000 | | | | 2,456,875 | | | | 4,136,875 | | | | 388,618 | | | | | | | | 1,680,000 | | | | 2,845,493 | | | | 4,525,493 | | | | 1,103,970 | | | 1985 | | | 1/23/2015 | |
| | IL | | | 2,276,668 | | | | | | | | 810,000 | | | | 3,856,874 | | | | 4,666,874 | | | | 530,883 | | | | | | | | 810,000 | | | | 4,387,757 | | | | 5,197,757 | | | | 1,572,874 | | | 1987 | | | 2/19/2015 | |
| | IL | | | 1,565,160 | | | | | | | | 250,000 | | | | 2,096,875 | | | | 2,346,875 | | | | 438,121 | | | | | | | | 250,000 | | | | 2,534,996 | | | | 2,784,996 | | | | 991,115 | | | 1987 | | | 1/23/2015 | |
| | MD | | | 3,319,976 | | | | | | | | 1,940,000 | | | | 4,346,875 | | | | 6,286,875 | | | | 1,167,003 | | | | | | | | 1,940,000 | | | | 5,513,878 | | | | 7,453,878 | | | | 2,374,972 | | | 1988 | | | 1/23/2015 | |
| | MI | | | 1,873,401 | | | | | | | | 230,000 | | | | 2,966,875 | | | | 3,196,875 | | | | 627,470 | | | | | | | | 230,000 | | | | 3,594,345 | | | | 3,824,345 | | | | 1,357,803 | | | 1996 | | | 5/8/2015 | |
| | MI | | | 2,205,597 | | | | | | | | 250,000 | | | | 3,286,875 | | | | 3,536,875 | | | | 938,423 | | | | | | | | 250,000 | | | | 4,225,298 | | | | 4,475,298 | | | | 1,518,388 | | | 1977 | | | 5/21/2015 | |
| | MI | | | 3,272,859 | | | | | | | | 240,000 | | | | 4,176,875 | | | | 4,416,875 | | | | 483,088 | | | | | | | | 240,000 | | | | 4,659,963 | | | | 4,899,963 | | | | 1,667,907 | | | 1988 | | | 5/8/2015 | |
| | MI | | | 2,158,084 | | | | | | | | 240,000 | | | | 3,066,875 | | | | 3,306,875 | | | | 748,969 | | | | | | | | 240,000 | | | | 3,815,844 | | | | 4,055,844 | | | | 1,458,534 | | | 1987 | | | 5/8/2015 | |
| | NJ | | | 1,327,991 | | | | | | | | 400,000 | | | | 1,696,875 | | | | 2,096,875 | | | | 397,455 | | | | | | | | 400,000 | | | | 2,094,330 | | | | 2,494,330 | | | | 732,300 | | | 1988 | | | 5/28/2015 | |
| | WA | | | 2,608,468 | | | | | | | | 2,010,000 | | | | 2,956,875 | | | | 4,966,875 | | | | 845,670 | | | | | | | | 2,010,000 | | | | 3,802,545 | | | | 5,812,545 | | | | 1,358,108 | | | 1986 | | | 2/5/2015 | |
| | AL | | | 3,960,413 | | | | | | | | 1,839,000 | | | | 5,717,000 | | | | 7,556,000 | | | | 997,763 | | | | | | | | 1,839,000 | | | | 6,714,763 | | | | 8,553,763 | | | | 2,356,794 | | | 1985/1996/2006 | | | 9/11/2015 | |
| | FL | | | 1,565,160 | | | | | | | | 718,244 | | | | 2,257,471 | | | | 2,975,715 | | | | 651,284 | | | | | | | | 718,244 | | | | 2,908,755 | | | | 3,626,999 | | | | 995,634 | | | 1985 | | | 11/3/2015 | |
| | FL | | | 7,825,798 | | | | | | | | 1,983,491 | | | | 15,232,817 | | | | 17,216,308 | | | | 606,131 | | | | | | | | 1,983,491 | | | | 15,838,948 | | | | 17,822,439 | | | | 3,888,762 | | | 2004 | | | 1/7/2016 | |
| | CA | | | 2,253,110 | | | | | | | | 670,392 | | | | 3,711,424 | | | | 4,381,816 | | | | 407,827 | | | | | | | | 670,392 | | | | 4,119,251 | | | | 4,789,643 | | | | 1,297,463 | | | 1991 | | | 1/11/2016 | |
| | ONT | | | 8,493,418 | | | | | | | | 1,452,870 | | | | 7,929,810 | | | | 9,382,680 | | | | 879,821 | | | | (3 | ) | | | 1,523,120 | | | | 8,739,381 | | | | 10,262,501 | | | | 2,190,939 | | | 2006 | | | 2/11/2016 | |
| | ONT | | | 10,643,927 | | | | | | | | 3,293,267 | | | | 10,278,861 | | | | 13,572,128 | | | | 1,367,312 | | | | (3 | ) | | | 3,452,505 | | | | 11,486,935 | | | | 14,939,440 | | | | 2,850,818 | | | 2011 | | | 2/11/2016 | |
| | ONT | | | 12,841,958 | | | | | | | | 2,655,215 | | | | 13,072,458 | | | | 15,727,673 | | | | 5,409,226 | | | | (3 | ) | | | 2,783,601 | | | | 18,353,298 | | | | 21,136,899 | | | | 4,071,978 | | | 2016 | | | 2/11/2016 | |
| | ONT | | | — | | | | (4 | ) | | | 2,983,307 | | | | 9,346,283 | | | | 12,329,590 | | | | 595,954 | | | | (3 | ) | | | 3,041,574 | | | | 9,883,970 | | | | 12,925,544 | | | | 2,587,886 | | | 2004 | | | 2/29/2016 | |
| | ONT | | | — | | | | (4 | ) | | | 2,944,035 | | | | 5,125,839 | | | | 8,069,874 | | | | 428,292 | | | | (3 | ) | | | 3,001,535 | | | | 5,496,631 | | | | 8,498,166 | | | | 1,439,217 | | | 2008 | | | 2/29/2016 | |
| | OH | | | — | | | | (4 | ) | | | 275,493 | | | | 2,664,693 | | | | 2,940,186 | | | | 184,631 | | | | | | | | 275,493 | | | | 2,849,324 | | | | 3,124,817 | | | | 898,678 | | | 2003 | | | 4/20/2016 | |
| | OH | | | — | | | | (4 | ) | | | 255,246 | | | | 1,806,349 | | | | 2,061,595 | | | | 242,591 | | | | | | | | 255,246 | | | | 2,048,940 | | | | 2,304,186 | | | | 938,106 | | | 2003 | | | 4/20/2016 | |
| | OH | | | — | | | | (4 | ) | | | 150,666 | | | | 2,596,010 | | | | 2,746,676 | | | | 206,114 | | | | | | | | 150,666 | | | | 2,802,124 | | | | 2,952,790 | | | | 1,003,595 | | | 2003 | | | 4/20/2016 | |
F-73
| | | | | | | | | | | | | | | | | | | | | | | | | | | | | | | | | | | | | | | | | | | | | | | | | | | | |
| | | | | | | | | | | | | | | | | Gross Carrying Amount at December 31, 2023 | | | | | | |
| | | | | | | | | | | | | | | | | | | Cost
Capitalized
Subsequent
to Acquisition | | | | | | | | | | | | | | | | | | | | | |
| | OH | | | — | | | | (4 | ) | | | 82,598 | | | | 1,909,466 | | | | 1,992,064 | | | | 214,748 | | | | | | | | 82,598 | | | | 2,124,214 | | | | 2,206,812 | | | | 672,123 | | | 2003 | | | 4/20/2016 | |
| | OH | | | — | | | | (4 | ) | | | 255,456 | | | | 1,882,203 | | | | 2,137,659 | | | | 202,110 | | | | | | | | 255,456 | | | | 2,084,313 | | | | 2,339,769 | | | | 673,119 | | | 2003 | | | 4/20/2016 | |
| | IN | | | — | | | | (4 | ) | | | 223,159 | | | | 2,944,379 | | | | 3,167,538 | | | | 229,866 | | | | | | | | 223,159 | | | | 3,174,245 | | | | 3,397,404 | | | | 1,054,832 | | | 2003 | | | 4/20/2016 | |
| | IN | | | — | | | | (4 | ) | | | 155,533 | | | | 1,652,290 | | | | 1,807,823 | | | | 157,593 | | | | | | | | 155,533 | | | | 1,809,883 | | | | 1,965,416 | | | | 594,365 | | | 2003 | | | 4/20/2016 | |
| | FL | | | — | | | | (4 | ) | | | 2,589,781 | | | | 6,339,578 | | | | 8,929,359 | | | | 317,750 | | | | | | | | 2,589,781 | | | | 6,657,328 | | | | 9,247,109 | | | | 1,838,345 | | | 1999 | | | 4/29/2016 | |
| | CA | | | — | | | | (4 | ) | | | 1,205,209 | | | | 6,616,767 | | | | 7,821,976 | | | | 364,488 | | | | | | | | 991,287 | | | | 7,195,177 | | | | 8,186,464 | | | | 1,803,889 | | | 2006 | | | 5/9/2016 | |
| | CA | | | — | | | | (4 | ) | | | 5,711,189 | | | | 6,902,446 | | | | 12,613,635 | | | | 385,699 | | | | | | | | 5,711,189 | | | | 7,288,145 | | | | 12,999,334 | | | | 1,846,755 | | | 1979 | | | 5/18/2016 | |
| | CA | | | — | | | | (4 | ) | | | 19,090,003 | | | | 17,202,868 | | | | 36,292,871 | | | | 1,216,315 | | | | | | | | 19,090,003 | | | | 18,419,183 | | | | 37,509,186 | | | | 4,733,552 | | | 1988/1998 | | | 5/18/2016 | |
| | FL | | | 8,342,710 | | | | | | | | 3,947,715 | | | | 16,656,002 | | | | 20,603,717 | | | | 381,234 | | | | | | | | 3,947,715 | | | | 17,037,236 | | | | 20,984,951 | | | | 3,909,595 | | | 1979 | | | 6/1/2016 | |
| | FL | | | 10,075,901 | | | | | | | | 12,108,208 | | | | 10,804,173 | | | | 22,912,381 | | | | (304,434 | ) | | | | | | | 12,108,208 | | | | 10,499,739 | | | | 22,607,947 | | | | 3,451,312 | | | 1998/2003 | | | 6/1/2016 | |
| | FL | | | 11,290,419 | | | | | | | | 16,029,881 | | | | 10,556,833 | | | | 26,586,714 | | | | 421,436 | | | | | | | | 16,029,881 | | | | 10,978,269 | | | | 27,008,150 | | | | 2,928,339 | | | 1992/2012 | | | 6/1/2016 | |
| | FL | | | 9,472,082 | | | | | | | | 11,425,394 | | | | 13,275,322 | | | | 24,700,716 | | | | 397,447 | | | | | | | | 11,425,394 | | | | 13,672,769 | | | | 25,098,163 | | | | 4,067,177 | | | 2001/2003 | | | 6/1/2016 | |
| | FL | | | 6,897,272 | | | | | | | | 5,130,621 | | | | 8,410,474 | | | | 13,541,095 | | | | 460,939 | | | | | | | | 5,130,621 | | | | 8,871,413 | | | | 14,002,034 | | | | 2,526,569 | | | 2002 | | | 6/1/2016 | |
| | FL | | | — | | | | (4 | ) | | | 10,233,511 | | | | 11,662,801 | | | | 21,896,312 | | | | 369,080 | | | | | | | | 10,233,511 | | | | 12,031,881 | | | | 22,265,392 | | | | 2,972,352 | | | 2005 | | | 6/1/2016 | |
| | FL | | | — | | | | (4 | ) | | | 11,335,658 | | | | 11,485,045 | | | | 22,820,703 | | | | 456,278 | | | | | | | | 11,335,658 | | | | 11,941,323 | | | | 23,276,981 | | | | 3,018,459 | | | 1998 | | | 6/1/2016 | |
| | FL | | | 15,267,178 | | | | | | | | 12,989,079 | | | | 19,224,919 | | | | 32,213,998 | | | | 863,346 | | | | | | | | 12,989,079 | | | | 20,088,265 | | | | 33,077,344 | | | | 4,962,866 | | | 2002/2012 | | | 6/1/2016 | |
| | FL | | | — | | | | (4 | ) | | | 11,789,085 | | | | 12,771,305 | | | | 24,560,390 | | | | 403,545 | | | | | | | | 11,789,085 | | | | 13,174,850 | | | | 24,963,935 | | | | 3,219,678 | | | 2002 | | | 6/1/2016 | |
| | FL | | | 11,569,885 | | | | | | | | 17,096,692 | | | | 12,983,627 | | | | 30,080,319 | | | | 393,248 | | | | | | | | 17,096,692 | | | | 13,376,875 | | | | 30,473,567 | | | | 3,391,554 | | | 2003 | | | 6/1/2016 | |
| | MD | | | — | | | | (4 | ) | | | 3,897,872 | | | | 22,427,843 | | | | 26,325,715 | | | | 766,965 | | | | | | | | 3,897,872 | | | | 23,194,808 | | | | 27,092,680 | | | | 5,999,593 | | | 1990/2014 | | | 6/1/2016 | |
| | CA | | | 6,795,065 | | | | | | | | 3,468,153 | | | | 3,679,939 | | | | 7,148,092 | | | | 226,397 | | | | | | | | 3,468,153 | | | | 3,906,336 | | | | 7,374,489 | | | | 1,076,857 | | | 1984 | | | 6/14/2016 | |
| | NV | | | 11,158,848 | | | | | | | | 2,391,220 | | | | 11,117,892 | | | | 13,509,112 | | | | 327,197 | | | | | | | | 2,391,220 | | | | 11,445,089 | | | | 13,836,309 | | | | 2,651,647 | | | 2002 | | | 7/28/2016 | |
| | NV | | | 11,207,605 | | | | | | | | 3,840,088 | | | | 9,916,937 | | | | 13,757,025 | | | | 367,608 | | | | | | | | 3,840,088 | | | | 10,284,545 | | | | 14,124,633 | | | | 2,577,231 | | | 2000 | | | 9/23/2016 | |
| | NV | | | 8,474,386 | | | | | | | | 2,565,579 | | | | 6,338,944 | | | | 8,904,523 | | | | 462,220 | | | | | | | | 2,565,579 | | | | 6,801,164 | | | | 9,366,743 | | | | 1,762,564 | | | 1989 | | | 9/27/2016 | |
| | NC | | | — | | | | (4 | ) | | | 3,619,676 | | | | 11,173,603 | | | | 14,793,279 | | | | 534,290 | | | | | | | | 3,619,676 | | | | 11,707,893 | | | | 15,327,569 | | | | 3,017,521 | | | 1988/2005/2015 | | | 12/30/2016 | |
| | NC | | | — | | | | (4 | ) | | | 1,764,969 | | | | 3,107,311 | | | | 4,872,280 | | | | 280,642 | | | | | | | | 1,764,969 | | | | 3,387,953 | | | | 5,152,922 | | | | 925,111 | | | 1984 | | | 12/30/2016 | |
| | NC | | | — | | | | (4 | ) | | | 1,081,547 | | | | 3,441,204 | | | | 4,522,751 | | | | 275,422 | | | | | | | | 1,081,547 | | | | 3,716,626 | | | | 4,798,173 | | | | 958,428 | | | 1982 | | | 12/30/2016 | |
| | NC | | | — | | | | (4 | ) | | | 5,096,833 | | | | 4,620,013 | | | | 9,716,846 | | | | 298,426 | | | | | | | | 5,096,833 | | | | 4,918,439 | | | | 10,015,272 | | | | 1,404,918 | | | 1991/2002 | | | 12/30/2016 | |
| | NC | | | — | | | | (4 | ) | | | 1,790,118 | | | | 10,265,741 | | | | 12,055,859 | | | | 559,549 | | | | | | | | 1,790,118 | | | | 10,825,290 | | | | 12,615,408 | | | | 2,498,962 | | | 1973 | | | 12/30/2016 | |
| | NC | | | — | | | | (4 | ) | | | 4,558,139 | | | | 4,455,118 | | | | 9,013,257 | | | | 308,653 | | | | | | | | 4,558,139 | | | | 4,763,771 | | | | 9,321,910 | | | | 1,376,190 | | | 1985/1986/2005 | | | 12/30/2016 | |
| | NC | | | — | | | | (4 | ) | | | 2,414,680 | | | | 7,826,417 | | | | 10,241,097 | | | | 436,177 | | | | | | | | 2,414,680 | | | | 8,262,594 | | | | 10,677,274 | | | | 2,122,396 | | | 1978/2009/2014 | | | 12/30/2016 | |
| | NC | | | — | | | | (4 | ) | | | 1,306,240 | | | | 5,121,332 | | | | 6,427,572 | | | | 288,489 | | | | | | | | 1,306,240 | | | | 5,409,821 | | | | 6,716,061 | | | | 1,305,740 | | | 2004 | | | 12/30/2016 | |
| | NC | | | — | | | | (4 | ) | | | 1,764,965 | | | | 6,162,855 | | | | 7,927,820 | | | | 361,209 | | | | | | | | 1,764,965 | | | | 6,524,064 | | | | 8,289,029 | | | | 1,717,579 | | | 1968/2002 | | | 12/30/2016 | |
| | NC | | | — | | | | (4 | ) | | | 2,597,584 | | | | 5,037,350 | | | | 7,634,934 | | | | 357,417 | | | | | | | | 2,597,584 | | | | 5,394,767 | | | | 7,992,351 | | | | 1,635,125 | | | 1989/2003 | | | 12/30/2016 | |
| | NC | | | — | | | | (4 | ) | | | 782,457 | | | | 2,139,791 | | | | 2,922,248 | | | | 98,749 | | | | | | | | 782,457 | | | | 2,238,540 | | | | 3,020,997 | | | | 618,789 | | | 1999 | | | 12/30/2016 | |
| | NC | | | — | | | | | | | | 348,480 | | | | — | | | | 348,480 | | | | — | | | | | | | | 348,480 | | | | — | | | | 348,480 | | | | — | | | N/A | | | 12/30/2016 | |
| | NC | | | — | | | | | | | | 50,000 | | | | — | | | | 50,000 | | | | — | | | | | | | | 50,000 | | | | — | | | | 50,000 | | | | — | | | N/A | | | 12/30/2016 | |
| | CO | | | — | | | | (4 | ) | | | 1,584,664 | | | | 8,196,091 | | | | 9,780,755 | | | | 161,797 | | | | | | | | 1,584,664 | | | | 8,357,888 | | | | 9,942,552 | | | | 2,294,021 | | | 2012 | | | 1/11/2017 | |
| | ONT | | | — | | | | (4 | ) | | | 6,258,511 | | | | 16,287,332 | | | | 22,545,843 | | | | 2,236,451 | | | | (3 | ) | | | 6,688,797 | | | | 18,093,497 | | | | 24,782,294 | | | | 4,071,360 | | | 2015 | | | 2/1/2017 | |
| | ONT | | | 14,237,413 | | | | | | | | 4,657,233 | | | | 14,493,508 | | | | 19,150,741 | | | | 1,726,591 | | | | (3 | ) | | | 4,977,427 | | | | 15,899,905 | | | | 20,877,332 | | | | 3,510,756 | | | 2013 | | | 2/1/2017 | |
| | ONT | | | 10,484,016 | | | | | | | | 4,136,329 | | | | 9,527,410 | | | | 13,663,739 | | | | 1,162,816 | | | | (3 | ) | | | 4,420,711 | | | | 10,405,844 | | | | 14,826,555 | | | | 2,365,007 | | | 2013 | | | 2/1/2017 | |
| | ONT | | | 9,603,748 | | | | | | | | 3,126,446 | | | | 8,701,429 | | | | 11,827,875 | | | | 1,016,132 | | | | (3 | ) | | | 3,341,396 | | | | 9,502,611 | | | | 12,844,007 | | | | 2,046,831 | | | 1998/2016 | | | 2/1/2017 | |
| | ONT | | | 8,172,086 | | | | | | | | 1,714,644 | | | | 11,428,538 | | | | 13,143,182 | | | | 997,911 | | | | (3 | ) | | | 1,832,529 | | | | 12,308,564 | | | | 14,141,093 | | | | 2,588,000 | | | 2016/2017 | | | 2/1/2017 | |
| | FL | | | 8,764,926 | | | | | | | | 1,152,931 | | | | 12,398,306 | | | | 13,551,237 | | | | 523,244 | | | | | | | | 1,152,931 | | | | 12,921,550 | | | | 14,074,481 | | | | 1,985,036 | | | 2008 | | | 1/24/2019 | |
Russell Blvd, Las Vegas II | | NV | | | — | | | | (4 | ) | | | 3,433,634 | | | | 15,449,497 | | | | 18,883,131 | | | | 821,275 | | | | | | | | 3,510,075 | | | | 16,194,331 | | | | 19,704,406 | | | | 3,110,405 | | | 1996 | | | 1/24/2019 | |
| | NV | | | — | | | | (4 | ) | | | 1,975,283 | | | | 12,565,410 | | | | 14,540,693 | | | | 192,404 | | | | | | | | 1,975,283 | | | | 12,757,814 | | | | 14,733,097 | | | | 1,975,267 | | | 1999 | | | 1/24/2019 | |
Airport Rd, Colorado Springs | | CO | | | — | | | | (4 | ) | | | 870,373 | | | | 7,877,813 | | | | 8,748,186 | | | | 365,598 | | | | | | | | 870,373 | | | | 8,243,411 | | | | 9,113,784 | | | | 1,376,544 | | | 1983 | | | 1/24/2019 | |
| | CA | | | — | | | | (4 | ) | | | 1,259,685 | | | | 6,995,794 | | | | 8,255,479 | | | | 469,540 | | | | | | | | 1,259,685 | | | | 7,465,334 | | | | 8,725,019 | | | | 1,309,361 | | | 1980 | | | 1/24/2019 | |
| | CA | | | — | | | | (4 | ) | | | 783,938 | | | | 7,706,492 | | | | 8,490,430 | | | | 223,340 | | | | | | | | 783,938 | | | | 7,929,832 | | | | 8,713,770 | | | | 1,350,085 | | | 1984 | | | 1/24/2019 | |
F-74
| | | | | | | | | | | | | | | | | | | | | | | | | | | | | | | | | | | | | | | | | | | | | | | | | | | | |
| | | | | | | | | | | | | | | | | Gross Carrying Amount at December 31, 2023 | | | | | | |
| | | | | | | | | | | | | | | | | | | Cost
Capitalized
Subsequent
to Acquisition | | | | | | | | | | | | | | | | | | | | | |
| | CA | | | — | | | | (4 | ) | | | 4,384,861 | | | | 9,153,677 | | | | 13,538,538 | | | | 246,750 | | | | | | | | 4,384,861 | | | | 9,400,427 | | | | 13,785,288 | | | | 1,517,193 | | | 1986 | | | 1/24/2019 | |
| | IL | | | — | | | | (4 | ) | | | 964,701 | | | | 5,755,146 | | | | 6,719,847 | | | | 377,480 | | | | | | | | 964,701 | | | | 6,132,626 | | | | 7,097,327 | | | | 1,114,367 | | | 1986 | | | 1/24/2019 | |
| | IL | | | — | | | | (4 | ) | | | 1,162,197 | | | | 2,895,052 | | | | 4,057,249 | | | | 192,690 | | | | | | | | 1,162,197 | | | | 3,087,742 | | | | 4,249,939 | | | | 705,872 | | | 1986 | | | 1/24/2019 | |
| | TX | | | — | | | | (4 | ) | | | 1,602,740 | | | | 9,196,093 | | | | 10,798,833 | | | | 218,000 | | | | | | | | 1,602,740 | | | | 9,414,093 | | | | 11,016,833 | | | | 1,544,570 | | | 1998 | | | 1/24/2019 | |
| | TX | | | — | | | | (4 | ) | | | 1,016,291 | | | | 9,358,519 | | | | 10,374,810 | | | | 243,943 | | | | | | | | 1,016,291 | | | | 9,602,462 | | | | 10,618,753 | | | | 1,644,091 | | | 2001 | | | 1/24/2019 | |
| | CO | | | — | | | | (4 | ) | | | 1,678,141 | | | | 5,958,219 | | | | 7,636,360 | | | | 138,151 | | | | | | | | 1,678,141 | | | | 6,096,370 | | | | 7,774,511 | | | | 1,316,073 | | | 2015 | | | 1/24/2019 | |
| | ONT | | | — | | | | (4 | ) | | | 2,363,127 | | | | 8,154,202 | | | | 10,517,329 | | | | 194,152 | | | | (3 | ) | | | 2,379,849 | | | | 8,331,632 | | | | 10,711,481 | | | | 1,399,339 | | | N/A | | | 1/24/2019 | |
| | ONT | | | 8,496,435 | | | | | | | | 2,714,051 | | | | 5,262,813 | | | | 7,976,864 | | | | 8,308,116 | | | | (3 | ) | | | 2,733,256 | | | | 13,551,724 | | | | 16,284,980 | | | | 1,954,222 | | | 1980 | | | 1/24/2019 | |
| | AZ | | | — | | | | (4 | ) | | | 1,307,289 | | | | 11,385,380 | | | | 12,692,669 | | | | 230,483 | | | | | | | | 1,307,289 | | | | 11,615,863 | | | | 12,923,152 | | | | 1,962,138 | | | 2016 | | | 1/24/2019 | |
3173 Sweeten Creek Rd, Asheville | | NC | | | — | | | | (4 | ) | | | 1,036,164 | | | | 8,764,558 | | | | 9,800,722 | | | | 1,234,645 | | | | | | | | 1,036,164 | | | | 9,999,203 | | | | 11,035,367 | | | | 1,543,948 | | | 1982 | | | 1/24/2019 | |
| | IL | | | — | | | | (4 | ) | | | 2,384,166 | | | | 6,000,071 | | | | 8,384,237 | | | | 1,195,950 | | | | | | | | 2,384,166 | | | | 7,196,021 | | | | 9,580,187 | | | | 1,120,919 | | | 2016 | | | 1/24/2019 | |
| | CA | | | — | | | | (4 | ) | | | 8,076,202 | | | | 13,152,494 | | | | 21,228,696 | | | | 309,129 | | | | | | | | 8,076,202 | | | | 13,461,623 | | | | 21,537,825 | | | | 2,207,622 | | | 2017 | | | 1/24/2019 | |
| | NC | | | — | | | | (4 | ) | | | 1,449,001 | | | | 4,412,039 | | | | 5,861,040 | | | | 319,805 | | | | | | | | 1,449,001 | | | | 4,731,844 | | | | 6,180,845 | | | | 886,708 | | | 1992 | | | 1/24/2019 | |
Highland Center Blvd, Asheville | | NC | | | — | | | | (4 | ) | | | 1,763,875 | | | | 4,823,116 | | | | 6,586,991 | | | | 313,330 | | | | | | | | 1,763,875 | | | | 5,136,446 | | | | 6,900,321 | | | | 924,648 | | | 1994 | | | 1/24/2019 | |
| | FL | | | — | | | | (4 | ) | | | 1,084,165 | | | | 7,359,913 | | | | 8,444,078 | | | | 335,912 | | | | | | | | 1,084,165 | | | | 7,695,825 | | | | 8,779,990 | | | | 1,186,020 | | | 2017 | | | 1/24/2019 | |
| | SC | | | — | | | | (4 | ) | | | 1,054,553 | | | | 5,678,794 | | | | 6,733,347 | | | | 142,561 | | | | | | | | 1,054,553 | | | | 5,821,355 | | | | 6,875,908 | | | | 913,120 | | | 2016 | | | 1/24/2019 | |
| | MA | | | 20,207,278 | | | | | | | | 5,854,837 | | | | 33,210,517 | | | | 39,065,354 | | | | 237,500 | | | | | | | | 5,854,837 | | | | 33,448,017 | | | | 39,302,854 | | | | 5,031,330 | | | 2002 | | | 1/24/2019 | |
| | FL | | | — | | | | (4 | ) | | | 3,146,970 | | | | 14,296,167 | | | | 17,443,137 | | | | 134,235 | | | | | | | | 3,146,970 | | | | 14,430,402 | | | | 17,577,372 | | | | 2,301,962 | | | 2018 | | | 1/24/2019 | |
| | FL | | | — | | | | (4 | ) | | | 1,593,082 | | | | 7,102,271 | | | | 8,695,353 | | | | 3,364,687 | | | | | | | | 2,405,974 | | | | 9,654,066 | | | | 12,060,040 | | | | 1,454,178 | | | 2018 | | | 1/24/2019 | |
| | CA | | | — | | | | (4 | ) | | | 2,120,104 | | | | 15,417,746 | | | | 17,537,850 | | | | 174,364 | | | | | | | | 2,120,104 | | | | 15,592,110 | | | | 17,712,214 | | | | 2,292,218 | | | 2018 | | | 1/24/2019 | |
| | TX | | | — | | | | (4 | ) | | | 2,177,186 | | | | 9,320,876 | | | | 11,498,062 | | | | 267,854 | | | | | | | | 2,101,521 | | | | 9,664,395 | | | | 11,765,916 | | | | 1,509,276 | | | 2016 | | | 1/24/2019 | |
| | NV | | | — | | | | (4 | ) | | | 742,839 | | | | 9,018,717 | | | | 9,761,556 | | | | 107,430 | | | | | | | | 742,839 | | | | 9,126,147 | | | | 9,868,986 | | | | 1,428,655 | | | 2018 | | | 1/24/2019 | |
| | AZ | | | — | | | | (4 | ) | | | 1,379,687 | | | | 9,021,255 | | | | 10,400,942 | | | | 382,006 | | | | | | | | 1,037,750 | | | | 9,745,198 | | | | 10,782,948 | | | | 1,430,440 | | | 2019 | | | 7/11/2019 | |
| | FL | | | 4,009,000 | | | | | | | | 893,648 | | | | 6,969,348 | | | | 7,862,996 | | | | 42,310 | | | | | | | | 893,648 | | | | 7,011,658 | | | | 7,905,306 | | | | 649,898 | | | 1979 | | | 3/17/2021 | |
Emmett F Lowry Expy, Texas City | | TX | | | 5,112,000 | | | | | | | | 940,119 | | | | 8,643,066 | | | | 9,583,185 | | | | 235,006 | | | | | | | | 940,119 | | | | 8,878,072 | | | | 9,818,191 | | | | 805,789 | | | 2010 | | | 3/17/2021 | |
Van Buren Blvd, Riverside II | | CA | | | 3,510,000 | | | | | | | | 2,308,151 | | | | 7,393,117 | | | | 9,701,268 | | | | 225,661 | | | | | | | | 2,308,151 | | | | 7,618,778 | | | | 9,926,929 | | | | 665,377 | | | 1984 | | | 3/17/2021 | |
Las Vegas Blvd, Las Vegas | | NV | | | 5,413,000 | | | | | | | | 922,569 | | | | 11,035,721 | | | | 11,958,290 | | | | 71,220 | | | | | | | | 922,569 | | | | 11,106,941 | | | | 12,029,510 | | | | 928,001 | | | 1996 | | | 3/17/2021 | |
| | FL | | | — | | | | (4 | ) | | | 2,467,683 | | | | 18,647,151 | | | | 21,114,834 | | | | 213,931 | | | | | | | | 2,467,683 | | | | 18,861,082 | | | | 21,328,765 | | | | 1,613,887 | | | 2001 | | | 3/17/2021 | |
| | NV | | | 7,118,000 | | | | | | | | 1,397,045 | | | | 15,193,510 | | | | 16,590,555 | | | | 63,025 | | | | | | | | 1,397,045 | | | | 15,256,535 | | | | 16,653,580 | | | | 1,319,115 | | | 2006 | | | 3/17/2021 | |
Texas Ave, College Station | | TX | | | — | | | | (4 | ) | | | 3,530,460 | | | | 5,583,528 | | | | 9,113,988 | | | | 174,560 | | | | | | | | 3,530,460 | | | | 5,758,088 | | | | 9,288,548 | | | | 576,640 | | | 2004 | | | 3/17/2021 | |
| | WA | | | 6,616,000 | | | | | | | | 5,747,712 | | | | 9,884,313 | | | | 15,632,025 | | | | 243,691 | | | | | | | | 5,747,712 | | | | 10,128,004 | | | | 15,875,716 | | | | 1,025,366 | | | 1990 | | | 3/17/2021 | |
| | TX | | | — | | | | (4 | ) | | | 1,212,751 | | | | 6,423,972 | | | | 7,636,723 | | | | 39,686 | | | | | | | | 1,212,751 | | | | 6,463,658 | | | | 7,676,409 | | | | 568,424 | | | 2003 | | | 3/17/2021 | |
| | TX | | | — | | | | (4 | ) | | | 1,945,532 | | | | 8,905,822 | | | | 10,851,354 | | | | 113,482 | | | | | | | | 1,945,532 | | | | 9,019,304 | | | | 10,964,836 | | | | 830,818 | | | 2007 | | | 3/17/2021 | |
| | TX | | | — | | | | (4 | ) | | | 2,832,498 | | | | 5,259,689 | | | | 8,092,187 | | | | 116,333 | | | | | | | | 2,832,498 | | | | 5,376,022 | | | | 8,208,520 | | | | 533,702 | | | 2002 | | | 3/17/2021 | |
Lake Houston Pkwy, Humble | | TX | | | — | | | | (4 | ) | | | 2,475,909 | | | | 6,539,367 | | | | 9,015,276 | | | | 111,163 | | | | | | | | 2,475,909 | | | | 6,650,530 | | | | 9,126,439 | | | | 706,694 | | | 2004 | | | 3/17/2021 | |
Gosling Rd, The Woodlands | | TX | | | — | | | | (4 | ) | | | 1,248,558 | | | | 7,314,476 | | | | 8,563,034 | | | | 107,869 | | | | | | | | 1,248,558 | | | | 7,422,345 | | | | 8,670,903 | | | | 679,492 | | | 2002 | | | 3/17/2021 | |
| | TX | | | — | | | | (4 | ) | | | 778,007 | | | | 5,241,798 | | | | 6,019,805 | | | | 331,331 | | | | | | | | 778,007 | | | | 5,573,129 | | | | 6,351,136 | | | | 519,167 | | | 2007 | | | 3/17/2021 | |
Jim Johnson Rd, Plant City | | FL | | | 8,722,000 | | | | | | | | 1,176,605 | | | | 20,045,758 | | | | 21,222,363 | | | | 64,731 | | | | | | | | 1,176,605 | | | | 20,110,489 | | | | 21,287,094 | | | | 2,104,743 | | | 2004 | | | 3/17/2021 | |
F-75
| | | | | | | | | | | | | | | | | | | | | | | | | | | | | | | | | | | | | | | | | | | | | | | | | | | | | | | | |
| | | | | | | | | | | | | | | | | | Gross Carrying Amount at December 31, 2023 | | | | | | | |
| | | | | | | | | | | | | | | | | | | | Cost
Capitalized
Subsequent
to Acquisition | | | | | | | | | | | | | | | | | | | | | | |
Frelinghuysen Ave, Newark | | | NJ | | | | — | | | | (4 | ) | | | 10,700,968 | | | | 24,754,531 | | | | 35,455,499 | | | | 1,987,651 | | | | | | | | 10,700,968 | | | | 26,742,182 | | | | 37,443,150 | | | | 2,454,691 | | | | 1931 | | | | 3/17/2021 | |
Redmond Fall City Rd, Redmond | | | WA | | | | — | | | | (4 | ) | | | 3,874,807 | | | | 7,061,417 | | | | 10,936,224 | | | | 110,974 | | | | | | | | 3,874,807 | | | | 7,172,391 | | | | 11,047,198 | | | | 704,459 | | | | 1997 | | | | 3/17/2021 | |
| | | AZ | | | | — | | | | (4 | ) | | | 1,340,075 | | | | 7,587,601 | | | | 8,927,676 | | | | 87,373 | | | | | | | | 1,340,075 | | | | 7,674,974 | | | | 9,015,049 | | | | 697,254 | | | | 2019 | | | | 3/17/2021 | |
| | | FL | | | | — | | | | (4 | ) | | | 1,253,081 | | | | 10,931,368 | | | | 12,184,449 | | | | 19,021 | | | | | | | | 1,253,081 | | | | 10,950,389 | | | | 12,203,470 | | | | 927,525 | | | | 2019 | | | | 3/17/2021 | |
Ardrey Kell Rd, Charlotte | | | NC | | | | — | | | | (4 | ) | | | 1,316,193 | | | | 15,140,130 | | | | 16,456,323 | | | | — | | | | | | | | 1,316,193 | | | | 15,140,130 | | | | 16,456,323 | | | | 1,278,753 | | | | 2018 | | | | 3/17/2021 | |
University City, Charlotte II | | | NC | | | | — | | | | (4 | ) | | | 1,134,981 | | | | 11,301,614 | | | | 12,436,595 | | | | 18,130 | | | | | | | | 1,134,981 | | | | 11,319,744 | | | | 12,454,725 | | | | 978,787 | | | | 2017 | | | | 3/17/2021 | |
Hydraulic Rd, Charlottesville | | | VA | | | | — | | | | (4 | ) | | | 1,846,479 | | | | 16,268,290 | | | | 18,114,769 | | | | 186,725 | | | | | | | | 1,846,479 | | | | 16,455,015 | | | | 18,301,494 | | | | 1,350,824 | | | | 2017 | | | | 3/17/2021 | |
| | | CA | | | | — | | | | (4 | ) | | | 1,018,965 | | | | 18,019,171 | | | | 19,038,136 | | | | 164,355 | | | | | | | | 1,018,965 | | | | 18,183,526 | | | | 19,202,491 | | | | 1,483,164 | | | | 2019 | | | | 3/17/2021 | |
Tamiami Trail, Punta Gorda | | | FL | | | | — | | | | (4 | ) | | | 2,034,608 | | | | 15,764,762 | | | | 17,799,370 | | | | 261,577 | | | | | | | | 2,034,608 | | | | 16,026,339 | | | | 18,060,947 | | | | 1,370,789 | | | | 1992 | | | | 3/17/2021 | |
Iroquois Shore Rd, Oakville III (2) | | | ONT | | | | — | | | | | | | | 1,423,150 | | | | 18,637,895 | | | | 20,061,045 | | | | (1,029,215 | ) | | | | | | | 1,343,845 | | | | 17,687,985 | | | | 19,031,830 | | | | 1,402,748 | | | | 2020 | | | | 4/16/2021 | |
Van Buren Blvd, Riverside III | | | CA | | | | — | | | | (4 | ) | | | 3,705,043 | | | | 6,511,602 | | | | 10,216,645 | | | | 262,920 | | | | | | | | 3,705,043 | | | | 6,774,522 | | | | 10,479,565 | | | | 685,523 | | | | 1996 | | | | 5/27/2021 | |
| | | CO | | | | — | | | | (4 | ) | | | 2,134,320 | | | | 14,750,963 | | | | 16,885,283 | | | | 447,013 | | | | | | | | 2,134,320 | | | | 15,197,976 | | | | 17,332,296 | | | | 1,066,593 | | | | 1998 | | | | 10/19/2021 | |
| | | IL | | | | — | | | | (4 | ) | | | 717,325 | | | | 17,439,376 | | | | 18,156,701 | | | | 307,339 | | | | | | | | 717,325 | | | | 17,746,715 | | | | 18,464,040 | | | | 1,112,447 | | | | 1987 | | | | 2/8/2022 | |
| | | CA | | | | — | | | | (4 | ) | | | 1,796,664 | | | | 22,828,895 | | | | 24,625,559 | | | | 286,190 | | | | | | | | 1,796,664 | | | | 23,115,085 | | | | 24,911,749 | | | | 1,260,702 | | | | 1981 | | | | 5/10/2022 | |
St. Johns Commons
Rd, St. Johns | | | FL | | | | — | | | | (4 | ) | | | 1,099,464 | | | | 14,432,172 | | | | 15,531,636 | | | | 178,448 | | | | | | | | 1,099,464 | | | | 14,610,620 | | | | 15,710,084 | | | | 714,199 | | | | 2017 | | | | 5/17/2022 | |
Mills Station Rd, Sacramento | | | CA | | | | — | | | | (4 | ) | | | 2,685,588 | | | | 13,075,090 | | | | 15,760,678 | | | | 46,954 | | | | | | | | 2,685,588 | | | | 13,122,044 | | | | 15,807,632 | | | | 707,309 | | | | 1979 | | | | 6/1/2022 | |
| | | AZ | | | | — | | | | (4 | ) | | | 542,935 | | | | 9,132,940 | | | | 9,675,875 | | | | 18,642 | | | | | | | | 542,935 | | | | 9,151,582 | | | | 9,694,517 | | | | 458,208 | | | | 1941 | | | | 6/1/2022 | |
| | | TX | | | | — | | | | (4 | ) | | | 1,310,537 | | | | 16,908,880 | | | | 18,219,417 | | | | 14,609 | | | | | | | | 1,310,537 | | | | 16,923,489 | | | | 18,234,026 | | | | 821,762 | | | | 2018 | | | | 6/1/2022 | |
| | | WI | | | | — | | | | (4 | ) | | | 1,065,590 | | | | 11,782,373 | | | | 12,847,963 | | | | 233,977 | | | | | | | | 1,065,590 | | | | 12,016,350 | | | | 13,081,940 | | | | 600,527 | | | | 1996 | | | | 6/1/2022 | |
Bothell Everett, Mill Creek | | | WA | | | | — | | | | (4 | ) | | | 4,814,088 | | | | 28,674,527 | | | | 33,488,615 | | | | 369,519 | | | | | | | | 4,814,088 | | | | 29,044,046 | | | | 33,858,134 | | | | 1,620,485 | | | | 2003 | | | | 6/1/2022 | |
| | | FL | | | | — | | | | (4 | ) | | | 1,607,054 | | | | 32,909,667 | | | | 34,516,721 | | | | 56,070 | | | | | | | | 1,607,054 | | | | 32,965,737 | | | | 34,572,791 | | | | 1,545,445 | | | | 2019 | | | | 6/1/2022 | |
| | | FL | | | | — | | | | (4 | ) | | | 2,674,729 | | | | 26,985,047 | | | | 29,659,776 | | | | 10,061 | | | | | | | | 2,674,729 | | | | 26,995,108 | | | | 29,669,837 | | | | 1,281,524 | | | | 2019 | | | | 6/1/2022 | |
| | | FL | | | | — | | | | (4 | ) | | | 1,896,569 | | | | 23,290,141 | | | | 25,186,710 | | | | 5,409 | | | | | | | | 1,896,569 | | | | 23,295,550 | | | | 25,192,119 | | | | 1,150,559 | | | | 2020 | | | | 6/1/2022 | |
| | | NV | | | | — | | | | (4 | ) | | | 2,355,229 | | | | 26,030,925 | | | | 28,386,154 | | | | 168,696 | | | | | | | | 2,355,229 | | | | 26,199,621 | | | | 28,554,850 | | | | 1,214,472 | | | | 2019 | | | | 6/1/2022 | |
| | | WA | | | | — | | | | (4 | ) | | | 2,159,298 | | | | 18,458,512 | | | | 20,617,810 | | | | 94,654 | | | | | | | | 2,159,298 | | | | 18,553,166 | | | | 20,712,464 | | | | 966,484 | | | | 2006 | | | | 6/1/2022 | |
| | | CO | | | | — | | | | (4 | ) | | | 1,222,564 | | | | 10,445,390 | | | | 11,667,954 | | | | 180,285 | | | | | | | | 1,222,564 | | | | 10,625,675 | | | | 11,848,239 | | | | 518,609 | | | | 2018 | | | | 6/28/2022 | |
| | | CA | | | | — | | | | | | | | 9,448,745 | | | | 14,265,295 | | | | 23,714,040 | | | | 87,706 | | | | | | | | 9,448,745 | | | | 14,353,001 | | | | 23,801,746 | | | | 93,026 | | | | 2023 | | | | 7/13/2023 | |
| | | CA | | | | 3,832,774 | | | | | | | | 975,000 | | | | 5,525,000 | | | | 6,500,000 | | | | 790,771 | | | | | | | | 975,000 | | | | 6,315,771 | | | | 7,290,771 | | | | 789,282 | | | | 2018 | | | | 1/24/2019 | |
| | | | | | | | | | | | | | | | | | | | | | | | | | | | | | | | | | | | | | | | | | | | | | | | | | | | | | | | |
| | | | | | $ | 373,098,743 | | | | | | | $ | 428,812,794 | | | $ | 1,417,142,017 | | | $ | 1,845,954,811 | | | $ | 78,791,561 | | | | | | | $ | 430,868,563 | | | $ | 1,493,877,809 | | | $ | 1,924,746,372 | | | $ | 255,844,284 | | | | | | | | | |
| | | | | | | | | | | | | | | | | | | | | | | | | | | | | | | | | | | | | | | | | | | | | | | | | | | | | | | | |
| (1) | | The aggregate cost of real estate for United States federal income tax purposes is approximately $1,921,347,528 |
| (2) | | This property is located in Ontario, Canada. |
| (3) | | The change in cost at these self storage facilities are the net of the impact of foreign exchange rate changes and any actual additions. |
| (4) | | The equity interest in these wholly-owned subsidiaries that directly own these unencumbered real estate assets comprise the borrowing base of the Credit Facility and the 2032 Private Placement Notes, and such equity interests were pledged as of December 31, 2023 for the benefit of the lenders thereunder. |
F-76
SMARTSTOP SELF STORAGE REIT, INC. AND SUBSIDIARIES
SCHEDULE III
REAL ESTATE AND ACCUMULATED DEPRECIATION
Activity in real estate facilities during 2023, 2022, and 2021 was as follow
s:
| | | | | | | | | | | | |
| | | | | | | | | | |
| | | | | | | | | | | | |
Balance at beginning of year | | $ | 1,887,205,645 | | | $ | 1,593,623,628 | | | $ | 1,210,102,582 | |
| | | 23,696,536 | | | | 298,341,568 | | | | 371,507,610 | |
Impact of foreign exchange rate changes and other | | | 4,342,673 | | | | (12,984,154 | ) | | | (138,457 | ) |
Improvements and additions | | | 9,501,518 | | | | 8,224,603 | | | | 12,151,893 | |
Other facility acquisitions | | | — | | | | — | | | | 15,689,143 | |
Disposition due to deconsolidation | | | — | | | | — | | | | (15,689,143 | ) |
| | | | | | | | | | | | |
| | | | | | | | | | | | |
| | | | | | | | | | | | |
| | | | | | | | | | | | |
Balance at beginning of year | | $ | (202,682,688 | ) | | $ | (155,926,875 | ) | | $ | (115,903,045 | ) |
| | | — | | | | — | | | | — | |
| | | (52,619,881 | ) | | | (48,400,073 | ) | | | (40,158,233 | ) |
Disposition due to deconsolidation | | | — | | | | — | | | | 62,466 | |
Impact of foreign exchange rate changes and other | | | (541,715 | ) | | | 1,644,260 | | | | 71,937 | |
| | | | | | | | | | | | |
| | | | | | | | | | | | |
| | | | | | | | | | | | |
| | | | | | | | | | | | |
Balance at beginning of year | | $ | 4,490,926 | | | $ | 1,799,004 | | | $ | 1,761,303 | |
Net additions and assets placed into service | | | 1,486,020 | | | | 2,691,922 | | | | 37,701 | |
| | | | | | | | | | | | |
| | | | | | | | | | | | |
| | | | | | | | | | | | |
Real estate facilities, net | | | | | | | | | | | | |
| | | | | | | | | | | | |
F-77
SMARTSTOP SELF STORAGE REIT, INC. AND SUBSIDIARIES
CONSOLIDATED BALANCE SHEETS
(Amounts in thousands, except share and per share data)
| | | | | | | | |
| | |
| | | | |
| | | | | | | | |
| | | | | | | | |
| | $ | 438,333 | | | $ | 430,869 | |
| | | 1,442,534 | | | | 1,401,981 | |
| | | 93,330 | | | | 91,896 | |
| | | | | | | | |
| | | 1,974,197 | | | | 1,924,746 | |
| | | (293,518 | ) | | | (255,844 | ) |
| | | | | | | | |
| | | 1,680,679 | | | | 1,668,902 | |
| | | 7,651 | | | | 5,977 | |
| | | | | | | | |
Real estate facilities, net | | | 1,688,330 | | | | 1,674,879 | |
Cash and cash equivalents | | | 36,701 | | | | 45,079 | |
| | | 8,337 | | | | 8,348 | |
Investments in unconsolidated real estate ventures (Note 4) | | | 42,847 | | | | 35,832 | |
Investments in and advances to Managed REITs | | | 55,345 | | | | 34,391 | |
| | | 4,512 | | | | 4,450 | |
| | | 21,711 | | | | 21,701 | |
Intangible assets, net of accumulated amortization | | | 2,587 | | | | 1,170 | |
Trademarks, net of accumulated amortization | | | 15,700 | | | | 15,771 | |
| | | 53,643 | | | | 53,643 | |
Debt issuance costs, net of accumulated amortization | | | 7,493 | | | | 377 | |
| | | | | | | | |
| | | | | | | | |
| | | | | | | | |
LIABILITIES, TEMPORARY EQUITY, AND EQUITY | | | | | | | | |
| | $ | 1,179,904 | | | $ | 1,087,401 | |
Accounts payable and accrued liabilities | | | 55,537 | | | | 28,978 | |
| | | 371 | | | | 416 | |
| | | 8,803 | | | | 9,156 | |
| | | 6,215 | | | | 6,194 | |
| | | | | | | | |
| | | | | | | | |
| | | | | | | | |
Commitments and contingencies (Note 12) | | | | | | | | |
| | | 58,356 | | | | 71,277 | |
Preferred stock, $0.001 par value; 200,000,000 shares authorized: | | | | | | | | |
Series A Convertible Preferred Stock, $0.001 par value; 200,000 shares authorized; 200,000 and 200,000 shares issued and outstanding at September 30, 2024 and December 31, 2023, respectively, with aggregate liquidation preferences of $203,142 and $203,151 at September 30, 2024 and December 31, 2023, respectively | | | 196,356 | | | | 196,356 | |
| | | | | | | | |
SmartStop Self Storage REIT, Inc.: | | | | | | | | |
Class A common stock, $0.001 par value; 350,000,000 shares authorized; 88,477,687 and 88,761,135 shares issued and outstanding at September 30, 2024 and December 31, 2023, respectively | | | 89 | | | | 89 | |
Class T common stock, $0.001 par value; 350,000,000 shares authorized; 8,144,385 and 8,113,827 shares issued and outstanding at September 30, 2024 and December 31, 2023, respectively | | | 8 | | | | 8 | |
| | | 894,960 | | | | 894,857 | |
| | | (367,640 | ) | | | (324,191 | ) |
| | | (181,958 | ) | | | (167,270 | ) |
Accumulated other comprehensive income | | | (1,583 | ) | | | 847 | |
| | | | | | | | |
Total SmartStop Self Storage REIT, Inc. equity | | | 343,876 | | | | 404,340 | |
| | | | | | | | |
Noncontrolling interests in our Operating Partnership | | | 87,432 | | | | 91,488 | |
Other noncontrolling interests | | | 356 | | | | 35 | |
| | | | | | | | |
Total noncontrolling interests | | | 87,788 | | | | 91,523 | |
| | | | | | | | |
| | | | | | | | |
| | | | | | | | |
Total liabilities, temporary equity and equity | | | | | | | | |
| | | | | | | | |
See notes to consolidated financial statements.
F-78
SMARTSTOP SELF STORAGE REIT, INC. AND SUBSIDIARIES
CONSOLIDATED STATEMENTS OF OPERATIONS
(Amounts in thousands, except share and per share data)
| | | | | | | | | | | | | | | | |
| | |
| | |
| |
| | | | | | | | | | | | | |
| | | | | | | | | | | | | | | | |
Self storage rental revenue | | $ | 52,921 | | | $ | 52,502 | | | $ | 156,050 | | | $ | 155,457 | |
Ancillary operating revenue | | | 2,457 | | | | 2,255 | | | | 6,973 | | | | 6,626 | |
Managed REIT Platform revenue | | | 2,923 | | | | 2,518 | | | | 8,328 | | | | 9,115 | |
Reimbursable costs from Managed REITs | | | 1,856 | | | | 1,430 | | | | 5,011 | | | | 4,232 | |
| | | | | | | | | | | | | | | | |
| | | 60,157 | | | | 58,705 | | | | 176,362 | | | | 175,430 | |
| | | | | | | | | | | | | | | | |
| | | | | | | | | | | | | | | | |
Property operating expenses | | | 18,249 | | | | 16,317 | | | | 53,334 | | | | 49,333 | |
Managed REIT Platform expenses | | | 1,053 | | | | 1,307 | | | | 2,552 | | | | 2,538 | |
Reimbursable costs from Managed REITs | | | 1,856 | | | | 1,430 | | | | 5,011 | | | | 4,232 | |
General and administrative | | | 7,210 | | | | 6,277 | | | | 22,449 | | | | 19,996 | |
| | | 13,836 | | | | 13,427 | | | | 41,057 | | | | 40,075 | |
Intangible amortization expense | | | 215 | | | | 1,732 | | | | 461 | | | | 5,487 | |
| | | 38 | | | | 76 | | | | 121 | | | | 118 | |
| | | | | | | | | | | | | | | | |
| | | 42,457 | | | | 40,566 | | | | 124,985 | | | | 121,779 | |
| | | | | | | | | | | | | | | | |
| | | 17,700 | | | | 18,139 | | | | 51,377 | | | | 53,651 | |
| | | | | | | | | | | | | | | | |
Equity in earnings (losses) from investments in joint ventures | | | (380 | ) | | | (274 | ) | | | (1,068 | ) | | | (1,215 | ) |
Equity in earnings (losses) from investments in Managed REITs | | | (248 | ) | | | (444 | ) | | | (957 | ) | | | (894 | ) |
| | | (1,981 | ) | | | (266 | ) | | | (2,949 | ) | | | (161 | ) |
| | | 1,023 | | | | 699 | | | | 2,375 | | | | 2,537 | |
| | | (19,102 | ) | | | (15,925 | ) | | | (52,949 | ) | | | (45,534 | ) |
Loss on debt extinguishment | | | — | | | | — | | | | (471 | ) | | | — | |
Income tax (expense) benefit | | | (404 | ) | | | 1,050 | | | | (1,093 | ) | | | 907 | |
| | | | | | | | | | | | | | | | |
| | | (3,392 | ) | | | 2,979 | | | | (5,735 | ) | | | 9,291 | |
Net (income) loss attributable to noncontrolling interests | | | 314 | | | | (464 | ) | | | 405 | | | | (1,574 | ) |
Less: Distributions to preferred stockholders | | | (3,142 | ) | | | (3,151 | ) | | | (9,358 | ) | | | (9,349 | ) |
| | | | | | | | | | | | | | | | |
Net (loss) income attributable to SmartStop Self Storage REIT, Inc. common stockholders | | $ | (6,220 | ) | | $ | (636 | ) | | $ | (14,688 | ) | | $ | (1,632) | |
| | | | | | | | | | | | | | | | |
Net (loss) income per Class A & Class T share - basic | | $ | (0.07 | ) | | $ | (0.01 | ) | | $ | (0.16 | ) | | $ | (0.02) | |
Net (loss) income per Class A & Class T share - diluted | | $ | (0.07 | ) | | $ | (0.01 | ) | | $ | (0.16 | ) | | $ | (0.02) | |
| | | | | | | | | | | | | | | | |
Weighted average Class A shares outstanding - basic & diluted | | | 88,347,183 | | | | 88,725,350 | | | | 88,570,764 | | | | 88,725,831 | |
Weighted average Class T shares outstanding - basic & diluted | | | 8,129,804 | | | | 8,112,234 | | | | 8,123,312 | | | | 8,098,669 | |
See notes to consolidated financial statements.
F-79
SMARTSTOP SELF STORAGE REIT, INC. AND SUBSIDIARIES
CONSOLIDATED STATEMENTS OF COMPREHENSIVE INCOME (LOSS)
| | | | | | | | | | | | | | | | |
| | | Three Months Ended
September 30, | | | Nine Months Ended
September 30, | |
| | | | | | | | | | | | | |
| | $ | (3,392 | ) | | $ | 2,979 | | | $ | (5,735 | ) | | $ | 9,291 | |
Other comprehensive income (loss): | | | | | | | | | | | | | | | | |
Foreign currency translation adjustment | | | 774 | | | | (1,410 | ) | | | (1,144 | ) | | | 27 | |
Foreign currency hedge contract gains (losses) | | | (538 | ) | | | 1,244 | | | | 1,322 | | | | 189 | |
Interest rate swap and cap contract losses | | | (1,626 | ) | | | (640 | ) | | | (2,940 | ) | | | (1,583 | ) |
| | | (1,390 | ) | | | (806 | ) | | | (2,762 | ) | | | (1,367 | ) |
| | | | | | | | | | | | | | | | |
Comprehensive income (loss) | | | (4,782 | ) | | | 2,173 | | | | (8,497 | ) | | | 7,924 | |
| | | | | | | | | | | | | | | | |
Comprehensive income attributable to noncontrolling interests: | | | | | | | | | | | | | | | | |
Comprehensive (income) loss attributable to noncontrolling interests | | | 482 | | | | (370 | ) | | | 737 | | | | (1,415 | ) |
| | | | | | | | | | | | | | | | |
Comprehensive income (loss) attributable to SmartStop Self Storage REIT, Inc. stockholders | | $ | (4,300 | ) | | $ | 1,803 | | | $ | (7,760 | ) | | $ | 6,509 | |
| | | | | | | | | | | | | | | | |
See notes to consolidated financial statements.
F-80
SMARTSTOP SELF STORAGE REIT, INC. AND SUBSIDIARIES
CONSOLIDATED STATEMENTS OF EQUITY AND TEMPORARY EQUITY
(Amounts in thousands, except share and per share data)
| | | | | | | | | | | | | | | | | | | | | | | | | | | | | | | | | | | | | | | | | | | | | | | | | | | | |
| | | | | | | | | | | | | | | | | | | | | | | | | | | | | | | |
| | | | | | | | | | | | | | | | | | | | | | | | | | | | | | | | | | |
| | |
| | |
| | | | | |
| | |
| | | | | |
| | |
Comprehensive
Income (Loss) | | |
| | |
| | |
| | | | | |
| |
Balance as of June 30, 2024 | | | 88,696,458 | | | $ | 89 | | | | 8,124,618 | | | $ | 8 | | | $ | 894,870 | | | $ | (353,086 | ) | | $ | (175,738 | ) | | $ | (361 | ) | | $ | 365,782 | | | $ | 89,036 | | | $ | 454,818 | | | $ | 196,356 | | | $ | 65,371 | |
| | | — | | | | — | | | | — | | | | — | | | | (64 | ) | | | — | | | | — | | | | — | | | | (64 | ) | | | — | | | | (64 | ) | | | — | | | | — | |
Changes to redeemable common stock | | | — | | | | — | | | | — | | | | — | | | | (5,602 | ) | | | — | | | | — | | | | — | | | | (5,602 | ) | | | — | | | | (5,602 | ) | | | — | | | | 5,602 | |
Issuance of noncontrolling interest in SST VI Advisor | | | — | | | | — | | | | — | | | | — | | | | — | | | | — | | | | — | | | | — | | | | — | | | | 330 | | | | 330 | | | | — | | | | — | |
Redemptions of common stock | | | (547,947 | ) | | | (1 | ) | | | (18,104 | ) | | | — | | | | — | | | | — | | | | — | | | | — | | | | (1 | ) | | | — | | | | (1 | ) | | | — | | | | (12,617 | ) |
Issuance of restricted stock, net of forfeitures | | | (1,049 | ) | | | — | | | | — | | | | — | | | | — | | | | — | | | | — | | | | — | | | | — | | | | — | | | | — | | | | — | | | | — | |
Distributions ($0.15 per share) | | | — | | | | — | | | | — | | | | — | | | | — | | | | (14,554 | ) | | | — | | | | — | | | | (14,554 | ) | | | — | | | | (14,554 | ) | | | — | | | | — | |
Distributions to noncontrolling interests in our Operating Partnership | | | — | | | | — | | | | — | | | | — | | | | — | | | | — | | | | — | | | | — | | | | — | | | | (2,142 | ) | | | (2,142 | ) | | | — | | | | — | |
Distributions to other noncontrolling interests | | | — | | | | — | | | | — | | | | — | | | | — | | | | — | | | | — | | | | — | | | | — | | | | (107 | ) | | | (107 | ) | | | — | | | | — | |
Issuance of shares for distribution reinvestment plan | | | 330,225 | | | | 1 | | | | 37,871 | | | | — | | | | 5,602 | | | | — | | | | — | | | | — | | | | 5,603 | | | | — | | | | 5,603 | | | | — | | | | — | |
Equity based compensation expense | | | — | | | | — | | | | — | | | | — | | | | 154 | | | | — | | | | — | | | | — | | | | 154 | | | | 1,153 | | | | 1,307 | | | | — | | | | — | |
Net loss attributable to SmartStop Self Storage REIT, Inc. common stockholders | | | — | | | | — | | | | — | | | | — | | | | — | | | | — | | | | (6,220 | ) | | | — | | | | (6,220 | ) | | | — | | | | (6,220 | ) | | | — | | | | — | |
Net loss attributable to the noncontrolling interests in our Operating Partnership | | | — | | | | — | | | | — | | | | — | | | | — | | | | — | | | | — | | | | — | | | | — | | | | (422 | ) | | | (422 | ) | | | — | | | | — | |
Net income attributable to other noncontrolling interests | | | — | | | | — | | | | — | | | | — | | | | — | | | | — | | | | — | | | | — | | | | — | | | | 108 | | | | 108 | | | | — | | | | — | |
Foreign currency translation adjustment | | | — | | | | — | | | | — | | | | — | | | | — | | | | — | | | | — | | | | 681 | | | | 681 | | | | 93 | | | | 774 | | | | — | | | | — | |
Foreign currency hedge contract loss | | | — | | | | — | | | | — | | | | — | | | | — | | | | — | | | | — | | | | (473 | ) | | | (473 | ) | | | (65 | ) | | | (538 | ) | | | — | | | | — | |
Interest rate hedge contract loss | | | — | | | | — | | | | — | | | | — | | | | — | | | | — | | | | — | | | | (1,430 | ) | | | (1,430 | ) | | | (196 | ) | | | (1,626 | ) | | | — | | | | — | |
| | | | | | | | | | | | | | | | | | | | | | | | | | | | | | | | | | | | | | | | | | | | | | | | | | | | |
Balance as of September 30, 2024 | | | 88,477,687 | | | $ | 89 | | | | 8,144,385 | | | $ | 8 | | | $ | 894,960 | | | $ | (367,640 | ) | | $ | (181,958 | ) | | $ | (1,583 | ) | | $ | 343,876 | | | $ | 87,788 | | | $ | 431,664 | | | $ | 196,356 | | | $ | 58,356 | |
| | | | | | | | | | | | | | | | | | | | | | | | | | | | | | | | | | | | | | | | | | | | | | | | | | | | |
See notes to consolidated financial statements.
F-81
| | | | | | | | | | | | | | | | | | | | | | | | | | | | | | | | | | | | | | | | | | | | | | | | | | | | |
| | | | | | | | | | | | | | | | | | | | | | | | | | | | | | | |
| | | | | | | | | | | | | | | | | | | | | | | | | | | | | | | | | | |
| | | | | |
| | |
| | |
| | |
| | | | | |
| | |
| | |
| | |
| | |
| | |
| | |
| |
Balance as of June 30, 2023 | | | 88,936,541 | | | $ | 89 | | | | 8,113,553 | | | $ | 8 | | | $ | 894,583 | | | $ | (294,917 | ) | | $ | (165,520 | ) | | $ | 3,159 | | | $ | 437,402 | | | $ | 93,205 | | | $ | 530,607 | | | $ | 196,356 | | | $ | 70,599 | |
Changes to redeemable common stock | | | — | | | | — | | | | — | | | | — | | | | (5,901 | ) | | | — | | | | — | | | | — | | | | (5,901 | ) | | | — | | | | (5,901 | ) | | | — | | | | 5,901 | |
Redemptions of common stock | | | (446,718 | ) | | | — | | | | (31,755 | ) | | | — | | | | — | | | | — | | | | — | | | | — | | | | — | | | | — | | | | — | | | | — | | | | (7,039 | ) |
Forfeitures of restricted stock | | | (3,424 | ) | | | — | | | | — | | | | — | | | | — | | | | — | | | | — | | | | — | | | | — | | | | — | | | | — | | | | — | | | | — | |
Distributions ($0.15 per share) | | | — | | | | — | | | | — | | | | — | | | | — | | | | (14,642 | ) | | | — | | | | — | | | | (14,642 | ) | | | — | | | | (14,642 | ) | | | — | | | | — | |
Distributions to noncontrolling interests in our Operating Partnership | | | — | | | | — | | | | — | | | | — | | | | — | | | | — | | | | — | | | | — | | | | — | | | | (2,081 | ) | | | (2,081 | ) | | | — | | | | — | |
Distributions to other noncontrolling interests | | | — | | | | — | | | | — | | | | — | | | | — | | | | — | | | | — | | | | — | | | | — | | | | (258 | ) | | | (258 | ) | | | — | | | | — | |
Issuance of shares for distribution reinvestment plan | | | 348,984 | | | | — | | | | 39,233 | | | | — | | | | 5,901 | | | | — | | | | — | | | | — | | | | 5,901 | | | | — | | | | 5,901 | | | | — | | | | — | |
Equity based compensation expense | | | — | | | | — | | | | — | | | | — | | | | 136 | | | | — | | | | — | | | | — | | | | 136 | | | | 1,323 | | | | 1,459 | | | | — | | | | — | |
Net income attributable to SmartStop Self Storage REIT, Inc. common stockholders | | | — | | | | — | | | | — | | | | — | | | | — | | | | — | | | | (636 | ) | | | — | | | | (636 | ) | | | — | | | | (636 | ) | | | — | | | | — | |
Net income attributable to the noncontrolling interests in our
Operating Partnership | | | — | | | | — | | | | — | | | | — | | | | — | | | | — | | | | — | | | | — | | | | — | | | | 360 | | | | 360 | | | | — | | | | — | |
Net income attributable to other noncontrolling interests | | | — | | | | — | | | | — | | | | — | | | | — | | | | — | | | | — | | | | — | | | | — | | | | 104 | | | | 104 | | | | — | | | | — | |
Foreign currency
translation adjustment | | | — | | | | — | | | | — | | | | — | | | | — | | | | — | | | | — | | | | (1,245 | ) | | | (1,245 | ) | | | (165 | ) | | | (1,410 | ) | | | — | | | | — | |
Foreign currency hedge contract gain | | | — | | | | — | | | | — | | | | — | | | | — | | | | — | | | | — | | | | 1,098 | | | | 1,098 | | | | 146 | | | | 1,244 | | | | — | | | | — | |
Interest rate hedge contract loss | | | — | | | | — | | | | — | | | | — | | | | — | | | | — | | | | — | | | | (565 | ) | | | (565 | ) | | | (75 | ) | | | (640 | ) | | | — | | | | — | |
| | | | | | | | | | | | | | | | | | | | | | | | | | | | | | | | | | | | | | | | | | | | | | | | | | | | |
Balance as of September 30, 2023 | | | 88,835,383 | | | $ | 89 | | | | 8,121,031 | | | $ | 8 | | | $ | 894,719 | | | $ | (309,559 | ) | | $ | (166,156 | ) | | $ | 2,447 | | | $ | 421,548 | | | $ | 92,559 | | | $ | 514,107 | | | $ | 196,356 | | | $ | 69,461 | |
| | | | | | | | | | | | | | | | | | | | | | | | | | | | | | | | | | | | | | | | | | | | | | | | | | | | |
See notes to consolidated financial statements.
F-82
SMARTSTOP SELF STORAGE REIT, INC. AND SUBSIDIARIES
CONSOLIDATED STATEMENTS OF EQUITY AND TEMPORARY EQUITY
| | | | | | | | | | | | | | | | | | | | | | | | | | | | | | | | | | | | | | | | | | | | | | | | | | | | |
| | | | | | | | | | | | | | | | | | | | | | | | | | | | | | | |
| | | | | | | | | | | | | | | | | | | | | | | | | | | | | | | | | | |
| | | | | |
| | | | | |
| | | | | | | | |
| | |
| | |
| | |
| | |
| | |
| | |
| |
Balance as of December 31, 2023 | | | 88,761,135 | | | $ | 89 | | | | 8,113,827 | | | $ | 8 | | | $ | 894,857 | | | $ | (324,191 | ) | | $ | (167,270 | ) | | $ | 847 | | | $ | 404,340 | | | $ | 91,523 | | | $ | 495,863 | | | $ | 196,356 | | | $ | 71,277 | |
| | | — | | | | — | | | | — | | | | — | | | | (145 | ) | | | — | | | | — | | | | — | | | | (145 | ) | | | — | | | | (145 | ) | | | — | | | | — | |
Tax withholding (net settlement) related to vesting of restricted stock | | | (15,315 | ) | | | (1 | ) | | | — | | | | — | | | | (219 | ) | | | — | | | | — | | | | — | | | | (220 | ) | | | — | | | | (220 | ) | | | — | | | | — | |
Changes to redeemable common stock | | | — | | | | — | | | | — | | | | — | | | | (16,979 | ) | | | — | | | | — | | | | — | | | | (16,979 | ) | | | — | | | | (16,979 | ) | | | — | | | | 16,979 | |
Issuance of noncontrolling interest in SST VI Advisor | | | — | | | | — | | | | — | | | | — | | | | — | | | | — | | | | — | | | | — | | | | — | | | | 330 | | | | 330 | | | | — | | | | — | |
Redemptions of common stock | | | (1,308,487 | ) | | | (1 | ) | | | (84,135 | ) | | | — | | | | — | | | | — | | | | — | | | | — | | | | (1 | ) | | | — | | | | (1 | ) | | | — | | | | (29,900 | ) |
Issuance of restricted stock, net of forfeitures | | | 40,651 | | | | 1 | | | | — | | | | — | | | | — | | | | — | | | | — | | | | — | | | | 1 | | | | — | | | | 1 | | | | — | | | | — | |
Distributions ($0.45 per share) | | | — | | | | — | | | | — | | | | — | | | | — | | | | (43,449 | ) | | | — | | | | — | | | | (43,449 | ) | | | — | | | | (43,449 | ) | | | — | | | | — | |
Distributions to noncontrolling interests in our Operating Partnership | | | — | | | | — | | | | — | | | | — | | | | — | | | | — | | | | — | | | | — | | | | — | | | | | | | | (6,389 | ) | | | — | | | | — | |
Distributions to other noncontrolling interests | | | — | | | | — | | | | — | | | | — | | | | — | | | | — | | | | — | | | | — | | | | — | | | | (334 | ) | | | (334 | ) | | | — | | | | — | |
Issuance of shares for distribution reinvestment plan | | | 999,703 | | | | 1 | | | | 114,693 | | | | — | | | | 16,978 | | | | — | | | | — | | | | — | | | | 16,979 | | | | — | | | | 16,979 | | | | — | | | | — | |
Equity based compensation expense | | | — | | | | — | | | | — | | | | — | | | | 468 | | | | — | | | | — | | | | — | | | | 468 | | | | 3,395 | | | | 3,863 | | | | — | | | | — | |
Net loss attributable to SmartStop Self Storage REIT, Inc. common stockholders | | | — | | | | — | | | | — | | | | — | | | | — | | | | — | | | | (14,688 | ) | | | — | | | | (14,688 | ) | | | — | | | | (14,688 | ) | | | — | | | | — | |
Net loss attributable to the noncontrolling interests in our Operating Partnership | | | — | | | | — | | | | — | | | | — | | | | — | | | | — | | | | — | | | | — | | | | — | | | | (729 | ) | | | (729 | ) | | | — | | | | — | |
Net income attributable to other noncontrolling interests | | | — | | | | — | | | | — | | | | — | | | | — | | | | — | | | | — | | | | — | | | | — | | | | 324 | | | | 324 | | | | — | | | | — | |
Foreign currency translation adjustment | | | — | | | | — | | | | — | | | | — | | | | — | | | | — | | | | — | | | | (1,008 | ) | | | (1,008 | ) | | | (136 | ) | | | (1,144 | ) | | | — | | | | — | |
Foreign currency hedge contract gain | | | — | | | | — | | | | — | | | | — | | | | — | | | | — | | | | — | | | | 1,165 | | | | 1,165 | | | | 157 | | | | 1,322 | | | | — | | | | — | |
Interest rate hedge contract loss | | | — | | | | — | | | | — | | | | — | | | | — | | | | — | | | | — | | | | (2,587 | ) | | | (2,587 | ) | | | (353 | ) | | | (2,940 | ) | | | — | | | | — | |
| | | | | | | | | | | | | | | | | | | | | | | | | | | | | | | | | | | | | | | | | | | | | | | | | | | | |
Balance as of September 30, 2024 | | | 88,477,687 | | | $ | 89 | | | | 8,144,385 | | | $ | 8 | | | $ | 894,960 | | | $ | (367,640 | ) | | $ | (181,958 | ) | | $ | (1,583 | ) | | $ | 343,876 | | | $ | 87,788 | | | $ | 431,664 | | | $ | 196,356 | | | $ | 58,356 | |
| | | | | | | | | | | | | | | | | | | | | | | | | | | | | | | | | | | | | | | | | | | | | | | | | | | | |
See notes to consolidated financial statements.
F-83
| | | | | | | | | | | | | | | | | | | | | | | | | | | | | | | | | | | | | | | | | | | | | | | | | | | | |
| | | | | | | | | | | | | | | | | | | | | | | | | | | | | | | |
| | | | | | | | | | | | | | | | | | | | | | | | | | | | | | | | | | |
| | | | | |
| | | | | |
| | | | | | | | | | | |
Comprehensive
Income (Loss) | | |
SmartStop
Self
Storage
REIT,
Inc. Equity | | |
| | |
| | |
| | |
| |
Balance as of December 31, 2022 | | | 88,853,454 | | | $ | 89 | | | | 8,085,550 | | | $ | 8 | | | $ | 894,284 | | | $ | (266,152 | ) | | $ | (164,524) | | | $ | 3,655 | | | $ | 467,360 | | | $ | 94,460 | | | $ | 561,820 | | | $ | 196,356 | | | $ | 76,578 | |
| | | — | | | | — | | | | — | | | | — | | | | (11) | | | | — | | | | — | | | | — | | | | (11) | | | | — | | | | (11) | | | | — | | | | — | |
Tax withholding (net settlement) related to vesting of restricted stock | | | (17,422) | | | | — | | | | — | | | | — | | | | (247) | | | | — | | | | — | | | | — | | | | (247) | | | | — | | | | (247) | | | | — | | | | — | |
Changes to redeemable
common stock | | | — | | | | — | | | | — | | | | — | | | | (11,875) | | | | — | | | | — | | | | — | | | | (11,875 | ) | | | — | | | | (11,875 | ) | | | — | | | | 11,875 | |
Redemptions of common
stock | | | (745,847) | | | | (1) | | | | (42,623 | ) | | | — | | | | — | | | | — | | | | — | | | | — | | | | (1 | ) | | | — | | | | (1 | ) | | | — | | | | (18,992 | ) |
Issuance of restricted stock, net of forfeitures | | | 42,566 | | | | — | | | | — | | | | — | | | | — | | | | — | | | | — | | | | — | | | | — | | | | — | | | | — | | | | — | | | | — | |
Distributions ($0.45 per share) | | | — | | | | — | | | | — | | | | — | | | | — | | | | (43,407 | ) | | | — | | | | — | | | | (43,407 | ) | | | — | | | | (43,407 | ) | | | — | | | | — | |
Distributions to noncontrolling interests in our Operating
Partnership | | | — | | | | — | | | | — | | | | — | | | | — | | | | — | | | | — | | | | — | | | | — | | | | (6,216 | ) | | | (6,216 | ) | | | — | | | | — | |
Distributions to other noncontrolling interests | | | — | | | | — | | | | — | | | | — | | | | — | | | | — | | | | — | | | | — | | | | — | | | | (485 | ) | | | (485 | ) | | | — | | | | — | |
Issuance of shares for
distribution reinvestment
plan | | | 702,632 | | | | 1 | | | | 78,104 | | | | — | | | | 11,875 | | | | — | | | | — | | | | — | | | | 11,876 | | | | — | | | | 11,876 | | | | — | | | | — | |
Equity based compensation expense | | | — | | | | — | | | | — | | | | — | | | | 693 | | | | — | | | | — | | | | — | | | | 693 | | | | 3,385 | | | | 4,078 | | | | — | | | | — | |
Net loss attributable to
SmartStop Self Storage
REIT, Inc. common
stockholders | | | — | | | | — | | | | — | | | | — | | | | — | | | | — | | | | (1,632) | | | | — | | | | (1,632 | ) | | | — | | | | (1,632 | ) | | | — | | | | — | |
Net income attributable to the noncontrolling interests in
our Operating Partnership | | | — | | | | — | | | | — | | | | — | | | | — | | | | — | | | | — | | | | — | | | | — | | | | 1,097 | | | | 1,097 | | | | — | | | | — | |
Net income attributable to
other noncontrolling
interests | | | — | | | | — | | | | — | | | | — | | | | — | | | | — | | | | — | | | | — | | | | — | | | | 477 | | | | 477 | | | | — | | | | — | |
Foreign currency translation adjustment | | | — | | | | — | | | | — | | | | — | | | | — | | | | — | | | | — | | | | 24 | | | | 24 | | | | 3 | | | | 27 | | | | — | | | | — | |
Foreign currency hedge
contract gain | | | — | | | | — | | | | — | | | | — | | | | — | | | | — | | | | — | | | | 167 | | | | 167 | | | | 22 | | | | 189 | | | | — | | | | — | |
Interest rate hedge contract
loss | | | — | | | | — | | | | — | | | | — | | | | — | | | | — | | | | — | | | | (1,399 | ) | | | (1,399 | ) | | | (184 | ) | | | (1,583 | ) | | | — | | | | — | |
| | | | | | | | | | | | | | | | | | | | | | | | | | | | | | | | | | | | | | | | | | | | | | | | | | | | |
Balance as of September 30, 2023 | | | 88,835,383 | | | $ | 89 | | | | 8,121,031 | | | $ | 8 | | | $ | 894,719 | | | $ | (309,559) | | | $ | (166,156) | | | $ | 2,447 | | | $ | 421,548 | | | $ | 92,559 | | | $ | 514,107 | | | $ | 196,356 | | | $ | 69,461 | |
| | | | | | | | | | | | | | | | | | | | | | | | | | | | | | | | | | | | | | | | | | | | | | | | | | | | |
See notes to consolidated financial statements.
F-84
SMARTSTOP SELF STORAGE REIT, INC. AND SUBSIDIARIES
CONSOLIDATED STATEMENTS OF CASH FLOWS
| | | | | | | | |
| | |
| |
| | | | | | | |
Cash flows from operating activities: | | | | | | | | |
| | $ | (5,735 | ) | | $ | 9,291 | |
Adjustments to reconcile net income to net cash provided by operating activities: | | | | | | | | |
Depreciation and amortization | | | 41,518 | | | | 45,563 | |
Change in deferred tax assets and liabilities | | | 602 | | | | (1,527 | ) |
Accretion of fair market value adjustment of debt | | | 80 | | | | 10 | |
Amortization of debt issuance costs | | | 2,975 | | | | 2,026 | |
Loss on extinguishment of debt | | | 471 | | | | — | |
Equity based compensation expense | | | 3,863 | | | | 4,079 | |
Non-cash adjustment from equity method investments in joint ventures | | | 1,068 | | | | 1,215 | |
Non-cash adjustment from equity method investments in Managed REITs | | | 957 | | | | 1,315 | |
Accretion of financing fee revenues | | | (114 | ) | | | (576 | ) |
Unrealized foreign currency and derivative (gains) losses | | | 4,215 | | | | (839 | ) |
Issuance of noncontrolling interest in SST VI Advisor | | | 330 | | | | — | |
Non-cash adjustments for sponsor funding reduction | | | 598 | | | | — | |
Increase (decrease) in cash from changes in assets and liabilities: | | | | | | | | |
| | | 2,684 | | | | 7,176 | |
Accounts payable and accrued liabilities | | | 12,288 | | | | 5,526 | |
Managed REITs receivables | | | (12,333 | ) | | | (4,561 | ) |
| | | (45 | ) | | | 15 | |
Net cash provided by operating activities | | | 53,422 | | | | 68,713 | |
| | | | | | | | |
Cash flows from investing activities: | | | | | | | | |
| | | (54,909 | ) | | | (15,617 | ) |
Additions to real estate and construction in process | | | (8,565 | ) | | | (10,134 | ) |
Insurance proceeds on insured property damage | | | — | | | | 1,686 | |
Investments in unconsolidated joint ventures, net | | | (8,759 | ) | | | (7,489 | ) |
Deposits on acquisition of real estate | | | (474 | ) | | | (753 | ) |
Capital distributions from Managed REITs | | | 463 | | | | 444 | |
| | | — | | | | (8,000 | ) |
| | | 4,000 | | | | 20,500 | |
SSGT III Bridge loan funding | | | (20,000 | ) | | | — | |
SSGT III Bridge loan repayment | | | 15,000 | | | | — | |
SST VI Mezzanine loan funding | | | — | | | | (15,000 | ) |
SST VI Mezzanine loan repayment | | | — | | | | 50,000 | |
SST VI promissory note funding | | | (8,000 | ) | | | (15,000 | ) |
SST VI preferred equity investment | | | — | | | | (15,000 | ) |
SST VI preferred equity investment redemption | | | — | | | | 15,000 | |
Purchase of SST VI Subordinated Class C Units | | | (926 | ) | | | — | |
Settlement of foreign currency hedges | | | 1,939 | | | | 2,851 | |
| | | (70 | ) | | | — | |
| | | | | | | | |
Net cash (used in) provided by investing activities | | | (80,301 | ) | | | 3,488 | |
| | | | | | | | |
F-85
SMARTSTOP SELF STORAGE REIT, INC. AND SUBSIDIARIES
CONSOLIDATED STATEMENTS OF CASH FLOWS
| | | | | | | | |
| | |
| |
| | | | | | | |
Cash flows from financing activities: | | | | | | | | |
Gross proceeds from issuance of non-credit facility debt | | | 75,590 | | | | — | |
Repayment of non-credit facility debt | | | (15,000 | ) | | | (12,017 | ) |
Scheduled principal payments on non-credit facility debt | | | (2,617 | ) | | | (1,964 | ) |
Proceeds from issuance of credit facility debt | | | 659,000 | | | | 105,000 | |
Repayment of credit facility debt | | | (623,808 | ) | | | (105,000 | ) |
| | | (9,614 | ) | | | — | |
| | | (88 | ) | | | (11 | ) |
Redemption of common stock | | | (21,228 | ) | | | (11,993 | ) |
Restricted stock withholding for payroll taxes | | | (218 | ) | | | (247 | ) |
Distributions paid to preferred stockholders | | | (9,367 | ) | | | (9,349 | ) |
Distributions paid to common stockholders | | | (26,684 | ) | | | (31,895 | ) |
Distributions paid to noncontrolling interests in our OP | | | (6,521 | ) | | | (6,251 | ) |
Distributions paid to other noncontrolling interests | | | (333 | ) | | | (485 | ) |
| | | | | | | | |
Net cash provided by (used in) financing activities | | | 19,112 | | | | (74,212 | ) |
| | | | | | | | |
Impact of foreign exchange rate changes on cash and restricted cash | | | (622 | ) | | | (215 | ) |
| | | | | | | | |
Change in cash, cash equivalents, and restricted cash | | | (8,389 | ) | | | (2,226 | ) |
Cash, cash equivalents, and restricted cash beginning of year | | | 53,427 | | | | 46,038 | |
| | | | | | | | |
Cash, cash equivalents, and restricted cash end of year | | $ | 45,038 | | | $ | 43,812 | |
| | | | | | | | |
Supplemental disclosures and non-cash transactions: | | | | | | | | |
Cash paid for interest, net of capitalized interest | | $ | 46,311 | | | $ | 38,848 | |
Cash paid for income taxes | | $ | 53 | | | $ | 16 | |
Supplemental disclosure of noncash activities: | | | | | | | | |
Deposits applied to the purchase of real estate | | $ | — | | | $ | 400 | |
Redemption of common stock included in accounts payable and accrued liabilities | | $ | 12,617 | | | $ | 7,000 | |
| | $ | 8,803 | | | $ | 8,928 | |
Real estate and construction in process included in accounts payable and accrued liabilities | | $ | 623 | | | $ | — | |
Issuance of shares pursuant to distribution reinvestment plan | | $ | 16,979 | | | $ | 11,875 | |
Earnest deposits on acquisitions assigned to the Managed REITs, amounts reclassified to Managed REITs receivables | | $ | — | | | $ | 1,083 | |
See notes to consolidated financial statements.
F-86
SMARTSTOP SELF STORAGE REIT, INC. AND SUBSIDIARIES
NOTES TO CONSOLIDATED FINANCIAL STATEMENTS
SmartStop Self Storage REIT, Inc., a Maryland corporation (the “Company”), is a self-managed and fully-integrated self storage real estate investment trust (“REIT”), formed on January 8, 2013 under the Maryland General Corporation Law. Our year end is December 31. As used in this report, “we,” “us,” “our,” and “Company” refer to SmartStop Self Storage REIT, Inc. and each of our subsidiaries.
We acquire and own self storage facilities; we also operate self storage facilities owned by us as well as those owned by the entities sponsored by us. As of September 30, 2024, we wholly-owned 157
operating self storage facilities located in
19
states (Alabama, Arizona, California, Colorado, Florida, Illinois, Indiana, Maryland, Massachusetts, Michigan, New Jersey, Nevada, North Carolina, Ohio, South Carolina, Texas, Virginia, Washington, and Wisconsin) and Canada.
As discussed herein, we, through our subsidiaries, currently serve as the sponsor of Strategic Storage Trust VI, Inc., a publicly-registered
non-traded
REIT (“SST VI”), and Strategic Storage Growth Trust III, Inc., a private REIT (“SSGT III” and together with SST VI and any future sponsored REITs, the “Managed REITs”). We also served as the sponsor of Strategic Storage Trust IV, Inc., a public
non-traded
REIT (“SST IV”), through March 17, 2021, and Strategic Storage Growth Trust II, Inc., a private REIT (“SSGT II”), through June 1, 2022, the dates on which we closed on the mergers of SST IV (the “SST IV Merger”) and SSGT II (the “SSGT II Merger”), respectively, as defined in Note 3 – Real Estate Facilities. Prior to March 17, 2021 and June 1, 2022, SST IV and SSGT II, respectively, were also included in the “Managed REITs.”
We operate the properties owned by the Managed REITs, which together with one other self storage property we manage, as of September 30, 2024, represented 35 operating properties and approximately 27,500 units and 3.0 million rentable square feet. Through our Managed REIT Platform (as defined below), we originate, structure, and manage additional self storage investment products.
SmartStop OP, L.P. (the “Operating Partnership”) owns, directly or indirectly through one or more subsidiaries, all of the self storage properties that we own. As of September 30, 2024, we owned approximately 88% of the common units of limited partnership interests of our Operating Partnership. The remaining approximately 12% of the common units are owned by current and former employees, members of our executive management team, board members, or indirectly by Strategic Asset Management I, LLC (f/k/a SmartStop Asset Management, LLC), our former sponsor (“SAM”), its affiliates, and affiliates of Select Capital Corporation, the former dealer manager of our offering (the “Former Dealer Manager”). As the sole general partner of our Operating Partnership, we have the exclusive power to manage and conduct the business of our Operating Partnership.
We commenced our initial public offering in January 2014, in which we offered a maximum of $1.0 billion in common shares for sale to the public (the “Primary Offering”) and $95.0 million in common shares for sale pursuant to our distribution reinvestment plan (collectively, the “Offering”). At the termination of our Offering in January 2017, we had sold approximately 48 million shares of our Class A common stock (the “Class A Shares”) and approximately 7 million shares of our Class T common stock (the “Class T Shares”) for approximately $493 million and $73 million respectively.
In November 2016, we filed a Registration Statement on Form
S-3
with the SEC, which registered $100.9 million in shares under our distribution reinvestment plan. On May 14, 2024, we filed a new Registration Statement on Form S-3 with the SEC which registered up to an additional 4,500,000 Class A Shares and 500,000 Class T Shares under our distribution reinvestment plan (our “DRP Offering”).
F-87
SMARTSTOP SELF STORAGE REIT, INC. AND SUBSIDIARIES
NOTES TO CONSOLIDATED FINANCIAL STATEMENTS
As of September 30, 2024, we had sold approximately 10.3 million Class A Shares and approximately 1.3 million Class T Shares through our distribution reinvestment plan, of which, approximately 0.5 million Class A Shares and approximately 0.1 million Class T Shares were sold under our current DRP Offering. The DRP Offering may be terminated at any time upon 10 days’ prior written notice to stockholders.
On January 15, 2024, our board of directors (the “Board”), upon recommendation of our Nominating and Corporate Governance Committee, approved an Estimated Per Share Net Asset Value (“NAV”) of our common stock of $15.25 for our Class A Shares and Class T Shares based on the estimated value of our assets less the estimated value of our liabilities, or net asset value, divided by the number of shares outstanding on a fully diluted basis, calculated as of September 30, 2023.
Note 2. Summary of Significant Accounting Policies
The accompanying consolidated financial statements have been prepared in accordance with U.S. generally accepted accounting principles (“GAAP”) as contained within the Financial Accounting Standards Board (“FASB”) Accounting Standards Codification (“ASC”) and the rules and regulations of the SEC.
The square footage, unit count, and occupancy percentage data and related disclosures included in these notes to the consolidated financial statements are outside the scope of our independent registered accounting firm’s review.
Principles of Consolidation
Our financial statements, and the financial statements of our Operating Partnership, including its wholly-owned subsidiaries, are consolidated in the accompanying consolidated financial statements. The portion of these entities not wholly-owned by us is presented as noncontrolling interests. All intercompany accounts and transactions have been eliminated in consolidation.
Consolidation Considerations
Current accounting guidance provides a framework for identifying a variable interest entity (“VIE”) and determining when a company should include the assets, liabilities, noncontrolling interests, and results of activities of a VIE in its consolidated financial statements. In general, a VIE is an entity or other legal structure used to conduct activities or hold assets that either (1) has an insufficient amount of equity to carry out its principal activities without additional subordinated financial support, (2) has a group of equity owners that are unable to make significant decisions about its activities, or (3) has a group of equity owners that do not have the obligation to absorb losses or the right to receive returns generated by its operations. Generally, a VIE should be consolidated if a party with an ownership, contractual, or other financial interest in the VIE (a variable interest holder) has the power to direct the VIE’s most significant activities and the obligation to absorb losses or right to receive benefits of the VIE that could be significant to the VIE. A variable interest holder that consolidates the VIE is called the primary beneficiary. Upon consolidation, the primary beneficiary generally must initially record all of the VIE’s assets, liabilities, and noncontrolling interest at fair value and subsequently account for the VIE as if it were consolidated based on majority voting interest.
Our Operating Partnership is deemed to be a VIE and is consolidated by us as we are currently the primary beneficiary. Our sole significant asset is our investment in our Operating Partnership; as a result, substantially all of our assets and liabilities represent those assets and liabilities of our Operating Partnership and its wholly-owned subsidiaries.
F-88
SMARTSTOP SELF STORAGE REIT, INC. AND SUBSIDIARIES
NOTES TO CONSOLIDATED FINANCIAL STATEMENTS
Pacific Oak Holding Group, LLC, the parent company of Pacific Oak Capital Markets, LLC, the dealer manager for the public offering of SST VI, is a 17.5%
non-voting
member of Strategic Storage Advisor VI, LLC, our advisor to SST VI (the “SST VI Advisor”). We are the primary beneficiary of SST VI Advisor, and its operations therefore are consolidated by us.
As of September 30, 2024 and December 31, 2023, we were not a party to any other material contracts or interests that would be deemed variable interests in VIEs other than our joint ventures with SmartCentres, our Nantucket Joint Venture (as defined below), and our equity investments in the Managed REIT’s, which are all accounted for under the equity method of accounting (see Note 4 – Investments in Unconsolidated Real Estate Ventures and Note 10 – Related Party Transactions for additional information), and our joint venture programs through which we offer our tenant insurance, tenant protection plans or similar programs (the “Tenant Protection Programs”) with SST VI, SSGT III, and SSGT II (through June 1, 2022) which are consolidated.
Under the equity method, our investments are stated at cost and adjusted for our share of net earnings or losses and reduced by distributions and impairments, as applicable. Equity in earnings will generally be recognized based on our ownership interest in the earnings of each of the unconsolidated investments and recorded within our consolidated statements of operations.
Investments in and Advances to Managed REITs
As of September 30, 2024 and December 31, 2023, we had both equity and debt investments in the Managed REITs; such amounts are included in Investments in and advances to Managed REITs within our consolidated balance sheets. We account for the equity investments using the equity method of accounting as we have the ability to exercise significant influence, but not control, over the Managed REITs’ operating and financial policies through our advisory and property management agreements with the respective Managed REITs.
We record the interest and related financing fees on our debt investments on the accrual basis and such income was previously included in Other, net, within our consolidated statements of operations. Such income has been reclassified to Interest income within the consolidated statements of operations included herein. While we do make loans periodically, we do not consider that to be part of our primary operating activity, and therefore do not report income from loans as operating income.
See Note 10 – Related Party Transactions for additional information.
Noncontrolling Interests in Consolidated Entities
We account for the noncontrolling interests in our Operating Partnership and the noncontrolling interests in SST VI Advisor and our Tenant Protection Programs joint ventures with SST VI, SSGT III, and SSGT II (prior to the SSGT II Merger on June 1, 2022) in accordance with the related accounting guidance.
Due to our control through our general partnership interest in our Operating Partnership and the limited rights of the limited partners, our Operating Partnership, including its wholly-owned subsidiaries, are consolidated with the Company and the limited partner interests are reflected as noncontrolling interests in the accompanying consolidated balance sheets. We also consolidate our interests in the SSGT III and SST VI Tenant
F-89
SMARTSTOP SELF STORAGE REIT, INC. AND SUBSIDIARIES
NOTES TO CONSOLIDATED FINANCIAL STATEMENTS
Protection Programs and present the minority interests as noncontrolling interests in the accompanying consolidated balance sheets. The noncontrolling interests shall be attributed their share of income and losses, even if that attribution results in a deficit noncontrolling interests balance.
The preparation of the consolidated financial statements in conformity with GAAP requires management to make estimates and assumptions that affect the amounts reported in the consolidated financial statements and accompanying notes. The current economic environment has increased the degree of uncertainty inherent in these estimates and assumptions. Management will adjust such estimates when facts and circumstances dictate. Actual results could materially differ from those estimates. The most significant estimates made include that of real estate acquisition valuation and the allocation of property purchase price to tangible and intangible assets acquired and liabilities assumed at relative fair value, the evaluation of potential impairment of indefinite and long-lived assets and goodwill, and the estimated useful lives of real estate assets and intangibles.
Cash and Cash Equivalents
We consider all short-term, highly liquid investments that are readily convertible to cash with a maturity of three months or less at the time of purchase to be cash equivalents.
We may maintain cash and cash equivalents in financial institutions in excess of insured limits. In an effort to mitigate this risk, we only invest in or through major financial institutions.
Restricted cash consists primarily of impound reserve accounts for property taxes, insurance and capital improvements in connection with the requirements of certain of our loan agreements.
Real Estate Purchase Price Allocation and Treatment of Acquisition Costs
We account for asset acquisitions in accordance with GAAP which requires that we allocate the purchase price of a property to the tangible and intangible assets acquired and the liabilities assumed based on their relative fair values as of the date of acquisition. This guidance requires us to make significant estimates and assumptions, including fair value estimates, which requires the use of significant unobservable inputs as of the acquisition date. We engage independent third-party valuation specialists to assist in the determination of significant estimates and market-based assumptions used in the valuation models.
The value of the tangible assets, consisting of land and buildings, is determined as if vacant. Substantially all of the leases in place at acquired properties are at market rates, as the majority of the leases are
contracts. We also consider whether
in-place,
market leases represent an intangible asset. We recorded approximately $1.8 million and none in intangible assets to recognize the value of
in-place
leases related to our acquisitions during the nine months ended September 30, 2024 and 2023, respectively. We do not expect, nor to date have we recorded, intangible assets for the value of customer relationships because we expect we will not have concentrations of significant customers and the average customer turnover will be fairly frequent.
Allocation of purchase price to acquisitions of portfolios of facilities are allocated to the individual facilities based upon an income approach or a cash flow analysis using appropriate risk adjusted capitalization rates which take into account the relative size, age, and location of the individual facility along with current and projected occupancy and rental rate levels or appraised values, if available.
F-90
SMARTSTOP SELF STORAGE REIT, INC. AND SUBSIDIARIES
NOTES TO CONSOLIDATED FINANCIAL STATEMENTS
Acquisitions that do not meet the definition of a business, as defined under current GAAP, are accounted for as asset acquisitions. During the nine months ended September 30, 2024 and 2023, our property acquisitions did not meet the definition of a business. To date, our acquisitions have generally not met the definition of a business because substantially all of the fair value was concentrated in a single identifiable asset or group of similar identifiable assets (i.e. land, buildings, and related intangible assets) and because the acquisitions did not include a substantive process in the form of an acquired workforce or an acquired contract that cannot be replaced without significant cost, effort or delay. As a result, once an acquisition is deemed probable, acquisition related transaction costs are capitalized rather than expensed.
During the three months ended September 30, 2024 and 2023, we expensed approximately $38,000 and $76,000, respectively, of acquisition-related transaction costs that did not meet our capitalization policy during the respective periods.
During the nine months ended September 30, 2024 and 2023, we expensed approximately $121,000 and $118,000, respectively, of acquisition-related transaction costs that did not meet our capitalization policy during the respective periods.
Evaluation of Possible Impairment of Real Property Assets
Management monitors events and changes in circumstances that could indicate that the carrying amounts of our real property assets may not be recoverable. When indicators of potential impairment are present that indicate that the carrying amounts of the assets may not be recoverable, we will assess the recoverability of the assets by determining whether the carrying value of the real property assets will be recovered through the undiscounted future operating cash flows expected from the use of the asset and its eventual disposition. In the event that such expected undiscounted future cash flows do not exceed the carrying value, we will adjust the value of the real property assets to the fair value and recognize an impairment loss. For the nine months ended September 30, 2023, no real property asset impairment losses were recognized. For the nine months ended September 30, 2024, we recorded a casualty loss in connection with damage to one of our wholly-owned properties caused by Hurricane Helene. Please see Note 3 – Real Estate for additional detail.
Casualty Insurance Recoveries
In the event of a wind storm, flood, fire or other such event causing property damage, we estimate the carrying value of the damaged property and record a corresponding casualty loss. If we determine that an insurance recovery is probable, we record such estimated recovery as a receivable up to the amount of the casualty loss. Any amount of insurance recovery for such loss in excess of the amount of the casualty loss recorded is considered a gain contingency and is recognized when the claim is fully settled.
We initially recorded goodwill as a result of the Self Administration Transaction (as defined in Note 10 – Related Party Transactions), which occurred in 2019. Goodwill is recorded as the difference, if any, between the aggregate consideration paid for an acquisition and the fair value of the net tangible assets and other intangible assets acquired. Goodwill is allocated to various reporting units, as applicable, and is not amortized. We perform an annual qualitative impairment assessment as of December 31 for goodwill; between annual tests we evaluate the recoverability of goodwill whenever events or changes in circumstances indicate that the carrying amount of goodwill may not be fully recoverable. If circumstances indicate the carrying amount may not be fully
F-91
SMARTSTOP SELF STORAGE REIT, INC. AND SUBSIDIARIES
NOTES TO CONSOLIDATED FINANCIAL STATEMENTS
recoverable, we perform a quantitative analysis to compare the fair value of each reporting unit to its respective carrying amount. If the carrying amount of goodwill exceeds its fair value, an impairment charge will be recognized.
In connection with the Self Administration Transaction, we recorded the fair value associated with the two primary trademarks acquired therein.
Trademarks are based on the value of our brands. Trademarks are valued using the relief from royalty method, which presumes that without ownership of such trademarks, we would have to make a stream of payments to a brand or franchise owner in return for the right to use their name. By virtue of this asset, we avoid any such payments and record the related intangible fair value of our ownership of the brand name.
As of September 30, 2024 and December 31, 2023, $15.7 million was recorded related to the SmartStop
®
Self Storage trademark, which is an indefinite lived trademark. The “Strategic Storage
®
” trademark is a definite lived trademark, which was fully amortized as of September 30, 2024. As of December 31, 2023, approximately $71,000 was recorded to the “Strategic Storage
®
” trademark.
We qualitatively evaluate whether any triggering events or changes in circumstances have occurred in addition to our annual impairment test that would indicate an impairment condition may exist. If any change in circumstance or triggering event occurs, and results in a significant impact to our revenue and profitability projections, or any significant assumption in our valuation methods is adversely impacted, the impact could result in a material impairment charge in the future.
Management believes that all of our leases are operating leases. Rental income is recognized in accordance with the terms of the leases, which generally are
Revenues from any long-term operating leases are recognized on a straight-line basis over the term of the lease. The excess of rents received over amounts contractually due pursuant to the underlying leases is included in accounts payable and accrued liabilities in our consolidated balance sheets, and contractually due but unpaid rent is included in other assets.
In accordance with ASC 842, we review the collectability of lease payments on an ongoing basis. We consider collectability indicators when analyzing accounts receivable and historical bad debt levels, including current economic trends, all of which assist in evaluating the probability of outstanding and future rental income collections.
Additionally, we earn ancillary revenue from fees we receive related to providing tenant insurance or tenant protection plans to customers at our properties through our Tenant Protection Programs, and to a lesser extent, through the sale of various moving and packing supplies such as locks and boxes. We recognize such revenue in the Ancillary operating revenue line within our consolidated statements of operations as the services are performed and as the goods or services are delivered.
We earn property management and asset management revenue, pursuant to the respective property management and advisory agreement contracts, in connection with providing services to the Managed REITs.
F-92
SMARTSTOP SELF STORAGE REIT, INC. AND SUBSIDIARIES
NOTES TO CONSOLIDATED FINANCIAL STATEMENTS
We have determined under ASC 606 – Revenue from Contracts with Customers (“ASC 606”), that the performance obligation for the property management services and asset management services are satisfied as the services are rendered. While we are compensated for our services on a monthly basis, these services represent a series of distinct daily services in accordance with ASC 606. Such revenue is recorded in the Managed REIT Platform revenue line within our consolidated statements of operations.
The Managed REITs’ advisory agreements also provide for reimbursement to us of our direct and indirect costs of providing administrative and management services to the Managed REITs. These reimbursements include costs incurred in relation to organization and offering services provided to the Managed REITs and the reimbursement of salaries, bonuses, and other expenses related to benefits paid to our employees while performing services for the Managed REITs. The Managed REITs’ property management agreements also provide reimbursement to us for the property manager’s costs of managing the properties. Reimbursable costs include wages and salaries and other expenses that arise in operating, managing and maintaining the Managed REITs’ properties.
Under ASC 606, direct reimbursement of such costs does not represent a separate performance obligation from our obligation to perform property management and asset management services. The reimbursement income is considered variable consideration, and is recognized as the costs are incurred, subject to limitations on the Managed REIT Platform’s ability to incur offering costs or limitations imposed by the advisory agreements. We have elected to separately record such revenue in the Reimbursable costs from Managed REITs line within our consolidated statements of operations.
Additionally, we earn revenue in connection with our Tenant Protection Programs joint ventures with our Managed REITs. We also earn development and construction management revenue from services we provide in connection with the project design, coordination and oversight of development and certain capital improvement projects undertaken by the Managed REITs. We recognize such revenue in the Managed REIT Platform revenue line within our consolidated statements of operations as the services are performed or delivered. See Note 10 – Related Party Transactions, for additional information regarding revenue generated from our Managed REIT Platform.
Sponsor Funding Agreement
On November 1, 2023, SmartStop REIT Advisors, LLC, a subsidiary of our Operating Partnership, entered into a sponsor funding agreement (the “Sponsor Funding Agreement”) with SST VI and Strategic Storage Operating Partnership VI, L.P. (“SST VI OP”) in connection with certain changes to the public offering of SST VI (see Note 10 – Related Party Transactions for additional information).
Pursuant to the Sponsor Funding Agreement, SmartStop, through a wholly-owned subsidiary, is required to fund the payment of the front-end sales load for the sale of SST VI’s class Y and class Z shares sold in its offering. In exchange, SmartStop receives a number of series C convertible units (“Series C Units”) in SST VI OP calculated as the dollar amount of such funding divided by the then-current offering price, which was $9.30 through August 6, 2024 for such class Y and Z shares. The Series C Units shall automatically convert into class A units of SST VI OP on a one-to-one basis upon SST VI’s disclosure of an estimated net asset value per share equal to at least $10.00 per share for each class of SST VI shares of common stock, including the class Y shares and class Z shares, calculated net of the Series C Units to be converted. On August 7, 2024, SST VI declared an estimated net asset value per share of $10.00. Since the Series C Units that could be converted would result in the net asset value falling below $10.00 per share, none of the Series C Units we own were converted into class A
F-93
SMARTSTOP SELF STORAGE REIT, INC. AND SUBSIDIARIES
NOTES TO CONSOLIDATED FINANCIAL STATEMENTS
units of SST VI OP, and our future purchases will be determined based on the current estimated net asset value at such time. Subsequent to SST VI declaring an estimated net asset value of $10.00 per share, the number of Series C Units SmartStop receives in exchange for funding the front-end sales load of the sale of SST VI’s class Y and class Z shares is calculated as the dollar amount of such sponsor funding divided by the current offering price of $10.00 per share for such class Y and Z shares.
In accordance with ASC 606, the amount by which our funding exceeds the fair value of the Series C Units received is accounted for as a payment to a customer and is therefore recorded as a reduction to the transaction price for the services we provide to such customer. Each payment is initially included in the Other assets line-item in our consolidated balance sheet and subsequently recorded as a reduction of Managed REIT Platform revenues ratably over the remaining estimated life of our management contracts with SST VI. Below is a summary of the portion of sponsorship funding payments which exceeds the fair value of the Series C Units received, and is recorded pursuant to ASC 606 as described above (in thousands):
| | | | |
Balance as of December 31, 2022 | | | | |
| | | 3,527 | |
Recorded sponsor funding reduction | | | (34 | ) |
| | | | |
Balance as of December 31, 2023 | | | | |
| | | | |
| | $ | 932 | |
Recorded sponsor funding reduction | | | (598 | ) |
| | | | |
Balance as of September 30, 2024 | | | | |
| | | | |
Allowance for Doubtful Accounts
Tenant accounts receivable is reported net of an allowance for doubtful accounts. Management records this general allowance estimate based upon a review of the current status of accounts receivable. It is reasonably possible that management’s estimate of the allowance will change in the future. As of September 30, 2024 and December 31, 2023, approximately $1.0 million and $0.9 million, respectively, were recorded to allowance for doubtful accounts and are included within other assets in the accompanying consolidated balance sheets.
Advertising costs are expensed in the period in which the cost is incurred and are included in property operating expenses and general and administrative lines within our consolidated statements of operations, depending on the nature of the expense. We incurred advertising costs of approximately $1.3 million and $1.2 million for the three months ended September 30, 2024 and 2023, respectively, within property operating expenses, and approximately $0.7 million and $0.5 million for the three months ended September 30, 2024 and 2023, respectively, within general and administrative. We incurred advertising costs of approximately $4.0 million and $3.6 million for the nine months ended September 30, 2024 and 2023, respectively, within property operating expenses, and approximately $1.7 million and $1.6 million for the nine months ended September 30, 2024 and 2023, respectively, within general and administrative.
We capitalize costs incurred to develop, construct, renovate and improve properties, including interest and property taxes incurred during the construction period. The construction period begins when expenditures for the
F-94
SMARTSTOP SELF STORAGE REIT, INC. AND SUBSIDIARIES
NOTES TO CONSOLIDATED FINANCIAL STATEMENTS
real estate assets have been made and activities that are necessary to prepare the asset for its intended use are in progress. The construction period ends when the asset is substantially complete and ready for its intended use.
Depreciation of Real Property Assets
Our management is required to make subjective assessments as to the useful lives of our depreciable assets. We consider the period of future benefit of the asset to determine the appropriate useful lives.
Depreciation of our real property assets is charged to expense on a straight-line basis over the estimated useful lives as follows:
| | |
| | Standard Depreciable Life |
| Land | | Not Depreciated |
| Buildings | | 30-40 years |
| Site Improvements | | 7-10 years |
Depreciation of Personal Property Assets
Personal property assets consist primarily of furniture, fixtures and equipment and are depreciated on a straight-line basis over the estimated useful lives, generally ranging from 3 to 5 years, and are included in other assets on our consolidated balance sheets.
We have allocated a portion of our real estate purchase price to
in-place
lease intangibles, which amortize on a straight-line basis over the estimated future benefit period. Additionally, we have other contract related intangible assets. As of September 30, 2024, the gross amount of the intangible assets was approximately $82.1 million, and accumulated amortization was approximately $79.5 million. As of December 31, 2023, the gross amount of the intangible assets was approximately $80.7 million, and accumulated amortization was approximately $79.5 million. See Note 10 – Related Party Transactions for additional information.
The total estimated future amortization expense related to intangible assets for the years ending December 31, 2024, 2025, 2026, 2027, 2028, and thereafter is approximately $0.3 million, $1.2 million, $0.2 million, $0.1 million, $0.1 million, and $0.6 million thereafter, respectively. The weighted-average amortization period on our remaining intangible assets with a net book value of approximately $2.6 million was approximately 3.2 years as of September 30, 2024.
We evaluate whether any triggering events or changes in circumstances have occurred subsequent to our annual impairment test that would indicate an impairment condition may exist. If any change in circumstance or triggering event occurs, and results in a significant impact to our revenue and profitability projections, or any significant assumption in our valuations methods is adversely impacted, the impact could result in an impairment charge in the future.
The net carrying value of costs incurred in connection with obtaining non revolving debt are presented on the balance sheet as a deduction from debt; amounts incurred related to obtaining revolving debt are included in the debt issuance costs line on our consolidated balance sheet. See Note 5 – Debt for additional information. Debt issuance costs are amortized using the effective interest method.
F-95
SMARTSTOP SELF STORAGE REIT, INC. AND SUBSIDIARIES
NOTES TO CONSOLIDATED FINANCIAL STATEMENTS
As of September 30, 2024 the gross amount of debt issuance costs related to our revolving credit facility totaled approximately $9.3 million and accumulated amortization of debt issuance costs related to our revolving credit facility totaled approximately $1.8 million. As of December 31, 2023, the gross amount of debt issuance costs related to our revolving credit facility totaled approximately $4.5 million, and accumulated amortization of debt issuance costs related to our revolving credit facility totaled approximately $4.1 million.
As of September 30, 2024, the gross amount allocated to debt issuance costs related to non-revolving debt totaled approximately $6.0 million and accumulated amortization of debt issuance costs related to non-revolving debt totaled approximately $2.7 million. As of December 31, 2023, the gross amount allocated to debt issuance costs related to
non-revolving
debt totaled approximately $7.7 million and accumulated amortization of debt issuance costs related to
non-revolving
debt totaled approximately $3.4 million.
Foreign Currency Translation
For
non-U.S.
functional currency operations, assets and liabilities are translated to U.S. dollars at current exchange rates, as of the reporting date. Revenues and expenses are translated at the average rates for the period. All adjustments related to amounts classified as long term net investments are recorded in accumulated other comprehensive income (loss) as a separate component of equity. Transactions denominated in a currency other than the functional currency of the related operation are recorded at rates of exchange in effect at the date of the transaction. Changes in
not classified as long term are recorded in other income (expense) and represented a gain of approximately $0.2 million and a loss of approximately $3.8 million for the three months ended September 30, 2024 and 2023, respectively, and represented a loss of approximately $1.5 million and $0.7 million for the nine months ended September 30, 2024 and 2023, respectively.
We adopted a share redemption program (“SRP”) that enables stockholders to sell their shares to us in limited circumstances.
We have evaluated the terms of our SRP, and we classify amounts that are redeemable under the SRP as redeemable common stock in the accompanying consolidated balance sheets. The maximum amount of redeemable shares under our SRP is limited to the net proceeds from the distribution reinvestment plan. However, accounting guidance states that determinable amounts that can become redeemable should be presented as redeemable when such amount is known. Therefore, the net proceeds from the distribution reinvestment plan are considered to be temporary equity and are presented as redeemable common stock in the accompanying consolidated balance sheets.
In addition, current accounting guidance requires, among other things, that financial instruments that represent a mandatory obligation of us to repurchase shares be classified as liabilities and reported at settlement value. When we determine we have a mandatory obligation to repurchase shares under the SRP, we reclassify such obligations from temporary equity to a liability based upon their respective settlement values.
See Note 12 – Commitments and Contingencies for additional information on our SRP.
Accounting for Equity Awards
We issue equity based awards in two forms: (1) restricted stock awards consisting of shares of our common stock and (2) long-term incentive plan units of our Operating Partnership (“LTIP Units”), both of which may be
F-96
SMARTSTOP SELF STORAGE REIT, INC. AND SUBSIDIARIES
NOTES TO CONSOLIDATED FINANCIAL STATEMENTS
issued subject to either time based vesting criteria or performance based vesting criteria restrictions. For time based awards granted which contain a graded vesting schedule, compensation cost is recognized as an expense on a straight-line basis over the requisite service period as if the award was, in substance, a single award. For performance based awards, compensation cost is recognized over the requisite service period if and when we determine the performance condition is probable of being achieved. We record the cost of such equity based awards based on the grant date fair value, and have elected to record forfeitures as they occur.
The Company maintains its own retirement savings plan under Section 401(k) of the Internal Revenue Code, as amended (the “Code”), under which eligible employees can contribute up to 100% of their annual salary, subject to a statutory prescribed annual limit. The Company matches 100% on contributions up to the first 4% of an employee’s compensation.
Under GAAP, we are required to measure certain financial instruments at fair value on a recurring basis. In addition, we are required to measure other financial instruments and balances at fair value on a
non-recurring
basis. Fair value is defined by the accounting standard for fair value measurements and disclosures as the exchange price that would be received for an asset or paid to transfer a liability (an exit price) in the principal or most advantageous market for the asset or liability in an orderly transaction between market participants on the measurement date. It also establishes a fair value hierarchy that prioritizes observable and unobservable inputs used to measure fair value into three levels. The following summarizes the three levels of inputs and hierarchy of fair value we use when measuring fair value:
| | • | | Level 1 inputs utilize quoted prices (unadjusted) in active markets for identical assets or liabilities that we have the ability to access; |
| | • | | Level 2 inputs may include quoted prices for similar assets and liabilities in active markets, as well as interest rates and yield curves that are observable at commonly quoted intervals; and |
| | • | | Level 3 inputs are unobservable inputs for the assets or liabilities that are typically based on an entity’s own assumptions as there is little, if any, related market activity. |
In instances where the determination of the fair value measurement is based on inputs from different levels of the fair value hierarchy, the fair value measurement will fall within the lowest level that is significant to the fair value measurement in its entirety.
The accounting guidance for fair value measurements and disclosures provides a framework for measuring fair value and establishes a fair value hierarchy which requires an entity to maximize the use of observable inputs and minimize the use of unobservable inputs when measuring fair value. In determining fair value, we will utilize valuation techniques that maximize the use of observable inputs and minimize the use of unobservable inputs to the extent possible as well as consider counterparty credit risk in our assessment of fair value. Considerable judgment will be necessary to interpret Level 2 and 3 inputs in determining fair value of our financial and
non-financial
assets and liabilities. Accordingly, there can be no assurance that the fair values we will present will be indicative of amounts that may ultimately be realized upon sale or other disposition of these assets.
Financial and
non-financial
assets and liabilities measured at fair value on a
non-recurring
basis in our consolidated financial statements consist of real estate and related liabilities assumed related to our acquisitions
F-97
SMARTSTOP SELF STORAGE REIT, INC. AND SUBSIDIARIES
NOTES TO CONSOLIDATED FINANCIAL STATEMENTS
along with the assets and liabilities described in Note 3 – Real Estate Facilities. The fair values of these assets and liabilities were determined as of the acquisition dates using widely accepted valuation techniques, including (i) discounted cash flow analysis, which considers, among other things, leasing assumptions, growth rates, discount rates and terminal capitalization rates, (ii) income capitalization approach, which considers prevailing market capitalization rates, and (iii) market approach, which considers comparable sales activity. Additionally, certain such assets and liabilities are required to be fair valued periodically or valued pursuant to ongoing fair value requirements and impairment analyses and have been valued subsequently utilizing the same techniques noted above. In general, we consider multiple valuation techniques when measuring fair values. However, in certain circumstances, a single valuation technique may be appropriate. All of the fair values of the assets and liabilities as of the acquisition dates were derived using Level 3 inputs.
The Series C Units (categorized within Level 3 of the fair value hierarchy) acquired in connection with the Sponsor Funding Agreement are measured at fair value at the time of acquisition, and are accounted for using the equity method of accounting as described in Note 10 – Related Party Transactions. The fair value of these units were determined upon purchase using a valuation model which considered the following key assumptions: the projected distribution rate of SST VI, implied share price volatility, risk free interest rate, current estimated net asset value, and the estimated effective life of the Series C Units.
The carrying amounts of cash and cash equivalents, restricted cash, other assets, accounts payable and accrued liabilities, distributions payable and amounts due to affiliates approximate fair value (categorized within Level 1 of the fair value hierarchy).
The estimated fair value of financial instruments is subjective in nature and is dependent on a number of important assumptions, including discount rates and relevant comparable market information associated with each financial instrument. The fair value of our fixed and variable rate debt was estimated by discounting the future cash flows using the current rates at which similar loans would be made to borrowers with similar credit ratings and for the same remaining maturities (categorized within Level 2 of the fair value hierarchy). The use of different market assumptions and estimation methodologies may have a material effect on the reported estimated fair value amounts. As of September 30, 2024 and December 31, 2023, we believe the fair value of our variable rate debt was reasonably estimated at their notional amounts as there have been minimal changes to the fixed spread portion of interest rates for similar loans observed in the market, and as the variable portion of our interest rates fluctuate with the associated market indices. The table below summarizes the carrying amounts and fair values of our fixed rate debt which are not carried at fair value as of September 30, 2024 and December 31, 2023 (in thousands):
| | | | | | | | | | | | | | | | |
| | | | | | | |
| | | | | | | | | | | | | |
| | $ | 502,200 | | | $ | 519,471 | | | $ | 505,700 | | | $ | 523,019 | |
During the nine months ended September 30, 2024 and 2023, we held interest rate cash flow hedges and foreign currency net investment hedges to hedge our interest rate and foreign currency exposure (See Notes 5 – Debt and 7 – Derivative Instruments). The fair value analyses of these instruments reflect the contractual terms of the derivatives, including the period to maturity, and used observable market-based inputs, including interest rate curves, foreign exchange rates, and implied volatilities, as applicable. The fair value of interest rate swap and cap agreements are determined using widely accepted valuation techniques, including discounted cash flow analyses on the expected cash flows of the instruments. Our fair values of our net investment hedges are based primarily on the change in the spot rate at the end of the period as compared with the strike price at inception.
F-98
SMARTSTOP SELF STORAGE REIT, INC. AND SUBSIDIARIES
NOTES TO CONSOLIDATED FINANCIAL STATEMENTS
To comply with GAAP, we incorporate credit valuation adjustments to appropriately reflect both our own nonperformance risk and the respective counterparty’s nonperformance risk in the fair value measurements. In adjusting the fair value of derivative contracts for the effect of
non-performance
risk, we consider the impact of netting and any applicable credit enhancements, such as collateral postings, thresholds, mutual puts, and guarantees.
Although we had determined that the majority of the inputs used to value our derivatives were within Level 2 of the fair value hierarchy, the credit valuation adjustments associated with our derivatives utilized Level 3 inputs, such as estimates of current credit spreads, to evaluate the likelihood of default by us and our counterparties. However, through September 30, 2024, we had assessed the significance of the impact of the credit valuation adjustments on the overall valuation of our derivative positions and determined that the credit valuation adjustments were not significant to the overall valuation of our derivatives. As a result, we determined that our derivative valuations in their entirety were classified in Level 2 of the fair value hierarchy.
The table below presents the Company’s assets and liabilities measured at fair value on a recurring basis as of September 30, 2024 and December 31, 2023, aggregated by the level in the fair value hierarchy within which those measurements fall (in thousands):
| | | | | | | | | | | | |
| | | Fair Value Measurements at
September 30, 2024 | |
| | Quoted
Prices in
Active
Markets for
Identical
Assets
(Level 1) | | | Significant
Other
Observable
Inputs
(Level 2) | | | Significant
unobservable
Inputs
(Level 3) | |
Other assets - interest rate derivatives | | $ | — | | | $ | 202 | | | $ | — | |
Accounts payable and accrued liabilities - interest rate derivatives | | $ | — | | | $ | 5,656 | | | $ | — | |
Accounts payable and accrued liabilities - foreign currency hedges | | $ | — | | | $ | 1,326 | | | $ | — | |
| | | | | | | | | | | | |
| | | Fair Value Measurements at
December 31, 2023 | |
| | Quoted
Prices in
Active
Markets for
Identical
Assets
(Level 1) | | | Significant
Other
Observable
Inputs
(Level 2) | | | Significant
unobservable
Inputs
(Level 3) | |
Other assets - interest rate derivatives | | $ | — | | | $ | 3,485 | | | $ | — | |
Accounts payable and accrued liabilities - foreign currency hedges | | $ | — | | | $ | 985 | | | $ | — | |
Derivative Instruments and Hedging Activities
We record all derivatives on our balance sheet at fair value. The accounting for changes in the fair value of derivatives depends on the intended use of the derivative, whether we have elected to designate a derivative in a hedging relationship and apply hedge accounting and whether the hedging relationship has satisfied the criteria necessary to apply hedge accounting. Derivatives designated and qualifying as a hedge of the exposure to changes in the fair value of an asset, liability, or firm commitment attributable to a particular risk, such as interest rate risk, are considered fair value hedges. Derivatives designated and qualifying as a hedge of the exposure to variability in expected future cash flows, or other types of forecasted transactions, are considered cash flow
F-99
SMARTSTOP SELF STORAGE REIT, INC. AND SUBSIDIARIES
NOTES TO CONSOLIDATED FINANCIAL STATEMENTS
hedges. Derivatives may also be designated as hedges of the foreign currency exposure of a net investment in a foreign operation. We may enter into derivative contracts that are intended to economically hedge certain of our risks, even though hedge accounting does not apply or we elect not to apply hedge accounting.
For derivatives designated as net investment hedges, the effective portion of changes in the fair value of the derivatives are reported in accumulated other comprehensive income (loss). The ineffective portion of the change in fair value of the derivatives is recognized in Other, net, within our consolidated statements of operations. Amounts are reclassified out of other comprehensive (loss) income (“OCI”) into earnings (loss) when the hedged net investment is either sold or substantially liquidated.
We made an election to be taxed as a Real Estate Investment Trust (“REIT”), under Sections 856 through 860 of the Code, commencing with our taxable year ended December 31, 2014. To qualify as a REIT, we must continue to meet certain organizational and operational requirements, including a requirement to distribute at least 90% of the REIT’s taxable income to stockholders (which is computed without regard to the dividends paid deduction or net capital gains and which does not equal net income as calculated in accordance with GAAP).
For income tax purposes, distributions to common stockholders are characterized as ordinary dividends, capital gain dividends, or as nontaxable distributions. To the extent that we make a distribution in excess of our current or accumulated earnings and profits, the distribution will be a
non-taxable
return of capital, reducing the tax basis in each U.S. stockholder’s shares, and the amount of each distribution in excess of a U.S. stockholder’s tax basis in its shares will be taxable as gain realized from the sale of its shares.
As a REIT, we generally will not be subject to U.S. federal income tax on taxable income that we distribute to our stockholders. If we fail to qualify as a REIT in any taxable year, we will then be subject to U.S. federal income taxes on our taxable income at regular corporate rates and will not be permitted to qualify for treatment as a REIT for U.S. federal income tax purposes for four years following the year during which qualification is lost unless the IRS grants us relief under certain statutory provisions. Such an event could materially adversely affect our net income and net cash available for distribution to stockholders. However, we believe that we are organized and operate in such a manner as to qualify for treatment as a REIT and intend to operate in the foreseeable future in such a manner that we will remain qualified as a REIT for U.S. federal income tax purposes.
Even if we continue to qualify for taxation as a REIT, we may be subject to certain state, local, and foreign taxes on our income and property, and federal income and excise taxes on our undistributed income.
We filed an election to treat our primary taxable REIT subsidiary (“TRS”) as a taxable REIT subsidiary effective January 1, 2014. In general, our TRS performs additional services for our customers and provides the advisory and property management services to the Managed REITs and otherwise generally engages in
non-real
estate related business. The TRS is subject to corporate federal and state income tax.
We account for deferred income taxes using the asset and liability method and recognize deferred tax assets and liabilities for the expected future tax consequences of events that have been included in our financial statements or tax returns. Deferred tax assets and liabilities are determined based on differences between financial reporting and tax bases of assets and liabilities using enacted tax rates in effect for the year in which the differences are expected to reverse.
F-100
SMARTSTOP SELF STORAGE REIT, INC. AND SUBSIDIARIES
NOTES TO CONSOLIDATED FINANCIAL STATEMENTS
Any increase or decrease in the deferred tax liability that results from a change in circumstances, and that causes a change in our judgment about expected future tax consequences of events, is included in the tax provision when such changes occur. Deferred income taxes also reflect the impact of operating loss and tax credit carryforwards. A valuation allowance is provided if we believe it is more likely than not that all or some portion of the deferred tax asset will not be realized. Any increase or decrease in the valuation allowance that results from a change in circumstances, and that causes a change in our judgment about the realizability of the related deferred tax asset, is included in the tax provision when such changes occur.
Uncertain tax positions may arise where tax laws may allow for alternative interpretations or where the timing of recognition of income is subject to judgment. Under ASC Topic 740, tax positions are evaluated for recognition using a more–likely–than–not threshold, and those tax positions requiring recognition are measured at the largest amount of tax benefit that is greater than 50 percent likely of being realized upon ultimate settlement with a taxing authority that has full knowledge of all relevant information. Interest and penalties relating to uncertain tax positions will be recognized in income tax expense when incurred. As of September 30, 2024 and December 31, 2023, the Company had no uncertain tax positions. Income taxes payable are classified within accounts payable and accrued liabilities in the consolidated balance sheets. The tax years 2020-2023 remain open to examination by the major taxing jurisdictions to which we are subject.
No single self storage customer represents a significant concentration of our revenues. For the nine months ended September 30, 2024, approximately 22%, 20%, and 10% of our rental income was concentrated in Florida, California, and the Greater Toronto Area of Canada, respectively. Our properties within the aforementioned geographic areas are dispersed therein, operating in multiple different regions and
sub-markets.
Our business is composed of two reportable segments: (i) self storage operations and (ii) the Managed REIT Platform business. Please see Note 9 – Segment Disclosures for additional detail.
Convertible Preferred Stock
We classify our Series A Convertible Preferred Stock (as defined in Note 6 – Preferred Equity) on our consolidated balance sheets using the guidance in ASC 480-10-S99. Our Series A Convertible Preferred Stock can be redeemed by us on or after the fifth anniversary of its issuance (October 29, 2024), or if certain events occur, such as the listing of our common stock on a national securities exchange, a change in control, or if a redemption would be required to maintain our REIT status. Additionally, if we do not maintain our REIT status the holder can require redemption. As the shares are contingently redeemable, and under certain circumstances not solely within our control, we have classified our Series A Convertible Preferred Stock as temporary equity.
We have analyzed whether the conversion features in our Series A Convertible Preferred Stock should be bifurcated under the guidance in ASC 815-10 and have determined that bifurcation is not necessary.
Basic earnings per share attributable to our common stockholders for all periods presented are computed by dividing net income (loss) attributable to our common stockholders by the weighted average number of common shares outstanding during the period, excluding unvested restricted stock.
F-101
SMARTSTOP SELF STORAGE REIT, INC. AND SUBSIDIARIES
NOTES TO CONSOLIDATED FINANCIAL STATEMENTS
Diluted earnings per share is computed by including the dilutive effect of the conversion of all potential common stock equivalents (which includes unvested restricted stock, Series A Convertible Preferred Stock, Class A and
Class A-1
OP Units, and unvested LTIP Units) and accordingly, as applicable, adjusting net income to add back any changes in earnings that reduce earnings per common share in the period associated with the potential common stock equivalents.
The computation of earnings per common share is as follows for the periods presented (amounts presented in thousands, except share and per share data):
| | | | | | | | | | | | | | | | |
| | | For the Three Months Ended
September 30, | | | For the Nine Months Ended
September 30, | |
| | | | | | | | | | | | | |
| | $ | (3,392 | ) | | $ | 2,979 | | | $ | (5,735 | ) | | $ | 9,291 | |
Net (income) loss attributable to noncontrolling interests | | | 314 | | | | (464 | ) | | | 405 | | | | (1,574 | ) |
| | | | | | | | | | | | | | | | |
Net income (loss) attributable to SmartStop Self Storage REIT, Inc. | | | | | | | | | | | | | | | | |
Less: Distributions to preferred stockholders | | | (3,142 | ) | | | (3,151 | ) | | | (9,358 | ) | | | (9,349 | ) |
Less: Distributions to participating securities | | | (113 | ) | | | (93 | ) | | | (340 | ) | | | (276 | ) |
| | | | | | | | | | | | | | | | |
Net (loss) income attributable to common stockholders - basic: | | | | | | | | | | | | | | | | |
| | | | | | | | | | | | | | | | |
Net (loss) income attributable to common stockholders - diluted: | | | | | | | | | | | | | | | | |
| | | | | | | | | | | | | | | | |
Weighted average common shares outstanding: | | | | | | | | | | | | | | | | |
Average number of common shares outstanding - basic | | | | | | | | | | | | | | | | |
| | | — | | | | — | | | | — | | | | — | |
Unvested restricted stock awards | | | — | | | | — | | | | — | | | | — | |
| | | | | | | | | | | | | | | | |
Average number of common shares outstanding - diluted | | | | | | | | | | | | | | | | |
Earnings per common share: | | | | | | | | | | | | | | | | |
| | $ | (0.07 | ) | | $ | (0.01 | ) | | $ | (0.16 | ) | | $ | (0.02 | ) |
| | $ | (0.07 | ) | | $ | (0.01 | ) | | $ | (0.16 | ) | | $ | (0.02 | ) |
F-102
SMARTSTOP SELF STORAGE REIT, INC. AND SUBSIDIARIES
NOTES TO CONSOLIDATED FINANCIAL STATEMENTS
The following table presents the weighted average Series A Convertible Preferred Stock, Class A and
Class A-1
OP Units, unvested LTIP Units, and unvested restricted stock awards, that were excluded from the computation of diluted earnings per share above as their effect would have been antidilutive for the respective periods, and was calculated using the
two-class,
treasury stock or
if-converted
method, as applicable:
| | | | | | | | | | | | | | | | |
| | | For the Three Months Ended
September 30, | | | For the Nine Months Ended
September 30, | |
| | | | | | | | | | | | | |
| | | Equivalent
Shares
(if converted) | | | Equivalent
Shares
(if converted) | | | Equivalent
Shares
(if converted) | | | Equivalent
Shares
(if converted) | |
Series A Convertible Preferred Stock | | | 18,761,726 | | | | 18,761,726 | | | | 18,761,726 | | | | 18,761,726 | |
Class A and Class A-1 OP Units | | | 13,245,359 | | | | 12,864,174 | | | | 13,201,258 | | | | 12,831,077 | |
| | | 403,562 | | | | 443,655 | | | | 356,600 | | | | 378,665 | |
Unvested restricted stock awards | | | 30,277 | | | | 36,200 | | | | 22,413 | | | | 65,121 | |
| | | | | | | | | | | | | | | | |
| | | 32,440,924 | | | | 32,105,755 | | | | 32,341,997 | | | | 32,036,589 | |
| | | | | | | | | | | | | | | | |
Recently Issued Accounting Guidance
In November 2023, the FASB issued ASU 2023-07, “Segment Reporting (Topic 280).” The guidance in ASU 2023-07 was issued to improve reportable segment disclosure requirements, primarily through enhanced disclosures about significant segment expenses. The amendment becomes effective for fiscal years beginning after December 15, 2023, and interim periods within fiscal years beginning after December 15, 2024. Other than the required incremental disclosures, we do not expect it to have a material impact on our consolidated financial statements and related disclosures. We expect to adopt this ASU for the annual report on Form 10-K for the year ending December 31, 2024.
In December 2023, the FASB issued ASU 2023-09, “Income Taxes (Topic 740).” The guidance in ASU 2023-09 was issued to provide investors with information to better assess how an entity’s operations and related tax risks, tax planning and operational opportunities affect its tax rate and prospects for future cash flows. The amendment becomes effective for fiscal years beginning after December 15, 2024. We are currently evaluating the impact upon adoption of the new standard on our consolidated financial statements and related disclosures.
In March 2024, the FASB issued ASU 2024-01, “Compensation–Stock Compensation (Topic 718).” ASU 2024-01 adds illustrative guidance in ASC 718 and was issued to reduce complexity in determining whether a profits interest award is subject to the guidance in Topic 718, and to reduce existing diversity in practice. ASU 2024-01 clarifies how to determine whether profits interest and similar awards should be accounted for as a share-based payment arrangement under ASC 718, or as a cash bonus or profit-sharing arrangement under ASC 710 or other guidance, and applies to all reporting entities that account for profits interest awards as compensation to employees or non-employees. The amendment becomes effective for fiscal years beginning after December 15, 2024, including interim periods within those annual periods, with early adoption permitted. The amendments should be applied either retrospectively to all prior periods presented in the financial statements, or prospectively to profits interest and similar awards granted or modified on or after the adoption date. We are currently assessing the impact upon adoption of the new standard on our consolidated financial statements and related disclosures.
In November 2024, the FASB issued ASU 2024-03, “Disaggregation of Income Statement Expenses (Topic 220).” The guidance in ASU 2024-03 was issued to provide investors with more disaggregated information about
F-103
SMARTSTOP SELF STORAGE REIT, INC. AND SUBSIDIARIES
NOTES TO CONSOLIDATED FINANCIAL STATEMENTS
an entity’s expenses. The amendment becomes effective for fiscal years beginning after December 15, 2026, and interim periods within fiscal years beginning after December 15, 2027. We are currently evaluating the impact upon adoption of the new standard on our consolidated financial statements and related disclosures.
The following summarizes the activity in real estate during the nine months ended September 30, 2024 (in thousands):
| | | | |
| | | | |
Balance at December 31, 2023 | | $ | 1,924,746 | |
Impact of foreign exchange rate changes and other | | | (4,602 | ) |
Improvements and additions | | | 7,514 | |
| | | (6,541 | ) |
| | | 53,080 | |
| | | | |
Balance at September 30, 2024 | | | | |
| | | | |
| | | | |
Balance at December 31, 2023 | | $ | (255,844 | ) |
| | | 1,913 | |
| | | (40,189 | ) |
Impact of foreign exchange rate changes and other | | | 602 | |
| | | | |
Balance at September 30, 2024 | | | | |
| | | | |
| (1) | Hurricane Helene caused record flooding in late September 2024 in Asheville, North Carolina. One of our 14 wholly-owned properties in this market was severely flooded. As a result of the storm event, flooding and related damage, we recorded a net casualty loss related to this property of approximately $4.6 million during the three and nine months ended September 30, 2024, to write-off the carrying value. We expect to rebuild and therefore we believe it is probable that we will receive insurance proceeds to offset the casualty loss and have recorded a receivable related to our pending insurance claims. Consequently the casualty loss was completely offset in our consolidated statements of operations by such recovery. Any amount of insurance recovery related to the property damage in excess of the casualty loss incurred is considered a gain contingency, and will be recognized upon final settlement of the claims. |
On June 1, 2022, we closed on our merger with SSGT II (the “SSGT II Merger”). On such date, (the “SSGT II Merger Date”), we acquired all of the real estate owned by SSGT II, consisting primarily of (i) 10 wholly-owned self storage facilities, and (ii) SSGT II’s 50% equity interest in three unconsolidated real estate ventures located in the Greater Toronto Area of Ontario, Canada.
We issued approximately 11.5 million Class A Shares to the former SSGT II stockholders in connection with the SSGT II Merger.
On March 17, 2021, we closed on our merger with SST IV (the “SST IV Merger”). On such date, (the “SST IV Merger Date”), we acquired all of the real estate owned by SST IV, consisting primarily of (i) 24 self storage
F-104
SMARTSTOP SELF STORAGE REIT, INC. AND SUBSIDIARIES
NOTES TO CONSOLIDATED FINANCIAL STATEMENTS
facilities, and (ii) SST IV’s 50% equity interest in six unconsolidated real estate ventures located in the Greater Toronto Area of Ontario, Canada. As a result of the SST IV Merger, we issued approximately 23.1 million Class A Shares to the former SST IV stockholders.
Self Storage Facility Acquisitions
On April 10, 2024, we purchased a self storage facility located in Colorado Springs, Colorado (the “Colorado Springs II Property”). The purchase price for the Colorado Springs II Property was approximately $10.5 million, plus closing costs. Upon acquisition, the property was approximately 86% occupied.
On July 16, 2024, we purchased a self storage facility located in Spartanburg, South Carolina (the “Spartanburg Property”). The purchase price for the Spartanburg Property was approximately $13.2 million, plus closing costs. Upon acquisition, the property was approximately 94% occupied.
On September 24, 2024, we purchased a self storage facility located in Miami, Florida (the “Miami Property”). The purchase price for the Miami Property was approximately $31.2 million, plus closing costs. Upon acquisition, the property was approximately 96% occupied.
The following table summarizes our purchase price allocation for our acquisitions during the nine months ended September 30, 2024 (in thousands):
| | | | | | | | | | | | | | | | | | | | | | | | |
| |
| | | | | | | | | | | | | | |
| |
| | | 4/10/2024 | | | $ | 9,841 | | | $ | 675 | | | $ | 10,516 | | | $ | 446 | | | $ | 266 | |
| | | 7/16/2024 | | | | 12,831 | | | | 401 | | | | 13,232 | | | | 229 | | | | 124 | |
| | | 9/24/2024 | | | | 30,408 | | | | 753 | | | | 31,161 | | | | 25 | | | | 3 | |
| | | | | | | | | | | | | | | | | | | | | | | | |
| | | | | | | | | | | | | | | | | | | | | | | | |
| | | | | | | | | | | | | | | | | | | | | | | | |
| (1) | The allocation noted above is based on a determination of the relative fair value of the total consideration provided and represents the amount paid including capitalized acquisition costs. |
| (2) | The operating results of the self storage properties acquired have been included in our consolidated statements of operations since their acquisition dates. |
| (3) | Net operating income excludes corporate general and administrative expenses, interest expense, depreciation, amortization and acquisition related expenses. |
As of November 13, 2024, we, through our wholly-owned subsidiaries were party to four purchase and sale agreements with unaffiliated third parties for the acquisition of self storage facilities located in the United States and Canada. The total purchase price for these properties is approximately $83.3 million, plus closing costs. There can be no assurance that we will complete these acquisitions. If we fail to acquire these properties, in addition to the incurred acquisition costs, we may also forfeit earnest money of approximately $1.2 million as a result.
We may assign some or all of the above purchase and sale agreements to one or more of our Managed REITs.
F-105
SMARTSTOP SELF STORAGE REIT, INC. AND SUBSIDIARIES
NOTES TO CONSOLIDATED FINANCIAL STATEMENTS
Note 4. Investments in Unconsolidated Real Estate Ventures
On July 18, 2024, we entered into a joint venture arrangement with an unaffiliated third party to develop a self storage property in Nantucket, Massachusetts (the “Nantucket Joint Venture”). On such date we agreed to purchase a minority ownership in the property of approximately 38%, and immediately funded approximately $4.9 million. In September 2024, we funded an additional $1.3 million. Upon completion of development, we expect to serve as property manager of the self storage property. This investment is accounted for pursuant to the equity method of accounting as we have the ability to exercise influence, but not control. As of September 30, 2024, the carrying value of this investment was approximately $6.2 million.
SmartCentres Joint Ventures
As a result of the SST IV Merger, we acquired six self storage real estate joint ventures located in the Greater Toronto Area of Ontario, Canada, all of which were operating as of September 30, 2024. As a result of the SSGT II Merger, we acquired three self storage real estate joint ventures located in the Greater Toronto Area of Ontario, Canada, all of which were operating as of September 30, 2024.
On May 25, 2022, we, as 50% owner and SmartCentres as the other 50% owner of a joint venture subsidiary, purchased a single tenant industrial building located in the city of Burnaby, British Columbia (the “Regent Property”), that we and SmartCentres intend to develop into a self storage facility in the future.
On January 12, 2023, we as 50% owner and SmartCentres as the other 50% owner of a joint venture subsidiary, purchased a parcel of land in Whitby, Ontario, (the “Whitby Property”), that we and SmartCentres developed into a self storage facility that became operational in January 2024.
These joint venture agreements are with a subsidiary of SmartCentres, an unaffiliated third party, to acquire, develop, and operate self storage facilities.
For the three months ended September 30, 2024 and 2023, we recorded net aggregate loss of approximately $0.4 million and $0.3 million respectively, from our equity in earnings related to our unconsolidated real estate ventures in Canada. For the nine months ended September 30, 2024 and 2023, we recorded net aggregate loss of approximately $1.1 million and $1.2 million respectively, from our equity in earnings related to our unconsolidated real estate ventures in Canada.
F-106
SMARTSTOP SELF STORAGE REIT, INC. AND SUBSIDIARIES
NOTES TO CONSOLIDATED FINANCIAL STATEMENTS
The following table summarizes our 50% ownership interests in investments in unconsolidated real estate ventures in Canada (the “JV Properties”) (in thousands):
| | | | | | | | | | |
| | Date Real Estate Venture Became
Operational | |
of Investment as of
September 30, 2024 | | |
of Investment as of
December 31, 2023 | |
| | October 2019 | | $ | 3,731 | | | $ | 3,975 | |
| | June 2020 | | | 5,667 | | | | 5,663 | |
| | November 2020 | | | 1,979 | | | | 1,975 | |
| | January 2021 | | | 2,222 | | | | 2,297 | |
| | August 2021 | | | 1,348 | | | | 1,275 | |
| | November 2021 | | | 2,377 | | | | 2,343 | |
| | December 2022 | | | 2,177 | | | | 2,481 | |
| | March 2023 | | | 3,568 | | | | 3,947 | |
| | January 2024 | | | 8,221 | | | | 7,076 | |
| | May 2024 | | | 2,639 | | | | 2,064 | |
| | Under Development | | | 2,743 | | | | 2,736 | |
| | | | | | | | | | |
| | | | | | | | | | |
| | | | | | | | | | |
| (1) | These joint venture properties were acquired through the SSGT II Merger, which closed on June 1, 2022. |
| (2) | These joint venture properties were acquired through the SST IV Merger, which closed on March 17, 2021. |
| (3) | This property was leased as a single tenant industrial lease as of September 30, 2024. The joint venture plans to develop this property into a self storage facility in the future. |
| (4) | This property was acquired on January 12, 2023 in connection with a purchase agreement assumed in the SSGT II Merger. |
| (5) | As of September 30, 2024, these properties were encumbered by first mortgages pursuant to the RBC JV Term Loan II (defined below). |
| (6) | As of September 30, 2024, these properties were encumbered by first mortgages pursuant to the RBC JV Term Loan (defined below). |
| (7) | This property is encumbered by a first mortgage pursuant to the SmartCentres Financings (defined below). |
On July 17, 2024, three of our joint ventures with SmartCentres closed on a $46.0 million CAD term loan (the “RBC JV Term Loan II”) with Royal Bank Canada (“RBC”) pursuant to which three of our joint venture subsidiaries that each own 50% of a JV Property serve as borrowers (the “RBC Borrowers II”). The RBC JV Term Loan II is secured by first mortgages on three of the JV Properties which were previously encumbered by the SmartCentres Financings. The maturity date of the RBC JV Term Loan II is November 3, 2025, which may be requested to be extended by one additional year at the sole discretion of RBC and subject to certain conditions. Interest on the RBC JV Term Loan is a fixed annual rate of 4.97%, and payments are interest only during the term of the loan.
We and SmartCentres each serve as a full recourse guarantor with respect to 50% of the secured obligations under the RBC JV Term Loan II. The RBC JV Term Loan II contains certain customary representations and warranties, affirmative, negative and financial covenants, and events of default. Pursuant to the terms of the RBC JV Term Loan II, a failure by either us or SmartCentres to observe any negative covenant under each of our respective (and separate) credit facilities (“Separate Credit Facilities”) would be an event of default under the
F-107
SMARTSTOP SELF STORAGE REIT, INC. AND SUBSIDIARIES
NOTES TO CONSOLIDATED FINANCIAL STATEMENTS
RBC JV Term Loan II. We and SmartCentres entered into a separate Cross-Indemnity Agreement pursuant to which we and SmartCentres have each agreed to indemnify the other party with respect to any claims arising from a breach or default of the other party pursuant to the RBC JV Term Loan II or the Separate Credit Facilities.
The net proceeds from the RBC JV Term Loan II, in combination with cash on hand were used to fully repay the allocated loan amounts of approximately $46.4 million CAD or approximately $34.1 million USD under the SmartCentres Financings for each of the three JV Properties.
As of September 30, 2024, there was approximately $46.0 million CAD or approximately $34.0 million USD outstanding on the RBC JV Term Loan II.
On November 3, 2023, five of our joint ventures with SmartCentres closed on a $70 million CAD term loan (the “RBC JV Term Loan”) with RBC pursuant to which five of our joint venture subsidiaries that each own 50% of a Joint Venture property serve as borrowers (the “RBC Borrowers”). The RBC JV Term Loan is secured by first mortgages on five of the JV Properties which were previously encumbered by the SmartCentres Financings (as defined below). The maturity date of the RBC JV Term Loan is November 2, 2025, which may be requested to be extended by one additional year by the RBC Borrowers, subject to the approval of RBC in its sole and absolute discretion. Interest on the RBC JV Term Loan is a fixed annual rate of 6.21%, and payments are interest only during the term of the loan.
We and SmartCentres each serve as a full recourse guarantor with respect to 50% of the secured obligations under the RBC JV Term Loan. The RBC JV Term Loan contains certain customary representations and warranties, affirmative, negative and financial covenants, and events of default. Pursuant to the terms of the RBC JV Term Loan, a failure by either us or SmartCentres to observe any negative covenant under each of our Separate Credit Facilities would be an event of default under the RBC JV Term Loan; in addition, certain actions by either us or SmartCentres may trigger an event of default under the RBC JV Term Loan. We and SmartCentres entered into a separate Cross-Indemnity Agreement pursuant to which we and SmartCentres have each agreed to indemnify the other party with respect to any claims arising from a breach or default of the other party pursuant to the RBC JV Term Loan or the Separate Credit Facilities.
The majority of net proceeds from the RBC JV Term Loan were used to fully repay the allocated loan amounts of approximately $68.9 million CAD under the SmartCentres Financings (as defined below) for each of the five JV Properties.
As of September 30, 2024, $70.0 million CAD or approximately $51.8 million in USD, was outstanding on the RBC JV Term Loan.
In connection with the SST IV Merger, we, through our acquisition of the Oshawa, East York, Brampton, Vaughan, and Scarborough joint venture partnerships, also became party to a master mortgage commitment agreement (the “MMCA I”) with SmartCentres Storage Finance LP (the “SmartCentres Lender”) (the “SmartCentres Loan I”). The SmartCentres Lender is an affiliate of SmartCentres. On August 18, 2021, the Kingspoint Property was added to the MMCA I, increasing the available capacity.
F-108
SMARTSTOP SELF STORAGE REIT, INC. AND SUBSIDIARIES
NOTES TO CONSOLIDATED FINANCIAL STATEMENTS
On June 1, 2022, in connection with the SSGT II Merger, we assumed another loan with the SmartCentres Lender. SSGT II had previously entered into a master mortgage commitment agreement on April 30, 2021, which was subsequently modified on October 22, 2021 (the “MMCA II”), with the SmartCentres Lender in the amount of up to approximately $34.3 million CAD (the “SmartCentres Loan II”) (collectively with SmartCentres Loan I, the “SmartCentres Financings”). The borrowers under the SmartCentres Loan II are the joint venture entities in which we (SSGT II prior to June 1, 2022), and SmartCentres each hold a 50% limited partnership interest with respect to the Dupont and Aurora joint venture properties. In connection with the SmartCentres Loan II assumption, we became a recourse guarantor for 50% of the SmartCentres Financings. On September 13, 2022, the Markham Property was added to the MMCA II, increasing the available capacity.
The SmartCentres Loan I and SmartCentres Loan II have an accordion feature such that borrowings pursuant thereto may be increased up to approximately $120 million CAD each, subject to certain conditions set forth in the MMCA I and MMCA II agreements. Additionally, pursuant to the MMCA I and MMCA II agreements, the collective borrowings between all SmartCentres Financings, and loans made by the SmartCentres Lender to our affiliates, are limited to an overall combined capacity of $120 million CAD.
The SmartCentres Financings were amended on May 13, 2024, extending the maturity date to May 11, 2026, among other changes. Monthly interest payments initially increase the outstanding principal balance. Upon a JV Property generating sufficient net cash flow, the SmartCentres Financings provide for the commencement of quarterly payments of interest. The borrowings advanced pursuant to the SmartCentres Financings may be prepaid without penalty, subject to certain conditions set forth in the MMCA I and MMCA II.
The SmartCentres Financings contain customary affirmative and negative covenants, agreements, representations, warranties and borrowing conditions (including a loan to value ratio of no greater than 70% with respect to each JV Property) and events of default, all as set forth in the MMCA I and MMCA II. We serve as a full recourse guarantor with respect to 50% of the SmartCentres Financings. As of September 30, 2024, the joint ventures were in compliance with all such covenants.
On July 17, 2024, three of our joint ventures with SmartCentres closed on a $46.0 million CAD term loan with RBC pursuant to which three of our joint venture subsidiaries that each own 50% of a JV Property serve as borrowers. The RBC JV Term Loan II is secured by first mortgages on three of the JV Properties which were previously encumbered by the SmartCentres Financings. The net proceeds from such loan were used to fully repay the allocated loan amounts of approximately $46.4 million CAD or approximately $34.1 million USD under the SmartCentres Financings for each of the three JV Properties.
Interest on the SmartCentres Financings is a variable annual rate equal to the aggregate of: (i) the BA Equivalent Rate, plus: (ii) a margin based on the External Credit Rating, plus (iii) a margin under the Senior Credit Facility, each as defined and described further in the MMCA I and MMCA II. As of September 30, 2024, the total interest rate was approximately 7.3%.
As of September 30, 2024, approximately $17.3 million CAD or approximately $12.8 million in USD, was outstanding on the SmartCentres Financings. As of December 31, 2023, approximately $57.3 million CAD or approximately $43.3 million USD was outstanding on the SmartCentres Financings. The proceeds of the SmartCentres Financings have been and will generally be used to finance the acquisition, development, and construction of the JV Properties.
F-109
SMARTSTOP SELF STORAGE REIT, INC. AND SUBSIDIARIES
NOTES TO CONSOLIDATED FINANCIAL STATEMENTS
Our debt is summarized as follows (in thousands):
| | | | | | | | | | | | | | | | |
| |
| | |
| | |
| | | | |
| | $ | 5,000 | | | $ | — | | | | 7.71 | % | | | 7/31/2025 | |
| | | 89,702 | | | | 91,042 | | | | 3.89 | % | | | 8/1/2026 | |
| | | 3,761 | | | | 3,833 | | | | 4.29 | % | | | 11/1/2026 | |
| | | 603,881 | | | | — | | | | 6.91 | % | | | 2/22/2027 | |
| | | 54,896 | | | | — | | | | 6.80 | % | | | 3/7/2027 | |
KeyBank Florida CMBS Loan (2) | | | 50,131 | | | | 50,751 | | | | 4.65 | % | | | 5/1/2027 | |
2028 Canadian Term Loan (6)(8) | | | 81,378 | | | | 82,973 | | | | 6.41 | % | | | 12/1/2028 | |
| | | 104,000 | | | | 104,000 | | | | 5.00 | % | | | 2/1/2029 | |
| | | 40,500 | | | | 40,500 | | | | 3.56 | % | | | 2/1/2030 | |
2032 Private Placement Notes (5) | | | 150,000 | | | | 150,000 | | | | 5.28 | % | | | 4/19/2032 | |
Credit Facility Term Loan-USD | | | — | | | | 250,000 | | | | | | | | | |
Credit Facility Revolver-USD | | | — | | | | 318,688 | | | | | | | | | |
Discount on secured debt, net | | | — | | | | (80 | ) | | | | | | | | |
| | | (3,345 | ) | | | (4,306 | ) | | | | | | | | |
| | | | | | | | | | | | | | | | |
| | | | | | | | | | | | | | | | |
| | | | | | | | | | | | | | | | |
| (1) | This fixed rate loan encumbers 29 properties (Whittier, La Verne, Santa Ana, Upland, La Habra, Monterey Park, Huntington Beach, Chico, Lancaster I, Riverside, Fairfield, Lompoc, Santa Rosa, Federal Heights, Aurora, Littleton, Bloomingdale, Crestwood, Forestville, Warren I, Sterling Heights, Troy, Warren II, Beverly, Everett, Foley, Tampa, Boynton Beach, and Lancaster II) with monthly interest only payments until September 2021, at which time both interest and principal payments became due monthly. The separate assets of these encumbered properties are not available to pay our other debts. |
| (2) | This fixed rate loan encumbers five properties (Pompano Beach, Lake Worth, Jupiter, Royal Palm Beach, and Delray) with monthly interest only payments until June 2022, at which time both interest and principal payments became due monthly. The separate assets of these encumbered properties are not available to pay our other debts. |
| (3) | This fixed rate, interest only loan encumbers 10 properties (Myrtle Beach I, Myrtle Beach II, Port St. Lucie, Plantation, Sonoma, Las Vegas I, Las Vegas II, Las Vegas III, Ft Pierce, and Nantucket Island). The separate assets of these encumbered properties are not available to pay our other debts. |
| (4) | On March 17, 2021, in connection with the SST IV Merger, we assumed a $40.5 million fixed rate CMBS financing with KeyBank as the initial lender pursuant to a mortgage loan (the “SST IV CMBS Loan”). This fixed rate loan encumbers seven properties owned by us (Jensen Beach, Texas City, Riverside, Las Vegas IV, Puyallup, Las Vegas V, and Plant City). The separate assets of these encumbered properties are not available to pay our other debt. The loan has a maturity date of February 1, 2030. Monthly payments due under the loan agreement (the “SST IV CMBS Loan Agreement”) are interest only, with the full principal amount becoming due and payable on the maturity date. |
| (5) | As of March 31, 2023, a Total Leverage Ratio Event (as defined below) had occurred, and the interest rate on such Note increased to 5.28% prospectively. For additional information regarding this loan, see 2032 Private Placement Notes below. |
| (6) | The amounts shown above are in USD based on the foreign exchange rate in effect as of the date presented. |
| (7) | This loan incurs interest at an all in rate of CORRA (as defined further below under the section entitled “2027 NBC Loan”), plus a CORRA adjustment of approximately 0.30%, plus a spread of 2.20%. The |
F-110
SMARTSTOP SELF STORAGE REIT, INC. AND SUBSIDIARIES
NOTES TO CONSOLIDATED FINANCIAL STATEMENTS
| | effective interest rate on this loan is 6.42% when factoring the effects of a CORRA Swap which we entered into with the National Bank of Canada for the initial term of the loan. The Dufferin, Oakville II, Burlington II, Iroquois Shore Rd, and Stoney Creek I properties are encumbered by this loan. See Note 7 – Derivative Instruments for additional information. |
| (8) | On November 16, 2023, we, through eight of our wholly-owned Canadian subsidiaries entered into a term loan (the “2028 Canadian Term Loan”) with affiliates of QuadReal Finance LP, receiving net proceeds of $110.0 million CAD on such date. The 2028 Canadian Term Loan is secured by eight Canadian properties, has a maturity date of December 1, 2028, and carries a fixed interest rate for the term of the loan of 6.41%. The first two years of the Canadian Term Loan are interest only, after which it requires monthly amortizing payments based on a 25-year amortization schedule. |
The weighted average interest rate on our consolidated debt, excluding the impact of our interest rate hedging activities, as of September 30, 2024 was approximately 6.1%. We are subject to certain restrictive covenants, as amended, relating to the outstanding debt, and as of September 30, 2024, we were in compliance with all such covenants.
On July 31, 2024, we entered into a bridge loan with KeyBank for up to $45.0 million (the “KeyBank Bridge Loan”) which matures on July 31, 2025. The KeyBank Bridge Loan was able to be funded in up to two draws, neither of which could occur after 90 days from closing. No amounts borrowed and repaid under such loan were available to be redrawn. At closing, we drew $20.0 million. There were no subsequent draws within 90 days after initial closing, and we no longer have the ability to draw additional funds pursuant to this loan.
The KeyBank Bridge Loan was completed in connection with SSGT III’s acquisition of two self storage facilities on July 31, 2024, whereby our Operating Partnership provided a similar bridge loan to an indirect wholly-owned subsidiary of SSGT III for $20.0 million (the “SSGT III Bridge Loan”) to facilitate SSGT III’s closing on such properties. An indirect wholly-owned subsidiary of SSGT III is sponsoring a private offering of beneficial interests in a Delaware statutory trust (“DST”) relating to the two properties. We, through a newly formed subsidiary of SmartStop REIT Advisors, LLC (“SRA”), will serve as property manager of both of these properties.
The KeyBank Bridge Loan incurs interest based on adjusted daily simple SOFR plus 275 basis points. The SSGT III Bridge Loan incurs interest based on adjusted daily simple SOFR plus 300 basis points. The SSGT III Bridge Loan is secured by an indirect pledge of equity in the entity sponsoring the private DST offering relating to the two properties mentioned above, as well as a full guaranty by SSGT III OP. We have pledged the SSGT III Bridge Loan to KeyBank as the collateral for the KeyBank Bridge Loan, as well as provided a full guaranty from our Operating Partnership. As such sponsor entity sells such DST interests, it is required to utilize such net proceeds to pay down the SSGT III Bridge Loan and we are similarly required to use such net proceeds to pay down the KeyBank Bridge Loan. In any event, we will be required to pay down at least 15% of the balance within four months, 35% within six months, 55% within nine months, and 75% within twelve months from the final draw. Full repayment is subject to one six month extension option. Similar required paydowns are also required of SSGT III pursuant to the terms of the SSGT III Bridge Loan.
On February 22, 2024, we through our Operating Partnership (the “Borrower”), entered into an amended and restated revolving credit facility with KeyBank, National Association, as administrative agent and collateral
F-111
SMARTSTOP SELF STORAGE REIT, INC. AND SUBSIDIARIES
NOTES TO CONSOLIDATED FINANCIAL STATEMENTS
agent, certain others listed as joint book runners, joint lead arrangers, syndication agents and documentation agents, and certain other lenders party thereto, (the “2024 Credit Facility”). The 2024 Credit Facility replaced the Credit Facility (defined below) the Company entered into on March 17, 2021, and has a maturity date of February 22, 2027.
The aggregate commitment of the 2024 Credit Facility is $650 million. The Borrower has the right to request to increase the commitment amount available under the 2024 Credit Facility by an additional $850 million, for a total potential maximum aggregate amount of $1.5 billion, subject to certain conditions. The 2024 Credit Facility also includes sublimits of (a) up to $25 million for letters of credit and (b) up to $25 million for swingline loans; each of these sublimits are part of, and not in addition to, the amounts available under the 2024 Credit Facility. Borrowings under the 2024 Credit Facility may be in either USD or CAD. Upon the closing of the 2024 Credit Facility, we immediately drew down an aggregate amount of $576 million, which was used primarily to pay off the amounts outstanding under the Credit Facility.
The maturity date of the 2024 Credit Facility is February 22, 2027, subject to a one-year extension option, subject to the payment of an extension fee of 0.20% on the aggregate amount of the then-outstanding revolving commitments for such extension, and it may be prepaid or terminated at any time without penalty; provided, however, that the lenders shall be indemnified for certain breakage costs.
Amounts borrowed under the 2024 Credit Facility bear interest based on the type of borrowing (either Base Rate Loans, Daily Simple SOFR Loans, Term SOFR Loans or CORRA Loans, each as defined in the 2024 Credit Facility). Base Rate Loans bear interest at the lesser of (x) the Base Rate (as defined in the 2024 Credit Facility) plus the applicable rate, or (y) the maximum rate. Daily Simple SOFR Loans bear interest at the lesser of (a) Adjusted Daily Simple SOFR (as defined in the 2024 Credit Facility) plus the applicable rate, or (b) the maximum rate. Term SOFR Loans bear interest at the lesser of (a) Term SOFR (as defined in the 2024 Credit Facility) for the interest period in effect plus the applicable rate, or (b) the maximum rate. CORRA Loans bear interest at the lesser of (a) Adjusted Daily Simple CORRA (as defined in the 2024 Credit Facility) plus the applicable rate, or (b) the maximum rate. The corresponding applicable rate varies between (i) prior to a Security Interest Termination Event (defined below), 165 basis points to 230 basis points for Daily Simple SOFR Loans, Term SOFR Loans and CORRA Loans and between 65 basis points and 130 basis points for Base Rate Loans, in each case of this clause (i), depending on the consolidated leverage ratio of the Company and (ii) following a Security Interest Termination Event, 140 basis points to 225 basis points for Daily Simple SOFR Loans, Term SOFR Loans and CORRA Loans and between 40 basis points and 125 basis points for Base Rate Loans, in each case of this clause (ii), depending on the consolidated capitalization rate leverage ratio of the Company. Initial advances under the 2024 Credit Facility are Daily Simple SOFR Loans that bear interest at 175 basis points over Adjusted Daily Simple SOFR. The 2024 Credit Facility is also subject to an annual unused fee based upon the average amount of the unused portion of the 2024 Credit Facility, which varies from 15 bps to 25 bps, depending on the size of the unused amount, as well as whether a Security Interest Termination Event has occurred.
As of September 30, 2024, borrowings under the 2024 Credit Facility only bore interest based on Daily Simple SOFR. The rate spread above Daily Simple SOFR at which the 2024 Credit Facility incurs interest is subject to increase based on the consolidated leverage ratio. There are five leverage tiers under the 2024 Credit Facility, with the highest tier limited to a maximum leverage of 60% and a maximum spread of 230 basis points on the 2024 Credit Facility. During the three months ended September 30, 2024, our consolidated leverage ratio was within the second leverage tier, and this loan incurred interest at daily simple SOFR plus a spread of 1.85% and the SOFR Index Adjustment of 0.10%.
F-112
SMARTSTOP SELF STORAGE REIT, INC. AND SUBSIDIARIES
NOTES TO CONSOLIDATED FINANCIAL STATEMENTS
The 2024 Credit Facility is fully recourse, jointly and severally, to us, the Borrower, and certain of our subsidiaries (the “Subsidiary Guarantors”). In connection with the 2024 Credit Facility, we, the Borrower and the Subsidiary Guarantors executed guarantees in favor of the lenders. It is an event of default under the 2024 Credit Facility if (a) there is a payment default by us, the Borrower or any Subsidiary Guarantor under any recourse debt for borrowed money, (b) there is a payment default by us or any of its subsidiaries under any non-recourse debt of at least $75 million or (c) prior to a Security Interest Termination Event, an event of default occurs under the 2032 Private Placement Notes.
The 2024 Credit Facility is initially secured by a pledge of equity interests in the Subsidiary Guarantors. However, upon the achievement of certain security interest termination conditions, the pledges shall be released and the 2024 Credit Facility shall become unsecured (the “Security Interest Termination Event”). The Security Interest Termination Event occurs at the Borrower’s election, once the Borrower satisfies all of the following security interest termination conditions: (i) a fixed charge coverage ratio of no less than 1.50:1.00; (ii) an unsecured interest coverage ratio of not less than 2.00:1.00; (iii) a consolidated capitalization rate leverage ratio of not greater than 60%; and (iv) a secured debt ratio of no greater than 40%. Following the occurrence of the Security Interest Termination Event, certain terms and conditions of the 2024 Credit Facility are modified, including, but not limited to: (i) in certain circumstances, a reduction in the applicable rate under the 2024 Credit Facility, (ii) the modification or addition of certain financial covenants, (iii) the addition of a floor of at least $25 million for any cross-defaulted recourse debt of us, Borrower or any Subsidiary Guarantor, and (iv) in certain circumstances, a reduction in the annual unused fee for the 2024 Credit Facility. The outstanding 2032 Private Placement Notes previously issued by us remain pari passu with the 2024 Credit Facility.
The 2024 Credit Facility contains certain customary representations and warranties, affirmative, negative and financial covenants, borrowing conditions, and events of default. In particular, the financial covenants imposed on us include: a maximum leverage ratio, a minimum fixed charge coverage ratio, a minimum tangible net worth, certain limits on both secured debt and secured recourse debt, certain payout ratios of dividends paid to adjusted funds from operations, limits on unhedged variable rate debt, and minimum liquidity. If an event of default occurs and continues, the Borrower is subject to certain actions by the administrative agent, including, without limitation, the acceleration of repayment of all amounts outstanding under the 2024 Credit Facility.
Subsequent to the initial draw on the 2024 Credit Facility, during the three months ended September 30, 2024, we borrowed an additional $67.5 million in order to fund our acquisitions of the Spartanburg and Miami Properties, to lend to the Managed REITs, and to fund other general corporate activities.
Subsequent to the initial draw on the 2024 Credit Facility, during the nine months ended September 30, 2024, we borrowed an additional $83.0 million in order to fund our acquisitions of the Colorado Springs II, Spartanburg and Miami Properties, to lend to the Managed REITs, and to fund other general corporate activities.
During the nine months ended September 30, 2024, the Colorado Springs II Property was added to the borrowing base of the 2024 Credit Facility.
As of September 30, 2024, 90 of our wholly-owned properties were encumbered by the 2024 Credit Facility, and we had borrowed approximately $604 million of the $650 million maximum potential current commitment of the 2024 Credit Facility. The availability of the Credit Facility is subject to certain calculations, including a debt service coverage ratio (“DSCR”) calculation which utilizes prevailing treasury rates within the calculation. As of September 30, 2024, based on the aforementioned and other borrowing base calculations, we had the ability to draw up to an additional approximately $46.1 million on the current capacity of the revolver.
F-113
SMARTSTOP SELF STORAGE REIT, INC. AND SUBSIDIARIES
NOTES TO CONSOLIDATED FINANCIAL STATEMENTS
On March 7, 2024, we, through five of our wholly-owned Canadian subsidiaries (the “2027 NBC Loan Borrowers”), entered into a loan with National Bank of Canada (“NBC”) as administrative agent, National Bank Financial as lead arranger and sole bookrunner, and certain other lenders party thereto (the “2027 NBC Loan”). On such date, we drew the maximum aggregate borrowing of $75 million CAD pursuant to the 2027 NBC Loan. This loan is secured by the five properties owned by the 2027 NBC Loan Borrowers (the “Secured NBC Properties”).
Previously, four of the Secured NBC Properties were included in the borrowing base of the 2024 Credit Facility, and the other property was unencumbered. The net proceeds from the 2027 NBC Loan were used to pay down the 2024 Credit Facility by approximately $55.1 million USD, and accordingly, the respective four properties were released as collateral from the 2024 Credit Facility.
The 2027 NBC Loan has a maturity date of March 7, 2027, which may be extended for additional one-year periods in the discretion of the lenders. The 2027 NBC Loan carries a variable interest rate based on either the Canadian Overnight Repo Rate Average (“CORRA”) or the Canadian Prime Rate. As of September 30, 2024, borrowings under the 2027 NBC Loan were subject to interest at the CORRA rate, plus a CORRA adjustment of approximately 0.30%, plus a spread of 2.20%.
On March 12, 2024, we entered into an interest rate swap agreement based on CORRA with NBC whereby, inclusive of the swap we fixed the interest rate on the NBC loan at 6.42% for the initial three year term of the loan. The 2027 NBC Loan requires monthly amortizing principal and interest payments, which are based on a 25-year amortization schedule. The 2027 NBC Loan may be prepaid, in whole or in part, at any time upon prior written notice to the lenders, subject to interest rate swap breakage costs. SmartStop and the 2027 NBC Loan Borrowers provided an ordinary course environmental indemnity in favor of NBC and the lenders. SmartStop serves as a non-recourse guarantor, and each borrower provided a limited recourse guaranty up to the amount of the collateral pledged by it, under the 2027 NBC Loan.
2032 Private Placement Notes
On April 19, 2022, we as guarantor, and our Operating Partnership as issuer, entered into a note purchase agreement (the “Note Purchase Agreement”) which provides for the private placement of $150 million of 4.53% Senior Notes due April 19, 2032 (the “2032 Private Placement Notes”). The sale and purchase of the 2032 Private Placement Notes occurred in two closings, with the first of such closings having occurred on April 19, 2022 with $75 million aggregate principal amount of the 2032 Private Placement Notes having been issued on such date (the “First Closing”) and the second of such closings having occurred on May 25, 2022 with $75 million aggregate principal amount of the 2032 Private Placement Notes having been issued on such date (the “Second Closing”). Interest on each series of the 2032 Private Placement Notes is payable semiannually on the nineteenth day of April and October in each year.
Interest payable on the Notes was originally subject to a prospective 75 basis points increase, if, as of March 31, 2023, the ratio of total indebtedness to EBITDA (the “Total Leverage Ratio”) of the Company and its subsidiaries, on a consolidated basis, was greater than 7.00 to 1.00 (a “Total Leverage Ratio Event”).
As of March 31, 2023, such Total Leverage Ratio Event occurred, and our 2032 Private Placement Notes began accruing interest at a rate of 5.28%. The interest accruing on the 2032 Private Placement Notes will
F-114
SMARTSTOP SELF STORAGE REIT, INC. AND SUBSIDIARIES
NOTES TO CONSOLIDATED FINANCIAL STATEMENTS
continue to accrue at 5.28% until such time as the Total Leverage Ratio is less than or equal to 7.00 to 1.00 for two consecutive fiscal quarters, upon such achievement, the applicable fixed interest rate will revert to 4.53% and remain at that interest rate through maturity, regardless of our future Total Leverage Ratio.
We are permitted to prepay at any time all, or from time to time, any part of the Notes in amounts not less than 5% of the 2032 Private Placement Notes then outstanding at (i) 100% of the principal amount so prepaid and (ii) the make-whole amount (as defined in the Note Purchase Agreement). The “Make-Whole Amount” is equal to the excess, if any, of the discounted value of the remaining scheduled payments with respect to the 2032 Private Placement Notes being prepaid over the amount of such 2032 Private Placement Notes. In addition, in connection with a change of control (as defined in the Note Purchase Agreement), the Operating Partnership is required to offer to prepay the 2032 Private Placement Notes at 100% of the principal amount plus accrued and unpaid interest thereon, but without the Make Whole Amount or any other prepayment premium or penalty of any kind. The Company must also maintain a debt rating of the 2032 Private Placement Notes by a rating agency.
The Note Purchase Agreement contains certain customary representations and warranties, affirmative, negative and financial covenants, and events of default that were substantially similar to the previously existing Credit Facility (defined below). The 2032 Private Placement Notes were issued on a pari passu basis with the previously existing Credit Facility, and are pari passu with the 2024 Credit Facility. As such, the Company and certain of its subsidiaries (the “Subsidiary Guarantors”) fully and unconditionally guarantee the Operating Partnership’s obligations under the 2032 Private Placement Notes. The 2032 Private Placement Notes were initially secured by a pledge of equity interests in the Subsidiary Guarantors on similar terms as the previously existing Credit Facility.
On April 26, 2024, we amended the Note Purchase Agreement dated April 19, 2022 (the “NPA Amendment”). The primary purpose of the NPA Amendment was to make certain conforming changes between the Note Purchase Agreement and our recently amended and restated revolving credit facility, the 2024 Credit Facility. In particular, the NPA Amendment conformed certain of the definitions related to the financial tests that we are required to maintain, as well as certain of the property pool covenants we are required to satisfy, in the Note Purchase Agreement during the term thereof to those in the 2024 Credit Facility.
On March 17, 2021, we, through our Operating Partnership (the “Borrower”), entered into a credit facility with KeyBank, National Association, as administrative agent, KeyBanc Capital Markets, Inc., Wells Fargo Securities, Citibank, N.A., and BMO Capital Markets, Corp., as joint book runners and joint lead arrangers, and certain other lenders party thereto (the “Credit Facility”).
The initial aggregate amount of the Credit Facility was $500 million, which consisted of a $250 million revolving credit facility (the “Credit Facility Revolver”) and a $250 million term loan (the “Credit Facility Term Loan”).
On October 7, 2021, the Borrower and lenders who were party to the Credit Facility amended the Credit Facility to increase the commitment on the Credit Facility by $200 million. In connection with the increased commitment, additional lenders were added to the Credit Facility. As a result of this amendment, the aggregate commitment on the Credit Facility was $700 million.
The Credit Facility was repaid in full on February 22, 2024 in connection with the establishment of the 2024 Credit Facility.
F-115
SMARTSTOP SELF STORAGE REIT, INC. AND SUBSIDIARIES
NOTES TO CONSOLIDATED FINANCIAL STATEMENTS
The following table presents the future principal payments required on outstanding debt as of September 30, 2024 (in thousands):
| | | | |
| | $ | 915 | |
| | | 8,948 | |
| | | 94,333 | |
| | | 706,122 | |
| | | 78,431 | |
| | | 294,500 | |
| | | | |
| | | 1,183,249 | |
| | | (3,345 | ) |
| | | | |
| | | | |
| | | | |
Series A Convertible Preferred Stock
On October 29, 2019 (the “Commitment Date”), we entered into a preferred stock purchase agreement (the “Purchase Agreement”) with Extra Space Storage LP (the “Investor”), a subsidiary of Extra Space Storage Inc. (NYSE: EXR), pursuant to which the Investor committed to purchase up to $200 million in preferred shares (the aggregate shares to be purchased, the “Preferred Shares”) of our new Series A Convertible Preferred Stock (the “Series A Convertible Preferred Stock”), in one or more closings (each, a “Closing,” and collectively, the “Closings”). The initial closing (the “Initial Closing”) in the amount of $150 million occurred on the Commitment Date, and the second and final closing in the amount of $50 million occurred on October 26, 2020. We incurred approximately $3.6 million in issuance costs related to the Series A Convertible Preferred Stock, which were recorded as a reduction to Series A Convertible Preferred stock on our consolidated balance sheets.
The shares of Series A Convertible Preferred Stock rank senior to all other shares of our capital stock, including our common stock, with respect to rights to receive dividends and to participate in distributions or payments upon any voluntary or involuntary liquidation, dissolution or winding up of the Company. Dividends payable on each share of Series A Convertible Preferred Stock were initially equal to a rate of 6.25% per annum. The dividend rate increased by an additional 0.75% per annum to an aggregate of 7.0% per annum on October 29, 2024. The dividend rate will increase an additional 0.75% per annum each year thereafter to a maximum of 9.0% per annum until the tenth anniversary of the Initial Closing, unless the Series A Convertible Preferred Stock is redeemed or repurchased in full. The dividends are payable in arrears for the prior calendar quarter on or before the 15
th
day of March, June, September and December of each year. The Series A Convertible Preferred Stock has not been redeemed and therefore the dividend rate was increased to 7.0% per annum.
Upon any voluntary or involuntary liquidation, dissolution or winding up of the Company, the holders of Series A Convertible Preferred Stock will be entitled to receive a payment equal to the greater of (i) aggregate purchase price of all outstanding Preferred Shares, plus any accrued and unpaid dividends (the “Liquidation Amount”) and (ii) the amount that would have been payable had the Preferred Shares been converted into common stock pursuant to the terms of the Purchase Agreement immediately prior to such liquidation.
Subject to certain additional redemption rights, as described herein, we have the right to redeem the Series A Convertible Preferred Stock for cash. The amount of such redemption will be equal to the Liquidation Amount.
F-116
SMARTSTOP SELF STORAGE REIT, INC. AND SUBSIDIARIES
NOTES TO CONSOLIDATED FINANCIAL STATEMENTS
Upon the listing of our common stock on a national securities exchange (the “Listing”), we have the right to redeem any or all outstanding Series A Convertible Preferred Stock at an amount equal to the greater of (i) the amount that would have been payable had such Preferred Shares been converted into common stock pursuant to the terms of the Purchase Agreement immediately prior to the Listing, and then all of such Preferred Shares were sold in the Listing, or (ii) the Liquidation Amount. Upon a change of control event, we have the right to redeem any or all outstanding Series A Convertible Preferred Stock at an amount equal to the greater of (i) the amount that would have been payable had the Preferred Shares been converted into common stock pursuant to the terms of the Purchase Agreement immediately prior to such change of control or (ii) the Liquidation Amount. In addition, subject to certain cure provisions, if we fail to maintain our status as a real estate investment trust, the holders of Series A Convertible Preferred Stock have the right to require us to repurchase the Series A Convertible Preferred Stock at an amount equal to the Liquidation Amount with no Premium Amount.
Subject to our redemption rights in the event of a listing or change of control described above, the holders of Series A Convertible Preferred Stock have the right to convert any or all of the Series A Convertible Preferred Stock held by such holders into common stock at a rate per share equal to the quotient obtained by dividing the Liquidation Amount by the conversion price. The conversion price is $10.66, as may be adjusted in connection with stock splits, stock dividends and other similar transactions.
The holders of Series A Convertible Preferred Stock are not entitled to vote on any matter submitted to a vote of our stockholders, except that in the event that the dividend for the Series A Convertible Preferred Stock has not been paid for at least four quarters (whether or not consecutive), the holders of Series A Convertible Preferred Stock have the right to vote together with our stockholders on any matter submitted to a vote of our stockholders, upon which the holders of the Series A Convertible Preferred Stock and holders of common stock shall vote together as a single class. The number of votes applicable to a share of Series A Convertible Preferred Stock will be equal to the number of shares of common stock a share of Series A Convertible Preferred Stock could have been converted into as of the record date set for purposes of such stockholder vote.
This foregoing limited voting right shall cease when all past dividend periods have been paid in full. In addition, the affirmative vote of the holders of a majority of the outstanding shares of Series A Convertible Preferred Stock is required in certain customary circumstances, as well as other circumstances, such as (i) our real estate portfolio exceeding a leverage ratio of 60%
(ii) entering into certain transactions with our Chief Executive Officer as of the Commitment Date, or his affiliates, (iii) effecting a merger (or similar) transaction with an entity whose assets are not at least 80% self storage related and (iv) entering into any line of business other than self storage and ancillary businesses, unless such ancillary business represents revenues of less than 10% of our revenues for our last fiscal year.
In connection with the issuance of the Series A Convertible Preferred Stock, we and the Investor also entered into an investors’ rights agreement (the “Investors’ Rights Agreement”) which provides the Investor with certain customary protections, including demand registration rights and “piggyback” registration rights with respect to our common stock issued to the Investor upon conversion of the Preferred Shares.
As of September 30, 2024, there were 200,000 Preferred Shares outstanding with an aggregate liquidation preference of approximately $203.1 million, which consists of $150 million from the Initial Closing, $50 million from a closing on October 26, 2020 and approximately $3.1 million of accumulated and unpaid distributions. As of December 31, 2023, there were 200,000 Preferred Shares outstanding with an aggregate liquidation preference of approximately $203.2 million, which consists of $150 million from the Initial Closing, $50 million from a closing on October 26, 2020 and approximately $3.2 million of accumulated and unpaid distributions.
F-117
SMARTSTOP SELF STORAGE REIT, INC. AND SUBSIDIARIES
NOTES TO CONSOLIDATED FINANCIAL STATEMENTS
Note 7. Derivative Instruments
Interest Rate Derivatives
Our objectives in using interest rate derivatives are to add stability to our earnings (losses) and to manage our exposure to interest rate movements. To accomplish this objective, we have used interest rate swaps and caps as part of our interest rate risk management strategy.
For interest rate derivatives designated and qualified as a hedge for GAAP purposes, the change in the fair value of the effective portion of the derivative is recorded in accumulated other comprehensive income (loss) (“AOCI”) and is subsequently reclassified into earnings in the period that the hedged forecasted transaction affects earnings. Amounts reported in AOCI related to such derivatives will be reclassified to interest expense as interest payments are made on our variable rate debt. In addition, we classify cash flows from qualifying cash flow hedging relationships in the same category as the cash flows from the hedged items in our consolidated statements of cash flows. We do not use interest rate derivatives for trading or speculative purposes.
Interest rate derivatives not designated as hedges for GAAP are not speculative and are used to manage our exposure to interest rate movements and other identified risks but we have elected not to apply hedge accounting. Changes in the fair value of interest rate derivatives not designated in hedging relationships are recorded in other income (expense) within our consolidated statements of operations.
Our objectives in using foreign currency derivatives are to add stability to potential fluctuations in exchange rates between foreign currencies and the U.S. dollar and to manage our exposure to exchange rate movements. To accomplish this objective, we have used foreign currency forwards and foreign currency options as part of our exchange rate risk management strategy. A foreign currency forward contract is a commitment to deliver a certain amount of currency at a certain price on a specific date in the future. By entering into the forward contract and holding it to maturity, we are locked into a future currency exchange rate in an amount equal to and for the term of the forward contract. A foreign currency option contract is a commitment by the seller of the option to deliver, solely at the option of the buyer, a certain amount of currency at a certain price on a specific date.
For derivatives designated as net investment hedges for GAAP purposes, the changes in the fair value of the derivatives are reported in accumulated other comprehensive income. Amounts are reclassified out of accumulated other comprehensive income (loss) into earnings when the hedged net investment is either sold or substantially liquidated. The change in the value of the designated portion of our settled and unsettled foreign currency hedges is recorded net in foreign currency hedge contract gain (loss) in our consolidated statements of comprehensive income (loss) in the related period.
The change in the value of the portion of our settled and unsettled foreign currency hedges that are not designated for hedge accounting for GAAP is recorded in other income (expense) within our consolidated statements of operations and represented a loss of approximately $0.4 million and a gain of approximately $3.8 million for the three months ended September 30, 2024 and 2023, respectively, and a gain of approximately $1.3 million and $0.6 million for the nine months ended September 30, 2024 and 2023, respectively.
On April 12, 2021, we entered into an approximately $125.9 million CAD currency forward with a settlement date of April 12, 2023. On April 12, 2023, we settled this foreign currency forward and received approximately USD $6.4 million, and simultaneously entered into a new approximately $134.4 million CAD
F-118
SMARTSTOP SELF STORAGE REIT, INC. AND SUBSIDIARIES
NOTES TO CONSOLIDATED FINANCIAL STATEMENTS
currency forward with a maturity date of July 6, 2023. On July 5, 2023, we settled this foreign currency forward and paid approximately USD $1.2 million, and simultaneously entered into a new approximately $132.4 million CAD currency forward with a settlement date of April 12, 2024.
On April 12, 2024, we settled this hedge and we received approximately USD $3.5 million. We simultaneously entered into a new foreign currency hedge with a notional amount of $136,476,000 CAD at a strike rate of 1.3648 which matures on April 11, 2025.
On October 12, 2022, we entered into a new $137.7 million CAD currency forward with a settlement date of October 12, 2023. On October 11, 2023, we rolled this hedge without any cash settlement, extending the maturity date to November 9, 2023 at a strike rate of 1.3766, and notional of $137,664,000 CAD. On November 9, 2023, we rolled this hedge without any cash settlement, extending the maturity date to November 16, 2023 at a strike rate of 1.3767, and notional of $137,669,000 CAD. On November 16, 2023, this hedge matured, and without any cash settlement, we simultaneously entered into a new $30.0 million CAD currency forward with a maturity date of January 16, 2024, and a strike rate of 1.3782. On January 16, 2024 we rolled this hedge without any cash settlement, effectively extending the maturity date to February 15, 2024 at a strike rate of 1.3781. Additionally, on February 16, 2024 we further rolled this hedge without any cash settlement at a strike rate of 1.3781. This hedge ultimately matured on March 7, 2024 whereby we owed and paid approximately $0.5 million at settlement.
In connection with the 2027 NBC Loan borrowing, on March 12, 2024, we entered into a CORRA Swap with NBC with an initial notional amount of CAD $75,000,000 at a rate of 3.926% for the initial duration of the 2027 NBC Loan, maturing on March 7, 2027. The amortization of this swap corresponds with the amortizing principal payments on the related loan.
On May 1, 2024, to hedge our exposure to potentially rising interest rates, we entered into three SOFR interest rate caps for a total of approximately $8.2 million. We deferred payment for these SOFR interest rate caps, and are recording these interest rate caps net of such deferred payment liability on our balance sheet.
The following table summarizes the terms of our de
rivat
ive financial instruments as of September 30, 2024 (in thousands):
| | | | | | | | | | | | | | |
| | | | | | | | | Effective Date or
Date Assumed | | | |
Interest Rate Derivatives: | | | | | | | | | | | | | | |
| | $ | 100,000 | | | | 4.75 | % | | December 1, 2022 | | | December 1, 2025 | |
| | $ | 100,000 | | | | 4.75 | % | | December 1, 2022 | | | December 2, 2024 | |
| | $ | 100,000 | | | | 4.75 | % | | December 1, 2022 | | | December 2, 2024 | |
| | $ | 100,000 | | | | 1.50 | % | | May 1, 2024 | | | May 1, 2025 | |
| | $ | 100,000 | | | | 2.00 | % | | July 1, 2024 | | | July 1, 2025 | |
| | $ | 200,000 | | | | 5.50 | % | | December 2, 2024 | | | December 1, 2026 | |
| | $ | 74,204 | | | | 3.93 | % | | March 12, 2024 | | | March 7, 2027 | |
Foreign Currency Forwards: | | | | | | | | | | | | | | |
| | $ | 136,746 | | | | 1.3648 | | | April 12, 2024 | | | April 11, 2025 | |
| (1) | We deferred payment on this SOFR cap until its maturity. |
| (2) | We deferred payment on this SOFR cap until January 2, 2025, at which point, monthly payments will become due on the first of each month until the date of its maturity. |
| (3) | Notional amounts shown are denominated in CAD. |
F-119
SMARTSTOP SELF STORAGE REIT, INC. AND SUBSIDIARIES
NOTES TO CONSOLIDATED FINANCIAL STATEMENTS
The following table summarizes the terms of our derivative financial instruments as of December 31, 2023 (in thousands):
| | | | | | | | | | | | | | | | |
| | | | | | | | |
| | | | |
Interest Rate Derivatives: | | | | | | | | | | | | | | | | |
| | $ | 125,000 | | | | 2.00 | % | | | June 1, 2022 | | | | June 28, 2024 | |
| | $ | 100,000 | | | | 4.75 | % | | | December 1, 2022 | | | | December 1, 2025 | |
| | $ | 100,000 | | | | 4.75 | % | | | December 1, 2022 | | | | December 2, 2024 | |
| | $ | 100,000 | | | | 4.75 | % | | | December 1, 2022 | | | | December 2, 2024 | |
Foreign Currency Forwards: | | | | | | | | | | | | | | | | |
| | $ | 132,350 | | | | 1.3273 | | | | July 5, 2023 | | | | April 12, 2024 | |
| | $ | 30,000 | | | | 1.3782 | | | | November 16, 2023 | | | | January 16, 2024 | |
| (1) | Notional amount shown is denominated in CAD. |
The following table presents a gross presentation of the fair value of our derivative financial instruments as well as their classification on our consolidated balance sheets as of September 30, 2024 and December 31, 2023 (in thousands):
| | | | | | | | |
| | | Asset/Liability Derivatives
| |
| | | | | | |
Interest Rate Derivatives | | | | | | | | |
| | $ | 202 | | | $ | 3,485 | |
Accounts payable and accrued liabilities (1) | | $ | 5,656 | | | $ | — | |
| | | | | | | | |
Accounts payable and accrued liabilities | | $ | 1,326 | | | $ | 985 | |
| (1) | Included herein is the value of certain SOFR interest rate caps, net of approximately $8.2 million in deferred payments, as well as the fair value of our CORRA swap. |
F-120
SMARTSTOP SELF STORAGE REIT, INC. AND SUBSIDIARIES
NOTES TO CONSOLIDATED FINANCIAL STATEMENTS
The following tables presents the effect of our derivative financial instruments designated for hedge accounting on our consolidated statements of operations for the periods presented (in thousands):
| | | | | | | | | | | | | | | | | | |
| | | Gain (loss) recognized in OCI
for the three months ended
September 30, | | | Location of amounts
reclassified from
OCI into income | | Gain (loss) reclassified from OCI
for the three months ended
September 30, | |
| | | | | | | | | | | | | | |
| | $ | (1,133 | ) | | $ | — | | | Interest expense | | $ | 87 | | | $ | — | |
| | | (322 | ) | | | 162 | | | Interest expense | | | 81 | | | | 802 | |
Foreign Currency Forwards | | | (538 | ) | | | 1,243 | | | N/A | | | — | | | | — | |
| | | | | | | | | | | | | | | | | | |
| | $ | (1,993 | ) | | $ | 1,405 | | | | | $ | 168 | | | $ | 802 | |
| | | | | | | | | | | | | | | | | | |
| | | |
| | | Gain (loss) recognized in OCI
for the nine months ended
September 30, | | | Location of amounts
reclassified from
OCI into income | | Gain (loss) reclassified from OCI
for the nine months ended
September 30, | |
| | | | | | | | | | | | | | |
| | $ | (1,181 | ) | | $ | — | | | Interest expense | | $ | 273 | | | $ | 51 | |
| | | 313 | | | | 1,533 | | | Interest expense | | | 1,799 | | | | 3,065 | |
Foreign Currency Forwards | | | 1,322 | | | | 189 | | | N/A | | | — | | | | — | |
| | | | | | | | | | | | | | | | | | |
| | $ | 454 | | | $ | 1,722 | | | | | $ | 2,072 | | | $ | 3,116 | |
| | | | | | | | | | | | | | | | | | |
Based on the forward rates in effect as of September 30, 2024, we estimate that approximately $0.9 million related to our qualifying cash flow hedges will be reclassified to increase interest expense during the next 12 months.
As a REIT, we gener
all
y will not be subject to U.S. federal income tax on taxable income that we distribute to our stockholders. However, certain of our consolidated subsidiaries are taxable REIT subsidiaries, which are subject to federal, state and foreign income taxes. We have filed an election to treat our primary TRS as a taxable REIT subsidiary effective January 1, 2014. In general, our TRS performs additional services for our customers and provides the advisory and property management services to the Managed REITs and otherwise generally engages in
non-real
estate related business. The TRS is subject to corporate U.S. federal and state income tax. Additionally, we own and operate a number of self storage properties located throughout Canada, the income of which is generally subject to income taxes under the laws of Canada.
F-121
SMARTSTOP SELF STORAGE REIT, INC. AND SUBSIDIARIES
NOTES TO CONSOLIDATED FINANCIAL STATEMENTS
The following is a summary of our income tax expense (benefit) for the three and nine months ended September 30, 2024 and 2023 (in
thousands
):
| | | | | | | | | | | | | | | | |
| | | For the three months ended
September 30, 2024 | |
| | | | | | | | | | | | | |
| | $ | 17 | | | $ | 12 | | | $ | 144 | | | $ | 173 | |
| | | 68 | | | | 1 | | | | 162 | | | | 231 | |
| | | | | | | | | | | | | | | | |
| | $ | 85 | | | $ | 13 | | | $ | 306 | | | $ | 404 | |
| | | | | | | | | | | | | | | | |
| |
| | | For the three months ended
September 30, 2023 | |
| | | | | | | | | | | | | |
| | $ | 117 | | | $ | 20 | | | $ | 155 | | | $ | 292 | |
| | | (2 | ) | | | (1 | ) | | | (1,339 | ) | | | (1,342 | ) |
| | | | | | | | | | | | | | | | |
Total income tax expense (benefit) | | $ | 115 | | | $ | 19 | | | $ | (1,184 | ) | | $ | (1,050 | ) |
| | | | | | | | | | | | | | | | |
| |
| | | For the nine months ended
September 30, 2024 | |
| | | | | | | | | | | | | |
| | $ | 17 | | | $ | 30 | | | $ | 444 | | | $ | 491 | |
| | | 192 | | | | 4 | | | | 406 | | | | 602 | |
| | | | | | | | | | | | | | | | |
| | $ | 209 | | | $ | 34 | | | $ | 850 | | | $ | 1,093 | |
| | | | | | | | | | | | | | | | |
| |
| | | For the nine months ended
September 30, 2023 | |
| | | | | | | | | | | | | |
| | $ | 209 | | | $ | 38 | | | $ | 373 | | | $ | 620 | |
| | | (8 | ) | | | (1 | ) | | | (1,518 | ) | | | (1,527 | ) |
| | | | | | | | | | | | | | | | |
Total income tax expense (benefit) | | $ | 201 | | | $ | 37 | | | $ | (1,145 | ) | | $ | (907 | ) |
| | | | | | | | | | | | | | | | |
The major sources of temporary differences that give rise to the deferred tax effects are shown below (in
thousands
):
| | | | | | | | |
| | | | | | | |
Deferred tax liabilities: | | | | | | | | |
Intangible contract assets | | $ | (9 | ) | | $ | (18 | ) |
| | | (9,707 | ) | | | (9,887 | ) |
| | | | | | | | |
Total deferred tax liability | | | (9,716 | ) | | | (9,905 | ) |
| | | | | | | | |
| | | | | | | | |
| | | 1,654 | | | | 1,267 | |
Canadian real estate and non-capital losses | | | 8,044 | | | | 7,561 | |
Total deferred tax assets | | | 9,698 | | | | 8,828 | |
| | | | | | | | |
| | | (1,685 | ) | | | (667 | ) |
| | | | | | | | |
Net deferred tax liabilities | | | | | | | | |
| | | | | | | | |
F-122
SMARTSTOP SELF STORAGE REIT, INC. AND SUBSIDIARIES
NOTES TO CONSOLIDATED FINANCIAL STATEMENTS
The Canadian
non-capital
losses expire between 2032 and 2043. As of September 30, 2024 and December 31, 2023, the Company had Canadian
non-capital
loss carry forwards of approximately $22.9 million and $24.9 million, respectively. As of September 30, 2024 and December 31, 2023, we had a valuation allowance of approximately $1.7 million and $0.7 million, respectively, related to non-capital loss carry-forwards and other deferred tax assets at certain of our Canadian properties.
Note 9. Segment Disclosures
We operate in two reportable business segments: (i) self storage operations and (ii) our Managed REIT Platform business.
Management evaluates performance based upon property net operating income (“NOI”). For our self storage operations, NOI is defined as leasing and related revenues, less property level operating expenses. NOI for the Company’s Managed REIT Platform business represents Managed REIT Platform revenues less Managed REIT Platform expenses.
The following tables summarize information for the reportable segments for the periods presented (in thousands):
| | | | | | | | | | | | | | | | |
| | | Three Months Ended September 30, 2024 | |
| | | | | | | | | | | | | |
| | | | | | | | | | | | | | | | |
Self storage rental revenue | | $ | 52,921 | | | $ | — | | | $ | — | | | $ | 52,921 | |
Ancillary operating revenue | | | 2,457 | | | | — | | | | — | | | | 2,457 | |
Managed REIT Platform revenue | | | — | | | | 2,923 | | | | — | | | | 2,923 | |
Reimbursable costs from Managed REITs | | | — | | | | 1,856 | | | | — | | | | 1,856 | |
| | | | | | | | | | | | | | | | |
| | | 55,378 | | | | 4,779 | | | | — | | | | 60,157 | |
| | | | | | | | | | | | | | | | |
| | | | | | | | | | | | | | | | |
Property operating expenses | | | 18,249 | | | | — | | | | — | | | | 18,249 | |
Managed REIT Platform expense | | | — | | | | 1,053 | | | | — | | | | 1,053 | |
Reimbursable costs from Managed REITs | | | — | | | | 1,856 | | | | — | | | | 1,856 | |
General and administrative | | | — | | | | — | | | | 7,210 | | | | 7,210 | |
| | | 13,592 | | | | — | | | | 244 | | | | 13,836 | |
Intangible amortization expense | | | 202 | | | | 13 | | | | — | | | | 215 | |
| | | 38 | | | | — | | | | — | | | | 38 | |
| | | | | | | | | | | | | | | | |
| | | 32,081 | | | | 2,922 | | | | 7,454 | | | | 42,457 | |
| | | | | | | | | | | | | | | | |
Income (loss) from operations | | | 23,297 | | | | 1,857 | | | | (7,454 | ) | | | 17,700 | |
| | | | | | | | | | | | | | | | |
Equity in earnings (losses) from investments in joint ventures | | | — | | | | — | | | | (380 | ) | | | (380 | ) |
Equity in earnings (losses) from investments in Managed REITs | | | — | | | | (248 | ) | | | — | | | | (248 | ) |
| | | (1,976 | ) | | | — | | | | (5 | ) | | | (1,981 | ) |
| | | 263 | | | | 760 | | | | — | | | | 1,023 | |
| | | (19,061 | ) | | | — | | | | (41 | ) | | | (19,102 | ) |
Income tax (expense) benefit | | | (333 | ) | | | (75 | ) | | | 4 | | | | (404 | ) |
| | | | | | | | | | | | | | | | |
| | | | | | | | | | | | | | | | |
| | | | | | | | | | | | | | | | |
F-123
SMARTSTOP SELF STORAGE REIT, INC. AND SUBSIDIARIES
NOTES TO CONSOLIDATED FINANCIAL STATEMENTS
| | | | | | | | | | | | | | | | |
| | | Three Months Ended September 30, 2023 | |
| | | | | | | | | | | | | |
| | | | | | | | | | | | | | | | |
Self storage rental revenue | | $ | 52,502 | | | $ | — | | | $ | — | | | $ | 52,502 | |
Ancillary operating revenue | | | 2,255 | | | | — | | | | — | | | | 2,255 | |
Managed REIT Platform revenue | | | — | | | | 2,518 | | | | — | | | | 2,518 | |
Reimbursable costs from Managed REITs | | | — | | | | 1,430 | | | | — | | | | 1,430 | |
| | | | | | | | | | | | | | | | |
| | | 54,757 | | | | 3,948 | | | | — | | | | 58,705 | |
| | | | | | | | | | | | | | | | |
| | | | | | | | | | | | | | | | |
Property operating expenses | | | 16,317 | | | | — | | | | — | | | | 16,317 | |
Managed REIT Platform expense | | | — | | | | 1,307 | | | | — | | | | 1,307 | |
Reimbursable costs from Managed REITs | | | — | | | | 1,430 | | | | — | | | | 1,430 | |
General and administrative | | | — | | | | — | | | | 6,277 | | | | 6,277 | |
| | | 13,196 | | | | — | | | | 231 | | | | 13,427 | |
Intangible amortization expense | | | 1,683 | | | | 49 | | | | — | | | | 1,732 | |
| | | 76 | | | | — | | | | — | | | | 76 | |
| | | | | | | | | | | | | | | | |
| | | 31,272 | | | | 2,786 | | | | 6,508 | | | | 40,566 | |
Income (loss) from operations | | | 23,485 | | | | 1,162 | | | | (6,508 | ) | | | 18,139 | |
| | | — | | | | — | | | | — | | | | | |
Equity in earnings (losses) from investments in joint ventures | | | — | | | | — | | | | (274 | ) | | | (274 | ) |
Equity in earnings (losses) from investments in Managed REITs | | | — | | | | (444 | ) | | | — | | | | (444 | ) |
| | | (245 | ) | | | 149 | | | | (170 | ) | | | (266 | ) |
| | | 151 | | | | 548 | | | | — | | | | 699 | |
| | | (15,883 | ) | | | — | | | | (42 | ) | | | (15,925 | ) |
Income tax (expense) benefit | | | 1,163 | | | | (106 | ) | | | (7 | ) | | | 1,050 | |
| | | | | | | | | | | | | | | | |
| | | | | | | | | | | | | | | | |
| | | | | | | | | | | | | | | | |
| | | | | | | | | | | | | | | | |
| | | Nine Months Ended September 30, 2024 | |
| | | | | | | | | | | | | |
| | | | | | | | | | | | | | | | |
Self storage rent al re venue | | $ | 156,050 | | | $ | — | | | $ | — | | | $ | 156,050 | |
Ancillary operating revenue | | | 6,973 | | | | — | | | | — | | | | 6,973 | |
Managed REIT Platform revenue | | | — | | | | 8,328 | | | | — | | | | 8,328 | |
Reimbursable costs from Managed REITs | | | — | | | | 5,011 | | | | — | | | | 5,011 | |
| | | | | | | | | | | | | | | | |
| | | 163,023 | | | | 13,339 | | | | — | | | | 176,362 | |
| | | | | | | | | | | | | | | | |
| | | | | | | | | | | | | | | | |
Property operating expenses | | | 53,334 | | | | — | | | | — | | | | 53,334 | |
Managed REIT Platform expense | | | — | | | | 2,552 | | | | — | | | | 2,552 | |
Reimbursable costs from Managed REITs | | | — | | | | 5,011 | | | | — | | | | 5,011 | |
General and administrative | | | — | | | | — | | | | 22,449 | | | | 22,449 | |
| | | 40,348 | | | | — | | | | 709 | | | | 41,057 | |
Intangible amortization expense | | | 350 | | | | 111 | | | | — | | | | 461 | |
| | | 121 | | | | — | | | | — | | | | 121 | |
| | | | | | | | | | | | | | | | |
| | | 94,153 | | | | 7,674 | | | | 23,158 | | | | 124,985 | |
| | | | | | | | | | | | | | | | |
Income (loss) from operations | | | 68,870 | | | | 5,665 | | | | (23,158 | ) | | | 51,377 | |
| | | | | | | | | | | | | | | | |
Equity in earnings (losses) from investments in joint ventures | | | — | | | | — | | | | (1,068 | ) | | | (1,068 | ) |
Equity in earnings (losses) from investments in Managed REITs | | | — | | | | (957 | ) | | | — | | | | (957 | ) |
| | | (2,891 | ) | | | — | | | | (58 | ) | | | (2,949 | ) |
| | | 758 | | | | 1,617 | | | | — | | | | 2,375 | |
| | | (52,826 | ) | | | — | | | | (123 | ) | | | (52,949 | ) |
Loss on debt extinguishment | | | (471 | ) | | | — | | | | — | | | | (471 | ) |
Income tax (expense) benefit | | | (862 | ) | | | (210 | ) | | | (21 | ) | | | (1,093 | ) |
| | | | | | | | | | | | | | | | |
| | | | | | | | | | | | | | | | |
| | | | | | | | | | | | | | | | |
F-124
SMARTSTOP SELF STORAGE REIT, INC. AND SUBSIDIARIES
NOTES TO CONSOLIDATED FINANCIAL STATEMENTS
| | | | | | | | | | | | | | | | |
| | | Nine Months Ended September 30, 2023 | |
| | | | | | | | | | | | | |
| | | | | | | | | | | | | | | | |
Self storage rental revenue | | $ | 155,457 | | | $ | — | | | $ | — | | | $ | 155,457 | |
Ancillary operating revenue | | | 6,626 | | | | — | | | | — | | | | 6,626 | |
Managed REIT Platform revenue | | | — | | | | 9,115 | | | | — | | | | 9,115 | |
Reimbursable costs from Managed REITs | | | — | | | | 4,232 | | | | — | | | | 4,232 | |
| | | | | | | | | | | | | | | | |
| | | 162,083 | | | | 13,347 | | | | — | | | | 175,430 | |
| | | | | | | | | | | | | | | | |
| | | | | | | | | | | | | | | | |
Property operating expenses | | | 49,333 | | | | — | | | | — | | | | 49,333 | |
Managed REIT Platform expense | | | — | | | | 2,538 | | | | — | | | | 2,538 | |
Reimbursable costs from Managed REITs | | | — | | | | 4,232 | | | | — | | | | 4,232 | |
General and administrative | | | — | | | | — | | | | 19,996 | | | | 19,996 | |
| | | 39,425 | | | | — | | | | 650 | | | | 40,075 | |
Intangible amortization expense | | | 5,340 | | | | 147 | | | | — | | | | 5,487 | |
| | | 118 | | | | — | | | | — | | | | 118 | |
| | | | | | | | | | | | | | | | |
| | | 94,216 | | | | 6,917 | | | | 20,646 | | | | 121,779 | |
| | | | | | | | | | | | | | | | |
Income (loss) from operations | | | 67,867 | | | | 6,430 | | | | (20,646 | ) | | | 53,651 | |
| | | | | | | | | | | | | | | | |
Equity in earnings (losses) from investments in joint ventures | | | — | | | | — | | | | (1,215 | ) | | | (1,215 | ) |
Equity in earnings (losses) from investments in Managed REITs | | | — | | | | (894 | ) | | | — | | | | (894 | ) |
| | | (30 | ) | | | 156 | | | | (287 | ) | | | (161 | ) |
| | | 157 | | | | 2,380 | | | | — | | | | 2,537 | |
| | | (45,408 | ) | | | — | | | | (126 | ) | | | (45,534 | ) |
Income tax (expense) benefit | | | 706 | | | | (199 | ) | | | 400 | | | | 907 | |
| | | | | | | | | | | | | | | | |
| | | | | | | | | | | | | | | | |
| | | | | | | | | | | | | | | | |
The following table summarizes our total assets by segment (in thousands):
| | | | | | | | |
| | | | | | |
| | $ | 1,802,103 | | | $ | 1,798,511 | |
| | | 58,244 | | | | 41,761 | |
| | | 76,859 | | | | 55,369 | |
| | | | | | | | |
| | $ | 1,937,206 | | | $ | 1,895,641 | |
| | | | | | | | |
| (1) | Included in the assets of the Self Storage segment as of September 30, 2024 and December 31, 2023 was approximately $52.2 million of goodwill. Additionally, as of September 30, 2024 and December 31, 2023, there were no accumulated impairment charges to goodwill within the Self Storage segment. |
| (2) | Included in the assets of the Managed REIT Platform segment as of September 30, 2024 and December 31, 2023 was approximately $1.4 million of goodwill. Such goodwill is net of accumulated impairment charges in the Managed REIT Platform segment of approximately $24.7 million, which relates to the impairment charge recorded during the quarter ended March 31, 2020. |
| (3) | Other than our investments in and advances to Managed REITs and investments in joint ventures, substantially all of our investments in real estate facilities and intangible assets as of September 30, 2024 and December 31, 2023, respectively, were associated with our self storage platform. |
As of September 30, 2024 and December 31, 2023, approximately $166.5 million and $174 million, respectively, of our assets in the self storage segment related to our operations in Canada. For the three and nine
F-125
SMARTSTOP SELF STORAGE REIT, INC. AND SUBSIDIARIES
NOTES TO CONSOLIDATED FINANCIAL STATEMENTS
months ended September 30, 2024, approximately $5.8 million and $16.9 million, respectively, of our revenues in the self storage segment related to our operations in Canada. For the three and nine months ended September 30, 2023, approximately $5.7 million and $16.6 million, respectively, of our revenues in the self storage segment related to our operations in Canada. Substantially all of our operations related to the management fees we generate through our management contracts with the Managed REITs are performed in the U.S.; accordingly substantially all of our assets and revenues related to our Managed REIT segment are based in the U.S. as well.
As of September 30, 2024 and December 31, 2023, approximately $36.7 million and $35.8 million, respectively, of our assets in the Corporate and Other segment in the table above relate to our JV Properties which operate in Canada. For the nine months ended September 30, 2024 and 2023, approximately $1.1 million and $1.2 million of losses, respectively, relate to these JV Properties’ operations in Canada.
Note 10. Related Party Transactions
Self Administration Transaction
On June 28, 2019, we, our Operating Partnership and our TRS entered into a series of transactions, agreements, and amendments to our existing agreements and arrangements with our then-sponsor, SAM, and SmartStop OP Holdings, LLC (“SS OP Holdings”), a subsidiary of SAM, pursuant to which, effective June 28, 2019, we acquired the self storage advisory, asset management and property management businesses and certain joint venture interests of SAM, along with certain other assets of SAM (collectively, the “Self Administration Transaction”).
As a result of the Self Administration Transaction, we became self-managed and succeeded to the advisory, asset management and property management businesses and certain joint ventures previously in place for us, SST IV (until the SST IV Merger Date), and SSGT II (until the SSGT II Merger Date), and we acquired the internal capability to originate, structure and manage additional future self storage investment products which would be sponsored by SmartStop REIT Advisors, LLC (“SRA”), our indirect subsidiary. The transfer agent agreement described below was not impacted by the Self Administration Transaction.
Our Chief Executive Officer, who is also the Chairman of our board of directors, holds ownership interests in and is an officer of SAM, and other affiliated entities. Our Chief Executive Officer also previously indirectly held an ownership interest in our former dealer manager. Previously, certain of our executive officers and another member of our board of directors held ownership interests in and/or were officers of SAM, and other affiliated entities. Accordingly, any agreements or transactions we have entered into with such entities may present a conflict of interest. None of SAM and its affiliates or our directors or executive officers receive any compensation, fees or reimbursements from our Managed REITs, other than with respect to fees and reimbursements in accordance with the Administrative Services Agreement and the transfer agent agreement, or as otherwise described in this section.
Former Transfer Agent Agreement
SAM owns 100% of the membership interests of Strategic Transfer Agent Services, LLC, our former transfer agent (“Transfer Agent”), which is a registered transfer agent with the SEC. Pursuant to our transfer agent agreement, our Transfer Agent provided transfer agent and registrar services to us. These services were substantially similar to what a third party transfer agent would provide in the ordinary course of performing its
F-126
SMARTSTOP SELF STORAGE REIT, INC. AND SUBSIDIARIES
NOTES TO CONSOLIDATED FINANCIAL STATEMENTS
functions as a transfer agent, including, but not limited to: providing customer service to our stockholders, processing the distributions and any servicing fees with respect to our shares and issuing regular reports to our stockholder. We believe that our Transfer Agent, through its knowledge and understanding of the direct participation program industry which includes
non-traded
REITs, was particularly suited to provide us with transfer agent and registrar services.
Fees paid to our Transfer Agent included a fixed quarterly fee,
one-time
account setup fees, monthly open account fees and fees for investor inquiries. In addition, we reimbursed our Transfer Agent for all reasonable expenses or other charges incurred by it in connection with the provision of its services to us, and we paid our Transfer Agent fees for any additional services that we requested from time to time, in accordance with its rates then in effect.
Effective as of April 29, 2024, we transitioned to a new transfer agent, SS&C GIDS, Inc. In connection with such transfer, we simultaneously terminated the transfer agent agreement with Strategic Transfer Agent Services, LLC. In lieu of a termination fee and in recognition of the additional cost and expenses incurred by our former transfer agent in connection with the transition, we paid a transition fee of $150,000 to Strategic Transfer Agent Services, LLC in May 2024.
Pursuant to the terms of the agreements described above, the following table summarizes related party costs incurred and paid by us for the year ended December 31, 2023 and the nine months ended September 30, 2024, as well as any related amounts payable as of December 31, 2023 and September 30, 2024 (in thousands):
| | | | | | | | | | | | | | | | | | | | | | | | |
| | | Year Ended December 31, 2023 | | | Nine Months Ended September 30, 2024 | |
| | | | | | | | | | | | | | | | | | | |
| | | | | | | | | | | | | | | | | | | | | | | | |
| | $ | 1,479 | | | $ | 1,473 | | | $ | 75 | | | $ | 648 | | | $ | 693 | | | $ | 30 | |
| | | | | | | | | | | | | | | | | | | | | | | | |
| | | — | | | | — | | | | 341 | | | | — | | | | — | | | | 341 | |
| | | | | | | | | | | | | | | | | | | | | | | | |
| | $ | 1,479 | | | $ | 1,473 | | | $ | 416 | | | $ | 648 | | | $ | 693 | | | $ | 371 | |
| | | | | | | | | | | | | | | | | | | | | | | | |
Acquisition of Self Storage Platform from SAM and Other Transactions
As a result of the Self Administration Transaction, we acquired the self storage sponsorship platform of SAM. Accordingly, the advisor and property manager entities of SST IV and SSGT II became our indirect subsidiaries, and we became entitled to receive various fees and expense reimbursements under the terms of the SST IV and SSGT II advisory and property management agreements as described below. In addition, we now also own the advisor and property manager entities of SST VI and SSGT III and are entitled to receive various fees and expense reimbursements under the terms of the SST VI and SSGT III advisory and property management agreements as described below.
Our indirect subsidiaries, the SST VI Advisor, and the SSGT III Advisor are or were entitled to receive various fees and expense reimbursements under the terms of the SST VI, and SSGT III advisory agreements.
F-127
SMARTSTOP SELF STORAGE REIT, INC. AND SUBSIDIARIES
NOTES TO CONSOLIDATED FINANCIAL STATEMENTS
SST VI Advisory Agreement
The SST VI Advisor provides acquisition and advisory services to SST VI pursuant to an advisory agreement (the “SST VI Advisory Agreement”). In connection with the SST VI private placement offering, SST VI was required to reimburse the SST VI Advisor for organization and offering costs from the SST VI private offering pursuant to the SST VI private offering advisory agreement.
Pursuant to the SST VI Advisory Agreement, the SST VI Advisor receives acquisition fees equal to 1.00% of the contract purchase price of each property SST VI acquires plus reimbursement of any acquisition expenses that SST VI Advisor incurs. The SST VI Advisor also receives a monthly asset management fee equal to 0.0625%, which is
one-twelfth
of 0.75%, of SST VI’s aggregate asset value, as defined. The SST VI Advisor is also potentially entitled to receive a disposition fee if a substantial amount of services are performed by the SST VI Advisor, as determined by a majority of SST VI’s independent directors, equal to the lesser of 1% of the contract sales price for any properties sold or 50% of the competitive real estate commission; however in no event shall the total real estate commissions paid exceed 6% of the contract sales price.
A subsidiary of our Operating Partnership may also be potentially entitled to a subordinated distribution through its ownership of a special limited partnership in SST VI OP if SST VI (1) lists its shares of common stock on a national exchange, (2) terminates the SST VI Advisory Agreement, (3) liquidates its portfolio, or (4) merges with another entity or enters into an Extraordinary Transaction, as defined in SST VI OP’s limited partnership agreement.
The SST VI Advisory Agreement provides for reimbursement of the SST VI Advisor’s direct and indirect costs of providing administrative and management services to SST VI. Beginning four fiscal quarters after commencement of SST VI’s public offering, which was declared effective March 17, 2022, the SST VI Advisor was required to pay or reimburse SST VI the amount by which SST VI’s aggregate annual operating expenses, as defined, exceed the greater of 2% of SST VI’s average invested assets or 25% of SST VI’s net income, as defined, unless a majority of SST VI’s independent directors determine that such excess expenses were justified based on unusual and
non-recurring
factors.
Pacific Oak Holding Group, LLC, is a 17.5%
non-voting
member of the SST VI Advisor. Pacific Oak Capital Markets, LLC (a subsidiary of Pacific Oak Holding Group, LLC) is SST VI’s dealer manager, and as such, is responsible for the marketing of SST VI shares being offered pursuant to SST VI’s private offering, and subsequent to March 17, 2022, SST VI’s public offering. Separately, we through one of our subsidiaries agreed to pay SST VI’s dealer manager an amount equal to 1.5% of the gross offering proceeds from the sale of Class Z shares sold in its public offering. For the three and nine months ended September 30, 2024, we had incurred approximately $13,000 and $29,000, respectively, to SST VI’s dealer manager associated with the Class Z shares sold in its public offering.
SSGT III Advisory Agreement
The SSGT III Advisor provides acquisition and advisory services to SSGT III pursuant to an advisory agreement (the “SSGT III Advisory Agreement”). In connection with the SSGT III private placement offering, which became effective on May 18, 2022, SSGT III is required to reimburse the SSGT III Advisor for organization and offering costs from the SSGT III private offering pursuant to the SSGT III Advisory Agreement.
Pursuant to the SSGT III Advisory Agreement, the SSGT III Advisor will receive acquisition fees equal to 1.00% of the contract purchase price of each property SSGT III acquires plus reimbursement of acquisition
F-128
SMARTSTOP SELF STORAGE REIT, INC. AND SUBSIDIARIES
NOTES TO CONSOLIDATED FINANCIAL STATEMENTS
expenses that SSGT III Advisor incurs, provided, however, that no reimbursement shall be made for costs of personnel to the extent that such personnel perform services in transactions for which the Advisor receives the Acquisition Fee. The SSGT III Advisor also receives a monthly asset management fee equal to 0.0625%, which is one-twelfth of 0.75%, of SSGT III’s aggregate asset value, as defined. The SSGT III Advisor is also entitled to receive a disposition fee equal to 1.5% of the contract sale price for any properties sold inclusive of any real estate commissions paid to third party real estate brokers. Through a separate agreement, Pacific Oak Holding Group, LLC, the parent company of Pacific Oak Capital Markets, LLC, the dealer manager for the SSGT III private offering, is entitled to receive 17.5% of the acquisition fees, asset management fees and disposition fees SSGT III Advisor earns pursuant to the SSGT III Advisory Agreement.
A subsidiary of our Operating Partnership may also be potentially entitled to various subordinated distributions through its ownership of a special limited partnership in SSGT III’s operating partnership agreement if SSGT III (1) lists its shares of common stock on a national exchange, (2) terminates the SSGT III Advisory Agreement, (3) liquidates its portfolio, or (4) merges with another entity or enters into an Extraordinary Transaction, as defined in the SSGT III operating partnership agreement.
Managed REIT Property Management Agreements
Our indirect subsidiaries, SS Growth Property Management II, LLC, Strategic Storage Property Management VI, LLC, and SS Growth Property Management III, LLC, (collectively the “Managed REITs Property Managers”), are or were entitled to receive fees for their services in managing the properties wholly or partially owned by the Managed REITs pursuant to property management agreements entered into between the owner of the property and the applicable Managed REIT’s Property Manager.
The Managed REITs’ Property Managers will receive a property management fee equal to 6% of the gross revenues from the properties, generally subject to a monthly minimum of $3,000 per property, plus reimbursement of the costs of managing the properties, and a
one-time
fee of $3,750 for each property acquired that would be managed by the Managed REITs’ Property Managers. Reimbursable costs and expenses include wages and salaries and other expenses of employees engaged in operating, managing and maintaining such properties. Pursuant to the property management agreements, we through our Operating Partnership employ the
on-site
staff for the Managed REITs’ properties.
The SST VI and SSGT III property managers are or were entitled to a construction management fee equal to 5% of the cost of a related construction or capital improvement work project in excess of $10,000.
Effective June 1, 2022, in connection with the SSGT II Merger, the SSGT II property management contracts were terminated. As a result of us acquiring SSGT II and terminating such contracts, we recorded a
write-off
of approximately $0.6 million related to the carrying value of the SSGT II property management contracts.
In connection with the Self Administration Transaction, we previously recorded a deferred tax liability, which was the result of the difference between the GAAP carrying value of the SSGT II property management contract and the carrying value for tax purposes. As we reduced the GAAP carrying value of such intangible asset, we adjusted the value of our deferred tax liability on a
pro-rata
basis, reducing the deferred tax liability by approximately $0.2 million during the year ended December 31, 2022 related to the SSGT II Merger and the related aforementioned write-offs, and recorded such benefits within the income tax (expense) benefit line-item in our consolidated statements of operations.
F-129
SMARTSTOP SELF STORAGE REIT, INC. AND SUBSIDIARIES
NOTES TO CONSOLIDATED FINANCIAL STATEMENTS
Summary of Fees and Revenue Related to the Managed REITs
Pursuant to the terms of the various agreements described above for the Managed REITs, the following summarizes the related party fees for the three and nine months ended September 30, 2024 and 2023 (in thousands):
| | | | | | | | | | | | | | | | |
| | |
| | | Nine Months Ended
September 30, | |
Managed REIT Platform Revenues | | | | | | | | | | | | |
| | | | | | | | | | | | | | | | |
| | $ | 1,082 | | | $ | 1,062 | | | $ | 3,208 | | | $ | 2,378 | |
| | | 367 | | | | 296 | | | | 1,039 | | | | 690 | |
| | | | | | | | | | | | | | | | |
| | | | | | | | | | | | | | | | |
Property Management Fees: | | | | | | | | | | | | | | | | |
| | | 436 | | | | 346 | | | | 1,244 | | | | 857 | |
| | | 150 | | | | 105 | | | | 407 | | | | 236 | |
| | | 248 | | | | 190 | | | | 703 | | | | 540 | |
| | | | | | | | | | | | | | | | |
| | | | | | | | | | | | | | | | |
Tenant Protection Program Fees: | | | | | | | | | | | | | | | | |
| | | 317 | | | | 263 | | | | 883 | | | | 575 | |
| | | 106 | | | | 63 | | | | 281 | | | | 112 | |
| | | 100 | | | | 72 | | | | 270 | | | | 196 | |
| | | | | | | | | | | | | | | | |
| | | | | | | | | | | | | | | | |
| | | | | | | | | | | | | | | | |
| | | — | | | | — | | | | 34 | | | | 2,465 | |
| | | 103 | | | | — | | | | 162 | | | | 642 | |
| | | | | | | | | | | | | | | | |
| | | | | | | — | | | | | | | | | |
Other Managed REIT Fees (1) | | | 232 | | | | 121 | | | | 695 | | | | 424 | |
Managed REIT Platform Fees | | | 3,141 | | | | 2,518 | | | | 8,926 | | | | 9,115 | |
Sponsor funding reduction (2) | | | (218 | ) | | | — | | | | (598 | ) | | | — | |
| | | | | | | | | | | | | | | | |
Total Managed REIT Platform Revenues | | | | | | | | | | | | | | | | |
| | | | | | | | | | | | | | | | |
| (1) | Such revenue primarily includes other property management related fees, construction management fees, development fees, and other miscellaneous revenues. |
| (2) | Pursuant to the Sponsor Funding Agreement, SmartStop funds certain costs of SST VI’s share sales, and in return receives Series C Units in SST VI’s OP. The excess of the funding over the value of the Series C Units received is accounted for as a reduction of Managed REIT Platform revenues from SST VI over the remaining estimated term of the management contracts with SST VI. |
We offer tenant insurance or tenant protection programs to customers at our Managed REITs’ properties pursuant to which we, as the property manager and majority owner of the Tenant Protection Program joint ventures, are entitled to substantially all of the net revenue attributable to the sale of such tenant programs.
In order to protect our interest in receiving these revenues in light of the fact that the Managed REITs control the properties, we and the Managed REITs transferred our respective rights in such arrangements to a joint venture entity owned 99.9% by us through a TRS subsidiary and 0.1% by the Managed REIT. Under the
F-130
SMARTSTOP SELF STORAGE REIT, INC. AND SUBSIDIARIES
NOTES TO CONSOLIDATED FINANCIAL STATEMENTS
terms of the operating agreements of the joint venture entities, we receive 99.9% of the net revenues generated from such Tenant Protection Programs and the Managed REIT receives the other 0.1% of such net revenues. Subsequent to the SSGT II Merger, the SSGT II Tenant Protection Programs joint ventures are wholly-owned by us and such revenue is generated at our now wholly-owned self storage properties and is recorded within ancillary operating revenue in our consolidated statements of operations.
Reimbursable costs from Managed REITs includes reimbursement of SST IV (until the SST IV Merger Date), SSGT II (until the SSGT II Merger Date), SST VI and SSGT III’s Advisors’ certain direct and indirect costs of providing administrative and management services to the Managed REITs. Additionally, reimbursable costs includes reimbursement pursuant to the property management agreements for reimbursement of certain costs of managing the Managed REITs’ properties, including wages and salaries and other expenses of employees engaged in operating, managing and maintaining such properties.
As of September 30, 2024 and December 31, 2023 we had receivables due from the Managed REITs totaling approximately $18.8 million and $6.5 million, respectively. Such amounts are included in investments in and advances to the Managed REITs line-item in our consolidated balance sheets. Such amounts included unpaid amounts relative to the above table, in addition to other direct reimbursable expenditures of the Managed REITs that we directly funded.
Investments in and advances to SST VI OP
On March 10, 2021, SmartStop OP made an investment of $5.0 million in SST VI OP, in exchange for common units of limited partnership interest in SST VI OP. Additionally, a subsidiary of SmartStop OP owns a special limited partnership interest (the “SST VI SLP”) in SST VI OP.
For the three and nine months ended September 30, 2024 we recorded a loss related to our equity interest in SST VI OP of approximately $0.2 million, and $0.6 million, respectively, and received distributions in the amount of approximately $0.1 million, and $0.3 million, respectively.
For the three and nine months ended September 30, 2023 we recorded a loss related to our equity interest, excluding our preferred investment discussed below, in SST VI OP of approximately $0.3 million, and $0.7 million, respectively, and received distributions in the amount of approximately $0.1 million, and $0.3 million, respectively.
On January 30, 2023, a subsidiary of SmartStop made a preferred investment of 600,000 Series A Cumulative Redeemable Preferred units of limited partnership interest in SST VI OP for an aggregate of $15 million. Upon closing of the preferred investment, an investment fee equal to 1% of the investment amount was owed and paid by SST VI OP. SmartStop, through its subsidiary, received distributions, payable monthly in arrears, at a rate of 7.0% per annum from the date of issuance until the second anniversary of the date of issuance, 8.0% per annum commencing thereafter until the third anniversary of the date of issuance, 9.0% per annum commencing thereafter until the fourth anniversary of the date of issuance, and 10% per annum thereafter, payable monthly. On May 2, 2023, SST VI fully redeemed SmartStop’s preferred investment of 600,000 Series A Cumulative Redeemable Preferred units of limited partnership interest in SST VI OP, and repaid accrued distributions due as of the date of redemption for a total amount of approximately $15.1 million.
F-131
SMARTSTOP SELF STORAGE REIT, INC. AND SUBSIDIARIES
NOTES TO CONSOLIDATED FINANCIAL STATEMENTS
Sponsor Funding Agreement
On November 1, 2023, SRA, a subsidiary of our Operating Partnership, entered into a Sponsor Funding Agreement with SST VI and SST VI OP, in connection with certain changes to the public offering of SST VI.
Pursuant to the Sponsor Funding Agreement, SRA, as sponsor of the SST VI offering, has agreed to fund the payment of (i) the upfront 3% sales commission for the sale of Class Y shares sold in the SST VI offering, (ii) the upfront 3% dealer manager fee for the Class Y shares sold in the SST VI offering, and (iii) the estimated 1% organization and offering expenses for the sale of Class Y shares and Class Z shares sold in the SST VI offering. SRA also agreed to reimburse SST VI in cash to cover the dilution from certain one-time stock dividends which were issued by SST VI to existing stockholders in connection with the sponsor funding changes to the SST VI offering. On December 15, 2023, we paid SST VI approximately $6.6 million for the reimbursement of the aforementioned stock dividend.
In consideration for SRA providing the funding for the front-end sales load and the cash to cover the dilution from the stock dividends described above, SST VI OP will issue a number of Series C Units to SRA equal to the dollar amount of such funding divided by the then-current offering price for the Class Y shares and Class Z shares sold in the SST VI offering, which was initially $9.30 per share. Pursuant to the Sponsor Funding Agreement, SRA will reimburse SST VI monthly for the applicable front-end sales load it has agreed to fund, and SST VI OP will issue the Series C Units on a monthly basis upon such reimbursement.
On August 7, 2024, SST VI declared an estimated net asset value per share of $10.00. Since the Series C Units that could be converted would result in the net asset value falling below $10.00 per share, none of the Series C Units we own were converted into class A units of SST VI OP, and our future purchases will be determined based on the current estimated net asset value at such time. Subsequent to SST VI declaring an estimated net asset value of $10.00 per share, the number of Series C Units SmartStop receives in exchange for funding the front-end sales load of the sale of SST VI’s class Y and class Z shares is calculated as the dollar amount of such sponsor funding divided by the current offering price of $10.00 per share for such class Y and Z shares. The Sponsor Funding Agreement will terminate immediately upon the date that SST VI ceases to offer the Class Y shares and Class Z shares in the SST VI offering. The SST VI offering was set to expire on March 17, 2024, and was extended to March 17, 2025 upon the approval of SST VI’s board of directors on February 1, 2024. Inclusive of all extension options available to SST VI, its current offering could not extend beyond September 12, 2025.
On November 1, 2023, SRA entered into Amendment No. 3 to the Second Amended and Restated Limited Partnership Agreement of SST VI OP with SST VI and SST VI OP containing, among other things, the terms of the Series C Units. The Series C Units shall initially have no distribution, liquidation, voting, or other rights to participate in SST VI OP unless and until such Series C Units are converted into class A units of SST VI OP. The Series C Units shall automatically convert into class A units on a one-to-one basis upon SST VI’s disclosure of an estimated net asset value per share equal to at least $10.00 per share for each class of SST VI shares of common stock, including the Class Y shares and Class Z shares, calculated net of the Series C Units to be converted.
Through September 30, 2024, we have incurred approximately $8.7 million in connection with the Sponsor Funding Agreement, representing approximately 928,000 subordinated units. During the three and nine months ended September 30, 2024 we incurred approximately $0.6 million and $1.8 million, respectively, of which approximately $0.2 million was accrued as a payable pursuant to the Sponsor Funding Agreement.
F-132
SMARTSTOP SELF STORAGE REIT, INC. AND SUBSIDIARIES
NOTES TO CONSOLIDATED FINANCIAL STATEMENTS
As of September 30, 2024, the maximum remaining commitment of SRA pursuant to the Sponsor Funding Agreement is approximately $61.9 million if SST VI were to sell the maximum amount under its current offering of $1.0 billion.
On December 30, 2021, in connection with SST VI’s acquisition of two self storage facilities, our Operating Partnership entered into a mezzanine loan agreement with a wholly-owned subsidiary of SST VI OP for up to $45 million (the “SST VI Mezzanine Loan”). The SST VI Mezzanine Loan required a commitment fee equal to 1.0% of the amount drawn at closing of the SST VI Mezzanine Loan, and each subsequent draw. Interest on this loan accrued at LIBOR plus 3.0%.
The SST VI Mezzanine Loan was amended on December 20, 2022, such amendment increased the principal borrowing amount from a maximum of $45 million to $55 million. Pursuant to this amendment, the interest rate on the SST VI Mezzanine Loan was converted to a variable rate equal to SOFR plus 3.0%. Additionally, in such amendment, SST VI exercised the existing extension option; payments on the SST VI Mezzanine Loan were interest only until the due date of December 30, 2023. As of December 31, 2022 the balance on the SST VI Mezzanine Loan was $35.0 million. On January 31, 2023, SST VI borrowed an additional $15.0 million on the SST VI Mezzanine Loan.
On May 2, 2023, SST VI fully repaid the outstanding principal, plus all applicable accrued interest due on the SST VI Mezzanine Loan as of such date for a total amount of approximately $
51.7
million. On such date, the SST VI Mezzanine Loan agreement was terminated.
On June 13, 2023 SmartStop OP entered into a promissory note agreement with SST VI OP ( the “SST VI Note”), where SST VI OP borrowed $15.0 million. Interest on the loan accrued at SOFR plus 3.0%. Payments on the SST VI Note are interest only. The loan was extended to December 31, 2024 at the borrower’s option. As such, the interest rate on the loan increased to SOFR plus 4.0%, and a fee equal to 0.25% of the outstanding principal balance was due as a result of SST VI exercising the extension option on December 8, 2023. The SST VI Note required a commitment fee equal to 1.0% of the aggregate principal amount of the loan. On June 28, 2024, the SST VI Note was amended to expand the borrowing capacity up to $25.0 million and extend the maturity date from December 31, 2024 to December 31, 2025. The loan is interest only, and the interest rate on such loan is SOFR plus 4.0%. On July 29, 2024, SST VI borrowed an additional $8.0 million on the SST VI Note. As of September 30, 2024, SST VI OP had $23.0 million borrowed and outstanding pursuant to the SST VI Note.
The following table summarizes the carrying value of our investments in and advances to SST VI as of September 30, 2024 and December 31, 2023 (in thousands):
| | | | | | | | |
| |
| | | | |
Receivables and advances due | | $ | 16,660 | | | $ | 5,861 | |
| | | | | | | | |
| | | 23,000 | | | | 15,000 | |
| | | | | | | | |
SST VI OP Units and SST VI SLP | | | 1,126 | | | | 1,932 | |
SST VI Class C Subordinated Units | | | 4,215 | | | | 3,307 | |
| | | | | | | | |
Total investments in and advances | | | | | | | | |
| | | | | | | | |
F-133
SMARTSTOP SELF STORAGE REIT, INC. AND SUBSIDIARIES
NOTES TO CONSOLIDATED FINANCIAL STATEMENTS
Investments in and advances to SSGT III OP
On August 29, 2022, SmartStop OP made an investment of $5.0 million in SS Growth Operating Partnership III, L.P., the operating partnership of SSGT III (“SSGT III OP”), in exchange for common units of limited partnership interest in SSGT III OP. Additionally, a subsidiary of SmartStop OP owns a special limited partnership interest (the “SSGT III SLP”) in SSGT III OP.
For the three and nine months ended September 30, 2024, we recorded a loss related to our equity interest in SSGT III OP of approximately $0.1 million and $0.4 million, respectively, and received distributions in the amount of approximately $0.1 million, and $0.2 million, respectively.
For the three and nine months ended September 30, 2023, we recorded a loss related to our equity interest in SSGT III OP of approximately $0.2 million and $0.6 million, respectively, and received distributions in the amount of approximately $0.1 million, and $0.2 million, respectively.
On August 9, 2022, in connection with SSGT III’s acquisition of two self storage facilities, our Operating Partnership entered into a mezzanine loan agreement with a wholly-owned subsidiary of SSGT III, for up to $50.0 million (the “SSGT III Mezzanine Loan”), of which $42.0 million was funded as an initial draw at the time of closing. The SSGT III Mezzanine Loan requires a commitment fee equal to 1.0% of the amount drawn at closing of the SSGT III Mezzanine Loan, and subsequent draws.
The SSGT III Mezzanine Loan was amended on December 20, 2022, such amendment increased the principal borrowing amount from up to $50 million to $77 million. Pursuant to this amendment, the interest rate on the SSGT III Mezzanine Loan became a variable rate equal to SOFR plus 3.0%. Payments on the SSGT III Mezzanine Loan are interest only, and it had an initial maturity date of August 9, 2023. SSGT III extended the ultimate maturity date of the SSGT III Mezzanine Loan until August 9, 2024, as such, the interest rate of the SSGT III Mezzanine Loan increased to SOFR plus 4.0% per annum, pursuant to the December 20, 2022 amendment. The SSGT III Mezzanine Loan may be prepaid in whole or in part at any time without fees or penalty and, in certain circumstances, equity interests securing the SSGT III Mezzanine Loan may be released from the pledge of collateral. The SSGT III Mezzanine Loan is secured by a pledge of the equity interest in the indirect, wholly-owned subsidiaries of SSGT III, that owned seven operating self storage facilities as of September 30, 2024. SSGT III OP, also serves as a
non-recourse
guarantor.
On May 2, 2024, SSGT III paid down the remaining $1.0 million outstanding on the SSGT III Mezzanine Loan. On August 9, 2024, the SSGT III Mezzanine Loan expired, and no further borrowings were allowed pursuant to such loan agreement.
On July 31, 2024, our Operating Partnership provided a bridge loan to an indirect wholly-owned subsidiary of SSGT III for $20.0 million (the “SSGT III Bridge Loan”) to facilitate SSGT III’s acquisition of two self storage facilities. An indirect wholly-owned subsidiary of SSGT III is sponsoring a private offering of beneficial interests in a Delaware statutory trust (“DST”) relating to the two properties. The SSGT III Bridge Loan incurs interest based on adjusted daily simple SOFR plus 300 basis points. The SSGT III Bridge Loan is secured by an indirect pledge of equity in the entity sponsoring the private DST offering relating to the two properties mentioned above, as well as a full guaranty by SSGT III OP. As such sponsor entity sells such DST interests, it is
F-134
SMARTSTOP SELF STORAGE REIT, INC. AND SUBSIDIARIES
NOTES TO CONSOLIDATED FINANCIAL STATEMENTS
required to utilize such net proceeds to pay down the SSGT III Bridge Loan. SSGT III will be required to pay down at least 15% of the balance within four months, 35% within six months, 55% within nine months, and 75% within twelve months from the final draw.
As of September 30, 2024, SSGT III and its subsidiaries had repaid approximately $15.0 million on the SSGT III Bridge Loan, such that $5.0 million was outstanding on such loan as of September 30, 2024.
The following table summarizes the carrying value of our investments in and advances to SSGT III OP as of September 30, 2024 and December 31, 2023 (in thousands):
| | | | | | | | |
| | | | | | |
Receivables and advances due | | $ | 2,161 | | | $ | 629 | |
| | | | | | | | |
| | | 5,000 | | | | — | |
SSGT III Mezzanine Loan (1) | | | — | | | | 4,000 | |
| | | | | | | | |
SSGT III OP Units and SSGT III SLP | | | 3,047 | | | | 3,662 | |
| | | | | | | | |
Total investments in and advances | | | | | | | | |
| | | | | | | | |
| (1) | The SSGT III Mezzanine Loan expired on the maturity date of August 9, 2024, as such there is no further ability for SSGT III to borrow on this loan. |
Administrative Services Agreement
On June 28, 2019, we along with our Operating Partnership, our TRS and SmartStop Storage Advisors, LLC (collectively, the “Company Parties”) entered into an Administrative Services Agreement with SAM (the “Administrative Services Agreement”), which, as amended, requires that the Company Parties will be reimbursed for providing certain operational and administrative services to SAM which may include, without limitation, accounting and financial support, IT support, HR support, advisory services and operations support, and administrative support and other miscellaneous reimbursements as set forth in the Administrative Services Agreement and SAM will be reimbursed for providing certain operational and administrative services to the Company Parties which may include, without limitation, due diligence support, marketing, fulfillment and offering support, events support, insurance support, and administrative and facilities support. SAM and the Company Parties will reimburse one another based on the actual costs of providing their respective services. Additionally, SAM paid the Company Parties an allocation of rent and overhead for the portion of the Ladera Office that it occupied until October 2022, at which time SAM relocated to a separate office. Such agreement had an initial term of three years, with automatic
one-year
renewals, and is subject to certain adjustments as defined in the agreement.
For the three and nine months ended September 30, 2024, we incurred reimbursements payable to SAM under the Administrative Services Agreement of approximately $276,000 and $634,000, respectively, which were recorded in the Managed REIT Platform expenses line item in our consolidated statements of operations. For the three and nine months ended September 30, 2023, we incurred reimbursements payable to SAM under the Administrative Services Agreement of approximately $103,000 and $272,000, respectively, which were recorded in the Managed REIT Platform expenses line item in our consolidated statements of operations.
F-135
SMARTSTOP SELF STORAGE REIT, INC. AND SUBSIDIARIES
NOTES TO CONSOLIDATED FINANCIAL STATEMENTS
We recorded reimbursements from SAM of approximately $39,000 and $160,000 during the three and nine months ended September 30, 2024, respectively, related to services provided to SAM, which were included in Managed REIT Platform revenue in our consolidated statements of operations. We recorded reimbursements from SAM of approximately $36,000 and $536,000 during the three and nine months ended September 30, 2023, respectively, related to services provided to SAM, which were included in Managed REIT Platform revenue in our consolidated statements of operations.
As of September 30, 2024 and December 31, 2023, a payable of approximately $30,000 was due from SAM and a payable of approximately $11,000, was due to SAM, respectively, related to the Administrative Services Agreement.
Note 11. Equity Based Compensation
Prior to June 15, 2022, we issued equity based compensation pursuant to the Company’s Employee and Director Long-Term Incentive Plan (the “Prior Plan”). On June 15, 2022, our stockholders approved the 2022 Long-Term Incentive Plan (the “Plan”) and we no longer issue equity under the Prior Plan. Pursuant to the Plan, we are able to issue various forms of equity based compensation. Through September 30, 2024, we have generally issued equity based awards in two forms: (1) restricted stock awards consisting of shares of our common stock and (2) long-term incentive plan units of our Operating Partnership (“LTIP Units”).
The fair value of restricted stock is determined on the grant date based on an estimated value per share. The estimated fair value of our restricted stock was determined with the assistance of third party valuation specialists primarily based on an income approach to value our properties as well as the Managed REIT Platform, less the estimated fair value of our debt and other liabilities. The key assumptions used in estimating the fair value of our restricted stock were projected annual net operating income, projected growth rates, discount rates, capitalization rates and an illiquidity discount. The fair value of LTIP Units were further adjusted by applying an additional discount as the LTIP Units are not initially economically equivalent to our restricted stock. For performance based awards, a fair value was determined for each performance ranking scenario, with stock compensation expense recorded using the fair value of the scenario determined to be probable of achievement as of the end of the respective period.
We have granted various time based awards, which generally vest ratably over either
one
,
three
, or four years commencing in the year of grant, subject to the recipient’s continued employment or service through the applicable vesting date. All grants of time based restricted stock have limitations on transferability during the vesting period, and the grantee does not have the ability to vote any unvested shares. Transferability prior to vesting is restricted only to the unvested portion of the restricted stock.
With respect to grants of time based LTIP Units, distributions accrue based on the effective date of each grant, and are payable as distributions are paid on our Class A Shares without regard to whether the underlying awards have vested. With respect to time based restricted stock issued to our board of directors, distributions accrue as of the effective date of each grant and are payable as distributions are paid on our Class A Shares without regard to whether the underlying awards have vested. With respect to all other existing time based restricted stock, distributions accrue on
non-vested
shares granted and are paid when the underlying restricted shares vest.
F-136
SMARTSTOP SELF STORAGE REIT, INC. AND SUBSIDIARIES
NOTES TO CONSOLIDATED FINANCIAL STATEMENTS
Holders of time based LTIP Units receive allocations of profits and losses with respect to the LTIP Units as of the effective date, distributions from the effective date in an amount equivalent to the distributions declared and paid on our Class A Shares, and the same voting rights as holders of common units, voting as a class with each LTIP Unit holder having one vote per LTIP Unit held. Prior to vesting, time based LTIP Units generally may not be transferred, other than by laws of descent and distribution.
The following table summarizes the activity related to our time based awards:
| | | | | | | | | | | | | | | | |
| | | | | | | |
| | | | | Weighted-Average Grant-Date Fair Value | | | | | | Weighted-Average Grant-Date Fair Value | |
Unvested at December 31, 2022 | | | 145,850 | | | $ | 11.50 | | | | 290,641 | | | $ | 11.16 | |
| | | 43,720 | | | | 14.30 | | | | 315,915 | | | | 13.30 | |
| | | (96,295 | ) | | | 10.86 | | | | (226,271 | ) | | | 11.58 | |
| | | (7,960 | ) | | | 13.92 | | | | — | | | | — | |
| | | | | | | | | | | | | | | | |
Unvested at December 31, 2023 | | | 85,315 | | | | 13.44 | | | | 380,285 | | | | 12.69 | |
| | | 45,904 | | | | 14.30 | | | | 315,962 | | | | 13.53 | |
| | | (47,321 | ) | | | 12.79 | | | | (18,048 | ) | | | 13.30 | |
| | | (5,254 | ) | | | 14.28 | | | | (15,814 | ) | | | 12.86 | |
| | | | | | | | | | | | | | | | |
Unvested at September 30, 2024 | | | 78,644 | | | $ | 14.28 | | | | 662,385 | | | $ | 13.07 | |
| | | | | | | | | | | | | | | | |
With respect to performance based awards, the number of shares of restricted stock granted as of the grant date equaled 100% of the targeted award, whereas the number of LTIP Units granted as of the grant date equaled 200% of the targeted amount of the award. The targeted award for each executive was determined and approved by the Compensation Committee of our board of directors. The actual number of shares of restricted stock or LTIP Units, as applicable, to be issued upon vesting may range from 0% to 200% of the targeted award, such determination being based upon the results of the performance measure. Performance based awards vest based upon our performance as ranked amongst a peer group of self storage related companies. This comparison is conducted using a performance measure of average annual same-store revenue growth, analyzed over a three-year period. Earned awards for the 2022, 2023 and 2024 grants will vest, as applicable, no later than March 31, 2025,
2026
, and
2027
, respectively.
Recipients of performance based restricted stock accrue distributions during the performance period, and such distributions will only be payable on the date that any such shares of restricted stock vest, based upon the performance level attained. Recipients of performance based LTIP Units are issued LTIP Units at 200% of the targeted award and are entitled to receive distributions and allocations of profits and losses with respect to the performance based LTIP Units as of the effective date of each award in an amount equal to 10% of the distributions and allocations available to such LTIP Units, until the Distribution Participation Date (as defined in the Operating Partnership Agreement). The remaining 90% of distributions will accrue and will be payable on the Distribution Participation Date based upon the performance level attained and number of performance based LTIP Units that vest. Following the Distribution Participation Date, recipients will be entitled to receive the full amount of distributions and allocations of profits and losses with respect to the vested performance-based LTIP Units, such amount being equivalent to distributions declared and paid on our Class A Shares.
F-137
SMARTSTOP SELF STORAGE REIT, INC. AND SUBSIDIARIES
NOTES TO CONSOLIDATED FINANCIAL STATEMENTS
The following table summarizes our activity related to our performance based awards:
| | | | | | | | | | | | | | | | |
| | | | | | | |
Performance Based Award Grants | | | | | Weighted-Average Grant-Date Fair Value | | | | | | Weighted-Average Grant-Date Fair Value | |
Unvested at December 31, 2022 | | | 5,752 | | | $ | 9.78 | | | | 380,536 | | | $ | 10.39 | |
| | | 5,752 | (1) | | | 9.78 | | | | 271,199 | | | | 13.30 | |
| | | (11,504 | ) | | | 9.78 | | | | (118,720 | ) | | | 9.09 | |
| | | — | | | | — | | | | — | | | | — | |
| | | | | | | | | | | | | | | | |
Unvested at December 31, 2023 | | | — | | | | — | | | | 533,015 | | | | 12.16 | |
| | | — | | | | — | | | | 270,096 | | | | 13.55 | |
| | | — | | | | — | | | | (148,387 | ) | | | 9.30 | |
| | | — | | | | — | | | | (16,160 | ) | | | 13.36 | |
| | | | | | | | | | | | | | | | |
Unvested at September 30, 2024 | | | — | | | $ | — | | | | 638,564 | | | $ | 13.38 | |
| | | | | | | | | | | | | | | | |
| (1) | On March 2, 2023 the Compensation Committee of the board of directors approved the vesting of the 2020 performance grant at 200% of the targeted award. Accordingly, individuals who elected to receive performance based restricted stock were issued and immediately vested additional shares to equal 200% of their targeted award. |
Holders of performance based restricted stock do not have any rights as a stockholder with respect to the unvested portion of such restricted stock awards. Prior to vesting, shares of performance based restricted stock generally may not be transferred, other than by laws of descent and distribution.
Holders of performance based LTIP Units have the same voting rights as holders of common units, voting as a class with each LTIP Unit holder having one vote per LTIP Unit held. Prior to vesting, performance based LTIP Units generally may not be transferred, other than by laws of descent and distribution.
LTIP Units are designed to qualify as “profits interests” in the Operating Partnership for federal income tax purposes. The profits interests’ characteristics of the LTIP Units mean that initially they will not be treated as economically equivalent in value to a common unit and the issuance of LTIP Units will not be a taxable event to the Operating Partnership or the recipient. If and when certain events occur pursuant to applicable tax regulations and in accordance with the Operating Partnership Agreement, LTIP Units may become economically equivalent to common units of limited partnership interest of our Operating Partnership on a
basis.
As of September 30, 2024, 8,769,928 shares of stock were available for issuance under the Plan.
We recorded approximately $1.3 million and $3.7 million of equity based compensation expense in general and administrative expense during the three and nine months ended September 30, 2024, respectively, compared to approximately $1.3 million and $3.7 million during the three and nine months ended September 30, 2023, respectively. We recorded approximately $0.1 million and $0.2 million of equity based compensation expense in property operating expenses, within our consolidated statements of operations for the three and nine months ended September 30, 2024, respectively, compared to approximately $0.1 million and $0.4 million during the three and nine months ended September 30, 2023, respectively.
As of September 30, 2024, there was approximately $9.3 million of total unrecognized compensation expense related to
non-vested
equity awards, with such cost expected to be recognized over a weighted-average
F-138
SMARTSTOP SELF STORAGE REIT, INC. AND SUBSIDIARIES
NOTES TO CONSOLIDATED FINANCIAL STATEMENTS
period of approximately 2.3 years. As of December 31, 2023, there was approximately $6.8 million of total unrecognized compensation expense related to
non-vested
equity awards, with such cost expected to be recognized over a weighted-average period of approximately 2.2 years.
In March 2024, an aggregate of 270,096 LTIP Units were issued to our executive officers in connection with performance-based equity grants. With respect to performance-based equity grants, the number of LTIP Units granted as of the grant date was equal 200% of the targeted award. Similarly, in March 2024, an aggregate of 274,183 LTIP Units were issued to our executive officers in connection with time-based equity grants. These are non-vested grants which shall vest ratably over four years, with the first tranche vesting on December 31, 2024, subject to the recipient’s continued employment through the applicable vesting date.
Note 12. Commitments and Contingencies
Distribution Reinvestment Plan
We have adopted an amended and restated distribution reinvestment plan (our “DRP”) that allows both our Class A and Class T stockholders to have distributions otherwise distributable to them invested in additional Class A Shares and Class T Shares, respectively. Under our DRP, the board of directors may amend, modify, suspend or terminate our plan for any reason upon 10 days’ written notice to the participants. The purchase price per share pursuant to our DRP is equivalent to the estimated value per share approved by our board of directors and in effect on the date of purchase of shares under the plan. In conjunction with the board of directors’ declaration of a new estimated value per share of our common stock on January 15, 2024, any shares sold pursuant to our distribution reinvestment plan will be sold at our new estimated value per share of $15.25 per Class A Share and Class T Share. Please see the section below titled “Suspension and Partial Resumption of DRP and SRP” for additional information. As of September 30, 2024, we had sold approximately 10.3 million Class A Shares and approximately 1.3 million Class T Shares through our distribution reinvestment plan, of which, approximately 0.5 million Class A Shares and approximately 0.1 million Class T Shares were sold under our current DRP Offering. The DRP Offering may be terminated at any time upon 10 days’ prior written notice to stockholders.
As described in “Note 2 – Summary of Significant Accounting Policies – Redeemable Common Stock,” we have an SRP. Please refer to that section for additional details. Pursuant to the SRP, we may redeem the shares of stock presented for redemption for cash to the extent that such requests comply with the below terms of our SRP and we have sufficient funds available to fund such redemption. All redemption requests received, and not withdrawn, on or prior to the last day of the applicable quarter are processed on the last business day of the month following the end of the quarter in which the redemption requests were received.
Our board of directors may amend, suspend or terminate the SRP with 30 days’ notice to our stockholders. We may provide this notice by including such information in a Current Report on Form
8-K
or in our annual or quarterly reports, all publicly filed with the SEC, or by a separate mailing to our stockholders.
On August 20, 2020, our board of directors amended the terms of the SRP to revise the redemption price per share for all redemptions under the SRP to be equal to the most recently published estimated net asset value per share of the applicable share class (the “SRP Amendment”). Prior to the SRP Amendment, the redemption
SMARTSTOP SELF STORAGE REIT, INC. AND SUBSIDIARIES
NOTES TO CONSOLIDATED FINANCIAL STATEMENTS
amount was the lesser of the amount the stockholders paid for their shares or the price per share in the current offering. On January 15, 2024, we declared a new estimated net asset value per share and the redemption price under our SRP immediately changed to $15.25 (our current estimated net asset value per share).
There are several limitations in addition to those noted above on our ability to redeem shares under the SRP including, but not limited to:
| | • | | During any calendar year, we will not redeem in excess of 5% of the weighted-average number of shares outstanding during the prior calendar year. |
| | • | | The amount available for redemption is limited to the proceeds from the sale of shares pursuant to our distribution reinvestment plan, less any prior redemptions. |
| | • | | We have no obligation to redeem shares if the redemption would violate the restrictions on distributions under Maryland law, which prohibits distributions that would cause a corporation to fail to meet statutory tests of solvency. |
During the nine months ended September 30, 2024, approximately 2.0 million shares or $29.9 million of requests that met the eligibility criteria were requested to be redeemed; approximately $17.3 million of which were fulfilled during the nine months ended September 30, 2024, and approximately $12.6 million of which were included in accounts payable and accrued liabilities within our consolidated balance sheets as of September 30, 2024 and fulfilled in October 2024.
During the year ended December 31, 2023, approximately 1.5 million shares or $22.9 million of requests that met the eligibility criteria were requested to be redeemed; approximately $19.0 million of which were fulfilled during the year ended December 31, 2023, and approximately $3.9 million of which were included in accounts payable and accrued liabilities within our consolidated balance sheets as of December 31, 2023 and fulfilled in January 2024.
Please see the section below titled “Suspension and Partial Resumption of DRP and SRP” for additional information.
Suspension and Partial Resumption of DRP and SRP
In connection with a review of liquidity alternatives by the board of directors, on March 7, 2022, the board of directors approved the full suspension of our DRP and SRP. However, on March 16, 2023, the DRP was fully reinstated and the SRP was partially reinstated to allow for redemptions solely sought in connection with a stockholder’s death, “qualifying disability” (as that term is defined in the SRP), confinement to a long-term care facility, or other exigent circumstances. All other redemptions remain suspended at this time.
On May 1, 2024, our board of directors adopted a limitation to our SRP such that any redemption request made under the SRP in connection with a stockholder’s death must be made within one year of the date of such death in order to be honored by us. This limitation took effect on June 1, 2024.
Operating Partnership Redemption Rights
Generally, the limited partners of our Operating Partnership have the right to cause our Operating Partnership to redeem their limited partnership units for cash equal to the value of an equivalent number of our
F-140
SMARTSTOP SELF STORAGE REIT, INC. AND SUBSIDIARIES
NOTES TO CONSOLIDATED FINANCIAL STATEMENTS
shares, or, at our option, we may purchase their limited partnership units by issuing one share of our common stock for each limited partnership unit redeemed. These rights may not be exercised under certain circumstances that could cause us to lose our REIT election. Furthermore, limited partners may exercise their redemption rights only after their limited partnership units have been outstanding for one year.
Additionally, the
Class A-1
Units issued in connection with the Self Administration Transaction are subject to the general restrictions on transfer contained in the Operating Partnership Agreement. The
Class A-1
Units are otherwise entitled to all rights and duties of the Class A limited partnership units in the Operating Partnership, including cash distributions and the allocation of any profits or losses in the Operating Partnership.
Other Contingencies and Commitments
We have severance arrangements which cover certain members of our management team; these provide for severance payments upon certain events, including after a change of control.
See Note 10 – Related Party Transactions related to our debt investments in the Managed REITs and our Sponsor Funding Agreement with SST VI for more information about our contingent obligations under these agreements.
As of September 30, 2024, pursuant to various contractual relationships, we are required to make other payments in the amounts of approximately $3.0 million, $11.2 million, $4.2 million, and $3.9 million during the years ending December 31, 2024, 2025, 2026, and 2027, respectively.
From time to time, we are party to legal, regulatory and other proceedings that arise in the ordinary course of our business. In accordance with applicable accounting guidance, management accrues an estimated liability when those matters present loss contingencies that are both probable and reasonably estimable. In such cases, there may be an exposure to loss in excess of any amounts accrued. For such proceedings, we are not aware of any for which the outcome is reasonably likely to have a material adverse effect on our results of operations or financial condition.
Note 13. Declaration of Distributions
On September 27, 2024, our board of directors declared a distribution rate for the month of October 2024 of approximately $0.0508 per share on the outstanding shares of common stock payable to Class A and Class T stockholders of record of such shares as shown on our books at the close of business on October 31, 2024. Such distributions payable to each stockholder of record will be paid the following month.
On October 25, 2024, our board of directors declared a distribution rate for the month of November 2024 of approximately $0.0492 per share on the outstanding shares of common stock payable to Class A and Class T stockholders of record of such shares as shown on our books at the close of business on November 30, 2024. Such distributions payable to each stockholder of record will be paid the following month.
Note 14. Subsequent Events
There are no significant events which have occurred subsequent to September 30, 2024, other than the subsequent events discussed elsewhere in the notes to the financial statements.
F-141
Shares
SMARTSTOP SELF STORAGE REIT, INC.
Common Stock
J.P. Morgan
Wells Fargo Securities
KeyBanc Capital Markets
BMO Capital Markets
Truist Securities
PART II – INFORMATION NOT REQUIRED IN PROSPECTUS
| Item 31. | Other Expenses of Issuance and Distribution. |
The following table itemizes the expenses incurred by us in connection with the issuance and distribution of the securities being registered hereunder. All amounts shown are estimates except for the SEC registration fee, the FINRA filing fee and the listing fee.
| | | | |
SEC registration fee | | | | |
Listing fee | | | | |
FINRA fee | | | | |
Printing expenses | | | | |
Legal fees and expenses | | | | |
Transfer agent fees and expenses | | | | |
Accounting fees and expenses | | | | |
Other fees and expenses | | | | |
| | | | |
Total | | | | |
| | | | |
| Item 32. | Sales to Special Parties. |
None.
| Item 33. | Recent Sales of Unregistered Securities. |
None.
Item 34. Indemnification of Directors and Officers.
The Maryland General Corporation Law, as amended (the “MGCL”), permits a Maryland corporation to include in its charter a provision limiting the liability of its directors and officers to the corporation and its stockholders for money damages except for liability resulting from (a) actual receipt of an improper benefit or profit in money, property or services or (b) active and deliberate dishonesty established by a final judgment as being material to the cause of action. Our charter contains a provision providing for elimination of the liability of our directors or officers to us or our stockholders for money damages, to the maximum extent permitted by Maryland law.
The MGCL requires a Maryland corporation (unless its charter provides otherwise, which our charter does not) to indemnify a director or officer who has been successful, on the merits or otherwise, in the defense of any proceeding to which he or she is made a party by reason of his or her service in that capacity. The MGCL permits a Maryland corporation to indemnify its present and former directors and officers, among others, against judgments, penalties, fines, settlements and reasonable expenses actually incurred by them in connection with any proceeding to which they may be made or threatened to be made a party by reason of their service in those or other capacities unless it is established that (a) the act or omission of the director or officer was material to the matter giving rise to the proceeding and (i) was committed in bad faith or (ii) was the result of active and deliberate dishonesty, (b) the director or officer actually received an improper personal benefit in money, property or services or (c) in the case of any criminal proceeding, the director or officer had reasonable cause to believe that the act or omission was unlawful. However, under the MGCL, a Maryland corporation may not indemnify for an adverse judgment in a suit by or in the right of the corporation or for a judgment of liability on the basis that personal benefit was improperly received, unless in either case a court orders indemnification and then only for expenses. In addition, the MGCL permits a corporation to advance reasonable expenses to a director or officer upon the corporation’s receipt of (a) a written affirmation by the director or officer of his or her good faith belief that he or she has met the standard of conduct necessary for indemnification and (b) a written undertaking by or on his or her behalf to repay the amount paid or reimbursed if it shall ultimately be
II-1
determined that the standard of conduct was not met. It is the position of the SEC that indemnification of directors and officers for liabilities arising under the Securities Act is against public policy and is unenforceable pursuant to Section 14 of the Securities Act.
Our charter provides that, to the maximum extent permitted by Maryland law in effect from time to time, we must indemnify and, without requiring a preliminary determination of the ultimate entitlement to indemnification, must pay or reimburse reasonable expenses in advance of the final disposition of a proceeding to: (i) any individual who is a present or former director or officer of us and who is made or threatened to be made a party to, or witness in, the proceeding by reason of his or her service in such capacity; or (ii) any individual who, while a director or officer of us and at our request, serves or has served as a director, officer, member, manager, partner or trustee of another corporation, real estate investment trust, limited liability company, partnership, joint venture, trust, employee benefit plan or any other enterprise and who is made or threatened to be made a party to, or witness in, the proceeding by reason of his or her service in such capacity.
We also maintain insurance on behalf of all of our directors and executive officers against liability asserted against or incurred by them in their official capacities with us.
We have entered into indemnification agreements with each of our directors and executive officers (each, an “Indemnitee”). The indemnification agreements obligate us, if an Indemnitee is or is threatened to be made a party to, or witness in, any proceeding by reason of such Indemnitee’s status as a present or former director or officer of us, or as a director, trustee, officer, partner, manager, managing member, fiduciary, employee or agent of another entity that the Indemnitee served in such capacity at our request, to indemnify such Indemnitee, and advance expenses actually and reasonably incurred by him or her, subject to certain exceptions and conditions.
| Item 35. | Treatment of Proceeds From Stock Being Registered. |
None of the net proceeds will be credited to an account other than the appropriate capital share account.
| Item 36. | Financial Statements and Exhibits. |
| | (a) | | Financial Statements. See page F-1 for an index of the financial statements that are being filed as part of this registration statement. |
| | (b) | | Exhibits. See the Exhibit Index on the page immediately preceding the signature page for a list of exhibits filed as part of this registration statement on Form S-11, which Exhibit Index is incorporated herein by reference. |
| | (a) | | Insofar as indemnification for liabilities arising under the Securities Act may be permitted to directors, officers and controlling persons of the registrant pursuant to the foregoing provisions, or otherwise, the registrant has been advised that in the opinion of the SEC such indemnification is against public policy as expressed in the Act and is, therefore, unenforceable. In the event that a claim for indemnification against such liabilities (other than the payment by the registrant of expenses incurred or paid by a director, officer or controlling person of the registrant in the successful defense of any action, suit or proceeding) is asserted by such director, officer or controlling person in connection with the securities being registered, the registrant will, unless in the opinion of its counsel the matter has been settled by |
| | controlling precedent, submit to a court of appropriate jurisdiction the question whether such indemnification by it is against public policy as expressed in the Act and will be governed by the final adjudication of such issue. |
II-2
| | (b) | | The undersigned registrant hereby undertakes that: |
| | (i) | | For purposes of determining any liability under the Securities Act, the information omitted from the form of prospectus filed as part of this registration statement in reliance upon Rule 430A and contained in a form of prospectus filed by the registrant pursuant to Rule 424(b) (1) or (4) or 497(h) under the Securities Act shall be deemed to be part of this registration statement as of the time it was declared effective. |
| | (ii) | | For the purpose of determining any liability under the Securities Act, each post-effective amendment that contains a form of prospectus shall be deemed to be a new registration statement relating to the securities offered therein, and the offering of such securities at that time shall be deemed to be the initial bona fide offering thereof. |
Exhibits Index
| | (a) | Financial Statement Schedules |
See the Index to Consolidated Financial Statements on page F-1 of this registration statement.
| | |
Exhibit
No. | | Description |
| |
| 1.1** | | Form of Underwriting Agreement |
| |
| 2.1 | | Agreement and Plan of Merger, dated as of February 24, 2022, by and among Strategic Storage Growth Trust II, Inc., SmartStop Self Storage REIT, Inc., and SSGT II Merger Sub, LLC, incorporated by reference to Exhibit 2.1 of the Registrant’s Current Report on Form 8-K filed on February 24, 2022, Commission File No. 000-55617 |
| |
| 2.2 | | Agreement and Plan of Merger, dated November 10, 2020, by and among SmartStop Self Storage REIT, Inc., Strategic Storage Trust IV, Inc., and SST IV Merger Sub, LLC, incorporated by reference to Exhibit 2.1 to the Company’s Form 8-K, filed on November 12, 2020, Commission File No. 000-55617 |
| |
| 3.1 | | Second Articles of Amendment and Restatement of SmartStop Self Storage REIT, Inc., incorporated by reference to Exhibit 3.1 to the Registrant’s Current Report on Form 8-K, filed on September 19, 2019, Commission File No. 000-55617 |
| |
| 3.2 | | Articles Supplementary for Series A Convertible Preferred Stock of SmartStop Self Storage REIT, Inc., incorporated by reference to Exhibit 3.1 to the Registrant’s Current Report on Form 8-K, filed on October 30, 2019, Commission File No. 000-55617 |
| |
| 3.3 | | Articles of Amendment to Second Articles of Amendment and Restatement of SmartStop Self Storage REIT, Inc., incorporated by reference to Exhibit 3.1 to the Registrant’s Current Report on Form 8-K, filed on June 23, 2021, Commission File No. 000-55617 |
| |
| 3.4 | | Articles of Merger Between SmartStop Self Storage REIT, Inc. and SSGT II Merger Sub, LLC, incorporated by reference to Exhibit 3.4 to the Registrant’s Annual Report on Form 10-K, filed on March 18, 2024, Commission File No. 000-55617 |
| |
| 3.5** | | Form of Articles Supplementary to Second Articles of Amendment and Restatement of SmartStop Self Storage REIT, Inc. |
| |
| 3.6** | | Form of Articles Supplementary to Second Articles of Amendment and Restatement of SmartStop Self Storage REIT, Inc. |
II-3
| | |
Exhibit
No. | | Description |
| |
| 3.7 | | Amended and Restated Bylaws of SmartStop Self Storage REIT, Inc., incorporated by reference to Exhibit 3.2 to the Registrant’s Current Report on Form 8-K, filed on September 19, 2019, Commission File No. 000-55617 |
| |
| 3.8** | | Form of Second Amended and Restated Bylaws of SmartStop Self Storage REIT, Inc. |
| |
| 4.1** | | Statement regarding restrictions on transferability of shares of common stock (to appear on stock certificate or to be sent upon request and without charge to stockholders issued shares without certificates) |
| |
| 4.2 | | Note Purchase Agreement, dated April 19, 2022, incorporated by reference to Exhibit 10.1 to the Company’s Current Report on Form 8-K, filed on April 20, 2022, Commission File No. 000-55617 |
| |
| 4.3 | | Form of Note, incorporated by reference to Exhibit 10.2 to the Company’s Current Report on Form 8-K, filed on April 20, 2022, Commission File No. 000-55617 |
| |
| 4.4 | | Distribution Reinvestment Plan Enrollment Form (included as Appendix A to prospectus), incorporated by reference to the Company’s Registration Statement on Form S-3, filed on November 30, 2016, Commission File No. 333-214848 |
| |
| 4.5 | | Second Amended and Restated Distribution Reinvestment Plan (included as Appendix B to prospectus), incorporated by reference to the Company’s Registration Statement on Form S-3, filed on November 30, 2016, Commission File No. 333-214848 |
| |
| 5.1** | | Opinion of Venable LLP regarding the legality of the securities being registered |
| |
| 8.1** | | Opinion of Nelson Mullins Riley & Scarborough LLP as to tax matters |
| |
| 10.1 | | SmartStop Self Storage REIT, Inc. 2022 Long-Term Incentive Plan, incorporated by reference to Exhibit 10.1 to the Registrant’s Current Report on Form 8-K, filed on June 15, 2022, Commission File No. 000-55617 |
| |
| 10.2 | | Executive Severance and Change of Control Plan, incorporated by reference to Exhibit 10.4 to the Registrant’s Current Report on Form 8-K, filed on July 2, 2019, Commission File No. 000-55617 |
| |
| 10.3 | | Amendment No. 1 to the Executive Severance and Change of Control Plan of SmartStop Self Storage REIT, Inc., incorporated by reference to Exhibit 10.7 to the Registrant’s Current Report on Form 8-K, filed on April 24, 2020, Commission File No. 000-55617 |
| |
| 10.4 | | Third Amended and Restated Limited Partnership Agreement, dated June 28, 2019, of Strategic Storage Operating Partnership II, L.P., incorporated by reference to Exhibit 10.2 to the Registrant’s Current Report on Form 8-K, filed on July 2, 2019, Commission File No. 000-55617 |
| |
| 10.5 | | Amendment No. 1 to Third Amended and Restated Limited Partnership Agreement of SmartStop OP, L.P., incorporated by reference to Exhibit 10.2 to the Registrant’s Current Report on Form 8-K, filed on October 30, 2019, Commission File No. 000-55617 |
| |
| 10.6 | | Amendment No. 2 to Third Amended and Restated Limited Partnership Agreement of SmartStop OP, L.P., incorporated by reference to Exhibit 10.1 to the Registrant’s Current Report on Form 8-K, filed on April 24, 2020, Commission File No. 000-55617 |
| |
| 10.7 | | Amendment No. 3 to Third Amended and Restated Limited Partnership Agreement of SmartStop OP, L.P., incorporated by reference to Exhibit 10.1 to the Registrant’s Current Report on Form 8-K, filed on March 25, 2021, Commission File No. 000-55617 |
| |
| 10.8 | | Amendment No. 4 to Third Amended and Restated Limited Partnership Agreement of SmartStop OP, L.P., incorporated by reference to Exhibit 10.32 to the Registrant’s Annual Report on Form 10-K, filed on March 23, 2022, Commission File No. 000-55617 |
II-4
| | |
Exhibit
No. | | Description |
| |
| 10.9 | | Form of Time-Based Restricted Stock Agreement (Executives), incorporated by reference to Exhibit 10.2 to the Registrant’s Annual Report on Form 10-K, filed on March 3, 2023, Commission File No. 000-55617 |
| |
| 10.10 | | Form of Performance-Based Restricted Stock Agreement (Executives), incorporated by reference to Exhibit 10.3 to the Registrant’s Annual Report on Form 10-K, filed on March 3, 2023, Commission File No. 000-55617 |
| |
| 10.11 | | Form of Restricted Stock Agreement (Directors), incorporated by reference to Exhibit 10.4 to the Registrant’s Annual Report on Form 10-K, filed on March 3, 2023, Commission File No. 000-55617 |
| |
| 10.12 | | Form of Time-Based LTIP Unit Agreement (Executives), incorporated by reference to Exhibit 10.5 to the Registrant’s Annual Report on Form 10-K, filed on March 3, 2023, Commission File No. 000-55617 |
| |
| 10.13 | | Form of Performance-Based LTIP Unit Agreement (Executives), incorporated by reference to Exhibit 10.6 to the Registrant’s Annual Report on Form 10-K, filed on March 3, 2023, Commission File No. 000-55617 |
| |
| 10.14 | | Form of LTIP Unit Agreement (Directors), incorporated by reference to Exhibit 10.7 to the Registrant’s Annual Report on Form 10-K, filed on March 3, 2023, Commission File No. 000-55617 |
| |
| 10.15 | | Loan Agreement, incorporated by reference to Exhibit 10.1 to the Registrant’s Form 8-K, filed on August 3, 2016, Commission File No. 000-55617 |
| |
| 10.16 | | KeyBank Guaranty, incorporated by reference to Exhibit 10.2 to the Registrant’s Form 8-K filed on August 3, 2016, Commission File No. 000-55617 |
| |
| 10.17 | | Promissory Note A-1, incorporated by reference to Exhibit 10.3 to the Registrant’s Form 8-K filed on August 3, 2016, Commission File No. 000-55617 |
| |
| 10.18 | | Promissory Note A-2, incorporated by reference to Exhibit 10.4 to the Registrant’s Form 8-K filed on August 3, 2016, Commission File No. 000-55617 |
| |
| 10.19 | | CMBS Loan Agreement, dated January 24, 2019, incorporated by reference to Exhibit 10.9 to the Registrant’s Form 8-K, filed on January 30, 2019, Commission File No. 000-55617 |
| |
| 10.20 | | CMBS Promissory Note A-1, dated January 24, 2019, incorporated by reference to Exhibit 10.10 to the Registrant’s Form 8-K, filed on January 30, 2019, Commission File No. 000-55617 |
| |
| 10.21 | | CMBS Promissory Note A-2, dated January 24, 2019, incorporated by reference to Exhibit 10.11 to the Registrant’s Form 8-K, filed on January 30, 2019, Commission File No. 000-55617 |
| |
| 10.22 | | CMBS Promissory Note A-3, dated January 24, 2019, incorporated by reference to Exhibit 10.12 to the Registrant’s Form 8-K, filed on January 30, 2019, Commission File No. 000-55617 |
| |
| 10.23 | | CMBS Promissory Note A-4, dated January 24, 2019, incorporated by reference to Exhibit 10.13 to the Registrant’s Form 8-K, filed on January 30, 2019, Commission File No. 000-55617 |
| |
| 10.24 | | CMBS Guaranty Agreement, dated January 24, 2019, incorporated by reference to Exhibit 10.14 to the Registrant’s Form 8-K, filed on January 30, 2019, Commission File No. 000-55617 |
| |
| 10.25 | | Contribution Agreement, dated June 28, 2019, by and among Strategic Storage Operating Partnership II, L.P., the Company, SmartStop Asset Management, LLC and SmartStop OP Holdings, LLC, incorporated by reference to Exhibit 10.1 to the Registrant’s Current Report on Form 8-K, filed on July 2, 2019, Commission File No. 000-55617 |
II-5
| | |
Exhibit
No. | | Description |
| |
| 10.26 | | Registration Rights Agreement, dated June 28, 2019, by and among the Company, Strategic Storage Operating Partnership II, L.P., SmartStop OP Holdings, LLC, SS Growth Advisor, LLC, Strategic 1031, LLC, SS Toronto REIT Advisors, Inc., San Juan Capital, LLC, and JDW 1998 Trust, incorporated by reference to Exhibit 10.3 to the Registrant’s Current Report on Form 8-K, filed on July 2, 2019, Commission File No. 000-55617 |
| |
| 10.27 | | Form of Indemnification Agreement, incorporated by reference to Exhibit 10.1 to the Registrant’s Current Report on Form 8-K, filed on September 19, 2019, Commission File No. 000-55617 |
| |
| 10.28 | | Preferred Stock Purchase Agreement, dated as of October 29, 2019, by and between SmartStop Self Storage REIT, Inc. and Extra Space Storage LP, incorporated by reference to Exhibit 10.1 to the Registrant’s Current Report on Form 8-K, filed on October 30, 2019, Commission File No. 000-55617 |
| |
| 10.29 | | Investors’ Rights Agreement, dated as of October 29, 2019, by and between SmartStop Self Storage REIT, Inc. and Extra Space Storage LP, incorporated by reference to Exhibit 10.3 to the Registrant’s Current Report on Form 8-K, filed on October 30, 2019, Commission File No. 000-55617 |
| |
| 10.30 | | Credit Agreement, dated March 17, 2021, among SmartStop OP, L.P., as borrower, KeyBank, National Association, as administrative agent, certain other financial institutions acting as joint book runners, joint lead arrangers, syndication agents and documentation agents, and certain lenders party thereto, incorporated by reference to Exhibit 10.1 to the Registrant’s Current Report on Form 8-K, filed on March 17, 2021, Commission File No. 000-55617 |
| |
| 10.31 | | First Amendment to Credit Agreement, dated October 7, 2021, incorporated by reference to Exhibit 10.1 to the Registrant’s Current Report on Form 8-K, filed on October 7, 2021, Commission File No. 000-55617 |
| |
| 10.32 | | Increase Agreement, dated October 7, 2021, incorporated by reference to Exhibit 10.2 to the Registrant’s Current Report on Form 8-K, filed on October 7, 2021, Commission File No. 000-55617 |
| |
| 10.33 | | Second Amendment to Credit Agreement, dated April 19, 2022, incorporated by reference to Exhibit 10.32 to Amendment No. 1 to the Company’s Registration Statement on Form S-11, filed on December 12, 2022, Commission File No. 333-264449 |
| |
| 10.34 | | Sponsor Funding Agreement, dated as of November 1, 2023, incorporated by reference to Exhibit 10.1 to the Registrant’s Current Report on Form 8-K, filed on November 1, 2023, Commission File No. 000-55617 |
| |
| 10.35 | | Amendment No. 3 to the Second Amended and Restated Limited Partnership Agreement of Strategic Storage Operating Partnership VI, L.P., dated as of November 1, 2023, incorporated by reference to Exhibit 10.2 to the Registrant’s Current Report on Form 8-K, filed on November 1, 2023, Commission File No. 000-55617 |
| |
| 10.36 | | Amended and Restated Credit Agreement, dated as of February 22, 2024, incorporated by reference to Exhibit 10.1 to the Registrant’s Current Report on Form 8-K, filed on February 23, 2024, Commission File No. 000-55617 |
| |
| 10.37 | | Note Purchase Agreement, as amended on April 26, 2024, incorporated by reference to Exhibit 10.1 to the Registrant’s Current Report on Form 8-K, filed on April 29, 2024, Commission File No. 000-55617 |
| |
| 10.38 | | Credit Agreement, dated November 19, 2024, incorporated by reference to Exhibit 10.1 to the Registrant’s Current Report on Form 8-K, filed on November 25, 2024, Commission File No. 000-55617 |
| |
| 21.1 | | Subsidiaries of SmartStop Self Storage REIT, Inc., incorporated by reference to Exhibit 21.1 to the Registrant’s Annual Report on Form 10-K, filed on March 18, 2024, Commission File No. 000-55617 |
| |
| 23.1* | | Consent of BDO USA, P.C., Independent Registered Public Accounting Firm |
| |
| 23.2** | | Consent of Venable LLP (included in Exhibit 5.1) |
II-6
| | |
Exhibit
No. | | Description |
| |
| 23.3** | | Consent of Nelson Mullins Riley & Scarborough LLP (included in Exhibit 8.1) |
| |
| 24.1*** | | Power of Attorney |
| |
| 99.1* | | Consent of Robert A. Stanger & Co., Inc. |
| |
| 101* | | The following SmartStop Self Storage REIT, Inc. financial information for the Nine Months Ended September 30, 2024 and the Year Ended December 31, 2023, formatted in Inline XBRL: (i) Consolidated Balance Sheets, (ii) Consolidated Statements of Operations, (iii) Consolidated Statements of Comprehensive Loss, (iv) Consolidated Statements of Equity, (v) Consolidated Statements of Cash Flows and (vi) the Notes to Consolidated Financial Statements |
| |
| 104* | | Cover Page Interactive Data File (formatted as inline XBRL and contained in Exhibit 101) |
| |
| 107*** | | Filing fee table |
| ** | | To be filed by amendment. |
Certain instruments defining rights of holders of long-term debt of the company and its consolidated subsidiaries are omitted pursuant to Item 601(b)(4)(iii) of Regulation S-K. Upon request, the company agrees to furnish to the SEC copies of such instruments.
II-7
SIGNATURES
Pursuant to the requirements of the Securities Act of 1933, the Registrant certifies that it has reasonable grounds to believe that it meets all the requirements for filing on Form S-11 and has duly caused this registration statement to be signed on its behalf by the undersigned, thereunto duly authorized, in the City of Ladera Ranch, State of California, on December 9, 2024.
| | |
| SMARTSTOP SELF STORAGE REIT, INC. |
| |
By: | | /s/ H. Michael Schwartz |
Name: | | H. Michael Schwartz |
Title: | | Chairman of the Board and Chief Executive Officer |
Pursuant to the requirements of the Securities Act of 1933, as amended, this Registration Statement has been signed by the following persons in the capacities and on the dates indicated.
| | | | | | |
Signature | | Title | | Date |
| | | |
| By: | | /s/ H. Michael Schwartz H. Michael Schwartz | | Chairman of the Board and Chief Executive Officer (Principal Executive Officer) | | December 9, 2024 |
| | | |
| By: | | /s/ James R. Barry James R. Barry* | | Chief Financial Officer and Treasurer (Principal Financial Officer) | | December 9, 2024 |
| | | |
| By: | | /s/ Michael O. Terjung Michael O. Terjung* | | Chief Accounting Officer (Principal Accounting Officer) | | December 9, 2024 |
| | | |
| By: | | /s/ Paula Mathews Paula Mathews* | | Director | | December 9, 2024 |
| | | |
| By: | | /s/ Timothy S. Morris Timothy S. Morris* | | Director | | December 9, 2024 |
| | | |
| By: | | /s/ David J. Mueller David J. Mueller* | | Director | | December 9, 2024 |
| | | |
| By: | | /s/ Harold “Skip” Perry Harold “Skip” Perry* | | Director | | December 9, 2024 |
| * | | By: H. Michael Schwartz, as Attorney in fact, pursuant to Power of Attorney, dated April 21, 2022. |
II-8