UNITED STATES
SECURITIES AND EXCHANGE COMMISSION
Washington, D.C. 20549
FORM N-CSR
CERTIFIED SHAREHOLDER REPORT OF REGISTERED
MANAGEMENT INVESTMENT COMPANIES
Investment Company Act File Number 811-22888
Wildermuth Endowment Strategy Fund
(Exact name of registrant as specified in charter)
11525 Park Woods Circle, Ste. 200
Alpharetta, GA 30005
(Address of principal executive offices) (Zip code)
Daniel Wildermuth
Wildermuth Advisory, LLC
11525 Park Woods Circle, Ste. 200
Alpharetta, GA 30005
(Name and address of agent for service)
Registrant's telephone number, including area code: (888) 889-8981
Date of fiscal year end: December 31
Date of reporting period: June 30, 2016
Item 1. Reports to Stockholders.

SEMI-ANNUAL REPORT
JUNE 30, 2016
WWW.WILDERMUTHENDOWMENTFUND.COM ● 1-888-889-8981 ●
DISTRIBUTED BY SQN SECURITIES, LLC (MEMBER FINRA/SIPC)
Wildermuth Endowment Strategy Fund |
Table of Contents | |
| |
Letter to Shareholders | 2 |
Portfolio Review | 3 |
Schedule of Investments | 4 |
Statement of Assets and Liabilities | 10 |
Statement of Operations | 11 |
Statements of Changes in Net Assets | 12 |
Statement of Cash Flows | 13 |
Financial Highlights | 14 |
Notes to Financial Statements | 16 |
Additional Information | 26 |
Wildermuth Endowment Strategy Fund Letter to Shareholders (Unaudited)
June 30, 2016 |
Dear Investor:
We are pleased to present this semi-annual report for the Wildermuth Endowment Strategy Fund (the “Fund”) covering the 6-month period from January 2, 2016 to June 30, 2016.
During this period, the Fund generated a total return of 4.79% versus 3.84% for the S&P 500 and 5.31% for the Barclays U.S. Aggregate Bond Index. The Fund’s performance resulted from several asset classes within its diversified strategy delivering strong performance which enhanced the returns generated by the U.S. stocks.
The asset classes that contributed to the Fund’s performance included private equity, emerging market equities, real estate, US equities, US fixed income, and oil and gas holdings. The greatest positive impact on performance resulted from a favorable private equity investment in a firm offering an improved method for doctors to perform biopsies. Emerging markets also contributed significantly by generating strong returns in the first half of the year.
Oil and gas holdings also helped performance as most fossil fuel energy companies recovered from February lows to end up for the first half of the year. Returns for the fund in the sector were enhanced through significantly expanding the fund’s allocation in February very near the lows in the overall market, enabling a larger percentage of the portfolio to benefit from the strong and widespread pricing recovery.
For the first half of the year in 2016, no asset classes experienced severe downturns, but a few lagged the portfolio’s overall performance. Most notably, developed market equities were approximately flat through the first half of the year with a slight downturn in pricing essentially offset by dividends.
Holdings in business development companies were mixed with some holdings increasing in value while others declined slightly. The contribution of dividends from the sector resulting in overall returns that were up, but only marginally. An investment in alternative debt also declined slightly in value. Cash holdings also contributed almost nothing to portfolio returns.
Looking forward to the second half of 2016, we expect that global uncertainty and volatile markets will likely present ongoing challenges to investors. High uncertainty in commodities, particularly oil and gas, combined with heightened struggles of numerous large international economies and the impacts of Brexit will likely continue to destabilize a wide variety of asset values and related investment sectors.
Against this backdrop, we feel that investment selection is particularly important, and we believe we are well positioned to find and add attractive investments to the portfolio which should contribute to portfolio returns while limiting overall portfolio volatility.
Thank you for your continued confidence and support.
Sincerely,
Daniel Wildermuth
President and Chief Executive Officer, and
Chairman and Trustee of the Fund
2
Wildermuth Endowment Strategy Fund Portfolio Review (Unaudited)
June 30, 2016 |
The Fund’s performance figures* for each of the periods ended June 30, 2016, compared to its benchmarks:
| Year
to Date4 | One
Year | Annualized
Since Inception2 |
Class A | 4.79% | 0.52% | 9.79% |
Class A with Load1 | (1.51)% | (5.51)% | 5.33% |
| | | | |
S&P 500® Index** | 3.84% | 3.99% | 3.49% |
Barclays U.S. Aggregate Bond Index*** | 5.31% | 6.00% | 3.90% |
| | | Cumulative
Since Inception3,4 |
Class C | | | 5.05% |
Class C with Sales Charge5 | | | 4.05% |
S&P 500® Index** | | | 4.55% |
Barclays U.S. Aggregate Bond Index*** | | | 3.43% |
1 | Calculated using the maximum sales load of 6.00% |
2 | The Class A inception date is December 31, 2014. |
3 | The Class C inception date is March 14, 2016. |
4 | Not annualized for periods less than one year. |
5 | Class C shares are subject to a Contingent Deferred Sales Charge of 1.00% on any shares redeemed within 365 days of purchase. |
* | The performance data quoted here represents past performance. Current performance may be lower or higher than the performance data quoted above. Investment return and principal value will fluctuate, so that shares, when redeemed, may be worth more or less than their original cost. The returns shown do not reflect the deduction of taxes that a shareholder would pay on Fund distributions or on the redemptions of Fund shares. Past performance is no guarantee of future results. Class A has a total annual operating expense of 17.26% and Class C has a total annual operating expense of 18.01% per the prospectus dated March 15, 2016. |
** | The S&P 500® Total Return Index is an unmanaged market capitalization-weighted index of 500 widely held common stocks. Investors cannot invest directly in an index. |
*** | The Barclays U.S. Aggregate Bond Index is a broad-based benchmark that measures the investment grade, U.S. dollar-denominated, fixed-rate taxable bond market, including Treasuries, government-related and corporate securities, MBS (agency fixed-rate and hybrid ARM pass-through securities), ABS, and CMBS. Investors cannot invest directly in an index. |
Holdings by type of Investment | % of
Net Assets | 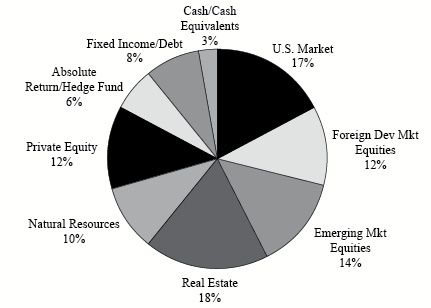
|
U.S. Market | 17.45% |
Foreign Dev Mkt Equities | 11.66% |
Emerging Mkt Equities | 13.66% |
Real Estate | 18.10% |
Natural Resources | 9.75% |
Private Equity | 12.31% |
Absolute Return/Hedge Fund | 6.35% |
Fixed Income/Debt | 8.08% |
Cash/Cash Equivalents | 2.64% |
| | 100.00% |
| | |
| | |
Please refer to the Schedule of Investments in this Semi-Annual Report for detailed analysis of the Fund’s Holdings.
3
Wildermuth Endowment Strategy Fund Schedule of Investments
June 30, 2016 (Unaudited) |
Number
of Shares | | | | Value | |
| | | COMMON STOCKS — 26.7% | | | |
| | | AGRICULTURE — 0.2% | | | |
| | 1,448 | | Swedish Match AB | | $ | 49,989 | |
| | | | | | | | |
| | | | AIRLINES — 0.2% | | | | |
| | 18,401 | | Qantas Airways, Ltd.(a) | | | 38,638 | |
| | | | | | | | |
| | | | AUTO PARTS & EQUIPMENT — 0.8% | | | | |
| | 206 | | Continental AG | | | 38,747 | |
| | 1,023 | | Cooper-Standard Holding, Inc.(a) | | | 80,807 | |
| | 17,562 | | SORL Auto Parts, Inc.(a) | | | 31,260 | |
| | 820 | | Tenneco, Inc.(a) | | | 38,220 | |
| | | | | | | 189,034 | |
| | | | BANKS — 1.0% | | | | |
| | 1,053 | | Capital One Financial Corp. | | | 66,876 | |
| | 10,164 | | Mitsubishi UFJ Financial Group, Inc., ADR | | | 45,027 | |
| | 2,180 | | Western Alliance Bancorp(a) | | | 71,177 | |
| | 4,310 | | Yamaguchi Financial Group, Inc. | | | 40,541 | |
| | | | | | | 223,621 | |
| | | | BEVERAGES — 0.2% | | | | |
| | 634 | | Heineken Holding NV | | | 51,531 | |
| | | | | | | | |
| | | | BIOTECHNOLOGY — 0.5% | | | | |
| | 287 | | China Biologic Products, Inc.(a) | | | 30,514 | |
| | 769 | | United Therapeutics Corp.(a) | | | 81,452 | |
| | | | | | | 111,966 | |
| | | | BUILDING MATERIALS — 1.2% | | | | |
| | 8,501 | | Asahi Glass Co., Ltd. | | | 45,741 | |
| | 4,126 | | Owens Corning | | | 212,571 | |
| | | | | | | 258,312 | |
| | | | CHEMICALS — 0.4% | | | | |
| | 1,117 | | Croda International PLC | | | 46,873 | |
| | 14,053 | | Teijin, Ltd. | | | 46,163 | |
| | | | | | | 93,036 | |
| | | | COMMERCIAL SERVICES — 1.5% | | | | |
| | 4,821 | | Total System Services, Inc. | | | 256,043 | |
| | 1,174 | | United Rentals, Inc.(a) | | | 78,776 | |
| | | | | | | 334,819 | |
| | | | DIVERSIFIED FINANCIAL SERVICES — 1.2% | | | | |
| | 4,898 | | Ally Financial, Inc.(a) | | | 83,609 | |
| | 3,335 | | Encore Capital Group, Inc.(a) | | | 78,473 | |
| | 1,011 | | Euronext NV(b) | | | 37,223 | |
| | 76,000 | | Haitong International Securities Group, Ltd. | | | 45,553 | |
| | 2,295 | | KCG Holdings, Inc., Class A(a) | | | 30,523 | |
| | | | | | | 275,381 | |
See accompanying notes to financial statements.
4
Wildermuth Endowment Strategy Fund Schedule of Investments - Continued
June 30, 2016 (Unaudited) |
Number
of Shares | | | | Value | |
| | | COMMON STOCKS (CONTINUED) | | | |
| | | ELECTRIC — 0.4% | | | |
| | 1,614 | | Brookfield Infrastructure Partners LP | | $ | 73,050 | |
| | 1,053 | | Huaneng Power International, Inc., ADR | | | 26,293 | |
| | | | | | | 99,343 | |
| | | | ELECTRONICS — 0.2% | | | | |
| | 10,528 | | AU Optronics Corp., ADR | | | 36,743 | |
| | | | | | | | |
| | | | ENGINEERING & CONSTRUCTION — 0.5% | | | | |
| | 1,966 | | Argan, Inc. | | | 82,021 | |
| | 1,117 | | Boskalis Westminster | | | 38,334 | |
| | | | | | | 120,355 | |
| | | | FOOD — 1.0% | | | | |
| | 2,065 | | Cal-Maine Foods, Inc. | | | 91,521 | |
| | 13,272 | | J Sainsbury PLC | | | 41,212 | |
| | 1,359 | | Tyson Foods, Inc., Class A | | | 90,768 | |
| | | | | | | 223,501 | |
| | | | FOREST PRODUCTS & PAPER — 0.6% | | | | |
| | 3,666 | | Domtar Corp. | | | 128,347 | |
| | | | | | | | |
| | | | HEALTHCARE-PRODUCTS — 0.5% | | | | |
| | 4,194 | | Exactech, Inc.(a) | | | 112,148 | |
| | | | | | | | |
| | | | HEALTHCARE-SERVICES — 0.5% | | | | |
| | 784 | | Chemed Corp. | | | 106,867 | |
| | 342 | | HealthSouth Corp. | | | 13,276 | |
| | | | | | | 120,143 | |
| | | | HOME FURNISHINGS — 0.2% | | | | |
| | 5,829 | | Panasonic Corp. | | | 50,057 | |
| | | | | | | | |
| | | | INSURANCE — 1.1% | | | | |
| | 2,909 | | AmTrust Financial Services, Inc. | | | 71,270 | |
| | 248 | | Muenchener Rueckver AG | | | 41,398 | |
| | 7,764 | | State National Cos., Inc. | | | 81,755 | |
| | 523 | | Swiss Re AG | | | 45,498 | |
| | | | | | | 239,921 | |
| | | | INTERNET — 0.3% | | | | |
| | 537 | | F5 Networks, Inc.(a) | | | 61,132 | |
| | | | | | | | |
| | | | LEISURE TIME — 0.2% | | | | |
| | 2,996 | | TUI AG | | | 33,851 | |
| | | | | | | | |
| | | | MACHINERY-DIVERSIFIED — 0.1% | | | | |
| | 1,726 | | Hollysys Automation Technologies, Ltd.(a) | | | 29,981 | |
See accompanying notes to financial statements.
5
Wildermuth Endowment Strategy Fund Schedule of Investments - Continued
June 30, 2016 (Unaudited) |
Number
of Shares | | | | Value | |
| | | COMMON STOCKS (CONTINUED) | | | |
| | | OFFICE/BUSINESS EQUIPMENT — 0.6% | | | |
| | 13,705 | | Xerox Corp. | | $ | 130,060 | |
| | | | | | | | |
| | | | OIL & GAS — 1.1% | | | | |
| | 1,723 | | Murphy Oil Corp. | | | 54,705 | |
| | 1,730 | | Neste Oyj | | | 61,754 | |
| | 6,704 | | Western Refining, Inc. | | | 138,304 | |
| | | | | | | 254,763 | |
| | | | OIL & GAS SERVICES — 1.0% | | | | |
| | 24,238 | | Gulfmark Offshore, Inc., Class A(a) | | | 75,865 | |
| | 2,494 | | National Oilwell Varco, Inc. | | | 83,923 | |
| | 3,843 | | World Point Terminals LP | | | 60,719 | |
| | | | | | | 220,507 | |
| | | | PHARMACEUTICALS — 1.5% | | | | |
| | 2,426 | | Daiichi Sankyo Co., Ltd. | | | 58,492 | |
| | 2,861 | | Mitsubishi Tanabe Pharma Corp. | | | 51,397 | |
| | 784 | | Novartis AG, ADR | | | 64,688 | |
| | 4,385 | | Omega Protein Corp.(a) | | | 87,656 | |
| | 735 | | USANA Health Sciences, Inc.(a) | | | 81,901 | |
| | | | | | | 344,134 | |
| | | | PIPELINES — 2.4% | | | | |
| | 722 | | Buckeye Partners LP | | | 50,778 | |
| | 1,900 | | DCP Midstream Partners LP | | | 65,531 | |
| | 6,540 | | Energy Transfer Equity LP | | | 93,980 | |
| | 1,852 | | Genesis Energy LP | | | 71,061 | |
| | 817 | | Phillips 66 Partners LP | | | 45,646 | |
| | 1,053 | | Spectra Energy Partners LP | | | 49,681 | |
| | 970 | | TC PipeLines LP | | | 55,542 | |
| | 2,737 | | Williams Partners LP | | | 94,810 | |
| | | | | | | 527,029 | |
| | | | RETAIL — 2.0% | | | | |
| | 1,467 | | Asbury Automotive Group, Inc.(a) | | | 77,369 | |
| | 2,805 | | Brinker International, Inc. | | | 127,712 | |
| | 1,035 | | Liberty Interactive Corp. QVC Group, Class A(a) | | | 26,258 | |
| | 2,190 | | Michaels Cos., Inc.(a) | | | 62,284 | |
| | 416 | | Pandora A/S | | | 56,342 | |
| | 1,039 | | Target Corp. | | | 72,543 | |
| | 763 | | World Fuel Services Corp. | | | 36,235 | |
| | | | | | | 458,743 | |
| | | | SEMICONDUCTORS — 1.2% | | | | |
| | 2,860 | | Cirrus Logic, Inc.(a) | | | 110,939 | |
| | 1,167 | | Lam Research Corp. | | | 98,098 | |
| | 809 | | NXP Semiconductors NV(a) | | | 63,377 | |
| | | | | | | 272,414 | |
See accompanying notes to financial statements.
6
Wildermuth Endowment Strategy Fund Schedule of Investments - Continued
June 30, 2016 (Unaudited) |
Number
of Shares | | | | Value | |
| | | COMMON STOCKS (CONTINUED) | | | |
| | | SOFTWARE — 1.3% | | | |
| | 3,061 | | ACI Worldwide, Inc.(a) | | $ | 59,720 | |
| | 1,810 | | Cerner Corp.(a) | | | 106,066 | |
| | 1,474 | | Changyou.com, Ltd., ADR(a) | | | 29,539 | |
| | 938 | | Fiserv, Inc.(a) | | | 101,989 | |
| | | | | | | 297,314 | |
| | | | TELECOMMUNICATIONS — 2.0% | | | | |
| | 4,369 | | ARRIS International PLC(a) | | | 91,574 | |
| | 10,307 | | CenturyLink, Inc. | | | 299,006 | |
| | 13,023 | | Koninklijke KPN NV | | | 47,095 | |
| | | | | | | 437,675 | |
| | | | TRANSPORTATION — 0.4% | | | | |
| | 5,355 | | Ship Finance International, Ltd. | | | 78,933 | |
| | | | | | | | |
| | | | TRUCKING & LEASING — 0.4% | | | | |
| | 213 | | AMERCO | | | 79,779 | |
| | | | | | | | |
| | | | TOTAL COMMON STOCKS (Cost $5,973,938) | | | 5,983,200 | |
| | | | | | | | |
| | | | EXCHANGE TRADED FUNDS — 26.6% | | | | |
| | | | ASSET ALLOCATION FUNDS — 0.8% | | | | |
| | 4,296 | | SPDR Barclays Convertible Securities | | | 188,337 | |
| | | | | | | | |
| | | | CLOSED-END FUNDS — 0.8% | | | | |
| | 19,509 | | PIMCO High Income Fund | | | 190,018 | |
| | | | | | | | |
| | | | DEBT FUNDS — 4.0% | | | | |
| | 3,591 | | iShares Core U.S. Aggregate Bond | | | 404,239 | |
| | 1,294 | | iShares iBoxx $Investment Grade Corporate Bond | | | 158,812 | |
| | 1,445 | | iShares JP Morgan USD Emerging Markets Bond | | | 166,392 | |
| | 5,635 | | PowerShares Emerging Markets Sovereign Debt Portfolio | | | 166,683 | |
| | | | | | | 896,126 | |
| | | | EQUITY FUNDS — 21.0% | | | | |
| | 17,303 | | First Trust North American Energy Infrastructure | | | 427,038 | |
| | 4,723 | | Global X MLP & Energy Infrastructure | | | 65,225 | |
| | 3,938 | | iShares MSCI All Peru Capped | | | 121,645 | |
| | 4,326 | | iShares MSCI Chile Capped | | | 159,197 | |
| | 23,777 | | iShares MSCI EAFE | | | 1,326,994 | |
| | 5,231 | | iShares MSCI India | | | 146,049 | |
| | 19,213 | | iShares MSCI Malaysia | | | 159,276 | |
| | 3,537 | | iShares MSCI Philippines | | | 138,544 | |
| | 8,418 | | iShares MSCI Poland Capped | | | 142,853 | |
| | 9,158 | | iShares MSCI Taiwan | | | 128,670 | |
| | 3,259 | | Market Vectors Vietnam | | | 47,614 | |
See accompanying notes to financial statements.
7
Wildermuth Endowment Strategy Fund Schedule of Investments - Continued
June 30, 2016 (Unaudited) |
Number
of Shares | | | | Value | |
| | | EXCHANGE TRADED FUNDS (CONTINUED) | | | |
| | | EQUITY FUNDS (Continued) | | | |
| | 52,282 | | Vanguard FTSE Emerging Markets | | $ | 1,841,372 | |
| | | | | | | 4,704,477 | |
| | | | | | | | |
| | | | TOTAL EXCHANGE TRADED FUNDS (Cost $5,828,776) | | | 5,978,958 | |
| | | | | | | | |
| | | | EXCHANGE TRADED NOTES — 2.5% | | | | |
| | | | EQUITY FUNDS — 2.5% | | | | |
| | 13,158 | | Credit Suisse X-Links Cushing MLP Infrastructure | | | 280,002 | |
| | 9,688 | | ETRACS Alerian MLP Infrastructure Index | | | 273,888 | |
| | | | TOTAL EXCHANGE TRADED NOTES (Cost $437,257) | | | 553,890 | |
| | | | | | | | |
| | | | HEDGE FUNDS — 6.4% | | | | |
| | 500,000 | | Direct Lending Income Fund LP(c) | | | 503,077 | |
| | 450,000 | | PHI Single Index Option Fund LP(c) | | | 464,109 | |
| | 475,000 | | Semper Midas Fund LP(c) | | | 460,140 | |
| | | | TOTAL HEDGE FUNDS (Cost $1,425,000) | | | 1,427,326 | |
| | | | | | | | |
| | | | PRIVATE EQUITY — 12.3% | | | | |
| | 1,500 | | Clear Guide Medical, Inc.(c) | | | 1,765,823 | |
| | 10 | | GPB Automotive Portfolio LP(c) | | | 500,695 | |
| | 153,276 | | Tout, Inc. - Series C Preferred Stock(c) | | | 500,000 | |
| | | | TOTAL PRIVATE EQUITY (Cost $2,500,000) | | | 2,766,518 | |
| | | | | | | | |
| | | | PUBLIC NON-TRADED BUSINESS DEVELOPMENT COMPANIES — 4.9% | | | | |
| | 23,217 | | CION Investment Corp.(c) | | | 203,151 | |
| | 22,462 | | Corporate Capital Trust, Inc.(c) | | | 193,619 | |
| | 78,452 | | FS Energy & Power Fund(c) | | | 557,796 | |
| | 18,605 | | HMS Income Fund, Inc.(c) | | | 145,117 | |
| | | | TOTAL PUBLIC NON-TRADED BUSINESS DEVELOPMENT COMPANIES
(Cost $1,100,020) | | | 1,099,683 | |
| | | | | | | | |
| | | | PRIVATE REAL ESTATE INVESTMENTS — 9.8% | | | | |
| | 40,625 | | ARC Property Trust, Inc.(c) | | | 546,406 | |
| | 61,140 | | Cottonwood Residential, Inc.(c) | | | 1,002,085 | |
| | 600 | | PCG Select Series I LLC - Series A Preferred Stock(c) | | | 600,000 | |
| | 56 | | Shopoff Land Fund III LP(c) | | | 50,680 | |
| | | | | | | | |
| | | | TOTAL PRIVATE REAL ESTATE INVESTMENTS (Cost $2,056,013) | | | 2,199,171 | |
| | | | | | | | |
| | | | PUBLIC REAL ESTATE INVESTMENTS — 8.3% | | | | |
| | | | PUBLIC NON-TRADED REAL ESTATE INVESTMENT TRUSTS — 8.0% | | | | |
| | 111,521 | | Behringer Harvard Opportunity(c) | | | 399,245 | |
| | 107,025 | | CNL Lifestyle Properties(c) | | | 326,427 | |
| | 18,060 | | Dividend Capital Diversified(c) | | | 133,106 | |
See accompanying notes to financial statements.
8
Wildermuth Endowment Strategy Fund Schedule of Investments - Continued
June 30, 2016 (Unaudited) |
Number
of Shares | | | | Value | |
| | | PUBLIC REAL ESTATE INVESTMENTS (CONTINUED) | | | |
| | | PUBLIC NON-TRADED REAL ESTATE INVESTMENT TRUSTS (Continued) | | | |
| | 136,771 | | Highlands REIT, Inc.(c) | | $ | 49,238 | |
| | 153,283 | | Inventrust Properties Corp.(c) | | | 481,309 | |
| | 97,153 | | KBS REIT II, Inc.(c) | | | 382,784 | |
| | 2,000 | | Phillips Edison Grocery Center(c) | | | 20,400 | |
| | | | | | | 1,792,509 | |
| | | | PUBLIC NON-TRADED REAL ESTATE LIMITED PARTNERSHIP — 0.1% | | | | |
| | 1,000 | | Uniprop Manufactured Housing Communities Income Fund II(c) | | | 12,340 | |
| | | | | | | | |
| | | | PUBLICLY TRADED REAL ESTATE INVESTMENT TRUSTS — 0.2% | | | | |
| | 4,037 | | Tier REIT, Inc. | | | 61,887 | |
| | | | TOTAL PUBLIC REAL ESTATE INVESTMENTS (Cost $1,494,234) | | | 1,866,736 | |
| | | | | | | | |
| | | | SHORT-TERM INVESTMENTS — 2.6% | | | | |
| | 594,007 | | Fidelity Institutional Government Portfolio - Institutional Class, 0.30%(d) | | | 594,007 | |
| | | | TOTAL SHORT-TERM INVESTMENTS (Cost $594,007) | | | 594,007 | |
| | | | | | | | |
| | | | TOTAL INVESTMENTS — 100.1% (Cost $21,409,245) | | | 22,469,489 | |
| | | | Liabilities less other assets — (0.1)% | | | (29,858 | ) |
| | | | | | | | |
| | | | TOTAL NET ASSETS —100.0% | | $ | 22,439,631 | |
ADR – American Depositary Receipt
LP – Limited Partnership
PLC – Public Limited Company
REIT – Real Estate Investment Trust
(b) | 144A Restricted Security |
(c) | Illiquid Security. Total illiquid securities represent 41.43% of net assets as of June 30, 2016 |
(d) | Represents the current rate as of June 30, 2016 |
See accompanying notes to financial statements.
9
Wildermuth Endowment Strategy Fund Statement of Assets and Liabilities
June 30, 2016 (Unaudited) |
Assets: | | | |
Investments at value (cost $21,409,245) | | $ | 22,469,489 | |
Cash | | | 920 | |
Receivables: | | | | |
Investment securities sold | | | 395,159 | |
Due from Advisor | | | 48,637 | |
Dividends and interest | | | 40,032 | |
Fund shares sold | | | 5,250 | |
Prepaid expenses | | | 77,206 | |
Total assets | | | 23,036,693 | |
| | | | | |
Liabilities: | | | | |
Payables: | | | | |
Investment securities purchased | | | 555,367 | |
Shareholder servicing fees | | | 12,616 | |
Professional fees | | | 10,921 | |
Fund accounting & administration | | | 6,610 | |
Transfer agent fees and expenses | | | 5,939 | |
Custody fees | | | 3,305 | |
Distribution fees | | | 748 | |
Accrued other liabilities | | | 1,556 | |
Total liabilities | | | 597,062 | |
Net Assets | | $ | 22,439,631 | |
| | | | | |
Net Assets Consist of: | | | | |
Paid in capital ($0 par value, 25,000,000 shares authorized) | | $ | 21,627,432 | |
Undistributed net investment income | | | 81,242 | |
Accumulated net realized loss on investments | | | (328,665 | ) |
Net unrealized appreciation (depreciation) on: | | | | |
Investments | | | 1,060,244 | |
Foreign currency translations | | | (622 | ) |
Net Assets | | $ | 22,439,631 | |
| | | | | |
Net Assets: | | | | |
Class A | | $ | 21,077,633 | |
Class C(1) | | | 1,361,998 | |
Net Assets | | $ | 22,439,631 | |
| | | | | |
Shares of Beneficial Interest Issued and Outstanding: | | | | |
Class A shares | | | 1,885,186 | |
Class C shares(1) | | | 122,158 | |
Total Shares Outstanding | | | 2,007,344 | |
| | | | | |
Net Asset Value, Offering Price and Redemption Proceeds per Share(2) | | | | |
Class A | | $ | 11.18 | |
Class C(1)(4) | | $ | 11.15 | |
Class A - Maximum offering price per share (Net asset value per share divided by 0.94)(3) | | $ | 11.89 | |
(1) | Class C inception date was March 14, 2016. |
(2) | Redemptions made within 90 days of purchase may be assessed a redemption fee of 2.00%. |
(3) | Reflects a maximum sales charge of 6.00%. |
(4) | Class C Shares of the Fund are subject to a Contingent Deferred Sales Charge (“CDSC”) of 1.00% on any shares sold within 365 days of purchase. |
See accompanying notes to financial statements.
10
Wildermuth Endowment Strategy Fund Statement of Operations
For the six months ended June 30, 2016(Unaudited) |
Investment Income: | | | |
Dividends (net of foreign withholding taxes of $4,740) | | $ | 282,397 | |
Interest | | | 1,398 | |
Total investment income | | | 283,795 | |
| | | | | |
Expenses: | | | | |
Management fees (see Note 4) | | | 127,686 | |
Legal expense | | | 86,690 | |
Fund Accounting & administration fees | | | 36,456 | |
Transfer agent expense | | | 31,397 | |
Shareholder servicing fees - Class A | | | 20,836 | |
Chief financial officer fees | | | 19,619 | |
Trustees' expense | | | 18,559 | |
Chief compliance officer fees | | | 18,427 | |
Registration expense | | | 15,859 | |
Insurance expense | | | 12,392 | |
Audit expense | | | 9,127 | |
Custodian expense | | | 7,228 | |
Printing expense | | | 6,848 | |
Miscellaneous Expenses | | | 6,757 | |
Distribution fees - Class C* | | | 1,324 | |
Shareholder servicing fees - Class C* | | | 441 | |
Total expenses | | | 419,646 | |
Expenses waived and reimbursed from advisor (see Note 4) | | | (205,884 | ) |
Net expenses | | | 213,762 | |
Net investment income | | | 70,033 | |
| | | | | |
Realized and Unrealized Gain (Loss) on Investments and foreign currency: | | | | |
Net realized gain (loss) on: | | | | |
Investments | | | (148,622 | ) |
Foreign currency transactions | | | 483 | |
Total net realized loss | | | (148,139 | ) |
Net change in unrealized appreciation (depreciation) on: | | | | |
Investments | | | 1,005,478 | |
Foreign currency translations | | | (622 | ) |
Total net change in unrealized appreciation | | | 1,004,856 | |
Net realized and unrealized gain on investments and foreign currency | | | 856,717 | |
| | | | | |
Net Increase in Net Assets from Operations | | $ | 926,750 | |
* | Reflects operations for the period from March 14, 2016 (inception date) to June 30, 2016. |
See accompanying notes to financial statements.
11
Wildermuth Endowment Strategy Fund Statement of Changes in Net Assets
|
| | | For the six
months ended
June 30, 2016
(Unaudited) | | | For the
period ended
December 31,
2015(3) | |
Change in Net Assets From: | | | | | | |
Operations: | | | | | | |
Net investment income | | $ | 70,033 | | | $ | 24,563 | |
Net realized loss on investments | | | (148,139 | ) | | | (182,891 | ) |
Net change in unrealized appreciation on investments | | | 1,004,856 | | | | 54,766 | |
Net increase (decrease) in net assets resulting from operations | | | 926,750 | | | | (103,562 | ) |
| | | | | | | | | |
Distributions to Shareholders: | | | | | | | | |
From net investment income - Class A | | | — | | | | (10,989 | ) |
From return of capital - Class A | | | (206,638 | )(1) | | | (135,124 | ) |
From return of capital - Class C | | | (8,217 | )(1) | | | — | |
Total distributions to shareholders | | | (214,855 | ) | | | (146,113 | ) |
| | | | | | | | | |
Capital Share Transactions: | | | | | | | | |
Net proceeds from Class A shares sold | | | 6,230,221 | | | | 14,121,176 | |
Net proceeds from Class C shares sold(2) | | | 1,324,193 | | | | — | |
Reinvestment of distributions from Class A shares | | | 134,906 | | | | 95,473 | |
Reinvestment of distributions from Class C shares(2) | | | 7,554 | | | | — | |
Cost of Class A shares redeemed | | | (436,121 | ) | | | — | |
Redemption fees | | | 9 | | | | — | |
Net increase from capital share transactions | | | 7,260,762 | | | | 14,216,649 | |
| | | | | | | | | |
Net change in net assets | | | 7,972,657 | | | | 13,966,974 | |
| | | | | | | | | |
Net Assets: | | | | | | | | |
Beginning of period | | | 14,466,974 | | | | 500,000 | |
End of period | | $ | 22,439,631 | | | $ | 14,466,974 | |
| | | | | | | | | |
Undistributed net investment income | | $ | 81,242 | | | $ | 11,209 | |
| | | | | | | | | |
Transactions in Shares: | | | | | | | | |
Issuance of Class A shares | | | 572,341 | | | | 1,281,421 | |
Issuance of Class C shares(2) | | | 121,475 | | | | — | |
Class A shares reinvested | | | 12,374 | | | | 8,770 | |
Class C shares reinvested(2) | | | 683 | | | | — | |
Class A shares redeemed | | | (39,720 | ) | | | — | |
Net increase in shares of beneficial interest outstanding | | | 667,153 | | | | 1,290,191 | |
(1) | The amounts and sources of distributions reported in this report reflect the estimates in order to comply with SEC regulations and are not being provided for tax reporting purposes. The actual amounts and sources of the amounts for tax reporting purposes will depend upon the Fund’s investment experience during the remainder of its fiscal year and may be subject to changes based on tax regulations. The Fund will send you a Form 1099-DIV in early 2017 for the 2016 calendar year that will tell you how to report these distributions for federal income tax purposes (e.g., ordinary income, long-term capital gain or return of capital). |
(2) | Reflects operations for the period from March 14, 2016 (inception date) to June 30, 2016. |
(3) | The Wildermuth Endowment Strategy Fund commenced operations on January 2, 2015 (inception date 12/31/2014). |
See accompanying notes to financial statements.
12
Wildermuth Endowment Strategy Fund Statement of Cash Flows (Unaudited)
|
| | | For the six
months ended
June 30, 2016 | |
Cash flows from operating activities: | | | |
Net increase in net assets resulting from operations | | $ | 926,750 | |
Adjustments to reconcile net increase in net assets resulting from operations to net cash used in operating activities: | | | | |
Purchases of investments | | | (12,186,247 | ) |
Sale of short term investments, net | | | 915,755 | |
Proceeds from sales of investments | | | 4,261,096 | |
Net realized loss from investments | | | 148,622 | |
Net unrealized depreciation on foreign currency translations | | | 622 | |
Net unrealized appreciation on investments | | | (1,005,478 | ) |
Net realized gain from foreign currency translations | | | (483 | ) |
| | | | | |
Changes in assets and liabilities | | | | |
(Increase)/Decrease in assets: | | | | |
Receivable from Investment Adviser | | | (5,884 | ) |
Dividend and interest receivable | | | 106,953 | |
Receivable for fund shares sold | | | (5,250 | ) |
Receivable for securities sold | | | (316,042 | ) |
Receivable from affiliate | | | 2,719 | |
Prepaid expenses and other assets | | | (45,034 | ) |
Increase/(Decrease) in liabilities: | | | | |
Payable for securities purchased | | | 183,532 | |
Payable for shareholder servicing fees | | | 6,424 | |
Payable for professional fees | | | (19,831 | ) |
Payable for fund accounting and administration fees | | | (3,402 | ) |
Payables for transfer agent fees and expenses | | | 2,753 | |
Payable for custody fees | | | (329 | ) |
Payable for distribution fees | | | 748 | |
Accrued expenses and other liabilities | | | (13,836 | ) |
Net cash used in operating activities | | | (7,045,842 | ) |
| | | | | |
Cash flows from financing activities: | | | | |
Proceeds from shares sold | | | 7,554,414 | |
Cost of shares redeemed, net of redemption fees | | | (436,112 | ) |
Cash distributions paid, net of reinvestment | | | (72,395 | ) |
Net cash provided by financing activities | | | 7,045,907 | |
| | | | | |
Net decrease in cash | | | 65 | |
Cash at beginning of period | | | 855 | |
Cash at end of period | | $ | 920 | |
| | | | | |
Supplemental disclosure of non-cash activity: | | | | |
Non-cash financing activities not included herein consist of reinvestment of distributions | | $ | 142,460 | |
See accompanying notes to financial statements.
13
Wildermuth Endowment Strategy Fund Financial Highlights – Class A
|
Per share income and capital changes for a share outstanding throughout each period
| | | For the six
months ended
June 30, 2016
(Unaudited) | | | For the
year ended
December 31,
2015(10) | |
| | | | | | | |
Net asset value, beginning of period | | $ | 10.79 | | | $ | 10.00 | |
| | | | | | | | | |
Income from Investment Operations: | | | | | | | | |
Net investment income(1) | | | 0.04 | | | | 0.05 | |
Net realized and unrealized gain on investments | | | 0.47 | | | | 0.93 | (2) |
Total from investment operations | | | 0.51 | | | | 0.98 | |
Less Distributions: | | | | | | | | |
From net investment income | | | — | | | | (0.03 | ) |
From return of capital | | | (0.12 | )(3) | | | (0.16 | ) |
Total distributions | | | (0.12 | ) | | | (0.19 | ) |
| | | | | | | | | |
Net asset value, end of period | | $ | 11.18 | | | $ | 10.79 | |
| | | | | | | | | |
Total return(4)(5) | | | 4.79 | % | | | 9.74 | % |
| | | | | | | | | |
Ratios and Supplemental Data: | | | | | | | | |
Net assets, end of period (in thousands) | | $ | 21,078 | | | $ | 14,467 | |
Ratio of expenses before waivers to average net assets(6)(7) | | | 4.91 | % | | | 16.65 | % |
Ratio of net expenses to average net assets(6)(7)(8) | | | 2.50 | % | | | 2.50 | % |
Ratio of net investment income to average net assets(6)(7)(9) | | | 0.82 | % | | | 0.49 | % |
Portfolio turnover rate(5) | | | 26 | % | | | 107 | % |
(1) | Per share amounts calcuated using the average shares method, which more appropriately presents the per share data for the period. |
(2) | Realized and unrealized gain per share does not correlate to the aggregate of the net realized and unrealized gains on the Statement of Operations for the period ended December 31, 2015, primarily due to the timing of sales and repurchases of the Fund’s shares in relation to fluctuating market values for the Fund’s portfolio. |
(3) | The amounts and sources of distributions reported in this report reflect the estimates in order to comply with SEC regulations and are not being provided for tax reporting purposes. The actual amounts and sources of the amounts for tax reporting purposes will depend upon the Fund’s investment experience during the remainder of its fiscal year and may be subject to changes based on tax regulations. The Fund will send you a Form 1099-DIV in early 2017 for the 2016 calendar year that will tell you how to report these distributions for federal income tax purposes (e.g., ordinary income, long-term capital gain or return of capital). |
(4) | Total returns would have been lower had certain expenses not been waived or absorbed by the Adviser. Returns shown do not include payment of a maximum sales load of 6.00% of offering price. If the sales charge was included total returns would be lower. |
(7) | The ratios of expenses and net investment income to average net assets do not reflect the Fund’s proportionate share of income and expenses of underlying investment companies in which the Fund invests. |
(8) | Represents the ratio of expenses to average net assets net of fee waivers and/or expense reimbursements by adviser. |
(9) | Recognition of net investment income by the Fund is affected by the timing of the declaration of dividends by the underlying investment companies in which the Fund invests. |
(10) | The Wildermuth Endowment Strategy Fund commenced operations on January 2, 2015 (inception date 12/31/2014). |
See accompanying notes to financial statements.
14
Wildermuth Endowment Strategy Fund Financial Highlights – Class C
|
Per share income and capital changes for a share outstanding throughout the period
| | | For the
period ended
June 30, 2016(1) (Unaudited) | |
| | | | |
Net asset value, beginning of period | | $ | 10.68 | |
| | | | | |
Income from Investment Operations: | | | | |
Net investment income(2) | | | 0.03 | |
Net realized and unrealized gain on investments | | | 0.51 | |
Total from investment operations | | | 0.54 | |
Less Distributions: | | | | |
From return of capital | | | (0.07 | )(3) |
Total distributions | | | (0.07 | ) |
| | | | | |
Net asset value, end of period | | $ | 11.15 | |
| | | | | |
Total return(4)(5) | | | 5.05 | % |
| | | | | |
Ratios and Supplemental Data: | | | | |
Net assets, end of period (in thousands) | | $ | 1,362 | |
Ratio of expenses before waivers to average net assets(6)(7) | | | 5.87 | % |
Ratio of net expenses to average net assets(6)(7)(8) | | | 3.25 | % |
Ratio of net investment income to average net assets(6)(7)(9) | | | 0.93 | % |
Portfolio turnover rate(5) | | | 26 | % |
(1) | Reflects operations for the period from March 14, 2016 (inception date) to June 30, 2016. |
(2) | Per share amounts calcuated using the average shares method, which more appropriately presents the per share data for the period. |
(3) | The amounts and sources of distributions reported in this report reflect the estimates in order to comply with SEC regulations and are not being provided for tax reporting purposes. The actual amounts and sources of the amounts for tax reporting purposes will depend upon the Fund’s investment experience during the remainder of its fiscal year and may be subject to changes based on tax regulations. The Fund will send you a Form 1099-DIV in early 2017 for the 2016 calendar year that will tell you how to report these distributions for federal income tax purposes (e.g., ordinary income, long-term capital gain or return of capital). |
(4) | Total returns would have been lower had certain expenses not been waived or absorbed by the Adviser. Returns shown do not include payment of a Contingent Deferred Sales Charge (“CDSC”) of 1.00% on any shares sold within 365 days of purchase. If the sales charge was included total returns would be lower. |
(7) | The ratios of expenses and net investment income to average net assets do not reflect the Fund’s proportionate share of income and expenses of underlying investment companies in which the Fund invests. |
(8) | Represents the ratio of expenses to average net assets net of fee waivers and/or expense reimbursements by adviser. |
(9) | Recognition of net investment income by the Fund is affected by the timing of the declaration of dividends by the underlying investment companies in which the Fund invests. |
See accompanying notes to financial statements.
15
Wildermuth Endowment Strategy Fund Notes to Financial Statements
June 30, 2016 (Unaudited) |
Wildermuth Endowment Strategy Fund (the “Fund”) is registered under the Investment Company Act of 1940, as amended (the “1940 Act”), as a non-diversified, closed-end management investment company that is operated as an interval fund. The Fund was organized as a Delaware statutory trust on August 28, 2013, and did not have any operations from that date until December 31, 2014, other than those relating to organizational matters and registration of its shares under applicable securities law. The Fund commenced operations on January 2, 2015. The Fund’s investment objective is to seek total return through a combination of long-term capital appreciation and income generation. The Fund will pursue its objective by investing in assets that Wildermuth Advisory, LLC (the “Adviser”) believes provide favorable long-term capital appreciation and risk-adjusted return potential, as well as in income-producing assets that the Adviser believes will provide consistent income generation and liquidity.
The Fund is engaged in a continuous offering, up to a maximum of 25 million shares of beneficial interest, and will operate as an interval fund that will offer to make quarterly repurchases of shares at the Fund’s net asset value (“NAV”). The Fund currently offers two different classes of shares: Class A and Class C shares. In addition, the Fund has registered Class I shares, which are not currently being offered.
2. | SUMMARY OF SIGNIFICANT ACCOUNTING POLICIES |
The following is a summary of significant accounting policies followed by the Fund in the preparation of its financial statements. These policies are in conformity with accounting principles generally accepted in the United States of America (“GAAP”). The preparation of financial statements requires management to make estimates and assumptions that affect the reported amounts of assets and liabilities and disclosure of contingent assets and liabilities at the date of the financial statements and the reported amounts of income and expenses for the period. Actual results could differ from those estimates. The Fund follows the specialized accounting and reporting requirements under GAAP that are applicable to investment companies.
Investment Valuation – Securities listed on an exchange are valued at the last reported sale price at the close of the regular trading session of the exchange on the business day the value is being determined, or in the case of securities listed on NASDAQ at the NASDAQ Official Closing Price (“NOCP”). In the absence of a sale such securities shall be valued at the mean of the closing bid and asked prices for the day of valuation. The Funds may invest in portfolios of open-end or closed-end investment companies (the “open-end funds”). Open-end funds are valued at their respective net asset values as reported by such investment companies. The underlying funds value securities in their portfolios for which market quotations are readily available at their market values (generally the last reported sale price) and all other securities and assets at their fair value by the methods established by the Boards of the open-end funds. The shares of many closed-end investment companies, after their initial public offering, frequently trade at a price per share, which is different than the net asset value per share. The difference represents a market premium or market discount of such shares. There can be no assurances that the market discount or market premium on shares of any closed-end investment company purchased by the Funds will not change.
When price quotations for certain securities are not readily available, or if the available quotations are not believed to be reflective of market value by the Adviser, those securities will be valued at “fair value” as determined in good faith by the Adviser and the fair value team using procedures adopted by and under the supervision of the Fund’s Board of Trustees (the “Board”). There can be no assurance that the Fund could purchase or sell a portfolio security at the price used to calculate the Fund’s NAV.
Investments in Private Funds, Non-Traded REITs (“Non-Traded Funds”) and BDCs will be difficult to value, particularly to the extent that their underlying investments are not publicly traded. In the event a Non-Traded Fund does not report a value to the Fund on a timely basis, the Adviser, acting under the Board’s supervision and pursuant to policies implemented by the Board, will determine the fair value of the Fund’s investment based on the most recent value reported by the Non-Traded Fund, as well as any other relevant information available at the time the Fund values its investments. Following procedures adopted by the Board, in the absence of specific transaction activity in a particular investment fund, the Adviser will consider whether it is appropriate, in light of all relevant circumstances, to value the Fund’s investment at the NAV reported by the Non-Traded Fund at the time of valuation or to adjust the value to reflect a premium or discount.
16
Wildermuth Endowment Strategy Fund Notes to Financial Statements
June 30, 2016 (Unaudited) (Continued) |
There is no single standard for determining fair value of a security. Rather, the Adviser’s fair value calculations will involve significant professional judgment in the application of both observable and unobservable attributes, and as a result, the calculated net asset values of the Non-Traded Funds’ assets may differ from their actual realizable value or future fair value. In determining the fair value of a security for which there are no readily available market quotations, the Adviser, acting under the Board’s supervision and pursuant to policies implemented by the Board, may consider several factors, including, but not limited to: (i) the nature and pricing history (if any) of the security; (ii) whether any dealer quotations for the security are available; (iii) possible valuation methodologies that could be used to determine the fair value of the security; (iv) the recommendation of the portfolio manager of the Fund with respect to the valuation of the security; (v) whether the same or similar securities are held by other accounts managed by the Adviser and the method used to price the security in those accounts; (vi) the extent to which the fair value to be determined for the security will result from the use of data or formula produced by third parties independent of the Adviser; and (vii) the liquidity or illiquidity of the market for the security. As part of its due diligence of Non-Traded Fund investments, the Adviser will attempt to obtain current information on an ongoing basis from market sources, asset managers and/or issuers to value all fair valued securities. However, it is anticipated that portfolio holdings and other value information of the Non-Traded Funds could be available on no more than a quarterly basis. Based on its review of all relevant information, the Adviser may conclude in certain circumstances that the information provided by the asset manager and/or issuer of a Non-Traded Fund does not represent the fair value of the Fund’s investment in such security. Private Funds that invest primarily in publicly traded securities are more easily valued because the values of their underlying investments are based on market quotations.
GAAP defines fair value, establishes a three-tier framework for measuring fair value based on a hierarchy of inputs, and expands disclosure about fair value measurements. It also provides guidance on determining when there has been a significant decrease in the volume and level of activity for an asset or liability, when a transaction is not orderly and how that information must be incorporated into a fair value measurement. The hierarchy distinguishes between market data obtained from independent sources (observable inputs) and the Fund’s own market assumptions (unobservable inputs). These inputs are used in determining the fair value of the Fund’s investments. These inputs are summarized in the three broad levels listed below:
| | ● | Level 1 – quoted prices in active markets for identical securities. An active market for the security is a market in which transactions occur with sufficient frequency and volume to provide pricing information on an ongoing basis. A quoted price in an active market provides the most reliable evidence of fair value. |
| | ● | Level 2 – other significant observable inputs (including quoted prices for similar securities, interest rates, prepayment speeds, credit risk, etc. and quoted prices for identical or similar assets in markets that are not active.) Inputs that are derived principally from or corroborated by observable market data. An adjustment to any observable input that is significant to the fair value may render the measurement a Level 3 measurement. |
| | ● | Level 3 – significant unobservable inputs, including the Fund’s own assumptions in determining the fair value of investments. |
The availability of observable inputs can vary from security to security and is affected by a wide variety of factors, including, for example, the type of security, whether the security is new and not yet established in the marketplace, the liquidity of markets, and other characteristics particular to the security. To the extent that valuation is based on models or inputs that are less observable or unobservable in the market, the determination of fair value requires more judgment. Accordingly, the degree of judgment exercised in determining fair value is greatest for instruments categorized in Level 3.
The inputs used to measure fair value may fall into different levels of the fair value hierarchy. In such cases, for disclosure purposes, the level in the fair value hierarchy within which the fair value measurement falls in its entirety is determined based on the lowest level input that is significant to the fair value measurement in its entirety.
In May 2015, the Financial Accounting Standards Board (the “FASB”) issued Accounting Standard Update (“ASU”) 2015-07, Disclosures for Investments in Certain Entities That Calculate Net Asset Value per Unit (or Its Equivalent), modifying ASC 820. ASU 2015-07 became effective for interim and annual reporting periods beginning after December 15, 2015. Under the modifications, certain investments valued at net asset value are no longer included in the fair value hierarchy. The value of these investments is $1,466,136 and are excluded from the fair value hierarchy as of June 30, 2016.
17
Wildermuth Endowment Strategy Fund Notes to Financial Statements
June 30, 2016 (Unaudited) (Continued) |
The inputs or methodology used for valuing securities are not necessarily an indication of the risk associated with investing in those securities. The following is a summary of the valuation inputs, representing 100% of the Fund’s investments, used to value the Fund’s assets and liabilities as of June 30, 2016:
| | | | | | Fair Value Measurements at the
End of the Reporting Period Using | | | | |
Investment in Securities | | Practical
Expedient** | | | Level 1
Quoted Prices | | | Level 2
Other Significant Observable Inputs | | | Level 3
Significant Unobservable Inputs | | | Total | |
Security Type | | | | | | | | | | | | | | | |
Common Stock* | | $ | — | | | $ | 5,983,200 | | | $ | — | | | $ | — | | | $ | 5,983,200 | |
Exchange Traded Funds* | | | — | | | | 5,978,958 | | | | — | | | | — | | | | 5,978,958 | |
Exchange Traded Notes | | | — | | | | 553,890 | | | | — | | | | — | | | | 553,890 | |
Hedge Funds | | | 924,249 | (1)(3)(4) | | | — | | | | — | | | | 503,077 | | | | 1,427,326 | |
Private Equity | | | — | | | | — | | | | — | | | | 2,766,518 | | | | 2,766,518 | |
Public Non-Traded Business Development Companies | | | 541,887 | (2)(3)(4) | | | — | | | | — | | | | 557,796 | | | | 1,099,683 | |
Private Real Estate Investments | | | — | | | | — | | | | — | | | | 2,199,171 | | | | 2,199,171 | |
Public Real Estate Investments* | | | — | | | | 61,887 | | | | — | | | | 1,804,849 | | | | 1,866,736 | |
Short Term Investments | | | — | | | | 594,007 | | | | — | | | | | | | | 594,007 | |
Total | | $ | 1,466,136 | | | $ | 13,171,942 | | | $ | — | | | $ | 7,831,411 | | | $ | 22,469,489 | |
* | All sub-categories within the security type represent their respective evaluation status. For a detailed breakout by industry, please refer to the Schedule of Investments. |
** | Certain investments that are measured at fair value using the net asset value per share (or its equivalent) practical expedient have not been categorized in the fair value hierarchy. The fair value amounts presented in the this table are intended to permit reconciliation of the fair value hierarchy to the amounts presented in the schedule of investments. |
(1) | Security | Withdrawals Permitted | Redemption Notice Period | Investment Objective | Investment Strategy | Lock Up Period |
| | PHI Single Index Option Fund, LP | Monthly | 90 days | LT Capital Appreciation | Sell options on market indexes with a downward bias hedge | None |
| | Semper Midas Fund, LP | Monthly | 90 days | LT Capital Appreciation | Mortgage Backed Securities investing | None |
(2) | Security | Withdrawals Permitted | Redemption Notice Period | Investment Objective | Investment Strategy | Lock Up Period |
| | CION Investment Corp. | Quarterly | 45 days | Current Income | Middle market private business loans | None |
| | Corporate Capital Trust, Inc. | Quarterly | 45 days | Current Income | Middle market private business loans | None |
| | HMS Income Fund, Inc. | Quarterly | 45 days | Current Income | Middle market private business loans | None |
(3) | Redemption frequency and redemption notice period reflect general redemption terms, and exclude liquidity restrictions. Different tranches may have different liquidity terms and may be subject to investor level gates. |
(4) | These investments are domiciled in the United States. |
For the period ended June 30, 2016, there were no transfers in and out of Level 1, Level 2 and Level 3. It is the Fund’s policy to recognize transfers into and out of all Levels at the end of the reporting period.
18
Wildermuth Endowment Strategy Fund Notes to Financial Statements
June 30, 2016 (Unaudited) (Continued) |
The following is a roll forward of the activity in investments in which significant unobservable inputs (Level 3) were used in determining fair value on a recurring basis:
| | Beginning balance January 1, 2016 | | | Transfers into
Level 3 during the period | | | Transfers out of
Level 3 during the period | | | Purchases | | | (Sales) | | | Net realized gain | | | Prior Year Tax Adjustment | | | Change in net unrealized gain | | | Ending balance
June 30, 2016 | |
Wildermuth Endowment Strategy Fund | | | | | | | | | | | | | | | | | | | | | | | | | | | |
Hedge Funds | | $ | — | | | $ | — | | | $ | — | | | $ | 500,000 | | | $ | — | | | $ | — | | | $ | — | | | $ | 3,077 | | | $ | 503,077 | |
Private Equity | | | 500,000 | | | | — | | | | — | | | | 2,000,000 | | | | — | | | | — | | | | — | | | | 266,518 | | | | 2,766,518 | |
Public Non-Traded Business Development Companies | | | — | | | | — | | | | — | | | | 520,000 | | | | — | | | | — | | | | — | | | | 37,796 | | | | 557,796 | |
Private Real Estate Investments | | | 580,712 | | | | — | | | | — | | | | 1,524,494 | | | | — | | | | — | | | | — | | | | 93,965 | | | | 2,199,171 | |
Public Real Estate Investments | | | 1,609,645 | | | | — | | | | — | | | | 219,149 | | | | (8,150 | ) | | | 2,181 | | | | — | | | | (17,976 | ) | | | 1,804,849 | |
| | | $ | 2,690,357 | | | $ | — | | | $ | — | | | $ | 4,763,643 | | | $ | (8,150 | ) | | $ | 2,181 | | | $ | — | | | $ | 383,380 | | | $ | 7,831,411 | |
The change in net unrealized gain included in the Statement of Operations attributable to Level 3 investments as of June 30, 2016 is $383,380.
The following is a summary of quantitative information about significant unobservable valuation inputs for Level 3 Fair Value Measurements for investments held as of June 30, 2016:
Type of Level 3 Investment | | Fair Value as of
June 30, 2016 | | Valuation Technique | Unobservable Inputs |
Hedge Funds | | $ | 503,077 | | Monthly NAV | Not Applicable* |
Private Equity | | $ | 2,766,518 | | Private Transaction Cost | Not Applicable* |
Public Non- Traded Business
Development Companies | | $ | 557,796 | | Current Value Method** | Not Applicable* |
Private Real Estate Investments | | $ | 2,199,171 | | Private Transaction Cost | Not Applicable* |
Public Real Estate Investments | | $ | 1,804,849 | | Current Value Method** | Not Applicable* |
* | Financial information is not prepared in accordance with GAAP or ASC Topic 946 |
** | The Current Value Method, also referred to as the “Waterfall Method,” is based on allocating the Enterprise Value (individual assets net of liabilities) across the various classes of securities, in conformance with liquidation preferences and conversion values. |
Security Transactions and Related Income – Security transactions are accounted for on trade date basis. Interest income is recognized on an accrual basis. Discounts are accreted and premiums are amortized on securities purchased over the lives of the respective securities. Dividend income is recorded on the ex-dividend date. Realized gains or losses from sales of securities are determined by comparing the identified cost of the security lot sold with the net sales proceeds.
Dividends and Distributions to Shareholders – Dividends from gross investment income are declared and distributed quarterly. Distributable net realized capital gains are declared and distributed annually. Dividends from gross investment income and distributions from net realized gains are recorded on ex- dividend date and determined in accordance with federal income tax regulations, which may
19
Wildermuth Endowment Strategy Fund Notes to Financial Statements
June 30, 2016 (Unaudited) (Continued) |
differ from GAAP. These “book/tax” differences are considered either temporary (i.e., deferred losses, capital loss carry forwards) or permanent in nature. To the extent these differences are permanent in nature, such amounts are reclassified within the composition of net assets based on their federal tax-basis treatment; temporary differences do not require reclassification.
Distributions received from investments in securities that represent a return of capital or capital gains are recorded as a reduction of cost of investment or as a realized gain, respectively. The calendar year-end amounts of ordinary income, capital gains, and return of capital included in distributions received from the Fund’s investments in real estate investment trusts (“REITs”) are reported to the Fund after the end of the calendar year; accordingly, the Fund estimates these amounts for accounting purposes until the characterization of REIT distributions is reported to the Fund after the end of the calendar year. Estimates are based on the most recent REIT distribution information available.
Investment Companies – The Fund may obtain investment exposure to various asset classes by investing in other investment companies, including registered investment companies, such as ETFs, mutual funds and closed-end funds, as well as hedge funds, private equity funds or other privately offered pooled investment vehicles that are not registered under the 1940 Act (collectively “Investment Funds”). Each Investment Fund is subject to specific risks, depending on the nature of the fund. These risks could include liquidity risk, sector risk, and foreign currency risk, as well as risks associated with fixed income securities and commodities among others. Also, the Fund’s performance depends in part upon the performance of the Investment Fund managers and selected strategies, the adherence by such Investment Fund managers to such selected strategies, the instruments used by such Investment Fund managers and the Adviser’s ability to select Investment Funds and strategies and effectively allocate Fund assets among them. By investing in Investment Funds indirectly through the Fund, the investor bears asset-based fees at the Fund level, in addition to any asset-based fees and/or performance-based fees and allocations at the Investment Fund level. Moreover, an investor in the Fund bears a proportionate share of the fees and expenses of the Fund (including organizational and offering expenses, operating costs, sales charges, brokerage transaction expenses, and administrative fees) and, indirectly, similar expenses of the Investment Funds. Thus, an investor in the Fund may be subject to higher fees and operating expenses than if he or she invested in an Investment Fund directly.
Federal Income Taxes – It is the Fund’s policy to qualify as a regulated investment company by complying with the provisions of the Internal Revenue Code that are applicable to regulated investment companies and to distribute substantially all of its taxable income and net realized gains to shareholders. Therefore, no federal income tax provision has been recorded.
The Fund recognizes the tax benefits of uncertain tax positions only where the position is “more likely than not” to be sustained assuming examination by tax authorities. Management has analyzed the Fund’s tax positions, and has concluded that no liability for unrecognized tax benefits should be recorded related to uncertain tax positions expected to be taken on returns to be filed for open tax year 2016. The Fund identifies its major tax jurisdictions as U.S. federal, and foreign jurisdictions where the Fund makes significant investments; however, the Fund is not aware of any tax positions for which it is reasonably possible that the total amounts of unrecognized tax benefits will change materially in the next twelve months.
Redemption Fee – For shares held for 90 days or less, the Fund will deduct a 2% redemption fee from the redemption amount if the shares are sold pursuant to the Fund’s quarterly repurchase program. Shares held longest will be treated as being repurchased first and shares held shortest as being repurchased last. The redemption fee does not apply to shares that were acquired through reinvestment of distributions. Shares held for more than 90 days are not subject to the 2% fee. Redemption fees are paid to the Fund directly and are designed to offset costs associated with fluctuations in Fund asset levels and cash flow caused by short-term shareholder trading. For the period ended June 30, 2016, the Fund had contributions to capital due to redemption fees in the amount of $9.00.
Indemnification – The Fund indemnifies its officers and trustees for certain liabilities that may arise from the performance of their duties to the Fund. Additionally, in the normal course of business, the Fund enters into contracts that contain a variety of representations and warranties and which provide general indemnities. The Fund’s maximum exposure under these arrangements is unknown, as this would involve future claims that may be made against the Fund that have not yet occurred. However, based on industry experience, the risk of loss due to these warranties and indemnities appears to be remote.
Foreign Currency Translation – The accounting records of the Fund are maintained in U.S. dollars. All assets and liabilities denominated in foreign currencies are translated into U.S. dollars based on the rate of exchange of such currencies against U.S. dollars on the date of valuation. Purchases and sales of securities, income, and expenses are translated at the rate of exchange quoted on the respective date
20
Wildermuth Endowment Strategy Fund Notes to Financial Statements
June 30, 2016 (Unaudited) (Continued) |
that such transactions are recorded. The Fund does not isolate that portion of the results of operations resulting from changes in foreign exchange rates on investments from the fluctuations arising from changes in market prices of securities held. Such fluctuations are included with the net realized and unrealized gain or loss from investments.
Reported net realized foreign exchange gains or losses arise from sales of portfolio securities, sales and maturities of short-term securities, sales of foreign currencies, currency gains or losses realized between the trade and settlement dates on securities transactions, and the difference between the amounts of dividends, interest, and foreign withholding taxes recorded on the Fund’s books and the U.S. dollar equivalent of the amounts actually received or paid. Net unrealized foreign exchange gains and losses arise from changes in the value of assets and liabilities other than investments in securities at each reporting period, resulting from changes in the exchange rate.
3. | INVESTMENT TRANSACTIONS |
The cost of purchases and proceeds from the sale of securities, other than short-term investments, for the period ended June 30, 2016, amounted to $12,186,247 and $4,261,096, respectively.
4. | ADVISORY FEE AND OTHER SERVICE PROVIDER TRANSACTIONS |
Advisory Fees – The Adviser is entitled to receive a monthly fee equal to the annual rate of 1.50% of the Fund’s average daily net assets. For the period ended June 30, 2016, the Adviser earned $127,686 in advisory fees.
The Adviser and the Fund have entered into an expense limitation and reimbursement agreement (the “Expense Limitation Agreement”) under which the Adviser has agreed contractually to waive its fees and to pay or absorb the direct, ordinary operating expenses of the Fund (including offering and organizational expenses but excluding front-end or contingent deferred loads, brokerage fees and commissions, acquired fund fees and expenses, borrowing costs (such as interest and dividend expenses on securities sold short), taxes and extraordinary expenses such as litigation)), to the extent that they exceed 2.50% and 3.25% per annum of the Fund’s average daily net assets attributable to Class A and Class C shares (the “Expense Limitation”), respectively, through March 31, 2017. In consideration of the Adviser’s agreement to limit the Fund’s expenses, the Fund has agreed to repay the Adviser in the amount of any fees waived and Fund expenses paid or absorbed. Any waiver or reimbursement of fees by the Adviser is subject to repayment by the Fund within three years following such waiver or reimbursement; provided, however, that (i) the Fund is able to make such repayment without exceeding the expense limitation in place at the time the fees being repaid were waived or the Fund’s current expense limitation, whichever is lower, and (ii) such repayment is approved by the Fund’s Board of Trustees. The Expense Limitation Agreement will remain in effect for successive twelve-month periods provided that such continuance is specifically approved at least annually by the Board of Trustees. The Expense Limitation Agreement may be terminated only by the Fund’s Board on 60 days’ written notice to the Adviser. During the period ended June 30, 2016, the Adviser did not recoup any expenses. At June 30, 2016, $73,173 is subject to recoupment through December 31, 2017, $703,853 through December 31, 2018 and an additional $205,884 through June 30, 2019, to the extent the Expense Limitation Agreement is still in effect.
On December 31, 2015, Realty Capital Securities, LLC (“RCS”) ceased its securities–related operations and filed a notice of inactivity with the Financial Industry Regulatory Authority, Inc. As a result, RCS ceased acting as the Fund’s principal underwriter and distributor. The Fund has adopted a Distribution Agreement (the “Agreement”) with SQN Securities, LLC (the “Distributor”) to act as the Fund’s principal underwriter and distributor. The Agreement provides that a monthly distribution fee is calculated at an annual rate equal to 0.75% of the Fund’s average daily net assets attributable to Class C. Class A shares are not currently subject to a distribution fee. For the period ended June 30, 2016, $1,324 had been accrued for Class C distribution fees.
Pursuant to a separate Shareholder Services Plan and Agreement (the “Plan) with Hemlock Fund Services, LLC (the “Servicer), an affiliate of the Distributor, the Fund will pay a shareholder servicing fee to the Servicer in connection with servicing shares of the Fund. The Plan provides that a monthly service fee is calculated at an annual rate equal 0.25% of average daily net assets separately attributable to Class A and Class C. For the period ended June 30, 2016, Class A had accrued $20,836 in shareholder service fees and Class C had accrued $441.
Trustees – Each Independent Trustee will receive a retainer of $5,000 per year, plus $2,500 for each board or board committee meeting the trustee attends in person ($3,000 for attendance by the chairperson of the audit committee at each meeting of the audit committee), $500 for each meeting the trustee attends telephonically. If there is a meeting of the Board and one or more committees in a single day,
21
Wildermuth Endowment Strategy Fund Notes to Financial Statements
June 30, 2016 (Unaudited) (Continued) |
the fees will be limited to $3,000 per day ($3,500 for the chairperson of the audit committee if there is a meeting of such committee) for an in person meeting and $750 ($1,000 for the chairperson of the audit committee if there is a meeting of such committee) for meetings attended telephonically. No “interested persons” who serve as Trustees of the Fund will receive any compensation for their services as Trustees. None of the executive officers receive compensation from the Fund.
Pursuant to an agreement with Vigilant Compliance, LLC (“Vigilant”), an employee of Vigilant serves as the Chief Compliance Officer and Chief Financial Officer of the Fund. For the provision of these services, Vigilant receives compensation for these services. For the period ended June 30, 2016, the amounts accrued for payment to Vigilant for these services were $18,427 for Chief Compliance Officer and $19,619 for Chief Financial Officer. These amounts are shown in the Statement of Operations under “Chief compliance officer fees” and “Chief financial officer fees”.
Pursuant to a separate, previous servicing agreement with RCS Advisory Services, LLC (“RCSAS”), previously the Administrator of the Fund and an affiliate of RCS, the Fund paid RCSAS customary fees for providing administration and fund accounting services to the Fund. RCSAS had entered into a contract with Gemini Fund Services (“GFS”) pursuant to which GFS served as sub-administrator and provided sub-fund accounting services for the Trust from January 1, 2016 through March 14, 2016. During that period, $13,244 had been accrued for services provided. Effective March 14, 2016 UMB Fund Services, Inc. (“UMBFS”) replaced GFS as the Fund’s administrator and fund accounting service provider.
Pursuant to a separate, previous servicing agreement with American National Stock Transfer, LLC (“ANST”), ANST had served as the Transfer Agent for the Fund for the period January 1, 2016 through March 14, 2016 and was an affiliate of the RCS and GFS. ANST had entered into an agreement with GFS to serve as sub-transfer agent to the Fund. For the period January 1, 2016 through March 14, 2016, $17,346 was accrued for payment to ANST for services provided. Effective March 14, 2016, UMBFS replaced ANST as the Fund’s transfer agent.
5. | DISTRIBUTIONS TO SHAREHOLDERS AND TAX COMPONENTS OF CAPITAL |
At December 31, 2015, gross unrealized appreciation/depreciation of investments based on cost for federal income tax purposes were as follows:
Cost of investments | | $ | 14,509,784 | |
Gross unrealized appreciation | | $ | 618,801 | |
Gross unrealized depreciation | | | (625,525 | ) |
Net unrealized depreciation on investments | | $ | (6,724 | ) |
The difference between cost amounts for financial statement and federal income tax purposes is due primarily to timing difference in recognizing certain gains and losses in security transactions.
The tax character of Fund distributions for the period ended December 31, 2015 was as follows:
| | Fiscal Period Ended December 31, 2015 | |
Ordinary Income | | $ | 10,989 | |
Return of Capital | | | 135,124 | |
| | $ | 146,113 | |
As of December 31, 2015, the components of accumulated earnings/(deficit) on a tax basis were as follows:
22
Wildermuth Endowment Strategy Fund Notes to Financial Statements
June 30, 2016 (Unaudited) (Continued) |
Undistributed
Ordinary
Income | | | Undistributed
Long-Term
Gains | | | Post October
Loss and Late
Year Loss | | | Capital Loss Carry
Forwards | | | Other
Book/Tax
Differences | | | Unrealized
Appreciation/
(Depreciation) | | | Total
Accumulated Earnings/(Deficits) | |
$ | — | | | $ | — | | | $ | — | | | $ | (107,827 | ) | | $ | — | | | $ | (6,724 | ) | | $ | (114,551 | ) |
The difference between book basis and tax basis undistributed net investment income and unrealized appreciation (depreciation) is primarily attributable to the tax deferral of losses on wash sales and adjustments for partnerships and return of capital distributions from C-Corporations.
At December 31, 2015, the Fund had capital loss carry forwards for federal income tax purposes available to offset future capital gains, if any as follows:
Non-Expiring
Short-Term | | | Non-Expiring
Long-Term | | | Total | |
$ | 107,827 | | | $ | — | | | $ | 107,827 | |
Pursuant to Rule 23c 3 under the Investment Company Act of 1940, as amended, the Fund offers shareholders on a quarterly basis the option of redeeming shares, at net asset value, of no less than 5% and no more than 25% of the shares outstanding. There is no guarantee that shareholders will be able to sell all of the shares they desire in a quarterly repurchase offer, although each shareholder will have the right to require the Fund to purchase up to and including 5% of such shareholder’s shares in each quarterly repurchase. Limited liquidity will be provided to shareholders only through the Fund’s quarterly repurchases.
During the period ended June 30, 2016, the Fund completed two quarterly repurchase offers. In those offers, the Fund offered to repurchase up to 5% of the number of its outstanding shares as of the Repurchase Pricing Dates. The results of those repurchase offers were as follows:
Repurchase Pricing Date | | February 1, 2016 | | | May 2, 2016 | |
Number of Shares Tendered - Class A | | | 8,562 | | | | 31,158 | |
Number of Shares Tendered - Class C | | Not Applicable | | | | — | |
% of Shares Offered - Total Fund | | | 5.00 | % | | | 5.00 | % |
% of Shares Tendered - Total Fund | | | 0.64 | % | | | 1.76 | % |
7. | INVESTMENT IN RESTRICTED SECURITIES |
Restricted securities include securities that have not been registered under the Securities Act of 1933, as amended, and securities that are subject to restrictions on resale. The Fund may invest in restricted securities that are consistent with the Fund’s investment objectives and investment strategies. Investments in restricted securities are valued at fair value as determined in good faith in accordance with procedures adopted by the Board of Trustees. It is possible that the estimated value may differ significantly from the amount that might ultimately be realized in the near term, and the difference could be material.
23
Wildermuth Endowment Strategy Fund Notes to Financial Statements
June 30, 2016 (Unaudited) (Continued) |
Additional information on each illiquid restricted security held by the Fund at June 30, 2016 is as follows:
Security | Initial
Acquisition Date | | Shares | | | Cost | | | Value | | | % of
Net Assets | |
ARC Property Trust, Inc. | June 30, 2016 | | | 40,625 | | | $ | 499,964 | | | $ | 546,406 | | | | 2.44 | % |
Behringer Harvard Opportunity | February 17, 2015 | | | 111,521 | | | | 237,920 | | | | 399,245 | | | | 1.78 | % |
CION Investment Corp. | November 16, 2015 | | | 23,217 | | | | 210,000 | | | | 203,151 | | | | 0.90 | % |
Clear Guide Medical, Inc. | April 19, 2016 | | | 1,500 | | | | 1,500,000 | | | | 1,765,823 | | | | 7.87 | % |
CNL Lifestyle Properties | February 2, 2015 | | | 107,025 | | | | 356,148 | | | | 326,427 | | | | 1.45 | % |
Corporate Capital Trust, Inc. | October 30, 2015 | | | 22,462 | | | | 210,026 | | | | 193,619 | | | | 0.86 | % |
Cottonwood Residential, Inc. | February 17, 2015 | | | 61,140 | | | | 905,370 | | | | 1,002,085 | | | | 4.47 | % |
Direct Lending Income Fund LP | April 29, 2016 | | | 500,000 | | | | 500,000 | | | | 503,077 | | | | 2.24 | % |
Dividend Capital Diversified | June 2, 2015 | | | 18,060 | | | | 110,503 | | | | 133,106 | | | | 0.59 | % |
FS Energy & Power Fund | April 19, 2016 | | | 78,452 | | | | 520,000 | | | | 557,796 | | | | 2.49 | % |
GPB Automotive Portfolio LP | March 13, 2015 | | | 10 | | | | 500,000 | | | | 500,695 | | | | 2.23 | % |
Highland REIT, Inc. | April 28, 2016 | | | 136,771 | | | | 34,827 | | | | 49,238 | | | | 0.22 | % |
HMS Income Fund, Inc. | November 11, 2015 | | | 18,605 | | | | 159,994 | | | | 145,117 | | | | 0.65 | % |
Inventrust Properties Corp. | March 2, 2015 | | | 153,283 | | | | 381,115 | | | | 481,309 | | | | 2.14 | % |
KBS REIT II, Inc. | March 12, 2015 | | | 97,153 | | | | 283,674 | | | | 382,784 | | | | 1.71 | % |
PCG Select Series I LLC -
Series A Preferred Stock | June 23, 2016 | | | 600 | | | | 600,000 | | | | 600,000 | | | | 2.67 | % |
PHI Single Index Option Fund LP | December 23, 2015 | | | 450,000 | | | | 450,000 | | | | 464,109 | | | | 2.07 | % |
Phillips Edison Grocery Center | February 3, 2016 | | | 2,000 | | | | 17,920 | | | | 20,400 | | | | 0.09 | % |
Semper Midas Fund LP | August 1, 2015 | | | 475,000 | | | | 475,000 | | | | 460,140 | | | | 2.05 | % |
Shopoff Land Fund III LP | April 29, 2015 | | | 56 | | | | 50,680 | | | | 50,680 | | | | 0.23 | % |
Tout, Inc. - Series C
Preferred Stock | June 2, 2016 | | | 153,276 | | | | 500,000 | | | | 500,000 | | | | 2.23 | % |
Uniprop Manufactured Housing Communities Income Fund II | August 31, 2015 | | | 1,000 | | | | 8,275 | | | | 12,340 | | | | 0.05 | % |
| | | | | | | | $ | 8,511,416 | | | $ | 9,297,547 | | | | | |
8. | OFFERING PRICE PER SHARE |
Class A shares are offered subject to a maximum sales charge of 6.00% of the offering price, while Class C shares are not subject to sales loads but are subject to a 1% contingent deferred sales charges on shares redeemed during the first 365 days after purchase. For the period ended June 30, 2016, the various broker dealers received $110,191 in underwriting commissions for sales of shares, of which $49,163 was retained by the principal underwriter or other affiliated broker-dealers. For the period ended June 30, 2016, there were not contingent deferred sales charges applied to Class C shareholders.
24
Wildermuth Endowment Strategy Fund Notes to Financial Statements
June 30, 2016 (Unaudited) (Continued) |
Subsequent events after the balance sheet date have been evaluated through the date the financial statements were issued.
The Fund completed a quarterly repurchase offer on August 1, 2016. 5,151 Class A shares and zero Class C shares were tendered, constituting 0.23% of the outstanding shares of the fund on the Repurchase Pricing Date.
At the quarterly meeting of the Trustees held on August 10, 2016, the Board of Trustees of the Fund accepted the resignations of John H. Grady and Nataly Zelensky as Executive Vice Presidents of the Fund.
Management has concluded that there is no impact requiring adjustment or disclosure in the financial statements.
25
Wildermuth Endowment Strategy Fund Additional Information
June 30, 2016 (Unaudited) |
Proxy Voting Policy — Information regarding how the Fund votes proxies relating to portfolio securities for the most recent period ended June 30, as well as a description of the policies and procedures that the Fund used to determine how to vote proxies is available without charge, upon request, by calling 1-888-889-8981 or by referring to the Securities and Exchange Commission’s (“SEC”) website at http://www.sec.gov. A description of the policies and procedures is also included in the Fund’s Statement of Additional Information, which is available on the SEC’s website at http://www.sec.gov.
Portfolio Holdings — The Fund files its complete schedule of portfolio holdings with the SEC for the first and third quarters of each fiscal year on Form N-Q. Form N-Q is available on the SEC’s website at http://www.sec.gov and may be reviewed and copied at the SEC’s Public Reference Room in Washington, DC (1-800-SEC-0330). The information on Form N-Q is available without charge, upon request, by calling 1-888-889-8981.
26
THIS PAGE INTENTIONALLY LEFT BLANK
THIS PAGE INTENTIONALLY LEFT BLANK
THIS PAGE INTENTIONALLY LEFT BLANK
Investment Adviser
Wildermuth Advisory, LLC
11525 Park Woods Circle, Ste. 200
Alpharetta, Georgia 30005
Distributor
SQN Securities, LLC
100 Wall Street, 28th Floor
New York, New York 10005
This report and the financial statements contained herein are submitted for the general information of shareholders and are not authorized for distribution to prospective investors unless preceded or accompanied by an effective prospectus. Nothing herein contained is to be considered an offer of sale or solicitation of an offer to buy shares of the Wildermuth Endowment Strategy Fund. Such offering is made only by prospectus, which includes details as to offering price and other material information.
Distributed by SQN Securities, LLC
Member FINRA
Item 2. Code of Ethics.
Not applicable to semi-annual reports.
Item 3. Audit Committee Financial Expert.
Not applicable to semi-annual reports.
Item 4. Principal Accountant Fees and Services.
Not applicable to semi-annual reports.
Item 5. Audit Committee of Listed Registrants.
Not applicable.
Item 6. Schedule of Investments.
Included as part of the report to shareholders filed under Item 1 of this Form N-CSR.
Item 7. Disclosure of Proxy Voting Policies and Procedures for Closed-End Management Investment Companies.
Not applicable to semi-annual reports.
Item 8. Portfolio Managers of Closed-End Management Investment Companies.
Not applicable to semi-annual reports.
Item 9. Purchases of Equity Securities by Closed-End Management Investment Company and Affiliated Purchasers.
| Period | | (a) Total Number of Shares (or Units) Purchased | | | (b) Average Price Paid per Share (of Unit) | | | (c) Total Number of Shares (or Units) Purchased as Part of Publicly Announced Plans or Programs | | | (d) Maximum Number (or Approximate Dollar Value) of Shares (or Units) that May Yet Be Purchased Under the Plans or Programs | |
| Jan. 1-31, 2016 | | | 0 | | | | 0 | | | | 0 | | | | 0 | |
| Feb. 1-29, 2016 | | | 8,562 | | | $ | 10.36 | | | | 0 | | | | 0 | |
| Mar. 1-31, 2016 | | | 0 | | | | 0 | | | | 0 | | | | 0 | |
| Apr. 1-28, 2016 | | | 0 | | | | 0 | | | | 0 | | | | 0 | |
| May. 1-31, 2016 | | | 31,158 | | | $ | 11.15 | | | | 0 | | | | 0 | |
| Jun. 1-30, 2016 | | | 0 | | | | 0 | | | | 0 | | | | 0 | |
| Jul. 1-31, 2016 | | | 0 | | | | 0 | | | | 0 | | | | 0 | |
| Aug. 1-31, 2016 | | | 0 | | | | 0 | | | | 0 | | | | 0 | |
| Sep. 1-30, 2016 | | | 0 | | | | 0 | | | | 0 | | | | 0 | |
| Oct. 1-31, 2016 | | | 0 | | | | 0 | | | | 0 | | | | 0 | |
| Nov. 1-30, 2016 | | | 0 | | | | 0 | | | | 0 | | | | 0 | |
| Dec. 1-31, 2016 | | | 0 | | | | 0 | | | | 0 | | | | 0 | |
| Total | | | 39,720 | | | $ | 10.98 | | | | 0 | | | | 0 | |
| * | On December 29, 2015 and March 30, 2016, the Registrant offered to repurchase up to 5% of the Registrant’s total outstanding shares, or 67,010 and 88,582 shares, respectively, pursuant to its periodic repurchase plan. |
| ** | Class C, with an inception date of March 14, 2016, only participated in the March 30, 2016 offer. No shares were repurchased during the offer period. |
Item 10. Submission of Matters to a Vote of Security Holders.
Not applicable.
Item 11. Controls and Procedures.
| (a) | The Registrant’s principal executive officer and principal financial officer have reviewed the Registrant's disclosure controls and procedures (as defined in Rule 30a-3(c) under the Investment Company Act of 1940, as amended, (the “Act”)) as of a date within 90 days of the filing of this report, as required by Rule 30a-3(b) under the Act. Based on their review, such officers have concluded that the disclosure controls and procedures were effective in ensuring that information required to be disclosed in this report was appropriately recorded, processed, summarized and reported and made known to them by others within the Registrant and by the Registrant’s service providers. |
| (b) | There were no changes in the Registrant’s internal control over financial reporting (as defined in Rule 30a-3(d) under the Act (17 CFR 270.30a-3(d)) that occurred during the Registrant’s second fiscal quarter of the period covered by this report that materially affected, or were reasonably likely to materially affect, the Registrant’s internal control over financial reporting. |
Item 12. Exhibits.
| (a) (1) | Not applicable to semi-annual reports. |
| (a) (2) | Certifications required pursuant to Section 302 of the Sarbanes-Oxley Act of 2002. Filed herewith. |
| (b) | Certification pursuant to Section 906 of the Sarbanes-Oxley Act of 2002. Filed herewith. |
SIGNATURES
Pursuant to the requirements of the Securities Exchange Act of 1934 and the Investment Company Act of 1940, the Registrant has duly caused this report to be signed on its behalf by the undersigned, thereunto duly authorized.
Wildermuth Endowment Strategy Fund
| /s/ Daniel Wildermuth | |
| By: Daniel Wildermuth | |
| Trustee, Chairman of the Board, President and Chief Executive Officer | |
| September 2, 2016 | |
Pursuant to the requirements of the Securities Exchange Act of 1934 and the Investment Company Act of 1940, this report has been signed below by the following persons on behalf of the Registrant and in the capacities and on the dates indicated.
| /s/ Daniel Wildermuth | |
| By: Daniel Wildermuth | |
| Trustee, Chairman of the Board, President and Chief Executive Officer | |
| (Principal Executive Officer) | |
| September 2, 2016 | |
| /s/ Gerard Scarpati | |
| By: Gerard Scarpati | |
| Treasurer and Chief Financial Officer | |
| (Principal Financial Officer) | |
| September 2, 2016 | |