UNITED STATES
SECURITIES AND EXCHANGE COMMISSION
Washington, D.C. 20549
FORM N-CSR
CERTIFIED SHAREHOLDER REPORT OF REGISTERED MANAGEMENT
INVESTMENT COMPANIES
Investment Company Act File Number 811-22888
Wildermuth Endowment Strategy Fund
(Exact name of registrant as specified in charter)
11525 Park Woods Circle, Ste. 200
Alpharetta, GA 30005
(Address of principal executive offices) (Zip code)
Daniel Wildermuth
Wildermuth Advisory, LLC
11525 Park Woods Circle, Ste. 200
Alpharetta, GA 30005
(Name and address of agent for service)
COPIES TO:
John H. Grady
DLA Piper, LLP
1650 Market Street, Suite 4900
Philadelphia, PA 19103
(215) 656-3365
Registrant's telephone number, including area code: (888) 889-8981
Date of fiscal year end: December 31
Date of reporting period: June 30, 2017
Item 1. Reports to Stockholders.
SEMI-ANNUAL REPORT
JUNE 30, 2017
WWW.WILDERMUTHENDOWMENTFUND.COM ● 1-888-889-8981 ●
DISTRIBUTED BY UMB DISTRIBRUTION SERVICES, LLC (MEMBER FINRA)
Wildermuth Endowment Strategy Fund
| Table of Contents | |
| | |
| Letter to Shareholders | 2 |
| Portfolio Review | 4 |
| Schedule of Investments | 6 |
| Statement of Assets and Liabilities | 14 |
| Statement of Operations | 15 |
| Statements of Changes in Net Assets | 16 |
| Statement of Cash Flows | 17 |
| Financial Highlights | 18 |
| Notes to Financial Statements | 21 |
| Additional Information | 32 |
Wildermuth Endowment Strategy Fund
Letter to Shareholders
June 30, 2017
Dear Investor:
We are pleased to present this annual report for the Wildermuth Endowment Strategy Fund (the “Fund”) covering the 6-month period from January 1, 2017 to June 30, 2017.
During this period, the Fund generated a total return of 5.65% versus 9.34% for the S&P 500® Total Return Index and 2.27% for the Barclays U.S. Aggregate Bond Index. We are pleased that we continue to deliver strong performance with monthly volatility that consistently remains well below that of a 60 percent stock and 40 percent bond portfolio (as represented by a 60 percent S&P 500 and 40 percent Barclays Aggregate Bond portfolio).
The Fund’s performance resulted from several asset classes within its diversified strategy delivering strong returns including private equity, U.S. equity, emerging market equity, developed market equity, real estate, and hedge funds. Both global and domestic equity markets enjoyed a very strong first half of the year, with both emerging markets and developed markets outperforming a strong US market.
Private equity holdings continue to thrive. Ongoing growth and progress by some of the directly held companies resulted in solid increases in value, and in one case, income through some additional financing activities. Holdings in private equity funds also fared well with several recognized increases in value across different funds.
Real estate holdings continue to perform well. Value was recognized across the sector in various ways ranging from increases in the value of holdings to interest received to fees for financing activities. Overall, the sector provided solid and consistent returns to the portfolio.
During the most recent six-month period, the fund increased its exposure to Hedge Funds. Increased exposure to the asset class has been purposefully slow giving us ample time to identify opportunities that we believe will contribute both returns and stability to the fund. During the first half of the year, the funds performed as hoped, adding gains and diversification.
For the first half of the year in 2017, no asset classes experienced severe downtowns, but a few turned in losses and inevitably, some lagged the portfolio’s overall performance. Most notably, managed futures experienced losses and several oil and gas holdings dragged down the category average into negative territory.
Managed Futures losses were fairly minor. During the second quarter, we exited all managed futures holdings and replaced them with hedge funds that we believe offer a more attractive combination of return potential and diversification. Overall, we felt the mediocre performance expectations for the category no longer warranted inclusion in the portfolio.
Oil and gas holdings struggled through the year as energy prices again sagged. While the largest holdings in funds saw very limited price declines, some of the traded positions experienced losses that more than negated their significant dividend income.
Fixed income contributed positive returns to the portfolio with performance surprisingly strong given very tepid bond market returns. Still, the category as a whole acted as a drag on total performance. Cash holdings predictably contributed very little to portfolio returns.
Looking forward to the second half of 2017, we expect that global equity market performance will cool somewhat. The performance of equities over the past 12 months has been exceptionally strong and remarkably steady. Recent strong returns have resulted in fairly rich valuations for equities which we believe pose challenges for future equity market returns. The growing strength of various global economies is leading us to look overseas for more opportunities and we believe emerging markets still offer good potential. In other asset classes, the relative calm across many market segments combined with historically low interest rates has also lead to fairly strong valuations in other asset classes including real estate and even private equity.
2
Wildermuth Endowment Strategy Fund
Letter to Shareholders - Continued
June 30, 2017
Against this backdrop which we feel offers investors far fewer tailwinds than were available just a few years ago, we feel that investment selection is particularly important. We believe we are well positioned to find and add attractive investments to the portfolio which should contribute to portfolio returns while limiting overall portfolio volatility.
Thank you for your continued confidence and support.
Sincerely,
Daniel Wildermuth
President and Chief Executive Officer, and
Chairman and Trustee of the Fund
3
Wildermuth Endowment Strategy Fund
Portfolio Review
June 30, 2017 (Unaudited)
The Fund’s performance figures* for the period ended June 30, 2017, compared to its benchmarks:
| Two
Year | One
Year | Annualized
Since Inception1 |
| Class A | 5.87% | 11.52% | 10.48% |
Class A with Load2 | 2.65% | 4.86% | 7.77% |
S&P 500® Total Return Index** | 10.73% | 17.90% | 9.04% |
| Barclays U.S. Aggregate Bond Index*** | 2.79% | -0.31% | 2.19% |
| | | |
| | One
Year | Annualized
Since Inception3 |
| Class C | | 10.65% | 12.31% |
| Class C with Sales Charge | | 9.65%4 | 12.31% |
S&P 500® Total Return Index** | | 17.90% | 17.51% |
| Barclays U.S. Aggregate Bond Index*** | | -0.31% | 2.39% |
| | | | |
| | | Cumulative
Since Inception5,6 |
| Class I | | | 0.73% |
S&P 500® Total Return Index** | | | 2.04% |
| Barclays U.S. Aggregate Bond Index*** | | | 0.67% |
1 | The Class A inception date is December 31, 2014. |
2 | Calculated using the maximum sales load of 6.00% |
3 | The Class C inception date is March 14, 2016. |
4 | Class C shares are subject to a Contingent Deferred Sales Charge of 1.00% on any shares redeemed within 365 days of purchase. |
5 | The Class I inception date is April 28, 2017. |
6 | Not annualized for periods less than one year. |
| * | The performance data quoted here represents past performance. Current performance may be lower or higher than the performance data quoted above. Investment return and principal value will fluctuate, so that shares, when redeemed, may be worth more or less than their original cost. The returns shown do not reflect the deduction of taxes that a shareholder would pay on Fund distributions or on the redemptions of Fund shares. Past performance is no guarantee of future results. Class A has a total annual operating expense of 5.46%, Class C has a total annual operating expense of 6.21%, and Class I has a total annual operating expense of 5.21%, respectively, per the prospectus dated May 1, 2017. |
| ** | The S&P 500® Total Return Index is an unmanaged market capitalization-weighted index of 500 widely held common stocks. Investors cannot invest directly in an index. |
| *** | The Barclays U.S. Aggregate Bond Index is a broad-based benchmark that measures the investment grade, U.S. dollar-denominated, fixed-rate taxable bond market, including Treasuries, government-related and corporate securities, MBS (agency fixed-rate and hybrid ARM pass-through securities), ABS, and CMBS. Investors cannot invest directly in an index. |
4
Wildermuth Endowment Strategy Fund
Portfolio Review - Continued
June 30, 2017 (Unaudited)
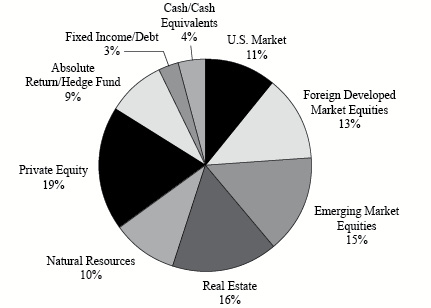
| Holdings by type of Investment | % of
Net Assets | |
| U.S. Market | 11.36% |
| Foreign Developed Market Equities | 13.15% |
| Emerging Market Equities | 15.10% |
| Real Estate | 15.96% |
| Natural Resources | 9.84% |
| Private Equity | 18.93% |
| Absolute Return/Hedge Fund | 8.84% |
| Fixed Income/Debt | 2.57% |
| Cash/Cash Equivalents | 4.25% |
| | 100.00% |
| | |
| | |
Please refer to the Schedule of Investments in this Semi-Annual Report for a detailed analysis of the Fund’s Holdings.
5
Wildermuth Endowment Strategy Fund
Schedule of Investments
June 30, 2017 (Unaudited)
Shares or Principal Amount | | | | Value | |
| | | COMMON STOCKS — 28.4% | | | |
| | | ADVERTISING — 0.3% | | | |
| | 13,734 | | Havas SA | | $ | 144,201 | |
| | | | | | | | |
| | | | AGRICULTURE — 0.9% | | | | |
| | 2,469 | | Bunge, Ltd. | | | 184,187 | |
| | 2,117 | | Sipef SA | | | 152,111 | |
| | 4,098 | | Swedish Match AB | | | 144,154 | |
| | | | | | | 480,452 | |
| | | | AIRLINES — 0.3% | | | | |
| | 35,701 | | Qantas Airways, Ltd. | | | 156,639 | |
| | | | | | | | |
| | | | AUTO MANUFACTURERS — 0.5% | | | | |
| | 13,700 | | Nissan Motor Co., Ltd. | | | 136,317 | |
| | 3,100 | | Suzuki Motor Corp. | | | 147,054 | |
| | | | | | | 283,371 | |
| | | | AUTO PARTS & EQUIPMENT — 0.2% | | | | |
| | 2,600 | | American Axle & Manufacturing Holdings, Inc.(a) | | | 40,560 | |
| | 1,701 | | Tenneco, Inc. | | | 98,369 | |
| | | | | | | 138,929 | |
| | | | BANKS — 2.5% | | | | |
| | 16,657 | | Bendigo & Adelaide Bank, Ltd. | | | 141,566 | |
| | 1,218 | | Capital One Financial Corp. | | | 100,631 | |
| | 19,000 | | Chiba Bank, Ltd. | | | 137,647 | |
| | 4,000 | | Customers Bancorp, Inc.(a) | | | 113,120 | |
| | 3,943 | | Erste Group Bank AG | | | 150,763 | |
| | 6,945 | | FNB Corp. | | | 98,341 | |
| | 1,036 | | JPMorgan Chase & Co. | | | 94,690 | |
| | 11,114 | | Mitsubishi UFJ Financial Group, Inc., ADR | | | 75,020 | |
| | 18,000 | | Oversea-Chinese Banking Corp., Ltd. | | | 141,056 | |
| | 3,900 | | Sumitomo Mitsui Trust Holdings, Inc. | | | 139,499 | |
| | 1,586 | | Wells Fargo & Co. | | | 87,880 | |
| | 2,100 | | Western Alliance Bancorp(a) | | | 103,320 | |
| | | | | | | 1,383,533 | |
| | | | BEVERAGES — 0.2% | | | | |
| | 1,514 | | Heineken Holding NV | | | 138,570 | |
| | | | | | | | |
| | | | BIOTECHNOLOGY — 0.2% | | | | |
| | 769 | | United Therapeutics Corp.(a) | | | 99,762 | |
| | | | | | | | |
| | | | BUILDING MATERIALS — 1.0% | | | | |
| | 3,300 | | Asahi Glass Co., Ltd. | | | 138,928 | |
| | 10,300 | | Nihon Flush Co., Ltd. | | | 139,521 | |
| | 4,126 | | Owens Corning | | | 276,112 | |
| | | | | | | 554,561 | |
See accompanying notes to financial statements.
6
Wildermuth Endowment Strategy Fund
Schedule of Investments - Continued
June 30, 2017 (Unaudited)
Shares or Principal Amount | | | | Value | |
| | | COMMON STOCKS (CONTINUED) | | | |
| | | CHEMICALS — 0.6% | | | |
| | 2,747 | | Croda International PLC | | $ | 138,616 | |
| | 415 | | LyondellBasell Industries NV, Class A | | | 35,022 | |
| | 7,210 | | Teijin, Ltd. | | | 138,669 | |
| | | | | | | 312,307 | |
| | | | COMMERCIAL SERVICES — 1.3% | | | | |
| | 1,673 | | Groupe Crit | | | 155,508 | |
| | 4,098 | | Intrum Justitia AB | | | 138,955 | |
| | 13,046 | | McMillan Shakespeare, Ltd. | | | 134,092 | |
| | 884 | | S&P Global, Inc. | | | 129,055 | |
| | 1,294 | | United Rentals, Inc.(a) | | | 145,847 | |
| | | | | | | 703,457 | |
| | | | COMPUTERS — 0.2% | | | | |
| | 622 | | International Business Machines Corp. | | | 95,682 | |
| | | | | | | | |
| | | | DISTRIBUTION/WHOLESALE — 0.2% | | | | |
| | 13,292 | | Inchcape PLC | | | 130,261 | |
| | | | | | | | |
| | | | DIVERSIFIED FINANCIAL SERVICES — 0.7% | | | | |
| | 5,700 | | Ally Financial, Inc. | | | 119,130 | |
| | 7,840 | | Enova International, Inc.(a) | | | 116,424 | |
| | 26,000 | | Mitsubishi UFJ Lease & Finance Co., Ltd. | | | 142,079 | |
| | | | | | | 377,633 | |
| | | | ELECTRIC — 0.2% | | | | |
| | 2,800 | | Brookfield Renewable Partners LP | | | 89,432 | |
| | | | | | | | |
| | | | ELECTRICAL COMPONENTS & EQUIPMENT — 0.3% | | | | |
| | 1,998 | | OSRAM Licht AG | | | 158,942 | |
| | | | | | | | |
| | | | ELECTRONICS — 0.4% | | | | |
| | 61,700 | | Japan Display, Inc.(a) | | | 116,415 | |
| | 4,000 | | Orbotech, Ltd.(a) | | | 130,480 | |
| | | | | | | 246,895 | |
| | | | ENERGY-ALTERNATE SOURCES — 0.2% | | | | |
| | 12,846 | | Innergex Renewable Energy, Inc. | | | 141,052 | |
| | | | | | | | |
| | | | ENGINEERING & CONSTRUCTION — 0.2% | | | | |
| | 2,176 | | Argan, Inc. | | | 130,560 | |
| | | | | | | | |
| | | | ENTERTAINMENT — 0.2% | | | | |
| | 2,328 | | Cinemark Holdings, Inc. | | | 90,443 | |
| | | | | | | | |
| | | | FOOD — 1.1% | | | | |
| | 14,010 | | Darling Ingredients, Inc.(a) | | | 220,517 | |
| | 635 | | Fresh Del Monte Produce, Inc. | | | 32,328 | |
See accompanying notes to financial statements.
7
Wildermuth Endowment Strategy Fund
Schedule of Investments - Continued
June 30, 2017 (Unaudited)
Shares or Principal Amount | | | | Value | |
| | | COMMON STOCKS (CONTINUED) | | | |
| | | FOOD (Continued) | | | |
| | 3,967 | | Hain Celestial Group, Inc.(a) | | $ | 153,999 | |
| | 1,580 | | Performance Food Group Co.(a) | | | 43,292 | |
| | 23,872 | | Synlait Milk, Ltd. - Australia (a) | | | 74,526 | |
| | 23,500 | | Synlait Milk, Ltd. - New Zealand (a) | | | 72,953 | |
| | | | | | | 597,615 | |
| | | | FOREST PRODUCTS & PAPER — 0.1% | | | | |
| | 3,260 | | Mercer International, Inc. | | | 37,490 | |
| | | | | | | | |
| | | | GAS — 0.3% | | | | |
| | 4,832 | | Enagas SA | | | 135,294 | |
| | 760 | | UGI Corp. | | | 36,791 | |
| | | | | | | 172,085 | |
| | | | HEALTHCARE-PRODUCTS — 0.2% | | | | |
| | 4,194 | | Exactech, Inc.(a) | | | 124,981 | |
| | | | | | | | |
| | | | HEALTHCARE-SERVICES — 1.2% | | | | |
| | 874 | | Chemed Corp. | | | 178,759 | |
| | 1,621 | | Fresenius SE & Co. KGaA | | | 138,769 | |
| | 7,157 | | HealthSouth Corp. | | | 346,399 | |
| | | | | | | 663,927 | |
| | | | HOME FURNISHINGS — 0.3% | | | | |
| | 10,829 | | Panasonic Corp. | | | 146,880 | |
| | | | | | | | |
| | | | INSURANCE — 1.0% | | | | |
| | 9,840 | | State National Cos., Inc. | | | 180,859 | |
| | 433 | | Swiss Life Holding AG (a) | | | 146,308 | |
| | 1,548 | | Swiss Re AG | | | 141,675 | |
| | 2,117 | | Unum Group | | | 98,716 | |
| | | | | | | 567,558 | |
| | | | INTERNET — 0.2% | | | | |
| | 578 | | Iliad SA | | | 136,523 | |
| | | | | | | | |
| | | | LEISURE TIME — 0.3% | | | | |
| | 3,044 | | Norwegian Cruise Line Holdings, Ltd.(a) | | | 165,259 | |
| | | | | | | | |
| | | | LODGING — 0.8% | | | | |
| | 1,650 | | Marriott International, Inc., Class A | | | 165,511 | |
| | 41,300 | | Rezidor Hotel Group AB | | | 152,771 | |
| | 1,119 | | Wyndham Worldwide Corp. | | | 112,359 | |
| | | | | | | 430,641 | |
| | | | MACHINERY-DIVERSIFIED — 1.0% | | | | |
| | 648 | | Cummins, Inc. | | | 105,119 | |
| | 340 | | Deere & Co. | | | 42,021 | |
| | 8,700 | | Eagle Industry Co., Ltd. | | | 146,729 | |
See accompanying notes to financial statements.
8
Wildermuth Endowment Strategy Fund
Schedule of Investments - Continued
June 30, 2017 (Unaudited)
Shares or Principal Amount | | | | Value | |
| | | COMMON STOCKS (CONTINUED) | | | |
| | | MACHINERY-DIVERSIFIED (Continued) | | | |
| | 3,286 | | Hollysys Automation Technologies, Ltd. | | $ | 54,580 | |
| | 2,000 | | Zebra Technologies Corp., Class A(a) | | | 201,040 | |
| | | | | | | 549,489 | |
| | | | MINING — 0.4% | | | | |
| | 4,565 | | Coeur Mining, Inc.(a) | | | 39,168 | |
| | 19,439 | | Hudbay Minerals, Inc. | | | 111,774 | |
| | 470 | | Kaiser Aluminum Corp. | | | 41,605 | |
| | 13,380 | | Yamana Gold, Inc. | | | 32,513 | |
| | | | | | | 225,060 | |
| | | | OIL & GAS — 1.0% | | | | |
| | 2,395 | | Marathon Oil Corp. | | | 28,381 | |
| | 2,529 | | Murphy Oil Corp. | | | 64,818 | |
| | 3,505 | | Neste Oyj | | | 137,873 | |
| | 8,020 | | Rowan Cos. Plc, Class A(a) | | | 82,125 | |
| | 1,614 | | Tesoro Corp. | | | 151,070 | |
| | 1,650 | | Unit Corp.(a) | | | 30,905 | |
| | 835 | | Valero Energy Corp. | | | 56,329 | |
| | | | | | | 551,501 | |
| | | | OIL & GAS SERVICES — 0.4% | | | | |
| | 10,299 | | Subsea 7 SA | | | 138,071 | |
| | 5,447 | | World Point Terminals LP | | | 94,124 | |
| | | | | | | 232,195 | |
| | | | PHARMACEUTICALS — 1.9% | | | | |
| | 9,700 | | Astellas Pharma, Inc. | | | 118,660 | |
| | 530 | | Bayer AG | | | 68,426 | |
| | 6,126 | | Daiichi Sankyo Co., Ltd. | | | 144,318 | |
| | 920 | | Johnson & Johnson | | | 121,707 | |
| | 6,161 | | Mitsubishi Tanabe Pharma Corp. | | | 142,346 | |
| | 864 | | Novartis AG, ADR | | | 72,118 | |
| | 2,809 | | Novo Nordisk A/S, ADR | | | 120,478 | |
| | 7,170 | | Omega Protein Corp. | | | 128,343 | |
| | 2,041 | | UCB SA | | | 140,202 | |
| | | | | | | 1,056,598 | |
| | | | PIPELINES — 1.5% | | | | |
| | 5,200 | | Boardwalk Pipeline Partners LP | | | 93,652 | |
| | 1,306 | | Buckeye Partners LP | | | 83,493 | |
| | 2,495 | | DCP Midstream LP | | | 84,406 | |
| | 6,540 | | Energy Transfer Equity LP | | | 117,458 | |
| | 1,360 | | Enterprise Products Partners LP | | | 36,829 | |
| | 2,437 | | Genesis Energy LP | | | 77,326 | |
| | 1,340 | | ONEOK, Inc. | | | 69,894 | |
| | 1,813 | | Phillips 66 Partners LP | | | 89,599 | |
| | 1,896 | | Spectra Energy Partners LP | | | 81,338 | |
See accompanying notes to financial statements.
9
Wildermuth Endowment Strategy Fund
Schedule of Investments - Continued
June 30, 2017 (Unaudited)
Shares or Principal Amount | | | | Value | |
| | | COMMON STOCKS (CONTINUED) | | | |
| | | PIPELINES (CONTINUED) | | | |
| | 2,275 | | TC PipeLines LP | | $ | 125,125 | |
| | | | | | | 859,120 | |
| | | | RETAIL — 1.0% | | | | |
| | 1,687 | | Asbury Automotive Group, Inc.(a) | | | 95,400 | |
| | 850 | | CVS Health Corp. | | | 68,391 | |
| | 4,242 | | Michaels Cos., Inc.(a) | | | 78,562 | |
| | 3,925 | | MTY Food Group, Inc. | | | 140,112 | |
| | 1,202 | | Target Corp. | | | 62,852 | |
| | 1,312 | | Wal-Mart Stores, Inc. | | | 99,292 | |
| | | | | | | 544,609 | |
| | | | SEMICONDUCTORS — 2.0% | | | | |
| | 501 | | Broadcom, Ltd. | | | 116,758 | |
| | 3,131 | | Cirrus Logic, Inc.(a) | | | 196,376 | |
| | 2,940 | | Intel Corp. | | | 99,196 | |
| | 1,513 | | Lam Research Corp. | | | 213,984 | |
| | 809 | | NXP Semiconductors NV(a) | | | 88,545 | |
| | 1,473 | | Skyworks Solutions, Inc. | | | 141,335 | |
| | 34,689 | | Telit Communications PLC | | | 140,576 | |
| | 1,424 | | Texas Instruments, Inc. | | | 109,548 | |
| | | | | | | 1,106,318 | |
| | | | SOFTWARE — 1.0% | | | | |
| | 2,280 | | Cerner Corp.(a) | | | 151,552 | |
| | 759 | | Check Point Software Technologies, Ltd.(a) | | | 82,792 | |
| | 1,517 | | Dassault Systemes | | | 135,800 | |
| | 1,540 | | Fiserv, Inc.(a) | | | 188,403 | |
| | | | | | | 558,547 | |
| | | | TELECOMMUNICATIONS — 1.2% | | | | |
| | 23,007 | | CenturyLink, Inc. | | | 549,407 | |
| | 2,431 | | Millicom International Cellular SA | | | 143,417 | |
| | | | | | | 692,824 | |
| | | | TRANSPORTATION — 0.5% | | | | |
| | 3,650 | | Golar LNG Partners LP | | | 73,255 | |
| | 8,490 | | Ship Finance International, Ltd. | | | 115,464 | |
| | 2,190 | | Teekay LNG Partners LP | | | 33,617 | |
| | 15,426 | | Teekay Offshore Partners LP | | | 44,273 | |
| | | | | | | 266,609 | |
| | | | TRUCKING & LEASING — 0.4% | | | | |
| | 5,222 | | Greenbrier Cos., Inc. | | | 241,517 | |
| | | | | | | | |
| | | | TOTAL COMMON STOCKS (Cost $14,372,416) | | | 15,784,028 | |
See accompanying notes to financial statements.
10
Wildermuth Endowment Strategy Fund
Schedule of Investments - Continued
June 30, 2017 (Unaudited)
Shares or Principal Amount | | | | Value | |
| | | EXCHANGE TRADED FUNDS — 17.3% | | | |
| | | DEBT FUNDS — 2.5% | | | |
| | 5,690 | | iShares Emerging Markets High Yield Bond | | $ | 285,411 | |
| | 5,780 | | iShares Global High Yield Corporate Bond | | | 291,832 | |
| | 2,190 | | iShares iBoxx $High Yield Corporate Bond | | | 193,574 | |
| | 1,294 | | iShares iBoxx $Investment Grade Corporate Bond | | | 155,940 | |
| | 4,542 | | iShares J.P. Morgan Emerging Markets Local Currency Bond(a) | | | 211,657 | |
| | 1,340 | | iShares TIPS Bond | | | 151,996 | |
| | 2,100 | | PowerShares International Corporate Bond Portfolio | | | 55,167 | |
| | 1,247 | | SPDR Citi International Government Inflation-Protected Bond | | | 69,284 | |
| | | | | | | 1,414,861 | |
| | | | EQUITY FUNDS — 14.8% | | | | |
| | 51,500 | | Global X MSCI Colombia | | | 498,005 | |
| | 24,654 | | iShares MSCI All Peru Capped | | | 835,031 | |
| | 22,497 | | iShares MSCI Brazil Capped | | | 768,048 | |
| | 19,268 | | iShares MSCI Chile Capped | | | 802,898 | |
| | 26,765 | | iShares MSCI India | | | 859,156 | |
| | 22,532 | | iShares MSCI Philippines | | | 807,321 | |
| | 38,896 | | iShares MSCI Poland Capped | | | 944,395 | |
| | 29,656 | | iShares MSCI Taiwan | | | 1,060,498 | |
| | 10,798 | | iShares MSCI Thailand Capped | | | 841,812 | |
| | 40,792 | | VanEck Vectors Russia | | | 781,983 | |
| | | | | | | 8,199,147 | |
| | | | | | | | |
| | | | TOTAL EXCHANGE TRADED FUNDS (Cost $9,256,021) | | | 9,614,008 | |
| | | | | | | | |
| | | | COMMODITY & NATURAL RESOURCE INVESTMENTS — 4.4% | | | | |
| | 857 | | Casillas Petroleum Resource Partners, LLC(b) | | | 856,834 | |
| | 1,575,000 | | Kayne Anderson Energy Fund VII LP(b) | | | 1,588,313 | |
| | | | TOTAL COMMODITY & NATURAL RESOURCE INVESTMENTS (Cost $2,324,037) | | | 2,445,147 | |
| | | | | | | | |
| | | | HEDGE FUNDS — 8.7% | | | | |
| | 1,000 | | Condire Resource Partners LP(b) | | | 1,000,000 | |
| | 1,625,000 | | Direct Lending Income Fund LP(b) | | | 1,723,375 | |
| | 1,000 | | Esulep LLC Permo Fund(b) | | | 1,000,000 | |
| | 1,020,000 | | Rosebrook Opportunities Fund LP(b)(c) | | | 1,132,860 | |
| | | | TOTAL HEDGE FUNDS (Cost $4,645,000) | | | 4,856,235 | |
| | | | | | | | |
| | | | PRIVATE DEBT — 4.7% | | | | |
| $ | 500,000 | | Atlanta Healthcare Property Consultants, LLC, 12.00%, 8/19/2017(b) | | | 530,000 | |
| | 1,000,000 | | Doctor's Hospice of Georgia, Inc., 12.00%, 9/13/2017(b) | | | 1,060,000 | |
| | 1,000,000 | | Tout, Inc. - Convertible Promissory Note, 8.00%, 5/12/2018(b) | | | 1,000,000 | |
| | | | TOTAL PRIVATE DEBT (Cost $2,518,860) | | | 2,590,000 | |
See accompanying notes to financial statements.
11
Wildermuth Endowment Strategy Fund
Schedule of Investments - Continued
June 30, 2017 (Unaudited)
Shares or Principal Amount | | | | Value | |
| | | PRIVATE EQUITY — 14.1% | | | |
| | 350,000 | | Abbott Secondary Opportunities LP(b) | | $ | 363,611 | |
| | 100 | | Atlas Fintech Holdings Corp.(b) | | | 1,150,000 | |
| | 2,500 | | Clear Guide Medical, Inc.(b)(c) | | | 2,989,100 | |
| | 288,560 | | Committed Advisors Secondary Fund III(b) | | | 382,042 | |
| | 10 | | GPB Automotive Portfolio LP(b) | | | 500,696 | |
| | 500 | | Gravity Ranch Fund I LP(b)(c) | | | 500,000 | |
| | 438,000 | | Star Mountain Diversified Small Business Access Fund II LP(b) | | | 479,215 | |
| | 337,207 | | Tout, Inc. - Series C Preferred Stock(b) | | | 1,448,180 | |
| | | | TOTAL PRIVATE EQUITY (Cost $6,512,298) | | | 7,812,844 | |
| | | | | | | | |
| | | | PUBLIC NON-TRADED BUSINESS DEVELOPMENT COMPANIES — 1.3% | | | | |
| | 95,638 | | Franklin Square Energy & Power Fund(b) | | | 741,191 | |
| | | | TOTAL PUBLIC NON-TRADED BUSINESS DEVELOPMENT COMPANIES (Cost $642,607) | | | 741,191 | |
| | | | | | | | |
| | | | PRIVATE REAL ESTATE INVESTMENTS — 10.6% | | | | |
| | 95,075 | | ARCTRUST, Inc.(b) | | | 1,348,168 | |
| | 101,470 | | Cottonwood Residential, Inc.(b) | | | 1,714,843 | |
| | 621,841 | | Harbert Seniors Housing Fund I LP(b) | | | 701,743 | |
| | 800 | | PCG Select Series I LLC - Series A Preferred Stock(b) | | | 800,000 | |
| | 56 | | Shopoff Land Fund III LP(b) | | | 50,680 | |
| | 884,883 | | Stonehill Strategic Hotel Credit Opportunity Fund II LP(b) | | | 963,132 | |
| | 2,522 | | Walton Real Estate Fund VIII LP(b) | | | 281,193 | |
| | | | TOTAL PRIVATE REAL ESTATE INVESTMENTS (Cost $5,261,748) | | | 5,859,759 | |
| | | | | | | | |
| | | | PUBLIC REAL ESTATE INVESTMENTS — 2.2% | | | | |
| | | | PUBLIC NON-TRADED REAL ESTATE INVESTMENT TRUSTS — 2.1% | | | | |
| | 111,521 | | Behringer Harvard Opportunity(b) | | | 209,659 | |
| | 18,060 | | Dividend Capital Diversified(b) | | | 135,454 | |
| | 136,771 | | Highlands REIT, Inc.(b) | | | 47,870 | |
| | 153,283 | | Inventrust Properties Corp.(b) | | | 504,301 | |
| | 102,130 | | KBS REIT II, Inc.(b) | | | 252,773 | |
| | 3,330 | | Phillips Edison Grocery Center(b) | | | 33,964 | |
| | | | | | | 1,184,021 | |
| | | | PUBLIC NON-TRADED REAL ESTATE LIMITED PARTNERSHIP — 0.1% | | | | |
| | 1,725 | | Uniprop Manufactured Housing Communities Income Fund II(b) | | | 22,511 | |
| | | | TOTAL PUBLIC REAL ESTATE INVESTMENTS (Cost $971,394) | | | 1,206,532 | |
| | | | | | | | |
| | | | REAL ESTATE LOANS — 3.1% | | | | |
| $ | 400,000 | | Airport Center Development Partners, LLC, 9.50%, 9/17/2018(b) | | | 400,000 | |
| | 400,000 | | Dog Wood Park of Northeast Florida, LLC, 3.50%, 3/21/2018(b) | | | 400,000 | |
| | 400,000 | | Hauiki Hui, LLC, 9.50%, 1/1/2018(b) | | | 400,000 | |
| | 500,000 | | Saratoga Springs Partners, LLC, 9.50%, 11/1/2017(b) | | | 500,000 | |
| | | | TOTAL REAL ESTATE LOANS (Cost $1,624,500) | | | 1,700,000 | |
See accompanying notes to financial statements.
12
Wildermuth Endowment Strategy Fund
Schedule of Investments - Continued
June 30, 2017 (Unaudited)
Shares or Principal Amount | | | | Value | |
| | | SHORT-TERM INVESTMENTS — 4.2% | | | |
| | 2,332,987 | | Fidelity Institutional Government Portfolio - Institutional Class, 0.85%(d) | | $ | 2,332,987 | |
| | | | TOTAL SHORT-TERM INVESTMENTS (Cost $2,332,987) | | | 2,332,987 | |
| | | | | | | | |
| | | | TOTAL INVESTMENTS — 99.0% (Cost $50,461,868) | | | 54,942,731 | |
| | | | Other assets less liabilities — 1.0% | | | 579,665 | |
| | | | | | | | |
| | | | TOTAL NET ASSETS —100.0% | | $ | 55,522,396 | |
ADR – American Depositary Receipt
LLC – Limited Liability Company
LP – Limited Partnership
PLC – Public Limited Company
REIT – Real Estate Investment Trust
(b) | Illiquid Security. Total illiquid securities represent 49.01% of net assets as of June 30, 2017. |
(c) | Denotes an investment in an affiliated entity. Please refer to Note 8, Investments in Affiliated Issuers, in the Notes to the Financial Statements. |
(d) | Represents the current rate as of June 30, 2017. |
See accompanying notes to financial statements.
13
Wildermuth Endowment Strategy Fund
Statement of Assets and Liabilities
As of June 30, 2017 (Unaudited)
| Assets: | | | |
| Investments in unaffiliated issuers at value (cost $46,691,868) | | $ | 50,320,771 | |
| Investments at affiliated issuers at value (cost $3,770,000) | | | 4,621,960 | |
| Cash | | | 1,141 | |
| Receivables: | | | | |
| Investment securities sold | | | 255,355 | |
| Due from Adviser | | | 24,973 | |
| Dividends and interest | | | 146,980 | |
| Fund shares sold | | | 161,850 | |
| Prepaid expenses | | | 55,697 | |
| Total assets | | | 55,588,727 | |
| | | | | |
| Liabilities: | | | | |
| Payables: | | | | |
| Professional fees | | | 11,450 | |
| Shareholder servicing fees | | | 19,298 | |
| Transfer agent fees and expenses | | | 11,143 | |
| Fund accounting & administration | | | 12,017 | |
| Custody fees | | | 4,103 | |
| Distribution fees | | | 6,555 | |
| Accrued other liabilities | | | 1,765 | |
| Total liabilities | | | 66,331 | |
| Net Assets | | $ | 55,522,396 | |
| | | | | |
| Net Assets Consist of: | | | | |
| Paid in capital (unlimited shares authorized, 25,000,000 shares registered, no par value) | | $ | 50,809,927 | |
| Accumulated net investment loss | | | (135,516 | ) |
| Accumulated net realized gain on investments | | | 367,049 | |
| Net unrealized appreciation on: | | | | |
| Investments | | | 4,480,863 | |
| Foreign currency translations | | | 73 | |
| Net Assets | | $ | 55,522,396 | |
| | | | | |
| Net Assets: | | | | |
| Class A | | $ | 44,511,216 | |
| Class C | | | 10,997,082 | |
Class I(1) | | | 14,098 | |
| Net Assets | | $ | 55,522,396 | |
| | | | | |
| Shares of Beneficial Interest Issued and Outstanding: | | | | |
| Class A shares | | | 3,628,789 | |
| Class C shares | | | 905,902 | |
Class I shares(1) | | | 1,149 | |
| Total Shares Outstanding | | | 4,535,840 | |
| | | | | |
Net Asset Value, Offering Price and Redemption Proceeds per Share(2) | | | | |
| Class A | | $ | 12.27 | |
Class C(3) | | $ | 12.14 | |
Class I(1) | | $ | 12.27 | |
Class A - Maximum offering price per share (Net asset value per share divided by 0.94)(4) | | $ | 13.05 | |
(1) | Class I inception date was April 28, 2017. |
(2) | Redemptions made within 90 days of purchase may be assessed a redemption fee of 2.00%. |
(3) | Class C Shares of the Fund are subject to a Contingent Deferred Sales Charge (“CDSC”) of 1.00% on any shares sold within 365 days of purchase. |
(4) | Reflects a maximum sales charge of 6.00%. |
See accompanying notes to financial statements.
14
Wildermuth Endowment Strategy Fund
Statement of Operations
For the six months ended June 30, 2017 (Unaudited)
| Investment Income: | | | |
| Dividends from unaffiliated issuers (net of foreign withholding taxes of $7,733) | | $ | 372,191 | |
| Interest | | | 87,308 | |
| Total investment income | | | 459,499 | |
| | | | | |
| Expenses: | | | | |
| Advisory fees (see Note 4) | | | 339,635 | |
| Legal fees | | | 98,178 | |
| Accounting & administration servicing fees | | | 54,590 | |
| Shareholder servicing fees - Class A | | | 46,946 | |
| Transfer agent fees | | | 42,148 | |
| Distribution fees - Class C | | | 28,963 | |
| Registration fees | | | 26,537 | |
| Trustees' fees | | | 26,282 | |
| Printing and postage expenses | | | 23,066 | |
| Chief compliance officer fees | | | 21,908 | |
| Chief financial officer fees | | | 19,412 | |
| Miscellaneous Expenses | | | 16,791 | |
| Custodian fees | | | 12,784 | |
| Insurance expense | | | 12,704 | |
| Audit fees | | | 11,258 | |
| Shareholder servicing fees - Class C | | | 9,654 | |
| Total expenses | | | 790,856 | |
| Expenses waived and reimbursed from Adviser (see Note 4) | | | (195,841 | ) |
| Net expenses | | | 595,015 | |
| Net investment loss | | | (135,516 | ) |
| | | | | |
| Realized and Unrealized Gain (Loss) on Investments and Foreign Currency: | | | | |
| Net realized gain (loss) on: | | | | |
| Investments in unaffiliated issuers | | | 391,744 | |
| Foreign currency transactions | | | (3,924 | ) |
| Total net realized gain | | | 387,820 | |
| Net change in unrealized appreciation/depreciation on: | | | | |
| Investments in unaffiliated issuers | | | 1,739,945 | |
| Investments in affiliated issuers | | | 101,574 | |
| Foreign currency translations | | | 98 | |
| Total net change in unrealized appreciation/depreciation | | | 1,841,617 | |
| Net realized and unrealized gain on investments and foreign currency | | | 2,229,437 | |
| | | | | |
| Net Increase in Net Assets from Operations | | $ | 2,093,921 | |
See accompanying notes to financial statements.
15
Wildermuth Endowment Strategy Fund
Statements of Changes in Net Assets
| | | For the six
months ended
June 30, 2017
(Unaudited) | | | For the
year ended
December 31,
2016 | |
| Change in Net Assets From: | | | | | | |
| Operations: | | | | | | |
| Net investment loss | | $ | (135,516 | ) | | $ | (123 | ) |
| Net realized gain on investments | | | 387,820 | | | | 3,643 | |
| Distributions of realized gains by underlying investment companies | | | — | | | | 12,670 | |
| Net change in unrealized appreciation/depreciation on investments | | | 1,841,617 | | | | 2,584,553 | |
| Net increase in net assets resulting from operations | | | 2,093,921 | | | | 2,600,743 | |
| | | | | | | | | |
| Distributions to Shareholders: | | | | | | | | |
| From return of capital - Class A | | | (448,435 | )(2) | | | (351,953 | ) |
| From return of capital - Class C | | | (104,344 | )(2) | | | (27,113 | )(3) |
From return of capital - Class I(1) | | | (91 | )(2) | | | — | |
| Total distributions to shareholders | | | (552,870 | ) | | | (379,066 | ) |
| | | | | | | | | |
| Capital Share Transactions: | | | | | | | | |
| Net proceeds from Class A shares sold | | | 12,492,426 | | | | 15,811,022 | |
| Net proceeds from Class C shares sold | | | 5,820,645 | | | | 4,773,737 | (3) |
Net proceeds from Class I shares sold(1) | | | 13,982 | | | | — | |
| Reinvestment of distributions from Class A shares | | | 274,876 | | | | 224,283 | |
| Reinvestment of distributions from Class C shares | | | 96,675 | | | | 24,899 | (3) |
Reinvestment of distributions from Class I shares(1) | | | 91 | | | | — | |
| Cost of Class A shares redeemed | | | (1,275,376 | ) | | | (867,149 | ) |
| Cost of Class C shares redeemed | | | (80,325 | ) | | | (20,000 | )(3) |
Cost of Class I shares redeemed(1) | | | — | | | | — | |
| Redemption fees | | | 1,465 | | | | 1,443 | |
| Net increase from capital share transactions | | | 17,344,459 | | | | 19,948,235 | |
| | | | | | | | | |
| Net change in net assets | | | 18,885,510 | | | | 22,169,912 | |
| | | | | | | | | |
| Net Assets: | | | | | | | | |
| Beginning of period | | | 36,636,886 | | | | 14,466,974 | |
| End of period | | $ | 55,522,396 | | | $ | 36,636,886 | |
| | | | | | | | | |
| Accumulated net investment loss | | $ | (135,516 | ) | | $ | — | |
| | | | | | | | | |
| Transactions in Shares: | | | | | | | | |
| Issuance of Class A shares | | | 1,028,171 | | | | 1,399,946 | |
| Issuance of Class C shares | | | 482,619 | | | | 421,583 | (3) |
Issuance of Class I Shares(1) | | | 1,142 | | | | — | |
| Class A shares reinvested | | | 22,542 | | | | 20,041 | |
| Class C shares reinvested | | | 8,003 | | | | 2,177 | (3) |
Class I shares reinvested(1) | | | 7 | | | | — | |
| Class A shares redeemed | | | (105,014 | ) | | | (77,088 | ) |
| Class C shares redeemed | | | (6,739 | ) | | | (1,741 | )(3) |
Class I shares redeemed(1) | | | — | | | | — | |
| Net increase in shares of beneficial interest outstanding | | | 1,430,731 | | | | 1,764,918 | |
(1) | Reflects operations for the period from April 28, 2017 (inception date) to June 30, 2017. |
(2) | The amounts and sources of distributions reported in this report reflect the estimates in order to comply with SEC regulations and are not being provided for tax reporting purposes. The actual amounts and sources of the amounts for tax reporting purposes will depend upon the Fund’s investment experience during the remainder of its fiscal year and may be subject to changes based on tax regulations. The Fund will send you a Form 1099-DIV in early 2018 for the 2017 calendar year that will tell you how to report these distributions for federal income tax purposes (e.g., ordinary income, long-term capital gain or return of capital). |
(3) | Reflects operations for the period from March 14, 2016 (inception date) to December 31, 2016. |
See accompanying notes to financial statements.
16
Wildermuth Endowment Strategy Fund
Statement of Cash Flows (Unaudited)
| | | For the six
months ended
June 30, 2017 | |
| Cash flows from operating activities: | | | |
| Net change in net assets resulting from operations | | $ | 2,093,921 | |
| Adjustments to reconcile net increase in net assets resulting from operations to net cash used in operating activities: | | | | |
| Purchases of investments | | | (28,266,944 | ) |
| Purchase of short term investments, net | | | (563,746 | ) |
| Proceeds from sale of investments | | | 10,977,255 | |
| Net realized gain from investments | | | (391,744 | ) |
| Net unrealized appreciation on investments | | | (1,841,519 | ) |
| Return of capital and non-income distributions received | | | 1,066,648 | |
| | | | | |
| Changes in assets and liabilities | | | | |
| (Increase)/Decrease in assets: | | | | |
| Receivable from Tax Credit | | | 244,927 | |
| Receivable for securities sold | | | (255,355 | ) |
| Due from Investment Adviser | | | 25,864 | |
| Dividend and interest receivable | | | (77,586 | ) |
| Prepaid expenses and other assets | | | (10,971 | ) |
| Funded commitment | | | 300,000 | |
| Increase/(Decrease) in liabilities: | | | | |
| Payable for professional fees | | | (15,950 | ) |
| Payable for shareholder servicing fees | | | 3,622 | |
| Payables for transfer agent fees and expenses | | | (422 | ) |
| Payable for fund accounting and administration fees | | | 2,564 | |
| Payable for custody fees | | | 185 | |
| Payable for distribution fees | | | 3,625 | |
| Accrued expenses and other liabilities | | | (10,222 | ) |
| Net cash used in operating activities | | | (16,715,848 | ) |
| | | | | |
| Cash flows from financing activities: | | | | |
| Proceeds from shares sold | | | 18,251,501 | |
| Cost of shares redeemed, net of redemption fees | | | (1,354,236 | ) |
| Cash distributions paid, net of reinvestment | | | (181,228 | ) |
| Net cash provided by financing activities | | | 16,716,037 | |
| | | | | |
| Net increase in cash | | | 189 | |
| Cash at beginning of period | | | 952 | |
| Cash at end of period | | $ | 1,141 | |
| | | | | |
| Supplemental disclosure of non-cash activity: | | | | |
| Non-cash financing activities not included herein consist of reinvestment of distributions | | $ | 371,642 | |
See accompanying notes to financial statements.
17
Wildermuth Endowment Strategy Fund
Financial Highlights – Class A
Per share income and capital changes for a share outstanding throughout the period.
| | | For the six
months ended
June 30, 2017(1)(2)
(Unaudited) | | | For the
year ended
December 31,
2016(1)(2) | | | For the
period ended
December 31,
2015(12) | |
| | | | | | | | | | |
| Net asset value, beginning of period | | $ | 11.81 | | | $ | 10.79 | | | $ | 10.00 | |
| | | | | | | | | | | | | |
| Income from Investment Operations: | | | | | | | | | | | | |
Net investment income(3) | | | 0.00 | (4) | | | 0.01 | | | | 0.05 | |
| Net realized and unrealized gain on investments | | | 0.59 | | | | 1.19 | | | | 0.93 | (13) |
| Total from investment operations | | | 0.59 | | | | 1.20 | | | | 0.98 | |
| Less Distributions: | | | | | | | | | | | | |
| From net investment income | | | — | | | | — | | | | (0.03 | ) |
| From return of capital | | | (0.13 | )(5) | | | (0.18 | ) | | | (0.16 | ) |
| Total distributions | | | (0.13 | ) | | | (0.18 | ) | | | (0.19 | ) |
| | | | | | | | | | | | | |
| Net asset value, end of period | | $ | 12.27 | | | $ | 11.81 | | | $ | 10.79 | |
| | | | | | | | | | | | | |
Total return(6) | | | 5.02 | %(7) | | | 11.27 | % | | | 9.74 | %(7) |
| | | | | | | | | | | | | |
| Ratios and Supplemental Data: | | | | | | | | | | | | |
| Net assets, end of period (in thousands) | | $ | 44,511 | | | $ | 31,686 | | | $ | 14,467 | |
Ratio of expenses before waivers to average net assets(9) | | | 3.37 | %(8) | | | 4.73 | % | | | 16.65 | %(8) |
Ratio of net expenses to average net assets(9)(10) | | | 2.50 | %(8) | | | 2.50 | % | | | 2.50 | %(8) |
Ratio of net investment income (loss) to average net assets(9)(11) | | | (0.03 | %)(8) | | | 0.07 | % | | | 0.49 | %(8) |
| Portfolio turnover rate | | | 26 | %(7) | | | 55 | % | | | 107 | %(7) |
(1) | Includes adjustments in accordance with accounting principles generally accepted in the United States and consequently, the net asset value for financial reporting purposes and the returns based upon those net asset values may differ from the net asset values and returns for shareholder processing. |
(2) | Redemption fees consisted of per share amounts of less than $0.01. |
(3) | Per share amounts calculated using the average shares method, which more appropriately presents the per share data for the period. |
(4) | This amount represents less than $0.01 per share. |
(5) | The amounts and sources of distributions reported in this report reflect the estimates in order to comply with SEC regulations and are not being provided for tax reporting purposes. The actual amounts and sources of the amounts for tax reporting purposes will depend upon the Fund’s investment experience during the remainder of its fiscal year and may be subject to changes based on tax regulations. The Fund will send you a Form 1099-DIV in early 2018 for the 2017 calendar year that will tell you how to report these distributions for federal income tax purposes (e.g., ordinary income, long-term capital gain or return of capital). |
(6) | Total returns would have been lower had certain expenses not been waived or absorbed by the Adviser. Returns shown do not include payment of a maximum sales load of 6.00% of offering price. If the sales charge was included total returns would be lower. |
(9) | The ratios of expenses and net investment income to average net assets do not reflect the Fund’s proportionate share of income and expenses of underlying investment companies in which the Fund invests. |
(10) | Represents the ratio of expenses to average net assets net of fee waivers and/or expense reimbursements by adviser. |
(11) | Recognition of net investment income by the Fund is affected by the timing of the declaration of dividends by the underlying investment companies in which the Fund invests. |
(12) | The Wildermuth Endowment Strategy Fund commenced operations on January 2, 2015 (inception date 12/31/2014). |
(13) | Realized and unrealized gain per share does not correlate to the aggregate of the net realized and unrealized gains on the Statement of Operations for the period ended December 31, 2015, primarily due to the timing of sales and repurchases of the Fund’s shares in relation to fluctuating market values for the Fund’s portfolio. |
See accompanying notes to financial statements.
18
Wildermuth Endowment Strategy Fund
Financial Highlights – Class C
Per share income and capital changes for a share outstanding throughout the period.
| | | For the six
months ended
June 30, 2017(1) (Unaudited) | | | For the
period ended
December 31,
2016(1)(10) | |
| | | | | | | |
| Net asset value, beginning of period | | $ | 11.73 | | | $ | 10.68 | |
| | | | | | | | | |
| Income from Investment Operations: | | | | | | | | |
Net investment loss(2) | | | (0.05 | ) | | | (0.07 | ) |
| Net realized and unrealized gain on investments | | | 0.59 | | | | 1.25 | |
| Total from investment operations | | | 0.54 | | | | 1.18 | |
| Less Distributions: | | | | | | | | |
| From return of capital | | | (0.13 | )(3) | | | (0.13 | ) |
| Total distributions | | | (0.13 | ) | | | (0.13 | ) |
| | | | | | | | | |
| Net asset value, end of period | | $ | 12.14 | | | $ | 11.73 | |
| | | | | | | | | |
Total return(4)(5) | | | 4.63 | % | | | 11.10 | % |
| | | | | | | | | |
| Ratios and Supplemental Data: | | | | | | | | |
| Net assets, end of period (in thousands) | | $ | 10,997 | | | $ | 4,951 | |
Ratio of expenses before waivers to average net assets(6)(7) | | | 4.09 | % | | | 5.63 | % |
Ratio of net expenses to average net assets(6)(7)(8) | | | 3.25 | % | | | 3.25 | % |
Ratio of net investment loss to average net assets(6)(7)(9) | | | (0.76 | %) | | | (0.77 | %) |
Portfolio turnover rate(5) | | | 26 | % | | | 55 | % |
(1) | Includes adjustments in accordance with accounting principles generally accepted in the United States and consequently, the net asset value for financial reporting purposes and the returns based upon those net asset values may differ from the net asset values and returns for shareholder processing. |
(2) | Per share amounts calculated using the average shares method, which more appropriately presents the per share data for the period. |
(3) | The amounts and sources of distributions reported in this report reflect the estimates in order to comply with SEC regulations and are not being provided for tax reporting purposes. The actual amounts and sources of the amounts for tax reporting purposes will depend upon the Fund’s investment experience during the remainder of its fiscal year and may be subject to changes based on tax regulations. The Fund will send you a Form 1099-DIV in early 2018 for the 2017 calendar year that will tell you how to report these distributions for federal income tax purposes (e.g., ordinary income, long-term capital gain or return of capital). |
(4) | Total returns would have been lower had certain expenses not been waived or absorbed by the Adviser. Returns shown do not include payment of a Contingent Deferred Sales Charge (“CDSC”) of 1.00% on any shares sold within 365 days of purchase. If the sales charge was included total returns would be lower. |
(7) | The ratios of expenses and net investment income to average net assets do not reflect the Fund’s proportionate share of income and expenses of underlying investment companies in which the Fund invests. |
(8) | Represents the ratio of expenses to average net assets net of fee waivers and/or expense reimbursements by adviser. |
(9) | Recognition of net investment income by the Fund is affected by the timing of the declaration of dividends by the underlying investment companies in which the Fund invests. |
(10) | Reflects operations for the period from March 14, 2016 (inception date) to December 31, 2016. |
See accompanying notes to financial statements.
19
Wildermuth Endowment Strategy Fund
Financial Highlights – Class I
Per share income and capital changes for a share outstanding throughout the period.
| | | For the
period ended
June 30, 2017(1)(2)
(Unaudited) | |
| | | | |
| Net asset value, beginning of period | | $ | 12.26 | |
| | | | | |
| Income from Investment Operations: | | | | |
Net investment income(3) | | | 0.01 | |
| Net realized and unrealized gain on investments | | | 0.08 | |
| Total from investment operations | | | 0.09 | |
| Less Distributions: | | | | |
| From return of capital | | | (0.08 | )(4) |
| Total distributions | | | (0.08 | ) |
| | | | | |
| Net asset value, end of period | | $ | 12.27 | |
| | | | | |
Total return(5) | | | 0.73 | % |
| | | | | |
| Ratios and Supplemental Data: | | | | |
| Net assets, end of period (in thousands) | | $ | 14 | |
Ratio of expenses before waivers to average net assets(6)(7) | | | 3.65 | % |
Ratio of net expenses to average net assets(6)(7)(8) | | | 2.25 | % |
Ratio of net investment Income to average net assets(6)(7)(9) | | | 0.34 | % |
Portfolio turnover rate(5) | | | 26 | % |
(1) | Reflects operations for the period from April 28, 2017 (inception date) to June 30, 2017. |
(2) | Includes adjustments in accordance with accounting principles generally accepted in the United States and consequently, the net asset value for financial reporting purposes and the returns based upon those net asset values may differ from the net asset values and returns for shareholder processing. |
(3) | Per share amounts calculated using the average shares method, which more appropriately presents the per share data for the period. |
(4) | The amounts and sources of distributions reported in this report reflect the estimates in order to comply with SEC regulations and are not being provided for tax reporting purposes. The actual amounts and sources of the amounts for tax reporting purposes will depend upon the Fund’s investment experience during the remainder of its fiscal year and may be subject to changes based on tax regulations. The Fund will send you a Form 1099-DIV in early 2018 for the 2017 calendar year that will tell you how to report these distributions for federal income tax purposes (e.g., ordinary income, long-term capital gain or return of capital). |
(7) | The ratios of expenses and net investment income to average net assets do not reflect the Fund’s proportionate share of income and expenses of underlying investment companies in which the Fund invests. |
(8) | Represents the ratio of expenses to average net assets net of fee waivers and/or expense reimbursements by adviser. |
(9) | Recognition of net investment income by the Fund is affected by the timing of the declaration of dividends by the underlying investment companies in which the Fund invests. |
See accompanying notes to financial statements.
20
Wildermuth Endowment Strategy Fund
Notes to Financial Statements
June 30, 2017 (Unaudited)
1. ORGANIZATION
Wildermuth Endowment Strategy Fund (the “Fund”) is registered under the Investment Company Act of 1940, as amended (the “1940 Act”), as a non-diversified, closed-end management investment company that is operated as an interval fund. The Fund was organized as a Delaware statutory trust on August 28, 2013, and did not have any operations from that date until December 31, 2014, other than those relating to organizational matters and registration of its shares under applicable securities law. The Fund commenced operations on January 2, 2015. The Fund’s investment objective is to seek total return through a combination of long-term capital appreciation and income generation. The Fund will pursue its objective by investing in assets that Wildermuth Advisory, LLC (the “Adviser”) believes provide favorable long-term capital appreciation and risk-adjusted return potential, as well as in income-producing assets that the Adviser believes will provide consistent income generation and liquidity.
The Fund is engaged in a continuous offering, up to a maximum of 25 million shares of beneficial interest, and will operate as an interval fund that will offer to make quarterly repurchases of shares at the Fund’s net asset value (“NAV”). The Fund currently offers three different classes of shares: Class A, Class C, and Class I shares.
2. SUMMARY OF SIGNIFICANT ACCOUNTING POLICIES
The following is a summary of significant accounting policies followed by the Fund in the preparation of its financial statements. These policies are in conformity with accounting principles generally accepted in the United States of America (“GAAP”). The preparation of financial statements requires management to make estimates and assumptions that affect the reported amounts of assets and liabilities and disclosure of contingent assets and liabilities at the date of the financial statements and the reported amounts of income and expenses for the period. Actual results could differ from those estimates. The Fund is an investment company and follows the accounting and reporting requirements under Financial Accounting Standards Board (“FASB”) Accounting Standards (“ASC”) Topic 946, Financials Services – Investment Companies.
Investment Valuation – For purposes of determining the NAV of the Fund, and as applicable, readily marketable portfolio securities listed on the NYSE are valued, except as indicated below, at the last sale price reflected on the consolidated tape at the close of the NYSE on the business day as of which such value is being determined. If there has been no sale on such day, the securities are valued at the mean of the closing bid and asked prices on such day. If no bid or asked prices are quoted on such day or if market prices may be unreliable because of events occurring after the close of trading, then the security is valued by such method as the Fair Value Committee shall determine in good faith to reflect its fair market value. Readily marketable securities not listed on the NYSE but listed on other domestic or foreign securities exchanges are valued in a like manner. Portfolio securities traded on more than one securities exchange are valued at the last sale price on the business day as of which such value is being determined as reflected on the consolidated tape at the close of the exchange representing the principal market for such securities. Securities trading on NASDAQ are valued at the closing price, or, in the case of securities not reported by NASDAQ, a comparable source, as the Fair Value Committee deems appropriate to reflect their fair market value. If there has been no sale on such day, the securities are valued at the mean of the closing bid and asked prices for the day, or if no asked price is available, at the bid price. However, certain debt securities may be valued on the basis of prices provided by a pricing service based on broker or dealer supplied valuations or matrix pricing, a method of valuing securities by reference to the value of other securities with similar characteristics, such as rating, interest rate and maturity.
The “last reported” trade price or sale price or “closing” bid price of a security on any trading day shall be deemed to be: (a) with respect to securities traded primarily on the NYSE, the American Stock Exchange or NASDAQ, the last reported trade price or sale price, as the case may be, as of 4:00 p.m., Eastern Time, on that day, and (b) for securities listed, traded or quoted on any other exchange, market, system or service, the market price as of the end of the “regular hours” trading period that is generally accepted as such by such exchange, market, system or service. If, in the future, the benchmark times generally accepted in the securities industry for determining the market price of a stock as of a given trading day shall change from those set forth above, the fair market value of a security shall be determined as of such other generally accepted benchmark times.
Non-dollar-denominated securities, if any, are valued as of the close of the NYSE at the closing price of such securities in their principal trading market, but may be valued at fair value if subsequent events occurring before the computation of NAV have materially affected the value of the securities. Trading may take place in foreign issues held by the Fund, if any, at times when the Fund is not open for business. As a result, the Fund’s NAV may change at times when it is not possible to purchase or sell shares of the Fund.
21
Wildermuth Endowment Strategy Fund
Notes to Financial Statements - Continued
June 30, 2017 (Unaudited)
If market quotations are not readily available, securities are valued at fair values as determined in good faith by the Board of Trustees (the “Board”). The Board has delegated the day-to-day responsibility for determining these fair values in accordance with the policies it has approved to the Fair Value Committee, subject to Valuation Committee and ultimately Board oversight. The Fair Value Committee will provide the Board with periodic reports, no less frequently than quarterly, that discuss the functioning of the valuation process, if applicable to that period, and that identify issues and valuations problems that have arisen, if any. As appropriate, the Valuation Committee and the Board will review any securities valued by the Fair Value Committee in accordance with the Fund’s valuation policies during these periodic reports.
Investments in privately placed debt instruments initially will be valued at cost (purchase price plus all related acquisition costs and expenses, such as legal fees and closing costs) and thereafter will be revalued quarterly at fair value.
Investment Funds that are Private Funds and Non-Traded REITs (“Non-Traded Funds”) will be difficult to value, particularly to the extent that their underlying investments are not publicly traded. In the event a Non-Traded Fund does not report a value to the Fund on a timely basis, the Fair Value Committee, acting under the Valuation Committee and ultimately the Board’s supervision and pursuant to policies implemented by the Board, will determine the fair value of the Fund’s investment based on the most recent value reported by the Non-Traded Fund, as well as any other relevant information available at the time the Fund values its investments. Following procedures adopted by the Board, in the absence of specific transaction activity in a particular investment fund, the Fair Value Committee will consider whether it is appropriate, in light of all relevant circumstances, to value the Fund’s investment at the NAV reported by the Non-Traded Fund at the time of valuation or to adjust the value to reflect a premium or discount.
There is no single standard for determining fair value of a security. Rather, the Fair Value Committee’s fair value calculations will involve significant professional judgment in the application of both observable and unobservable attributes. In determining the fair value of a security for which there are no readily available market quotations, the Fair Value Committee, acting under the Valuation Committee and ultimately the Board’s supervision and pursuant to policies implemented by the Board, may consider several factors, including, but not limited to: (i) the nature and pricing history (if any) of the security; (ii) whether any dealer quotations for the security are available; (iii) possible valuation methodologies that could be used to determine the fair value of the security; (iv) the recommendation of the portfolio manager of the Fund with respect to the valuation of the security; (v) whether the same or similar securities are held by other accounts managed by the Adviser and the method used to price the security in those accounts; (vi) the extent to which the fair value to be determined for the security will result from the use of data or formula produced by third parties independent of the Fund; and (vii) the liquidity or illiquidity of the market for the security. Based on its review of all relevant information, the Fair Value Committee may conclude in certain circumstances that the information provided by the asset manager and/or issuer of a Non-Traded Fund does not represent the fair value of the Fund’s investment in such security.
Because any Corporate Subsidiary through which the Fund invests in private equity investments or private oil and gas funds is treated as a regular taxable corporation, for U.S. federal income tax purposes any Corporate Subsidiary will incur tax expenses. Any Corporate Subsidiary used by the Fund will accrue, in accordance with generally accepted accounting principles, a deferred income tax liability balance at the currently effective maximum statutory U.S. federal income tax rate (currently 35%) plus an assumed state and local income tax rate, for its future tax liability associated with the capital appreciation of its investments and the distributions received on equity securities considered to be return of capital. In calculating its Daily NAV, the Fund will, among other things, account for any Corporate Subsidiary’s deferred tax liability and/or asset balances. Any deferred tax liability balance of any Corporate Subsidiary used by the Fund will reduce the Fund’s NAV.
GAAP defines fair value, establishes a three-tier framework for measuring fair value based on a hierarchy of inputs, and expands disclosure about fair value measurements. It also provides guidance on determining when there has been a significant decrease in the volume and level of activity for an asset or liability, when a transaction is not orderly and how that information must be incorporated into a fair value measurement. The hierarchy distinguishes between market data obtained from independent sources (observable inputs) and the Fund’s own market assumptions (unobservable inputs). These inputs are used in determining the fair value of the Fund’s investments. These inputs are summarized in the three broad levels listed below:
| | ● | Level 1 – quoted prices in active markets for identical securities. An active market for the security is a market in which transactions occur with sufficient frequency and volume to provide pricing information on an ongoing basis. A quoted price in an active market provides the most reliable evidence of fair value. |
22
Wildermuth Endowment Strategy Fund
Notes to Financial Statements - Continued
June 30, 2017 (Unaudited)
| | ● | Level 2 – other significant observable inputs (including quoted prices for similar securities, interest rates, prepayment speeds, credit risk, etc. and quoted prices for identical or similar assets in markets that are not active.) Inputs that are derived principally from or corroborated by observable market data. An adjustment to any observable input that is significant to the fair value may render the measurement a Level 3 measurement. |
| | ● | Level 3 – significant unobservable inputs, including the Fund’s own assumptions in determining the fair value of investments. |
The availability of observable inputs can vary from security to security and is affected by a wide variety of factors, including, for example, the type of security, whether the security is new and not yet established in the marketplace, the liquidity of markets, and other characteristics particular to the security. To the extent that valuation is based on models or inputs that are less observable or unobservable in the market, the determination of fair value requires more judgment. Accordingly, the degree of judgment exercised in determining fair value is greatest for instruments categorized in Level 3.
The inputs used to measure fair value may fall into different levels of the fair value hierarchy. In such cases, for disclosure purposes, the level in the fair value hierarchy within which the fair value measurement falls in its entirety is determined based on the lowest level input that is significant to the fair value measurement in its entirety.
The inputs or methodology used for valuing securities are not necessarily an indication of the risk associated with investing in those securities. The following is a summary of the valuation inputs, representing 100% of the Fund’s investments, used to value the Fund’s assets and liabilities as of June 30, 2017:
| | | | | | Fair Value Measurements at the
End of the Reporting Period Using | | | | |
| Investment in Securities | | Practical
Expedient** | | | Level 1
Quoted Prices | | | Level 2
Other Significant Observable Inputs | | | Level 3
Significant Unobservable Inputs | | | Total | |
| Security Type | | | | | | | | | | | | | | | |
| Common Stock* | | $ | — | | | $ | 15,784,028 | | | $ | — | | | $ | — | | | $ | 15,784,028 | |
| Exchange Traded Funds* | | | — | | | | 9,614,008 | | | | — | | | | — | | | | 9,614,008 | |
| Commodity & Natural Resource Investments | | | 1,588,313 | (1)(6)(7) | | | — | | | | — | | | | 856,834 | | | | 2,445,147 | |
| Hedge Funds | | | 4,856,235 | (2)(6)(7) | | | — | | | | — | | | | — | | | | 4,856,235 | |
| Private Debt | | | — | | | | — | | | | — | | | | 2,590,000 | | | | 2,590,000 | |
| Private Equity | | | 842,826 | (3)(6)(7) | | | — | | | | — | | | | 6,970,018 | | | | 7,812,844 | |
| Public Non-Traded Business Development Companies | | | — | | | | — | | | | — | | | | 741,191 | | | | 741,191 | |
| Private Real Estate Investments | | | 1,501,743 | (4)(6)(7) | | | — | | | | — | | | | 4,358,016 | | | | 5,859,759 | |
| Public Real Estate Investments* | | | — | | | | — | | | | — | | | | 1,206,532 | | | | 1,206,532 | |
| Real Estate Loans | | | 1,700,000 | (5)(7) | | | — | | | | — | | | | — | | | | 1,700,000 | |
| Short Term Investments | | | — | | | | 2,332,987 | | | | — | | | | — | | | | 2,332,987 | |
| Total | | $ | 10,489,117 | | | $ | 27,731,023 | | | $ | — | | | $ | 16,722,591 | | | $ | 54,942,731 | |
| * | All sub-categories within the security type represent their respective evaluation status. For a detailed breakout by industry, please refer to the Schedule of Investments. |
| ** | Certain investments that are measured at fair value using the net asset value per share (or its equivalent) practical expedient have not been categorized in the fair value hierarchy. The fair value amounts presented in this table are intended to permit reconciliation of the fair value hierarchy to the amounts presented in the schedule of investments. |
23
Wildermuth Endowment Strategy Fund
Notes to Financial Statements - Continued
June 30, 2017 (Unaudited)
(1) | Security | Withdrawals Permitted | Redemption Notice Period | Investment Objective | Investment Strategy | Lock Up Period |
| | Kayne Anderson Energy Fund VII | Not
Applicable | Not
Applicable | Capital Gains | Purchase oil and gas; extraction and production companies. | None |
| | | | | | | |
(2) | Security | Withdrawals Permitted | Redemption Notice Period | Investment Objective | Investment Strategy | Lock Up Period |
| | Condire Resource Partners LP | Quarterly | 45 days | Capital Gains | Long/short mining and energy | 12 months |
| | Direct Lending Income Fund LP | Quarterly | 35 days | Current Income | Buying existing small business loans | None |
| | Esulep LLC Permo Fund | Monthly | 21 days | Capital Gains | S&P futures and options spreads | None |
| | Rosebrook Opportunities Fund LP | Quarterly | Not Applicable | Capital Appreciation | Buying distressed hedge fund assets | None |
| | | | | | | |
(3) | Security | Withdrawals Permitted | Redemption Notice Period | Investment Objective | Investment Strategy | Lock Up Period |
| | Abbot Secondary Opportunities LP | Not
Applicable | Not
Applicable | Capital Gains | Purchase private equity funds on secondary market | None |
| | Star Mountain Diversified Small Business Access Fund II LP | Not
Applicable | Not
Applicable | Capital Appreciation | Structured Credit | None |
| | | | | | | |
(4) | Security | Withdrawals Permitted | Redemption Notice Period | Investment Objective | Investment Strategy | Lock Up Period |
| | Harbert Seniors Housing Fund I LP | Quarterly | Not
Applicable | Income and Capital Appreciation | Real Estate | None |
| | PCG Select Series I LLC - Series A Preferred Stock | Not
Applicable | Not
Applicable | Income | Real Estate Loans | None |
| | | | | | | |
(5) | Security | Withdrawals Permitted | Redemption Notice Period | Investment Objective | Investment Strategy | Lock Up Period |
| | Airport Center Development Partners, LLC | Not
Applicable | Not
Applicable | Income | Real Estate Loans | None |
| | Dog Wood Park of Northeast Florida, LLC | Not
Applicable | Not
Applicable | Income | Real Estate Loans | None |
| | Hauiki Hui, LLC | Not
Applicable | Not
Applicable | Income | Real Estate Loans | None |
| | Saratoga Springs Partners, LLC | Not
Applicable | Not
Applicable | Income | Real Estate Loans | None |
(6) | Redemption frequency and redemption notice period reflect general redemption terms, and exclude liquidity restrictions. Different tranches may have different liquidity terms and may be subject to investor level gates. |
(7) | These investments are domiciled in the United States. |
For the period ended June 30, 2017, there were no transfers in and out of Level 1 and Level 2 or into Level 3. The transfers out of Level 3 in the following table represent securities now being valued using net asset value per share practical expedient, which is not included in the fair value measurement hierarchy. It is the Fund’s policy to recognize transfers into and out of all Levels at the end of the reporting period.
24
Wildermuth Endowment Strategy Fund
Notes to Financial Statements - Continued
June 30, 2017 (Unaudited)
The following is a roll forward of the activity in investments in which significant unobservable inputs (Level 3) were used in determining fair value on a recurring basis:
| | | Beginning balance January 1, 2017 | | | Transfers into
Level 3 during the period | | | Transfers out of
Level 3 during the period | | | Purchases | | | Sales or Conversions | | | Net realized gain | | | Return of Capital | | | Tax Basis Adjustments | | | Change
in net unrealized gain | | | Ending balance
June 30,
2017 | |
| Commodity & Natural Resource Investments | | $ | 856,834 | | | $ | — | | | $ | — | | | $ | — | | | $ | — | | | $ | — | | | $ | — | | | $ | — | | | $ | — | | | $ | 856,834 | |
| Private Debt | | | — | | | | — | | | | — | | | | 2,518,860 | | | | — | | | | — | | | | — | | | | — | | | | 71,140 | | | | 2,590,000 | |
| Private Equity | | | 5,089,793 | | | | — | | | | — | | | | 1,314,399 | | | | — | | | | — | | | | — | | | | — | | | | 565,826 | | | | 6,970,018 | |
| Public Non-Traded Business Development Companies | | | 718,716 | | | | — | | | | — | | | | — | | | | — | | | | — | | | | — | | | | (1,241 | ) | | | 23,716 | | | | 741,191 | |
| Private Real Estate Investments | | | 4,953,388 | | | | — | | | | (800,000 | ) | | | 252,191 | | | | — | | | | — | | | | (115,117 | ) | | | (50,009 | ) | | | 117,563 | | | | 4,358,016 | |
| Public Real Estate Investments | | | 1,776,721 | | | | — | | | | — | | | | — | | | | (334,163 | )* | | | — | | | | (102,131 | ) | | | (6,572 | ) | | | (127,323 | ) | | | 1,206,532 | |
| | | $ | 13,395,452 | | | $ | — | | | $ | (800,000 | ) | | $ | 4,085,450 | | | $ | (334,163 | ) | | $ | — | | | $ | (217,248 | ) | | $ | (57,822 | ) | | $ | 650,922 | | | $ | 16,722,591 | |
| * | Represents $334,163 in public real estate investments, which along with an accumulated loss of $36,432, was converted to common stock. |
The change in net unrealized gain included in the Statement of Operations attributable to Level 3 investments as of June 30, 2017 is $650,922.
The following is a summary of quantitative information about significant unobservable valuation inputs for Level 3 Fair Value Measurements for investments held as of June 30, 2017:
| Type of Level 3 Investment | | Fair Value as of
June 30, 2017 | | Valuation Technique | Unobservable Inputs |
Commodity & Natural
Resource Investments | | $ | 856,834 | | Private Transaction Cost | Not Applicable* |
| Private Equity | | $ | 6,970,018 | | Private Transaction Cost, Option Pricing Method** | Not Applicable* |
Public Non- Traded Business
Development Companies | | $ | 741,191 | | Current Value Method*** | Not Applicable* |
| Private Real Estate Investments | | $ | 4,358,016 | | Private Transaction Cost | Not Applicable* |
| Public Real Estate Investments | | $ | 1,206,532 | | Current Value Method*** | Not Applicable* |
| Private Debt | | $ | 2,590,000 | | Private Transaction Cost | Not Applicable* |
| * | Financial information is not prepared in accordance with GAAP or ASC Topic 946 |
| ** | Relies on financial option theory to allocate value among difference classes of members’ equity based upon a future option “claim” on value. Under this method, the values of the various classes of stock are estimated as the net value of a series of call options, representing the present value of the expected future returns to the shareholders. |
| *** | The Current Value Method, also referred to as the “Waterfall Method,” is based on allocating the Enterprise Value (individual assets net of liabilities) across the various classes of securities, in conformance with liquidation preferences and conversion values. |
Security Transactions and Related Income – Security transactions are accounted for on trade date basis. Interest income is recognized on an accrual basis. Discounts are accreted and premiums are amortized on securities purchased over the lives of the respective securities. Dividend income is recorded on the ex-dividend date. Realized gains or losses from sales of securities are determined by comparing the identified cost of the security lot sold with the net sales proceeds.
25
Wildermuth Endowment Strategy Fund
Notes to Financial Statements - Continued
June 30, 2017 (Unaudited)
Dividends and Distributions to Shareholders – Dividends from gross investment income are declared and distributed quarterly. Distributable net realized capital gains are declared and distributed annually. Dividends from gross investment income and distributions from net realized gains are recorded on ex- dividend date and determined in accordance with federal income tax regulations, which may differ from GAAP. These “book/tax” differences are considered either temporary (i.e., deferred losses, capital loss carry forwards) or permanent in nature. To the extent these differences are permanent in nature, such amounts are reclassified within the composition of net assets based on their federal tax-basis treatment; temporary differences do not require reclassification.
Distributions received from investments in securities that represent a return of capital or capital gains are recorded as a reduction of cost of investment or as a realized gain, respectively. The calendar year-end amounts of ordinary income, capital gains, and return of capital included in distributions received from the Fund’s investments in real estate investment trusts (“REITs”) are reported to the Fund after the end of the calendar year; accordingly, the Fund estimates these amounts for accounting purposes until the characterization of REIT distributions is reported to the Fund after the end of the calendar year. Estimates are based on the most recent REIT distribution information available.
Investment Companies – The Fund may obtain investment exposure to various asset classes by investing in other investment companies, including registered investment companies, such as ETFs, mutual funds and closed-end funds, as well as hedge funds, private equity funds or other privately offered pooled investment vehicles that are not registered under the 1940 Act (collectively “Investment Funds”). Each Investment Fund is subject to specific risks, depending on the nature of the fund. These risks could include liquidity risk, sector risk, and foreign currency risk, as well as risks associated with fixed income securities and commodities among others. Also, the Fund’s performance depends in part upon the performance of the Investment Fund managers and selected strategies, the adherence by such Investment Fund managers to such selected strategies, the instruments used by such Investment Fund managers and the Adviser’s ability to select Investment Funds and strategies and effectively allocate Fund assets among them. By investing in Investment Funds indirectly through the Fund, the investor bears asset-based fees at the Fund level, in addition to any asset-based fees and/or performance-based fees and allocations at the Investment Fund level. Moreover, an investor in the Fund bears a proportionate share of the fees and expenses of the Fund (including organizational and offering expenses, operating costs, sales charges, brokerage transaction expenses, and administrative fees) and, indirectly, similar expenses of the Investment Funds. Thus, an investor in the Fund may be subject to higher fees and operating expenses than if he or she invested in an Investment Fund directly.
Federal Income Taxes – It is the Fund’s policy to qualify as a regulated investment company by complying with the provisions of the Internal Revenue Code that are applicable to regulated investment companies and to distribute substantially all of its taxable income and net realized gains to shareholders. Therefore, no federal income tax provision has been recorded.
The Fund recognizes the tax benefits of uncertain tax positions only where the position is “more likely than not” to be sustained assuming examination by tax authorities. Management has analyzed the Fund’s tax positions, and has concluded that no liability for unrecognized tax benefits should be recorded related to uncertain tax positions taken or expected to be taken on returns filed for open tax years 2015 and 2016. The Fund identifies its major tax jurisdictions as U.S. federal, and foreign jurisdictions where the Fund makes significant investments; however, the Fund is not aware of any tax positions for which it is reasonably possible that the total amounts of unrecognized tax benefits will change materially in the next twelve months.
Redemption Fee – For shares held for 90 days or less, the Fund will deduct a 2% redemption fee from the redemption amount if the shares are sold pursuant to the Fund’s quarterly repurchase program. Shares held longest will be treated as being repurchased first and shares held shortest as being repurchased last. The redemption fee does not apply to shares that were acquired through reinvestment of distributions. Shares held for more than 90 days are not subject to the 2% fee. Redemption fees are paid to the Fund directly and are designed to offset costs associated with fluctuations in Fund asset levels and cash flow caused by short-term shareholder trading. For the period ended June 30, 2017, the Fund had contributions to capital due to redemption fees in the amount of $1,465.
Indemnification – The Fund indemnifies its officers and trustees for certain liabilities that may arise from the performance of their duties to the Fund. Additionally, in the normal course of business, the Fund enters into contracts that contain a variety of representations and warranties and which provide general indemnities. The Fund’s maximum exposure under these arrangements is unknown, as this would involve future claims that may be made against the Fund that have not yet occurred. However, based on industry experience, the risk of loss due to these warranties and indemnities appears to be remote.
Foreign Currency Translation – The accounting records of the Fund are maintained in U.S. dollars. All assets and liabilities denominated in foreign currencies are translated into U.S. dollars based on the rate of exchange of such currencies against U.S. dollars on the date of valuation. Purchases and sales of securities, income, and expenses are translated at the rate of exchange quoted on the respective date
26
Wildermuth Endowment Strategy Fund
Notes to Financial Statements - Continued
June 30, 2017 (Unaudited)
that such transactions are recorded. The Fund does not isolate that portion of the results of operations resulting from changes in foreign exchange rates on investments from the fluctuations arising from changes in market prices of securities held. Such fluctuations are included with the net realized and unrealized gain or loss from investments.
Reported net realized foreign exchange gains or losses arise from sales of portfolio securities, sales and maturities of short-term securities, sales of foreign currencies, currency gains or losses realized between the trade and settlement dates on securities transactions, and the difference between the amounts of dividends, interest, and foreign withholding taxes recorded on the Fund’s books and the U.S. dollar equivalent of the amounts actually received or paid. Net unrealized foreign exchange gains and losses arise from changes in the value of assets and liabilities other than investments in securities at each reporting period, resulting from changes in the exchange rate.
3. INVESTMENT TRANSACTIONS
The cost of purchases and proceeds from the sale of securities, other than short-term investments, for the period ended June 30, 2017, amounted to $28,266,944 and $10,977,255, respectively.
4. ADVISORY FEE AND OTHER FUND TRANSACTIONS
Advisory Fees – The Adviser is entitled to receive a monthly fee equal to the annual rate of 1.50% of the Fund’s average daily net assets. For the period ended June 30, 2017, the Adviser earned $339,635 in advisory fees.
Expense limitation agreement – The Adviser and the Fund have entered into an expense limitation and reimbursement agreement (the “Expense Limitation Agreement”) under which the Adviser has agreed contractually to waive its fees and to pay or absorb the direct, ordinary operating expenses of the Fund (including offering and organizational expenses but excluding front-end or contingent deferred loads, brokerage fees and commissions, acquired fund fees and expenses, borrowing costs (such as interest and dividend expenses on securities sold short), taxes and extraordinary expenses such as litigation), to the extent that they exceed 2.50%, 3.25%, and 2.25% per annum of the Fund’s average daily net assets attributable to Class A, Class C, and Class I shares (the “Expense Limitation”), respectively, through April 30, 2018. In consideration of the Adviser’s agreement to limit the Fund’s expenses, the Fund has agreed to repay the Adviser in the amount of any fees waived and Fund expenses paid or absorbed. Any waiver or reimbursement of fees by the Adviser is subject to repayment by the Fund within three years following such waiver or reimbursement; provided, however, that (i) the Fund is able to make such repayment without exceeding the expense limitation in place at the time the fees being repaid were waived or the Fund’s current expense limitation, whichever is lower, and (ii) such repayment is approved by the Fund’s Board of Trustees. The Expense Limitation Agreement will remain in effect for successive twelve-month periods provided that such continuance is specifically approved at least annually by the Board of Trustees. The Expense Limitation Agreement may be terminated only by the Fund’s Board on 60 days’ written notice to the Adviser. During the period ended June 30, 2017, the Adviser did not recoup any expenses. At June 30, 2017, $73,173 is subject to recoupment through December 31, 2017, $703,853 through December 31, 2018, $525,023 through December 31, 2019, and $195,841 through December 31, 2020, to the extent the Expense Limitation Agreement is still in effect.
Distribution Agreement – The Fund has adopted a Distribution Agreement (the “Agreement”). The Agreement provides that a monthly distribution fee is calculated at an annual rate equal to 0.75% of the Fund’s average daily net assets attributable to Class C. Class A and Class I shares are not currently subject to a distribution fee. For the period ended June 30, 2017, $28,963 had been accrued for Class C distribution fees.
Shareholder Services Plan – The Fund has adopted a Shareholder Services Plan and Agreement (the “Plan). The Plan provides that a monthly service fee is calculated up to an annual rate equal to 0.25% of average daily net assets separately attributable to Class A and Class C shares. Class I shares are not included under the Plan and are not subject to a 0.25% average daily net asset fee. For the period ended June 30, 2017, Class A had accrued $46,946 in shareholder service fees and Class C had accrued $9,654.
Trustees – Each Independent Trustee receives a retainer of $5,000 per year, plus $2,500 for each board or board committee meeting the trustee attends in person ($3,000 for attendance by the chairperson of the audit committee at each meeting of the audit committee), or $500 for each meeting the trustee attends telephonically. If there is a meeting of the Board and one or more committees in a single day, the fees will be limited to $3,000 per day ($3,500 for the chairperson of the audit committee if there is a meeting of such committee) for
27
Wildermuth Endowment Strategy Fund
Notes to Financial Statements - Continued
June 30, 2017 (Unaudited)
an in person meeting and $750 ($1,000 for the chairperson of the audit committee if there is a meeting of such committee) for meetings attended telephonically. No “interested persons” who serve as Trustees of the Fund received any compensation for their services as Trustees. None of the executive officers received compensation from the Fund.
5. FEDERAL TAX INFORMATION
At December 31, 2016, gross unrealized appreciation and depreciation on investments based on cost for federal income tax purposes were as follows:
| Cost of investments | | $ | 33,164,338 | |
| Gross unrealized appreciation | | $ | 3,454,348 | |
| Gross unrealized depreciation | | | (696,005 | ) |
| Net unrealized appreciation on investments | | $ | 2,758,343 | |
The difference between cost amounts for financial statement and federal income tax purposes is due primarily to timing differences in recognizing certain gains and losses in security transactions and investments in partnerships.
As of December 31, 2016, the components of accumulated earnings (deficit) on a tax basis were as follows:
| Undistributed ordinary income | | $ | — | |
| Undistributed long-term gains | | | — | |
| Tax accumulated earnings | | | — | |
| Accumulated capital and other losses | | | (139,770 | ) |
| Net unrealized appreciation on investments | | | 2,758,343 | |
| Net unrealized depreciation on foreign currency translations | | | (25 | ) |
| Total accumulated earnings/(deficit) | | $ | 2,618,548 | |
The tax character of distributions paid during the fiscal years ended December 31, 2016 and December 31, 2015 were as follows:
| | | 2016 | | | 2015 | |
| Distributions paid from: | | | | | | |
| Ordinary income | | $ | — | | | $ | 10,989 | |
| Long-term capital gains | | | — | | | | — | |
| Return of capital | | | 379,066 | | | | 135,124 | |
| Total distributions paid | | $ | 379,066 | | | $ | 146,113 | |
As of December 31, 2016, the Fund had net capital loss carryovers as follows:
| Not subject to expiration: | | | |
| Short Term | | $ | 117,992 | |
| Long Term | | | 21,778 | |
| | | $ | 139,770 | |
Capital loss carryovers are available to offset future realized capital gains and thereby reduce further taxable gain distributions.
28
Wildermuth Endowment Strategy Fund
Notes to Financial Statements - Continued
June 30, 2017 (Unaudited)
6. REPURCHASE OFFERS
Pursuant to Rule 23c 3 under the Investment Company Act of 1940, as amended, the Fund offers shareholders on a quarterly basis the option of redeeming shares, at net asset value, of no less than 5% and no more than 25% of the shares outstanding. There is no guarantee that shareholders will be able to sell all of the shares they desire in a quarterly repurchase offer, although each shareholder will have the right to require the Fund to purchase up to and including 5% of such shareholder’s shares in each quarterly repurchase. Limited liquidity will be provided to shareholders only through the Fund’s quarterly repurchases.
During the period ended June 30, 2017, the Fund completed four quarterly repurchase offers. In those offers, the Fund offered to repurchase up to 5% of the number of its outstanding shares as of the Repurchase Pricing Dates. The results of those repurchase offers were as follows:
| Repurchase Pricing Date | | February 1, 2017 | | | May 1, 2017 | |
| % of Shares Offered - Total Fund | | | 5.00 | % | | | 5.00 | % |
| Number of Shares Offered - Total Fund | | | 164,990 | | | | 198,691 | |
| Pricing Date Net Asset Value - Class A | | $ | 11.96 | | | $ | 12.27 | |
| Pricing Date Net Asset Value - Class C | | $ | 11.87 | | | $ | 12.16 | |
| Pricing Date Net Asset Value - Class I | | Not Applicable | | | $ | 12.27 | |
| Number of Shares Tendered - Class A | | | 42,412 | | | | 62,602 | |
| Number of Shares Tendered - Class C | | | 5,596 | | | | 1,143 | |
| Number of Shares Tendered - Class I | | Not Applicable | | | | — | |
| % of Shares Tendered - Total Fund | | | 1.45 | % | | | 1.60 | % |
7. INVESTMENT IN RESTRICTED SECURITIES
Restricted securities include securities that have not been registered under the Securities Act of 1933, as amended, and securities that are subject to restrictions on resale. The Fund may invest in restricted securities that are consistent with the Fund’s investment objectives and investment strategies. Investments in restricted securities are valued at fair value as determined in good faith in accordance with procedures adopted by the Board of Trustees. It is possible that the estimated value may differ significantly from the amount that might ultimately be realized in the near term, and the difference could be material.
Additional information on each illiquid restricted security held by the Fund on June 30, 2017 is as follows:
| Security | Initial
Acquisition Date | | Shares or Principal | | | Cost | | | Value | | | % of
Net Assets | |
| Abbott Secondary Opportunities LP | April 13, 2017 | | | 350,000 | | | $ | 363,611 | | | $ | 363,611 | | | | 0.66 | % |
| Airport Center Development Partners, LLC 9.50%, 9/17/2018 | March 21, 2017 | | | 400,000 | | | | 378,000 | | | | 400,000 | | | | 0.72 | % |
| ARCTRUST, Inc. | June 30, 2016 | | | 95,075 | | | | 1,134,951 | | | | 1,348,168 | | | | 2.43 | % |
| Atlanta Healthcare Property Consultants, LLC 12.00%, 8/19/2017 | May 19, 2017 | | | 500,000 | | | | 506,926 | | | | 530,000 | | | | 0.96 | % |
| Atlas Fintech Holdings Corp. | December 20, 2016 | | | 100 | | | | 1,000,000 | | | | 1,150,000 | | | | 2.07 | % |
| Behringer Harvard Opportunity | February 17, 2015 | | | 111,521 | | | | 237,920 | | | | 209,659 | | | | 0.38 | % |
| Casillas Petroleum Resource Partners, LLC | October 11, 2016 | | | 857 | | | | 856,834 | | | | 856,834 | | | | 1.54 | % |
| Clear Guide Medical, Inc. | April 19, 2016 | | | 2,500 | | | | 2,250,000 | | | | 2,989,100 | | | | 5.38 | % |
29
Wildermuth Endowment Strategy Fund
Notes to Financial Statements - Continued
June 30, 2017 (Unaudited)
| Security | Initial
Acquisition Date | | Shares or Principal | | | Cost | | | Value | | | % of
Net Assets | |
| Committed Advisors Secondary Fund III | March 30, 2017 | | | 288,560 | | | $ | 319,472 | | | $ | 382,042 | | | | 0.69 | % |
| Condire Resource Partners LP | May 30, 2017 | | | 1,000 | | | | 1,000,000 | | | | 1,000,000 | | | | 1.80 | % |
| Cottonwood Residential, Inc. | February 17, 2015 | | | 101,470 | | | | 1,474,166 | | | | 1,714,843 | | | | 3.09 | % |
| Direct Lending Income Fund LP | April 29, 2016 | | | 1,625,000 | | | | 1,625,000 | | | | 1,723,375 | | | | 3.10 | % |
| Dividend Capital Diversified | June 2, 2015 | | | 18,060 | | | | 104,817 | | | | 135,454 | | | | 0.24 | % |
| Doctor's Hospice of Georgia, Inc., 12.00%, 9/13/2017 | June 13, 2017 | | | 1,000,000 | | | | 1,011,934 | | | | 1,060,000 | | | | 1.91 | % |
| Dog Wood Park of Northeast Florida, LLC, 3.50%, 3/21/2018 | March 21, 2017 | | | 400,000 | | | | 382,000 | | | | 400,000 | | | | 0.72 | % |
| Esulep LLC Permo Fund | May 24, 2017 | | | 1,000 | | | | 1,000,000 | | | | 1,000,000 | | | | 1.80 | % |
Franklin Square
Energy & Power Fund | April 19, 2016 | | | 95,638 | | | | 642,607 | | | | 741,191 | | | | 1.33 | % |
| GPB Automotive Portfolio LP | March 13, 2015 | | | 10 | | | | 500,000 | | | | 500,696 | | | | 0.90 | % |
| Gravity Ranch Fund I LP | June 13, 2017 | | | 500 | | | | 500,000 | | | | 500,000 | | | | 0.90 | % |
| Harbert Seniors Housing Fund I LP | February 24, 2017 | | | 621,841 | | | | 664,878 | | | | 701,743 | | | | 1.26 | % |
| Hauiki Hui, LLC, 9.50%, 1/1/2018 | January 4, 2017 | | | 400,000 | | | | 382,000 | | | | 400,000 | | | | 0.72 | % |
| Highland REIT, Inc. | April 28, 2016 | | | 136,771 | | | | 34,827 | | | | 47,870 | | | | 0.09 | % |
| Inventrust Properties Corp. | March 2, 2015 | | | 153,283 | | | | 367,663 | | | | 504,301 | | | | 0.91 | % |
Kayne Anderson
Energy Fund VII LP | September 12, 2016 | | | 1,575,000 | | | | 1,467,203 | | | | 1,588,313 | | | | 2.86 | % |
| KBS REIT II, Inc. | March 12, 2015 | | | 102,130 | | | | 183,789 | | | | 252,773 | | | | 0.46 | % |
| PCG Select Series I LLC - Series A Preferred Stock | June 23, 2016 | | | 800 | | | | 800,000 | | | | 800,000 | | | | 1.44 | % |
| Phillips Edison Grocery Center | February 3, 2016 | | | 3,330 | | | | 27,576 | | | | 33,964 | | | | 0.06 | % |
| Rosebrook Opportunities Fund LP | February 2, 2017 | | | 1,020,000 | | | | 1,020,000 | | | | 1,132,860 | | | | 2.04 | % |
| Saratoga Springs Partners, LLC, 9.50%, 11/1/2017 | May 5, 2017 | | | 500,000 | | | | 482,500 | | | | 500,000 | | | | 0.90 | % |
| Shopoff Land Fund III LP | April 28, 2015 | | | 56 | | | | 50,680 | | | | 50,680 | | | | 0.09 | % |
| Star Mountain Diversified Small Business Access Fund II LP | June 2, 2017 | | | 438,000 | | | | 479,215 | | | | 479,215 | | | | 0.86 | % |
| Stonehill Strategic Hotel Credit Opportunity Fund II LP | July 18, 2016 | | | 884,883 | | | | 884,883 | | | | 963,132 | | | | 1.74 | % |
| Tout, Inc. - Convertible Promissory Note, 8.00%, 5/12/2018 | May 15, 2017 | | | 1,000,000 | | | | 1,000,000 | | | | 1,000,000 | | | | 1.80 | % |
Tout, Inc. - Series C
Preferred Stock | June 2, 2016 | | | 337,207 | | | | 1,100,000 | | | | 1,448,180 | | | | 2.61 | % |
| Uniprop Manufactured Housing Communities Income Fund II | August 31, 2015 | | | 1,725 | | | | 14,801 | | | | 22,511 | | | | 0.04 | % |
| Walton Real Estate Fund VIII LP | May 24, 2017 | | | 2,522 | | | | 252,191 | | | | 281,193 | | | | 0.51 | % |
| | | | | | | | $ | 24,500,444 | | | $ | 27,211,708 | | | | | |
30
Wildermuth Endowment Strategy Fund
Notes to Financial Statements - Continued
June 30, 2017 (Unaudited)
8. INVESTMENTS IN AFFILIATED ISSUERS
An affiliated issuer is an entity in which the Fund has ownership of at least 5% of the voting securities. Issuers that are affiliates of the Fund at period-end are noted in the Fund’s Schedule of Investments. Additional security purchases and the reduction of certain security shares outstanding of existing portfolio holdings that were not considered affiliated in prior years may result in the Fund owning in excess of 5% of the outstanding shares at period-end. The table below reflects transactions during the period with entities that are affiliates as of June 30, 2017 and may include acquisitions of new investments, prior year holdings that became affiliated during the period and prior period affiliated holdings that are no longer affiliated as of period-end.
| Security Description | | Value Beginning
of Period | | | Purchases | | | Sales Proceeds | | | Securities no longer considered an affiliated investment | | | Change in Unrealized Appreciation (Depreciation) | | | Net Realized Gain (Loss) | | | Tax Basis Adjustments | | | Value End
of Period | | | Dividends Credited
to Income | |
| Clear Guide Medical, Inc. | | $ | 2,989,100 | | | $ | — | | | $ | — | | | $ | — | | | $ | 5,073 | | | $ | — | | | $ | (5,073 | ) | | $ | 2,989,100 | | | $ | — | |
| Gravity Ranch Fund I LP | | | — | | | | 500,000 | | | | — | | | | — | | | | — | | | | — | | | | — | | | | 500,000 | | | | — | |
| PCG Select Series I LLC - Series A Preferred Stock* | | | 816,359 | | | | — | | | | — | | | | (800,000 | ) | | | (16,359 | ) | | | — | | | | — | | | | — | | | | — | ** |
| Rosebrook Opportunities Fund LP | | | — | | | | 1,020,000 | | | | — | | | | — | | | | 112,860 | | | | — | | | | — | | | | 1,132,860 | | | | — | |
| | | $ | 3,805,459 | | | $ | 1,520,000 | | | $ | — | | | $ | (800,000 | ) | | $ | 101,574 | | | $ | — | | | $ | (5,073 | ) | | $ | 4,621,960 | | | $ | — | |
| * | Affiliated security as of December 31, 2016, but no longer meeting the 5% ownership in voting securities definition for the period ended June 30, 2017. The inclusion in the table above is to provide the net change for affiliated securities as a whole. The security is still held in the portfolio, see the Schedule of Investments for current value. |
| ** | Dividends accrued for the period ended June 30, 2017 were $38,741. The amount is not included in the table above as the security no longer meets the definition of an affiliated investment. This amount is included in the “Dividends from unaffiliated issuers” amount in the Statement of Operations. |
9. OFFERING PRICE PER SHARE
Class A shares are offered subject to a maximum sales charge of 6.00% of the offering price, while Class C shares are not subject to sales loads but are subject to a 1% contingent deferred sales charges on shares redeemed during the first 365 days after purchase. For the period ended June 30, 2017, the various broker dealers received $238,421 in underwriting commissions for sales of shares, of which $42,362 was retained by the principal underwriter or other affiliated broker-dealers. For the period ended June 30, 2017, contingent deferred sales charges in the amount of $680 were applied to Class C shareholders.
10. SUBSEQUENT EVENTS
Subsequent events after the balance sheet date have been evaluated through the date the financial statements were issued.
The Fund completed a quarterly repurchase offer on July 31, 2017. 95,959 shares of Class A and 8,155 shares of Class C were tendered, constituting 2.15% of the outstanding shares of the fund on the Repurchase Pricing Date. There were no repurchased shares of Class I.
Effective July 1, 2017, UMB Distribution Services, LLC became the Fund’s principal distributor.
Management has concluded that there are no outstanding circumstances requiring adjustment or disclosure in the financial statements.
31
Wildermuth Endowment Strategy Fund
Additional Information
June 30, 2017 (Unaudited)
Proxy Voting Policy — Information regarding how the Fund votes proxies relating to portfolio securities for the most recent period ended June 30, as well as a description of the policies and procedures that the Fund used to determine how to vote proxies is available without charge, upon request, by calling 1-888-889-8981 or by referring to the Securities and Exchange Commission’s (“SEC”) website at http://www.sec.gov. A description of the policies and procedures is also included in the Fund’s Statement of Additional Information, which is available on the SEC’s website at http://www.sec.gov.
Portfolio Holdings — The Fund files its complete schedule of portfolio holdings with the SEC for the first and third quarters of each fiscal year on Form N-Q. Form N-Q is available on the SEC’s website at http://www.sec.gov and may be reviewed and copied at the SEC’s Public Reference Room in Washington, DC (1-800-SEC-0330). The information on Form N-Q is available without charge, upon request, by calling 1-888-889-8981
32
THIS PAGE INTENTIONALLY LEFT BLANK
Investment Adviser
Wildermuth Advisory, LLC
11525 Park Woods Circle, Ste. 200
Alpharetta, Georgia 30005
Distributor
UMB Distribution Services, LLC
235 West Galena Street
Milwaukee, Wisconsin 53212
This report and the financial statements contained herein are submitted for the general information of shareholders and are not authorized for distribution to prospective investors unless preceded or accompanied by an effective prospectus. Nothing herein contained is to be considered an offer of sale or solicitation of an offer to buy shares of the Wildermuth Endowment Strategy Fund. Such offering is made only by prospectus, which includes details as to offering price and other material information.
Distributed by UMB Distribution Services, LLC
Member FINRA
Item 2. Code of Ethics.
Not applicable to semi-annual reports.
Item 3. Audit Committee Financial Expert.
Not applicable to semi-annual reports.
Item 4. Principal Accountant Fees and Services.
Not applicable to semi-annual reports.
Item 5. Audit Committee of Listed Registrants.
Not applicable.
Item 6. Schedule of Investments.
Included as part of the report to shareholders filed under Item 1 of this Form N-CSR.
Item 7. Disclosure of Proxy Voting Policies and Procedures for Closed-End Management Investment Companies.
Not applicable to semi-annual reports.
Item 8. Portfolio Managers of Closed-End Management Investment Companies.
Not applicable to semi-annual reports.
Item 9. Purchases of Equity Securities by Closed-End Management Investment Company and Affiliated Purchasers.
| Class A: | | (a) Total Number of Shares (or Units) Purchased | | | (b) Average Price Paid per Share (of Unit) | | | (c) Total Number of Shares (or Units) Purchased as Part of Publicly Announced Plans or Programs | | | (d) Maximum Number (or Approximate Dollar Value) of Shares (or Units) that May Yet Be Purchased Under the Plans or Programs | |
| Period | | | | | | | | | | | | |
| Jan. 1-31, 2017 | | | 0 | | | | 0 | | | | 0 | | | | 0 | |
| Feb. 1-28, 2017 (1) | | | 42,412 | | | $ | 11.96 | | | | 0 | | | | 0 | |
| Mar. 1-31, 2017 | | | 0 | | | | 0 | | | | 0 | | | | 0 | |
| Apr. 1-30, 2017 | | | 0 | | | | 0 | | | | 0 | | | | 0 | |
| May. 1-31, 2017 (2) | | | 62,602 | | | $ | 12.27 | | | | 0 | | | | 0 | |
| Jun. 1-30, 2017 | | | 0 | | | | 0 | | | | 0 | | | | 0 | |
| Jul. 1-31, 2017 | | | 0 | | | | 0 | | | | 0 | | | | 0 | |
| Aug. 1-31, 2017 | | | 0 | | | | 0 | | | | 0 | | | | 0 | |
| Sep. 1-30, 2017 | | | 0 | | | | 0 | | | | 0 | | | | 0 | |
| Oct. 1-31, 2017 | | | 0 | | | | 0 | | | | 0 | | | | 0 | |
| Nov. 1-30, 2017 | | | 0 | | | | 0 | | | | 0 | | | | 0 | |
| Dec. 1-31, 2017 | | | 0 | | | | 0 | | | | 0 | | | | 0 | |
| Total | | | 105,014 | | | $ | 12.14 | | | | 0 | | | | 0 | |
| Class C: | | (a) Total Number of Shares (or Units) Purchased | | | (b) Average Price Paid per Share (of Unit) | | | (c) Total Number of Shares (or Units) Purchased as Part of Publicly Announced Plans or Programs | | | (d) Maximum Number (or Approximate Dollar Value) of Shares (or Units) that May Yet Be Purchased Under the Plans or Programs | |
| Period | | | | | | | | | | | | |
| Jan. 1-31, 2017 | | | 0 | | | | 0 | | | | 0 | | | | 0 | |
| Feb. 1-28, 2017 (1) | | | 5,596 | | | $ | 11.87 | | | | 0 | | | | 0 | |
| Mar. 1-31, 2017 | | | 0 | | | | 0 | | | | 0 | | | | 0 | |
| Apr. 1-30, 2017 | | | 0 | | | | 0 | | | | 0 | | | | 0 | |
| May. 1-31, 2017 (2) | | | 1,143 | | | $ | 12.16 | | | | 0 | | | | 0 | |
| Jun. 1-30, 2017 | | | 0 | | | | 0 | | | | 0 | | | | 0 | |
| Jul. 1-31, 2017 | | | 0 | | | | 0 | | | | 0 | | | | 0 | |
| Aug. 1-31, 2017 | | | 0 | | | | 0 | | | | 0 | | | | 0 | |
| Sep. 1-30, 2017 | | | 0 | | | | 0 | | | | 0 | | | | 0 | |
| Oct. 1-31, 2017 | | | 0 | | | | 0 | | | | 0 | | | | 0 | |
| Nov. 1-30, 2017 | | | 0 | | | | 0 | | | | 0 | | | | 0 | |
| Dec. 1-31, 2017 | | | 0 | | | | 0 | | | | 0 | | | | 0 | |
| Total | | | 6,739 | | | $ | 11.92 | | | | 0 | | | | 0 | |
| Class I(3): | | (a) Total Number of Shares (or Units) Purchased | | | (b) Average Price Paid per Share (of Unit) | | | (c) Total Number of Shares (or Units) Purchased as Part of Publicly Announced Plans or Programs | | | (d) Maximum Number (or Approximate Dollar Value) of Shares (or Units) that May Yet Be Purchased Under the Plans or Programs | |
| Period | | | | | | | | | | | | |
| Jan. 1-31, 2017 | | | 0 | | | | 0 | | | | 0 | | | | 0 | |
| Feb. 1-28, 2017 | | | 0 | | | | 0 | | | | 0 | | | | 0 | |
| Mar. 1-31, 2017 | | | 0 | | | | 0 | | | | 0 | | | | 0 | |
| Apr. 1-30, 2017 | | | 0 | | | | 0 | | | | 0 | | | | 0 | |
| May. 1-31, 2017 (2) | | | 0 | | | | 0 | | | | 0 | | | | 0 | |
| Jun. 1-30, 2017 | | | 0 | | | | 0 | | | | 0 | | | | 0 | |
| Jul. 1-31, 2017 | | | 0 | | | | 0 | | | | 0 | | | | 0 | |
| Aug. 1-31, 2017 | | | 0 | | | | 0 | | | | 0 | | | | 0 | |
| Sep. 1-30, 2017 | | | 0 | | | | 0 | | | | 0 | | | | 0 | |
| Oct. 1-31, 2017 | | | 0 | | | | 0 | | | | 0 | | | | 0 | |
| Nov. 1-30, 2017 | | | 0 | | | | 0 | | | | 0 | | | | 0 | |
| Dec. 1-31, 2017 | | | 0 | | | | 0 | | | | 0 | | | | 0 | |
| Total | | | 0 | | | $ | 0 | | | | 0 | | | | 0 | |
| (1) | On December 30, 2016 the Registrant offered to repurchase up to 5% of the Registrant’s total outstanding shares as of February 1, 2017 ( the "Repurchase Request Deadline"). On the Repurchase Request Deadline, 164,990 shares represented 5% of the Registrant's total outstanding shares. |
| (2) | On March 30 , 2017 the Registrant offered to repurchase up to 5% of the Registrant’s total outstanding shares as of May 1, 2017 ( the "Repurchase Request Deadline"). On the Repurchase Request Deadline, 198,691 shares represented 5% of the Registrant's total outstanding shares. |
| (3) | Class I inception date was April 28, 2017. |
Item 10. Submission of Matters to a Vote of Security Holders.
Not applicable.
Item 11. Controls and Procedures.
| (a) | The Registrant’s principal executive officer and principal financial officer have reviewed the Registrant's disclosure controls and procedures (as defined in Rule 30a-3(c) under the Investment Company Act of 1940, as amended, (the “Act”)) as of a date within 90 days of the filing of this report, as required by Rule 30a-3(b) under the Act. Based on their review, such officers have concluded that the disclosure controls and procedures were effective in ensuring that information required to be disclosed in this report was appropriately recorded, processed, summarized and reported and made known to them by others within the Registrant and by the Registrant’s service providers. |
| (b) | There were no changes in the Registrant’s internal control over financial reporting (as defined in Rule 30a-3(d) under the Act (17 CFR 270.30a-3(d)) that occurred during the Registrant’s second fiscal quarter of the period covered by this report that materially affected, or were reasonably likely to materially affect, the Registrant’s internal control over financial reporting. |
Item 12. Exhibits.
| (a) (1) | Not applicable to semi-annual reports. |
| (a) (2) | Certifications required pursuant to Section 302 of the Sarbanes-Oxley Act of 2002. Filed herewith. |
| (b) | Certification pursuant to Section 906 of the Sarbanes-Oxley Act of 2002. Filed herewith. |
SIGNATURES
Pursuant to the requirements of the Securities Exchange Act of 1934 and the Investment Company Act of 1940, the Registrant has duly caused this report to be signed on its behalf by the undersigned, thereunto duly authorized.
Wildermuth Endowment Strategy Fund
| /s/ Daniel Wildermuth | |
| By: Daniel Wildermuth | |
| Trustee, Chairman of the Board, President and Chief Executive Officer | |
| September 1, 2017 | |
Pursuant to the requirements of the Securities Exchange Act of 1934 and the Investment Company Act of 1940, this report has been signed below by the following persons on behalf of the Registrant and in the capacities and on the dates indicated.
| /s/ Daniel Wildermuth | |
| By: Daniel Wildermuth | |
| Trustee, Chairman of the Board, President and Chief Executive Officer | |
| (Principal Executive Officer) | |
| September 1, 2017 | |
| /s/ Gerard Scarpati | |
| By: Gerard Scarpati | |
| Treasurer and Chief Financial Officer | |
| (Principal Financial Officer) | |
| September 1, 2017 | |