UNITED STATES
SECURITIES AND EXCHANGE COMMISSION
Washington, D.C. 20549
FORM N-CSR
CERTIFIED SHAREHOLDER REPORT OF REGISTERED
MANAGEMENT INVESTMENT COMPANIES
Investment Company Act File Number 811-22888
Wildermuth Endowment Fund
(Exact name of registrant as specified in charter)
818 A1A Hwy, Suite 301
Ponte Vedra Beach, Florida 32082
(Address of principal executive offices) (Zip code)
Daniel Wildermuth
Wildermuth Advisory, LLC
818 A1A Hwy, Suite 301
Ponte Vedra Beach, Florida 32082
(Name and address of agent for service)
COPIES TO:
John H. Grady
Practus, LLP
1062 East Lancaster Avenue, Suite 15-A
Rosemont, PA 19010
(484) 730-8535
Registrant's telephone number, including area code: (678) 222-1100
Date of fiscal year end: December 31
Date of reporting period: June 30, 2020
Item 1. Reports to Stockholders.

SEMI-ANNUAL REPORT
June 30, 2020
WWW.WILDERMUTHENDOWMENTFUND.COM ● 1-888-445-6032 ●
DISTRIBUTED BY WILDERMUTH SECURITIES, LLC AND
UMB DISTRIBUTION SERVICES, LLC (MEMBERS OF FINRA)
Wildermuth Endowment Fund |
Table of Contents | |
Rule 30e-3 Notice for Delivery of Shareholder Reports | 2 |
Portfolio Review | 3 |
Portfolio Composition | 5 |
Schedule of Investments | 6 |
Statement of Assets and Liabilities | 13 |
Statement of Operations | 14 |
Statements of Changes in Net Assets | 15 |
Statement of Cash Flows | 17 |
Financial Highlights | 18 |
Notes to Financial Statements | 21 |
Additional Information | 39 |
Wildermuth Endowment Fund Optional Delivery of Shareholder Reports Notice |
Dear Wildermuth Endowment Fund Shareholder:
The Wildermuth Endowment Fund (the “Fund”) is a closed-end fund registered with the Securities and Exchange Commission (the “Commission”) under the Investment Company Act of 1940, as amended, and operates as an “interval fund” thereunder. The Fund is obligated to provide each of its shareholders with paper copies of its annual and semi-annual reports.
In June 2018, the Commission approved of a new, optional “notice and access” method for delivery of annual and semi-annual shareholder reports to investors in certain registered investment funds.
Under new Rule 30e-3 (the “Rule”), funds may deliver their annual and semi-annual shareholder reports by making them publicly accessible on a website, free of charge, and sending investors a paper notice of the availability of each report by mail. Investors who prefer to receive the full shareholder reports in paper form may, at any time, choose that option free of charge.
Please be advised that the Fund intends to rely on the new Rule 30e-3.
You are receiving this notice now because the Fund may elect to rely on the Rule as of January 1, 2021, and funds must provide notice to shareholders at least two (2) years prior to relying on the Rule.
Under the circumstances, this notice would permit the Fund to mail notices to shareholders instead of mailing paper forms of its annual and semi-annual reports as early as two (2) years from the date of the original notice that was mailed to shareholders on March 1, 2019 for the December 31, 2018 annual report.
Sincerely,

Daniel Wildermuth
Wildermuth Endowment Fund
2
Wildermuth Endowment Fund Portfolio Review June 30, 2020 (Unaudited) |
The Fund’s performance figures* for each of the periods ended June 30, 2020, compared to its benchmarks:
| Five
Years | Three
Years | One
Year | Annualized
Since Inception1 |
Class A | 5.67% | 5.53% | 0.30% | 7.75% |
Class A with Load2 | 4.37% | 3.39% | (5.48)% | 6.54% |
S&P 500® Total Return Index** | 10.73% | 10.73% | 7.51% | 9.96% |
Bloomberg Barclays U.S. Aggregate Bond Index*** | 4.30% | 5.32% | 8.74% | 3.89% |
| Three
Years | One
Year | Annualized
Since Inception3 |
Class C | 4.75% | (0.41)% | 6.98% |
Class C with Sales Charge4 | 4.75% | (1.39)% | 6.98% |
S&P 500® Total Return Index** | 10.73% | 7.51% | 12.73% |
Bloomberg Barclays U.S. Aggregate Bond Index*** | 5.32% | 8.74% | 4.43% |
| Three
Years | One
Year | Annualized
Since Inception5 |
Class I | 5.94% | 0.61% | 5.85% |
S&P 500® Total Return Index** | 10.73% | 7.51% | 10.82% |
Bloomberg Barclays U.S. Aggregate Bond Index*** | 5.32% | 8.74% | 5.25% |
1 | The Class A inception date was December 31, 2014. |
2 | Calculated using a maximum sales load. The maximum sales load was 6.00% from the Class A inception date through October 19, 2017. Effective October 20, 2017 the maximum sales load is 5.75%. |
3 | The Class C inception date was March 14, 2016. |
4 | Class C shares are subject to a Contingent Deferred Sales Charge of 1.00% on any shares redeemed within 365 days of purchase. |
5 | The Class I inception date was April 28, 2017. |
* | The performance data quoted here represents past performance. Current performance may be lower or higher than the performance data quoted above. Investment return and principal value will fluctuate, so that shares, when redeemed, may be worth more or less than their original cost. The returns shown do not reflect the deduction of taxes that a shareholder would pay on Fund distributions or on the redemptions of Fund shares. Past performance is no guarantee of future results. Class A has a total annual operating expense of 3.98%, Class C has a total annual operating expense of 4.73%, and Class I has a total annual operating expense of 3.73%, per the prospectus dated May 1, 2019. |
** | The S&P 500® Total Return Index is an unmanaged market capitalization-weighted index of 500 widely held common stocks. Investors cannot invest directly in an index. |
*** | The Bloomberg Barclays U.S. Aggregate Bond Index is a broad-based benchmark that measures the investment grade, U.S. dollar-denominated, fixed-rate taxable bond market, including Treasuries, government-related and corporate securities, MBS (agency fixed-rate and hybrid ARM pass-through securities), ABS, and CMBS. Investors cannot invest directly in an index. |
3
Wildermuth Endowment Fund Portfolio Review - Continued
June 30, 2020 (Unaudited) |
Holdings by type of Investment | % of
Net Assets | 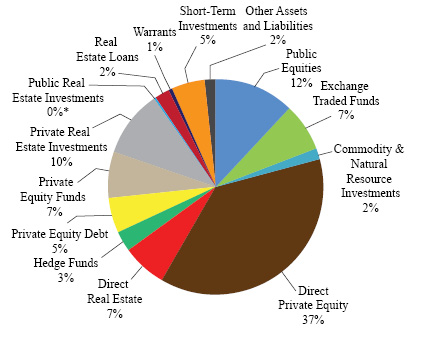
* Represents less than 0.4% of net assets. |
Public Equities | 12.2% |
Exchange Traded Funds | 7.0 |
Commodity & Natural Resource Investments | 1.9 |
Direct Private Equity | 37.3 |
Direct Real Estate | 6.6 |
Hedge Funds | 3.3 |
Private Equity Debt | 5.1 |
Private Equity Funds | 6.9 |
Private Real Estate Investments | 10.0 |
Public Real Estate Investments | 0.3 |
Real Estate Loans | 2.3 |
Warrants | 0.7 |
Short-Term Investments | 4.8 |
Other Assets and Liabilities | 1.6 |
| | 100.0% |
Please refer to the Schedule of Investments in this Semi-Annual Report for detailed analysis of the Fund’s Holdings.
4
Wildermuth Endowment Fund Portfolio Composition June 30, 2020 (Unaudited) |
Country of Investment | | Fair Value | | | % of
Net Assets | |
Australia | | $ | 300,164 | | | | 0.2% | |
Belgium | | | 414,670 | | | | 0.2 | |
Bermuda | | | 471,532 | | | | 0.2 | |
Canada | | | 1,077,873 | | | | 0.6 | |
France | | | 2,149,952 | | | | 1.2 | |
Germany | | | 366,448 | | | | 0.2 | |
Ireland | | | 9,590,256 | | | | 5.4 | |
Japan | | | 1,227,238 | | | | 0.7 | |
Luxembourg | | | 4,551,860 | | | | 2.5 | |
Netherlands | | | 325,260 | | | | 0.2 | |
New Zealand | | | 500,000 | | | | 0.3 | |
Singapore | | | 745,786 | | | | 0.4 | |
Spain | | | 138,612 | | | | 0.1 | |
Switzerland | | | 473,196 | | | | 0.3 | |
United Kingdom | | | 670,556 | | | | 0.4 | |
United States | | | 152,172,955 | | | | 85.5 | |
Other Assets & Liabilities, net | | | 2,843,912 | | | | 1.6 | |
| | | $ | 178,020,270 | | | | 100.0% | |
5
Wildermuth Endowment Fund Schedule of Investments June 30, 2020 (Unaudited) |
| | Interests,
Shares,
Principal
Amount,
or Units | | | | Fair
Value | |
| | | | | PUBLIC EQUITIES — 12.2% | | | | |
| | | | | ADVERTISING — 0.3% | | | | |
| | | 184,413 | | National CineMedia, Inc. | | $ | 547,707 | |
| | | | | | | | | |
| | | | | AIRLINES — 0.5% | | | | |
| | | 35,000 | | Delta Air Lines, Inc. | | | 981,750 | |
| | | | | | | | | |
| | | | | APPAREL — 0.2% | | | | |
| | | 538 | | Kering | | | 292,595 | |
| | | | | | | | | |
| | | | | BANKS — 0.1% | | | | |
| | | 3,970 | | Bank of New York Mellon Corp. | | | 153,440 | |
| | | | | | | | | |
| | | | | BEVERAGES — 0.2% | | | | |
| | | 1,938 | | Pernod Ricard SA | | | 304,826 | |
| | | | | | | | | |
| | | | | BIOTECHNOLOGY — 0.6% | | | | |
| | | 1,043 | | CSL, Ltd. | | | 206,101 | |
| | | 1,365 | | Regeneron Pharmaceuticals, Inc.(a) | | | 851,282 | |
| | | | | | | | 1,057,383 | |
| | | | | BUILDING MATERIALS — 0.1% | | | | |
| | | 4,422 | | LafargeHolcim, Ltd.(a) | | | 193,707 | |
| | | | | | | | | |
| | | | | CHEMICALS — 0.0% | | | | |
| | | 700 | | FMC Corp. | | | 69,734 | |
| | | | | | | | | |
| | | | | COMMERCIAL SERVICES — 1.0% | | | | |
| | | 2,300 | | FleetCor Technologies, Inc.(a) | | | 578,519 | |
| | | 15,046 | | McMillan Shakespeare, Ltd. | | | 94,064 | |
| | | 3,207 | | S&P Global, Inc. | | | 1,056,642 | |
| | | 977 | | Wirecard AG | | | 6,287 | |
| | | | | | | | 1,735,512 | |
| | | | | COSMETICS/PERSONAL CARE — 0.6% | | | | |
| | | 9,240 | | Procter & Gamble Co. | | | 1,104,827 | |
| | | | | | | | | |
| | | | | DISTRIBUTION/WHOLESALE — 0.3% | | | | |
| | | 27,674 | | Inchcape PLC | | | 167,556 | |
| | | 15,593 | | Triton International, Ltd. | | | 471,532 | |
| | | | | | | | 639,088 | |
| | | | | DIVERSIFIED FINANCIAL SERVICES — 0.5% | | | | |
| | | 7,985 | | LPL Financial Holdings, Inc. | | | 626,024 | |
| | | 46,619 | | Mitsubishi UFJ Lease & Finance Co., Ltd. | | | 220,380 | |
| | | | | | | | 846,404 | |
See accompanying notes to financial statements.
6
Wildermuth Endowment Fund Schedule of Investments - Continued
June 30, 2020 (Unaudited) |
| | Interests,
Shares,
Principal
Amount,
or Units | | | | Fair
Value | |
| | | | | PUBLIC EQUITIES (CONTINUED) | | | | |
| | | | | ELECTRIC — 0.3% | | | | |
| | | 15,000 | | Clearway Energy, Inc. - Class A | | $ | 314,550 | |
| | | 14,300 | | Clearway Energy, Inc. - Class C | | | 329,758 | |
| | | | | | | | 644,308 | |
| | | | | ELECTRONICS — 0.0% | | | | |
| | | 3,860 | | nVent Electric PLC | | | 72,298 | |
| | | | | | | | | |
| | | | | ENERGY-ALTERNATE SOURCES — 0.2% | | | | |
| | | 27,642 | | TransAlta Renewables, Inc. | | | 296,106 | |
| | | | | | | | | |
| | | | | ENGINEERING & CONSTRUCTION — 0.2% | | | | |
| | | 5,500 | | ACS Actividades de Construccion y Servicios SA | | | 138,612 | |
| | | 9,400 | | HomeServe PLC | | | 151,575 | |
| | | | | | | | 290,187 | |
| | | | | FOOD — 0.5% | | | | |
| | | 975 | | JM Smucker Co. | | | 103,165 | |
| | | 4,030 | | Mondelez International, Inc. - Class A | | | 206,054 | |
| | | 7,920 | | Sysco Corp. | | | 432,907 | |
| | | 1,150 | | TreeHouse Foods, Inc.(a) | | | 50,370 | |
| | | 1,066 | | Tyson Foods, Inc. - Class A | | | 63,651 | |
| | | | | | | | 856,147 | |
| | | | | HEALTHCARE-SERVICES — 0.1% | | | | |
| | | 3,380 | | Fresenius SE & Co. KGaA | | | 167,481 | |
| | | | | | | | | |
| | | | | HOME FURNISHINGS — 0.2% | | | | |
| | | 5,930 | | Sony Corp., ADR | | | 409,941 | |
| | | | | | | | | |
| | | | | INTERNET — 2.0% | | | | |
| | | 546 | | Alphabet, Inc. - Class A(a) | | | 774,255 | |
| | | 450 | | Amazon.com, Inc.(a) | | | 1,241,469 | |
| | | 16,140 | | eBay, Inc. | | | 846,543 | |
| | | 3,536 | | Facebook, Inc. - Class A(a) | | | 802,920 | |
| | | | | | | | 3,665,187 | |
| | | | | MACHINERY-CONSTRUCTION & MINING — 0.2% | | | | |
| | | 22,255 | | Mitsubishi Electric Corp. | | | 288,695 | |
| | | | | | | | | |
| | | | | MACHINERY-DIVERSIFIED — 0.1% | | | | |
| | | 1,025 | | AGCO Corp. | | | 56,847 | |
| | | 394 | | Deere & Co. | | | 61,917 | |
| | | | | | | | 118,764 | |
| | | | | MEDIA — 0.2% | | | | |
| | | 30,000 | | TEGNA, Inc. | | | 334,200 | |
| | | | | | | | | |
See accompanying notes to financial statements.
7
Wildermuth Endowment Fund Schedule of Investments - Continued
June 30, 2020 (Unaudited) |
| | Interests,
Shares,
Principal
Amount,
or Units | | | | Fair
Value | |
| | | | | PUBLIC EQUITIES (CONTINUED) | | | | |
| | | | | MINING — 0.2% | | | | |
| | | 14,000 | | Kinross Gold Corp.(a) | | $ | 101,080 | |
| | | 1,075 | | Rio Tinto PLC, ADR | | | 60,394 | |
| | | 2,810 | | Teck Resources, Ltd. | | | 29,280 | |
| | | 39,053 | | Yamana Gold, Inc. | | | 213,229 | |
| | | | | | | | 403,983 | |
| | | | | MISCELLANEOUS MANUFACTURING — 0.1% | | | | |
| | | 17,040 | | General Electric Co. | | | 116,383 | |
| | | | | | | | | |
| | | | | OIL & GAS — 0.1% | | | | |
| | | 68,500 | | QEP Resources, Inc. | | | 88,365 | |
| | | 475 | | Royal Dutch Shell PLC, Class A, ADR | | | 15,528 | |
| | | 1,000 | | Suncor Energy, Inc. | | | 16,860 | |
| | | | | | | | 120,753 | |
| | | | | PHARMACEUTICALS — 0.8% | | | | |
| | | 6,220 | | Dechra Pharmaceuticals PLC | | | 218,734 | |
| | | 4,082 | | Johnson & Johnson | | | 574,052 | |
| | | 3,200 | | Novartis AG, ADR | | | 279,488 | |
| | | 2,491 | | UCB SA | | | 288,434 | |
| | | | | | | | 1,360,708 | |
| | | | | PIPELINES — 0.3% | | | | |
| | | 2,000 | | CNX Midstream Partners LP | | | 13,300 | |
| | | 10,220 | | Enable Midstream Partners LP | | | 47,830 | |
| | | 13,850 | | Enbridge, Inc. | | | 421,317 | |
| | | 1,716 | | Genesis Energy LP | | | 12,390 | |
| | | 888 | | Phillips 66 Partners LP | | | 32,003 | |
| | | | | | | | 526,840 | |
| | | | | REAL ESTATE — 0.1% | | | | |
| | | 2,000 | | Atenor | | | 126,235 | |
| | | | | | | | | |
| | | | | REITS — 0.1% | | | | |
| | | 41,123 | | VEREIT, Inc. - REIT | | | 264,421 | |
| | | | | | | | | |
| | | | | RETAIL — 0.1% | | | | |
| | | 7,520 | | Wendy’s Co. | | | 163,786 | |
| | | | | | | | | |
| | | | | SEMICONDUCTORS — 1.7% | | | | |
| | | 2,363 | | Broadcom, Ltd. | | | 745,786 | |
| | | 16,346 | | Intel Corp. | | | 977,981 | |
| | | 2,716 | | NXP Semiconductors NV | | | 309,733 | |
| | | 8,840 | | Qorvo, Inc.(a) | | | 977,085 | |
| | | | | | | | 3,010,585 | |
See accompanying notes to financial statements.
8
Wildermuth Endowment Fund Schedule of Investments - Continued
June 30, 2020 (Unaudited) |
| | Interests,
Shares,
Principal
Amount,
or Units | | | | Fair
Value | |
| | | | | PUBLIC EQUITIES (CONTINUED) | | | | |
| | | | | SOFTWARE — 0.1% | | | | |
| | | 1,380 | | SAP SE | | $ | 192,679 | |
| | | | | | | | | |
| | | | | TELECOMMUNICATIONS — 0.2% | | | | |
| | | 11,538 | | NTT DOCOMO, Inc. | | | 308,222 | |
| | | | | | | | | |
| | | | | TOTAL PUBLIC EQUITIES (Cost $19,932,841) | | | 21,664,882 | |
| | | | | | | | | |
| | | | | EXCHANGE TRADED FUNDS — 7.0% | | | | |
| | | | | COMMODITY FUND — 1.2% | | | | |
| | | 12,500 | | SPDR Gold Shares(a) | | | 2,092,125 | |
| | | | | | | | | |
| | | | | DEBT FUNDS — 0.3% | | | | |
| | | 15,720 | | Invesco International Corporate Bond | | | 421,170 | |
| | | 1,618 | | iShares iBoxx High Yield Corporate Bond | | | 132,061 | |
| | | | | | | | 553,231 | |
| | | | | EQUITY FUNDS — 5.5% | | | | |
| | | 44,389 | | Emerging Markets Internet and Ecommerce | | | 2,073,410 | |
| | | 37,354 | | iShares MSCI Brazil | | | 1,074,301 | |
| | | 36,530 | | iShares MSCI India | | | 1,060,101 | |
| | | 28,850 | | iShares MSCI Indonesia | | | 519,300 | |
| | | 34,400 | | iShares MSCI Malaysia | | | 867,224 | |
| | | 36,756 | | iShares MSCI Taiwan | | | 1,478,326 | |
| | | 51,512 | | VanEck Vectors Russia | | | 1,068,874 | |
| | | 17,000 | | WisdomTree China ex-State-Owned Enterprises Fund | | | 1,631,317 | |
| | | | | | | | 9,772,853 | |
| | | | | | | | | |
| | | | | TOTAL EXCHANGE TRADED FUNDS (Cost $12,296,850) | | | 12,418,209 | |
| | | | | | | | | |
| | | | | COMMODITY & NATURAL RESOURCE INVESTMENTS — 1.9% | | | | |
| | | 953 | | Casillas Petroleum Resource Partners, LLC(b)(c)(d)(e)(f) | | | 523,991 | |
| | | 1,876,034 | | CM Funding, LLC(b)(c)(d)(e)(f) | | | 856,643 | |
| | | — | | Kayne Anderson Energy Fund VII LP(c)(e)(g) | | | 669,374 | |
| | | 2,080,000 | | Thunder Investment Partners, LLC(b)(c)(d)(e)(f) | | | 1,317,845 | |
| | | | | TOTAL COMMODITY & NATURAL RESOURCE INVESTMENTS (Cost $6,782,345) | | | 3,367,853 | |
| | | | | | | | | |
| | | | | DIRECT PRIVATE EQUITY — 37.3% | | | | |
| | | 41,751 | | Affinity Beverages, LLC(c)(d)(e) | | | 174,999 | |
| | | 684 | | Atlas Fintech Holdings Corp. - Class A Share Interests(b)(c)(d)(e)(f) | | | 3,883,393 | |
| | | 2,500 | | Clear Guide Medical, Inc. - Series A Preferred Stock(b)(c)(d)(e)(f) | | | 4,227,826 | |
| | | 134,898 | | Clear Guide Medical, Inc. - Series A-2 Preferred Stock(b)(c)(d)(e)(f) | | | 815,870 | |
| | | 770,489 | | Clear Guide Medical, Inc. - Series A-3 Preferred Stock(b)(c)(d)(e)(f) | | | 4,316,417 | |
| | | 1,543,074 | | Clearsense, LLC - Class C Preferred Shares(b)(c)(d)(e)(f) | | | 12,888,820 | |
| | | 280,200 | | Content Management Live, LLC(b)(c)(d)(e)(f) | | | 250,000 | |
See accompanying notes to financial statements.
9
Wildermuth Endowment Fund Schedule of Investments - Continued
June 30, 2020 (Unaudited) |
| | Interests,
Shares,
Principal
Amount,
or Units | | | | Fair
Value | |
| | | | | DIRECT PRIVATE EQUITY (CONTINUED) |
| | | 4,711,751 | | DSI Digital, LLC - Series A Convertible Preferred Units(b)(c)(d)(e)(f) | | $ | 15,430,478 | |
| | | 6,785,282 | | GigaPro, Inc. - Common Units(b)(c)(d)(e)(f) | | | 10,048,084 | |
| | | 1,288,103 | | GigaPro, Inc. - Series Seed-2 Preferred Units(b)(c)(d)(e)(f) | | | 1,850,803 | |
| | | — | | Level ATI HoldCo, LLC - Class A(b)(c)(d)(e)(f) | | | 2,506,886 | |
| | | 3,500,000 | | Metro Diner, LLC - Series B Units(c)(d)(e)(f) | | | 2,730,000 | |
| | | 1,880,968 | | Metro Diner, LLC - Series II Common Units(c)(d)(e)(f) | | | 1,351,479 | |
| | | 635,838 | | Waratek, Ltd. - Series B-1(b)(c)(d)(e)(f) | | | 2,575,558 | |
| | | 756,826 | | Waratek, Ltd. - Series B-2(b)(c)(d)(e)(f) | | | 3,352,496 | |
| | | — | | WG Pitts Caribbean, LLC - Common Units(b)(c)(d)(e)(f) | | | — | |
| | | | | TOTAL DIRECT PRIVATE EQUITY (Cost $39,505,784) | | | 66,403,109 | |
| | | | | | | | | |
| | | | | DIRECT REAL ESTATE — 6.6% | | | | |
| | | — | | Brookwood SFL Investor Co-Investment Vehicle, LLC(b)(c)(e) | | | 1,557,869 | |
| | | 439,716 | | Dog Wood Park of Northeast Florida, LLC(b)(c)(d)(e)(f) | | | 372,192 | |
| | | 1,741,602 | | GT Operating Company, Inc.(b)(c)(d)(e) | | | 1,741,602 | |
| | | 400,000 | | Hauiki Hui, LLC(b)(c)(d)(e)(f) | | | 230,672 | |
| | | 1,800,000 | | LaGrange Senior Living, LLC - Class A Interests(b)(c)(d)(e) | | | 1,800,000 | |
| | | — | | Polara Builder II, LLC(b)(c)(d)(e)(f) | | | 4,592,873 | |
| | | — | | RS17 Rexburg Preferred, LLC - Series A Preferred Interests(b)(c)(d)(e)(f) | | | 1,547,504 | |
| | | | | TOTAL DIRECT REAL ESTATE (Cost $10,226,349) | | | 11,842,712 | |
| | | | | | | | | |
| | | | | HEDGE FUNDS — 3.3% | | | | |
| | | — | | Altegris Millennium Fund LP(c)(e)(g)(i) | | | 1,128,367 | |
| | | — | | CRC Bond Opportunity Trading Fund LP(c)(e)(g)(i) | | | 2,584,001 | |
| | | — | | EJF Trust Preferred Fund LP(c)(e)(g)(i) | | | 713,571 | |
| | | — | | Rosebrook Opportunities Fund LP(b)(c)(e)(g)(i) | | | 1,516,893 | |
| | | | | TOTAL HEDGE FUNDS (Cost $5,586,348) | | | 5,942,832 | |
| | | | | | | | | |
| | | | | PRIVATE EQUITY DEBT — 5.1% | | | | |
| | $ | 1,974,366 | | Aetius Intermediate Company, LLC, LIBOR 1 Month + 9.50%, 12/20/2023(c)(d)(e)(j) | | | 1,974,366 | |
| | | 264,412 | | EJF Trust Preferred Master Fund LP, 16.00%, 4/16/2022(c)(d)(e)(g)(i) | | | 264,412 | |
| | | 1,500,000 | | Sequin, Inc. - Convertible Note, 8.00%, 6/28/2022(b)(c)(d)(e) | | | 1,500,000 | |
| | | 500,000 | | The Work Shop Limited T/A RIP Global - Convertible Note, 10.00%, 5/22/2022(b)(c)(d)(e) | | | 500,000 | |
| | | 2,191,374 | | Waratek, Ltd. - Convertible Note, 12.00%, 3/25/2021(b)(c)(d)(e)(f) | | | 2,955,549 | |
| | | 2,000,000 | | WG Pitts Caribbean, LLC - Promissory Note, 10.00%, 10/12/2020(b)(c)(d)(e)(f)(h) | | | 1,815,745 | |
| | | | | TOTAL PRIVATE EQUITY DEBT (Cost $8,004,113) | | | 9,010,072 | |
| | | | | | | | | |
| | | | | PRIVATE EQUITY FUNDS — 6.9% | | | | |
| | | — | | Abbott Secondary Opportunities LP(c)(e)(g)(i) | | | 1,451,688 | |
| | | — | | Auda Capital SCS SICAV SIF - Auda Asia Secondary Fund(c)(e)(g)(i) | | | 2,209,414 | |
| | | — | | Committed Advisors Secondary Fund III(c)(e)(g)(i) | | | 1,552,531 | |
| | | — | | EJF Sidecar Fund, Series LLC - Small Financial Equities Series(c)(e)(g)(i) | | | 710,779 | |
| | | 10 | | GPB Automotive Portfolio LP(c)(d)(e)(f)(g) | | | 155,838 | |
See accompanying notes to financial statements.
10
Wildermuth Endowment Fund Schedule of Investments - Continued
June 30, 2020 (Unaudited) |
| | Interests,
Shares,
Principal
Amount,
or Units | | | | Fair
Value | |
| | | | | PRIVATE EQUITY FUNDS (CONTINUED) |
| | | — | | Gravity Ranch Fund I LP(b)(c)(e)(g)(i) | | $ | 136,049 | |
| | | — | | Greenspring Opportunities V LP(c)(e)(g)(i) | | | 633,028 | |
| | | — | | Madryn Health Partners LP(c)(e)(g)(i) | | | 2,104,773 | |
| | | — | | PineBridge Secondary Partners IV SLP(c)(e)(g)(i) | | | 1,335,614 | |
| | | — | | Star Mountain Diversified Credit Income Fund III LP(c)(e)(g)(i) | | | 921,033 | |
| | | — | | Star Mountain Diversified Small Business Access Fund II LP(c)(e)(g)(i) | | | 1,017,926 | |
| | | | | TOTAL PRIVATE EQUITY FUNDS (Cost $11,900,760) | | | 12,228,673 | |
| | | | | | | | | |
| | | | | PRIVATE REAL ESTATE INVESTMENTS — 10.0% | | | | |
| | | 95,075 | | ARCTRUST, Inc.(c)(e)(g) | | | 1,224,541 | |
| | | 23,529 | | Broadstone Net Lease, Inc.(c)(e)(g) | | | 1,929,412 | |
| | | 2,423,689 | | Carlyle Europe Realty Fund, S.C.Sp.(c)(e)(g)(i) | | | 2,342,446 | |
| | | 157,812 | | Cottonwood Residential II, Inc.(c)(e)(g) | | | 3,378,755 | |
| | | — | | Cygnus Property Fund V, LLC(b)(c)(e)(g) | | | 1,751,721 | |
| | | — | | Harbert Seniors Housing Fund I LP(c)(e)(g) | | | 1,386,013 | |
| | | — | | Harbert Seniors Housing Fund II LP(c)(e)(g) | | | 776,645 | |
| | | — | | PCG Select Series I, LLC - Series A Preferred Stock(c)(e)(g) | | | 267,029 | |
| | | 789 | | PRISA III Fund LP(c)(e)(g) | | | 1,538,401 | |
| | | — | | RRA Credit Opportunity Fund LP(b)(c)(e)(g) | | | 1,476,619 | |
| | | 56 | | Shopoff Land Fund III LP(c)(e)(g) | | | 33,053 | |
| | | 702,851 | | Stonehill Strategic Hotel Credit Opportunity Fund II LP(c)(e)(g) | | | 1,010,349 | |
| | | — | | Walton Street Real Estate Fund VIII LP(c)(e)(g) | | | 631,546 | |
| | | | | TOTAL PRIVATE REAL ESTATE INVESTMENTS (Cost $16,777,596) | | | 17,746,530 | |
| | | | | | | | | |
| | | | | PUBLIC REAL ESTATE INVESTMENTS — 0.3% | | | | |
| | | 136,771 | | Highlands REIT, Inc.(c)(e) | | | 49,238 | |
| | | 153,283 | | Inventrust Properties Corp.(c)(e) | | | 481,308 | |
| | | 3,330 | | Phillips Edison Grocery Center(c)(e) | | | 29,136 | |
| | | | | TOTAL PUBLIC REAL ESTATE INVESTMENTS (Cost $394,578) | | | 559,682 | |
| | | | | | | | | |
| | | | | REAL ESTATE LOANS — 2.3% | | | | |
| | $ | 1,645,229 | | Airport Center Development Partners, LLC, 10.50%, 4/10/2020(c)(d)(e)(h) | | | 1,645,229 | |
| | | 679,962 | | Park City (PCG), 12.00%, 11/26/2020(c)(d)(e) | | | 679,962 | |
| | | 1,851,567 | | Westgate at Powers, LLC, 12.00%, 6/21/2021(c)(d)(e) | | | 1,851,567 | |
| | | | | TOTAL REAL ESTATE LOANS (Cost $3,887,847) | | | 4,176,758 | |
| | | | | | | | | |
| | | | | WARRANTS — 0.7% | | | | |
| | | 100 | | Atlas Fintech Holdings Corp., Exercise Price $13,000, Expiration Date,12/30/2021(a)(b)(c)(d)(e)(f) | | | 28,435 | |
| | | 44 | | Atlas Fintech Holdings Corp., Exercise Price $14,950, Expiration Date,12/30/2022(a)(b)(c)(d)(e)(f) | | | 7,774 | |
| | | 475 | | Atlas Fintech Holdings Corp., Exercise Price $8,000, Expiration Date,12/30/2021(a)(b)(c)(d)(e)(f) | | | 475,090 | |
| | | 1,442 | | Schweizer RSG, LLC, Exercise Price $112.50, Expiration Date,1/21/2028(a)(c)(d)(e)(f) | | | 1,846 | |
| | | 492,610 | | Waratek, Ltd., Exercise Price 0.01 Euro, Expiration Date,1/22/2028(a)(b)(c)(d)(e)(f) | | | 706,657 | |
| | | | | TOTAL WARRANTS (Cost $0) | | | 1,219,802 | |
| | | | | | | | | |
See accompanying notes to financial statements.
11
Wildermuth Endowment Fund Schedule of Investments - Continued
June 30, 2020 (Unaudited) |
| | Interests,
Shares,
Principal
Amount,
or Units | | | | Fair
Value | |
| | | | | SHORT-TERM INVESTMENTS — 4.8% | | | | |
| | | 8,595,244 | | Fidelity Institutional Government Portfolio - Institutional Class, 0.06%(k) | | $ | 8,595,244 | |
| | | | | TOTAL SHORT-TERM INVESTMENTS (Cost $8,595,244) | | | 8,595,244 | |
| | | | | | | | | |
| | | | | TOTAL INVESTMENTS — 98.4% (Cost $143,890,655) | | | 175,176,358 | |
| | | | | Other assets less liabilities — 1.6% | | | 2,843,912 | |
| | | | | TOTAL NET ASSETS — 100.0% | | $ | 178,020,270 | |
ADR – American Depository Receipt
LIBOR – London Inter-Bank Offered Rate
LLC – Limited Liability Company
LP – Limited Partnership
PLC – Public Limited Company
REIT – Real Estate Investment Trusts
SLP – Special Limited Partnership
(b) | Denotes an investment in an affiliated entity. Please refer to Note 8, Investments in Affiliated Issuers, in the Notes to the Financial Statements. |
(c) | Illiquid Security. As of June 30, 2020 these securities amounted to $132,498,023 representing 74.43% of total net assets. |
(d) | Level 3 security in accordance with fair value hierarchy. |
(e) | Restricted Security. As of June 30, 2020 these securities amounted to $132,498,023 representing 74.43% of total net assets. Please refer to Note 7, Investments in Restricted Securities, in the Notes to the Financial Statements. |
(f) | Security fair valued using method determined in good faith by the Fair Value Committee designated by the Board of Trustees. As of June 30, 2020 these securities amounted to $77,422,072 representing 43.49% of total net assets. |
(g) | Private Fund. As of June 30, 2020 these securities amounted to $36,851,821 representing 20.70% of total net assets. |
(h) | Security is in default. |
(i) | Private Investment Company. As of June 30, 2020 these securities amounted to $20,622,525 representing 11.58% of total net assets. |
(j) | Denotes a floating rate security. Floating rate securities are securities whose yields vary with a designated market index or market rate. |
(k) | Represents the current rate as of June 30, 2020. |
See accompanying notes to financial statements.
12
Wildermuth Endowment Fund Statement of Assets and Liabilities As of June 30, 2020 (Unaudited) |
Assets: | | | | |
Investments in unaffiliated issuers at fair value (cost $82,096,496) | | $ | 85,618,004 | |
Investments in affiliated issuers at fair value (cost $61,794,159) | | | 89,558,354 | |
Cash | | | 88 | |
Receivables: | | | | |
Due from Investment Adviser (Note 4) | | | 1,084,885 | |
Dividends and interest | | | 1,191,673 | |
Prepaid expenses | | | 58,509 | |
Other receivables | | | 665,163 | |
Total assets | | | 178,176,676 | |
| | | | | |
Liabilities: | | | | |
Payables: | | | | |
Shareholder servicing fees | | | 28,472 | |
Transfer agent fees and expenses | | | 17,594 | |
Fund accounting and administration fees | | | 19,132 | |
Custody fees | | | 4,939 | |
Distribution fees | | | 33,704 | |
Accrued other liabilities | | | 52,565 | |
Total liabilities | | | 156,406 | |
Net Assets | | $ | 178,020,270 | |
| | | | | |
Net Assets Consist of: | | | | |
Paid in capital (unlimited shares authorized, 25,000,000 shares registered, no par value) | | $ | 154,698,123 | |
Total distributable earnings | | | 23,322,147 | |
Net Assets | | $ | 178,020,270 | |
| | | | | |
Net Assets: | | | | |
Class A | | $ | 83,477,169 | |
Class C | | | 54,425,869 | |
Class I | | | 40,117,232 | |
Net Assets | | $ | 178,020,270 | |
| | | | | |
Shares of Beneficial Interest Issued and Outstanding: | | | | |
Class A shares | | | 6,259,180 | |
Class C shares | | | 4,215,460 | |
Class I shares | | | 2,978,646 | |
Total Shares Outstanding | | | 13,453,286 | |
| | | | | |
Net Asset Value, Offering Price and Redemption Proceeds Per Share:(1) | | | | |
Class A | | $ | 13.34 | |
Class C(2) | | $ | 12.91 | |
Class I | | $ | 13.47 | |
Class A - Maximum offering price per share (Net asset value per share divided by 0.9425)(3) | | $ | 14.15 | |
(1) | Redemptions made within 90 days of purchase may be asessed a redemption fee of 2.00%. |
(2) | Class C Shares of the Fund are subject to a Contingent Deferred Sales Chare (“CDSC”) of 1.00% on any shares sold within 365 days of purchase. |
(3) | Reflects a maximum sales charge of 5.75%. |
See accompanying notes to financial statements.
13
Wildermuth Endowment Fund Statement of Operations For the six months ended June 30, 2020 (Unaudited) |
Investment Income: | | | | |
Interest from unaffiliated issuers | | $ | 461,838 | |
Interest from affiliated issuers | | | 456,460 | |
Dividends from unaffiliated issuers (net of foreign withholding taxes of $12,049) | | | 389,247 | |
Dividends from affiliated issuers | | | 382,343 | |
Other income | | | 83,559 | |
Total investment income | | | 1,773,447 | |
| | | | | |
Expenses: | | | | |
Investment Advisory fees (see Note 4) | | | 1,308,346 | |
Distribution fees - Class C | | | 208,770 | |
Legal fees | | | 182,505 | |
Shareholder servicing fees - Class A & Class C | | | 175,255 | |
Accounting and administration servicing fees | | | 151,788 | |
Transfer agent fees | | | 124,830 | |
Audit fees | | | 95,498 | |
Printing and postage expenses | | | 60,091 | |
Pricing and valuation service fees | | | 49,278 | |
Trustees’ fees | | | 43,472 | |
Chief compliance officer fees | | | 28,757 | |
Chief financial officer fees | | | 26,966 | |
Registration fees | | | 22,800 | |
Miscellaneous expenses | | | 15,502 | |
Custodian fees | | | 14,438 | |
Insurance expense | | | 12,079 | |
Total expenses | | | 2,520,375 | |
Expenses waived by Adviser (see Note 4) | | | (173,831 | ) |
Net expenses | | | 2,346,544 | |
Net investment loss | | | (573,097 | ) |
| | | | | |
Realized and Unrealized Gain (Loss) on Investments and foreign currency: | | | | |
Net realized loss on: | | | | |
Investments in unaffiliated issuers | | | (2,447,784 | ) |
Foreign currency transactions | | | (8,043 | ) |
Total net realized loss | | | (2,455,827 | ) |
Net change in unrealized appreciation (depreciation) on: | | | | |
Investments in unaffiliated issuers | | | (5,222,887 | ) |
Investments in affiliated issuers | | | 2,871,958 | |
Foreign currency translations | | | 3,561 | |
Total net change in unrealized depreciation | | | (2,347,368 | ) |
Net realized and unrealized loss on investments and foreign currency | | | (4,803,195 | ) |
| | | | | |
Net Decrease in Net Assets Resulting from Operations | | $ | (5,376,292 | ) |
See accompanying notes to financial statements.
14
Wildermuth Endowment Fund Statements of Changes in Net Assets |
| | | For the six
months ended
June 30, 2020
(Unaudited) | | | For the
year ended
December 31,
2019 | |
Increase/(Decrease) in Net Assets From: | | | | | | | | |
Operations: | | | | | | | | |
Net investment loss | | $ | (573,097 | ) | | $ | (1,247,938 | ) |
Net realized loss on investments | | | (2,455,827 | ) | | | (8,622,913 | ) |
Net change in unrealized appreciation (depreciation) on investments | | | (2,347,368 | ) | | | 24,547,091 | |
Net increase (decrease) in net assets resulting from operations | | | (5,376,292 | ) | | | 14,676,240 | |
| | | | | | | | | |
Distributions to Shareholders: | | | | | | | | |
From other sources (tax return of capital): | | | | | | | | |
Class A | | | (543,211 | ) | | | (2,301,159 | ) |
Class C | | | (366,907 | ) | | | (1,288,847 | ) |
Class I | | | (258,281 | ) | | | (822,680 | ) |
Total: | | | (1,168,399 | ) | | | (4,412,686 | ) |
Total distributions to shareholders | | $ | (1,168,399 | ) | | $ | (4,412,686 | ) |
See accompanying notes to financial statements.
15
Wildermuth Endowment Fund Statements of Changes in Net Assets - Continued |
| | | For the six
months ended
June 30, 2020
(Unaudited) | | | For the
year ended
December 31,
2019 | |
Capital Share Transactions: | | | | | | | | |
Net proceeds from Class A shares sold | | $ | 7,747,878 | | | $ | 34,124,083 | |
Net proceeds from Class C shares sold | | | 2,455,420 | | | | 17,098,216 | |
Net proceeds from Class I shares sold | | | 5,411,498 | | | | 27,493,959 | |
Reinvestment of distributions from Class A shares | | | — | | | | 1,090,416 | |
Reinvestment of distributions from Class C shares | | | — | | | | 1,088,395 | |
Reinvestment of distributions from Class I shares | | | — | | | | 661,696 | |
Cost of Class A shares redeemed | | | (2,028,385 | ) | | | (30,119,763 | ) |
Cost of Class C shares redeemed | | | (633,519 | ) | | | (2,590,991 | ) |
Cost of Class I shares redeemed | | | (2,103,974 | ) | | | (3,395,157 | ) |
Redemption fees | | | 7,243 | | | | 16,452 | |
Capital contribution from affiliate (Note 4) | | | 199,890 | | | | 663,313 | |
Net increase from capital share transactions | | | 11,056,051 | | | | 46,130,619 | |
| | | | | | | | | |
Net change in net assets | | | 4,511,360 | | | | 56,394,173 | |
| | | | | | | | | |
Net Assets: | | | | | | | | |
Beginning of period | | | 173,508,910 | | | | 117,114,737 | |
End of period | | $ | 178,020,270 | | | $ | 173,508,910 | |
| | | | | | | | | |
Share Activity: | | | | | | | | |
Issuance of Class A shares | | | 544,188 | | | | 2,524,088 | |
Issuance of Class C shares | | | 177,626 | | | | 1,302,018 | |
Issuance of Class I shares | | | 376,436 | | | | 1,999,921 | |
Class A shares reinvested | | | — | | | | 80,385 | |
Class C shares reinvested | | | — | | | | 82,487 | |
Class I shares reinvested | | | — | | | | 47,928 | |
Class A shares redeemed | | | (141,254 | ) | | | (2,197,236 | ) |
Class C shares redeemed | | | (46,014 | ) | | | (194,887 | ) |
Class I shares redeemed | | | (145,202 | ) | | | (245,199 | ) |
Net increase in shares of beneficial interest outstanding | | | 765,780 | | | | 3,399,505 | |
See accompanying notes to financial statements.
16
Wildermuth Endowment Fund Statement of Cash Flows (Unaudited) |
| | | For the six
months ended
June 30, 2020 | |
Cash flows from operating activities: | | | | |
Net increase in net assets resulting from operations | | $ | (5,376,292 | ) |
Adjustments to reconcile net increase in net assets resulting from operations to net cash used in operating activities: | | | | |
Purchases of investments | | | (34,920,532 | ) |
Purchase of short term investments, net | | | (4,973,269 | ) |
Proceeds from sale of investments | | | 32,406,625 | |
Net realized loss from investments | | | 2,447,784 | |
Net realized loss from foreign currency transactions | | | 8,043 | |
Net unrealized depreciation on investments | | | 2,350,929 | |
Net unrealized appreciation on foreign currency translations | | | (3,561 | ) |
Return of capital and non-income distributions received | | | (1,716,186 | ) |
| | | | | |
Changes in assets and liabilities | | | | |
(Increase)/Decrease in assets: | | | | |
Due from Investment Adviser | | | (403,336 | ) |
Dividend and interest receivable | | | (203,836 | ) |
Return of capital receivable | | | 449,580 | |
Receivable for investment securities sold | | | 55,556 | |
Other receivables | | | 115,055 | |
Prepaid expenses | | | (47,938 | ) |
Increase/(Decrease) in liabilities: | | | | |
Payable for professional fees | | | (121,561 | ) |
Payable for shareholder servicing fees | | | (119 | ) |
Payable for fund accounting and administration fees | | | (7,221 | ) |
Payable for custody fees | | | (624 | ) |
Payables for transfer agent fees and expenses | | | (9,296 | ) |
Payable for distribution fees | | | (1,570 | ) |
Accrued other liabilities | | | (37,387 | ) |
Net cash used in operating activities | | | (9,989,156 | ) |
| | | | | |
Cash flows from financing activities: | | | | |
Proceeds from shares sold | | | 15,720,870 | |
Cost of shares redeemed, net of redemption fees | | | (4,758,635 | ) |
Cash distributions paid, net of reinvestment | | | (1,168,399 | ) |
Capital contributions from affiliates | | | 199,890 | |
Net cash provided by financing activities | | | 9,993,726 | |
| | | | | |
Effects of foreign currency exchange rate changes in cash | | | (4,482 | ) |
| | | | | |
Net change in cash | | | 88 | |
Cash at beginning of period | | | — | |
Cash at end of period | | $ | 88 | |
| | | | | |
Supplemental disclosure of non-cash activity: | | | | |
Reinvestment of fund distributions | | $ | — | |
See accompanying notes to financial statements.
17
Wildermuth Endowment Fund Financial Highlights – Class A |
Per share income and capital changes for a share outstanding throughout each period.
| | | For the six
months ended
June 30, 2020
(Unaudited)(1) | | | For the
year ended
December 31,
2019(1) | | | For the
year ended
December 31,
2018(1) | | | For the
year ended
December 31,
2017(1) | | | For the
year ended
December 31,
2016(1) | | | For the
year ended
December 31,
2015(2) | |
Net asset value, beginning of period | | $ | 13.78 | | | $ | 12.69 | | | $ | 13.21 | | | $ | 11.81 | | | $ | 10.79 | | | $ | 10.00 | |
| | | | | | | | | | | | | | | | | | | | | | | | | |
Income from Investment Operations: | | | | | | | | | | | | | | | | | | | | | | | | |
Net investment income (loss)(3) | | | (0.04 | ) | | | (0.08 | ) | | | 0.06 | | | | (0.04 | ) | | | 0.01 | | | | 0.05 | |
Net realized and unrealized gain (loss) on investments | | | (0.31 | ) | | | 1.55 | | | | (0.23 | ) | | | 1.80 | | | | 1.19 | | | | 0.93 | (4) |
Total from investment operations | | | (0.35 | ) | | | 1.47 | | | | (0.17 | ) | | | 1.76 | | | | 1.20 | | | | 0.98 | |
Less Distributions: | | | | | | | | | | | | | | | | | | | | | | | | |
From net investment income | | | — | | | | — | | | | — | | | | — | | | | — | | | | (0.03 | ) |
From return of capital | | | (0.09 | ) | | | (0.38 | ) | | | (0.32 | ) | | | (0.18 | ) | | | (0.18 | ) | | | (0.16 | ) |
From net realized gains | | | — | | | | — | | | | (0.03 | ) | | | (0.18 | ) | | | — | | | | — | |
Total distributions | | | (0.09 | ) | | | (0.38 | ) | | | (0.35 | ) | | | (0.36 | ) | | | (0.18 | ) | | | (0.19 | ) |
Net asset value, end of period | | $ | 13.34 | | | $ | 13.78 | | | $ | 12.69 | | | $ | 13.21 | | | $ | 11.81 | | | $ | 10.79 | |
| | | | | | | | | | | | | | | | | | | | | | | | | |
Total return(5) | | | (2.57 | )%(6)(8) | | | 11.65 | %(7) | | | (1.38 | )% | | | 15.07 | % | | | 11.27 | % | | | 9.74 | %(8) |
| | | | | | | | | | | | | | | | | | | | | | | | | |
Ratios and Supplemental Data: | | | | | | | | | | | | | | | | | | | | | | | | |
Net assets, end of period (in thousands) | | $ | 83,477 | | | $ | 80,692 | | | $ | 69,143 | | | $ | 61,568 | | | $ | 31,686 | | | $ | 14,467 | |
Ratio of gross expenses to average net assets(9)(10) | | | 2.72 | %(11) | | | 2.97 | % | | | 3.21 | % | | | 3.32 | % | | | 4.73 | % | | | 16.65 | %(11) |
Ratio of net expenses to average net assets(9)(12) | | | 2.50 | %(11) | | | 2.50 | % | | | 2.50 | % | | | 2.50 | % | | | 2.50 | % | | | 2.50 | %(11) |
Ratio of net investment income (loss) to average net assets(9)(13) | | | (0.50 | )%(11) | | | (0.63 | )% | | | 0.45 | % | | | (0.35 | )% | | | 0.07 | % | | | 0.49 | %(11) |
Portfolio turnover rate | | | 19 | %(8) | | | 29 | % | | | 31 | % | | | 51 | % | | | 55 | % | | | 107 | %(8) |
(1) | Redemption fees consisted of per share amounts of less than $0.01. |
(2) | The Fund commenced operations on January 2, 2015 (inception date 12/31/2014). |
(3) | Per share amounts calculated using the average shares method. |
(4) | Realized and unrealized gain per share does not correlate to the aggregate of the net realized and unrealized gains on the Statement of Operations for the period ended December 31, 2015, primarily due to the timing of sales and repurchases of the Fund’s shares in relation to fluctuating market values for the Fund’s portfolio. |
(5) | Total returns would have been lower had certain expenses not been waived or absorbed by the Adviser. Returns shown do not include payment of a maximum sales load of offering price. If the sales charge was included total returns would be lower. The maximum sales load in 2016 and 2015 was 6.00% of offering price. Effective October 20, 2017 the maximum sales load was changed to 5.75% of offering price. |
(6) | Total return would have been (2.72)% absent the Capital Contribution from the Adviser (see Note 4). |
(7) | Total return would have been 11.24% absent the Capital Contribution from the Adviser (see Note 4 in the annual report to shareholders dated December 31, 2019). |
(9) | The ratios of expenses and net investment income to average net assets do not reflect the Fund’s proportionate share of income and expenses of underlying investment companies in which the Fund invests. |
(10) | Represents the ratio of expenses to average net assets absent fee waivers and/or expense reimbursements. |
(12) | Represents the ratio of expenses to average net assets inclusive of fee waivers and/or expense reimbursements by Adviser. |
(13) | Recognition of net investment income by the Fund is affected by the timing of the declaration of dividends by the underlying investment companies in which the Fund invests. |
See accompanying notes to financial statements.
18
Wildermuth Endowment Fund Financial Highlights – Class C |
Per share income and capital changes for a share outstanding throughout each period.
| | | For the six
months ended
June 30, 2020
(Unaudited) | | | For the
year ended
December 31,
2019(1) | | | For the
year ended
December 31,
2018(1) | | | For the
year ended
December 31,
2017 | | | For the
period ended
December 31,
2016(2) | |
Net asset value, beginning of period | | $ | 13.37 | | | $ | 12.40 | | | $ | 13.02 | | | $ | 11.73 | | | $ | 10.68 | |
| | | | | | | | | | | | | | | | | | | | | |
Income from Investment Operations: | | | | | | | | | | | | | | | | | | | | |
Net investment loss(3) | | | (0.07 | ) | | | (0.18 | ) | | | (0.02 | ) | | | (0.13 | ) | | | (0.07 | ) |
Net realized and unrealized gain (loss) on investments | | | (0.30 | ) | | | 1.50 | | | | (0.25 | ) | | | 1.78 | | | | 1.25 | |
Total from investment operations | | | (0.37 | ) | | | 1.32 | | | | (0.27 | ) | | | 1.65 | | | | 1.18 | |
Less Distributions: | | | | | | | | | | | | | | | | | | | | |
From return of capital | | | (0.09 | ) | | | (0.35 | ) | | | (0.32 | ) | | | (0.18 | ) | | | (0.13 | ) |
From net realized gains | | | — | | | | — | | | | (0.03 | ) | | | (0.18 | ) | | | — | |
Total distributions | | | (0.09 | ) | | | (0.35 | ) | | | (0.35 | ) | | | (0.36 | ) | | | (0.13 | ) |
Net asset value, end of period | | $ | 12.91 | | | $ | 13.37 | | | $ | 12.40 | | | $ | 13.02 | | | $ | 11.73 | |
| | | | | | | | | | | | | | | | | | | | | |
Total return(4) | | | (2.80 | )%(5)(7) | | | 10.74 | %(6) | | | (2.18 | )% | | | 14.23 | % | | | 11.10 | %(7) |
| | | | | | | | | | | | | | | | | | | | | |
Ratios and Supplemental Data: | | | | | | | | | | | | | | | | | | | | |
Net assets, end of period (in thousands) | | $ | 54,426 | | | $ | 54,614 | | | $ | 35,888 | | | $ | 18,435 | | | $ | 4,951 | |
Ratio of gross expenses to average net assets(8)(9) | | | 3.47 | %(10) | | | 3.72 | % | | | 3.96 | % | | | 4.07 | % | | | 5.63 | %(10) |
Ratio of net expenses to average net assets(8)(11) | | | 3.25 | %(10) | | | 3.25 | % | | | 3.25 | % | | | 3.25 | % | | | 3.25 | %(10) |
Ratio of net investment loss to average net assets(8)(12) | | | (1.20 | )%(10) | | | (1.40 | )% | | | (0.20 | )% | | | (1.08 | )% | | | (0.77 | )%(10) |
Portfolio turnover rate | | | 19 | %(7) | | | 29 | % | | | 31 | % | | | 51 | % | | | 55 | %(7) |
(1) | Redemption fees consisted of per share amounts of less than $0.01. |
(2) | Reflects operations for the period from March 14, 2016 (inception date) to December 31, 2016. |
(3) | Per share amounts calculated using the average shares method. |
(4) | Total returns would have been lower had certain expenses not been waived or absorbed by the Adviser. Returns shown do not include payment of a Contingent Deferred Sales Charge (“CDSC”) of 1.00% on any shares sold within 365 days of purchase. If the sales charge was included total returns would be lower. |
(5) | Total return would have been (2.88)% absent the Capital Contribution from the Adviser (see Note 4). |
(6) | Total return would have been 10.33% absent the Capital Contribution from the Adviser (see Note 4 in the annual report to shareholders dated December 31, 2019). |
(8) | The ratios of expenses and net investment income to average net assets do not reflect the Fund’s proportionate share of income and expenses of underlying investment companies in which the Fund invests. |
(9) | Represents the ratio of expenses to average net assets absent fee waivers and/or expense reimbursements. |
(11) | Represents the ratio of expenses to average net assets inclusive of fee waivers and/or expense reimbursements by Adviser. |
(12) | Recognition of net investment income by the Fund is affected by the timing of the declaration of dividends by the underlying investment companies in which the Fund invests. |
See accompanying notes to financial statements.
19
Wildermuth Endowment Fund Financial Highlights – Class I |
Per share income and capital changes for a share outstanding throughout each period.
| | | For the six
months ended
June 30, 2020
(Unaudited)(1) | | | For the
year ended
December 31,
2019 | | | For the
year ended
December 31,
2018 | | | For the
period ended
December 31,
2017(2) | |
Net asset value, beginning of period | | $ | 13.91 | | | $ | 12.79 | | | $ | 13.27 | | | $ | 12.26 | |
| | | | | | | | | | | | | | | | | |
Income from Investment Operations: | | | | | | | | | | | | | | | | |
Net investment income (loss)(3) | | | (0.01 | ) | | | (0.06 | ) | | | 0.17 | | | | 0.02 | |
Net realized and unrealized gain (loss) on investments | | | (0.34 | ) | | | 1.58 | | | | (0.31 | ) | | | 1.30 | |
Total from investment operations | | | (0.35 | ) | | | 1.52 | | | | (0.14 | ) | | | 1.32 | |
Less Distributions: | | | | | | | | | | | | | | | | |
From return of capital | | | (0.09 | ) | | | (0.41 | ) | | | (0.32 | ) | | | (0.13 | ) |
From net realized gains | | | — | | | | — | | | | (0.03 | ) | | | (0.18 | ) |
Total distributions | | | (0.09 | ) | | | (0.41 | ) | | | (0.35 | ) | | | (0.31 | ) |
Redemption Fees: | | | — | | | | 0.01 | | | | 0.01 | | | | — | |
Net asset value, end of period | | $ | 13.47 | | | $ | 13.91 | | | $ | 12.79 | | | $ | 13.27 | |
| | | | | | | | | | | | | | | | | |
Total return | | | (2.55 | )%(4)(6) | | | 12.06 | %(5) | | | (1.07 | )% | | | 10.87 | %(6) |
| | | | | | | | | | | | | | | | | |
Ratios and Supplemental Data: | | | | | | | | | | | | | | | | |
Net assets, end of period (in thousands) | | $ | 40,117 | | | $ | 38,203 | | | $ | 12,084 | | | $ | 283 | |
Ratio of gross expenses to average net assets(7)(8) | | | 2.47 | %(9) | | | 2.72 | % | | | 2.96 | % | | | 3.24 | %(9) |
Ratio of net expenses to average net assets(7)(10) | | | 2.25 | %(9) | | | 2.25 | % | | | 2.25 | % | | | 2.25 | %(9) |
Ratio of net investment income (loss) to average net assets(7)(11) | | | (0.23 | )%(9) | | | (0.42 | )% | | | 1.27 | % | | | 0.26 | %(9) |
Portfolio turnover rate | | | 19 | %(6) | | | 29 | % | | | 31 | % | | | 51 | %(6) |
(1) | Redemption fees consisted of per share amounts of less than $0.01. |
(2) | Reflects operations for the period from April 28, 2017 (inception date) to December 31, 2017. |
(3) | Per share amounts calculated using the average shares method. |
(4) | Total return would have been (2.69)% absent the Capital Contribution from the Adviser (see Note 4). |
(5) | Total return would have been 11.58% absent the Capital Contribution from the Adviser (see Note 4 in the annual report to shareholders dated December 31, 2019). |
(7) | The ratios of expenses and net investment income to average net assets do not reflect the Fund’s proportionate share of income and expenses of underlying investment companies in which the Fund invests. |
(8) | Represents the ratio of expenses to average net assets absent fee waivers and/or expense reimbursements. |
(10) | Represents the ratio of expenses to average net assets inclusive of fee waivers and/or expense reimbursements by Adviser. |
(11) | Recognition of net investment income by the Fund is affected by the timing of the declaration of dividends by the underlying investment companies in which the Fund invests. |
See accompanying notes to financial statements.
20
Wildermuth Endowment Fund Notes to Financial Statements June 30, 2020 (Unaudited) |
1. ORGANIZATION
Wildermuth Endowment Fund (the “Fund”) is registered under the Investment Company Act of 1940, as amended (the “1940 Act”), as a non-diversified, closed-end management investment company that is operated as an interval fund. The Fund was organized as a Delaware statutory trust on August 28, 2013, and did not have any operations from that date until December 31, 2014, other than those relating to organizational matters and registration of its shares under applicable securities law. The Fund commenced operations on January 2, 2015. The Fund’s investment objective is to seek total return through a combination of long-term capital appreciation and income generation. The Fund will pursue its objective by investing in assets that Wildermuth Advisory, LLC (the “Adviser”) believes provide favorable long-term capital appreciation and risk-adjusted return potential, as well as in income-producing assets that the Adviser believes will provide consistent income generation and liquidity.
The Fund is engaged in a continuous offering, up to a maximum of 25 million shares of beneficial interest, and operates as an interval fund that offers to make quarterly repurchases of shares at the Fund’s net asset value (“NAV”). The Fund currently offers three different classes of shares: Class A, Class C, and Class I shares.
2. SUMMARY OF SIGNIFICANT ACCOUNTING POLICIES
The following is a summary of significant accounting policies followed by the Fund in the preparation of its financial statements. These policies are in conformity with accounting principles generally accepted in the United States of America (“US GAAP”). The preparation of financial statements requires management to make estimates and assumptions that affect the reported amounts of assets and liabilities and disclosure of contingent assets and liabilities at the date of the financial statements and the reported amounts of income and expenses for the period. Actual results could differ from those estimates. The Fund is an investment company and follows the accounting and reporting requirements under Financial Accounting Standards Board (“FASB”) Accounting Standards (“ASC”) Topic 946, Financials Services – Investment Companies.
Investment Valuation – For purposes of determining the NAV of the Fund, and as applicable, readily marketable portfolio securities listed on the NYSE are valued, except as indicated below, at the last sale price reflected on the consolidated tape at the close of the NYSE on the business day as of which such value is being determined. If there has been no sale on such day, the securities are valued at the mean of the closing bid and asked prices on such day. If no bid or asked prices are quoted on such day or if market prices may be unreliable because of events occurring after the close of trading, then the security is valued by such method as the Fair Value Committee shall determine in good faith to reflect its fair market value. Readily marketable securities not listed on the NYSE but listed on other domestic or foreign securities exchanges are valued in a like manner. Portfolio securities traded on more than one securities exchange are valued at the last sale price on the business day as of which such value is being determined as reflected on the consolidated tape at the close of the exchange representing the principal market for such securities. Securities trading on NASDAQ are valued at the closing price, or, in the case of securities not reported by NASDAQ, a comparable source, as the Fair Value Committee deems appropriate to reflect their fair market value. If there has been no sale on such day, the securities are valued at the mean of the closing bid and asked prices for the day, or if no asked price is available, at the bid price. However, certain debt securities may be valued on the basis of prices provided by a pricing service based on broker or dealer supplied valuations or matrix pricing, a method of valuing securities by reference to the value of other securities with similar characteristics, such as rating, interest rate and maturity.
The “last reported” trade price or sale price or “closing” bid price of a security on any trading day shall be deemed to be: (a) with respect to securities traded primarily on the NYSE, the American Stock Exchange or NASDAQ, the last reported trade price or sale price, as the case may be, as of 4:00 p.m., Eastern Time, on that day, and (b) for securities listed, traded or quoted on any other exchange, market, system or service, the market price as of the end of the “regular hours” trading period that is generally accepted as such by such exchange, market, system or service. If, in the future, the benchmark times generally accepted in the securities industry for determining the market price of a stock as of a given trading day shall change from those set forth above, the fair market value of a security shall be determined as of such other generally accepted benchmark times.
Non-U.S. dollar denominated securities, if any, are valued as of the close of the NYSE at the closing price of such securities in their principal trading market, but may be valued at fair value if subsequent events occurring before the computation of NAV have materially affected the value of the securities. Trading may take place in foreign issues held by the Fund, if any, at times when the Fund is not open for business. As a result, the Fund’s NAV may change at times when it is not possible to purchase or sell shares of the Fund.
21
Wildermuth Endowment Fund Notes to Financial Statements - Continued
June 30, 2020 (Unaudited) |
If market quotations are not readily available, securities are valued at fair values as determined in good faith by the Board of Trustees (the “Board”). The Board has delegated the day-to-day responsibility for determining these fair values, in accordance with the policies it has approved, to the Fair Value Committee, subject to Valuation Committee and ultimately Board oversight. The Fair Value Committee will provide the Board with periodic reports, no less frequently than quarterly, that discuss the functioning of the valuation process, if applicable to that period, and that identify issues and valuation problems that have arisen, if any. As appropriate, the Valuation Committee and the Board will review any securities valued by the Fair Value Committee in accordance with the Fund’s valuation policies during these periodic reports.
Investments in private equity and private equity debt instruments initially will be valued at cost (purchase price plus all related acquisition costs and expenses, such as legal fees and closing costs) and thereafter will be revalued quarterly at fair value based on payment history, market conditions, collateral of underlying debt and credit quality of borrower.
As a general matter, the fair value of the Fund’s interest in Investment Funds that are Commodity and Natural Resource Investments, Direct Real Estate Funds, Hedge Funds, High Yield Loans, Private Equity Funds, Private Equity Debt, Private Real Estate Funds, Non-Traded REITs and Real Estate Loans (“Non-Traded Funds”), will represent the amount that the Fund could reasonably expect to receive from the Non-Traded Fund if the Fund’s interest was redeemed at the time of valuation, based on information reasonably available at the time the valuation is made and that the Fund believes to be reliable. Investments in Non-Traded Funds are recorded at fair value, using the Non-Traded Fund’s net asset value as a practical expedient. Based on guidance provided by FASB, investments for which fair value is measured using the net asset value practical expedient are not required to be categorized in the fair value hierarchy. In the event a Non-Traded Fund does not report a value to the Fund on a timely basis, the Fair Value Committee, acting under the Valuation Committee and ultimately the Board’s supervision and pursuant to policies implemented by the Board, will determine the fair value of the Fund’s investment based on the most recent value reported by the Non-Traded Fund, as well as any other relevant information available at the time the Fund values its investments. Following procedures adopted by the Board, in the absence of specific transaction activity in a particular investment fund, the Fair Value Committee will consider whether it is appropriate, in light of all relevant circumstances, to value the Fund’s investment at the NAV reported by the Non-Traded Fund at the time of valuation or to adjust the value to reflect a fair value.
Securities for which market quotations are not readily available (including restricted securities and private placements, if any) are valued at their fair value as determined in good faith under consistently applied procedures approved by the Board. Methodologies and factors used to fair value securities may include, but are not limited to, the analysis of current debt to cash flow, information of any recent sales, the analysis of the company’s financial statements, quotations or evaluated prices from broker-dealers, information obtained from the issuer or analysts and the nature of the existing market for securities with characteristics similar to such obligations. Valuations may be derived following a review of pertinent data (EBITDA, Revenue, etc.) from company financial statements, relevant market valuation multiples for comparable companies in comparable industries, recent transactions, and management assumptions. The Fund may use fair value pricing for foreign securities if a material event occurs that may affect the price of a security after the close of the foreign market or exchange (or on days the foreign market is closed) but before the Fund prices its portfolio, generally at 4:00 p.m. Eastern Time. Fair value pricing may also be used for securities acquired as a result of corporate restructurings or reorganizations, as reliable market quotations for such issues may not be readily available. For securities valued in good faith, the value of an investment used to determine the Fund’s net asset value may differ from published or quoted prices for the same investment. The valuations for these good faith securities are monitored and reviewed in accordance with the methodologies described above by the Fund’s Fair Value Committee on an ongoing basis as information becomes available but are evaluated at least quarterly. The good faith security valuations and fair value methodologies are reviewed and approved by the Fund’s Board on a quarterly basis. There can be no assurance that the Fund could obtain the fair value assigned to an investment if it were to sell the investment at the same time which the Fund determines its net asset value per share.
US GAAP defines fair value, establishes a three-tier framework for measuring fair value based on a hierarchy of inputs, and expands disclosure about fair value measurements. It also provides guidance on determining when there has been a significant decrease in the volume and level of activity for an asset or liability, when a transaction is not orderly and how that information must be incorporated into a fair value measurement. The hierarchy distinguishes between market data obtained from independent sources (observable inputs) and the Fund’s own market assumptions (unobservable inputs). These inputs are used in determining the fair value of the Fund’s investments. These inputs are summarized in the three broad levels listed below:
| | ● | Level 1 – quoted prices in active markets for identical securities. An active market for the security is a market in which transactions occur with sufficient frequency and volume to provide pricing information on an ongoing basis. A quoted price in an active market provides the most reliable evidence of fair value. |
22
Wildermuth Endowment Fund Notes to Financial Statements - Continued
June 30, 2020 (Unaudited) |
| | ● | Level 2 – other significant observable inputs (including quoted prices for similar securities, interest rates, prepayment speeds, credit risk, etc. and quoted prices for identical or similar assets in markets that are not active.) Inputs that are derived principally from or corroborated by observable market data. An adjustment to any observable input that is significant to the fair value may render the measurement a Level 3 measurement. |
| | ● | Level 3 – significant unobservable inputs, including the Fund’s own assumptions in determining the fair value of investments. |
The availability of observable inputs can vary from security to security and is affected by a wide variety of factors, including, for example, the type of security, whether the security is new and not yet established in the marketplace, the liquidity of markets, and other characteristics particular to the security. To the extent that valuation is based on models or inputs that are less observable or unobservable in the market, the determination of fair value requires more judgment. Accordingly, the degree of judgment exercised in determining fair value is greatest for instruments categorized in Level 3.
The inputs used to measure fair value may fall into different levels of the fair value hierarchy. In such cases, for disclosure purposes, the level in the fair value hierarchy within which the fair value measurement falls in its entirety is determined based on the lowest level input that is significant to the fair value measurement in its entirety.
The inputs or methodology used for valuing securities are not necessarily an indication of the risk associated with investing in those securities. The following is a summary of the valuation inputs, representing 100% of the Fund’s investments, used to value the Fund’s assets and liabilities as of June 30, 2020:
| | | | | | | Fair Value Measurements at the
End of the Reporting Period Using | | | | | |
Investment in Securities | | Practical
Expedient** | | | Level 1
Quoted Prices | | | Level 2
Other Significant
Observable Inputs | | | Level 3
Significant
Unobservable
Inputs | | | Total | |
Security Type | | | | | | | | | | | | | | | | | | | | |
Public Equities* | | $ | — | | | $ | 21,664,882 | | | $ | — | | | $ | — | | | $ | 21,664,882 | |
Exchange Traded Funds* | | | — | | | | 12,418,209 | | | | — | | | | — | | | | 12,418,209 | |
Commodity & Natural Resource Investments | | | 669,374 | (1)(6)(7) | | | — | | | | — | | | | 2,698,479 | | | | 3,367,853 | |
Direct Private Equity | | | — | | | | — | | | | — | | | | 66,403,109 | | | | 66,403,109 | |
Direct Real Estate | | | 1,557,869 | (2)(6)(7) | | | — | | | | — | | | | 10,284,843 | | | | 11,842,712 | |
Hedge Funds | | | 5,942,832 | (3)(6)(7) | | | — | | | | — | | | | — | | | | 5,942,832 | |
Private Equity Debt | | | — | | | | — | | | | — | | | | 9,010,072 | | | | 9,010,072 | |
Private Equity Funds | | | 12,072,835 | (4)(6)(8) | | | — | | | | — | | | | 155,838 | | | | 12,228,673 | |
Private Real Estate Investments | | | 17,746,530 | (5)(6)(9) | | | — | | | | — | | | | — | | | | 17,746,530 | |
Public Real Estate Investments | | | — | | | | 559,682 | | | | — | | | | — | | | | 559,682 | |
Real Estate Loans | | | — | | | | — | | | | — | | | | 4,176,758 | | | | 4,176,758 | |
Warrants | | | — | | | | — | | | | — | | | | 1,219,802 | | | | 1,219,802 | |
Short Term Investments | | | — | | | | 8,595,244 | | | | — | | | | — | | | | 8,595,244 | |
Total | | $ | 37,989,440 | | | $ | 43,238,017 | | | $ | — | | | $ | 93,948,901 | | | $ | 175,176,358 | |
* | All sub-categories within the security type represent their respective evaluation status. For a detailed breakout by industry, please refer to the Schedule of Investments. |
** | Certain investments that are measured at fair value using the net asset value per share (or its equivalent) practical expedient have not been categorized in the fair value hierarchy. The fair value amounts presented in this table are intended to permit reconciliation of the fair value hierarchy to the amounts presented in the schedule of investments. |
23
Wildermuth Endowment Fund Notes to Financial Statements - Continued
June 30, 2020 (Unaudited) |
| (1) | Security | | | Value | | | Unfunded Commitments | | | | Withdrawals Permitted | | | Redemption Notice Period | | Investment Objective | | Investment Strategy | | Lock Up Period | | | Remaining Life | | | Redemption Terms and Restrictions | | |
| | Kayne Anderson Energy Fund VII LP | | | 669,374 | | | 517,590 | | | | Not Applicable | | | Not Applicable | | Capital Gains | | Purchase oil and gas companies; extraction and production companies. | | N/A | | | Up to 8 years | | | Up to 8 years | | |
| (2) | Security | | | Value | | | Unfunded Commitments | | | | Withdrawals Permitted | | | Redemption Notice Period | | Investment Objective | | Investment Strategy | | Lock Up Period | | | Remaining Life | | | Redemption Terms and Restrictions | | |
| | Brookwood SFL Investor Co-Investment Vehicle, LLC | | | 1,557,869 | | | — | | | | Not Applicable | | | Not Applicable | | Capital Gains and Current Income | | Real Estate | | N/A | | | Unit Asset is Sold | | | No redemption rights | | |
| (3) | Security | | | Value | | | Unfunded Commitments | | | | Withdrawals Permitted | | | Redemption Notice Period | | Investment Objective | | Investment Strategy | | Lock Up Period | | | Remaining Life | | | Redemption Terms and Restrictions | | |
| | Altegris Millennium Fund LP | | | 1,128,367 | | | — | | | | Quarterly | | | Not Applicable | | Capital Gains and Income | | Multistrategy hedge fund | | N/A | | | Open Ended | | | 5% quarterly tenders at the fund level with 90 days notice | | |
| | CRC Bond Opportunity Trading Fund LP | | | 2,584,001 | | | — | | | | Monthly | | | 90 days | | Capital Gains and Income | | Opportunistic, event-driven credit fund focused on subordinated debt, preferred equity, and additional Tier 1 capital of banks and financial firms. | | 12 months | | | Open Ended | | | Monthly redemption with 90 days notice | | |
| | EJF Trust Preferred Fund LP | | | 713,571 | | | — | | | | Not Applicable | | | Not Applicable | | Capital Gains and Income | | Event driven with focus on financials | | 3 years | | | Up to 1 year | | | Up to 1
year | | |
| | Rosebrook Opportunities Fund LP | | | 1,516,893 | | | 747,568 | | | | Quarterly | | | Not Applicable | | Capital Appreciation | | Buying distressed hedge fund assets | | N/A | | | Up to 5 years | | | Up to 5 years | | |
| (4) | Security | | | Value | | | Unfunded Commitments | | | | Withdrawals Permitted | | | Redemption Notice Period | | Investment Objective | | Investment Strategy | | Lock Up Period | | | Remaining Life | | | Redemption Terms and Restrictions | | |
| | Abbot Secondary Opportunities LP | | | 1,451,688 | | | 339,566 | | | | Not Applicable | | | Not Applicable | | Capital Gains | | Purchase private equity funds on secondary market | | N/A | | | Up to 6 years | | | Up to 6 years | | |
| | Auda Capital SCS SICAV SIF - Auda Asia Secondary Fund | | | 2,209,414 | | | 819,724 | | | | Not Applicable | | | Not Applicable | | Capital Gains and Dividends | | Purchase private equity funds on the secondary market with exposure to Asian small to mid-sized privately owned companies. | | N/A | | | Up to 10 years | | | Up to 10 years | | |
| | Committed Advisors Secondary Fund III | | | 1,552,531 | | | 709,369 | | | | Not Applicable | | | Not Applicable | | Capital Gains | | Private equity fund with a global focus | | N/A | | | Up to 8 years | | | Up to 8 years | | |
24
Wildermuth Endowment Fund Notes to Financial Statements - Continued
June 30, 2020 (Unaudited) |
| Security | | Value | | | Unfunded Commitments | | | Withdrawals Permitted | | Redemption Notice Period | | Investment Objective | | Investment Strategy | | Lock Up Period | | | Remaining Life | | Redemption Terms and Restrictions |
| EJF Sidecar Fund, Series LLC - Small Financial Equities Series | | | 710,779 | | | | — | | | Not Applicable | | Not Applicable | | Capital Gains and Dividends | | Invests in equity of small depository institutions, including without limitation financial institutions that are impacted directly or indirectly by: (1) bank and thrift recapitalizations and/or restructurings; (2) merger and acquisition activity; and (3) government financial reform related policies. | | | N/A | | | Up to 5 years | | Up to 5 years |
| Gravity Ranch Fund I LP | | | 136,049 | | | | — | | | Not Applicable | | Not Applicable | | Capital Gains | | Venture Capital investing | | | N/A | | | Up to 10 years | | Up to 10 years |
| Greenspring Opportunities V LP | | | 633,028 | | | | 91,000 | | | Not Applicable | | Not Applicable | | Capital Appreciation | | Direct investments in growth stage companies | | | N/A | | | Up to 9 years | | Up to 9 years |
| Madryn Health Partners LP | | | 2,104,773 | | | | 692,474 | | | Not Applicable | | Not Applicable | | Capital Gains | | Invests in commercial-stage healthcare companies | | | N/A | | | Up to 5 years | | Up to 5 years |
| PineBridge Secondary Partners IV SLP | | | 1,335,614 | | | | 788,256 | | | Not Applicable | | Not Applicable | | Capital Appreciation | | Private equity fund of funds | | | N/A | | | Up to 9 years | | Up to 9 years |
| Star Mountain Diversified Credit Income Fund III LP | | | 921,033 | | | | 4,000,000 | | | Not Applicable | | Not Applicable | | Capital Appreciation | | Structured Credit | | | N/A | | | Up to 12 years | | Up to 12 years |
| Star Mountain Diversified Small Business Access Fund II LP | | | 1,017,926 | | | | 78,000 | | | Not Applicable | | Not Applicable | | Capital Appreciation | | Structured Credit | | | N/A | | | Up to 9 years | | Up to 9 years |
| (5) | Security | | | Value | | | Unfunded Commitments | | | | Withdrawals Permitted | | | Redemption Notice Period | | Investment Objective | | Investment Strategy | | Lock Up Period | | | Remaining Life | | | Redemption Terms and Restrictions | | |
| | ARCTRUST, Inc. | | | 1,224,541 | | | — | | | | Suspended | | | 30 days | | Capital Appreciation and Income | | Development, acquisition and financing of commercial properties | | 3 years | | | Until Assets are Sold | | | No redemption rights | | |
| | Broadstone Net Lease, Inc. | | | 1,929,412 | | | — | | | | Quarterly | | | 10 days | | Capital Appreciation and Income | | Real estate | | N/A | | | Open Ended | | | No redemption rights | | |
| | Carlyle Europe Realty Fund, S.C.Sp | | | 2,342,446 | | | 2,905,664 | | | | Not Applicable | | | Not Applicable | | Capital Appreciation and Income | | Primary focus is on large, more liquid Western European markets. Seek to invest at the intersection of hard asset and private equity. | | N/A | | | Up to 6 years | | | Up to 6 years | | |
25
Wildermuth Endowment Fund Notes to Financial Statements - Continued
June 30, 2020 (Unaudited) |
| Security | | Value | | | Unfunded Commitments | | | Withdrawals Permitted | | Redemption Notice Period | | Investment Objective | | Investment Strategy | | Lock Up Period | | | Remaining Life | | Redemption Terms and Restrictions |
| Cottonwood Residential II, Inc. | | | 3,378,755 | | | | — | | | Quarterly | | Not Applicable | | Capital Appreciation and Income | | Development, acquisition and financing of multi-family properties. | | | 1 year | | | Up to 5 years | | Beginning 18 months after the Offering Termination Date and continuing thereafter, the purchase price for the repurchased Shares will be equal to 95% of the net asset value of the Shares |
| Cygnus Property Fund V, LLC | | | 1,751,721 | | | | — | | | Not Applicable | | Not Applicable | | Capital Appreciation and Income | | Distressed debt/special situation and opportunistic real estate investments. | | | N/A | | | Up to 4 years | | Up to 4 years |
| Harbert Seniors Housing Fund I LP | | | 1,386,013 | | | | 265,687 | | | Not Applicable | | Not Applicable | | Capital Appreciation and Income | | Real estate | | | N/A | | | Up to 8 years | | Up to 8 years |
| Harbert Seniors Housing Fund II LP | | | 776,645 | | | | 4,114,542 | | | Not Applicable | | Not Applicable | | Capital Appreciation and Income | | Real estate | | | N/A | | | Up to 11 years | | Up to 11 years |
| PCG Select Series I, LLC - Series A Preferred Stock | | | 267,029 | | | | — | | | Not Applicable | | Not Applicable | | Income | | Real estate loans | | | N/A | | | Up to 7 years | | Up to 7 years |
| PRISA III Fund LP | | | 1,538,401 | | | | 684,046 | | | Quarterly | | 90 days | | Capital Appreciation and Income | | Diversified value-add real estate portfolio that targets above average real estate returns. | | | N/A | | | Open Ended | | Redemptions offered on a quarterly basis with 90 days notice |
| RRA Credit Opportunity Fund LP | | | 1,476,619 | | | | 679,802 | | | Not Applicable | | Not Applicable | | Current Income | | Real estate backed lending | | | N/A | | | Up to 3 years | | Up to 3 years |
| Shopoff Land Fund III LP | | | 33,053 | | | | — | | | Not Applicable | | Not Applicable | | Capital Gains | | Value added Real Estate | | | N/A | | | Up to 2 years | | Up to 2 years |
| Stonehill Strategic Hotel Credit Opportunity Fund II LP | | | 1,010,349 | | | | — | | | Not Applicable | | Not Applicable | | Capital Appreciation and Income | | Value added lending to hospitality assets | | | N/A | | | Up to 6 years | | Up to 6 years |
| Walton Street Real Estate Fund VIII LP | | | 631,546 | | | | 466,089 | | | Not Applicable | | Not Applicable | | Capital Gains | | Value added Real Estate | | | N/A | | | Up to 9 years | | Up to 9 years |
(6) | Redemption frequency and redemption notice period reflect general redemption terms, and exclude liquidity restrictions. Different tranches may have different liquidity terms and may be subject to investor level gates. |
(7) | These investments are domiciled in the United States. |
(8) | These investments are domiciled in the United States with the exception of Auda Capital SCS SICAV SIF - Auda Asia Secondary Fund which is domiciled in Luxembourg and and Committed Advisors Secondary Fund III which is domiciled in France. |
(9) | These investments are domiciled in the United States with the exception of Carlyle Europe Realty Fund S.C.Sp. which is domiciled in Luxembourg |
26
Wildermuth Endowment Fund Notes to Financial Statements - Continued
June 30, 2020 (Unaudited) |
There were no transfers into or out of Level 3 during the reporting period. The following is a roll forward of the activity in investments in which significant unobservable inputs (Level 3) were used in determining fair value on a recurring basis:
| | | Beginning
balance
January 1,
2020 | | | Transfers
into
Level 3
during the
period | | | Transfers
out of
Level 3
during the
period | | | Purchases or
Conversions | | | Sales or
Conversions | | | Net
realized
gain (loss) | | | Return of
Capital | | | Change
in net
unrealized
appreciation
(depreciation) | | | Ending
balance
June 30, 2020 | |
Commodity & Natural Resource Investments | | $ | 3,580,992 | | | $ | — | | | $ | — | | | $ | — | | | $ | — | | | $ | — | | | $ | — | | | $ | (882,513 | ) | | $ | 2,698,479 | |
Direct Private Equity | | | 55,326,942 | | | | — | | | | — | | | | 8,952,175 | | | | — | | | | — | | | | — | | | | 2,123,992 | | | | 66,403,109 | |
Direct Real Estate | | | 11,224,441 | | | | — | | | | — | | | | — | | | | (1,067,990 | ) | | | 33,776 | | | | — | | | | 94,616 | | | | 10,284,843 | |
Private Equity Debt | | | 10,542,418 | | | | — | | | | — | | | | 2,041,699 | | | | (3,918,219 | ) | | | 19,556 | | | | — | | | | 324,618 | | | | 9,010,072 | |
Private Equity Funds | | | 155,838 | | | | — | | | | — | | | | — | | | | — | | | | — | | | | — | | | | — | | | | 155,838 | |
Real Estate Loans | | | 4,474,533 | | | | — | | | | — | | | | — | | | | (297,775 | ) | | | 19,323 | | | | (90,000 | ) | | | 70,677 | | | | 4,176,758 | |
Warrants | | | 2,007,084 | | | | — | | | | — | | | | — | | | | — | | | | — | | | | — | | | | (787,282 | ) | | | 1,219,802 | |
| | | $ | 87,312,248 | | | $ | — | | | $ | — | | | $ | 10,993,874 | | | $ | (5,283,984 | ) | | $ | 72,655 | | | $ | (90,000 | ) | | $ | 944,108 | | | $ | 93,948,901 | |
The change in net unrealized appreciation (depreciation) included in the Statement of Operations attributable to recurring Level 3 investments that were held as of June 30, 2020 is $639,506.
The following is a summary of quantative information about significant unobservable valuation inputs determined by management for Level 3 Fair Measurements for investments held as of June 30, 2020:
Type of Level 3
Investment | | Fair Value as of
June 30, 2020 | | | Valuation
Technique | | | Unobservable
Inputs | | | Range | | | Weighted
Average | | | Impact to
Valuation from
an Increase in
Input | |
Commodity & Natural Resource Investments | | $ | 2,698,479 | | | | Income Approach | | | | NYMEX future strip for WTI crude oil | | | | $29.25/bbl - $55.01/bbl | | | | $42.04 | | | | Increase | |
| | | | | | | | | | | | NYMEX future strip for Henry Hub gas | | | | $2.05/MCF-$3.10/MCF | | | | $2.48 | | | | Increase | |
| | | | | | | | | | | | Discount Rate | | | | 10%-25% | | | | 14.76% | | | | Decrease | |
| | | | | | | | | | | | Risk Factor | | | | 50%-100% | | | | 63.63% | | | | Decrease | |
| | | | | | | | | | | | | | | | | | | | | | | | | |
Direct Real Estate | | | 6,743,241 | | | | Income Approach | | | | Discount Rate | | | | 18%-20% | | | | 19.44% | | | | Decrease | |
| | | | | | | | Market Approach | | | | Cap Rate | | | | 5.5-5.75 | | | | 5.69 | | | | Decrease | |
| | | | | | | | | | | | | | | | | | | | | | | | | |
Private Equity | | | | | | | | | | | | | | | | | | | | | | | | |
Direct Private Equity | | | 66,228,110 | | | | Income Approach | | | | Discount Rate | | | | 30.00% | | | | 30.00% | | | | Decrease | |
| | | | | | | | | | | | | | | | | | | | | | | | | |
| | | | | | | | Guideline company comparison | | | | Projected revenue mulitple | | | | .17x-4.5x | | | | 2.98 | | | | Increase | |
| | | | | | | | | | | | LTM Revenue multiple | | | | 3.75x | | | | 3.75x | | | | Increase | |
| | | | | | | | | | | | | | | | | | | | | | | | | |
| | | | | | | | Guideline company comparison | | | | Book Multiple | | | | 1.5x | | | | 1.5x | | | | Increase | |
| | | | | | | | | | | | | | | | | | | | | | | | | |
27
Wildermuth Endowment Fund Notes to Financial Statements - Continued
June 30, 2020 (Unaudited) |
Type of Level 3
Investment | | Fair Value as of
June 30, 2020 | | | Valuation
Technique | | | Unobservable
Inputs | | | Range | | | Weighted
Average | | | Impact to
Valuation from
an Increase in
Input | |
| | | | | | | | Option pricing method | | | | Time to Liquidity | | | | 2-3 | | | | 2.3 | | | | Decrease | |
| | | | | | | | | | | | Volatility | | | | 59%-75% | | | | 64.34% | | | | Increase | |
| | | | | | | | | | | | Risk Free Rate | | | | .19%-.24% | | | | 0.21% | | | | Decrease | |
| | | | | | | | | | | | | | | | | | | | | | | | | |
| | | | | | | | Market Yield | | | | Time to Liquidity | | | | 2 | | | | 2 | | | | Decrease | |
| | | | | | | | Approach | | | | LIBOR Swap Rate | | | | 0.34% | | | | 0.34% | | | | Decrease | |
| | | | | | | | | | | | Credit Spread | | | | 11.88% | | | | 11.88% | | | | Decrease | |
| | | | | | | | | | | | | | | | | | | | | | | | | |
Private Equity Debt | | $ | 4,771,294 | | | | Income Approach | | | | Discount Rate | | | | 27.5%-28.0% | | | | 27.69% | | | | Decrease | |
| | | | | | | | | | | | | | | | | | | | | | | | | |
Private Equity Funds | | | 155,838 | | | | Market Approach | | | | Discount Rate | | | | 45.00% | | | | 45.00% | | | | Decrease | |
| | | | | | | | | | | | | | | | | | | | | | | | | |
Warrants | | | 1,219,802 | | | | Guideline company comparison | | | | Projected revenue mulitple | | | | 3.5x | | | | 3.5x | | | | Increase | |
| | | | | | | | | | | | | | | | | | | | | | | | | |
| | | | | | | | Guideline company comparison | | | | Book Multiple | | | | 1.5x | | | | 1.5x | | | | Increase | |
| | | | | | | | | | | | | | | | | | | | | | | | | |
| | | | | | | | Option pricing method | | | | Time to Liquidity | | | | 2.0 | | | | 2.0 | | | | Decrease | |
| | | | | | | | | | | | Volatility | | | | 60%-75% | | | | 68.70% | | | | Increase | |
| | | | | | | | | | | | Risk Free Rate | | | | .19%-.20% | | | | 0.20% | | | | Decrease | |
The following is a summary of quantative information about significant unobservable valuation inputs not determined by management for Level 3 Fair Measurements for investments held as of June 30, 2020:
Type of Level 3 Investment | | Fair Value as of
June 30, 2020 | | | Valuation Technique | |
Direct Real Estate | | $ | 3,541,602 | | | | Face Value | |
Direct Private Equity | | | 174,999 | | | | Recent Transaction Value | |
Private Equity Debt | | | 4,238,778 | | | | Recent Transaction Value | |
Real Estate Loans | | | 4,176,758 | | | | Face Value | |
Security Transactions and Related Income – Security transactions are accounted for on trade date basis. Interest income is recognized on an accrual basis. Discounts are accreted and premiums are amortized on securities purchased over the lives of the respective securities. Dividend income is recorded on the ex-dividend date. Distributions from underlying investment companies are classified as investment income or realized gains based on the U.S. income tax characteristics of the distribution. Realized gains or losses from sales of securities are determined by comparing the identified cost of the security lot sold with the net sales proceeds.
Dividends and Distributions to Shareholders – Dividends from gross investment income are declared and distributed quarterly. Distributable net realized capital gains are declared and distributed annually. Dividends from gross investment income and distributions from net realized gains are recorded on ex- dividend date and determined in accordance with federal income tax regulations, which may
28
Wildermuth Endowment Fund Notes to Financial Statements - Continued
June 30, 2020 (Unaudited) |
differ from US GAAP. These “book/tax” differences are considered either temporary (i.e., deferred losses, capital loss carry forwards) or permanent in nature. To the extent these differences are permanent in nature, such amounts are reclassified within the composition of net assets based on their federal tax-basis treatment; temporary differences do not require reclassification.
Distributions received from investments in securities that represent a return of capital or capital gains are recorded as a reduction of cost of investment or as a realized gain, respectively. The calendar year-end amounts of ordinary income, capital gains, and return of capital included in distributions received from the Fund’s investments in real estate investment trusts (“REITs”) are reported to the Fund after the end of the calendar year; accordingly, the Fund estimates these amounts for accounting purposes until the characterization of REIT distributions is reported to the Fund after the end of the calendar year. Estimates are based on the most recent REIT distribution information available.
LIBOR Transition Risk – Certain instruments in which the Fund may invest rely in some fashion upon the London Interbank Offered Rate (“LIBOR”). The United Kingdom’s Financial Conduct Authority, which regulates LIBOR, has announced plans to phase out the use of LIBOR by the end of 2021. There remains uncertainty regarding the future utilization of LIBOR and the nature of any replacement rate, and any potential effects of the transition away from LIBOR on the Fund or on certain instruments in which the Fund invests are not known. The transition process may involve, among other things, increased volatility or illiquidity in markets for instruments that currently rely on LIBOR. The transition, as well as other unforeseen effects, may also result in a reduction in the value of certain instruments held by the Fund.
Investment Companies – The Fund may obtain investment exposure to various asset classes by investing in other investment companies, including registered investment companies, such as exchange-traded funds, mutual funds and closed-end funds, as well as hedge funds, private equity funds or other privately offered pooled investment vehicles that are not registered under the 1940 Act (collectively “Investment Funds”). Each Investment Fund is subject to specific risks, depending on the nature of the fund. These risks could include liquidity risk, sector risk, and foreign currency risk, as well as risks associated with fixed income securities and commodities among others. Also, the Fund’s performance depends in part upon the performance of the Investment Fund managers and selected strategies, the adherence by such Investment Fund managers to such selected strategies, the instruments used by such Investment Fund managers and the Adviser’s ability to select Investment Funds and strategies and effectively allocate Fund assets among them. By investing in Investment Funds indirectly through the Fund, the investor bears asset-based fees at the Fund level, in addition to any asset-based fees and/or performance-based fees and allocations at the Investment Fund level. Moreover, an investor in the Fund bears a proportionate share of the fees and expenses of the Fund (including organizational and offering expenses, operating costs, sales charges, brokerage transaction expenses, and administrative fees) and, indirectly, similar expenses of the Investment Funds. Thus, an investor in the Fund may be subject to higher fees and operating expenses than if he or she invested in an Investment Fund directly.
Federal Income Taxes – It is the Fund’s policy to qualify as a regulated investment company by complying with the provisions of the Internal Revenue Code that are applicable to regulated investment companies and to distribute substantially all of its taxable income and net realized gains to shareholders. Therefore, no federal income tax provision has been recorded.
The Fund recognizes the tax benefits of uncertain tax positions only where the position is “more likely than not” to be sustained assuming examination by tax authorities. Management has analyzed the Fund’s tax positions, and has concluded that no liability for unrecognized tax benefits should be recorded related to uncertain tax positions taken or expected to be taken on returns filed for tax years open for the current and prior three years. The Fund identifies its major tax jurisdictions as U.S. federal, and foreign jurisdictions where the Fund makes significant investments; however, the Fund is not aware of any tax positions for which it is reasonably possible that the total amounts of unrecognized tax benefits will change materially in the next twelve months.
Redemption Fee – For shares held for 90 days or less, the Fund will deduct a 2% redemption fee from the redemption amount if the shares are sold pursuant to the Fund’s quarterly repurchase program. Shares held longest will be treated as being repurchased first and shares held shortest as being repurchased last. The redemption fee does not apply to shares that were acquired through reinvestment of distributions. Shares held for more than 90 days are not subject to the 2% fee. Redemption fees are paid to the Fund directly and are designed to offset costs associated with fluctuations in Fund asset levels and cash flow caused by short-term shareholder trading. For the period ended June 30, 2020, the Fund had contributions to capital due to redemption fees in the amount of $7,243.
29
Wildermuth Endowment Fund Notes to Financial Statements - Continued
June 30, 2020 (Unaudited) |
Indemnification – The Fund indemnifies its officers and trustees for certain liabilities that may arise from the performance of their duties to the Fund. Additionally, in the normal course of business, the Fund enters into contracts that contain a variety of representations and warranties and which provide general indemnities. The Fund’s maximum exposure under these arrangements is unknown, as this would involve future claims that may be made against the Fund that have not yet occurred. However, based on industry experience, the risk of loss due to these warranties and indemnities appears to be remote.
Foreign Currency Translations – The accounting records of the Fund are maintained in U.S. dollars. All assets and liabilities denominated in foreign currencies are translated into U.S. dollars based on the rate of exchange of such currencies against U.S. dollars on the date of valuation. Purchases and sales of securities, income, and expenses are translated at the rate of exchange quoted on the respective date that such transactions are recorded. The Fund does not isolate that portion of the results of operations resulting from changes in foreign exchange rates on investments from the fluctuations arising from changes in market prices of securities held. Such fluctuations are included with the net realized and unrealized gain or loss from investments.
Reported net realized foreign exchange gains or losses arise from sales of portfolio securities, sales and maturities of short-term securities, sales of foreign currencies, currency gains or losses realized between the trade and settlement dates on securities transactions, and the difference between the amounts of dividends, interest, and foreign withholding taxes recorded on the Fund’s books and the U.S. dollar equivalent of the amounts actually received or paid. Net unrealized foreign exchange gains and losses arise from changes in the value of assets and liabilities other than investments in securities at each reporting period, resulting from changes in the exchange rate.
3. INVESTMENT TRANSACTIONS
The cost of purchases and proceeds from the sale of securities, other than short-term investments, for the period ended June 30, 2020, amounted to $34,920,532 and $32,406,625, respectively.
4. ADVISORY FEE AND FUND TRANSACTIONS
Subsequent to December 31, 2019, it was determined that the valuation of the Fund’s investments in several issuers was determined without appropriately observable inputs during the period March 2019 through December 31, 2019. The Fund has recognized a receivable due from the Investment Manager in the amount of approximately $200,000 for overpayments on share repurchase payments made to investors that redeemed shares during 2020 resulting from these valuations. This amount is included within Due from Investment Adviser on the Statement of Assets and Liabilities. The Investment Manager understands that there may be additional amounts owed to the Fund related to these same issuers. Additionally, advisory fees that were paid to the Investment Manager and attributable to overstated net assets are due to the Fund, along with amounts calculated under the Fund’s expense limitation.
Advisory Fees – The Adviser is entitled to receive a monthly fee equal to the annual rate of 1.50% of the Fund’s average daily net assets. For the period ended June 30, 2020, the Adviser earned $1,308,346 in advisory fees.
Expense limitation agreement – The Adviser and the Fund have entered into an expense limitation and reimbursement agreement (the “Expense Limitation Agreement”) under which the Adviser has agreed contractually to waive its fees and to pay or absorb the direct, ordinary operating expenses of the Fund (including offering and organizational expenses but excluding front-end or contingent deferred loads, brokerage fees and commissions, acquired fund fees and expenses, borrowing costs (such as interest and dividend expenses on securities sold short), taxes and extraordinary expenses such as litigation), to the extent that they exceed 2.50%, 3.25%, and 2.25% per annum of the Fund’s average daily net assets attributable to Class A, Class C, and Class I shares (the “Expense Limitation”), respectively, through July 31, 2021. In consideration of the Adviser’s agreement to limit the Fund’s expenses, the Fund has agreed to repay the Adviser in the amount of any fees waived and Fund expenses paid or absorbed. Any waiver or reimbursement of fees by the Adviser is subject to repayment by the Fund within three years following such waiver or reimbursement; provided, however, that (i) the Fund is able to make such repayment without exceeding the expense limitation in place at the time the fees being repaid were waived or the Fund’s current expense limitation, whichever is lower, and (ii) such repayment is approved by the Fund’s Board of Trustees. The Expense Limitation Agreement will remain in effect for successive twelve-month periods provided that such continuance is specifically approved at least annually by the Board of Trustees. The Expense Limitation Agreement may be terminated only by the Fund’s Board on 60 days’ written
30
Wildermuth Endowment Fund Notes to Financial Statements - Continued
June 30, 2020 (Unaudited) |
notice to the Adviser. During the period ended June 30, 2020, the Adviser did not recoup any expenses. As of June 30, 2020, $458,874 is subject to recoupment through December 31, 2020, $695,394 through December 31, 2021, $670,176 through December 31, 2022, and $173,831 through December 31, 2023.
Distribution Agreement – The Fund has adopted a Distribution Agreement (the “Agreement”). The Agreement provides that a monthly distribution fee is calculated at an annual rate equal to 0.75% of the Fund’s average daily net assets attributable to Class C. Class A and Class I shares are not currently subject to a distribution fee. For the period ended June 30, 2020, $208,770 had been accrued for Class C distribution fees.
Shareholder Services Plan – The Fund has adopted a Shareholder Services Plan and Agreement (the “Plan). The Plan provides that a monthly service fee is calculated up to an annual rate equal to 0.25% of average daily net assets separately attributable to Class A and Class C shares. Class I shares are not included under the Plan and are not subject to a 0.25% average daily net asset fee. For the period ended June 30, 2020, Class A had accrued $105,665 in shareholder service fees and Class C had accrued $69,590.
Trustees – Each Independent Trustee receives a retainer of $5,000 per year, plus $2,500 for each board or board committee meeting the trustee attends in person ($3,000 for attendance by the chairperson of the audit committee at each meeting of the audit committee), or $500 for each meeting the trustee attends telephonically. If there is a meeting of the Board and one or more committees in a single day, the fees will be limited to $3,000 per day ($3,500 for the chairperson of the audit committee if there is a meeting of such committee) for an in person meeting and $750 ($1,000 for the chairperson of the audit committee if there is a meeting of such committee) for meetings attended telephonically. No “interested persons” who serve as Trustees of the Fund received any compensation for their services as Trustees. None of the executive officers received compensation from the Fund.
5. FEDERAL TAX INFORMATION
At December 31, 2019, gross unrealized appreciation and depreciation on investments based on cost for federal income tax purposes were as follows:
Cost of investments | | $ | 132,570,193 | |
Gross unrealized appreciation | | $ | 46,703,092 | |
Gross unrealized depreciation | | | (8,501,576 | ) |
Net unrealized appreciation on investments | | $ | 38,201,516 | |
The difference between cost amounts for financial statement and federal income tax purposes is due primarily to timing differences in recognizing certain gains and losses in security transactions and investments in partnerships.
As of December 31, 2019, the components of accumulated earnings (deficit) on a tax basis were as follows:
Accumulated capital and other losses | | $ | (9,499,596 | ) |
Net unrealized appreciation on investments | | | 38,201,516 | |
Net unrealized depreciation on foreign currency translations | | | (3,481 | ) |
Total accumulated earnings (deficit) | | $ | 28,698,439 | |
The tax character of distributions paid during the fiscal years ended December 31, 2019 and December 31, 2018 were as follows:
| | | 2019 | | | 2018 | |
Distributions paid from: | | | | | | | | |
Ordinary income | | $ | — | | | $ | — | |
Long-term capital gains | | | — | | | | 264,796 | |
Return of capital | | | 4,412,686 | | | | 2,517,920 | |
Total distributions paid | | $ | 4,412,686 | | | $ | 2,782,716 | |
31
Wildermuth Endowment Fund Notes to Financial Statements - Continued
June 30, 2020 (Unaudited) |
As of December 31, 2019, the Fund had net capital loss carryovers as follows:
Not subject to expiration: | | | | |
Short Term | | $ | 9,499,596 | |
Long Term | | | — | |
| | | $ | 9,499,596 | |
Capital loss carryovers are available to offset future realized capital gains and thereby reduce further taxable gain distributions.
6. REPURCHASE OFFERS
Pursuant to Rule 23c-3 under the Investment Company Act of 1940, as amended, the Fund offers shareholders on a quarterly basis the option of redeeming shares, at net asset value, of no less than 5% of the shares outstanding. There is no guarantee that shareholders will be able to sell all of the shares they desire in a quarterly repurchase offer, although each shareholder will have the right to require the Fund to purchase up to and including 5% of such shareholder’s shares in each quarterly repurchase. Limited liquidity will be provided to shareholders only through the Fund’s quarterly repurchases.
During the period ended June 30, 2020, the Fund completed one repurchase offer. The results of that repurchase offer was as follows:
Repurchase Pricing Date | | January 30, 2020 | |
% of Shares Offered - Total Fund | | | 5.00 | % |
Number of Shares Offered - Total Fund | | | 657,503 | |
Pricing Date Net Asset Value - Class A | | $ | 14.36 | |
Pricing Date Net Asset Value - Class C | | $ | 13.95 | |
Pricing Date Net Asset Value - Class I | | $ | 14.49 | |
Number of Shares Tendered - Class A | | | 136,866 | |
Number of Shares Tendered - Class C | | | 33,815 | |
Number of Shares Tendered - Class I | | | 145,202 | |
% of Shares Tendered - Total Fund | | | 2.40 | % |
The Fund opened a repurchase offer on June 29, 2020 with July 21, 2020 as the Repurchase Pricing Date. See Note 12. Subsequent Events, in these Notes to the Financial Statements for the results of that repurchase offer.
32
Wildermuth Endowment Fund Notes to Financial Statements - Continued
June 30, 2020 (Unaudited) |
7. INVESTMENTS IN RESTRICTED SECURITIES
Restricted securities include securities that have not been registered under the Securities Act of 1933, as amended, and securities that are subject to restrictions on resale. The Fund may invest in restricted securities that are consistent with the Fund’s investment objectives and investment strategies. Investments in restricted securities are valued at fair value as determined in good faith in accordance with procedures adopted by the Board of Trustees. It is possible that the estimated value may differ significantly from the amount that might ultimately be realized in the near term, and the difference could be material.
Additional information on each restricted security held by the Fund on June 30, 2020 is as follows:
| Security | | Initial Acquisition Date | | Shares, Principal Amount or Unit | | | Cost | | | Fair Value | | | % of Net Assets | |
| Abbott Secondary Opportunities LP | | April 13, 2017 | | | — | | | $ | 1,073,183 | | | $ | 1,451,688 | | | | 0.82 | % |
| Aetius Intermediate Company, LLC, LIBOR 1 Month + 9.50%, 12/20/2023 | | December 26, 2019 | | | 1,974,366 | | | | 1,974,366 | | | | 1,974,366 | | | | 1.11 | % |
| Affinity Beverage, LLC | | February 21, 2020 | | | 41,751 | | | | 175,000 | | | | 174,999 | | | | 0.10 | % |
| Airport Center Development Partners, LLC, 10.50%, 4/10/2020 | | September 28, 2018 | | | 1,645,229 | | | | 1,595,872 | | | | 1,645,229 | | | | 0.92 | % |
| Altegris Millennium Fund LP | | December 20, 2018 | | | — | | | | 1,000,000 | | | | 1,128,367 | | | | 0.63 | % |
| ARCTRUST, Inc. | | June 30, 2016 | | | 95,075 | | | | 933,455 | | | | 1,224,541 | | | | 0.69 | % |
| Atlas Fintech Holdings Corp. - Class A Share Interests | | December 20, 2016 | | | 684 | | | | 3,126,329 | | | | 3,883,393 | | | | 2.18 | % |
| Atlas Fintech Holdings Corp., Exercise Price $13,000, Expiration Date 12/30/2021 | | December 20, 2016 | | | 100 | | | | — | | | | 28,435 | | | | 0.02 | % |
| Atlas Fintech Holdings Corp., Exercise Price $14,950, Expiration Date 12/30/2022 | | December 20, 2016 | | | 44 | | | | — | | | | 7,774 | | | | 0.00 | % |
| Atlas Fintech Holdings Corp., Exercise Price $8,000, Expiration Date 12/30/2021 | | December 23, 2019 | | | 475 | | | | — | | | | 475,090 | | | | 0.27 | % |
| Auda Capital SCS SICAV SIF- Auda Asia Secondary Fund | | April 2, 2018 | | | — | | | | 2,148,468 | | | | 2,209,414 | | | | 1.24 | % |
| Broadstone Net Lease, Inc. | | September 12, 2019 | | | 23,529 | | | | 2,000,000 | | | | 1,929,412 | | | | 1.08 | % |
| Brookwood SFL Investor Co-Investment Vehicle, LLC | | November 3, 2017 | | | — | | | | 978,730 | | | | 1,557,869 | | | | 0.88 | % |
| Carlyle Europe Realty Fund, S.C.Sp. | | December 19, 2018 | | | 2,423,689 | | | | 2,735,223 | | | | 2,342,446 | | | | 1.32 | % |
| Casillas Petroleum Resource Partners, LLC | | October 11, 2016 | | | 953 | | | | 952,711 | | | | 523,991 | | | | 0.29 | % |
| Clear Guide Medical, Inc. - Series A Preferred Stock | | April 19, 2016 | | | 2,500 | | | | 2,250,000 | | | | 4,227,826 | | | | 2.37 | % |
| Clear Guide Medical, Inc. - Series A-2 Preferred Stock | | March 6, 2018 | | | 134,898 | | | | 500,000 | | | | 815,870 | | | | 0.46 | % |
33
Wildermuth Endowment Fund Notes to Financial Statements - Continued
June 30, 2020 (Unaudited) |
| Security | | Initial Acquisition Date | | Shares, Principal Amount or Units | | | Cost | | | Fair Value | | | % of Net Assets | |
| Clear Guide Medical, Inc. - Series A-3 Preferred Stock | | July 16, 2018 | | | 770,489 | | | $ | 2,835,394 | | | $ | 4,316,417 | | | | 2.42 | % |
| Clearsense, LLC - Class C Preferred Shares | | February 20, 2019 | | | 1,543,074 | | | | 6,799,865 | | | | 12,888,820 | | | | 7.24 | % |
| CM Funding, LLC | | December 14, 2018 | | | 1,876,034 | | | | 1,876,034 | | | | 856,643 | | | | 0.48 | % |
| Committed Advisors Secondary Fund III | | March 30, 2017 | | | — | | | | 1,217,261 | | | | 1,552,531 | | | | 0.87 | % |
| Content Management Live, LLC | | December 17, 2019 | | | 280,200 | | | | 280,200 | | | | 250,000 | | | | 0.14 | % |
| Cottonwood Residential II, Inc. | | June 12, 2019 | | | 157,812 | | | | 2,852,302 | | | | 3,378,755 | | | | 1.90 | % |
| CRC Bond Opportunity Trading Fund LP | | June 7, 2019 | | | — | | | | 2,500,000 | | | | 2,584,001 | | | | 1.45 | % |
| Cygnus Property Fund V, LLC | | October 30, 2018 | | | — | | | | 1,838,768 | | | | 1,751,721 | | | | 0.98 | % |
| Dog Wood Park of Northeast Florida, LLC | | March 21, 2017 | | | 439,716 | | | | 382,000 | | | | 372,192 | | | | 0.21 | % |
| DSI Digital, LLC - Series A Convertible Preferred Units | | November 29, 2017 | | | 4,711,751 | | | | 6,950,000 | | | | 15,430,478 | | | | 8.67 | % |
| EJF Sidecar Fund, Series LLC - Small Financial Equities Series | | October 25, 2017 | | | — | | | | 977,661 | | | | 710,779 | | | | 0.40 | % |
| EJF Trust Preferred Fund LP | | August 23, 2017 | | | — | | | | 579,861 | | | | 713,571 | | | | 0.40 | % |
| EJF Trust Preferred Master Fund LP, 16.00%, 4/16/2022 | | April 16, 2020 | | | 264,412 | | | | 264,412 | | | | 264,412 | | | | 0.15 | % |
| GigaPro, Inc. - Common Units | | August 8, 2019 | | | 6,785,282 | | | | 2,758,800 | | | | 10,048,084 | | | | 5.64 | % |
| GigaPro, Inc. - Series Seed-2 Preferred Units | | June 15, 2020 | | | 1,288,103 | | | | 1,526,647 | | | | 1,850,803 | | | | 1.04 | % |
| GPB Automotive Portfolio LP | | March 13, 2015 | | | 10 | | | | 500,000 | | | | 155,838 | | | | 0.09 | % |
| Gravity Ranch Fund I LP | | June 13, 2017 | | | — | | | | 500,000 | | | | 136,049 | | | | 0.08 | % |
| Greenspring Opportunities V LP | | January 18, 2018 | | | — | | | | 559,000 | | | | 633,028 | | | | 0.36 | % |
| GT Operating Company, Inc. | | July 3, 2018 | | | 1,741,602 | | | | 1,663,230 | | | | 1,741,602 | | | | 0.98 | % |
| Harbert Seniors Housing Fund I LP | | February 24, 2017 | | | — | | | | 1,155,508 | | | | 1,386,013 | | | | 0.78 | % |
| Harbert Seniors Housing Fund II LP | | September 10, 2019 | | | — | | | | 881,949 | | | | 776,645 | | | | 0.44 | % |
| Hauiki Hui, LLC, 9.50% | | January 4, 2017 | | | 400,000 | | | | 382,000 | | | | 230,672 | | | | 0.13 | % |
| Highlands REIT, Inc. | | April 28, 2016 | | | 136,771 | | | | 34,827 | | | | 49,238 | | | | 0.03 | % |
| Inventrust Properties Corp. | | March 2, 2015 | | | 153,283 | | | | 335,705 | | | | 481,308 | | | | 0.27 | % |
| Kayne Anderson Energy Fund VII LP | | September 12, 2016 | | | — | | | | 1,873,600 | | | | 669,374 | | | | 0.38 | % |
| LaGrange Senior Living, LLC - Class A Interests | | September 11, 2019 | | | 1,800,000 | | | | 1,800,000 | | | | 1,800,000 | | | | 1.01 | % |
| Level ATI HoldCo, LLC - Class A | | September 10, 2018 | | | — | | | | 1,690,000 | | | | 2,506,886 | | | | 1.41 | % |
| Madryn Health Partners LP | | September 28, 2018 | | | — | | | | 2,020,291 | | | | 2,104,773 | | | | 1.18 | % |
| Metro Diner, LLC - Series B Units | | November 16, 2017 | | | 3,500,000 | | | | 2,276,543 | | | | 2,730,000 | | | | 1.53 | % |
34
Wildermuth Endowment Fund Notes to Financial Statements - Continued
June 30, 2020 (Unaudited) |
| Security | | Initial Acquisition Date | | Shares, Principal Amount or Units | | | Cost | | | Fair Value | | | % of Net Assets | |
| Metro Diner, LLC - Series II Common Units | | November 16, 2017 | | | 1,880,968 | | | $ | 1,223,458 | | | $ | 1,351,479 | | | | 0.76 | % |
| Park City (PCG), 12.00%, 11/26/2020 | | March 16, 2018 | | | 679,962 | | | | 625,565 | | | | 679,962 | | | | 0.38 | % |
| PCG Select Series I, LLC - Series A Preferred Stock | | June 23, 2016 | | | — | | | | 554,941 | | | | 267,029 | | | | 0.15 | % |
| Phillips Edison Grocery Center | | February 3, 2016 | | | 3,330 | | | | 20,046 | | | | 29,136 | | | | 0.02 | % |
| PineBridge Secondary Partners IV SLP | | September 19, 2017 | | | — | | | | 1,139,683 | | | | 1,335,614 | | | | 0.75 | % |
| Polara Builder II, LLC | | June 15, 2018 | | | — | | | | 4,050,389 | | | | 4,592,873 | | | | 2.58 | % |
| PRISA III Fund LP | | September 26, 2017 | | | 789 | | | | 1,315,954 | | | | 1,538,401 | | | | 0.86 | % |
| Rosebrook Opportunities Fund LP | | February 2, 2017 | | | — | | | | 1,506,486 | | | | 1,516,893 | | | | 0.85 | % |
| RRA Credit Opportunity Fund LP | | December 12, 2017 | | | — | | | | 1,217,692 | | | | 1,476,619 | | | | 0.83 | % |
| RS17 Rexburg Preferred, LLC - Series A Preferred Interests | | September 21, 2017 | | | — | | | | 970,000 | | | | 1,547,504 | | | | 0.87 | % |
| Schweizer RSG, LLC, Exercise Price $112.50, Expiration Date 1/21/2028 | | February 6, 2018 | | | 1,442 | | | | — | | | | 1,846 | | | | 0.00 | % |
| Sequin, Inc. - Convertible Note, 8.00%, 6/28/2022 | | July 1, 2019 | | | 1,500,000 | | | | 1,500,00 | | | | 1,500,000 | | | | 0.84 | % |
| Shopoff Land Fund III LP | | April 28, 2015 | | | 56 | | | | 40,203 | | | | 33,053 | | | | 0.02 | % |
| Star Mountain Diversified Credit Income Fund III LP | | June 20, 2019 | | | — | | | | 921,453 | | | | 921,033 | | | | 0.52 | % |
| Star Mountain Diversified Small Business Access Fund II LP | | June 2, 2017 | | | — | | | | 843,760 | | | | 1,017,926 | | | | 0.57 | % |
| Stonehill Strategic Hotel Credit Opportunity Fund II LP | | July 18, 2016 | | | 702,851 | | | | 702,850 | | | | 1,010,349 | | | | 0.57 | % |
| The Work Shop Limited T/A RIP Global - Convertible Note, 10.00%, 5/22/2022 | | November 22, 2019 | | | 500,00 | | | | 500,000 | | | | 500,000 | | | | 0.28 | % |
| Thunder Investment Partners, LLC | | November 2, 2018 | | | 2,080,000 | | | | 2,080,000 | | | | 1,317,845 | | | | 0.74 | % |
| Walton Street Real Estate Fund VIII LP | | May 24, 2017 | | | — | | | | 548,751 | | | | 631,546 | | | | 0.35 | % |
| Waratek, Ltd. - Convertible Note, 12.00%, 3/25/2021 | | March 25, 2019 | | | 2,191,374 | | | | 2,191,374 | | | | 2,955,546 | | | | 1.66 | % |
| Waratek, Ltd. - Series B-1 | | June 5, 2018 | | | 635,838 | | | | 2,990,569 | | | | 2,575,558 | | | | 1.45 | % |
| Waratek, Ltd. - Series B-2 | | December 28, 2017 | | | 756,826 | | | | 3,696,940 | | | | 3,352,496 | | | | 1.88 | % |
| Waratek, Ltd., Exercise Price 0.01 Euro, Expiration Date 1/22/2028 | | June 5, 2018 | | | 492,610 | | | | — | | | | 706,657 | | | | 0.40 | % |
| Westgate at Powers, LLC, 12.00%, 6/21/2021 | | January 17, 2018 | | | 1,851,567 | | | | 1,666,411 | | | | 1,851,567 | | | | 1.04 | % |
35
Wildermuth Endowment Fund Notes to Financial Statements - Continued
June 30, 2020 (Unaudited) |
Security | | Initial
Acquisition Date | | | Shares,
Principal Amount
or Units | | | Cost | | | Fair
Value | | | % of
Net Assets | |
WG Pitts Caribbean, LLC - Common Units | October 12, 2018 | | | — | | | $ | 426,040 | | | $ | — | | | | 0.00% | |
WG Pitts Caribbean, LLC - Promissory Note, 10.00%, 10/12/2020 | October 12, 2018 | | | 2,000,000 | | | | 1,573,960 | | | | 1,815,748 | | | | 1.02% | |
| | | | | | | | | | | $ | 103,065,720 | | | $ | 132,498,023 | | | | | |
8. INVESTMENTS IN AFFILIATED ISSUERS
Issuers that are considered affiliates, as defined in Section 2(a)(3) of the 1940 Act, of the Fund at period-end are noted in the Fund’s Schedule of Investments. The table below reflects transactions during the period with entities that are affiliates as of June 30, 2020 and may include acquisitions of new investments, prior year holdings that became affiliated during the period, and prior period affiliated holdings that are no longer affiliated as of period-end.
Security Description | | Beginning
balance
January 1,
2020 | | | Purchases or
Conversions | | | Sales or
Conversions | | | Change in
securities
meeting the
definition of
an affiliated
investment | | | Change in
Unrealized
Appreciation
(Depreciation) | | | Net
Realized
Gain (Loss) | | | Tax Basis
or Return
of Capital
Adjustments | | | Ending
Value
June 30, 2020 | | | Investment
Income | |
Atlas Fintech Holdings Corp. - Class A Share Interests | | $ | 1,272,000 | | | $ | 1,620,329 | | | $ | — | | | $ | — | | | $ | 991,064 | | | $ | — | | | $ | — | | | $ | 3,883,393 | | | $ | — | |
Atlas Fintech Holdings Corp - Convertible Note 8.00%, 6/20/2020 | | | 1,500,000 | | | | — | | | | (1,500,000 | ) | | | — | | | | — | | | | — | | | | — | | | | — | | | | 56,219 | |
Atlas Fintech Holdings Corp. Exercise Price $13,000 Expiration Date 12/30/2021 | | | 87,955 | | | | — | | | | — | | | | — | | | | (59,520 | ) | | | — | | | | — | | | | 28,435 | | | | — | |
Atlas Fintech Holdings Corp. Exercise Price $14,950 Expiration Date 12/30/2022 | | | 26,642 | | | | — | | | | — | | | | — | | | | (18,868 | ) | | | — | | | | — | | | | 7,774 | | | | — | |
Atlas Fintech Holdings Corp. Exercise Price $8,000 Expiration Date 12/30/2021 | | | 1,091,788 | | | | — | | | | — | | | | — | | | | (616,698 | ) | | | — | | | | — | | | | 475,090 | | | | — | |
Brookwood SFL Investor Co-Investment Vehicle, LLC(1) | | | — | | | | — | | | | — | | | | 1,017,978 | | | | 579,140 | | | | — | | | | (39,249 | ) | | | 1,557,869 | | | | — | |
Casillas Petroleum Resource Partners, LLC | | | 1,286,160 | | | | — | | | | — | | | | — | | | | (762,169 | ) | | | — | | | | — | | | | 523,991 | | | | — | |
Clear Guide Medical, Inc. - Series A Preferred Stock(2) | | | 4,902,056 | | | | — | | | | — | | | | — | | | | (674,230 | ) | | | — | | | | — | | | | 4,227,826 | | | | — | |
Clear Guide Medical, Inc. - Series A-2 Preferred Stock(2) | | | 955,816 | | | | — | | | | — | | | | — | | | | (139,946 | ) | | | — | | | | — | | | | 815,870 | | | | — | |
Clear Guide Medical, Inc. - Series A-3 Preferred Stock(2) | | | 4,248,609 | | | | 500,000 | | | | — | | | | — | | | | (432,192 | ) | | | — | | | | — | | | | 4,316,417 | | | | — | |
Clearsense, LLC- Class C Preferred Shares | | | 8,148,270 | | | | 3,150,000 | | | | — | | | | — | | | | 1,590,550 | | | | — | | | | — | | | | 12,888,820 | | | | — | |
CM Funding, LLC(2) | | | 856,643 | | | | — | | | | — | | | | — | | | | — | | | | — | | | | — | | | | 856,643 | | | | — | |
Content Management Live, LLC(2) | | | 250,000 | | | | 30,200 | | | | — | | | | — | | | | (30,200 | ) | | | — | | | | — | | | | 250,000 | | | | — | |
Cygnus Property Fund V, LLC | | | 1,752,097 | | | | — | | | | — | | | | — | | | | 81,054 | | | | — | | | | (81,430 | ) | | | 1,751,721 | | | | — | |
Dog Wood Park of Northeast Florida, LLC(1) | | | — | | | | — | | | | — | | | | 382,000 | | | | (9,808 | ) | | | — | | | | — | | | | 372,192 | | | | 33,383 | |
36
Wildermuth Endowment Fund Notes to Financial Statements - Continued
June 30, 2020 (Unaudited) |
Security Description | | Beginning
balance
January 1,
2020 | | | Purchases or
Conversions | | | Sales or
Conversions | | | Change in
securities
meeting the
definition of
an affiliated
investment | | | Change in
Unrealized
Appreciation
(Depreciation) | | | Net
Realized
Gain (Loss) | | | Tax Basis
or Return
of Capital
Adjustments | | | Ending
Value
June 30, 2020 | | | Investment
Income | |
DSI Digital, LLC - Series A Convertible Preferred Units(2) | | $ | 13,191,310 | | | $ | 1,950,000 | | | $ | — | | | $ | — | | | $ | 289,168 | | | $ | — | | | $ | — | | | $ | 15,430,478 | | | $ | — | |
GigaPro, Inc. - Common Units(2) | | | 7,615,550 | | | | — | | | | — | | | | — | | | | 2,432,534 | | | | — | | | | — | | | | 10,048,084 | | | | — | |
GigaPro, Inc. - Series Seed-2 Preferred Units (2) | | | — | | | | 1,526,647 | | | | — | | | | — | | | | 324,156 | | | | — | | | | — | | | | 1,850,803 | | | | — | |
GigaPro, Inc. - Secured Note - 8.00%, 8/7/2021(2) | | | 884,450 | | | | 556,000 | | | | (1,440,450 | ) | | | — | | | | — | | | | — | | | | — | | | | — | | | | 53,723 | |
GT Operating Company, Inc.(1)(2) | | | — | | | | — | | | | — | | | | 1,663,230 | | | | 78,372 | | | | — | | | | — | | | | 1,741,602 | | | | 92,450 | |
Gravity Ranch Fund I LP | | | 23,043 | | | | — | | | | — | | | | — | | | | 113,006 | | | | — | | | | — | | | | 136,049 | | | | — | |
Hauiki Hui, LLC | | | 230,672 | | | | — | | | | — | | | | — | | | | — | | | | — | | | | — | | | | 230,672 | | | | 19,211 | |
LaGrange Senior Living, LLC - Class A Interests(2) | | | 1,800,000 | | | | — | | | | — | | | | — | | | | — | | | | — | | | | — | | | | 1,800,000 | | | | 173,983 | |
Level ATI HoldCo, LLC - Class A(2) | | | 3,040,100 | | | | — | | | | — | | | | — | | | | (533,214 | ) | | | — | | | | — | | | | 2,506,886 | | | | — | |
Polara Builder II, LLC(2) | | | 5,660,763 | | | | — | | | | (1,067,990 | ) | | | — | | | | (33,676 | ) | | | 33,776 | | | | — | | | | 4,592,873 | | | | 208,360 | |
Rosebrook Opportunities Fund LP(1)(2) | | | — | | | | — | | | | — | | | | 1,506,486 | | | | 10,407 | | | | — | | | | — | | | | 1,516,893 | | | | — | |
RS17 Rexburg Preferred, LLC - Series A Preferred Interests(2) | | | 1,434,299 | | | | — | | | | — | | | | — | | | | 113,205 | | | | — | | | | — | | | | 1,547,504 | | | | — | |
RRA Credit Opportunity Fund LP | | | 975,012 | | | | 525,194 | | | | — | | | | — | | | | 53,796 | | | | — | | | | (77,383 | ) | | | 1,476,619 | | | | — | |
Sequin, Inc. - Convertible Note, 8.00%, 6/28/2022 | | | 1,000,000 | | | | 500,000 | | | | — | | | | — | | | | — | | | | — | | | | — | | | | 1,500,000 | | | | 59,888 | |
The Work Shop Limited T/A RIP Global - Convertible Note, 10.00%, 5/22/2022 | | | 500,000 | | | | — | | | | — | | | | — | | | | — | | | | — | | | | — | | | | 500,000 | | | | 25,278 | |
Tides Capital Gamma LP | | | 566,324 | | | | — | | | | (832,682 | ) | | | — | | | | 433,676 | | | | (167,318 | ) | | | — | | | | — | | | | — | |
Thunder Investment Partners, LLC(2) | | | 1,438,189 | | | | — | | | | — | | | | — | | | | (120,344 | ) | | | — | | | | — | | | | 1,317,845 | | | | — | |
Waratek, Ltd. - Series B-1 | | | 3,149,601 | | | | — | | | | — | | | | — | | | | (574,043 | ) | | | — | | | | — | | | | 2,575,558 | | | | — | |
Waratek, Ltd. - Series B-2 | | | 3,817,736 | | | | — | | | | — | | | | — | | | | (465,240 | ) | | | — | | | | — | | | | 3,352,496 | | | | — | |
Waratek, Ltd. - Convertible Note, 12.00%, 3/25/2021 | | | 1,920,001 | | | | 691,374 | | | | — | | | | — | | | | 344,174 | | | | — | | | | — | | | | 2,955,549 | | | | — | |
Waratek, Ltd., Exercise Price 0.01 Euro, Expiration Date 01/22/2028 | | | 798,853 | | | | — | | | | — | | | | — | | | | (92,196 | ) | | | — | | | | — | | | | 706,657 | | | | — | |
WG Pitts Caribbean, LLC - Common Units(2) | | | — | | | | — | | | | — | | | | — | | | | — | | | | — | | | | — | | | | — | | | | — | |
WG Pitts Caribbean, LLC - Promissory Note, 10.00%, 10/12/2020 | | | 1,815,745 | | | | — | | | | — | | | | — | | | | — | | | | — | | | | — | | | | 1,815,745 | | | | 116,308 | |
| | | $ | 76,239,684 | | | $ | 11,049,744 | | | $ | (4,841,122 | ) | | $ | 4,569,694 | | | $ | 2,871,958 | | | $ | (133,542 | ) | | $ | (198,062 | ) | | $ | 89,558,354 | | | $ | 838,803 | |
(1) | Security was held in the portfolio as of December 31, 2019 but did not meet the definition of an affiliated investment. |
(2) | Affliated investments for which ownership exceeds 25% of the Investment Fund’s Capital. |
9. OFFERING PRICE PER SHARE
Class A shares are offered subject to a maximum sales charge of 5.75% of the offering price, while Class C shares and Class I shares are not subject to a sales charge. Class C shares are subject to a 1% contingent deferred sales charges on shares redeemed during the first 365 days after purchase, while Class A shares and Class I shares are not subject to a contingent deferred sales charge. For the period ended June 30, 2020, the various broker dealers received $220,874 in underwriting commissions for sales of shares. For the period ended June 30, 2020, contingent deferred sales charges in the amount of $1,480 were applied to Class C shareholders.
37
Wildermuth Endowment Fund Notes to Financial Statements - Continued
June 30, 2020 (Unaudited) |
10. COMMITMENTS
The Fund is required to provide financial support in the form of investment commitments to certain investees as part of the conditions for entering into such investments. As of June 30, 2020, the Fund had unfunded commitments in the amount of $19,399,377. The Adviser monitors capital call activity and regularly reviews the Fund’s cash position. In the event the Fund receives a capital call in excess of the Fund’s cash position and the Fund has not received enough incoming shareholder subscriptions to meet the capital call requirement, the Adviser would liquidate public security positions held in the Fund’s portfolio to satisfy the capital commitment.
11. RECENT MARKET AND ECONOMIC DEVELOPMENTS
Certain impacts to public health conditions particular to the coronavirus (COVID-19) may have a significant negative impact on the operations and profitability of the Fund’s investments. The extent of the impact to the financial performance of the Fund will depend on future developments, including (i) the duration and spread of the outbreak, (ii) the restrictions and advisories, (iii) the effects on the financial markets, and (iv) the effects on the economy overall, all of which are highly uncertain and cannot be predicted.
12. SUBSEQUENT EVENTS
Subsequent events after the balance sheet date have been evaluated through the date the financial statements were issued.
The Fund completed a quarterly repurchase offer on July 21, 2020. 240,771 shares of Class A, 105,881 shares of Class C, and 326,003 shares of Class I were tendered. The shares tendered represented 5.00% of the Fund’s outstanding shares on the Repurchase Pricing Date.
The Fund completed a quarterly repurchase offer on August 21, 2020. 264,529 shares of Class A, 67,012 shares of Class C, and 346,059 shares of Class I were tendered. The shares tendered represented 5.25% of the Fund’s outstanding shares on the Repurchase Pricing Date.
After the close of the period covered by the report, the Fund agreed to the issuance of new shares to shareholders who acquired shares at a restated net asset value (NAV) per share, and booked receivables from the Investment Manager to account for the financial impact of incorrect valuations used in 2020. The effect of the share issuance and the receivables was to, in the aggregate, reduce the NAV per share calculated for periods after the close of the period covered by the Report.
38
Wildermuth Endowment Fund Additional Information June 30, 2020 (Unaudited) |
Proxy Voting Policy — Information regarding how the Fund votes proxies relating to portfolio securities for the most recent period ended June 30, as well as a description of the policies and procedures that the Fund used to determine how to vote proxies is available without charge, upon request, by calling 1-888-445-6032 or by referring to the Securities and Exchange Commission’s (“SEC”) website at http://www.sec.gov. A description of the policies and procedures is also included in the Fund’s Statement of Additional Information, which is available on the SEC’s website at http://www.sec.gov.
Portfolio Holdings — The Fund files its complete schedule of portfolio holdings with the SEC for the first and third quarters of each fiscal year on Form N-PORT. Form N-PORT is available on the SEC’s website at http://www.sec.gov. The information on Form N-PORT is available without charge, upon request, by calling 1-888-445-6032.
39
THIS PAGE INTENTIONALLY LEFT BLANK
THIS PAGE INTENTIONALLY LEFT BLANK
Investment Adviser
Wildermuth Advisory, LLC
818 A1A Hwy, Suite 301
Ponte Vedra Beach, Florida 32082
Co-Distributors
Wildermuth Securities, LLC
818 A1A Hwy, Suite 301
Ponte Vedra Beach, Florida 32082
UMB Distribution Services, LLC
235 West Galena Street
Milwaukee, Wisconsin 53212
This material must be preceded or accompanied by a prospectus. Investors should carefully consider the investment objectives, risks, charges and expenses of the Fund. This and other important information is contained within the Fund’s Prospectus, which can be obtained by calling (888) 445-6032, or by visiting our website www.wildermuthendowmentfund.com. The Fund’s Prospectus should be read carefully before investing.
Wildermuth Endowment Fund’s principal underwriters and co-distributors are: Wildermuth Securities, LLC 818 A1A, Suite 301, Ponte Vedra Beach, FL 32082 and UMB Distribution Services, LLC 235 W Galena St Milwaukee, WI 53212
Principal underwriters and co-distributors are
Wildermuth Securities, LLC and UMB Distribution Services, LLC
Members of FINRA
Item 2. Code of Ethics.
Not applicable to semi-annual reports.
Item 3. Audit Committee Financial Expert.
Not applicable to semi-annual reports.
Item 4. Principal Accountant Fees and Services.
Not applicable to semi-annual reports.
Item 5. Audit Committee of Listed Registrants.
Not applicable.
Item 6. Schedule of Investments.
Included as part of the report to shareholders filed under Item 1 of this Form N-CSR.
Item 7. Disclosure of Proxy Voting Policies and Procedures for Closed-End Management Investment Companies.
Not applicable to semi-annual reports.
Item 8. Portfolio Managers of Closed-End Management Investment Companies.
Not applicable to semi-annual reports.
Item 9. Purchases of Equity Securities by Closed-End Management Investment Company and Affiliated Purchasers.
| Class A: | | (a) Total Number of Shares (or Units) Purchased | | | (b) Average Price Paid per Share (or Unit) | | | (c) Total Number of Shares (or Units) Purchased as Part of Publicly Announced Plans or Programs | | | (d) Maximum Number (or Approximate Dollar Value) of Shares (or Units) that May Yet Be Purchased Under the Plans or Programs | |
| Period | | | | | | | | | | | | |
| Jan. 1-31, 2020 (1) | | | 136,866 | | | $ | 14.36 | | | | 0 | | | | 0 | |
| Feb. 1-29, 2020 | | | 0 | | | | 0 | | | | 0 | | | | 0 | |
| Mar. 1-31, 2020 | | | 0 | | | | 0 | | | | 0 | | | | 0 | |
| Apr. 1-30, 2020 | | | 0 | | | | 0 | | | | 0 | | | | 0 | |
| May. 1-31, 2020 | | | 0 | | | | 0 | | | | 0 | | | | 0 | |
| Jun. 1-30, 2020 | | | 0 | | | | 0 | | | | 0 | | | | 0 | |
| Jul. 1-31, 2020 | | | 0 | | | | 0 | | | | 0 | | | | 0 | |
| Aug. 1-31, 2020 | | | 0 | | | | 0 | | | | 0 | | | | 0 | |
| Sep. 1-30, 2020 | | | 0 | | | | 0 | | | | 0 | | | | 0 | |
| Oct. 1-31, 2020 | | | 0 | | | | 0 | | | | 0 | | | | 0 | |
| Nov. 1-30, 2020 | | | 0 | | | | 0 | | | | 0 | | | | 0 | |
| Dec. 1-31, 2020 | | | 0 | | | | 0 | | | | 0 | | | | 0 | |
| Total | | | 136,866 | | | $ | 14.36 | | | | 0 | | | | 0 | |
| Class C: | | (a) Total Number of Shares (or Units) Purchased | | | (b) Average Price Paid per Share (or Unit) | | | (c) Total Number of Shares (or Units) Purchased as Part of Publicly Announced Plans or Programs | | | (d) Maximum Number (or Approximate Dollar Value) of Shares (or Units) that May Yet Be Purchased Under the Plans or Programs | |
| Period | | | | | | | | | | | | |
| Jan. 1-31, 2020 (1) | | | 33,815 | | | $ | 13.95 | | | | 0 | | | | 0 | |
| Feb. 1-29, 2020 | | | 0 | | | | 0 | | | | 0 | | | | 0 | |
| Mar. 1-31, 2020 | | | 0 | | | | 0 | | | | 0 | | | | 0 | |
| Apr. 1-30, 2020 | | | 0 | | | | 0 | | | | 0 | | | | 0 | |
| May. 1-31, 2020 | | | 0 | | | | 0 | | | | 0 | | | | 0 | |
| Jun. 1-30, 2020 | | | 0 | | | | 0 | | | | 0 | | | | 0 | |
| Jul. 1-31, 2020 | | | 0 | | | | 0 | | | | 0 | | | | 0 | |
| Aug. 1-31, 2020 | | | 0 | | | | 0 | | | | 0 | | | | 0 | |
| Sep. 1-30, 2020 | | | 0 | | | | 0 | | | | 0 | | | | 0 | |
| Oct. 1-31, 2020 | | | 0 | | | | 0 | | | | 0 | | | | 0 | |
| Nov. 1-30, 2020 | | | 0 | | | | 0 | | | | 0 | | | | 0 | |
| Dec. 1-31, 2020 | | | 0 | | | | 0 | | | | 0 | | | | 0 | |
| Total | | | 33,815 | | | $ | 13.95 | | | | 0 | | | | 0 | |
| Class I: | | (a) Total Number of Shares (or Units) Purchased | | | (b) Average Price Paid per Share (or Unit) | | | (c) Total Number of Shares (or Units) Purchased as Part of Publicly Announced Plans or Programs | | | (d) Maximum Number (or Approximate Dollar Value) of Shares (or Units) that May Yet Be Purchased Under the Plans or Programs | |
| Period | | | | | | | | | | | | |
| Jan. 1-31, 2020 (1) | | | 145,202 | | | $ | 14.49 | | | | 0 | | | | 0 | |
| Feb. 1-29, 2020 | | | 0 | | | | 0 | | | | 0 | | | | 0 | |
| Mar. 1-31, 2020 | | | 0 | | | | 0 | | | | 0 | | | | 0 | |
| Apr. 1-30, 2020 | | | 0 | | | | 0 | | | | 0 | | | | 0 | |
| May. 1-31, 2020 | | | 0 | | | | 0 | | | | 0 | | | | 0 | |
| Jun. 1-30, 2020 | | | 0 | | | | 0 | | | | 0 | | | | 0 | |
| Jul. 1-31, 2020 | | | 0 | | | | 0 | | | | 0 | | | | 0 | |
| Aug. 1-31, 2020 | | | 0 | | | | 0 | | | | 0 | | | | 0 | |
| Sep. 1-30, 2020 | | | 0 | | | | 0 | | | | 0 | | | | 0 | |
| Oct. 1-31, 2020 | | | 0 | | | | 0 | | | | 0 | | | | 0 | |
| Nov. 1-30, 2020 | | | 0 | | | | 0 | | | | 0 | | | | 0 | |
| Dec. 1-31, 2020 | | | 0 | | | | 0 | | | | 0 | | | | 0 | |
| Total | | | 145,202 | | | $ | 14.49 | | | | 0 | | | | 0 | |
| (1) | On December 27, 2019 the Registrant offered to repurchase up to 5% of the Registrant’s total outstanding shares as of January 30, 2020 ( the "Repurchase Request Deadline"). On the Repurchase Request Deadline, 657,503 shares represented 5% of the Registrant's total outstanding shares. |
Item 10. Submission of Matters to a Vote of Security Holders.
Not applicable.
Item 11. Controls and Procedures.
| (a) | The Registrant’s principal executive officer and principal financial officer have reviewed the Registrant's disclosure controls and procedures (as defined in Rule 30a-3(c) under the Investment Company Act of 1940, as amended, (the “Act”)) as of a date within 90 days of the filing of this report, as required by Rule 30a-3(b) under the Act. Based on their review, such officers have concluded that the disclosure controls and procedures were effective in ensuring that information required to be disclosed in this report was appropriately recorded, processed, summarized and reported and made known to them by others within the Registrant and by the Registrant’s service providers. |
| (b) | There were no changes in the Registrant’s internal control over financial reporting (as defined in Rule 30a-3(d) under the Act (17 CFR 270.30a-3(d)) that occurred during the period covered by this report that materially affected, or were reasonably likely to materially affect, the Registrant’s internal control over financial reporting. |
Item 12. Disclosure of Securities Lending Activities for Closed-End Management Investment Companies.
The Fund has not engaged in Security Lending Activities.
Item 13. Exhibits.
| (a) (1) | Not applicable to semi-annual reports. |
SIGNATURES
Pursuant to the requirements of the Securities Exchange Act of 1934 and the Investment Company Act of 1940, the Registrant has duly caused this report to be signed on its behalf by the undersigned, thereunto duly authorized.
Wildermuth Endowment Fund
| /s/ Daniel Wildermuth | |
| By: Daniel Wildermuth | |
| Trustee, Chairman of the Board, President and Chief Executive Officer | |
| September 2, 2020 | |
Pursuant to the requirements of the Securities Exchange Act of 1934 and the Investment Company Act of 1940, this report has been signed below by the following persons on behalf of the Registrant and in the capacities and on the dates indicated.
| /s/ Daniel Wildermuth | |
| By: Daniel Wildermuth | |
| Trustee, Chairman of the Board, President and Chief Executive Officer | |
| (Principal Executive Officer) | |
| September 2, 2020 | |
| /s/ Gerard Scarpati | |
| By: Gerard Scarpati | |
| Treasurer and Chief Financial Officer | |
| (Principal Financial Officer) | |
| September 2, 2020 | |