UNITED STATES
SECURITIES AND EXCHANGE COMMISSION
Washington, D.C. 20549
FORM N-CSR
CERTIFIED SHAREHOLDER REPORT OF REGISTERED
MANAGEMENT INVESTMENT COMPANIES
Investment Company Act file number: 811-22895
Capitol Series Trust
(Exact name of registrant as specified in charter)
Huntington Asset Services, Inc.
2960 North Meridian Street, Suite 300
Indianapolis, IN 46208
(Address of principal executive offices) (Zip code)
Robert W. Silva
Huntington Asset Services, Inc.
2960 N. Meridian St. Suite 300
Indianapolis, IN 46208
(Name and address of agent for service)
Registrant’s telephone number, including area code: 317-917-7000
Date of fiscal year end: August 31
Date of reporting period: February 28, 2014
Item 1. Reports to Stockholders.


Where discipline meets common sense.
Semi-Annual Report
February 28, 2014
Meritage Yield-Focus Equity Fund MPYEX/MPYIX
Meritage Growth Equity Fund MPGEX/MPGIX
Meritage Value Equity Fund MPVEX/MVEBX
| | | | |
| 913.345.7000 | | www.meritageportfoliofunds.com | | 7500 College Blvd., Suite 1212, Overland Park, KS 66210 |
Dear Fellow Shareholders:
Meritage Portfolio Management launched three mutual funds on December 20, 2013: Meritage Growth Equity Fund, Meritage Value Equity Fund and Meritage Yield-Focus Equity Fund. The first fiscal year will end August 31, 2014, so February 28, 2014 marks the half-way point even though it is less than six months after the inception of the funds. We are pleased to have the opportunity to write this inaugural letter, and communicate with you, accordingly.
Launching our mutual funds was a natural extension of our business. The funds are based on the separately managed account strategies Meritage has been using for over 10 years to manage assets for institutions, families and corporations. Extending these strategies to mutual funds allows us to better serve our existing clients as well as bring our investment capabilities to new investors.
Since Meritage is probably new to many of you, we will spend the next few paragraphs sharing some of our thoughts on investing. We think this will be helpful to you in getting to know us better and will also provide a good foundation for the discussion of the portfolio results attached to this letter.
| | • | | Our investment process starts with the belief that stock prices are more volatile than the corresponding underlying business valuations, and this volatility creates opportunities for skilled investors to buy companies at a discount to their value. For example the price of Apple stock closed at $549/share on January 2, 2013, dropped to a price of $385/share on April 19th, and then rose to $575/share later in the year. The January – April decline was approximately 30% and the subsequent rise to $575/share in December was a 49% increase. (1) |
| | • | | Did the underlying value of the company vary this much, following the down-and-up pattern described here, during 2013? We don’t think so! And it’s worth noting that the mispricing of Apple, which occurred as a result of the stock price volatility, happened to a large-cap company that is perhaps the most widely followed and analyzed company in the world, i.e., the type of company where all the known information is supposedly efficiently priced into the stock, thereby eliminating the opportunity for investors to identify a mispriced company and make a corresponding excess profit. |
| | • | | We are value-centric equity investors. The key, in our opinion, to finding and consistently investing in stocks when they are “valuable” rests with the breadth and depth of a comprehensive and systematic security selection process. In our work stocks are mispriced relative to the underlying company, and relative to each other, often enough that a portfolio can be created for investors that provides a much better investment opportunity than a corresponding “benchmark” portfolio such as the S&P 500 Index or other style specific indices. |
| | • | | The hallmarks of the Meritage investment process are: |
| | – | A value-driven mindset, emphasizing a margin of safety between our estimated value of the security and the market price; |
| | – | A systematic investment process, combining the power of quantitative research with the benefit of a qualitative analysis focused on managing risk; and |
| | – | An opportunistic mentality, leading the portfolio managers to invest in their best ideas, regardless of market cap size, in both domestic and foreign markets. |
| (1) | This example is being used merely to demonstrate how the variance between volatile stock prices and perceived company values can create opportunity for investors. The Meritage mutual funds were not operational until December 20, 2013 and, as a result, were not in a position to take advantage of the opportunity presented. The Meritage Growth Equity Fund did purchase Apple stock in December and continued to hold a position at the time of writing this letter. |
1
| | • | | We believe markets are too broad and complex to approach unsystematically, and the quantitative process we employ is highly effective in evaluating a broad universe of securities. It is grounded in factors that we believe drive stock prices – valuation, cash flow return on investment, profitability, growth, investor sentiment, momentum, and management IQ – and it also provides a discipline that helps protect against emotion and biases which often lead to irrational behavior. |
| | • | | Each week we screen over 6,500 common stocks in our Value and Growth models, focusing on factors that we have extensively tested to be predictive of stock price performance versus the corresponding benchmark. These factors are ranked 1 – 100 (1 being the best) and then scored in a normal distribution. Stocks that score 20 or better – generally about 3% of the working universe, and more than two standard deviations away from the mean – are candidates for further analysis and potential purchase, as based on our work they have the greatest probability of outperforming the other stocks in the universe. |
| | • | | All investment disciplines have their limitations, however, and as helpful as our quantitative framework is, like other quantitative processes it does not capture all the information relevant to making a good investment decision. As a result, we complement our quantitative process with stock-specific, proprietary qualitative research before making a final investment decision. |
| | • | | We also emphasize “optimal diversification” in constructing our portfolios. It’s our concept of being concentrated enough to generate attractive excess returns yet diversified enough to help manage risk. The resulting portfolios will typically be invested in 45 – 60 companies. |
In closing, we would like to thank you for your support and entrusting us with your investment dollars. In conjunction with this we hope the information provided in this letter, including the attached discussions of the portfolio results, gives you a better understanding of our investment process. We also hope that we are able to help you meet your investment needs in the years to come.
Sincerely,
Mark Eveans, CFA
President and Chief Investment Officer
2
MANAGEMENT’S DISCUSSION OF FUND PERFORMANCE – (Unaudited)
Meritage Growth Equity Fund
For the period beginning December 20, 2013, the fund’s inception, through February 28, 2014, the Meritage Growth Equity Fund Institutional Class and Investors Class returned 3.00%, and 2.90%, respectively. These returns compare to the 4.75% total return for the Russell 1000 Growth Index during this same time frame.
A core founding premise of the Meritage Growth Equity Fund is that the richest opportunity for creating value added return lies primarily with superior stock selection skills. The Meritage comprehensive security selection process searches globally for the most attractive, value-driven growth stock opportunities.
As for traditional sectors, information technology and healthcare were the two most positive contributors in the period. The two weakest sectors were materials and energy.
Regarding specific issues, NetScout Systems (technology/Internet software and hardware) advanced 30.3%, Akamai Technologies (technology, Internet cloud infrastructure) increased 28.2% and Novo Nordisk ADR (healthcare – Danish pharmaceutical) was ahead 32.0%. Each of these issues clearly carries above-average earnings and asset growth profiles. In addition, our cash flow return on investment driven valuation techniques suggest a further significant and positive difference between the current price and what we believe each to be worth.
As for detractors, MRC Global (energy – products and services) was off 18.6%, and Bed Bath & Beyond (consumer discretionary – household products) was down 12.4%. The former is the largest distributor of pipe, valve and fitting products and services to the energy and industrial markets. The company continues to rank well in our quantitative process. In conjunction with this, while returns in the short-term have been disappointing, we expect the growth in the energy infrastructure to lead to higher sales, profits and corresponding stock price.
Bed, Bath & Beyond is similar in that it, too, continues to rank well in our quantitative process. We think the recent weakness is primarily the result of investments the company is making, which have led to lower returns in the short term. However, we expect these investments to pay off and believe the stock is cheap in the context of the company’s strong cash flow and prospects for growth.
We expect a continuation of the abnormally low interest rate, below average economic growth condition for the world’s leading economies. We believe this environment will continue to favor the Growth strategy’s strong stock selection skillset, which emphasizes conservative valuation techniques.
Meritage Value Equity Fund
For the period beginning December 20, 2013, the fund’s inception, through February 28, 2014, the Meritage Value Equity Fund Institutional Class and Investors Class returned 2.40%, and 2.30%, respectively. These returns compare to the 2.68% total return for the Russell 1000 Value Index during this same time frame.
A core founding premise of the Meritage Value Equity Fund is that the richest opportunity for creating value-added return lies primarily with superior stock selection skills. The Meritage comprehensive security selection process searches globally for the most attractive value opportunities.
As for traditional sectors, information technology and healthcare were the two most positive contributors in the period. The two weakest sectors were consumer discretionary and financials.
Regarding specific issues, Skyworks Solutions (technology – semiconductors) gained 28.1%, and Teva Pharmaceuticals (healthcare – proprietary and generic drugs) was up 27.0%. Another notable gainer was Baker
3
Hughes (energy – service) which gained 17.9%. All three issues have very attractive ranks in our process, with improving cash flow return on investment, very attractive low/no debt on the balance sheet, and consistent free cash flow generation.
As for detractors, Horace Mann (financial – insurance) was off 8.7%, AGCO (industrial – farm equipment) was also down 8.7%, and Lukoil (energy – Russian integrated) declined 11.8%. We believe the first two declines were primarily in the category of normal, short-term, random fluctuation, whereas Lukoil is down for other reasons. It is being affected by the current Ukrainian/Russian controversy. We believe all three issues continue to be strong opportunities given their significant undervaluation.
We expect a continuation of the abnormally low interest rate, below average economic growth condition for the world’s leading economies. We believe this environment will continue to favor the Value strategy’s strong stock selection skillset.
Meritage Yield-Focus Equity Fund
For the period beginning December 20, 2013, the fund’s inception, through February 28, 2014, the Meritage Yield-Focus Equity Fund Institutional Class and Investors Class returned 3.40%, and 3.30%, respectively. These returns compare to the 2.76% total return for the Russell 3000 Value Index during this same time frame.
A core founding premise of the Yield-Focus strategy is to earn between 50-75% of the expected long-term equity return, in the form of cash dividends and distributions. The strategy invests in six key primary sectors – common stocks, master limited partnerships, real estate investment trusts, business development companies, convertible preferred stocks, and in rare situations, straight preferred stocks. The Meritage comprehensive security selection process searches globally for attractive yield franchises.
Regarding primary sector performance, yield-driven common stocks, MLPs and the REIT sectors were the strongest positive contributors. No primary sectors were meaningfully negative. More specifically, based on traditional industry sectors, standout positive contributors were found in the energy, consumer discretionary, healthcare, and information technology sectors. Less attractive performance was achieved in the consumer staples, materials, and telecom sectors.
Among the strongest performers were health care issues Eli Lilly and AstraZeneca. Eli Lilly gained 19.8% while AstraZeneca was up 19.5%. Other strong performers were in the REIT sector – Realty Income and STAG Industrial, up 19.6%, and 19.9%, respectively. Average annual dividend payments ranged from 3.4% to 5.4% in this group, all benefitting from strong cash flow dividend coverage.
The two poorest performers among individual holdings were: i) VimpelCom Ltd. ADR, a global provider of telecom services headquartered in Amsterdam, and ii) Norbord, Inc., a Canadian-based international producer of proprietary wood-based panels sold in Canada and the U.S. VimpelCom was down 17.4%, whereas Norbord lost 8.8% during the initial period. The VimpelCom position was sold in January, as it lost its attractive rank due to deterioration in cash flow dividend coverage, simultaneous with new concerns about undue Russian influence on their business activities. Norbord remains a top-ranked holding in the portfolio, and the company continues to develop strong cash flow from operations. With reasonable help from economic activity in upcoming years, dividend payments should be well covered, and the issue carries a very attractive 8% annual yield.
We expect a continuation of the abnormally low interest rate, below average economic growth condition for the world’s leading economies. We believe this environment will continue to favor this strategy’s strong stock selection skillset, combined with its emphasis on equity return from cash dividends and distributions.
Funds distributed by Unified Financial Securities, Inc., 2960 North Meridian Street, Suite 300, Indianapolis, IN 46208. (Member FINRA).
4
Diversification does not ensure a profit or guarantee against loss.
Past performance is no guarantee of future results. The investment return and principal value of an investment in the Funds will fluctuate so that an investor’s shares, when redeemed, may be worth more or less than their original cost.
This material must be preceded or accompanied by a prospectus.
5
INVESTMENT RESULTS – (Unaudited)
Total Return*
(For the period ended February 28, 2014)
| | | | |
| | | Since Inception
(December 20, 2013) | |
Meritage Growth Equity Fund, Institutional Class | | | 3.00 | % |
Russell 1000 Growth Index** | | | 4.75 | % |
Total annual operating expenses, as disclosed in the Fund’s prospectus dated December 19, 2013, were 1.84% of average daily net assets (1.00% after fee waivers/expense reimbursements by the Adviser). The Adviser has contractually agreed to waive or limit its fees and assume other expenses of the Fund through December 31, 2015, so that total annual fund operating expenses do not exceed 1.00% of the Fund’s average daily net assets. This operating expense limitation does not apply to brokerage fees and commissions, borrowing costs (such as interest and dividend expenses on securities sold short), taxes, 12b-1 fees, extraordinary expenses and indirect expenses (such as “acquired fund fees and expenses”). This contractual arrangement may only be terminated by mutual consent of the Adviser and the Board of Trustees of the Fund, and it will automatically terminate upon the termination of the investment advisory agreement between the Fund and the Adviser.
Total Return*
(For the period ended February 28, 2014)
| | | | |
| | | Since Inception
(December 20, 2013) | |
Meritage Growth Equity Fund,
Investor Class | | | 2.90 | % |
Russell 1000 Growth Index** | | | 4.75 | % |
Total annual operating expenses, as disclosed in the Fund’s prospectus dated December 19, 2013, were 2.09% of average daily net assets (1.25% after fee waivers/expense reimbursements by the Adviser). The Adviser has contractually agreed to waive or limit its fees and assume other expenses of the Fund through December 31, 2015, so that total annual fund operating expenses do not exceed 1.00% of the Fund’s average daily net assets. This operating expense limitation does not apply to brokerage fees and commissions, borrowing costs (such as interest and dividend expenses on securities sold short), taxes, 12b-1 fees, extraordinary expenses and indirect expenses (such as “acquired fund fees and expenses”). This contractual arrangement may only be terminated by mutual consent of the Adviser and the Board of Trustees of the Fund, and it will automatically terminate upon the termination of the investment advisory agreement between the Fund and the Adviser.
The performance quoted represents past performance, which does not guarantee future results. The investment return and principal value of an investment will fluctuate so that an investor’s shares, when redeemed, may be worth more or less than their original cost. The returns shown do not reflect deduction of taxes that a shareholder would pay on Fund distributions or the redemption of Fund shares. The Fund’s investment objectives, risks, charges and expenses must be considered carefully before investing. Current performance of a Fund may be lower or higher than the performance quoted. Performance data current to the most recent month end may be obtained by calling 1-855-261-0104.
6
The performance above reflects any fee reductions during the applicable period. If such fee reductions had not occurred, the quoted performance would be lower.
| * | Return figures reflect any change in price per share and assume the reinvestment of all distributions. |
| ** | The Russell 1000® Growth Index is a widely recognized unmanaged indices of equity securities and is representative of a broader domestic equity market and range of securities than is found in the Fund’s portfolio. Individuals cannot invest directly in an Index; however, an individual can invest in exchange traded funds or other investment vehicles that attempt to track the performance of a benchmark index. |
The Fund’s investment objective, strategies, risks, charges and expenses must be considered carefully before investing. The prospectus contains this and other important information about the investment company and may be obtained by calling 1-855-261-0104. Please read it carefully before investing.
The Fund is distributed by Unified Financial Securities, Inc., Member FINRA.
7
Total Return*
(For the period ended February 28, 2014)
| | | | |
| | | Since Inception
(December 20, 2013) | |
Meritage Value Equity Fund,
Institutional Class | | | 2.40 | % |
Russell 1000 Value Index** | | | 2.68 | % |
Total annual operating expenses, as disclosed in the Fund’s prospectus dated December 19, 2013, were 1.84% of average daily net assets (1.00% after fee waivers/expense reimbursements by the Adviser). The Adviser has contractually agreed to waive or limit its fees and assume other expenses of the Fund through December 31, 2015, so that total annual fund operating expenses do not exceed 1.00% of the Fund’s average daily net assets. This operating expense limitation does not apply to brokerage fees and commissions, borrowing costs (such as interest and dividend expenses on securities sold short), taxes, 12b-1 fees, extraordinary expenses and indirect expenses (such as “acquired fund fees and expenses”). This contractual arrangement may only be terminated by mutual consent of the Adviser and the Board of Trustees of the Fund, and it will automatically terminate upon the termination of the investment advisory agreement between the Fund and the Adviser.
Total Return*
(For the period ended February 28, 2014)
| | | | |
| | | Since Inception
(December 20, 2013) | |
Meritage Value Equity Fund,
Investor Class | | | 2.30 | % |
Russell 1000 Value Index** | | | 2.68 | % |
Total annual operating expenses, as disclosed in the Fund’s prospectus dated December 19, 2013, were 2.09% of average daily net assets (1.25% after fee waivers/expense reimbursements by the Adviser). The Adviser has contractually agreed to waive or limit its fees and assume other expenses of the Fund through December 31, 2015, so that total annual fund operating expenses do not exceed 1.00% of the Fund’s average daily net assets. This operating expense limitation does not apply to brokerage fees and commissions, borrowing costs (such as interest and dividend expenses on securities sold short), taxes, 12b-1 fees, extraordinary expenses and indirect expenses (such as “acquired fund fees and expenses”). This contractual arrangement may only be terminated by mutual consent of the Adviser and the Board of Trustees of the Fund, and it will automatically terminate upon the termination of the investment advisory agreement between the Fund and the Adviser.
The performance quoted represents past performance, which does not guarantee future results. The investment return and principal value of an investment will fluctuate so that an investor’s shares, when redeemed, may be worth more or less than their original cost. The returns shown do not reflect deduction of taxes that a shareholder would pay on Fund distributions or the redemption of Fund shares. The Fund’s investment objectives, risks, charges and expenses must be considered carefully before investing. Current performance of a Fund may be lower or higher than the performance quoted. Performance data current to the most recent month end may be obtained by calling 1-855-261-0104.
8
The performance above reflects any fee reductions during the applicable period. If such fee reductions had not occurred, the quoted performance would be lower.
| * | Return figures reflect any change in price per share and assume the reinvestment of all distributions. |
| ** | The Russell 1000® Value Index is a widely recognized unmanaged indices of equity securities and is representative of a broader domestic equity market and range of securities than is found in the Fund’s portfolio. Individuals cannot invest directly in an Index; however, an individual can invest in exchange traded funds or other investment vehicles that attempt to track the performance of a benchmark index. |
The Fund’s investment objective, strategies, risks, charges and expenses must be considered carefully before investing. The prospectus contains this and other important information about the investment company and may be obtained by calling 1-855-261-0104. Please read it carefully before investing.
The Fund is distributed by Unified Financial Securities, Inc., Member FINRA.
9
Total Return*
(For the period ended February 28, 2014)
| | | | |
| | | Since Inception
(December 20, 2013) | |
Meritage Yield-Focus Equity Fund, Institutional Class | | | 3.40 | % |
Russell 3000 Value Index** | | | 2.76 | % |
Total annual operating expenses, as disclosed in the Fund’s prospectus dated December 19, 2013, were 1.48% of average daily net assets (1.00% after fee waivers/expense reimbursements by the Adviser. The Adviser has contractually agreed to waive or limit its fees and assume other expenses of the Fund through December 31, 2015, so that total annual fund operating expenses do not exceed 1.00% of the Fund’s average daily net assets. This operating expense limitation does not apply to brokerage fees and commissions, borrowing costs (such as interest and dividend expenses on securities sold short), taxes, 12b-1 fees, extraordinary expenses and indirect expenses (such as “acquired fund fees and expenses”). This contractual arrangement may only be terminated by mutual consent of the Adviser and the Board of Trustees of the Fund, and it will automatically terminate upon the termination of the investment advisory agreement between the Fund and the Adviser.
Total Return*
(For the period ended February 28, 2014)
| | | | |
| | | Since Inception
(December 20, 2013) | |
Meritage Yield-Focus Equity Fund, Investor Class | | | 3.30 | % |
Russell 3000 Value Index** | | | 2.76 | % |
Total annual operating expenses, as disclosed in the Fund’s prospectus dated December 19, 2013, were 1.73% of average daily net assets (1.25% after fee waivers/expense reimbursements by the Adviser. The Adviser has contractually agreed to waive or limit its fees and assume other expenses of the Fund through December 31, 2015, so that total annual fund operating expenses do not exceed 1.00% of the Fund’s average daily net assets. This operating expense limitation does not apply to brokerage fees and commissions, borrowing costs (such as interest and dividend expenses on securities sold short), taxes, 12b-1 fees, extraordinary expenses and indirect expenses (such as “acquired fund fees and expenses”). This contractual arrangement may only be terminated by mutual consent of the Adviser and the Board of Trustees of the Fund, and it will automatically terminate upon the termination of the investment advisory agreement between the Fund and the Adviser.
The performance quoted represents past performance, which does not guarantee future results. The investment return and principal value of an investment will fluctuate so that an investor’s shares, when redeemed, may be worth more or less than their original cost. The returns shown do not reflect deduction of taxes that a shareholder would pay on Fund distributions or the redemption of Fund shares. The Fund’s investment objectives, risks, charges and expenses must be considered carefully before investing. Current performance of a Fund may be lower or higher than the performance quoted. Performance data current to the most recent month end may be obtained by calling 1-855-261-0104.
10
The performance above reflects any fee reductions during the applicable period. If such fee reductions had not occurred, the quoted performance would be lower.
| * | Return figures reflect any change in price per share and assume the reinvestment of all distributions. |
| ** | The Russell 3000® Value Index is a widely recognized unmanaged indices of equity securities and is representative of a broader domestic equity market and range of securities than is found in the Fund’s portfolio. Individuals cannot invest directly in an Index; however, an individual can invest in exchange traded funds or other investment vehicles that attempt to track the performance of a benchmark index. |
The Fund’s investment objective, strategies, risks, charges and expenses must be considered carefully before investing. The prospectus contains this and other important information about the investment company and may be obtained by calling 1-855-261-0104. Please read it carefully before investing.
The Fund is distributed by Unified Financial Securities, Inc., Member FINRA.
11
FUND HOLDINGS – (Unaudited)
Meritage Growth Equity Fund Holdings as of February 28, 2014*
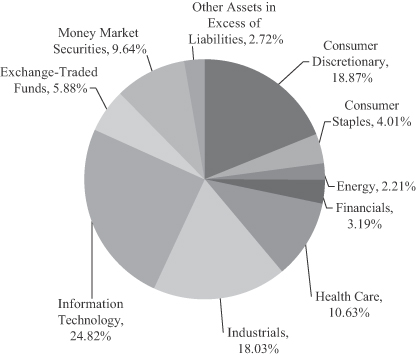
| * | As a percent of net assets. |
The investment objective of the Meritage Growth Equity Fund is to seek growth of capital.
12
FUND HOLDINGS – (Unaudited)
Meritage Value Equity Fund Holdings as of February 28, 2014*
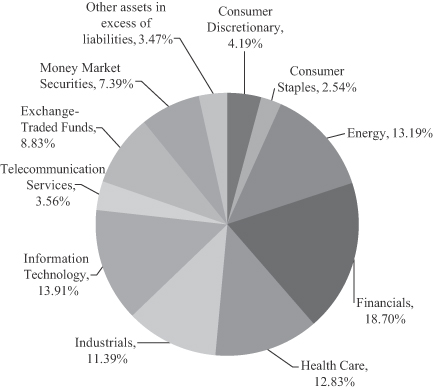
| * | As a percentage of net assets. |
The investment objective of the Meritage Value Equity Fund is to seek growth of capital. Income is a secondary objective.
13
FUND HOLDINGS – (Unaudited)
Meritage Yield-Focus Equity Fund Holdings as of February 28, 2014*
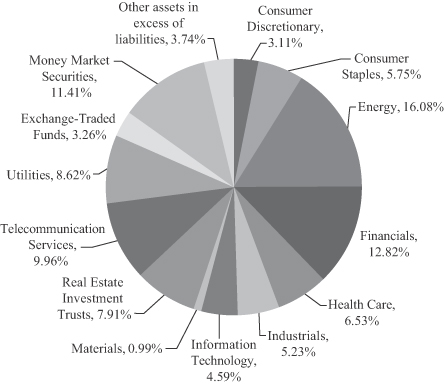
| * | As a percent of net assets. |
The investment objective of the Meritage Yield-Focus Equity Fund is to seek long-term growth of capital with an emphasis on high current income.
Availability of Portfolio Schedule – (Unaudited)
The Funds will file their complete schedule of portfolio holdings with the Securities and Exchange Commission (“SEC”) for the first and third quarter of each fiscal year on Form N-Q. The Funds’ Forms N-Q will be available at the SEC’s website at www.sec.gov. The Form N-Q may be reviewed and copied at the Public Reference Room in Washington, DC. Information on the operation of the Public Reference Room may be obtained by calling 1-800-SEC-0330.
Summary of Fund’s Expenses – (Unaudited)
As a shareholder of the Fund, you incur ongoing costs, including management fees and other Fund expenses. This Example is intended to help you understand your ongoing costs (in dollars) of investing in the Fund and to compare these costs with the ongoing costs of investing in other mutual funds. The Example is based on an investment of $1,000 invested at the beginning of the period, and held for the entire period from December 20, 2013 (commencement of operations) to February 28, 2014.
14
Actual Expenses
The first line of the table below provides information about actual account values and actual expenses. You may use the information in this line, together with the amount you invested, to estimate the expenses that you paid over the period. Simply divide your account value by $1,000 (for example, an $8,600 account value divided by $1,000 = $8.60), then multiply the result by the number in the first line under the heading entitled “Expenses Paid During the Period” to estimate the expenses you paid on your account during this period.
Hypothetical Example for Comparison Purposes
The second line of the table below provides information about hypothetical account values and hypothetical expenses based on the Fund’s actual expense ratio and an assumed rate of return of 5% per year before expenses, which is not the Fund’s actual return. The hypothetical account values and expenses may not be used to estimate the actual ending account balance or expenses you paid for the period. You may use this information to compare the ongoing costs of investing in the Fund and other funds. To do so, compare this 5% hypothetical example with the 5% hypothetical examples that appear in the shareholder reports of the other funds.
Please note that the expenses shown in the table are meant to highlight your ongoing costs only. Therefore, the second line of the table below is useful in comparing ongoing costs only and will not help you determine the relative costs of owning different funds.
| | | | | | | | | | | | | | | | |
| | | Beginning
Account Value | | | Ending
Account Value
February 28, 2014 | | | Expenses Paid
During Period | | | Annualized
Expense
Ratio | |
Meritage Growth Equity Fund | | | | | | | | | | | | | | | | |
Institutional Class | | | | | | | | | | | | | | | | |
Actual | | $ | 1,000.00 | | | $ | 1,030.00 | | | $ | 1.89 | * | | | 1.00 | % |
Hypothetical** | | $ | 1,000.00 | | | $ | 1,019.84 | | | $ | 5.01 | | | | 1.00 | % |
Investor Class | | | | | | | | | | | | | | | | |
Actual | | $ | 1,000.00 | | | $ | 1,029.00 | | | $ | 2.36 | * | | | 1.25 | % |
Hypothetical** | | $ | 1,000.00 | | | $ | 1,018.60 | | | $ | 6.26 | | | | 1.25 | % |
Meritage Value Equity Fund | | | | | | | | | | | | | | | | |
Institutional Class | | | | | | | | | | | | | | | | |
Actual | | $ | 1,000.00 | | | $ | 1,024.00 | | | $ | 1.89 | * | | | 1.00 | % |
Hypothetical** | | $ | 1,000.00 | | | $ | 1,019.84 | | | $ | 5.01 | | | | 1.00 | % |
Investor Class | | | | | | | | | | | | | | | | |
Actual | | $ | 1,000.00 | | | $ | 1,023.00 | | | $ | 2.36 | * | | | 1.25 | % |
Hypothetical** | | $ | 1,000.00 | | | $ | 1,018.60 | | | $ | 6.26 | | | | 1.25 | % |
Meritage Yield-Focus Equity Fund | | | | | | | | | | | | | | | | |
Institutional Class | | | | | | | | | | | | | | | | |
Actual | | $ | 1,000.00 | | | $ | 1,034.00 | | | $ | 1.89 | * | | | 1.00 | % |
Hypothetical** | | $ | 1,000.00 | | | $ | 1,019.84 | | | $ | 5.01 | | | | 1.00 | % |
Investor Class | | | | | | | | | | | | | | | | |
Actual | | $ | 1,000.00 | | | $ | 1,033.00 | | | $ | 2.37 | * | | | 1.25 | % |
Hypothetical** | | $ | 1,000.00 | | | $ | 1,018.60 | | | $ | 6.26 | | | | 1.25 | % |
| * | Expenses are equal to the Fund’s annualized expense ratio multiplied by the average account value over the period, multiplied by 68/365 (to reflect the period since commencement of operations on December 20, 2013). |
| ** | Assumes 5% return before expenses. The hypothetical example is calculated based on a six month period from September 1, 2013 to February 28, 2014. Accordingly, expenses are equal to the Fund’s annualized expense ratio multiplied by the average account value over the six month period, multiplied by 181/365 (to reflect the one-half year period). |
15
MERITAGE GROWTH EQUITY FUND
SCHEDULE OF INVESTMENTS
February 28, 2014 (Unaudited)
| | | | | | | | |
| COMMON STOCKS – 81.76% | | Shares | | | Fair Value | |
Consumer Discretionary – 18.87% | | | | | | | | |
Bed Bath & Beyond, Inc. * | | | 940 | | | $ | 63,751 | |
CBS Corp. – Class B | | | 860 | | | | 57,689 | |
Continental AG ADR | | | 1,285 | | | | 62,229 | |
Fossil Group, Inc. * | | | 330 | | | | 37,920 | |
Home Depot, Inc./The | | | 460 | | | | 37,734 | |
Jack in the Box, Inc. * | | | 1,145 | | | | 65,780 | |
PetSmart, Inc. | | | 1,090 | | | | 73,095 | |
Polaris Industries, Inc. | | | 600 | | | | 80,418 | |
Scripps Networks Interactive, Inc. – Class A | | | 1,225 | | | | 99,519 | |
TJX Cos., Inc./The | | | 2,170 | | | | 133,368 | |
Valeo SA ADR | | | 1,535 | | | | 107,128 | |
Walt Disney Co./The | | | 1,065 | | | | 86,063 | |
| | | | | | | | |
| | | | | | | 904,694 | |
| | | | | | | | |
Consumer Staples – 4.01% | |
Colgate-Palmolive Co. | | | 1,310 | | | | 82,307 | |
Henkel AG & Co. KGaA ADR | | | 1,085 | | | | 109,694 | |
| | | | | | | | |
| | | | | | | 192,001 | |
| | | | | | | | |
Energy – 2.21% | |
Exxon Mobil Corp. | | | 530 | | | | 51,023 | |
Schlumberger Ltd. | | | 590 | | | | 54,870 | |
| | | | | | | | |
| | | | | | | 105,893 | |
| | | | | | | | |
Financials – 3.19% | |
ACE Ltd. | | | 710 | | | | 69,488 | |
Allstate Corp./The | | | 1,535 | | | | 83,289 | |
| | | | | | | | |
| | | | | | | 152,777 | |
| | | | | | | | |
Health Care – 10.63% | |
Amgen, Inc. | | | 325 | | | | 40,307 | |
Edwards LifeSciences Corp. * | | | 1,200 | | | | 83,712 | |
McKesson Corp. | | | 875 | | | | 154,919 | |
Medtronic, Inc. | | | 735 | | | | 43,556 | |
Novo-Nordisk A/S ADR | | | 2,295 | | | | 109,081 | |
United Therapeutics Corp. * | | | 770 | | | | 78,093 | |
| | | | | | | | |
| | | | | | | 509,668 | |
| | | | | | | | |
Industrials – 18.03% | |
AMETEK, Inc. | | | 1,330 | | | | 70,809 | |
Danaher Corp. | | | 1,855 | | | | 141,889 | |
Deluxe Corp. | | | 900 | | | | 45,432 | |
Equifax, Inc. | | | 870 | | | | 60,952 | |
Hubbell, Inc. – Class B | | | 645 | | | | 77,103 | |
See accompanying notes which are an integral part of these financial statements.
16
MERITAGE GROWTH EQUITY FUND
SCHEDULE OF INVESTMENTS – (continued)
February 28, 2014 (Unaudited)
| | | | | | | | |
| COMMON STOCKS – 81.76% – continued | | Shares | | | Fair Value | |
Industrials – 18.03% – continued | |
Hyster-Yale Materials Handling, Inc. – Class A | | | 585 | | | $ | 59,050 | |
Lincoln Electric Holdings, Inc. | | | 910 | | | | 68,223 | |
MRC Global, Inc. * | | | 2,650 | | | | 68,158 | |
Rockwell Automation, Inc. | | | 440 | | | | 54,050 | |
Southwest Airlines Co. | | | 2,385 | | | | 53,519 | |
UniFirst Corp. | | | 470 | | | | 51,554 | |
Union Pacific Corp. | | | 630 | | | | 113,639 | |
| | | | | | | | |
| | | | | | | 864,378 | |
| | | | | | | | |
Information Technology – 24.82% | |
Activision Blizzard, Inc. | | | 2,325 | | | | 44,989 | |
Akamai Technologies, Inc. * | | | 775 | | | | 47,376 | |
Apple, Inc. | | | 304 | | | | 159,977 | |
Electronics For Imaging, Inc. * | | | 1,575 | | | | 70,245 | |
Fiserv, Inc. * | | | 1,135 | | | | 65,887 | |
Google, Inc. – Class A * | | | 137 | | | | 166,544 | |
International Business Machines Corp. | | | 345 | | | | 63,884 | |
MasterCard, Inc. – Class A | | | 1,310 | | | | 101,813 | |
Netscout Systems, Inc. * | | | 1,520 | | | | 57,730 | |
Oracle Corp. | | | 2,080 | | | | 81,349 | |
PTC, Inc. * | | | 1,545 | | | | 60,734 | |
QUALCOMM, Inc. | | | 1,105 | | | | 83,195 | |
Sanmina Corp. * | | | 4,370 | | | | 74,115 | |
Sapient Corp. * | | | 3,180 | | | | 55,364 | |
Ubiquiti Networks, Inc. * | | | 1,145 | | | | 56,574 | |
| | | | | | | | |
| | | | | | | 1,189,776 | |
| | | | | | | | |
| | |
TOTAL COMMON STOCKS (Cost $3,669,744) | | | | | | | 3,919,187 | |
| | | | | | | | |
EXCHANGE-TRADED FUNDS – 5.88% | | | | | | | | |
iShares Russell 1000 Growth ETF | | | 2,200 | | | | 193,006 | |
Vanguard Financials ETF | | | 1,990 | | | | 88,535 | |
| | | | | | | | |
TOTAL EXCHANGE-TRADED FUNDS (Cost $278,291) | | | | | | | 281,541 | |
| | | | | | | | |
MONEY MARKET SECURITIES – 9.64% | | | | | | | | |
Fidelity Institutional Money Market Treasury Portfolio – Class I, 0.01% (a) | | | 462,191 | | | | 462,191 | |
| | | | | | | | |
| | |
TOTAL MONEY MARKET SECURITIES (Cost $462,191) | | | | | | | 462,191 | |
| | | | | | | | |
TOTAL INVESTMENTS – 97.28% (Cost $4,410,226) | | | | | | | 4,662,919 | |
| | | | | | | | |
Other Assets in Excess of Liabilities – 2.72% | | | | | | | 130,584 | |
| | | | | | | | |
TOTAL NET ASSETS – 100.00% | | | | | | $ | 4,793,503 | |
| | | | | | | | |
| | (a) | Rate disclosed is the seven day yield as of February 28, 2014. |
| | * | Non-income producing security. |
ADR – American Depositary Receipt
ETF – Exchange-Traded Fund
See accompanying notes which are an integral part of these financial statements.
17
MERITAGE VALUE EQUITY FUND
SCHEDULE OF INVESTMENTS
February 28, 2014 (Unaudited)
| | | | | | | | |
| COMMON STOCKS – 80.31% | | Shares | | | Fair Value | |
Consumer Discretionary – 4.19% | | | | | | | | |
Ford Motor Co. | | | 3,835 | | | $ | 59,021 | |
Iconix Brand Group, Inc. * | | | 1,335 | | | | 53,720 | |
Steven Madden Ltd. * | | | 2,305 | | | | 84,017 | |
| | | | | | | | |
| | | | | | | 196,758 | |
| | | | | | | | |
Consumer Staples – 2.54% | |
CVS Caremark Corp. | | | 1,630 | | | | 119,218 | |
| | | | | | | | |
Energy – 13.19% | |
Baker Hughes, Inc. | | | 1,160 | | | | 73,405 | |
Chevron Corp. | | | 630 | | | | 72,658 | |
ConocoPhillips | | | 1,135 | | | | 75,478 | |
Ensco PLC – Class A | | | 1,265 | | | | 66,615 | |
Exxon Mobil Corp. | | | 760 | | | | 73,165 | |
Halliburton Co. | | | 1,230 | | | | 70,110 | |
Lukoil ADR | | | 1,195 | | | | 65,008 | |
National Oilwell Varco, Inc. | | | 790 | | | | 60,862 | |
Royal Dutch Shell PLC ADR | | | 845 | | | | 61,575 | |
| | | | | | | | |
| | | | | | | 618,876 | |
| | | | | | | | |
Financials – 18.70% | |
Discover Financial Services | | | 1,135 | | | | 65,126 | |
Horace Mann Educators Corp. | | | 2,445 | | | | 69,951 | |
ING U.S., Inc. | | | 2,515 | | | | 90,213 | |
KeyCorp | | | 6,360 | | | | 83,761 | |
MetLife, Inc. | | | 1,815 | | | | 91,966 | |
Primerica, Inc. | | | 2,070 | | | | 92,777 | |
Prudential Financial, Inc. | | | 1,190 | | | | 100,650 | |
Reinsurance Group of America, Inc. | | | 1,125 | | | | 86,614 | |
Torchmark Corp. | | | 1,405 | | | | 108,902 | |
Wells Fargo & Co. | | | 1,880 | | | | 87,270 | |
| | | | | | | | |
| | | | | | | 877,230 | |
| | | | | | | | |
Health Care – 12.83% | |
Aetna, Inc. | | | 870 | | | | 63,258 | |
CIGNA Corp. | | | 710 | | | | 56,509 | |
Eli Lilly & Co. | | | 1,260 | | | | 75,109 | |
Humana, Inc. | | | 870 | | | | 97,840 | |
Magellan Health Services, Inc. * | | | 1,330 | | | | 81,316 | |
Mednax, Inc. * | | | 1,160 | | | | 70,551 | |
Teva Pharmaceutical Industries Ltd. ADR | | | 1,785 | | | | 89,054 | |
UnitedHealth Group, Inc. | | | 885 | | | | 68,384 | |
| | | | | | | | |
| | | | | | | 602,021 | |
| | | | | | | | |
See accompanying notes which are an integral part of these financial statements.
18
MERITAGE VALUE EQUITY FUND
SCHEDULE OF INVESTMENTS – (continued)
February 28, 2014 (Unaudited)
| | | | | | | | |
| COMMON STOCKS – 80.31% – continued | | Shares | | | Fair Value | |
Industrials – 11.39% | |
AGCO Corp. | | | 1,265 | | | $ | 66,387 | |
Dover Corp. | | | 1,145 | | | | 107,974 | |
EnerSys | | | 1,600 | | | | 113,664 | |
Huron Consulting Group, Inc. * | | | 865 | | | | 57,237 | |
Northrop Grumman Corp. | | | 965 | | | | 116,794 | |
Valmont Industries, Inc. | | | 495 | | | | 72,087 | |
| | | | | | | | |
| | | | | | | 534,143 | |
| | | | | | | | |
Information Technology – 13.91% | |
Arrow Electronics, Inc. * | | | 1,865 | | | | 105,615 | |
Brocade Communications Systems, Inc. * | | | 11,885 | | | | 113,739 | |
Check Point Software Technologies Ltd. * | | | 1,050 | | | | 70,791 | |
CSG Systems International, Inc. | | | 1,565 | | | | 43,820 | |
Hewlett-Packard Co. | | | 2,130 | | | | 63,644 | |
Skyworks Solutions, Inc. * | | | 3,000 | | | | 106,380 | |
Symantec Corp. | | | 2,890 | | | | 62,077 | |
Synopsys, Inc. * | | | 2,135 | | | | 86,254 | |
| | | | | | | | |
| | | | | | | 652,320 | |
| | | | | | | | |
Telecommunication Services – 3.56% | |
Deutsche Telekom AG ADR | | | 5,985 | | | | 100,961 | |
Nippon Telegraph & Telephone Corp. ADR | | | 2,345 | | | | 66,223 | |
| | | | | | | | |
| | | | | | | 167,184 | |
| | | | | | | | |
TOTAL COMMON STOCKS (Cost $3,548,048) | | | | | | | 3,767,750 | |
| | | | | | | | |
EXCHANGE-TRADED FUNDS – 8.83% | | | | | | | | |
iShares S&P 500 Value Index Fund | | | 1,900 | | | | 161,766 | |
SPDR S&P Bank ETF | | | 2,540 | | | | 83,820 | |
Utilities Select Sector SPDR Fund | | | 4,170 | | | | 168,676 | |
| | | | | | | | |
TOTAL EXCHANGE-TRADED FUNDS (Cost $405,614) | | | | 414,262 | |
| | | | | | | | |
MONEY MARKET SECURITIES – 7.39% | | | | | | | | |
Fidelity Institutional Money Market Treasury Portfolio – Class I, 0.01% (a) | | | 346,776 | | | | 346,776 | |
| | | | | | | | |
TOTAL MONEY MARKET SECURITIES (Cost $346,776) | | | | | | | 346,776 | |
| | | | | | | | |
TOTAL INVESTMENTS – 96.53%(Cost $4,300,438) | | | | | | | 4,528,788 | |
| | | | | | | | |
Other Assets in Excess of Liabilities – 3.47% | | | | | | | 162,579 | |
| | | | | | | | |
TOTAL NET ASSETS – 100.00% | | | | | | $ | 4,691,367 | |
| | | | | | | | |
| | (a) | Rate disclosed is the seven day yield as of February 28, 2014. |
| | * | Non-income producing security. |
ADR – American Depositary Receipt
ETF – Exchange-Traded Fund
See accompanying notes which are an integral part of these financial statements.
19
MERITAGE YIELD-FOCUS EQUITY FUND
SCHEDULE OF INVESTMENTS
February 28, 2014 (Unaudited)
| | | | | | | | |
| COMMON STOCKS – 80.07% | | Shares | | | Fair Value | |
Consumer Discretionary – 3.11% | | | | | | | | |
Garmin Ltd. | | | 1,465 | | | $ | 78,612 | |
Superior Industries International, Inc. | | | 1,430 | | | | 26,140 | |
| | | | | | | | |
| | | | | | | 104,752 | |
| | | | | | | | |
Consumer Staples – 5.75% | |
Altria Group, Inc. | | | 1,870 | | | | 67,806 | |
Lorillard, Inc. | | | 1,160 | | | | 56,910 | |
Reynolds American, Inc. | | | 1,350 | | | | 68,621 | |
| | | | | | | | |
| | | | | | | 193,337 | |
| | | | | | | | |
Energy – 16.08% | |
BP PLC ADR | | | 1,085 | | | | 54,912 | |
Energy Transfer Equity LP | | | 790 | | | | 34,484 | |
Energy Transfer Partners LP | | | 495 | | | | 27,487 | |
Eni SpA ADR | | | 1,025 | | | | 49,139 | |
Enterprise Products Partners LP | | | 915 | | | | 61,406 | |
Golar LNG Partners LP (a) | | | 1,540 | | | | 46,523 | |
Plains All American Pipeline LP | | | 1,290 | | | | 69,879 | |
Plains GP Holdings LP (a) | | | 1,185 | | | | 33,180 | |
Targa Resources Corp. | | | 340 | | | | 32,898 | |
Targa Resources Partners LP (a) | | | 755 | | | | 40,536 | |
Vanguard Natural Resources LLC (a) | | | 1,305 | | | | 38,967 | |
Williams Partners LP | | | 1,030 | | | | 51,098 | |
| | | | | | | | |
| | | | | | | 540,509 | |
| | | | | | | | |
Financials – 12.82% | |
Ares Capital Corp. | | | 2,955 | | | | 53,279 | |
Bank of Montreal | | | 745 | | | | 49,148 | |
BGC Partners, Inc. | | | 4,260 | | | | 28,968 | |
Canadian Imperial Bank of Commerce | | | 520 | | | | 43,581 | |
Fifth Street Finance Corp. | | | 5,200 | | | | 51,064 | |
KKR & Co. LP (a) | | | 2,675 | | | | 64,575 | |
KKR Financial Holdings LLC (a) | | | 3,455 | | | | 42,220 | |
Power Financial Corp. | | | 1,245 | | | | 39,230 | |
Zurich Insurance Group AG ADR | | | 1,925 | | | | 58,828 | |
| | | | | | | | |
| | | | | | | 430,893 | |
| | | | | | | | |
Health Care – 6.53% | |
AstraZeneca PLC ADR | | | 880 | | | | 59,629 | |
Eli Lilly & Co. | | | 875 | | | | 52,159 | |
GlaxoSmithKline PLC ADR | | | 830 | | | | 46,430 | |
Pfizer, Inc. | | | 1,915 | | | | 61,491 | |
| | | | | | | | |
| | | | | | | 219,709 | |
| | | | | | | | |
See accompanying notes which are an integral part of these financial statements.
20
MERITAGE YIELD-FOCUS EQUITY FUND
SCHEDULE OF INVESTMENTS – (continued)
February 28, 2014 (Unaudited)
| | | | | | | | |
| COMMON STOCKS – 80.07% – continued | | Shares | | | Fair Value | |
Industrials – 5.23% | |
Ennis, Inc. | | | 1,610 | | | $ | 25,438 | |
Lockheed Martin Corp. | | | 515 | | | | 83,584 | |
Navios Maritime Partners LP | | | 1,510 | | | | 25,821 | |
Norbord, Inc. | | | 1,465 | | | | 40,866 | |
| | | | | | | | |
| | | | | | | 175,709 | |
| | | | | | | | |
Information Technology – 4.59% | |
Electro Rent Corp. | | | 1,505 | | | | 27,346 | |
Intel Corp. | | | 2,290 | | | | 56,700 | |
Intersil Corp. – Class A | | | 2,470 | | | | 31,418 | |
Silicon Motion Technology Corp. ADR | | | 2,320 | | | | 38,721 | |
| | | | | | | | |
| | | | | | | 154,185 | |
| | | | | | | | |
Materials – 0.99% | | | | | | | | |
CVR Partners LP (a) | | | 1,680 | | | | 33,348 | |
| | | | | | | | |
Real Estate Investment Trusts – 6.39% | |
EPR Properties | | | 1,065 | | | | 56,722 | |
Lexington Realty Trust | | | 2,515 | | | | 28,696 | |
Medical Properties Trust, Inc. | | | 3,660 | | | | 48,275 | |
Realty Income Corp. | | | 1,155 | | | | 51,305 | |
STAG Industrial, Inc. | | | 1,275 | | | | 29,720 | |
| | | | | | | | |
| | | | | | | 214,718 | |
| | | | | | | | |
Telecommunication Services – 9.96% | | | | | | | | |
AT&T, Inc. | | | 1,405 | | | | 44,862 | |
BCE, Inc. ADR | | | 1,155 | | | | 50,358 | |
CenturyLink, Inc. | | | 1,375 | | | | 42,983 | |
Telecom Corporation of New Zealand Ltd. ADR | | | 3,470 | | | | 36,140 | |
Telefonica Brasil SA ADR | | | 2,725 | | | | 50,821 | |
Telstra Corp. Ltd. ADR | | | 2,040 | | | | 46,267 | |
Verizon Communications, Inc. | | | 473 | | | | 22,488 | |
Vodafone Group PLC ADR | | | 982 | | | | 40,829 | |
| | | | | | | | |
| | | | | | | 334,748 | |
| | | | | | | | |
Utilities – 8.62% | | | | | | | | |
Centrica PLC ADR | | | 2,455 | | | | 52,635 | |
E.ON AG ADR | | | 2,840 | | | | 53,932 | |
Entergy Corp. | | | 630 | | | | 40,207 | |
PPL Corp. | | | 1,710 | | | | 55,216 | |
Public Service Enterprise Group, Inc. | | | 1,245 | | | | 45,642 | |
Westar Energy, Inc. | | | 1,230 | | | | 42,091 | |
| | | | | | | | |
| | | | | | | 289,723 | |
| | | | | | | | |
See accompanying notes which are an integral part of these financial statements.
21
MERITAGE YIELD-FOCUS EQUITY FUND
SCHEDULE OF INVESTMENTS – (continued)
February 28, 2014 (Unaudited)
| | | | | | | | |
| COMMON STOCKS – 80.07% – continued | | Shares | | | Fair Value | |
| |
TOTAL COMMON STOCKS (Cost $2,583,134) | | | $ | 2,691,631 | |
| | | | | | | | |
PREFERRED STOCKS – 1.52% | | | | | | | | |
Real Estate Investment Trusts – 1.52% | | | | | | | | |
Weyerhaeuser Co., Series A, 6.375% | | | 940 | | | | 51,192 | |
| | | | | | | | |
TOTAL PREFERRED STOCKS (Cost $50,962) | | | | 51,192 | |
| | | | | | | | |
EXCHANGE-TRADED FUNDS – 3.26% | | | | | | | | |
SPDR S&P Dividend ETF | | | 1,500 | | | | 109,590 | |
| | | | | | | | |
Total Exchange-Traded Funds (Cost $109,771) | | | | 109,590 | |
| | | | | | | | |
MONEY MARKET SECURITIES – 11.41% | | | | | | | | |
Fidelity Institutional Money Market Treasury Portfolio – Class I, 0.01% (b) | | | 383,550 | | | | 383,550 | |
| | | | | | | | |
TOTAL MONEY MARKET SECURITIES (Cost $383,550) | | | | | | | 383,550 | |
| | | | | | | | |
TOTAL INVESTMENTS – 96.26% (Cost $3,127,417) | | | | | | | 3,235,963 | |
| | | | | | | | |
Other Assets in Excess of Liabilities – 3.74% | | | | | | | 125,889 | |
| | | | | | | | |
TOTAL NET ASSETS – 100.00% | | | | | | $ | 3,361,852 | |
| | | | | | | | |
| | (a) | Master Limited Partnership. |
| | (b) | Rate disclosed is the seven day yield as of February 28, 2014. |
ADR – American Depositary Receipt
ETF – Exchange-Traded Fund
See accompanying notes which are an integral part of these financial statements.
22
STATEMENTS OF ASSETS AND LIABILITIES
February 28, 2014 (Unaudited)
| | | | | | | | | | | | |
| | | Meritage Growth
Equity Fund | | | Meritage Value
Equity Fund | | | Meritage Yield-
Focus Equity Fund | |
Assets | | | | | | | | | | | | |
Investments in securities at value
(cost $4,410,226, $4,300,438 and $3,127,417) | | $ | 4,662,919 | | | $ | 4,528,788 | | | $ | 3,235,963 | |
Receivable for fund shares sold | | | 316,900 | | | | 247,350 | | | | 404,800 | |
Receivable for investments sold | | | 55,318 | | | | 127,039 | | | | 8,107 | |
Dividends receivable | | | 4,014 | | | | 5,236 | | | | 9,807 | |
Receivable from Adviser | | | 16,233 | | | | 14,019 | | | | 17,220 | |
Prepaid organizational costs | | | 5,344 | | | | 5,377 | | | | 5,337 | |
| | | | | | | | | | | | |
Total Assets | | | 5,060,728 | | | | 4,927,809 | | | | 3,681,234 | |
| | | | | | | | | | | | |
| | | |
Liabilities | | | | | | | | | | | | |
Payable for investments purchased | | | 236,330 | | | | 208,079 | | | | 288,435 | |
Accrued 12b-1 fees – Investor class | | | – | (a) | | | – | (a) | | | 6 | |
Payable to administrator, fund accountant, and transfer agent | | | 19,834 | | | | 17,322 | | | | 19,834 | |
Payable to custodian | | | 1,818 | | | | 1,818 | | | | 1,818 | |
Payable to trustees | | | 2,132 | | | | 2,132 | | | | 2,132 | |
Other accrued expenses | | | 7,111 | | | | 7,091 | | | | 7,157 | |
| | | | | | | | | | | | |
Total Liabilities | | | 267,225 | | | | 236,442 | | | | 319,382 | |
| | | | | | | | | | | | |
| | | |
Net Assets | | $ | 4,793,503 | | | $ | 4,691,367 | | | $ | 3,361,852 | |
| | | | | | | | | | | | |
| | | |
Net Assets consist of: | | | | | | | | | | | | |
Paid-in capital | | $ | 4,536,084 | | | $ | 4,457,320 | | | $ | 3,242,887 | |
Accumulated undistributed net investment income | | | 2,150 | | | | 2,836 | | | | 10,788 | |
Accumulated undistributed net realized gain (loss) from investment transactions | | | 2,576 | | | | 2,861 | | | | (369 | ) |
Net unrealized appreciation on investments | | | 252,693 | | | | 228,350 | | | | 108,546 | |
| | | | | | | | | | | | |
| | | |
Net Assets | | $ | 4,793,503 | | | $ | 4,691,367 | | | $ | 3,361,852 | |
| | | | | | | | | | | | |
| | | |
Net Assets: Institutional Class | | $ | 4,792,474 | | | $ | 4,690,344 | | | $ | 3,282,298 | |
| | | | | | | | | | | | |
Shares outstanding
(unlimited number of shares authorized, no par value) | | | 465,247 | | | | 458,080 | | | | 317,420 | |
| | | | | | | | | | | | |
Net asset value, offering and redemption price per share | | $ | 10.30 | | | $ | 10.24 | | | $ | 10.34 | |
| | | | | | | | | | | | |
| | | |
Net Assets: Investor Class | | $ | 1,029 | | | $ | 1,023 | | | $ | 79,554 | |
| | | | | | | | | | | | |
Shares outstanding
(unlimited number of shares authorized, no par value) | | | 100 | | | | 100 | | | | 7,701 | |
| | | | | | | | | | | | |
Net asset value, offering and redemption price per share | | $ | 10.29 | | | $ | 10.23 | | | $ | 10.33 | |
| | | | | | | | | | | | |
| (a) | Amount is less than $0.50. |
See accompanying notes which are an integral part of these financial statements.
23
STATEMENTS OF OPERATIONS
For the period ended February 28, 2014 (a) (Unaudited)
| | | | | | | | | | | | |
| | | Meritage Growth
Equity Fund | | | Meritage Value
Equity Fund | | | Meritage Yield-
Focus Equity Fund | |
Investment Income | | | | | | | | | | | | |
Dividend income
(net of foreign taxes withheld of $-, $157 and $328) | | $ | 4,872 | | | $ | 5,335 | | | $ | 12,542 | |
| | | | | | | | | | | | |
Total investment income | | | 4,872 | | | | 5,335 | | | | 12,542 | |
| | | | | | | | | | | | |
| | | |
Expenses | | | | | | | | | | | | |
Investment Adviser fees | | | 2,036 | | | | 1,870 | | | | 1,308 | |
12b-1 fees – Investor class | | | – | (b) | | | – | (b) | | | 6 | |
Administration expenses | | | 11,319 | | | | 10,384 | | | | 11,319 | |
Fund accounting expenses | | | 7,988 | | | | 6,680 | | | | 7,988 | |
Transfer agent expenses | | | 10,079 | | | | 9,871 | | | | 10,079 | |
Legal expenses | | | 3,997 | | | | 3,997 | | | | 3,997 | |
Custodian expenses | | | 1,818 | | | | 1,818 | | | | 1,818 | |
Audit expenses | | | 4,797 | | | | 4,797 | | | | 4,797 | |
Trustee expenses | | | 2,132 | | | | 2,132 | | | | 2,132 | |
Pricing expenses | | | 656 | | | | 656 | | | | 656 | |
Report printing expenses | | | 1,627 | | | | 1,627 | | | | 1,627 | |
Organizational expenses | | | 929 | | | | 935 | | | | 928 | |
Miscellaneous expenses | | | 711 | | | | 711 | | | | 713 | |
| | | | | | | | | | | | |
Total expenses | | | 48,089 | | | | 45,478 | | | | 47,368 | |
Fees waived and expenses reimbursed by Adviser | | | (45,367 | ) | | | (42,979 | ) | | | (45,614 | ) |
| | | | | | | | | | | | |
Net operating expenses | | | 2,722 | | | | 2,499 | | | | 1,754 | |
| | | | | | | | | | | | |
Net investment income | | | 2,150 | | | | 2,836 | | | | 10,788 | |
| | | | | | | | | | | | |
| |
Net Realized and Unrealized Gain on Investments | | | | | |
Net realized gain (loss) on investment securities transactions | | | 2,576 | | | | 201 | | | | (371 | ) |
Net realized gain on foreign currency transactions | | | – | | | | – | | | | 2 | |
Net realized gain on investment transactions of affiliates | | | – | | | | 2,660 | (c) | | | – | |
Net change in unrealized appreciation of investment securities | | | 252,693 | | | | 228,350 | | | | 108,546 | |
| | | | | | | | | | | | |
Net realized and unrealized gain on investments | | | 255,269 | | | | 231,211 | | | | 108,177 | |
| | | | | | | | | | | | |
Net increase in net assets resulting from operations | | $ | 257,419 | | | $ | 234,047 | | | $ | 118,965 | |
| | | | | | | | | | | | |
| (a) | For the period December 20, 2013 (commencement of operations) to February 28, 2014. |
| (b) | Amount is less than $0.50. |
| (c) | See Note 5 in the Notes to the Financial Statements. |
See accompanying notes which are an integral part of these financial statements.
24
STATEMENTS OF CHANGES IN NET ASSETS
For the period ended February 28, 2014 (a) (Unaudited)
| | | | | | | | | | | | |
| | | Meritage Growth
Equity Fund | | | Meritage Value
Equity Fund | | | Meritage Yield-
Focus Equity Fund | |
Increase in Net Assets due to: | | | | | | | | | | | | |
Operations | | | | | | | | | | | | |
Net investment income | | $ | 2,150 | | | $ | 2,836 | | | $ | 10,788 | |
Net realized gain (loss) on investment securities transactions | | | 2,576 | | | | 2,861 | (b) | | | (369 | ) |
Net change in unrealized appreciation
of investment securities | | | 252,693 | | | | 228,350 | | | | 108,546 | |
| | | | | | | | | | | | |
Net increase in net assets resulting from operations | | | 257,419 | | | | 234,047 | | | | 118,965 | |
| | | | | | | | | | | | |
| | | |
Capital Transactions – Institutional Class | | | | | | | | | | | | |
Proceeds from shares sold | | | 4,535,140 | | | | 4,456,620 | | | | 3,166,808 | |
Amount paid for shares redeemed | | | (56 | ) | | | (300 | ) | | | (1,921 | ) |
| | | | | | | | | | | | |
Total Institutional Class | | | 4,535,084 | | | | 4,456,320 | | | | 3,164,887 | |
| | | | | | | | | | | | |
| | | |
Capital Transactions – Investor Class | | | | | | | | | | | | |
Proceeds from shares sold | | | 1,000 | | | | 1,000 | | | | 78,040 | |
Amount paid for shares redeemed | | | – | | | | – | | | | (40 | ) |
| | | | | | | | | | | | |
Total Investor Class | | | 1,000 | | | | 1,000 | | | | 78,000 | |
| | | | | | | | | | | | |
Net increase in net assets resulting from capital transactions | | | 4,536,084 | | | | 4,457,320 | | | | 3,242,887 | |
| | | | | | | | | | | | |
Total Increase in Net Assets | | | 4,793,503 | | | | 4,691,367 | | | | 3,361,852 | |
| | | | | | | | | | | | |
| | | |
Net Assets | | | | | | | | | | | | |
Beginning of period | | | – | | | | – | | | | – | |
| | | | | | | | | | | | |
End of period | | $ | 4,793,503 | | | $ | 4,691,367 | | | $ | 3,361,852 | |
| | | | | | | | | | | | |
Accumulated undistributed net investment income included in net assets at end of period | | $ | 2,150 | | | $ | 2,836 | | | $ | 10,788 | |
| | | | | | | | | | | | |
| | | |
Share Transactions – Institutional Class | | | | | | | | | | | | |
Shares sold | | | 465,252 | | | | 458,110 | | | | 317,617 | |
Shares redeemed | | | (5 | ) | | | (30 | ) | | | (197 | ) |
| | | | | | | | | | | | |
Total Institutional Class | | | 465,247 | | | | 458,080 | | | | 317,420 | |
| | | | | | | | | | | | |
| | | |
Share Transactions – Investor Class | | | | | | | | | | | | |
Shares sold | | | 100 | | | | 100 | | | | 7,705 | |
Shares redeemed | | | – | | | | – | | | | (4 | ) |
| | | | | | | | | | | | |
Total Investor Class | | | 100 | | | | 100 | | | | 7,701 | |
| | | | | | | | | | | | |
Net increase in share transactions | | | 465,347 | | | | 458,180 | | | | 325,121 | |
| (a) | For the period December 20, 2013 (commencement of operations) to February 28, 2014. |
| (b) | Includes gain of $2,660 due to investment violation. See Note 5 in the Notes to the Financial Statements. |
See accompanying notes which are an integral part of these financial statements.
25
MERITAGE GROWTH EQUITY FUND – INSTITUTIONAL CLASS
FINANCIAL HIGHLIGHTS
For a share outstanding during each period
| | | | |
| | | For the
Period Ended
February 28, 2014(a)
(unaudited) | |
Selected Per Share Data: | | | | |
Net asset value, beginning of period | | $ | 10.00 | |
| | | | |
Income from investment operations: | | | | |
Net investment income | | | 0.01 | |
Net realized and unrealized gain (loss) on investments | | | 0.29 | |
| | | | |
Total from investment operations | | | 0.30 | |
| | | | |
Net asset value, end of period | | $ | 10.30 | |
| | | | |
| |
Total Return (b) | | | 3.00 | %(c) |
| |
Ratios and Supplemental Data: | | | | |
Net assets, end of period (000 omitted) | | $ | 4,792 | |
Ratio of expenses to average net assets | | | 1.00 | %(d) |
Ratio of expenses to average net assets before waiver and reimbursement | | | 17.61 | %(d) |
Ratio of net investment income to average net assets | | | 0.79 | %(d) |
Ratio of net investment income (loss) to average net assets before waiver and reimbursement | | | (15.82 | )%(d) |
Portfolio turnover rate | | | 10 | %(c) |
| (a) | For the period December 20, 2013 (commencement of operations) to February 28, 2014. |
| (b) | Total return in the above table represents the rate that the investor would have earned or lost on an investment in the Fund, assuming reinvestment of dividends. |
See accompanying notes which are an integral part of these financial statements.
26
MERITAGE GROWTH EQUITY FUND – INVESTOR CLASS
FINANCIAL HIGHLIGHTS
For a share outstanding during each period
| | | | |
| | | For the
Period Ended
February 28, 2014 (a)
(unaudited) | |
Selected Per Share Data: | | | | |
Net asset value, beginning of period | | $ | 10.00 | |
| | | | |
Income from investment operations: | | | | |
Net investment income | | | – | (b) |
Net realized and unrealized gain (loss) on investments | | | 0.29 | |
| | | | |
Total from investment operations | | | 0.29 | |
| | | | |
Net asset value, end of period | | $ | 10.29 | |
| | | | |
| |
Total Return (c) | | | 2.90 | %(d) |
| |
Ratios and Supplemental Data: | | | | |
Net assets, end of period (000 omitted) | | $ | 1 | |
Ratio of expenses to average net assets | | | 1.25 | %(e) |
Ratio of expenses to average net assets before waiver and reimbursement | | | 22.01 | %(e) |
Ratio of net investment income to average net assets | | | (0.18 | )%(e) |
Ratio of net investment income (loss) to average net assets before waiver and reimbursement | | | (19.78 | )%(e) |
Portfolio turnover rate | | | 10 | %(d) |
| (a) | For the period December 20, 2013 (commencement of operations) to February 28, 2014. |
| (b) | Amount is less than $0.01. |
| (c) | Total return in the above table represents the rate that the investor would have earned or lost on an investment in the Fund, assuming reinvestment of dividends. |
See accompanying notes which are an integral part of these financial statements.
27
MERITAGE VALUE EQUITY FUND – INSTITUTIONAL CLASS
FINANCIAL HIGHLIGHTS
For a share outstanding during each period
| | | | |
| | | For the
Period Ended
February 28, 2014 (a)
(unaudited) | |
Selected Per Share Data: | | | | |
Net asset value, beginning of period | | $ | 10.00 | |
| | | | |
Income from investment operations: | | | | |
Net investment income | | | 0.01 | |
Net realized and unrealized gain (loss) on investments | | | 0.23 | (b) |
| | | | |
Total from investment operations | | | 0.24 | |
| | | | |
Net asset value, end of period | | $ | 10.24 | |
| | | | |
| |
Total Return (c) | | | 2.40 | %(d)(e) |
| |
Ratios and Supplemental Data: | | | | |
Net assets, end of period (000 omitted) | | $ | 4,690 | |
Ratio of expenses to average net assets | | | 1.00 | %(f) |
Ratio of expenses to average net assets before waiver and reimbursement | | | 18.13 | %(f) |
Ratio of net investment income to average net assets | | | 1.14 | %(f) |
Ratio of net investment income (loss) to average net assets before waiver and reimbursement | | | (15.99 | )%(f) |
Portfolio turnover rate | | | 13 | %(d) |
| (a) | For the period December 20, 2013 (commencement of operations) to February 28, 2014. |
| (b) | Includes gain of $0.02 from investment violation. See Note 5 in the Notes to the Financial Statements. |
| (c) | Total return in the above table represents the rate that the investor would have earned or lost on an investment in the Fund, assuming reinvestment of dividends. |
| (e) | During the period, 0.20% of the Fund’s total return includes gain from investment violation. Excluding this item, the total return would have been 2.20%. See Note 5 in the Notes to the Financial Statements. |
See accompanying notes which are an integral part of these financial statements.
28
MERITAGE VALUE EQUITY FUND – INVESTOR CLASS
FINANCIAL HIGHLIGHTS
For a share outstanding during each period
| | | | |
| | | For the
Period Ended
February 28, 2014 (a)
(unaudited) | |
Selected Per Share Data: | | | | |
Net asset value, beginning of period | | $ | 10.00 | |
| | | | |
Income from investment operations: | | | | |
Net investment income | | | – | (b) |
Net realized and unrealized gain (loss) on investments | | | 0.23 | (c) |
| | | | |
Total from investment operations | | | 0.23 | |
| | | | |
Net asset value, end of period | | $ | 10.23 | |
| | | | |
| |
Total Return (d) | | | 2.30 | %(e)(f) |
| |
Ratios and Supplemental Data: | | | | |
Net assets, end of period (000 omitted) | | $ | 1 | |
Ratio of expenses to average net assets | | | 1.25 | %(g) |
Ratio of expenses to average net assets before waiver and reimbursement | | | 22.66 | %(g) |
Ratio of net investment income to average net assets | | | 0.04 | %(g) |
Ratio of net investment income (loss) to average net assets before waiver and reimbursement | | | (19.99 | )%(g) |
Portfolio turnover rate | | | 13 | %(e) |
| (a) | For the period December 20, 2013 (commencement of operations) to February 28, 2014. |
| (b) | Amount is less than $0.01. |
| (c) | Includes gain of $0.02 from investment violation. See Note 5 in the Notes to the Financial Statements. |
| (d) | Total return in the above table represents the rate that the investor would have earned or lost on an investment in the Fund, assuming reinvestment of dividends. |
| (f) | During the period, 0.20% of the Fund’s total return includes gain from investment violation. Excluding this item, the total return would have been 2.10%. See Note 5 in the Notes to the Financial Statements. |
See accompanying notes which are an integral part of these financial statements.
29
MERITAGE YIELD-FOCUS EQUITY FUND – INSTITUTIONAL CLASS
FINANCIAL HIGHLIGHTS
For a share outstanding during each period
| | | | |
| | | For the
Period Ended
February 28, 2014 (a)
(unaudited) | |
Selected Per Share Data: | | | | |
Net asset value, beginning of period | | $ | 10.00 | |
| | | | |
Income from investment operations: | | | | |
Net investment income | | | 0.03 | |
Net realized and unrealized gain (loss) on investments | | | 0.31 | |
| | | | |
Total from investment operations | | | 0.34 | |
| | | | |
Net asset value, end of period | | $ | 10.34 | |
| | | | |
| |
Total Return (b) | | | 3.40 | %(c) |
| |
Ratios and Supplemental Data: | | | | |
Net assets, end of period (000 omitted) | | $ | 3,282 | |
Ratio of expenses to average net assets | | | 1.00 | %(d) |
Ratio of expenses to average net assets before waiver and reimbursement | | | 27.29 | %(d) |
Ratio of net investment income to average net assets | | | 6.16 | %(d) |
Ratio of net investment income (loss) to average net assets before waiver and reimbursement | | | (20.13 | )%(d) |
Portfolio turnover rate | | | 9 | %(c) |
| (a) | For the period December 20, 2013 (commencement of operations) to February 28, 2014. |
| (b) | Total return in the above table represents the rate that the investor would have earned or lost on an investment in the Fund, assuming reinvestment of dividends. |
30
MERITAGE YIELD-FOCUS EQUITY FUND – INVESTOR CLASS
FINANCIAL HIGHLIGHTS
For a share outstanding during each period
| | | | |
| | | For the
Period Ended
February 28, 2014 (a)
(unaudited) | |
Selected Per Share Data: | | | | |
Net asset value, beginning of period | | $ | 10.00 | |
| | | | |
Income from investment operations: | | | | |
Net investment income | | | 0.03 | |
Net realized and unrealized gain (loss) on investments | | | 0.30 | |
| | | | |
Total from investment operations | | | 0.33 | |
| | | | |
Net asset value, end of period | | $ | 10.33 | |
| | | | |
| |
Total Return (b) | | | 3.30 | %(c) |
| |
Ratios and Supplemental Data: | | | | |
Net assets, end of period (000 omitted) | | $ | 80 | |
Ratio of expenses to average net assets | | | 1.25 | %(d) |
Ratio of expenses to average net assets before waiver and reimbursement | | | 16.18 | %(d) |
Ratio of net investment income to average net assets | | | 7.06 | %(d) |
Ratio of net investment income (loss) to average net assets before waiver and reimbursement | | | (7.88 | )%(d) |
Portfolio turnover rate | | | 9 | %(c) |
| (a) | For the period December 20, 2013 (commencement of operations) to February 28, 2014. |
| (b) | Total return in the above table represents the rate that the investor would have earned or lost on an investment in the Fund, assuming reinvestment of dividends. |
31
MERITAGE FUNDS
NOTES TO THE FINANCIAL STATEMENTS
February 28, 2014 (Unaudited)
NOTE 1. ORGANIZATION
The Meritage Growth Equity Fund (the “Growth Equity Fund”), the Meritage Value Equity Fund (the “Value Equity Fund”), the Meritage Yield-Focus Equity Fund (the “Yield-Focus Equity Fund”) (each a “Fund” and, collectively the “Funds”) were organized as a diversified series of the Capitol Series Trust (the “Trust”). The Trust is an open-end investment company established under the laws of Ohio by an Agreement and Declaration of Trust dated September 18, 2013 (the “Trust Agreement”). The Trust Agreement permits the Trust’s Board of Trustees (the “Board”) to issue an unlimited number of shares of beneficial interest of separate series without par value. The Funds each offer two share classes, Institutional Class Shares and Investor Class Shares. The Funds commenced operations on December 20, 2013. The Funds’ investment adviser is Meritage Portfolio Management, Inc. (the “Adviser”). The investment objective of the Growth Equity Fund is to seek growth of capital. The investment objective of the Value Equity Fund is to seek growth of capital. Income is a secondary objective for the Value Equity Fund. The investment objective of the Yield-Focus Equity Fund is to seek long-term growth of capital with an emphasis on high current income.
Each Fund’s prospectus provides a description of the investment objective, policies and strategies, along with information on the classes of shares currently being offered.
NOTE 2. SIGNIFICANT ACCOUNTING POLICIES
The following is a summary of significant accounting policies consistently followed by each Fund in the preparation of its financial statements.
Securities Valuation – All investments in securities are recorded at their estimated fair value as described in Note 3.
Federal Income Taxes – The Funds make no provision for federal income or excise tax. Each Fund intends to qualify each year as a regulated investment company (“RIC”) under subchapter M of the Internal Revenue Code of 1986, as amended, by complying with the requirements applicable to RICs and by distributing substantially all of its taxable income. Each Fund also intends to distribute sufficient net investment income and net capital gains, if any, so that it will not be subject to excise tax on undistributed income and gains. If the required amount of net investment income or gains is not distributed, the Funds could incur a tax expense.
As of and during the period ended February 28, 2014, the Funds did not have a liability for any unrecognized tax benefits. The Funds recognize interest and penalties, if any, related to unrecognized tax benefits as income tax expense in the statement of operations. During the period, the Funds did not incur any interest or penalties. The Funds are subject to examination by U.S. federal tax authorities for all tax years since inception.
Expenses – Expenses incurred by the Trust that do not relate to a specific fund of the Trust are allocated to the individual funds based on each Fund’s relative net assets or another appropriate basis (as determined by the Board).
Security Transactions and Related Income – The Funds follow industry practice and record security transactions on the trade date for financial reporting purposes. The first in, first out (“FIFO”) method is used for determining gains or losses for financial statements and income tax purposes. Dividend income is recorded on the ex-dividend date and interest income is recorded on an accrual basis. Discounts and premiums on securities purchased are accreted or amortized using the effective interest method. Withholding taxes on foreign dividends have been provided for in accordance with the Funds’ understanding of the applicable country’s tax rules and rates. The
32
MERITAGE FUNDS
NOTES TO THE FINANCIAL STATEMENTS – (continued)
February 28, 2014 (Unaudited)
NOTE 2. SIGNIFICANT ACCOUNTING POLICIES – continued
ability of issuers of debt securities held by the Funds to meet their obligations may be affected by economic and political developments in a specific country or region.
Dividends and Distributions – Each Fund intends to distribute substantially all of its net investment income, if any, as dividends to its shareholders on at least an annual basis. Each Fund intends to distribute its net realized long term capital gains and its net realized short term capital gains, if any, at least once a year. Dividends to shareholders, which are determined in accordance with income tax regulations, are recorded on the ex-dividend date. The treatment for financial reporting purposes of distributions made to shareholders during the period from net investment income or net realized capital gains may differ from their ultimate treatment for federal income tax purposes. These differences are caused primarily by differences in the timing of the recognition of certain components of income, expense or realized capital gains for federal income tax purposes. Where such differences are permanent in nature, they are reclassified in the components of the net assets based on their ultimate characterization for federal income tax purposes. Any such reclassifications will have no effects on net assets, results of operations or net asset values per share of the Funds.
NOTE 3. SECURITIES VALUATION AND FAIR VALUE MEASUREMENTS
Fair value is defined as the price that a Fund would receive upon selling an investment in an orderly transaction to an independent buyer in the principal or most advantageous market of the investment. Generally Accepted Accounting Principles in the United States of America (“GAAP”) establish a three-tier hierarchy to maximize the use of observable market data and minimize the use of unobservable inputs and to establish classification of fair value measurements for disclosure purposes.
Inputs refer broadly to the assumptions that market participants would use in pricing the asset or liability, including assumptions about risk (the risk inherent in a particular valuation technique used to measure fair value such as pricing model and/or the risk inherent in the inputs to the valuation technique). Inputs may be observable or unobservable. Observable inputs are inputs that reflect the assumptions market participants would use in pricing the asset or liability developed based on market data obtained from sources independent of the reporting entity. Unobservable inputs are inputs that reflect the reporting entity’s own assumptions about the assumptions market participants would use in pricing the asset or liability developed based on the best information available in the circumstances.
Various inputs are used in determining the value of each Fund’s investments. These inputs are summarized in the three broad levels listed below.
| | • | | Level 1 – quoted prices in active markets for identical securities |
| | • | | Level 2 – other significant observable inputs (including, but not limited to, quoted prices for an identical security in an inactive market, quoted prices for similar securities, interest rates, prepayment speeds, credit risk, etc.) |
| | • | | Level 3 – significant unobservable inputs (including the Funds’ own assumptions in determining fair value of investments based on the best information available) |
The inputs used to measure fair value may fall into different levels of the fair value hierarchy. In such cases, for disclosure purposes, the level in the fair value hierarchy within which the fair value measurement falls in its entirety, is determined based on the lowest level input that is significant to the fair value measurement in its entirety.
33
MERITAGE FUNDS
NOTES TO THE FINANCIAL STATEMENTS – (continued)
February 28, 2014 (Unaudited)
NOTE 3. SECURITIES VALUATION AND FAIR VALUE MEASUREMENTS – continued
Equity securities, including common stock and exchange-traded funds, are generally valued by using market quotations, but may be valued on the basis of prices furnished by a pricing service when the Fund believes such prices more accurately reflect the fair value of such securities. Securities that are traded on any stock exchange are generally valued by the pricing service at the last quoted sale price. Lacking a last sale price, an exchange traded security is generally valued by the pricing service at its last bid price. Securities traded in the NASDAQ over-the-counter market are generally valued by the pricing service at the NASDAQ Official Closing Price. When using the market quotations or close prices provided by the pricing service and when the market is considered active, the security will be classified as a Level 1 security. Sometimes, an equity security owned by the Fund will be valued by the pricing service with factors other than market quotations or when the market is considered inactive. When this happens, the security will be classified as a Level 2 security. When market quotations are not readily available, when the Fund determines that the market quotation or the price provided by the pricing service does not accurately reflect the current fair value, or when certain restricted or illiquid securities are being valued, such securities are valued as determined in good faith by the Fund, in conformity with guidelines adopted by and subject to review by the Board. These securities will be categorized as Level 3 securities.
Investments in open-end mutual funds, including money market mutual funds, are generally priced at the ending net asset value (NAV) provided by the service agent of the Funds. These securities are categorized as Level 1 securities.
In accordance with the Trust’s good faith pricing guidelines, each Fund is required to consider all appropriate factors relevant to the value of securities for which it has determined other pricing sources are not available or reliable as described above. No single standard exists for determining fair value, because fair value depends upon the circumstances of each individual case. As a general principle, the current fair value of an issue of securities being valued by the Fund would appear to be the amount which the owner might reasonably expect to receive for them upon their current sale. Methods which are in accordance with this principle may, for example, be based on (i) a multiple of earnings; (ii) a discount from market of a similar freely traded security (including a derivative security or a basket of securities traded on other markets, exchanges or among dealers); or (iii) yield to maturity with respect to debt issues, or a combination of these and other methods. Good faith pricing is permitted if, in the Fund’s opinion, the validity of market quotations appears to be questionable based on factors such as evidence of a thin market in the security based on a small number of quotations, a significant event occurs after the close of a market but before a Fund’s NAV calculation that may affect a security’s value, or the Fund is aware of any other data that calls into question the reliability of market quotations. Good faith pricing may also be used in instances when the bonds the Fund invests in may default or otherwise cease to have market quotations readily available. Any fair valuation pricing done outside the Fund’s approved pricing methods must be approved by the Pricing Committee of the Board.
34
MERITAGE FUNDS
NOTES TO THE FINANCIAL STATEMENTS – (continued)
February 28, 2014 (Unaudited)
NOTE 3. SECURITIES VALUATION AND FAIR VALUE MEASUREMENTS – continued
The following is a summary of the inputs used to value the Funds’ investments as of February 28, 2014:
| | | | | | | | | | | | | | | | |
| | | Valuation Inputs | |
| Growth Equity Fund | | Level 1 –
Quoted Prices in
Active Markets | | | Level 2 –
Other
Significant
Observable
Inputs | | | Level 3 –
Significant
Unobservable
Inputs | | | Total | |
Common Stocks* | | $ | 3,919,187 | | | $ | – | | | $ | – | | | $ | 3,919,187 | |
Exchange-Traded Funds | | | 281,541 | | | | – | | | | – | | | | 281,541 | |
Money Market Securities | | | 462,191 | | | | – | | | | – | | | | 462,191 | |
Total | | $ | 4,662,919 | | | $ | – | | | $ | – | | | $ | 4,662,919 | |
Value Equity Fund | | | | | | | | | | | | | | | | |
Common Stocks* | | $ | 3,767,750 | | | $ | – | | | $ | – | | | $ | 3,767,750 | |
Exchange-Traded Funds | | | 414,262 | | | | – | | | | – | | | | 414,262 | |
Money Market Securities | | | 346,776 | | | | – | | | | – | | | | 346,776 | |
Total | | $ | 4,528,788 | | | $ | – | | | $ | – | | | $ | 4,528,788 | |
Yield-Focus Equity Fund | | | | | | | | | | | | | | | | |
Common Stocks* | | $ | 2,691,631 | | | $ | – | | | $ | – | | | $ | 2,691,631 | |
Preferred Stocks | | | 51,192 | | | | – | | | | – | | | | 51,192 | |
Exchange-Traded Funds | | | 109,590 | | | | – | | | | – | | | | 109,590 | |
Money Market Securities | | | 383,550 | | | | – | | | | – | | | | 383,550 | |
Total | | $ | 3,235,963 | | | $ | – | | | $ | – | | | $ | 3,235,963 | |
| * | Refer to Schedule of Investments for Industry classifications. |
The Funds did not hold any investments at any time during the reporting period in which significant unobservable inputs were used in determining fair value; therefore, no reconciliation of Level 3 securities is included for this reporting period. The Funds did not hold any derivative instruments during the reporting period.
The Trust recognizes transfers between fair value hierarchy levels at the end of the reporting period. There were no transfers between any levels for the period ended February 28, 2014.
NOTE 4. FEES AND OTHER TRANSACTIONS WITH AFFILIATES
Under the terms of the management agreement, on behalf of the Funds (the “Agreement”), the Adviser manages each Fund’s investments subject to oversight of the Board. As compensation for its management services each Fund is obligated to pay the Adviser a fee computed and accrued daily and paid monthly at an annual rate of 0.75% of the average daily net assets of each Fund. For the period ended February 28, 2014, the Adviser earned fees of $2,036 from the Growth Equity Fund, $1,870 from the Value Equity Fund and $1,308 from the Yield-Focus Equity Fund before the reimbursements described below.
35
MERITAGE FUNDS
NOTES TO THE FINANCIAL STATEMENTS – (continued)
February 28, 2014 (Unaudited)
NOTE 4. FEES AND OTHER TRANSACTIONS WITH AFFILIATES – continued
The Adviser has contractually agreed to waive or limit its fees and to assume other expenses of each Fund until December 31, 2015, so that total annual fund operating expenses do not exceed 1.00%. This operating expense limitation does not apply to borrowing costs (such as interest and dividend expenses on securities sold short), taxes, brokerage fees and commissions, and expenses incurred under a plan of distribution adopted pursuant to Rule 12b-1 under the Investment Company Act of 1940 (“Excluded Expenses”). This limitation also excludes any “acquired fund fees and expenses” as that term is described in each Fund’s prospectus.
The waiver and/or reimbursement by the Adviser with respect to the Funds are subject to repayment by the Funds within the three fiscal years following the fiscal year in which that particular waiver and/or reimbursement occurred, provided that the Funds are able to make the repayment without exceeding the expense limitations described above.
The amounts subject to repayment by the Funds, pursuant to the aforementioned conditions are as follows:
| | | | | | | | |
| | | Amount
Waived or
Reimbursed | | | Recoverable
through
August 31, | |
Growth Equity Fund | | $ | 45,367 | | | | 2017 | |
Value Equity Fund | | | 42,979 | | | | 2017 | |
Yield-Focus Equity Fund | | | 45,614 | | | | 2017 | |
The Trust retains Huntington Asset Services, Inc. (“HASI”) to manage each Fund’s business affairs and provide each Fund with administrative services, including all regulatory reporting and necessary office equipment and personnel. For the period ended February 28, 2014, HASI earned fees of $11,319 for the Growth Equity Fund, $10,384 for the Value Equity Fund and $11,319 for the Yield-Focus Equity Fund. At February 28, 2014, HASI was owed $7,296 for the Growth Equity Fund, $6,335 for the Value Equity Fund and $7,296 for the Yield-Focus Equity Fund for administrative services.
The Trust also retains HASI to act as the Fund’s transfer agent and to provide fund accounting services. For the period ended February 28, 2014, HASI earned fees of $10,079 for the Growth Equity Fund, $9,871 for the Value Equity Fund and $10,079 for the Yield-Focus Equity Fund for transfer agent services and reimbursement for out-of- pocket expenses incurred in providing transfer agent services. At February 28, 2014, HASI was owed $7,233 for the Growth Equity Fund, $7,007 for the Value Equity Fund and $7,233 for the Yield-Focus Equity Fund for transfer agent services and out-of-pocket expenses. For the period ended February 28, 2014, HASI earned fees of $7,988 for the Growth Equity Fund, $6,680 for the Value Equity Fund and $7,988 for the Yield-Focus Equity Fund for fund accounting services. At February 28, 2014, HASI was owed $5,305 for the Growth Equity Fund, $3,980 Value Equity Fund and $5,305 for the Yield-Focus Equity Fund for fund accounting services.
Certain officers of the Trust are members of management and/or employees of HASI. HASI is a wholly-owned subsidiary of Huntington Bancshares, Inc., the parent company of Unified Financial Securities, Inc. (the “Distributor”).
The Funds have adopted a Distribution Plan (the “Plan”) pursuant to Rule 12b-1 under the 1940 Act. The Plan provides that the Funds will pay the Distributor and/or any registered securities dealer, financial institution or any other person (the “Recipient”) a fee of 0.25% of the average daily net assets of each Fund’s Investor Shares in connection with the promotion and distribution of Fund’s shares or the provision of personal services to
36
MERITAGE FUNDS
NOTES TO THE FINANCIAL STATEMENTS – (continued)
February 28, 2014 (Unaudited)
NOTE 4. FEES AND OTHER TRANSACTIONS WITH AFFILIATES – continued
shareholders, including, but not necessarily limited to, advertising, compensation to underwriters, dealers and selling personnel, the printing and mailing of prospectuses to other than current Fund shareholders, the printing and mailing of sales literature and servicing shareholder accounts. The Funds or Adviser may pay all or a portion of these fees to any Recipient who renders assistance in distributing or promoting the sale of shares, or who provides certain shareholder services, pursuant to a written agreement. The Plan is a compensation plan, which means that compensation is provided regardless of 12b-1 expenses actually incurred. It is anticipated that the Plan will benefit shareholders because an effective sales program typically is necessary in order for the Funds to reach and maintain a sufficient size to achieve efficiently its investment objectives and to realize economies of scale.
Unified Financial Securities, Inc. (“Unified”) acts as the principal distributor of the Funds’ shares. An officer of the Trust is an officer of the Distributor and such person may be deemed to be an affiliate of the Distributor.
NOTE 5. INVESTMENT TRANSACTIONS
For the period ended February 28, 2014, purchases and sales of investment securities, other than short-term investments and short-term U.S. government obligations, were as follows:
| | | | | | | | |
Fund | | Purchases | | | Sales | |
Growth Equity Fund | | $ | 4,099,764 | | | $ | 154,305 | |
Value Equity Fund | | | 4,144,416 | | | | 193,614 | |
Yield-Focus Equity Fund | | | 2,834,825 | | | | 90,588 | |
During the period ended February 28, 2014, the Adviser purchased shares of Huntington Bancshares, Inc. (“HBAN”), of which Huntington National Bank, Inc. is a subsidiary. Due to the affiliation of Huntington National Bank, Inc. as the parent company of Unified Financial Securities, Inc. (the Fund’s Distributor), the Fund is not permitted to invest in HBAN. Upon notification of this error, the Adviser closed the Fund’s position in HBAN, resulting in a gain of $2,660. As the transaction resulted in a gain, no further action was necessary.
NOTE 6. ESTIMATES
The preparation of financial statements in conformity with GAAP requires management to make estimates and assumptions that affect the reported amounts of assets and liabilities and disclosure of contingent assets and liabilities at the date of the financial statements and the reported amounts of increases and decreases in net assets from operations during the reporting period. Actual results could differ from those estimates.
NOTE 7. DISTRIBUTIONS TO SHAREHOLDERS
The Funds did not make any distributions during the period ended February 28, 2014.
NOTE 8. COMMITMENTS AND CONTINGENCIES
The Funds indemnify their officers and trustees for certain liabilities that may arise from the performance of their duties to the Funds. Additionally, in the normal course of business, the Funds enter into contracts that contain a variety of representations and warranties which provide general indemnifications. The Funds’ maximum exposure under these arrangements is unknown, as this would involve future claims that may be made against the Funds that have not yet occurred.
37
MERITAGE FUNDS
NOTES TO THE FINANCIAL STATEMENTS – (continued)
February 28, 2014 (Unaudited)
NOTE 9. SUBSEQUENT EVENTS
Management has evaluated events or transactions that may have occurred since February 28, 2014, that would merit recognition or disclosure in the financial statements. There were no items requiring adjustment of the financial statements or additional disclosure.
38
INVESTMENT ADVISORY AGREEMENT APPROVAL (Unaudited)
MERITAGE PORTFOLIO MANAGEMENT, INC.
At the organizational meeting of the Board of Trustees of Capitol Series Trust (“Trust”) on November 19, 2013, the Trust’s Board of Trustees (“Board”), including all of the Trustees who are not “interested persons” of the Trust as that term is defined in Section 2(a)(19) of the Investment Company Act of 1940, as amended (“Independent Trustees”), considered and approved the Investment Advisory Agreement between the Trust and Meritage Portfolio Management, Inc. (Meritage) regarding the Meritage Growth Equity Fund, Meritage Value Equity Fund, and Meritage Yield-Focus Equity Fund (each a “Fund” and together the “Funds”) (the “Investment Advisory Agreement”). Each Fund is a newly organized series of the Trust.
Prior to the meeting, the Trustees received and considered information from Meritage and the Trust’s administrator designed to provide the Trustees with the information necessary to evaluate the terms of the proposed Investment Advisory Agreement between the Trust and Meritage (“Support Materials”). Before voting to approve the proposed Investment Advisory Agreement, the Trustees reviewed the terms and the form of Investment Advisory Agreement and the Support Materials with Trust management and with counsel to the Independent Trustees and received a memorandum from such counsel discussing the legal standards for their consideration of the proposed agreement. Meritage also met with the Trustees and provided further information regarding its proposed services to the Funds, including but not limited to information regarding its investment philosophy.
In determining whether to approve the Investment Advisory Agreement, the Trustees considered all factors they believed relevant including the following, with respect to each Fund: (1) the nature, extent, and quality of the services to be provided by Meritage; (2) the cost of the services to be provided and the profits to be realized by Meritage from services rendered to the Trust and each Fund; (3) comparative fee and expense data for each Fund and other investment companies with similar investment objectives; (4) the extent to which economies of scale would be realized as each Fund grows and whether the proposed advisory fee for each Fund, and the Funds together, reflects these economies of scale for each Fund’s benefit; and (5) other financial benefits to Meritage resulting from services to be rendered to the Funds. In their deliberations, the Trustees did not identify any particular information that was all-important or controlling.
Based upon Meritage’s presentation and the Support Materials, the Board concluded that the overall arrangements between the Trust and Meritage as will be set forth in the Investment Advisory Agreement as it relates to the Funds are fair and reasonable in light of the services that Meritage will perform, the investment advisory fees that the Fund will pay, and such other matters as the Trustees considered relevant in the exercise of their reasonable judgment. The material factors and conclusions that formed the basis of the Trustees’ determination to approve the Investment Advisory Agreement are summarized below.
Nature, Extent and Quality of Services Provided. The Trustees considered the scope of services to be provided under the Investment Advisory Agreement with respect to the Funds, noting that such services will include but are not limited to the following: (1) investing the Fund’s assets consistent with the Fund’s investment objective and investment policies; (2) determining the portfolio securities to be purchased, sold or otherwise disposed of and timing of such transaction; (3) voting all proxies with respect to the Fund’s portfolio securities; (4) maintaining the required books and records for transactions affected by Meritage on behalf of the Funds; and (5) selecting broker-dealers to execute orders on behalf of the Funds. The Trustees noted the investment philosophy of the portfolio managers and their significant investment and portfolio management experience. The Trustees considered Meritage’s capitalization and its assets under management. The Trustees concluded that they are satisfied with the nature, extent and quality of services that Meritage proposes to provide to the Funds under to the Investment Advisory Agreement.
39
INVESTMENT ADVISORY AGREEMENT APPROVAL (Unaudited)
MERITAGE PORTFOLIO MANAGEMENT, INC.
Cost of Advisory Services and Profitability. The Trustees considered the proposed annual management fee associated with each Fund and each class (Meritage Growth Equity Fund: Advisory Fees of 0.75 percent for both the Institutional Class and the Investor Class, with total annual operating expenses capped at 1.00 percent for the Institutional Class and 1.25 percent for the Investors Class; Meritage Value Equity Fund: Advisory Fees of 0.75 percent for both the Institutional Class and the Investor Class, with total annual operating expenses capped at 1.00 percent for the Institutional Class and 1.25 percent for the Investors Class; Meritage Yield-Focus Equity Fund: Advisory Fees of 0.75 percent for both the Institutional Class and the Investor Class, with total annual operating expenses capped at 1.00 percent for the Institutional Class and 1.25% for the Investors Class). The Trustees considered Meritage’s profitability analysis (12 month pro-forma) for services that Meritage will render to the Funds. The Trustees noted that the management fees charged by Meritage to separately managed accounts with assets similar to those projected for the Meritage Funds are consistent with the proposed respective advisory fees for the Meritage Funds. The Trustees also noted that Meritage had contractually agreed to reimburse each Meritage Fund for operating expenses, and may reduce its management fees, in order to ensure that Total Annual Fund Operating Expenses (excluding interest and tax expenses, brokerage commissions, extraordinary expenses, and acquired fund fees and expenses) do not exceed the capped amount with respect to each class of each of Meritage Funds’ average daily net assets. The Trustees concluded that the Meritage’s service relationship with the Meritage Funds will not initially be profitable until assets grow.
Comparative Fee and Expense Data. The Trustees considered an analysis comparing the contractual expenses born by the Fund and those of funds in the same Morningstar benchmark category with similar assets. Trustees noted that the management fees and total operating expense ratio for each Fund compared reasonably with the average and median management fees (after waivers) reported for the benchmark category. While recognizing that it is difficult to compare advisory fees since advisory services provided may vary from one investment adviser to another, the Trustees concluded that Meritage’s proposed advisory fees for each Fund were reasonable.
Economies of Scale. The Trustees considered whether the Funds would benefit from any economies of scale, noting that the proposed investment advisory fee for the Funds did not contain breakpoints. The Trustees noted the fact that each Fund is newly organized and that an increase in assets would most likely not decrease the amount of advisory services that Meritage would need to provide to the Funds. The Trustees also considered that Meritage had agreed to consider breakpoints in the future in response to asset growth. The Trustees concluded that it is not necessary to consider the implementation of fee breakpoints at this time, but considered revisiting this issue in the future as circumstances change and asset levels increase.
Other Benefits. The Trustees noted that Meritage does utilize soft dollar arrangements with respect to portfolio transactions; however, the Trustees noted that Meritage has no affiliated brokers to execute the Fund’s portfolio transactions. The Trustees concluded that Meritage will not receive material additional financial benefits from services rendered to the Funds.
Based upon the Meritage’s presentation and Meeting materials, the Board concluded that the overall arrangements between the Trust and Meritage to be set forth in the Advisory Agreement between the Trust and Meritage are fair and reasonable in light of the services to be performed, investment advisory fees to be paid and such other matters as the Trustees considered relevant in the exercise of their reasonable judgment.
40
CAPITOL SERIES TRUST
Privacy Policy
Capitol Series Trust (the “Trust”) on behalf of each of its series (each a “Fund,” collectively the “Funds”) adopts the following privacy policy in order to safeguard the personal information of its consumers and customers that are individuals in accordance with Securities and Exchange Commission Regulation S-P,17 CFR 284.30.
We collect only relevant information about a Fund’s shareholders that the law allows or requires us to have in order to conduct our business and properly service you. We collect financial and personal information about you (“Personal Information”) directly (e.g., information on account applications and other forms, such as your name, address, and social security number, and information provided to access account information or conduct account transactions online, such as password, account number, e-mail address, and alternate telephone number), and indirectly (e.g., information about your transactions with us, such as transaction amounts, account balance and account holdings).
The Trust does not disclose any non-public personal information about its shareholders or former shareholders other than for everyday business purposes such as to process a transaction, service an account, to respond to court orders and legal investigations or as otherwise permitted by law. Third parties that may receive this information include companies that provide transfer agency, technology and administrative services to a Fund, as well as the Fund’s investment adviser who is an affiliate of the Fund. If you maintain a retirement/educational custodial account directly with a Fund, we may also disclose your Personal Information to the custodian for that account for shareholder servicing purposes. We limit access to your Personal Information provided to unaffiliated third parties to information necessary to carry out their assigned responsibilities to a Fund. All shareholder records will be disposed of in accordance with applicable law.
The Trust maintains physical, electronic and procedural safeguards to protect Personal Information and requires its third parties service provides with access to such information to treat the Personal Information with the same high degree of confidentiality.
In the event that a shareholder holds shares of a Fund through a financial intermediary, including, but not limited to, a broker-dealer, bank, credit union or trust company, the privacy policy of the shareholders’ financial intermediary would govern how their non-public personal information would be shared with unaffiliated third parties.
41
OTHER INFORMATION
The Funds’ Statement of Additional Information (“SAI”) includes additional information about the trustees and is available without charge, upon request. You may call toll-free at (855) 261-0104 to request a copy of the SAI or to make shareholder inquiries.
42
PROXY VOTING
A description of the policies and procedures that the Funds use to determine how to vote proxies relating to portfolio securities and information regarding how each Fund voted those proxies during the most recent twelve month period ended June 30, is available without charge upon request by (1) calling the Funds at (855) 261-0104 and (2) from Funds documents filed with the Securities and Exchange Commission (“SEC”) on the SEC’s website at www.sec.gov.
TRUSTEES
R. Jeffrey Young, Chairman
Walter B. Grimm
Mary M. Morrow
OFFICERS
Matthew J. Miller, Chief Executive Officer
and President
John C. Swhear, Chief Compliance Officer,
AML Officer and Vice-President
Stacey Havens, Vice President
Robert W. Silva, Chief Financial Officer and
Treasurer
Jay S. Fitton, Secretary
INVESTMENT ADVISER
Meritage Portfolio Management, Inc.
7500 College Boulevard, Suite 1212
Overland Park, KS 66210
DISTRIBUTOR
Unified Financial Securities, Inc.
2960 North Meridian Street, Suite 300
Indianapolis, IN 46208
INDEPENDENT REGISTERED
PUBLIC ACCOUNTING FIRM
KPMG LLP
191 West Nationwide Boulevard, Suite 500
Columbus, OH 43215
LEGAL COUNSEL
Bernstein Shur
100 Middle Street, 6th Floor
Portland, ME 04104
CUSTODIAN
Huntington National Bank
41 South High Street
Columbus, OH 43215
ADMINISTRATOR, TRANSFER AGENT AND
FUND ACCOUNTANT
Huntington Asset Services, Inc.
2960 North Meridian Street, Suite 300
Indianapolis, IN 46208
This report is intended only for the information of shareholders or those who have received the Funds’ prospectus which contains information about the Funds’ management fee and expenses. Please read the prospectus carefully before investing.
Distributed by Unified Financial Securities, Inc.
Member FINRA/SIPC
43
Item 2. Code of Ethics.
Not applicable.
Item 3. Audit Committee Financial Expert.
Not applicable.
Item 4. Principal Accountant Fees and Services.
Not applicable.
Item 5. Audit Committee of Listed Registrants.
Not applicable.
Item 6. Schedule of Investments.
(a) Not applicable.
(b) Not applicable.
Item 7. Disclosure of Proxy Voting Policies and Procedures for Closed-End Management Investment Companies.
Not applicable.
Item 8. Portfolio Managers of Closed-End Management Investment Companies.
Not applicable.
Item 9. Purchases of Equity Securities by Closed-End Management Investment Company and Affiliated Purchasers.
Not applicable.
Item 10. Submission of Matters to a Vote of Security Holders.
Not applicable.
Item 11. Controls and Procedures.
(a) The registrant’s Principal Executive Officer and Principal Financial Officer have concluded that the registrant’s disclosure controls and procedures (as defined in Rule 30a-3(c) under the Act) are effective in design and operation and are sufficient to form the basis of the certifications required by Rule 30a-2 under the Act, based on their evaluation of these disclosure controls and procedures within 90 days of the filing of this report on Form N-CSR.
(b) There were no changes in the registrant’s internal control over financial reporting (as defined in Rule 30a-3(d) under the Act (17 CFR 270.30a-3(d)) that occurred during the second fiscal quarter of the period covered by this report that have materially affected or are reasonably likely to materially affect, the registrant’s internal control over financial reporting.
Item 12. Exhibits.
(a)(1) Not applicable.
(a)(2) Certifications pursuant to Rule 30a-2(a) are attached hereto.
(a)(3) Not applicable.
(b) Certifications pursuant to Rule 30a-2(b) are furnished herewith.
SIGNATURES
Pursuant to the requirements of the Securities Exchange Act of 1934 and the Investment Company Act of 1940, the registrant has duly caused this report to be signed on its behalf by the undersigned, thereunto duly authorized.
| | |
| (Registrant) | | Capitol Series Trust |
| | | | |
| | |
| By (Signature and Title) | | /s/ Matthew J. Miller | | |
| | Matthew J. Miller, Chief Executive Officer and President | | |
Date 4/28/14
Pursuant to the requirements of the Securities Exchange Act of 1934 and the Investment Company Act of 1940, this report has been signed below by the following persons on behalf of the registrant and in the capacities and on the dates indicated.
| | | | |
| | |
| By (Signature and Title) | | /s/ Matthew J. Miller | | |
| | Matthew J. Miller, Chief Executive Officer and President | | |
Date 4/28/14
| | | | |
| | |
| By (Signature and Title) | | /s/ Robert W. Silva | | |
| | Robert W. Silva, Treasurer and Chief Financial Officer | | |
Date 4/28/14