UNITED STATES
SECURITIES AND EXCHANGE COMMISSION
Washington, D.C. 20549
FORM N-CSR
CERTIFIED SHAREHOLDER REPORT OF REGISTERED
MANAGEMENT INVESTMENT COMPANIES
Investment Company Act file number: 811-22895
Capitol Series Trust
(Exact name of registrant as specified in charter)
Ultimus Asset Services, LLC
2960 North Meridian Street, Suite 300
Indianapolis, IN 46208
(Address of principal executive offices) (Zip code)
Zachary P. Richmond
Ultimus Asset Services, LLC
2960 N. Meridian St. Suite 300
Indianapolis, IN 46208
(Name and address of agent for service)
Registrant’s telephone number, including area code: 317-917-7000
Date of fiscal year end: August 31
Date of reporting period: February 29, 2016
Item 1. Reports to Stockholders.


Where discipline meets common sense.
Semi-Annual Report
February 29, 2016
Meritage Yield-Focus Equity Fund MPYEX/MPYIX
Meritage Growth Equity Fund MPGEX/MPGIX
Meritage Value Equity Fund MPVEX/MVEBX
| | | | |
| 913.345.7000 | | www.meritageportfoliofunds.com | | 7500 College Blvd., Suite 1212, Overland Park, KS 66210 |
MESSAGE FROM THE CHIEF INVESTMENT OFFICER – (Unaudited)
At Meritage, we are value-driven investors. We buy stock in businesses when they score well in our comprehensive stock-ranking process (universe is global, all-cap and about 6,500 securities), which is designed to provide strong insight about each security’s intrinsic value. Our value discipline is intended to provide a margin of safety and is one of our primary risk management tools, along with managing position sizes and diversification.
Dear Fellow Shareholders:
In our last letter (August 31, 2015 Annual Report), we highlighted that the first correction for the broad equity market in about four years had recently taken place. The closing low for the S&P 500 during that period was 1,867.61, which was reached on August 25th.
Earlier this year, the S&P 500 moved even lower. On February 11th it closed at 1,829.08, which was a further decline of about 2% from the aforementioned close in August. This was accompanied by a significant rise in stock market volatility.
Market behavior of this type is not unusual. Neither are bear markets. According to Yardeni Research, Inc. there have been a total of 19 bear markets – defined as a decline of 20% from the prior market peak – since 1929, or one about every four and a half years.
In contrast to many market pundits, we do not pretend to know what this historical information portends for near-term market behavior. We do know, however, that traditional fundamental market measures such as price to cash flow and price to earnings suggest that stocks continue to be richly valued. So it can reasonably be argued in our opinion that market risk is higher than normal, as we believe the biggest risk to investors is the permanent loss of capital that often occurs when an over-valued security is purchased and it declines to fair value. Our investment process suggests that many stocks currently fit this description of “risky.”
With this backdrop in place, we believe the value discipline we employ in managing each of our three equity portfolios is the best way to “play defense” should a steeper correction or bear market materialize. It has been our experience that stocks ultimately achieve fair value, and that buying companies at a discount to their value, riding out the volatility in stock prices driven by macro concerns unrelated to company performance when necessary, and consistently maintaining this discipline as the equities in our portfolios grow to fair value, is the best way to produce attractive returns over full market cycles.
Our efforts to implement our investment process for each of our three equity portfolios in the context of the above are further described on the following pages. A specific discussion of each Fund and its performance is also included.
Thank you for your continued trust in us as stewards of your capital. As mentioned previously we have our own funds invested alongside yours in each of our mutual funds, and we remain committed to our goal of delivering attractive risk-adjusted returns over full market cycles.
Sincerely,
Mark Eveans, CFA
President and Chief Investment Officer
1
MANAGEMENT’S DISCUSSION OF FUND PERFORMANCE – (Unaudited)
Meritage Growth Equity Fund
For the six-month period ending February 29, 2016, the Meritage Growth Equity Fund Institutional Class and Investor Class returned -3.08% and -3.24%, respectively. These returns lagged the Russell 1000 Growth Index benchmark which returned -1.22% during the same time frame. They exceeded the return of the Lipper Large-Cap Growth Index, however, which returned -5.31% during the period.
The biggest contributor to the Fund’s underperformance, compared to the benchmark, was our investment in the Industrials sector. While we were slightly overweight the sector, which was a relatively good performer, our stock selection underachieved (i.e., there was “selection drag”). The second biggest contributor was our investment in the Consumer Discretionary sector. We were modestly underweight the sector, which was a relatively good performer, and there was selection drag. The third biggest contributor was our investment in the Telecommunication Services sector. The Fund had an underweight position, and the sector was a strong performer during the period.
We think it’s worth noting that most portfolio sector differences, compared to the benchmark, are a result of our investment process identifying specific, bottom-up valuation opportunities which correspondingly lead to sector over or underweights.
Regarding specific issues, key strong performers were Coherent Inc., up 45%, NVIDIA Corp., up 41%, Dr. Pepper Snapple Group, up 21%, and Mohawk Industries, Inc., ahead 17%.
Poor performers were Jones Lang LaSalle Inc., down 37%, Mallinkrodt PLC and Shire PLC, both down 33%, and Westlake Chemical Corp., which declined 25%.
We expect a continuation of abnormally low interest rates and below average economic growth for the world’s leading economies. We believe many investors share our view and have correspondingly been willing to pay an excessive premium for well-known growth issues. This is where we part company with the crowd, however, as we believe the value discipline embedded in our growth approach will yield better results over full market cycles.
Meritage Value Equity Fund
For the six-month period ending February 29, 2016, the Meritage Value Equity Fund Institutional Class and Investor Class returned -4.87% and -5.03%, respectively. These returns lagged the Russell 1000 Value Index benchmark which returned -2.87% during the same time frame, as well as the Lipper Large-Cap Value Index return of -3.84%.
The biggest contributor to the Fund’s underperformance, compared to the benchmark, was our investment in the Information Technology sector. While the Fund was essentially equal weight the sector, which was a strong performer, our stock selection underachieved (i.e., there was “selection drag”). The second biggest contributor was our investment in the Consumer Staples sector. We were modestly underweight the sector, which was a strong performer, and there was selection drag. The third biggest contributor was our investment in the Health Care sector. The Fund was slightly overweight this neutrally performing sector, and there was selection drag.
We think it’s worth noting that most portfolio sector differences, compared to the benchmark, are a result of our investment process identifying specific, bottom-up valuation opportunities which correspondingly lead to sector over or underweights.
Regarding specific issues, key strong performers were Michael Kors Holdings, up 30%, Raytheon Co., up 22%, Northrup Grumman Corp., up 18%, and Southwest Airlines Co., ahead 15%.
2
MANAGEMENT’S DISCUSSION OF FUND PERFORMANCE – (Unaudited) (continued)
The poorest performers were Voya Financial, Inc., down 32%, Marathon Petroleum Corp. and Mentor Graphics Corp., both down 31%, and Magna International Inc., which declined 30%.
We expect a continuation of abnormally low interest rates and below average economic growth for the world’s leading economies. We believe many investors share our view and have correspondingly been willing to pay an excessive premium for well-known stocks. This is where we part company with the crowd, however, as we believe the value discipline embedded in our investment process will yield better results over full market cycles.
Meritage Yield-Focus Equity Fund
For the six-month period ending February 29, 2016, the Meritage Yield-Focus Equity Fund Institutional Class and Investor Class returned -1.66% and -1.76%, respectively. These returns exceeded the -3.18% return for the Russell 3000 Value Index, a general market benchmark, and they were also significantly better than the Zacks Multi-Asset Income Index, a style-specific peer index, which returned -9.92% during the period. The Fund’s returns slightly trailed the Lipper Equity Income Index, which returned -1.43% during the period.
In the context of the Yield-Focus Equity Fund, the Meritage comprehensive security selection process searches globally for attractive yield franchises. A founding premise of the Fund is to earn between 50% – 75% of the expected long-term equity return in the form of cash dividends and distributions. The strategy invests in seven key types of equity asset classes: common stocks, master limited partnerships (MLPs), other limited partnerships, real estate investment trusts (REITs), business development companies (BDCs), convertible preferred stocks and straight preferred stocks.
Regarding equity asset class performance, common stocks and real estate investment trusts were the strongest relative performers. Master limited partnerships and other limited partnerships were the poorest performers by a wide margin.
In terms of specific issues, stronger performers were Mattel, Inc., up 43% during the period, EPR Properties, up 26%, Reynolds American, Inc., up 22%, and Altria Group, Inc., ahead 17%.
The poorest performers were KKR & Co. L.P., down 41%, Seagate Technology PLC, down 37%, HP Inc. and Waddell & Reed Financial Inc., which both lost 31%.
We use two benchmarks in assessing the performance of the Yield-Focus Equity Fund. The Russell 3000 Value Index is a long-term, general purpose, value-centric benchmark with no specificity regarding the Fund’s distinct yield-focus style. The second benchmark, the Zacks Multi-Asset Income Index, has specific asset structure and distinguished dividend yield characteristics similar to the Fund.
We believe it is worth noting that there was a wide divergence between the performances of the two benchmarks during the referenced time period as pointed out above, with the higher-yielding segment of the market as represented by the Zacks benchmark performing appreciably worse than the overall market. Even with this style-specific headwind during period, the Fund was able to outperform the broad equity market as represented by the Russell benchmark while maintaining a distinguished yield. In conjunction with this we believe the Fund is positioned to perform well in the coming economic environment, which we believe will be characterized by below average economic growth and abnormally low interest rates
3
INVESTMENT RESULTS – (Unaudited)
Total Return
For the Periods Ended February 29, 2016 (a)
| | | | | | |
Fund/Index | | Six Months | | 1 Year | | Average Annual
Since Inception
(12/23/13) |
Meritage Growth Equity Fund – Institutional Class | | -3.08% | | -7.22% | | 4.33% |
Meritage Growth Equity Fund – Investor Class | | -3.24% | | -7.47% | | 4.03% |
Russell 1000 Growth Index (b) | | -1.22% | | -5.05% | | 6.51% |
| | | | | | |
| | | Expense Ratios (c) | |
| | | Institutional Class | | Investor Class | |
Gross | | 1.68% | | | 1.93 | % |
With Applicable Waivers | | 1.02% | | | 1.27% | |
The performance quoted represents past performance, which does not guarantee future results. The investment return and principal value of an investment will fluctuate so that an investor’s shares, when redeemed, may be worth more or less than their original cost. The returns shown do not reflect deduction of taxes that a shareholder would pay on Fund distributions or the redemption of Fund shares. The Fund’s investment objectives, risks, charges and expenses must be considered carefully before investing. Current performance of a Fund may be lower or higher than the performance quoted. Performance data current to the most recent month end may be obtained by calling 1-855-261-0104.
The performance in the preceding table reflects any fee reductions during the applicable period. If such fee reductions had not occurred, the quoted performance would be lower.
| (a) | Return figures reflect any change in price per share and assume the reinvestment of all distributions. |
| (b) | The Russell 1000 Growth Index is a widely recognized unmanaged index of equity securities and is representative of a broader domestic equity market and range of securities than is found in the Fund’s portfolio. Individuals cannot invest directly in an Index; however, an individual can invest in exchange traded funds or other investment vehicles that attempt to track the performance of a benchmark index. |
| (c) | The expense ratios are from the Fund’s prospectus dated December 29, 2015. The Adviser has contractually agreed to waive or limit its fees and assume other expenses of the Fund through December 31, 2016, so that total annual fund operating expenses do not exceed 1.00% of the Fund’s average daily net assets. This operating expense limitation does not apply to brokerage fees and commissions, borrowing costs (such as interest and dividend expenses on securities sold short), taxes, 12b-1 fees, extraordinary expenses and indirect expenses (such as “acquired fund fees and expenses”). Additional information pertaining to the Fund’s expense ratios as of February 29, 2016 can be found in the financial highlights. |
The Fund’s investment objective, strategies, risks, charges and expenses must be considered carefully before investing. The prospectus contains this and other important information about the investment company and may be obtained by calling 1-855-261-0104. Please read it carefully before investing.
The Fund is distributed by Unified Financial Securities, LLC, Member FINRA.
4
INVESTMENT RESULTS – (Unaudited) (continued)
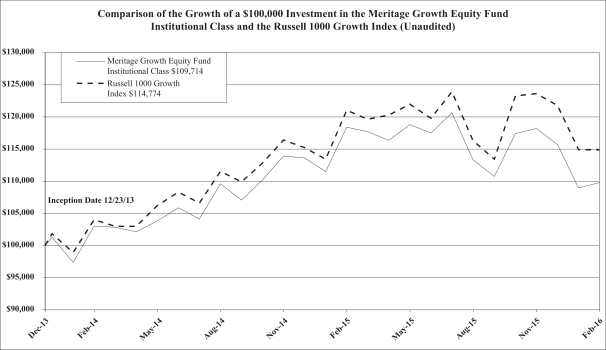
The chart above assumes an initial investment of $100,000 made on December 23, 2013 (commencement of operations) and held through February 29, 2016. THE FUND’S RETURNS REPRESENT PAST PERFORMANCE AND DO NOT GUARANTEE FUTURE RESULTS. The returns shown do not reflect deduction of taxes that a shareholder would pay on the Fund’s distributions or the redemption of the Fund’s shares. Investment returns and principal values will fluctuate so that your shares, when redeemed, may be worth more or less than their original purchase price.
The Russell 1000 Growth Index is a widely recognized unmanaged index of equity securities and is representative of a broader domestic equity market and range of securities than is found in the Fund’s portfolio. Individuals cannot invest directly in an Index; however, an individual can invest in exchange traded funds or other investment vehicles that attempt to track the performance of a benchmark index. The Index returns do not include expenses, which have been deducted from the Fund’s return. These performance figures include the change in value of the stocks in the index plus the reinvestment of dividends and are not annualized. The returns shown do not reflect deduction of taxes that a shareholder would pay on Fund distributions or the redemption of Fund shares.
Current performance may be lower or higher than the performance data quoted. For more information on the Fund, and to obtain performance data current to the most recent month-end, or to request a prospectus, please call 1-855-261-0104. You should carefully consider the investment objectives, potential risks, management fees, and charges and expenses of the Fund before investing. The Fund’s prospectus contains this and other information about the Fund, and should be read carefully before investing.
The Fund is distributed by Unified Financial Securities, LLC, Member FINRA.
5
INVESTMENT RESULTS – (Unaudited) (continued)
Total Return
For the Periods Ended February 29, 2016 (a)
| | | | | | |
Fund/Index | | Six Months | | 1 Year | | Average Annual
Since Inception
(12/23/13) |
Meritage Value Equity Fund – Institutional Class | | -4.87% | | -8.61% | | 2.53% |
Meritage Value Equity Fund – Investor Class | | -5.03% | | -8.94% | | 2.25% |
Russell 1000 Value Index (b) | | -2.87% | | -9.41% | | 2.33% |
| | | | |
| | | Expense Ratios (c) |
| | | Institutional Class | | Investor Class |
Gross | | 1.69% | | 1.94% |
With Applicable Waivers | | 1.03% | | 1.28% |
The performance quoted represents past performance, which does not guarantee future results. The investment return and principal value of an investment will fluctuate so that an investor’s shares, when redeemed, may be worth more or less than their original cost. The returns shown do not reflect deduction of taxes that a shareholder would pay on Fund distributions or the redemption of Fund shares. The Fund’s investment objectives, risks, charges and expenses must be considered carefully before investing. Current performance of a Fund may be lower or higher than the performance quoted. Performance data current to the most recent month end may be obtained by calling 1-855-261-0104.
The performance in the preceding table reflects any fee reductions during the applicable period. If such fee reductions had not occurred, the quoted performance would be lower.
| (a) | Return figures reflect any change in price per share and assume the reinvestment of all distributions. |
| (b) | The Russell 1000 Value Index is a widely recognized unmanaged index of equity securities and is representative of a broader domestic equity market and range of securities than is found in the Fund’s portfolio. Individuals cannot invest directly in an Index; however, an individual can invest in exchange traded funds or other investment vehicles that attempt to track the performance of a benchmark index. |
| (c) | The expense ratios are from the Fund’s prospectus dated December 29, 2015. The Adviser has contractually agreed to waive or limit its fees and assume other expenses of the Fund through December 31, 2016, so that total annual fund operating expenses do not exceed 1.00% of the Fund’s average daily net assets. This operating expense limitation does not apply to brokerage fees and commissions, borrowing costs (such as interest and dividend expenses on securities sold short), taxes, 12b-1 fees, extraordinary expenses and indirect expenses (such as “acquired fund fees and expenses”). Additional information pertaining to the Fund’s expense ratios as of February 29, 2016 can be found in the financial highlights. |
The Fund’s investment objective, strategies, risks, charges and expenses must be considered carefully before investing. The prospectus contains this and other important information about the investment company and may be obtained by calling 1-855-261-0104. Please read it carefully before investing.
The Fund is distributed by Unified Financial Securities, LLC, Member FINRA.
6
INVESTMENT RESULTS – (Unaudited) (continued)
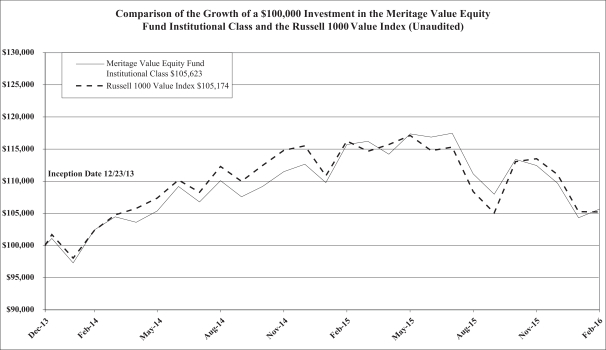
The chart above assumes an initial investment of $100,000 made on December 23, 2013 (commencement of operations) and held through February 29, 2016. THE FUND’S RETURNS REPRESENT PAST PERFORMANCE AND DO NOT GUARANTEE FUTURE RESULTS. The returns shown do not reflect deduction of taxes that a shareholder would pay on the Fund’s distributions or the redemption of the Fund’s shares. Investment returns and principal values will fluctuate so that your shares, when redeemed, may be worth more or less than their original purchase price.
The Russell 1000 Value Index is a widely recognized unmanaged index of equity securities and is representative of a broader domestic equity market and range of securities than is found in the Fund’s portfolio. Individuals cannot invest directly in an Index; however, an individual can invest in exchange traded funds or other investment vehicles that attempt to track the performance of a benchmark index. The Index returns do not include expenses, which have been deducted from the Fund’s return. These performance figures include the change in value of the stocks in the index plus the reinvestment of dividends and are not annualized. The returns shown do not reflect deduction of taxes that a shareholder would pay on Fund distributions or the redemption of Fund shares.
Current performance may be lower or higher than the performance data quoted. For more information on the Fund, and to obtain performance data current to the most recent month-end, or to request a prospectus, please call 1-855-261-0104. You should carefully consider the investment objectives, potential risks, management fees, and charges and expenses of the Fund before investing. The Fund’s prospectus contains this and other information about the Fund, and should be read carefully before investing.
The Fund is distributed by Unified Financial Securities, LLC, Member FINRA.
7
INVESTMENT RESULTS – (Unaudited) (continued)
Total Return
For the Periods Ended February 29, 2016 (a)
| | | | | | |
Fund/Index | | Six Months | | 1 Year | | Average Annual
Since Inception
(12/23/13) |
Meritage Yield-Focus Equity Fund – Institutional Class | | -1.66% | | -12.90% | | -1.43% |
Meritage Yield-Focus Equity Fund – Investor Class | | -1.76% | | -13.14% | | -1.70% |
Russell 3000 Value Index(b) | | -3.18% | | -9.73% | | 1.83% |
Zacks Multi-Asset Income Index TR (c) | | -9.92% | | -19.48% | | -9.33% |
| | | | | | | | |
| | | Expense Ratios (d) | |
| | | Institutional Class | | | Investor Class | |
Gross | | | 1.62 | % | | | 1.87 | % |
With Applicable Waivers | | | 1.18 | % | | | 1.43 | % |
The performance quoted represents past performance, which does not guarantee future results. The investment return and principal value of an investment will fluctuate so that an investor’s shares, when redeemed, may be worth more or less than their original cost. The returns shown do not reflect deduction of taxes that a shareholder would pay on Fund distributions or the redemption of Fund shares. The Fund’s investment objectives, risks, charges and expenses must be considered carefully before investing. Current performance of a Fund may be lower or higher than the performance quoted. Performance data current to the most recent month end may be obtained by calling 1-855-261-0104.
The performance in the preceding table reflects any fee reductions during the applicable period. If such fee reductions had not occurred, the quoted performance would be lower.
| (a) | Return figures reflect any change in price per share and assume the reinvestment of all distributions. |
| (b) | The Russell 3000 Value Index is a widely recognized unmanaged index of equity securities and is representative of a broader domestic equity market and range of securities than is found in the Fund’s portfolio. Individuals cannot invest directly in an Index; however, an individual can invest in exchange traded funds or other investment vehicles that attempt to track the performance of a benchmark index. |
| (c) | The Zacks Multi-Asset Income Index is comprised of approximately 125 to 150 securities selected, based on investment and other criteria, from a universe of domestic and international companies. The universe of securities within the Index includes U.S. listed common stocks and ADRs paying dividends, real estate investment trusts, MLPs, closed end funds, Canadian royalty trusts and traditional preferred stocks. Individuals cannot invest directly in an Index. |
| (d) | The expense ratios are from the Fund’s prospectus dated December 29, 2015. The Adviser has contractually agreed to waive or limit its fees and assume other expenses of the Fund through December 31, 2016, so that total annual fund operating expenses do not exceed 1.00% of the Fund’s average daily net assets. This operating expense limitation does not apply to brokerage fees and commissions, borrowing costs (such as interest and dividend expenses on securities sold short), taxes, 12b-1 fees, extraordinary expenses and indirect expenses (such as “acquired fund fees and expenses”). Additional information pertaining to the Fund’s expense ratios as of February 29, 2016 can be found in the financial highlights. |
The Fund’s investment objective, strategies, risks, charges and expenses must be considered carefully before investing. The prospectus contains this and other important information about the investment company and may be obtained by calling 1-855-261-0104. Please read it carefully before investing.
The Fund is distributed by Unified Financial Securities, LLC, Member FINRA.
8
INVESTMENT RESULTS – (Unaudited) (continued)
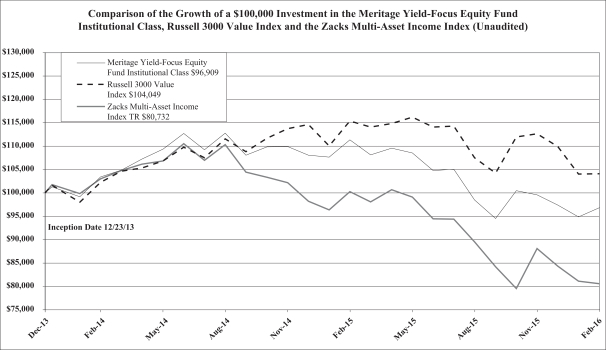
The chart above assumes an initial investment of $100,000 made on December 23, 2013 (commencement of operations) and held through February 29, 2016. THE FUND’S RETURNS REPRESENT PAST PERFORMANCE AND DO NOT GUARANTEE FUTURE RESULTS. The returns shown do not reflect deduction of taxes that a shareholder would pay on the Fund’s distributions or the redemption of the Fund’s shares. Investment returns and principal values will fluctuate so that your shares, when redeemed, may be worth more or less than their original purchase price.
The Russell 3000 Value Index is a widely recognized unmanaged index of equity securities and is representative of a broader domestic equity market and range of securities than is found in the Fund’s portfolio. Individuals cannot invest directly in an Index; however, an individual can invest in exchange traded funds or other investment vehicles that attempt to track the performance of a benchmark index. The Index returns do not include expenses, which have been deducted from the Fund’s return. These performance figures include the change in value of the stocks in the index plus the reinvestment of dividends and are not annualized. The returns shown do not reflect deduction of taxes that a shareholder would pay on Fund distributions or the redemption of Fund shares.
The Zacks Multi-Asset Income Index is comprised of approximately 125 to 150 securities selected, based on investment and other criteria, from a universe of domestic and international companies. The universe of securities within the Index includes U.S. listed common stocks and ADRs paying dividends, real estate investment trusts, MLPs, closed end funds, Canadian royalty trusts and traditional preferred stocks. Individuals cannot invest directly in an Index.
Current performance may be lower or higher than the performance data quoted. For more information on the Fund, and to obtain performance data current to the most recent month-end, or to request a prospectus, please call 1-855-261-0104. You should carefully consider the investment objectives, potential risks, management fees, and charges and expenses of the Fund before investing. The Fund’s prospectus contains this and other information about the Fund, and should be read carefully before investing.
The Fund is distributed by Unified Financial Securities, LLC, Member FINRA.
9
FUND HOLDINGS – (Unaudited)
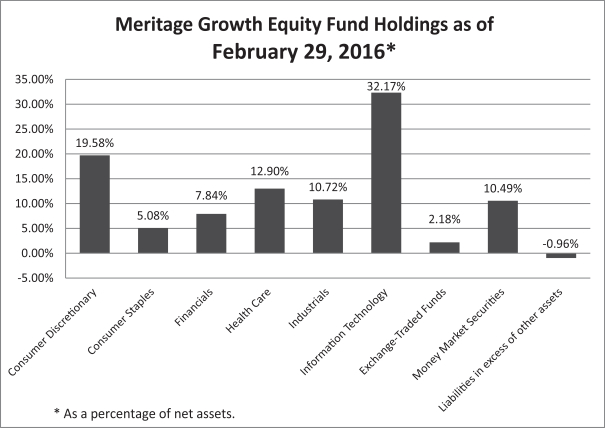
The investment objective of the Meritage Growth Equity Fund is to seek growth of capital.
10
FUND HOLDINGS – (Unaudited) (continued)
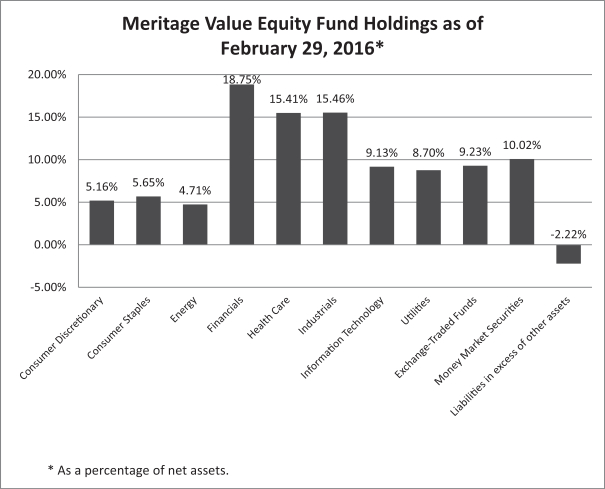
The investment objective of the Meritage Value Equity Fund is to seek growth of capital. Income is a secondary objective.
11
FUND HOLDINGS – (Unaudited) (continued)
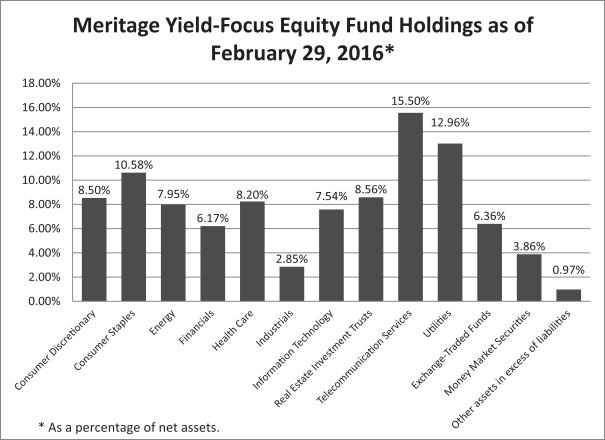
The investment objective of the Meritage Yield-Focus Equity Fund is to seek long-term growth of capital with an emphasis on high current income.
AVAILABILITY OF PORTFOLIO SCHEDULE – (Unaudited)
The Funds will file their complete schedule of portfolio holdings with the Securities and Exchange Commission (“SEC”) for the first and third quarter of each fiscal year on Form N-Q. The Funds’ Forms N-Q will be available at the SEC’s website at www.sec.gov. The Form N-Q may be reviewed and copied at the Public Reference Room in Washington, DC. Information on the operation of the Public Reference Room may be obtained by calling 1-800-SEC-0330.
SUMMARY OF FUND EXPENSES – (Unaudited)
As a shareholder of a Fund, you incur ongoing costs, including management fees and other Fund expenses. This Example is intended to help you understand your ongoing costs (in dollars) of investing in the Fund and to compare these costs with the ongoing costs of investing in other mutual funds. The Example is based on an investment of $1,000 invested at the beginning of the period, and held for the entire period from September 1, 2015 to February 29, 2016.
12
SUMMARY OF FUND EXPENSES – (Unaudited) (continued)
Actual Expenses
The first line of the table below provides information about actual account values and actual expenses. You may use the information in this line, together with the amount you invested, to estimate the expenses that you paid over the period. Simply divide your account value by $1,000 (for example, an $8,600 account value divided by $1,000 = $8.60), then multiply the result by the number in the first line under the heading entitled “Expenses Paid During the Period” to estimate the expenses you paid on your account during this period.
Hypothetical Example for Comparison Purposes
The second line of the table below provides information about hypothetical account values and hypothetical expenses based on the Fund’s actual expense ratio and an assumed rate of return of 5% per year before expenses, which is not the Fund’s actual return. The hypothetical account values and expenses may not be used to estimate the actual ending account balance or expenses you paid for the period. You may use this information to compare the ongoing costs of investing in the Fund and other funds. To do so, compare this 5% hypothetical example with the 5% hypothetical examples that appear in the shareholder reports of the other funds.
Please note that the expenses shown in the table are meant to highlight your ongoing costs only. Therefore, the second line of the table below is useful in comparing ongoing costs only and will not help you determine the relative costs of owning different funds.
| | | | | | | | | | | | | | | | |
| | | Beginning
Account Value
September 1, 2015 | | | Ending
Account Value
February 29, 2016 | | | Expenses Paid
During Period* | | | Annualized
Expense
Ratio | |
Meritage Growth Equity Fund | | | | | | | | | | | | | | | | |
Institutional Class | | | | | | | | | | | | | | | | |
Actual | | $ | 1,000.00 | | | $ | 969.20 | | | $ | 4.90 | | | | 1.00 | % |
Hypothetical** | | $ | 1,000.00 | | | $ | 1,019.89 | | | $ | 5.02 | | | | 1.00 | % |
Investor Class | | | | | | | | | | | | | | | | |
Actual | | $ | 1,000.00 | | | $ | 967.60 | | | $ | 6.12 | | | | 1.25 | % |
Hypothetical** | | $ | 1,000.00 | | | $ | 1,018.65 | | | $ | 6.27 | | | | 1.25 | % |
Meritage Value Equity Fund | | | | | | | | | | | | | | | | |
Institutional Class | | | | | | | | | | | | | | | | |
Actual | | $ | 1,000.00 | | | $ | 951.30 | | | $ | 4.85 | | | | 1.00 | % |
Hypothetical** | | $ | 1,000.00 | | | $ | 1,019.89 | | | $ | 5.02 | | | | 1.00 | % |
Investor Class | | | | | | | | | | | | | | | | |
Actual | | $ | 1,000.00 | | | $ | 949.70 | | | $ | 6.06 | | | | 1.25 | % |
Hypothetical** | | $ | 1,000.00 | | | $ | 1,018.65 | | | $ | 6.27 | | | | 1.25 | % |
Meritage Yield-Focus Equity Fund | | | | | | | | | | | | | | | | |
Institutional Class | | | | | | | | | | | | | | | | |
Actual | | $ | 1,000.00 | | | $ | 983.40 | | | $ | 4.93 | | | | 1.00 | % |
Hypothetical** | | $ | 1,000.00 | | | $ | 1,019.89 | | | $ | 5.02 | | | | 1.00 | % |
Investor Class | | | | | | | | | | | | | | | | |
Actual | | $ | 1,000.00 | | | $ | 982.40 | | | $ | 6.16 | | | | 1.25 | % |
Hypothetical** | | $ | 1,000.00 | | | $ | 1,018.65 | | | $ | 6.27 | | | | 1.25 | % |
| * | Expenses are equal to the Fund’s annualized expense ratio multiplied by the average account value over the period, multiplied by 182/366. |
| ** | Assumes 5% return before expenses. |
13
MERITAGE GROWTH EQUITY FUND
SCHEDULE OF INVESTMENTS
February 29, 2016 (Unaudited)
| | | | | | | | |
| COMMON STOCKS – 88.29% | | Shares | | | Fair Value | |
Consumer Discretionary – 19.58% | | | | | | | | |
Amazon.com, Inc. * | | | 866 | | | $ | 478,482 | |
Helen of Troy Ltd. * | | | 3,710 | | | | 353,786 | |
Home Depot, Inc./The | | | 5,060 | | | | 628,047 | |
Mohawk Industries, Inc. * | | | 1,150 | | | | 206,689 | |
Priceline Group, Inc./The * | | | 273 | | | | 345,402 | |
Target Corp. | | | 6,185 | | | | 485,213 | |
TJX Cos., Inc./The | | | 5,640 | | | | 417,924 | |
| | | | | | | | |
| | | | | | | 2,915,543 | |
| | | | | | | | |
Consumer Staples – 5.08% | |
Colgate-Palmolive Co. | | | 4,330 | | | | 284,221 | |
Dr. Pepper Snapple Group, Inc. | | | 5,160 | | | | 472,295 | |
| | | | | | | | |
| | | | | | | 756,516 | |
| | | | | | | | |
Financials – 7.84% | |
Allstate Corp. | | | 5,080 | | | | 322,377 | |
Aon PLC | | | 2,095 | | | | 199,633 | |
Chubb Ltd. | | | 2,330 | | | | 269,185 | |
Everest Re Group Ltd. | | | 1,356 | | | | 252,392 | |
Jones Lang LaSalle, Inc. | | | 1,213 | | | | 123,811 | |
| | | | | | | | |
| | | | | | | 1,167,398 | |
| | | | | | | | |
Health Care – 12.90% | |
Amgen, Inc. | | | 2,071 | | | | 294,662 | |
Cambrex Corp. * | | | 4,030 | | | | 155,437 | |
Gilead Sciences, Inc. | | | 5,155 | | | | 449,774 | |
Johnson & Johnson | | | 4,690 | | | | 493,435 | |
LivaNova PLC * | | | 3,355 | | | | 189,356 | |
Mettler-Toledo International, Inc. * | | | 606 | | | | 190,835 | |
Shire PLC ADR | | | 947 | | | | 147,836 | |
| | | | | | | | |
| | | | | | | 1,921,335 | |
| | | | | | | | |
Industrials – 10.72% | |
Acuity Brands, Inc. | | | 1,792 | | | | 375,299 | |
AMETEK, Inc. | | | 4,385 | | | | 203,508 | |
AZZ, Inc. | | | 3,525 | | | | 178,013 | |
Danaher Corp. | | | 2,222 | | | | 198,358 | |
Deluxe Corp. | | | 3,070 | | | | 176,249 | |
Equifax, Inc. | | | 2,875 | | | | 301,530 | |
Snap-on, Inc. | | | 1,130 | | | | 163,477 | |
| | | | | | | | |
| | | | | | | 1,596,434 | |
| | | | | | | | |
See accompanying notes which are an integral part of these financial statements.
14
MERITAGE GROWTH EQUITY FUND
SCHEDULE OF INVESTMENTS – (continued)
February 29, 2016 (Unaudited)
| | | | | | | | |
| COMMON STOCKS – 88.29% – continued | | Shares | | | Fair Value | |
Information Technology – 32.17% | | | | | | | | |
Alphabet, Inc. – Class A * | | | 716 | | | $ | 513,530 | |
Apple, Inc. | | | 7,429 | | | | 718,310 | |
Cisco Systems, Inc. | | | 12,595 | | | | 329,737 | |
Coherent, Inc. * | | | 3,145 | | | | 266,067 | |
F5 Networks, Inc. * | | | 2,160 | | | | 207,727 | |
Fiserv, Inc. * | | | 3,750 | | | | 358,612 | |
II-VI, Inc. * | | | 6,830 | | | | 149,919 | |
Linear Technology Corp. | | | 4,340 | | | | 189,311 | |
MasterCard, Inc. – Class A | | | 4,335 | | | | 376,798 | |
Mellanox Technologies Ltd. * | | | 4,105 | | | | 208,575 | |
MKS Instruments, Inc. | | | 6,100 | | | | 200,690 | |
NICE-Systems Ltd. ADR | | | 2,790 | | | | 167,177 | |
NVIDIA Corp. | | | 15,825 | | | | 496,272 | |
NXP Semiconductors NV * | | | 6,230 | | | | 443,825 | |
Tessera Technologies, Inc. | | | 5,610 | | | | 165,383 | |
| | | | | | | | |
| | | | | | | 4,791,933 | |
| | | | | | | | |
TOTAL COMMON STOCKS (Cost $12,568,739) | | | | | | | 13,149,159 | |
| | | | | | | | |
EXCHANGE-TRADED FUNDS – 2.18% | | | | | | | | |
Consumer Staples Select Sector SPDR Fund | | | 6,370 | | | | 324,360 | |
| | | | | | | | |
TOTAL EXCHANGE-TRADED FUNDS (Cost $320,654) | | | | | | | 324,360 | |
| | | | | | | | |
MONEY MARKET SECURITIES – 10.49% | | | | | | | | |
Fidelity Institutional Money Market Funds Treasury Portfolio – Class I, 0.17% (a) | | | 1,561,384 | | | | 1,561,384 | |
| | | | | | | | |
TOTAL MONEY MARKET SECURITIES (Cost $1,561,384) | | | | | | | 1,561,384 | |
| | | | | | | | |
TOTAL INVESTMENTS – 100.96% (Cost $14,450,777) | | | | | | | 15,034,903 | |
| | | | | | | | |
Liabilities in Excess of Other Assets – (0.96)% | | | | | | | (142,452 | ) |
| | | | | | | | |
NET ASSETS – 100.00% | | | | | | $ | 14,892,451 | |
| | | | | | | | |
| | (a) | Rate disclosed is the seven day yield as of February 29, 2016. |
| | * | Non-income producing security. |
ADR – American Depositary Receipt
SPDR – Standard & Poor’s Depositary Receipts
The sectors shown on the schedule of investments are based on Global Industry Classification Standard, or GICS® (“GICS”). The GICS was developed by and/or is the exclusive property of MSCI, Inc. and Standard & Poor Financial Services LLC (“S&P”). GICS is a service mark of MSCI, Inc. and S&P and has been licensed for use by Ultimus Asset Services, LLC.
See accompanying notes which are an integral part of these financial statements.
15
MERITAGE VALUE EQUITY FUND
SCHEDULE OF INVESTMENTS
February 29, 2016 (Unaudited)
| | | | | | | | |
| COMMON STOCKS – 82.97% | | Shares | | | Fair Value | |
Consumer Discretionary – 5.16% | | | | | | | | |
Ford Motor Co. | | | 19,075 | | | $ | 238,628 | |
Honda Motor Co., Ltd. ADR | | | 9,240 | | | | 237,560 | |
Michael Kors Holdings Ltd. * | | | 3,475 | | | | 196,859 | |
| | | | | | | | |
| | | | | | | 673,047 | |
| | | | | | | | |
Consumer Staples – 5.65% | | | | | | | | |
CVS Health Corp. | | | 3,415 | | | | 331,836 | |
Ingredion, Inc. | | | 4,010 | | | | 405,892 | |
| | | | | | | | |
| | | | | | | 737,728 | |
| | | | | | | | |
Energy – 4.71% | | | | | | | | |
Chevron Corp. | | | 3,415 | | | | 284,948 | |
Royal Dutch Shell PLC ADR | | | 7,260 | | | | 330,185 | |
| | | | | | | | |
| | | | | | | 615,133 | |
| | | | | | | | |
Financials – 18.75% | | | | | | | | |
Aspen Insurance Holdings Ltd. | | | 6,425 | | | | 287,133 | |
Axis Capital Holdings Ltd. | | | 6,400 | | | | 343,744 | |
Fidelity & Guaranty Life | | | 6,380 | | | | 158,033 | |
Horace Mann Educators Corp. | | | 7,915 | | | | 243,861 | |
Prudential Financial, Inc. | | | 3,870 | | | | 255,768 | |
Reinsurance Group of America, Inc. | | | 3,640 | | | | 327,964 | |
Torchmark Corp. | | | 6,802 | | | | 348,398 | |
Voya Financial, Inc. | | | 8,100 | | | | 237,816 | |
W.R. Berkley Corp. | | | 4,725 | | | | 243,338 | |
| | | | | | | | |
| | | | | | | 2,446,055 | |
| | | | | | | | |
Health Care – 15.41% | | | | | | | | |
Aetna, Inc. | | | 2,695 | | | | 292,758 | |
AmerisourceBergen Corp. | | | 2,930 | | | | 253,797 | |
Cigna Corp. | | | 2,060 | | | | 287,597 | |
ICON PLC * | | | 3,770 | | | | 268,273 | |
Taro Pharmaceutical Industries Ltd. * | | | 2,240 | | | | 324,554 | |
Teva Pharmaceutical Industries Ltd. ADR | | | 5,740 | | | | 319,144 | |
UnitedHealth Group, Inc. | | | 2,215 | | | | 263,807 | |
| | | | | | | | |
| | | | | | | 2,009,930 | |
| | | | | | | | |
Industrials – 15.46% | | | | | | | | |
EnerSys | | | 5,740 | | | | 294,806 | |
General Dynamics Corp. | | | 2,120 | | | | 288,892 | |
Korn/Ferry International | | | 7,205 | | | | 204,766 | |
Northrop Grumman Corp. | | | 1,451 | | | | 278,911 | |
Raytheon Co. | | | 2,185 | | | | 270,612 | |
Southwest Airlines Co. | | | 9,370 | | | | 393,071 | |
UniFirst Corp. | | | 2,715 | | | | 286,188 | |
| | | | | | | | |
| | | | | | | 2,017,246 | |
| | | | | | | | |
See accompanying notes which are an integral part of these financial statements.
16
MERITAGE VALUE EQUITY FUND
SCHEDULE OF INVESTMENTS – (continued)
February 29, 2016 (Unaudited)
| | | | | | | | |
| COMMON STOCKS – 82.97% – continued | | Shares | | | Fair Value | |
Information Technology – 9.13% | | | | | | | | |
Check Point Software Technologies Ltd. * | | | 3,410 | | | $ | 283,269 | |
Cognizant Technology Solutions Corp. – Class A * | | | 4,440 | | | | 252,991 | |
Synopsys, Inc. * | | | 6,890 | | | | 308,327 | |
Teradyne, Inc. | | | 7,480 | | | | 142,718 | |
WNS Holdings Ltd. ADR * | | | 7,130 | | | | 203,205 | |
| | | | | | | | |
| | | | | | | 1,190,510 | |
| | | | | | | | |
Utilities – 8.70% | |
Ameren Corp. | | | 6,995 | | | | 328,415 | |
Entergy Corp. | | | 5,155 | | | | 372,243 | |
Exelon Corp. | | | 13,800 | | | | 434,562 | |
| | | | | | | | |
| | | | | | | 1,135,220 | |
| | | | | | | | |
TOTAL COMMON STOCKS (Cost $10,465,383) | | | | | | | 10,824,869 | |
| | | | | | | | |
EXCHANGE-TRADED FUNDS – 9.23% | |
iShares Global Telecom ETF | | | 3,220 | | | | 189,980 | |
iShares Russell 1000 Value ETF | | | 3,680 | | | | 341,320 | |
Utilities Select Sector SPDR Fund | | | 9,640 | | | | 446,332 | |
Vanguard Telecommunication Services ETF | | | 2,575 | | | | 227,373 | |
| | | | | | | | |
TOTAL EXCHANGE-TRADED FUNDS (Cost $1,172,476) | | | | | | | 1,205,005 | |
| | | | | | | | |
MONEY MARKET SECURITIES – 10.02% | | | | | | | | |
Fidelity Institutional Money Market Funds Treasury Portfolio – Class I, 0.17% (a) | | | 1,307,113 | | | | 1,307,113 | |
| | | | | | | | |
TOTAL MONEY MARKET SECURITIES (Cost $1,307,113) | | | | | | | 1,307,113 | |
| | | | | | | | |
TOTAL INVESTMENTS – 102.22% (Cost $12,944,972) | | | | | | | 13,336,987 | |
| | | | | | | | |
Liabilities in Excess of Other Assets – (2.22)% | | | | | | | (290,126 | ) |
| | | | | | | | |
NET ASSETS – 100.00% | | | | | | | $13,046,861 | |
| | | | | | | | |
| | (a) | Rate disclosed is the seven day yield as of February 29, 2016. |
| | * | Non-income producing security. |
ADR – American Depositary Receipt
ETF – Exchange-Traded Fund
SPDR – Standard & Poor’s Depositary Receipts
The sectors shown on the schedule of investments are based on Global Industry Classification Standard, or GICS® (“GICS”). The GICS was developed by and/or is the exclusive property of MSCI, Inc. and Standard & Poor Financial Services LLC (“S&P”). GICS is a service mark of MSCI, Inc. and S&P and has been licensed for use by Ultimus Asset Services, LLC.
See accompanying notes which are an integral part of these financial statements.
17
MERITAGE YIELD-FOCUS EQUITY FUND
SCHEDULE OF INVESTMENTS
February 29, 2016 (Unaudited)
| | | | | | | | |
| COMMON STOCKS – 85.02% | | Shares | | | Fair Value | |
Consumer Discretionary – 8.50% | | | | | | | | |
Gannett Co., Inc. | | | 50,120 | | | $ | 764,831 | |
Garmin Ltd. | | | 14,810 | | | | 599,953 | |
Las Vegas Sands Corp. | | | 16,730 | | | | 807,724 | |
Mattel, Inc. | | | 32,245 | | | | 1,048,607 | |
| | | | | | | | |
| | | | | | | 3,221,115 | |
| | | | | | | | |
Consumer Staples – 10.58% | | | | | | | | |
Altria Group, Inc. | | | 16,560 | | | | 1,019,599 | |
Philip Morris International, Inc. | | | 9,815 | | | | 893,459 | |
Reynolds American, Inc. | | | 22,327 | | | | 1,125,951 | |
Universal Corp. | | | 17,745 | | | | 966,748 | |
| | | | | | | | |
| | | | | | | 4,005,757 | |
| | | | | | | | |
Energy – 7.95% | | | | | | | | |
BP PLC ADR | | | 26,945 | | | | 783,830 | |
Enterprise Products Partners LP (a) | | | 14,970 | | | | 349,849 | |
Magellan Midstream Partners LP (a) | | | 5,970 | | | | 403,453 | |
Royal Dutch Shell PLC ADR | | | 16,210 | | | | 740,959 | |
Total SA ADR | | | 16,385 | | | | 732,573 | |
| | | | | | | | |
| | | | | | | 3,010,664 | |
| | | | | | | | |
Financials – 6.17% | | | | | | | | |
AllianceBernstein Holding LP (a) | | | 25,105 | | | | 496,577 | |
Banco Latinoamericano de Comercio Exterior SA | | | 23,915 | | | | 511,064 | |
Old Republic International Corp. | | | 42,805 | | | | 761,929 | |
Solar Capital Ltd. (b) | | | 32,990 | | | | 569,077 | |
| | | | | | | | |
| | | | | | | 2,338,647 | |
| | | | | | | | |
Health Care – 8.20% | | | | | | | | |
GlaxoSmithKline PLC ADR | | | 20,855 | | | | 806,463 | |
Merck & Co., Inc. | | | 14,305 | | | | 718,254 | |
Pfizer, Inc. | | | 23,610 | | | | 700,509 | |
Quality Systems, Inc. | | | 56,540 | | | | 879,197 | |
| | | | | | | | |
| | | | | | | 3,104,423 | |
| | | | | | | | |
Industrials – 2.85% | | | | | | | | |
Lockheed Martin Corp. | | | 4,995 | | | | 1,077,871 | |
| | | | | | | | |
Information Technology – 7.54% | | | | | | | | |
International Business Machines Corp. | | | 5,258 | | | | 688,956 | |
QUALCOMM, Inc. | | | 15,990 | | | | 812,132 | |
Seagate Technology PLC | | | 23,350 | | | | 732,256 | |
STMicroelectronics NV | | | 109,750 | | | | 624,477 | |
| | | | | | | | |
| | | | | | | 2,857,821 | |
| | | | | | | | |
See accompanying notes which are an integral part of these financial statements.
18
MERITAGE YIELD-FOCUS EQUITY FUND
SCHEDULE OF INVESTMENTS – (continued)
February 29, 2016 (Unaudited)
| | | | | | | | |
| COMMON STOCKS – 85.02% – continued | | Shares | | | Fair Value | |
Real Estate Investment Trusts – 6.90% | |
EPR Properties | | | 8,060 | | | $ | 501,574 | |
Medical Properties Trust, Inc. | | | 70,405 | | | | 814,586 | |
Omega Healthcare Investors, Inc. | | | 23,875 | | | | 765,432 | |
STAG Industrial, Inc. | | | 30,325 | | | | 532,507 | |
| | | | | | | | |
| | | | | | | 2,614,099 | |
| | | | | | | | |
Telecommunication Services – 15.50% | |
AT&T, Inc. | | | 29,835 | | | | 1,102,403 | |
BCE, Inc. ADR | | | 25,150 | | | | 1,084,468 | |
CenturyLink, Inc. | | | 20,020 | | | | 612,412 | |
Rogers Communications, Inc. | | | 22,605 | | | | 835,255 | |
Spark New Zealand Ltd. ADR | | | 49,160 | | | | 555,508 | |
Telstra Corp. Ltd. ADR | | | 29,135 | | | | 547,447 | |
Verizon Communications, Inc. | | | 22,387 | | | | 1,135,693 | |
| | | | | | | | |
| | | | | | | 5,873,186 | |
| | | | | | | | |
Utilities – 10.83% | |
Entergy Corp. | | | 12,100 | | | | 873,741 | |
National Grid PLC ADR | | | 12,620 | | | | 849,074 | |
PPL Corp. | | | 24,315 | | | | 850,782 | |
Public Service Enterprise Group, Inc. | | | 17,785 | | | | 758,708 | |
Westar Energy, Inc. | | | 17,700 | | | | 769,242 | |
| | | | | | | | |
| | | | | | | 4,101,547 | |
| | | | | | | | |
TOTAL COMMON STOCKS (Cost $31,658,661) | | | | | | | 32,205,130 | |
| | | | | | | | |
CONVERTIBLE PREFERRED STOCKS – 3.79% | | | | | | | | |
Real Estate Investment Trusts – 1.66% | | | | | | | | |
Weyerhaeuser Co., Series A, 6.38% | | | 13,580 | | | | 631,198 | |
| | | | | | | | |
UTILITIES – 2.13% | |
Exelon Corp., 6.50% | | | 18,180 | | | | 806,283 | |
| | | | | | | | |
TOTAL CONVERTIBLE PREFERRED STOCKS (Cost $1,616,031) | | | | | | | 1,437,481 | |
| | | | | | | | |
EXCHANGE-TRADED FUNDS – 6.36% | | | | | | | | |
First Trust Morningstar Dividend Leaders Index | | | 89,950 | | | | 2,187,584 | |
PowerShares S&P 500 High Dividend Low Volatility Portfolio | | | 6,500 | | | | 222,495 | |
| | | | | | | | |
TOTAL EXCHANGE-TRADED FUNDS (Cost $2,335,218) | | | | | | | 2,410,079 | |
| | | | | | | | |
See accompanying notes which are an integral part of these financial statements.
19
MERITAGE YIELD-FOCUS EQUITY FUND
SCHEDULE OF INVESTMENTS – (continued)
February 29, 2016 (Unaudited)
| | | | | | | | |
| MONEY MARKET SECURITIES – 3.86% | | Shares | | | Fair Value | |
Fidelity Institutional Money Market Funds Treasury Portfolio – Class I, 0.17% (c) | | | 1,461,253 | | | $ | 1,461,253 | |
| | | | | | | | |
TOTAL MONEY MARKET SECURITIES (Cost $1,461,253) | | | | | | | 1,461,253 | |
| | | | | | | | |
TOTAL INVESTMENTS – 99.03% (Cost $37,071,163) | | | | | | | 37,513,943 | |
| | | | | | | | |
Other Assets in Excess of Liabilities – 0.97% | | | | | | | 365,557 | |
| | | | | | | | |
NET ASSETS – 100.00% | | | | | | | $37,879,500 | |
| | | | | | | | |
| | (a) | Master Limited Partnership |
| | (b) | Business Development Company |
| | (c) | Rate disclosed is the seven day yield as of February 29, 2016. |
ADR – American Depositary Receipt
The sectors shown on the schedule of investments are based on Global Industry Classification Standard, or GICS® (“GICS”). The GICS was developed by and/or is the exclusive property of MSCI, Inc. and Standard & Poor Financial Services LLC (“S&P”). GICS is a service mark of MSCI, Inc. and S&P and has been licensed for use by Ultimus Asset Services, LLC.
See accompanying notes which are an integral part of these financial statements.
20
STATEMENTS OF ASSETS AND LIABILITIES
February 29, 2016
(Unaudited)
| | | | | | | | | | | | |
| | | Meritage Growth
Equity Fund | | | Meritage Value
Equity Fund | | | Meritage Yield-
Focus Equity Fund | |
Assets | | | | | | | | | | | | |
Investments in securities at value
(cost $14,450,777, $12,944,972 and $37,071,163) | | $ | 15,034,903 | | | $ | 13,336,987 | | | $ | 37,513,943 | |
Receivable for fund shares sold | | | 8,453 | | | | – | | | | – | |
Receivable for investments sold | | | – | | | | – | | | | 258,873 | |
Dividends receivable | | | 18,121 | | | | 36,406 | | | | 143,487 | |
Tax reclaims receivable | | | 302 | | | | – | | | | – | |
Prepaid expenses | | | 9,344 | | | | 7,498 | | | | 26,696 | |
| | | | | | | | | | | | |
Total Assets | | | 15,071,123 | | | | 13,380,891 | | | | 37,942,999 | |
| | | | | | | | | | | | |
| | | |
Liabilities | | | | | | | | | | | | |
Payable for investments purchased | | | 150,195 | | | | 308,008 | | | | – | |
Payable to Adviser | | | 1,550 | | | | 1,135 | | | | 6,529 | |
Accrued 12b-1 fees – Investor class | | | 30 | | | | 2 | | | | 1,795 | |
Payable to administrator, fund accountant, and transfer agent | | | 9,868 | | | | 8,113 | | | | 25,654 | |
Other accrued expenses | | | 17,029 | | | | 16,772 | | | | 29,521 | |
| | | | | | | | | | | | |
Total Liabilities | | | 178,672 | | | | 334,030 | | | | 63,499 | |
| | | | | | | | | | | | |
| | | |
Net Assets | | $ | 14,892,451 | | | $ | 13,046,861 | | | $ | 37,879,500 | |
| | | | | | | | | | | | |
| | | |
Net Assets consist of: | | | | | | | | | | | | |
Paid-in capital | | $ | 14,651,614 | | | $ | 13,129,358 | | | $ | 44,710,637 | |
Accumulated undistributed net investment income | | | 13,388 | | | | 62,380 | | | | 167,785 | |
Accumulated undistributed net realized loss from investment transactions | | | (356,677 | ) | | | (536,892 | ) | | | (7,441,702 | ) |
Net unrealized appreciation on investments | | | 584,126 | | | | 392,015 | | | | 442,780 | |
| | | | | | | | | | | | |
| | | |
Net Assets | | $ | 14,892,451 | | | $ | 13,046,861 | | | $ | 37,879,500 | |
| | | | | | | | | | | | |
| | | |
Net Assets: Institutional Class | | $ | 14,738,485 | | | $ | 13,037,182 | | | $ | 28,662,640 | |
| | | | | | | | | | | | |
Shares outstanding
(unlimited number of shares authorized, no par value) | | | 1,387,051 | | | | 1,260,962 | | | | 3,134,725 | |
| | | | | | | | | | | | |
Net asset value, offering and redemption price per share | | $ | 10.63 | | | $ | 10.34 | | | $ | 9.14 | |
| | | | | | | | | | | | |
| | | |
Net Assets: Investor Class | | $ | 153,966 | | | $ | 9,679 | | | $ | 9,216,860 | |
| | | | | | | | | | | | |
Shares outstanding
(unlimited number of shares authorized, no par value) | | | 14,566 | | | | 940 | | | | 1,010,069 | |
| | | | | | | | | | | | |
Net asset value,offering and redemption price per share | | $ | 10.57 | | | $ | 10.30 | | | $ | 9.12 | |
| | | | | | | | | | | | |
See accompanying notes which are an integral part of these financial statements.
21
STATEMENTS OF OPERATIONS
For the six months ended February 29, 2016
(Unaudited)
| | | | | | | | | | | | |
| | | Meritage Growth
Equity Fund | | | Meritage Value
Equity Fund | | | Meritage Yield-
Focus Equity Fund | |
Investment Income | | | | | | | | | | | | |
Dividend income
(net of foreign taxes withheld of $141, $3,383 and $25,842) | | $ | 83,349 | | | $ | 123,024 | | | $ | 931,436 | |
| | | | | | | | | | | | |
Total investment income | | | 83,349 | | | | 123,024 | | | | 931,436 | |
| | | | | | | | | | | | |
| | | |
Expenses | | | | | | | | | | | | |
Investment Adviser fee | | | 53,612 | | | | 45,572 | | | | 141,407 | |
12b-1 fee – Investor class | | | 202 | | | | 12 | | | | 11,991 | |
Administration expenses | | | 12,280 | | | | 10,341 | | | | 33,271 | |
Fund accounting expenses | | | 8,187 | | | | 6,895 | | | | 22,181 | |
Transfer agent expenses | | | 8,888 | | | | 7,481 | | | | 24,442 | |
Legal expenses | | | 4,085 | | | | 3,581 | | | | 10,136 | |
Registration expenses | | | 6,420 | | | | 5,779 | | | | 19,115 | |
Custodian expenses | | | 2,160 | | | | 2,488 | | | | 5,065 | |
Audit expenses | | | 9,890 | | | | 9,890 | | | | 9,890 | |
Trustee expenses | | | 908 | | | | 855 | | | | 1,414 | |
Insurance expense | | | 1,012 | | | | 935 | | | | 2,733 | |
Pricing expenses | | | 1,301 | | | | 1,274 | | | | 1,381 | |
Report printing expense | | | 2,367 | | | | 2,035 | | | | 6,882 | |
24f-2 expense | | | 29 | | | | 33 | | | | 397 | |
Miscellaneous expenses | | | 3,873 | | | | 3,619 | | | | 9,373 | |
| | | | | | | | | | | | |
Total expenses | | | 115,214 | | | | 100,790 | | | | 299,678 | |
Fees waived by Adviser | | | (43,679 | ) | | | (40,146 | ) | | | (99,244 | ) |
| | | | | | | | | | | | |
Net operating expenses | | | 71,535 | | | | 60,644 | | | | 200,434 | |
| | | | | | | | | | | | |
Net investment income | | | 11,814 | | | | 62,380 | | | | 731,002 | |
| | | | | | | | | | | | |
| |
Net Realized and Unrealized Loss on Investments | | | | | |
Net realized loss on investment securities transactions | | | (341,291 | ) | | | (514,184 | ) | | | (4,758,198 | ) |
Net realized loss on foreign currency transactions | | | – | | | | – | | | | (460 | ) |
Net change in unrealized appreciation (depreciation) of investment securities | | | (174,897 | ) | | | (193,500 | ) | | | 3,452,924 | |
| | | | | | | | | | | | |
Net realized and unrealized loss on investments | | | (516,188 | ) | | | (707,684 | ) | | | (1,305,734 | ) |
| | | | | | | | | | | | |
Net decrease in net assets resulting from operations | | $ | (504,374 | ) | | $ | (645,304 | ) | | $ | (574,732 | ) |
| | | | | | | | | | | | |
See accompanying notes which are an integral part of these financial statements.
22
MERITAGE GROWTH EQUITY FUND
STATEMENTS OF CHANGES IN NET ASSETS
| | | | | | | | |
| | | For the Six
Months Ended
February 29, 2016
(Unaudited) | | | For the Year
Ended
August 31, 2015 | |
Increase in Net Assets due to: | | | | | | | | |
Operations | | | | | | | | |
Net investment income | | $ | 11,814 | | | $ | 10,151 | |
Net realized gain (loss) on investment securities transactions | | | (341,291 | ) | | | 301,011 | |
Net change in unrealized appreciation (depreciation) of investment securities | | | (174,897 | ) | | | 36,414 | |
| | | | | | | | |
Net increase (decrease) in net assets resulting from operations | | | (504,374 | ) | | | 347,576 | |
| | | | | | | | |
| | |
Distributions | | | | | | | | |
From net investment income – Institutional Class | | | (8,254 | ) | | | (9,879 | ) |
From net investment income – Investor Class | | | – | | | | (90 | ) |
From net realized gains – Institutional Class | | | (306,531 | ) | | | (117,832 | ) |
From net realized gains – Investor Class | | | (3,439 | ) | | | (1,660 | ) |
| | | | | | | | |
Total distributions | | | (318,224 | ) | | | (129,461 | ) |
| | | | | | | | |
| | |
Capital Transactions – Institutional Class | | | | | | | | |
Proceeds from shares sold | | | 2,588,517 | | | | 4,756,438 | |
Reinvestment of distributions | | | 306,740 | | | | 127,710 | |
Amount paid for shares redeemed | | | (674,277 | ) | | | (2,409,418 | ) |
| | | | | | | | |
Total Institutional Class | | | 2,220,980 | | | | 2,474,730 | |
| | | | | | | | |
| | |
Capital Transactions – Investor Class | | | | | | | | |
Proceeds from shares sold | | | 15,846 | | | | 37,500 | |
Reinvestment of distributions | | | 2,110 | | | | 919 | |
Amount paid for shares redeemed | | | (19,509 | ) | | | (13,254 | ) |
| | | | | | | | |
Total Investor Class | | | (1,553 | ) | | | 25,165 | |
| | | | | | | | |
Net increase in net assets resulting from capital transactions | | | 2,219,427 | | | | 2,499,895 | |
| | | | | | | | |
Total Increase in Net Assets | | | 1,396,829 | | | | 2,718,010 | |
| | | | | | | | |
| | |
Net Assets | | | | | | | | |
Beginning of period | | | 13,495,622 | | | | 10,777,612 | |
| | | | | | | | |
End of period | | $ | 14,892,451 | | | $ | 13,495,622 | |
| | | | | | | | |
Accumulated undistributed net investment income included in net assets at end of period | | $ | 13,388 | | | $ | 9,828 | |
| | | | | | | | |
| | |
Share Transactions – Institutional Class | | | | | | | | |
Shares sold | | | 229,335 | | | | 415,966 | |
Shares issued in reinvestment of distributions | | | 27,169 | | | | 11,213 | |
Shares redeemed | | | (59,911 | ) | | | (208,834 | ) |
| | | | | | | | |
Total Institutional Class | | | 196,593 | | | | 218,345 | |
| | | | | | | | |
| | |
Share Transactions – Investor Class | | | | | | | | |
Shares sold | | | 1,365 | | | | 3,364 | |
Shares issued in reinvestment of distributions | | | 188 | | | | 81 | |
Shares redeemed | | | (1,735 | ) | | | (1,126 | ) |
| | | | | | | | |
Total Investor Class | | | (182 | ) | | | 2,319 | |
| | | | | | | | |
Net increase in shares outstanding | | | 196,411 | | | | 220,664 | |
See accompanying notes which are an integral part of these financial statements.
23
MERITAGE VALUE EQUITY FUND
STATEMENTS OF CHANGES IN NET ASSETS
| | | | | | | | |
| | | For the Six
Months Ended
February 29, 2016
(Unaudited) | | | For the Year
Ended
August 31, 2015 | |
Increase in Net Assets due to: | | | | | | | | |
Operations | | | | | | | | |
Net investment income | | $ | 62,380 | | | $ | 105,299 | |
Net realized gain (loss) on investment securities transactions | | | (514,184 | ) | | | 31,932 | |
Net change in unrealized appreciation (depreciation) of investment securities | | | (193,500 | ) | | | (79,858 | ) |
| | | | | | | | |
Net increase (decrease) in net assets resulting from operations | | | (645,304 | ) | | | 57,373 | |
| | | | | | | | |
| | |
Distributions | | | | | | | | |
From net investment income – Institutional Class | | | (105,233 | ) | | | (34,360 | ) |
From net investment income – Investor Class | | | (66 | ) | | | (23 | ) |
From net realized gains – Institutional Class | | | (50,499 | ) | | | (66,161 | ) |
From net realized gains – Investor Class | | | (39 | ) | | | (56 | ) |
| | | | | | | | |
Total distributions | | | (155,837 | ) | | | (100,600 | ) |
| | | | | | | | |
| | |
Capital Transactions – Institutional Class | | | | | | | | |
Proceeds from shares sold | | | 2,601,183 | | | | 3,521,673 | |
Reinvestment of distributions | | | 153,110 | | | | 100,521 | |
Amount paid for shares redeemed | | | (237,785 | ) | | | (1,931,369 | ) |
| | | | | | | | |
Total Institutional Class | | | 2,516,508 | | | | 1,690,825 | |
| | | | | | | | |
| | |
Capital Transactions – Investor Class | | | | | | | | |
Proceeds from shares sold | | | – | | | | 2,500 | |
Reinvestment of distributions | | | 105 | | | | 79 | |
Amount paid for shares redeemed | | | – | | | | (1,162 | ) |
| | | | | | | | |
Total Investor Class | | | 105 | | | | 1,417 | |
| | | | | | | | |
Net increase in net assets resulting from capital transactions | | | 2,516,613 | | | | 1,692,242 | |
| | | | | | | | |
Total Increase in Net Assets | | | 1,715,472 | | | | 1,649,015 | |
| | | | | | | | |
| | |
Net Assets | | | | | | | | |
Beginning of period | | | 11,331,389 | | | | 9,682,374 | |
| | | | | | | | |
End of period | | $ | 13,046,861 | | | $ | 11,331,389 | |
| | | | | | | | |
Accumulated undistributed net investment income included in net assets at end of period | | $ | 62,380 | | | $ | 105,299 | |
| | | | | | | | |
| | |
Share Transactions – Institutional Class | | | | | | | | |
Shares sold | | | 238,704 | | | | 312,825 | |
Shares issued in reinvestment of distributions | | | 14,164 | | | | 8,904 | |
Shares redeemed | | | (21,512 | ) | | | (171,721 | ) |
| | | | | | | | |
Total Institutional Class | | | 231,356 | | | | 150,008 | |
| | | | | | | | |
| | |
Share Transactions – Investor Class | | | | | | | | |
Shares sold | | | – | | | | 215 | |
Shares issued in reinvestment of distributions | | | 10 | | | | 7 | |
Shares redeemed | | | – | | | | (101 | ) |
| | | | | | | | |
Total Investor Class | | | 10 | | | | 121 | |
| | | | | | | | |
Net increase in shares outstanding | | | 231,366 | | | | 150,129 | |
See accompanying notes which are an integral part of these financial statements.
24
MERITAGE YIELD-FOCUS EQUITY FUND
STATEMENTS OF CHANGES IN NET ASSETS
| | | | | | | | |
| | | For the Six
Months Ended
February 29, 2016
(Unaudited) | | | For the Year
Ended
August 31, 2015 | |
Increase in Net Assets due to: | | | | | | | | |
Operations | | | | | | | | |
Net investment income | | $ | 731,002 | | | $ | 1,349,196 | |
Net realized gain (loss) on investment securities transactions | | | (4,758,658 | ) | | | (2,692,078 | ) |
Net change in unrealized appreciation (depreciation) of investment securities | | | 3,452,924 | | | | (4,254,389 | ) |
| | | | | | | | |
Net increase (decrease) in net assets resulting from operations | | | (574,732 | ) | | | (5,597,271 | ) |
| | | | | | | | |
| | |
Distributions | | | | | | | | |
From net investment income – Institutional Class | | | (440,860 | ) | | | (1,143,993 | ) |
From net investment income – Investor Class | | | (122,357 | ) | | | (430,671 | ) |
From net realized gains – Institutional Class | | | – | | | | (67,297 | ) |
From net realized gains – Investor Class | | | – | | | | (32,817 | ) |
From return of capital – Institutional Class | | | – | | | | (36,917 | ) |
From return of capital – Investor Class | | | – | | | | (17,535 | ) |
| | | | | | | | |
Total distributions | | | (563,217 | ) | | | (1,729,230 | ) |
| | | | | | | | |
| | |
Capital Transactions – Institutional Class | | | | | | | | |
Proceeds from shares sold | | | 8,554,695 | | | | 14,547,861 | |
Reinvestment of distributions | | | 433,054 | | | | 1,128,297 | |
Amount paid for shares redeemed | | | (7,738,405 | ) | | | (8,566,630 | ) |
| | | | | | | | |
Total Institutional Class | | | 1,249,344 | | | | 7,109,528 | |
| | | | | | | | |
| | |
Capital Transactions – Investor Class | | | | | | | | |
Proceeds from shares sold | | | 2,059,111 | | | | 19,159,246 | |
Reinvestment of distributions | | | 116,992 | | | | 424,363 | |
Amount paid for shares redeemed | | | (3,431,782 | ) | | | (9,405,752 | ) |
| | | | | | | | |
Total Investor Class | | | (1,255,679 | ) | | | 10,177,857 | |
| | | | | | | | |
Net increase in net assets resulting from capital transactions | | | (6,335 | ) | | | 17,287,385 | |
| | | | | | | | |
Total Increase in Net Assets | | | (1,144,284 | ) | | | 9,960,884 | |
| | | | | | | | |
| | |
Net Assets | | | | | | | | |
Beginning of period | | | 39,023,784 | | | | 29,062,900 | |
| | | | | | | | |
End of period | | $ | 37,879,500 | | | $ | 39,023,784 | |
| | | | | | | | |
Accumulated undistributed net investment income included in net assets at end of period | | $ | 167,785 | | | $ | – | |
| | | | | | | | |
| | |
Share Transactions – Institutional Class | | | | | | | | |
Shares sold | | | 924,467 | | | | 1,369,009 | |
Shares issued in reinvestment of distributions | | | 47,029 | | | | 108,752 | |
Shares redeemed | | | (837,392 | ) | | | (822,983 | ) |
| | | | | | | | |
Total Institutional Class | | | 134,104 | | | | 654,778 | |
| | | | | | | | |
| | |
Share Transactions – Investor Class | | | | | | | | |
Shares sold | | | 231,841 | | | | 1,793,720 | |
Shares issued in reinvestment of distributions | | | 12,746 | | | | 40,978 | |
Shares redeemed | | | (371,187 | ) | | | (931,554 | ) |
| | | | | | | | |
Total Investor Class | | | (126,600 | ) | | | 903,144 | |
| | | | | | | | |
Net increase in shares outstanding | | | 7,504 | | | | 1,557,922 | |
See accompanying notes which are an integral part of these financial statements.
25
MERITAGE GROWTH EQUITY FUND – INSTITUTIONAL CLASS
FINANCIAL HIGHLIGHTS
(For a share outstanding during each period)
| | | | | | | | | | | | |
| | | For the Six
Months Ended
February 29, 2016
(Unaudited) | | | For the
Year Ended
August 31, 2015 | | | For the
Period Ended
August 31, 2014 (a) | |
Selected Per Share Data: | | | | | | | | | | | | |
Net asset value, beginning of period | | $ | 11.20 | | | $ | 10.95 | | | $ | 10.00 | |
| | | | | | | | | | | | |
Income from investment operations: | | | | | | | | | | | | |
Net investment income | | | 0.01 | | | | 0.01 | | | | 0.01 | |
Net realized and unrealized gain (loss) on investments | | | (0.34 | ) | | | 0.36 | | | | 0.94 | |
| | | | | | | | | | | | |
Total from investment operations | | | (0.33 | ) | | | 0.37 | | | | 0.95 | |
| | | | | | | | | | | | |
Less distributions to shareholders: | | | | | | | | | | | | |
From net investment income | | | (0.01 | ) | | | (0.01 | ) | | | – | |
From net realized gains | | | (0.23 | ) | | | (0.11 | ) | | | – | |
| | | | | | | | | | | | |
Total distributions | | | (0.24 | ) | | | (0.12 | ) | | | – | |
| | | | | | | | | | | | |
Net asset value, end of period | | $ | 10.63 | | | $ | 11.20 | | | $ | 10.95 | |
| | | | | | | | | | | | |
| | | |
Total Return (b) | | | (3.08 | )%(c) | | | 3.38 | % | | | 9.50 | %(c) |
| | | |
Ratios and Supplemental Data: | | | | | | | | | | | | |
Net assets, end of period (000 omitted) | | $ | 14,738 | | | $ | 13,331 | | | $ | 10,642 | |
Ratio of net expenses to average net assets | | | 1.00 | %(d) | | | 1.00 | % | | | 1.00 | %(d) |
Ratio of expenses to average net assets before waiver | | | 1.61 | %(d) | | | 1.66 | % | | | 3.49 | %(d) |
Ratio of net investment income to average net assets | | | 0.17 | %(d) | | | 0.08 | % | | | 0.22 | %(d) |
Portfolio turnover rate | | | 46 | %(c) | | | 84 | % | | | 94 | %(c) |
| (a) | For the period December 23, 2013 (commencement of operations) to August 31, 2014. |
| (b) | Total return in the above table represents the rate that the investor would have earned or lost on an investment in the Fund, assuming reinvestment of dividends. |
See accompanying notes which are an integral part of these financial statements.
26
MERITAGE GROWTH EQUITY FUND – INVESTOR CLASS
FINANCIAL HIGHLIGHTS
(For a share outstanding during each period)
| | | | | | | | | | | | |
| | | For the Six
Months Ended
February 29, 2016
(Unaudited) | | | For the
Year Ended
August 31, 2015 | | | For the
Period Ended
August 31, 2014 (a) | |
Selected Per Share Data: | | | | | | | | | | | | |
Net asset value, beginning of period | | $ | 11.15 | | | $ | 10.92 | | | $ | 10.00 | |
| | | | | | | | | | | | |
Income from investment operations: | | | | | | | | | | | | |
Net investment income (loss) | | | – | (b) | | | (0.02 | ) | | | – | (b) |
Net realized and unrealized gain (loss) on investments | | | (0.35 | ) | | | 0.37 | | | | 0.92 | |
| | | | | | | | | | | | |
Total from investment operations | | | (0.35 | ) | | | 0.35 | | | | 0.92 | |
| | | | | | | | | | | | |
Less distributions to shareholders: | | | | | | | | | | | | |
From net investment income | | | – | | | | (0.01 | ) | | | – | |
From net realized gains | | | (0.23 | ) | | | (0.11 | ) | | | – | |
| | | | | | | | | | | | |
Total distributions | | | (0.23 | ) | | | (0.12 | ) | | | – | |
| | | | | | | | | | | | |
Net asset value, end of period | | $ | 10.57 | | | $ | 11.15 | | | $ | 10.92 | |
| | | | | | | | | | | | |
| | | |
Total Return (c) | | | (3.24 | )%(d) | | | 3.17 | % | | | 9.20 | %(d) |
| | | |
Ratios and Supplemental Data: | | | | | | | | | | | | |
Net assets, end of period (000 omitted) | | $ | 154 | | | $ | 164 | | | $ | 136 | |
Ratio of net expenses to average net assets | | | 1.25 | %(e) | | | 1.25 | % | | | 1.25 | %(e) |
Ratio of expenses to average net assets before waiver | | | 1.86 | %(e) | | | 1.91 | % | | | 3.32 | %(e) |
Ratio of net investment income (loss) to average net assets | | | (0.09 | )%(e) | | | (0.17 | )% | | | 0.01 | %(e) |
Portfolio turnover rate | | | 46 | %(d) | | | 84 | % | | | 94 | %(d) |
| (a) | For the period December 23, 2013 (commencement of operations) to August 31, 2014. |
| (b) | Amount is less than $0.01. |
| (c) | Total return in the above table represents the rate that the investor would have earned or lost on an investment in the Fund, assuming reinvestment of dividends. |
See accompanying notes which are an integral part of these financial statements.
27
MERITAGE VALUE EQUITY FUND – INSTITUTIONAL CLASS
FINANCIAL HIGHLIGHTS
(For a share outstanding during each period)
| | | | | | | | | | | | |
| | | For the Six
Months Ended
February 29, 2016
(Unaudited) | | | For the
Year Ended
August 31, 2015 | | | For the
Period Ended
August 31, 2014 (a) | |
Selected Per Share Data: | | | | | | | | | | | | |
Net asset value, beginning of period | | $ | 11.00 | | | $ | 11.00 | | | $ | 10.00 | |
| | | | | | | | | | | | |
Income from investment operations: | | | | | | | | | | | | |
Net investment income | | | 0.04 | | | | 0.10 | | | | 0.04 | |
Net realized and unrealized gain (loss) on investments | | | (0.57 | ) | | | 0.01 | (b) | | | 0.96 | |
| | | | | | | | | | | | |
Total from investment operations | | | (0.53 | ) | | | 0.11 | | | | 1.00 | |
| | | | | | | | | | | | |
Less distributions to shareholders: | | | | | | | | | | | | |
From net investment income | | | (0.09 | ) | | | (0.04 | ) | | | – | |
From net realized gains | | | (0.04 | ) | | | (0.07 | ) | | | – | |
| | | | | | | | | | | | |
Total distributions | | | (0.13 | ) | | | (0.11 | ) | | | – | |
| | | | | | | | | | | | |
Net asset value, end of period | | $ | 10.34 | | | $ | 11.00 | | | $ | 11.00 | |
| | | | | | | | | | | | |
| | | |
Total Return (c) | | | (4.87 | )%(d) | | | 0.94 | % | | | 10.00 | %(d) |
| | | |
Ratios and Supplemental Data: | | | | | | | | | | | | |
Net assets, end of period (000 omitted) | | $ | 13,037 | | | $ | 11,321 | | | $ | 9,673 | |
Ratio of net expenses to average net assets | | | 1.00 | %(e) | | | 1.00 | % | | | 1.00 | %(e) |
Ratio of expenses to average net assets before waiver | | | 1.66 | %(e) | | | 1.66 | % | | | 3.58 | %(e) |
Ratio of net investment income to average net assets | | | 1.03 | %(e) | | | 0.96 | % | | | 0.86 | %(e) |
Portfolio turnover rate | | | 43 | %(d) | | | 62 | % | | | 50 | %(d) |
| (a) | For the period December 23, 2013 (commencement of operations) to August 31, 2014. |
| (b) | The amount shown for a share outstanding throughout the period does not accord with the aggregate gains and losses in the portfolio securities during the period because of the timing of sales and purchases of fund shares in relation to fluctuating market values during the period. |
| (c) | Total return in the above table represents the rate that the investor would have earned or lost on an investment in the Fund, assuming reinvestment of dividends. |
See accompanying notes which are an integral part of these financial statements.
28
MERITAGE VALUE EQUITY FUND – INVESTOR CLASS
FINANCIAL HIGHLIGHTS
(For a share outstanding during each period)
| | | | | | | | | | | | |
| | | For the Six
Months Ended
February 29, 2016
(Unaudited) | | | For the
Year Ended
August 31, 2015 | | | For the
Period Ended
August 31, 2014 (a) | |
Selected Per Share Data: | | | | | | | | | | | | |
Net asset value, beginning of period | | $ | 10.96 | | | $ | 10.98 | | | $ | 10.00 | |
| | | | | | | | | | | | |
Income from investment operations: | | | | | | | | | | | | |
Net investment income | | | 0.04 | | | | 0.07 | | | | 0.02 | |
Net realized and unrealized gain (loss) on investments | | | (0.59 | ) | | | 0.01 | (b) | | | 0.96 | |
| | | | | | | | | | | | |
Total from investment operations | | | (0.55 | ) | | | 0.08 | | | | 0.98 | |
| | | | | | | | | | | | |
Less distributions to shareholders: | | | | | | | | | | | | |
From net investment income | | | (0.07 | ) | | | (0.03 | ) | | | – | |
From net realized gains | | | (0.04 | ) | | | (0.07 | ) | | | – | |
| | | | | | | | | | | | |
Total distributions | | | (0.11 | ) | | | (0.10 | ) | | | – | |
| | | | | | | | | | | | |
Net asset value, end of period | | $ | 10.30 | | | $ | 10.96 | | | $ | 10.98 | |
| | | | | | | | | | | | |
| | | |
Total Return (c) | | | (5.03 | )%(d) | | | 0.68 | % | | | 9.80 | %(d) |
| | | |
Ratios and Supplemental Data: | | | | | | | | | | | | |
Net assets, end of period (000 omitted) | | $ | 10 | | | $ | 10 | | | $ | 9 | |
Ratio of net expenses to average net assets | | | 1.25 | %(e) | | | 1.25 | % | | | 1.25 | %(e) |
Ratio of expenses to average net assets before waiver | | | 1.91 | %(e) | | | 1.91 | % | | | 9.87 | %(e) |
Ratio of net investment income to average net assets | | | 0.77 | %(e) | | | 0.74 | % | | | 0.64 | %(e) |
Portfolio turnover rate | | | 43 | %(d) | | | 62 | % | | | 50 | %(d) |
| (a) | For the period December 23, 2013 (commencement of operations) to August 31, 2014. |
| (b) | The amount shown for a share outstanding throughout the period does not accord with the aggregate gains and losses in the portfolio securities during the period because of the timing of sales and purchases of fund shares in relation to fluctuating market values during the period. |
| (c) | Total return in the above table represents the rate that the investor would have earned or lost on an investment in the Fund, assuming reinvestment of dividends. |
See accompanying notes which are an integral part of these financial statements.
29
MERITAGE YIELD-FOCUS EQUITY FUND – INSTITUTIONAL CLASS
FINANCIAL HIGHLIGHTS
(For a share outstanding during each period)
| | | | | | | | | | | | |
| | | For the Six
Months Ended
February 29, 2016
(Unaudited) | | | For the
Year Ended
August 31, 2015 | | | For the
Period Ended
August 31, 2014 (a) | |
Selected Per Share Data: | | | | | | | | | | | | |
Net asset value, beginning of period | | $ | 9.44 | | | $ | 11.27 | | | $ | 10.00 | |
| | | | | | | | | | | | |
Income from investment operations: | | | | | | | | | | | | |
Net investment income | | | 0.18 | | | | 0.33 | | | | 0.10 | |
Net realized and unrealized gain (loss) on investments | | | (0.34 | ) | | | (1.71 | ) | | | 1.17 | |
| | | | | | | | | | | | |
Total from investment operations | | | (0.16 | ) | | | (1.38 | ) | | | 1.27 | |
| | | | | | | | | | | | |
Less distributions to shareholders: | | | | | | | | | | | | |
From net investment income | | | (0.14 | ) | | | (0.41 | ) | | | – | |
From net realized gains | | | – | | | | (0.03 | ) | | | – | |
From return of capital | | | – | | | | (0.01 | ) | | | – | |
| | | | | | | | | | | | |
Total distributions | | | (0.14 | ) | | | (0.45 | ) | | | – | |
| | | | | | | | | | | | |
Net asset value, end of period | | $ | 9.14 | | | $ | 9.44 | | | $ | 11.27 | |
| | | | | | | | | | | | |
| | | |
Total Return (b) | | | (1.66 | )%(c) | | | (12.56 | )% | | | 12.70 | %(c) |
| | | |
Ratios and Supplemental Data: | | | | | | | | | | | | |
Net assets, end of period (000 omitted) | | $ | 28,663 | | | $ | 28,316 | | | $ | 26,436 | |
Ratio of net expenses to average net assets | | | 1.00 | %(d) | | | 1.00 | % | | | 1.00 | %(d) |
Ratio of expenses to average net assets before waiver | | | 1.53 | %(d) | | | 1.44 | % | | | 2.62 | %(d) |
Ratio of net investment income to average net assets | | | 3.94 | %(d) | | | 3.17 | % | | | 2.70 | %(d) |
Portfolio turnover rate | | | 49 | %(c) | | | 86 | % | | | 63 | %(c) |
| (a) | For the period December 23, 2013 (commencement of operations) to August 31, 2014. |
| (b) | Total return in the above table represents the rate that the investor would have earned or lost on an investment in the Fund, assuming reinvestment of dividends. |
See accompanying notes which are an integral part of these financial statements.
30
MERITAGE YIELD-FOCUS EQUITY FUND – INVESTOR CLASS
FINANCIAL HIGHLIGHTS
(For a share outstanding during each period)
| | | | | | | | | | | | |
| | | For the Six
Months Ended
February 29, 2016
(Unaudited) | | | For the
Year Ended
August 31, 2015 | | | For the
Period Ended
August 31, 2014 (a) | |
Selected Per Share Data: | | | | | | | | | | | | |
Net asset value, beginning of period | | $ | 9.42 | | | $ | 11.25 | | | $ | 10.00 | |
| | | | | | | | | | | | |
Income from investment operations: | | | | | | | | | | | | |
Net investment income | | | 0.19 | | | | 0.29 | | | | 0.01 | |
Net realized and unrealized gain (loss) on investments | | | (0.35 | ) | | | (1.70 | ) | | | 1.24 | |
| | | | | | | | | | | | |
Total from investment operations | | | (0.16 | ) | | | (1.41 | ) | | | 1.25 | |
| | | | | | | | | | | | |
Less distributions to shareholders: | | | | | | | | | | | | |
From net investment income | | | (0.14 | ) | | | (0.38 | ) | | | – | |
From net realized gains | | | – | | | | (0.03 | ) | | | – | |
From return of capital | | | – | | | | (0.01 | ) | | | – | |
| | | | | | | | | | | | |
Total distributions | | | (0.14 | ) | | | (0.42 | ) | | | – | |
| | | | | | | | | | | | |
Net asset value, end of period | | $ | 9.12 | | | $ | 9.42 | | | $ | 11.25 | |
| | | | | | | | | | | | |
| | | |
Total Return (b) | | | (1.76 | )%(c) | | | (12.85 | )% | | | 12.50 | %(c) |
| | | |
Ratios and Supplemental Data: | | | | | | | | | | | | |
Net assets, end of period (000 omitted) | | $ | 9,217 | | | $ | 10,708 | | | $ | 2,627 | |
Ratio of net expenses to average net assets | | | 1.25 | %(d) | | | 1.25 | % | | | 1.25 | %(d) |
Ratio of expenses to average net assets before waiver | | | 1.78 | %(d) | | | 1.69 | % | | | 2.46 | %(d) |
Ratio of net investment income to average net assets | | | 3.72 | %(d) | | | 2.84 | % | | | 2.26 | %(d) |
Portfolio turnover rate | | | 49 | %(c) | | | 86 | % | | | 63 | %(c) |
| (a) | For the period December 23, 2013 (commencement of operations) to August 31, 2014. |
| (b) | Total return in the above table represents the rate that the investor would have earned or lost on an investment in the Fund, assuming reinvestment of dividends. |
See accompanying notes which are an integral part of these financial statements.
31
MERITAGE FUNDS
NOTES TO THE FINANCIAL STATEMENTS
February 29, 2016
(Unaudited)
NOTE 1. ORGANIZATION
The Meritage Growth Equity Fund (the “Growth Equity Fund”), the Meritage Value Equity Fund (the “Value Equity Fund”), the Meritage Yield-Focus Equity Fund (the “Yield-Focus Equity Fund”) (each a “Fund” and, collectively the “Funds”) were each organized as a diversified series of the Capitol Series Trust (the “Trust”). The Trust is an open-end investment company established under the laws of Ohio by an Agreement and Declaration of Trust dated September 18, 2013 (the “Trust Agreement”). The Trust Agreement permits the Trust’s Board of Trustees (the “Board”) to issue an unlimited number of shares of beneficial interest of separate series without par value. The Funds each offer two share classes, Institutional Class Shares and Investor Class Shares. The Funds commenced operations on December 23, 2013. The Funds’ investment adviser is Meritage Portfolio Management, Inc. (the “Adviser”). The investment objective of the Growth Equity Fund is to seek growth of capital. The investment objective of the Value Equity Fund is to seek growth of capital. Income is a secondary objective for the Value Equity Fund. The investment objective of the Yield-Focus Equity Fund is to seek long-term growth of capital with an emphasis on high current income.
Each Fund’s prospectus provides a description of the investment objective, policies and strategies, along with information on the classes of shares currently being offered.
NOTE 2. SIGNIFICANT ACCOUNTING POLICIES
The Funds are investment companies and follow accounting and reporting guidance under Financial Accounting Standards Board (“FASB”) Accounting Standards Codification (“ASC”) Topic 946, “Financial Services-Investment Companies”. The following is a summary of significant accounting policies consistently followed by each Fund in the preparation of its financial statements.
Securities Valuation – All investments in securities are recorded at their estimated fair value as described in Note 3.
Federal Income Taxes – The Funds make no provision for federal income or excise tax. Each Fund intends to continue to qualify each year as a regulated investment company (“RIC”) under subchapter M of the Internal Revenue Code of 1986, as amended, by complying with the requirements applicable to RICs and by distributing substantially all of its taxable income. Each Fund also intends to distribute sufficient net investment income and net capital gains, if any, so that it will not be subject to excise tax on undistributed income and gains. If the required amount of net investment income or gains is not distributed, the Funds could incur a tax expense.
As of and during the period ended February 29, 2016, the Funds did not have a liability for any unrecognized tax benefits. The Funds recognize interest and penalties, if any, related to unrecognized tax benefits as income tax expense in the statement of operations. During the period, the Funds did not incur any interest or penalties. The Funds are subject to examination by U.S. federal tax authorities for all tax years since inception.
Expenses – Expenses incurred by the Trust that do not relate to a specific fund of the Trust are allocated to the individual funds based on each Fund’s relative net assets or another appropriate basis (as determined by the Board). Expenses attributable to any class are borne by that class. Income, realized gains and losses, unrealized appreciation and depreciation, and expenses are allocated to each class based on the net assets in relation to the relative net assets of the Fund.
Security Transactions and Related Income – Throughout the reporting period, security transactions are accounted for no later than one business day following the trade date. For financial reporting purposes, security transactions
32
MERITAGE FUNDS
NOTES TO THE FINANCIAL STATEMENTS – (continued)
February 29, 2016
(Unaudited)
NOTE 2. SIGNIFICANT ACCOUNTING POLICIES – continued
are accounted for on trade date on the last business day of the reporting period. The specific identification method is used for determining gains or losses for financial statements and income tax purposes. Dividend income is recorded on the ex-dividend date and interest income is recorded on an accrual basis. Discounts and premiums on securities purchased are accreted or amortized using the effective interest method. Withholding taxes on foreign dividends have been provided for in accordance with the Funds’ understanding of the applicable country’s tax rules and rates. The ability of issuers of debt securities held by the Funds to meet their obligations may be affected by economic and political developments in a specific country or region.
Dividends and Distributions – Each Fund intends to distribute substantially all of its net investment income, if any, as dividends to its shareholders on at least an annual basis. Each Fund intends to distribute its net realized long term capital gains and its net realized short term capital gains, if any, at least once a year. Dividends to shareholders, which are determined in accordance with income tax regulations, are recorded on the ex-dividend date. The treatment for financial reporting purposes of distributions made to shareholders during the period from net investment income or net realized capital gains may differ from their ultimate treatment for federal income tax purposes. These differences are caused primarily by differences in the timing of the recognition of certain components of income, expense or realized capital gains for federal income tax purposes. Where such differences are permanent in nature, they are reclassified in the components of the net assets based on their ultimate characterization for federal income tax purposes. Any such reclassifications will have no effects on net assets, results of operations or net asset values per share of the Funds.
NOTE 3. SECURITIES VALUATION AND FAIR VALUE MEASUREMENTS
Fair value is defined as the price that a Fund would receive upon selling an investment in an orderly transaction to an independent buyer in the principal or most advantageous market of the investment. Generally Accepted Accounting Principles in the United States of America (“GAAP”) establish a three-tier hierarchy to maximize the use of observable market data and minimize the use of unobservable inputs and to establish classification of fair value measurements for disclosure purposes.
Inputs refer broadly to the assumptions that market participants would use in pricing the asset or liability, including assumptions about risk (the risk inherent in a particular valuation technique used to measure fair value such as pricing model and/or the risk inherent in the inputs to the valuation technique). Inputs may be observable or unobservable. Observable inputs are inputs that reflect the assumptions market participants would use in pricing the asset or liability developed based on market data obtained from sources independent of the reporting entity. Unobservable inputs are inputs that reflect the reporting entity’s own assumptions about the assumptions market participants would use in pricing the asset or liability developed based on the best information available in the circumstances.
Various inputs are used in determining the value of each Fund’s investments. These inputs are summarized in the three broad levels listed below.
| | • | | Level 1 – unadjusted quoted prices in active markets for identical investments and/or registered investment companies where the value per share is determined and published and is the basis for current transactions for identical assets or liabilities at the valuation date |
| | • | | Level 2 – other significant observable inputs (including, but not limited to, quoted prices for an identical security in an inactive market, quoted prices for similar securities, interest rates, prepayment speeds, credit risk, etc.) |
33
MERITAGE FUNDS
NOTES TO THE FINANCIAL STATEMENTS – (continued)
February 29, 2016
(Unaudited)
NOTE 3. SECURITIES VALUATION AND FAIR VALUE MEASUREMENTS –continued
| | • | | Level 3 – significant unobservable inputs (including the Funds’ own assumptions in determining fair value of investments based on the best information available) |
The inputs used to measure fair value may fall into different levels of the fair value hierarchy. In such cases, for disclosure purposes, the level in the fair value hierarchy within which the fair value measurement falls in its entirety, is determined based on the lowest level input that is significant to the fair value measurement in its entirety.
In computing the net asset value (‘NAV”) of the Funds, fair value is based on market valuations with respect to portfolio securities for which market quotations are readily available. Pursuant to Trustee-approved policies, the Trust relies on independent third-party pricing services to provide the current market value of securities. Those pricing services value equity securities traded on a securities exchange at the last reported sales price on the principal exchange. Equity securities quoted by NASDAQ are valued at the NASDAQ Official Closing Price. If there is no reported sale on the principal exchange, equity securities are valued at the mean between the most recent quoted bid and asked price. If a non-exchange traded security does not trade on a particular day, then the mean between the last quoted closing bid and asked price will be used. In each of these situations, valuations are typically categorized as Level 1 in the fair value hierarchy.
Sometimes, an equity security owned by the Fund will be valued by the pricing service with factors other than market quotations or when the market is considered inactive. When this happens, the security may be classified as a Level 2 security. When market quotations are not readily available, when the Fund determines that the market quotation or the price provided by the pricing service does not accurately reflect the current fair value, or when certain restricted or illiquid securities are being valued, such securities are valued as determined in good faith by the Fund, in conformity with guidelines adopted by and subject to review by the Board. These securities are generally categorized as Level 3 securities.
Investments in open-end mutual funds, including money market mutual funds, are generally priced at the ending NAV provided by the service agent of the funds. These securities are categorized as Level 1 securities.
In accordance with the Trust’s good faith pricing guidelines, the Adviser is required to consider all appropriate factors relevant to the value of securities for which it has determined other pricing sources are not available or reliable as described above. No single standard exists for determining fair value, because fair value depends upon the circumstances of each individual case. As a general principle, the current fair value of an issue of securities being valued by the Fund would appear to be the amount which the owner might reasonably expect to receive for them upon their current sale. Methods which are in accordance with this principle may, for example, be based on (i) a multiple of earnings; (ii) a discount from market of a similar freely traded security (including a derivative security or a basket of securities traded on other markets, exchanges or among dealers); or (iii) yield to maturity with respect to debt issues, or a combination of these and other methods. Good faith pricing is permitted if, in the Adviser’s opinion, the validity of market quotations appears to be questionable based on factors such as evidence of a thin market in the security based on a small number of quotations, a significant event occurs after the close of a market but before a Fund’s NAV calculation that may affect a security’s value, or the Adviser is aware of any other data that calls into question the reliability of market quotations. Good faith pricing may also be used in instances when the bonds the Fund invests in may default or otherwise cease to have market quotations readily available. Any fair valuation pricing done outside the Fund’s approved pricing methods must be approved by the Pricing Committee of the Board.
34
MERITAGE FUNDS
NOTES TO THE FINANCIAL STATEMENTS – (continued)
February 29, 2016
(Unaudited)
NOTE 3. SECURITIES VALUATION AND FAIR VALUE MEASUREMENTS –continued
The following is a summary of the inputs used to value the Funds’ investments as of February 29, 2016:
| | | | | | | | | | | | | | | | |
| | | Valuation Inputs | |
| Growth Equity Fund | | Level 1 | | | Level 2 | | | Level 3 | | | Total | |
Common Stocks* | | $ | 13,149,159 | | | $ | – | | | $ | – | | | $ | 13,149,159 | |
Exchange-Traded Funds | | | 324,360 | | | | – | | | | – | | | | 324,360 | |
Money Market Securities | | | 1,561,384 | | | | – | | | | – | | | | 1,561,384 | |
Total | | $ | 15,034,903 | | | $ | – | | | $ | – | | | $ | 15,034,903 | |
Value Equity Fund | | | | | | | | | | | | | | | | |
Common Stocks* | | $ | 10,824,869 | | | $ | – | | | $ | – | | | $ | 10,824,869 | |
Exchange-Traded Funds | | | 1,205,005 | | | | – | | | | – | | | | 1,205,005 | |
Money Market Securities | | | 1,307,113 | | | | – | | | | – | | | | 1,307,113 | |
Total | | $ | 13,336,987 | | | $ | – | | | $ | – | | | $ | 13,336,987 | |
Yield-Focus Equity Fund | | | | | | | | | | | | | | | | |
Common Stocks* | | $ | 32,205,130 | | | $ | – | | | $ | – | | | $ | 32,205,130 | |
Preferred Stocks* | | | 1,437,481 | | | | – | | | | – | | | | 1,437,481 | |
Exchange-Traded Funds | | | 2,410,079 | | | | | | | | | | | | 2,410,079 | |
Money Market Securities | | | 1,461,253 | | | | – | | | | – | | | | 1,461,253 | |
Total | | $ | 37,513,943 | | | $ | – | | | $ | – | | | $ | 37,513,943 | |
| * | Refer to Schedule of Investments for Industry classifications. |
The Funds did not hold any investments at any time during the reporting period in which significant unobservable inputs were used in determining fair value; therefore, no reconciliation of Level 3 securities is included for this reporting period. The Funds did not hold any derivative instruments during the reporting period.
The Trust recognizes transfers between fair value hierarchy levels at the end of the reporting period. There were no transfers between any levels for the period ended February 29, 2016.
NOTE 4. FEES AND OTHER TRANSACTIONS WITH AFFILIATES
Under the terms of the management agreement, on behalf of the Funds (the “Agreement”), the Adviser manages each Fund’s investments subject to oversight of the Board. As compensation for its management services, each Fund is obligated to pay the Adviser a fee computed and accrued daily and paid monthly at an annual rate of 0.75% of the average daily net assets of each Fund. For the period ended February 29, 2016, the Adviser earned fees of $53,612 from the Growth Equity Fund, $45,572 from the Value Equity Fund and $141,407 from the Yield-Focus Equity Fund before the reimbursements described below.
The Adviser has contractually agreed to waive or limit its fees and to assume other expenses of each Fund until December 31, 2016, so that total annual fund operating expenses do not exceed 1.00%. This operating expense
35
MERITAGE FUNDS
NOTES TO THE FINANCIAL STATEMENTS – (continued)
February 29, 2016
(Unaudited)
NOTE 4. FEES AND OTHER TRANSACTIONS WITH AFFILIATES – continued
limitation does not apply to borrowing costs (such as interest and dividend expenses on securities sold short), taxes, extraordinary expenses, brokerage fees and commissions, and expenses incurred under a plan of distribution adopted pursuant to Rule 12b-1 under the Investment Company Act of 1940 (“Excluded Expenses”). This limitation also excludes any “acquired fund fees and expenses” as that term is described in each Fund’s prospectus.
The waiver and/or reimbursement by the Adviser with respect to the Funds are subject to repayment by the Funds within the three fiscal years following the fiscal year in which that particular waiver and/or reimbursement occurred, provided that the Funds are able to make the repayment without exceeding the expense limitations that were in effect at the time of the waiver or reimbursement.
The amounts subject to repayment by the Funds, pursuant to the aforementioned conditions, are as follows:
| | | | | | | | |
| | | Amount
Waived or
Reimbursed | | | Recoverable
through
August 31, | |
Growth Equity Fund | | $ | 109,316 | | | | 2017 | |
| | | 83,727 | | | | 2018 | |
| | | 43,679 | | | | 2019 | |
| | |
Value Equity Fund | | $ | 103,749 | | | | 2017 | |
| | | 72,434 | | | | 2018 | |
| | | 40,146 | | | | 2019 | |
| | |
Yield-Focus Equity Fund | | $ | 144,170 | | | | 2017 | |
| | | 190,960 | | | | 2018 | |
| | | 99,244 | | | | 2019 | |
The Trust retains Ultimus Asset Services, LLC (“Ultimus”), formerly Huntington Asset Services, Inc. (“HASI”) to supply non-investment related administrative and compliance services for each Fund. For the period ended February 29, 2016, Ultimus earned fees of $12,280 for the Growth Equity Fund, $10,341 for the Value Equity Fund and $33,271 for the Yield-Focus Equity Fund. At February 29, 2016, Ultimus was owed $4,151 for the Growth Equity Fund, $3,408 for the Value Equity Fund and $10,832 for the Yield-Focus Equity Fund for administrative services.
The Trust also retains Ultimus to act as the Fund’s transfer agent and to provide fund accounting services. For the period ended February 29, 2016, Ultimus earned fees of $8,888 for the Growth Equity Fund, $7,481 for the Value Equity Fund and $24,442 for the Yield-Focus Equity Fund for transfer agent services and reimbursement for out-of-pocket expenses incurred in providing transfer agent services. At February 29, 2016, Ultimus was owed $2,949 for the Growth Equity Fund, $2,431 for the Value Equity Fund and $7,600 for the Yield-Focus Equity Fund for transfer agent services and out-of-pocket expenses. For the period ended February 29, 2016, Ultimus earned fees of $8,187 for the Growth Equity Fund, $6,895 for the Value Equity Fund and $22,181 for the Yield-Focus Equity Fund for fund accounting services. At February 29, 2016, Ultimus was owed $2,768 for the Growth Equity Fund, $2,274 Value Equity Fund and $7,222 for the Yield-Focus Equity Fund for fund accounting services.
36
MERITAGE FUNDS
NOTES TO THE FINANCIAL STATEMENTS – (continued)
February 29, 2016
(Unaudited)
NOTE 4. FEES AND OTHER TRANSACTIONS WITH AFFILIATES – continued
Certain officers of the Trust are members of management and/or employees of Ultimus. Unified Financial Securities, LLC (the “Distributor”) acts as the principal distributor of the Funds’ shares. Huntington National Bank is the custodian of the Funds’ investments (the “Custodian”). Prior to January 1, 2016, the Custodian, HASI and the Distributor were under common control by Huntington Bancshares, Inc.
The Funds have adopted a Distribution Plan (the “Plan”) pursuant to Rule 12b-1 under the 1940 Act. The Plan provides that the Funds will pay the Distributor and/or any registered securities dealer, financial institution or any other person (the “Recipient”) a fee of 0.25% of the average daily net assets of each Fund’s Investor Shares in connection with the promotion and distribution of Fund’s shares or the provision of personal services to shareholders, including, but not necessarily limited to, advertising, compensation to underwriters, dealers and selling personnel, the printing and mailing of prospectuses to other than current Fund shareholders, the printing and mailing of sales literature and servicing shareholder accounts. The Funds may pay all or a portion of these fees to any Recipient who renders assistance in distributing or promoting the sale of shares, or who provides certain shareholder services, pursuant to a written agreement. The Plan is a compensation plan, which means that compensation is provided regardless of 12b-1 expenses actually incurred. The Trustees believe that the Plan will significantly enhance the Trust’s ability to expand distribution of Investor Shares of each Fund. It is also anticipated that an increase in the size of a Fund will facilitate more efficient portfolio management and assist the Fund in seeking to achieve its investment objective.
There were no payments made to the Distributor for serving as principal underwriter by the Funds for the period ended February 29, 2016. An officer of the Trust is an officer of the Distributor and such person may be deemed to be an affiliate of the Distributor.
NOTE 5. INVESTMENT TRANSACTIONS
For the period ended February 29, 2016, purchases and sales of investment securities, excluding short-term securities, were as follows:
| | | | | | | | |
Fund | | Purchases | | | Sales | |
Growth Equity Fund | | $ | 7,572,912 | | | $ | 6,171,830 | |
Value Equity Fund | | | 7,175,797 | | | | 4,918,514 | |
Yield-Focus Equity Fund | | | 17,917,795 | | | | 18,873,974 | |
NOTE 6. ESTIMATES
The preparation of financial statements in conformity with GAAP requires management to make estimates and assumptions that affect the reported amounts of assets and liabilities and disclosure of contingent assets and liabilities at the date of the financial statements and the reported amounts of increases and decreases in net assets from operations during the reporting period. Actual results could differ from those estimates.
NOTE 7. BENEFICIAL OWNERSHIP
The beneficial ownership, either directly or indirectly, of 25% or more of the voting securities of a fund creates a presumption of control of a fund, under Section 2(a)(9) of the Investment Company Act of 1940. At February 29,
37
MERITAGE FUNDS
NOTES TO THE FINANCIAL STATEMENTS – (continued)
February 29, 2016
(Unaudited)
NOTE 7. BENEFICIAL OWNERSHIP – continued
2016, National Financial Services LLC (“NFS”) and Charles Schwab & Co. Inc. (“Schwab”) owned, as record shareholder, 54.81% and 42.59%, respectively, of the outstanding shares of the Growth Equity Fund. At February 29, 2016, NFS and Schwab owned, as record shareholder, 55.46% and 42.68%, respectively, of the outstanding shares of the Value Equity Fund. At February 29, 2016, NFS owned, as record shareholder, 28.77% of the outstanding shares of the Yield-Focus Equity Fund. It is not known whether NFS, Schwab or any of the underlying beneficial owners owned or controlled 25% or more of the voting securities of the Funds.
NOTE 8. FEDERAL TAX INFORMATION
At February 29, 2016, the net unrealized appreciation (depreciation) of investments for tax purposes was as follows:
| | | | | | | | | | | | | | | | |
| | | Tax Cost of
Securities | | | Unrealized
Appreciation | | | Unrealized
Depreciation | | | Net Unrealized
Appreciation | |
Growth Equity Fund | | $ | 14,464,586 | | | $ | 1,122,520 | | | $ | (552,203 | ) | | $ | 570,317 | |
Value Equity Fund | | | 12,967,679 | | | | 948,880 | | | | (579,572 | ) | | | 369,308 | |
Yield-Focus Equity Fund | | | 37,484,706 | | | | 2,215,477 | | | | (2,186,240 | ) | | | 29,237 | |
The tax character of distributions paid during the fiscal year ended August 31, 2015, was as follows:
| | | | | | | | | | | | | | | | |
| | | Ordinary
Income | | | Net Long-Term
Capital Gains | | | Return of
Capital | | | Total
Distributions
Paid | |
Growth Equity Fund | | $ | 129,461 | | | $ | – | | | $ | – | | | $ | 129,461 | |
Value Equity Fund | | | 100,600 | | | | – | | | | – | | | | 100,600 | |
Yield-Focus Equity Fund | | | 1,674,778 | | | | – | | | | 54,452 | | | | 1,729,230 | |
At August 31, 2015, the components of distributable earnings (accumulated losses) on a tax basis were as follows:
| | | | | | | | | | | | | | | | | | | | |
| | | Ordinary
Income | | | Undistributed
Long-Term
Capital Gains | | | Accumulated
Capital and
Other Losses | | | Unrealized
Appreciation/
(Depreciation) | | | Total
Accumulated
Earnings
(Losses) | |
Growth Equity Fund | | $ | 208,722 | | | $ | 109,499 | | | $ | – | | | $ | 745,214 | | | $ | 1,063,435 | |
Value Equity Fund | | | 105,298 | | | | 50,538 | | | | – | | | | 562,808 | | | | 718,644 | |
Yield-Focus Equity Fund | | | – | | | | – | | | | (2,414,870 | ) | | | (3,278,318 | ) | | | (5,693,188 | ) |
The difference between book basis and tax basis unrealized appreciation is primarily attributable to the tax deferral of wash losses.
As of August 31, 2015, the Yield-Focus Equity Fund has available for tax purposes an unused capital loss carryforward of $265,888 of short-term capital losses with no expiration, which is available to offset against future taxable net capital gains. To the extent that these carryforwards are used to offset future gains, it is probable that the amount offset will not be distributed to shareholders.
38
MERITAGE FUNDS
NOTES TO THE FINANCIAL STATEMENTS – (continued)
February 29, 2016
(Unaudited)
NOTE 8. FEDERAL TAX INFORMATION – continued
Certain capital losses incurred after October 31, and within the current taxable year, are deemed to arise on the first business day of the Fund’s following taxable year. For the tax year ended August 31, 2015, the Yield-Focus Equity Fund deferred post October capital losses in the amount of $2,148,982.
NOTE 9. COMMITMENTS AND CONTINGENCIES
The Funds indemnify their officers and trustees for certain liabilities that may arise from the performance of their duties to the Funds. Additionally, in the normal course of business, the Funds enter into contracts that contain a variety of representations and warranties which provide general indemnifications. The Funds’ maximum exposure under these arrangements is unknown, as this would involve future claims that may be made against the Funds that have not yet occurred.
NOTE 10. SUBSEQUENT EVENTS
Management has evaluated events or transactions that may have occurred since February 29, 2016 through the date the financial statements were issued, that would merit recognition or disclosure in the financial statements. There were no items requiring adjustment of the financial statements or additional disclosure.
39
CAPITOL SERIES TRUST
Privacy Policy
(Unaudited)
Capitol Series Trust (the “Trust”) on behalf of each of its series (each a “Fund,” collectively the “Funds”) adopts the following privacy policy in order to safeguard the personal information of its consumers and customers that are individuals in accordance with Securities and Exchange Commission Regulation S-P,17 CFR 284.30.
We collect only relevant information about a Fund’s shareholders that the law allows or requires us to have in order to conduct our business and properly service you. We collect financial and personal information about you (“Personal Information”) directly (e.g., information on account applications and other forms, such as your name, address, and social security number, and information provided to access account information or conduct account transactions online, such as password, account number, e-mail address, and alternate telephone number), and indirectly (e.g., information about your transactions with us, such as transaction amounts, account balance and account holdings).
The Trust does not disclose any non-public personal information about its shareholders or former shareholders other than for everyday business purposes such as to process a transaction, service an account, to respond to court orders and legal investigations or as otherwise permitted by law. Third parties that may receive this information include companies that provide transfer agency, technology and administrative services to a Fund, as well as the Fund’s investment adviser who is an affiliate of the Fund. If you maintain a retirement/educational custodial account directly with a Fund, we may also disclose your Personal Information to the custodian for that account for shareholder servicing purposes. We limit access to your Personal Information provided to unaffiliated third parties to information necessary to carry out their assigned responsibilities to a Fund. All shareholder records will be disposed of in accordance with applicable law.
The Trust maintains physical, electronic and procedural safeguards to protect Personal Information and requires its third parties service provides with access to such information to treat the Personal Information with the same high degree of confidentiality.
In the event that a shareholder holds shares of a Fund through a financial intermediary, including, but not limited to, a broker-dealer, bank, credit union or trust company, the privacy policy of the shareholders’ financial intermediary would govern how their non-public personal information would be shared with unaffiliated third parties.
OTHER INFORMATION – (Unaudited)
The Funds’ Statement of Additional Information (“SAI”) includes additional information about the trustees and is available without charge, upon request. You may call toll-free at (855) 261-0104 to request a copy of the SAI or to make shareholder inquiries.
PROXY VOTING – (Unaudited)
A description of the policies and procedures that the Funds use to determine how to vote proxies relating to portfolio securities and information regarding how each Fund voted those proxies during the most recent twelve month period ended June 30, is available without charge upon request by (1) calling the Funds at (855) 261-0104 and (2) from Funds documents filed with the Securities and Exchange Commission (“SEC”) on the SEC’s website at www.sec.gov.
TRUSTEES
R. Jeffrey Young, Chairman
Walter B. Grimm
Mary M. Morrow
OFFICERS
Matthew J. Miller, Chief Executive Officer and President
John C. Swhear, Chief Compliance Officer, AML Officer and Vice President
Stacey Havens, Vice President
Zachary P. Richmond, Treasurer and Chief Financial Officer
Tiffany R. Franklin, Secretary
INVESTMENT ADVISER
Meritage Portfolio Management, Inc.
7500 College Boulevard, Suite 1212
Overland Park, KS 66210
DISTRIBUTOR
Unified Financial Securities, LLC
2960 North Meridian Street, Suite 300
Indianapolis, IN 46208
INDEPENDENT REGISTERED PUBLIC ACCOUNTING FIRM
KPMG LLP
191 West Nationwide Boulevard, Suite 500
Columbus, OH 43215
LEGAL COUNSEL
Bernstein Shur
100 Middle Street, 6th Floor
Portland, ME 04104
CUSTODIAN
Huntington National Bank
41 South High Street
Columbus, OH 43215
ADMINISTRATOR, TRANSFER AGENT AND FUND ACCOUNTANT
Ultimus Asset Services, LLC
2960 North Meridian Street, Suite 300
Indianapolis, IN 46208
This report is intended only for the information of shareholders or those who have received the Funds’ prospectus which contains information about the Funds’ management fee and expenses. Please read the prospectus carefully before investing.
Distributed by Unified Financial Securities, LLC
Member FINRA/SIPC
Item 2. Code of Ethics.
Not applicable.
Item 3. Audit Committee Financial Expert.
Not applicable.
Item 4. Principal Accountant Fees and Services.
Not applicable.
Item 5. Audit Committee of Listed Registrants.
Not applicable.
Item 6. Schedule of Investments.
(a) Not applicable.
(b) Not applicable.
Item 7. Disclosure of Proxy Voting Policies and Procedures for Closed-End Management Investment Companies.
Not applicable.
Item 8. Portfolio Managers of Closed-End Management Investment Companies.
Not applicable.
Item 9. Purchases of Equity Securities by Closed-End Management Investment Company and Affiliated Purchasers.
Not applicable.
Item 10. Submission of Matters to a Vote of Security Holders.
Not applicable.
Item 11. Controls and Procedures.
(a) Based on their evaluation of the registrant’s disclosure controls and procedures (as defined in Rule 30a-3(c) under the Investment Company Act of 1940, as amended (the “Act”)) as of a date within 90 days of the filing date of this report, the registrant’s principal executive officer and principal financial officer have concluded that such disclosure controls and procedures are reasonably designed and are operating effectively to ensure that material information relating to the registrant is made known to them by others within those entities, particularly during the period in which this report is being prepared, and that the information required in filings on Form N-CSR is recorded, processed, summarized, and reported on a timely basis.
(b) There were no changes in the registrant’s internal control over financial reporting (as defined in Rule 30a-3(d) under the Investment Company Act of 1940) that occurred during the second fiscal quarter of the period covered by this report that have materially affected, or are reasonably likely to materially affect, the registrant’s internal control over financial reporting.
Item 12. Exhibits.
| | |
| (a)(1) Not applicable. |
|
| (a)(2) Certifications by the registrant's principal executive officer and principal financial officer, pursuant to Section 302 of the Sarbanes- Oxley Act of 2002 and required by Rule 30a-2 under the Investment Company Act of 1940 are filed herewith. |
|
| (a)(3) Not applicable. |
|
| (b) Certifications pursuant to Rule 30a-2(b) are furnished herewith. |
SIGNATURES
Pursuant to the requirements of the Securities Exchange Act of 1934 and the Investment Company Act of 1940, the registrant has duly caused this report to be signed on its behalf by the undersigned, thereunto duly authorized.
| | |
| (Registrant) | | Capitol Series Trust |
| | | | |
| | |
| By (Signature and Title) | | /s/ Matthew J. Miller | | |
| | Matthew J. Miller, Chief Executive Officer and President | | |
Date 4/28/16
Pursuant to the requirements of the Securities Exchange Act of 1934 and the Investment Company Act of 1940, this report has been signed below by the following persons on behalf of the registrant and in the capacities and on the dates indicated.
| | | | |
| By (Signature and Title) | | /s/ Matthew J. Miller | | |
| | Matthew J. Miller, Chief Executive Officer and President | | |
| |
| Date 4/28/16 | | |
| | |
| By (Signature and Title) | | /s/ Zachary P. Richmond | | |
| | Zachary P. Richmond, Treasurer and Chief Financial Officer | | |
| |
| Date 4/28/16 | | |