UNITED STATES
SECURITIES AND EXCHANGE COMMISSION
Washington, D.C. 20549
FORM N-CSR
CERTIFIED SHAREHOLDER REPORT OF REGISTERED
MANAGEMENT INVESTMENT COMPANIES
Investment Company Act file number: 811-22895
Capitol Series Trust
(Exact name of registrant as specified in charter)
Ultimus Asset Services, LLC
225 Pictoria Drive, Suite 450
Cincinnati, OH 45246
(Address of principal executive offices) (Zip code)
Zachary P. Richmond
Ultimus Asset Services, LLC
225 Pictoria Drive, Suite 450
Cincinnati, OH 45246
(Name and address of agent for service)
Registrant’s telephone number, including area code: 513-587-3400
Date of fiscal year end: August 31
Date of reporting period: February 28, 2017
Item 1. Reports to Stockholders.


Where discipline meets common sense.
Semi-Annual Report
February 28, 2017
Meritage Growth Equity Fund MPGEX/MPGIX
Meritage Value Equity Fund MVEBX
Meritage Yield-Focus Equity Fund MPYEX/MPYIX
| | | | |
| 913.345.7000 | | www.meritageportfoliofunds.com | | 7500 College Blvd., Suite 1212, Overland Park, KS 66210 |
MESSAGE FROM THE CHIEF INVESTMENT OFFICER – (Unaudited)
At Meritage, we are value-driven investors. We buy stock in businesses when i) they score well in our comprehensive stock-ranking process (universe is global, all-cap and about 6,500 securities), and ii) they are selling for less than we believe they are worth. Our value discipline is intended to provide a margin of safety and is one of our primary risk management tools, along with managing position sizes and diversification.
Dear Fellow Shareholders:
The past year has seen quite a change in the broad market. Specifically, we note how the S&P 500 marked its low for 2016 on February 11, 2016, closing at 1,829.08. At the conclusion of the first six months of fiscal year 2017, February 28, 2017, the S&P closed at 2,363.64. This period of slightly more than a year saw the S&P recover 32.19% from the low in 2016 and 10.01% from our last report six months ago on August 31, 2016.
Though not much has changed economically in these past six months, the market’s favorable reaction to the likelihood of change following a highly improbably election is logical. A policy agenda that includes the prospects of lower corporate and individual tax rates, a rollback in business regulation, massive infrastructure spending and the repatriation of foreign corporate earnings back to the U.S. are all potential developments that have been enthusiastically embraced by the stock market.
While we have seen interest rates begin to move higher off their historic lows, we expect a low interest rate environment to remain an important component to the investment backdrop. Economic activity, starting from a very low base around the world, should continue to see modest improvement. While many investors share our view, they have correspondingly been willing to pay a premium for well-known stocks. This is where we part company with the crowd, however, as we expect the discipline embedded in our value approach will yield better results over full market cycles.
Our Growth Fund continued to perform well for the past six months, ahead of its respective market benchmark. Our Value Fund turned in a solid six months, but trailed its primary benchmarks somewhat. The Yield-Focus Fund also performed well, but fell short of its most comparable benchmark, the Zacks Multi-Asset Income Index.
As always, we attribute our bottom-up value-centric security selection process for generating our strong long-term returns and our results so far in fiscal 2017. We continue to refine and improve this process of rigorously searching for attractive mispriced securities, among all capitalization sizes and geographies throughout the world.
We explore this topic further in the following pages. A specific discussion of each Fund and its performance is included in Management’s Discussion of Fund Performance.
Thank you for your continued trust in us as stewards of your capital. As previously mentioned we have our own money invested alongside yours in each of our funds, and we remain committed to delivering attractive risk-adjusted returns over full market cycles.
Sincerely,
Mark Eveans, CFA
President and Chief Investment Officer
1
MANAGEMENT’S DISCUSSION OF FUND PERFORMANCE – (Unaudited)
Meritage Growth Equity Fund
For the six-month period ended February 28, 2017, the Meritage Growth Equity Fund Institutional Class and Investors Class returned 10.82% and 10.70%, respectively. The Fund’s returns exceeded its primary benchmark, the Russell 1000 Growth Index, and the Lipper Large Cap Growth Index. They returned 9.15% and 7.66%, respectively, during the same time frame.
From an attribution standpoint the Fund’s strong performance over the course of the last six months, compared to the benchmark, was driven primarily by two key factors. The Fund was overweight in the Information Technology sector compared to the benchmark and our stock selection within that sector was superior. The interaction of these two factors was a significant positive.
Regarding specific issues, the strongest gainers for the six months were Coherent, Inc. up 73.6%, II-VI, Inc. up 68.0% and Nvidia up 65.9%.
The poorest performers for the six months were McKesson Corporation down 23.2%, Acuity Brands, Inc. down 23.1%, and AZZ Inc. down 15.7%.
As a value-centric and process driven Growth manager, most sector differences as compared to the benchmark are a result of either an under or overweight of specific, bottom-up, attractively valued growth opportunities identified by our process, within that particular sector.
While we have seen interest rates begin to move higher off their historic lows, we expect a low interest rate environment to remain an important component to the investment backdrop. Economic activity, starting from a very low base around the world, should continue to see some modest improvement. While many investors share our view, they have correspondingly been willing to pay an excessive premium for well-known growth stocks. This is where we part company with the crowd, however, as we expect the value discipline embedded in our growth approach will yield better results over full market cycles.
Meritage Value Equity Fund
For the six months ended February 28, 2017, the Meritage Value Equity Fund Institutional Class had a very nice return of 9.41%, but lagged the Russell 1000 Value Index benchmark which returned 11.07% during the same time frame, as well as the Lipper Large Cap Value Index return of 11.51%.
From an attribution standpoint, there were positive sector allocation influences from Real Estate and Telecommunications as well as superior stock selection within the Industrials, Health Care and Energy sectors. These were offset by subpar security selection in the Consumer Staples and Consumer Discretionary sectors.
Regarding individual issues, the strongest gainers for the six months were Southwest Airlines up 57.1%, Prudential Financial up 41.2%, and Voya Financial up 41.1%.
The poorest performers for the six months were Teva Pharmaceutical down 23.1%, World Fuel Services Corporation down 20.9% and Taro Pharmaceutical down 19.8%.
Because we are a value-centric and process driven manager, most sector differences as compared to the benchmark were the result of either an under or overweight of specific bottom-up valuation opportunities identified by our process.
2
MANAGEMENT’S DISCUSSION OF FUND PERFORMANCE – (Unaudited) (continued)
Meritage Yield-Focus Equity Fund
For the six months ended February 28, 2017, the Meritage Yield-Focus Equity Fund Institutional Class and Investors Class returned 6.34% and 6.53%, respectively. We use two benchmarks in assessing the performance of the Yield-Focus Equity Fund. The Russell 3000 Value Index is a long-term general purpose value-centric benchmark without specificity regarding the Fund’s distinct yield-focus style. The Zacks Multi-Asset Income Index has specific asset structure and distinguished dividend yield characteristics similar to the Fund. The Fund’s returns trailed the 11.42% total return for the Russell 3000 Value Index, as well as the Zacks Multi-Asset Income Index, which returned 8.52% during the same time. The Fund’s returns also trailed the Lipper Equity Income Index, which returned 9.20% during the period.
A founding premise of the Yield-Focus Equity Fund is to earn 50 – 75% of the expected long-term equity return in the form of cash dividends and distributions. The fund invests in six key types of equity asset classes – common stocks, master limited partnerships, other limited partnerships, real estate investment trusts, business development companies, convertible preferred stocks and, in rare situations, straight preferred stocks. The Meritage comprehensive security selection process searches globally for attractive yield franchises.
In terms of specific issues, the strongest performers for the period were Boeing Company up 41.5%, Universal Corp. up 26.9%, and Reynolds American up 26.4%.
The poorest performers for the year were GameStop Corp. down 26.2%, Gannett Co. down 24.6% and National Grid PLC ADR down 15.7%.
We use two benchmarks in assessing the performance of the Yield-Focus Equity Fund. The Russell 3000 Value Index is a long-term general purpose value-centric benchmark without specificity regarding the Fund’s distinct yield-focus style. The Zacks Multi-Asset Income Index has specific asset structure and distinguished dividend yield characteristics similar to the Fund.
3
Investment Results – (Unaudited)
Total Returns
For the Periods Ended February 28, 2017 (a)
| | | | | | |
Fund/Index | | Six Months | | 1 Year | | Since Inception
(12/23/13) |
Meritage Growth Equity Fund – Institutional Class | | 10.82% | | 26.25% | | 10.75% |
Meritage Growth Equity Fund – Investor Class | | 10.70% | | 25.99% | | 10.46% |
Russell 1000 Growth Index(b) | | 9.15% | | 22.15% | | 11.17% |
| | | | |
| | | Expense Ratios (c) |
| | | Institutional Class | | Investor Class |
Gross | | 1.63% | | 1.88% |
With Applicable Waivers | | 1.03% | | 1.28% |
The performance quoted represents past performance, which does not guarantee future results. The investment return and principal value of an investment will fluctuate so that an investor’s shares, when redeemed, may be worth more or less than their original cost. The returns shown do not reflect deduction of taxes that a shareholder would pay on Fund distributions or the redemption of Fund shares. The Fund’s investment objectives, risks, charges and expenses must be considered carefully before investing. Current performance of a Fund may be lower or higher than the performance quoted. Performance data current to the most recent month end may be obtained by calling 1-855-261-0104.
The performance in the preceding table reflects any fee reductions during the applicable period. If such fee reductions had not occurred, the quoted performance would be lower.
| (a) | Return figures reflect any change in price per share and assume the reinvestment of all distributions. Total returns for less than one year are not annualized. |
| (b) | The Russell 1000 Growth Index is a widely recognized unmanaged index of equity securities and is representative of a broader domestic equity market and range of securities than is found in the Fund’s portfolio. Individuals cannot invest directly in an Index; however, an individual can invest in exchange traded funds or other investment vehicles that attempt to track the performance of a benchmark index. |
| (c) | The expense ratios are from the Fund’s prospectus dated December 29, 2016. The Adviser has contractually agreed to waive or limit its fees and assume other expenses of the Fund through December 31, 2017, so that total annual fund operating expenses do not exceed 1.00% of the Fund’s average daily net assets. This operating expense limitation does not apply to brokerage fees and commissions, borrowing costs (such as interest and dividend expenses on securities sold short), taxes, 12b-1 fees, extraordinary expenses and indirect expenses (such as “acquired fund fees and expenses”). Additional information pertaining to the Fund’s expense ratios as of February 28, 2017 can be found in the financial highlights. |
The Fund’s investment objective, strategies, risks, charges and expenses must be considered carefully before investing. The prospectus contains this and other important information about the investment company and may be obtained by calling 1-855-261-0104. Please read it carefully before investing.
The Fund is distributed by Unified Financial Securities, LLC, Member FINRA/SIPC.
4
Investment Results – (Unaudited) (continued)
Total Returns
For the Periods Ended February 28, 2017 (a)
| | | | | | |
Fund/Index | | Six Months | | 1 Year | | Since Inception
(12/23/13) |
Meritage Value Equity Fund – Institutional Class | | 9.41% | | 17.13% | | 6.89% |
Russell 1000 Value Index(b) | | 11.07% | | 29.13% | | 10.06% |
| | | | | | |
| | | Expense Ratios (c) | | | |
| | | Institutional Class | | | |
Gross | | 1.71% | | | | |
With Applicable Waivers | | 1.04% | | | | |
The performance quoted represents past performance, which does not guarantee future results. The investment return and principal value of an investment will fluctuate so that an investor’s shares, when redeemed, may be worth more or less than their original cost. The returns shown do not reflect deduction of taxes that a shareholder would pay on Fund distributions or the redemption of Fund shares. The Fund’s investment objectives, risks, charges and expenses must be considered carefully before investing. Current performance of a Fund may be lower or higher than the performance quoted. Performance data current to the most recent month end may be obtained by calling 1-855-261-0104.
The performance in the preceding table reflects any fee reductions during the applicable period. If such fee reductions had not occurred, the quoted performance would be lower.
| (a) | Return figures reflect any change in price per share and assume the reinvestment of all distributions. Total returns for less than one year are not annualized. |
| (b) | The Russell 1000 Value Index is a widely recognized unmanaged index of equity securities and is representative of a broader domestic equity market and range of securities than is found in the Fund’s portfolio. Individuals cannot invest directly in an Index; however, an individual can invest in exchange traded funds or other investment vehicles that attempt to track the performance of a benchmark index. |
| (c) | The expense ratios are from the Fund’s prospectus dated December 29, 2016. The Adviser has contractually agreed to waive or limit its fees and assume other expenses of the Fund through December 31, 2017, so that total annual fund operating expenses do not exceed 1.00% of the Fund’s average daily net assets. This operating expense limitation does not apply to brokerage fees and commissions, borrowing costs (such as interest and dividend expenses on securities sold short), taxes, 12b-1 fees, extraordinary expenses and indirect expenses (such as “acquired fund fees and expenses”). Additional information pertaining to the Fund’s expense ratios as of February 28, 2017 can be found in the financial highlights. |
The Fund’s investment objective, strategies, risks, charges and expenses must be considered carefully before investing. The prospectus contains this and other important information about the investment company and may be obtained by calling 1-855-261-0104. Please read it carefully before investing.
The Fund is distributed by Unified Financial Securities, LLC, Member FINRA/SIPC.
5
Investment Results – (Unaudited) (continued)
Total Returns
For the Periods Ended February 28, 2017 (a)
| | | | | | |
Fund/Index | | Six Months | | 1 Year | | Since Inception
(12/23/13) |
Meritage Yield-Focus Equity Fund – Institutional Class | | 6.34% | | 18.48% | | 4.42% |
Meritage Yield-Focus Equity Fund – Investor Class | | 6.53% | | 18.57% | | 4.25% |
Russell 3000 Value Index(b) | | 11.42% | | 30.02% | | 9.93% |
Zacks Multi-Asset Income Index TR(c) | | 8.52% | | 26.82% | | 0.74% |
| | | | |
| | | Expense Ratios (d) |
| | | Institutional Class | | Investor Class |
Gross | | 1.64% | | 1.89% |
With Applicable Waivers | | 1.15% | | 1.40% |
The performance quoted represents past performance, which does not guarantee future results. The investment return and principal value of an investment will fluctuate so that an investor’s shares, when redeemed, may be worth more or less than their original cost. The returns shown do not reflect deduction of taxes that a shareholder would pay on Fund distributions or the redemption of Fund shares. The Fund’s investment objectives, risks, charges and expenses must be considered carefully before investing. Current performance of a Fund may be lower or higher than the performance quoted. Performance data current to the most recent month end may be obtained by calling 1-855-261-0104.
The performance in the preceding table reflects any fee reductions during the applicable period. If such fee reductions had not occurred, the quoted performance would be lower.
| (a) | Return figures reflect any change in price per share and assume the reinvestment of all distributions. Total returns for less than one year are not annualized. |
| (b) | The Russell 3000 Value Index is a widely recognized unmanaged index of equity securities and is representative of a broader domestic equity market and range of securities than is found in the Fund’s portfolio. Individuals cannot invest directly in an Index; however, an individual can invest in exchange traded funds or other investment vehicles that attempt to track the performance of a benchmark index. |
| (c) | The Zacks Multi-Asset Income Index is comprised of approximately 125 to 150 securities selected, based on investment and other criteria, from a universe of domestic and international companies. The universe of securities within the Index includes U.S. listed common stocks and ADRs paying dividends, real estate investment trusts, MLPs, closed end funds, Canadian royalty trusts and traditional preferred stocks. Individuals cannot invest directly in an Index. |
| (d) | The expense ratios are from the Fund’s prospectus dated December 29, 2016. The Adviser has contractually agreed to waive or limit its fees and assume other expenses of the Fund through December 31, 2017, so that total annual fund operating expenses do not exceed 1.00% of the Fund’s average daily net assets. This operating expense limitation does not apply to brokerage fees and commissions, borrowing costs (such as interest and dividend expenses on securities sold short), taxes, 12b-1 fees, extraordinary expenses and indirect expenses (such as “acquired fund fees and expenses”). Additional information pertaining to the Fund’s expense ratios as of February 28, 2017 can be found in the financial highlights. |
The Fund’s investment objective, strategies, risks, charges and expenses must be considered carefully before investing. The prospectus contains this and other important information about the investment company and may be obtained by calling 1-855-261-0104. Please read it carefully before investing.
The Fund is distributed by Unified Financial Securities, LLC, Member FINRA/SIPC.
6
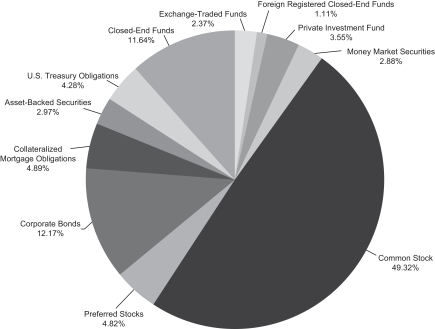
Fund Holdings – (Unaudited)
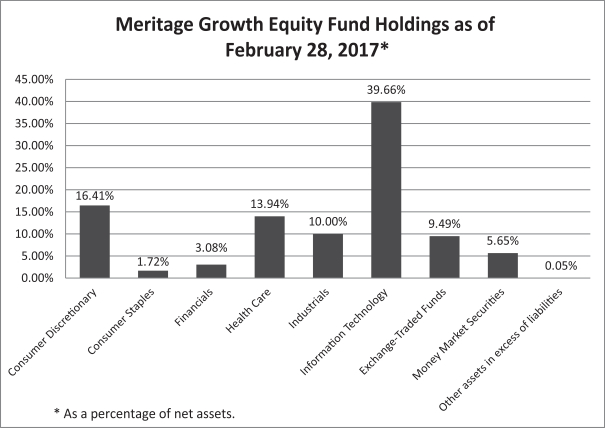
The investment objective of the Meritage Growth Equity Fund is to seek growth of capital.
7
Fund Holdings – (Unaudited) (continued)
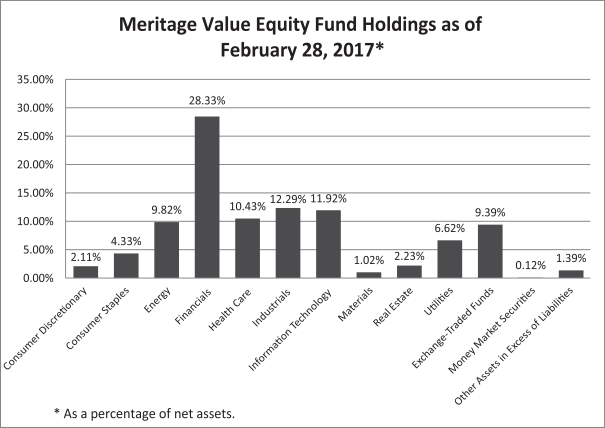
The investment objective of the Meritage Value Equity Fund is to seek growth of capital. Income is a secondary objective.
8
Fund Holdings – (Unaudited) (continued)
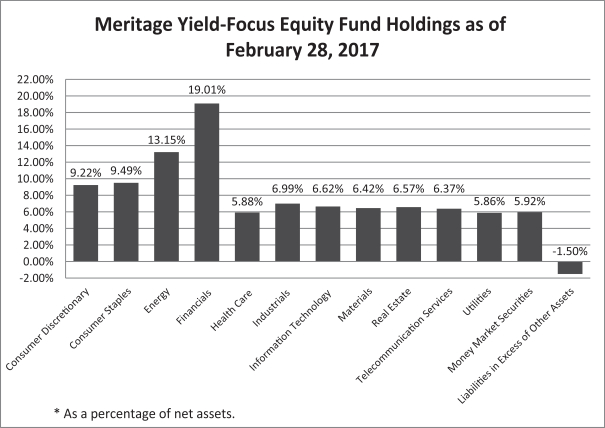
The investment objective of the Meritage Yield-Focus Equity Fund is to seek long-term growth of capital with an emphasis on high current income.
Availability of Portfolio Schedule – (Unaudited)
The Funds will file their complete schedule of portfolio holdings with the Securities and Exchange Commission (“SEC”) for the first and third quarter of each fiscal year on Form N-Q. The Funds’ Forms N-Q will be available at the SEC’s website at www.sec.gov. The Form N-Q may be reviewed and copied at the Public Reference Room in Washington, DC. Information on the operation of the Public Reference Room may be obtained by calling 1-800-SEC-0330.
9
MERITAGE GROWTH EQUITY FUND
SCHEDULE OF INVESTMENTS
February 28, 2017 (Unaudited)
| | | | | | | | |
| Common Stocks – 84.81% | | Shares | | | Fair Value | |
Consumer Discretionary – 16.41% | | | | | | | | |
Amazon.com, Inc. * | | | 961 | | | $ | 812,083 | |
Home Depot, Inc./The | | | 5,595 | | | | 810,772 | |
Omnicom Group, Inc. | | | 4,785 | | | | 407,204 | |
Priceline Group, Inc./The * | | | 390 | | | | 672,411 | |
Thor Industries, Inc. | | | 5,260 | | | | 582,913 | |
| | | | | | | | |
| | | | | | | 3,285,383 | |
| | | | | | | | |
Consumer Staples – 1.72% | |
Colgate-Palmolive Co. | | | 4,730 | | | | 345,195 | |
| | | | | | | | |
Financials – 3.08% | |
Aon PLC | | | 2,320 | | | | 268,308 | |
Everest Re Group Ltd. | | | 1,481 | | | | 348,242 | |
| | | | | | | | |
| | | | | | | 616,550 | |
| | | | | | | | |
Health Care – 13.94% | |
Amgen, Inc. | | | 2,261 | | | | 399,134 | |
Danaher Corp. | | | 4,572 | | | | 391,135 | |
Intuitive Surgical, Inc. * | | | 331 | | | | 243,947 | |
Johnson & Johnson | | | 5,205 | | | | 636,103 | |
Masimo Corp. * | | | 2,715 | | | | 245,327 | |
Mettler-Toledo International, Inc. * | | | 661 | | | | 314,781 | |
Teleflex, Inc. | | | 1,507 | | | | 288,108 | |
United Therapeutics Corp. * | | | 1,855 | | | | 274,021 | |
| | | | | | | | |
| | | | | | | 2,792,556 | |
| | | | | | | | |
Industrials – 10.00% | |
Acuity Brands, Inc. | | | 1,957 | | | | 413,514 | |
AMETEK, Inc. | | | 4,795 | | | | 258,786 | |
Deluxe Corp. | | | 5,790 | | | | 426,086 | |
Gibraltar Industries, Inc. * | | | 9,580 | | | | 397,091 | |
Snap-on, Inc. | | | 1,235 | | | | 209,543 | |
Trex Company, Inc. * | | | 4,375 | | | | 297,544 | |
| | | | | | | | |
| | | | | | | 2,002,564 | |
| | | | | | | | |
Information Technology – 39.66% | |
Alphabet, Inc., Class A * | | | 1,045 | | | | 882,952 | |
Apple, Inc. | | | 8,209 | | | | 1,124,551 | |
Applied Materials, Inc. | | | 7,790 | | | | 282,154 | |
Cisco Systems, Inc. | | | 13,770 | | | | 470,659 | |
Citrix Systems, Inc. * | | | 2,805 | | | | 221,455 | |
Coherent, Inc. * | | | 3,495 | | | | 638,117 | |
Fiserv, Inc. * | | | 4,105 | | | | 473,717 | |
Flex Ltd. * | | | 16,555 | | | | 272,992 | |
II-VI, Inc. * | | | 7,475 | | | | 266,110 | |
See accompanying notes which are an integral part of these financial statements.
10
MERITAGE GROWTH EQUITY FUND
SCHEDULE OF INVESTMENTS – (continued)
February 28, 2017 (Unaudited)
| | | | | | | | |
| Common Stocks – 84.81% – continued | | Shares | | | Fair Value | |
Information Technology – 39.66% – continued | |
Lam Research Corp. | | | 4,010 | | | $ | 475,345 | |
LogMeIn, Inc. | | | – | (a) | | | 25 | |
MasterCard, Inc., Class A | | | 4,740 | | | | 523,580 | |
MaxLinear, Inc., Class A * | | | 12,195 | | | | 317,558 | |
Microsoft Corp. | | | 12,965 | | | | 829,501 | |
NICE-Systems Ltd. ADR | | | 5,285 | | | | 360,701 | |
NVIDIA Corp. | | | 5,700 | | | | 578,436 | |
Xperi Corp. | | | 6,260 | | | | 224,421 | |
| | | | | | | | |
| | | | | | | 7,942,274 | |
| | | | | | | | |
TOTAL COMMON STOCKS (Cost $13,235,871) | | | | | | | 16,984,522 | |
| | | | | | | | |
Exchange-Traded Funds – 9.49% | |
Consumer Staples Select Sector SPDR Fund | | | 12,835 | | | | 707,209 | |
Financial Select Sector SPDR Fund | | | 12,065 | | | | 296,075 | |
iShares Nasdaq Biotechnology ETF | | | 1,596 | | | | 474,379 | |
iShares Russell 1000 Growth ETF | | | 1,230 | | | | 138,707 | |
iShares US Regional Banks ETF | | | 6,000 | | | | 285,060 | |
| | | | | | | | |
TOTAL EXCHANGE-TRADED FUNDS (Cost $1,761,632) | | | | | | | 1,901,430 | |
| | | | | | | | |
Money Market Securities – 5.65% | |
Morgan Stanley Institutional Liquidity Funds Treasury Securities Portfolio, Institutional Class, 0.40% (b) | | | 1,130,643 | | | | 1,130,643 | |
| | | | | | | | |
TOTAL MONEY MARKET SECURITIES (Cost $1,130,643) | | | | | | | 1,130,643 | |
| | | | | | | | |
TOTAL INVESTMENTS – 99.95% (Cost $16,128,146) | | | | | | | 20,016,595 | |
| | | | | | | | |
Other Assets in Excess of Liabilities – 0.05% | | | | | | | 10,769 | |
| | | | | | | | |
NET ASSETS – 100.00% | | | | | | $ | 20,027,364 | |
| | | | | | | | |
| | (a) | Rounds to less than 1 share. |
| | (b) | Rate disclosed is the seven day effective yield as of February 28, 2017. |
| | * | Non-income producing security. |
ADR – American Depositary Receipt
The sectors shown on the schedule of investments are based on Global Industry Classification Standard, or GICS® (“GICS”). The GICS was developed by and/or is the exclusive property of MSCI, Inc. and Standard & Poor Financial Services LLC (“S&P”). GICS is a service mark of MSCI, Inc. and S&P and has been licensed for use by Ultimus Asset Services, LLC.
See accompanying notes which are an integral part of these financial statements.
11
MERITAGE VALUE EQUITY FUND
SCHEDULE OF INVESTMENTS
February 28, 2017 (Unaudited)
| | | | | | | | |
| Common Stocks – 89.10% | | Shares | | | Fair Value | |
Consumer Discretionary – 2.11% | |
Big Lots, Inc. | | | 3,060 | | | $ | 157,100 | |
DeVry Education Group, Inc. | | | 4,795 | | | | 154,159 | |
| | | | | | | | |
| | | | | | | 311,259 | |
| | | | | | | | |
Consumer Staples – 4.33% | |
CVS Health Corp. | | | 1,990 | | | | 160,354 | |
Ingredion, Inc. | | | 1,650 | | | | 199,469 | |
Pilgrim’s Pride Corp. | | | 13,665 | | | | 278,493 | |
| | | | | | | | |
| | | | | | | 638,316 | |
| | | | | | | | |
Energy – 9.82% | |
Chevron Corp. | | | 5,090 | | | | 572,625 | |
Royal Dutch Shell PLC ADR | | | 10,965 | | | | 568,974 | |
World Fuel Services Corp. | | | 8,485 | | | | 306,902 | |
| | | | | | | | |
| | | | | | | 1,448,501 | |
| | | | | | | | |
Financials – 28.33% | |
Aspen Insurance Holdings Ltd. | | | 6,080 | | | | 340,784 | |
Berkshire Hathaway, Inc., Class B * | | | 2,429 | | | | 416,379 | |
Citigroup, Inc. | | | 5,320 | | | | 318,189 | |
Fidelity & Guaranty Life | | | 6,105 | | | | 162,393 | |
Goldman Sachs Group, Inc./The | | | 1,107 | | | | 274,602 | |
Horace Mann Educators Corp. | | | 7,470 | | | | 312,993 | |
Prudential Financial, Inc. | | | 3,670 | | | | 405,682 | |
Reinsurance Group of America, Inc. | | | 3,450 | | | | 448,707 | |
State Street Corp. | | | 4,955 | | | | 394,963 | |
Torchmark Corp. | | | 4,902 | | | | 380,052 | |
Unum Group | | | 6,270 | | | | 306,164 | |
Voya Financial, Inc. | | | 10,090 | | | | 416,011 | |
| | | | | | | | |
| | | | | | | 4,176,919 | |
| | | | | | | | |
Health Care – 10.43% | |
Aetna, Inc. | | | 2,580 | | | | 332,201 | |
Biogen, Inc. * | | | 926 | | | | 267,244 | |
Cigna Corp. | | | 1,975 | | | | 294,077 | |
ICON PLC * | | | 3,560 | | | | 298,221 | |
UnitedHealth Group, Inc. | | | 2,095 | | | | 346,471 | |
| | | | | | | | |
| | | | | | | 1,538,214 | |
| | | | | | | | |
Industrials – 12.29% | |
Chicago Bridge & Iron Co. N.V. | | | 4,270 | | | | 143,344 | |
EnerSys | | | 3,930 | | | | 301,549 | |
Raytheon Co. | | | 2,080 | | | | 320,632 | |
Regal-Beloit Corp. | | | 4,120 | | | | 306,734 | |
See accompanying notes which are an integral part of these financial statements.
12
MERITAGE VALUE EQUITY FUND
SCHEDULE OF INVESTMENTS – (continued)
February 28, 2017 (Unaudited)
| | | | | | | | |
| Common Stocks – 89.10% – continued | | Shares | | | Fair Value | |
Industrials – 12.29% – continued | |
Southwest Airlines Co. | | | 6,430 | | | $ | 371,654 | |
Spirit AeroSystems Holdings, Inc. | | | 5,970 | | | | 367,812 | |
| | | | | | | | |
| | | | | | | 1,811,725 | |
| | | | | | | | |
Information Technology – 11.92% | |
Check Point Software Technologies Ltd. * | | | 3,230 | | | | 319,479 | |
Juniper Networks, Inc. | | | 6,015 | | | | 168,420 | |
MAXIMUS, Inc. | | | 2,665 | | | | 159,021 | |
Skyworks Solutions, Inc. | | | 1,985 | | | | 188,198 | |
Synopsys, Inc. * | | | 3,625 | | | | 258,970 | |
Teradyne, Inc. | | | 7,100 | | | | 201,924 | |
Vishay Intertechnology, Inc. | | | 9,540 | | | | 151,209 | |
WNS Holdings Ltd. ADR * | | | 10,965 | | | | 309,761 | |
| | | | | | | | |
| | | | | | | 1,756,982 | |
| | | | | | | | |
Materials – 1.02% | |
Innospec, Inc. | | | 2,300 | | | | 150,190 | |
| | | | | | | | |
Real Estate – 2.23% | |
Welltower, Inc. | | | 4,665 | | | | 328,323 | |
| | | | | | | | |
Utilities – 6.62% | |
Ameren Corp. | | | 6,595 | | | | 360,681 | |
Entergy Corp. | | | 4,875 | | | | 373,717 | |
Exelon Corp. | | | 6,565 | | | | 241,001 | |
| | | | | | | | |
| | | | | | | 975,399 | |
| | | | | | | | |
TOTAL COMMON STOCKS (Cost $10,757,745) | | | | | | | 13,135,828 | |
| | | | | | | | |
Exchange-Traded Funds – 9.39% | |
Materials Select Sector SPDR Fund | | | 5,270 | | | | 275,357 | |
SPDR S&P Oil & Gas Equipment & Services ETF | | | 12,450 | | | | 266,555 | |
SPDR S&P Regional Banking ETF | | | 5,480 | | | | 314,881 | |
Vanguard REIT ETF | | | 3,290 | | | | 280,505 | |
Vanguard Telecommunication Services ETF | | | 2,525 | | | | 246,794 | |
| | | | | | | | |
TOTAL EXCHANGE-TRADED FUNDS (Cost $1,323,928) | | | | | | | 1,384,092 | |
| | | | | | | | |
Money Market Securities – 0.12% | |
Morgan Stanley Institutional Liquidity Funds Treasury Securities Portfolio, Institutional Class, 0.40% (a) | | | 17,596 | | | | 17,596 | |
| | | | | | | | |
TOTAL MONEY MARKET SECURITIES (Cost $17,596) | | | | | | | 17,596 | |
| | | | | | | | |
TOTAL INVESTMENTS – 98.61% (Cost $12,099,269) | | | | | | | 14,537,516 | |
| | | | | | | | |
Other Assets in Excess of Liabilities – 1.39% | | | | | | | 205,313 | |
| | | | | | | | |
NET ASSETS – 100.00% | | | | | | $ | 14,742,829 | |
| | | | | | | | |
See accompanying notes which are an integral part of these financial statements.
13
MERITAGE VALUE EQUITY FUND
SCHEDULE OF INVESTMENTS – (continued)
February 28, 2017 (Unaudited)
| | (a) | Rate disclosed is the seven day effective yield as of February 28, 2017. |
| | * | Non-income producing security. |
ADR — American Depositary Receipt
The sectors shown on the schedule of investments are based on Global Industry Classification Standard, or GICS® (“GICS”). The GICS was developed by and/or is the exclusive property of MSCI, Inc. and Standard & Poor Financial Services LLC (“S&P”). GICS is a service mark of MSCI, Inc. and S&P and has been licensed for use by Ultimus Asset Services, LLC.
See accompanying notes which are an integral part of these financial statements.
14
MERITAGE YIELD-FOCUS EQUITY FUND
SCHEDULE OF INVESTMENTS
February 28, 2017 (Unaudited)
| | | | | | | | |
| Common Stocks – 89.87% | | Shares | | | Fair Value | |
Consumer Discretionary – 9.22% | |
GameStop Corp., Class A | | | 11,390 | | | $ | 278,372 | |
Gannett Co., Inc. | | | 59,515 | | | | 518,971 | |
Garmin Ltd. | | | 12,320 | | | | 635,835 | |
Kohl’s Corp. | | | 11,055 | | | | 471,164 | |
Staples, Inc. | | | 45,955 | | | | 413,135 | |
Target Corp. | | | 4,185 | | | | 245,952 | |
| | | | | | | | |
| | | | | | | 2,563,429 | |
| | | | | | | | |
Consumer Staples – 9.49% | |
Altria Group, Inc. | | | 10,200 | | | | 764,184 | |
Philip Morris International, Inc. | | | 6,070 | | | | 663,754 | |
Reynolds American, Inc. | | | 9,477 | | | | 583,499 | |
Unilever PLC ADR | | | 13,215 | | | | 627,448 | |
| | | | | | | | |
| | | | | | | 2,638,885 | |
| | | | | | | | |
Energy – 13.15% | |
BP PLC ADR | | | 16,640 | | | | 564,429 | |
Enterprise Products Partners LP (a) | | | 19,580 | | | | 548,827 | |
Occidental Petroleum Corp. | | | 7,655 | | | | 501,785 | |
Phillips 66 Partners LP (a) | | | 5,400 | | | | 300,402 | |
Repsol SA ADR | | | 46,790 | | | | 692,258 | |
Total SA ADR | | | 10,055 | | | | 502,448 | |
Valero Energy Corp. | | | 8,040 | | | | 546,318 | |
| | | | | | | | |
| | | | | | | 3,656,467 | |
| | | | | | | | |
Financials – 19.01% | |
AllianceBernstein Holding LP (a) | | | 21,480 | | | | 509,076 | |
Ares Capital Corp. (b) | | | 27,175 | | | | 482,356 | |
Banco Latinoamericano de Comercio Exterior SA, Class E | | | 14,455 | | | | 406,619 | |
Bank of Montreal | | | 5,885 | | | | 445,083 | |
Federated Investors, Inc., Class B | | | 20,215 | | | | 549,242 | |
Invesco Ltd. | | | 18,910 | | | | 608,713 | |
Lazard Ltd., Class A (a) | | | 9,760 | | | | 420,266 | |
Maiden Holdings Ltd. | | | 30,245 | | | | 467,285 | |
Old Republic International Corp. | | | 26,390 | | | | 546,537 | |
Power Financial Corp. | | | 15,715 | | | | 410,932 | |
Solar Capital Ltd. (b) | | | 19,850 | | | | 442,059 | |
| | | | | | | | |
| | | | | | | 5,288,168 | |
| | | | | | | | |
Health Care – 3.85% | |
Merck & Co., Inc. | | | 8,710 | | | | 573,728 | |
Pfizer, Inc. | | | 14,595 | | | | 497,981 | |
| | | | | | | | |
| | | | | | | 1,071,709 | |
| | | | | | | | |
See accompanying notes which are an integral part of these financial statements.
15
MERITAGE YIELD-FOCUS EQUITY FUND
SCHEDULE OF INVESTMENTS – (continued)
February 28, 2017 (Unaudited)
| | | | | | | | |
| Common Stocks – 89.87% – continued | | Shares | | | Fair Value | |
Industrials – 5.31% | |
Boeing Co./The | | | 3,055 | | | $ | 550,603 | |
Eaton Corp. PLC | | | 6,510 | | | | 468,590 | |
Lockheed Martin Corp. | | | 1,715 | | | | 457,185 | |
| | | | | | | | |
| | | | | | | 1,476,378 | |
| | | | | | | | |
Information Technology – 6.62% | |
HP, Inc. | | | 38,445 | | | | 667,790 | |
International Business Machines Corp. | | | 3,203 | | | | 575,963 | |
QUALCOMM, Inc. | | | 5,770 | | | | 325,890 | |
Western Union Co./The | | | 13,830 | | | | 271,621 | |
| | | | | | | | |
| | | | | | | 1,841,264 | |
| | | | | | | | |
Materials – 6.42% | |
Domtar Corp. | | | 14,150 | | | | 538,973 | |
Lyondellbasell Industries NV, Class A | | | 7,670 | | | | 699,811 | |
Rio Tinto PLC ADR | | | 13,170 | | | | 546,818 | |
| | | | | | | | |
| | | | | | | 1,785,602 | |
| | | | | | | | |
Real Estate – 6.57% | |
Brandywine Realty Trust | | | 16,825 | | | | 280,305 | |
Medical Properties Trust, Inc. | | | 36,015 | | | | 483,321 | |
Omega Healthcare Investors, Inc. | | | 14,570 | | | | 475,565 | |
VEREIT, Inc. | | | 64,990 | | | | 589,459 | |
| | | | | | | | |
| | | | | | | 1,828,650 | |
| | | | | | | | |
Telecommunication Services – 6.37% | |
AT&T, Inc. | | | 12,845 | | | | 536,793 | |
CenturyLink, Inc. | | | 22,780 | | | | 552,643 | |
Verizon Communications, Inc. | | | 13,772 | | | | 683,504 | |
| | | | | | | | |
| | | | | | | 1,772,940 | |
| | | | | | | | |
Utilities – 3.86% | |
Entergy Corp. | | | 7,445 | | | | 570,734 | |
Public Service Enterprise Group, Inc. | | | 10,945 | | | | 503,251 | |
| | | | | | | | |
| | | | | | | 1,073,985 | |
| | | | | | | | |
TOTAL COMMON STOCKS (Cost $21,626,309) | | | | | | | 24,997,477 | |
| | | | | | | | |
Convertible Preferred Stocks – 5.71% | | | | | | | | |
Health Care – 2.03% | |
Anthem, Inc., 5.25% | | | 11,245 | | | | 564,049 | |
| | | | | | | | |
Industrials – 1.68% | |
Stericycle, Inc., 5.25% | | | 6,620 | | | | 468,696 | |
| | | | | | | | |
See accompanying notes which are an integral part of these financial statements.
16
MERITAGE YIELD-FOCUS EQUITY FUND
SCHEDULE OF INVESTMENTS – (continued)
February 28, 2017 (Unaudited)
| | | | | | | | |
| Convertible Preferred Stocks – 5.71% – continued | | Shares | | | Fair Value | |
Utilities – 2.00% | |
Exelon Corp., 6.50% | | | 11,210 | | | $ | 555,792 | |
| | | | | | | | |
TOTAL CONVERTIBLE PREFERRED STOCKS (Cost $1,435,729) | | | | | | | 1,588,537 | |
| | | | | | | | |
Money Market Securities – 5.92% | |
Morgan Stanley Institutional Liquidity Funds Treasury Securities Portfolio, Institutional Class, 0.40% (c) | | | 1,646,378 | | | | 1,646,378 | |
| | | | | | | | |
TOTAL MONEY MARKET SECURITIES (Cost $1,646,378) | | | | | | | 1,646,378 | |
| | | | | | | | |
TOTAL INVESTMENTS – 101.50% (Cost $24,708,416) | | | | | | | 28,232,392 | |
| | | | | | | | |
Liabilities in Excess of Other Assets – (1.50)% | | | | | | | (416,138 | ) |
| | | | | | | | |
NET ASSETS – 100.00% | | | | | | $ | 27,816,254 | |
| | | | | | | | |
| | (a) | Master Limited Partnership |
| | (b) | Business Development Company |
| | (c) | Rate disclosed is the seven day effective yield as of February 28, 2017. |
ADR – American Depositary Receipt
The sectors shown on the schedule of investments are based on Global Industry Classification Standard, or GICS® (“GICS”). The GICS was developed by and/or is the exclusive property of MSCI, Inc. and Standard & Poor Financial Services LLC (“S&P”). GICS is a service mark of MSCI, Inc. and S&P and has been licensed for use by Ultimus Asset Services, LLC.
See accompanying notes which are an integral part of these financial statements.
17
MERITAGE FUNDS
STATEMENTS OF ASSETS AND LIABILITIES
February 28, 2017 (Unaudited)
| | | | | | | | | | | | |
| | | Meritage Growth
Equity Fund | | | Meritage Value
Equity Fund | | | Meritage Yield-
Focus Equity Fund | |
Assets | | | | | | | | | | | | |
Investments in securities at value (cost $16,128,146, $12,099,269 and $24,708,416) | | $ | 20,016,595 | | | $ | 14,537,516 | | | $ | 28,232,392 | |
Foreign currencies, at value (Cost $-, $- and $4,765) | | | – | | | | – | | | | 4,765 | |
Receivable for fund shares sold | | | – | | | | – | | | | 4,431 | |
Receivable for investments sold | | | – | | | | 274,128 | | | | 273,922 | |
Dividends receivable | | | 16,132 | | | | 30,952 | | | | 124,984 | |
Tax reclaims receivable | | | 926 | | | | – | | | | 9,360 | |
Prepaid expenses | | | 13,355 | | | | 12,425 | | | | 29,795 | |
| | | | | | | | | | | | |
Total Assets | | | 20,047,008 | | | | 14,855,021 | | | | 28,679,649 | |
| | | | | | | | | | | | |
| | | |
Liabilities | | | | | | | | | | | | |
Payable for fund shares redeemed | | | – | | | | – | | | | 5,500 | |
Payable for investments purchased | | | – | | | | 97,088 | | | | 812,372 | |
Payable to Adviser | | | 4,466 | | | | 2,605 | | | | 6,615 | |
Accrued 12b-1 fees – Investor class | | | 47 | | | | – | | | | 3,632 | |
Payable to administrator, fund accountant, and transfer agent | | | 4,955 | | | | 4,123 | | | | 10,724 | |
Payable to custodian | | | 640 | | | | 72 | | | | – | |
Other accrued expenses | | | 9,536 | | | | 8,304 | | | | 24,552 | |
| | | | | | | | | | | | |
Total Liabilities | | | 19,644 | | | | 112,192 | | | | 863,395 | |
| | | | | | | | | | | | |
| | | |
Net Assets | | $ | 20,027,364 | | | $ | 14,742,829 | | | $ | 27,816,254 | |
| | | | | | | | | | | | |
| | | |
Net Assets consist of: | | | | | | | | | | | | |
Paid-in capital | | $ | 15,952,691 | | | $ | 12,813,117 | | | $ | 29,391,072 | |
Accumulated undistributed net investment income | | | 1,088 | | | | 53,021 | | | | 204,428 | |
Accumulated undistributed net realized gain (loss) from investment transactions | | | 185,136 | | | | (561,556 | ) | | | (5,303,222 | ) |
Net unrealized appreciation on investments | | | 3,888,449 | | | | 2,438,247 | | | | 3,523,976 | |
| | | | | | | | | | | | |
| | | |
Net Assets | | $ | 20,027,364 | | | $ | 14,742,829 | | | $ | 27,816,254 | |
| | | | | | | | | | | | |
| | | |
Net Assets: Institutional Class | | $ | 19,894,459 | | | $ | 14,742,829 | | | $ | 27,261,829 | |
| | | | | | | | | | | | |
Shares outstanding
(unlimited number of shares authorized, no par value) | | | 1,500,027 | | | | 1,227,768 | | | | 2,599,885 | |
| | | | | | | | | | | | |
Net asset value, offering and redemption price per share | | $ | 13.26 | | | $ | 12.01 | | | $ | 10.49 | |
| | | | | | | | | | | | |
| | | |
Net Assets: Investor Class | | $ | 132,905 | | | | | | | $ | 554,425 | |
| | | | | | | | | | | | |
Shares outstanding
(unlimited number of shares authorized, no par value) | | | 10,076 | | | | | | | | 52,797 | |
| | | | | | | | | | | | |
Net asset value, offering and redemption price per share | | $ | 13.19 | | | | | | | $ | 10.50 | |
| | | | | | | | | | | | |
See accompanying notes which are an integral part of these financial statements.
18
MERITAGE FUNDS
STATEMENTS OF OPERATIONS
For the six months ended February 28, 2017 (Unaudited)
| | | | | | | | | | | | |
| | | Meritage Growth
Equity Fund | | | Meritage Value
Equity Fund | | | Meritage Yield-
Focus Equity Fund | |
Investment Income | | | | | | | | | | | | |
Dividend income
(net of foreign taxes withheld of $306, $2,937 and $8,465) | | $ | 96,918 | | | $ | 120,277 | | | $ | 871,171 | |
| | | | | | | | | | | | |
Total investment income | | | 96,918 | | | | 120,277 | | | | 871,171 | |
| | | | | | | | | | | | |
| | | |
Expenses | | | | | | | | | | | | |
Investment Adviser | | | 67,398 | | | | 50,311 | | | | 141,604 | |
Administration | | | 14,112 | | | | 10,594 | | | | 30,932 | |
Fund accounting | | | 9,434 | | | | 7,022 | | | | 20,736 | |
Audit | | | 10,232 | | | | 10,232 | | | | 10,232 | |
Registration | | | 7,538 | | | | 5,499 | | | | 17,108 | |
Transfer agent | | | 7,575 | | | | 5,644 | | | | 16,800 | |
Other | | | 5,885 | | | | 5,405 | | | | 10,742 | |
Legal | | | 4,359 | | | | 3,253 | | | | 9,496 | |
12b-1 – Investor class | | | 185 | | | | 11 | (a) | | | 12,569 | |
Report printing | | | 2,744 | | | | 1,750 | | | | 5,735 | |
Insurance | | | 3,297 | | | | 3,174 | | | | 3,597 | |
Custodian | | | 2,101 | | | | 1,831 | | | | 2,464 | |
Trustee | | | 1,971 | | | | 1,970 | | | | 1,970 | |
Pricing | | | 1,132 | | | | 1,119 | | | | 1,294 | |
| | | | | | | | | | | | |
Total expenses | | | 137,963 | | | | 107,815 | | | | 285,279 | |
Fees waived by Adviser | | | (47,703 | ) | | | (40,559 | ) | | | (83,468 | ) |
| | | | | | | | | | | | |
Net operating expenses | | | 90,260 | | | | 67,256 | | | | 201,811 | |
| | | | | | | | | | | | |
Net investment income | | | 6,658 | | | | 53,021 | | | | 669,360 | |
| | | | | | | | | | | | |
| |
Net Realized and Unrealized Gain (Loss) on Investments | | | | | |
Net realized gain on investment securities transactions | | | 449,426 | | | | 74,437 | | | | 1,374,693 | |
Net realized loss on foreign currency transactions | | | – | | | | – | | | | (161 | ) |
Net change in unrealized appreciation of investment securities | | | 1,442,338 | | | | 1,067,774 | | | | 215,717 | |
| | | | | | | | | | | | |
Net realized and unrealized gain on investments | | | 1,891,764 | | | | 1,142,211 | | | | 1,590,249 | |
| | | | | | | | | | | | |
Net increase in net assets resulting from operations | | $ | 1,898,422 | | | $ | 1,195,232 | | | $ | 2,259,609 | |
| | | | | | | | | | | | |
| (a) | Meritage Value Equity Fund – Investor Class liquidated on February 3, 2017. |
See accompanying notes which are an integral part of these financial statements.
19
MERITAGE GROWTH EQUITY FUND
STATEMENTS OF CHANGES IN NET ASSETS
| | | | | | | | |
| | | For the Six
Months Ended
February 28, 2017
(Unaudited) | | | For the
Year Ended
August 31, 2016 | |
Increase (Decrease) in Net Assets due to: | | | | | | | | |
Operations | | | | | | | | |
Net investment income | | $ | 6,658 | | | $ | 37,576 | |
Net realized gain (loss) on investment securities transactions | | | 449,426 | | | | (76,545 | ) |
Net change in unrealized appreciation of investment securities | | | 1,442,338 | | | | 1,687,088 | |
| | | | | | | | |
Net increase in net assets resulting from operations | | | 1,898,422 | | | | 1,648,119 | |
| | | | | | | | |
| | |
Distributions | | | | | | | | |
From net investment income – Institutional Class | | | (44,491 | ) | | | (8,254 | ) |
From net realized gains – Institutional Class | | | (171,541 | ) | | | (306,530 | ) |
From net realized gains – Investor Class | | | (1,047 | ) | | | (3,439 | ) |
| | | | | | | | |
Total distributions | | | (217,079 | ) | | | (318,223 | ) |
| | | | | | | | |
| | |
Capital Transactions – Institutional Class | | | | | | | | |
Proceeds from shares sold | | | 1,814,571 | | | | 3,937,403 | |
Reinvestment of distributions | | | 208,934 | | | | 306,740 | |
Amount paid for shares redeemed | | | (1,279,317 | ) | | | (1,405,523 | ) |
| | | | | | | | |
Total Institutional Class | | | 744,188 | | | | 2,838,620 | |
| | | | | | | | |
| | |
Capital Transactions – Investor Class | | | | | | | | |
Proceeds from shares sold | | | 29,490 | | | | 209,178 | |
Reinvestment of distributions | | | 1,047 | | | | 2,111 | |
Amount paid for shares redeemed | | | (274,854 | ) | | | (29,277 | ) |
| | | | | | | | |
Total Investor Class | | | (244,317 | ) | | | 182,012 | |
| | | | | | | | |
Net increase in net assets resulting from capital transactions | | | 499,871 | | | | 3,020,632 | |
| | | | | | | | |
Total Increase in Net Assets | | | 2,181,214 | | | | 4,350,528 | |
| | | | | | | | |
| | |
Net Assets | | | | | | | | |
Beginning of period | | | 17,846,150 | | | | 13,495,622 | |
| | | | | | | | |
End of period | | $ | 20,027,364 | | | $ | 17,846,150 | |
| | | | | | | | |
Accumulated undistributed net investment income included in net assets at end of period | | $ | 1,088 | | | $ | 38,921 | |
| | | | | | | | |
| | |
Share Transactions – Institutional Class | | | | | | | | |
Shares sold | | | 144,134 | | | | 347,376 | |
Shares issued in reinvestment of distributions | | | 16,822 | | | | 27,169 | |
Shares redeemed | | | (104,467 | ) | | | (121,465 | ) |
| | | | | | | | |
Total Institutional Class | | | 56,489 | | | | 253,080 | |
| | | | | | | | |
| | |
Share Transactions – Investor Class | | | | | | | | |
Shares sold | | | 2,265 | | | | 18,178 | |
Shares issued in reinvestment of distributions | | | 85 | | | | 188 | |
Shares redeemed | | | (22,776 | ) | | | (2,612 | ) |
| | | | | | | | |
Total Investor Class | | | (20,426 | ) | | | 15,754 | |
| | | | | | | | |
Net increase in shares outstanding | | | 36,063 | | | | 268,834 | |
| | | | | | | | |
See accompanying notes which are an integral part of these financial statements.
20
MERITAGE VALUE EQUITY FUND
STATEMENTS OF CHANGES IN NET ASSETS
| | | | | | | | |
| | | For the Six
Months Ended
February 28, 2017
(Unaudited) | | | For the
Year Ended
August 31, 2016 | |
Increase (Decrease) in Net Assets due to: | | | | | | | | |
Operations | | | | | | | | |
Net investment income | | $ | 53,021 | | | $ | 117,793 | |
Net realized gain (loss) on investment securities transactions | | | 74,437 | | | | (615,738 | ) |
Net change in unrealized appreciation of investment securities | | | 1,067,774 | | | | 784,958 | |
| | | | | | | | |
Net increase in net assets resulting from operations | | | 1,195,232 | | | | 287,013 | |
| | | | | | | | |
| | |
Distributions | | | | | | | | |
From net investment income – Institutional Class | | | (115,272 | ) | | | (105,233 | ) |
From net investment income – Investor Class | | | (67 | )(a) | | | (66 | ) |
From net realized gains – Institutional Class | | | – | | | | (50,500 | ) |
From net realized gains – Investor Class | | | – | | | | (39 | ) |
| | | | | | | | |
Total distributions | | | (115,339 | ) | | | (155,838 | ) |
| | | | | | | | |
| | |
Capital Transactions – Institutional Class | | | | | | | | |
Proceeds from shares sold | | | 1,788,063 | | | | 3,408,257 | |
Reinvestment of distributions | | | 113,051 | | | | 153,110 | |
Amount paid for shares redeemed | | | (2,091,596 | ) | | | (1,159,673 | ) |
| | | | | | | | |
Total Institutional Class | | | (190,482 | ) | | | 2,401,694 | |
| | | | | | | | |
| | |
Capital Transactions – Investor Class | | | | | | | | |
Reinvestment of distributions | | | 67 | (a) | | | 105 | |
Amount paid for shares redeemed | | | (11,012 | )(a) | | | – | |
| | | | | | | | |
Total Investor Class | | | (10,945 | ) | | | 105 | |
| | | | | | | | |
Net increase (decrease) in net assets resulting from capital transactions | | | (201,427 | ) | | | 2,401,799 | |
| | | | | | | | |
Total Increase in Net Assets | | | 878,466 | | | | 2,532,974 | |
| | | | | | | | |
| | |
Net Assets | | | | | | | | |
Beginning of period | | | 13,864,363 | | | | 11,331,389 | |
| | | | | | | | |
End of period | | $ | 14,742,829 | | | $ | 13,864,363 | |
| | | | | | | | |
Accumulated undistributed net investment income included in net assets at end of period | | $ | 53,021 | | | $ | 115,339 | |
| | | | | | | | |
| | |
Share Transactions – Institutional Class | | | | | | | | |
Shares sold | | | 153,443 | | | | 313,214 | |
Shares issued in reinvestment of distributions | | | 9,729 | | | | 14,164 | |
Shares redeemed | | | (187,396 | ) | | | (104,992 | ) |
| | | | | | | | |
Total Institutional Class | | | (24,224 | ) | | | 222,386 | |
| | | | | | | | |
| | |
Share Transactions – Investor Class | | | | | | | | |
Shares issued in reinvestment of distributions | | | 6 | (a) | | | 10 | |
Shares redeemed | | | (946 | )(a) | | | – | |
| | | | | | | | |
Total Investor Class | | | (940 | ) | | | 10 | |
| | | | | | | | |
Net increase (decrease) in shares outstanding | | | (25,164 | ) | | | 222,396 | |
| | | | | | | | |
| (a) | Meritage Value Equity Fund – Investor Class liquidated on February 3, 2017. |
See accompanying notes which are an integral part of these financial statements.
21
MERITAGE YIELD-FOCUS EQUITY FUND
STATEMENTS OF CHANGES IN NET ASSETS
| | | | | | | | |
| | | For the Six
Months Ended
February 28, 2017
(Unaudited) | | | For the
Year Ended
August 31, 2016 | |
Increase (Decrease) in Net Assets due to: | | | | | | | | |
Operations | | | | | | | | |
Net investment income | | $ | 669,360 | | | $ | 1,268,575 | |
Net realized gain (loss) on investment securities transactions | | | 1,374,532 | | | | (4,040,548 | ) |
Net change in unrealized appreciation of investment securities | | | 215,717 | | | | 6,318,403 | |
| | | | | | | | |
Net increase in net assets resulting from operations | | | 2,259,609 | | | | 3,546,430 | |
| | | | | | | | |
| | |
Distributions | | | | | | | | |
From net investment income – Institutional Class | | | (378,133 | ) | | | (982,202 | ) |
From net investment income – Investor Class | | | (135,357 | ) | | | (267,892 | ) |
| | | | | | | | |
Total distributions | | | (513,490 | ) | | | (1,250,094 | ) |
| | | | | | | | |
| | |
Capital Transactions – Institutional Class | | | | | | | | |
Proceeds from shares sold | | | 1,603,926 | | | | 11,584,316 | |
Reinvestment of distributions | | | 352,452 | | | | 949,085 | |
Amount paid for shares redeemed | | | (5,302,509 | ) | | | (13,279,431 | ) |
| | | | | | | | |
Total Institutional Class | | | (3,346,131 | ) | | | (746,030 | ) |
| | | | | | | | |
| | |
Capital Transactions – Investor Class | | | | | | | | |
Proceeds from shares sold | | | 433,652 | | | | 5,341,482 | |
Reinvestment of distributions | | | 129,553 | | | | 255,968 | |
Amount paid for shares redeemed | | | (11,200,790 | ) | | | (6,117,689 | ) |
| | | | | | | | |
Total Investor Class | | | (10,637,585 | ) | | | (520,239 | ) |
| | | | | | | | |
Net decrease in net assets resulting from capital transactions | | | (13,983,716 | ) | | | (1,266,269 | ) |
| | | | | | | | |
Total Increase (Decrease) in Net Assets | | | (12,237,597 | ) | | | 1,030,067 | |
| | | | | | | | |
| | |
Net Assets | | | | | | | | |
Beginning of period | | | 40,053,851 | | | | 39,023,784 | |
| | | | | | | | |
End of period | | $ | 27,816,254 | | | $ | 40,053,851 | |
| | | | | | | | |
Accumulated undistributed net investment income included in net assets at end of period | | $ | 204,428 | | | $ | 48,558 | |
| | | | | | | | |
| | |
Share Transactions – Institutional Class | | | | | | | | |
Shares sold | | | 158,185 | | | | 1,240,531 | |
Shares issued in reinvestment of distributions | | | 35,126 | | | | 101,101 | |
Shares redeemed | | | (525,972 | ) | | | (1,409,707 | ) |
| | | | | | | | |
Total Institutional Class | | | (332,661 | ) | | | (68,075 | ) |
| | | | | | | | |
| | |
Share Transactions – Investor Class | | | | | | | | |
Shares sold | | | 43,385 | | | | 560,884 | |
Shares issued in reinvestment of distributions | | | 12,933 | | | | 27,331 | |
Shares redeemed | | | (1,076,550 | ) | | | (651,855 | ) |
| | | | | | | | |
Total Investor Class | | | (1,020,232 | ) | | | (63,640 | ) |
| | | | | | | | |
Net decrease in shares outstanding | | | (1,352,893 | ) | | | (131,715 | ) |
| | | | | | | | |
See accompanying notes which are an integral part of these financial statements.
22
MERITAGE GROWTH EQUITY FUND – INSTITUTIONAL CLASS
FINANCIAL HIGHLIGHTS
(For a share outstanding during each period)
| | | | | | | | | | | | | | | | |
| | | For the Six
Months Ended
February 28, 2017
(Unaudited) | | | For the
Year Ended
August 31, 2016 | | | For the
Year Ended
August 31, 2015 | | | For the
Period Ended
August 31, 2014 (a) | |
Selected Per Share Data: | | | | | | | | | | | | | | | | |
Net asset value, beginning of period | | $ | 12.11 | | | $ | 11.20 | | | $ | 10.95 | | | $ | 10.00 | |
| | | | | | | | | | | | | | | | |
Investment operations: | | | | | | | | | | | | | | | | |
Net investment income | | | 0.01 | | | | 0.03 | | | | 0.01 | | | | 0.01 | |
Net realized and unrealized gain on investments | | | 1.29 | | | | 1.12 | | | | 0.36 | | | | 0.94 | |
| | | | | | | | | | | | | | | | |
Total from investment operations | | | 1.30 | | | | 1.15 | | | | 0.37 | | | | 0.95 | |
| | | | | | | | | | | | | | | | |
Less distributions to shareholders: | | | | | | | | | | | | | | | | |
From net investment income | | | (0.03 | ) | | | (0.01 | ) | | | (0.01 | ) | | | – | |
From net realized gains | | | (0.12 | ) | | | (0.23 | ) | | | (0.11 | ) | | | – | |
| | | | | | | | | | | | | | | | |
Total distributions | | | (0.15 | ) | | | (0.24 | ) | | | (0.12 | ) | | | – | |
| | | | | | | | | | | | | | | | |
Net asset value, end of period | | $ | 13.26 | | | $ | 12.11 | | | $ | 11.20 | | | $ | 10.95 | |
| | | | | | | | | | | | | | | | |
| | | | |
Total Return (b) | | | 10.82 | %(c) | | | 10.41 | % | | | 3.38 | % | | | 9.50 | %(c) |
| | | | |
Ratios and Supplemental Data: | | | | | | | | | | | | | | | | |
Net assets, end of period (000 omitted) | | $ | 19,894 | | | $ | 17,479 | | | $ | 13,331 | | | $ | 10,642 | |
Ratio of net expenses to average net assets | | | 1.00 | %(d) | | | 1.00 | % | | | 1.00 | % | | | 1.00 | %(d) |
Ratio of expenses to average net assets before waiver | | | 1.53 | %(d) | | | 1.60 | % | | | 1.66 | % | | | 3.49 | %(d) |
Ratio of net investment income to average net assets | | | 0.08 | %(d) | | | 0.24 | % | | | 0.08 | % | | | 0.22 | %(d) |
Portfolio turnover rate (e) | | | 34 | %(c) | | | 73 | % | | | 84 | % | | | 94 | %(c) |
| (a) | For the period December 23, 2013 (commencement of operations) to August 31, 2014. |
| (b) | Total return in the above table represents the rate that the investor would have earned or lost on an investment in the Fund, assuming reinvestment of dividends. |
| (e) | Portfolio turnover is calculated on the basis on the Fund as a whole without distinguishing among the classes of shares. |
See accompanying notes which are an integral part of these financial statements.
23
MERITAGE GROWTH EQUITY FUND – INVESTOR CLASS
FINANCIAL HIGHLIGHTS
(For a share outstanding during each period)
| | | | | | | | | | | | | | | | |
| | | For the Six
Months Ended
February 28, 2017
(Unaudited) | | | For the
Year Ended
August 31, 2016 | | | For the
Year Ended
August 31, 2015 | | | For the
Period Ended
August 31, 2014 (a) | |
Selected Per Share Data: | | | | | | | | | | | | | | | | |
Net asset value, beginning of period | | $ | 12.03 | | | $ | 11.15 | | | $ | 10.92 | | | $ | 10.00 | |
| | | | | | | | | | | | | | | | |
Investment operations: | | | | | | | | | | | | | | | | |
Net investment income (loss) | | | (0.02 | ) | | | – | (b) | | | (0.02 | ) | | | – | (b) |
Net realized and unrealized gain on investments | | | 1.30 | | | | 1.11 | | | | 0.37 | | | | 0.92 | |
| | | | | | | | | | | | | | | | |
Total from investment operations | | | 1.28 | | | | 1.11 | | | | 0.35 | | | | 0.92 | |
| | | | | | | | | | | | | | | | |
Less distributions to shareholders: | | | | | | | | | | | | | | | | |
From net investment income | | | – | | | | – | | | | (0.01 | ) | | | – | |
From net realized gains | | | (0.12 | ) | | | (0.23 | ) | | | (0.11 | ) | | | – | |
| | | | | | | | | | | | | | | | |
Total distributions | | | (0.12 | ) | | | (0.23 | ) | | | (0.12 | ) | | | – | |
| | | | | | | | | | | | | | | | |
Net asset value, end of period | | $ | 13.19 | | | $ | 12.03 | | | $ | 11.15 | | | $ | 10.92 | |
| | | | | | | | | | | | | | | | |
| | | | |
Total Return (c) | | | 10.70 | %(d) | | | 10.13 | % | | | 3.17 | % | | | 9.20 | %(d) |
| | | | |
Ratios and Supplemental Data: | | | | | | | | | | | | | | | | |
Net assets, end of period (000 omitted) | | $ | 133 | | | $ | 367 | | | $ | 164 | | | $ | 136 | |
Ratio of net expenses to average net assets | | | 1.25 | %(e) | | | 1.25 | % | | | 1.25 | % | | | 1.25 | %(e) |
Ratio of expenses to average net assets before waiver | | | 1.78 | %(e) | | | 1.85 | % | | | 1.91 | % | | | 3.32 | %(e) |
Ratio of net investment income (loss) to average net assets | | | (0.14 | )%(e) | | | (0.01 | )% | | | (0.17 | )% | | | 0.01 | %(e) |
Portfolio turnover rate (f) | | | 34 | %(d) | | | 73 | % | | | 84 | % | | | 94 | %(d) |
| (a) | For the period December 23, 2013 (commencement of operations) to August 31, 2014. |
| (b) | Amount is less than $0.01. |
| (c) | Total return in the above table represents the rate that the investor would have earned or lost on an investment in the Fund, assuming reinvestment of dividends. |
| (f) | Portfolio turnover is calculated on the basis on the Fund as a whole without distinguishing among the classes of shares. |
See accompanying notes which are an integral part of these financial statements.
24
MERITAGE VALUE EQUITY FUND – INSTITUTIONAL CLASS
FINANCIAL HIGHLIGHTS
(For a share outstanding during each period)
| | | | | | | | | | | | | | | | |
| | | For the Six
Months Ended
February 28, 2017
(Unaudited) | | | For the
Year Ended
August 31, 2016 | | | For the
Year Ended
August 31, 2015 | | | For the
Period Ended
August 31, 2014 (a) | |
Selected Per Share Data: | | | | | | | | | | | | | | | | |
Net asset value, beginning of period | | $ | 11.07 | | | $ | 11.00 | | | $ | 11.00 | | | $ | 10.00 | |
| | | | | | | | | | | | | | | | |
Investment operations: | | | | | | | | | | | | | | | | |
Net investment income | | | 0.05 | | | | 0.08 | | | | 0.10 | | | | 0.04 | |
Net realized and unrealized gain on investments | | | 0.99 | | | | 0.12 | | | | 0.01 | (b) | | | 0.96 | |
| | | | | | | | | | | | | | | | |
Total from investment operations | | | 1.04 | | | | 0.20 | | | | 0.11 | | | | 1.00 | |
| | | | | | | | | | | | | | | | |
Less distributions to shareholders: | | | | | | | | | | | | | | | | |
From net investment income | | | (0.10 | ) | | | (0.09 | ) | | | (0.04 | ) | | | – | |
From net realized gains | | | – | | | | (0.04 | ) | | | (0.07 | ) | | | – | |
| | | | | | | | | | | | | | | | |
Total distributions | | | (0.10 | ) | | | (0.13 | ) | | | (0.11 | ) | | | – | |
| | | | | | | | | | | | | | | | |
Net asset value, end of period | | $ | 12.01 | | | $ | 11.07 | | | $ | 11.00 | | | $ | 11.00 | |
| | | | | | | | | | | | | | | | |
| | | | |
Total Return (c) | | | 9.41 | %(d) | | | 1.85 | % | | | 0.94 | % | | | 10.00 | %(d) |
| | | | |
Ratios and Supplemental Data: | | | | | | | | | | | | | | | | |
Net assets, end of period (000 omitted) | | $ | 14,743 | | | $ | 13,854 | | | $ | 11,321 | | | $ | 9,673 | |
Ratio of net expenses to average net assets | | | 1.00 | %(e) | | | 1.00 | % | | | 1.00 | % | | | 1.00 | %(e) |
Ratio of expenses to average net assets before waiver | | | 1.60 | %(e) | | | 1.67 | % | | | 1.66 | % | | | 3.58 | %(e) |
Ratio of net investment income to average net assets | | | 0.79 | %(e) | | | 0.89 | % | | | 0.96 | % | | | 0.86 | %(e) |
Portfolio turnover rate (f) | | | 47 | %(d) | | | 67 | % | | | 62 | % | | | 50 | %(d) |
| (a) | For the period December 23, 2013 (commencement of operations) to August 31, 2014. |
| (b) | The amount shown for a share outstanding throughout the period does not accord with the aggregate gains and losses in the portfolio securities during the period because of the timing of sales and purchases of fund shares in relation to fluctuating market values during the period. |
| (c) | Total return in the above table represents the rate that the investor would have earned or lost on an investment in the Fund, assuming reinvestment of dividends. |
| (f) | Portfolio turnover is calculated on the basis on the Fund as a whole without distinguishing among the classes of shares. |
See accompanying notes which are an integral part of these financial statements.
25
MERITAGE YIELD-FOCUS EQUITY FUND – INSTITUTIONAL CLASS
FINANCIAL HIGHLIGHTS
(For a share outstanding during each period)
| | | | | | | | | | | | | | | | |
| | | For the Six
Months Ended
February 28, 2017
(Unaudited) | | | For the
Year Ended
August 31, 2016 | | | For the
Year Ended
August 31, 2015 | | | For the
Period Ended
August 31, 2014 (a) | |
Selected Per Share Data: | | | | | | | | | | | | | | | | |
Net asset value, beginning of period | | $ | 10.00 | | | $ | 9.44 | | | $ | 11.27 | | | $ | 10.00 | |
| | | | | | | | | | | | | | | | |
Investment operations: | | | | | | | | | | | | | | | | |
Net investment income | | | 0.19 | | | | 0.32 | | | | 0.33 | | | | 0.10 | |
Net realized and unrealized gain (loss) on investments | | | 0.44 | | | | 0.56 | | | | (1.71 | ) | | | 1.17 | |
| | | | | | | | | | | | | | | | |
Total from investment operations | | | 0.63 | | | | 0.88 | | | | (1.38 | ) | | | 1.27 | |
| | | | | | | | | | | | | | | | |
Less distributions to shareholders: | | | | | | | | | | | | | | | | |
From net investment income | | | (0.14 | ) | | | (0.32 | ) | | | (0.41 | ) | | | – | |
From net realized gains | | | – | | | | – | | | | (0.03 | ) | | | – | |
From return of capital | | | – | | | | – | | | | (0.01 | ) | | | – | |
| | | | | | | | | | | | | | | | |
Total distributions | | | (0.14 | ) | | | (0.32 | ) | | | (0.45 | ) | | | – | |
| | | | | | | | | | | | | | | | |
Net asset value, end of period | | $ | 10.49 | | | $ | 10.00 | | | $ | 9.44 | | | $ | 11.27 | |
| | | | | | | | | | | | | | | | |
| | | | |
Total Return (b) | | | 6.34 | %(c) | | | 9.58 | % | | | (12.56 | )% | | | 12.70 | %(c) |
| | | | |
Ratios and Supplemental Data: | | | | | | | | | | | | | | | | |
Net assets, end of period (000 omitted) | | $ | 27,262 | | | $ | 29,340 | | | $ | 28,316 | | | $ | 26,436 | |
Ratio of net expenses to average net assets | | | 1.00 | %(d) | | | 1.00 | % | | | 1.00 | % | | | 1.00 | %(d) |
Ratio of expenses to average net assets before waiver | | | 1.44 | %(d) | | | 1.49 | % | | | 1.44 | % | | | 2.62 | %(d) |
Ratio of net investment income to average net assets | | | 3.61 | %(d) | | | 3.41 | % | | | 3.17 | % | | | 2.70 | %(d) |
Portfolio turnover rate (e) | | | 29 | %(c) | | | 99 | % | | | 86 | % | | | 63 | %(c) |
| (a) | For the period December 23, 2013 (commencement of operations) to August 31, 2014. |
| (b) | Total return in the above table represents the rate that the investor would have earned or lost on an investment in the Fund, assuming reinvestment of dividends. |
| (e) | Portfolio turnover is calculated on the basis on the Fund as a whole without distinguishing among the classes of shares. |
See accompanying notes which are an integral part of these financial statements.
26
MERITAGE YIELD-FOCUS EQUITY FUND – INVESTOR CLASS
FINANCIAL HIGHLIGHTS
(For a share outstanding during each period)
| | | | | | | | | | | | | | | | |
| | | For the Six
Months Ended
February 28, 2017
(Unaudited) | | | For the
Year Ended
August 31, 2016 | | | For the
Year Ended
August 31, 2015 | | | For the
Period Ended
August 31, 2014 (a) | |
Selected Per Share Data: | | | | | | | | | | | | | | | | |
Net asset value, beginning of period | | $ | 9.98 | | | $ | 9.42 | | | $ | 11.25 | | | $ | 10.00 | |
| | | | | | | | | | | | | | | | |
Investment operations: | | | | | | | | | | | | | | | | |
Net investment income | | | 0.17 | (b) | | | 0.32 | | | | 0.29 | | | | 0.01 | |
Net realized and unrealized gain (loss) on investments | | | 0.48 | | | | 0.54 | | | | (1.70 | ) | | | 1.24 | |
| | | | | | | | | | | | | | | | |
Total from investment operations | | | 0.65 | | | | 0.86 | | | | (1.41 | ) | | | 1.25 | |
| | | | | | | | | | | | | | | | |
Less distributions to shareholders: | | | | | | | | | | | | | | | | |
From net investment income | | | (0.13 | ) | | | (0.30 | ) | | | (0.38 | ) | | | – | |
From net realized gains | | | – | | | | – | | | | (0.03 | ) | | | – | |
From return of capital | | | – | | | | – | | | | (0.01 | ) | | | – | |
| | | | | | | | | | | | | | | | |
Total distributions | | | (0.13 | ) | | | (0.30 | ) | | | (0.42 | ) | | | – | |
| | | | | | | | | | | | | | | | |
Net asset value, end of period | | $ | 10.50 | | | $ | 9.98 | | | $ | 9.42 | | | $ | 11.25 | |
| | | | | | | | | | | | | | | | |
| | | | |
Total Return (c) | | | 6.53 | %(d) | | | 9.35 | % | | | (12.85 | )% | | | 12.50 | %(d) |
| | | | |
Ratios and Supplemental Data: | | | | | | | | | | | | | | | | |
Net assets, end of period (000 omitted) | | $ | 554 | | | $ | 10,714 | | | $ | 10,708 | | | $ | 2,627 | |
Ratio of net expenses to average net assets | | | 1.25 | %(e) | | | 1.25 | % | | | 1.25 | % | | | 1.25 | %(e) |
Ratio of expenses to average net assets before waiver | | | 1.69 | %(e) | | | 1.74 | % | | | 1.69 | % | | | 2.46 | %(e) |
Ratio of net investment income to average net assets | | | 3.35 | %(e) | | | 3.17 | % | | | 2.84 | % | | | 2.26 | %(e) |
Portfolio turnover rate (f) | | | 29 | %(d) | | | 99 | % | | | 86 | % | | | 63 | %(d) |
| (a) | For the period December 23, 2013 (commencement of operations) to August 31, 2014. |
| (b) | Calculated using the average shares method. |
| (c) | Total return in the above table represents the rate that the investor would have earned or lost on an investment in the Fund, assuming reinvestment of dividends. |
| (f) | Portfolio turnover is calculated on the basis on the Fund as a whole without distinguishing among the classes of shares. |
See accompanying notes which are an integral part of these financial statements.
27
MERITAGE FUNDS
NOTES TO THE FINANCIAL STATEMENTS
February 28, 2017 (Unaudited)
NOTE 1. ORGANIZATION
The Meritage Growth Equity Fund (the “Growth Equity Fund”), the Meritage Value Equity Fund (the “Value Equity Fund”), and the Meritage Yield-Focus Equity Fund (the “Yield-Focus Equity Fund”) (each a “Fund” and, collectively the “Funds”) were each organized as a diversified series of the Capitol Series Trust (the “Trust”). The Trust is an open-end investment company established under the laws of Ohio by an Agreement and Declaration of Trust dated September 18, 2013 (the “Trust Agreement”). The Trust Agreement permits the Trust’s Board of Trustees (the “Board”) to issue an unlimited number of shares of beneficial interest of separate series without par value. The Growth Equity and Yield-Focus Equity Funds each offer two share classes, Institutional Class Shares and Investor Class Shares. As disclosed in a prospectus supplement dated February 15, 2017, the Value Equity Fund has discontinued the sale of its Investor Shares, and will continue to offer Institutional Shares. The Funds commenced operations on December 23, 2013. The Funds’ investment adviser is Meritage Portfolio Management, Inc. (the “Adviser”). The investment objective of the Growth Equity Fund is to seek growth of capital. The investment objective of the Value Equity Fund is to seek growth of capital, with income as a secondary objective. The investment objective of the Yield-Focus Equity Fund is to seek long-term growth of capital with an emphasis on high current income.
Each Fund’s prospectus provides a description of the investment objective, policies and strategies, along with information on the classes of shares currently being offered.
NOTE 2. SIGNIFICANT ACCOUNTING POLICIES
The Funds are investment companies and follow accounting and reporting guidance under Financial Accounting Standards Board Accounting Standards Codification (“ASC”) Topic 946, “Financial Services-Investment Companies”. The following is a summary of significant accounting policies consistently followed by each Fund in the preparation of its financial statements. These policies are in conformity with generally accepted accounting principles in the United States of America (“GAAP”).
Estimates – The preparation of financial statements in conformity with GAAP requires management to make estimates and assumptions that affect the reported amounts of assets and liabilities and disclosure of contingent assets and liabilities at the date of the financial statements and the reported amounts of increases and decreases in net assets from operations during the reporting period. Actual results could differ from those estimates.
Securities Valuation – All investments in securities are recorded at their estimated fair value as described in Note 3.
Foreign Currency Translation – The accounting records of the Funds are maintained in U.S. dollars. Foreign currency amounts are translated into U.S. dollars at the current rate of exchange each business day to determine the value of investments, and other assets and liabilities. Purchases and sales of foreign securities, and income and expenses, are translated at the prevailing rate of exchange on the respective date of these transactions. The Funds do not isolate that portion of the results of operations resulting from changes in foreign exchange rates on investments from fluctuation arising from changes in market prices of securities held. These fluctuations are included with the net realized and unrealized gain or loss from investments.
Federal Income Taxes – The Funds make no provision for federal income or excise tax. Each Fund has qualified and intends to qualify each year as a regulated investment company (“RIC”) under subchapter M of the Internal Revenue Code of 1986, as amended, by complying with the requirements applicable to RICs and by distributing substantially all of its taxable income. Each Fund also intends to distribute sufficient net investment income and
28
MERITAGE FUNDS
NOTES TO THE FINANCIAL STATEMENTS – (continued)
February 28, 2017 (Unaudited)
NOTE 2. SIGNIFICANT ACCOUNTING POLICIES – continued
net capital gains, if any, so that it will not be subject to excise tax on undistributed income and gains. If the required amount of net investment income or gains is not distributed, the Funds could incur a tax expense.
As of and during the six months ended February 28, 2017, the Funds did not have a liability for any unrecognized tax benefits. The Funds recognize interest and penalties, if any, related to unrecognized tax benefits as income tax expense in the Statement of Operations. During the period, the Funds did not incur any interest or penalties.
Expenses – Expenses incurred by the Trust that do not relate to a specific fund of the Trust are allocated to the individual funds based on each Fund’s relative net assets or another appropriate basis (as determined by the Board). Expenses specifically attributable to any class are borne by that class. Income, realized gains and losses, unrealized appreciation and depreciation, and expenses are allocated to each class based on the net assets in relation to the relative net assets of the Fund.
Security Transactions and Related Income – Throughout the reporting period, security transactions are accounted for no later than one business day following the trade date. For financial reporting purposes, security transactions are accounted for on trade date on the last business day of the reporting period. The specific identification method is used for determining gains or losses for financial statements and income tax purposes. Dividend income is recorded on the ex-dividend date. Interest income is recorded on an accrual basis and includes, where applicable, the amortization of premium or accretion of discount. Dividend income from real estate investment trusts (REITs) and distributions from limited partnerships are recognized on the ex-date and included in dividend income. The calendar year-end classification of distributions received from REITs during the fiscal year are reported subsequent to year end; accordingly, the Fund estimates the character of REIT distributions based on the most recent information available. Income or loss from limited partnerships is reclassified among the components of net assets upon receipt of K-1’s.
Dividends and Distributions – Each Fund intends to distribute substantially all of its net investment income, if any, as dividends to its shareholders on at least an annual basis, except for Yield-Focus Fund which will normally distribute dividends on a quarterly basis. Each Fund intends to distribute its net realized long term capital gains and its net realized short term capital gains, if any, at least once a year. Dividends to shareholders are recorded on the ex-dividend date. The amounts of dividends from net investment income and distributions from net realized gains are determined in accordance with federal income tax regulations, which may differ from GAAP. These differences are caused primarily by differences in the timing of the recognition of certain components of income, expense or realized capital gains for federal income tax purposes. Where such differences are permanent in nature, they are reclassified in the components of the net assets based on their ultimate characterization for federal income tax purposes. Any such reclassifications will have no effects on net assets, results of operations or net asset values per share of the Funds.
NOTE 3. SECURITIES VALUATION AND FAIR VALUE MEASUREMENTS
Fair value is defined as the price that a Fund would receive upon selling an investment in an orderly transaction to an independent buyer in the principal or most advantageous market of the investment. GAAP establishes a three-tier hierarchy to maximize the use of observable market data and minimize the use of unobservable inputs and to establish classification of fair value measurements for disclosure purposes.
29
MERITAGE FUNDS
NOTES TO THE FINANCIAL STATEMENTS – (continued)
February 28, 2017 (Unaudited)
NOTE 3. SECURITIES VALUATION AND FAIR VALUE MEASUREMENTS – continued
Inputs refer broadly to the assumptions that market participants would use in pricing the asset or liability, including assumptions about risk (the risk inherent in a particular valuation technique used to measure fair value such as pricing model and/or the risk inherent in the inputs to the valuation technique). Inputs may be observable or unobservable. Observable inputs are inputs that reflect the assumptions market participants would use in pricing the asset or liability developed based on market data obtained from sources independent of the reporting entity. Unobservable inputs are inputs that reflect the reporting entity’s own assumptions about the assumptions market participants would use in pricing the asset or liability developed based on the best information available in the circumstances.
Various inputs are used in determining the value of each Fund’s investments. These inputs are summarized in the three broad levels listed below.
| | • | | Level 1 – unadjusted quoted prices in active markets for identical investments and/or registered investment companies where the value per share is determined and published and is the basis for current transactions for identical assets or liabilities at the valuation date |
| | • | | Level 2 – other significant observable inputs (including, but not limited to, quoted prices for an identical security in an inactive market, quoted prices for similar securities, interest rates, prepayment speeds, credit risk, etc.) |
| | • | | Level 3 – significant unobservable inputs (including the Funds’ own assumptions in determining fair value of investments based on the best information available) |
The inputs used to measure fair value may fall into different levels of the fair value hierarchy. In such cases, for disclosure purposes, the level in the fair value hierarchy within which the fair value measurement falls in its entirety is determined based on the lowest level input that is significant to the fair value measurement in its entirety.
In computing the net asset value (‘NAV”) of the Funds, fair value is based on market valuations with respect to portfolio securities for which market quotations are readily available. Pursuant to Board approved policies, the Funds rely on independent third-party pricing services to provide the current market value of securities. Those pricing services value equity securities traded on a securities exchange at the last reported sales price on the principal exchange. Equity securities quoted by NASDAQ are valued at the NASDAQ Official Closing Price. If there is no reported sale on the principal exchange, equity securities are valued at the mean between the most recent quoted bid and asked price. If a non-exchange traded security does not trade on a particular day, then the mean between the last quoted closing bid and asked price will be used. When using the market quotations or close prices provided by the pricing service and when the market is considered active, the security will be classified as a Level 1 security.
Sometimes, an equity security owned by a Fund will be valued by the pricing service with factors other than market quotations or when the market is considered inactive. When this happens, the security may be classified as a Level 2 security. When market quotations are not readily available, when the Fund determines that the market quotation or the price provided by the pricing service does not accurately reflect the current fair value, or when certain restricted or illiquid securities are being valued, such securities are valued as determined in good faith by the Adviser, in conformity with guidelines adopted by and subject to review by the Board. These securities are generally categorized as Level 3 securities.
30
MERITAGE FUNDS
NOTES TO THE FINANCIAL STATEMENTS – (continued)
February 28, 2017 (Unaudited)
NOTE 3. SECURITIES VALUATION AND FAIR VALUE MEASUREMENTS – continued
Investments in open-end mutual funds, including money market mutual funds, are generally priced at the ending NAV provided by the service agent of the funds. These securities are categorized as Level 1 securities.
In accordance with the Trust’s valuation procedures, the Adviser is required to consider all appropriate factors relevant to the value of securities for which it has determined other pricing sources are not available or reliable as described above. No single standard exists for determining fair value, because fair value depends upon the circumstances of each individual case. As a general principle, the current fair value of an issue of securities being valued by the Adviser would be the amount which the Funds might reasonably expect to receive for them upon their current sale. Methods which are in accordance with this principle may, for example, be based on (i) a multiple of earnings; (ii) a discount from market of a similar freely traded security (including a derivative security or a basket of securities traded on other markets, exchanges or among dealers); or (iii) yield to maturity with respect to debt issues, or a combination of these and other methods. Fair value pricing is permitted if, in the Adviser’s opinion, the validity of market quotations appears to be questionable based on factors such as evidence of a thin market in the security based on a small number of quotations, a significant event occurs after the close of a market but before a Fund’s NAV calculation that may affect a security’s value, or the Adviser is aware of any other data that calls into question the reliability of market quotations.
The following is a summary of the inputs used to value the Funds’ investments as of February 28, 2017:
| | | | | | | | | | | | | | | | |
| | | Valuation Inputs | |
| Growth Equity Fund | | Level 1 | | | Level 2 | | | Level 3 | | | Total | |
Common Stocks | | $ | 16,984,522 | | | $ | – | | | $ | – | | | $ | 16,984,522 | |
Exchange-Traded Funds | | | 1,901,430 | | | | – | | | | – | | | | 1,901,430 | |
Money Market Securities | | | 1,130,643 | | | | – | | | | – | | | | 1,130,643 | |
Total | | | 20,016,595 | | | | – | | | | – | | | | 20,016,595 | |
Value Equity Fund | | | | | | | | | | | | | | | | |
Common Stocks | | | 13,135,828 | | | | – | | | | – | | | | 13,135,828 | |
Exchange-Traded Funds | | | 1,384,092 | | | | – | | | | – | | | | 1,384,092 | |
Money Market Securities | | | 17,596 | | | | – | | | | – | | | | 17,596 | |
Total | | | 14,537,516 | | | | – | | | | – | | | | 14,537,516 | |
Yield-Focus Equity Fund | | | | | | | | | | | | | | | | |
Common Stocks | | | 24,997,477 | | | | – | | | | – | | | | 24,997,477 | |
Convertible Preferred Stocks | | | 1,588,537 | | | | | | | | | | | | 1,588,537 | |
Money Market Securities | | | 1,646,378 | | | | – | | | | – | | | | 1,646,378 | |
Total | | | 28,232,392 | | | | – | | | | – | | | | 28,232,392 | |
The Funds did not hold any investments at any time during the reporting period in which significant unobservable inputs were used in determining fair value; therefore, no reconciliation of Level 3 securities is included for this reporting period. The Funds did not hold any derivative instruments during the reporting period.
The Trust recognizes transfers between fair value hierarchy levels at the end of the reporting period. There were no transfers between any levels as of February 28, 2017 based on input levels assigned as of August 31, 2016.
31
MERITAGE FUNDS
NOTES TO THE FINANCIAL STATEMENTS – (continued)
February 28, 2017 (Unaudited)
NOTE 4. FEES AND OTHER TRANSACTIONS WITH AFFILIATES
Under the terms of the management agreement, on behalf of the Funds (the “Agreement”), the Adviser manages each Fund’s investments subject to oversight of the Board. As compensation for its management services each Fund is obligated to pay the Adviser a fee computed and accrued daily and paid monthly at an annual rate of 0.75% of the average daily net assets of each Fund. For the six months ended February 28, 2017, the Adviser earned fees of $67,398 from the Growth Equity Fund, $50,311 from the Value Equity Fund and $141,604 from the Yield-Focus Equity Fund before the reimbursements described below.
The Adviser has contractually agreed to waive or limit its fees and to assume other expenses of each Fund until December 31, 2017, so that total annual fund operating expenses do not exceed 1.00%. This operating expense limitation does not apply to borrowing costs (such as interest and dividend expenses on securities sold short), taxes, extraordinary expenses, brokerage fees and commissions, and expenses incurred under a plan of distribution adopted pursuant to Rule 12b-1 under the Investment Company Act of 1940 (“Excluded Expenses”). This limitation also excludes any “acquired fund fees and expenses” as that term is described in each Fund’s prospectus.
The waiver and/or reimbursement by the Adviser with respect to the Funds are subject to repayment by the Funds within three years following the date in which that particular waiver and/or reimbursement occurred, provided that the Funds are able to make the repayment without exceeding the expense limitations that were in effect at the time of the waiver or reimbursement.
The amounts subject to repayment by the Funds, pursuant to the aforementioned conditions are as follows:
| | | | | | | | |
| | | Amount
Waived or
Reimbursed | | | Recoverable
through
August 31, | |
Growth Equity Fund | | $ | 63,949 | | | | 2017 | |
| | | 83,727 | | | | 2018 | |
| | | 93,928 | | | | 2019 | |
| | | 47,703 | | | | 2020 | |
| | |
Value Equity Fund | | | 60,770 | | | | 2017 | |
| | | 72,434 | | | | 2018 | |
| | | 88,618 | | | | 2019 | |
| | | 40,559 | | | | 2020 | |
| | |
Yield-Focus Equity Fund | | | 98,556 | | | | 2017 | |
| | | 190,960 | | | | 2018 | |
| | | 186,012 | | | | 2019 | |
| | | 83,468 | | | | 2020 | |
32
MERITAGE FUNDS
NOTES TO THE FINANCIAL STATEMENTS – (continued)
February 28, 2017 (Unaudited)
NOTE 4. FEES AND OTHER TRANSACTIONS WITH AFFILIATES – continued
The Trust retains Ultimus Asset Services, LLC (“Ultimus”) to provide the Funds with non-investment related administration and compliance, fund accounting and transfer agent services. For the six months ended February 28, 2017, fees incurred for administration, fund accounting and transfer agent services, and the amounts due to Ultimus at February 28, 2017 were as follows:
| | | | | | | | | | | | |
| | | Growth
Equity Fund | | | Value Equity
Fund | | | Yield-Focus
Equity Fund | |
Administration | | $ | 14,112 | | | $ | 10,594 | | | $ | 30,932 | |
Fund Accounting | | | 9,434 | | | | 7,022 | | | | 20,736 | |
Transfer Agent | | | 7,575 | | | | 5,644 | | | | 16,800 | |
Payable to Ultimus | | | 4,955 | | | | 4,123 | | | | 10,724 | |
Certain officers and one Trustee of the Trust are employees of Ultimus. Unified Financial Securities, LLC (the “Distributor”) acts as the principal distributor of the Funds’ shares. Both Ultimus and the Distributor operate as wholly-owned subsidiaries of Ultimus Fund Solutions, LLC. Certain officers of the Trust are officers of the Distributor; such persons may be deemed to be affiliates of the Distributor.
The Funds have adopted a Distribution Plan (the “Plan”) pursuant to Rule 12b-1 under the 1940 Act. The Plan provides that the Funds will pay the Distributor and/or any registered securities dealer, financial institution or any other person (the “Recipient”) a fee of 0.25% of the average daily net assets of each Fund’s Investor Shares in connection with the promotion and distribution of each Fund’s Investor Shares or the provision of personal services to shareholders, including, but not necessarily limited to, advertising, compensation to underwriters, dealers and selling personnel, the printing and mailing of prospectuses to other than current shareholders of Investor Shares, the printing and mailing of sales literature and servicing shareholder accounts. The Funds may pay all or a portion of these fees to any Recipient who renders assistance in distributing or promoting the sale of shares, or who provides certain shareholder services, pursuant to a written agreement. The Plan is a compensation plan, which means that compensation is provided regardless of 12b-1 expenses actually incurred. The Board believes that the Plan will significantly enhance the Funds’ ability to expand distribution of Investor Shares of each Fund. For the six months ended February 28, 2017, Investor Shares 12b-1 expense incurred by the Growth Equity Fund was $185, $11 for the Value Equity Fund, and $12,569 for the Yield-Focus Equity Fund. At February 28, 2017, the Distributor was owed $47 by the Growth Equity Fund and $3,632 for the Yield-Focus Equity Fund for Investor Shares 12b-1 expenses.
NOTE 5. PURCHASES AND SALES OF SECURITIES
For the six months ended February 28, 2017, purchases and sales of investment securities, excluding short-term securities were as follows:
| | | | | | | | |
Fund | | Purchases | | | Sales | |
Growth Equity Fund | | $ | 5,814,259 | | | $ | 6,171,496 | |
Value Equity Fund | | | 6,258,919 | | | | 6,645,757 | |
Yield-Focus Equity Fund | | | 10,570,958 | | | | 24,851,863 | |
There were no purchases or sales of long-term U.S. government obligations during the six months ended February 28, 2017.
33
MERITAGE FUNDS
NOTES TO THE FINANCIAL STATEMENTS – (continued)
February 28, 2017 (Unaudited)
NOTE 6. BENEFICIAL OWNERSHIP
The beneficial ownership, either directly or indirectly, of 25% or more of the voting securities of a fund creates a presumption of control of a fund, under Section 2(a)(9) of the Investment Company Act of 1940. At February 28, 2017, National Financial Services LLC (“NFS”) and Charles Schwab & Co. Inc. (“Schwab”) owned, as record shareholder, 52.93% and 43.17%, respectively, of the outstanding shares of the Growth Equity Fund. At February 28, 2017, NFS and Schwab owned, as record shareholder, 53.89% and 43.31%, respectively, of the outstanding shares of the Value Equity Fund. At February 28, 2017, NFS and Schwab owned, as record shareholder, 56.69% and 32.01%, respectively, of the outstanding shares of the Yield-Focus Equity Fund. It is not known whether NFS, Schwab or any of the underlying beneficial owners owned or controlled 25% or more of the voting securities of the Funds.
NOTE 7. FEDERAL TAX INFORMATION
At February 28, 2017, the net unrealized appreciation (depreciation) of investments for tax purposes was as follows:
| | | | | | | | | | | | | | | | |
| | | Tax Cost of
Securities | | | Unrealized
Appreciation | | | Unrealized
Depreciation | | | Net Unrealized
Appreciation | |
Growth Equity Fund | | $ | 16,146,147 | | | $ | 3,885,531 | | | $ | (15,083 | ) | | $ | 3,870,448 | |
Value Equity Fund | | | 12,141,674 | | | | 2,513,472 | | | | (117,630 | ) | | | 2,395,842 | |
Yield-Focus Equity Fund | | | 25,126,163 | | | | 3,460,184 | | | | (353,955 | ) | | | 3,106,229 | |
The tax character of distributions paid during the fiscal year ended August 31, 2016, was as follows:
| | | | | | | | | | | | |
| | | Ordinary
Income | | | Net Long-Term
Capital Gains | | | Total
Distributions
Paid | |
Growth Equity Fund | | $ | 208,724 | | | $ | 109,499 | | | $ | 318,223 | |
Value Equity Fund | | | 105,289 | | | | 50,549 | | | | 155,838 | |
Yield-Focus Equity Fund | | | 1,250,094 | | | | – | | | | 1,250,094 | |
For the fiscal year ended August 31, 2016, the components of distributable earnings (accumulated losses) on a tax basis were as follows:
| | | | | | | | | | | | | | | | |
| | | Ordinary
Income | | | Accumulated
Capital and
Other Losses | | | Unrealized
Appreciation/
(Depreciation) | | | Total
Accumulated
Earnings
(Losses) | |
Growth Equity Fund | | $ | 35,392 | | | $ | (70,172 | ) | | $ | 2,428,110 | | | $ | 2,393,330 | |
Value Equity Fund | | | 115,338 | | | | (593,588 | ) | | | 1,328,069 | | | | 849,819 | |
Yield-Focus Equity Fund | | | 48,559 | | | | (6,260,008 | ) | | | 2,890,512 | | | | (3,320,937 | ) |
The difference between book basis and tax basis unrealized appreciation is primarily attributable to the tax deferral of wash losses.
34
MERITAGE FUNDS
NOTES TO THE FINANCIAL STATEMENTS – (continued)
February 28, 2017 (Unaudited)
NOTE 7. FEDERAL TAX INFORMATION – continued
As of August 31, 2016, the Growth Equity Fund, Value Equity Fund, and Yield-Focus Equity Fund, respectively, had available for tax purposes an unused capital loss carryforward of $41,212, $71,283, and $2,930,258 of short-term capital losses with no expiration, which was available to offset against future taxable net capital gains. To the extent that these carryforwards are used to offset future gains, it is probable that the amount offset will not be distributed to shareholders.
Certain capital losses incurred after October 31, and within the current taxable year, are deemed to arise on the first business day of the Fund’s following taxable year. For the tax year ended August 31, 2016, the Growth Equity Fund, Value Equity Fund, and Yield-Focus Equity Fund, respectively, deferred post-October capital losses in the amount of $28,960, $522,305, and $2,853,786.
NOTE 8. COMMITMENTS AND CONTINGENCIES
The Funds indemnify their officers and trustees for certain liabilities that may arise from the performance of their duties to the Funds. Additionally, in the normal course of business, the Funds enter into contracts that contain a variety of representations and warranties which provide general indemnifications. The Funds’ maximum exposure under these arrangements is unknown, as this would involve future claims that may be made against the Funds that have not yet occurred.
NOTE 9. SUBSEQUENT EVENTS
Management has evaluated events or transactions that may have occurred since February 28, 2017 through the date the financial statements were issued, that would merit recognition or disclosure in the financial statements. There were no items requiring adjustment of the financial statements or additional disclosure.
35
SUMMARY OF FUND EXPENSES – (Unaudited)
As a shareholder of a Fund, you incur ongoing costs, including management fees and other Fund expenses. This Example is intended to help you understand your ongoing costs (in dollars) of investing in the Fund and to compare these costs with the ongoing costs of investing in other mutual funds. The Example is based on an investment of $1,000 invested at the beginning of the period, and held for the entire period from September 1, 2016 to February 28, 2017.
Actual Expenses
The first line of the table below provides information about actual account values and actual expenses. You may use the information in this line, together with the amount you invested, to estimate the expenses that you paid over the period. Simply divide your account value by $1,000 (for example, an $8,600 account value divided by $1,000 = $8.60), then multiply the result by the number in the first line under the heading entitled “Expenses Paid During the Period” to estimate the expenses you paid on your account during this period.
Hypothetical Example for Comparison Purposes
The second line of the table below provides information about hypothetical account values and hypothetical expenses based on the Fund’s actual expense ratio and an assumed rate of return of 5% per year before expenses, which is not the Fund’s actual return. The hypothetical account values and expenses may not be used to estimate the actual ending account balance or expenses you paid for the period. You may use this information to compare the ongoing costs of investing in the Fund and other funds. To do so, compare this 5% hypothetical example with the 5% hypothetical examples that appear in the shareholder reports of the other funds.
Please note that the expenses shown in the table are meant to highlight your ongoing costs only. Therefore, the second line of the table below is useful in comparing ongoing costs only and will not help you determine the relative costs of owning different funds.
| | | | | | | | | | | | | | | | |
| | | Beginning
Account Value
September 1, 2016 | | | Ending
Account Value
February 28, 2017 | | | Expenses Paid
During Period* | | | Annualized
Expense
Ratio | |
Meritage Growth Equity Fund | | | | | | | | | | | | | | | | |
Institutional Class | | | | | | | | | | | | | | | | |
Actual | | $ | 1,000.00 | | | $ | 1,108.20 | | | $ | 5.23 | | | | 1.00 | % |
Hypothetical** | | $ | 1,000.00 | | | $ | 1,019.84 | | | $ | 5.01 | | | | 1.00 | % |
Investor Class | | | | | | | | | | | | | | | | |
Actual | | $ | 1,000.00 | | | $ | 1,107.00 | | | $ | 6.53 | | | | 1.25 | % |
Hypothetical** | | $ | 1,000.00 | | | $ | 1,018.60 | | | $ | 6.26 | | | | 1.25 | % |
Meritage Value Equity Fund | | | | | | | | | | | | | | | | |
Institutional Class | | | | | | | | | | | | | | | | |
Actual | | $ | 1,000.00 | | | $ | 1,094.10 | | | $ | 5.19 | | | | 1.00 | % |
Hypothetical** | | $ | 1,000.00 | | | $ | 1,019.84 | | | $ | 5.01 | | | | 1.00 | % |
36
SUMMARY OF FUND EXPENSES – (Unaudited) (continued)
| | | | | | | | | | | | | | | | |
| | | Beginning
Account Value
September 1, 2016 | | | Ending
Account Value
February 28, 2017 | | | Expenses Paid
During Period* | | | Annualized
Expense
Ratio | |
Meritage Yield-Focus Equity Fund | | | | | | | | | | | | | | | | |
Institutional Class | | | | | | | | | | | | | | | | |
Actual | | $ | 1,000.00 | | | $ | 1,063.40 | | | $ | 5.12 | | | | 1.00 | % |
Hypothetical** | | $ | 1,000.00 | | | $ | 1,019.84 | | | $ | 5.01 | | | | 1.00 | % |
Investor Class | | | | | | | | | | | | | | | | |
Actual | | $ | 1,000.00 | | | $ | 1,065.30 | | | $ | 6.40 | | | | 1.25 | % |
Hypothetical** | | $ | 1,000.00 | | | $ | 1,018.60 | | | $ | 6.26 | | | | 1.25 | % |
| * | Expenses are equal to the Fund’s annualized expense ratio multiplied by the average account value over the period, multiplied by 181/365. |
| ** | Assumes 5% return before expenses. |
37
APPROVAL OF INVESTMENT ADVISORY AGREEMENT – (Unaudited)
At a quarterly meeting of the Board of Trustees of Capitol Series Trust (“Trust”) on September 28, 2016, the Trust’s Board of Trustees (“Board”), including all of the Trustees who are not “interested persons” of the Trust as that term is defined in Section 2(a)(19) of the Investment Company Act of 1940, as amended (“Independent Trustees”), considered and approved the renewal of the Investment Advisory Agreement between the Trust and Meritage Portfolio Management, Inc. (“Meritage”) for an additional one-year period (the “Investment Advisory Agreement”), regarding the Meritage Growth Equity Fund, Meritage Value Equity Fund, and Meritage Yield-Focus Equity Fund (each a “Fund” and together the “Funds”). Each Fund is a series of the Trust.
Prior to the meeting, the Trustees received and considered information from Meritage and the Trust’s administrator designed to provide the Trustees with the information necessary to evaluate the terms of the proposed renewal of the Investment Advisory Agreement between the Trust and Meritage (the “Support Materials”). Before voting to approve the renewal of the Investment Advisory Agreement, the Trustees reviewed the terms and the form of Investment Advisory Agreement and the Support Materials with Trust management and with counsel to the Independent Trustees and received a memorandum from such counsel discussing the legal standards for their consideration of the renewal of the Investment Advisory Agreement, which memorandum described the various factors that the U.S. Securities and Exchange Commission (“SEC”) and U.S. Courts over the years have suggested would be appropriate for trustee consideration, including the factors outlined in the case of Gartenberg v. Merrill Lynch Asset Management Inc., 694 F.2d 923, 928 (2d Cir. 1982); cert. denied sub. nom. Andre v. Merrill Lynch Ready Assets Trust, Inc., 461 U.S. 906 (1983). Representatives from Meritage also provided additional information to the Trustees in the Board materials for the meeting regarding its proposed services to the Funds, including but not limited to, information regarding its investment philosophy, the firm’s compliance culture, resources and profitability.
In determining whether to approve the renewal of the Investment Advisory Agreement, the Trustees considered all factors they believed relevant with respect to each Fund , including the following: (1) the nature, extent, and quality of the services to be provided by Meritage; (2) the cost of the services to be provided and the profits to be realized by Meritage from services rendered to the Trust and each Fund; (3) comparative fee and expense data for each Fund and other investment companies with similar investment objectives, as well other accounts that Meritage advises; (4) the extent to which economies of scale would be realized as each Fund grows and whether the proposed advisory fee for each Fund, and the Funds together, reflects these economies of scale for each Fund’s benefit; and (5) other financial benefits to Meritage resulting from services to be rendered to the Funds. In their deliberations, the Trustees did not identify any particular information that was all-important or controlling.
Based upon the information provided to the Board throughout the course of the year and the Support Materials, the Board considered whether the overall arrangements between the Trust and Meritage set forth in the Investment Advisory Agreement and the investment advisory fees that each Fund pays, continue to be fair and reasonable in light of the services Meritage performs, as well as such other matters as the Trustees considered relevant in the exercise of their reasonable business judgment. The material factors and conclusions that formed the basis of the Trustees’ determination to approve the continuation of the Investment Advisory Agreement are summarized below.
Nature, Extent and Quality of Services Provided. The Trustees considered the scope of services that Meritage provides under the Investment Advisory Agreement, noting that such services include but are not limited to the following: (1) investing each Fund’s assets consistent with the Fund’s investment objective and investment policies; (2) determining the portfolio securities to be purchased, sold or otherwise disposed of and the timing of such transactions; (3) voting all proxies with respect to each Fund’s portfolio securities; (4) maintaining the required books and records for transactions that Meritage effects on behalf of the Funds; and (5) selecting broker-dealers to execute orders on behalf of the Funds. The Trustees considered Meritage’s capitalization and its assets under management. The Trustees further considered the investment philosophy and experience of the portfolio
38
APPROVAL OF INVESTMENT ADVISORY AGREEMENT – (Unaudited)
managers, and noted the lead portfolio manager’s experience managing assets using investment philosophies similar to that employed for the Funds. The Trustees also noted each Fund’s performance compared to its respective benchmark. The Trustees considered that each Fund underperformed its benchmark for certain periods since its inception, but noted that the Funds had each achieved positive returns at other times over the course of its limited operations, and had exceeded its benchmark during certain quarters. The Trustees also considered each Fund’s performance compared to its respective Morningstar peer group category. They noted that the Meritage Growth Equity Fund is outperforming the average of its peer group for the one-year and year-to-date periods ended June 30, 2016, that the Meritage Value Equity Fund is underperforming the average of its peer group for the same one-year and year-to-date periods, and that the Meritage Yield-Focus Equity Fund is underperforming the average of its peer group for the one-year period and outperforming the average of its peer group for the year-to-date period ended June 30, 2016. The Trustees further noted that it is difficult to make meaningful comparisons with short-term results. The Trustees concluded that they are satisfied with the nature, extent and quality of services that Meritage provides to the Funds under the Investment Advisory Agreement.
Cost of Advisory Services and Profitability. The Trustees considered the annual management fee that the Funds pay to Meritage under the Investment Advisory Agreement, as well as Meritage’s profitability from the services that it rendered to the Funds. In that regard, the Trustees noted that Meritage subsidizes the costs of all distribution services rendered to the Funds which exceed the amounts payable by the Funds under their Rule 12b-1 Distribution Plan. The Trustees considered that Meritage has contractually agreed to reduce its management fees and, if necessary, reimburse the Funds for operating expenses, as specified in each Fund’s prospectus. The Trustees noted that Meritage has begun to realize a small profit as a result of its advisory services to the Funds.
Comparative Fee and Expense Data. The Trustees noted that each Fund’s management fee and total expense ratio were either below or equal to the average management fee and total expense ratio (after waivers and expense reimbursements) reported for its relevant Morningstar peer group. The Trustees also noted that the peer group comparisons included in the Support Materials were based upon funds with net asset levels similar to each Fund. They further considered the lower fee schedule, based upon breakpoints for account size, paid by Meritage’s separately managed accounts compared to the gross management fee charged to the Funds, and noted the significant and distinct differences in the services that Meritage provides to the Funds, including greater regulatory, compliance and Board reporting responsibilities. The Board also noted that the Funds and separately managed accounts differ in retention expectations, economics and market forces, which were contributors to the difference in fees. While recognizing that it is difficult to compare advisory fees because the scope of advisory services provided may vary from one investment adviser to another or from one account to another, the Trustees concluded that Meritage’s advisory fee continues to be reasonable.
Economies of Scale. The Trustees considered whether the Funds may benefit from any economies of scale, but did not find that any material economies exist at this time. The Board considered the fee structures of the Funds’ various service providers. It was noted that recent negotiations of competitive fees for various services may allow for future economies of scale with respect to the Funds for those services rendered to the Funds.
Other Benefits. The Trustees considered the extent to which Meritage utilizes soft dollar arrangements with respect to portfolio transactions, and noted that Meritage does utilize brokers with whom it has soft dollar relationships to execute the Funds’ portfolio transactions. The Trustees noted that Meritage had been successful over the course of the previous year in negotiating lower commission rates for the Funds. While the Trustees noted that Rule 12b-1 fees may be paid to Meritage as compensation for shareholder and distribution services performed on behalf of the Funds, the Trustees also observed that the distribution expenses that Meritage incurred continue to exceed any Rule 12b-1 payments from the Funds. After considering all relevant information, the Trustees concluded that Meritage does not receive material additional financial benefits from services rendered to the Funds.
39
CAPITOL SERIES TRUST
Privacy Policy
(Unaudited)
Capitol Series Trust (the “Trust”) on behalf of each of its series (each a “Fund,” collectively the “Funds”) adopts the following privacy policy in order to safeguard the personal information of its consumers and customers that are individuals in accordance with Securities and Exchange Commission Regulation S-P,17 CFR 284.30.
We collect only relevant information about a Fund’s shareholders that the law allows or requires us to have in order to conduct our business and properly service you. We collect financial and personal information about you (“Personal Information”) directly (e.g., information on account applications and other forms, such as your name, address, and social security number, and information provided to access account information or conduct account transactions online, such as password, account number, e-mail address, and alternate telephone number), and indirectly (e.g., information about your transactions with us, such as transaction amounts, account balance and account holdings).
The Trust does not disclose any non-public personal information about its shareholders or former shareholders other than for everyday business purposes such as to process a transaction, service an account, to respond to court orders and legal investigations or as otherwise permitted by law. Third parties that may receive this information include companies that provide transfer agency, technology and administrative services to a Fund, as well as the Fund’s investment adviser who is an affiliate of the Fund. If you maintain a retirement/educational custodial account directly with a Fund, we may also disclose your Personal Information to the custodian for that account for shareholder servicing purposes. We limit access to your Personal Information provided to unaffiliated third parties to information necessary to carry out their assigned responsibilities to a Fund. All shareholder records will be disposed of in accordance with applicable law.
The Trust maintains physical, electronic and procedural safeguards to protect Personal Information and requires its third parties service provides with access to such information to treat the Personal Information with the same high degree of confidentiality.
In the event that a shareholder holds shares of a Fund through a financial intermediary, including, but not limited to, a broker-dealer, bank, credit union or trust company, the privacy policy of the shareholders’ financial intermediary would govern how their non-public personal information would be shared with unaffiliated third parties.
40
PROXY VOTING – (Unaudited)
A description of the policies and procedures that the Funds use to determine how to vote proxies relating to portfolio securities and information regarding how each Fund voted those proxies during the most recent twelve month period ended June 30, is available without charge upon request by (1) calling the Funds at (855) 261-0104 and (2) from Funds documents filed with the Securities and Exchange Commission (“SEC”) on the SEC’s website at www.sec.gov.
TRUSTEES
Robert G. Dorsey, Chairman
Walter B. Grimm
Mary M. Morrow
OFFICERS
Matthew J. Miller, Chief Executive Officer and
President
John C. Swhear, Chief Compliance Officer and
AML Officer
Stacey Havens, Vice President
Zachary P. Richmond, Treasurer and Chief Financial Officer
Tiffany R. Franklin, Secretary
INVESTMENT ADVISER
Meritage Portfolio Management, Inc.
7500 College Boulevard, Suite 1212
Overland Park, KS 66210
DISTRIBUTOR
Unified Financial Securities, LLC
9465 Counselors Row, Suite 200
Indianapolis, IN 46240
INDEPENDENT REGISTERED PUBLIC ACCOUNTING FIRM
Ernst & Young LLP
800 Yard Street, Suite 200
Grandview Heights, OH 43212
LEGAL COUNSEL
Bernstein Shur
100 Middle Street, 6th Floor
Portland, ME 04104
CUSTODIAN
Huntington National Bank
41 South High Street
Columbus, OH 43215
ADMINISTRATOR, TRANSFER AGENT AND FUND ACCOUNTANT
Ultimus Asset Services, LLC
225 Pictoria Drive, Suite 450
Cincinnati, OH 45246
This report is intended only for the information of shareholders or those who have received the Funds’ prospectus which contains information about the Funds’ management fee and expenses. Please read the prospectus carefully before investing.
Distributed by Unified Financial Securities, LLC
Member FINRA/SIPC

Preserver Alternative Opportunities Fund
Institutional Shares – PAOIX
Retail Shares – PAORX
Semi-Annual Report
February 28, 2017
PreserverPartners, LLC
8700 Trail Lake Drive West, Suite 105
Memphis, Tennessee 38125
(844) 838-2119 or (901) 755-4737
Investment Results (Unaudited)
Total Returns(a) as of February 28, 2017
| | | | | | | | |
| | | Six Months | | | Since
Inception
(3/1/16) | |
Preserver Alternative Opportunities Fund | | | | | | | | |
Institutional Shares | | | 5.50 | % | | | 12.08 | % |
Retail Shares | | | 5.49 | % | | | 11.86 | % |
Bloomberg Barclays U.S. Aggregate Bond Index (b) | | | -2.19 | % | | | 1.42 | % |
| | | Expense Ratios(c) | |
| |
| Institutional
Shares |
| |
| Retail
Shares |
|
Gross | | | 3.22 | % | | | 3.47 | % |
With Applicable Waivers | | | 2.05 | % | | | 2.30 | % |
The performance quoted represents past performance, which does not guarantee future results. The investment return and principal value of an investment will fluctuate so that an investor’s shares, when redeemed, may be worth more or less than their original cost. The returns shown do not reflect deduction of taxes that a shareholder would pay on Preserver Alternative Opportunities Fund (the "Fund") distributions or the redemption of Fund shares. Current performance of the Fund may be lower or higher than the performance quoted. The Fund's investment objectives, risks, charges and expenses must be considered carefully before investing. Performance data current to the most recent month end may be obtained by calling (844) 838-2119.
(a) Return figures reflect any change in price per share and assume the reinvestment of all distributions. The Fund's returns reflect any fee waivers during the applicable period. If such fee waivers had not occurred, the quoted performance would have been lower. Total Returns for less than one year are not annualized.
(b) The Bloomberg Barclays U.S. Aggregate Bond Index (the "Index") covers the U.S. investment grade fixed rate bond market (measuring bonds with maturities of at least one year), with index components for government and corporate securities, mortgage pass through securities, and asset-backed securities. The Index is an unmanaged benchmark that assumes reinvestment of all distributions and excludes the effect of taxes and fees. Individuals cannot invest directly in this Index; however, an individual can invest in exchange traded funds or other investment vehicles that attempt to track the performance of a benchmark index.
(c) The expense ratios are from the Fund’s prospectus dated December 29, 2016. PreserverPartners, LLC (the “Adviser”), the Fund’s adviser, has contractually agreed to waive its management fee and/or reimburse expenses so that total annual operating expenses (excluding (i) interest; (ii) taxes; (iii) brokerage fees and commissions; (iv) other extraordinary expenses not incurred in the ordinary course of the Fund’s business; (v) dividend expenses on short sales; (vi) expenses incurred under a Rule 12b-1 plan of distribution; and (vii) indirect expenses such as acquired fund fees and expenses) do not exceed 1.75% of the Fund’s average daily net assets through December 29, 2017. This expense cap agreement may be terminated by the Board of Trustees at any time. Additional information pertaining to the Fund’s expense ratios as of February 28, 2017, can be found in the financial highlights.
The Fund's investment objectives, strategies, risks, charges and expenses must be considered carefully before investing. The prospectus contains this and other important information about the Fund and may be obtained by calling (844) 838-2119. Please read it carefully before investing.
The Fund is distributed by Unified Financial Securities, LLC, member FINRA/SIPC.
1
Portfolio Illustration (Unaudited)
February 28, 2017
The following chart gives a visual breakdown of the Fund’s holdings as a percentage of the fair value of portfolio investments.
Availability of Portfolio Schedule – (Unaudited)
The Fund files its complete schedule of portfolio holdings with the Securities and Exchange Commission (“SEC”) for the first and third quarters of each fiscal year on Form N-Q. The Fund’s Forms N-Q are available at the SEC’s website at www.sec.gov. The Fund’s Forms N-Q may be reviewed and copied at the Public Reference Room in Washington DC. Information on the operation of the Public Reference Room may be obtained by calling 1-800-SEC-0330.
2
Preserver Alternative Opportunities Fund
Schedule of Investments (Unaudited)
February 28, 2017
| | | | | | | | |
| Shares | | | | | Fair Value | |
| | COMMON STOCKS – 49.82% | |
| |
| | | | Australia – 0.44% | |
| | | | Industrials – 0.44% | | | | |
| | 14,000 | | | Sydney Airport | | $ | 65,051 | |
| | | | | | | | |
| | | | | | | 65,051 | |
| | | | | | | | |
| | | | Canada – 4.50% | | | | |
| | | | Consumer Discretionary – 1.02% | | | | |
| | 5,000 | | | A&W Revenue Royalties Income Fund | | | 149,827 | |
| | | | | | | | |
| | |
| | | | Financials – 0.56% | | | | |
| | 5,000 | | | Alaris Royalty Corp. | | | 82,669 | |
| | | | | | | | |
| | |
| | | | Materials – 0.88% | | | | |
| | 4,200 | | | Stella-Jones, Inc. | | | 129,807 | |
| | | | | | | | |
| | |
| | | | Real Estate – 0.81% | | | | |
| | 15,620 | | | NorthWest Healthcare Properties Real Estate Investment Trust | | | 119,955 | |
| | | | | | | | |
| | |
| | | | Utilities – 1.23% | | | | |
| | 5,000 | | | Brookfield Infrastructure Partners LP | | | 180,400 | |
| | | | | | | | |
| | | | | | | 662,658 | |
| | | | | | | | |
| | | | Denmark – 0.60% | | | | |
| | | | Consumer Discretionary – 0.60% | | | | |
| | 770 | | | Pandora A/S | | | 87,795 | |
| | | | | | | | |
| | | | | | | 87,795 | |
| | | | | | | | |
| | | | France – 1.47% | | | | |
| | | | Industrials – 1.47% | | | | |
| | 2,200 | | | Thales SA | | | 216,760 | |
| | | | | | | | |
| | | | | | | 216,760 | |
| | | | | | | | |
| | | | Germany – 3.71% | | | | |
| | | | Consumer Discretionary – 0.91% | | | | |
| | 800 | | | adidas AG | | | 134,252 | |
| | | | | | | | |
| | |
| | | | Consumer Staples – 0.59% | | | | |
| | 800 | | | Henkel AG & Co. KGaA | | | 86,238 | |
| | | | | | | | |
| | |
| | | | Financials – 0.81% | | | | |
| | 1,800 | | | AURELIUS SE & Co. KGaA | | | 119,263 | |
| | | | | | | | |
| | |
| | | | Real Estate – 1.40% | | | | |
| | 6,000 | | | Deutsche Wohnen AG | | | 206,113 | |
| | | | | | | | |
| | | | | | | 545,866 | |
| | | | | | | | |
| | | | Ireland – 0.91% | |
| | | | Consumer Discretionary – 0.91% | | | | |
| | 2,000 | | | Adient PLC | | | 134,260 | |
| | | | | | | | |
| | | | | | | 134,260 | |
| | | | | | | | |
See accompanying notes which are an integral part of these financial statements.
3
Preserver Alternative Opportunities Fund
Schedule of Investments (Unaudited) (continued)
February 28, 2017
| | | | | | | | |
| Shares | | | | | Fair Value | |
| | COMMON STOCKS – (continued) | |
| | |
| | | | Israel – 0.80% | | | | |
| | | | Industrials – 0.80% | | | | |
| | 1,000 | | | Elbit Systems Ltd. | | $ | 118,000 | |
| | | | | | | | |
| | | | | | | 118,000 | |
| | | | | | | | |
| | | | Japan – 1.77% | | | | |
| | | | Consumer Staples – 0.58% | | | | |
| | 2,500 | | | Calbee, Inc. | | | 84,810 | |
| | | | | | | | |
| | |
| | | | Information Technology – 1.19% | | | | |
| | 4,000 | | | Amano Corp. | | | 80,634 | |
| | 4,500 | | | Nippon Ceramic Co. Ltd. | | | 95,361 | |
| | | | | | | | |
| | | | | | | 175,995 | |
| | | | | | | | |
| | | | | | | 260,805 | |
| | | | | | | | |
| | | | Switzerland – 0.80% | | | | |
| | | | Financials – 0.80% | | | | |
| | 850 | | | Chubb Ltd. | | | 117,444 | |
| | | | | | | | |
| | | | | | | 117,444 | |
| | | | | | | | |
| | | | United Kingdom – 5.73% | | | | |
| | | | Financials – 3.28% | | | | |
| | 45,000 | | | Burford Capital Ltd. | | | 381,119 | |
| | 800 | | | Willis Towers Watson PLC | | | 102,744 | |
| | | | | | | | |
| | | | | | | 483,863 | |
| | | | | | | | |
| | | | Health Care – 0.87% | | | | |
| | 12,000 | | | Abcam PLC | | | 128,287 | |
| | | | | | | | |
| | |
| | | | Industrials – 0.56% | | | | |
| | 1,000 | | | Ashtead Group PLC ADR | | | 82,050 | |
| | | | | | | | |
| | |
| | | | Information Technology – 1.02% | | | | |
| | 20,000 | | | Smart Metering Systems PLC | | | 150,648 | |
| | | | | | | | |
| | | | | | | 844,848 | |
| | | | | | | | |
| | | | United States – 29.09% | | | | |
| | | | Consumer Discretionary – 4.16% | | | | |
| | 2,300 | | | CBS Corp., Class B | | | 151,616 | |
| | 400 | | | Charter Communications, Inc., Class A* | | | 129,224 | |
| | 1,300 | | | Marriott International, Inc., Class A | | | 113,087 | |
| | 500 | | | Mohawk Industries, Inc.* | | | 113,180 | |
| | 4,100 | | | TEGNA, Inc. | | | 105,083 | |
| | | | | | | | |
| | | | | | | 612,190 | |
| | | | | | | | |
| | | | Consumer Staples – 0.72% | | | | |
| | 3,000 | | | Hormel Foods Corp. | | | 105,750 | |
| | | | | | | | |
See accompanying notes which are an integral part of these financial statements.
4
Preserver Alternative Opportunities Fund
Schedule of Investments (Unaudited) (continued)
February 28, 2017
| | | | | | | | |
| Shares | | | | | Fair Value | |
| | COMMON STOCKS – (continued) | |
| | |
| | | | Energy – 2.44% | | | | |
| | 5,000 | | | Enterprise Products Partners LP(a)(b) | | $ | 140,150 | |
| | 1,100 | | | EQT Midstream Partners LP(b) | | | 86,702 | |
| | 6,000 | | | NGL Energy Partners LP(b) | | | 133,200 | |
| | | | | | | | |
| | | | | | | 360,052 | |
| | | | | | | | |
| | | | Financials – 6.21% | | | | |
| | 800 | | | Affiliated Managers Group, Inc. | | | 134,344 | |
| | 1,000 | | | Berkshire Hathaway, Inc., Class B (a)* | | | 171,420 | |
| | 6,700 | | | Blackstone Group LP/The(b) | | | 197,918 | |
| | 6,000 | | | Charles Schwab Corp./The | | | 242,460 | |
| | 1,800 | | | First Republic Bank | | | 168,894 | |
| | | | | | | | |
| | | | | | | 915,036 | |
| | | | | | | | |
| | | | Health Care – 3.95% | | | | |
| | 500 | | | C.R. Bard, Inc. | | | 122,620 | |
| | 1,745 | | | Danaher Corp. | | | 149,285 | |
| | 1,200 | | | Express Scripts Holding Co.* | | | 84,780 | |
| | 3,000 | | | Mylan NV* | | | 125,550 | |
| | 600 | | | UnitedHealth Group, Inc. | | | 99,228 | |
| | | | | | | | |
| | | | | | | 581,463 | |
| | | | | | | | |
| | | | Industrials – 5.21% | | | | |
| | 7,000 | | | Air Transport Services Group, Inc.* | | | 119,140 | |
| | 2,000 | | | AMETEK, Inc. | | | 107,940 | |
| | 700 | | | FedEx Corp. | | | 135,086 | |
| | 5,000 | | | Fortress Transportation & Infrastructure Investors LLC | | | 76,700 | |
| | 3,000 | | | JELD-WEN Holding, Inc.* | | | 93,720 | |
| | 1,600 | | | Macquarie Infrastructure Corp. | | | 123,104 | |
| | 1,500 | | | United Continental Holdings, Inc.* | | | 111,135 | |
| | | | | | | | |
| | | | | | | 766,825 | |
| | | | | | | | |
| | | | Information Technology – 0.80% | | | | |
| | 1,000 | | | Adobe Systems, Inc.* | | | 118,340 | |
| | | | | | | | |
| | |
| | | | Materials – 0.77% | | | | |
| | 1,000 | | | Monsanto Co. | | | 113,830 | |
| | | | | | | | |
| | |
| | | | Real Estate – 2.81% | | | | |
| | 900 | | | Digital Realty Trust, Inc. | | | 97,200 | |
| | 3,000 | | | Education Realty Trust, Inc. | | | 126,450 | |
| | 5,000 | | | Monmouth Real Estate Investment Corp. | | | 73,000 | |
| | 3,470 | | | Weyerhaeuser Co. | | | 117,008 | |
| | | | | | | | |
| | | | | | | 413,658 | |
| | | | | | | | |
See accompanying notes which are an integral part of these financial statements.
5
Preserver Alternative Opportunities Fund
Schedule of Investments (Unaudited) (continued)
February 28, 2017
| | | | | | | | |
| Shares | | | | | Fair Value | |
| | COMMON STOCKS – (continued) | |
| | |
| | | | Utilities – 2.02% | | | | |
| | 2,000 | | | American Electric Power Co., Inc. | | $ | 133,940 | |
| | 6,000 | | | CenterPoint Energy, Inc. | | | 163,920 | |
| | | | | | | | |
| | | | | | | 297,860 | |
| | | | | | | | |
| | | | | | | 4,285,004 | |
| | | | | | | | |
| | | | Total Common Stocks (Cost $6,518,641) | | | 7,338,491 | |
| | | | | | | | |
|
| | PREFERRED STOCKS – 4.87% | |
| | |
| | | | United States – 4.87% | | | | |
| | | | Energy – 0.99% | | | | |
| | 3,000 | | | Kinder Morgan, Inc., Series A, 9.75% | | | 146,100 | |
| | | | | | | | |
| | |
| | | | Health Care – 0.87% | | | | |
| | 150 | | | Allergan PLC, Series A, 5.50% | | | 128,667 | |
| | | | | | | | |
| | |
| | | | Industrials – 1.68% | | | | |
| | 3,200 | | | Arconic Inc, Series 1, 5.38% | | | 141,248 | |
| | 1,500 | | | Stericycle, Inc., 5.25% | | | 106,200 | |
| | | | | | | | |
| | | | | | | 247,448 | |
| | | | | | | | |
| | | | Real Estate – 0.68% | | | | |
| | 4,000 | | | Invesco Mortgage Capital, Inc., Series A, 7.75% | | | 100,000 | |
| | | | | | | | |
| | |
| | | | Telecommunication Services – 0.65% | | | | |
| | 1,500 | | | Frontier Communications Corp., Series A, 11.13% | | | 95,025 | |
| | | | | | | | |
| | | | Total Preferred Stocks (Cost $695,627) | | | 717,240 | |
| | | | | | | | |
| | |
Principal
Amount | | | | | | |
| | CORPORATE BONDS – 12.29% | |
| | |
| | | | United States – 12.29% | | | | |
| | | | Consumer Discretionary – 2.32% | | | | |
| $ | 120,000 | | | International Game Technology PLC, 5.35%, 10/15/23 | | | 120,600 | |
| | 110,000 | | | Ruby Tuesday, Inc., 7.63%, 5/15/20 | | | 107,250 | |
| | 120,000 | | | Scientific Games International, Inc., 6.25%, 9/1/20 | | | 114,300 | |
| | | | | | | | |
| | | | | | | 342,150 | |
| | | | | | | | |
| | | | Energy – 2.47% | | | | |
| | 100,000 | | | Crestwood Midstream Partners LP, 6.00%, 12/15/20 | | | 103,375 | |
| | 100,000 | | | Genesis Energy LP, 6.75%, 8/1/22 | | | 104,750 | |
| | 150,000 | | | Western Refining, Inc., 6.25%, 4/1/21 | | | 155,156 | |
| | | | | | | | |
| | | | | | | 363,281 | |
| | | | | | | | |
See accompanying notes which are an integral part of these financial statements.
6
Preserver Alternative Opportunities Fund
Schedule of Investments (Unaudited) (continued)
February 28, 2017
| | | | | | | | |
Principal
Amount | | | | | Fair Value | |
| | CORPORATE BONDS – (continued) | |
| | |
| | | | Financials – 1.38% | | | | |
| $ | 200,000 | | | Stifel Financial Corp., 4.25%, 7/18/24 | | $ | 202,722 | |
| | | | | | | | |
| | |
| | | | Health Care – 1.55% | | | | |
| | 130,000 | | | CHS/Community Health Systems, Inc., 7.13%, 7/15/20 | | | 122,850 | |
| | 100,000 | | | Tenet Healthcare Corp., 8.13%, 4/1/22 | | | 105,250 | |
| | | | | | | | |
| | | | | | | 228,100 | |
| | | | | | | | |
| | | | Industrials – 2.51% | | | | |
| | 120,000 | | | Atlas Air Worldwide Holdings, Inc., 2.25%, 6/1/22 | | | 128,625 | |
| | 100,000 | | | Timken Co./The, 3.88%, 9/1/24 | | | 98,977 | |
| | 150,000 | | | Triumph Group, Inc., 5.25%, 6/1/22 | | | 142,500 | |
| | | | | | | | |
| | | | | | | 370,102 | |
| | | | | | | | |
| | | | Materials – 0.70% | | | | |
| | 100,000 | | | United States Steel Corp., 7.00%, 2/1/18 | | | 102,750 | |
| | | | | | | | |
| | |
| | | | Real Estate – 0.69% | | | | |
| | 100,000 | | | Senior Housing Properties Trust, 4.75%, 5/1/24 | | | 102,303 | |
| | | | | | | | |
| | |
| | | | Utilities – 0.67% | | | | |
| | 100,000 | | | Ferrellgas Partners LP, 8.63%, 6/15/20 | | | 99,000 | |
| | | | | | | | |
| | | | Total Corporate Bonds (Cost $1,709,575) | | | 1,810,408 | |
| | | | | | | | |
|
| | COLLATERALIZED MORTGAGE OBLIGATIONS – 4.93% | |
| | 95,100 | | | Banc of America Mortgage Securities, Inc., Series 2004-K, Class B3, 4.08%, 12/25/34(c) | | | 91,309 | |
| | 65,507 | | | Countrywide Alternative Loan Trust, Series 2003-J2, Class A1, 6.00%, 10/25/33 | | | 67,840 | |
| | 92,330 | | | Countrywide Home Loans Mortgage Pass-Through Trust, Series 2004-HYB9, Class 1A1, 3.31%, 2/20/35(c) | | | 93,204 | |
| | 31,073 | | | GSR Mortgage Loan Trust, Series 2005-5F, Class 8A3, 1.28%, 6/25/35(c) | | | 29,743 | |
| | 169,470 | | | HarborView Mortgage Loan Trust, Series 2004-07, Class 2A1, 2.99%, 11/19/34(c) | | | 158,027 | |
| | 203,460 | | | Impac CMB Trust, Series 2005-08, Class 2B, 3.03%, 2/25/36 (c) | | | 194,123 | |
| | 92,916 | | | JP Morgan Mortgage Trust, Series 2004-A3, Class SF1, 2.87%, 6/25/34(c) | | | 92,640 | |
| | | | | | | | |
| | | | Total Collateralized Mortgage Obligations (Cost $700,881) | | | 726,886 | |
| | | | | | | | |
|
| | ASSET-BACKED SECURITIES – 3.00% | |
| | 148,992 | | | American Airlines, Inc., Series 2013-2, Class B, 5.60%, 7/15/20(d) | | | 154,766 | |
| | 304,109 | | | Residential Asset Mortgage Products, Inc., Series 2001-RS2, 2.20%, 6/25/31(c) | | | 287,107 | |
| | | | | | | | |
| | | | Total Asset-Backed Securities (Cost $427,431) | | | 441,873 | |
| | | | | | | | |
|
| | U.S. TREASURY OBLIGATIONS – 4.32% | |
| | 200,000 | | | United States Treasury Inflation Indexed Bonds, 0.38%, 7/15/25(e) | | | 205,575 | |
| | 200,000 | | | United States Treasury Note, 1.13%, 2/28/21 | | | 195,199 | |
| | 250,000 | | | United States Treasury Note, 1.63%, 2/15/26 | | | 235,239 | |
| | | | | | | | |
| | | | Total U.S. Treasury Obligations (Cost $648,228) | | | 636,013 | |
| | | | | | | | |
See accompanying notes which are an integral part of these financial statements.
7
Preserver Alternative Opportunities Fund
Schedule of Investments (Unaudited) (continued)
February 28, 2017
| | | | | | | | |
| Shares | | | | | Fair Value | |
| | CLOSED-END FUNDS – 11.76% | |
| | 20,000 | | | Aberdeen Australia Equity Fund, Inc. | | $ | 123,000 | |
| | 7,500 | | | Avenue Income Credit Strategies Fund | | | 107,475 | |
| | 11,000 | | | Calamos Convertible Opportunities and Income Fund | | | 120,780 | |
| | 6,500 | | | Eaton Vance Limited Duration Income Fund | | | 92,235 | |
| | 3,500 | | | Guggenheim Strategic Opportunities Fund | | | 72,450 | |
| | 7,300 | | | KKR Income Opportunities Fund | | | 124,319 | |
| | 20,000 | | | Nuveen Senior Income Fund | | | 142,400 | |
| | 3,700 | | | PIMCO Dynamic Credit and Mortgage Income Fund | | | 77,552 | |
| | 7,000 | | | Pioneer Diversified High Income Trust | | | 114,380 | |
| | 10,000 | | | Pioneer Floating Rate Trust | | | 123,700 | |
| | 39,313 | | | Stone Ridge Reinsurance Risk Premium Interval Fund(f) | | | 404,526 | |
| | 7,000 | | | Western Asset Emerging Markets Debt Fund, Inc. | | | 108,850 | |
| | 11,834 | | | Western Asset Global High Income Fund, Inc. | | | 120,707 | |
| | | | | | | | |
| | | | Total Closed-End Funds (Cost $1,564,507) | | | 1,732,374 | |
| | | | | | | | |
|
| | FOREIGN REGISTERED CLOSED-END FUNDS – 1.12% | |
| | 6,600 | | | Third Point Offshore Investors Ltd. | | | 100,254 | |
| | 19,265 | | | VinaCapital Vietnam Opportunity Fund Ltd. | | | 65,145 | |
| | | | | | | | |
| | | | Total Foreign Registered Closed-End Funds (Cost $147,417) | | | 165,399 | |
| | | | | | | | |
|
| | EXCHANGE-TRADED FUNDS – 2.40% | |
| | 2,000 | | | Schwab U.S. TIPs ETF | | | 111,040 | |
| | 3,000 | | | SPDR Bloomberg Barclays Convertible Securities ETF | | | 143,580 | |
| | 807 | | | SPDR S&P 600 Small Cap ETF | | | 98,567 | |
| | | | | | | | |
| | | | Total Exchange-Traded Funds (Cost $342,912) | | | 353,187 | |
| | | | | | | | |
|
| | PRIVATE INVESTMENT FUND – 3.58% | |
| | | | Trumbull Property Income Fund LP(f)(g) | | | 528,037 | |
| | | | | | | | |
| | | | Total Private Investment Fund (Cost $500,000) | | | 528,037 | |
| | | | | | | | |
|
| | MONEY MARKET SECURITIES – 2.91% | |
| | 429,157 | | | Fidelity Investments Money Market Government Portfolio, Class I, 0.45%(h) | | | 429,157 | |
| | | | | | | | |
| | | | Total Money Market Securities (Cost $429,157) | | | 429,157 | |
| | | | | | | | |
| | |
| | | | Total Investments – 101.01% (Cost $13,684,376) | | | 14,879,065 | |
| | | | | | | | |
| | |
| | | | Liabilities in Excess of Other Assets – (1.01)% | | | (149,478 | ) |
| | | | | | | | |
| | |
| | | | NET ASSETS – 100.00% | | $ | 14,729,587 | |
| | | | | | | | |
See accompanying notes which are an integral part of these financial statements.
8
Preserver Alternative Opportunities Fund
Schedule of Investments (Unaudited) (continued)
February 28, 2017
| (a) | | All or a portion of the security is held as collateral for unsettled security transactions. |
| (b) | | Master Limited Partnership |
| (c) | | Variable or Floating Rate Security. Rate disclosed is as of February 28, 2017. |
| (d) | | Security exempt from registration under Rule 144A or Section 4(2) of the Securities Act of 1933. The security may be resold in transactions exempt from registration, normally to qualified institutional buyers. |
| (e) | | Principal amount of security is adjusted periodically based on changes in the Consumer Price Index. |
| (g) | | Security is currently being valued according to the fair value procedures approved by the Board of Trustees. |
| (h) | | Rate disclosed is the seven day effective yield as of February 28, 2017. |
| * | | Non-income producing security. |
| ADR | | – American Depositary Receipt |
The sectors shown on the schedule of investments are based on the Global Industry Classification Standard, or GICS® (“GICS”). The GICS was developed by and/or is the exclusive property of MSCI, Inc. and Standard & Poor’s Financial Services LLC (“S&P”). GICS is a service mark of MSCI, Inc. and S&P and has been licensed for use by Ultimus Asset Services, LLC.
See accompanying notes which are an integral part of these financial statements.
9
Preserver Alternative Opportunities Fund
Statement of Assets and Liabilities (Unaudited)
February 28, 2017
| | | | |
Assets | | | | |
Investments in securities at fair value (cost $13,684,376) | | $ | 14,879,065 | |
Foreign currencies, at value (Cost $426) | | | 426 | |
Receivable for fund shares sold | | | 2,000 | |
Receivable for investments sold | | | 190,233 | |
Dividends and interest receivable | | | 42,663 | |
Tax reclaims receivable | | | 1,425 | |
Prepaid expenses | | | 16,333 | |
Total Assets | | | 15,132,145 | |
Liabilities | | | | |
Payable for investments purchased | | | 374,574 | |
Payable to Adviser | | | 4,523 | |
Payable to administrator, fund accountant, and transfer agent | | | 7,649 | |
Accrued 12b-1 fees – Retail Shares | | | 657 | |
Other accrued expenses | | | 15,155 | |
Total Liabilities | | | 402,558 | |
Net Assets | | $ | 14,729,587 | |
Net Assets consist of: | | | | |
Paid-in capital | | $ | 13,651,632 | |
Accumulated undistributed net investment loss | | | (77,551 | ) |
Accumulated undistributed net realized loss from investments | | | (39,161 | ) |
Net unrealized appreciation on investments | | | 1,194,667 | |
Net Assets | | $ | 14,729,587 | |
Institutional Shares: | | | | |
Net Assets | | $ | 12,991,945 | |
Shares outstanding | | | 1,183,885 | |
Net asset value ("NAV"), offering and redemption price per share(a) | | $ | 10.97 | |
Retail Shares: | | | | |
Net Assets | | $ | 1,737,642 | |
Shares outstanding | | | 158,471 | |
Net asset value ("NAV"), offering and redemption price per share(a) | | $ | 10.97 | |
| (a) | | A 2% redemption fee is imposed upon shares redeemed within 60 calendar days of their purchase. |
10
See accompanying notes which are an integral part of these financial statements.
Preserver Alternative Opportunities Fund
Statement of Operations (Unaudited)
For the six months ended February 28, 2017
| | | | |
Investment Income | | | | |
Dividend income (net of foreign taxes withheld of $2,441) | | $ | 166,599 | |
Interest income | | | 80,558 | |
Total investment income | | | 247,157 | |
Expenses | | | | |
Investment Adviser | | | 46,659 | |
Administration | | | 14,132 | |
Fund accounting | | | 11,157 | |
Audit | | | 10,442 | |
Offering | | | 10,332 | |
Printing | | | 8,778 | |
Registration | | | 7,402 | |
Transfer agent | | | 6,942 | |
Pricing | | | 6,465 | |
Legal | | | 5,492 | |
Custodian | | | 3,404 | |
Trustee | | | 2,767 | |
12b-1 fees – Retail Shares | | | 2,002 | |
Miscellaneous | | | 10,667 | |
Total expenses | | | 146,641 | |
Fees contractually waived by Adviser | | | (35,551 | ) |
Net operating expenses | | | 111,090 | |
Net investment income | | | 136,067 | |
Net Realized and Change in Unrealized Gain (Loss) on Investments | | | | |
Long-term capital gain dividends from investment companies | | | 2,063 | |
Net realized loss on investment securities transactions | | | (39,467 | ) |
Net realized loss on foreign currency transactions | | | (2,111 | ) |
Net change in unrealized appreciation of investment securities and foreign currency translations | | | 623,173 | |
Net realized and change in unrealized gain on investments | | | 583,658 | |
Net increase in net assets resulting from operations | | $ | 719,725 | |
11
See accompanying notes which are an integral part of these financial statements.
Preserver Alternative Opportunities Fund
Statements of Changes in Net Assets
| | | | | | | | |
| | | For the Six Months
Ended February 28, 2017 (Unaudited) | | | For the Period
Ended August 31, 2016(a) | |
Increase (Decrease) in Net Assets due to: Operations | | | | | | | | |
Net investment income | | $ | 136,067 | | | $ | 73,829 | |
Net realized loss on investment securities transactions and foreign currency translations | | | (39,515 | ) | | | (10,611 | ) |
Net change in unrealized appreciation of investment securities and foreign currency translations | | | 623,173 | | | | 571,494 | |
Net increase in net assets resulting from operations | | | 719,725 | | | | 634,712 | |
Distributions From: | | | | | | | | |
Net investment income: | | | | | | | | |
Institutional Shares | | | (239,216 | ) | | | — | |
Retail Shares | | | (28,812 | ) | | | — | |
Net realized gains: | | | | | | | | |
Institutional Shares | | | (7,459 | ) | | | — | |
Retail Shares | | | (995 | ) | | | — | |
Total distributions | | | (276,482 | ) | | | — | |
Capital Transactions – Institutional Shares | | | | | | | | |
Proceeds from shares sold | | | 3,148,922 | | | | 9,304,557 | |
Reinvestment of distributions | | | 244,577 | | | | — | |
Amount paid for shares redeemed | | | (455,561 | ) | | | (197,744 | ) |
Total Institutional Shares | | | 2,937,938 | | | | 9,106,813 | |
Capital Transactions – Retail Shares | | | | | | | | |
Proceeds from shares sold | | | 472,297 | | | | 1,687,743 | |
Reinvestment of distributions | | | 29,807 | | | | — | |
Amount paid for shares redeemed | | | (554,435 | ) | | | (28,531 | ) |
Total Retail Shares | | | (52,331 | ) | | | 1,659,212 | |
Net increase in net assets resulting from capital transactions | | | 2,885,607 | | | | 10,766,025 | |
Total Increase in Net Assets | | | 3,328,850 | | | | 11,400,737 | |
Net Assets | | | | | | | | |
Beginning of period | | | 11,400,737 | | | | — | |
End of period | | $ | 14,729,587 | | | $ | 11,400,737 | |
Accumulated undistributed net investment income (loss) included in net assets at end of period | | $ | (77,551 | ) | | $ | 54,410 | |
Share Transactions – Institutional Shares | | | | | | | | |
Shares sold | | | 294,262 | | | | 928,043 | |
Shares issued in reinvestment of distributions | | | 23,205 | | | | — | |
Shares redeemed | | | (43,039 | ) | | | (18,586 | ) |
Total Institutional Shares | | | 274,428 | | | | 909,457 | |
Share Transactions – Retail Shares | | | | | | | | |
Shares sold | | | 44,149 | | | | 167,001 | |
Shares issued in reinvestment of distributions | | | 2,828 | | | | — | |
Shares redeemed | | | (52,819 | ) | | | (2,688 | ) |
Total Retail Shares | | | (5,842 | ) | | | 164,313 | |
| (a) | | For the period March 1, 2016 (commencement of operations) through August 31, 2016. |
12
See accompanying notes which are an integral part of these financial statements.
Preserver Alternative Opportunities Fund - Institutional Shares
Financial Highlights
Selected data for a share outstanding throughout each period.
| | | | | | | | |
| | | For the six months
ended
February 28, 2017
(Unaudited) | | | For the period
ended
August 31, 2016(a) | |
Net asset value, at beginning of period | | | $10.62 | | | | $10.00 | |
| | | | | | | | |
| | |
Income from investment operations: | | | | | | | | |
| | |
Net investment income | | | 0.11 | | | | 0.07 | |
| | |
Net realized and unrealized gain on investments | | | 0.47 | | | | 0.55 | |
| | | | | | | | |
| | |
Total from investment operations | | | 0.58 | | | | 0.62 | |
| | | | | | | | |
| | |
Distributions from: | | | | | | | | |
| | |
Net investment income | | | (0.22 | ) | | | — | |
| | |
Net realized gain | | | (0.01 | ) | | | — | |
| | | | | | | | |
| | |
Total from distributions | | | (0.23 | ) | | | — | |
| | | | | | | | |
Net asset value, at end of period | | | $10.97 | | | | $10.62 | |
| | | | | | | | |
| | |
Total Return(b) | | | 5.50 | %(c) | | | 6.20 | %(c) |
| | | | | | | | |
Ratios/Supplemental Data: | |
| | |
Net assets at end of period (thousands) | | | $12,992 | | | | $9,659 | |
| | |
Before waiver: | | | | | | | | |
| | |
Ratio of expenses to average net assets | | | 2.32 | %(d) | | | 2.92 | %(d) |
| | |
After waiver: | | | | | | | | |
| | |
Ratio of expenses to average net assets | | | 1.75 | %(d) | | | 1.75 | %(d) |
| | |
Ratio of net investment income to average net assets | | | 2.22 | %(d) | | | 1.44 | %(d) |
| | |
Portfolio turnover(e) | | | 23 | %(c) | | | 20 | %(c) |
| (a) | | For the period March 1, 2016 (commencement of operations) through August 31, 2016. |
| (b) | | Total return in the above table represents the rate that the investor would have earned or lost on an investment in the Fund, assuming reinvestment of distributions. Excludes redemption fee. |
| (e) | | Portfolio turnover is calculated on the basis on the Fund as a whole without distinguishing among the classes of shares. |
13
See accompanying notes which are an integral part of these financial statements.
Preserver Alternative Opportunities Fund - Retail Shares
Financial Highlights
Selected data for a share outstanding throughout each period.
| | | | | | | | |
| | | For the six months
ended
February 28, 2017
(Unaudited) | | | For the period
ended
August 31, 2016(a) | |
Net asset value, at beginning of period | | | $10.60 | | | | $10.00 | |
| | | | | | | | |
| | |
Income from investment operations: | | | | | | | | |
| | |
Net investment income | | | 0.12 | | | | 0.05 | |
| | |
Net realized and unrealized gain on investments | | | 0.46 | | | | 0.55 | |
| | | | | | | | |
| | |
Total from investment operations | | | 0.58 | | | | 0.60 | |
| | | | | | | | |
| | |
Distributions from: | | | | | | | | |
| | |
Net investment income | | | (0.20 | ) | | | — | |
| | |
Net realized gain | | | (0.01 | ) | | | — | |
| | | | | | | | |
| | |
Total from distributions | | | (0.21 | ) | | | — | |
| | | | | | | | |
Net asset value, at end of period | | | $10.97 | | | | $10.60 | |
| | | | | | | | |
| | |
Total Return(b) | | | 5.49 | %(c) | | | 6.00 | %(c) |
| | | | | | | | |
Ratios/Supplemental Data: | |
| | |
Net assets at end of period (thousands) | | | $1,738 | | | | $1,742 | |
| | |
Before waiver: | | | | | | | | |
| | |
Ratio of expenses to average net assets | | | 2.57 | %(d) | | | 3.17 | %(d) |
| | |
After waiver: | | | | | | | | |
| | |
Ratio of expenses to average net assets | | | 2.00 | %(d) | | | 2.00 | %(d) |
| | |
Ratio of net investment income to average net assets | | | 1.94 | %(d) | | | 1.19 | %(d) |
| | |
Portfolio turnover(e) | | | 23 | %(c) | | | 20 | %(c) |
| (a) | | For the period March 1, 2016 (commencement of operations) through August 31, 2016. |
| (b) | | Total return in the above table represents the rate that the investor would have earned or lost on an investment in the Fund, assuming reinvestment of distributions. Excludes redemption fee. |
| (e) | | Portfolio turnover is calculated on the basis on the Fund as a whole without distinguishing among the classes of shares. |
14
See accompanying notes which are an integral part of these financial statements.
Preserver Alternative Opportunities Fund
Notes to Financial Statements (Unaudited)
February 28, 2017
NOTE 1. ORGANIZATION
The Preserver Alternative Opportunities Fund (the “Fund”) was organized as a diversified series of Capitol Series Trust (the “Trust”) on September 16, 2015. The Trust is an open-end investment company established under the laws of Ohio by an Agreement and Declaration of Trust dated September 18, 2013 (the “Trust Agreement”). The Trust Agreement permits the Board of Trustees of the Trust (the “Board”) to issue an unlimited number of shares of beneficial interest of separate series without par value. The Fund is one of a series of funds currently authorized by the Board. The Fund’s investment adviser is PreserverPartners, LLC (the “Adviser”). The investment objective of the Fund is to seek current income and capital appreciation with low volatility compared to the major equity and fixed income markets.
The Fund currently offers two classes of shares, Institutional Shares and Retail Shares. The Fund commenced operations on March 1, 2016. Each share represents an equal proportionate interest in the assets and liabilities belonging to the Fund and is entitled to such dividends and distributions out of income belonging to the Fund as are declared by the Board. Both share classes impose a 2.00% redemption fee on shares redeemed within 60 days of purchase.
NOTE 2. SIGNIFICANT ACCOUNTING POLICIES
The Fund is an investment company and follows accounting and reporting guidance under Financial Accounting Standards Board Accounting Standards Codification (“ASC”) Topic 946, “Financial Services-Investment Companies”. The following is a summary of significant accounting policies followed by the Fund in the preparation of its financial statements. These policies are in conformity with generally accepted accounting principles in the United States of America (“GAAP”).
Estimates - The preparation of financial statements in conformity with GAAP requires management to make estimates and assumptions that affect the reported amounts of assets and liabilities and disclosure of contingent assets and liabilities at the date of the financial statements and the reported amounts of increases and decreases in net assets from operations during the reporting period. Actual results could differ from those estimates.
Securities Valuation – All investments in securities are recorded at their estimated fair value as described in Note 3.
Foreign Currency Translation – The accounting records of the Fund are maintained in U.S. dollars. Foreign currency amounts are translated into U.S. dollars at the current rate of exchange each business day to determine the value of investments, and other assets and liabilities. Purchases and sales of foreign securities, and income and expenses, are translated at the prevailing rate of exchange on the respective date of these transactions. The Fund does not isolate that portion of the results of operations resulting from changes in foreign exchange rates on investments from fluctuation arising from changes in market prices of securities held. These fluctuations are included with the unrealized gain or loss from investments.
Federal Income Taxes – The Fund makes no provision for federal income tax or excise tax. The Fund has qualified and intends to qualify each year as a regulated investment company (“RIC”) under subchapter M of the Internal Revenue Code of 1986, as amended, by complying with the
15
Preserver Alternative Opportunities Fund
Notes to Financial Statements (Unaudited) (continued)
February 28, 2017
requirements applicable to RICs and by distributing substantially all of its taxable income. The Fund also intends to distribute sufficient net investment income and net capital gains, if any, so that it will not be subject to excise tax on undistributed income and gains. If the required amount of net investment income or gains is not distributed, the Fund could incur a tax expense.
As of, and during the period ended February 28, 2017, the Fund did not have a liability for any unrecognized tax benefits. The Fund recognizes interest and penalties, if any, related to unrecognized tax benefits as income tax expense in the Statement of Operations. During the period, the Fund did not incur any interest or penalties.
Expenses – Expenses incurred by the Trust that do not relate to a specific fund of the Trust are allocated to the individual funds based on each fund’s relative net assets or another appropriate basis (as determined by the Board). Expenses specifically attributable to any class are borne by that class. Income, realized gains and losses, unrealized appreciation and depreciation, and expenses are allocated to each class based on the net assets in relation to the relative net assets of the Fund.
Security Transactions and Related Income – Throughout the reporting period, security transactions are accounted for no later than one business day following the trade date. For financial reporting purposes, security transactions are accounted for on trade date on the last business day of the reporting period. The specific identification method is used for determining gains or losses for financial statements and income tax purposes. Dividend income is recorded on the ex-dividend date and interest income is recorded on an accrual basis. Dividend income from real estate investment trusts (REITs) and distributions from limited partnerships are recognized on the ex-date and included in dividend income. The calendar year-end classification of distributions received from REITs during the fiscal year are reported subsequent to year end; accordingly, the Fund estimates the character of REIT distributions based on the most recent information available. Income or loss from limited partnerships is reclassified among the components of net assets upon receipt of K-1’s. Discounts and premiums on securities purchased are amortized or accreted using the effective interest method.
Dividends and Distributions – The Fund intends to distribute substantially all of its net investment income, if any, as dividends to its shareholders on a quarterly basis. The Fund intends to distribute its net realized long term capital gains and its net realized short term capital gains, if any, at least once a year. Distributions to shareholders are recorded on the ex-dividend date. The amounts of dividends from net investment income and distributions from net realized gains are determined in accordance with federal income tax regulations, which may differ from GAAP. These differences are caused primarily by differences in the timing of the recognition of certain components of income, expense or realized capital gains for federal income tax purposes. Where such differences are permanent in nature, they are reclassified in the components of net assets based on their ultimate characterization for federal income tax purposes. Any such reclassifications will have no effect on net assets, results of operations or net asset values per share of the Fund.
Restricted and Illiquid Securities – Restricted securities are any securities which are subject to restriction on resale under federal securities law, including commercial paper issued in reliance on the exemption from registration afforded by Section 4(2) of the Securities Act of 1933 (“1933 Act”), loan participations and interests in investment companies that are not registered under the
16
Preserver Alternative Opportunities Fund
Notes to Financial Statements (Unaudited) (continued)
February 28, 2017
Investment Company Act of 1940 (“1940 Act”) (each a “Private Fund”). Illiquid securities are securities that may be difficult to sell promptly (generally within seven days) at approximately their current value because of a limited trading market and other factors. The Fund intends to treat interests in loan participations and Private Funds as illiquid securities. Generally, the Trust also considers securities eligible for resale under Rule 144A of the 1933 Act to be illiquid securities for purposes of the Fund’s investment limitation applicable to illiquid securities. The Trust believes that Section 4(2) commercial paper and Rule 144A securities may be considered “liquid” if certain criteria are satisfied consistent with procedures adopted by the Board. The Fund will not invest greater than 15% of its net assets in illiquid or restricted securities.
As of February 28, 2017, the Fund held illiquid and restricted securities representing 6.33% of net assets as listed below:
| | | | | | | | | | | | | | | | |
| Issuer Description | | Acquisition
Date | | | Shares | | | Cost | | | Fair Value | |
Stone Ridge Reinsurance
Risk Premium Interval Fund(a) | | | 5/19/16 | (b) | | | 39,313 | | | $ | 400,000 | | | $ | 404,526 | |
Trumbull Property Income Fund LP(c) | | | 4/1/16 | | | | – | | | | 500,000 | | | | 528,037 | |
| (a) | | Subject to quarterly offers to repurchase a portion of the outstanding shares at NAV, subject to approval of the securities’ Board of Trustees, and in all cases such repurchases will be for at least 5% and not more than 25%, and are currently expected to be for 5%, of its outstanding shares at NAV. |
| (b) | | The security was purchased on multiple dates with the initial purchase date shown. |
| (c) | | Security is currently being valued according to the fair value procedures approved by the Board. |
NOTE 3. SECURITIES VALUATION AND FAIR VALUE MEASUREMENTS
Fair value is defined as the price that the Fund would receive upon selling an investment in an orderly transaction to an independent buyer in the principal or most advantageous market of the investment. GAAP establishes a three-tier hierarchy to maximize the use of observable market data and minimize the use of unobservable inputs and to establish classification of fair value measurements for disclosure purposes.
Inputs refer broadly to the assumptions that market participants would use in pricing the asset or liability, including assumptions about risk (the risk inherent in a particular valuation technique used to measure fair value such as a pricing model and/or the risk inherent in the inputs to the valuation technique). Inputs may be observable or unobservable. Observable inputs are inputs that reflect the assumptions market participants would use in pricing the asset or liability developed based on market data obtained from sources independent of the reporting entity. Unobservable inputs are inputs that reflect the reporting entity’s own assumptions about the assumptions market participants would use in pricing the asset or liability developed based on the best information available in the circumstances.
Various inputs are used in determining the value of the Fund’s investments. These inputs are summarized in the three broad levels listed below.
| | • | | Level 1 – unadjusted quoted prices in active markets for identical investments and/or registered investment companies where the value per share is determined and published and is the basis for current transactions for identical assets or liabilities at the valuation date |
17
Preserver Alternative Opportunities Fund
Notes to Financial Statements (Unaudited) (continued)
February 28, 2017
| | • | | Level 2 – other significant observable inputs (including, but not limited to, quoted prices for an identical security in an inactive market, quoted prices for similar securities, interest rates, prepayment speeds, credit risk, etc.) |
| | • | | Level 3 – significant unobservable inputs (including the Fund’s own assumptions in determining fair value of investments based on the best information available) |
The inputs used to measure fair value may fall into different levels of the fair value hierarchy. In such cases, for disclosure purposes, the level in the fair value hierarchy within which the fair value measurement falls in its entirety is determined based on the lowest level input that is significant to the fair value measurement in its entirety.
In computing the net asset value (“NAV”) of the Fund, fair value is based on market valuations with respect to portfolio securities for which market quotations are readily available. Pursuant to Board approved policies, the Fund relies on independent third-party pricing services to provide the current market value of securities. Those pricing services value equity securities traded on a securities exchange at the last reported sales price on the principal exchange. Equity securities quoted by NASDAQ are valued at the NASDAQ Official Closing Price. If there is no reported sale on the principal exchange, equity securities are valued at the mean between the most recent quoted bid and asked price. When using the market quotations or close prices provided by the pricing service and when the market is considered active, the security will be classified as a Level 1 security.
Sometimes, an equity security owned by the Fund will be valued by the pricing service with factors other than market quotations or when the market is considered inactive. When this happens, the security may be classified as a Level 2 security. When market quotations are not readily available, when the Fund determines that the market quotation or the price provided by the pricing service does not accurately reflect the current fair value, or when certain restricted or illiquid securities are being valued, such securities are valued as determined in good faith by the Adviser, in conformity with guidelines adopted by and subject to review by the Board. These securities are generally categorized as Level 3 securities.
Investments in open-end mutual funds, including money market mutual funds, are generally priced at the ending NAV provided by the service agent of the funds. These securities are categorized as Level 1 securities.
Debt securities are valued by using the mean between the closing bid and asked prices provided by a pricing service. If the closing bid and asked prices are not readily available, the pricing service may provide a price determined by a matrix pricing method. Matrix pricing is a mathematical technique used to value fixed income securities without relying exclusively on quoted prices. Matrix pricing takes into consideration recent transactions, yield, liquidity, risk, credit quality, coupon, maturity, type of issue and any other factors or market data the pricing service deems relevant for the actual security being priced and for other securities with similar characteristics. These securities will generally be categorized as Level 2 securities. If the Adviser decides that a price provided by the pricing service does not accurately reflect the fair value of the securities, when prices are not readily available from a pricing service, or when restricted or illiquid securities are being valued, securities are valued at fair value as determined in good faith by the Adviser, in conformity with
18
Preserver Alternative Opportunities Fund
Notes to Financial Statements (Unaudited) (continued)
February 28, 2017
guidelines adopted by and subject to review of the Board. These securities will generally be categorized as Level 3 securities.
Private investment funds exempt from registration as an investment company under the 1940 Act (each a “Private Fund”) will be fair valued using the NAV as a practical expedient, as provided by the Private Fund’s investment adviser or administrator. The Private Funds value their underlying investments in accordance with policies established by such Private Funds. The Adviser will consider whether it is appropriate, in light of the relevant circumstances, to value shares at NAV as reported by a Private Fund for valuation purposes, or whether to adjust such reported value to reflect an adjusted fair value.
In April 2015, the Financial Accounting Standards Board issued Accounting Standards Update (“ASU”) No. 2015-07 (“ASU 2015-07”), Fair Value Measurement (Topic 820), Disclosures for Investments in Certain Entities That Calculate Net Asset Value per Share (or its Equivalent). ASU 2015-07 removed the requirement to categorize within the fair value hierarchy all investments for which fair value is measured using the NAV per share as a practical expedient. As permitted, Private Funds with a fair value of $528,037 are excluded from the fair value hierarchy as of February 28, 2017.
In accordance with the Trust’s valuation procedures, the Adviser is required to consider all appropriate factors relevant to the value of securities for which it has determined other pricing sources are not available or reliable as described above. No single standard exists for determining fair value, because fair value depends upon the circumstances of each individual case. As a general principle, the current fair value of an issue of securities being valued by the Adviser would be the amount that the Fund might reasonably expect to receive for them upon their current sale. Methods which are in accordance with this principle may, for example, be based on (i) a multiple of earnings; (ii) a discount from market prices of a similar freely traded security (including a derivative security or a basket of securities traded on other markets, exchanges or among dealers); or (iii) yield to maturity with respect to debt issues, or a combination of these and other methods. Fair value pricing is permitted if, in the Adviser’s opinion, the validity of market quotations appears to be questionable based on factors such as evidence of a thin market in the security based on a small number of quotations, a significant event occurs after the close of a market but before the Fund’s NAV calculation that may affect a security’s value, or the Adviser is aware of any other data that calls into question the reliability of market quotations. Fair value pricing may also be used in instances when the bonds the Fund invests in may default or otherwise cease to have market quotations readily available.
19
Preserver Alternative Opportunities Fund
Notes to Financial Statements (Unaudited) (continued)
February 28, 2017
The following is a summary of the inputs used to value the Fund’s investments as of February 28, 2017:
| | | | | | | | | | | | | | | | |
| | | Valuation Inputs | | | | |
| Asset Category | | Level 1 | | | Level 2 | | | Level 3 | | | Total | |
Common Stocks | | $ | 7,338,491 | | | $ | – | | | $ | – | | | $ | 7,338,491 | |
Preferred Stocks | | | 717,240 | | | | – | | | | – | | | | 717,240 | |
Corporate Bonds | | | – | | | | 1,810,408 | | | | – | | | | 1,810,408 | |
Collateralized Mortgage Obligations | | | – | | | | 726,886 | | | | – | | | | 726,886 | |
Asset-Backed Securities | | | – | | | | 441,873 | | | | – | | | | 441,873 | |
U.S. Treasury Obligations | | | – | | | | 636,013 | | | | – | | | | 636,013 | |
Closed-End Funds | | | 1,732,374 | | | | – | | | | – | | | | 1,732,374 | |
Foreign Registered Closed-End Funds | | | 165,399 | | | | – | | | | – | | | | 165,399 | |
Exchange-Traded Funds | | | 353,187 | | | | – | | | | – | | | | 353,187 | |
Money Market Securities | | | 429,157 | | | | – | | | | – | | | | 429,157 | |
Total | | $ | 10,735,848 | | | $ | 3,615,180 | | | $ | – | | | $ | 14,351,028 | |
The Trust recognizes transfers between fair value hierarchy levels at the end of the reporting period. There were no transfers between any levels as of February 28, 2017 based on input levels assigned at August 31, 2016.
NOTE 4. FEES AND OTHER TRANSACTIONS WITH AFFILIATES AND OTHER SERVICE PROVIDERS
Under the terms of the investment advisory agreement (the “Agreement”), the Adviser manages the Fund’s investments subject to approval of the Board. As compensation for its management services, the Fund is obligated to pay the Adviser a fee computed and accrued daily and paid monthly at an annual rate of 0.75% of the Fund’s average daily net assets. For the six months ended February 28, 2017, the Adviser earned fees of $46,659 from the Fund. At February 28, 2016, the Fund owed the Adviser $4,523.
The Adviser has contractually agreed to waive its management fee and/or reimburse expenses so that total annual operating expenses (excluding (i) interest; (ii) taxes; (iii) brokerage fees and commissions; (iv) other extraordinary expenses not incurred in the ordinary course of the Fund’s business; (v) dividend expenses on short sales; (vi) expenses incurred under a Rule 12b-1 plan of distribution; and (vii) indirect expenses such as acquired fund fees and expenses) do not exceed 1.75% of the Fund’s average daily net assets through December 29, 2017 (“Expense Limitation”). During any fiscal year that the Agreement between the Adviser and Trust is in effect, the Adviser may recoup the sum of all fees previously waived or expenses reimbursed during any of the previous three fiscal years, less any reimbursement previously paid, if such recoupment can be achieved within the Expense Limitation as well as any expense limitation in effect at the time the reimbursement is made. This expense cap agreement may be terminated by the Board at any time.
20
Preserver Alternative Opportunities Fund
Notes to Financial Statements (Unaudited) (continued)
February 28, 2017
The amount subject to repayment by the Fund, pursuant to the aforementioned conditions, is as follows:
| | | | |
| Amount | | Recoverable through August 31, | |
| $61,712 | | | 2019 | |
| 35,551 | | | 2020 | |
The Trust retains Ultimus Asset Services, LLC (“Ultimus”) to provide the Fund with administration, accounting, transfer agent and compliance services, including all regulatory reporting. For the six months ended February 28, 2017, Ultimus earned fees of $14,132 for administration services, $6,942 for transfer agent services, and $11,157 for fund accounting services. At February 28, 2017, the Fund owed Ultimus $7,649 for such services.
The officers and one Trustee of the Trust are employees of Ultimus. Unified Financial Securities, LLC (the “Distributor”) acts as the principal distributor of the Fund’s shares. Both Ultimus and the Distributor operate as wholly-owned subsidiaries of Ultimus Fund Solutions, LLC.
The Fund has adopted a Distribution Plan (the “Plan”) pursuant to Rule 12b-1 under the 1940 Act. The Plan provides that the Fund will pay the Distributor and/or any registered securities dealer, financial institution or any other person (the “Recipient”) a fee of 0.25% of the average daily net assets of the Fund’s Retail Shares in connection with the promotion and distribution of the Fund’s Retail Shares or the provision of personal services to shareholders, including, but not necessarily limited to, advertising, compensation to underwriters, dealers and selling personnel, the printing and mailing of prospectuses to other than current shareholders of Retail Shares, the printing and mailing of sales literature and servicing shareholder accounts (“12b-1 Expenses”). The Fund or Distributor may pay all or a portion of these fees to any Recipient who renders assistance in distributing or promoting the sale of shares, or who provides certain shareholder services, pursuant to a written agreement. The Plan is a compensation plan, which means that compensation is provided regardless of whether 12b-1 Expenses are actually incurred. Accordingly, the 12b-1 Expenses of the Retail Shares of the Fund may be less than fees paid out by the class under the Plan. For the six months ended February 28, 2017, Retail Shares 12b-1 expense incurred by the Fund was $2,002. At February 28, 2017, the Fund owed the Distributor $657 for Retail Shares 12b-1 expenses.
NOTE 5. PURCHASES AND SALES OF SECURITIES
For the six months ended February 28, 2017, purchases and sales of investment securities, other than short-term investments, were as follows:
| | | | |
Purchases | | $ | 5,939,942 | |
Sales | | $ | 2,790,335 | |
There were no purchases or sales of long-term U.S. government obligations during the six months ended February 28, 2017.
21
Preserver Alternative Opportunities Fund
Notes to Financial Statements (Unaudited) (continued)
February 28, 2017
NOTE 6. FEDERAL TAX INFORMATION
As of February 28, 2017, the net unrealized appreciation (depreciation) of investments for tax purposes was as follows:
| | | | |
Gross Unrealized Appreciation | | $ | 1,233,269 | |
Gross Unrealized Depreciation | | | (129,221 | ) |
Net Unrealized Appreciation (Depreciation) | | $ | 1,104,048 | |
At February 28, 2017, the aggregate cost of securities for federal income tax purposes was $13,775,017 for the Fund.
At February 28, 2017, the difference between book basis and tax basis unrealized appreciation was attributable primarily to the mark-to-market adjustments on passive foreign investment companies, the tax treatment of Grantor Trusts and the return of capital adjustments from real estate investment trusts.
At August 31, 2016, the Fund’s most recent fiscal year end, the components of distributable earnings (accumulated losses) on a tax basis was as follows:
| | | | |
Undistributed Ordinary Income | | $ | 149,322 | |
Undistributed Long-Term Capital Gains | | | 4,537 | |
Unrealized Appreciation (Depreciation)(a) | | | 480,853 | |
Total Accumulated Earnings (Deficit) | | $ | 634,712 | |
| (a) | | The difference between book basis and tax basis unrealized appreciation (depreciation), including foreign currency translation, is attributable to the mark-to-market adjustments on passive foreign investment companies, the tax treatment of Grantor Trusts and the return of capital adjustments from real estate investment trusts. |
NOTE 7. BENEFICIAL OWNERSHIP
The beneficial ownership, either directly or indirectly, of 25% or more of the voting securities of a fund creates a presumption of control of a fund, under Section 2(a) (9) of the 1940 Act. At February 28, 2017, Charles Schwab & Co., Inc. (“Schwab”) owned, as record shareholder, 86% of the outstanding shares of the Fund. It is not known whether Schwab or any of the underlying beneficial owners owned or controlled 25% or more of the voting securities of the Fund.
NOTE 8. COMMITMENTS AND CONTINGENCIES
The Fund indemnifies its officers and trustees for certain liabilities that may arise from the performance of their duties to the Fund. Additionally, in the normal course of business, the Fund enters into contracts that contain a variety of representations and warranties which provide general indemnifications. The Fund’s maximum exposure under these arrangements is unknown, as this would involve future claims that may be made against the Fund that have not yet occurred.
NOTE 9. SUBSEQUENT EVENTS
Management of the Fund has evaluated the need for disclosures and/or adjustments resulting from subsequent events through the date these financial statements were issued. Based upon this evaluation, management has determined there were no items requiring adjustment of the financial statements or additional disclosure.
22
Summary of Fund Expenses (Unaudited)
As a shareholder of the Fund, you incur two types of costs: (1) transaction costs, including short-term redemption fees and (2) ongoing costs, including management fees, distribution and service (12b-1) fees, and other Fund expenses. These examples are intended to help you understand your ongoing costs (in dollars) of investing in the Fund and to compare these costs with the ongoing costs of investing in other mutual funds.
The example is based on an investment of $1,000 invested at the beginning of the period and held for the entire period from September 1, 2016 through February 28, 2017.
Actual Expenses
The first line of the table for each class provides information about actual account values and actual expenses. You may use the information in these lines, together with the amount you invested, to estimate the expenses that you paid over the period. Simply divide your account value by $1,000 (for example, an $8,600 account value divided by $1,000 = 8.60), then multiply the result by the number in the first line under the heading “Expenses Paid During Period” to estimate the expenses you paid on your account during this period.
Hypothetical Example for Comparison Purposes
The second line of the table for each class provides information about hypothetical account values and hypothetical expenses based on the Fund’s actual expense ratios and an assumed rate of return of 5% per year before expenses, which is not the Fund’s actual return. The hypothetical account values and expenses may not be used to estimate the actual ending account balances or expenses you paid for the period. You may use this information to compare the ongoing costs of investing in the Fund and other funds. To do so, compare this 5% hypothetical example with the 5% hypothetical examples that appear in the shareholder reports of the other funds.
Expenses shown in the table are meant to highlight your ongoing costs only and do not reflect any transactional costs such as the fee imposed on sales charges and short-term redemptions. Therefore, the second line of the table for each class is useful in comparing ongoing costs only and will not help you determine the relative total costs of owning different funds. In addition, if transaction costs were included, your costs would have been higher.
23
Summary of Fund Expenses (Unaudited) (continued)
| | | | | | | | | | | | | | | | | | |
| | | | | Beginning
Account
Value,
September 1,
2016 | | | Ending
Account
Value,
February 28,
2017 | | | Expenses
Paid
During
Period(a) | | | Annualized
Expense
Ratio | |
Preserver Alternative Opportunities Fund | | | | | | | | | | | | | |
Institutional Shares | | Actual | | $ | 1,000.00 | | | $ | 1,055.00 | | | $ | 8.92 | | | | 1.75 | % |
| | | | | | | | | | | | | | | | | | |
| | Hypothetical(b) | | $ | 1,000.00 | | | $ | 1,016.12 | | | $ | 8.75 | | | | 1.75 | % |
| | | | | | | | | | | | | | | | | | |
Retail Shares | | Actual | | $ | 1,000.00 | | | $ | 1,054.90 | | | $ | 10.19 | | | | 2.00 | % |
| | | | | | | | | | | | | | | | | | |
| | Hypothetical(b) | | $ | 1,000.00 | | | $ | 1,014.88 | | | $ | 9.99 | | | | 2.00 | % |
| (a) | | Expenses are equal to the Fund’s annualized expense ratios, multiplied by the average account value over the period, multiplied by 181/365 (to reflect the one-half year period). |
| (b) | | Hypothetical assumes 5% annual return before expenses. |
24
CAPITOL SERIES TRUST
PRIVACY POLICY
(Unaudited)
Capitol Series Trust (the “Trust”) on behalf of each of its series (each a “Fund,” collectively the “Funds”) adopts the following privacy policy in order to safeguard the personal information of its consumers and customers that are individuals in accordance with Securities and Exchange Commission Regulation S-P,17 CFR 284.30.
We collect only relevant information about a Fund’s shareholders that the law allows or requires us to have in order to conduct our business and properly service you. We collect financial and personal information about you (“Personal Information”) directly (e.g., information on account applications and other forms, such as your name, address, and social security number, and information provided to access account information or conduct account transactions online, such as password, account number, e-mail address, and alternate telephone number), and indirectly (e.g., information about your transactions with us, such as transaction amounts, account balance and account holdings).
The Trust does not disclose any non-public personal information about its shareholders or former shareholders other than for everyday business purposes such as to process a transaction, service an account, to respond to court orders and legal investigations or as otherwise permitted by law. Third parties that may receive this information include companies that provide transfer agency, technology and administrative services to a Fund, as well as the Fund’s investment adviser who is an affiliate of the Fund. If you maintain a retirement/educational custodial account directly with a Fund, we may also disclose your Personal Information to the custodian for that account for shareholder servicing purposes. We limit access to your Personal Information provided to unaffiliated third parties to information necessary to carry out their assigned responsibilities to a Fund. All shareholder records will be disposed of in accordance with applicable law.
The Trust maintains physical, electronic and procedural safeguards to protect Personal Information and requires its third parties service provides with access to such information to treat the Personal Information with the same high degree of confidentiality.
In the event that a shareholder holds shares of a Fund through a financial intermediary, including, but not limited to, a broker-dealer, bank, credit union or trust company, the privacy policy of the shareholders’ financial intermediary would govern how their non-public personal information would be shared with unaffiliated third parties.
25
PROXY VOTING (Unaudited)
A description of the policies and procedures that the Fund uses to determine how to vote proxies relating to portfolio securities and information regarding how the Fund voted those proxies during the most recent twelve month period ended June 30, is available without charge upon request by (1) calling the Fund at (844) 838-2119 and (2) from Fund documents filed with the Securities and Exchange Commission (“SEC”) on the SEC’s website at www.sec.gov.
TRUSTEES
Robert G. Dorsey, Chairman
Walter B. Grimm
Mary M. Morrow
OFFICERS
Matthew J. Miller, Chief Executive Officer and President
John C. Swhear, Chief Compliance Officer, AML Officer and Vice President
Stacey Havens, Vice President
Zachary P. Richmond, Treasurer and Chief Financial Officer
Tiffany Franklin, Secretary
INVESTMENT ADVISER
PreserverPartners, LLC
8700 Trail Lake Drive West, Suite 105
Memphis, TN 38125
DISTRIBUTOR
Unified Financial Securities, LLC
9465 Counselors Row, Suite 200
Indianapolis, IN 46240
INDEPENDENT REGISTERED PUBLIC ACCOUNTING FIRM
Ernst & Young LLP
800 Yard Street, Suite 500
Grandview Heights, OH 43212
LEGAL COUNSEL
Bernstein Shur
100 Middle Street, 6th Floor
Portland, ME 04104
CUSTODIAN
Huntington National Bank
41 South High Street
Columbus, OH 43215
ADMINISTRATOR, TRANSFER AGENT AND FUND ACCOUNTANT
Ultimus Asset Services, LLC
225 Pictoria Drive, Suite 450
Cincinnati, OH 45246
This report is intended only for the information of shareholders or those who have received the Fund’s prospectus which contains information about the Fund’s management fee and expenses. Please read the prospectus carefully before investing.
Distributed by Unified Financial Securities, LLC
Member FINRA/SIPC

HEDEKER STRATEGIC APPRECIATION FUND
Institutional Shares – SAFFX
Semi-Annual Report
February 28, 2017
Hedeker Wealth LLC
One Overlook Point, Suite 250
Lincolnshire, Illinois 60069
(800) 657-4450
Investment Results (Unaudited)
Total Return(a) as of February 28, 2017
| | | | |
| | | Since
Inception
(12/21/2016) | |
Hedeker Strategic Appreciation Fund | | | | |
Institutional Shares | | | 0.84 | % |
Bloomberg Barclays Intermediate Government/Credit Index (b) | | | 1.22 | % |
| | | Expense Ratio(c) | |
| |
| Institutional
Shares |
|
| | | | |
Net | | | 1.47 | % |
The performance quoted represents past performance, which does not guarantee future results. The investment return and principal value of an investment will fluctuate so that an investor’s shares, when redeemed, may be worth more or less than their original cost. The returns shown do not reflect deduction of taxes that a shareholder would pay on the Hedeker Strategic Appreciation Fund (the "Fund") distributions or the redemption of Fund shares. Current performance of the Fund may be lower or higher than the performance quoted. The Fund's investment objectives, risks, charges and expenses must be considered carefully before investing. Performance data current to the most recent month end may be obtained by calling (800) 657-4450.
(a) Return figures reflect any change in price per share and assume the reinvestment of all distributions. The Fund's returns reflect any fee waivers during the applicable period. If such waivers had not occurred, the quoted performance would have been lower.
(b) The Bloomberg Barclays Intermediate Government/Credit Index ("Index") is a broad-based flagship benchmark that measures the non-securitized component of the US Aggregate Index. It includes investment grade, US dollar-denominated, fixed-rate Treasuries, government-related and corporate securities. The returns of the Index do not reflect the deduction of fees and expenses, whereas the Fund returns are shown net of fees. An individual cannot invest directly in an index.
(c) The expense ratio is from the Fund's prospectus dated December 21, 2016. Hedeker Wealth LLC (the “Adviser”), the Fund’s adviser, has contractually agreed, until December 31, 2018, to waive its management fee and/or reimburse expenses so that total annual operating expenses (excluding (i) interest; (ii) taxes; (iii) brokerage fees and commissions; (iv) other extraordinary expenses not incurred in the ordinary course of the Fund’s business; (v) dividend expenses on short sales; and (vi) indirect expenses such as acquired fund fees and expenses) do not exceed 1.75% of the Fund’s average daily net assets. This expense cap agreement may be terminated by the Board of Trustees at any time. Additional information pertaining to the Fund's expense ratios as of February 28, 2017, can be found in the financial highlights.
The Fund's investment objectives, strategies, risks, charges and expenses must be considered carefully before investing. The prospectus contains this and other important information about the Fund and may be obtained by calling the same number as above. Please read it carefully before investing.
The Fund is distributed by Ultimus Fund Distributors, LLC, member FINRA/SIPC.
1
Portfolio Illustration (Unaudited)
February 28, 2017
The following chart gives a visual breakdown of the Fund’s holdings as a percentage of the fair value of portfolio investments.
Availability of Portfolio Schedule (Unaudited)
The Fund files its complete schedule of portfolio holdings with the Securities and Exchange Commission (“SEC”) for the first and third quarter of each fiscal year on Form N-Q. The Fund’s Forms N-Q will be available at the SEC’s website at www.sec.gov. The Fund’s Forms N-Q may be reviewed and copied at the Public Reference Room in Washington, DC. Information on the operation of the Public Reference Room may be obtained by calling 1-800-SEC-0330.
2
Hedeker Strategic Appreciation Fund
Schedule of Investments (Unaudited)
February 28, 2017
| | | | | | | | |
Principal
Amount | | | | | Fair Value | |
| | CONVERTIBLE BONDS – 91.23% | |
| |
| | | | Consumer Discretionary – 10.61% | |
| $ | 325,000 | | | Global Eagle Entertainment, Inc., 2.75%, 2/15/2035 | | $ | 196,625 | |
| | 1,000,000 | | | Live Nation Entertainment, Inc., 2.50%, 5/15/2019 | | | 1,073,125 | |
| | 900,000 | | | Meritage Homes Corp., 1.88%, 9/15/2032 | | | 901,687 | |
| | 1,250,000 | | | Priceline Group, Inc./The, 0.90%, 9/15/2021 | | | 1,403,125 | |
| | 1,200,000 | | | Shutterfly, Inc., 0.25%, 5/15/2018 | | | 1,194,000 | |
| | | | | | | | |
| | | | | | | 4,768,562 | |
| | | | | | | | |
| |
| | | | Financials – 24.56% | |
| | 1,350,000 | | | Apollo Commercial Real Estate Finance, Inc., 5.50%, 3/15/2019 | | | 1,447,882 | |
| | 1,600,000 | | | AmTrust Financial Services, Inc., 2.75%, 12/15/2044 | | | 1,288,000 | |
| | 888,000 | | | BlackRock Capital Investment Corp., 5.50%, 2/15/2018 | | | 915,750 | |
| | 1,100,000 | | | Blackstone Mortgage Trust, Inc., 5.25%, 12/1/2018 | | | 1,244,375 | |
| | 808,000 | | | GSV Capital Corp., 5.25%, 9/15/2018 | | | 798,910 | |
| | 1,000,000 | | | New Mountain Finance Corp., 5.00%, 6/15/2019 | | | 1,033,125 | |
| | 1,050,000 | | | Safeguard Scientifics, Inc., 5.25%, 5/15/2018 | | | 1,071,000 | |
| | 1,200,000 | | | Starwood Property Trust, Inc., 3.75%, 10/15/2017 | | | 1,227,750 | |
| | 1,200,000 | | | TCP Capital Corp., 5.25%, 12/15/2019 | | | 1,254,000 | |
| | 750,000 | | | Two Harbors Investment Corp., 6.25%, 1/15/2022 | | | 755,156 | |
| | | | | | | | |
| | | | | | | 11,035,948 | |
| | | | | | | | |
| |
| | | | Health Care – 13.90% | |
| | 1,243,000 | | | Aceto Corp., 2.00%, 11/1/2020 | | | 1,125,692 | |
| | 1,000,000 | | | Allscripts Healthcare Solutions, Inc., 1.25%, 7/1/2020 | | | 990,625 | |
| | 1,250,000 | | | Impax Laboratories, Inc., 2.00%, 6/15/2022 | | | 1,024,219 | |
| | 1,350,000 | | | Jazz Investments I Ltd., 1.88%, 8/15/2021 | | | 1,402,312 | |
| | 600,000 | | | Quidel Corp., 3.25%, 12/15/2020 | | | 606,000 | |
| | 1,000,000 | | | Teva Pharmaceutical Finance Co. LLC, Series C, 0.25%, 2/1/2026 | | | 1,098,750 | |
| | | | | | | | |
| | | | | | | 6,247,598 | |
| | | | | | | | |
| |
| | | | Industrials – 8.47% | |
| | 1,000,000 | | | 51job, Inc., 3.25%, 4/15/2019 | | | 1,075,000 | |
| | 1,217,000 | | | Echo Global Logistics, Inc., 2.50%, 5/1/2020 | | | 1,160,714 | |
| | 1,664,000 | | | Huron Consulting Group, Inc., 1.25%, 10/1/2019 | | | 1,569,360 | |
| | | | | | | | |
| | | | | | | 3,805,074 | |
| | | | | | | | |
| |
| | | | Information Technology – 27.27% | |
| | 1,000,000 | | | Akamai Technologies, Inc., 0.00%, 2/15/2019(a) | | | 1,008,130 | |
| | 1,350,000 | | | Bottomline Technologies, Inc., 1.50%, 12/1/2017 | | | 1,403,156 | |
| | 1,153,000 | | | CalAmp Corp., 1.63%, 5/15/2020 | | | 1,143,632 | |
| | 850,000 | | | Cornerstone OnDemand, Inc., 1.50%, 7/1/2018 | | | 887,187 | |
| | 1,000,000 | | | Electronics For Imaging, Inc., 0.75%, 9/1/2019 | | | 1,058,125 | |
| | 1,200,000 | | | Infinera Corp., 1.75%, 6/1/2018 | | | 1,297,500 | |
See accompanying notes which are an integral part of these financial statements.
3
Hedeker Strategic Appreciation Fund
Schedule of Investments (Unaudited) (continued)
February 28, 2017
| | | | | | | | |
Principal
Amount | | | | | Fair Value | |
| | CONVERTIBLE BONDS – (continued) | |
| |
| | | | Information Technology – (continued) | |
| $ | 1,039,000 | | | Nuance Communications, Inc., 2.75%, 11/1/2031 | | $ | 1,045,494 | |
| | 1,000,000 | | | NXP Semiconductors NV, 1.00%, 12/1/2019 | | | 1,158,750 | |
| | 1,350,000 | | | Synchronoss Technologies, Inc., 0.75%, 8/15/2019 | | | 1,283,344 | |
| | 1,200,000 | | | Verint Systems, Inc., 1.50%, 6/1/2021 | | | 1,143,750 | |
| | 800,000 | | | Yahoo!, Inc., 0.00%, 12/1/2018(a) | | | 829,000 | |
| | | | | | | | |
| | | | | | | 12,258,068 | |
| | | | | | | | |
| |
| | | | Real Estate – 6.42% | |
| | 824,000 | | | Colony NorthStar, Inc., 3.88%, 1/15/2021 | | | 844,600 | |
| | 350,000 | | | Resource Capital Corp., 8.00%, 1/15/2020 | | | 346,719 | |
| | 1,650,000 | | | Spirit Realty Capital, Inc., 2.88%, 5/15/2019 | | | 1,696,414 | |
| | | | | | | | |
| | | | | | | 2,887,733 | |
| | | | | | | | |
| | | | Total Convertible Bonds (Cost $41,113,330) | | | 41,002,983 | |
| | | | | | | | |
| | |
Shares | | | | | | |
| | CONVERTIBLE PREFERRED STOCKS – 3.18% | | | | |
| |
| | | | Financials – 3.18% | |
| | 2,000 | | | KeyCorp, Series A, 7.75% | | | 270,000 | |
| | 23,000 | | | NY Community Capital Trust V, 6.00% | | | 1,160,350 | |
| | | | | | | | |
| | | | Total Convertible Preferred Stocks (Cost $1,422,460) | | | 1,430,350 | |
| | | | | | | | |
|
| | MONEY MARKET SECURITIES – 8.88% | |
| | 3,989,129 | | | Fidelity Investments Government Money Market Portfolio, Institutional Class, 0.49%(b) | | | 3,989,129 | |
| | | | | | | | |
| | | | Total Money Market Securities (Cost $3,989,129) | | | 3,989,129 | |
| | | | | | | | |
| | |
| | | | Total Investments – 103.29% (Cost $46,524,919) | | | 46,422,462 | |
| | | | | | | | |
| | |
| | | | Liabilities in Excess of Other Assets – (3.29)% | | | (1,476,487 | ) |
| | | | | | | | |
| | |
| | | | NET ASSETS – 100.00% | | $ | 44,945,975 | |
| | | | | | | | |
| (b) | | Rate disclosed is the seven day effective yield as of February 28, 2017. |
The sectors shown on the schedule of investments are based on Global Industry Classification Standard, or GICS® (“GICS”). The GICS was developed by and/or is the exclusive property of MSCI, Inc. and Standard & Poor’s Financial Services LLC (“S&P”). GICS is a service mark of MSCI, Inc. and S&P and has been licensed for use by Ultimus Fund Solutions, LLC.
See accompanying notes which are an integral part of these financial statements.
4
Hedeker Strategic Appreciation Fund
Statement of Assets and Liabilities (Unaudited)
February 28, 2017
| | | | |
Assets | | | | |
Investments in securities at fair value (cost $46,524,919) | | $ | 46,422,462 | |
Receivable for fund shares sold | | | 325,000 | |
Dividends and interest receivable | | | 257,108 | |
Deferred offering costs | | | 7,372 | |
Prepaid expenses | | | 641 | |
Total Assets | | | 47,012,583 | |
Liabilities | | | | |
Payable for investments purchased | | | 2,003,500 | |
Payable to Adviser | | | 35,107 | |
Payable to administrator, compliance, fund accountant and transfer agent | | | 8,811 | |
Payable to trustees | | | 716 | |
Other accrued expenses | | | 18,474 | |
Total Liabilities | | | 2,066,608 | |
Net Assets | | $ | 44,945,975 | |
Net Assets consist of: | | | | |
Paid-in capital | | $ | 44,812,996 | |
Accumulated undistributed net investment income | | | 7,636 | |
Accumulated undistributed net realized gain from investments | | | 227,800 | |
Net unrealized depreciation on investments | | | (102,457 | ) |
Net Assets | | $ | 44,945,975 | |
Shares outstanding (unlimited number of shares authorized, no par value) | | | 1,782,538 | |
Net asset value ("NAV"), offering and redemption price per share | | $ | 25.21 | |
5
See accompanying notes which are an integral part of these financial statements.
Hedeker Strategic Appreciation Fund
Statement of Operations (Unaudited)
For the period ended February 28, 2017(a)
| | | | |
Investment Income | | | | |
Dividend income | | $ | 25,073 | |
Interest income | | | 79,279 | |
Total investment income | | | 104,352 | |
Expenses | | | | |
Investment Adviser | | | 55,250 | |
Administration | | | 7,215 | |
Organizational | | | 6,136 | |
Audit | | | 5,591 | |
Fund accounting | | | 5,279 | |
Offering | | | 4,498 | |
Legal | | | 2,557 | |
Transfer agent | | | 2,278 | |
Printing | | | 2,209 | |
Compliance | | | 1,139 | |
Custodian | | | 1,036 | |
Trustee | | | 716 | |
Pricing | | | 696 | |
Registration | | | 192 | |
Miscellaneous | | | 4,520 | |
Total expenses | | | 99,312 | |
Fees contractually waived by Adviser | | | (2,596 | ) |
Net operating expenses | | | 96,716 | |
Net investment income | | | 7,636 | |
Net Realized and Unrealized Gain (Loss) on Investments | | | | |
Net realized gain on investment securities transactions | | | 227,800 | |
Net change in unrealized depreciation of investment securities | | | (102,457 | ) |
Net realized and unrealized gain on investments | | | 125,343 | |
Net increase in net assets resulting from operations | | $ | 132,979 | |
| (a) | | For the period December 21, 2016 (commencement of operations) to February 28, 2017. |
6
See accompanying notes which are an integral part of these financial statements.
Hedeker Strategic Appreciation Fund
Statement of Changes in Net Assets
| | | | |
| | | For the Period Ended
February 28, 2017(a)
(Unaudited) | |
Increase (Decrease) in Net Assets due to: Operations | | | | |
Net investment income | | $ | 7,636 | |
Net realized gain on investment securities transactions | | | 227,800 | |
Net change in unrealized depreciation of investment securities | | | (102,457 | ) |
Net increase in net assets resulting from operations | | | 132,979 | |
Capital Transactions | | | | |
Proceeds from shares sold | | | 47,309,047 | |
Amount paid for shares redeemed | | | (2,496,051 | ) |
Net increase in net assets resulting from capital transactions | | | 44,812,996 | |
Total Increase in Net Assets | | | 44,945,975 | |
Net Assets | | | | |
Beginning of period | | | — | |
End of period | | $ | 44,945,975 | |
Accumulated undistributed net investment income included in net assets at end of period | | $ | 7,636 | |
Share Transactions | | | | |
Shares sold | | | 1,881,274 | |
Shares redeemed | | | (98,736 | ) |
Net increase in shares outstanding | | | 1,782,538 | |
| (a) | | For the period December 21, 2016 (commencement of operations) to February 28, 2017. |
7
See accompanying notes which are an integral part of these financial statements.
Hedeker Strategic Appreciation Fund - Institutional Shares
Financial Highlights
Selected data for a share outstanding throughout the period.
| | | | |
| | | For the period ended
February 28, 2017(a)
(Unaudited) | |
Net asset value, at beginning of period | | | $25.00 | |
| | | | |
| |
Income from investment operations: | | | | |
| |
Net investment income | | | — | (b) |
| |
Net realized and unrealized gain on investments | | | 0.21 | |
| | | | |
| |
Total from investment operations | | | 0.21 | |
| | | | |
Net asset value, at end of period | | | $25.21 | |
| | | | |
| |
Total Return(c) | | | 0.84 | %(d) |
| | | | |
Ratios/Supplemental Data: | |
| |
Net assets at end of period (thousands) | | | $44,946 | |
| |
Before waiver: | | | | |
| |
Ratio of expenses to average net assets | | | 1.80 | %(e) |
| |
After waiver: | | | | |
| |
Ratio of expenses to average net assets | | | 1.75 | %(e) |
| |
Ratio of net investment income to average net assets | | | 0.14 | %(e) |
| |
Portfolio turnover | | | 30 | %(d) |
| (a) | | For the period December 21, 2016 (commencement of operations) through February 28, 2017. |
| (b) | | Amount is less than $0.005 per share. |
| (c) | | Total return in the above table represents the rate that the investor would have earned or lost on an investment in the Fund, assuming reinvestment of distributions. |
8
See accompanying notes which are an integral part of these financial statements.
Hedeker Strategic Appreciation Fund
Notes to the Financial Statements (Unaudited)
February 28, 2017
NOTE 1. ORGANIZATION
The Hedeker Strategic Appreciation Fund (the “Fund”) was organized as a non-diversified series of Capitol Series Trust (the “Trust”) on December 15, 2016. The Trust is an open-end investment company established under the laws of Ohio by an Agreement and Declaration of Trust dated September 18, 2013 (the “Trust Agreement”). The Trust Agreement permits the Board of Trustees of the Trust (the “Board”) to issue an unlimited number of shares of beneficial interest of separate series without par value. The Fund is one of a series of funds currently authorized by the Board. The Fund’s investment adviser is Hedeker Wealth LLC (the “Adviser”). The investment objective of the Fund is to seek superior risk-adjusted returns over a market cycle.
The Fund currently offers one class of shares, Institutional Shares. The Fund commenced operations on December 21, 2016. Each share represents an equal proportionate interest in the assets and liabilities belonging to the Fund and is entitled to such dividends and distributions out of income belonging to the Fund as are declared by the Board.
NOTE 2. SIGNIFICANT ACCOUNTING POLICIES
The Fund is an investment company and follows accounting and reporting guidance under Financial Accounting Standards Board Accounting Standards Codification (“ASC”) Topic 946, “Financial Services-Investments Companies”. The following is a summary of significant accounting policies followed by the Fund in the preparation of its financial statements. These policies are in conformity with generally accepted accounting principles in the United States of America (“GAAP”).
Estimates - The preparation of financial statements in conformity with GAAP requires management to make estimates and assumptions that affect the reported amounts of assets and liabilities and disclosure of contingent assets and liabilities at the date of the financial statements and the reported amounts of increases and decreases in net assets from operations during the reporting period. Actual results could differ from those estimates.
Securities Valuation - All investments in securities are recorded at their estimated fair value as described in Note 3.
Federal Income Taxes - The Fund makes no provision for federal income tax or excise tax. The Fund intends to qualify each year as a regulated investment company (“RIC”) under subchapter M of the Internal Revenue Code of 1986, as amended, by complying with the requirements applicable to RICs and by distributing substantially all of its taxable income. The Fund also intends to distribute sufficient net investment income and net capital gains, if any, so that it will not be subject to excise tax on undistributed income and gains. If the required amount of net investment income or gains is not distributed, the Fund could incur a tax expense.
As of, and during the period ended February 28, 2017, the Fund did not have a liability for any unrecognized tax benefits. The Fund recognizes interest and penalties, if any, related to unrecognized tax benefits as income tax expense in the Statement of Operations. During the period, the Fund did not incur any interest or penalties.
9
Hedeker Strategic Appreciation Fund
Notes to the Financial Statements (Unaudited) (continued)
February 28, 2017
Expenses - Expenses incurred by the Trust that do not relate to a specific fund of the Trust are allocated to the individual funds based on each fund’s relative net assets or another appropriate basis (as determined by the Board).
Security Transactions and Related Income - Throughout the reporting period, security transactions are accounted for no later than one business day following the trade date. For financial reporting purposes, security transactions are accounted for on trade date on the last business day of the reporting period. The specific identification method is used for determining gains or losses for financial statements and income tax purposes. Dividend income is recorded on the ex-dividend date. Interest income is recorded on an accrual basis and includes, where applicable, the amortization of premium or accretion of discount.
Dividends and Distributions – The Fund intends to distribute substantially all of its net investment income, if any, as dividends to its shareholders on a quarterly basis. The Fund intends to distribute its net realized long-term capital gains and its net realized short-term capital gains, if any, to its shareholders at least once a year. Distributions to shareholders are recorded on the ex-dividend date. The amounts of dividends from net investment income and distributions from net realized gains are determined in accordance with federal income tax regulations, which may differ from GAAP. These differences are caused primarily by differences in the timing of the recognition of certain components of income, expense or realized capital gains for federal income tax purposes. Where such differences are permanent in nature, they are reclassified in the components of net assets based on their ultimate characterization for federal income tax purposes. Any such reclassifications will have no effect on net assets, results of operations or net asset values per share of the Fund.
NOTE 3. SECURITIES VALUATION AND FAIR VALUE MEASUREMENTS
Fair value is defined as the price that the Fund would receive upon selling an investment in an orderly transaction to an independent buyer in the principal or most advantageous market of the investment. GAAP establishes a three-tier hierarchy to maximize the use of observable market data and minimize the use of unobservable inputs and to establish classification of fair value measurements for disclosure purposes.
Inputs refer broadly to the assumptions that market participants would use in pricing the asset or liability, including assumptions about risk (the risk inherent in a particular valuation technique used to measure fair value such as a pricing model and/or the risk inherent in the inputs to the valuation technique). Inputs may be observable or unobservable. Observable inputs are inputs that reflect the assumptions market participants would use in pricing the asset or liability developed based on market data obtained from sources independent of the reporting entity. Unobservable inputs are inputs that reflect the reporting entity’s own assumptions about the assumptions market participants would use in pricing the asset or liability developed based on the best information available in the circumstances.
10
Hedeker Strategic Appreciation Fund
Notes to the Financial Statements (Unaudited) (continued)
February 28, 2017
Various inputs are used in determining the value of the Fund’s investments. These inputs are summarized in the three broad levels listed below.
| | • | | Level 1 – unadjusted quoted prices in active markets for identical investments and/or registered investment companies where the value per share is determined and published and is the basis for current transactions for identical assets or liabilities at the valuation date |
| | • | | Level 2 – other significant observable inputs (including, but not limited to, quoted prices for an identical security in an inactive market, quoted prices for similar securities, interest rates, prepayment speeds, credit risk, etc.) |
| | • | | Level 3 – significant unobservable inputs (including the Fund’s own assumptions in determining fair value of investments based on the best information available) |
The inputs used to measure fair value may fall into different levels of the fair value hierarchy. In such cases, for disclosure purposes, the level in the fair value hierarchy within which the fair value measurement falls in its entirety is determined based on the lowest level input that is significant to the fair value measurement in its entirety.
In computing the net asset value (“NAV”) of the Fund, fair value is based on market valuations with respect to portfolio securities for which market quotations are readily available. Pursuant to Board approved policies, the Fund relies on independent third-party pricing services to provide the current market value of securities. Those pricing services value equity securities traded on a securities exchange at the last reported sales price on the principal exchange. Equity securities quoted by NASDAQ are valued at the NASDAQ Official Closing Price. If there is no reported sale on the principal exchange, equity securities are valued at the mean between the most recent quoted bid and asked price. When using the market quotations or close prices provided by the pricing service and when the market is considered active, the security will be classified as a Level 1 security.
Sometimes, an equity security owned by the Fund will be valued by the pricing service with factors other than market quotations or when the market is considered inactive. When this happens, the security may be classified as a Level 2 security. When market quotations are not readily available, when the Fund determines that the market quotation or the price provided by the pricing service does not accurately reflect the current fair value, or when certain restricted or illiquid securities are being valued, such securities are valued as determined in good faith by the Adviser, in conformity with guidelines adopted by and subject to review by the Board. These securities are generally categorized as Level 3 securities.
Investments in open-end mutual funds, including money market mutual funds, are generally priced at the ending NAV provided by the service agent of the funds. These securities are categorized as Level 1 securities.
Debt securities are valued by using the mean between the closing bid and asked prices provided by a pricing service. If the closing bid and asked prices are not readily available, the pricing service may provide a price determined by a matrix pricing method. Matrix pricing is a mathematical technique used to value fixed income securities without relying exclusively on quoted prices. Matrix pricing takes into consideration recent transactions, yield, liquidity, risk, credit quality, coupon, maturity,
11
Hedeker Strategic Appreciation Fund
Notes to the Financial Statements (Unaudited) (continued)
February 28, 2017
type of issue and any other factors or market data the pricing service deems relevant for the actual security being priced and for other securities with similar characteristics. These securities will generally be categorized as Level 2 securities. If the Adviser decides that a price provided by the pricing service does not accurately reflect the fair value of the securities, when prices are not readily available from a pricing service, or when restricted or illiquid securities are being valued, securities are valued at fair value as determined in good faith by the Adviser, in conformity with guidelines adopted by and subject to review of the Board. These securities will generally be categorized as Level 3 securities.
In accordance with the Trust’s valuation procedures, the Adviser is required to consider all appropriate factors relevant to the value of securities for which it has determined other pricing sources are not available or reliable as described above. No single standard exists for determining fair value, because fair value depends upon the circumstances of each individual case. As a general principle, the current fair value of an issue of securities being valued by the Adviser would be the amount that the Fund might reasonably expect to receive for them upon their current sale. Methods which are in accordance with this principle may, for example, be based on (i) a multiple of earnings; (ii) a discount from market prices of a similar freely traded security (including a derivative security or a basket of securities traded on other markets, exchanges or among dealers); or (iii) yield to maturity with respect to debt issues, or a combination of these and other methods. Fair value pricing is permitted if, in the Adviser’s opinion, the validity of market quotations appears to be questionable based on factors such as evidence of a thin market in the security based on a small number of quotations, a significant event occurs after the close of a market but before the Fund’s NAV calculation that may affect a security’s value, or the Adviser is aware of any other data that calls into question the reliability of market quotations. Fair value pricing may also be used in instances when the bonds the Fund invests in may default or otherwise cease to have market quotations readily available.
The following is a summary of the inputs used to value the Fund’s investments as of February 28, 2017:
| | | | | | | | | | | | | | | | |
| | | Valuation Inputs | | | | |
| Assets | | Level 1 | | | Level 2 | | | Level 3 | | | Total | |
Convertible Bonds | | $ | — | | | $ | 41,002,983 | | | $ | — | | | $ | 41,002,983 | |
Convertible Preferred Stocks | | | 1,430,350 | | | | — | | | | — | | | | 1,430,350 | |
Money Market Securities | | | 3,989,129 | | | | — | | | | — | | | | 3,989,129 | |
Total | | $ | 5,419,479 | | | $ | 41,002,983 | | | $ | — | | | $ | 46,422,462 | |
The Fund did not hold any investments at any time during the reporting period in which significant unobservable inputs (Level 3) were used in determining fair value; therefore, no reconciliation of Level 3 securities is included for this reporting period. The Fund did not hold any derivative instruments during the reporting period.
The Trust recognizes transfers between fair value hierarchy levels at the end of the reporting period. There were no transfers between any levels as of February 28, 2017 based on input levels assigned on December 21, 2016 (commencement of operations).
12
Hedeker Strategic Appreciation Fund
Notes to the Financial Statements (Unaudited) (continued)
February 28, 2017
NOTE 4. FEES AND OTHER TRANSACTIONS WITH AFFILIATES AND OTHER SERVICE PROVIDERS
Under the terms of the investment advisory agreement (the “Agreement”), the Adviser manages the Fund’s investments subject to approval of the Board. As compensation for its management services, the Fund is obligated to pay the Adviser a fee computed and accrued daily and paid monthly at an annual rate of 1.00% of the Fund’s average daily net assets. For the period ended February 28, 2017, the Adviser earned fees of $55,250 from the Fund. At February 28, 2017, the Fund owed the Adviser $35,107.
The Adviser has contractually agreed to waive its management fee and/or reimburse expenses so that total annual operating expenses (excluding (i) interest; (ii) taxes; (iii) brokerage fees and commissions; (iv) other extraordinary expenses not incurred in the ordinary course of the Fund’s business; (v) dividend expenses on short sales; and (vi) indirect expenses such as acquired fund fees and expenses; do not exceed 1.75% of the Fund’s average daily net assets through December 31, 2018. The waiver and/or reimbursement by the Adviser with respect to the Fund is subject to repayment by the Fund within three years following the date in which that particular waiver and/or reimbursement occurred, provided that the Fund is able to make the repayment without exceeding the expense limitation that was in effect at the time of the waiver or reimbursement. This expense cap agreement may be terminated by the Board at any time.
The amount subject to repayment by the Fund, pursuant to the aforementioned conditions, is $2,596, which is recoverable through February 29, 2020.
The Trust retains Ultimus Fund Solutions, LLC (“Ultimus”) to provide the Fund with administration, compliance, fund accounting and transfer agent services, including all regulatory reporting. For the period ended February 28, 2017, Ultimus earned fees of $7,215 for administration services, $1,139 for compliance services, $5,279 for fund accounting services, and $2,278 for transfer agent services. At February 28, 2017, the Fund owed Ultimus $8,811 for such services.
The officers and one trustee of the Trust are employees of Ultimus. Ultimus Fund Distributors, LLC (the Distributor”) acts as the principal distributor of the Fund’s shares. The Distributor operates as wholly-owned subsidiary of Ultimus Fund Solutions, LLC.
NOTE 5. PURCHASES AND SALES OF SECURITIES
For the period ended February 28, 2017, purchases and sales of investment securities, other than short-term investments were as follows:
| | | | |
Purchases | | $ | 47,810,849 | |
Sales | | $ | 8,089,028 | |
There were no purchases or sales of long-term U.S. government obligations during the period ended February 28, 2017.
13
Hedeker Strategic Appreciation Fund
Notes to the Financial Statements (Unaudited) (continued)
February 28, 2017
NOTE 6. FEDERAL TAX INFORMATION
As of February 28, 2017, the net unrealized appreciation (depreciation) of investments for tax purposes was as follows:
| | | | |
Gross unrealized appreciation | | $ | 353,544 | |
Gross unrealized depreciation | | | (456,001 | ) |
Net unrealized appreciation (depreciation) | | $ | (102,457 | ) |
At February 28, 2017, the aggregate cost of securities for federal income tax purposes was $46,524,919 for the Fund.
NOTE 7. BENEFICIAL OWNERSHIP
The beneficial ownership, either directly or indirectly, of 25% or more of the voting securities of a fund creates a presumption of control of a fund, under Section 2(a) (9) of the Investment Company Act of 1940. At February 28, 2017, TD Ameritrade, Inc., owned, as record shareholder, 100% of the outstanding shares of the Fund. It is not known whether TD Ameritrade, Inc. or any of the underlying beneficial owners owned or controlled 25% or more of the voting securities of the Fund.
NOTE 8. COMMITMENTS AND CONTINGENCIES
The Fund indemnifies its officers and trustees for certain liabilities that may arise from the performance of their duties to the Fund. Additionally, in the normal course of business, the Fund enters into contracts that contain a variety of representations and warranties which provide general indemnifications. The Fund’s maximum exposure under these arrangements is unknown, as this would involve future claims that may be made against the Fund that have not yet occurred.
NOTE 9. SUBSEQUENT EVENTS
Management of the Fund has evaluated the need for disclosures and/or adjustments resulting from subsequent events through the date these financial statements were issued. Management has determined there were no items requiring adjustment of the financial statements or additional disclosure.
14
Summary of Fund Expenses (Unaudited)
As a shareholder of the Fund, you incur two types of costs: (1) transaction costs and (2) ongoing costs, including management fees, and other Fund expenses. These examples are intended to help you understand your ongoing costs (in dollars) of investing in the Fund and to compare these costs with the ongoing costs of investing in other mutual funds.
The Example is based on an investment of $1,000 invested at the beginning of the period and held for the entire period from September 1, 2016 through February 28, 2017.
Actual Expenses
The first line of the table for each class provides information about actual account values and actual expenses. You may use the information in these lines, together with the amount you invested, to estimate the expenses that you paid over the period. Simply divide your account value by $1,000 (for example, an $8,600 account value divided by $1,000 = 8.60), then multiply the result by the number in the first line under the heading “Expenses Paid During Period” to estimate the expenses you paid on your account during this period.
Hypothetical Example for Comparison Purposes
The second line of the table for each class provides information about hypothetical account values and hypothetical expenses based on the Fund’s actual expense ratios and an assumed rate of return of 5% per year before expenses, which is not the Fund’s actual return. The hypothetical account values and expenses may not be used to estimate the actual ending account balances or expenses you paid for the period. You may use this information to compare the ongoing costs of investing in the Fund and other funds. To do so, compare this 5% hypothetical example with the 5% hypothetical examples that appear in the shareholder reports of the other funds.
Expenses shown in the table are meant to highlight your ongoing costs only and do not reflect any transactional costs such as the fee imposed on sales charges. Therefore, the second line of the table for each class is useful in comparing ongoing costs only and will not help you determine the relative total costs of owning different funds. In addition, if transaction costs were included, your costs would have been higher.
15
Summary of Fund Expenses (Unaudited) (continued)
| | | | | | | | | | | | | | | | | | |
| | | | | Beginning
Account
Value | | | Ending
Account
Value,
February 28,
2017 | | | Expenses
Paid
During
Period | | | Annualized
Expense
Ratio | |
Hedeker Strategic Appreciation Fund | | | | | | | | | | | | | |
Institutional Shares | | Actual | | $ | 1,000.00 | | | $ | 1,008.40 | | | $ | 3.32 | (a) | | | 1.75 | % |
| | | | | | | | | | | | | | | | | | |
| | Hypothetical(b) | | $ | 1,000.00 | | | $ | 1,016.12 | | | $ | 8.75 | | | | 1.75 | % |
| (a) | | Expenses are equal to the Fund’s annualized expense ratios, multiplied by the average account value over the period, multiplied by 69/365 (to reflect the period since commencement of operations on December 21, 2016). The annualized expense ratios reflect reimbursement of expenses by the Fund’s Adviser for the period beginning December 21, 2016 to February 28, 2017. The “Financial Highlights” tables in the Fund’s financial statements, included in the report, also show the gross expense ratios, without such reimbursements. |
| (b) | | Assumes a 5% return before expenses. The hypothetical example is calculated based on a six month period from September 1, 2016 to February 28, 2017. Accordingly, expenses are equal to the Fund’s annualized expense ratios, multiplied by the average account value over the six month period, multiplied by 181/365 (to reflect the one-half year period). |
16
Approval of Investment Advisory Agreement (Unaudited)
At a quarterly meeting of the Board of Trustees of Capitol Series Trust (“Trust”) on December 15, 2016, the Trust’s Board of Trustees (“Board”), including all of the Trustees who are not “interested persons” of the Trust as that term is defined in Section 2(a)(19) of the Investment Company Act of 1940, as amended (“Independent Trustees”), considered and approved the Investment Advisory Agreement between the Trust and Hedeker Wealth, LLC (“Hedeker”) (the “Investment Advisory Agreement”) regarding the Hedeker Strategic Appreciation Fund (the “Fund”). The Fund is a newly organized series of the Trust.
Prior to the meeting, the Trustees received and considered information from Hedeker and the Trust’s administrator designed to provide the Trustees with the information necessary to evaluate the terms of the proposed Investment Advisory Agreement between the Trust and Hedeker, including, but not limited to, Hedeker’s due diligence questionnaire, Hedeker’s Code of Ethics, the operating expense limitation agreement between the Trust and Hedeker (the “Expense Limitation Agreement”), and certain Morningstar expense analysis data (“Support Materials”). Before voting to approve the proposed Investment Advisory Agreement, the Trustees reviewed the terms and the form of Investment Advisory Agreement and the Support Materials with Trust management and with counsel to the Independent Trustees and received a memorandum from such counsel discussing the legal standards for their consideration of the proposed Investment Advisory Agreement, which memorandum described the various factors that the U.S. Securities and Exchange Commission (“SEC”) and U.S. Courts over the years have suggested would be appropriate for trustee consideration, including the factors outlined in the case of Gartenberg v. Merrill Lynch Asset Management Inc., 694 F.2d 923, 928 (2d Cir. 1982); cert. denied sub. nom. Andre v. Merrill Lynch Ready Assets Trust, Inc., 461 U.S. 906 (1983). Representatives from Hedeker also met with the Trustees and provided further information regarding its proposed services to the Fund, including but not limited to, information regarding its investment philosophy, experience and resources.
In determining whether to approve the Investment Advisory Agreement, the Trustees considered all factors they believed relevant with respect to the Fund, including the following: (1) the nature, extent, and quality of the services to be provided by Hedeker; (2) the cost of the services to be provided and the profits to be realized by Hedeker from services rendered to the Trust and the Fund; (3) comparative fee and expense data for the Fund and other investment companies with similar investment objectives, as well other accounts that Hedeker advises; (4) the extent to which economies of scale would be realized as the Fund grows and whether the proposed advisory fee for the Fund reflects these economies of scale for the Fund’s benefit; and (5) other financial benefits to Hedeker resulting from services to be rendered to the Fund. In their deliberations, the Trustees did not identify any particular information that was all-important or controlling.
Based upon Hedeker’s presentation and the Support Materials, the Board concluded that the overall arrangements between the Trust and Hedeker as will be set forth in the Investment Advisory Agreement as it relates to the Fund and the investment advisory fees that the Fund will pay, are fair and reasonable in light of the services that Hedeker will perform, as well as such other matters as the Trustees considered relevant in the exercise of their reasonable judgment. The material factors and conclusions that formed the basis of the Trustees’ determination to approve the Investment Advisory Agreement are summarized below.
Nature, Extent and Quality of Services Provided. The Trustees considered the scope of services that Hedeker will provide under the Advisory Agreement with respect to the Fund, which include but are not limited to the following: (1) providing overall supervisory responsibility for the general
17
management and investment of the Fund’s securities portfolio; (2) investing or overseeing the investment of the Fund’s assets consistent with the Fund’s investment objective and investment policies; (3) directly managing the Fund’s assets and determining or overseeing the portfolio securities to be purchased, sold or otherwise disposed of and timing of such transaction; (4) voting or overseeing the voting of all proxies with respect to the Fund’s portfolio securities; (5) maintaining or overseeing the maintenance of the required books and records for transactions effected by Hedeker on behalf of the Fund; and (6) selecting or overseeing the selection of broker-dealers to execute orders on behalf of the Fund. The Trustees considered Hedeker’s own capitalization separately and its assets under management, as well as the commitment on the part of Hedeker to be adequately capitalized. The Trustees discussed the implications of a potential change of control of Hedeker as a result of changed ownership percentages among its existing members, should such an event occur in the future, as may be contemplated. The Trustees also considered the investment philosophy of Hedeker’s portfolio management team and their investment industry experience. The Trustees concluded that they were satisfied with the nature, extent and quality of services that Hedeker proposes to provide to the Fund under the Advisory Agreement.
Cost of Advisory Services and Profitability. The Trustees considered the proposed annual management fee that the Fund will pay to Hedeker under the Advisory Agreement, as well as Hedeker’s pro forma profitability analysis for services that Hedeker will render to the Fund. In this regard, the Trustees noted that Hedeker is agreeing to an operating expense limitation agreement. The Trustees emphasized that Hedeker had contractually agreed to reimburse the Fund for its operating expenses, and to reduce its management fees to the extent necessary to ensure that Total Annual Fund Operating Expenses, (excluding acquired fund fees and expenses, brokerage fees and commissions, dividend expense on short sales, interest, taxes, and extraordinary expenses), do not exceed the amount specified in the expense limitation agreement. The Trustees concluded that Hedeker’s projected profitability with respect to its advisory relationship with the Fund is reasonable.
Comparative Fee and Expense Data. Hedeker discussed the advisory fee and contractual expenses of the Fund as compared to those of funds in its Morningstar peer group category. The Trustees noted that the Fund’s management fee compared favorably to the average management fees reported for the Morningstar peer group. The Trustees also discussed the appropriateness of the Morningstar peer group category selected for the comparison. In addition, they considered that the total fund operating expenses of the Fund were less than the average total fund operating expenses reported for the Morningstar peer group. They noted that the projected total fund operating expenses net of waivers and expense reimbursements of the Fund were slightly higher than the average of the Morningstar peer group. They further considered the similar fees paid by Hedeker’s separately managed accounts with a similar investment strategy to that of the Fund as compared to the gross management fee charged to the Fund, and noted the significant and distinct differences in the services that Hedeker would provide to the Fund, which would include greater regulatory, compliance and Board reporting responsibilities. While recognizing that it is difficult to compare management fees because the scope of advisory services provided may vary from one investment adviser to another or from one account to another, the Trustees concluded that Hedeker’s proposed management fee is reasonable at this time.
Economies of Scale. The Trustees considered whether the Fund would benefit from any economies of scale, noting that the management fee for advisory services rendered on behalf of the Fund does not contain breakpoints. The Trustees noted that the Fund is newly organized and that an increase in assets would mostly likely not diminish the level of advisory services that Hedeker would need to
18
provide to the Fund in the foreseeable future. The Trustees concluded that it is not necessary to consider the implementation of fee breakpoints at this time, but stated that they would consider revisiting this issue in the future as circumstances change and asset levels of the Fund increase.
Other Benefits. The Trustees noted that Hedeker confirmed that the firm does not utilize soft dollar arrangements with respect to portfolio transactions and does not anticipate the use of affiliated brokers to execute the Fund’s portfolio transactions. The Trustees concluded that Hedeker will not receive any other material financial benefits from services rendered to the Fund.
Other Considerations. The Trustees also considered potential conflicts of interest for Hedeker. Based on the assurances from representatives of Hedeker, the Trustees concluded that no material conflicts of interest currently exist that would adversely impact the Fund.
19
CAPITOL SERIES TRUST
PRIVACY POLICY
(Unaudited)
Capitol Series Trust (the “Trust”) on behalf of each of its series (each a “Fund,” collectively the “Funds”) adopts the following privacy policy in order to safeguard the personal information of its consumers and customers that are individuals in accordance with Securities and Exchange Commission Regulation S-P,17 CFR 284.30.
We collect only relevant information about a Fund’s shareholders that the law allows or requires us to have in order to conduct our business and properly service you. We collect financial and personal information about you (“Personal Information”) directly (e.g., information on account applications and other forms, such as your name, address, and social security number, and information provided to access account information or conduct account transactions online, such as password, account number, e-mail address, and alternate telephone number), and indirectly (e.g., information about your transactions with us, such as transaction amounts, account balance and account holdings).
The Trust does not disclose any non-public personal information about its shareholders or former shareholders other than for everyday business purposes such as to process a transaction, service an account, to respond to court orders and legal investigations or as otherwise permitted by law. Third parties that may receive this information include companies that provide transfer agency, technology and administrative services to a Fund, as well as the Fund’s investment adviser who is an affiliate of the Fund. If you maintain a retirement/educational custodial account directly with a Fund, we may also disclose your Personal Information to the custodian for that account for shareholder servicing purposes. We limit access to your Personal Information provided to unaffiliated third parties to information necessary to carry out their assigned responsibilities to a Fund. All shareholder records will be disposed of in accordance with applicable law.
The Trust maintains physical, electronic and procedural safeguards to protect Personal Information and requires its third parties service provides with access to such information to treat the Personal Information with the same high degree of confidentiality.
In the event that a shareholder holds shares of a Fund through a financial intermediary, including, but not limited to, a broker-dealer, bank, credit union or trust company, the privacy policy of the shareholders’ financial intermediary would govern how their non-public personal information would be shared with unaffiliated third parties.
20
PROXY VOTING (Unaudited)
A description of the policies and procedures that the Fund uses to determine how to vote proxies relating to portfolio securities and information regarding how the Fund voted those proxies during the most recent twelve month period ended June 30, is available without charge upon request by (1) calling the Fund at (800) 657-4450 and (2) from Fund documents filed with the Securities and Exchange Commission (“SEC”) on the SEC’s website at www.sec.gov.
TRUSTEES
Robert G. Dorsey, Chairman
Walter B. Grimm
Mary M. Morrow
OFFICERS
Matthew J. Miller, Chief Executive Officer and President
John C. Swhear, Chief Compliance Officer, AML Officer and Vice President
Stacey Havens, Vice President
Zachary P. Richmond, Treasurer and Chief Financial Officer
Tiffany R. Franklin, Secretary
INVESTMENT ADVISER
Hedeker Wealth LLC
One Overlook Point, Suite 250
Lincolnshire, IL 60069
DISTRIBUTOR
Ultimus Fund Distributors, LLC
225 Pictoria Drive, Suite 450
Cincinnati, OH 45246
INDEPENDENT REGISTERED PUBLIC ACCOUNTING FIRM
Ernst & Young LLP
800 Yard Street, Suite 200
Grandview Heights, OH 43212
LEGAL COUNSEL
Bernstein Shur
100 Middle Street, 6th Floor
Portland, ME 04104
CUSTODIAN
Huntington National Bank
41 South High Street
Columbus, OH 43215
ADMINISTRATOR, TRANSFER AGENT AND FUND ACCOUNTANT
Ultimus Fund Solutions, LLC
225 Pictoria Drive, Suite 450
Cincinnati, OH 45246
This report is intended only for the information of shareholders or those who have received the Fund’s prospectus which contains information about the Fund’s management fee and expenses. Please read the prospectus carefully before investing.
Distributed by Ultimus Fund Distributors, LLC
Member FINRA/SIPC
Item 2. Code of Ethics.
Not applicable.
Item 3. Audit Committee Financial Expert.
Not applicable.
Item 4. Principal Accountant Fees and Services.
Not applicable.
Item 5. Audit Committee of Listed Registrants.
Not applicable.
Item 6. Schedule of Investments.
(a) Not applicable.
(b) Not applicable.
Item 7. Disclosure of Proxy Voting Policies and Procedures for Closed-End Management Investment Companies.
Not applicable.
Item 8. Portfolio Managers of Closed-End Management Investment Companies.
Not applicable.
Item 9. Purchases of Equity Securities by Closed-End Management Investment Company and Affiliated Purchasers.
Not applicable.
Item 10. Submission of Matters to a Vote of Security Holders.
Not applicable.
Item 11. Controls and Procedures.
(a) Based on their evaluation of the registrant’s disclosure controls and procedures (as defined in Rule 30a-3(c) under the Investment Company Act of 1940, as amended (the “Act”)) as of a date within 90 days of the filing date of this report, the registrant’s principal executive officer and principal financial officer have concluded that such disclosure controls and procedures are reasonably designed and are operating effectively to ensure that material information relating to the registrant is made known to them by others within those entities, particularly during the period in which this report is being prepared, and that the information required in filings on Form N-CSR is recorded, processed, summarized, and reported on a timely basis.
(b) There were no changes in the registrant’s internal control over financial reporting (as defined in Rule 30a-3(d) under the Investment Company Act of 1940) that occurred during the second fiscal quarter of the period covered by this report that have materially affected, or are reasonably likely to materially affect, the registrant’s internal control over financial reporting.
Item 12. Exhibits.
| (a)(2) | Certifications by the registrant’s principal executive officer and principal financial officer, pursuant to Section 302 of the Sarbanes- Oxley Act of 2002 and required by Rule 30a-2under the Investment Company Act of 1940 are filed herewith. |
(b) Certifications pursuant to Rule 30a-2(b) are furnished herewith.
SIGNATURES
Pursuant to the requirements of the Securities Exchange Act of 1934 and the Investment Company Act of 1940, the registrant
has duly caused this report to be signed on its behalf by the undersigned, thereunto duly authorized.
(Registrant) Capitol Series Trust
| | |
| By (Signature and Title) | | /s/ Matthew J. Miller |
| | Matthew J. Miller, Chief Executive Officer and President |
Date 4/27/17
Pursuant to the requirements of the Securities Exchange Act of 1934 and the Investment Company Act of 1940, this report has been signed below by the following persons on behalf of the registrant and in the capacities and on the dates indicated.
| | |
| By (Signature and Title) | | /s/ Matthew J. Miller |
| | Matthew J. Miller, Chief Executive Officer and President |
Date 4/27/17
| | |
| By (Signature and Title) | | /s/ Zachary P. Richmond |
| | Zachary P. Richmond, Treasurer and Chief Financial Officer |
Date 4/27/17