UNITED STATES
SECURITIES AND EXCHANGE COMMISSION
Washington, D.C. 20549
FORM N-CSR
CERTIFIED SHAREHOLDER REPORT OF REGISTERED
MANAGEMENT INVESTMENT COMPANIES
Investment Company Act file number: 811-22895
Capitol Series Trust
(Exact name of registrant as specified in charter)
Ultimus Asset Services, LLC
225 Pictoria Drive, Suite 450
Cincinnati, OH 45246
(Address of principal executive offices) (Zip code)
Zachary P. Richmond
Ultimus Asset Services, LLC
225 Pictoria Drive, Suite 450
Cincinnati, OH 45246
(Name and address of agent for service)
Registrant’s telephone number, including area code: 513-587-3400
Date of fiscal year end: August 31
Date of reporting period: February 28, 2018
Item 1. Reports to Stockholders.

HEDEKER STRATEGIC APPRECIATION FUND
Institutional Shares – SAFFX
Semi-Annual Report
February 28, 2018
Hedeker Wealth LLC
One Overlook Point, Suite 610
Lincolnshire, Illinois 60069
(800) 657-4450
Investment Results (Unaudited)
Total Returns(a) as of February 28, 2018
| | | | | | | | | | | | | | | | |
| | | Six Months | | | One Year | | | Since
Inception
(12/21/2016) | | | Expense
Ratio(c) | |
Hedeker Strategic Appreciation Fund | | | | | | | | | | | | | | | | |
Institutional Shares | | | 0.75 | % | | | 1.85 | % | | | 2.27 | % | | | 1.57 | % |
Bloomberg Barclays Intermediate Government/Credit Index (b) | | | -1.98 | % | | | 0.04 | % | | | 1.05 | % | | | — | |
The performance quoted represents past performance, which does not guarantee future results. The investment return and principal value of an investment will fluctuate so that an investor’s shares, when redeemed, may be worth more or less than their original cost. The returns shown do not reflect deduction of taxes that a shareholder would pay on the Hedeker Strategic Appreciation Fund (the "Fund") distributions or the redemption of Fund shares. Current performance of the Fund may be lower or higher than the performance quoted. The Fund's investment objectives, risks, charges and expenses must be considered carefully before investing. Performance data current to the most recent month end may be obtained by calling (800) 657-4450.
(a) Return figures reflect any change in price per share and assume the reinvestment of all distributions. Total returns for less than one year are not annualized.
(b) The Bloomberg Barclays Intermediate Government/Credit Index ("Index") is a broad-based flagship benchmark that measures the non-securitized component of the U.S. Aggregate Index. It includes investment grade, U.S. dollar-denominated, fixed-rate Treasuries, government-related and corporate securities. The returns of the Index do not reflect the deduction of fees and expenses, whereas the Fund returns are shown net of fees. An individual cannot invest directly in an index.
(c) Reflects the expense ratio as disclosed in the Fund's prospectus dated December 29, 2017. Hedeker Wealth LLC (the “Adviser”), the Fund’s adviser, has contractually agreed, until December 31, 2018, to waive its management fee and/or reimburse expenses so that total annual operating expenses (excluding (i) interest; (ii) taxes; (iii) brokerage fees and commissions; (iv) other extraordinary expenses not incurred in the ordinary course of the Fund’s business; (v) dividend expenses on short sales; and (vi) indirect expenses such as acquired fund fees and expenses) do not exceed 1.75% of the Fund’s average daily net assets. This expense cap agreement may be terminated by the Board of Trustees at any time. Additional information pertaining to the Fund's expense ratios as of February 28, 2018, can be found in the financial highlights.
The Fund's investment objectives, strategies, risks, charges and expenses must be considered carefully before investing. The prospectus contains this and other important information about the Fund and may be obtained by calling (800) 657-4450. Please read it carefully before investing.
The Fund is distributed by Ultimus Fund Distributors, LLC, member FINRA/SIPC.
1
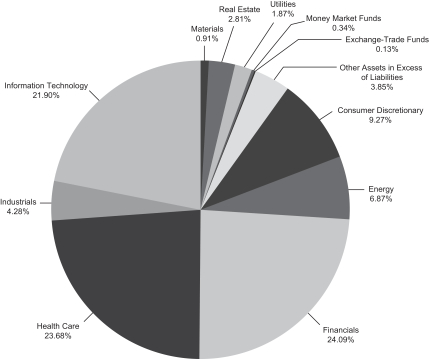
Portfolio Illustration (Unaudited)
February 28, 2018
The following chart gives a visual breakdown of the Fund’s holdings as a percentage of net assets.
Availability of Portfolio Schedule (Unaudited)
The Fund files its complete schedule of portfolio holdings with the Securities and Exchange Commission (“SEC”) for the first and third quarter of each fiscal year on Form N-Q. The Fund’s Forms N-Q will be available at the SEC’s website at www.sec.gov. The Fund’s Forms N-Q may be reviewed and copied at the Public Reference Room in Washington, DC. Information on the operation of the Public Reference Room may be obtained by calling 1-800-SEC-0330.
2
Hedeker Strategic Appreciation Fund
Schedule of Investments (Unaudited)
February 28, 2018
| | | | | | | | |
Principal
Amount | | | | | Fair Value | |
| | CONVERTIBLE BONDS – 85.41% | | | | |
| | |
| | | | Consumer Discretionary – 9.27% | | | | |
| $ | 500,000 | | | Booking Holdings, Inc., 0.90%, 9/15/2021 | | $ | 619,700 | |
| | 300,000 | | | Carriage Services, Inc., 2.75%, 3/15/2021 | | | 390,840 | |
| | 1,000,000 | | | Ctrip.com International Ltd., 1.00%, 7/1/2020 | | | 1,071,600 | |
| | 1,279,000 | | | DISH Network Corporation, 3.38%, 8/15/2026 | | | 1,258,151 | |
| | 835,000 | | | Horizon Global Corporation, 2.75%, 7/1/2022 | | | 693,301 | |
| | 750,000 | | | Tesla, Inc., 0.25%, 3/1/2019 | | | 822,081 | |
| | 500,000 | | | Vitamin Shoppe, Inc., 2.25%, 12/1/2020 | | | 327,188 | |
| | | | | | | | |
| | | | | | | 5,182,861 | |
| | | | | | | | |
| | |
| | | | Energy – 6.41% | | | | |
| | 25,000 | | | Cheniere Energy, Inc., 4.25%, 3/15/2045 | | | 19,185 | |
| | 1,250,000 | | | Green Plains, Inc., 4.13%, 9/1/2022 | | | 1,246,449 | |
| | 500,000 | | | Hurricane Energy PLC, 7.50%, 7/24/2022 | | | 562,500 | |
| | 850,000 | | | PDC Energy, Inc., 1.13%, 9/15/2021 | | | 860,322 | |
| | 400,000 | | | Renewable Energy Group, Inc., 2.75%, 6/15/2019 | | | 417,500 | |
| | 500,000 | | | Weatherford International PLC, 5.88%, 7/1/2021 | | | 476,636 | |
| | | | | | | | |
| | | | | | | 3,582,592 | |
| | | | | | | | |
| | |
| | | | Financials – 14.34% | | | | |
| | 1,600,000 | | | AmTrust Financial Services, Inc., 2.75%, 12/15/2044 | | | 1,407,629 | |
| | 500,000 | | | EZCORP, Inc., 2.13%, 6/15/2019 | | | 529,532 | |
| | 500,000 | | | GAIN Capital Holdings, Inc., 4.13%, 12/1/2018 | | | 520,300 | |
| | 808,000 | | | GSV Capital Corporation, 5.25%, 9/15/2018 | | | 824,200 | |
| | 1,000,000 | | | Hannon Armstrong Sustainable Infrastructure Capital, Inc., 4.13%, 9/1/2022 | | | 942,283 | |
| | 500,000 | | | PRA Group, Inc., 3.00%, 8/1/2020 | | | 486,642 | |
| | 375,000 | | | Resource Capital Corporation, 8.00%, 1/15/2020 | | | 386,438 | |
| | 1,050,000 | | | Safeguard Scientifics, Inc., 5.25%, 5/15/2018 | | | 1,098,089 | |
| | 500,000 | | | Starwood Property Trust, Inc., 4.00%, 1/15/2019 | | | 530,938 | |
| | 500,000 | | | TCP Capital Corporation, 5.25%, 12/15/2019 | | | 517,828 | |
| | 750,000 | | | Two Harbors Investment Corporation, 6.25%, 1/15/2022 | | | 771,040 | |
| | | | | | | | |
| | | | | | | 8,014,919 | |
| | | | | | | | |
| | |
| | | | Health Care – 23.68% | | | | |
| | 640,000 | | | Acorda Therapeutics, Inc., 1.75%, 6/15/2021 | | | 589,469 | |
| | 1,000,000 | | | Alder Biopharmaceuticals, Inc., 2.50%, 2/1/2025 | | | 964,520 | |
| | 1,000,000 | | | Allscripts Healthcare Solutions, Inc., 1.25%, 7/1/2020 | | | 1,047,768 | |
| | 900,000 | | | AMAG Pharmaceuticals, Inc., 3.25%, 6/1/2022 | | | 944,991 | |
| | 550,000 | | | ANI Pharmaceuticals, Inc., 3.00%, 12/1/2019 | | | 629,841 | |
| | 300,000 | | | BioMarin Pharmaceutical, Inc., 1.50%, 10/15/2020 | | | 333,000 | |
| | 750,000 | | | Depomed, Inc., 2.50%, 9/1/2021 | | | 620,959 | |
| | 500,000 | | | Hologic, Inc., Series 2012, 2.00%, 3/1/2042 | | | 621,750 | |
| | 272,000 | | | Illumina, Inc., 0.00%, 6/15/2019 | | | 298,264 | |
| | 500,000 | | | Ionis Pharmaceuticals, Inc., 1.00%, 11/15/2021 | | | 534,863 | |
See accompanying notes which are an integral part of these financial statements.
3
Hedeker Strategic Appreciation Fund
Schedule of Investments (Unaudited) (continued)
February 28, 2018
| | | | | | | | |
Principal
Amount | | | | | Fair Value | |
| | CONVERTIBLE BONDS – (continued) | | | | |
| | |
| | | | Health Care – (continued) | | | | |
| $ | 1,200,000 | | | Jazz Investments I Ltd., 1.88%, 8/15/2021 | | $ | 1,233,511 | |
| | 1,050,000 | | | Medicines Company (The), 2.75%, 7/15/2023 | | | 985,701 | |
| | 1,250,000 | | | Nevro Corporation, 1.75%, 6/1/2021 | | | 1,397,797 | |
| | 1,000,000 | | | NuVasive, Inc., 2.25%, 3/15/2021 | | | 1,074,485 | |
| | 500,000 | | | PDL BioPharma, Inc., 2.75%, 12/1/2021 | | | 455,200 | |
| | 750,000 | | | Radius Health, Inc., 3.00%, 9/1/2024 | | | 780,239 | |
| | 800,000 | | | Teligent, Inc., 3.75%, 12/15/2019 | | | 717,680 | |
| | | | | | | | |
| | | | | | | 13,230,038 | |
| | | | | | | | |
| | |
| | | | Industrials – 4.28% | | | | |
| | 500,000 | | | Arconic, Inc., 1.63%, 10/15/2019 | | | 538,841 | |
| | 500,000 | | | Astaldi SpA, 4.88%, 6/21/2024 | | | 368,948 | |
| | 300,000 | | | KeyW Holding Corporation (The), 2.50%, 7/15/2019 | | | 288,335 | |
| | 1,100,000 | | | Tutor Perini Corporation, 2.88%, 6/15/2021 | | | 1,198,036 | |
| | | | | | | | |
| | | | | | | 2,394,160 | |
| | | | | | | | |
| | |
| | | | Information Technology – 21.84% | | | | |
| | 500,000 | | | Blackhawk Network Holdings, Inc., 1.50%, 1/15/2022 | | | 555,125 | |
| | 1,000,000 | | | Cardtronics, PLC, 1.00%, 12/1/2020 | | | 925,450 | |
| | 500,000 | | | Electronics For Imaging, Inc., 0.75%, 9/1/2019 | | | 485,907 | |
| | 500,000 | | | Envestnet, Inc., 1.75%, 12/15/2019 | | | 538,000 | |
| | 750,000 | | | Finisar Corporation, 0.50%, 12/15/2033 | | | 747,263 | |
| | 500,000 | | | Inphi Corporation, 0.75%, 9/1/2021 | | | 460,810 | |
| | 1,800,000 | | | Integrated Device Technology, Inc., 0.88%, 11/15/2022 | | | 2,030,939 | |
| | 500,000 | | | InterDigital, Inc., 1.50%, 3/1/2020 | | | 576,050 | |
| | 350,000 | | | j2 Global, Inc., 3.25%, 6/15/2029 | | | 427,521 | |
| | 900,000 | | | Knowles Corporation, 3.25%, 11/1/2021 | | | 986,760 | |
| | 850,000 | | | Liberty Interactive LLC, 4.00%, 11/15/2029 | | | 603,500 | |
| | 430,000 | | | Nuance Communications, Inc., 1.00%, 12/15/2035 | | | 412,626 | |
| | 800,000 | | | Pandora Media, Inc., 1.75%, 12/1/2020 | | | 725,200 | |
| | 1,600,000 | | | Synchronoss Technologies, Inc., 0.75%, 8/15/2019 | | | 1,500,960 | |
| | 800,000 | | | Veeco Instruments, Inc., 2.70%, 1/15/2023 | | | 741,650 | |
| | 500,000 | | | Verint Systems, Inc., 1.50%, 6/1/2021 | | | 483,984 | |
| | | | | | | | |
| | | | | | | 12,201,745 | |
| | | | | | | | |
| | |
| | | | Materials – 0.91% | | | | |
| | 500,000 | | | Cemex SAB de CV, 3.72%, 3/15/2020 | | | 506,300 | |
| | | | | | | | |
| | |
| | | | Real Estate – 2.81% | | | | |
| | 10,000 | | | Colony NorthStar, Inc., 3.88%, 1/15/2021 | | | 9,510 | |
| | 1,000,000 | | | Colony NorthStar, Inc., 5.00%, 4/15/2023 | | | 959,600 | |
See accompanying notes which are an integral part of these financial statements.
4
Hedeker Strategic Appreciation Fund
Schedule of Investments (Unaudited) (continued)
February 28, 2018
| | | | | | | | |
Principal
Amount | | | | | Fair Value | |
| | CONVERTIBLE BONDS – (continued) | | | | |
| | |
| | | | Real Estate – (continued) | | | | |
| $ | 400,000 | | | Helical Bar Jersey Ltd., 4.00%, 6/17/2019 | | $ | 553,467 | |
| | 50,000 | | | Spirit Realty Capital, Inc., 2.88%, 5/15/2019 | | | 49,906 | |
| | | | | | | | |
| | | | | | | 1,572,483 | |
| | | | | | | | |
| | |
| | | | Utilities – 1.87% | | | | |
| | 800,000 | | | Just Energy Group, Inc., 6.50%, 7/29/2019 | | | 795,920 | |
| | 250,000 | | | Pattern Energy Group, Inc., 4.00%, 7/15/2020 | | | 249,042 | |
| | | | | | | | |
| | | | | | | 1,044,962 | |
| | | | | | | | |
| | | | Total Convertible Bonds (Cost $47,890,344) | | | 47,730,060 | |
| | | | | | | | |
| | |
Shares | | | | | | |
| | COMMON STOCKS – 5.11% | |
| | |
| | | | Financials – 5.05% | | | | |
| | 5,500 | | | Comerica, Inc. | | | 534,710 | |
| | 39,432 | | | KeyCorp | | | 833,200 | |
| | 2,790 | | | SVB Financial Group(a) | | | 694,654 | |
| | 13,800 | | | Zions Bancorporation | | | 758,586 | |
| | | | | | | | |
| | | | | | | 2,821,150 | |
| | | | | | | | |
| | |
| | | | Information Technology – 0.06% | | | | |
| | 150 | | | NVIDIA Corporation | | | 36,300 | |
| | | | | | | | |
| | | | Total Common Stocks (Cost $2,765,593) | | | 2,857,450 | |
| | | | | | | | |
|
| | CONVERTIBLE PREFERRED STOCKS – 5.16% | |
| | |
| | | | Energy – 0.46% | | | | |
| | 5,000 | | | Chesapeake Energy Corporation, 4.50% | | | 257,500 | |
| | | | | | | | |
| | |
| | | | Financials – 4.70% | | | | |
| | 33,203 | | | Capitala Finance Corporation, 5.75% | | | 805,505 | |
| | 28,196 | | | Great Ajax Corporation, 7.25% | | | 697,152 | |
| | 23,000 | | | NY Community Cap Trust V, 6.00% | | | 1,122,696 | |
| | | | | | | | |
| | | | | | | 2,625,353 | |
| | | | | | | | |
| | | | Total Convertible Preferred Stocks (Cost $2,983,033) | | | 2,882,853 | |
| | | | | | | | |
|
| | EXCHANGE-TRADED FUNDS – 0.13% | |
| | 470 | | | iShares Russell 2000 ETF | | | 70,665 | |
| | | | | | | | |
| | | | Total Exchange-Traded Funds Cost ($70,108) | | | 70,665 | |
| | | | | | | | |
See accompanying notes which are an integral part of these financial statements.
5
Hedeker Strategic Appreciation Fund
Schedule of Investments (Unaudited) (continued)
February 28, 2018
| | | | | | | | |
| Shares | | | | | Fair Value | |
| | MONEY MARKET FUNDS – 0.34% | |
| | 190,517 | | | Fidelity Investments Money Market Government Portfolio – Institutional Class, 1.30%(b) | | $ | 190,517 | |
| | | | | | | | |
| | | | Total Money Market Funds (Cost $190,517) | | | 190,517 | |
| | | | | | | | |
| | |
| | | | Total Investments – 96.15% (Cost $53,899,595) | | | 53,731,545 | |
| | | | | | | | |
| | |
| | | | Other Assets in Excess of Liabilities – 3.85% | | | 2,153,528 | |
| | | | | | | | |
| | |
| | | | NET ASSETS – 100.00% | | $ | 55,885,073 | |
| | | | | | | | |
| (a) | | Non-income producing security. |
| (b) | | Rate disclosed is the seven day effective yield as of February 28, 2018. |
| ETF | | – Exchange-Traded Fund |
The sectors shown on the schedule of investments are based on the Global Industry Classification Standard, or GICS® (“GICS”). The GICS was developed by and/or is the exclusive property of MSCI, Inc. and Standard & Poor’s Financial Services LLC (“S&P”). GICS is a service mark of MSCI, Inc. and S&P and has been licensed for use by Ultimus Fund Solutions, LLC.
See accompanying notes which are an integral part of these financial statements.
6
Hedeker Strategic Appreciation Fund
Statement of Assets and Liabilities (Unaudited)
February 28, 2018
| | | | |
Assets | | | | |
Investments in securities at fair value (cost $53,899,595) | | $ | 53,731,545 | |
Dividends and interest receivable | | | 330,324 | |
Receivable for investments sold | | | 2,860,935 | |
Prepaid expenses | | | 22,740 | |
Total Assets | | | 56,945,544 | |
Liabilities | | | | |
Payable for investments purchased | | | 1,000,293 | |
Payable to Adviser | | | 42,341 | |
Payable to Administrator | | | 8,361 | |
Other accrued expenses | | | 9,476 | |
Total Liabilities | | | 1,060,471 | |
Net Assets | | $ | 55,885,073 | |
Net Assets consist of: | | | | |
Paid-in capital | | $ | 56,363,298 | |
Accumulated net investment loss | | | (349,178 | ) |
Accumulated undistributed net realized gain from investments | | | 39,014 | |
Net unrealized depreciation on investments | | | (168,061 | ) |
Net Assets | | $ | 55,885,073 | |
Shares outstanding (unlimited number of shares authorized, no par value) | | | 2,239,727 | |
Net asset value, offering and redemption price per share | | $ | 24.95 | |
7
See accompanying notes which are an integral part of these financial statements.
Hedeker Strategic Appreciation Fund
Statement of Operations (Unaudited)
For the six months ended February 28, 2018
| | | | |
Investment Income | | | | |
Dividend income (net of foreign taxes withheld of $4,191) | | $ | 115,354 | |
Interest income | | | 608,121 | |
Total investment income | | | 723,475 | |
Expenses | | | | |
Investment Adviser | | | 259,870 | |
Administration | | | 25,469 | |
Fund accounting | | | 16,630 | |
Audit | | | 13,430 | |
Legal | | | 11,151 | |
Offering | | | 7,233 | |
Printing | | | 6,683 | |
Transfer agent | | | 5,951 | |
Pricing | | | 5,285 | |
Custodian | | | 3,988 | |
Compliance | | | 2,887 | |
Trustee | | | 2,864 | |
Registration | | | 1,143 | |
Insurance | | | 728 | |
Miscellaneous | | | 7,127 | |
Net operating expenses | | | 370,439 | |
Net investment income | | | 353,036 | |
Net Realized and Change in Unrealized Gain (Loss) on Investments | | | | |
Net realized loss on investment securities transactions | | | (118,387 | ) |
Net realized loss on foreign currency translations | | | (4,561 | ) |
Net change in unrealized appreciation of investment securities and foreign currency translations | | | 149,536 | |
Net realized and change in unrealized gain on investments | | | 26,588 | |
Net increase in net assets resulting from operations | | $ | 379,624 | |
8
See accompanying notes which are an integral part of these financial statements.
Hedeker Strategic Appreciation Fund
Statements of Changes in Net Assets
| | | | | | | | |
| | | For the Six Months
Ended
February 28, 2018
(Unaudited) | | | For the Period
Ended
August 31, 2017(a) | |
Increase (Decrease) in Net Assets due to: Operations | | | | | | | | |
Net investment income | | $ | 353,036 | | | $ | 144,861 | |
Net realized gain (loss) on investment securities transactions and foreign currency translations | | | (122,948 | ) | | | 803,809 | |
Net change in unrealized appreciation (depreciation) of investment securities and foreign currency translations | | | 149,536 | | | | (317,597 | ) |
Net increase in net assets resulting from operations | | | 379,624 | | | | 631,073 | |
Distributions From: | | | | | | | | |
Net investment income | | | (824,606 | ) | | | (28,007 | ) |
Net realized gain | | | (636,309 | ) | | | — | |
Total Distributions | | | (1,460,915 | ) | | | (28,007 | ) |
Capital Transactions – Institutional Shares | | | | | | | | |
Proceeds from shares sold | | | 5,541,450 | | | | 53,634,047 | |
Reinvestment of distributions | | | 1,460,915 | | | | 28,007 | |
Amount paid for shares redeemed | | | (656,706 | ) | | | (3,644,415 | ) |
Net increase in net assets resulting from capital transactions | | | 6,345,659 | | | | 50,017,639 | |
Total Increase in Net Assets | | | 5,264,368 | | | | 50,620,705 | |
Net Assets | | | | | | | | |
Beginning of period | | | 50,620,705 | | | | — | |
End of period | | $ | 55,885,073 | | | $ | 50,620,705 | |
Accumulated net investment income (loss) | | $ | (349,178 | ) | | $ | 122,392 | |
Share Transactions – Institutional Shares | | | | | | | | |
Shares sold | | | 219,357 | | | | 2,130,213 | |
Shares issued in reinvestment of distributions | | | 58,947 | | | | 1,093 | |
Shares redeemed | | | (25,803 | ) | | | (144,080 | ) |
Net increase in shares outstanding | | | 252,501 | | | | 1,987,226 | |
| (a) | | For the period December 21, 2016 (commencement of operations) to August 31, 2017. |
9
See accompanying notes which are an integral part of these financial statements.
Hedeker Strategic Appreciation Fund - Institutional Shares
Financial Highlights
Selected data for a share outstanding during each period.
| | | | | | | | |
| | | For the Six Months
Ended
February 28, 2018
(Unaudited) | | | For the Period
Ended
August 31, 2017(a) | |
Net asset value, at beginning of period | | $ | 25.47 | | | $ | 25.00 | |
| | | | | | | | |
| | |
Income from investment operations: | | | | | | | | |
| | |
Net investment income | | | 0.18 | | | | 0.07 | |
| | |
Net realized and unrealized gain on investments | | | 0.01 | | | | 0.41 | |
| | | | | | | | |
| | |
Total from investment operations | | | 0.19 | | | | 0.48 | |
| | | | | | | | |
| | |
Distributions from: | | | | | | | | |
| | |
Net investment income | | | (0.40 | ) | | | (0.01 | ) |
| | |
Net realized gain | | | (0.31 | ) | | | — | |
| | | | | | | | |
| | |
Total from distributions | | | (0.71 | ) | | | (0.01 | ) |
| | | | | | | | |
Net asset value, at end of period | | $ | 24.95 | | | $ | 25.47 | |
| | | | | | | | |
| | |
Total Return(b) | | | 0.75 | %(c) | | | 1.94 | %(c) |
| | | | | | | | |
Ratios/Supplemental Data: | | | | | | | | |
| | |
Net assets at end of period (thousands) | | $ | 55,885 | | | $ | 50,621 | |
| | |
Ratio of net expenses to average net assets | | | 1.43 | %(d) | | | 1.56 | %(d) |
| | |
Ratio of net investment income to average net assets | | | 1.36 | %(d) | | | 0.49 | %(d) |
| | |
Portfolio turnover | | | 84 | %(c) | | | 113 | %(c) |
| (a) | | For the period December 21, 2016 (commencement of operations) through August 31, 2017. |
| (b) | | Total return in the above table represents the rate that the investor would have earned or lost on an investment in the Fund, assuming reinvestment of distributions. |
10
See accompanying notes which are an integral part of these financial statements.
Hedeker Strategic Appreciation Fund
Notes to the Financial Statements (Unaudited)
February 28, 2018
NOTE 1. ORGANIZATION
The Hedeker Strategic Appreciation Fund (the “Fund”) was organized as a non-diversified series of Capitol Series Trust (the “Trust”) on December 15, 2016. The Trust is an open-end investment company established under the laws of Ohio by an Agreement and Declaration of Trust dated September 18, 2013 (the “Trust Agreement”). The Trust Agreement permits the Board of Trustees of the Trust (the “Board”) to issue an unlimited number of shares of beneficial interest of separate series without par value. The Fund is one of a series of funds currently authorized by the Board. The Fund’s investment adviser is Hedeker Wealth LLC (the “Adviser”). The investment objective of the Fund is to seek superior risk-adjusted returns over a market cycle.
The Fund currently offers one class of shares, Institutional Shares. The Fund commenced operations on December 21, 2016. Each share represents an equal proportionate interest in the assets and liabilities belonging to the Fund and is entitled to such dividends and distributions out of income belonging to the Fund as are declared by the Board.
NOTE 2. SIGNIFICANT ACCOUNTING POLICIES
The Fund is an investment company and follows accounting and reporting guidance under Financial Accounting Standards Board Accounting Standards Codification (“ASC”) Topic 946, “Financial Services-Investments Companies”. The following is a summary of significant accounting policies followed by the Fund in the preparation of its financial statements. These policies are in conformity with generally accepted accounting principles in the United States of America (“GAAP”).
Estimates – The preparation of financial statements in conformity with GAAP requires management to make estimates and assumptions that affect the reported amounts of assets and liabilities and disclosure of contingent assets and liabilities at the date of the financial statements and the reported amounts of increases and decreases in net assets from operations during the reporting period. Actual results could differ from those estimates.
Securities Valuation – All investments in securities are recorded at their estimated fair value as described in Note 3.
Foreign Currency Translation – The accounting records of the Fund are maintained in U.S. dollars. Foreign currency amounts are translated into U.S. dollars at the current rate of exchange each business day to determine the value of investments, and other assets and liabilities. Purchases and sales of foreign securities, and income and expenses, are translated at the prevailing rate of exchange on the respective date of these transactions. The Fund does not isolate that portion of the results of operations resulting from changes in foreign exchange rates on investments from fluctuation arising from changes in market prices of securities held. These fluctuations are included with the net realized and unrealized gain or loss from investments.
Federal Income Taxes – The Fund makes no provision for federal income tax or excise tax. The Fund intends to qualify each year as a regulated investment company (“RIC”) under subchapter M of the Internal Revenue Code of 1986, as amended, by complying with the requirements applicable to RICs and by distributing substantially all of its taxable income. The Fund also intends to distribute sufficient net investment income and net capital gains, if any, so that it will not be
11
Hedeker Strategic Appreciation Fund
Notes to the Financial Statements (Unaudited) (continued)
February 28, 2018
subject to excise tax on undistributed income and gains. If the required amount of net investment income or gains is not distributed, the Fund could incur a tax expense.
The Fund recognizes tax benefits or expenses of uncertain tax positions only when the position is “more likely than not” to be sustained assuming examination by tax authorities. Management of the Fund has reviewed tax positions taken in tax years that remain subject to examination by all major tax jurisdictions, including federal (i.e., the 2016 tax year end and the interim tax period since then, as applicable) and has concluded that no provision for unrecognized tax benefits or expenses is required in these financial statements and does not expect this to change over the next twelve months. The Fund recognizes interest and penalties, if any, related to unrecognized tax benefits as income tax expense in the Statement of Operations. During the six months ended February 28, 2018, the Fund did not incur any interest or penalties.
Expenses – Expenses incurred by the Trust that do not relate to a specific fund of the Trust are allocated to the individual funds based on each fund’s relative net assets or another appropriate basis (as determined by the Board).
Security Transactions and Related Income – Throughout the reporting period, security transactions are accounted for no later than one business day following the trade date. For financial reporting purposes, security transactions are accounted for on trade date on the last business day of the reporting period. The specific identification method is used for determining gains or losses for financial statements and income tax purposes. Dividend income is recorded on the ex-dividend date. Interest income is recorded on an accrual basis and includes, where applicable, the amortization of premium or accretion of discount. Discounts and premiums on fixed income securities are accreted or amortized over the life of the respective securities using the effective interest method.
Dividends and Distributions – The Fund intends to distribute substantially all of its net investment income, if any, as dividends to its shareholders on a quarterly basis. The Fund intends to distribute its net realized long-term capital gains and its net realized short-term capital gains, if any, to its shareholders at least once a year. Distributions to shareholders are recorded on the ex-dividend date. The amounts of dividends from net investment income and distributions from net realized gains are determined in accordance with federal income tax regulations, which may differ from GAAP. These differences are caused primarily by differences in the timing of the recognition of certain components of income, expense or realized capital gains for federal income tax purposes. Where such differences are permanent in nature, they are reclassified in the components of net assets based on their ultimate characterization for federal income tax purposes. Any such reclassifications will have no effect on net assets, results of operations or net asset values per share of the Fund.
NOTE 3. SECURITIES VALUATION AND FAIR VALUE MEASUREMENTS
Fair value is defined as the price that the Fund would receive upon selling an investment in an orderly transaction to an independent buyer in the principal or most advantageous market of the investment. GAAP establishes a three-tier hierarchy to maximize the use of observable market data and minimize the use of unobservable inputs and to establish classification of fair value measurements for disclosure purposes.
12
Hedeker Strategic Appreciation Fund
Notes to the Financial Statements (Unaudited) (continued)
February 28, 2018
Inputs refer broadly to the assumptions that market participants would use in pricing the asset or liability. Inputs may be observable or unobservable. Observable inputs are inputs that reflect the assumptions market participants would use in pricing the asset or liability developed based on market data obtained from sources independent of the reporting entity. Unobservable inputs are inputs that reflect the reporting entity’s own assumptions about the assumptions market participants would use in pricing the asset or liability developed based on the best information available in the circumstances.
Various inputs are used in determining the value of the Fund’s investments. These inputs are summarized in the three broad levels listed below.
| | • | | Level 1 – unadjusted quoted prices in active markets for identical investments and/or registered investment companies where the value per share is determined and published and is the basis for current transactions for identical assets or liabilities at the valuation date |
| | • | | Level 2 – other significant observable inputs (including, but not limited to, quoted prices for an identical security in an inactive market, quoted prices for similar securities, interest rates, prepayment speeds, credit risk, etc.) |
| | • | | Level 3 – significant unobservable inputs (including the Fund’s own assumptions in determining fair value of investments based on the best information available) |
The inputs used to measure fair value may fall into different levels of the fair value hierarchy. In such cases, for disclosure purposes, the level in the fair value hierarchy within which the fair value measurement falls in its entirety is determined based on the lowest level input that is significant to the fair value measurement in its entirety.
In computing the net asset value (“NAV”) of the Fund, fair value is based on market valuations with respect to portfolio securities for which market quotations are readily available. Pursuant to Board approved policies, the Fund relies on independent third-party pricing services to provide the current market value of securities. Those pricing services value equity securities, including exchange-traded funds and exchange-traded notes, traded on a securities exchange at the last reported sales price on the principal exchange. Equity securities quoted by NASDAQ are valued at the NASDAQ Official Closing Price. If there is no reported sale on the principal exchange, equity securities are valued at the mean between the most recent quoted bid and asked price. When using the market quotations or close prices provided by the pricing service and when the market is considered active, the security will be classified as a Level 1 security. Investments in open-end mutual funds, including money market mutual funds, are generally priced at the ending NAV provided by the pricing service of the funds and are generally categorized as Level 1 securities. Debt securities are valued using evaluated prices furnished by a pricing vendor selected by the Board and are generally classified as Level 2 securities.
In the event that market quotations are not readily available, the Adviser determines that the market quotation or the price provided by the pricing service does not accurately reflect the current fair value, or certain restricted or illiquid securities are being valued, such securities are valued as determined in good faith by the Trust’s Valuation Committee, based on recommendations from a pricing committee comprised of various officers of the Trust, various employees of the Fund’s administrator, and representatives of the Adviser (together the “Pricing Review Committee”).
13
Hedeker Strategic Appreciation Fund
Notes to the Financial Statements (Unaudited) (continued)
February 28, 2018
These securities will be classified as Level 2 or 3 within the fair value hierarchy, depending on the inputs used.
In accordance with the Trust’s Valuation Procedures, the Pricing Review Committee in making its recommendations are required to consider all appropriate factors relevant to the value of securities for which it has determined other pricing sources are not available or reliable as described above. No single standard exists for determining fair value, because fair value depends upon the circumstances of each individual case. As a general principle, the current fair value of an issue of securities being valued pursuant to the Trust’s Fair Valuation Procedures would be the amount which the Fund might reasonably expect to receive for them upon their current sale. Methods which are in accordance with this principle may, for example, be based on (i) a multiple of earnings; (ii) a discount from market prices of a similar freely traded security (including a derivative security or a basket of securities traded on other markets, exchanges or among dealers); or (iii) yield to maturity with respect to debt issues, or a combination of these and other methods. Fair value pricing is permitted if, in accordance with the Trust’s Valuation Procedures, the validity of market quotations appears to be questionable based on factors such as evidence of a thin market in the security based on a small number of quotations, a significant event occurs after the close of a market but before the Fund’s NAV calculation that may affect a security’s value, or other data calls into question the reliability of market quotations.
The following is a summary of the inputs used to value the Fund’s investments as of February 28, 2018:
| | | | | | | | | | | | | | | | |
| | | Valuation Inputs | | | | |
| Assets | | Level 1 | | | Level 2 | | | Level 3 | | | Total | |
Convertible Bonds | | $ | — | | | $ | 47,730,060 | | | $ | — | | | $ | 47,730,060 | |
Common Stocks | | | 2,857,450 | | | | — | | | | — | | | | 2,857,450 | |
Convertible Preferred Stocks | | | 1,063,005 | | | | 1,819,848 | (a) | | | — | | | | 2,882,853 | |
Exchange-Traded Funds | | | 70,665 | | | | — | | | | — | | | | 70,665 | |
Money Market Funds | | | 190,517 | | | | — | | | | — | | | | 190,517 | |
Total | | $ | 4,181,637 | | | $ | 49,549,908 | | | $ | — | | | $ | 53,731,545 | |
| (a) | | Consists of the holding: Great Ajax Corporation, 7.25% and NY Community Cap Trust V, 6.00% |
The Fund did not hold any investments at the end of the reporting period in which significant unobservable inputs (Level 3) were used in determining fair value; therefore, no reconciliation of Level 3 securities is included for this reporting period. The Fund did not hold any derivative instruments during the reporting period.
The Trust recognizes transfers between fair value hierarchy levels at the end of the reporting period. Transfers from Level 1 to Level 2 represent securities which were valued using close prices at the beginning of the period but did not have close prices available at February 28, 2018 due to lack of trading activity. The following is a summary of the transfer between Level 1 and Level 2 of the fair value hierarchy as of February 28, 2018 based on input levels assigned at August 31, 2017:
| | | | | | | | |
| | | Transfers from
Level 1 to
Level 2 | | | Transfers from
Level 2 to
Level 1 | |
Convertible Preferred Stocks | | $ | 1,819,848 | | | $ | — | |
14
Hedeker Strategic Appreciation Fund
Notes to the Financial Statements (Unaudited) (continued)
February 28, 2018
NOTE 4. FEES AND OTHER TRANSACTIONS WITH AFFILIATES AND OTHER SERVICE PROVIDERS
Under the terms of the investment advisory agreement (the “Agreement”), the Adviser manages the Fund’s investments subject to approval of the Board. As compensation for its management services, the Fund is obligated to pay the Adviser a fee computed and accrued daily and paid monthly at an annual rate of 1.00% of the Fund’s average daily net assets. For the six months ended February 28, 2018, the Adviser earned fees of $259,870 from the Fund. At February 28, 2018, the Fund owed the Adviser $42,341.
The Adviser has contractually agreed to waive its management fee and/or reimburse expenses so that total annual operating expenses (excluding (i) interest; (ii) taxes; (iii) brokerage fees and commissions; (iv) other extraordinary expenses not incurred in the ordinary course of the Fund’s business; (v) dividend expenses on short sales; and (vi) indirect expenses such as acquired fund fees and expenses; do not exceed 1.75% of the Fund’s average daily net assets through December 31, 2018. During any fiscal year that the Agreement between the Adviser and the Trust is in effect, the Adviser may recoup the sum of all fees previously waived or expenses reimbursed for a period of 36 months following the month during which such fee waiver or expense reimbursement was made, less any reimbursement previously paid, if such recoupment can be achieved within the Expense Limitation as well as any expense limitation in effect at the time the reimbursement is made. This expense cap agreement may be terminated by the Board at any time.
The Trust retains Ultimus Fund Solutions, LLC (the “Administrator”) to provide the Fund with administration, compliance, fund accounting and transfer agent services, including all regulatory reporting. For the six months ended February 28, 2018, the Administrator earned fees of $25,469 for administration services, $2,887 for compliance services, $16,630 for fund accounting services, and $5,951 for transfer agent services. At February 28, 2018, the Fund owed the Administrator $8,361 for such services.
The Board supervises the business activities of the Trust. Each Trustee serves as a Trustee for the lifetime of the Trust or until the earlier of his or her retirement as a Trustee at age 75, death, resignation or removal. “Independent Trustees,” which means that they are not “interested persons” as defined in the 1940 Act of the Trust, each receive annual compensation of $15,000 from the Trust. Each Committee Chairperson receives an additional annual compensation of $1,000 from the Trust. Independent Trustees also receive $1,000 for attending each special in-person meeting and up to $1,000 for attending special telephonic meetings, depending on the length of the telephonic meeting. In addition, the Trust reimburses Trustees for out-of-pocket expense incurred in conjunction with attendance at meetings.
The officers and one Trustee of the Trust are employees of the Administrator. Ultimus Fund Distributors, LLC (the Distributor”) acts as the principal distributor of the Fund’s shares. The Distributor operates as a wholly-owned subsidiary of Ultimus Fund Solutions, LLC.
15
Hedeker Strategic Appreciation Fund
Notes to the Financial Statements (Unaudited) (continued)
February 28, 2018
NOTE 5. PURCHASES AND SALES OF SECURITIES
For the six months ended February 28, 2018, purchases and sales of investment securities, other than short-term investments were as follows:
| | | | |
Purchases | | $ | 47,578,820 | |
Sales | | $ | 42,801,192 | |
There were no purchases or sales of long-term U.S. government obligations during the six months ended February 28, 2018.
NOTE 6. FEDERAL TAX INFORMATION
As of February 28, 2018, the net unrealized appreciation (depreciation) of investments for tax purposes was as follows:
| | | | |
Gross unrealized appreciation | | $ | 1,291,820 | |
Gross unrealized depreciation | | | (1,507,824 | ) |
Net unrealized depreciation | | $ | (216,004 | ) |
At February 28, 2018, the aggregate cost of securities for federal income tax purposes was $53,947,549 for the Fund.
The tax characterization of distributions for the period from December 21, 2016 (commencement of operations) to August 31, 2017, the Fund’s most recent fiscal year period, was as follows:
| | | | |
Distributions paid from: | | | | |
Ordinary income | | $ | 28,007 | |
At August 31, 2017, the Fund’s most recent fiscal year end, the components of distributable earnings (accumulated losses) on a tax bases was as follows:
| | |
Undistributed Ordinary Income | | $968,617 |
Unrealized Appreciation (Depreciation) | | (365,551) |
Total Accumulated Earnings (Deficit) | | $603,066 |
The difference between book basis and tax basis unrealized appreciation (depreciation) is primarily attributable to the tax deferral of wash sales, interest accruals on complex securities and deemed dividends from convertible bonds.
NOTE 7. BENEFICIAL OWNERSHIP
The beneficial ownership, either directly or indirectly, of 25% or more of the voting securities of a fund creates a presumption of control of a fund, under Section 2(a) (9) of the Investment Company Act of 1940. At February 28, 2018, TD Ameritrade, Inc., owned, as record shareholder, 100% of the outstanding shares of the Fund. It is not known whether TD Ameritrade, Inc. or any of the underlying beneficial owners owned or controlled 25% or more of the voting securities of the Fund.
16
Hedeker Strategic Appreciation Fund
Notes to the Financial Statements (Unaudited) (continued)
February 28, 2018
NOTE 8. COMMITMENTS AND CONTINGENCIES
The Fund indemnifies its officers and trustees for certain liabilities that may arise from the performance of their duties to the Fund. Additionally, in the normal course of business, the Fund enters into contracts that contain a variety of representations and warranties which provide general indemnifications. The Fund’s maximum exposure under these arrangements is unknown, as this would involve future claims that may be made against the Fund that have not yet occurred.
NOTE 9. SUBSEQUENT EVENTS
Management has evaluated events or transactions from February 28, 2018 through the date these financial statements were issued that would merit recognition or disclosure in the financial statements. There were no subsequent events to report that would have a material impact in the Funds’ financial statements.
17
Summary of Fund Expenses (Unaudited)
As a shareholder of the Fund, you incur two types of costs: (1) transaction costs and (2) ongoing costs, including management fees, and other Fund expenses. These examples are intended to help you understand your ongoing costs (in dollars) of investing in the Fund and to compare these costs with the ongoing costs of investing in other mutual funds.
The Example is based on an investment of $1,000 invested at the beginning of the period and held for the entire period from September 1, 2017 through February 28, 2018.
Actual Expenses
The first line of the table provides information about actual account values and actual expenses. You may use the information in this line, together with the amount you invested, to estimate the expenses that you paid over the period. Simply divide your account value by $1,000 (for example, an $8,600 account value divided by $1,000 = 8.60), then multiply the result by the number in the first line under the heading “Expenses Paid During Period” to estimate the expenses you paid on your account during this period.
Hypothetical Example for Comparison Purposes
The second line of the table provides information about hypothetical account values and hypothetical expenses based on the Fund’s actual expense ratios and an assumed rate of return of 5% per year before expenses, which is not the Fund’s actual return. The hypothetical account values and expenses may not be used to estimate the actual ending account balances or expenses you paid for the period. You may use this information to compare the ongoing costs of investing in the Fund and other funds. To do so, compare this 5% hypothetical example with the 5% hypothetical examples that appear in the shareholder reports of the other funds.
Expenses shown in the table are meant to highlight your ongoing costs only and do not reflect any transactional costs such as the fee imposed on sales charges. Therefore, the second line of the table is useful in comparing ongoing costs only and will not help you determine the relative total costs of owning different funds. In addition, if transaction costs were included, your costs would have been higher.
| | | | | | | | | | | | | | | | | | |
| | | | | Beginning
Account
Value
September 1,
2017 | | | Ending
Account
Value
February 28,
2018 | | | Expenses
Paid
During
Period(a) | | | Annualized
Expense
Ratio | |
Hedeker Strategic Appreciation Fund | | | | | | | | | | | | | |
Institutional Shares | | Actual | | $ | 1,000.00 | | | $ | 1,007.50 | | | $ | 7.12 | | | | 1.43 | % |
| | | | | | | | | | | | | | | | | | |
| | Hypothetical(b) | | $ | 1,000.00 | | | $ | 1,017.70 | | | $ | 7.15 | | | | 1.43 | % |
| (a) | | Expenses are equal to the Fund’s annualized expense ratios, multiplied by the average account value over the period, multiplied by 181/365 (to reflect the one-half year period). |
| (b) | | Hypothetical assumes a 5% return before expenses. |
18
| | |
FACTS | | WHAT DOES CAPITOL SERIES TRUST DO WITH YOUR PERSONAL INFORMATION? |
| | |
| Why? | | Financial companies choose how they share your personal information. Federal law gives consumers the right to limit some but not all sharing. Federal law also requires us to tell you how we collect, share, and protect your personal information. Please read this notice carefully to understand what we do. |
| | |
| What? | | The types of personal information we collect and share depend on the product or service you have with us. This information can include: ◾ Social Security number ◾ account balances and account transactions ◾ account transactions, transaction or loss history and purchase history ◾ checking account information and wire transfer instructions When you are no longer our customer, we continue to share your information as described in this notice. |
| | |
| How? | | All financial companies need to share customers’ personal information to run their everyday business. In the section below, we list the reasons financial companies can share their customers’ personal information; the reasons Capitol Series Trust chooses to share; and whether you can limit this sharing. |
| | |
| Reasons we can share your personal information | | Does Capitol Series
Trust share? |
For our everyday business purposes — such as to process your transactions, maintain your account(s), respond to court orders and legal investigations, or report to credit bureaus | | Yes |
For our marketing purposes — to offer our products and services to you | | Yes |
| For joint marketing with other financial companies | | No |
For our affiliates’ everyday business purposes — information about your transactions and experiences | | No |
For our affiliates’ everyday business purposes — information about your creditworthiness | | No |
| For nonaffiliates to market to you | | No |
| | |
| Questions? | | Call 1-800-657-4450 |
19
| | |
| Who we are | | |
| Who is providing this notice? | | Capitol Series Trust |
| What we do | | |
| How does Capitol Series Trust protect my personal information? | | To protect your personal information from unauthorized access and use, we use security measures that comply with federal law. These measures include computer safeguards and secured files and buildings. |
| How does Capitol Series Trust collect my personal information? | | We collect your personal information, for example, when you ◾ open an account or deposit money ◾ buy securities from us or sell securities to us ◾ make deposits or withdrawals from your account provide account information ◾ give us your account information ◾ make a wire transfer ◾ tell us who receives the money ◾ tell us where to send the money ◾ show your government-issued ID ◾ show your driver’s license |
Why can’t I limit all
sharing? | | Federal law gives you the right to limit only ◾ sharing for affiliates’ everyday business purposes — information about your creditworthiness ◾ affiliates from using your information to market to you ◾ sharing for nonaffiliates to market to you State laws and individual companies may give you additional rights to limit sharing. |
| Definitions | | |
| Affiliates | | Companies related by common ownership or control. They can be financial and nonfinancial companies. |
| Nonaffiliates | | Companies not related by common ownership or control. They can be financial and nonfinancial companies. ◾ Capitol Series Trust does not share your personal information with nonaffiliates so they can market to you. |
| Joint marketing | | A formal agreement between nonaffiliated financial companies that together market financial products or services to you. ◾ Capitol Series Trust doesn’t jointly market financial products or services to you. |
20
PROXY VOTING (Unaudited)
A description of the policies and procedures that the Fund uses to determine how to vote proxies relating to portfolio securities and information regarding how the Fund voted those proxies during the most recent twelve month period ended June 30, is available without charge upon request by (1) calling the Fund at (800) 657-4450 and (2) from Fund documents filed with the Securities and Exchange Commission (“SEC”) on the SEC’s website at www.sec.gov.
TRUSTEES
Walter B. Grimm, Chairman
Mary M. Morrow
Robert G. Dorsey
OFFICERS
Dina A. Tantra, Chief Executive Officer/President
Zachary P. Richmond, Chief Financial Officer/Treasurer
Brandon R. Kipp, Chief Compliance Officer
INVESTMENT ADVISER
Hedeker Wealth LLC
One Overlook Point, Suite 610
Lincolnshire, IL 60069
DISTRIBUTOR
Ultimus Fund Distributors, LLC
225 Pictoria Drive, Suite 450
Cincinnati, OH 45246
INDEPENDENT REGISTERED PUBLIC ACCOUNTING FIRM
Ernst & Young LLP
800 Yard Street, Suite 500
Grandview Heights, OH 43212
LEGAL COUNSEL
Bernstein Shur
100 Middle Street, 6th Floor
Portland, ME 04104
CUSTODIAN
Huntington National Bank
41 South High Street
Columbus, OH 43215
ADMINISTRATOR, TRANSFER AGENT AND FUND ACCOUNTANT
Ultimus Fund Solutions, LLC
225 Pictoria Drive, Suite 450
Cincinnati, OH 45246
This report is intended only for the information of shareholders or those who have received the Fund’s prospectus which contains information about the Fund’s management fee and expenses. Please read the prospectus carefully before investing.
Distributed by Ultimus Fund Distributors, LLC
Member FINRA/SIPC

Preserver Alternative Opportunities Fund
Institutional Shares – PAOIX
Retail Shares – PAORX
Semi-Annual Report
February 28, 2018
Preserver Partners, LLC
8700 Trail Lake Drive West, Suite 105
Memphis, Tennessee 38125
(844) 838-2119 or (901) 755-4737
Investment Results (Unaudited)
Average Annual Total Returns(a) as of February 28, 2018
| | | | | | | | | | | | |
| | | Six Months | | | One Year | | | Since
Inception
(3/1/16) | |
Preserver Alternative Opportunities Fund | | | | | | | | | | | | |
Institutional Shares | | | 1.80 | % | | | 8.11 | % | | | 10.06 | % |
Retail Shares | | | 1.69 | % | | | 7.80 | % | | | 9.79 | % |
Wilshire Liquid Alternative Index (b) | | | 1.26 | % | | | 3.05 | % | | | 4.21 | % |
Bloomberg Barclays U.S. Aggregate Bond Index (b) | | | -2.18 | % | | | 0.51 | % | | | 0.96 | % |
| | | Expense Ratios(c) | |
| |
| Institutional
Shares |
| | | | | |
| Retail
Shares |
|
Gross | | | 2.32 | % | | | | | | | 2.57 | % |
With Applicable Waivers | | | 2.05 | % | | | | | | | 2.30 | % |
The performance quoted represents past performance, which does not guarantee future results. The investment return and principal value of an investment will fluctuate so that an investor’s shares, when redeemed, may be worth more or less than their original cost. The returns shown do not reflect deduction of taxes that a shareholder would pay on Preserver Alternative Opportunities Fund (the "Fund") distributions or the redemption of Fund shares. Current performance of the Fund may be lower or higher than the performance quoted. The Fund's investment objectives, risks, charges and expenses must be considered carefully before investing. Performance data current to the most recent month end may be obtained by calling (844) 838-2119.
(a) Return figures reflect any change in price per share and assume the reinvestment of all distributions. The Fund's returns reflect any fee waivers during the applicable period. If such fee waivers had not occurred, the quoted performance would have been lower. Total Returns for less than one year are not annualized.
(b) The Wilshire Liquid Alternative Index measures the collective performance of the five Wilshire Liquid Alternative strategies that make up the Wilshire Liquid Alternative Universe. The Wilshire Liquid Alternative Index is designed to provide a broad measure of the liquid alternative market by combining the performance of the Wilshire Liquid Alternative Equity Hedge Index, Wilshire Liquid Alternative Global Macro Index, Wilshire Liquid Alternative Relative Value Index, Wilshire Liquid Alternative Multi-Strategy Index, and Wilshire Liquid Alternative Event Driven Index. The Bloomberg Barclays U.S. Aggregate Bond Index (the "Index") covers the U.S. investment grade fixed rate bond market (measuring bonds with maturities of at least one year), with index components for government and corporate securities, mortgage pass through securities, and asset-backed securities. The Index is an unmanaged benchmark that assumes reinvestment of all distributions and excludes the effect of taxes and fees. Individuals cannot invest directly in this Index; however, an individual can invest in exchange traded funds or other investment vehicles that attempt to track the performance of a benchmark index.
(c) The expense ratios are from the Fund’s prospectus dated December 29, 2017. Preserver Partners, LLC (the “Adviser”), the Fund’s adviser, has contractually agreed to waive its management fee and/or reimburse expenses so that total annual operating expenses (excluding (i) interest; (ii) taxes; (iii) brokerage fees and commissions; (iv) other extraordinary expenses not incurred in the ordinary course of the Fund’s business; (v) dividend expenses on short sales; (vi) expenses incurred under a Rule 12b-1 plan of distribution; and (vii) indirect expenses such as acquired fund fees and expenses) do not exceed 1.75% of the Fund’s average daily net assets through December 31, 2018. This expense cap agreement may be terminated by the Board of Trustees at any time. Additional information pertaining to the Fund’s expense ratios as of February 28, 2018, can be found in the financial highlights.
The Fund's investment objectives, strategies, risks, charges and expenses must be considered carefully before investing. The prospectus contains this and other important information about the Fund and may be obtained by calling (844) 838-2119. Please read it carefully before investing.
The Fund is distributed by Unified Financial Securities, LLC, member FINRA/SIPC.
1
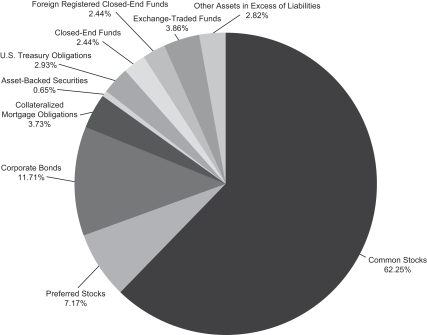
Portfolio Illustration (Unaudited)
February 28, 2018
The following chart gives a visual breakdown of the Fund’s holdings as a percentage of net assets.
Availability of Portfolio Schedule (Unaudited)
The Fund files its complete schedule of portfolio holdings with the Securities and Exchange Commission (“SEC”) as of the end of the first and third quarters of each fiscal on Form N-Q. The Fund’s Forms N-Q are available at the SEC’s website at www.sec.gov. The Forms N-Q may be reviewed and copied at the Public Reference Room in Washington DC. Information on the operation of the Public Reference Room may be obtained by calling 1-800-SEC-0330.
2
Preserver Alternative Opportunities Fund
Schedule of Investments (Unaudited)
February 28, 2018
| | | | | | | | |
| Shares | | | | | Fair Value | |
| | COMMON STOCKS – 62.25% | | | | |
| | |
| | | | Australia – 2.55% | | | | |
| | | | Consumer Discretionary – 1.79% | | | | |
| | 12,000 | | | Aristocrat Leisure Ltd. | | $ | 229,712 | |
| | 5,000 | | | Domino’s Pizza Enterprises Ltd. | | | 152,947 | |
| | | | | | | | |
| | | | | | | 382,659 | |
| | | | | | | | |
| | | | Industrials – 0.76% | | | | |
| | 31,524 | | | Sydney Airport | | | 161,329 | |
| | | | | | | | |
| | | | | | | 543,988 | |
| | | | | | | | |
| | | | Canada – 0.84% | | | | |
| | | | Real Estate – 0.84% | | | | |
| | 21,858 | | | NorthWest Healthcare Properties Real Estate Investment Trust | | | 179,537 | |
| | | | | | | | |
| | |
| | | | Denmark – 0.89% | | | | |
| | | | Consumer Discretionary – 0.89% | | | | |
| | 1,800 | | | Pandora A/S | | | 188,758 | |
| | | | | | | | |
| | |
| | | | France – 1.15% | | | | |
| | | | Industrials – 1.15% | | | | |
| | 2,200 | | | Thales SA | | | 245,685 | |
| | | | | | | | |
| | |
| | | | Germany – 7.36% | | | | |
| | | | Consumer Discretionary – 1.56% | | | | |
| | 1,500 | | | adidas AG | | | 334,147 | |
| | | | | | | | |
| | |
| | | | Consumer Staples – 1.02% | | | | |
| | 1,800 | | | Henkel AG & Company KGaA | | | 217,067 | |
| | | | | | | | |
| | |
| | | | Financials – 1.38% | | | | |
| | 4,000 | | | AURELIUS SE & Company KGaA | | | 294,010 | |
| | | | | | | | |
| | |
| | | | Industrials – 1.05% | | | | |
| | 2,600 | | | KION Group AG | | | 223,555 | |
| | | | | | | | |
| | |
| | | | Materials – 1.18% | | | | |
| | 3,000 | | | LANXESS AG | | | 251,067 | |
| | | | | | | | |
| | |
| | | | Real Estate – 1.17% | | | | |
| | 6,000 | | | Deutsche Wohnen SE | | | 248,506 | |
| | | | | | | | |
| | | | | | | 1,568,352 | |
| | | | | | | | |
| | | | Israel – 1.35% | | | | |
| | | | Industrials – 1.35% | | | | |
| | 2,000 | | | Elbit Systems Ltd. | | | 288,020 | |
| | | | | | | | |
See accompanying notes which are an integral part of these financial statements.
3
Preserver Alternative Opportunities Fund
Schedule of Investments (Unaudited) (continued)
February 28, 2018
| | | | | | | | |
| Shares | | | | | Fair Value | |
| | COMMON STOCKS – (continued) | | | | |
| | |
| | | | Japan – 8.48% | | | | |
| | | | Consumer Discretionary – 2.58% | | | | |
| | 7,200 | | | McDonald’s Holdings Company Japan Ltd. | | $ | 322,227 | |
| | 4,500 | | | Sony Corporation – ADR | | | 227,070 | |
| | | | | | | | |
| | | | | | | 549,297 | |
| | | | | | | | |
| | | | Consumer Staples – 0.94% | | | | |
| | 6,000 | | | Calbee, Inc. | | | 201,322 | |
| | | | | | | | |
| | |
| | | | Information Technology – 3.59% | | | | |
| | 10,000 | | | Amano Corporation | | | 280,706 | |
| | 350 | | | Keyence Corporation | | | 214,110 | |
| | 9,500 | | | Nippon Ceramic Company Ltd. | | | 268,897 | |
| | | | | | | | |
| | | | | | | 763,713 | |
| | | | | | | | |
| | | | Telecommunication Services – 1.37% | | | | |
| | 3,500 | | | SoftBank Group Corporation | | | 291,790 | |
| | | | | | | | |
| | | | | | | 1,806,122 | |
| | | | | | | | |
| | | | Luxembourg – 1.47% | | | | |
| | | | Consumer Discretionary – 1.47% | | | | |
| | 55,000 | | | B&M European Value Retail S.A. | | | 312,661 | |
| | | | | | | | |
| | |
| | | | Mexico – 1.36% | | | | |
| | | | Industrials – 1.36% | | | | |
| | 3,000 | | | Grupo Aeroportuario del Pacifico SAB de CV – ADR | | | 289,650 | |
| | | | | | | | |
| | |
| | | | Sweden – 1.33% | | | | |
| | | | Industrials – 1.33% | | | | |
| | 15,000 | | | Volvo AB, B Shares | | | 284,080 | |
| | | | | | | | |
| | |
| | | | United Kingdom – 6.04% | | | | |
| | | | Consumer Discretionary – 1.34% | | | | |
| | 3,000 | | | WPP PLC – ADR | | | 285,510 | |
| | | | | | | | |
| | |
| | | | Financials – 1.01% | | | | |
| | 15,000 | | | Burford Capital Ltd. | | | 216,018 | |
| | | | | | | | |
| | |
| | | | Health Care – 1.64% | | | | |
| | 20,000 | | | Abcam PLC | | | 349,703 | |
| | | | | | | | |
| | |
| | | | Industrials – 2.05% | | | | |
| | 15,000 | | | Ashtead Group PLC | | | 436,578 | |
| | | | | | | | |
| | | | | | | 1,287,809 | |
| | | | | | | | |
See accompanying notes which are an integral part of these financial statements.
4
Preserver Alternative Opportunities Fund
Schedule of Investments (Unaudited) (continued)
February 28, 2018
| | | | | | | | |
| Shares | | | | | Fair Value | |
| | COMMON STOCKS – (continued) | | | | |
| | |
| | | | United States – 29.43% | | | | |
| | | | Consumer Discretionary – 4.97% | | | | |
| | 200 | | | Amazon.com, Inc.(a) | | $ | 302,490 | |
| | 7,000 | | | Liberty Media Corporation – Liberty Formula One, Class C(a) | | | 230,510 | |
| | 1,000 | | | Mohawk Industries, Inc.(a) | | | 239,880 | |
| | 5,000 | | | Norwegian Cruise Line Holdings Ltd.(a) | | | 284,500 | |
| | | | | | | | |
| | | | | | | 1,057,380 | |
| | | | | | | | |
| | | | Energy – 2.49% | | | | |
| | 2,000 | | | Diamondback Energy, Inc.(a) | | | 249,280 | |
| | 11,000 | | | Enterprise Products Partners LP(b)(c) | | | 279,620 | |
| | | | | | | | |
| | | | | | | 528,900 | |
| | | | | | | | |
| | | | Financials – 7.05% | | | | |
| | 2,000 | | | Berkshire Hathaway, Inc., Class B(a)(c) | | | 414,400 | |
| | 600 | | | BlackRock, Inc. | | | 329,658 | |
| | 8,000 | | | Blackstone Group LP (The)(b) | | | 272,000 | |
| | 15,000 | | | Great Ajax Corporation | | | 194,700 | |
| | 5,000 | | | Western Alliance Bancorp(a) | | | 292,300 | |
| | | | | | | | |
| | | | | | | 1,503,058 | |
| | | | | | | | |
| | | | Health Care – 2.13% | | | | |
| | 2,000 | | | UnitedHealth Group, Inc. | | | 452,320 | |
| | | | | | | | |
| | |
| | | | Industrials – 5.23% | | | | |
| | 4,000 | | | AMETEK, Inc. | | | 302,960 | |
| | 2,000 | | | FedEx Corporation | | | 492,820 | |
| | 2,000 | | | Stanley Black & Decker, Inc. | | | 318,380 | |
| | | | | | | | |
| | | | | | | 1,114,160 | |
| | | | | | | | |
| | | | Information Technology – 5.16% | | | | |
| | 2,000 | | | Adobe Systems, Inc.(a) | | | 418,260 | |
| | 300 | | | Alphabet, Inc., Class A(a) | | | 331,176 | |
| | 2,000 | | | MasterCard, Inc., Class A | | | 351,520 | |
| | | | | | | | |
| | | | | | | 1,100,956 | |
| | | | | | | | |
| | | | Real Estate – 2.40% | | | | |
| | 12,240 | | | Landmark Infrastructure Partners LP(b) | | | 205,020 | |
| | 2,000 | | | Simon Property Group, Inc. | | | 307,020 | |
| | | | | | | | |
| | | | | | | 512,040 | |
| | | | | | | | |
| | | | | | | 6,268,814 | |
| | | | | | | | |
| | | | Total Common Stocks (Cost $11,812,509) | | | 13,263,476 | |
| | | | | | | | |
| |
| | PREFERRED STOCKS – 7.17% | | | | |
| | |
| | | | Ireland – 1.02% | | | | |
| | | | Health Care – 1.02% | | | | |
| | 400 | | | Allergan PLC, Series A, 5.50% | | | 217,400 | |
| | | | | | | | |
See accompanying notes which are an integral part of these financial statements.
5
Preserver Alternative Opportunities Fund
Schedule of Investments (Unaudited) (continued)
February 28, 2018
| | | | | | | | |
| Shares | | | | | Fair Value | |
| | PREFERRED STOCKS – (continued) | | | | |
| | |
| | | | United States – 6.15% | | | | |
| | | | Energy – 0.94% | | | | |
| | 6,000 | | | Kinder Morgan, Inc., Series A, 9.75% | | $ | 199,920 | |
| | | | | | | | |
| | |
| | | | Financials – 3.52% | | | | |
| | 10,000 | | | Invesco Mortgage Capital, Inc., Series A, 7.75% | | | 250,000 | |
| | 10,000 | | | New York Mortgage Trust, Inc., Series C, 7.88% | | | 240,200 | |
| | 10,000 | | | Wells Fargo & Co., Series J, 8.00% | | | 258,000 | |
| | | | | | | | |
| | | | | | | 748,200 | |
| | | | | | | | |
| | | | Industrials – 1.14% | | | | |
| | 5,000 | | | Stericycle, Inc., 5.25% | | | 242,900 | |
| | | | | | | | |
| | |
| | | | Real Estate – 0.55% | | | | |
| | 5,000 | | | Jernigan Capital, Inc., Series B, 7.00% | | | 118,250 | |
| | | | | | | | |
| | | | Total Preferred Stocks (Cost $1,687,806) | | | 1,526,670 | |
| | | | | | | | |
| |
| | EXCHANGE-TRADED FUNDS – 3.86% | | | | |
| | 1,500 | | | SPDR S&P 500 ETF Trust | | | 407,475 | |
| | 8,000 | | | SPDR Bloomberg Barclays Convertible Securities ETF | | | 414,400 | |
| | | | | | | | |
| | | | Total Exchange-Traded Funds Cost ($800,602) | | | 821,875 | |
| | | | | | | | |
| |
| | FOREIGN REGISTERED CLOSED-END FUNDS – 2.44% | | | | |
| | 12,000 | | | Third Point Offshore Investors Ltd. | | | 200,400 | |
| | 65,000 | | | VinaCapital Vietnam Opportunity Fund Ltd. | | | 320,378 | |
| | | | | | | | |
| | | | Total Foreign Registered Closed-End Funds Cost ($414,621) | | | 520,778 | |
| | | | | | | | |
| |
| | CLOSED-END FUNDS – 2.44% | | | | |
| | 20,000 | | | Eaton Vance Limited Duration Income Fund | | | 261,400 | |
| | 17,000 | | | Pioneer Diversified High Income Trust | | | 258,060 | |
| | | | | | | | |
| | | | Total Closed-End Funds Cost ($531,235) | | | 519,460 | |
| | | | | | | | |
| | |
Principal
Amount | | | | | | |
| | CORPORATE BONDS – 11.71% | | | | |
| | |
| | | | United States – 11.71% | | | | |
| | | | Consumer Discretionary – 1.59% | | | | |
| $ | 120,000 | | | International Game Technology PLC, 5.35%, 10/15/2023 | | | 120,787 | |
| | 100,000 | | | L Brands, Inc., 5.25%, 2/1/2028 | | | 96,375 | |
| | 120,000 | | | Scientific Games International, Inc., 6.25%, 9/1/2020 | | | 121,200 | |
| | | | | | | | |
| | | | | | | 338,362 | |
| | | | | | | | |
| | | | Energy – 1.16% | | | | |
| | 100,000 | | | Genesis Energy LP, 6.75%, 8/1/2022 | | | 103,250 | |
| | 150,000 | | | Range Resources Corporation, 4.88%, 5/15/2025 | | | 144,375 | |
| | | | | | | | |
| | | | | | | 247,625 | |
| | | | | | | | |
See accompanying notes which are an integral part of these financial statements.
6
Preserver Alternative Opportunities Fund
Schedule of Investments (Unaudited) (continued)
February 28, 2018
| | | | | | | | |
Principal
Amount | | | | | Fair Value | |
| | CORPORATE BONDS – (continued) | | | | |
| | |
| | | | Financials – 0.95% | | | | |
| $ | 200,000 | | | Stifel Financial Corporation, 4.25%, 7/18/2024 | | $ | 201,396 | |
| | | | | | | | |
| | |
| | | | Health Care – 2.71% | | | | |
| | 150,000 | | | Community Health Systems, Inc., 7.13%, 7/15/2020 | | | 127,500 | |
| | 200,000 | | | DaVita, Inc., 5.00%, 5/1/2025 | | | 196,750 | |
| | 100,000 | | | Tenet Healthcare Corporation, 8.13%, 4/1/2022 | | | 105,875 | |
| | 150,000 | | | Valeant Pharmaceuticals International, 7.25%, 7/15/2022 | | | 146,813 | |
| | | | | | | | |
| | | | | | | 576,938 | |
| | | | | | | | |
| | | | Industrials – 1.79% | | | | |
| | 120,000 | | | Atlas Air Worldwide Holdings, Inc., 2.25%, 6/1/2022 | | | 137,097 | |
| | 100,000 | | | Timken Company (The), 3.88%, 9/1/2024 | | | 99,196 | |
| | 150,000 | | | Triumph Group, Inc., 5.25%, 6/1/2022 | | | 145,875 | |
| | | | | | | | |
| | | | | | | 382,168 | |
| | | | | | | | |
| | | | Materials – 0.92% | | | | |
| | 200,000 | | | AK Steel Corporation, 6.38%, 10/15/2025 | | | 197,000 | |
| | | | | | | | |
| | |
| | | | Real Estate – 1.42% | | | | |
| | 200,000 | | | Iron Mountain, Inc., 5.75%, 8/15/2024 | | | 200,000 | |
| | 100,000 | | | Senior Housing Properties Trust, 4.75%, 5/1/2024 | | | 102,352 | |
| | | | | | | | |
| | | | | | | 302,352 | |
| | | | | | | | |
| | | | Telecommunication Services – 0.74% | | | | |
| | 62,000 | | | CenturyLink, Inc. , Series D, 7.20%, 12/1/2025 | | | 59,924 | |
| | 100,000 | | | T-Mobile USA, Inc., 4.75%, 2/1/2028 | | | 97,663 | |
| | | | | | | | |
| | | | | | | 157,587 | |
| | | | | | | | |
| | | | Utilities – 0.43% | | | | |
| | 100,000 | | | Ferrellgas Partners LP, 8.63%, 6/15/2020 | | | 92,250 | |
| | | | | | | | |
| | | | Total Corporate Bonds (Cost $2,438,802) | | | 2,495,678 | |
| | | | | | | | |
| |
| | COLLATERALIZED MORTGAGE OBLIGATIONS – 3.73% | | | | |
| | 88,500 | | | Banc of America Mortgage Securities, Inc., Series 2004-K, Class 1A2, 3.85%, 12/25/2034(d) | | | 85,359 | |
| | 54,118 | | | Countrywide Alternative Loan Trust, Series 2003-J2, Class A1, 6.00%, 10/25/2033 | | | 56,376 | |
| | 53,989 | | | Countrywide Home Loans Mortgage Pass Through Trust, Series 2004-HYB9, Class 1A1, 3.55%, 2/20/2035(d) | | | 54,679 | |
| | 24,559 | | | GSR Mortgage Loan Trust, Series 2005-5F, Class 8A3, 2.12%, 6/25/2035 (1MO LIBOR + 50bps)(e) | | | 23,590 | |
| | 125,185 | | | HarborView Mortgage Loan Trust, Series 2004-07, Class 2A1, 3.30%, 11/19/2034(d) | | | 126,742 | |
| | 179,050 | | | Impac CMB Trust, Series 2005-08, Class 2B, 3.87%, 2/25/2036
(1MO LIBOR + 225bps)(e) | | | 173,131 | |
| | 276,158 | | | Residential Asset Mortgage Products, Inc., Series 2001-RS2, Class MII2,
3.05%, 6/25/2031 (1MO LIBOR + 95bps)(e) | | | 275,526 | |
| | | | | | | | |
| | | | Total Collateralized Mortgage Obligations (Cost $745,905) | | | 795,403 | |
| | | | | | | | |
See accompanying notes which are an integral part of these financial statements.
7
Preserver Alternative Opportunities Fund
Schedule of Investments (Unaudited) (continued)
February 28, 2018
| | | | | | | | |
Principal
Amount | | | | | Fair Value | |
| | U.S. TREASURY OBLIGATIONS – 2.93% | | | | |
| $ | 200,000 | | | United States Treasury Inflation Indexed Bonds, 0.38%, 7/15/2025(f) | | $ | 204,205 | |
| | 200,000 | | | United States Treasury Notes, 1.13%, 2/28/2021 | | | 192,434 | |
| | 250,000 | | | United States Treasury Notes, 1.63%, 2/15/2026 | | | 228,237 | |
| | | | | | | | |
| | | | Total U.S. Treasury Obligations (Cost $653,304) | | | 624,876 | |
| | | | | | | | |
| |
| | ASSET-BACKED SECURITIES – 0.65% | | | | |
| | 133,929 | | | American Airlines, Inc. Pass Through Trust, Series 2013-2, Class B,
5.60%, 1/15/2022(g) | | | 137,941 | |
| | | | | | | | |
| | | | Total Asset-Backed Securities (Cost $135,218) | | | 137,941 | |
| | | | | | | | |
| | |
| | | | Total Investments – 97.18% (Cost $19,179,116) | | | 20,706,157 | |
| | | | | | | | |
| | |
| | | | Other Assets in Excess of Liabilities – 2.82% | | | 601,062 | |
| | | | | | | | |
| | |
| | | | NET ASSETS – 100.00% | | $ | 21,307,219 | |
| | | | | | | | |
| (a) | | Non-income producing security. |
| (b) | | Master Limited Partnership |
| (c) | | All or a portion of the security is held as collateral for unsettled security transactions. |
| (d) | | Variable or Floating Rate Security. Rate fluctuations may be used on index changes, prepayment or underlying positions and/or other variables. Rate presented is as of February 28, 2018. |
| (e) | | Variable rate security. The rate shown is the effective interest rate as of February 28, 2018. The benchmark on which the rate is calculated is shown parenthetically. |
| (f) | | Principal amount of security is adjusted periodically based on changes in the Consumer Price Index. |
| (g) | | Security exempt from registration under Rule 144A or Section 4(2) of the Securities Act of 1933. The security may be resold in transactions exempt from registration, normally to qualified institutional buyers. |
| | | | |
ADR | | – | | American Depositary Receipt |
ETF | | – | | Exchange-Traded Fund |
SPDR | | – | | Standard & Poor’s Depositary Receipt |
The sectors shown on the schedule of investments are based on the Global Industry Classification Standard, or GICS® (“GICS”). The GICS was developed by and/or is the exclusive property of MSCI, Inc. and Standard & Poor’s Financial Services LLC (“S&P”). GICS is a service mark of MSCI, Inc. and S&P and has been licensed for use by the Administrator.
See accompanying notes which are an integral part of these financial statements.
8
Preserver Alternative Opportunities Fund
Statement of Assets and Liabilities (Unaudited)
February 28, 2018
| | | | |
Assets | | | | |
Investments in securities at fair value (cost $19,179,116) | | $ | 20,706,157 | |
Cash | | | 442,085 | |
Receivable for fund shares sold | | | 54,630 | |
Receivable for investments sold | | | 72,810 | |
Dividends and interest receivable | | | 58,002 | |
Tax reclaims receivable | | | 4,630 | |
Prepaid expenses | | | 8,626 | |
Total Assets | | | 21,346,940 | |
Liabilities | | | | |
Payable for fund shares redeemed | | | 7,636 | |
Payable to Adviser | | | 13,045 | |
Payable to Administrator | | | 6,813 | |
Accrued 12b-1 fees – Retail class | | | 1,075 | |
Other accrued expenses | | | 11,152 | |
Total Liabilities | | | 39,721 | |
Net Assets | | $ | 21,307,219 | |
Net Assets consist of: | | | | |
Paid-in capital | | $ | 19,479,631 | |
Accumulated net investment loss | | | (170,862 | ) |
Accumulated undistributed net realized gain from investments | | | 470,843 | |
Net unrealized appreciation on investments | | | 1,527,607 | |
Net Assets | | $ | 21,307,219 | |
Institutional Shares: | | | | |
Net Assets | | $ | 18,880,870 | |
Shares outstanding | | | 1,641,315 | |
Net asset value, offering and redemption price per share(a) | | $ | 11.50 | |
Retail Shares: | | | | |
Net Assets | | $ | 2,426,349 | |
Shares outstanding | | | 211,369 | |
Net asset value, offering and redemption price per share(a) | | $ | 11.48 | |
| (a) | | A 2.00% redemption fee is imposed upon shares redeemed within 60 calendar days of their purchase. |
9
See accompanying notes which are an integral part of these financial statements.
Preserver Alternative Opportunities Fund
Statement of Operations (Unaudited)
For the six months ended February 28, 2018
| | | | |
Investment Income | | | | |
Dividend income (net of foreign taxes withheld of $5,089) | | $ | 187,001 | |
Interest income | | | 90,349 | |
Total investment income | | | 277,350 | |
Expenses | | | | |
Investment Adviser | | | 72,719 | |
Administration | | | 17,852 | |
Fund accounting | | | 14,876 | |
Audit | | | 11,157 | |
Transfer agent | | | 9,917 | |
Printing | | | 6,925 | |
Registration | | | 6,608 | |
Legal | | | 6,516 | |
Pricing | | | 5,030 | |
Custodian | | | 3,425 | |
12b-1 fees – Retail Shares | | | 3,060 | |
Trustee | | | 2,603 | |
Miscellaneous | | | 11,230 | |
Total expenses | | | 171,918 | |
Recoupment of prior expenses waived/reimbursed by Adviser | | | 811 | |
Net operating expenses | | | 172,729 | |
Net investment income | | | 104,621 | |
Net Realized and Change in Unrealized Gain (Loss) on Investments | | | | |
Net realized gain on investment securities transactions | | | 706,322 | |
Net realized loss on foreign currency translations | | | (40,698 | ) |
Net change in unrealized appreciation of investment securities and foreign currency translations | | | (449,460 | ) |
Net realized and change in unrealized gain on investments | | | 216,164 | |
Net increase in net assets resulting from operations | | $ | 320,785 | |
10
See accompanying notes which are an integral part of these financial statements.
Preserver Alternative Opportunities Fund
Statements of Changes in Net Assets
| | | | | | | | |
| | | For the Six Months
Ended
February 28, 2018
(Unaudited) | | | For the Year
Ended
August 31, 2017 | |
Increase (Decrease) in Net Assets due to: Operations | | | | | | | | |
Net investment income | | $ | 104,621 | | | $ | 232,740 | |
Long-term capital gain dividends from investment companies | | | — | | | | 2,063 | |
Net realized gain on investment securities transactions and foreign currency translations | | | 665,624 | | | | 97,105 | |
Net change in unrealized appreciation (depreciation) of investment securities and foreign currency translations | | | (449,460 | ) | | | 1,405,573 | |
Net increase in net assets resulting from operations | | | 320,785 | | | | 1,737,481 | |
Distributions From: | | | | | | | | |
Net investment income: | | | | | | | | |
Institutional Shares | | | (227,584 | ) | | | (239,216 | ) |
Retail Shares | | | (30,727 | ) | | | (28,812 | ) |
Net realized gains: | | | | | | | | |
Institutional Shares | | | (287,635 | ) | | | (7,459 | ) |
Retail Shares | | | (43,012 | ) | | | (995 | ) |
Total distributions | | | (588,958 | ) | | | (276,482 | ) |
Capital Transactions – Institutional Shares | | | | | | | | |
Proceeds from shares sold | | | 3,442,047 | | | | 5,835,841 | |
Reinvestment of distributions | | | 513,700 | | | | 244,577 | |
Amount paid for shares redeemed | | | (858,368 | ) | | | (1,014,138 | ) |
Proceeds from redemption fees(a) | | | — | | | | 72 | |
Total Institutional Shares | | | 3,097,379 | | | | 5,066,352 | |
Capital Transactions – Retail Shares | | | | | | | | |
Proceeds from shares sold | | | 817,506 | | | | 882,175 | |
Reinvestment of distributions | | | 73,225 | | | | 29,807 | |
Amount paid for shares redeemed | | | (622,321 | ) | | | (630,505 | ) |
Proceeds from redemption fees(a) | | | 6 | | | | 32 | |
Total Retail Shares | | | 268,416 | | | | 281,509 | |
Net increase in net assets resulting from capital transactions | | | 3,365,795 | | | | 5,347,861 | |
Total Increase in Net Assets | | | 3,097,622 | | | | 6,808,860 | |
Net Assets | | | | | | | | |
Beginning of period | | | 18,209,597 | | | | 11,400,737 | |
End of period | | $ | 21,307,219 | | | $ | 18,209,597 | |
Accumulated net investment loss | | $ | (170,862 | ) | | $ | (17,172 | ) |
Share Transactions – Institutional Shares | | | | | | | | |
Shares sold | | | 295,530 | | | | 535,360 | |
Shares issued in reinvestment of distributions | | | 44,530 | | | | 23,205 | |
Shares redeemed | | | (74,136 | ) | | | (92,631 | ) |
Total Institutional Shares | | | 265,924 | | | | 465,934 | |
Share Transactions – Retail Shares | | | | | | | | |
Shares sold | | | 70,041 | | | | 80,710 | |
Shares issued in reinvestment of distributions | | | 6,360 | | | | 2,828 | |
Shares redeemed | | | (53,194 | ) | | | (59,689 | ) |
Total Retail Shares | | | 23,207 | | | | 23,849 | |
| (a) | | A 2.00% redemption fee is imposed upon shares redeemed within 60 calendar days of their purchase. |
11
See accompanying notes which are an integral part of these financial statements.
Preserver Alternative Opportunities Fund – Institutional Shares
Financial Highlights
Selected data for a share outstanding throughout each period.
| | | | | | | | | | | | |
| | | For the six months
ended
February 28, 2018
(Unaudited) | | | For the year
ended
August 31, 2017 | | | For the period
ended
August 31, 2016(a) | |
Net asset value, at beginning of period | | | $11.65 | | | | $10.62 | | | | $10.00 | |
| | | | | | | | | | | | |
| | | |
Income from investment operations: | | | | | | | | | | | | |
| | | |
Net investment income | | | 0.08 | | | | 0.18 | | | | 0.07 | |
| | | |
Net realized and unrealized gain on investments | | | 0.13 | | | | 1.08 | | | | 0.55 | |
| | | | | | | | | | | | |
| | | |
Total from investment operations | | | 0.21 | | | | 1.26 | | | | 0.62 | |
| | | | | | | | | | | | |
| | | |
Distributions from: | | | | | | | | | | | | |
| | | |
Net investment income | | | (0.16 | ) | | | (0.22 | ) | | | — | |
| | | |
Net realized gain | | | (0.20 | ) | | | (0.01 | ) | | | — | |
| | | | | | | | | | | | |
| | | |
Total from distributions | | | (0.36 | ) | | | (0.23 | ) | | | — | |
| | | | | | | | | | | | |
Net asset value, at end of period | | | $11.50 | | | | $11.65 | | | | $10.62 | |
| | | | | | | | | | | | |
| | | |
Total Return(b) | | | 1.80 | %(c) | | | 12.04 | % | | | 6.20 | %(c) |
| | | | | | | | | | | | |
Ratios/Supplemental Data: | | | | | | | | | | | | |
| | | |
Net assets at end of period (thousands) | | | $18,881 | | | | $16,022 | | | | $9,659 | |
| | | |
Before waiver or recoupment: | | | | | | | | | | | | |
| | | |
Ratio of expenses to average net assets | | | 1.74 | %(d) | | | 2.02 | % | | | 2.92 | %(d) |
| | | |
After waiver or recoupment: | | | | | | | | | | | | |
| | | |
Ratio of expenses to average net assets | | | 1.75 | %(d) | | | 1.75 | % | | | 1.75 | %(d) |
| | | |
Ratio of net investment income to average net assets | | | 1.11 | %(d) | | | 1.62 | % | | | 1.44 | %(d) |
| | | |
Portfolio turnover(e) | | | 35 | %(c) | | | 72 | % | | | 20 | %(c) |
| (a) | | For the period March 1, 2016 (commencement of operations) through August 31, 2016. |
| (b) | | Total return in the above table represents the rate that the investor would have earned or lost on an investment in the Fund, assuming reinvestment of distributions. Excludes redemption fee. |
| (e) | | Portfolio turnover is calculated on the basis on the Fund as a whole without distinguishing among the classes of shares. |
12
See accompanying notes which are an integral part of these financial statements.
Preserver Alternative Opportunities Fund – Retail Shares
Financial Highlights
Selected data for a share outstanding throughout each period.
| | | | | | | | | | | | |
| | | For the six months
ended
February 28, 2018
(Unaudited) | | | For the year
ended
August 31, 2017 | | | For the period
ended
August 31, 2016(a) | |
Net asset value, at beginning of period | | | $11.63 | | | | $10.60 | | | | $10.00 | |
| | | | | | | | | | | | |
| | | |
Income from investment operations: | | | | | | | | | | | | |
| | | |
Net investment income | | | 0.06 | | | | 0.17 | | | | 0.05 | |
| | | |
Net realized and unrealized gain on investments | | | 0.14 | | | | 1.07 | | | | 0.55 | |
| | | | | | | | | | | | |
| | | |
Total from investment operations | | | 0.20 | | | | 1.24 | | | | 0.60 | |
| | | | | | | | | | | | |
| | | |
Distributions from: | | | | | | | | | | | | |
| | | |
Net investment income | | | (0.15 | ) | | | (0.20 | ) | | | — | |
| | | |
Net realized gain | | | (0.20 | ) | | | (0.01 | ) | | | — | |
| | | | | | | | | | | | |
| | | |
Total from distributions | | | (0.35 | ) | | | (0.21 | ) | | | — | |
| | | | | | | | | | | | |
Net asset value, at end of period | | | $11.48 | | | | $11.63 | | | | $10.60 | |
| | | | | | | | | | | | |
| | | |
Total Return(b) | | | 1.69 | %(c) | | | 11.84 | % | | | 6.00 | %(c) |
| | | | | | | | | | | | |
Ratios/Supplemental Data: | | | | | | | | | | | | |
| | | |
Net assets at end of period (thousands) | | | $2,426 | | | | $2,187 | | | | $1,742 | |
| | | |
Before waiver or recoupment: | | | | | | | | | | | | |
| | | |
Ratio of expenses to average net assets | | | 1.99 | %(d) | | | 2.27 | % | | | 3.17 | %(d) |
| | | |
After waiver or recoupment: | | | | | | | | | | | | |
| | | |
Ratio of expenses to average net assets | | | 2.00 | %(d) | | | 2.00 | % | | | 2.00 | %(d) |
| | | |
Ratio of net investment income to average net assets | | | 0.87 | %(d) | | | 1.38 | % | | | 1.19 | %(d) |
| | | |
Portfolio turnover(e) | | | 35 | %(c) | | | 72 | % | | | 20 | %(c) |
| (a) | | For the period March 1, 2016 (commencement of operations) through August 31, 2016. |
| (b) | | Total return in the above table represents the rate that the investor would have earned or lost on an investment in the Fund, assuming reinvestment of distributions. Excludes redemption fee. |
| (e) | | Portfolio turnover is calculated on the basis on the Fund as a whole without distinguishing among the classes of shares. |
13
See accompanying notes which are an integral part of these financial statements.
Preserver Alternative Opportunities Fund
Notes to Financial Statements (Unaudited)
February 28, 2018
NOTE 1. ORGANIZATION
The Preserver Alternative Opportunities Fund (the “Fund”) was organized as a diversified series of Capitol Series Trust (the “Trust”) on September 16, 2015. The Trust is an open-end investment company established under the laws of Ohio by an Agreement and Declaration of Trust dated September 18, 2013 (the “Trust Agreement”). The Trust Agreement permits the Board of Trustees of the Trust (the “Board”) to issue an unlimited number of shares of beneficial interest of separate series without par value. The Fund is one of a series of funds currently authorized by the Board. The Fund’s investment adviser is Preserver Partners, LLC (the “Adviser”). The investment objective of the Fund is to seek current income and capital appreciation with low volatility compared to the major equity and fixed income markets.
The Fund currently offers two classes of shares, Institutional Shares and Retail Shares. The Fund commenced operations on March 1, 2016. Each share represents an equal proportionate interest in the assets and liabilities belonging to the Fund and is entitled to such dividends and distributions out of income belonging to the Fund as are declared by the Board. Both share classes impose a 2.00% redemption fee on shares redeemed within 60 days of purchase.
NOTE 2. SIGNIFICANT ACCOUNTING POLICIES
The Fund is an investment company and follows accounting and reporting guidance under Financial Accounting Standards Board Accounting Standards Codification (“ASC”) Topic 946, “Financial Services-Investment Companies”. The following is a summary of significant accounting policies followed by the Fund in the preparation of its financial statements. These policies are in conformity with generally accepted accounting principles in the United States of America (“GAAP”).
Estimates – The preparation of financial statements in conformity with GAAP requires management to make estimates and assumptions that affect the reported amounts of assets and liabilities and disclosure of contingent assets and liabilities at the date of the financial statements and the reported amounts of increases and decreases in net assets from operations during the reporting period. Actual results could differ from those estimates.
Securities Valuation – All investments in securities are recorded at their estimated fair value as described in Note 3.
Foreign Currency Translation – The accounting records of the Fund are maintained in U.S. dollars. Foreign currency amounts are translated into U.S. dollars at the current rate of exchange each business day to determine the value of investments, and other assets and liabilities. Purchases and sales of foreign securities, and income and expenses, are translated at the prevailing rate of exchange on the respective date of these transactions. The Fund does not isolate that portion of the results of operations resulting from changes in foreign exchange rates on investments from fluctuation arising from changes in market prices of securities held. These fluctuations are included with the unrealized gain or loss from investments.
Federal Income Taxes – The Fund makes no provision for federal income tax or excise tax. The Fund has qualified and intends to qualify each year as a regulated investment company (“RIC”) under subchapter M of the Internal Revenue Code of 1986, as amended, by complying with the
14
Preserver Alternative Opportunities Fund
Notes to Financial Statements (Unaudited) (continued)
February 28, 2018
requirements applicable to RICs and by distributing substantially all of its taxable income. The Fund also intends to distribute sufficient net investment income and net capital gains, if any, so that it will not be subject to excise tax on undistributed income and gains. If the required amount of net investment income or gains is not distributed, the Fund could incur a tax expense.
The Fund may be subject to taxes imposed by countries in which it invests. Such taxes are generally based on income and/or capital gains earned or repatriated. Taxes are accrued and applied to net investment income, net realized gains and unrealized appreciation as such income and/or gains are earned.
The Fund recognizes tax benefits or expenses of uncertain tax positions only when the position is “more likely than not” to be sustained assuming examination by tax authorities. Management of the Fund has reviewed tax positions taken in tax years that remain subject to examination by all major tax jurisdictions, including federal (i.e., the previous two tax year ends and the interim tax period since then, as applicable) and has concluded that no provision for unrecognized tax benefits or expenses is required in these financial statements and does not expect this to change over the next twelve months. The Fund recognizes interest and penalties, if any, related to unrecognized tax benefits as income tax expense in the Statement of Operations. During the period, the Fund did not incur any interest or penalties.
Expenses – Expenses incurred by the Trust that do not relate to a specific fund of the Trust are allocated to the individual funds based on each fund’s relative net assets or another appropriate basis (as determined by the Board). Expenses specifically attributable to any class are borne by that class. Income, realized gains and losses, unrealized appreciation and depreciation, and expenses are allocated to each class based on the net assets in relation to the relative net assets of the Fund.
Security Transactions and Related Income – Throughout the reporting period, security transactions are accounted for no later than one business day following the trade date. For financial reporting purposes, security transactions are accounted for on trade date on the last business day of the reporting period. The specific identification method is used for determining gains or losses for financial statements and income tax purposes. Dividend income is recorded on the ex-dividend date and interest income is recorded on an accrual basis. Dividend income from real estate investment trusts (REITs) and distributions from limited partnerships are recognized on the ex-date and included in dividend income. The calendar year-end classification of distributions received from REITs during the fiscal year are reported subsequent to year end; accordingly, the Fund estimates the character of REIT distributions based on the most recent information available. Income or loss from limited partnerships is reclassified among the components of net assets upon receipt of K-1’s. Discounts and premiums on fixed income securities purchased are amortized or accreted over the life of the respective securities using the effective interest method.
Dividends and Distributions – The Fund intends to distribute substantially all of its net investment income, if any, as dividends to its shareholders on a quarterly basis. The Fund intends to distribute its net realized long term capital gains and its net realized short term capital gains, if any, at least once a year. Distributions to shareholders are recorded on the ex-dividend date. The amount of dividends from net investment income and distributions from net realized gains are determined in accordance with federal income tax regulations, which may differ from GAAP. These
15
Preserver Alternative Opportunities Fund
Notes to Financial Statements (Unaudited) (continued)
February 28, 2018
differences are caused primarily by differences in the timing of the recognition of certain components of income, expense or realized capital gains for federal income tax purposes. Where such differences are permanent in nature, they are reclassified in the components of net assets based on their ultimate characterization for federal income tax purposes. Any such reclassifications will have no effect on net assets, results of operations or net asset values per share of the Fund.
NOTE 3. SECURITIES VALUATION AND FAIR VALUE MEASUREMENTS
Fair value is defined as the price that the Fund would receive upon selling an investment in an orderly transaction to an independent buyer in the principal or most advantageous market of the investment. GAAP establishes a three-tier hierarchy to maximize the use of observable market data and minimize the use of unobservable inputs and to establish classification of fair value measurements for disclosure purposes.
Inputs refer broadly to the assumptions that market participants would use in pricing the asset or liability. Inputs may be observable or unobservable. Observable inputs are inputs that reflect the assumptions market participants would use in pricing the asset or liability developed based on market data obtained from sources independent of the reporting entity. Unobservable inputs are inputs that reflect the reporting entity’s own assumptions about the assumptions market participants would use in pricing the asset or liability developed based on the best information available in the circumstances.
Various inputs are used in determining the value of the Fund’s investments. These inputs are summarized in the three broad levels listed below.
| | • | | Level 1 – unadjusted quoted prices in active markets for identical investments and/or registered investment companies where the value per share is determined and published and is the basis for current transactions for identical assets or liabilities at the valuation date |
| | • | | Level 2 – other significant observable inputs (including, but not limited to, quoted prices for an identical security in an inactive market, quoted prices for similar securities, interest rates, prepayment speeds, credit risk, etc.) |
| | • | | Level 3 – significant unobservable inputs (including the Fund’s own assumptions in determining fair value of investments based on the best information available) |
The inputs used to measure fair value may fall into different levels of the fair value hierarchy. In such cases, for disclosure purposes, the level in the fair value hierarchy within which the fair value measurement falls in its entirety is determined based on the lowest level input that is significant to the fair value measurement in its entirety.
In computing the net asset value (“NAV”) of the Fund, fair value is based on market valuations with respect to portfolio securities for which market quotations are readily available. Pursuant to Board approved policies, the Fund relies on independent third-party pricing services to provide the current market value of securities. Those pricing services value equity securities, including exchange-traded funds and exchange-traded notes, traded on a securities exchange at the last reported sales price on the principal exchange. Equity securities quoted by NASDAQ are valued at
16
Preserver Alternative Opportunities Fund
Notes to Financial Statements (Unaudited) (continued)
February 28, 2018
the NASDAQ Official Closing Price. If there is no reported sale on the principal exchange, equity securities are valued at the mean between the most recent quoted bid and asked price. When using the market quotations or close prices provided by the pricing service and when the market is considered active, the security will be classified as a Level 1 security. Investments in open-end mutual funds, including money market mutual funds, are generally priced at the ending NAV provided by the pricing service of the funds and are generally categorized as Level 1 securities. Debt securities are valued using evaluated prices furnished by a pricing vendor selected by the Board and are generally classified as Level 2 securities.
In the event that market quotations are not readily available, the Adviser determines that the market quotation or the price provided by the pricing service does not accurately reflect the current fair value, or certain restricted or illiquid securities are being valued, such securities are valued as determined in good faith by the Trust’s Valuation Committee, based on recommendations from a pricing committee comprised of various officers of the Trust, various employees of the Fund’s administrator, and representatives of the Adviser (together the “Pricing Review Committee”). These securities will be classified as Level 2 or 3 within the fair value hierarchy, depending on the inputs used.
In accordance with the Trust’s Valuation Procedures, the Pricing Review Committee in making its recommendations are required to consider all appropriate factors relevant to the value of securities for which it has determined other pricing sources are not available or reliable as described above. No single standard exists for determining fair value, because fair value depends upon the circumstances of each individual case. As a general principle, the current fair value of an issue of securities being valued pursuant to the Trust’s Fair Valuation Procedures would be the amount which the Fund might reasonably expect to receive for them upon their current sale. Methods which are in accordance with this principle may, for example, be based on (i) a multiple of earnings; (ii) a discount from market prices of a similar freely traded security (including a derivative security or a basket of securities traded on other markets, exchanges or among dealers); or (iii) yield to maturity with respect to debt issues, or a combination of these and other methods. Fair value pricing is permitted if, in accordance with the Trust’s Valuation Procedures, the validity of market quotations appears to be questionable based on factors such as evidence of a thin market in the security based on a small number of quotations, a significant event occurs after the close of a market but before the Fund’s NAV calculation that may affect a security’s value, or other data calls into question the reliability of market quotations.
17
Preserver Alternative Opportunities Fund
Notes to Financial Statements (Unaudited) (continued)
February 28, 2018
The following is a summary of the inputs used to value the Fund’s investments as of February 28, 2018:
| | | | | | | | | | | | | | | | |
| | | Valuation Inputs | | | | |
| Asset Category | | Level 1 | | | Level 2 | | | Level 3 | | | Total | |
Common Stocks | | $ | 13,263,476 | | | $ | — | | | $ | — | | | $ | 13,263,476 | |
Preferred Stocks | | | 1,526,670 | | | | — | | | | — | | | | 1,526,670 | |
Corporate Bonds | | | — | | | | 2,495,678 | | | | — | | | | 2,495,678 | |
Collateralized Mortgage Obligations | | | — | | | | 795,403 | | | | — | | | | 795,403 | |
Asset-Backed Securities | | | — | | | | 137,941 | | | | — | | | | 137,941 | |
U.S. Treasury Obligations | | | — | | | | 624,876 | | | | — | | | | 624,876 | |
Closed-End Funds | | | 519,460 | | | | — | | | | — | | | | 519,460 | |
Foreign Registered Closed-End Funds | | | 520,778 | | | | — | | | | — | | | | 520,778 | |
Exchange-Traded Funds | | | 821,875 | | | | — | | | | — | | | | 821,875 | |
Total | | $ | 16,652,259 | | | $ | 4,053,898 | | | $ | — | | | $ | 20,706,157 | |
The Fund did not hold any investments at the end of the reporting period in which other significant unobservable inputs (Level 3) were used in determining fair value; therefore, no reconciliation of Level 3 securities is included for this reporting period. The Fund did not hold any derivative instruments during the reporting period.
The Trust recognizes transfers between fair value hierarchy levels at the end of the reporting period. There were no transfers between any levels as of February 28, 2018 based on input levels assigned at August 31, 2017.
NOTE 4. FEES AND OTHER TRANSACTIONS WITH AFFILIATES AND OTHER SERVICE PROVIDERS
Under the terms of the investment advisory agreement (the “Agreement”), the Adviser manages the Fund’s investments subject to approval of the Board. As compensation for its management services, the Fund is obligated to pay the Adviser a fee computed and accrued daily and paid monthly at an annual rate of 0.75% of the Fund’s average daily net assets. For the six months ended February 28, 2018, the Adviser earned fees of $72,719 from the Fund. At February 28, 2018, the Fund owed the Adviser $13,045.
The Adviser has contractually agreed to waive its management fee and/or reimburse expenses so that total annual operating expenses (excluding (i) interest; (ii) taxes; (iii) brokerage fees and commissions; (iv) other extraordinary expenses not incurred in the ordinary course of the Fund’s business; (v) dividend expenses on short sales; (vi) expenses incurred under a Rule 12b-1 plan of distribution; and (vii) indirect expenses such as acquired fund fees and expenses) do not exceed 1.75% of the Fund’s average daily net assets through December 31, 2018 (“Expense Limitation”). During any fiscal year that the Agreement between the Adviser and the Trust is in effect, the Adviser may recoup the sum of all fees previously waived or expenses reimbursed for a period of 36 months following the month during which such fee waiver or expense reimbursement was made, less any reimbursement previously paid, if such recoupment can be achieved within the Expense Limitation as well as any expense limitation in effect at the time the reimbursement is made. This
18
Preserver Alternative Opportunities Fund
Notes to Financial Statements (Unaudited) (continued)
February 28, 2018
expense cap agreement may be terminated by the Board at any time. As of February 28, 2018, the Adviser may seek repayment of investment advisory fee waivers and expense reimbursements in the amount of $101,179 from the Fund no later than February 28, 2021.
The Trust retains Ultimus Asset Services, LLC (the “Administrator”) to provide the Fund with administration, accounting, transfer agent and compliance services, including all regulatory reporting. For the six months ended February 28, 2018, the Administrator earned fees of $17,852 for administration services, $9,917 for transfer agent services, and $14,876 for fund accounting services. At February 28, 2018, the Fund owed the Administrator $6,813 for such services.
The Board supervises the business activities of the Trust. Each Trustee serves as a Trustee for the lifetime of the Trust or until the earlier of his or her retirement as a Trustee at age 75, death, resignation or removal. “Independent Trustees,” which means that they are not “interested persons” as defined in the 1940 Act of the Trust, each receive annual compensation of $15,000 from the Trust. Each Committee Chairperson receives an additional annual compensation of $1,000 from the Trust. Independent Trustees also receive $1,000 for attending each special in-person meeting and up to $1,000 for attending special telephonic meetings, depending on the length of the telephonic meeting. In addition, the Trust reimburses Trustees for out-of-pocket expense incurred in conjunction with attendance at meetings.
The officers and one Trustee of the Trust are employees of the Administrator. Unified Financial Securities, LLC (the “Distributor”) acts as the principal distributor of the Fund’s shares. Both the Administrator and the Distributor operate as wholly-owned subsidiaries of Ultimus Fund Solutions, LLC.
The Fund has adopted a Distribution Plan (the “Plan”) pursuant to Rule 12b-1 under the 1940 Act. The Plan provides that the Fund will pay the Distributor and/or any registered securities dealer, financial institution or any other person (the “Recipient”) a fee of 0.25% of the average daily net assets of the Fund’s Retail Shares in connection with the promotion and distribution of the Fund’s Retail Shares or the provision of personal services to shareholders, including, but not necessarily limited to, advertising, compensation to underwriters, dealers and selling personnel, the printing and mailing of prospectuses to other than current shareholders of Retail Shares, the printing and mailing of sales literature and servicing shareholder accounts (“12b-1 Expenses”). The Fund or Distributor may pay all or a portion of these fees to any Recipient who renders assistance in distributing or promoting the sale of shares, or who provides certain shareholder services, pursuant to a written agreement. The Plan is a compensation plan, which means that compensation is provided regardless of whether 12b-1 Expenses are actually incurred. Accordingly, the 12b-1 Expenses of the Retail Shares of the Fund may be less than fees paid out by the class under the Plan. For the sixth months ended February 28, 2018, Retail Shares 12b-1 expense incurred by the Fund was $3,060. At February 28, 2018, the Fund owed the Distributor $1,075 for Retail Shares 12b-1 expenses.
19
Preserver Alternative Opportunities Fund
Notes to Financial Statements (Unaudited) (continued)
February 28, 2018
NOTE 5. PURCHASES AND SALES OF SECURITIES
For the six months ended February 28, 2018, purchases and sales of investment securities, other than short-term investments, were as follows:
| | | | |
Purchases | | $ | 9,763,600 | |
Sales | | $ | 6,318,161 | |
There were no purchases or sales of long-term U.S. government obligations during the six months ended February 28, 2018.
NOTE 6. FEDERAL TAX INFORMATION
As of February 28, 2018, the net unrealized appreciation (depreciation) of investments for tax purposes was as follows:
| | | | |
Gross Unrealized Appreciation | | $ | 1,888,695 | |
Gross Unrealized Depreciation | | | (490,466 | ) |
Net Unrealized Appreciation (Depreciation) | | $ | 1,398,229 | |
At February 28, 2018, the aggregate cost of securities for federal income tax purposes was $19,307,928 for the Fund.
The tax characterization of distributions for the fiscal year ended August 31, 2017, the Fund’s most recent fiscal year end, was as follows:
| | | | |
Distributions paid from: | | | | |
Ordinary Income | | $ | 271,945 | |
Long-Term Capital Gains | | | 4,537 | |
Total Distributions Paid | | $ | 276,482 | |
At August 31, 2017, the Fund’s most recent fiscal year end, the components of distributable earnings (accumulated losses) on a tax basis was as follows:
| | | | |
Undistributed Ordinary Income | | $ | 152,521 | |
Undistributed Long-Term Capital Gains | | | 135,871 | |
Unrealized Appreciation (Depreciation)(a) | | | 1,807,369 | |
Total Accumulated Earnings (Deficit) | | $ | 2,095,761 | |
| (a) | | The difference between book basis and tax basis unrealized appreciation (depreciation) is primarily attributable to the mark-to-market adjustments on passive foreign investment companies, the tax treatment of return of capital adjustments and interest accruals on complex securities. |
NOTE 7. BENEFICIAL OWNERSHIP
The beneficial ownership, either directly or indirectly, of 25% or more of the voting securities of a fund creates a presumption of control of a fund, under Section 2(a)(9) of the 1940 Act. At February 28, 2018, Charles Schwab & Co., Inc. (“Schwab”) owned, as record shareholder, 68% of the outstanding shares of the Fund. It is not known whether Schwab or any of the underlying beneficial owners owned or controlled 25% or more of the voting securities of the Fund.
20
Preserver Alternative Opportunities Fund
Notes to Financial Statements (Unaudited) (continued)
February 28, 2018
NOTE 8. COMMITMENTS AND CONTINGENCIES
The Fund indemnifies its officers and trustees for certain liabilities that may arise from the performance of their duties to the Fund. Additionally, in the normal course of business, the Fund enters into contracts that contain a variety of representations and warranties which provide general indemnifications. The Fund’s maximum exposure under these arrangements is unknown, as this would involve future claims that may be made against the Fund that have not yet occurred.
NOTE 9. SUBSEQUENT EVENTS
Management has evaluated events or transactions from February 28, 2018 through the date these financial statements were issued that would merit recognition or disclosure in the financial statements. There were no subsequent events to report that would have a material impact in the Fund’s financial statements.
21
Summary of Fund Expenses (Unaudited)
As a shareholder of the Fund, you incur two types of costs: (1) transaction costs, including short-term redemption fees and (2) ongoing costs, including management fees, distribution and service (12b-1) fees, and other Fund expenses. These examples are intended to help you understand your ongoing costs (in dollars) of investing in the Fund and to compare these costs with the ongoing costs of investing in other mutual funds.
The example is based on an investment of $1,000 invested at the beginning of the period and held for the entire period from September 1, 2017 through February 28, 2018.
Actual Expenses
The first line of the table for each class provides information about actual account values and actual expenses. You may use the information in these lines, together with the amount you invested, to estimate the expenses that you paid over the period. Simply divide your account value by $1,000 (for example, an $8,600 account value divided by $1,000 = 8.60), then multiply the result by the number in the first line under the heading “Expenses Paid During Period” to estimate the expenses you paid on your account during this period.
Hypothetical Example for Comparison Purposes
The second line of the table for each class provides information about hypothetical account values and hypothetical expenses based on the Fund’s actual expense ratios and an assumed rate of return of 5% per year before expenses, which is not the Fund’s actual return. The hypothetical account values and expenses may not be used to estimate the actual ending account balances or expenses you paid for the period. You may use this information to compare the ongoing costs of investing in the Fund and other funds. To do so, compare this 5% hypothetical example with the 5% hypothetical examples that appear in the shareholder reports of the other funds.
Expenses shown in the table are meant to highlight your ongoing costs only and do not reflect any transactional costs, such as the fee imposed on sales charges and short-term redemptions. Therefore, the second line of the table for each class is useful in comparing ongoing costs only and will not help you determine the relative total costs of owning different funds. In addition, if transaction costs were included, your costs would have been higher.
| | | | | | | | | | | | | | | | | | |
| | | | | Beginning
Account
Value,
September 1,
2017 | | | Ending
Account
Value,
February 28,
2018 | | | Expenses
Paid
During
Period(a) | | | Annualized
Expense
Ratio | |
Preserver Alternative Opportunities Fund | | | | | | | | | | | | | |
Institutional Shares | | Actual | | $ | 1,000.00 | | | $ | 1,018.00 | | | $ | 8.76 | | | | 1.75 | % |
| | | | | | | | | | | | | | | | | | |
| | Hypothetical(b) | | $ | 1,000.00 | | | $ | 1,016.12 | | | $ | 8.75 | | | | 1.75 | % |
| | | | | | | | | | | | | | | | | | |
Retail Shares | | Actual | | $ | 1,000.00 | | | $ | 1,016.90 | | | $ | 10.00 | | | | 2.00 | % |
| | | | | | | | | | | | | | | | | | |
| | Hypothetical(b) | | $ | 1,000.00 | | | $ | 1,014.88 | | | $ | 9.99 | | | | 2.00 | % |
| (a) | | Expenses are equal to the Fund’s annualized expense ratios, multiplied by the average account value over the period, multiplied by 181/365 (to reflect the one-half year period). |
| (b) | | Hypothetical assumes 5% annual return before expenses. |
22
| | |
FACTS | | WHAT DOES CAPITOL SERIES TRUST DO WITH YOUR PERSONAL INFORMATION? |
| | |
| Why? | | Financial companies choose how they share your personal information. Federal law gives consumers the right to limit some but not all sharing. Federal law also requires us to tell you how we collect, share, and protect your personal information. Please read this notice carefully to understand what we do. |
| | |
| What? | | The types of personal information we collect and share depend on the product or service you have with us. This information can include: ◾ Social Security number ◾ account balances and account transactions ◾ account transactions, transaction or loss history and purchase history ◾ checking account information and wire transfer instructions When you are no longer our customer, we continue to share your information as described in this notice. |
| | |
| How? | | All financial companies need to share customers’ personal information to run their everyday business. In the section below, we list the reasons financial companies can share their customers’ personal information; the reasons Capitol Series Trust chooses to share; and whether you can limit this sharing. |
| | |
| Reasons we can share your personal information | | Does Capitol Series
Trust share? |
For our everyday business purposes — such as to process your transactions, maintain your account(s), respond to court orders and legal investigations, or report to credit bureaus | | Yes |
For our marketing purposes — to offer our products and services to you | | Yes |
| For joint marketing with other financial companies | | No |
For our affiliates’ everyday business purposes — information about your transactions and experiences | | No |
For our affiliates’ everyday business purposes — information about your creditworthiness | | No |
| For nonaffiliates to market to you | | No |
| | |
| Questions? | | Call 1-844-838-2119 |
23
| | |
| Who we are | | |
| Who is providing this notice? | | Capitol Series Trust |
| What we do | | |
| How does Capitol Series Trust protect my personal information? | | To protect your personal information from unauthorized access and use, we use security measures that comply with federal law. These measures include computer safeguards and secured files and buildings. |
| How does Capitol Series Trust collect my personal information? | | We collect your personal information, for example, when you ◾ open an account or deposit money ◾ buy securities from us or sell securities to us ◾ make deposits or withdrawals from your account provide account information ◾ give us your account information ◾ make a wire transfer ◾ tell us who receives the money ◾ tell us where to send the money ◾ show your government-issued ID ◾ show your driver’s license |
Why can’t I limit all
sharing? | | Federal law gives you the right to limit only ◾ sharing for affiliates’ everyday business purposes — information about your creditworthiness ◾ affiliates from using your information to market to you ◾ sharing for nonaffiliates to market to you State laws and individual companies may give you additional rights to limit sharing. |
| Definitions | | |
| Affiliates | | Companies related by common ownership or control. They can be financial and nonfinancial companies. |
| Nonaffiliates | | Companies not related by common ownership or control. They can be financial and nonfinancial companies. ◾ Capitol Series Trust does not share your personal information with nonaffiliates so they can market to you. |
| Joint marketing | | A formal agreement between nonaffiliated financial companies that together market financial products or services to you. ◾ Capitol Series Trust doesn’t jointly market financial products or services to you. |
24
PROXY VOTING (Unaudited)
A description of the policies and procedures that the Fund uses to determine how to vote proxies relating to portfolio securities and information regarding how the Fund voted those proxies during the most recent twelve month period ended June 30, is available without charge upon request by (1) calling the Fund at (844) 838-2119 and (2) from Fund documents filed with the Securities and Exchange Commission (“SEC”) on the SEC’s website at www.sec.gov.
TRUSTEES
Walter B. Grimm, Chairman
Mary M. Morrow
Robert G. Dorsey
OFFICERS
Dina A. Tantra, Chief Executive Officer and President
Zachary P. Richmond, Treasurer and Chief Financial Officer
Brandon R. Kipp, Chief Compliance Officer
INVESTMENT ADVISER
Preserver Partners, LLC
8700 Trail Lake Drive West, Suite 105
Memphis, TN 38125
DISTRIBUTOR
Unified Financial Securities, LLC
9465 Counselors Row, Suite 200
Indianapolis, IN 46240
INDEPENDENT REGISTERED PUBLIC ACCOUNTING FIRM
Ernst & Young LLP
800 Yard Street, Suite 500
Grandview Heights, OH 43212
LEGAL COUNSEL
Bernstein Shur
100 Middle Street, 6th Floor
Portland, ME 04104
CUSTODIAN
Huntington National Bank
41 South High Street
Columbus, OH 43215
ADMINISTRATOR, TRANSFER AGENT AND FUND ACCOUNTANT
Ultimus Asset Services, LLC
225 Pictoria Drive, Suite 450
Cincinnati, OH 45246
This report is intended only for the information of shareholders or those who have received the Fund’s prospectus which contains information about the Fund’s management fee and expenses. Please read the prospectus carefully before investing.
Distributed by Unified Financial Securities, LLC
Member FINRA/SIPC


Where discipline meets common sense.
Semi-Annual Report
February 28, 2018
Meritage Growth Equity Fund MPGEX/MPGIX
Meritage Value Equity Fund MVEBX
Meritage Yield-Focus Equity Fund MPYEX/MPYIX
| | | | |
| 913.345.7000 | | www.meritageportfoliofunds.com | | 7500 College Blvd., Suite 1212, Overland Park, KS 66210 |
MESSAGE FROM THE CHIEF INVESTMENT OFFICER – (Unaudited)
At Meritage, we are value-driven investors. We buy stock in businesses when i) they score well in our comprehensive stock-ranking process (universe is global, all-cap and about 6,500 securities), and ii) they are selling for less than we believe they are worth. Our value discipline is intended to provide a margin of safety and is one of our primary risk management tools, along with managing position sizes and diversification.
Dear Fellow Shareholders:
During the six months ended February 28, 2018, since our annual report of August 31, 2017, we have seen periods of increasing returns, buoyed by good news from corporate earnings and the reality of tax reform in late 2017. After a particularly exuberant start to the calendar year of 2018, the S&P ended with a gain of 10.82% from August 31, 2017 to February 28, 2018. Growth stocks again significantly outpaced Value stocks and income-oriented Yield-Focus stocks in this period.
A policy agenda that includes lower corporate and individual tax rates, a rollback in business regulation, massive infrastructure spending and the repatriation of foreign corporate earnings back to the U.S. have been enthusiastically embraced by the stock market. Investor attention to rising interest rates, the implications of tariffs and potential of trade wars and increased regulation of technology companies have led to the return of market volatility in 2018 which had been largely absent from the market in all of 2017.
Our Growth Fund continued to perform well for the past six months, ahead of the S&P 500 but slightly trailing its respective growth market benchmarks. Our Value Fund turned in a solid six months, but trailed its primary benchmarks somewhat. The Yield-Focus Fund also performed well, but fell short of its most comparable benchmark, the Zacks Multi-Asset Income Index.
As always, we attribute our bottom-up value-centric security selection process for generating our strong long-term returns. We continue to refine and improve this process of rigorously searching for attractive mispriced securities, among all capitalization sizes and geographies throughout the world.
We explore this topic further in the following pages. A specific discussion of each Fund and its performance is included in Management’s Discussion of Fund Performance.
Thank you for your continued trust in us as stewards of your capital. As previously mentioned we have our own money invested alongside yours in each of our funds, and we remain committed to delivering attractive risk-adjusted returns over full market cycles.
Sincerely,
Mark Eveans, CFA
President and Chief Investment Officer
1
MANAGEMENT’S DISCUSSION OF FUND PERFORMANCE – (Unaudited)
Meritage Growth Equity Fund
For the six-month period ended February 28, 2018, the Meritage Growth Equity Fund Institutional Class and Investors Class returned 12.06% and 11.87%, respectively. The Fund’s returns trailed its primary benchmark, the Russell 1000 Growth Index, and the Lipper Large Cap Growth Index. They returned 13.94% and 13.57%, respectively, during the same time frame.
From an attribution standpoint the Fund’s strong performance over the course of the last six months was driven by a number of factors. Positives included overweights in the Information Technology and Health Care sectors, and our stock selection within the Health Care and Consumer Discretionary sectors was superior. Stock selection within the Industrials and Financial sectors detracted from relative performance.
Regarding specific issues, the strongest gainers for the six months were Globus Medical, Inc. up 57.6%, Amazon.com, Inc. up 54.2% and Mastercard, Inc. up 32.3%.
The poorest performers for the six months were Applied Optoelectronics, Inc. down 18.6%, Momo Inc. Sponsored ADR, down 18.5%, and Electronic Arts, Inc. down 17.0%.
As a value-centric and process driven Growth manager, most sector differences as compared to the benchmark are a result of either an under or overweight of specific, bottom-up, attractively valued growth opportunities identified by our process, within that particular sector.
While we have seen interest rates begin to move higher in recent months, we expect a continuation of low interest rates and below average economic growth for the world’s leading economies. We believe many investors share our view but have correspondingly been willing to pay an excessive premium for well-known growth stocks. This is where we part company with the crowd, however, as we expect the value discipline embedded in our growth approach will yield better results over full market cycles.
Meritage Value Equity Fund
For the six months ended February 28, 2018, the Meritage Value Equity Fund Institutional Class returned 5.69%, but lagged the Russell 1000 Value Index benchmark which returned 7.26% during the same time frame, as well as the Lipper Large Cap Value Index return of 9.03%.
From an attribution standpoint, positives included overweight sector allocation influences from Information Technology and Consumer Staples, as well as strong stock selection within the Industrials and Consumer Discretionary sectors. These were offset by subpar security selection in the Materials, Financial and Information Technology sectors.
Regarding individual issues, the strongest gainers for the six months were Adtalem Global Education, Inc. up 34.6%, Ross Stores, Inc. up 34.2%, and WNS Holdings Limited ADR up 28.6%.
The poorest performers for the six months were Celgene Corporation down 25.1%, Cemex SAB de CV Sponsored ADR down 19.7% and Welltower, Inc. down 18.2%.
As a value-centric and process driven manager, most sector differences as compared to the benchmark were the result of either an under or overweight of specific bottom-up valuation opportunities identified by our process.
2
MANAGEMENT’S DISCUSSION OF FUND PERFORMANCE – (Unaudited) (continued)
While we have seen interest rates begin to move higher in recent months, we expect a continuation of low interest rates and below average economic growth for the world’s leading economies. We believe many investors share our view but have correspondingly been willing to pay an excessive premium for well-known stocks. This is where we part company with the crowd, however, as we expect the discipline embedded in our value approach will yield better results over full market cycles.
Meritage Yield-Focus Equity Fund
For the six months ended February 28, 2018, the Meritage Yield-Focus Equity Fund Institutional Class and Investors Class returned 4.13% and 3.97%, respectively. We use two benchmarks in assessing the performance of the Yield-Focus Equity Fund. The Russell 3000 Value Index is a long-term general purpose value-centric benchmark without specificity regarding the Fund’s distinct yield-focus style. The Zacks Multi-Asset Income Index has specific asset structure and distinguished dividend yield characteristics similar to the Fund. The Fund’s returns trailed the 7.10% total return for the Russell 3000 Value Index as well as the Zacks Multi-Asset Income Index which returned 5.65% during the same time.
A founding premise of the Yield-Focus Equity Fund is to earn 50 – 75% of the expected long-term equity return in the form of cash dividends and distributions. The fund invests in six key types of equity asset classes – common stocks, master limited partnerships, other limited partnerships, real estate investment trusts, business development companies, convertible preferred stocks and, in rare situations, straight preferred stocks. The Meritage comprehensive security selection process searches globally for attractive yield franchises.
For the six months ended February 28, 2018, regarding asset class performance, Limited Partnerships and common stocks were the strongest relative performers, whereas REITs and Master Limited Partnerships had the lowest contributions to returns. The fund’s underweight in the Financial sector as well as superior stock selection was a positive contributor to relative performance, as was stock selection in the Energy sector. Performance was hurt by an underweight in the Consumer Discretionary sector as well as less favorable stock selection in the Health Care, Information Technology and Consumer Discretionary sectors.
In terms of specific issues, the strongest performers for the period were Boeing Company up 52.7%, Target Corp. up 40.9%, and Valero Energy Corp. up 35.1%.
The poorest performers for the period were CBL & Associates Properties, Inc. down 29.1%, CenturyLink, Inc. down 21.5% and VEREIT, Inc. down 16.0%.
3
INVESTMENT RESULTS – (Unaudited)
Average Annual Total Returns as of February 28, 2018 (a)
| | | | | | | | | | | | | | |
Fund/Index | | Six Months | | | 1 Year | | | Since Inception
(12/23/13) | |
Meritage Growth Equity Fund – Institutional Class | | | 12.06 | % | | | 21.60 | % | | | 13.25 | % |
Meritage Growth Equity Fund – Investor Class | | | 11.87 | % | | | 21.29 | % | | | 12.95 | % |
Russell 1000 Growth Index (b) | | | 13.94 | % | | | 26.11 | % | | | 14.56 | % |
| | | | | | | | |
| | | Expense Ratios (c) | |
| | | Institutional Class | | | Investor Class | |
Gross | | | 1.59 | % | | | 1.84 | % |
With Applicable Waivers | | | 1.04 | % | | | 1.29 | % |
The performance quoted represents past performance, which does not guarantee future results. The investment return and principal value of an investment will fluctuate so that an investor’s shares, when redeemed, may be worth more or less than their original cost. The returns shown do not reflect deduction of taxes that a shareholder would pay on Fund distributions or the redemption of Fund shares. The Fund’s investment objectives, risks, charges and expenses must be considered carefully before investing. Current performance of a Fund may be lower or higher than the performance quoted. Performance data current to the most recent month end may be obtained by calling 1-855-261-0104.
The performance in the preceding table reflects any fee reductions during the applicable period. If such fee reductions had not occurred, the quoted performance would be lower.
| (a) | Return figures reflect any change in price per share and assume the reinvestment of all distributions. Total returns for less than one year are not annualized. |
| (b) | The Russell 1000 Growth Index is a widely recognized unmanaged index of equity securities and is representative of a broader domestic equity market and range of securities than is found in the Fund’s portfolio. Individuals cannot invest directly in an index; however, an individual can invest in exchange traded funds or other investment vehicles that attempt to track the performance of a benchmark index. |
| (c) | The expense ratios are from the Fund’s prospectus dated December 29, 2017. The Adviser has contractually agreed to waive or limit its fees and assume other expenses of the Fund through December 31, 2018, so that total annual fund operating expenses do not exceed 1.00% of the Fund’s average daily net assets. This operating expense limitation does not apply to brokerage fees and commissions, borrowing costs (such as interest and dividend expenses on securities sold short), taxes, 12b-1 fees, extraordinary expenses and indirect expenses (such as “acquired fund fees and expenses”). Additional information pertaining to the Fund’s expense ratios as of February 28, 2018 can be found in the financial highlights. |
The Fund’s investment objective, strategies, risks, charges and expenses must be considered carefully before investing. The prospectus contains this and other important information about the investment company and may be obtained by calling 1-855-261-0104. Please read it carefully before investing.
The Fund is distributed by Unified Financial Securities, LLC, Member FINRA/SIPC.
4
INVESTMENT RESULTS – (Unaudited) (continued)
Average Annual Total Returns as of February 28, 2018 (a)
| | | | | | |
Fund/Index | | Six Months | | 1 Year | | Since Inception
(12/23/13) |
Meritage Value Equity Fund – Institutional Class | | 5.69% | | 9.57% | | 7.53% |
Russell 1000 Value Index (b) | | 7.26% | | 7.75% | | 9.51% |
| | | | |
| | | Expense Ratios (c) | |
| | | Institutional Class | |
Gross | | | 1.73 | % |
With Applicable Waivers | | | 1.04 | % |
The performance quoted represents past performance, which does not guarantee future results. The investment return and principal value of an investment will fluctuate so that an investor’s shares, when redeemed, may be worth more or less than their original cost. The returns shown do not reflect deduction of taxes that a shareholder would pay on Fund distributions or the redemption of Fund shares. The Fund’s investment objectives, risks, charges and expenses must be considered carefully before investing. Current performance of a Fund may be lower or higher than the performance quoted. Performance data current to the most recent month end may be obtained by calling 1-855-261-0104.
The performance in the preceding table reflects any fee reductions during the applicable period. If such fee reductions had not occurred, the quoted performance would be lower.
| (a) | Return figures reflect any change in price per share and assume the reinvestment of all distributions. Total returns for less than one year are not annualized. |
| (b) | The Russell 1000 Value Index is a widely recognized unmanaged index of equity securities and is representative of a broader domestic equity market and range of securities than is found in the Fund’s portfolio. Individuals cannot invest directly in an index; however, an individual can invest in exchange traded funds or other investment vehicles that attempt to track the performance of a benchmark index. |
| (c) | The expense ratios are from the Fund’s prospectus dated December 29, 2017. The Adviser has contractually agreed to waive or limit its fees and assume other expenses of the Fund through December 31, 2018, so that total annual fund operating expenses do not exceed 1.00% of the Fund’s average daily net assets. This operating expense limitation does not apply to brokerage fees and commissions, borrowing costs (such as interest and dividend expenses on securities sold short), taxes, 12b-1 fees, extraordinary expenses and indirect expenses (such as “acquired fund fees and expenses”). Additional information pertaining to the Fund’s expense ratios as of February 28, 2018 can be found in the financial highlights. |
The Fund’s investment objective, strategies, risks, charges and expenses must be considered carefully before investing. The prospectus contains this and other important information about the investment company and may be obtained by calling 1-855-261-0104. Please read it carefully before investing.
The Fund is distributed by Unified Financial Securities, LLC, Member FINRA/SIPC.
5
INVESTMENT RESULTS – (Unaudited) (continued)
Average Annual Total Returns as of February 28, 2018 (a)
| | | | | | | | | | | | |
Fund/Index | | Six Months | | | 1 Year | | | Since Inception
(12/23/13) | |
Meritage Yield-Focus Equity Fund – Institutional Class | | | 4.13 | % | | | 5.56 | % | | | 4.69 | % |
Meritage Yield-Focus Equity Fund – Investor Class | | | 3.97 | % | | | 5.34 | % | | | 4.51 | % |
Zacks Multi-Asset Income Index TR (b) | | | 5.65 | % | | | 9.53 | % | | | 2.77 | % |
Russell 3000 Value Index (c) | | | 7.10 | % | | | 7.39 | % | | | 9.32 | % |
| | | | | | | | |
| | | Expense Ratios (d) | |
| | | Institutional Class | | | Investor Class | |
Gross | | | 1.81 | % | | | 2.06 | % |
With Applicable Waivers | | | 1.33 | % | | | 1.58 | % |
The performance quoted represents past performance, which does not guarantee future results. The investment return and principal value of an investment will fluctuate so that an investor’s shares, when redeemed, may be worth more or less than their original cost. The returns shown do not reflect deduction of taxes that a shareholder would pay on Fund distributions or the redemption of Fund shares. The Fund’s investment objectives, risks, charges and expenses must be considered carefully before investing. Current performance of a Fund may be lower or higher than the performance quoted. Performance data current to the most recent month end may be obtained by calling 1-855-261-0104.
The performance in the preceding table reflects any fee reductions during the applicable period. If such fee reductions had not occurred, the quoted performance would be lower.
| (a) | Return figures reflect any change in price per share and assume the reinvestment of all distributions. Total returns for less than one year are not annualized. |
| (b) | The Zacks Multi-Asset Income Index is comprised of approximately 125 to 150 securities selected, based on investment and other criteria, from a universe of domestic and international companies. The universe of securities within the index includes U.S. listed common stocks and ADRs paying dividends, real estate investment trusts, MLPs, closed end funds, Canadian royalty trusts and traditional preferred stocks. Individuals cannot invest directly in an index. |
| (c) | The Russell 3000 Value Index is a widely recognized unmanaged index of equity securities and is representative of a broader domestic equity market and range of securities than is found in the Fund’s portfolio. Individuals cannot invest directly in an index; however, an individual can invest in exchange traded funds or other investment vehicles that attempt to track the performance of a benchmark index. |
| (d) | The expense ratios are from the Fund’s prospectus dated December 29, 2017. The Adviser has contractually agreed to waive or limit its fees and assume other expenses of the Fund through December 31, 2018, so that total annual fund operating expenses do not exceed 1.00% of the Fund’s average daily net assets. This operating expense limitation does not apply to brokerage fees and commissions, borrowing costs (such as interest and dividend expenses on securities sold short), taxes, 12b-1 fees, extraordinary expenses and indirect expenses (such as “acquired fund fees and expenses”). Additional information pertaining to the Fund’s expense ratios as of February 28, 2018 can be found in the financial highlights. |
The Fund’s investment objective, strategies, risks, charges and expenses must be considered carefully before investing. The prospectus contains this and other important information about the investment company and may be obtained by calling 1-855-261-0104. Please read it carefully before investing.
The Fund is distributed by Unified Financial Securities, LLC, Member FINRA/SIPC.
6
FUND HOLDINGS – (Unaudited)
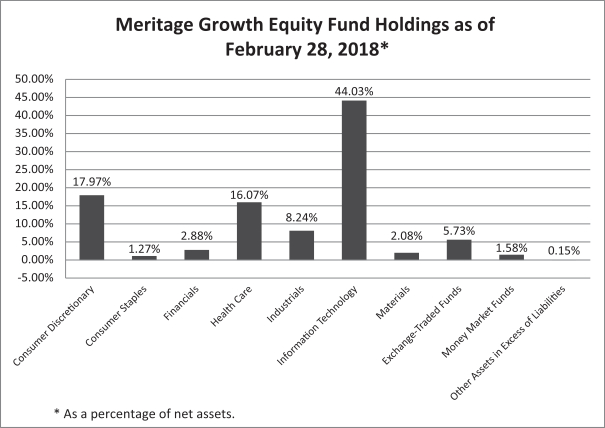
The investment objective of the Meritage Growth Equity Fund is to seek growth of capital.
7
FUND HOLDINGS – (Unaudited) (continued)
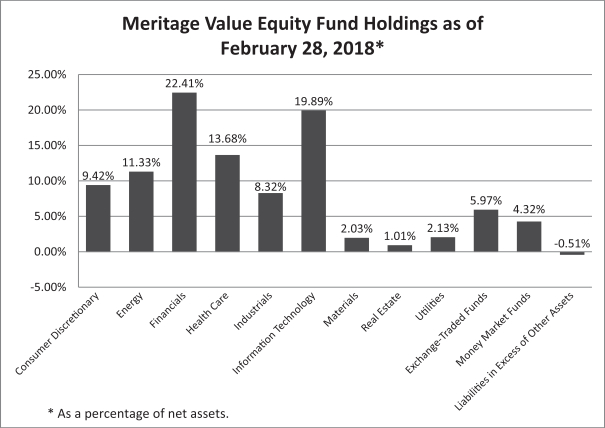
The investment objective of the Meritage Value Equity Fund is to seek growth of capital. Income is a secondary objective.
8
FUND HOLDINGS – (Unaudited) (continued)
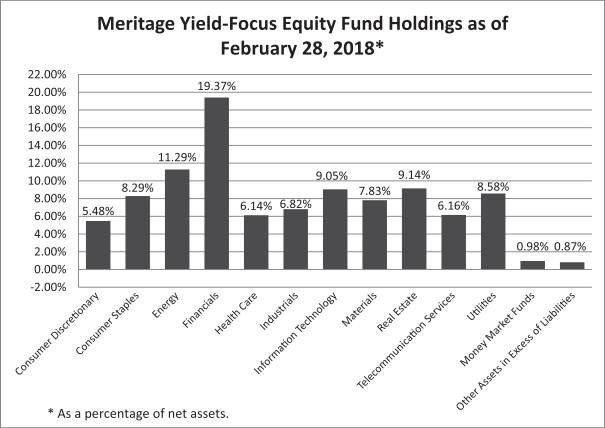
The investment objective of the Meritage Yield-Focus Equity Fund is to seek long-term growth of capital with an emphasis on high current income.
AVAILABILITY OF PORTFOLIO SCHEDULE – (Unaudited)
The Funds will file their complete schedule of portfolio holdings with the Securities and Exchange Commission (“SEC”) for the first and third quarter of each fiscal year on Form N-Q. The Funds’ Forms N-Q will be available at the SEC’s website at www.sec.gov. The Form N-Q may be reviewed and copied at the Public Reference Room in Washington, DC. Information on the operation of the Public Reference Room may be obtained by calling 1-800-SEC-0330.
9
MERITAGE GROWTH EQUITY FUND
SCHEDULE OF INVESTMENTS
February 28, 2018 (Unaudited)
| | | | | | | | |
| COMMON STOCKS – 92.54% | | Shares | | | Fair Value | |
Consumer Discretionary – 17.97% | | | | | | | | |
Amazon.com, Inc. (a) | | | 885 | | | $ | 1,338,518 | |
Aptiv PLC | | | 7,360 | | | | 672,189 | |
Best Buy Company, Inc. | | | 5,000 | | | | 362,200 | |
Carter’s, Inc. | | | 3,020 | | | | 352,374 | |
Hasbro, Inc. | | | 4,465 | | | | 426,720 | |
Home Depot, Inc. (The) | | | 6,195 | | | | 1,129,162 | |
Thor Industries, Inc. | | | 4,325 | | | | 557,925 | |
| | | | | | | | |
| | | | | | | 4,839,088 | |
| | | | | | | | |
Consumer Staples – 1.27% | | | | | | | | |
Monster Beverage Corporation (a) | | | 5,400 | | | | 342,198 | |
| | | | | | | | |
Financials – 2.88% | | | | | | | | |
Aon PLC | | | 2,570 | | | | 360,622 | |
BlackRock, Inc. | | | 755 | | | | 414,820 | |
| | | | | | | | |
| | | | | | | 775,442 | |
| | | | | | | | |
Health Care – 16.07% | | | | | | | | |
Amgen, Inc. | | | 2,456 | | | | 451,339 | |
Centene Corporation (a) | | | 3,860 | | | | 391,481 | |
Express Scripts Holding Company (a) | | | 5,730 | | | | 432,329 | |
Globus Medical, Inc., Class A (a) | | | 9,085 | | | | 432,809 | |
Intuitive Surgical, Inc. (a) | | | 1,119 | | | | 477,197 | |
Jazz Pharmaceuticals PLC (a) | | | 1,905 | | | | 275,844 | |
Johnson & Johnson | | | 5,670 | | | | 736,420 | |
Masimo Corporation (a) | | | 3,015 | | | | 263,903 | |
Mettler-Toledo International, Inc. (a) | | | 736 | | | | 453,538 | |
Teleflex, Inc. | | | 1,652 | | | | 412,719 | |
| | | | | | | | |
| | | | | | | 4,327,579 | |
| | | | | | | | |
Industrials – 8.24% | | | | | | | | |
AMETEK, Inc. | | | 5,365 | | | | 406,345 | |
Deluxe Corporation | | | 6,390 | | | | 453,690 | |
Fortive Corporation | | | 4,300 | | | | 330,240 | |
Ingersoll-Rand PLC | | | 3,460 | | | | 307,248 | |
Meritor, Inc. (a) | | | 14,490 | | | | 355,005 | |
Nordson Corporation | | | 2,735 | | | | 366,682 | |
| | | | | | | | |
| | | | | | | 2,219,210 | |
| | | | | | | | |
Information Technology – 44.03% | | | | | | | | |
Adobe Systems, Inc. (a) | | | 1,844 | | | | 385,636 | |
Alphabet, Inc., Class A (a) | | | 1,150 | | | | 1,269,508 | |
Apple, Inc. | | | 9,024 | | | | 1,607,355 | |
Applied Materials, Inc. | | | 14,905 | | | | 858,379 | |
See accompanying notes which are an integral part of these financial statements.
10
MERITAGE GROWTH EQUITY FUND
SCHEDULE OF INVESTMENTS – (continued)
February 28, 2018 (Unaudited)
| | | | | | | | |
| COMMON STOCKS – 92.54% – continued | | Shares | | | Fair Value | |
Information Technology – 44.03% – continued | | | | | | | | |
Facebook, Inc., Class A (a) | | | 4,483 | | | $ | 799,409 | |
Fiserv, Inc. (a) | | | 4,575 | | | | 656,009 | |
IAC/InterActiveCorp (a) | | | 3,221 | | | | 479,639 | |
MasterCard, Inc., Class A | | | 9,201 | | | | 1,617,168 | |
Microsoft Corporation | | | 14,365 | | | | 1,347,006 | |
Qualys, Inc. (a) | | | 6,085 | | | | 450,594 | |
Tencent Holdings Ltd. ADR | | | 22,050 | | | | 1,210,325 | |
Tokyo Electron Ltd. ADR | | | 7,335 | | | | 359,745 | |
Western Digital Corporation | | | 4,925 | | | | 428,672 | |
Zebra Technologies Corporation, Class A (a) | | | 2,810 | | | | 388,173 | |
| | | | | | | | |
| | | | | | | 11,857,618 | |
| | | | | | | | |
Materials – 2.08% | | | | | | | | |
Eagle Materials, Inc. | | | 5,575 | | | | 558,782 | |
| | | | | | | | |
TOTAL COMMON STOCKS (Cost $18,129,846) | | | | | | | 24,919,917 | |
| | | | | | | | |
EXCHANGE-TRADED FUNDS – 5.73% | | | | | | | | |
Consumer Staples Select Sector SPDR Fund | | | 5,485 | | | | 292,954 | |
iShares Nasdaq Biotechnology ETF | | | 5,653 | | | | 610,976 | |
SPDR S&P Bank ETF | | | 8,280 | | | | 408,287 | |
SPDR S&P Oil & Gas Exploration & Production ETF | | | 7,000 | | | | 231,420 | |
| | | | | | | | |
TOTAL EXCHANGE-TRADED FUNDS Cost ($1,417,737) | | | | | | | 1,543,637 | |
| | | | | | | | |
MONEY MARKET FUNDS – 1.58% | | | | | | | | |
Morgan Stanley Institutional Liquidity Funds Treasury Securities Portfolio, Institutional Class, 1.29% (b) | | | 425,361 | | | | 425,361 | |
| | | | | | | | |
TOTAL MONEY MARKET FUNDS (Cost $425,361) | | | | | | | 425,361 | |
| | | | | | | | |
TOTAL INVESTMENTS – 99.85% (Cost $19,972,944) | | | | | | | 26,888,915 | |
| | | | | | | | |
Other Assets in Excess of Liabilities – 0.15% | | | | | | | 40,077 | |
| | | | | | | | |
NET ASSETS – 100.00% | | | | | | $ | 26,928,992 | |
| | | | | | | | |
| | (a) | Non-income producing security. |
| | (b) | Rate disclosed is the seven day effective yield as of February 28, 2018. |
| | ADR – American | Depositary Receipt |
| | ETF – Exchange-Traded | Fund |
| | SPDR – Standard | & Poor’s Depositary Receipt |
The sectors shown on the schedule of investments are based on the Global Industry Classification Standard, or GICS® (“GICS”). The GICS was developed by and/or is the exclusive property of MSCI, Inc. and Standard & Poor’s Financial Services LLC (“S&P”). GICS is a service mark of MSCI, Inc. and S&P and has been licensed for use by Ultimus Fund Solutions, LLC.
See accompanying notes which are an integral part of these financial statements.
11
MERITAGE VALUE EQUITY FUND
SCHEDULE OF INVESTMENTS
February 28, 2018 (Unaudited)
| | | | | | | | |
| COMMON STOCKS – 90.22% | | Shares | | | Fair Value | |
Consumer Discretionary – 9.42% | | | | | | | | |
Adtalem Global Education, Inc. (a) | | | 8,320 | | | $ | 383,136 | |
Big Lots, Inc. | | | 5,955 | | | | 334,671 | |
Helen of Troy Ltd. (a) | | | 3,345 | | | | 301,217 | |
Ross Stores, Inc. | | | 4,295 | | | | 335,397 | |
Royal Caribbean Cruises Ltd. | | | 1,980 | | | | 250,668 | |
| | | | | | | | |
| | | | | | | 1,605,089 | |
| | | | | | | | |
Energy – 11.33% | | | | | | | | |
Chevron Corporation | | | 3,175 | | | | 355,346 | |
China Petroleum & Chemical Corporation ADR | | | 4,785 | | | | 378,494 | |
CNOOC Ltd. | | | 1,748 | | | | 249,090 | |
Devon Energy Corporation | | | 11,095 | | | | 340,284 | |
Husky Energy, Inc. | | | 13,680 | | | | 181,944 | |
Royal Dutch Shell PLC ADR | | | 6,725 | | | | 425,490 | |
| | | | | | | | |
| | | | | | | 1,930,648 | |
| | | | | | | | |
Financials – 22.41% | | | | | | | | |
Berkshire Hathaway, Inc., Class B (a) | | | 2,394 | | | | 496,037 | |
Citigroup, Inc. | | | 5,235 | | | | 395,190 | |
CNO Financial Group, Inc. | | | 9,990 | | | | 225,175 | |
Lincoln National Corporation | | | 4,515 | | | | 343,908 | |
Northern Trust Corporation | | | 3,640 | | | | 385,367 | |
Prudential Financial, Inc. | | | 3,610 | | | | 383,815 | |
Reinsurance Group of America, Inc. | | | 2,210 | | | | 339,876 | |
State Street Corporation | | | 4,930 | | | | 523,319 | |
Torchmark Corporation | | | 4,827 | | | | 412,081 | |
Unum Group | | | 6,100 | | | | 310,856 | |
| | | | | | | | |
| | | | | | | 3,815,624 | |
| | | | | | | | |
Health Care – 13.68% | | | | | | | | |
Aetna, Inc. | | | 1,640 | | | | 290,378 | |
Biogen, Inc. (a) | | | 1,024 | | | | 295,926 | |
Bristol-Myers Squibb Company | | | 5,380 | | | | 356,156 | |
Cigna Corporation | | | 1,930 | | | | 378,067 | |
ICON PLC (a) | | | 3,500 | | | | 396,585 | |
PRA Health Sciences, Inc. (a) | | | 3,810 | | | | 320,040 | |
UnitedHealth Group, Inc. | | | 1,297 | | | | 293,330 | |
| | | | | | | | |
| | | | | | | 2,330,482 | |
| | | | | | | | |
Industrials – 8.32% | | | | | | | | |
Briggs & Stratton Corporation | | | 6,920 | | | | 155,562 | |
Herman Miller, Inc. | | | 7,105 | | | | 255,070 | |
Regal-Beloit Corporation | | | 4,010 | | | | 289,923 | |
Southwest Airlines Company | | | 6,335 | | | | 366,416 | |
See accompanying notes which are an integral part of these financial statements.
12
MERITAGE VALUE EQUITY FUND
SCHEDULE OF INVESTMENTS – (continued)
February 28, 2018 (Unaudited)
| | | | | | | | |
| COMMON STOCKS – 90.22% – continued | | Shares | | | Fair Value | |
Industrials – 8.32% – continued | | | | | | | | |
Spirit AeroSystems Holdings, Inc., Class A | | | 3,835 | | | $ | 350,097 | |
| | | | | | | | |
| | | | | | | 1,417,068 | |
| | | | | | | | |
Information Technology – 19.89% | | | | | | | | |
CDW Corporation | | | 4,700 | | | | 342,771 | |
Cognizant Technology Solutions Corporation, Class A | | | 4,650 | | | | 381,393 | |
KLA-Tencor Corporation | | | 3,115 | | | | 352,960 | |
LG Display Company Ltd. | | | 12,760 | | | | 173,536 | |
MAXIMUS, Inc. | | | 5,115 | | | | 342,603 | |
Skyworks Solutions, Inc. | | | 3,210 | | | | 350,693 | |
Synopsys, Inc. (a) | | | 3,525 | | | | 298,462 | |
Teradyne, Inc. | | | 6,895 | | | | 313,033 | |
Vishay Intertechnology, Inc. | | | 18,675 | | | | 343,620 | |
WNS Holdings Ltd. ADR (a) | | | 10,880 | | | | 489,600 | |
| | | | | | | | |
| | | | | | | 3,388,671 | |
| | | | | | | | |
Materials – 2.03% | | | | | | | | |
Louisiana-Pacific Corporation | | | 12,150 | | | | 346,275 | |
| | | | | | | | |
Real Estate – 1.01% | | | | | | | | |
Host Hotels & Resorts, Inc. | | | 9,270 | | | | 172,051 | |
| | | | | | | | |
Utilities – 2.13% | | | | | | | | |
Entergy Corporation | | | 4,785 | | | | 362,799 | |
| | | | | | | | |
TOTAL COMMON STOCKS (Cost $12,159,591) | | | | | | | 15,368,707 | |
| | | | | | | | |
EXCHANGE-TRADED FUNDS – 5.97% | | | | | | | | |
Energy Select Sector SPDR Fund | | | 5,025 | | | | 335,369 | |
Materials Select Sector SPDR Fund | | | 2,840 | | | | 169,349 | |
Utilities Select Sector SPDR® Fund | | | 6,985 | | | | 342,683 | |
Vanguard REIT ETF | | | 2,310 | | | | 169,439 | |
| | | | | | | | |
TOTAL EXCHANGE-TRADED FUNDS Cost ($1,031,173) | | | | | | | 1,016,840 | |
| | | | | | | | |
MONEY MARKET FUNDS – 4.32% | | | | | | | | |
Morgan Stanley Institutional Liquidity Funds Treasury Securities Portfolio, Institutional Class, 1.29% (b) | | | 736,751 | | | | 736,751 | |
| | | | | | | | |
TOTAL MONEY MARKET FUNDS (Cost $736,751) | | | | | | | 736,751 | |
| | | | | | | | |
TOTAL INVESTMENTS – 100.51% (Cost $13,927,515) | | | | | | | 17,122,298 | |
| | | | | | | | |
Liabilities in Excess of Other Assets – (0.51)% | | | | | | | (86,415 | ) |
| | | | | | | | |
NET ASSETS – 100.00% | | | | | | $ | 17,035,883 | |
| | | | | | | | |
| | (a) | Non-income producing security. |
| | (b) | Rate disclosed is the seven day effective yield as of February 28, 2018. |
See accompanying notes which are an integral part of these financial statements.
13
MERITAGE VALUE EQUITY FUND
SCHEDULE OF INVESTMENTS – (continued)
February 28, 2018 (Unaudited)
ADR – American Depositary Receipt.
ETF – Exchange-Traded Fund
REIT – Real Estate Investment Trust
SPDR – Standard & Poor’s Depositary Receipt
The sectors shown on the schedule of investments are based on the Global Industry Classification Standard, or GICS® (“GICS”). The GICS was developed by and/or is the exclusive property of MSCI, Inc. and Standard & Poor’s Financial Services LLC (“S&P”). GICS is a service mark of MSCI, Inc. and S&P and has been licensed for use by Ultimus Fund Solutions, LLC.
See accompanying notes which are an integral part of these financial statements.
14
MERITAGE YIELD-FOCUS EQUITY FUND
SCHEDULE OF INVESTMENTS
February 28, 2018 (Unaudited)
| | | | | | | | |
| COMMON STOCKS – 89.21% | | Shares | | | Fair Value | |
Consumer Discretionary – 5.48% | | | | | | | | |
DSW, Inc., Class A | | | 20,765 | | | $ | 407,202 | |
GameStop Corporation, Class A | | | 18,025 | | | | 282,812 | |
Garmin Ltd. | | | 7,355 | | | | 435,710 | |
Target Corporation | | | 5,030 | | | | 379,312 | |
| | | | | | | | |
| | | | | | | 1,505,036 | |
| | | | | | | | |
Consumer Staples – 8.29% | | | | | | | | |
Altria Group, Inc. | | | 9,575 | | | | 602,746 | |
British American Tobacco PLC | | | 4,795 | | | | 283,193 | |
Imperial Brands PLC ADR | | | 11,860 | | | | 431,704 | |
Philip Morris International, Inc. | | | 5,785 | | | | 599,037 | |
Unilever PLC ADR | | | 7,005 | | | | 361,458 | |
| | | | | | | | |
| | | | | | | 2,278,138 | |
| | | | | | | | |
Energy – 11.29% | | | | | | | | |
Alliance Holdings GP LP (a) | | | 10,870 | | | | 276,859 | |
Enterprise Products Partners LP (a) | | | 18,675 | | | | 474,719 | |
Plains GP Holdings LP, Class A (a) | | | 21,780 | | | | 453,024 | |
Repsol SA ADR | | | 28,765 | | | | 510,579 | |
Royal Dutch Shell PLC, Class B ADR | | | 6,395 | | | | 410,431 | |
Total SA ADR | | | 9,540 | | | | 540,822 | |
Valero Energy Corporation | | | 4,840 | | | | 437,633 | |
| | | | | | | | |
| | | | | | | 3,104,067 | |
| | | | | | | | |
Financials – 19.37% | | | | | | | | |
AllianceBernstein Holding LP (a) | | | 20,290 | | | | 539,715 | |
Aviva PLC ADR | | | 29,890 | | | | 421,300 | |
AXA SA ADR | | | 14,680 | | | | 460,145 | |
Bank of Montreal | | | 5,610 | | | | 426,416 | |
Invesco Ltd. | | | 12,070 | | | | 392,758 | |
Lazard Ltd., Class A (a) | | | 9,255 | | | | 499,492 | |
Moelis & Company, Class A | | | 9,895 | | | | 502,171 | |
Old Republic International Corporation | | | 25,170 | | | | 504,155 | |
PacWest Bancorp | | | 5,800 | | | | 302,412 | |
Power Financial Corporation | | | 14,895 | | | | 389,504 | |
Solar Capital Ltd. (b) | | | 18,760 | | | | 380,828 | |
Valley National Bancorp | | | 40,845 | | | | 509,337 | |
| | | | | | | | |
| | | | | | | 5,328,233 | |
| | | | | | | | |
Health Care – 3.92% | | | | | | | | |
Merck & Company, Inc. | | | 10,640 | | | | 576,901 | |
Pfizer, Inc. | | | 13,775 | | | | 500,170 | |
| | | | | | | | |
| | | | | | | 1,077,071 | |
| | | | | | | | |
See accompanying notes which are an integral part of these financial statements.
15
MERITAGE YIELD-FOCUS EQUITY FUND
SCHEDULE OF INVESTMENTS – (continued)
February 28, 2018 (Unaudited)
| | | | | | | | |
| COMMON STOCKS – 89.21% – continued | | Shares | | | Fair Value | |
Industrials – 4.21% | | | | | | | | |
Boeing Company (The) | | | 944 | | | $ | 341,926 | |
Eaton Corporation PLC | | | 6,250 | | | | 504,375 | |
Lockheed Martin Corporation | | | 880 | | | | 310,147 | |
| | | | | | | | |
| | | | | | | 1,156,448 | |
| | | | | | | | |
Information Technology – 6.50% | | | | | | | | |
HP, Inc. | | | 24,565 | | | | 574,575 | |
International Business Machines Corporation | | | 5,464 | | | | 851,455 | |
QUALCOMM, Inc. | | | 5,540 | | | | 360,100 | |
| | | | | | | | |
| | | | | | | 1,786,130 | |
| | | | | | | | |
Materials – 7.83% | | | | | | | | |
Domtar Corporation | | | 7,715 | | | | 345,323 | |
Innophos Holdings, Inc. | | | 5,880 | | | | 244,373 | |
LyondellBasell Industries NV, Class A | | | 4,165 | | | | 450,736 | |
Norbord, Inc. | | | 12,770 | | | | 431,243 | |
Rio Tinto PLC ADR | | | 12,425 | | | | 679,772 | |
| | | | | | | | |
| | | | | | | 2,151,447 | |
| | | | | | | | |
Real Estate – 9.14% | | | | | | | | |
Brandywine Realty Trust | | | 23,920 | | | | 374,587 | |
Medical Properties Trust, Inc. | | | 29,910 | | | | 366,697 | |
Piedmont Office Realty Trust, Inc., Class A | | | 24,150 | | | | 433,733 | |
Simon Property Group, Inc. | | | 1,711 | | | | 262,656 | |
Uniti Group, Inc. | | | 24,910 | | | | 382,369 | |
VEREIT, Inc. | | | 61,985 | | | | 424,597 | |
Xenia Hotel & Resorts, Inc. | | | 13,570 | | | | 266,922 | |
| | | | | | | | |
| | | | | | | 2,511,561 | |
| | | | | | | | |
Telecommunication Services – 6.16% | | | | | | | | |
AT&T, Inc. | | | 16,965 | | | | 615,829 | |
China Mobile Ltd. ADR | | | 10,830 | | | | 503,487 | |
Verizon Communications, Inc. | | | 12,042 | | | | 574,885 | |
| | | | | | | | |
| | | | | | | 1,694,201 | |
| | | | | | | | |
Utilities – 7.02% | | | | | | | | |
Edison International | | | 4,460 | | | | 270,231 | |
Entergy Corporation | | | 7,105 | | | | 538,701 | |
PPL Corporation | | | 8,885 | | | | 254,555 | |
Public Service Enterprise Group, Inc. | | | 8,470 | | | | 410,202 | |
SSE PLC | | | 26,850 | | | | 457,256 | |
| | | | | | | | |
| | | | | | | 1,930,945 | |
| | | | | | | | |
TOTAL COMMON STOCKS (Cost $21,621,471) | | | | | | | 24,523,277 | |
| | | | | | | | |
See accompanying notes which are an integral part of these financial statements.
16
MERITAGE YIELD-FOCUS EQUITY FUND
SCHEDULE OF INVESTMENTS – (continued)
February 28, 2018 (Unaudited)
| | | | | | | | |
| CONVERTIBLE PREFERRED STOCKS – 8.94% | | Shares | | | Fair Value | |
Health Care – 2.22% | | | | | | | | |
Anthem, Inc., 5.25% | | | 10,615 | | | $ | 609,089 | |
| | | | | | | | |
Industrials – 2.61% | | | | | | | | |
Stanley Black & Decker, Inc. 5.38% | | | 3,530 | | | | 416,010 | |
Stericycle, Inc., 5.25% | | | 6,265 | | | | 304,354 | |
| | | | | | | | |
| | | | | | | 720,364 | |
| | | | | | | | |
Information Technology – 2.55% | | | | | | | | |
Belden, Inc., 6.75% | | | 7,085 | | | | 700,004 | |
| | | | | | | | |
Utilities – 1.56% | | | | | | | | |
Sempra Energy, Series A, 6.00% | | | 4,232 | | | | 428,829 | |
| | | | | | | | |
TOTAL CONVERTIBLE PREFERRED STOCKS (Cost $2,401,560) | | | | | | | 2,458,286 | |
| | | | | | | | |
MONEY MARKET FUNDS – 0.98% | | | | | | | | |
Morgan Stanley Institutional Liquidity Funds Treasury Securities Portfolio, Institutional Class, 1.29% (c) | | | 269,354 | | | | 269,354 | |
| | | | | | | | |
TOTAL MONEY MARKET FUNDS (Cost $269,354) | | | | | | | 269,354 | |
| | | | | | | | |
TOTAL INVESTMENTS – 99.13% (Cost $24,292,385) | | | | | | | 27,250,917 | |
| | | | | | | | |
Other Assets in Excess of Liabilities – 0.87% | | | | | | | 237,792 | |
| | | | | | | | |
NET ASSETS – 100.00% | | | | | | $ | 27,488,709 | |
| | | | | | | | |
| | (a) | Master Limited Partnership |
| | (b) | Business Development Company |
| | (c) | Rate disclosed is the seven day effective yield as of February 28, 2018. |
| | ADR – American | Depositary Receipt. |
| | REIT – Real | Estate Investment Trust |
The sectors shown on the schedule of investments are based on the Global Industry Classification Standard, or GICS® (“GICS”). The GICS was developed by and/or is the exclusive property of MSCI, Inc. and Standard & Poor’s Financial Services LLC (“S&P”). GICS is a service mark of MSCI, Inc. and S&P and has been licensed for use by Ultimus Fund Solutions, LLC.
See accompanying notes which are an integral part of these financial statements.
17
MERITAGE FUNDS
STATEMENTS OF ASSETS AND LIABILITIES
February 28, 2018 (Unaudited)
| | | | | | | | | | | | |
| | | Meritage Growth
Equity Fund | | | Meritage Value
Equity Fund | | | Meritage Yield-
Focus Equity Fund | |
Assets | | | | | | | | | | | | |
Investments in securities at value
(cost $19,972,944, $13,927,515 and $24,292,385) | | $ | 26,888,915 | | | $ | 17,122,298 | | | $ | 27,250,917 | |
Receivable for fund shares sold | | | – | | | | – | | | | 4,063 | |
Receivable for investments sold | | | 279,240 | | | | – | | | | 88,296 | |
Dividends receivable | | | 19,061 | | | | 24,664 | | | | 117,655 | |
Tax reclaims receivable | | | 952 | | | | – | | | | 15,035 | |
Prepaid expenses | | | 21,554 | | | | 12,644 | | | | 34,698 | |
| | | | | | | | | | | | |
Total Assets | | | 27,209,722 | | | | 17,159,606 | | | | 27,510,664 | |
| | | | | | | | | | | | |
| | | |
Liabilities | | | | | | | | | | | | |
Payable for fund shares redeemed | | | 260,201 | | | | – | | | | – | |
Payable for investments purchased | | | – | | | | 108,552 | | | | – | |
Payable to Adviser | | | 7,777 | | | | 2,729 | | | | 5,708 | |
Accrued 12b-1 fees – Investor class | | | 121 | | | | – | | | | 281 | |
Payable to Administrator | | | 5,826 | | | | 4,356 | | | | 8,944 | |
Other accrued expenses | | | 6,805 | | | | 8,086 | | | | 7,022 | |
| | | | | | | | | | | | |
Total Liabilities | | | 280,730 | | | | 123,723 | | | | 21,955 | |
| | | | | | | | | | | | |
| | | |
Net Assets | | $ | 26,928,992 | | | $ | 17,035,883 | | | $ | 27,488,709 | |
| | | | | | | | | | | | |
Net Assets consist of: | | | | | | | | | | | | |
Paid-in capital | | $ | 19,923,903 | | | $ | 13,704,016 | | | $ | 28,627,753 | |
Accumulated undistributed net investment income (loss) | | | (26,291 | ) | | | 37,140 | | | | 129,764 | |
Accumulated undistributed net realized gain (loss) from investment transactions and foreign currency translations | | | 115,409 | | | | 99,944 | | | | (4,227,340 | ) |
Net unrealized appreciation on investments | | | 6,915,971 | | | | 3,194,783 | | | | 2,958,532 | |
| | | | | | | | | | | | |
| | | |
Net Assets | | $ | 26,928,992 | | | $ | 17,035,883 | | | $ | 27,488,709 | |
| | | | | | | | | | | | |
| | | |
Net Assets: Institutional Class | | $ | 26,627,350 | | | $ | 17,035,883 | | | $ | 26,827,912 | |
| | | | | | | | | | | | |
Shares outstanding
(unlimited number of shares authorized, no par value) | | | 1,767,810 | | | | 1,301,566 | | | | 2,517,217 | |
| | | | | | | | | | | | |
Net asset value, offering and redemption price per share | | $ | 15.06 | | | $ | 13.09 | | | $ | 10.66 | |
| | | | | | | | | | | | |
| | | |
Net Assets: Investor Class | | $ | 301,642 | | | | | | | $ | 660,797 | |
| | | | | | | | | | | | |
Shares outstanding
(unlimited number of shares authorized, no par value) | | | 20,189 | | | | | | | | 61,413 | |
| | | | | | | | | | | | |
Net asset value, offering and redemption price per share | | $ | 14.94 | | | | | | | $ | 10.76 | |
| | | | | | | | | | | | |
See accompanying notes which are an integral part of these financial statements.
18
MERITAGE FUNDS
STATEMENTS OF OPERATIONS
For the six months ended February 28, 2018 (Unaudited)
| | | | | | | | | | | | |
| | | Meritage Growth
Equity Fund | | | Meritage Value
Equity Fund | | | Meritage Yield-
Focus Equity Fund | |
Investment Income | | | | | | | | | | | | |
Dividend income
(net of foreign taxes withheld of $-, $1,770 and $12,646) | | $ | 103,414 | | | $ | 121,808 | | | $ | 648,534 | |
| | | | | | | | | | | | |
Total investment income | | | 103,414 | | | | 121,808 | | | | 648,534 | |
| | | | | | | | | | | | |
| | | |
Expenses | | | | | | | | | | | | |
Investment Adviser | | | 96,661 | | | | 63,479 | | | | 103,024 | |
Administration | | | 20,086 | | | | 13,280 | | | | 22,424 | |
Fund accounting | | | 13,390 | | | | 8,853 | | | | 14,949 | |
Audit | | | 10,712 | | | | 10,712 | | | | 10,712 | |
Transfer agent | | | 10,712 | | | | 7,083 | | | | 11,959 | |
Registration | | | 6,688 | | | | 6,415 | | | | 15,425 | |
Legal | | | 5,703 | | | | 5,703 | | | | 5,703 | |
Trustee | | | 2,976 | | | | 2,976 | | | | 2,976 | |
Report printing | | | 3,010 | | | | 2,092 | | | | 3,258 | |
Insurance | | | 2,101 | | | | 1,982 | | | | 2,673 | |
Custodian | | | 2,154 | | | | 1,772 | | | | 2,034 | |
Pricing | | | 1,095 | | | | 1,135 | | | | 1,271 | |
12b-1 – Investor class | | | 356 | | | | – | | | | 843 | |
Other | | | 6,692 | | | | 5,142 | | | | 8,122 | |
| | | | | | | | | | | | |
Total expenses | | | 182,336 | | | | 130,624 | | | | 205,373 | |
Fees waived by Adviser | | | (53,060 | ) | | | (45,957 | ) | | | (67,141 | ) |
| | | | | | | | | | | | |
Net operating expenses | | | 129,276 | | | | 84,667 | | | | 138,232 | |
| | | | | | | | | | | | |
Net investment income (loss) | | | (25,862 | ) | | | 37,141 | | | | 510,302 | |
| | | | | | | | | | | | |
| | | |
Net Realized and Change in Unrealized Gain (Loss) on Investments | | | | | | | | | | | | |
Net realized gain on investment securities transactions | | | 255,760 | | | | 593,602 | | | | 684,468 | |
Net realized gain on foreign currency translations | | | – | | | | – | | | | 446 | |
Net change in unrealized appreciation (depreciation) of investment securities | | | 2,677,813 | | | | 289,434 | | | | (110,506 | ) |
| | | | | | | | | | | | |
Net realized and change in unrealized gain on investments | | | 2,933,573 | | | | 883,036 | | | | 574,408 | |
| | | | | | | | | | | | |
Net increase in net assets resulting from operations | | $ | 2,907,711 | | | $ | 920,177 | | | $ | 1,084,710 | |
| | | | | | | | | | | | |
See accompanying notes which are an integral part of these financial statements.
19
MERITAGE GROWTH EQUITY FUND
STATEMENTS OF CHANGES IN NET ASSETS
| | | | | | | | |
| | | For the Six Months
Ended
February 28, 2018
(Unaudited) | | | For the Year
Ended
August 31, 2017 | |
Increase (Decrease) in Net Assets due to: | | | | | | | | |
Operations | | | | | | | | |
Net investment income (loss) | | $ | (25,862 | ) | | $ | 23,986 | |
Net realized gain on investment securities transactions | | | 255,760 | | | | 1,852,658 | |
Net change in unrealized appreciation of investment securities | | | 2,677,813 | | | | 1,792,047 | |
| | | | | | | | |
Net increase in net assets resulting from operations | | | 2,907,711 | | | | 3,668,691 | |
| | | | | | | | |
| | |
Distributions | | | | | | | | |
From net investment income – Institutional Class | | | (10,776 | ) | | | (44,491 | ) |
From net realized gains – Institutional Class | | | (1,718,576 | ) | | | (171,541 | ) |
From net realized gains – Investor Class | | | (18,215 | ) | | | (1,047 | ) |
| | | | | | | | |
Total distributions | | | (1,747,567 | ) | | | (217,079 | ) |
| | | | | | | | |
| | |
Capital Transactions – Institutional Class | | | | | | | | |
Proceeds from shares sold | | | 2,081,791 | | | | 4,352,696 | |
Reinvestment of distributions | | | 1,671,004 | | | | 208,934 | |
Amount paid for shares redeemed | | | (1,809,448 | ) | | | (1,928,779 | ) |
| | | | | | | | |
Total Institutional Class | | | 1,943,347 | | | | 2,632,851 | |
| | | | | | | | |
| | |
Capital Transactions – Investor Class | | | | | | | | |
Proceeds from shares sold | | | 46,259 | | | | 211,276 | |
Reinvestment of distributions | | | 17,846 | | | | 1,047 | |
Amount paid for shares redeemed | | | (52,573 | ) | | | (328,967 | ) |
| | | | | | | | |
Total Investor Class | | | 11,532 | | | | (116,644 | ) |
| | | | | | | | |
Net increase in net assets resulting from capital transactions | | | 1,954,879 | | | | 2,516,207 | |
| | | | | | | | |
Total Increase in Net Assets | | | 3,115,023 | | | | 5,967,819 | |
| | | | | | | | |
| | |
Net Assets | | | | | | | | |
Beginning of period | | | 23,813,969 | | | | 17,846,150 | |
| | | | | | | | |
End of period | | $ | 26,928,992 | | | $ | 23,813,969 | |
| | | | | | | | |
Accumulated undistributed net investment income (loss) | | $ | (26,291 | ) | | $ | 10,347 | |
| | | | | | | | |
| | |
Share Transactions – Institutional Class | | | | | | | | |
Shares sold | | | 137,969 | | | | 327,228 | |
Shares issued in reinvestment of distributions | | | 114,374 | | | | 16,822 | |
Shares redeemed | | | (119,977 | ) | | | (152,144 | ) |
| | | | | | | | |
Total Institutional Class | | | 132,366 | | | | 191,906 | |
| | | | | | | | |
| | |
Share Transactions – Investor Class | | | | | | | | |
Shares sold | | | 3,104 | | | | 15,392 | |
Shares issued in reinvestment of distributions | | | 1,231 | | | | 85 | |
Shares redeemed | | | (3,487 | ) | | | (26,638 | ) |
| | | | | | | | |
Total Investor Class | | | 848 | | | | (11,161 | ) |
| | | | | | | | |
Net increase in shares outstanding | | | 133,214 | | | | 180,745 | |
| | | | | | | | |
See accompanying notes which are an integral part of these financial statements.
20
MERITAGE VALUE EQUITY FUND
STATEMENTS OF CHANGES IN NET ASSETS
| | | | | | | | |
| | | For the Six Months
Ended
February 28, 2018
(Unaudited) | | | For the Year
Ended
August 31, 2017 | |
Increase (Decrease) in Net Assets due to: | | | | | | | | |
Operations | | | | | | | | |
Net investment income | | $ | 37,141 | | | $ | 92,024 | |
Net realized gain on investment securities transactions | | | 593,602 | | | | 140,802 | |
Net change in unrealized appreciation of investment securities | | | 289,434 | | | | 1,534,876 | |
| | | | | | | | |
Net increase in net assets resulting from operations | | | 920,177 | | | | 1,767,702 | |
| | | | | | | | |
| | |
Distributions | | | | | | | | |
From net investment income – Institutional Class | | | (90,492 | ) | | | (115,272 | ) |
From net investment income – Investor Class(a) | | | – | | | | (67 | ) |
| | | | | | | | |
Total distributions | | | (90,492 | ) | | | (115,339 | ) |
| | | | | | | | |
| | |
Capital Transactions – Institutional Class | | | | | | | | |
Proceeds from shares sold | | | 1,391,726 | | | | 2,914,903 | |
Reinvestment of distributions | | | 88,422 | | | | 113,051 | |
Amount paid for shares redeemed | | | (1,290,888 | ) | | | (2,517,719 | ) |
| | | | | | | | |
Total Institutional Class | | | 189,260 | | | | 510,235 | |
| | | | | | | | |
| | |
Capital Transactions – Investor Class(a) | | | | | | | | |
Proceeds from shares sold | | | – | | | | 922 | |
Reinvestment of distributions | | | – | | | | 67 | |
Amount paid for shares redeemed | | | – | | | | (11,012 | ) |
| | | | | | | | |
Total Investor Class | | | – | | | | (10,023 | ) |
| | | | | | | | |
Net increase in net assets resulting from capital transactions | | | 189,260 | | | | 500,212 | |
| | | | | | | | |
Total Increase in Net Assets | | | 1,018,945 | | | | 2,152,575 | |
| | | | | | | | |
| | |
Net Assets | | | | | | | | |
Beginning of period | | | 16,016,938 | | | | 13,864,363 | |
| | | | | | | | |
End of period | | $ | 17,035,883 | | | $ | 16,016,938 | |
| | | | | | | | |
Accumulated undistributed net investment income | | $ | 37,140 | | | $ | 90,491 | |
| | | | | | | | |
| | |
Share Transactions – Institutional Class | | | | | | | | |
Shares sold | | | 105,317 | | | | 247,653 | |
Shares issued in reinvestment of distributions | | | 6,594 | | | | 9,729 | |
Shares redeemed | | | (97,152 | ) | | | (222,567 | ) |
| | | | | | | | |
Total Institutional Class | | | 14,759 | | | | 34,815 | |
| | | | | | | | |
| | |
Share Transactions – Investor Class(a) | | | | | | | | |
Shares sold | | | – | | | | – | |
Shares issued in reinvestment of distributions | | | – | | | | 6 | |
Shares redeemed | | | – | | | | (946 | ) |
| | | | | | | | |
Total Investor Class | | | – | | | | (940 | ) |
| | | | | | | | |
Net increase in shares outstanding | | | 14,759 | | | | 33,875 | |
| | | | | | | | |
| (a) | Meritage Value Equity Fund – Investor Class liquidated on February 3, 2017. |
See accompanying notes which are an integral part of these financial statements.
21
MERITAGE YIELD-FOCUS EQUITY FUND
STATEMENTS OF CHANGES IN NET ASSETS
| | | | | | | | |
| | | For the Six Months
Ended
February 28, 2018
(Unaudited) | | | For the Year
Ended
August 31, 2017 | |
Increase (Decrease) in Net Assets due to: | | | | | | | | |
Operations | | | | | | | | |
Net investment income | | $ | 510,302 | | | $ | 1,113,120 | |
Net realized gain on investment securities transactions and foreign currency translations | | | 684,914 | | | | 1,746,129 | |
Net change in unrealized depreciation of investment securities | | | (110,506 | ) | | | (239,221 | ) |
| | | | | | | | |
Net increase in net assets resulting from operations | | | 1,084,710 | | | | 2,620,028 | |
| | | | | | | | |
| | |
Distributions | | | | | | | | |
From net investment income – Institutional Class | | | (452,629 | ) | | | (925,897 | ) |
From net investment income – Investor Class | | | (10,800 | ) | | | (141,974 | ) |
| | | | | | | | |
Total distributions | | | (463,429 | ) | | | (1,067,871 | ) |
| | | | | | | | |
| | |
Capital Transactions – Institutional Class | | | | | | | | |
Proceeds from shares sold | | | 1,160,716 | | | | 2,700,387 | |
Reinvestment of distributions | | | 434,814 | | | | 877,453 | |
Amount paid for shares redeemed | | | (1,475,123 | ) | | | (7,887,178 | ) |
| | | | | | | | |
Total Institutional Class | | | 120,407 | | | | (4,309,338 | ) |
| | | | | | | | |
| | |
Capital Transactions – Investor Class | | | | | | | | |
Proceeds from shares sold | | | 66,950 | | | | 565,477 | |
Reinvestment of distributions | | | 9,951 | | | | 136,022 | |
Amount paid for shares redeemed | | | (77,509 | ) | | | (11,250,540 | ) |
| | | | | | | | |
Total Investor Class | | | (608 | ) | | | (10,549,041 | ) |
| | | | | | | | |
Net decrease in net assets resulting from capital transactions | | | 119,799 | | | | (14,858,379 | ) |
| | | | | | | | |
Total Increase (Decrease) in Net Assets | | | 741,080 | | | | (13,306,222 | ) |
| | | | | | | | |
| | |
Net Assets | | | | | | | | |
Beginning of period | | | 26,747,629 | | | | 40,053,851 | |
| | | | | | | | |
End of period | | $ | 27,488,709 | | | $ | 26,747,629 | |
| | | | | | | | |
Accumulated undistributed net investment income | | $ | 129,764 | | | $ | 82,891 | |
| | | | | | | | |
| | |
Share Transactions – Institutional Class | | | | | | | | |
Shares sold | | | 106,728 | | | | 264,568 | |
Shares issued in reinvestment of distributions | | | 39,977 | | | | 86,151 | |
Shares redeemed | | | (137,664 | ) | | | (775,089 | ) |
| | | | | | | | |
Total Institutional Class | | | 9,041 | | | | (424,370 | ) |
| | | | | | | | |
| | |
Share Transactions – Investor Class | | | | | | | | |
Shares sold | | | 6,117 | | | | 56,078 | |
Shares issued in reinvestment of distributions | | | 905 | | | | 13,555 | |
Shares redeemed | | | (6,969 | ) | | | (1,081,302 | ) |
| | | | | | | | |
Total Investor Class | | | 53 | | | | (1,011,669 | ) |
| | | | | | | | |
Net increase (decrease) in shares outstanding | | | 9,094 | | | | (1,436,039 | ) |
| | | | | | | | |
See accompanying notes which are an integral part of these financial statements.
22
MERITAGE GROWTH EQUITY FUND – INSTITUTIONAL CLASS
FINANCIAL HIGHLIGHTS
(For a share outstanding during each period)
| | | | | | | | | | | | | | | | | | | | |
| | | For the
Six Months Ended
February 28, 2018 | | | For the
Year Ended
August 31, 2017 | | | For the
Year Ended
August 31, 2016 | | | For the
Year Ended
August 31, 2015 | | | For the
Period Ended
August 31, 2014 (a) | |
| | | (Unaudited) | | | | | | | | | | | | | |
Selected Per Share Data: | | | | | | | | | | | | | | | | | | | | |
Net asset value, beginning of period | | $ | 14.39 | | | $ | 12.11 | | | $ | 11.20 | | | $ | 10.95 | | | $ | 10.00 | |
| | | | | | | | | | | | | | | | | | | | |
Investment operations: | | | | | | | | | | | | | | | | | | | | |
Net investment income | | | (0.01 | ) | | | 0.02 | | | | 0.03 | | | | 0.01 | | | | 0.01 | |
Net realized and unrealized gain on investments | | | 1.72 | | | | 2.41 | | | | 1.12 | | | | 0.36 | | | | 0.94 | |
| | | | | | | | | | | | | | | | | | | | |
Total from investment operations | | | 1.71 | | | | 2.43 | | | | 1.15 | | | | 0.37 | | | | 0.95 | |
| | | | | | | | | | | | | | | | | | | | |
Less distributions to shareholders: | | | | | | | | | | | | | | | | | | | | |
From net investment income | | | (0.01 | ) | | | (0.03 | ) | | | (0.01 | ) | | | (0.01 | ) | | | – | |
From net realized gains | | | (1.03 | ) | | | (0.12 | ) | | | (0.23 | ) | | | (0.11 | ) | | | – | |
| | | | | | | | | | | | | | | | | | | | |
Total distributions | | | (1.04 | ) | | | (0.15 | ) | | | (0.24 | ) | | | (0.12 | ) | | | – | |
| | | | | | | | | | | | | | | | | | | | |
Net asset value, end of period | | $ | 15.06 | | | $ | 14.39 | | | $ | 12.11 | | | $ | 11.20 | | | $ | 10.95 | |
| | | | | | | | | | | | | | | | | | | | |
| | | | | |
Total Return (b) | | | 12.06 | %(c) | | | 20.27 | % | | | 10.41 | % | | | 3.38 | % | | | 9.50 | %(c) |
| | | | | |
Ratios and Supplemental Data: | | | | | | | | | | | | | | | | | | | | |
Net assets, end of period (000 omitted) | | $ | 26,627 | | | $ | 23,537 | | | $ | 17,479 | | | $ | 13,331 | | | $ | 10,642 | |
Ratio of net expenses to average net assets | | | 1.00 | %(d) | | | 1.00 | % | | | 1.00 | % | | | 1.00 | % | | | 1.00 | %(d) |
Ratio of expenses to average net assets before waiver | | | 1.41 | %(d) | | | 1.55 | % | | | 1.60 | % | | | 1.66 | % | | | 3.49 | %(d) |
Ratio of net investment income (loss) to average net assets | | | (0.20 | )%(d) | | | 0.12 | % | | | 0.24 | % | | | 0.08 | % | | | 0.22 | %(d) |
Portfolio turnover rate (e) | | | 32 | %(c) | | | 82 | % | | | 73 | % | | | 84 | % | | | 94 | %(c) |
| (a) | For the period December 23, 2013 (commencement of operations) to August 31, 2014. |
| (b) | Total return in the above table represents the rate that the investor would have earned or lost on an investment in the Fund, assuming reinvestment of dividends. |
| (e) | Portfolio turnover is calculated on the basis on the Fund as a whole without distinguishing among the classes of shares. |
See accompanying notes which are an integral part of these financial statements.
23
MERITAGE GROWTH EQUITY FUND – INVESTOR CLASS
FINANCIAL HIGHLIGHTS
(For a share outstanding during each period)
| | | | | | | | | | | | | | | | | | | | |
| | | For the
Six Months Ended
February 28, 2018 | | | For the
Year Ended
August 31, 2017 | | | For the
Year Ended
August 31, 2016 | | | For the
Year Ended
August 31, 2015 | | | For the
Period Ended
August 31, 2014 (a) | |
| | | (Unaudited) | | | | | | | | | | | | | |
Selected Per Share Data: | | | | | | | | | | | | | | | | | | | | |
Net asset value, beginning of period | | $ | 14.30 | | | $ | 12.03 | | | $ | 11.15 | | | $ | 10.92 | | | $ | 10.00 | |
| | | | | | | | | | | | | | | | | | | | |
Investment operations: | | | | | | | | | | | | | | | | | | | | |
Net investment income (loss) | | | (0.03 | ) | | | – | (b) | | | – | (b) | | | (0.02 | ) | | | – | (b) |
Net realized and unrealized gain on investments | | | 1.70 | | | | 2.39 | | | | 1.11 | | | | 0.37 | | | | 0.92 | |
| | | | | | | | | | | | | | | | | | | | |
Total from investment operations | | | 1.67 | | | | 2.39 | | | | 1.11 | | | | 0.35 | | | | 0.92 | |
| | | | | | | | | | | | | | | | | | | | |
Less distributions to shareholders: | | | | | | | | | | | | | | | | | | | | |
From net investment income | | | – | | | | – | | | | – | | | | (0.01 | ) | | | – | |
From net realized gains | | | (1.03 | ) | | | (0.12 | ) | | | (0.23 | ) | | | (0.11 | ) | | | – | |
| | | | | | | | | | | | | | | | | | | | |
Total distributions | | | (1.03 | ) | | | (0.12 | ) | | | (0.23 | ) | | | (0.12 | ) | | | – | |
| | | | | | | | | | | | | | | | | | | | |
Net asset value, end of period | | $ | 14.94 | | | $ | 14.30 | | | $ | 12.03 | | | $ | 11.15 | | | $ | 10.92 | |
| | | | | | | | | | | | | | | | | | | | |
| | | | | |
Total Return (c) | | | 11.87 | %(d) | | | 20.02 | % | | | 10.13 | % | | | 3.17 | % | | | 9.20 | %(d) |
| | | | | |
Ratios and Supplemental Data: | | | | | | | | | | | | | | | | | | | | |
Net assets, end of period (000 omitted) | | $ | 302 | | | $ | 276 | | | $ | 367 | | | $ | 164 | | | $ | 136 | |
Ratio of net expenses to average net assets | | | 1.25 | %(e) | | | 1.25 | % | | | 1.25 | % | | | 1.25 | % | | | 1.25 | %(e) |
Ratio of expenses to average net assets before waiver | | | 1.66 | %(e) | | | 1.80 | % | | | 1.85 | % | | | 1.91 | % | | | 3.32 | %(e) |
Ratio of net investment income (loss) to average net assets | | | (0.45 | )%(e) | | | (0.10 | )% | | | (0.01 | )% | | | (0.17 | )% | | | 0.01 | %(e) |
Portfolio turnover rate (f) | | | 32 | %(d) | | | 82 | % | | | 73 | % | | | 84 | % | | | 94 | %(d) |
| (a) | For the period December 23, 2013 (commencement of operations) to August 31, 2014. |
| (b) | Amount is less than $0.01. |
| (c) | Total return in the above table represents the rate that the investor would have earned or lost on an investment in the Fund, assuming reinvestment of dividends. |
| (f) | Portfolio turnover is calculated on the basis on the Fund as a whole without distinguishing among the classes of shares. |
See accompanying notes which are an integral part of these financial statements.
24
MERITAGE VALUE EQUITY FUND – INSTITUTIONAL CLASS
FINANCIAL HIGHLIGHTS
(For a share outstanding during each period)
| | | | | | | | | | | | | | | | | | | | |
| | | For the
Six Months Ended
February 28, 2018 | | | For the
Year Ended
August 31, 2017 | | | For the
Year Ended
August 31, 2016 | | | For the
Year Ended
August 31, 2015 | | | For the
Period Ended
August 31, 2014 (a) | |
| | | (Unaudited) | | | | | | | | | | | | | |
Selected Per Share Data: | | | | | | | | | | | | | | | | | | | | |
Net asset value, beginning of period | | $ | 12.45 | | | $ | 11.07 | | | $ | 11.00 | | | $ | 11.00 | | | $ | 10.00 | |
| | | | | | | | | | | | | | | | | | | | |
Investment operations: | | | | | | | | | | | | | | | | | | | | |
Net investment income | | | 0.03 | | | | 0.07 | | | | 0.08 | | | | 0.10 | | | | 0.04 | |
Net realized and unrealized gain on investments | | | 0.68 | | | | 1.41 | | | | 0.12 | | | | 0.01 | (b) | | | 0.96 | |
| | | | | | | | | | | | | | | | | | | | |
Total from investment operations | | | 0.71 | | | | 1.48 | | | | 0.20 | | | | 0.11 | | | | 1.00 | |
| | | | | | | | | | | | | | | | | | | | |
Less distributions to shareholders: | | | | | | | | | | | | | | | | | | | | |
From net investment income | | | (0.07 | ) | | | (0.10 | ) | | | (0.09 | ) | | | (0.04 | ) | | | – | |
From net realized gains | | | – | | | | – | | | | (0.04 | ) | | | (0.07 | ) | | | – | |
| | | | | | | | | | | | | | | | | | | | |
Total distributions | | | (0.07 | ) | | | (0.10 | ) | | | (0.13 | ) | | | (0.11 | ) | | | – | |
| | | | | | | | | | | | | | | | | | | | |
Net asset value, end of period | | $ | 13.09 | | | $ | 12.45 | | | $ | 11.07 | | | $ | 11.00 | | | $ | 11.00 | |
| | | | | | | | | | | | | | | | | | | | |
| | | | | |
Total Return (c) | | | 5.69 | %(d) | | | 13.41 | % | | | 1.85 | % | | | 0.94 | % | | | 10.00 | %(d) |
| | | | | |
Ratios and Supplemental Data: | | | | | | | | | | | | | | | | | | | | |
Net assets, end of period (000 omitted) | | $ | 17,036 | | | $ | 16,017 | | | $ | 13,854 | | | $ | 11,321 | | | $ | 9,673 | |
Ratio of net expenses to average net assets | | | 1.00 | %(e) | | | 1.00 | % | | | 1.00 | % | | | 1.00 | % | | | 1.00 | %(e) |
Ratio of expenses to average net assets before waiver | | | 1.54 | %(e) | | | 1.69 | % | | | 1.67 | % | | | 1.66 | % | | | 3.58 | %(e) |
Ratio of net investment income to average net assets | | | 0.44 | %(e) | | | 0.60 | % | | | 0.89 | % | | | 0.96 | % | | | 0.86 | %(e) |
Portfolio turnover rate (f) | | | 41 | %(d) | | | 81 | % | | | 67 | % | | | 62 | % | | | 50 | %(d) |
| (a) | For the period December 23, 2013 (commencement of operations) to August 31, 2014. |
| (b) | The amount shown for a share outstanding throughout the period does not accord with the aggregate gains and losses in the portfolio securities during the period because of the timing of sales and purchases of fund shares in relation to fluctuating market values during the period. |
| (c) | Total return in the above table represents the rate that the investor would have earned or lost on an investment in the Fund, assuming reinvestment of dividends. |
| (f) | Portfolio turnover is calculated on the basis on the Fund as a whole without distinguishing among the classes of shares. |
See accompanying notes which are an integral part of these financial statements.
25
MERITAGE YIELD-FOCUS EQUITY FUND – INSTITUTIONAL CLASS
FINANCIAL HIGHLIGHTS
(For a share outstanding during each period)
| | | | | | | | | | | | | | | | | | | | |
| | | For the
Six Months Ended
February 28, 2018 | | | For the
Year Ended
August 31, 2017 | | | For the
Year Ended
August 31, 2016 | | | For the
Year Ended
August 31, 2015 | | | For the
Period Ended
August 31, 2014 (a) | |
| | | (Unaudited) | | | | | | | | | | | | | |
Selected Per Share Data: | | | | | | | | | | | | | | | | | | | | |
Net asset value, beginning of period | | $ | 10.41 | | | $ | 10.00 | | | $ | 9.44 | | | $ | 11.27 | | | $ | 10.00 | |
| | | | | | | | | | | | | | | | | | | | |
Investment operations: | | | | | | | | | | | | | | | | | | | | |
Net investment income | | | 0.20 | | | | 0.37 | | | | 0.32 | | | | 0.33 | | | | 0.10 | |
Net realized and unrealized gain (loss) on investments | | | 0.23 | | | | 0.40 | | | | 0.56 | | | | (1.71 | ) | | | 1.17 | |
| | | | | | | | | | | | | | | | | | | | |
Total from investment operations | | | 0.43 | | | | 0.77 | | | | 0.88 | | | | (1.38 | ) | | | 1.27 | |
| | | | | | | | | | | | | | | | | | | | |
Less distributions to shareholders: | | | | | | | | | | | | | | | | | | | | |
From net investment income | | | (0.18 | ) | | | (0.36 | ) | | | (0.32 | ) | | | (0.41 | ) | | | – | |
From net realized gains | | | – | | | | – | | | | – | | | | (0.03 | ) | | | – | |
From return of capital | | | – | | | | – | | | | – | | | | (0.01 | ) | | | – | |
| | | | | | | | | | | | | | | | | | | | |
Total distributions | | | (0.18 | ) | | | (0.36 | ) | | | (0.32 | ) | | | (0.45 | ) | | | – | |
| | | | | | | | | | | | | | | | | | | | |
Net asset value, end of period | | $ | 10.66 | | | $ | 10.41 | | | $ | 10.00 | | | $ | 9.44 | | | $ | 11.27 | |
| | | | | | | | | | | | | | | | | | | | |
| | | | | |
Total Return (b) | | | 4.13 | %(c) | | | 7.79 | % | | | 9.58 | % | | | (12.56 | )% | | | 12.70 | %(c) |
| | | | | |
Ratios and Supplemental Data: | | | | | | | | | | | | | | | | | | | | |
Net assets, end of period (000 omitted) | | $ | 26,828 | | | $ | 26,103 | | | $ | 29,340 | | | $ | 28,316 | | | $ | 26,436 | |
Ratio of net expenses to average net assets | | | 1.00 | %(d) | | | 1.00 | % | | | 1.00 | % | | | 1.00 | % | | | 1.00 | %(d) |
Ratio of expenses to average net assets before waiver | | | 1.49 | %(d) | | | 1.48 | % | | | 1.49 | % | | | 1.44 | % | | | 2.62 | %(d) |
Ratio of net investment income to average net assets | | | 3.72 | %(d) | | | 3.49 | % | | | 3.41 | % | | | 3.17 | % | | | 2.70 | %(d) |
Portfolio turnover rate (e) | | | 31 | %(c) | | | 60 | % | | | 99 | % | | | 86 | % | | | 63 | %(c) |
| (a) | For the period December 23, 2013 (commencement of operations) to August 31, 2014. |
| (b) | Total return in the above table represents the rate that the investor would have earned or lost on an investment in the Fund, assuming reinvestment of dividends. |
| (e) | Portfolio turnover is calculated on the basis on the Fund as a whole without distinguishing among the classes of shares. |
See accompanying notes which are an integral part of these financial statements.
26
MERITAGE YIELD-FOCUS EQUITY FUND – INVESTOR CLASS
FINANCIAL HIGHLIGHTS
(For a share outstanding during each period)
| | | | | | | | | | | | | | | | | | | | |
| | | For the
Six Months Ended
February 28, 2018 | | | For the
Year Ended
August 31, 2017 | | | For the
Year Ended
August 31, 2016 | | | For the
Year Ended
August 31, 2015 | | | For the
Period Ended
August 31, 2014 (a) | |
| | | (Unaudited) | | | | | | | | | | | | | |
Selected Per Share Data: | | | | | | | | | | | | | | | | | | | | |
Net asset value, beginning of period | | $ | 10.51 | | | $ | 9.98 | | | $ | 9.42 | | | $ | 11.25 | | | $ | 10.00 | |
| | | | | | | | | | | | | | | | | | | | |
Investment operations: | | | | | | | | | | | | | | | | | | | | |
Net investment income | | | 0.19 | | | | 0.32 | (b) | | | 0.32 | | | | 0.29 | | | | 0.01 | |
Net realized and unrealized gain (loss) on investments | | | 0.23 | | | | 0.46 | | | | 0.54 | | | | (1.70 | ) | | | 1.24 | |
| | | | | | | | | | | | | | | | | | | | |
Total from investment operations | | | 0.42 | | | | 0.78 | | | | 0.86 | | | | (1.41 | ) | | | 1.25 | |
| | | | | | | | | | | | | | | | | | | | |
Less distributions to shareholders: | | | | | | | | | | | | | | | | | | | | |
From net investment income | | | (0.17 | ) | | | (0.25 | ) | | | (0.30 | ) | | | (0.38 | ) | | | – | |
From net realized gains | | | – | | | | – | | | | – | | | | (0.03 | ) | | | – | |
From return of capital | | | – | | | | – | | | | – | | | | (0.01 | ) | | | – | |
| | | | | | | | | | | | | | | | | | | | |
Total distributions | | | (0.17 | ) | | | (0.25 | ) | | | (0.30 | ) | | | (0.42 | ) | | | – | |
| | | | | | | | | | | | | | | | | | | | |
Net asset value, end of period | | $ | 10.76 | | | $ | 10.51 | | | $ | 9.98 | | | $ | 9.42 | | | $ | 11.25 | |
| | | | | | | | | | | | | | | | | | | | |
| | | | | |
Total Return (c) | | | 3.97 | %(d) | | | 7.93 | % | | | 9.35 | % | | | (12.85 | )% | | | 12.50 | %(d) |
| | | | | |
Ratios and Supplemental Data: | | | | | | | | | | | | | | | | | | | | |
Net assets, end of period (000 omitted) | | $ | 661 | | | $ | 644 | | | $ | 10,714 | | | $ | 10,708 | | | $ | 2,627 | |
Ratio of net expenses to average net assets | | | 1.25 | %(e) | | | 1.25 | % | | | 1.25 | % | | | 1.25 | % | | | 1.25 | %(e) |
Ratio of expenses to average net assets before waiver | | | 1.78 | %(e) | | | 1.73 | % | | | 1.74 | % | | | 1.69 | % | | | 2.46 | %(e) |
Ratio of net investment income to average net assets | | | 3.48 | %(e) | | | 3.18 | % | | | 3.17 | % | | | 2.84 | % | | | 2.26 | %(e) |
Portfolio turnover rate (f) | | | 31 | %(d) | | | 60 | % | | | 99 | % | | | 86 | % | | | 63 | %(d) |
| (a) | For the period December 23, 2013 (commencement of operations) to August 31, 2014. |
| (b) | Calculated using the average shares method. |
| (c) | Total return in the above table represents the rate that the investor would have earned or lost on an investment in the Fund, assuming reinvestment of dividends. |
| (f) | Portfolio turnover is calculated on the basis on the Fund as a whole without distinguishing among the classes of shares. |
See accompanying notes which are an integral part of these financial statements.
27
MERITAGE FUNDS
NOTES TO THE FINANCIAL STATEMENTS
February 28, 2018 – (Unaudited)
NOTE 1. ORGANIZATION
The Meritage Growth Equity Fund (the “Growth Equity Fund”), the Meritage Value Equity Fund (the “Value Equity Fund”), and the Meritage Yield-Focus Equity Fund (the “Yield-Focus Equity Fund”) (each a “Fund” and, collectively the “Funds”) were organized as a diversified series of the Capitol Series Trust (the “Trust”). The Trust is an open-end investment company established under the laws of Ohio by an Agreement and Declaration of Trust dated September 18, 2013 (the “Trust Agreement”). The Trust Agreement permits the Trust’s Board of Trustees (the “Board”) to issue an unlimited number of shares of beneficial interest of separate series without par value. The Growth Equity and Yield-Focus Equity Funds each offer two share classes, Institutional Class Shares and Investor Class Shares. As disclosed in a prospectus supplement dated February 15, 2017, the Value Equity Fund has discontinued the sale of its Investor Shares, and will continue to offer Institutional Shares. The Funds commenced operations on December 23, 2013. The Funds’ investment adviser is Meritage Portfolio Management, Inc. (the “Adviser”). The investment objective of the Growth Equity Fund is to seek growth of capital. The investment objective of the Value Equity Fund is to seek growth of capital. Income is a secondary objective for the Value Equity Fund. The investment objective of the Yield-Focus Equity Fund is to seek long-term growth of capital with an emphasis on high current income.
Each Fund’s prospectus provides a description of the investment objective, policies and strategies, along with information on the classes of shares currently being offered.
NOTE 2. SIGNIFICANT ACCOUNTING POLICIES
The Funds are investment companies and follow accounting and reporting guidance under Financial Accounting Standards Board Accounting Standards Codification (“ASC”) Topic 946, “Financial Services-Investment Companies”. The following is a summary of significant accounting policies consistently followed by each Fund in the preparation of its financial statements. These policies are in conformity with generally accepted accounting principles in the United States of America (“GAAP”).
Estimates – The preparation of financial statements in conformity with GAAP requires management to make estimates and assumptions that affect the reported amounts of assets and liabilities and disclosure of contingent assets and liabilities at the date of the financial statements and the reported amounts of increases and decreases in net assets from operations during the reporting period. Actual results could differ from those estimates.
Securities Valuation – All investments in securities are recorded at their estimated fair value as described in Note 3.
Foreign Currency Translation – The accounting records of the Funds are maintained in U.S. dollars. Foreign currency amounts are translated into U.S. dollars at the current rate of exchange each business day to determine the value of investments, and other assets and liabilities. Purchases and sales of foreign securities, and income and expenses, are translated at the prevailing rate of exchange on the respective date of these transactions. The Funds do not isolate that portion of the results of operations resulting from changes in foreign exchange rates on investments from fluctuation arising from changes in market prices of securities held. These fluctuations are included with the net realized and unrealized gain or loss from investments.
Federal Income Taxes – The Funds make no provision for federal income or excise tax. Each Fund has qualified and intends to qualify each year as a regulated investment company (“RIC”) under subchapter M of the Internal Revenue Code of 1986, as amended, by complying with the requirements applicable to RICs and by distributing
28
MERITAGE FUNDS
NOTES TO THE FINANCIAL STATEMENTS – (continued)
February 28, 2018 – (Unaudited)
NOTE 2. SIGNIFICANT ACCOUNTING POLICIES – continued
substantially all of its taxable income. Each Fund also intends to distribute sufficient net investment income and net capital gains, if any, so that it will not be subject to excise tax on undistributed income and gains. If the required amount of net investment income or gains is not distributed, the Funds could incur a tax expense.
The Funds recognize tax benefits or expenses of uncertain tax positions only when the position is “more likely than not” to be sustained assuming examination by tax authorities. Management of the Funds has reviewed tax positions taken in tax years that remain subject to examination by all major tax jurisdictions, including federal (i.e., the previous three tax year ends and the interim tax period since then, as applicable) and has concluded that no provision for unrecognized tax benefits or expenses is required in these financial statements and does not expect this to change over the next twelve months. The Fund recognizes interest and penalties, if any, related to unrecognized tax benefits as income tax expense in the Statement of Operations. During the period, the Funds did not incur any interest or penalties.
Expenses – Expenses incurred by the Trust that do not relate to a specific fund of the Trust are allocated to the individual funds based on each Fund’s relative net assets or another appropriate basis (as determined by the Board). Expenses attributable to any class are borne by that class. Income, realized gains and losses, unrealized appreciation and depreciation, and expenses are allocated to each class based on the net assets in relation to the relative net assets of the Fund.
Security Transactions and Related Income – Throughout the reporting period, security transactions are accounted for no later than one business day following the trade date. For financial reporting purposes, security transactions are accounted for on trade date on the last business day of the reporting period. The specific identification method is used for determining gains or losses for financial statements and income tax purposes. Dividend income is recorded on the ex-dividend date and interest income is recorded on an accrual basis. Dividend income from real estate investment trusts (REITs) and distributions from limited partnerships are recognized on the ex-date and included in dividend income. The calendar year-end classification of distributions received from REITs during the fiscal year are reported subsequent to year end; accordingly, the Fund estimates the character of REIT distributions based on the most recent information available. Income or loss from limited partnerships is reclassified among the components of net assets upon receipt of K-1’s. Discounts and premiums on fixed income securities purchased are amortized over the life of the respective securities or accreted using the effective interest method.
Dividends and Distributions – Each Fund intends to distribute substantially all of its net investment income, if any, as dividends to its shareholders on at least an annual basis, except for Yield-Focus Fund which will normally distribute dividends on a quarterly basis. Each Fund intends to distribute its net realized long term capital gains and its net realized short term capital gains, if any, at least once a year. Dividends to shareholders, which are determined in accordance with income tax regulations, are recorded on the ex-dividend date. The treatment for financial reporting purposes of distributions made to shareholders during the period from net investment income or net realized capital gains may differ from their ultimate treatment for federal income tax purposes. These differences are caused primarily by differences in the timing of the recognition of certain components of income, expense or realized capital gains for federal income tax purposes. Where such differences are permanent in nature, they are reclassified in the components of the net assets based on their ultimate characterization for federal income tax purposes. Any such reclassifications will have no effects on net assets, results of operations or net asset values per share of the Funds.
29
MERITAGE FUNDS
NOTES TO THE FINANCIAL STATEMENTS – (continued)
February 28, 2018 – (Unaudited)
NOTE 3. SECURITIES VALUATION AND FAIR VALUE MEASUREMENTS
Fair value is defined as the price that the Funds would receive upon selling an investment in an orderly transaction to an independent buyer in the principal or most advantageous market of the investment. GAAP establishes a three-tier hierarchy to maximize the use of observable market data and minimize the use of unobservable inputs and to establish classification of fair value measurements for disclosure purposes.
Inputs refer broadly to the assumptions that market participants would use in pricing the asset or liability. Inputs may be observable or unobservable. Observable inputs are inputs that reflect the assumptions market participants would use in pricing the asset or liability developed based on market data obtained from sources independent of the reporting entity. Unobservable inputs are inputs that reflect the reporting entity’s own assumptions about the assumptions market participants would use in pricing the asset or liability developed based on the best information available in the circumstances.
Various inputs are used in determining the value of each Fund’s investments. These inputs are summarized in the three broad levels listed below.
| | • | | Level 1 – unadjusted quoted prices in active markets for identical investments and/or registered investment companies where the value per share is determined and published and is the basis for current transactions for identical assets or liabilities at the valuation date |
| | • | | Level 2 – other significant observable inputs (including, but not limited to, quoted prices for an identical security in an inactive market, quoted prices for similar securities, interest rates, prepayment speeds, credit risk, etc.) |
| | • | | Level 3 – significant unobservable inputs (including each Fund’s own assumptions in determining fair value of investments based on the best information available) |
The inputs used to measure fair value may fall into different levels of the fair value hierarchy. In such cases, for disclosure purposes, the level in the fair value hierarchy within which the fair value measurement falls in its entirety is determined based on the lowest level input that is significant to the fair value measurement in its entirety.
In computing the net asset value (“NAV”) of the Funds, fair value is based on market valuations with respect to portfolio securities for which market quotations are readily available. Pursuant to Board approved policies, the Funds rely on independent third-party pricing services to provide the current market value of securities. Those pricing services value equity securities, including exchange-traded funds and exchange-traded notes, traded on a securities exchange at the last reported sales price on the principal exchange. Equity securities quoted by NASDAQ are valued at the NASDAQ Official Closing Price. If there is no reported sale on the principal exchange, equity securities are valued at the mean between the most recent quoted bid and asked price. When using the market quotations or close prices provided by the pricing service and when the market is considered active, the security will be classified as a Level 1 security. Investments in open-end mutual funds, including money market mutual funds, are generally priced at the ending NAV provided by the pricing service of the funds and are generally categorized as Level 1 securities. Debt securities are valued using evaluated prices furnished by a pricing vendor selected by the Board and are generally classified as Level 2 securities.
In the event that market quotations are not readily available, the Adviser determines that the market quotation or the price provided by the pricing service does not accurately reflect the current fair value, or certain restricted or illiquid securities are being valued, such securities are valued as determined in good faith by the Trust’s
30
MERITAGE FUNDS
NOTES TO THE FINANCIAL STATEMENTS – (continued)
February 28, 2018 – (Unaudited)
NOTE 3. SECURITIES VALUATION AND FAIR VALUE MEASUREMENTS – continued
Valuation Committee, based on recommendations from a pricing committee comprised of various officers of the Trust, various employees of the Funds’ administrator, and representatives of the Adviser (together the “Pricing Review Committee”). These securities will be classified as Level 2 or 3 within the fair value hierarchy, depending on the inputs used.
In accordance with the Trust’s Valuation Procedures, the Pricing Review Committee in making its recommendations are required to consider all appropriate factors relevant to the value of securities for which it has determined other pricing sources are not available or reliable as described above. No single standard exists for determining fair value, because fair value depends upon the circumstances of each individual case. As a general principle, the current fair value of an issue of securities being valued pursuant to the Trust’s Fair Valuation Procedures would be the amount which the Funds might reasonably expect to receive for them upon their current sale. Methods which are in accordance with this principle may, for example, be based on (i) a multiple of earnings; (ii) a discount from market prices of a similar freely traded security (including a derivative security or a basket of securities traded on other markets, exchanges or among dealers); or (iii) yield to maturity with respect to debt issues, or a combination of these and other methods. Fair value pricing is permitted if, in accordance with the Trust’s Valuation Procedures, the validity of market quotations appears to be questionable based on factors such as evidence of a thin market in the security based on a small number of quotations, a significant event occurs after the close of a market but before the Fund’s NAV calculation that may affect a security’s value, or other data calls into question the reliability of market quotations.
The following is a summary of the inputs used to value the Funds’ investments as of February 28, 2018:
| | | | | | | | | | | | | | | | |
| | | Valuation Inputs | |
| Growth Equity Fund | | Level 1 | | | Level 2 | | | Level 3 | | | Total | |
Common Stocks | | $ | 24,919,917 | | | $ | – | | | $ | – | | | $ | 24,919,917 | |
Exchange-Traded Funds | | | 1,543,637 | | | | – | | | | – | | | | 1,543,637 | |
Money Market Funds | | | 425,361 | | | | – | | | | – | | | | 425,361 | |
Total | | $ | 26,888,915 | | | $ | – | | | $ | – | | | $ | 26,888,915 | |
Value Equity Fund | | | | | | | | | | | | | | | | |
Common Stocks | | $ | 15,368,707 | | | $ | – | | | $ | – | | | $ | 15,368,707 | |
Exchange-Traded Funds | | | 1,016,840 | | | | – | | | | – | | | | 1,016,840 | |
Money Market Funds | | | 736,751 | | | | – | | | | – | | | | 736,751 | |
Total | | $ | 17,122,298 | | | $ | – | | | $ | – | | | $ | 17,122,298 | |
Yield-Focus Equity Fund | | | | | | | | | | | | | | | | |
Common Stocks | | $ | 24,523,277 | | | $ | – | | | $ | – | | | $ | 24,523,277 | |
Convertible Preferred Stocks | | | 2,458,286 | | | | – | | | | – | | | | 2,458,286 | |
Money Market Funds | | | 269,354 | | | | – | | | | – | | | | 269,354 | |
Total | | $ | 27,250,917 | | | $ | – | | | $ | – | | | $ | 27,250,917 | |
31
MERITAGE FUNDS
NOTES TO THE FINANCIAL STATEMENTS – (continued)
February 28, 2018 – (Unaudited)
NOTE 3. SECURITIES VALUATION AND FAIR VALUE MEASUREMENTS – continued
The Funds did not hold any investments at the end of the reporting period in which significant unobservable inputs were used in determining fair value; therefore, no reconciliation of Level 3 securities is included for this reporting period. The Funds did not hold any derivative instruments during the reporting period.
The Trust recognizes transfers between fair value hierarchy levels at the end of the reporting period. There were no transfers between any levels as of February 28, 2018 based on input levels assigned as August 31, 2017.
NOTE 4. FEES AND OTHER TRANSACTIONS WITH AFFILIATES
Under the terms of the management agreement, on behalf of the Funds (the “Agreement”), the Adviser manages each Fund’s investments subject to oversight of the Board. As compensation for its management services each Fund is obligated to pay the Adviser a fee computed and accrued daily and paid monthly at an annual rate of 0.75% of the average daily net assets of each Fund. For the six months ended February 28, 2018, the Adviser earned fees of $96,661 from the Growth Equity Fund, $63,479 from the Value Equity Fund and $103,024 from the Yield-Focus Equity Fund before the waiver/reimbursements described below. At February 28, 2018, the Growth Equity Fund owed the Adviser $7,777, the Value Equity Fund owed the Adviser $2,729 and the Yield-Focus Fund owed the Adviser $5,708.
The Adviser has contractually agreed to waive its management fee and/or reimburse expenses so that total annual operating expenses (excluding (i) interest; (ii) taxes; (iii) brokerage fees and commissions; (iv) other extraordinary expenses not incurred in the ordinary course of the Fund’s business; (v) dividend expenses on short sales; (vi) expenses incurred under a Rule 12b-1 plan of distribution; and (vii) indirect expenses such as acquired fund fees and expenses) do not exceed 1.00% of each Fund’s average daily net assets through December 31, 2018 (“Expense Limitation”). During any fiscal year that the Investment Advisory Agreement between the Adviser and the Trust is in effect, the Adviser may recoup the sum of all fees previously waived or expenses reimbursed for a period of 36 months following the month during which such fee waiver or expense reimbursement was made, less any reimbursement previously paid, if such recoupment can be achieved within the Expense Limitation as well as any expense limitation in effect at the time the reimbursement is made. This expense cap agreement may be terminated by the Board at any time.
As of February 28, 2018, the Adviser may seek repayment of investment advisory fee waivers and expense reimbursements up to the amounts of $296,609, $267,286 and $518,167 from the Growth Equity Fund, Value Equity Fund and Yield-Focus Equity Fund, respectively, no later than February 28, 2021.
The Trust retains Ultimus Asset Services, LLC (the “Administrator”) to provide the Funds with non-investment related administration and compliance, fund accounting and transfer agent services. For the six months ended February 28, 2018, fees incurred for administration, fund accounting and transfer agent services, and the amounts due to the Administrator at February 28, 2018 were as follows:
| | | | | | | | | | | | |
| | | Growth
Equity Fund | | | Value Equity
Fund | | | Yield-Focus
Equity Fund | |
Administration | | $ | 20,086 | | | $ | 13,280 | | | $ | 22,424 | |
Fund Accounting | | | 13,390 | | | | 8,853 | | | | 14,949 | |
Transfer Agent | | | 10,712 | | | | 7,083 | | | | 11,959 | |
Payable to Administrator | | | 5,826 | | | | 4,356 | | | | 8,944 | |
32
MERITAGE FUNDS
NOTES TO THE FINANCIAL STATEMENTS – (continued)
February 28, 2018 – (Unaudited)
NOTE 4. FEES AND OTHER TRANSACTIONS WITH AFFILIATES – continued
The Board supervises the business activities of the Trust. Each Trustee serves as a Trustee for the lifetime of the Trust or until the earlier of his or her retirement as a Trustee at age 75, death, resignation or is removed. “Independent Trustees,” which means that they are not “interested persons” as defined in the 1940 Act of the Trust each receives annual compensation of $15,000 from the Trust. Each Committee Chairperson receives an additional annual compensation of $1,000 from the Trust. Independent Trustees also receive $1,000 for attending each special in-person meeting. In addition, the Trust reimburses Trustees for out-of-pocket expense incurred in conjunction with attendance at meetings.
The officers and one Trustee of the Trust are employees of the Administrator. Unified Financial Securities, LLC (the “Distributor”) acts as the principal distributor of the Funds’ shares. Both the Administrator and the Distributor operate as wholly-owned subsidiaries of Ultimus Fund Solutions, LLC.
The Funds have adopted a Distribution Plan (the “Plan”) pursuant to Rule 12b-1 under the 1940 Act. The Plan provides that the Funds will pay the Distributor and/or any registered securities dealer, financial institution or any other person (the “Recipient”) a fee of 0.25% of the average daily net assets of each Fund’s Investor Shares in connection with the promotion and distribution of each Fund’s Investor Shares or the provision of personal services to shareholders, including, but not necessarily limited to, advertising, compensation to underwriters, dealers and selling personnel, the printing and mailing of prospectuses to other than current shareholders of Investor Shares, the printing and mailing of sales literature and servicing shareholder accounts (“12b-1 Expense”). The Funds or Distributor may pay all or a portion of these fees to any Recipient who renders assistance in distributing or promoting the sale of shares, or who provides certain shareholder services, pursuant to a written agreement. The Plan is a compensation plan, which means that compensation is provided regardless of 12b-1 expenses actually incurred. For the six months ended February 28, 2018, Investor Shares 12b-1 expense incurred by the Growth Equity Fund was $356 and $843 for the Yield-Focus Equity Fund. At February 28, 2018, the Distributor was owed $121 by the Growth Equity Fund and $281 for the Yield Focus Equity Fund for Investor Shares 12b-1 expenses.
NOTE 5. PURCHASES AND SALES OF SECURITIES
For the six months ended February 28, 2018, purchases and sales of investment securities, excluding short-term securities were as follows:
| | | | | | | | |
Fund | | Purchases | | | Sales | |
Growth Equity Fund | | $ | 9,097,933 | | | $ | 7,806,371 | |
Value Equity Fund | | | 6,811,505 | | | | 7,018,355 | |
Yield-Focus Equity Fund | | | 8,473,600 | | | | 8,327,630 | |
There were no purchases or sales of long-term U.S. government obligations during the six months ended February 28, 2018.
NOTE 6. BENEFICIAL OWNERSHIP
The beneficial ownership, either directly or indirectly, of 25% or more of the voting securities of a fund creates a presumption of control of a fund, under Section 2(a)(9) of the Investment Company Act of 1940. At February 28, 2018, National Financial Services LLC (“NFS”) and Charles Schwab & Co. Inc. (“Schwab”) owned, as record shareholder, 51.36% and 44.24%, respectively, of the outstanding shares of the Growth Equity Fund. At
33
MERITAGE FUNDS
NOTES TO THE FINANCIAL STATEMENTS – (continued)
February 28, 2018 – (Unaudited)
NOTE 6. BENEFICIAL OWNERSHIP – continued
February 28, 2018, NFS and Schwab owned, as record shareholder, 51.54% and 45.33%, respectively, of the outstanding shares of the Value Equity Fund. At February 28, 2018, NFS and Schwab owned, as record shareholder, 60.41% and 30.42%, respectively, of the outstanding shares of the Yield-Focus Equity Fund. It is not known whether NFS, Schwab or any of the underlying beneficial owners owned or controlled 25% or more of the voting securities of the Funds.
NOTE 7. FEDERAL TAX INFORMATION
At February 28, 2018, the net unrealized appreciation (depreciation) of investments for tax purposes was as follows:
| | | | | | | | | | | | | | | | |
| | | Tax Cost of
Securities | | | Gross
Unrealized
Appreciation | | | Gross
Unrealized
Depreciation | | | Net Unrealized
Appreciation | |
Growth Equity Fund | | | 19,990,774 | | | | 6,968,605 | | | | (70,464 | ) | | | 6,898,141 | |
Value Equity Fund | | | 13,968,255 | | | | 3,335,585 | | | | (181,543 | ) | | | 3,154,042 | |
Yield-Focus Equity Fund | | | 24,646,953 | | | | 3,463,087 | | | | (859,123 | ) | | | 2,603,964 | |
The tax character of distributions paid during the fiscal year ended August 31, 2017 was as follows:
| | | | | | | | | | | | |
| | | Ordinary
Income | | | Net Long-Term
Capital Gains | | | Total
Distributions
Paid | |
Growth Equity Fund | | $ | 44,491 | | | $ | 172,588 | | | $ | 217,079 | |
Value Equity Fund | | | 115,339 | | | | – | | | | 115,339 | |
Yield-Focus Equity Fund | | | 1,067,872 | | | | – | | | | 1,067,872 | |
At August 31, 2017, the components of distributable earnings (accumulated losses) on a tax basis were as follows:
| | | | | | | | | | | | | | | | | | | | |
| | | Ordinary
Income | | | Undistributed
Long-Term
Capital Gains | | | Accumulated
Capital and
Other Losses | | | Unrealized
Appreciation
(Depreciation) | | | Total
Accumalated
Earnings
(Losses) | |
Growth Equity Fund | | $ | 10,347 | | | $ | 1,614,270 | | | $ | – | | | $ | 4,220,328 | | | $ | 5,844,945 | |
Value Equity Fund | | | 90,491 | | | | – | | | | (453,145 | ) | | | 2,864,836 | | | $ | 2,502,182 | |
Yield-Focus Equity Fund | | | 126,541 | | | | – | | | | (4,718,284 | ) | | | 2,831,418 | | | $ | (1,760,325 | ) |
The difference between book basis and tax basis unrealized appreciation is primarily attributable to the tax deferral of wash losses, return of capital adjustments, interest accruals on trust preferred securities and mark-to-market of passive foreign investment companies.
As of August 31, 2017, the Value Equity Fund and Yield-Focus Equity Fund, respectively, had available for tax purposes an unused capital loss carryforward of $453,145 and $4,718,284 of short-term capital losses with no expiration, which was available to offset against future taxable net capital gains. To the extent that these carryforwards are used to offset future gains, it is probable that the amount offset will not be distributed to shareholders.
34
MERITAGE FUNDS
NOTES TO THE FINANCIAL STATEMENTS – (continued)
February 28, 2018 – (Unaudited)
NOTE 8. COMMITMENTS AND CONTINGENCIES
The Funds indemnify their officers and trustees for certain liabilities that may arise from the performance of their duties to the Funds. Additionally, in the normal course of business, the Funds enter into contracts that contain a variety of representations and warranties which provide general indemnifications. The Funds’ maximum exposure under these arrangements is unknown, as this would involve future claims that may be made against the Funds that have not yet occurred.
NOTE 9. SUBSEQUENT EVENTS
Management has evaluated events or transactions from February 28, 2018 through the date these financial statements were issued that would merit recognition or disclosure in the financial statements. There were no subsequent events to report that would have a material impact in the Funds’ financial statements.
35
SUMMARY OF FUND EXPENSES – (Unaudited)
As a shareholder of a Fund, you incur ongoing costs, including management fees and other Fund expenses. This Example is intended to help you understand your ongoing costs (in dollars) of investing in the Fund and to compare these costs with the ongoing costs of investing in other mutual funds. The Example is based on an investment of $1,000 invested at the beginning of the period, and held for the entire period from September 1, 2017 to February 28, 2018.
Actual Expenses
The first line of the table below provides information about actual account values and actual expenses. You may use the information in this line, together with the amount you invested, to estimate the expenses that you paid over the period. Simply divide your account value by $1,000 (for example, an $8,600 account value divided by $1,000 = $8.60), then multiply the result by the number in the first line under the heading entitled “Expenses Paid During the Period” to estimate the expenses you paid on your account during this period.
Hypothetical Example for Comparison Purposes
The second line of the table below provides information about hypothetical account values and hypothetical expenses based on the Fund’s actual expense ratio and an assumed rate of return of 5% per year before expenses, which is not the Fund’s actual return. The hypothetical account values and expenses may not be used to estimate the actual ending account balance or expenses you paid for the period. You may use this information to compare the ongoing costs of investing in the Fund and other funds. To do so, compare this 5% hypothetical example with the 5% hypothetical examples that appear in the shareholder reports of the other funds.
Please note that the expenses shown in the table are meant to highlight your ongoing costs only. Therefore, the second line of the table below is useful in comparing ongoing costs only and will not help you determine the relative costs of owning different funds.
| | | | | | | | | | | | | | | | |
| | | Beginning
Account Value
September 1, 2017 | | | Ending
Account Value
February 28, 2018 | | | Expenses Paid
During
Period | | | Annualized
Expense
Ratio | |
Meritage Growth Equity Fund | | | | | | | | | | | | | | | | |
Institutional Class | | | | | | | | | | | | | | | | |
Actual | | $ | 1,000.00 | | | $ | 1,120.60 | | | $ | 5.26 | * | | | 1.00 | % |
Hypothetical** | | $ | 1,000.00 | | | $ | 1,019.84 | | | $ | 5.01 | | | | 1.00 | % |
Investor Class | | | | | | | | | | | | | | | | |
Actual | | $ | 1,000.00 | | | $ | 1,118.70 | | | $ | 6.57 | * | | | 1.25 | % |
Hypothetical** | | $ | 1,000.00 | | | $ | 1,018.60 | | | $ | 6.26 | | | | 1.25 | % |
Meritage Value Equity Fund | | | | | | | | | | | | | | | | |
Institutional Class | | | | | | | | | | | | | | | | |
Actual | | $ | 1,000.00 | | | $ | 1,056.90 | | | $ | 5.10 | * | | | 1.00 | % |
Hypothetical** | | $ | 1,000.00 | | | $ | 1,019.84 | | | $ | 5.01 | | | | 1.00 | % |
Meritage Yield-Focus Fund | | | | | | | | | | | | | | | | |
Institutional Class | | | | | | | | | | | | | | | | |
Actual | | $ | 1,000.00 | | | $ | 1,041.30 | | | $ | 5.06 | * | | | 1.00 | % |
Hypothetical** | | $ | 1,000.00 | | | $ | 1,019.84 | | | $ | 5.01 | | | | 1.00 | % |
Investor Class | | | | | | | | | | | | | | | | |
Actual | | $ | 1,000.00 | | | $ | 1,039.70 | | | $ | 6.32 | * | | | 1.25 | % |
Hypothetical** | | $ | 1,000.00 | | | $ | 1,018.60 | | | $ | 6.26 | | | | 1.25 | % |
| * | Expenses are equal to the Fund’s annualized expense ratio multiplied by the average account value over the period, multiplied by 181/365. |
| ** | Assumes 5% return before expenses. |
36
MANAGEMENT AGREEMENT RENEWAL – (Unaudited)
At a quarterly meeting of the Board of Trustees of Capitol Series Trust (“Trust”) on September 21, 2017, the Trust’s Board of Trustees (“Board”), including all of the Trustees who are not “interested persons” of the Trust (“Independent Trustees”) as that term is defined in Section 2(a)(19) of the Investment Company Act of 1940, as amended (the “1940 Act”), considered and approved the renewal of the Investment Advisory Agreement between the Trust and Meritage Portfolio Management, Inc. (“Meritage”) for an additional one-year period (the “Investment Advisory Agreement”), regarding the Meritage Growth Equity Fund, Meritage Value Equity Fund, and Meritage Yield-Focus Equity Fund (each a “Fund” and together the “Funds”). Each Fund is a series of the Trust.
Prior to the meeting, the Trustees received and considered information from Meritage and the Trust’s administrator designed to provide the Trustees with the information necessary to evaluate the terms of the proposed renewal of the Investment Advisory Agreement between the Trust and Meritage, including, but not limited to: Meritage’s response to counsel’s due diligence letter and Meritage’s supplemental response to counsel’s supplemental requests, each requesting information relevant to renewal of the Investment Advisory Agreement; the operating expense limitation agreement currently in effect between Meritage and each of the Funds (the “Expense Limitation Agreement”); and Morningstar expense and performance data for comparative purposes (the “Support Materials”). The Trustees reviewed the Support Materials at various times with Meritage, Trust management, and counsel to the Independent Trustees. The Trustees noted the completeness of the Support Materials provided by Meritage, which included responses and materials to supplemental requests. This information, together with the information provided to and reviewed by the Board throughout the course of the prior four years, formed the primary, but not exclusive, basis for the Board’s determinations. Before voting to approve the renewal of the Investment Advisory Agreement, the Trustees reviewed the terms and the form of Investment Advisory Agreement and the Support Materials with Trust management and with counsel to the Independent Trustees. The Trustees received and discussed a memorandum from such counsel delineating the legal standards governing their consideration of the renewal of the Investment Advisory Agreement, which memorandum described the various factors that the U.S. Securities and Exchange Commission (“SEC”) and U.S. Courts over the years have suggested would be appropriate for trustee consideration, including the factors outlined in Gartenberg v. Merrill Lynch Asset Management Inc., 694 F.2d 923, 928 (2d Cir. 1982); cert. denied sub. nom. and Andre v. Merrill Lynch Ready Assets Trust, Inc., 461 U.S. 906 (1983). Representatives from Meritage also provided additional information to the Trustees regarding its services to the Funds as part of the Support Materials, including but not limited to, information regarding its investment philosophy, the firm’s compliance culture, staffing and compensation, trading practices, liability insurance, resources available to service the Funds, financial statements, Fund expenses subsidized by Meritage, Meritage’s profitability with respect to each of the Funds, Meritage’s future plans with regard to the Funds and other benefits that Meritage derived from its relationship with the Funds, among other topics.
After having received and reviewed the Support Materials, as well as quarterly investment performance, compliance, operating, and distribution reports on the Funds over an extended time period, the Trustees discussed the facts and factors relevant to the continuation of the Investment Advisory Agreement, which incorporated and reflected their knowledge of Meritage’s services to the Funds. Taking such information into account, the Board considered whether the overall arrangements between the Trust and Meritage as set forth in the Investment Advisory Agreement, including the investment advisory fees that each Fund pays to Meritage, continue to be fair and reasonable in light of the services Meritage performs, as well as such other matters as the Trustees considered relevant in the exercise of their reasonable business judgment.
In determining whether to approve the renewal of the Investment Advisory Agreement, the Trustees considered all factors they believed relevant with respect to each Fund, including the following: (1) the nature, extent, and quality of the services to be provided by Meritage; (2) the cost of the services to be provided and the profits to be realized by Meritage from services rendered to the Trust and each Fund; (3) comparative fee and expense data for
37
MANAGEMENT AGREEMENT RENEWAL – (Unaudited) (continued)
each Fund and other investment companies with similar investment objectives, as well other accounts that Meritage advises; (4) the extent to which economies of scale would be realized as each Fund grows and whether the proposed advisory fee for each Fund, and the Funds together, reflects these economies of scale for each Fund’s benefit; and (5) other financial benefits to Meritage resulting from services to be rendered to the Funds. The material factors and conclusions that formed the basis of the Trustees’ determination to approve the continuation of the Investment Advisory Agreement are summarized below. In their deliberations, the Trustees did not identify any particular information that was all-important or controlling.
Nature, Extent and Quality of Services Provided. The Trustees considered the scope of services that Meritage provides under the Investment Advisory Agreement, noting that such services include but are not limited to the following: (1) investing each Fund’s assets consistent with the Fund’s investment objective and investment policies; (2) determining the portfolio securities to be purchased, sold or otherwise disposed of and the timing of such transactions; (3) voting all proxies with respect to each Fund’s portfolio securities; (4) maintaining the required books and records for transactions that Meritage effects on behalf of the Funds; (5) selecting broker-dealers to execute orders on behalf of the Funds; and (6) marketing services. The Trustees considered Meritage’s capitalization and its assets under management, noting the Fund’s high retention rates and an increase in total assets under management. The Trustees further considered the investment philosophy and experience of the portfolio managers, and noted the lead portfolio manager’s experience managing assets using investment philosophies similar to that employed for the Funds. The Trustees also noted each Fund’s performance compared to its respective benchmark. The Trustees considered that each Fund both underperformed and outperformed its benchmark for certain periods since the respective Fund’s inception. The Trustees also considered each Fund’s performance compared to its respective Morningstar peer group category. They noted that the Meritage Growth Fund is outperforming the average and median of its peer group for the one- and three-year periods ended August 31, 2017, and both the Meritage Value Fund and Meritage Yield-Focus Fund are underperforming the average and median of their respective peer group for the same one- and three-year periods. The Trustees also noted Meritage’s investment in internal resources and systems to promote growth in the firm and the Funds, including new hires and an investment in cloud-based technology systems to streamline and improve the client experience. The Trustees discussed the growth of assets of the Meritage Funds over time, as well as Meritage’s efforts to improve the Meritage Yield-Focus Fund’s performance. The Trustees further noted that it is difficult to make meaningful comparisons with short-term results. The Trustees concluded that they are satisfied with the nature, extent and quality of services that Meritage provides to the Funds under the Investment Advisory Agreement.
Cost of Advisory Services and Profitability. The Trustees considered the annual management fee that the Funds pay to Meritage under the Investment Advisory Agreement, as well as Meritage’s profitability from the services that it rendered to the Funds. In that regard, the Trustees noted that Meritage subsidizes the costs of all distribution services rendered to the Funds which exceed the amounts payable by the Funds under their Rule 12b-1 Distribution Plan. They also noted that Meritage has additional responsibilities with respect to the Funds, including compliance, reporting and operational responsibilities. The Trustees considered that Meritage has contractually agreed to reduce its management fees and, if necessary, reimburse the Funds for operating expenses, as specified in each Fund’s prospectus. The Trustees noted that while the firm is profitable, Meritage is not yet realizing any profits as a result of its advisory services to the Funds.
Comparative Fee and Expense Data. The Trustees noted that the Meritage Growth Fund’s management fee was in line with the average and median gross management fee reported for its peer group. The Trustees noted that both the Meritage Value Fund’s and Meritage Yield-Focus Fund’s contractual management fees were slightly above the average and median gross management fee reported for its respective peer group. The Trustees then noted that the Meritage Growth Fund’s gross and net total expense ratios (reflected with and without waivers and expense reimbursements) were below the average and median gross and net total expense ratios reported for its
38
MANAGEMENT AGREEMENT RENEWAL – (Unaudited) (continued)
peer group, and that the Meritage Value Fund’s and Meritage Yield-Focus Fund’s gross and net total expense ratios (reflected with and without waivers and expense reimbursements) were either at or below the average and median gross and net total expense ratios reported for its respective peer group. The Trustees also noted that the peer group comparisons included in the Support Materials were based upon funds with net asset levels similar to each Fund and considered the appropriateness of this comparison. They further considered the fees paid by Meritage’s separately managed accounts and the significant and distinct differences in the services provided to these accounts and the Meritage Funds. The Board also noted that the Funds and separately managed accounts differ in retention expectations, economics and market forces, which were contributors to the difference in fees. While recognizing that it is difficult to compare advisory fees because the scope of advisory services provided may vary from one investment vehicle to another and investment adviser to another, the Trustees concluded that Meritage’s advisory fee continues to be reasonable.
Economies of Scale. The Trustees considered whether the Funds may benefit from any economies of scale, but did not find that any material economies exist at this time. In addition, the Trustees reviewed comparable fee information to analyze whether economies of scale are already reflected in the advisory fee structure.
Other Benefits. The Trustees considered the extent to which Meritage utilizes soft dollar arrangements with respect to portfolio transactions, and noted that Meritage does utilize brokers with whom it has soft dollar relationships to execute the Funds’ portfolio transactions. The Trustees also noted that while Meritage does utilize soft dollar arrangements consistent with the Section 28(e) safe harbor in connection with the execution of client transactions, affiliated brokers are not utilized to execute the portfolio transactions of any of the Funds. The Trustees noted Meritage’s strong compliance culture and its successful efforts over the course of the previous two years in negotiating lower brokerage commission rates for the Funds. The Trustees further noted their continued review of and discussions with Meritage regarding the use of soft dollars and the soft dollar allocations with respect to the Funds. While the Trustees noted that Rule 12b-1 fees may be paid to Meritage as compensation for shareholder and distribution services performed on behalf of the Funds, the Trustees also observed that the distribution expenses that Meritage incurred continue to exceed any Rule 12b-1 payments from the Funds. The Trustees concluded that all things considered, Meritage does not receive material additional financial benefits from services rendered to the Funds.
39
| | |
| | |
FACTS | | WHAT DOES CAPITOL SERIES TRUST DO WITH YOUR PERSONAL INFORMATION? |
| | |
| | |
Why? | | Financial companies choose how they share your personal information. Federal law gives consumers the right to limit some but not all sharing. Federal law also requires us to tell you how we collect, share, and protect your personal information. Please read this notice carefully to understand what we do. |
| | |
| | |
What? | | The types of personal information we collect and share depend on the product or service you have with us. This information can include: ◾ Social Security number ◾ account balances and account transactions ◾ account transactions, transaction or loss history and purchase history ◾ checking account information and wire transfer instructions When you are no longer our customer, we continue to share your information as described in this notice. |
| | |
How? | | All financial companies need to share customers’ personal information to run their everyday business. In the section below, we list the reasons financial companies can share their customers’ personal information; the reasons Capitol Series Trust chooses to share; and whether you can limit this sharing. |
| | |
Reasons we can share your personal information | | Does Capitol Series
Trust share? |
For our everyday business purposes – such as to process your transactions, maintain your account(s), respond to court orders and legal investigations, or report to credit bureaus | | Yes |
For our marketing purposes – to offer our products and services to you | | Yes |
For joint marketing with other financial companies | | No |
For our affiliates’ everyday business purposes – information about your transactions and experiences | | No |
For our affiliates’ everyday business purposes – information about your creditworthiness | | No |
For nonaffiliates to market to you | | No |
| | |
Questions? | | Call 1-855-261-0104 |
40
| | |
| Who we are | | |
Who is providing this notice? | | Capitol Series Trust |
What we do | | |
How does Capitol Series Trust protect my personal information? | | To protect your personal information from unauthorized access and use, we use security measures that comply with federal law. These measures include computer safeguards and secured files and buildings. |
| How does Capitol Series Trust collect my personal information? | | We collect your personal information, for example, when you • open an account or deposit money ◾ buy securities from us or sell securities to us ◾ make deposits or withdrawals from your account provide account information ◾ give us your account information ◾ make a wire transfer ◾ tell us who receives the money ◾ tell us where to send the money ◾ show your government-issued ID ◾ show your driver’s license |
| Why can’t I limit all sharing? | | Federal law gives you the right to limit only • sharing for affiliates’ everyday business purposes – information about your creditworthiness ◾ affiliates from using your information to market to you ◾ sharing for nonaffiliates to market to you State laws and individual companies may give you additional rights to limit sharing. |
| | |
| Definitions | | |
| | |
| Affiliates | | Companies related by common ownership or control. They can be financial and nonfinancial companies. |
| | |
| Nonaffiliates | | Companies not related by common ownership or control. They can be financial and nonfinancial companies. ◾ Capitol Series Trust does not share your personal information with nonaffiliates so they can market to you. |
| | |
| Joint marketing | | A formal agreement between nonaffiliated financial companies that together market financial products or services to you. • Capitol Series Trust doesn’t jointly market financial products or services to you. |
41
PROXY VOTING – (Unaudited)
A description of the policies and procedures that the Funds use to determine how to vote proxies relating to portfolio securities and information regarding how each Fund voted those proxies during the most recent twelve month period ended June 30, is available without charge upon request by (1) calling the Funds at (855) 261-0104 and (2) from Funds documents filed with the Securities and Exchange Commission (“SEC”) on the SEC’s website at www.sec.gov.
TRUSTEES
Walter B. Grimm, Chairman
Robert G. Dorsey
Mary M. Morrow
OFFICERS
Dina Tantra, Chief Executive Officer and President
Zachary P. Richmond, Treasurer and Chief Financial Officer
Brandon Kipp, Chief Compliance Officer
INVESTMENT ADVISER
Meritage Portfolio Management, Inc.
7500 College Boulevard, Suite 1212
Overland Park, KS 66210
DISTRIBUTOR
Unified Financial Securities, LLC
9465 Counselors Row, Suite 200
Indianapolis, IN 46240
INDEPENDENT REGISTERED PUBLIC ACCOUNTING FIRM
Ernst & Young LLP
800 Yard Street, Suite 200
Grandview Heights, OH 43212
LEGAL COUNSEL
Bernstein Shur
100 Middle Street, 6th Floor
Portland, ME 04104
CUSTODIAN
Huntington National Bank
41 South High Street
Columbus, OH 43215
ADMINISTRATOR, TRANSFER AGENT AND FUND ACCOUNTANT
Ultimus Asset Services, LLC
225 Pictoria Drive, Suite 450
Cincinnati, OH 45246
This report is intended only for the information of shareholders or those who have received the Funds’ prospectus which contains information about the Funds’ management fee and expenses. Please read the prospectus carefully before investing.
Distributed by Unified Financial Securities, LLC
Member FINRA/SIPC
Item 2. Code of Ethics.
Not applicable.
Item 3. Audit Committee Financial Expert.
Not applicable.
Item 4. Principal Accountant Fees and Services.
Not applicable.
Item 5. Audit Committee of Listed Registrants.
Not applicable – applies to listed companies only.
Item 6. Schedule of Investments.
Schedule filed with Item 1.
Item 7. Disclosure of Proxy Voting Policies and Procedures for Closed-End Management Investment Companies.
Not applicable – applies to closed-end funds only.
Item 8. Portfolio Managers of Closed-End Management Investment Companies.
Not applicable – applies to closed-end funds only.
Item 9. Purchases of Equity Securities by Closed-End Management Investment Company and Affiliated Purchasers.
Not applicable – applies to closed-end funds only.
Item 10. Submission of Matters to a Vote of Security Holders.
The guidelines applicable to shareholders desiring to submit recommendations for nominees to the Registrant’s board of trustees are contained in the statement of additional information of the Trust with respect to the Fund(s) for which this Form N-CSR is being filed.
Item 11. Controls and Procedures.
(a) Based on their evaluation of the registrant’s disclosure controls and procedures (as defined in Rule 30a-3(c) under the Investment Company Act of 1940, as amended (the “Act”)) as of a date within 90 days of the filing date of this report, the registrant’s principal executive officer and principal financial officer have concluded that such disclosure controls and procedures are reasonably designed and are operating effectively to ensure that material information relating to the registrant is made known to them by others within those entities, particularly during the period in which this report is being prepared, and that the information required in filings on Form N-CSR is recorded, processed, summarized, and reported on a timely basis.
(b) There were no changes in the registrant’s internal control over financial reporting (as defined in Rule 30a-3(d) under the Investment Company Act of 1940) that occurred during the second fiscal quarter of the period covered by this report that have materially affected, or are reasonably likely to materially affect, the registrant’s internal control over financial reporting.
Item 12. Disclosure of Securities Lending Activities for Closed-End Management Investment Companies.
Not applicable.
Item 13. Exhibits.
(a)(1) Not applicable.
(a)(2) Certifications by the registrant’s principal executive officer and principal financial officer, pursuant to Section 302 of the Sarbanes-Oxley Act of 2002 and required by Rule 30a-2under the Investment Company Act of 1940 are filed herewith.
(a)(3) Not applicable.
(b) Certification pursuant to 18 U.S.C. Section 1350, as adopted pursuant to Section 906 of the Sarbanes-Oxley Act of 2002 is filed herewith.
SIGNATURES
Pursuant to the requirements of the Securities Exchange Act of 1934 and the Investment Company Act of 1940, the registrant has duly caused this report to be signed on its behalf by the undersigned, thereunto duly authorized.
(Registrant) Capitol Series Trust
| | | | |
By (Signature and Title) | | | | /s/ Dina A. Tantra |
| | | | Dina A. Tantra, Chief Executive Officer and President |
Date 4/26/18
Pursuant to the requirements of the Securities Exchange Act of 1934 and the Investment Company Act of 1940, this report has been signed below by the following persons on behalf of the registrant and in the capacities and on the dates indicated.
| | | | |
By (Signature and Title) | | | | /s/ Dina A. Tantra |
| | | | Dina A. Tantra, Chief Executive Officer and President |
Date 4/26/18
| | | | |
By (Signature and Title) | | | | /s/ Zachary P. Richmond |
| | | | Zachary P. Richmond, Treasurer and Chief Financial Officer |
Date 4/26/18