UNITED STATES
SECURITIES AND EXCHANGE COMMISSION
Washington, D.C. 20549
FORM N-CSR
CERTIFIED SHAREHOLDER REPORT OF REGISTERED
MANAGEMENT INVESTMENT COMPANIES
Investment Company Act file number: 811-22895
Capitol Series Trust
(Exact name of registrant as specified in charter)
Ultimus Fund Solutions, LLC
225 Pictoria Drive, Suite 450
Cincinnati, OH 45246
(Address of principal executive offices) (Zip code)
Zachary P. Richmond
Ultimus Fund Solutions, LLC
225 Pictoria Drive, Suite 450
Cincinnati, OH 45246
(Name and address of agent for service)
Registrant’s telephone number, including area code: 513-587-3400
Date of fiscal year end: September 30
Date of reporting period: September 30, 2020
Item 1. Reports to Stockholders.
Fuller & Thaler Behavioral Small-Cap Equity Fund
Fuller & Thaler Behavioral Small-Cap Growth Fund
Fuller & Thaler Behavioral Mid-Cap Value Fund
Fuller & Thaler Behavioral Unconstrained Equity Fund
Fuller & Thaler Behavioral Small-Mid Core Equity Fund
Fuller & Thaler Behavioral Micro-Cap Equity Fund
Annual Report
September 30, 2020
Beginning on January 1, 2021, as permitted by regulations adopted by the Securities and Exchange Commission, paper copies of the Fund’s shareholder reports like this one will no longer be sent by mail, unless you specifically request paper copies of the reports from the Fund or from your financial intermediary such as a broker-dealer or bank. Instead, the reports will be made available on a website, and you will be notified by mail each time a report is posted and provided with a website link to access the report.
If you already elected to receive shareholder reports electronically, you will not be affected by this change and you need not take any action. You may elect to receive shareholder reports and other communications from the Fund electronically by contacting the Fund at (888) 912-4562 or, if you own these shares through a financial intermediary, you may contact your financial intermediary.
You may elect to receive all future reports in paper free of charge. You can inform the Fund that you wish to continue receiving paper copies of your shareholder reports by contacting the Fund at (888) 912-4562. If you own shares through a financial intermediary, you may contact your financial intermediary or follow instructions included with this document to elect to continue to receive paper copies of your shareholder reports. Your election to receive reports in paper will apply to all funds held with the fund complex or at your financial intermediary.

411 Borel Avenue, Suite 300
San Mateo, CA 94402
(888) 912-4562
Fuller & Thaler Funds
Shareholder Letter (Unaudited)
September 30, 2020
Dear Shareholders:
As you may know, Fuller & Thaler’s investment process is based on decades of research into behavioral finance. Our very own Dr. Richard Thaler won the 2017 Nobel Prize® in Economics for his research on behavioral finance. Behavioral finance is the study of how investors actually behave, as opposed to how they should behave, when making investment decisions. Professional investors are human, and like all humans, they make mistakes. Investors make mistakes because they have emotions, use imperfect rules-of thumb, and have priorities beyond risk and return. We look for those mistakes. We predict when other investors – the “market” – have likely made a behavioral mistake, and in turn, have created a buying opportunity.
There are two kinds of mistakes that produce buying opportunities: over-reaction and under reaction. Other investors may over-react to bad news and losses (e.g., panic). Or investors may underreact to good news (e.g., not pay attention). At the individual stock level, we search for events that suggest this type of investor misbehavior. If these behaviors are present, we then analyze fundamentals. In summary, if an investor mistake is likely and the company has solid fundamentals – we buy the stock.
Our value strategies buy when others have likely over-reacted to bad news. Our growth strategies buy when others have likely under-reacted to good news. Our blend strategies combine both insights. We sell the stocks when we believe the over-reaction or under-reaction has gone away.
Our Funds deliver similar risk characteristics to their benchmarks. We believe our behavioral insights provide us with an opportunity to outperform.
Our behavioral process delivers returns primarily through stock selection. In general, we aim to deliver portfolios with similar sector composition and risk characteristics to that of each benchmark, but we will deviate when stock-specific opportunities arise.
For the 12-month period ended September 30, 2020, our Funds performed as follows:
The Institutional Shares of the Fuller & Thaler Behavioral Small-Cap Equity Fund returned -2.11% for the year. The Fund underperformed its U.S. small-cap equity benchmark, the Russell 2000® Index (0.39%) by 2.50% over that period. The strongest performing stocks in the Fund during the period were Horizon Therapeutics PLC, BMC Stock Holdings, Inc., and Deckers Outdoor Corp.; while the weakest performers were MasTec, Inc., J2 Global, Inc., and Fulton Financial Corp. Our focus on downside risk means we tend to outperform during a crisis like Q1 and underperform during a junk/risk rally like Q2 and Q3. In Q3 and Q2, stocks with high levels of debt, high levels of disagreement, and negative earnings significantly outperformed the rest of the market; because we tend to avoid these stocks, we under-performed. In terms of sector allocation, our underweight to Healthcare hurt, while our underweight to Energy helped. In terms of stock selection, we had relatively weak stock selection among the Health Care and Technology sectors, but strong stock selection among Industrials.
The Institutional Shares of the Fuller & Thaler Behavioral Small-Cap Growth Fund returned 29.37% for the year. The Fund outperformed its U.S. small-cap growth benchmark, the Russell 2000® Growth Index (15.71%) by 13.66% over that period. The strongest performing stocks in the Fund during the period were Fastly, Inc., Livongo Health, Inc., and Sarepta Therapeutics, Inc.; while the weakest
1
Fuller & Thaler Funds
Shareholder Letter (Unaudited) (continued)
September 30, 2020
performers were Meritage Homes Corp., Denny’s Corp., and OneMain Holdings, Inc. Stock selection was the largest contributor to returns for the fiscal year with strong selection in the Technology, Health Care, and Consumer Discretionary sectors.
The Institutional Shares of the Fuller & Thaler Behavioral Mid-Cap Value Fund returned -10.51% for the year. The Fund underperformed its U.S. mid-cap value benchmark, the Russell Mid-Cap® Value Index (-7.30%) by 3.21% over that period. The strongest performing stocks in the Fund during the period were Dollar General Corp., Berry Global Group, Inc., and Kansas City Southern; while the weakest performers were First Horizon National Corp., Continental Resources, Inc., and Colony Capital, Inc. In terms of sector allocation, the Fund’s overweight to the Materials sector and underweights to the Real Estate and Energy sectors were the largest contributors to performance. The Fund’s underweight to the Health Care and Communication Services sectors, and overweight to the Financials sector were the largest detractors from performance. The Fund’s overweight to the Banks industry group, which is supported by our behavioral process, was a significant detractor from performance. During the 12-month period ended September 30, 2020, the S&P® Regional Banks Index returned -29.97% and the KBW Bank Index returned -24.25% while the Russell Mid-Cap® Value Index returned -7.30%.
The Institutional Shares of the Fuller & Thaler Behavioral Unconstrained Equity Fund returned 7.09% for the year. The Fund underperformed its U.S. all-cap benchmark, the Russell 3000® Index (15.00%) by 7.91% over that period. The primary driver of underperformance was the Fund’s low exposure to “mega-cap” stocks (those with market capitalizations above $200 billion), which performed strongly relative to other stocks during the period. While this has been a headwind for the strategy returns in the most recent period, we do believe that the companies the strategy is invested in will prove to be superior long-term investments. The strongest performing stocks in the Fund during the period were Generac Holdings, Inc., Tiffany & Co., and eBay, Inc. The weakest performers were Southwest Airlines Co., Cooper-Standard Holdings, Inc., and Allison Transmission Holdings, Inc.
The Institutional Shares of Fuller & Thaler Behavioral Small-Mid Core Equity Fund returned 0.63% for the year. The Fund underperformed its U.S. small-mid cap benchmark, the Russell 2500® Index (2.22%) by 1.59% over that period. A primary driver of underperformance was the Fund’s lack of exposure to a group of technology and health care stocks in the Russell 2500 universe that shared certain characteristics: negative or very low profitability, unusually high valuations, and operating in businesses receiving much positive news coverage during the period, e.g. coronavirus-related treatments and cloud computing. Although such stocks outperformed significantly during the period, our investment methodology’s emphasis on positive free cash flow and profitability deters us from investing in them. Lack of exposure to these stocks can constitute an investment headwind in periods such as the past year, but we believe that over a multi-year time horizon, stocks meeting our investment criteria will prove to be superior longer-term investments. The strongest performing stocks in the Fund during the period were Generac Holdings, Inc., Entegris, Inc., and Synnex Corp. The weakest performers were Cooper-Standard Holdings, Inc., Store Capital Corp., and American Assets Trust, Inc.
2
Fuller & Thaler Funds
Shareholder Letter (Unaudited) (continued)
September 30, 2020
The Institutional Shares of Fuller & Thaler Behavioral Micro-Cap Equity Fund returned -13.88% for the year. The Fund underperformed its U.S. micro-cap benchmark, the Russell MicroCap Index (4.44%) by 18.32% over that period. The strongest performing stocks in the Fund during the period were Matador Resources Co., Owens & Minor, Inc., and Cardlytics, Inc.; while the weakest performers were Exantas Capital Corp., Intrepid Potash, Inc., and NN, Inc. Stock selection in the materials, consumer discretionary and healthcare sectors were the largest contributors to poor performance. The Micro-Cap Fund is greatly impacted by stock selection and sector allocations due to the idiosyncratic characteristics of the asset class. In addition, asset flows in the small cap equity market can have large, disproportional effects on the less liquid micro-cap asset class.
Looking forward, we see many opportunities. We believe that our unique, behaviorally driven investment process will continue to identify these opportunities and allow our Funds to outperform both our peers and our benchmark.
Finally, we thank you for your investments in our Funds.
Nobel Prize® is a trademark of the Nobel Foundation.
3
Investment Results (Unaudited)
Average Annual Total Returns* as of September 30, 2020
| | One Year | Three Year | Five Year | Since
Inception
(9/8/11) | Since
Inception
(12/19/18) |
Fuller & Thaler Behavioral Small-Cap Equity Fund | | |
R6 Shares | -2.02% | 1.16% | 9.07% | 12.41% | |
Institutional Shares | -2.11% | 1.06% | 8.92% | 12.27% | |
Investor Shares | -2.40% | 0.81% | 8.69% | 12.05% | |
A Shares | | | | | |
Without Load | -2.31% | | | | 8.98% |
With Load | -7.93% | | | | 5.41% |
C Shares | | | | | |
Without Load | -2.95% | | | | 8.28% |
With Load | -2.95% | | | | 8.28% |
Russell 2000® Index(a) | 0.39% | 1.77% | 8.00% | 10.46% | 7.99% |
| | R6 Shares | Institutional
Shares | Investor
Shares | A Shares | C Shares |
Expense Ratios(b) | 0.72% | 0.82% | 1.10% | 1.01% | 1.72% |
The performance quoted represents past performance, which does not guarantee future results. The investment return and principal value of an investment will fluctuate so that an investor’s shares, when redeemed, may be worth more or less than their original cost. The returns shown do not reflect the deduction of taxes that a shareholder would pay on Fuller & Thaler Behavioral Small-Cap Equity Fund (the “Small-Cap Equity Fund”) distributions or the redemption of Small-Cap Equity Fund shares. Current performance of the Small-Cap Equity Fund may be lower or higher than the performance quoted. The Small-Cap Equity Fund’s investment objectives, risks, charges and expenses must be considered carefully before investing. Performance data current to the most recent month end may be obtained by calling (888) 912-4562.
* Return figures reflect any change in price per share and assume the reinvestment of all distributions. The Small-Cap Equity Fund’s returns reflect any fee waivers during the applicable periods. If such fee waivers had not occurred, the quoted performance would have been lower. Prior to October 26, 2015, the performance reflected represents that of a series of Allianz Funds Multi-Strategy Trust for which Fuller & Thaler Asset Management, Inc. (the “Adviser”) served as the sole sub-adviser (“the Predecessor Fund”) (see Note 1).
(a) The Russell 2000® Index (“Russell 2000”) is a widely recognized unmanaged index of equity securities and is representative of a broader domestic equity market and range of securities than is found in the Small-Cap Equity Fund’s portfolio. The Russell 2000 measures the performance of the small-cap segment of the U.S. equity universe and is a subset of the Russell 3000® Index. Individuals cannot invest directly in an index; however, an individual can invest in exchange traded funds or other investment vehicles that attempt to track the performance of a benchmark index.
(b) The expense ratios are from the Small-Cap Equity Fund’s most recent prospectus dated January 28, 2020. The Adviser has contractually agreed to waive its management fee and/or reimburse Small-Cap Equity Fund expenses so that total annual operating expenses do not exceed 1.30%, 1.80%, 1.25%, 0.99% and 0.80% for A Shares, C Shares, Investor Shares, Institutional Shares and R6 Shares, respectively, of the average daily net assets for each class through January 31, 2021. The expense limitation does not apply to (i) interest (other than custodial overdraft fees and expenses associated with the Small-Cap Fund’s participation in an alternative liquidity program), (ii) taxes, (iii) brokerage fees and commissions, (iv) other extraordinary expenses not incurred in the ordinary course of the Small-Cap Equity Fund’s business, (v) dividend expense on short sales and (vi) indirect expenses such as acquired fund fees and expenses incurred by the Small-Cap Equity Fund in any fiscal year. During any fiscal year that the Investment
4
Investment Results (Unaudited) (continued)
Advisory Agreement between the Adviser and Capitol Series Trust (the “Trust”) is in effect, the Adviser may recoup the sum of all fees previously waived or expenses reimbursed, less any reimbursement previously paid, provided that the Adviser is only permitted to recoup fees or expenses within 36 months from the date the fee waiver or expense reimbursement occurred and provided further that such recoupment can be achieved within the Expense Limitation Agreement currently in effect and the Expense Limitation Agreement in place when the waiver/reimbursement occurred. The Expense Limitation Agreement may not be terminated by the Adviser prior to its expiration date, but the Board of Trustees of the Trust (the “Board”) may terminate such agreement at any time. The Expense Limitation Agreement shall terminate automatically upon the termination of the Advisory Agreement. Additional information pertaining to the Small-Cap Equity Fund’s expense ratios as of September 30, 2020 can be found in the financial highlights.
Comparison of the Growth of a $1,000,000 Investment in the Fuller & Thaler Behavioral Small-Cap Equity Fund - R6 Shares and the Russell 2000® Index.

The chart above assumes an initial investment of $1,000,000 made on September 8, 2011 (commencement of operations) and held through September 30, 2020. THE SMALL-CAP EQUITY FUND’S RETURNS REPRESENT PAST PERFORMANCE AND DO NOT GUARANTEE FUTURE RESULTS. The returns shown do not reflect deduction of taxes that a shareholder would pay on the Small-Cap Equity Fund’s distributions or the redemption of the Small-Cap Equity Fund’s shares. Investment returns and principal values will fluctuate so that your shares, when redeemed, may be worth more or less than their original purchase price.
Current performance may be lower or higher than the performance data quoted. For more information on the Small-Cap Equity Fund, and to obtain performance data current to the most recent month-end, or to request a prospectus, please call (888) 912-4562. You should carefully consider the investment objectives, potential risks, management fees, and charges and expenses of the Small-Cap Equity Fund before investing. The Small-Cap Equity Fund’s prospectus contains this and other information about the Small-Cap Equity Fund, and should be read carefully before investing.
Prior to October 26, 2015, the performance reflected represents that of a series of the Allianz Funds Multi-Strategy Trust for which the Adviser served as the sole sub-adviser (see Note 1). Visit www.fullerthalerfunds.com for more current performance information.
The Small-Cap Equity Fund is distributed by Ultimus Fund Distributors, LLC, Member FINRA/SIPC.
5
Investment Results (Unaudited) (continued)
Average Annual Total Returns* as of September 30, 2020
| | One Year | Since
Inception
(12/21/17) | Since
Inception
(12/19/18) |
Fuller & Thaler Behavioral Small-Cap Growth Fund | | | |
R6 Shares | 29.41% | 13.06% | |
Institutional Shares | 29.37% | 12.98% | |
Investor Shares | 28.98% | 12.69% | |
A Shares | | | |
Without Load | 28.90% | | 21.79% |
With Load | 21.48% | | 17.79% |
C Shares | | | |
Without Load | 28.31% | | 21.23% |
With Load | 28.31% | | 21.23% |
Russell 2000® Growth Index(a) | 15.71% | 6.94% | 17.91% |
| | Expense Ratios(b) |
| | R6 Shares | Institutional
Shares | Investor
Shares | A Shares | C Shares |
Gross | 2.19% | 2.25% | 2.57% | 2.15% | 2.87% |
With Applicable Waivers | 0.90% | 0.99% | 1.25% | 1.30% | 1.80% |
The performance quoted represents past performance, which does not guarantee future results. The investment return and principal value of an investment will fluctuate so that an investor’s shares, when redeemed, may be worth more or less than their original cost. The returns shown do not reflect the deduction of taxes that a shareholder would pay on Fuller & Thaler Behavioral Small-Cap Growth Fund (the “Small-Cap Growth Fund”) distributions or the redemption of Small-Cap Growth Fund shares. Current performance of the Small-Cap Growth Fund may be lower or higher than the performance quoted. The Small-Cap Growth Fund’s investment objectives, risks, charges and expenses must be considered carefully before investing. Performance data current to the most recent month end may be obtained by calling (888) 912-4562.
* Return figures reflect any change in price per share and assume the reinvestment of all distributions. The Small-Cap Growth Fund’s returns reflect any fee waivers during the applicable periods. If such fee waivers had not occurred, the quoted performance would have been lower.
(a) The Russell 2000® Growth Index (“Russell 2000 Growth”) is a widely recognized unmanaged index of equity securities and is representative of a broader domestic equity market and range of securities than is found in the Small-Cap Growth Fund’s portfolio. Russell 2000 Growth measures the performance of those Russell 2000 companies with higher price/book ratios and higher forecasted growth values. Individuals cannot invest directly in an index; however, an individual can invest in exchange traded funds or other investment vehicles that attempt to track the performance of a benchmark index.
(b) The expense ratios are from the Small-Cap Growth Fund’s most recent prospectus dated January 28, 2020. The Adviser has contractually agreed to waive its management fee and/or reimburse Small-Cap Growth Fund expenses so that total annual operating expenses do not exceed 1.30%, 1.80% 1.25%, 0.99%, and 0.90% for A Shares, C Shares, Investor Shares, Institutional Shares and R6 Shares, respectively, of the average daily net assets for each class through January 31, 2021. The expense limitation does not apply to (i) interest (other than custodial overdraft fees and expenses associated with the Small-Cap Growth Fund’s participation in an alternative liquidity program), (ii) taxes, (iii) brokerage fees and commissions, (iv) other extraordinary expenses not incurred in the ordinary course of the Small-Cap Growth Fund’s business, (v) dividend expense on short sales and (vi) indirect expenses such as acquired fund fees and expenses incurred by the Small-Cap Growth Fund in any fiscal year. During any fiscal year that the
6
Investment Results (Unaudited) (continued)
Investment Advisory Agreement between the Adviser and the Trust is in effect, the Adviser may recoup the sum of all fees previously waived or expenses reimbursed, less any reimbursement previously paid, provided that the Adviser is only permitted to recoup fees or expenses within 36 months from the date the fee waiver or expense reimbursement occurred and provided further that such recoupment can be achieved within the Expense Limitation Agreement currently in effect and the Expense Limitation Agreement in place when the waiver/reimbursement occurred. The Expense Limitation Agreement may not be terminated by the Adviser prior to its expiration date, but the Board may terminate such agreement at any time. The Expense Limitation Agreement shall terminate automatically upon the termination of the Advisory Agreement. Additional information pertaining to the Small-Cap Growth Fund’s expense ratios as of September 30, 2020 can be found in the financial highlights.
Comparison of the Growth of a $1,000,000 Investment in the Fuller & Thaler Behavioral Small-Cap Growth Fund - R6 Shares and the Russell 2000® Growth Index.
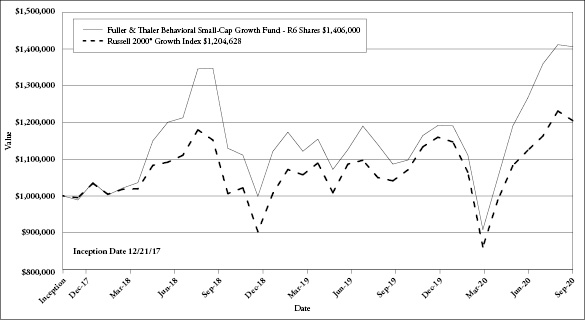
The chart above assumes an initial investment of $1,000,000 made on December 21, 2017 (commencement of operations) and held through September 30, 2020. THE SMALL-CAP GROWTH FUND’S RETURNS REPRESENT PAST PERFORMANCE AND DO NOT GUARANTEE FUTURE RESULTS. The returns shown do not reflect deduction of taxes that a shareholder would pay on the Small-Cap Growth Fund’s distributions or the redemption of the Small-Cap Growth Fund’s shares. Investment returns and principal values will fluctuate so that your shares, when redeemed, may be worth more or less than their original purchase price.
Current performance may be lower or higher than the performance data quoted. For more information on the Small-Cap Growth Fund, and to obtain performance data current to the most recent month-end, or to request a prospectus, please call (888) 912-4562. You should carefully consider the investment objectives, potential risks, management fees, and charges and expenses of the Small-Cap Growth Fund before investing. The Small-Cap Growth Fund’s prospectus contains this and other information about the Small-Cap Growth Fund, and should be read carefully before investing. Visit www.fullerthalerfunds.com for more current performance information.
The Small-Cap Growth Fund is distributed by Ultimus Fund Distributors, LLC, Member FINRA/SIPC.
7
Investment Results (Unaudited) (continued)
Average Annual Total Returns* as of September 30, 2020
| | One Year | Since
Inception
(12/21/17) |
Fuller & Thaler Behavioral Mid-Cap Value Fund | | |
R6 Shares | -10.42% | -1.12% |
Institutional Shares | -10.51% | -1.21% |
Investor Shares | -10.72% | -1.48% |
Russell Midcap® Value Index(a) | -7.30% | -0.93% |
| | Expense Ratios(b) |
| | R6 Shares | Institutional
Shares | Investor
Shares |
Gross | 1.72% | 1.81% | 2.10% |
With Applicable Waivers | 0.80% | 0.90% | 1.15% |
The performance quoted represents past performance, which does not guarantee future results. The investment return and principal value of an investment will fluctuate so that an investor’s shares, when redeemed, may be worth more or less than their original cost. The returns shown do not reflect the deduction of taxes that a shareholder would pay on Fuller & Thaler Behavioral Mid-Cap Value Fund (the “Mid-Cap Value Fund”) distributions or the redemption of Mid-Cap Value Fund shares. Current performance of the Mid-Cap Value Fund may be lower or higher than the performance quoted. The Mid-Cap Value Fund’s investment objectives, risks, charges and expenses must be considered carefully before investing. Performance data current to the most recent month end may be obtained by calling (888) 912-4562.
* Return figures reflect any change in price per share and assume the reinvestment of all distributions. The Mid-Cap Value Fund’s returns reflect any fee waivers during the applicable periods. If such fee waivers had not occurred, the quoted performance would have been lower.
(a) The Russell Midcap® Value Index (“Russell Midcap Value”) is a widely recognized unmanaged index of equity securities and is representative of a broader domestic equity market and range of securities than is found in the Mid-Cap Value Fund’s portfolio. The Russell Midcap Value measures the performance of those Russell Midcap companies with lower price/book ratios and lower forecasted growth values. Individuals cannot invest directly in an index; however, an individual can invest in exchange traded funds or other investment vehicles that attempt to track the performance of a benchmark index.
(b) The expense ratios are from the Mid-Cap Value Fund’s most recent prospectus dated January 28, 2020. The Adviser has contractually agreed to waive its management fee and/or reimburse Mid-Cap Value Fund expenses so that total annual operating expenses do not exceed 1.15%, 0.90%, and 0.80% for Investor Shares, Institutional Shares and R6 Shares, respectively, of the average daily net assets for each class through January 31, 2021. The expense limitation does not apply to (i) interest (other than custodial overdraft fees and expenses associated with the Mid-Cap Value Fund’s participation in an alternative liquidity program), (ii) taxes, (iii) brokerage fees and commissions, (iv) other extraordinary expenses not incurred in the ordinary course of the Mid-Cap Value Fund’s business, (v) dividend expense on short sales and (vi) indirect expenses such as acquired fund fees and expenses incurred by the Mid-Cap Value Fund in any fiscal year. During any fiscal year that the Investment Advisory Agreement between the Adviser and the Trust is in effect, the Adviser may recoup the sum of all fees previously waived or expenses reimbursed, less any reimbursement previously paid, provided that the Adviser is only permitted to recoup fees or expenses within 36 months from the date the fee waiver or expense reimbursement occurred and provided further that such recoupment can be achieved within the Expense Limitation Agreement currently in effect and the Expense Limitation Agreement in place when the waiver/reimbursement occurred. This Expense Limitation Agreement may not be terminated by the Adviser prior to its expiration date, but the Board may terminate such agreement at any time. The Expense
8
Investment Results (Unaudited) (continued)
Limitation Agreement shall terminate automatically upon the termination of the Advisory Agreement. Additional information pertaining to the Mid-Cap Value Fund’s expense ratios as of September 30, 2020 can be found in the financial highlights.
Comparison of the Growth of a $1,000,000 Investment in the Fuller & Thaler Behavioral Mid-Cap Value Fund - R6 Shares and the Russell Midcap® Value Index.
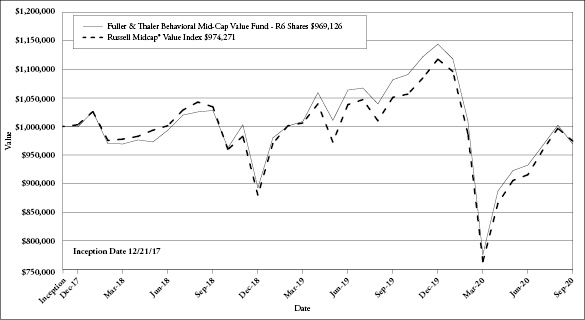
The chart above assumes an initial investment of $1,000,000 made on December 21, 2017 (commencement of operations) and held through September 30, 2020. THE MID-CAP VALUE FUND’S RETURNS REPRESENT PAST PERFORMANCE AND DO NOT GUARANTEE FUTURE RESULTS. The returns shown do not reflect deduction of taxes that a shareholder would pay on the Mid-Cap Value Fund’s distributions or the redemption of the Mid-Cap Value Fund’s shares. Investment returns and principal values will fluctuate so that your shares, when redeemed, may be worth more or less than their original purchase price.
Current performance may be lower or higher than the performance data quoted. For more information on the Mid-Cap Value Fund, and to obtain performance data current to the most recent month-end, or to request a prospectus, please call (888) 912-4562. You should carefully consider the investment objectives, potential risks, management fees, and charges and expenses of the Mid-Cap Value Fund before investing. The Mid-Cap Value Fund’s prospectus contains this and other information about the Mid-Cap Value Fund, and should be read carefully before investing. Visit www.fullerthalerfunds.com for more current performance information.
The Mid-Cap Value Fund is distributed by Ultimus Fund Distributors, LLC, Member FINRA/SIPC.
9
Investment Results (Unaudited) (continued)
Average Annual Total Returns* as of September 30, 2020
| | One Year | Since
Inception
(12/26/18) |
Fuller & Thaler Behavioral Unconstrained Equity Fund | | |
R6 Shares | 7.22% | 20.30% |
Institutional Shares | 7.09% | 20.16% |
Russell 3000® Index(a) | 15.00% | 21.23% |
| | Expense Ratios(b) |
| | R6 Shares | Institutional
Shares |
Gross | 4.33% | 4.39% |
With Applicable Waivers | 0.90% | 0.99% |
The performance quoted represents past performance, which does not guarantee future results. The investment return and principal value of an investment will fluctuate so that an investor’s shares, when redeemed, may be worth more or less than their original cost. The returns shown do not reflect the deduction of taxes that a shareholder would pay on Fuller & Thaler Behavioral Unconstrained Equity Fund (the “Unconstrained Equity Fund”) distributions or the redemption of Unconstrained Equity Fund shares. Current performance of the Unconstrained Equity Fund may be lower or higher than the performance quoted. The Unconstrained Equity Fund’s investment objectives, risks, charges and expenses must be considered carefully before investing. Performance data current to the most recent month end may be obtained by calling (888) 912-4562.
* Return figures reflect any change in price per share and assume the reinvestment of all distributions. The Unconstrained Equity Fund’s returns reflect any fee waivers during the applicable periods. If such fee waivers had not occurred, the quoted performance would have been lower.
(a) The Russell 3000® Index (“Russell 3000”) measures the performance of the broad U.S. equity market. The Russell 3000 represents the 3000 largest U.S. publicly traded companies as measured by market capitalization. Individuals cannot invest directly in an index; however, an individual can invest in exchange traded funds or other investment vehicles that attempt to track the performance of a benchmark index.
(b) The expense ratios are from the Unconstrained Equity Fund’s most recent prospectus dated January 28, 2020. The Adviser has contractually agreed to waive its management fee and/or reimburse Unconstrained Equity Fund expenses so that total annual operating expenses do not exceed 0.99% and 0.90% for Institutional Shares and R6 Shares, respectively, of the average daily net assets for each class through January 31, 2021. The expense limitation does not apply to (i) interest (other than custodial overdraft fees and expenses associated with the Unconstrained Equity Fund’s participation in an alternative liquidity program), (ii) taxes, (iii) brokerage fees and commissions, (iv) other extraordinary expenses not incurred in the ordinary course of the Unconstrained Equity Fund’s business, (v) dividend expense on short sales and (vi) indirect expenses such as acquired fund fees and expenses incurred by the Unconstrained Equity Fund in any fiscal year. During any fiscal year that the Investment Advisory Agreement between the Adviser and the Trust is in effect, the Adviser may recoup the sum of all fees previously waived or expenses reimbursed, less any reimbursement previously paid, provided that the Adviser is only permitted to recoup fees or expenses within 36 months from the date the fee waiver or expense reimbursement occurred and provided further that such recoupment can be achieved within the Expense Limitation Agreement currently in effect and the Expense Limitation Agreement in place when the waiver/reimbursement occurred. This Expense Limitation Agreement may not be terminated by the Adviser prior to its expiration date, but the Board may terminate such agreement at any time. The Expense Limitation Agreement shall terminate automatically upon the termination of the Advisory Agreement. Additional information pertaining to the Unconstrained Equity Fund’s expense ratios as of September 30, 2020 can be found in the financial highlights.
10
Investment Results (Unaudited) (continued)
Comparison of the Growth of a $1,000,000 Investment in the Fuller & Thaler Behavioral Unconstrained Equity Fund - R6 Shares and the Russell 3000® Index.
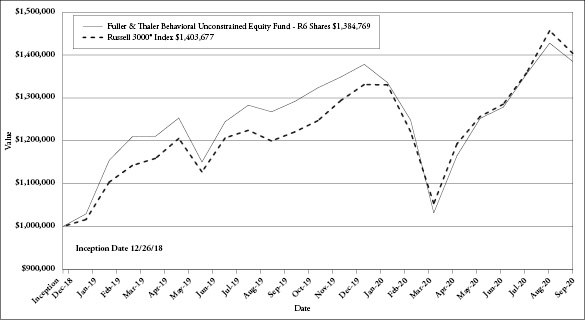
The chart above assumes an initial investment of $1,000,000 made on December 26, 2018 (commencement of operations) and held through September 30, 2020. THE UNCONSTRAINED EQUITY FUND’S RETURNS REPRESENT PAST PERFORMANCE AND DO NOT GUARANTEE FUTURE RESULTS. The returns shown do not reflect deduction of taxes that a shareholder would pay on the Unconstrained Equity Fund’s distributions or the redemption of the Unconstrained Equity Fund’s shares. Investment returns and principal values will fluctuate so that your shares, when redeemed, may be worth more or less than their original purchase price.
Current performance may be lower or higher than the performance data quoted. For more information on the Unconstrained Equity Fund, and to obtain performance data current to the most recent month-end, or to request a prospectus, please call (888) 912-4562. You should carefully consider the investment objectives, potential risks, management fees, and charges and expenses of the Unconstrained Equity Fund before investing. The Unconstrained Equity Fund’s prospectus contains this and other information about the Unconstrained Equity Fund, and should be read carefully before investing. Visit www.fullerthalerfunds.com for more current performance information.
The Unconstrained Equity Fund is distributed by Ultimus Fund Distributors, LLC, Member FINRA/SIPC.
11
Investment Results (Unaudited) (continued)
Average Annual Total Returns* as of September 30, 2020
| | One Year | Since
Inception
(12/26/18) |
Fuller & Thaler Behavioral Small-Mid Core Equity Fund | | |
Institutional Shares | 0.63% | 11.19% |
Russell 2500® Index(a) | 2.22% | 12.08% |
| | Expense
Ratios(b) |
| | Institutional
Shares |
Gross | 6.27% |
With Applicable Waivers | 0.95% |
The performance quoted represents past performance, which does not guarantee future results. The investment return and principal value of an investment will fluctuate so that an investor’s shares, when redeemed, may be worth more or less than their original cost. The returns shown do not reflect the deduction of taxes that a shareholder would pay on Fuller & Thaler Behavioral Small-Mid Core Equity Fund (the “Small-Mid Core Equity Fund”) distributions or the redemption of Small-Mid Core Equity Fund shares. Current performance of the Small-Mid Core Equity Fund may be lower or higher than the performance quoted. The Small-Mid Core Equity Fund’s investment objectives, risks, charges and expenses must be considered carefully before investing. Performance data current to the most recent month end may be obtained by calling (888) 912-4562.
* Return figures reflect any change in price per share and assume the reinvestment of all distributions. The Small-Mid Core Equity Fund’s returns reflect any fee waivers during the applicable periods. If such fee waivers had not occurred, the quoted performance would have been lower.
(a) The Russell 2500® Index (“Russell 2500”) is a widely recognized unmanaged index of equity securities and is representative of a broader domestic equity market and range of securities than is found in the Small-Mid Core Equity Fund’s portfolio. The Russell 2500 measures the performance of those Russell 2500 companies with lower price/book ratios and lower forecasted growth values. Individuals cannot invest directly in an index; however, an individual can invest in exchange traded funds or other investment vehicles that attempt to track the performance of a benchmark index.
(b) The expense ratios are from the Small-Mid Core Equity Fund’s most recent prospectus dated January 28, 2020. The Adviser has contractually agreed to waive its management fee and/or reimburse Small-Mid Core Equity Fund expenses so that total annual operating expenses do not exceed 0.95% of the Small-Mid Core Equity Fund’s Institutional Shares average daily net assets through January 31, 2021. The expense limitation does not apply to (i) interest (other than custodial overdraft fees and expenses associated with the Small-Mid Core Equity Fund’s participation in an alternative liquidity program), (ii) taxes, (iii) brokerage fees and commissions, (iv) other extraordinary expenses not incurred in the ordinary course of the Small-Mid Core Equity Fund’s business, (v) dividend expense on short sales and (vi) indirect expenses such as acquired fund fees and expenses incurred by the Small-Mid Core Equity Fund in any fiscal year. During any fiscal year that the Investment Advisory Agreement between the Adviser and the Trust is in effect, the Adviser may recoup the sum of all fees previously waived or expenses reimbursed, less any reimbursement previously paid, provided that the Adviser is only permitted to recoup fees or expenses within 36 months from the date the fee waiver or expense reimbursement occurred and provided further that such recoupment can be achieved within the Expense Limitation Agreement currently in effect and the Expense Limitation Agreement in place when the waiver/reimbursement occurred. This Expense Limitation Agreement may not be terminated by the Adviser prior to its expiration date, but the Board may terminate such agreement at
12
Investment Results (Unaudited) (continued)
any time. The Expense Limitation Agreement shall terminate automatically upon the termination of the Advisory Agreement. Additional information pertaining to the Small-Mid Core Equity Fund’s expense ratios as of September 30, 2020 can be found in the financial highlights.
Comparison of the Growth of a $100,000 Investment in the Fuller & Thaler Behavioral Small-Mid Core Equity Fund - Institutional Shares and the Russell 2500® Index.
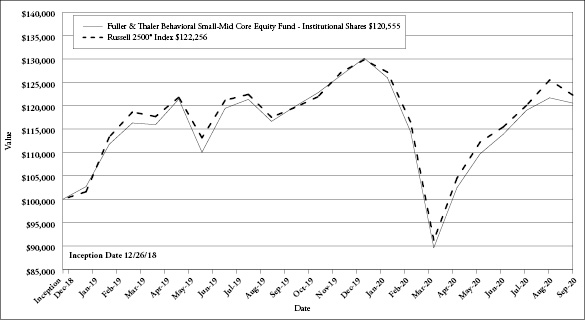
The chart above assumes an initial investment of $100,000 made on December 26, 2018 (commencement of operations) and held through September 30, 2020. THE SMALL-MID CORE EQUITY FUND’S RETURNS REPRESENT PAST PERFORMANCE AND DO NOT GUARANTEE FUTURE RESULTS. The returns shown do not reflect deduction of taxes that a shareholder would pay on the Small-Mid Core Equity Fund’s distributions or the redemption of the Small-Mid Core Equity Fund’s shares. Investment returns and principal values will fluctuate so that your shares, when redeemed, may be worth more or less than their original purchase price.
Current performance may be lower or higher than the performance data quoted. For more information on the Small-Mid Core Equity Fund, and to obtain performance data current to the most recent month-end, or to request a prospectus, please call (888) 912-4562. You should carefully consider the investment objectives, potential risks, management fees, and charges and expenses of the Small-Mid Core Equity Fund before investing. The Small-Mid Core Equity Fund’s prospectus contains this and other information about the Small-Mid Core Equity Fund, and should be read carefully before investing. Visit www.fullerthalerfunds.com for more current performance information.
The Small-Mid Core Equity Fund is distributed by Ultimus Fund Distributors, LLC, Member FINRA/SIPC.
13
Investment Results (Unaudited) (continued)
Average Annual Total Returns* as of September 30, 2020
| | One Year | Since
Inception
(12/28/18) |
Fuller & Thaler Behavioral Micro-Cap Equity Fund | | |
Institutional Shares | -13.88% | -3.79% |
Russell Microcap® Index(a) | 4.44% | 7.54% |
| | Expense
Ratios(b) |
| | Institutional
Shares |
Gross | 5.28% |
With Applicable Waivers | 1.75% |
The performance quoted represents past performance, which does not guarantee future results. The investment return and principal value of an investment will fluctuate so that an investor’s shares, when redeemed, may be worth more or less than their original cost. The returns shown do not reflect the deduction of taxes that a shareholder would pay on Fuller & Thaler Behavioral Micro-Cap Equity Fund (the “Micro-Cap Equity Fund”) distributions or the redemption of Micro-Cap Equity Fund shares. Current performance of the Micro-Cap Equity Fund may be lower or higher than the performance quoted. The Micro-Cap Equity Fund’s investment objectives, risks, charges and expenses must be considered carefully before investing. Performance data current to the most recent month end may be obtained by calling (888) 912-4562.
* Return figures reflect any change in price per share and assume the reinvestment of all distributions. The Micro-Cap Equity Fund’s returns reflect any fee waivers during the applicable periods. If such fee waivers had not occurred, the quoted performance would have been lower.
(a) The Russell Microcap® Index (“Russell Microcap”) measures the performance of the microcap segment of the U.S. equity market. Russell Microcap stocks make up less than 3% of the U.S. equity market (by market cap) and consist of the smallest 1,000 securities in the small cap Russell 2000® Index, plus the next smallest eligible securities by market cap. Individuals cannot invest directly in an index; however, an individual can invest in exchange traded funds or other investment vehicles that attempt to track the performance of a benchmark index.
(b) The expense ratios are from the Micro-Cap Equity Fund’s most recent prospectus dated January 28, 2020. The Adviser has contractually agreed to waive its management fee and/or reimburse Micro-Cap Equity Fund expenses so that total annual operating expenses do not exceed 1.75% of the Micro-Cap Equity Fund’s Institutional Shares average daily net assets through January 31, 2021. The expense limitation does not apply to (i) interest (other than custodial overdraft fees and expenses associated with the Micro-Cap Equity Fund’s participation in an alternative liquidity program), (ii) taxes, (iii) brokerage fees and commissions, (iv) other extraordinary expenses not incurred in the ordinary course of the Micro-Cap Equity Fund’s business, (v) dividend expense on short sales and (vi) indirect expenses such as acquired fund fees and expenses incurred by the Micro-Cap Equity Fund in any fiscal year. During any fiscal year that the Investment Advisory Agreement between the Adviser and the Trust is in effect, the Adviser may recoup the sum of all fees previously waived or expenses reimbursed, less any reimbursement previously paid, provided that the Adviser is only permitted to recoup fees or expenses within 36 months from the date the fee waiver or expense reimbursement occurred and provided further that such recoupment can be achieved within the Expense Limitation Agreement currently in effect and the Expense Limitation Agreement in place when the waiver/reimbursement occurred. This Expense Limitation Agreement may not be terminated by the Adviser prior to its expiration date, but the Board may terminate such agreement at any time. The Expense Limitation Agreement shall terminate automatically upon the termination of the Advisory Agreement. Additional information pertaining to the Micro-Cap Equity Fund’s expense ratios as of September 30, 2020 can be found in the financial highlights.
14
Investment Results (Unaudited) (continued)
Comparison of the Growth of a $100,000 Investment in the Fuller & Thaler Behavioral Micro-Cap Equity Fund - Institutional Shares and the Russell Microcap® Index.
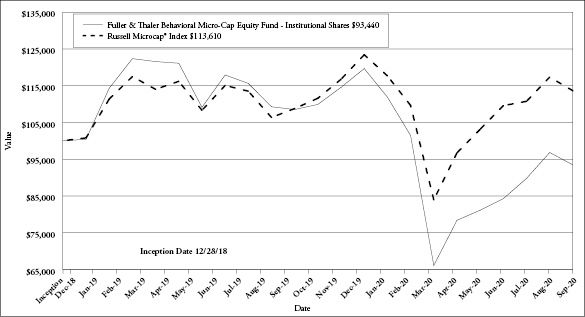
The chart above assumes an initial investment of $100,000 made on December 28, 2018 (commencement of operations) and held through September 30, 2020. THE MICRO-CAP EQUITY FUND’S RETURNS REPRESENT PAST PERFORMANCE AND DO NOT GUARANTEE FUTURE RESULTS. The returns shown do not reflect deduction of taxes that a shareholder would pay on the Micro-Cap Equity Fund’s distributions or the redemption of the Micro-Cap Equity Fund’s shares. Investment returns and principal values will fluctuate so that your shares, when redeemed, may be worth more or less than their original purchase price.
Current performance may be lower or higher than the performance data quoted. For more information on the Micro-Cap Equity Fund, and to obtain performance data current to the most recent month-end, or to request a prospectus, please call (888) 912-4562. You should carefully consider the investment objectives, potential risks, management fees, and charges and expenses of the Micro-Cap Equity Fund before investing. The Micro-Cap Equity Fund’s prospectus contains this and other information about the Micro-Cap Equity Fund, and should be read carefully before investing. Visit www.fullerthalerfunds.com for more current performance information.
The Micro-Cap Equity Fund is distributed by Ultimus Fund Distributors, LLC, Member FINRA/SIPC.
15
Portfolio Illustration (Unaudited)
September 30, 2020
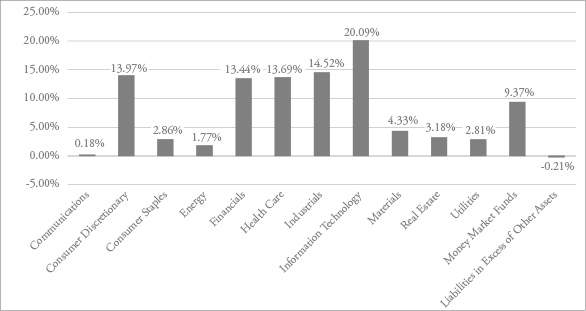
Fuller & Thaler Behavioral Small-Cap Equity Fund Sector Holdings as of September 30, 2020.*
Fuller & Thaler Behavioral Small-Cap Growth Fund Sector Holdings as of September 30, 2020.*
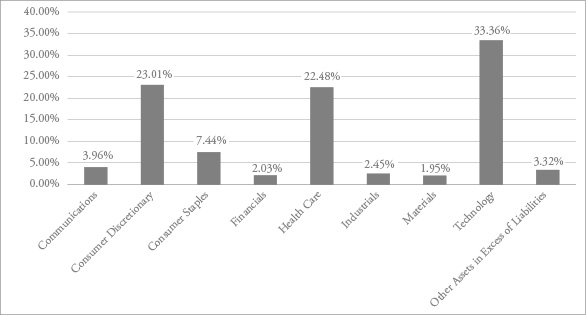
* | As a percentage of net assets. |
16
Portfolio Illustration (Unaudited)
September 30, 2020
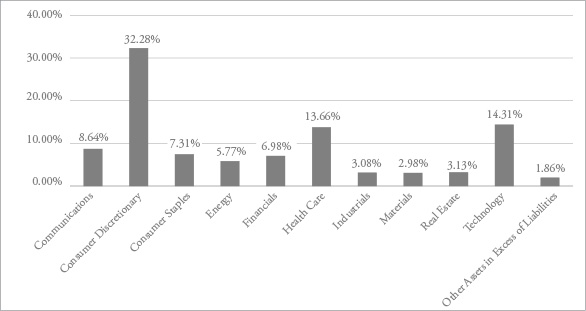
Fuller & Thaler Behavioral Mid-Cap Value Fund Sector Holdings as of September 30, 2020.*

Fuller & Thaler Behavioral Unconstrained Equity Fund Sector Holdings as of September 30, 2020.*
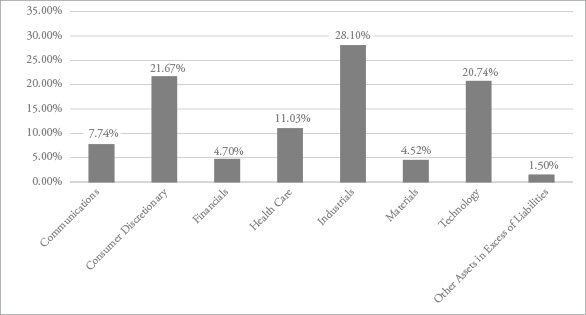
* | As a percentage of net assets. |
17
Portfolio Illustration (Unaudited)
September 30, 2020
Fuller & Thaler Behavioral Small-Mid Core Equity Fund Sector Holdings as of September 30, 2020.*

Fuller & Thaler Behavioral Micro-Cap Equity Fund Sector Holdings as of September 30, 2020.*
* | As a percentage of net assets. |
Availability of Portfolio Schedules (Unaudited)
The Funds file their complete schedule of portfolio holdings with the Securities and Exchange Commission (“SEC”) for the first and third quarters of each fiscal year as an exhibit to its reports on Form N-PORT. The Funds’ Form N-PORT reports are available on the SEC’s website at http://www.sec.gov.
18
Fuller & Thaler Behavioral Small-Cap Equity Fund
Schedule of Investments
September 30, 2020
| | Shares | | | Fair Value | |
COMMON STOCKS — 90.82% |
| | | | | | | | | |
Apparel & Textile Products — 2.33% |
Deckers Outdoor Corp.(a) | | | 300,888 | | | $ | 66,198,369 | |
| | | | | | | | | |
Asset Management — 1.08% |
Blucora, Inc.(a) | | | 542,619 | | | | 5,111,471 | |
Federated Hermes, Inc., Class B | | | 1,192,468 | | | | 25,649,987 | |
| | | | | | | | 30,761,458 | |
Banking — 6.29% |
BancorpSouth Bank | | | 791,346 | | | | 15,336,285 | |
Bank of Hawaii Corp. | | | 652,380 | | | | 32,958,239 | |
F.N.B. Corporation | | | 4,573,005 | | | | 31,004,974 | |
Farmers National Banc Corp. | | | 110,390 | | | | 1,205,459 | |
Financial Institutions, Inc. | | | 160,041 | | | | 2,464,631 | |
First Citizens BancShares, Inc., Class A | | | 94,721 | | | | 30,195,160 | |
First Commonwealth Financial Corp. | | | 270,607 | | | | 2,094,498 | |
First Financial Corp. | | | 102,689 | | | | 3,224,435 | |
Fulton Financial Corp. | | | 2,306,015 | | | | 21,515,120 | |
Lakeland Bancorp, Inc. | | | 130,396 | | | | 1,297,440 | |
Lakeland Financial Corp. | | | 276,545 | | | | 11,393,654 | |
Peapack-Gladstone Financial Corp. | | | 118,861 | | | | 1,800,744 | |
TowneBank | | | 170,398 | | | | 2,794,527 | |
TriState Capital Holdings, Inc.(a) | | | 802,242 | | | | 10,621,684 | |
Washington Federal, Inc. | | | 523,500 | | | | 10,920,210 | |
| | | | | | | | 178,827,060 | |
Biotech & Pharmaceuticals — 1.94% |
Amphastar Pharmaceuticals, Inc.(a) | | | 767,678 | | | | 14,393,963 | |
Emergent BioSolutions, Inc.(a) | | | 180,778 | | | | 18,679,791 | |
Horizon Therapeutics PLC(a) | | | 37,829 | | | | 2,938,557 | |
Supernus Pharmaceuticals, Inc.(a) | | | 919,768 | | | | 19,167,964 | |
| | | | | | | | 55,180,275 | |
Chemicals — 1.14% |
Avient Corp. | | | 425,670 | | | | 11,263,228 | |
Stepan Co. | | | 67,642 | | | | 7,372,978 | |
Valvoline, Inc. | | | 725,000 | | | | 13,804,000 | |
| | | | | | | | 32,440,206 | |
Commercial Support Services — 2.37% |
Clean Harbors, Inc.(a) | | | 66,852 | | | $ | 3,745,718 | |
CRA International, Inc. | | | 55,031 | | | | 2,062,012 | |
Deluxe Corp. | | | 647,360 | | | | 16,656,573 | |
FTI Consulting, Inc.(a) | | | 157,244 | | | | 16,663,146 | |
H&R Block, Inc. | | | 1,362,400 | | | | 22,193,495 | |
Kforce, Inc. | | | 129,133 | | | | 4,154,209 | |
SP Plus Corp.(a) | | | 107,551 | | | | 1,930,540 | |
| | | | | | | | 67,405,693 | |
Construction Materials — 1.50% |
MDU Resources Group, Inc. | | | 1,899,259 | | | | 42,733,328 | |
| | | | | | | | | |
Consumer Services — 4.25% |
Adtalem Global Education, Inc.(a) | | | 706,892 | | | | 17,347,130 | |
K12, Inc.(a) | | | 636,996 | | | | 16,778,475 | |
Perdoceo Education Corp.(a) | | | 2,644,765 | | | | 32,371,924 | |
Rent-A-Center, Inc. | | | 1,827,128 | | | | 54,612,855 | |
| | | | | | | | 121,110,384 | |
Electric Utilities — 1.47% |
Otter Tail Corp. | | | 322,312 | | | | 11,658,025 | |
Portland General Electric Co. | | | 850,821 | | | | 30,204,146 | |
| | | | | | | | 41,862,171 | |
Electrical Equipment — 0.09% |
Generac Holdings, Inc.(a) | | | 13,878 | | | | 2,687,336 | |
| | | | | | | | | |
Engineering & Construction — 8.11% |
Comfort Systems USA, Inc. | | | 851,024 | | | | 43,836,246 | |
EMCOR Group, Inc. | | | 1,206,317 | | | | 81,679,725 | |
MasTec, Inc.(a) | | | 1,548,237 | | | | 65,335,601 | |
Primoris Services Corp. | | | 612,937 | | | | 11,057,383 | |
Quanta Services, Inc. | | | 307,200 | | | | 16,238,592 | |
TopBuild Corp.(a) | | | 72,921 | | | | 12,446,885 | |
| | | | | | | | 230,594,432 | |
Food — 0.29% |
Simply Good Foods Co.(The)(a) | | | 376,287 | | | | 8,297,128 | |
| | | | | | | | | |
Gas & Water Utilities — 1.35% |
ONE Gas, Inc. | | | 259,383 | | | | 17,900,021 | |
Southwest Gas Corp. | | | 322,503 | | | | 20,349,939 | |
| | | | | | | | 38,249,960 | |
| | See accompanying notes which are an integral part of these financial statements. | 19 |
Fuller & Thaler Behavioral Small-Cap Equity Fund
Schedule of Investments (continued)
September 30, 2020
| | Shares | | | Fair Value | |
COMMON STOCKS — (continued) |
| |
Health Care Facilities & Services — 7.38% |
Amedisys, Inc.(a) | | | 156,613 | | | $ | 37,028,012 | |
Chemed Corp. | | | 24,295 | | | | 11,670,103 | |
Medpace Holdings, Inc.(a) | | | 765,211 | | | | 85,512,329 | |
PRA Health Sciences, Inc.(a) | | | 422,007 | | | | 42,808,390 | |
Select Medical Holdings Corp.(a) | | | 1,244,125 | | | | 25,902,683 | |
Syneos Health, Inc.(a) | | | 128,777 | | | | 6,845,785 | |
| | | | | | | | 209,767,302 | |
Home Construction — 2.08% |
Masonite International Corp.(a) | | | 315,762 | | | | 31,070,981 | |
Meritage Homes Corp.(a) | | | 255,500 | | | | 28,204,645 | |
| | | | | | | | 59,275,626 | |
Household Products — 1.57% |
Helen of Troy Ltd.(a) | | | 230,763 | | | | 44,657,256 | |
| | | | | | | | | |
Industrial Intermediate Products — 0.09% |
Raven Industries, Inc. | | | 117,060 | | | | 2,519,131 | |
| | | | | | | | | |
Industrial Support Services — 1.67% |
Applied Industrial Technologies, Inc. | | | 465,321 | | | | 25,639,187 | |
WESCO International, Inc.(a) | | | 497,694 | | | | 21,908,490 | |
| | | | | | | | 47,547,677 | |
Insurance — 5.48% |
Hanover Insurance Group, Inc. | | | 431,728 | | | | 40,228,415 | |
James River Group Holdings Ltd. | | | 186,815 | | | | 8,318,872 | |
Kemper Corp. | | | 1,301,535 | | | | 86,981,584 | |
Primerica, Inc. | | | 179,308 | | | | 20,286,907 | |
| | | | | | | | 155,815,778 | |
Leisure Facilities & Services — 0.92% |
Extended Stay America, Inc. | | | 2,182,280 | | | | 26,078,246 | |
| | | | | | | | | |
Leisure Products — 0.17% |
Johnson Outdoors, Inc., Class A | | | 57,697 | | | | 4,724,807 | |
| | | | | | | | | |
Medical Equipment & Devices — 4.38% |
Bruker Corp. | | | 1,570,379 | | | $ | 62,422,565 | |
Integer Holdings Corp.(a) | | | 524,916 | | | | 30,975,293 | |
Integra LifeSciences Holdings Corp.(a) | | | 72,219 | | | | 3,410,181 | |
Lantheus Holdings, Inc.(a) | | | 708,877 | | | | 8,981,472 | |
Meridian Bioscience, Inc.(a) | | | 1,104,400 | | | | 18,752,712 | |
| | | | | | | | 124,542,223 | |
Metals & Mining — 0.05% |
Gold Resource Corp. | | | 378,747 | | | | 1,291,527 | |
| | | | | | | | | |
Oil & Gas Producers — 1.77% |
Cimarex Energy Co. | | | 142,342 | | | | 3,463,181 | |
Murphy USA, Inc.(a) | | | 365,182 | | | | 46,841,895 | |
| | | | | | | | 50,305,076 | |
Publishing & Broadcasting — 0.18% |
Sinclair Broadcast Group, Inc., Class A | | | 263,994 | | | | 5,076,605 | |
| | | | | | | | | |
Real Estate — 2.98% |
Apple Hospitality, Inc. | | | 745,140 | | | | 7,160,795 | |
City Office, Inc. | | | 2,062,399 | | | | 15,509,241 | |
Columbia Property Trust, Inc. | | | 1,175,492 | | | | 12,824,618 | |
Industrial Logistics Properties Trust | | | 572,376 | | | | 12,517,863 | |
Monmouth Real Estate Investment Corp. | | | 227,867 | | | | 3,155,958 | |
Office Properties Income Trust | | | 469,109 | | | | 9,719,938 | |
OUTFRONT Media, Inc. | | | 175,194 | | | | 2,549,073 | |
Piedmont Office Realty Trust, Inc., Class A | | | 1,131,237 | | | | 15,350,886 | |
Sunstone Hotel Investors, Inc. | | | 733,137 | | | | 5,821,108 | |
| | | | | | | | 84,609,480 | |
Real Estate Services — 0.20% |
Marcus & Millichap, Inc.(a) | | | 150,405 | | | | 4,139,146 | |
RMR Group, Inc. (The), Class A | | | 60,515 | | | | 1,662,347 | |
| | | | | | | | 5,801,493 | |
20 | See accompanying notes which are an integral part of these financial statements. | |
Fuller & Thaler Behavioral Small-Cap Equity Fund
Schedule of Investments (continued)
September 30, 2020
| | Shares | | | Fair Value | |
COMMON STOCKS — (continued) |
| |
Retail - Discretionary — 4.20% |
BMC Stock Holdings, Inc.(a) | | | 2,071,553 | | | $ | 88,724,615 | |
MarineMax, Inc.(a) | | | 167,496 | | | | 4,299,622 | |
Qurate Retail, Inc., Series A | | | 226,721 | | | | 1,627,857 | |
Sleep Number Corp.(a) | | | 507,016 | | | | 24,798,153 | |
| | | | | | | | 119,450,247 | |
Semiconductors — 2.40% |
Amkor Technology, Inc.(a) | | | 5,417,992 | | | | 60,681,510 | |
FormFactor, Inc.(a) | | | 306,144 | | | | 7,632,170 | |
| | | | | | | | 68,313,680 | |
Software — 3.71% |
j2 Global, Inc.(a) | | | 1,114,021 | | | | 77,112,534 | |
Progress Software Corp. | | | 776,372 | | | | 28,477,325 | |
| | | | | | | | 105,589,859 | |
Specialty Finance — 0.58% |
Federal Agricultural Mortgage Corp., Class C | | | 35,652 | | | | 2,269,606 | |
Stewart Information Services Corp. | | | 326,819 | | | | 14,291,795 | |
| | | | | | | | 16,561,401 | |
Steel — 1.64% |
Commercial Metals Co. | | | 1,925,350 | | | | 38,468,493 | |
Worthington Industries, Inc. | | | 200,374 | | | | 8,171,252 | |
| | | | | | | | 46,639,745 | |
Technology Hardware — 8.95% |
Avnet, Inc. | | | 760,122 | | | | 19,641,552 | |
Jabil, Inc. | | | 2,700,538 | | | | 92,520,431 | |
NETGEAR, Inc.(a) | | | 424,946 | | | | 13,096,836 | |
Sanmina Corp.(a) | | | 1,750,651 | | | | 47,355,110 | |
SYNNEX Corp. | | | 559,220 | | | | 78,324,353 | |
Vishay Precision Group, Inc.(a) | | | 153,257 | | | | 3,880,467 | |
| | | | | | | | 254,818,749 | |
Technology Services — 5.02% |
CoreLogic, Inc. | | | 56,800 | | | | 3,843,656 | |
CSG Systems International, Inc. | | | 1,100,204 | | | | 45,053,354 | |
EVERTEC, Inc. | | | 1,754,233 | | | | 60,889,426 | |
Technology Services — (continued) |
Insight Enterprises, Inc.(a) | | | 69,826 | | | $ | 3,950,755 | |
Perspecta, Inc. | | | 872,928 | | | | 16,978,450 | |
Science Applications International Corp. | | | 152,037 | | | | 11,922,742 | |
| | | | | | | | 142,638,383 | |
Transportation & Logistics — 2.19% |
Costamare, Inc. | | | 782,924 | | | | 4,752,349 | |
Hub Group, Inc., Class A(a) | | | 182,700 | | | | 9,170,627 | |
Landstar System, Inc. | | | 384,775 | | | | 48,285,414 | |
| | | | | | | | 62,208,390 | |
Wholesale - Consumer Staples — 1.00% |
Core-Mark Holding Co., Inc. | | | 978,578 | | | | 28,310,262 | |
| | | | | | | | | |
Total Common Stocks (Cost $2,464,612,703) | | | | | | | 2,582,890,743 | |
| | | | | | | | | |
PREFERRED STOCKS — 0.02% |
Retail - Discretionary — 0.02% |
Qurate Retail, Inc., 8.00% | | | 6,802 | | | | 669,961 | |
| | | | | | | | | |
Total Preferred Stocks (Cost $395,726) | | | | | | | 669,961 | |
| | | | | | | | | |
MONEY MARKET FUNDS — 9.37% |
Fidelity Investments Money Market Government Portfolio, Institutional Class, 0.03%(b) | | | 266,343,352 | | | | 266,343,352 | |
| | | | | | | | | |
Total Money Market Funds (Cost $266,343,352) | | | | | | | 266,343,352 | |
Total Investments — 100.21% (Cost $2,731,351,781) | | | 2,849,904,056 | |
Liabilities in Excess of Other Assets — (0.21)% | | | | | | | (6,071,941 | ) |
NET ASSETS — 100.00% | | $ | 2,843,832,115 | |
(a) | Non-income producing security. |
(b) | Rate disclosed is the seven day effective yield as of September 30, 2020. |
| | See accompanying notes which are an integral part of these financial statements. | 21 |
Fuller & Thaler Behavioral Small-Cap Growth Fund
Schedule of Investments
September 30, 2020
| | Shares | | | Fair Value | |
COMMON STOCKS — 96.68% |
| | | | | | | | | |
Apparel & Textile Products — 6.41% |
Crocs, Inc.(a) | | | 30,300 | | | $ | 1,294,719 | |
Hanesbrands, Inc. | | | 74,225 | | | | 1,169,044 | |
Kontoor Brands, Inc. | | | 54,000 | | | | 1,306,799 | |
| | | | | | | | 3,770,562 | |
Asset Management — 2.03% |
Kennedy-Wilson Holdings, Inc. | | | 82,309 | | | | 1,195,127 | |
| | | | | | | | | |
Biotech & Pharmaceuticals — 6.19% |
Guardant Health, Inc.(a) | | | 11,445 | | | | 1,279,322 | |
Halozyme Therapeutics, Inc.(a) | | | 45,925 | | | | 1,206,909 | |
Sarepta Therapeutics, Inc.(a) | | | 8,200 | | | | 1,151,526 | |
| | | | | | | | 3,637,757 | |
Consumer Services — 3.60% |
Aaron’s, Inc. | | | 20,350 | | | | 1,152,828 | |
Chegg, Inc.(a) | | | 13,475 | | | | 962,654 | |
| | | | | | | | 2,115,482 | |
E-Commerce Discretionary — 1.84% |
Etsy, Inc.(a) | | | 8,880 | | | | 1,080,074 | |
| | | | | | | | | |
Entertainment Content — 1.66% |
Zynga, Inc., Class A(a) | | | 107,215 | | | | 977,801 | |
| | | | | | | | | |
Food — 2.08% |
Darling Ingredients, Inc.(a) | | | 34,075 | | | | 1,227,722 | |
| | | | | | | | | |
Forestry, Paper & Wood Products — 1.94% |
Trex Co., Inc.(a) | | | 15,900 | | | | 1,138,440 | |
| | | | | | | | | |
Health Care Facilities & Services — 2.00% |
Amedisys, Inc.(a) | | | 4,970 | | | | 1,175,057 | |
| | | | | | | | | |
Household Products — 1.78% |
Helen of Troy Ltd.(a) | | | 5,400 | | | | 1,045,008 | |
| | | | | | | | | |
Internet Media & Services — 2.30% |
Stamps.com, Inc.(a) | | | 5,600 | | | | 1,349,320 | |
| | | | | | | | | |
Leisure Facilities & Services — 5.07% |
Jack in the Box, Inc. | | | 13,275 | | | $ | 1,052,840 | |
Penn National Gaming, Inc.(a) | | | 26,475 | | | | 1,924,733 | |
| | | | | | | | 2,977,573 | |
Leisure Products — 3.07% |
Axon Enterprise, Inc.(a) | | | 10,765 | | | | 976,386 | |
Fox Factory Holding Corp.(a) | | | 11,125 | | | | 826,921 | |
| | | | | | | | 1,803,307 | |
Life Sciences Tools & Services — 2.00% |
Repligen Corp.(a) | | | 7,950 | | | | 1,172,943 | |
| | | | | | | | | |
Medical Equipment & Devices — 12.29% |
Cardiovascular Systems, Inc.(a) | | | 28,700 | | | | 1,129,345 | |
Globus Medical, Inc., Class A(a) | | | 20,745 | | | | 1,027,292 | |
Merit Medical Systems, Inc.(a) | | | 25,600 | | | | 1,113,600 | |
Natera, Inc.(a) | | | 21,015 | | | | 1,518,124 | |
Nevro Corp.(a) | | | 8,490 | | | | 1,182,657 | |
Tandem Diabetes Care, Inc.(a) | | | 11,050 | | | | 1,254,175 | |
| | | | | | | | 7,225,193 | |
Retail - Consumer Staples — 2.07% |
Big Lots, Inc. | | | 27,275 | | | | 1,216,465 | |
| | | | | | | | | |
Retail - Discretionary — 3.02% |
RH(a) | | | 2,955 | | | | 1,130,642 | |
Urban Outfitters, Inc.(a) | | | 30,900 | | | | 643,029 | |
| | | | | | | | 1,773,671 | |
Semiconductors — 4.90% |
Inphi Corp.(a) | | | 8,660 | | | | 972,085 | |
MACOM Technology Solutions Holdings, Inc.(a) | | | 29,580 | | | | 1,006,016 | |
Rambus, Inc.(a) | | | 65,905 | | | | 902,239 | |
| | | | | | | | 2,880,340 | |
22 | See accompanying notes which are an integral part of these financial statements. | |
Fuller & Thaler Behavioral Small-Cap Growth Fund
Schedule of Investments (continued)
September 30, 2020
| | Shares | | | Fair Value | |
COMMON STOCKS — (continued) |
| |
Software — 21.77% |
Avaya Holdings Corp.(a) | | | 56,525 | | | $ | 859,180 | |
Bandwidth, Inc., Class A(a) | | | 7,400 | | | | 1,291,818 | |
Box, Inc., Class A(a) | | | 54,405 | | | | 944,471 | |
Calix, Inc.(a) | | | 44,755 | | | | 795,744 | |
Evolent Health, Inc., Class A(a) | | | 96,625 | | | | 1,199,116 | |
FireEye, Inc.(a) | | | 70,175 | | | | 866,310 | |
Five9, Inc.(a) | | | 9,425 | | | | 1,222,234 | |
j2 Global, Inc.(a) | | | 16,700 | | | | 1,155,974 | |
LivePerson, Inc.(a) | | | 20,750 | | | | 1,078,793 | |
Model N,Inc.(a) | | | 22,117 | | | | 780,288 | |
Sailpoint Technologies Holdings, Inc.(a) | | | 36,375 | | | | 1,439,358 | |
Tenable Holdings, Inc.(a) | | | 30,575 | | | | 1,154,206 | |
| | | | | | | | 12,787,492 | |
Technology Hardware — 4.47% |
Digital Turbine, Inc.(a) | | | 52,661 | | | | 1,724,121 | |
NETGEAR, Inc.(a) | | | 29,350 | | | | 904,567 | |
| | | | | | | | 2,628,688 | |
Technology Services — 2.23% |
Green Dot Corp., Class A(a) | | | 25,850 | | | | 1,308,269 | |
| | | | | | | | | |
Transportation Equipment — 2.45% |
Navistar International Corp.(a) | | | 33,000 | | | | 1,436,820 | |
| | | | | | | | | |
Wholesale - Consumer Staples — 1.51% |
Grocery Outlet Holding Corp.(a) | | | 22,500 | | | | 884,700 | |
| | | | | | | | | |
Total Common Stocks/Investments — 96.68% (Cost $46,384,036) | | | | | | | 56,807,811 | |
Other Assets in Excess of Liabilities — 3.32% | | | | | | | 1,953,132 | |
NET ASSETS — 100.00% | | | | | | $ | 58,760,943 | |
(a) | Non-income producing security. |
| | See accompanying notes which are an integral part of these financial statements. | 23 |
Fuller & Thaler Behavioral Mid-Cap Value Fund
Schedule of Investments
September 30, 2020
| | Shares | | | Fair Value | |
COMMON STOCKS — 99.74% |
| | | | | | | | | |
Aerospace & Defense — 1.81% |
Howmet Aerospace, Inc.(a) | | | 38,140 | | | $ | 637,701 | |
| | | | | | | | | |
Banking — 13.99% |
CIT Group, Inc. | | | 16,310 | | | | 288,850 | |
Commerce Bancshares, Inc. | | | 9,744 | | | | 548,490 | |
East West Bancorp, Inc. | | | 23,460 | | | | 768,080 | |
First Horizon National Corp. | | | 79,440 | | | | 749,119 | |
KeyCorp | | | 73,465 | | | | 876,438 | |
M&T Bank Corp. | | | 4,730 | | | | 435,586 | |
TCF Financial Corp. | | | 25,252 | | | | 589,887 | |
Wells Fargo & Co. | | | 28,355 | | | | 666,626 | |
| | | | | | | | 4,923,076 | |
Chemicals — 5.31% |
Celanese Corp. | | | 6,060 | | | | 651,146 | |
Sherwin-Williams Co. (The) | | | 840 | | | | 585,262 | |
WR Grace & Co. | | | 15,650 | | | | 630,539 | |
| | | | | | | | 1,866,947 | |
Commercial Support Services — 6.59% |
Aramark | | | 38,285 | | | | 1,012,638 | |
Brink’s Co. (The) | | | 15,535 | | | | 638,333 | |
Republic Services, Inc. | | | 7,185 | | | | 670,720 | |
| | | | | | | | 2,321,691 | |
Containers & Packaging — 10.88% |
Berry Plastics Group, Inc.(a) | | | 21,595 | | | | 1,043,471 | |
Crown Holdings, Inc.(a) | | | 11,170 | | | | 858,526 | |
Graphic Packaging Holding Co. | | | 65,805 | | | | 927,192 | |
WestRock Co. | | | 28,835 | | | | 1,001,728 | |
| | | | | | | | 3,830,917 | |
Electric Utilities — 4.34% |
Alliant Energy Corp. | | | 8,275 | | | | 427,404 | |
CMS Energy Corp. | | | 5,725 | | | | 351,572 | |
Edison International | | | 6,160 | | | | 313,174 | |
Pinnacle West Capital Corp. | | | 5,860 | | | | 436,863 | |
| | | | | | | | 1,529,013 | |
Electrical Equipment — 4.37% |
AMETEK, Inc. | | | 5,120 | | | | 508,928 | |
Johnson Controls International PLC | | | 15,875 | | | | 648,493 | |
Roper Technologies, Inc. | | | 960 | | | | 379,306 | |
| | | | | | | | 1,536,727 | |
Food — 2.10% |
Ingredion, Inc. | | | 6,045 | | | $ | 457,486 | |
J.M. Smucker Co. (The) | | | 2,435 | | | | 281,291 | |
| | | | | | | | 738,777 | |
Health Care Facilities & Services — 3.84% |
Centene Corp.(a) | | | 6,040 | | | | 352,313 | |
Henry Schein, Inc.(a) | | | 6,810 | | | | 400,292 | |
Laboratory Corp. of America Holdings(a) | | | 3,180 | | | | 598,699 | |
| | | | | | | | 1,351,304 | |
Home & Office Products — 2.92% |
Newell Brands, Inc. | | | 36,286 | | | | 622,668 | |
Whirlpool Corp. | | | 2,205 | | | | 405,477 | |
| | | | | | | | 1,028,145 | |
Home Construction — 1.11% |
Mohawk Industries, Inc.(a) | | | 4,005 | | | | 390,848 | |
| | | | | | | | | |
Industrial Support Services — 2.58% |
AMERCO | | | 1,140 | | | | 405,817 | |
HD Supply Holdings, Inc.(a) | | | 12,180 | | | | 502,303 | |
| | | | | | | | 908,120 | |
Insurance — 4.47% |
Assured Guaranty Ltd. | | | 9,725 | | | | 208,893 | |
Everest Re Group Ltd. | | | 2,645 | | | | 522,494 | |
Globe Life, Inc. | | | 4,670 | | | | 373,133 | |
Markel Corp.(a) | | | 480 | | | | 467,376 | |
| | | | | | | | 1,571,896 | |
Leisure Facilities & Services — 1.23% |
Live Nation Entertainment, Inc.(a) | | | 8,020 | | | | 432,118 | |
| | | | | | | | | |
Machinery — 2.32% |
Donaldson Co., Inc. | | | 8,700 | | | | 403,854 | |
Snap-on, Inc. | | | 2,800 | | | | 411,964 | |
| | | | | | | | 815,818 | |
Metals & Mining — 0.37% |
Arconic Corp.(a) | | | 6,867 | | | | 130,816 | |
| | | | | | | | | |
Oil & Gas Producers — 2.59% |
Cheniere Energy, Inc.(a) | | | 8,250 | | | | 381,727 | |
Continental Resources, Inc. | | | 20,045 | | | | 246,153 | |
Pioneer Natural Resources Co. | | | 3,290 | | | | 282,907 | |
| | | | | | | | 910,787 | |
24 | See accompanying notes which are an integral part of these financial statements. | |
Fuller & Thaler Behavioral Mid-Cap Value Fund
Schedule of Investments (continued)
September 30, 2020
| | Shares | | | Fair Value | |
COMMON STOCKS — (continued) |
| |
Oil & Gas Services & Equipment — 0.59% |
Patterson-UTI Energy, Inc. | | | 73,405 | | | $ | 209,204 | |
| | | | | | | | | |
Real Estate — 6.68% |
Brixmor Property Group, Inc. | | | 51,900 | | | | 606,711 | |
Public Storage | | | 2,065 | | | | 459,917 | |
Retail Properties of America, Inc., Class A | | | 27,775 | | | | 161,373 | |
Simon Property Group, Inc. | | | 9,660 | | | | 624,808 | |
WP Carey, Inc. | | | 7,650 | | | | 498,474 | |
| | | | | | | | 2,351,283 | |
Retail - Consumer Staples — 3.45% |
Dollar General Corp. | | | 2,655 | | | | 556,541 | |
Dollar Tree, Inc.(a) | | | 7,190 | | | | 656,735 | |
| | | | | | | | 1,213,276 | |
Retail - Discretionary — 5.57% |
Advance Auto Parts, Inc. | | | 2,215 | | | | 340,003 | |
CarMax, Inc.(a) | | | 7,320 | | | | 672,781 | |
O’Reilly Automotive, Inc.(a) | | | 2,055 | | | | 947,519 | |
| | | | | | | | 1,960,303 | |
Software — 1.19% |
Verint Systems, Inc.(a) | | | 8,700 | | | | 419,166 | |
| | | | | | | | | |
Specialty Finance — 2.32% |
Synchrony Financial | | | 31,185 | | | $ | 816,111 | |
| | | | | | | | | |
Technology Hardware — 2.21% |
CommScope Holding Co., Inc.(a) | | | 37,345 | | | | 336,105 | |
NCR Corp.(a) | | | 19,875 | | | | 440,033 | |
| | | | | | | | 776,138 | |
Technology Services — 4.14% |
Amdocs Ltd. | | | 9,340 | | | | 536,209 | |
Nielsen Holdings PLC | | | 13,850 | | | | 196,393 | |
Verisk Analytics, Inc. | | | 3,900 | | | | 722,709 | |
| | | | | | | | 1,455,311 | |
Transportation & Logistics — 2.77% |
Kansas City Southern | | | 5,385 | | | | 973,770 | |
| | | | | | | | | |
Total Common Stocks/Investments — 99.74% (Cost $36,097,008) | | | | | | | 35,099,263 | |
Other Assets in Excess of Liabilities — 0.26% | | | | | | | 92,917 | |
NET ASSETS — 100.00% | | | | | | $ | 35,192,180 | |
(a) | Non-income producing security. |
| | See accompanying notes which are an integral part of these financial statements. | 25 |
Fuller & Thaler Behavioral Unconstrained Equity Fund
Schedule of Investments
September 30, 2020
| | Shares | | | Fair Value | |
COMMON STOCKS — 98.50% |
| | | | | | | | | |
Automotive — 1.44% |
Cooper-Standard Holding, Inc.(a) | | | 55,765 | | | $ | 736,656 | |
| | | | | | | | | |
Biotech & Pharmaceuticals — 7.58% |
Amgen, Inc. | | | 7,465 | | | | 1,897,304 | |
Exelixis, Inc.(a) | | | 80,880 | | | | 1,977,516 | |
| | | | | | | | 3,874,820 | |
Chemicals — 4.52% |
Ecolab, Inc. | | | 11,576 | | | | 2,313,348 | |
| | | | | | | | | |
Commercial Support Services — 6.97% |
Cintas Corp. | | | 10,710 | | | | 3,564,609 | |
| | | | | | | | | |
E-Commerce Discretionary — 6.43% |
eBay, Inc. | | | 63,135 | | | | 3,289,334 | |
| | | | | | | | | |
Electrical Equipment — 8.47% |
Generac Holdings, Inc.(a) | | | 22,375 | | | | 4,332,696 | |
| | | | | | | | | |
Internet Media & Services — 3.75% |
VeriSign, Inc.(a) | | | 9,360 | | | | 1,917,396 | |
| | | | | | | | | |
Leisure Facilities & Services — 5.40% |
Yum China Holdings, Inc. | | | 52,105 | | | | 2,758,960 | |
| | | | | | | | | |
Machinery — 4.03% |
Parker-Hannifin Corp. | | | 10,180 | | | | 2,059,821 | |
| | | | | | | | | |
Medical Equipment & Devices — 3.45% |
Waters Corp.(a) | | | 9,025 | | | | 1,766,012 | |
| | | | | | | | | |
Publishing & Broadcasting — 3.99% |
Liberty Media Corp.-Liberty Sirius XM, Class C(a) | | | 61,666 | | | | 2,039,911 | |
| | | | | | | | | |
Retail - Discretionary — 8.40% |
O’Reilly Automotive, Inc.(a) | | | 4,570 | | | $ | 2,107,136 | |
Ross Stores, Inc. | | | 23,435 | | | | 2,186,953 | |
| | | | | | | | 4,294,089 | |
Semiconductors — 12.51% |
Cabot Microelectronics Corp. | | | 15,100 | | | | 2,156,431 | |
Lam Research Corp. | | | 7,330 | | | | 2,431,727 | |
Teradyne, Inc. | | | 22,730 | | | | 1,806,126 | |
| | | | | | | | 6,394,284 | |
Software — 4.21% |
Fortinet, Inc.(a) | | | 18,280 | | | | 2,153,567 | |
| | | | | | | | | |
Specialty Finance — 4.70% |
Synchrony Financial | | | 91,840 | | | | 2,403,453 | |
| | | | | | | | | |
Technology Hardware — 4.02% |
Zebra Technologies Corp., Class A(a) | | | 8,150 | | | | 2,057,549 | |
| | | | | | | | | |
Transportation & Logistics — 5.11% |
Union Pacific Corp. | | | 13,285 | | | | 2,615,418 | |
| | | | | | | | | |
Transportation Equipment — 3.52% |
Allison Transmission Holdings, Inc. | | | 51,170 | | | | 1,798,114 | |
| | | | | | | | | |
Total Common Stocks/Investments — 98.50% (Cost $44,736,178) | | | | | | | 50,370,037 | |
Other Assets in Excess of Liabilities — 1.50% | | | | | | | 765,098 | |
NET ASSETS — 100.00% | | | | | | $ | 51,135,135 | |
(a) | Non-income producing security. |
26 | See accompanying notes which are an integral part of these financial statements. | |
Fuller & Thaler Behavioral Small-Mid Core Equity Fund
Schedule of Investments
September 30, 2020
| | Shares | | | Fair Value | |
COMMON STOCKS — 98.02% |
| | | | | | | | | |
Apparel & Textile Products — 2.11% |
Carter’s, Inc. | | | 530 | | | $ | 45,888 | |
PVH Corp. | | | 330 | | | | 19,681 | |
| | | | | | | | 65,569 | |
Automotive — 0.87% |
Cooper-Standard Holding, Inc.(a) | | | 2,035 | | | | 26,882 | |
| | | | | | | | | |
Banking — 7.15% |
First Citizens BancShares, Inc., Class A | | | 105 | | | | 33,472 | |
Live Oak Bancshares, Inc. | | | 3,165 | | | | 80,168 | |
PacWest BanCorp | | | 1,670 | | | | 28,524 | |
Sterling Bancorp | | | 4,010 | | | | 42,185 | |
Western Alliance Bancorp | | | 1,175 | | | | 37,154 | |
| | | | | | | | 221,503 | |
Biotech & Pharmaceuticals — 2.44% |
Exelixis, Inc.(a) | | | 3,095 | | | | 75,673 | |
| | | | | | | | | |
Cable & Satellite — 0.67% |
Liberty Latin America Ltd., Class C(a) | | | 2,535 | | | | 20,635 | |
| | | | | | | | | |
Chemicals — 4.67% |
Huntsman Corp. | | | 3,360 | | | | 74,625 | |
NewMarket Corp. | | | 100 | | | | 34,232 | |
Orion Engineered Carbons SA(a) | | | 2,890 | | | | 36,154 | |
| | | | | | | | 145,011 | |
Electrical Equipment — 6.88% |
Advanced Energy Industries, Inc.(a) | | | 825 | | | | 51,926 | |
Generac Holdings, Inc.(a) | | | 835 | | | | 161,689 | |
| | | | | | | | 213,615 | |
Entertainment Content — 2.31% |
Sciplay Corp.(a) | | | 4,420 | | | | 71,692 | |
| | | | | | | | | |
Food — 2.68% |
Lancaster Colony Corp. | | | 465 | | | | 83,142 | |
| | | | | | | | | |
Gas & Water Utilities — 1.54% |
UGI Corp. | | | 1,450 | | | | 47,821 | |
| | | | | | | | | |
Health Care Facilities & Services — 1.97% |
Universal Health Services, Inc., Class B | | | 570 | | | $ | 61,001 | |
| | | | | | | | | |
Industrial Support Services — 1.26% |
HD Supply Holdings, Inc.(a) | | | 945 | | | | 38,972 | |
| | | | | | | | | |
Institutional Financial Services — 1.74% |
Evercore Partners, Inc., Class A | | | 825 | | | | 54,005 | |
| | | | | | | | | |
Insurance — 5.58% |
Brown & Brown, Inc. | | | 1,000 | | | | 45,270 | |
Mercury General Corp. | | | 1,005 | | | | 41,577 | |
Old Republic International Corp. | | | 2,400 | | | | 35,376 | |
Voya Financial, Inc. | | | 1,065 | | | | 51,045 | |
| | | | | | | | 173,268 | |
Leisure Facilities & Services — 5.89% |
Carnival Corp. | | | 2,580 | | | | 39,164 | |
Darden Restaurants, Inc. | | | 460 | | | | 46,340 | |
Ruth’s Hospitality Group, Inc. | | | 3,040 | | | | 33,622 | |
Yum China Holdings, Inc. | | | 1,200 | | | | 63,541 | |
| | | | | | | | 182,667 | |
Machinery — 5.68% |
Altra Industrial Motion Corp. | | | 2,110 | | | | 78,007 | |
Hillenbrand, Inc. | | | 1,915 | | | | 54,309 | |
Oshkosh Corp. | | | 600 | | | | 44,100 | |
| | | | | | | | 176,416 | |
Medical Equipment & Devices — 7.93% |
Dentsply Sirona, Inc. | | | 1,325 | | | | 57,942 | |
Meridian Bioscience, Inc.(a) | | | 2,560 | | | | 43,469 | |
Quidel Corp.(a) | | | 370 | | | | 81,171 | |
Waters Corp.(a) | | | 325 | | | | 63,596 | |
| | | | | | | | 246,178 | |
Oil & Gas Producers — 1.15% |
WPX Energy, Inc.(a) | | | 7,250 | | | | 35,525 | |
| | | | | | | | | |
| | See accompanying notes which are an integral part of these financial statements. | 27 |
Fuller & Thaler Behavioral Small-Mid Core Equity Fund
Schedule of Investments (continued)
September 30, 2020
| | Shares | | | Fair Value | |
COMMON STOCKS — (continued) |
| |
Real Estate — 7.60% |
American Assets Trust, Inc. | | | 1,095 | | | $ | 26,379 | |
Gaming and Leisure Properties, Inc. | | | 2,676 | | | | 98,832 | |
SITE Centers Corp. | | | 2,990 | | | | 21,528 | |
STORE Capital Corp. | | | 3,245 | | | | 89,010 | |
| | | | | | | | 235,749 | |
Semiconductors — 9.02% |
Cabot Microelectronics Corp. | | | 675 | | | | 96,397 | |
Entegris, Inc. | | | 1,100 | | | | 81,774 | |
Power Integrations, Inc. | | | 1,200 | | | | 66,480 | |
Teradyne, Inc. | | | 445 | | | | 35,360 | |
| | | | | | | | 280,011 | |
Software — 3.36% |
Fortinet, Inc.(a) | | | 510 | | | | 60,083 | |
Verra Mobility Corp.(a) | | | 4,570 | | | | 44,146 | |
| | | | | | | | 104,229 | |
Specialty Finance — 2.15% |
Synchrony Financial | | | 2,550 | | | | 66,734 | |
| | | | | | | | | |
Steel — 1.35% |
Steel Dynamics, Inc. | | | 1,460 | | | | 41,800 | |
| | | | | | | | | |
Technology Hardware — 5.97% |
F5 Networks, Inc.(a) | | | 330 | | | $ | 40,514 | |
SYNNEX Corp. | | | 620 | | | | 86,837 | |
Zebra Technologies Corp., Class A(a) | | | 230 | | | | 58,066 | |
| | | | | | | | 185,417 | |
Technology Services — 1.24% |
Leidos Holdings, Inc. | | | 430 | | | | 38,335 | |
| | | | | | | | | |
Transportation & Logistics — 3.55% |
Alaska Air Group, Inc. | | | 810 | | | | 29,670 | |
Kansas City Southern | | | 445 | | | | 80,470 | |
| | | | | | | | 110,140 | |
Transportation Equipment — 1.26% |
Allison Transmission Holdings, Inc. | | | 1,110 | | | | 39,005 | |
| | | | | | | | | |
Total Common Stocks/Investments — 98.02% (Cost $2,758,368) | | | | | | | 3,040,995 | |
Other Assets in Excess of Liabilities — 1.98% | | | | | | | 61,484 | |
NET ASSETS — 100.00% | | | | | | $ | 3,102,479 | |
(a) | Non-income producing security. |
28 | See accompanying notes which are an integral part of these financial statements. | |
Fuller & Thaler Behavioral Micro-Cap Equity Fund
Schedule of Investments
September 30, 2020
| | Shares | | | Fair Value | |
COMMON STOCKS — 98.14% |
| | | | | | | | | |
Advertising & Marketing — 2.69% |
Magnite, Inc.(a) | | | 22,324 | | | $ | 155,040 | |
| | | | | | | | | |
Aerospace & Defense — 1.23% |
Ducommun, Inc.(a) | | | 2,163 | | | | 71,206 | |
| | | | | | | | | |
Asset Management — 4.51% |
B. Riley Financial, Inc. | | | 6,591 | | | | 165,170 | |
WisdomTree Investments, Inc. | | | 29,680 | | | | 94,976 | |
| | | | | | | | 260,146 | |
Biotech & Pharmaceuticals — 5.12% |
Antares Pharma, Inc.(a) | | | 26,734 | | | | 72,182 | |
DermTech, Inc.(a) | | | 3,919 | | | | 46,832 | |
PDL BioPharma, Inc.(a) | | | 56,050 | | | | 176,558 | |
| | | | | | | | 295,572 | |
Construction Materials — 0.84% |
Forterra, Inc.(a) | | | 4,115 | | | | 48,639 | |
| | | | | | | | | |
Consumer Services — 1.51% |
Carriage Services, Inc. | | | 3,897 | | | | 86,942 | |
| | | | | | | | | |
E-Commerce Discretionary — 1.99% |
Liquidity Services, Inc.(a) | | | 15,396 | | | | 114,854 | |
| | | | | | | | | |
Food — 2.44% |
Landec Corp.(a) | | | 9,088 | | | | 88,335 | |
Limoneira Co.(a) | | | 3,650 | | | | 52,195 | |
| | | | | | | | 140,530 | |
Forestry, Paper & Wood Products — 2.14% |
Verso Corp., Class A(a) | | | 15,639 | | | | 123,392 | |
| | | | | | | | | |
Health Care Facilities & Services — 4.49% |
Evofem Biosciences, Inc.(a) | | | 6,501 | | | | 15,342 | |
Owens & Minor, Inc. | | | 9,710 | | | | 243,818 | |
| | | | | | | | 259,160 | |
Home & Office Products — 0.51% |
Flexsteel Industries, Inc. | | | 1,225 | | | | 29,400 | |
| | | | | | | | | |
Home Construction — 3.92% |
Cornerstone Building Brands, Inc.(a) | | | 15,426 | | | $ | 123,100 | |
Hovnanian Enterprises, Inc.(a) | | | 3,170 | | | | 103,088 | |
| | | | | | | | 226,188 | |
Household Products — 1.42% |
elf Beauty, Inc.(a) | | | 4,464 | | | | 82,004 | |
| | | | | | | | | |
Institutional Financial Services — 1.43% |
Greenhill & Co., Inc. | | | 7,260 | | | | 82,401 | |
| | | | | | | | | |
Internet Media & Services — 4.09% |
Cars.com, Inc.(a) | | | 10,484 | | | | 84,711 | |
Groupon, Inc.(a) | | | 3,570 | | | | 72,828 | |
Truecar, Inc.(a) | | | 15,665 | | | | 78,325 | |
| | | | | | | | 235,864 | |
Leisure Facilities & Services — 8.27% |
Carrols Restaurant Group, Inc.(a) | | | 15,460 | | | | 99,717 | |
Del Taco Restaurants, Inc.(a) | | | 10,112 | | | | 82,918 | |
Drive Shack, Inc.(a) | | | 24,647 | | | | 27,605 | |
El Pollo Loco Holdings, Inc.(a) | | | 5,071 | | | | 82,150 | |
Fiesta Restaurant Group, Inc.(a) | | | 9,630 | | | | 90,233 | |
Monarch Casino & Resort, Inc.(a) | | | 2,125 | | | | 94,775 | |
| | | | | | | | 477,398 | |
Leisure Products — 2.57% |
Nautilus, Inc.(a) | | | 8,625 | | | | 148,005 | |
| | | | | | | | | |
Medical Equipment & Devices — 4.05% |
Invacare Corp. | | | 11,025 | | | | 82,908 | |
LeMaitre Vascular, Inc. | | | 2,610 | | | | 84,903 | |
Surmodics, Inc.(a) | | | 1,690 | | | | 65,758 | |
| | | | | | | | 233,569 | |
Oil & Gas Producers — 3.67% |
Matador Resources Co.(a) | | | 18,160 | | | | 150,002 | |
W&T Offshore, Inc.(a) | | | 34,104 | | | | 61,387 | |
| | | | | | | | 211,389 | |
| | See accompanying notes which are an integral part of these financial statements. | 29 |
Fuller & Thaler Behavioral Micro-Cap Equity Fund
Schedule of Investments (continued)
September 30, 2020
| | Shares | | | Fair Value | |
COMMON STOCKS — (continued) |
| |
Real Estate — 3.13% |
CatchMark Timber Trust, Inc., Class A(a) | | | 11,555 | | | $ | 103,186 | |
Front Yard Residential Corp.(a) | | | 8,850 | | | | 77,349 | |
| | | | | | | | 180,535 | |
Renewable Energy — 2.10% |
Green Plains, Inc.(a) | | | 7,840 | | | | 121,363 | |
| | | | | | | | | |
Retail - Consumer Staples — 1.63% |
Natural Grocers by Vitamin Cottage, Inc. | | | 9,532 | | | | 93,986 | |
| | | | | | | | | |
Retail - Discretionary — 13.50% |
Barnes & Noble Education, Inc.(a) | | | 26,200 | | | | 67,596 | |
Big 5 Sporting Goods Corp. | | | 12,490 | | | | 93,425 | |
BlueLinx Holdings, Inc.(a) | | | 3,725 | | | | 80,199 | |
Boot Barn Holdings, Inc.(a) | | | 5,029 | | | | 141,516 | |
Duluth Holdings, Inc., Class B(a) | | | 7,240 | | | | 88,473 | |
Freshpet, Inc.(a) | | | 1,127 | | | | 125,830 | |
GrowGeneration Corp.(a) | | | 6,925 | | | | 110,662 | |
MarineMax, Inc.(a) | | | 2,794 | | | | 71,722 | |
| | | | | | | | 779,423 | |
Software — 5.28% |
Donnelley Financial Solutions, Inc.(a) | | | 9,638 | | | | 128,764 | |
Immersion Corp.(a) | | | 10,826 | | | | 76,323 | |
Limelight Networks, Inc.(a) | | | 12,717 | | | | 73,250 | |
RealNetworks, Inc.(a) | | | 21,621 | | | | 26,378 | |
| | | | | | | | 304,715 | |
Specialty Finance — 1.04% |
Regional Management Corp.(a) | | | 3,616 | | | $ | 60,243 | |
| | | | | | | | | |
Technology Hardware — 7.00% |
A10 Networks, Inc.(a) | | | 15,120 | | | | 96,314 | |
Arlo Technologies, Inc.(a) | | | 24,311 | | | | 127,876 | |
Diebold, Inc.(a) | | | 14,726 | | | | 112,507 | |
Extreme Networks, Inc.(a) | | | 16,710 | | | | 67,174 | |
| | | | | | | | 403,871 | |
Technology Services — 2.03% |
comScore, Inc.(a) | | | 25,791 | | | | 52,614 | |
MoneyGram International, Inc.(a) | | | 22,895 | | | | 64,678 | |
| | | | | | | | 117,292 | |
Telecommunications — 1.87% |
HC2 Holdings, Inc.(a) | | | 44,600 | | | | 107,932 | |
| | | | | | | | | |
Transportation Equipment — 1.85% |
Shyft Group, Inc. (The) | | | 5,633 | | | | 106,351 | |
| | | | | | | | | |
Wholesale - Consumer Staples — 1.82% |
Andersons, Inc. (The) | | | 5,490 | | | | 105,243 | |
| | | | | | | | | |
Total Common Stocks/Investments — 98.14% (Cost $5,130,927) | | | | | | | 5,662,653 | |
Other Assets in Excess of Liabilities — 1.86% | | | | | | | 107,111 | |
NET ASSETS — 100.00% | | | | | | $ | 5,769,764 | |
(a) | Non-income producing security. |
30 | See accompanying notes which are an integral part of these financial statements. | |
Fuller & Thaler Funds
Statements of Assets and Liabilities
September 30, 2020
| | | Fuller & Thaler
Behavioral
Small-Cap
Equity Fund | | | Fuller & Thaler
Behavioral
Small-Cap
Growth Fund | | | Fuller & Thaler
Behavioral
Mid-Cap
Value Fund | |
Assets |
Investments in securities at fair value (cost $2,731,351,781, $46,384,036 and $36,097,008) | | $ | 2,849,904,056 | | | $ | 56,807,811 | | | $ | 35,099,263 | |
Cash and cash equivalents | | | 35,000,000 | | | | 2,656,895 | | | | 94,173 | |
Receivable for fund shares sold | | | 4,045,899 | | | | 955,230 | | | | 1,520 | |
Receivable for investments sold | | | 9,913,107 | | | | 342,741 | | | | — | |
Dividends and interest receivable | | | 1,055,867 | | | | 18,969 | | | | 48,789 | |
Prepaid expenses | | | 138,396 | | | | 29,960 | | | | 16,584 | |
Total Assets | | | 2,900,057,325 | | | | 60,811,606 | | | | 35,260,329 | |
Liabilities | | | | | | | | | | | | |
Payable for investments purchased | | | 50,377,507 | | | | — | | | | — | |
Payable for fund shares redeemed | | | 3,870,268 | | | | 1,991,668 | | | | 34,108 | |
Payable to Adviser | | | 1,374,825 | | | | 25,178 | | | | 10,745 | |
Accrued 12b-1 fees | | | 58,958 | | | | 265 | | | | 244 | |
Accrued administrative services fees | | | 192,601 | | | | 8,069 | | | | 575 | |
Payable to Administrator | | | 118,360 | | | | 2,651 | | | | 2,055 | |
Payable to auditors | | | 15,250 | | | | 15,250 | | | | 15,250 | |
Other accrued expenses | | | 217,441 | | | | 7,582 | | | | 5,172 | |
Total Liabilities | | | 56,225,210 | | | | 2,050,663 | | | | 68,149 | |
Net Assets | | $ | 2,843,832,115 | | | $ | 58,760,943 | | | $ | 35,192,180 | |
Net Assets consist of: | | | | | | | | | | | | |
Paid-in capital | | | 2,791,210,432 | | | | 48,534,632 | | | | 37,430,237 | |
Accumulated earnings (deficit) | | | 52,621,683 | | | | 10,226,311 | | | | (2,238,057 | ) |
Net Assets | | $ | 2,843,832,115 | | | $ | 58,760,943 | | | $ | 35,192,180 | |
R6 Shares: | | | | | | | | | | | | |
Net Assets | | $ | 610,476,261 | | | $ | 13,083,057 | | | $ | 24,323,791 | |
Shares outstanding (unlimited number of shares authorized, no par value) | | | 24,658,837 | | | | 465,268 | | | | 1,279,950 | |
Net asset value, offering and redemption price per share | | $ | 24.76 | | | $ | 28.12 | | | $ | 19.00 | |
Institutional Shares: | | | | | | | | | | | | |
Net Assets | | $ | 2,089,639,198 | | | $ | 44,808,078 | | | $ | 9,825,653 | |
Shares outstanding (unlimited number of shares authorized, no par value) | | | 85,114,100 | | | | 1,596,997 | | | | 517,566 | |
Net asset value, offering and redemption price per share | | $ | 24.55 | | | $ | 28.06 | | | $ | 18.98 | |
Investor Shares: | | | | | | | | | | | | |
Net Assets | | $ | 139,788,799 | | | $ | 781,150 | | | $ | 1,042,736 | |
Shares outstanding (unlimited number of shares authorized, no par value) | | | 5,732,040 | | | | 28,042 | | | | 55,173 | |
Net asset value, offering and redemption price per share | | $ | 24.39 | | | $ | 27.86 | | | $ | 18.90 | |
| | See accompanying notes which are an integral part of these financial statements. | 31 |
Fuller & Thaler Funds
Statements of Assets and Liabilities (continued)
September 30, 2020
| | | Fuller & Thaler
Behavioral
Small-Cap
Equity Fund | | | Fuller & Thaler
Behavioral
Small-Cap
Growth Fund | | | Fuller & Thaler
Behavioral
Mid-Cap
Value Fund | |
A Shares: | | | | | | | | | | | | |
Net Assets | | $ | 940,911 | | | $ | 60,209 | | | | | |
Shares outstanding (unlimited number of shares authorized, no par value) | | | 38,590 | | | | 2,163 | | | | | |
Net asset value, offering and redemption price per share | | $ | 24.38 | | | $ | 27.83 | (a) | | | | |
Maximum offering price per share (Note 1) | | $ | 25.87 | | | $ | 29.53 | | | | | |
C Shares: | | | | | | | | | | | | |
Net Assets | | $ | 2,986,946 | | | $ | 28,449 | | | | | |
Shares outstanding (unlimited number of shares authorized, no par value) | | | 123,628 | | | | 1,031 | | | | | |
Net asset value, offering and redemption price per share | | $ | 24.16 | | | $ | 27.60 | (a) | | | | |
(a) | Per share amounts may not recalculate due to rounding of net assets and/or shares outstanding. |
32 | See accompanying notes which are an integral part of these financial statements. | |
Fuller & Thaler Funds
Statements of Assets and Liabilities (continued)
September 30, 2020
| | | Fuller & Thaler
Behavioral
Unconstrained
Equity Fund | | | Fuller & Thaler
Behavioral
Small–Mid Core
Equity Fund | | | Fuller & Thaler
Behavioral
Micro-Cap
Equity Fund | |
Assets | | | | |
Investments in securities at fair value (cost $44,736,178, $2,758,368 and $5,130,927) | | $ | 50,370,037 | | | $ | 3,040,995 | | | $ | 5,662,653 | |
Cash and cash equivalents | | | 348,845 | | | | 69,913 | | | | 119,903 | |
Receivable for fund shares sold | | | 450,250 | | | | — | | | | 250 | |
Dividends and interest receivable | | | 14,983 | | | | 2,675 | | | | 1,027 | |
Receivable from Adviser | | | — | | | | 5,232 | | | | 342 | |
Prepaid expenses | | | 5,878 | | | | 4,120 | | | | 5,538 | |
Total Assets | | | 51,189,993 | | | | 3,122,935 | | | | 5,789,713 | |
Liabilities | | | | | | | | | | | | |
Payable to Adviser | | | 27,618 | | | | — | | | | — | |
Accrued administrative services fees | | | 757 | | | | 222 | | | | 431 | |
Payable to Administrator | | | 2,228 | | | | 1,497 | | | | 1,502 | |
Payable to auditors | | | 13,800 | | | | 13,800 | | | | 13,800 | |
Other accrued expenses | | | 10,455 | | | | 4,937 | | | | 4,216 | |
Total Liabilities | | | 54,858 | | | | 20,456 | | | | 19,949 | |
Net Assets | | $ | 51,135,135 | | | $ | 3,102,479 | | | $ | 5,769,764 | |
Net Assets consist of: | | | | | | | | | | | | |
Paid-in capital | | | 45,721,459 | | | | 2,898,070 | | | | 6,062,659 | |
Accumulated earnings (deficit) | | | 5,413,676 | | | | 204,409 | | | | (292,895 | ) |
Net Assets | | $ | 51,135,135 | | | $ | 3,102,479 | | | $ | 5,769,764 | |
R6 Shares: | | | | | | | | | | | | |
Net Assets | | $ | 43,131,283 | | | | | | | | | |
Shares outstanding (unlimited number of shares authorized, no par value) | | | 1,570,270 | | | | | | | | | |
Net asset value, offering and redemption price per share | | $ | 27.47 | | | | | | | | | |
Institutional Shares: | | | | | | | | | | | | |
Net Assets | | $ | 8,003,852 | | | $ | 3,102,479 | | | $ | 5,769,764 | |
Shares outstanding (unlimited number of shares authorized, no par value) | | | 291,757 | | | | 131,514 | | | | 324,295 | |
Net asset value, offering and redemption price per share | | $ | 27.43 | | | $ | 23.59 | | | $ | 17.79 | |
| | See accompanying notes which are an integral part of these financial statements. | 33 |
Fuller & Thaler Funds
Statements of Operations
For the year ended September 30, 2020
| | | Fuller & Thaler
Behavioral
Small-Cap
Equity Fund | | | Fuller & Thaler
Behavioral
Small-Cap
Growth Fund | | | Fuller & Thaler
Behavioral
Mid-Cap
Value Fund | |
Investment Income: | | | | | | | | | | | | |
Dividend income | | $ | 26,079,757 | | | $ | 91,678 | | | $ | 371,481 | |
Interest income | | | 241,804 | | | | 3,313 | | | | 8,980 | |
Total investment income | | | 26,321,561 | | | | 94,991 | | | | 380,461 | |
Expenses: | | | | | | | | | | | | |
Adviser | | | 13,643,463 | | | | 237,040 | | | | 142,182 | |
Administrative Services - Institutional Shares | | | 1,773,124 | | | | 20,122 | | | | 11,520 | |
Administration | | | 734,975 | | | | 9,338 | | | | 6,410 | |
12b-1 fees- Investor Shares | | | 338,636 | | | | 619 | | | | 3,930 | |
Transfer agent | | | 296,370 | | | | 3,157 | | | | 5,713 | |
Fund accounting | | | 261,642 | | | | 3,319 | | | | 2,281 | |
Registration | | | 213,277 | | | | 66,446 | | | | 22,258 | |
Administrative Services - Investor Shares | | | 195,965 | | | | 302 | | | | 1,945 | |
Report printing | | | 174,200 | | | | 2,739 | | | | 2,061 | |
Custodian | | | 120,991 | | | | 7,226 | | | | 3,582 | |
Legal | | | 45,805 | | | | 11,766 | | | | 11,759 | |
12b-1 fees - C Shares | | | 17,402 | | | | 113 | | | | — | |
Audit and tax preparation | | | 17,000 | | | | 17,000 | | | | 17,000 | |
Trustee | | | 14,095 | | | | 14,095 | | | | 14,095 | |
Compliance services | | | 6,000 | | | | 6,000 | | | | 6,000 | |
Pricing | | | 3,441 | | | | 962 | | | | 1,294 | |
12b-1 fees - A Shares | | | 1,848 | | | | 46 | | | | — | |
Administrative Services - A Shares | | | 1,340 | | | | 5 | | | | — | |
Interest | | | — | | | | 64 | | | | 547 | |
Miscellaneous | | | 234,443 | | | | 23,990 | | | | 20,060 | |
Total expenses | | | 18,094,017 | | | | 424,349 | | | | 272,637 | |
Fees contractually waived by Adviser | | | — | | | | (153,508 | ) | | | (103,543 | ) |
Net operating expenses | | | 18,094,017 | | | | 270,841 | | | | 169,094 | |
Net investment income (loss) | | | 8,227,544 | | | | (175,850 | ) | | | 211,367 | |
Net Realized and Change in Unrealized Gain (Loss) on Investments | | | | | | | | | | | | |
Net realized gain (loss) on investment securities transactions | | | (10,105,558 | ) | | | 803,173 | | | | (1,445,831 | ) |
Net change in unrealized appreciation (depreciation) of investment securities | | | 15,052,105 | | | | 9,828,656 | | | | (1,908,454 | ) |
Net realized and change in unrealized gain (loss) on investments | | | 4,946,547 | | | | 10,631,829 | | | | (3,354,285 | ) |
Net increase (decrease) in net assets resulting from operations | | $ | 13,174,091 | | | $ | 10,455,979 | | | $ | (3,142,918 | ) |
34 | See accompanying notes which are an integral part of these financial statements. | |
Fuller & Thaler Funds
Statements of Operations (continued)
For the year ended September 30, 2020
| | | Fuller & Thaler
Behavioral
Unconstrained
Equity Fund | | | Fuller & Thaler
Behavioral
Small–Mid Core
Equity Fund | | | Fuller & Thaler
Behavioral
Micro-Cap
Equity Fund | |
Investment Income: | | | | | | | | | | | | |
Dividend income | | | 293,650 | | | | 38,932 | | | | 94,946 | |
Interest income | | | 5,311 | | | | 1,427 | | | | 947 | |
Total investment income | | | 298,961 | | | | 40,359 | | | | 95,893 | |
Expenses: | | | | | | | | | | | | |
Adviser | | | 243,017 | | | | 21,031 | | | | 54,269 | |
Audit and tax preparation | | | 16,300 | | | | 16,300 | | | | 16,300 | |
Trustee | | | 14,096 | | | | 14,096 | | | | 14,096 | |
Legal | | | 11,758 | | | | 11,757 | | | | 11,770 | |
Administration | | | 11,641 | | | | 7,867 | | | | 7,846 | |
Registration | | | 6,116 | | | | 2,033 | | | | 9,083 | |
Compliance services | | | 6,000 | | | | 6,000 | | | | 6,000 | |
Administrative Services - Institutional Shares | | | 5,567 | | | | 2,096 | | | | 1,544 | |
Fund accounting | | | 4,143 | | | | 2,801 | | | | 2,794 | |
Custodian | | | 3,650 | | | | 1,344 | | | | 5,056 | |
Offering | | | 2,301 | | | | 2,296 | | | | 2,405 | |
Report printing | | | 2,138 | | | | 1,307 | | | | 1,335 | |
Transfer agent | | | 1,085 | | | | 1,329 | | | | 1,362 | |
Pricing | | | 988 | | | | 1,442 | | | | 2,057 | |
Miscellaneous | | | 21,576 | | | | 15,028 | | | | 15,086 | |
Total expenses | | | 350,376 | | | | 106,727 | | | | 151,003 | |
Fees contractually waived and expenses reimbursed by Adviser | | | (88,162 | ) | | | (81,772 | ) | | | (87,750 | ) |
Net operating expenses | | | 262,214 | | | | 24,955 | | | | 63,253 | |
Net investment income | | | 36,747 | | | | 15,404 | | | | 32,640 | |
Net Realized and Change in Unrealized Gain (Loss) on Investments | | | | | | | | | | | | |
Net realized loss on investment securities transactions | | | (250,617 | ) | | | (89,568 | ) | | | (857,133 | ) |
Net change in unrealized appreciation of investment securities | | | 5,015,769 | | | | 72,659 | | | | 463,442 | |
Net realized and change in unrealized gain (loss) on investments | | | 4,765,152 | | | | (16,909 | ) | | | (393,691 | ) |
Net increase (decrease) in net assets resulting from operations | | $ | 4,801,899 | | | $ | (1,505 | ) | | $ | (361,051 | ) |
| | See accompanying notes which are an integral part of these financial statements. | 35 |
Fuller & Thaler Funds
Statements of Changes in Net Assets
| | | Fuller & Thaler Behavioral
Small-Cap Equity Fund | |
| | | For the
Year Ended
September 30,
2020 | | | For the
Year Ended
September 30,
2019 | |
Increase (Decrease) in Net Assets due to: | | | | | | | | |
Operations | | | | | | | | |
Net investment income | | $ | 8,227,544 | | | $ | 7,850,732 | |
Net realized loss on investment securities transactions | | | (10,105,558 | ) | | | (56,026,826 | ) |
Net change in unrealized appreciation of investment securities | | | 15,052,105 | | | | 16,735,595 | |
Net increase (decrease) in net assets resulting from operations | | | 13,174,091 | | | | (31,440,499 | ) |
Distributions to Shareholders from Earnings: | | | | | | | | |
R6 Shares | | | (1,086,441 | ) | | | (345,172 | ) |
Institutional Shares | | | (7,110,517 | ) | | | (4,169,332 | ) |
Investor Shares | | | (165,320 | ) | | | (240,135 | ) |
A Shares | | | (2,581 | ) | | | — | |
C Shares | | | (982 | ) | | | — | |
Total distributions | | | (8,365,841 | ) | | | (4,754,639 | ) |
Capital Transactions: | | | | | | | | |
R6 Shares: | | | | | | | | |
Proceeds from shares sold | | | 533,681,322 | | | | 167,152,718 | |
Reinvestment of distributions | | | 166,481 | | | | 82,247 | |
Amount paid for shares redeemed | | | (115,329,104 | ) | | | (41,626,197 | ) |
Total R6 Shares | | | 418,518,699 | | | | 125,608,768 | |
Institutional Shares: | | | | | | | | |
Proceeds from shares sold | | | 1,123,606,065 | | | | 1,148,853,620 | |
Reinvestment of distributions | | | 4,482,435 | | | | 3,701,007 | |
Amount paid for shares redeemed | | | (659,307,454 | ) | | | (417,586,406 | ) |
Total Institutional Shares | | | 468,781,046 | | | | 734,968,221 | |
Investor Shares: | | | | | | | | |
Proceeds from shares sold | | | 85,492,383 | | | | 54,581,003 | |
Reinvestment of distributions | | | 154,790 | | | | 209,986 | |
Amount paid for shares redeemed | | | (67,577,994 | ) | | | (65,404,119 | ) |
Total Investor Shares | | | 18,069,179 | | | | (10,613,130 | ) |
A Shares: | | | | | | | | |
Proceeds from shares sold | | | 734,422 | | | | 869,422 | (a) |
Reinvestment of distributions | | | 2,581 | | | | — | (a) |
Amount paid for shares redeemed | | | (307,977 | ) | | | (303,818 | )(a) |
Total A Shares | | | 429,026 | | | | 565,604 | |
C Shares: | | | | | | | | |
Proceeds from shares sold | | | 2,852,424 | | | | 468,216 | (a) |
Reinvestment of distributions | | | 982 | | | | — | (a) |
Amount paid for shares redeemed | | | (330,221 | ) | | | (13,539 | )(a) |
Total C Shares | | | 2,523,185 | | | | 454,677 | |
Net increase in net assets resulting from capital transactions | | | 908,321,135 | | | | 850,984,140 | |
Total Increase in Net Assets | | | 913,129,385 | | | | 814,789,002 | |
36 | See accompanying notes which are an integral part of these financial statements. | |
Fuller & Thaler Funds
Statements of Changes in Net Assets (continued)
| | | Fuller & Thaler Behavioral
Small-Cap Equity Fund | |
| | | For the
Year Ended
September 30,
2020 | | | For the
Year Ended
September 30,
2019 | |
| Net Assets | | | | | | | | |
| Beginning of year | | | 1,930,702,730 | | | | 1,115,913,728 | |
| End of year | | $ | 2,843,832,115 | | | $ | 1,930,702,730 | |
| Share Transactions: | | | | | | | | |
| R6 Shares: | | | | | | | | |
Shares sold | | | 22,555,164 | | | | 6,995,374 | |
Shares issued in reinvestment of distributions | | | 6,165 | | | | 3,707 | |
Shares redeemed | | | (5,180,373 | ) | | | (1,782,681 | |
| Total R6 Shares | | | 17,380,956 | | | | 5,216,400 | |
| Institutional Shares: | | | | | | | | |
Shares sold | | | 48,149,525 | | | | 47,638,982 | |
Shares issued in reinvestment of distributions | | | 167,236 | | | | 168,075 | |
Shares redeemed | | | (27,540,964 | ) | | | (17,968,154 | |
| Total Institutional Shares | | | 20,775,797 | | | | 29,838,903 | |
| Investor Shares: | | | | | | | | |
Shares sold | | | 3,556,557 | | | | 2,274,387 | |
Shares issued in reinvestment of distributions | | | 5,804 | | | | 9,575 | |
Shares redeemed | | | (2,808,341 | ) | | | (2,800,812 | |
| Total Investor Shares | | | 754,020 | | | | (516,850 | |
| A Shares: | | | | | | | | |
Shares sold | | | 30,191 | | | | 35,118 | (a) |
Shares issued in reinvestment of distributions | | | 97 | | | | — | (a) |
Shares redeemed | | | (14,658 | ) | | | (12,158 | )(a) |
| Total A Shares | | | 15,630 | | | | 22,960 | |
| C Shares: | | | | | | | | |
Shares sold | | | 118,619 | | | | 19,485 | (a) |
Shares issued in reinvestment of distributions | | | 37 | | | | — | (a) |
Shares redeemed | | | (13,970 | ) | | | (543 | )(a) |
| Total C Shares | | | 104,686 | | | | 18,942 | |
(a) | For the period December 19, 2018 (commencement of operations) to September 30, 2019. |
| | See accompanying notes which are an integral part of these financial statements. | 37 |
Fuller & Thaler Funds
Statements of Changes in Net Assets (continued)
| | | Fuller & Thaler Behavioral
Small-Cap Growth Fund | |
| | | For the
Year Ended
September 30,
2020 | | | For the
Year Ended
September 30,
2019 | |
Increase (Decrease) in Net Assets due to: | | | | | | | | |
Operations | | | | | | | | |
Net investment loss | | $ | (175,850 | ) | | $ | (63,907 | ) |
Net realized gain (loss) on investment securities transactions | | | 803,173 | | | | (636,228 | ) |
Net change in unrealized appreciation (depreciation) of investment securities | | | 9,828,656 | | | | (1,388,291 | ) |
Net increase (decrease) in net assets resulting from operations | | | 10,455,979 | | | | (2,088,426 | ) |
Capital Transactions: | | | | | | | | |
R6 Shares: | | | | | | | | |
Proceeds from shares sold | | | 11,001,395 | | | | 19,141 | |
Reinvestment of distributions | | | — | �� | | | — | |
Amount paid for shares redeemed | | | (2,997,381 | ) | | | (259,557 | ) |
Total R6 Shares | | | 8,004,014 | | | | (240,416 | ) |
Institutional Shares: | | | | | | | | |
Proceeds from shares sold | | | 40,421,553 | | | | 11,671,932 | |
Reinvestment of distributions | | | — | | | | — | |
Amount paid for shares redeemed | | | (16,458,746 | ) | | | (6,143,583 | ) |
Total Institutional Shares | | | 23,962,807 | | | | 5,528,349 | |
Investor Shares: | | | | | | | | |
Proceeds from shares sold | | | 660,756 | | | | 173,932 | |
Reinvestment of distributions | | | — | | | | — | |
Amount paid for shares redeemed | | | (104,195 | ) | | | (400,342 | ) |
Total Investor Shares | | | 556,561 | | | | (226,410 | ) |
A Shares: | | | | | | | | |
Proceeds from shares sold | | | 71,619 | | | | 4,020 | (a) |
Reinvestment of distributions | | | — | | | | — | (a) |
Amount paid for shares redeemed | | | (22,111 | ) | | | — | (a) |
Total A Shares | | | 49,508 | | | | 4,020 | |
C Shares: | | | | | | | | |
Proceeds from shares sold | | | 26,693 | | | | 2,535 | (a) |
Reinvestment of distributions | | | — | | | | — | (a) |
Amount paid for shares redeemed | | | (4,238 | ) | | | (520 | )(a) |
Total C Shares | | | 22,455 | | | | 2,015 | |
Net increase in net assets resulting from capital transactions | | | 32,595,345 | | | | 5,067,558 | |
Total Increase in Net Assets | | | 43,051,324 | | | | 2,979,132 | |
Net Assets | | | | | | | | |
Beginning of year | | | 15,709,619 | | | | 12,730,487 | |
End of year | | $ | 58,760,943 | | | $ | 15,709,619 | |
38 | See accompanying notes which are an integral part of these financial statements. | |
Fuller & Thaler Funds
Statements of Changes in Net Assets (continued)
| | | Fuller & Thaler Behavioral
Small-Cap Growth Fund | |
| | | For the
Year Ended September 30, 2020 | | | For the
Year Ended September 30, 2019 | |
Share Transactions: | | | | | | | | |
R6 Shares: | | | | | | | | |
Shares sold | | | 471,108 | | | | 841 | |
Shares issued in reinvestment of distributions | | | — | | | | — | |
Shares redeemed | | | (106,696 | ) | | | (11,034 | ) |
Total R6 Shares | | | 364,412 | | | | (10,193 | ) |
Institutional Shares: | | | | | | | | |
Shares sold | | | 1,695,260 | | | | 529,959 | |
Shares issued in reinvestment of distributions | | | — | | | | — | |
Shares redeemed | | | (714,112 | ) | | | (257,814 | ) |
Total Institutional Shares | | | 981,148 | | | | 272,145 | |
Investor Shares: | | | | | | | | |
Shares sold | | | 25,303 | | | | 7,568 | |
Shares issued in reinvestment of distributions | | | — | | | | — | |
Shares redeemed | | | (4,328 | ) | | | (18,397 | ) |
Total Investor Shares | | | 20,975 | | | | (10,829 | ) |
A Shares: | | | | | | | | |
Shares sold | | | 2,827 | | | | 192 | (a) |
Shares issued in reinvestment of distributions | | | — | | | | — | (a) |
Shares redeemed | | | (856 | ) | | | — | (a) |
Total A Shares | | | 1,971 | | | | 192 | |
C Shares: | | | | | | | | |
Shares sold | | | 1,087 | | | | 125 | (a) |
Shares issued in reinvestment of distributions | | | — | | | | — | (a) |
Shares redeemed | | | (159 | ) | | | (22 | )(a) |
Total C Shares | | | 928 | | | | 103 | |
(a) | For the period December 19, 2018 (commencement of operations) to September 30, 2019. |
| | See accompanying notes which are an integral part of these financial statements. | 39 |
Fuller & Thaler Funds
Statements of Changes in Net Assets (continued)
| | | Fuller & Thaler Behavioral
Mid-Cap Value Fund | |
| | | For the
Year Ended
September 30,
2020 | | | For the
Year Ended
September 30,
2019 | |
Increase (Decrease) in Net Assets due to: | | | | | | | | |
Operations | | | | | | | | |
Net investment income | | $ | 211,367 | | | $ | 130,841 | |
Net realized gain (loss) on investment securities transactions | | | (1,445,831 | ) | | | 110,623 | |
Net change in unrealized appreciation (depreciation) of investment securities | | | (1,908,454 | ) | | | 657,880 | |
Net increase (decrease) in net assets resulting from operations | | | (3,142,918 | ) | | | 899,344 | |
Distributions to Shareholders from Earnings: | | | | | | | | |
R6 Shares | | | (32,868 | ) | | | (14,740 | ) |
Institutional Shares | | | (157,384 | ) | | | (65,069 | ) |
Investor Shares | | | (19,865 | ) | | | (2,158 | ) |
Total distributions | | | (210,117 | ) | | | (81,967 | ) |
Capital Transactions: | | | | | | | | |
R6 Shares: | | | | | | | | |
Proceeds from shares sold | | | 22,913,500 | | | | 55,299 | |
Reinvestment of distributions | | | 32,868 | | | | 14,741 | |
Amount paid for shares redeemed | | | (1,644 | ) | | | (127,587 | ) |
Total R6 Shares | | | 22,944,724 | | | | (57,547 | ) |
Institutional Shares: | | | | | | | | |
Proceeds from shares sold | | | 7,031,672 | | | | 4,551,931 | |
Reinvestment of distributions | | | 156,703 | | | | 65,069 | |
Amount paid for shares redeemed | | | (7,761,765 | ) | | | (3,336,153 | ) |
Total Institutional Shares | | | (573,390 | ) | | | 1,280,847 | |
Investor Shares: | | | | | | | | |
Proceeds from shares sold | | | 724,776 | | | | 1,528,567 | |
Reinvestment of distributions | | | 19,865 | | | | 2,158 | |
Amount paid for shares redeemed | | | (1,160,530 | ) | | | (308,132 | ) |
Total Investor Shares | | | (415,889 | ) | | | 1,222,593 | |
Net increase in net assets resulting from capital transactions | | | 21,955,445 | | | | 2,445,893 | |
Total Increase in Net Assets | | | 18,602,410 | | | | 3,263,270 | |
Net Assets | | | | | | | | |
Beginning of year | | | 16,589,770 | | | | 13,326,500 | |
End of year | | $ | 35,192,180 | | | $ | 16,589,770 | |
40 | See accompanying notes which are an integral part of these financial statements. | |
Fuller & Thaler Funds
Statements of Changes in Net Assets (continued)
| | | Fuller & Thaler Behavioral
Mid-Cap Value Fund | |
| | | For the
Year Ended September 30, 2020 | | | For the
Year Ended September 30, 2019 | |
Share Transactions: | | | | | | | | |
R6 Shares: | | | | | | | | |
Shares sold | | | 1,166,713 | | | | 2,796 | |
Shares issued in reinvestment of distributions | | | 1,482 | | | | 782 | |
Shares redeemed | | | (74 | ) | | | (6,558 | ) |
Total R6 Shares | | | 1,168,121 | | | | (2,980 | ) |
Institutional Shares: | | | | | | | | |
Shares sold | | | 365,786 | | | | 227,539 | |
Shares issued in reinvestment of distributions | | | 7,065 | | | | 3,454 | |
Shares redeemed | | | (437,943 | ) | | | (165,038 | ) |
Total Institutional Shares | | | (65,092 | ) | | | 65,955 | |
Investor Shares: | | | | | | | | |
Shares sold | | | 41,031 | | | | 77,055 | |
Shares issued in reinvestment of distributions | | | 898 | | | | 115 | |
Shares redeemed | | | (65,093 | ) | | | (15,636 | ) |
Total Investor Shares | | | (23,164 | ) | | | 61,534 | |
| | See accompanying notes which are an integral part of these financial statements. | 41 |
Fuller & Thaler Funds
Statements of Changes in Net Assets (continued)
| | | Fuller & Thaler Behavioral
Unconstrained Equity Fund | |
| | | For the
Year Ended
September 30,
2020 | | | For the
Period Ended
September 30,
2019(a) | |
Increase (Decrease) in Net Assets due to: | | | | | | | | |
Operations | | | | | | | | |
Net investment income | | $ | 36,747 | | | $ | 11,199 | |
Net realized gain (loss) on investment securities transactions | | | (250,617 | ) | | | 24,280 | |
Net change in unrealized appreciation of investment securities | | | 5,015,769 | | | | 618,090 | |
Net increase in net assets resulting from operations | | | 4,801,899 | | | | 653,569 | |
Distributions to Shareholders from Earnings: | | | | | | | | |
R6 Shares | | | (11,717 | ) | | | — | |
Institutional Shares | | | (30,081 | ) | | | — | |
Total distributions | | | (41,798 | ) | | | — | |
Capital Transactions: | | | | | | | | |
R6 Shares: | | | | | | | | |
Proceeds from shares sold | | | 37,569,740 | | | | 2,131,873 | |
Reinvestment of distributions | | | 11,717 | | | | — | |
Amount paid for shares redeemed | | | (739 | ) | | | (1,242,996 | ) |
Total R6 Shares | | | 37,580,718 | | | | 888,877 | |
Institutional Shares: | | | | | | | | |
Proceeds from shares sold | | | 4,319,130 | | | | 3,089,903 | |
Reinvestment of distributions | | | 30,013 | | | | — | |
Amount paid for shares redeemed | | | (187,176 | ) | | | — | |
Total Institutional Shares | | | 4,161,967 | | | | 3,089,903 | |
Net increase in net assets resulting from capital transactions | | | 41,742,685 | | | | 3,978,780 | |
Total Increase in Net Assets | | | 46,502,786 | | | | 4,632,349 | |
Net Assets | | | | | | | | |
Beginning of year | | | 4,632,349 | | | | — | |
End of year | | $ | 51,135,135 | | | $ | 4,632,349 | |
Share Transactions: | | | | | | | | |
R6 Shares: | | | | | | | | |
Shares sold | | | 1,516,923 | | | | 103,931 | |
Shares issued in reinvestment of distributions | | | 435 | | | | — | |
Shares redeemed | | | (33 | ) | | | (50,986 | ) |
Total R6 Shares | | | 1,517,325 | | | | 52,945 | |
Institutional Shares: | | | | | | | | |
Shares sold | | | 171,141 | | | | 126,503 | |
Shares issued in reinvestment of distributions | | | 1,114 | | | | — | |
Shares redeemed | | | (7,001 | ) | | | — | |
Total Institutional Shares | | | 165,254 | | | | 126,503 | |
(a) | For the period December 26, 2018 (commencement of operations) to September 30, 2019. |
42 | See accompanying notes which are an integral part of these financial statements. | |
Fuller & Thaler Funds
Statements of Changes in Net Assets (continued)
| | | Fuller & Thaler Behavioral
Small–Mid Core Equity Fund | |
| | | For the
Year Ended
September 30,
2020 | | | For the
Period Ended
September 30,
2019(a) | |
Increase (Decrease) in Net Assets due to: | | | | | | | | |
Operations | | | | | | | | |
Net investment income | | $ | 15,404 | | | $ | 12,346 | |
Net realized gain (loss) on investment securities transactions | | | (89,568 | ) | | | 40,759 | |
Net change in unrealized appreciation of investment securities | | | 72,659 | | | | 209,968 | |
Net increase (decrease) in net assets resulting from operations | | | (1,505 | ) | | | 263,073 | |
Distributions to Shareholders from Earnings: | | | | | | | | |
Institutional Shares | | | (57,188 | ) | | | — | |
Total distributions | | | (57,188 | ) | | | — | |
Capital Transactions: | | | | | | | | |
Institutional Shares: | | | | | | | | |
Proceeds from shares sold | | | 697,186 | | | | 2,230,978 | |
Reinvestment of distributions | | | 57,188 | | | | — | |
Amount paid for shares redeemed | | | (87,253 | ) | | | — | |
Total Institutional Shares | | | 667,121 | | | | 2,230,978 | |
Net increase in net assets resulting from capital transactions | | | 667,121 | | | | 2,230,978 | |
Total Increase in Net Assets | | | 608,428 | | | | 2,494,051 | |
Net Assets | | | | | | | | |
Beginning of year | | | 2,494,051 | | | | — | |
End of year | | $ | 3,102,479 | | | $ | 2,494,051 | |
Share Transactions: | | | | | | | | |
Institutional Shares: | | | | | | | | |
Shares sold | | | 30,031 | | | | 104,078 | |
Shares issued in reinvestment of distributions | | | 2,299 | | | | — | |
Shares redeemed | | | (4,894 | ) | | | — | |
Total Institutional Shares | | | 27,436 | | | | 104,078 | |
(a) | For the period December 26, 2018 (commencement of operations) to September 30, 2019. |
| | See accompanying notes which are an integral part of these financial statements. | 43 |
Fuller & Thaler Funds
Statements of Changes in Net Assets (continued)
| | | Fuller & Thaler Behavioral
Micro-Cap Equity Fund | |
| | | For the
Year Ended
September 30,
2020 | | | For the
Period Ended
September 30,
2019(a) | |
Increase (Decrease) in Net Assets due to: | | | | | | | | |
Operations | | | | | | | | |
Net investment income (loss) | | $ | 32,640 | | | $ | (25,796 | ) |
Net realized gain (loss) on investment securities transactions | | | (857,133 | ) | | | 171,644 | |
Net change in unrealized appreciation of investment securities | | | 463,442 | | | | 68,284 | |
Net increase (decrease) in net assets resulting from operations | | | (361,051 | ) | | | 214,132 | |
Distributions to Shareholders from Earnings: | | | | | | | | |
Institutional Shares | | | (145,976 | ) | | | — | |
Total distributions | | | (145,976 | ) | | | — | |
Capital Transactions: | | | | | | | | |
Institutional Shares: | | | | | | | | |
Proceeds from shares sold | | | 3,345,527 | | | | 2,605,042 | |
Reinvestment of distributions | | | 145,976 | | | | — | |
Amount paid for shares redeemed | | | (33,886 | ) | | | — | |
Total Institutional Shares | | | 3,457,617 | | | | 2,605,042 | |
Net increase in net assets resulting from capital transactions | | | 3,457,617 | | | | 2,605,042 | |
Total Increase in Net Assets | | | 2,950,590 | | | | 2,819,174 | |
Net Assets | | | | | | | | |
Beginning of year | | | 2,819,174 | | | | — | |
End of year | | $ | 5,769,764 | | | $ | 2,819,174 | |
Share Transactions: | | | | | | | | |
Institutional Shares: | | | | | | | | |
Shares sold | | | 190,105 | | | | 129,904 | |
Shares issued in reinvestment of distributions | | | 6,596 | | | | — | |
Shares redeemed | | | (2,310 | ) | | | — | |
Total Institutional Shares | | | 194,391 | | | | 129,904 | |
(a) | For the period December 28, 2018 (commencement of operations) to September 30, 2019. |
44 | See accompanying notes which are an integral part of these financial statements. | |
Fuller & Thaler Behavioral Small-Cap Equity Fund – R6 Shares
Financial Highlights
(For a share outstanding during each year)
| | | For the Years Ended September 30, | |
| | | 2020 | | | 2019 | | | 2018 | | | 2017 | | | 2016 | |
Net asset value, beginning of year | | $ | 25.39 | | | $ | 26.76 | | | $ | 24.25 | | | $ | 18.97 | | | $ | 18.84 | |
Income from investment operations: | | | | | | | | | | | | | | | | | | | | |
Net investment income(a) | | | 0.11 | | | | 0.17 | | | | 0.18 | | | | 0.18 | | | | 0.25 | |
Net realized and unrealized gain (loss) on investments | | | (0.61 | )* | | | (1.40 | ) | | | 2.40 | | | | 5.19 | | | | 2.42 | |
Total from investment operations | | | (0.50 | ) | | | (1.23 | ) | | | 2.58 | | | | 5.37 | | | | 2.67 | |
Less distributions to shareholders from: | | | | | | | | | | | | | | | | | | | | |
Net investment income | | | (0.13 | ) | | | (0.14 | ) | | | (0.07 | ) | | | (0.09 | ) | | | (0.28 | ) |
Net realized gains | | | — | | | | — | | | | — | | | | — | | | | (2.26 | ) |
Total from distributions | | | (0.13 | ) | | | (0.14 | ) | | | (0.07 | ) | | | (0.09 | ) | | | (2.54 | ) |
Net asset value, end of year | | $ | 24.76 | | | $ | 25.39 | | | $ | 26.76 | | | $ | 24.25 | | | $ | 18.97 | |
Total Return(b) | | | (2.02 | )% | | | (4.54 | )% | | | 10.68 | % | | | 28.35 | % | | | 16.14 | % |
| | | | | | | | | | | | | | | | | | | | | |
Ratios and Supplemental Data: | | | | | | | | | | | | | | | | | | | | |
Net assets, end of year (000 omitted) | | $ | 610,476 | | | $ | 184,779 | | | $ | 55,160 | | | $ | 3,740 | | | $ | 3,174 | |
Before waiver or recoupment: | | | | | | | | | | | | | | | | | | | | |
Ratio of expenses to average net assets | | | 0.69 | % | | | 0.72 | % | | | 0.74 | % | | | 1.30 | % | | | 2.65 | % |
After waiver or recoupment: | | | | | | | | | | | | | | | | | | | | |
Ratio of net expenses to average net assets | | | 0.69 | % | | | 0.72 | % | | | 0.76 | % | | | 0.75 | % | | | 0.64 | % |
Ratio of net investment income to average net assets | | | 0.47 | % | | | 0.69 | % | | | 0.71 | % | | | 0.81 | % | | | 1.33 | % |
Portfolio turnover(c) | | | 54 | % | | | 38 | % | | | 35 | % | | | 26 | % | | | 194 | % |
* | The amount shown for a share outstanding throughout the period does not accord with the change in aggregate gains and losses in the portfolio of securities during the period due to the timing of sales and purchases of fund shares in relation to fluctuating market values during the period. |
(a) | Per share net investment income has been calculated using the average shares method. |
(b) | Total return in the above table represents the rate that the investor would have earned or lost on an investment in the Small-Cap Equity Fund, assuming reinvestment of distributions. |
(c) | Portfolio turnover is calculated on the basis on the Small-Cap Equity Fund as a whole without distinguishing among the classes of shares. |
| | See accompanying notes which are an integral part of these financial statements. | 45 |
Fuller & Thaler Behavioral Small-Cap Equity Fund – Institutional Shares
Financial Highlights
(For a share outstanding during each year)
| | | For the Years Ended September 30, | |
| | | 2020 | | | 2019 | | | 2018 | | | 2017 | | | 2016 | |
Net asset value, beginning of year | | $ | 25.18 | | | $ | 26.55 | | | $ | 24.07 | | | $ | 18.85 | | | $ | 18.77 | |
Income from investment operations: | | | | | | | | | | | | | | | | | | | | |
Net investment income(a) | | | 0.09 | | | | 0.15 | | | | 0.15 | | | | 0.20 | | | | 0.23 | |
Net realized and unrealized gain (loss) on investments | | | (0.61 | )* | | | (1.40 | ) | | | 2.39 | | | | 5.11 | | | | 2.38 | |
Total from investment operations | | | (0.52 | ) | | | (1.25 | ) | | | 2.54 | | | | 5.31 | | | | 2.61 | |
Less distributions to shareholders from: | | | | | | | | | | | | | | | | | | | | |
Net investment income | | | (0.11 | ) | | | (0.12 | ) | | | (0.06 | ) | | | (0.09 | ) | | | (0.27 | ) |
Net realized gains | | | — | | | | — | | | | — | | | | — | | | | (2.26 | ) |
Total from distributions | | | (0.11 | ) | | | (0.12 | ) | | | (0.06 | ) | | | (0.09 | ) | | | (2.53 | ) |
Net asset value, end of year | | $ | 24.55 | | | $ | 25.18 | | | $ | 26.55 | | | $ | 24.07 | | | $ | 18.85 | |
Total Return(b) | | | (2.11 | )% | | | (4.65 | )% | | | 10.59 | % | | | 28.20 | % | | | 15.86 | % |
| | | | | | | | | | | | | | | | | | | | | |
Ratios and Supplemental Data: | | | | | | | | | | | | | | | | | | | | |
Net assets, end of year (000 omitted) | | $ | 2,089,639 | | | $ | 1,620,327 | | | $ | 915,898 | | | $ | 172,238 | | | $ | 2,113 | |
Before waiver or recoupment: | | | | | | | | | | | | | | | | | | | | |
Ratio of expenses to average net assets | | | 0.79 | % | | | 0.82 | % | | | 0.84 | % | | | 1.39 | % | | | 2.75 | % |
After waiver or recoupment: | | | | | | | | | | | | | | | | | | | | |
Ratio of net expenses to average net assets | | | 0.79 | % | | | 0.82 | % | | | 0.86 | % | | | 0.85 | % | | | 0.74 | % |
Ratio of net investment income to average net assets | | | 0.36 | % | | | 0.60 | % | | | 0.59 | % | | | 0.90 | % | | | 1.70 | % |
Portfolio turnover(c) | | | 54 | % | | | 38 | % | | | 35 | % | | | 26 | % | | | 194 | % |
* | The amount shown for a share outstanding throughout the period does not accord with the change in aggregate gains and losses in the portfolio of securities during the period due to the timing of sales and purchases of fund shares in relation to fluctuating market values during the period. |
(a) | Per share net investment income has been calculated using the average shares method. |
(b) | Total return in the above table represents the rate that the investor would have earned or lost on an investment in the Small-Cap Equity Fund, assuming reinvestment of distributions. |
(c) | Portfolio turnover is calculated on the basis on the Small-Cap Equity Fund as a whole without distinguishing among the classes of shares. |
46 | See accompanying notes which are an integral part of these financial statements. | |
Fuller & Thaler Behavioral Small-Cap Equity Fund – Investor Shares
Financial Highlights
(For a share outstanding during each year)
| | | For the Years Ended September 30, | |
| | | 2020 | | | 2019 | | | 2018 | | | 2017 | | | 2016 | |
Net asset value, beginning of year | | $ | 25.02 | | | $ | 26.36 | | | $ | 23.91 | | | $ | 18.75 | | | $ | 18.70 | |
Income from investment operations: | | | | | | | | | | | | | | | | | | | | |
Net investment income(a) | | | 0.02 | | | | 0.09 | | | | 0.08 | | | | 0.15 | | | | 0.20 | |
Net realized and unrealized gain (loss) on investments | | | (0.62 | )* | | | (1.38 | ) | | | 2.39 | | | | 5.09 | | | | 2.38 | |
Total from investment operations | | | (0.60 | ) | | | (1.29 | ) | | | 2.47 | | | | 5.24 | | | | 2.58 | |
Less distributions to shareholders from: | | | | | | | | | | | | | | | | | | | | |
Net investment income | | | (0.03 | ) | | | (0.05 | ) | | | (0.02 | ) | | | (0.08 | ) | | | (0.27 | ) |
Net realized gains | | | — | | | | — | | | | — | | | | — | | | | (2.26 | ) |
Total from distributions | | | (0.03 | ) | | | (0.05 | ) | | | (0.02 | ) | | | (0.08 | ) | | | (2.53 | ) |
Net asset value, end of year | | $ | 24.39 | | | $ | 25.02 | | | $ | 26.36 | | | $ | 23.91 | | | $ | 18.75 | |
Total Return(b) | | | (2.40 | )% | | | (4.89 | )% | | | 10.35 | % | | | 27.97 | % | | | 15.74 | % |
| | | | | | | | | | | | | | | | | | | | | |
Ratios and Supplemental Data: | | | | | | | | | | | | | | | | | | | | |
Net assets, end of year (000 omitted) | | $ | 139,789 | | | $ | 124,550 | | | $ | 144,856 | | | $ | 56,500 | | | $ | 4,319 | |
Before waiver or recoupment: | | | | | | | | | | | | | | | | | | | | |
Ratio of expenses to average net assets | | | 1.08 | % | | | 1.10 | % | | | 1.13 | % | | | 1.65 | % | | | 2.90 | % |
After waiver or recoupment: | | | | | | | | | | | | | | | | | | | | |
Ratio of net expenses to average net assets | | | 1.08 | % | | | 1.10 | % | | | 1.10 | % | | | 1.00 | % | | | 0.89 | % |
Ratio of net investment income to average net assets | | | 0.07 | % | | | 0.38 | % | | | 0.32 | % | | | 0.70 | % | | | 1.32 | % |
Portfolio turnover(c) | | | 54 | % | | | 38 | % | | | 35 | % | | | 26 | % | | | 194 | % |
* | The amount shown for a share outstanding throughout the period does not accord with the change in aggregate gains and losses in the portfolio of securities during the period due to the timing of sales and purchases of fund shares in relation to fluctuating market values during the period. |
(a) | Per share net investment income has been calculated using the average shares method. |
(b) | Total return in the above table represents the rate that the investor would have earned or lost on an investment in the Small-Cap Equity Fund, assuming reinvestment of distributions. |
(c) | Portfolio turnover is calculated on the basis on the Small-Cap Equity Fund as a whole without distinguishing among the classes of shares. |
| | See accompanying notes which are an integral part of these financial statements. | 47 |
Fuller & Thaler Behavioral Small-Cap Equity Fund – A Shares
Financial Highlights
(For a share outstanding during each period)
| | | For the
Year Ended
September 30,
2020 | | | For the
Period Ended
September 30,
2019(a) | |
Net asset value, beginning of period | | $ | 25.04 | | | $ | 20.99 | |
Income from investment operations: | | | | | | | | |
Net investment income (b) | | | 0.01 | | | | 0.07 | |
Net realized and unrealized gain (loss) on investments | | | (0.58 | )* | | | 3.98 | |
Total from investment operations | | | (0.57 | ) | | | 4.05 | |
Less distributions to shareholders from: | | | | | | | | |
Net investment income | | | (0.09 | ) | | | — | |
Total from distributions | | | (0.09 | ) | | | — | |
Net asset value, end of period | | $ | 24.38 | | | $ | 25.04 | |
Total Return (excludes sales charge) (c) | | | (2.31 | )% | | | 19.29 | %(d) |
| | | | | | | | | |
Ratios and Supplemental Data: | | | | | | | | |
Net assets, end of period (000 omitted) | | $ | 941 | | | $ | 575 | |
Before waiver or recoupment: | | | | | | | | |
Ratio of expenses to average net assets | | | 1.13 | % | | | 1.01 | %(e) |
After waiver or recoupment: | | | | | | | | |
Ratio of net expenses to average net assets | | | 1.13 | % | | | 1.01 | %(e) |
Ratio of net investment income to average net assets | | | 0.05 | % | | | 0.37 | %(e) |
Portfolio turnover(f) | | | 54 | % | | | 38 | %(d) |
* | The amount shown for a share outstanding throughout the period does not accord with the change in aggregate gains and losses in the portfolio of securities during the period due to the timing of sales and purchases of fund shares in relation to fluctuating market values during the period. |
(a) | For the period December 19, 2018 (commencement of operations) to September 30, 2019. |
(b) | Per share net investment income has been calculated using the average shares method. |
(c) | Total return in the above table represents the rate that the investor would have earned or lost on an investment in the Small-Cap Equity Fund, assuming reinvestment of distributions. |
(f) | Portfolio turnover is calculated on the basis on the Small-Cap Equity Fund as a whole without distinguishing among the classes of shares. |
48 | See accompanying notes which are an integral part of these financial statements. | |
Fuller & Thaler Behavioral Small-Cap Equity Fund – C Shares
Financial Highlights
(For a share outstanding during each period)
| | | For the
Year Ended
September 30,
2020 | | | For the
Period Ended
September 30,
2019(a) | |
Net asset value, beginning of period | | $ | 24.92 | | | $ | 20.99 | |
Income from investment operations: | | | | | | | | |
Net investment loss(b) | | | (0.12 | ) | | | (0.09 | ) |
Net realized and unrealized gain (loss) on investments | | | (0.61 | )* | | | 4.02 | |
Total from investment operations | | | (0.73 | ) | | | 3.93 | |
Less distributions to shareholders from: | | | | | | | | |
Net investment income | | | (0.03 | ) | | | — | |
Total from distributions | | | (0.03 | ) | | | — | |
Net asset value, end of period | | $ | 24.16 | | | $ | 24.92 | |
Total Return (excludes sales charge) (c) | | | (2.95 | )% | | | 18.72 | %(d) |
| | | | | | | | | |
Ratios and Supplemental Data: | | | | | | | | |
Net assets, end of period (000 omitted) | | $ | 2,987 | | | $ | 472 | |
Before waiver or recoupment: | | | | | | | | |
Ratio of expenses to average net assets | | | 1.69 | % | | | 1.72 | %(e) |
After waiver or recoupment: | | | | | | | | |
Ratio of net expenses to average net assets | | | 1.69 | % | | | 1.72 | %(e) |
Ratio of net investment loss to average net assets | | | (0.52 | )% | | | (0.46 | )%(e) |
Portfolio turnover(f) | | | 54 | % | | | 38 | %(d) |
* | The amount shown for a share outstanding throughout the period does not accord with the change in aggregate gains and losses in the portfolio of securities during the period due to the timing of sales and purchases of fund shares in relation to fluctuating market values during the period. |
(a) | For the period December 19, 2018 (commencement of operations) to September 30, 2019. |
(b) | Per share net investment income has been calculated using the average shares method. |
(c) | Total return in the above table represents the rate that the investor would have earned or lost on an investment in the Small-Cap Equity Fund, assuming reinvestment of distributions. |
(f) | Portfolio turnover is calculated on the basis on the Small-Cap Equity Fund as a whole without distinguishing among the classes of shares. |
| | See accompanying notes which are an integral part of these financial statements. | 49 |
Fuller & Thaler Behavioral Small-Cap Growth Fund - R6 Shares
Financial Highlights
(For a share outstanding during each period)
| | | For the
Year Ended
September 30,
2020 | | | For the
Year Ended
September 30,
2019 | | | For the
Period Ended
September 30,
2018(a) | |
Net asset value, beginning of period | | $ | 21.73 | | | $ | 26.95 | | | $ | 20.00 | |
Income from investment operations: | | | | | | | | | | | | |
Net investment loss(b) | | | (0.14 | ) | | | (0.10 | ) | | | (0.11 | ) |
Net realized and unrealized gain (loss) on investments | | | 6.53 | | | | (5.12 | ) | | | 7.06 | |
Total from investment operations | | | 6.39 | | | | (5.22 | ) | | | 6.95 | |
Net asset value, end of period | | $ | 28.12 | | | $ | 21.73 | | | $ | 26.95 | |
Total Return(c) | | | 29.41 | % | | | (19.37 | )% | | | 34.75 | %(d) |
| | | | | | | | | | | | | |
Ratios and Supplemental Data: | | | | | | | | | | | | |
Net assets, end of period (000 omitted) | | $ | 13,083 | | | $ | 2,191 | | | $ | 2,993 | |
Before waiver or recoupment: | | | | | | | | | | | | |
Ratio of expenses to average net assets | | | 1.63 | % | | | 2.19 | % | | | 4.42 | %(e) |
After waiver or recoupment: | | | | | | | | | | | | |
Ratio of net expenses to average net assets | | | 0.90 | % | | | 0.92 | %(f) | | | 0.90 | %(e) |
Ratio of net investment loss to average net assets | | | (0.57 | )% | | | (0.45 | )% | | | (0.60 | )%(e) |
Portfolio turnover(g) | | | 128 | % | | | 127 | % | | | 71 | %(d) |
(a) | For the period December 21, 2017 (commencement of operations) to September 30, 2018. |
(b) | Per share net investment income has been calculated using the average shares method. |
(c) | Total return in the above table represents the rate that the investor would have earned or lost on an investment in the Small-Cap Growth Fund, assuming reinvestment of distributions. |
(f) | Includes interest expense of 0.02% for the fiscal year ended September 30, 2019. |
(g) | Portfolio turnover is calculated on the basis on the Small-Cap Growth Fund as a whole without distinguishing among the classes of shares. |
50 | See accompanying notes which are an integral part of these financial statements. | |
Fuller & Thaler Behavioral Small-Cap Growth Fund - Institutional Shares
Financial Highlights
(For a share outstanding during each period)
| | | For the
Year Ended
September 30,
2020 | | | For the
Year Ended
September 30,
2019 | | | For the
Period Ended
September 30,
2018(a) | |
Net asset value, beginning of period | | $ | 21.69 | | | $ | 26.93 | | | $ | 20.00 | |
Income from investment operations: | | | | | | | | | | | | |
Net investment loss(b) | | | (0.16 | ) | | | (0.11 | ) | | | (0.14 | ) |
Net realized and unrealized gain (loss) on investments | | | 6.53 | | | | (5.13 | ) | | | 7.07 | |
Total from investment operations | | | 6.37 | | | | (5.24 | ) | | | 6.93 | |
Net asset value, end of period | | $ | 28.06 | | | $ | 21.69 | | | $ | 26.93 | |
Total Return(c) | | | 29.37 | % | | | (19.46 | )% | | | 34.65 | %(d) |
| | | | | | | | | | | | | |
Ratios and Supplemental Data: | | | | | | | | | | | | |
Net assets, end of period (000 omitted) | | $ | 44,808 | | | $ | 13,359 | | | $ | 9,257 | |
Before waiver or recoupment: | | | | | | | | | | | | |
Ratio of expenses to average net assets | | | 1.71 | % | | | 2.25 | % | | | 4.55 | %(e) |
After waiver or recoupment: | | | | | | | | | | | | |
Ratio of net expenses to average net assets | | | 0.99 | % | | | 1.00 | %(f) | | | 0.99 | %(e) |
Ratio of net investment loss to average net assets | | | (0.65 | )% | | | (0.48 | )% | | | (0.70 | )%(e) |
Portfolio turnover(g) | | | 128 | % | | | 127 | % | | | 71 | %(d) |
(a) | For the period December 21, 2017 (commencement of operations) to September 30, 2018. |
(b) | Per share net investment income has been calculated using the average shares method. |
(c) | Total return in the above table represents the rate that the investor would have earned or lost on an investment in the Small-Cap Growth Fund, assuming reinvestment of distributions. |
(f) | Includes interest expense of 0.01% for the fiscal year ended September 30, 2019. |
(g) | Portfolio turnover is calculated on the basis on the Small-Cap Growth Fund as a whole without distinguishing among the classes of shares. |
| | See accompanying notes which are an integral part of these financial statements. | 51 |
Fuller & Thaler Behavioral Small-Cap Growth Fund - Investor Shares
Financial Highlights
(For a share outstanding during each period)
| | | For the
Year Ended
September 30,
2020 | | | For the
Year Ended
September 30,
2019 | | | For the
Period Ended
September 30,
2018(a) | |
Net asset value, beginning of period | | $ | 21.60 | | | $ | 26.88 | | | $ | 20.00 | |
Income from investment operations: | | | | | | | | | | | | |
Net investment loss(b) | | | (0.22 | ) | | | (0.19 | ) | | | (0.18 | ) |
Net realized and unrealized gain (loss) on investments | | | 6.48 | | | | (5.09 | ) | | | 7.06 | |
Total from investment operations | | | 6.26 | | | | (5.28 | ) | | | 6.88 | |
Net asset value, end of period | | $ | 27.86 | | | $ | 21.60 | | | $ | 26.88 | |
Total Return(c) | | | 28.98 | % | | | (19.64 | )% | | | 34.40 | %(d) |
| | | | | | | | | | | | | |
Ratios and Supplemental Data: | | | | | | | | | | | | |
Net assets, end of period (000 omitted) | | $ | 781 | | | $ | 153 | | | $ | 481 | |
Before waiver or recoupment: | | | | | | | | | | | | |
Ratio of expenses to average net assets | | | 1.98 | % | | | 2.57 | % | | | 4.77 | %(e) |
After waiver or recoupment: | | | | | | | | | | | | |
Ratio of net expenses to average net assets | | | 1.25 | % | | | 1.27 | %(f) | | | 1.24 | %(e) |
Ratio of net investment loss to average net assets | | | (0.87 | )% | | | (0.85 | )% | | | (0.92 | )%(e) |
Portfolio turnover(g) | | | 128 | % | | | 127 | % | | | 71 | %(d) |
(a) | For the period December 21, 2017 (commencement of operations) to September 30, 2018. |
(b) | Per share net investment income has been calculated using the average shares method. |
(c) | Total return in the above table represents the rate that the investor would have earned or lost on an investment in the Small-Cap Growth Fund, assuming reinvestment of distributions. |
(f) | Includes interest expense of 0.02% for the fiscal year ended September 30, 2019. |
(g) | Portfolio turnover is calculated on the basis on the Small-Cap Growth Fund as a whole without distinguishing among the classes of shares. |
52 | See accompanying notes which are an integral part of these financial statements. | |
Fuller & Thaler Behavioral Small-Cap Growth Fund - A Shares
Financial Highlights
(For a share outstanding during each period)
| | | For the
Year Ended
September 30,
2020 | | | For the
Period Ended
September 30,
2019(a) | |
Net asset value, beginning of period | | $ | 21.59 | | | $ | 19.59 | |
Income from investment operations: | | | | | | | | |
Net investment loss(b) | | | (0.24 | ) | | | (0.13 | ) |
Net realized and unrealized gain on investments | | | 6.48 | | | | 2.13 | |
Total from investment operations | | | 6.24 | | | | 2.00 | |
Net asset value, end of period | | $ | 27.83 | | | $ | 21.59 | |
Total Return (excludes sales charge) (c) | | | 28.90 | % | | | 10.21 | %(d) |
| | | | | | | | | |
Ratios and Supplemental Data: | | | | | | | | |
Net assets, end of period (000 omitted) | | $ | 60 | | | $ | 4 | |
Before waiver or recoupment: | | | | | | | | |
Ratio of expenses to average net assets | | | 1.91 | % | | | 2.15 | %(e) |
After waiver or recoupment: | | | | | | | | |
Ratio of net expenses to average net assets | | | 1.30 | % | | | 1.30 | %(e) |
Ratio of net investment loss to average net assets | | | (0.95 | )% | | | (0.75 | )%(e) |
Portfolio turnover(f) | | | 128 | % | | | 127 | %(d) |
(a) | For the period December 19, 2018 (commencement of operations) to September 30, 2019. |
(b) | Per share net investment income has been calculated using the average shares method. |
(c) | Total return in the above table represents the rate that the investor would have earned or lost on an investment in the Small-Cap Growth Fund, assuming reinvestment of distributions. |
(f) | Portfolio turnover is calculated on the basis on the Small-Cap Growth Fund as a whole without distinguishing among the classes of shares. |
| | See accompanying notes which are an integral part of these financial statements. | 53 |
Fuller & Thaler Behavioral Small-Cap Growth Fund - C Shares
Financial Highlights
(For a share outstanding during each period)
| | | For the
Year Ended
September 30,
2020 | | | For the
Period Ended
September 30,
2019(a) | |
Net asset value, beginning of period | | $ | 21.51 | | | $ | 19.59 | |
Income from investment operations: | | | | | | | | |
Net investment loss(b) | | | (0.36 | ) | | | (0.22 | ) |
Net realized and unrealized gain on investments | | | 6.45 | | | | 2.14 | |
Total from investment operations | | | 6.09 | | | | 1.92 | |
Net asset value, end of period | | $ | 27.60 | | | $ | 21.51 | |
Total Return (excludes sales charge) (c) | | | 28.31 | % | | | 9.80 | %(d) |
| | | | | | | | | |
Ratios and Supplemental Data: | | | | | | | | |
Net assets, end of period (000 omitted) | | $ | 28 | | | $ | 2 | |
Before waiver or recoupment: | | | | | | | | |
Ratio of expenses to average net assets | | | 2.62 | % | | | 2.87 | %(e) |
After waiver or recoupment: | | | | | | | | |
Ratio of net expenses to average net assets | | | 1.80 | % | | | 1.80 | %(e) |
Ratio of net investment loss to average net assets | | | (1.45 | )% | | | (1.27 | )%(e) |
Portfolio turnover(f) | | | 128 | % | | | 127 | %(d) |
(a) | For the period December 19, 2018 (commencement of operations) to September 30, 2019. |
(b) | Per share net investment income has been calculated using the average shares method. |
(c) | Total return in the above table represents the rate that the investor would have earned or lost on an investment in the Small-Cap Growth Fund, assuming reinvestment of distributions. |
(f) | Portfolio turnover is calculated on the basis on the Small-Cap Growth Fund as a whole without distinguishing among the classes of shares. |
54 | See accompanying notes which are an integral part of these financial statements. | |
Fuller & Thaler Behavioral Mid-Cap Value Fund - R6 Shares
Financial Highlights
(For a share outstanding during each period)
| | | For the
Year Ended
September 30,
2020 | | | For the
Year Ended
September 30,
2019 | | | For the
Period Ended
September 30,
2018(a) | |
Net asset value, beginning of period | | $ | 21.49 | | | $ | 20.56 | | | $ | 20.00 | |
Income from investment operations: | | | | | | | | | | | | |
Net investment income(b) | | | 0.27 | | | | 0.20 | | | | 0.13 | |
Net realized and unrealized gain (loss) on investments | | | (2.47 | ) | | | 0.85 | | | | 0.43 | |
Total from investment operations | | | (2.20 | ) | | | 1.05 | | | | 0.56 | |
Less distributions to shareholders from: | | | | | | | | | | | | |
Net investment income | | | (0.15 | ) | | | (0.11 | ) | | | — | |
Net realized gains | | | (0.14 | ) | | | (0.01 | ) | | | — | |
Total from distributions | | | (0.29 | ) | | | (0.12 | ) | | | — | |
Net asset value, end of period | | $ | 19.00 | | | $ | 21.49 | | | $ | 20.56 | |
Total Return(c) | | | (10.42 | )% | | | 5.23 | % | | | 2.80 | %(d) |
| | | | | | | | | | | | | |
Ratios and Supplemental Data: | | | | | | | | | | | | |
Net assets, end of period (000 omitted) | | $ | 24,324 | | | $ | 2,403 | | | $ | 2,361 | |
Before waiver or recoupment: | | | | | | | | | | | | |
Ratio of expenses to average net assets | | | 1.39 | % | | | 1.72 | % | | | 4.29 | %(e) |
After waiver or recoupment: | | | | | | | | | | | | |
Ratio of net expenses to average net assets | | | 0.80 | % | | | 0.80 | % | | | 0.80 | %(e) |
Ratio of net investment income to average net assets | | | 1.36 | % | | | 0.98 | % | | | 0.82 | %(e) |
Portfolio turnover(f) | | | 30 | % | | | 12 | % | | | 0.44 | %(d) |
(a) | For the period December 21, 2017 (commencement of operations) to September 30, 2018. |
(b) | Per share net investment income has been calculated using the average shares method. |
(c) | Total return in the above table represents the rate that the investor would have earned or lost on an investment in the Mid-Cap Value Fund, assuming reinvestment of distributions. |
(f) | Portfolio turnover is calculated on the basis on the Mid-Cap Value Fund as a whole without distinguishing among the classes of shares. |
| | See accompanying notes which are an integral part of these financial statements. | 55 |
Fuller & Thaler Behavioral Mid-Cap Value Fund - Institutional Shares
Financial Highlights
(For a share outstanding during each period)
| | | For the
Year Ended
September 30,
2020 | | | For the
Year Ended
September 30,
2019 | | | For the
Period Ended
September 30,
2018(a) | |
Net asset value, beginning of period | | $ | 21.47 | | | $ | 20.56 | | | $ | 20.00 | |
Income from investment operations: | | | | | | | | | | | | |
Net investment income(b) | | | 0.21 | | | | 0.18 | | | | 0.14 | |
Net realized and unrealized gain (loss) on investments | | | (2.43 | ) | | | 0.85 | | | | 0.42 | |
Total from investment operations | | | (2.22 | ) | | | 1.03 | | | | 0.56 | |
Less distributions to shareholders from: | | | | | | | | | | | | |
Net investment income | | | (0.13 | ) | | | (0.11 | ) | | | — | |
Net realized gains | | | (0.14 | ) | | | (0.01 | ) | | | — | |
Total from distributions | | | (0.27 | ) | | | (0.12 | ) | | | — | |
Net asset value, end of period | | $ | 18.98 | | | $ | 21.47 | | | $ | 20.56 | |
Total Return(c) | | | (10.51 | )% | | | 5.09 | % | | | 2.80 | %(d) |
| | | | | | | | | | | | | |
Ratios and Supplemental Data: | | | | | | | | | | | | |
Net assets, end of period (000 omitted) | | $ | 9,826 | | | $ | 12,511 | | | $ | 10,621 | |
Before waiver or recoupment: | | | | | | | | | | | | |
Ratio of expenses to average net assets | | | 1.49 | % | | | 1.81 | % | | | 4.41 | %(e) |
After waiver or recoupment: | | | | | | | | | | | | |
Ratio of net expenses to average net assets | | | 0.90 | % | | | 0.90 | % | | | 0.89 | %(e) |
Ratio of net investment income to average net assets | | | 1.05 | % | | | 0.90 | % | | | 0.89 | %(e) |
Portfolio turnover(f) | | | 30 | % | | | 12 | % | | | 0.44 | %(d) |
(a) | For the period December 21, 2017 (commencement of operations) to September 30, 2018. |
(b) | Per share net investment income has been calculated using the average shares method. |
(c) | Total return in the above table represents the rate that the investor would have earned or lost on an investment in the Mid-Cap Value Fund, assuming reinvestment of distributions. |
(f) | Portfolio turnover is calculated on the basis on the Mid-Cap Value Fund as a whole without distinguishing among the classes of shares. |
56 | See accompanying notes which are an integral part of these financial statements. | |
Fuller & Thaler Behavioral Mid-Cap Value Fund - Investor Shares
Financial Highlights
(For a share outstanding during each period)
| | | For the
Year Ended
September 30,
2020 | | | For the
Year Ended
September 30,
2019 | | | For the
Period Ended
September 30,
2018(a) | |
Net asset value, beginning of period | | $ | 21.39 | | | $ | 20.50 | | | $ | 20.00 | |
Income from investment operations: | | | | | | | | | | | | |
Net investment income(b) | | | 0.15 | | | | 0.14 | | | | 0.10 | |
Net realized and unrealized gain (loss) on investments | | | (2.41 | ) | | | 0.84 | | | | 0.40 | |
Total from investment operations | | | (2.26 | ) | | | 0.98 | | | | 0.50 | |
Less distributions to shareholders from: | | | | | | | | | | | | |
Net investment income | | | (0.09 | ) | | | (0.08 | ) | | | — | |
Net realized gains | | | (0.14 | ) | | | (0.01 | ) | | | — | |
Total from distributions | | | (0.23 | ) | | | (0.09 | ) | | | — | |
Net asset value, end of period | | $ | 18.90 | | | $ | 21.39 | | | $ | 20.50 | |
Total Return(c) | | | (10.72 | )% | | | 4.84 | % | | | 2.50 | %(d) |
| | | | | | | | | | | | | |
Ratios and Supplemental Data: | | | | | | | | | | | | |
Net assets, end of period (000 omitted) | | $ | 1,043 | | | $ | 1,676 | | | $ | 344 | |
Before waiver or recoupment: | | | | | | | | | | | | |
Ratio of expenses to average net assets | | | 1.76 | % | | | 2.10 | % | | | 4.65 | %(e) |
After waiver or recoupment: | | | | | | | | | | | | |
Ratio of net expenses to average net assets | | | 1.15 | % | | | 1.15 | % | | | 1.14 | %(e) |
Ratio of net investment income to average net assets | | | 0.78 | % | | | 0.70 | % | | | 0.65 | %(e) |
Portfolio turnover(f) | | | 30 | % | | | 12 | % | | | 0.44 | %(d) |
(a) | For the period December 21, 2017 (commencement of operations) to September 30, 2018. |
(b) | Per share net investment income has been calculated using the average shares method. |
(c) | Total return in the above table represents the rate that the investor would have earned or lost on an investment in the Mid-Cap Value Fund, assuming reinvestment of distributions. |
(f) | Portfolio turnover is calculated on the basis on the Mid-Cap Value Fund as a whole without distinguishing among the classes of shares. |
| | See accompanying notes which are an integral part of these financial statements. | 57 |
Fuller & Thaler Behavioral Unconstrained Equity Fund - R6 Shares
Financial Highlights
(For a share outstanding during each period)
| | | For the
Year Ended
September 30,
2020 | | | For the
Period Ended
September 30,
2019(a) | |
Net asset value, beginning of period | | $ | 25.83 | | | $ | 20.00 | |
Income from investment operations: | | | | | | | | |
Net investment income(b) | | | 0.04 | | | | 0.07 | |
Net realized and unrealized gain on investments | | | 1.82 | | | | 5.76 | |
Total from investment operations | | | 1.86 | | | | 5.83 | |
Less distributions to shareholders from: | | | | | | | | |
Net investment income | | | (0.10 | ) | | | — | |
Net realized gains | | | (0.12 | ) | | | — | |
Total from distributions | | | (0.22 | ) | | | — | |
Net asset value, end of period | | $ | 27.47 | | | $ | 25.83 | |
Total Return(c) | | | 7.22 | % | | | 29.15 | %(d) |
| | | | | | | | | |
Ratios and Supplemental Data: | | | | | | | | |
Net assets, end of period (000 omitted) | | $ | 43,131 | | | $ | 1,368 | |
Before waiver or recoupment: | | | | | | | | |
Ratio of expenses to average net assets | | | 1.67 | % | | | 4.33 | %(e) |
After waiver or recoupment: | | | | | | | | |
Ratio of net expenses to average net assets | | | 0.90 | % | | | 0.90 | %(e) |
Ratio of net investment income to average net assets | | | 0.15 | % | | | 0.41 | %(e) |
Portfolio turnover(f) | | | 32 | % | | | 10 | %(d) |
(a) | For the period December 26, 2018 (commencement of operations) to September 30, 2019. |
(b) | Per share net investment income has been calculated using the average shares method. |
(c) | Total return in the above table represents the rate that the investor would have earned or lost on an investment in the Unconstrained Equity Fund, assuming reinvestment of distributions. |
(f) | Portfolio turnover is calculated on the basis on the Unconstrained Equity Fund as a whole without distinguishing among the classes of shares. |
58 | See accompanying notes which are an integral part of these financial statements. | |
Fuller & Thaler Behavioral Unconstrained Equity Fund - Institutional Shares
Financial Highlights
(For a share outstanding during each period)
| | | For the
Year Ended
September 30,
2020 | | | For the
Period Ended
September 30,
2019(a) | |
Net asset value, beginning of period | | $ | 25.81 | | | $ | 20.00 | |
Income from investment operations: | | | | | | | | |
Net investment income(b) | | | 0.01 | | | | 0.08 | |
Net realized and unrealized gain on investments | | | 1.81 | | | | 5.73 | |
Total from investment operations | | | 1.82 | | | | 5.81 | |
Less distributions to shareholders from: | | | | | | | | |
Net investment income | | | (0.08 | ) | | | — | |
Net realized gains | | | (0.12 | ) | | | — | |
Total from distributions | | | (0.20 | ) | | | — | |
Net asset value, end of period | | $ | 27.43 | | | $ | 25.81 | |
Total Return(c) | | | 7.09 | % | | | 29.05 | %(d) |
| | | | | | | | | |
Ratios and Supplemental Data: | | | | | | | | |
Net assets, end of period (000 omitted) | | $ | 8,004 | | | $ | 3,265 | |
Before waiver or recoupment: | | | | | | | | |
Ratio of expenses to average net assets | | | 1.77 | % | | | 4.39 | %(e) |
After waiver or recoupment: | | | | | | | | |
Ratio of net expenses to average net assets | | | 0.99 | % | | | 0.99 | %(e) |
Ratio of net investment income to average net assets | | | 0.03 | % | | | 0.42 | %(e) |
Portfolio turnover(f) | | | 32 | % | | | 10 | %(d) |
(a) | For the period December 26, 2018 (commencement of operations) to September 30, 2019. |
(b) | Per share net investment income has been calculated using the average shares method. |
(c) | Total return in the above table represents the rate that the investor would have earned or lost on an investment in the Unconstrained Equity Fund, assuming reinvestment of distributions. |
(f) | Portfolio turnover is calculated on the basis on the Unconstrained Equity Fund as a whole without distinguishing among the classes of shares. |
| | See accompanying notes which are an integral part of these financial statements. | 59 |
Fuller & Thaler Behavioral Small-Mid Core Equity Fund - Institutional Shares
Financial Highlights
(For a share outstanding during each period)
| | | For the
Year Ended
September 30,
2020 | | | For the
Period Ended
September 30,
2019(a) | |
Net asset value, beginning of period | | $ | 23.96 | | | $ | 20.00 | |
Income from investment operations: | | | | | | | | |
Net investment income(b) | | | 0.13 | | | | 0.13 | |
Net realized and unrealized gain on investments | | | 0.04 | * | | | 3.83 | |
Total from investment operations | | | 0.17 | | | | 3.96 | |
Less distributions to shareholders from: | | | | | | | | |
Net investment income | | | (0.15 | ) | | | — | |
Net realized gains | | | (0.39 | ) | | | — | |
Total from distributions | | | (0.54 | ) | | | — | |
Net asset value, end of period | | $ | 23.59 | | | $ | 23.96 | |
Total Return(c) | | | 0.63 | % | | | 19.80 | %(d) |
| | | | | | | | | |
Ratios and Supplemental Data: | | | | | | | | |
Net assets, end of period (000 omitted) | | $ | 3,102 | | | $ | 2,494 | |
Before waiver or recoupment: | | | | | | | | |
Ratio of expenses to average net assets | | | 4.09 | % | | | 6.27 | %(e) |
After waiver or recoupment: | | | | | | | | |
Ratio of net expenses to average net assets | | | 0.95 | % | | | 0.95 | %(e) |
Ratio of net investment income to average net assets | | | 0.59 | % | | | 0.73 | %(e) |
Portfolio turnover | | | 35 | % | | | 25 | %(d) |
* | The amount shown for a share outstanding throughout the period does not accord with the change in aggregate gains and losses in the portfolio of securities during the period due to the timing of sales and purchases of fund shares in relation to fluctuating market values during the period. |
(a) | For the period December 26, 2018 (commencement of operations) to September 30, 2019. |
(b) | Per share net investment income has been calculated using the average shares method. |
(c) | Total return in the above table represents the rate that the investor would have earned or lost on an investment in the Small-Mid Core Equity Fund, assuming reinvestment of distributions. |
60 | See accompanying notes which are an integral part of these financial statements. | |
Fuller & Thaler Behavioral Micro-Cap Equity Fund - Institutional Shares
Financial Highlights
(For a share outstanding during each period)
| | | For the
Year Ended
September 30,
2020 | | | For the
Period Ended
September 30,
2019(a) | |
Net asset value, beginning of period | | $ | 21.70 | | | $ | 20.00 | |
Income from investment operations: | | | | | | | | |
Net investment income (loss)(b) | | | 0.16 | | | | (0.20 | ) |
Net realized and unrealized gain (loss) on investments | | | (2.95 | ) | | | 1.90 | |
Total from investment operations | | | (2.79 | ) | | | 1.70 | |
Less distributions to shareholders from: | | | | | | | | |
Net realized gains | | | (1.12 | ) | | | — | |
Total from distributions | | | (1.12 | ) | | | — | |
Net asset value, end of period | | $ | 17.79 | | | $ | 21.70 | |
Total Return(c) | | | (13.88 | )% | | | 8.50 | %(d) |
| | | | | | | | | |
Ratios and Supplemental Data: | | | | | | | | |
Net assets, end of period (000 omitted) | | $ | 5,770 | | | $ | 2,819 | |
Before waiver or recoupment: | | | | | | | | |
Ratio of expenses to average net assets | | | 4.33 | % | | | 5.28 | %(e) |
After waiver or recoupment: | | | | | | | | |
Ratio of net expenses to average net assets | | | 1.75 | % | | | 1.75 | %(e) |
Ratio of net investment income (loss) to average net assets | | | 0.90 | % | | | (1.16 | )%(e) |
Portfolio turnover | | | 82 | % | | | 42 | %(d) |
(a) | For the period December 28, 2018 (commencement of operations) to September 30, 2019. |
(b) | Per share net investment income has been calculated using the average shares method. |
(c) | Total return in the above table represents the rate that the investor would have earned or lost on an investment in the Micro-Cap Equity Fund, assuming reinvestment of distributions. |
| | See accompanying notes which are an integral part of these financial statements. | 61 |
Fuller & Thaler Funds
Notes to the Financial Statements
September 30, 2020
NOTE 1. ORGANIZATION
The Fuller & Thaler Behavioral Small-Cap Equity Fund (the “Small-Cap Equity Fund”), the Fuller & Thaler Behavioral Small-Cap Growth Fund (the “Small-Cap Growth Fund”), the Fuller & Thaler Behavioral Mid-Cap Value Fund (the “Mid-Cap Value Fund”), the Fuller & Thaler Behavioral Unconstrained Equity Fund (the “Unconstrained Equity Fund”), the Fuller & Thaler Behavioral Small-Mid Core Equity Fund (the “Small-Mid Core Equity Fund”) and the Fuller & Thaler Behavioral Micro-Cap Equity Fund (the “Micro-Cap Equity Fund”) (each a “Fund” and, collectively the “Funds”) were each organized as a diversified (Unconstrained Equity Fund is non-diversified) series of Capitol Series Trust (the “Trust”). The Trust is an open-end investment company established under the laws of Ohio by an Agreement and Declaration of Trust dated September 18, 2013 (the “Trust Agreement”). The Trust Agreement permits the Board of Trustees of the Trust (“the Board”) to issue an unlimited number of shares of beneficial interest of separate series without par value. The Funds’ investment adviser is Fuller & Thaler Asset Management, Inc. (the “Adviser” or “Fuller & Thaler”). The investment objective of each Fund is to seek long-term capital appreciation.
The Small Cap Equity Fund and Small Cap Growth Fund each currently offer five share classes: R6 Shares, Institutional Shares, Investor Shares, A Shares and C Shares. The Mid-Cap Value Fund currently offers three share classes: R6 Shares, Institutional Shares and Investor Shares. The Unconstrained Equity Fund currently offers two share classes: R6 Shares and Institutional Shares. The Small-Mid Core Equity Fund and Micro-Cap Equity Fund each currently offers one share class: Institutional Shares. A Shares have a maximum sales charge on purchases of up to 5.75% and a Contingent Deferred Sales Charge (“CDSC”) on redemptions made within 12 months from the date of purchase and a CDSC of 0.50% on redemptions made more than 12 months but less than 18 months from the date of purchase. C Shares impose a 1.00% CDSC on redemptions made within 12 months from the date of purchase. A Shares and C Shares may be purchased without a sales charge under certain circumstances. Each share represents an equal proportionate interest in the assets and liabilities belonging to each Fund and is entitled to such dividends and distributions out of income belonging to each Fund as are declared by the Board.
The Small-Cap Equity Fund is the accounting successor to a series of Allianz Funds Multi-Strategy Trust, which commenced operations on September 8, 2011, and for which the Adviser served as the sole sub-adviser (the “Predecessor Fund”). In a transaction that was consummated on October 23, 2015 (the “Reorganization”), the Small-Cap Equity Fund acquired the assets and liabilities of: the A, C, and D Classes of the Predecessor Fund, which became the Investor Shares of the Small-Cap Equity Fund; the Class P Shares of the Predecessor Fund, which became the Institutional Shares of the Small-Cap Equity Fund; and the Institutional Shares of the Predecessor Fund, which became the R6 Shares of the Small-Cap Equity Fund.
NOTE 2. SIGNIFICANT ACCOUNTING POLICIES
The Funds are investment companies and follow accounting and reporting guidance under Financial Accounting Standards Board Accounting Standards Codification (“ASC”) Topic 946, “Financial Services-Investment Companies.” The following is a summary of significant accounting policies followed by the Funds in the preparation of their financial statements. These policies are in conformity with the generally accepted accounting principles in the United States of America (“GAAP”).
62
Fuller & Thaler Funds
Notes to the Financial Statements (continued)
September 30, 2020
Estimates – The preparation of financial statements in conformity with GAAP requires management to make estimates and assumptions that affect the reported amounts of assets and liabilities and disclosure of contingent assets and liabilities at the date of the financial statements and the reported amounts of increases and decreases in net assets from operations during the reporting period. Actual results could differ from those estimates.
Foreign Currency Translation – The accounting records of the Funds are maintained in U.S. dollars. Foreign currency amounts are translated into U.S. dollars at the current rate of exchange each business day to determine the value of investments, and other assets and liabilities. Purchases and sales of foreign securities, and income and expenses, are translated at the prevailing rate of exchange on the respective date of these transactions. The Funds do not isolate that portion of the results of operations resulting from changes in foreign exchange rates on investments from fluctuation arising from changes in market prices of securities held. These fluctuations are included with the unrealized gain or loss from investments.
Federal Income Taxes – The Funds make no provision for federal income or excise tax. Each Fund has qualified and intends to qualify each year as a regulated investment company (“RIC”) under subchapter M of the Internal Revenue Code of 1986, as amended, by complying with the requirements applicable to RICs and by distributing substantially all of its taxable income. Each Fund also intends to distribute sufficient net investment income and net capital gains, if any, so that it will not be subject to excise tax on undistributed income and gains. If the required amount of net investment income or gains is not distributed, the Fund could incur a tax expense.
The Funds may be subject to taxes imposed by countries in which they invest. Such taxes are generally based on income and/or capital gains earned or repatriated. Taxes are accrued and applied to net investment income, net realized gains and unrealized appreciation as such income and/or gains are earned.
The Funds recognize tax benefits or expenses of uncertain tax positions only when the position is “more likely than not” to be sustained assuming examination by tax authorities. Management of the Funds has reviewed tax positions taken in tax years that remain subject to examination by all major tax jurisdictions, including federal (i.e., the previous three tax year ends and the interim tax period since then, as applicable) and has concluded that no provision for unrecognized tax benefits or expenses is required in these financial statements and does not expect this to change over the next twelve months. The Funds recognize interest and penalties, if any, related to unrecognized tax benefits as income tax expense in the Statements of Operations. During the period, the Funds did not incur any interest or penalties.
Expenses – Expenses incurred by the Trust that do not relate to a specific fund of the Trust are allocated to the individual funds based on each fund’s relative net assets or another appropriate basis (as determined by the Board). Expenses specifically attributable to any class are borne by that class. Income, realized gains and losses, unrealized appreciation and depreciation, and fund-wide expenses not allocated to a particular class shall be allocated to each class based on the net assets of that class in relation to the net assets of the entire fund.
63
Fuller & Thaler Funds
Notes to the Financial Statements (continued)
September 30, 2020
Security Transactions and Related Income – Throughout the reporting period, security transactions are accounted for no later than one business day following the trade date. For financial reporting purposes, security transactions are accounted for on trade date on the last business day of the reporting period. The specific identification method is used for determining gains or losses for financial statements and income tax purposes. Dividend income is recorded on the ex-dividend date. Dividend income from real estate investment trusts (REITs) and distributions from limited partnerships are recognized on the ex-date and included in dividend income. The calendar year-end classification of distributions received from REITs, which may include return of capital, during the fiscal year are reported subsequent to year end; accordingly, the Fund estimates the character of REIT distributions based on the most recent information available. Income or loss from limited partnerships is reclassified among the components of net assets upon receipt of K-1’s. Withholding taxes on foreign dividends, if any, have been recorded for in accordance with the Fund’s understanding of the applicable country’s tax rules and rates.
Dividends and Distributions – Each Fund intends to distribute its net investment income and net realized long-term and short-term capital gains, if any, at least annually. Dividends and distributions to shareholders, which are determined in accordance with income tax regulations, are recorded on the ex-dividend date. The treatment for financial reporting purposes of distributions made to shareholders during the period from net investment income or net realized capital gains may differ from their ultimate treatment for federal income tax purposes. These differences are caused primarily by differences in the timing of the recognition of certain components of income, expense or realized capital gain for federal income tax purposes. Where such differences are permanent in nature, they are reclassified among the components of the net assets based on their ultimate characterization for federal income tax purposes. Any such reclassifications will have no effect on net assets, results of operations or net asset value (“NAV”) per share of the Funds.
For the fiscal year ended September 30, 2020, the Funds made the following reclassifications to increase (decrease) the components of net assets:
| | | Paid-In
Capital | | | Accumulated
Earnings
(Deficit) | |
Small-Cap Equity Fund | | $ | — | | | $ | — | |
Small-Cap Growth Fund | | | (91,707 | ) | | | 91,707 | |
Mid-Cap Value Fund | | | 5,848 | | | | (5,848 | ) |
Unconstrained Equity Fund | | | (6 | ) | | | 6 | |
Small-Mid Core Equity Fund | | | — | | | | — | |
Micro-Cap Equity Fund | | | — | | | | — | |
Organization and Offering Costs – The Adviser advanced some of the Funds’ organization and initial offering costs and was subsequently reimbursed by the Funds. Costs of $10,250, $10,235 and $10,208 incurred in connection with the offering and initial registration of the Unconstrained Equity Fund, Small-Mid Core Equity Fund and Micro-Cap Equity Fund, respectively, have been deferred and are being amortized on a straight-line basis over the first twelve months after commencement of operations. There were no unamortized offering costs remaining as of September 30, 2020 in the Unconstrained Equity Fund, Small-Mid Core Equity Fund and Micro-Cap Equity Fund.
64
Fuller & Thaler Funds
Notes to the Financial Statements (continued)
September 30, 2020
NOTE 3. SECURITIES VALUATION AND FAIR VALUE MEASUREMENTS
Fair value is defined as the price that a Fund would receive upon selling an investment in a timely transaction to an independent buyer in the principal or most advantageous market of the investment. GAAP establishes a three-tier hierarchy to maximize the use of observable market data and minimize the use of unobservable inputs and to establish classification of fair value measurements for disclosure purposes.
Inputs refer broadly to the assumptions that market participants would use in pricing the asset or liability, including assumptions about risk (the risk inherent in a particular valuation technique used to measure fair value including a pricing model and/or the risk inherent in the inputs to the valuation technique). Inputs may be observable or unobservable. Observable inputs are inputs that reflect the assumptions market participants would use in pricing the asset or liability developed based on market data obtained and available from sources independent of the reporting entity. Unobservable inputs are inputs that reflect the reporting entity’s own assumptions about the assumptions market participants would use in pricing the asset or liability developed based on the best information available in the circumstances.
Various inputs are used in determining the value of each Fund’s investments. These inputs are summarized in the three broad levels listed below.
| | ● | Level 1 – unadjusted quoted prices in active markets for identical investments and/or registered investment companies where the value per share is determined and published and is the basis for current transactions for identical assets or liabilities at the valuation date |
| | ● | Level 2 – other significant observable inputs (including, but not limited to, quoted prices for an identical security in an inactive market, quoted prices for similar securities, interest rates, prepayment speeds, credit risk, etc.) |
| | ● | Level 3 – significant unobservable inputs (including the Funds’ own assumptions in determining fair value of investments based on the best information available) |
The inputs used to measure fair value may fall into different levels of the fair value hierarchy. In such cases, for disclosure purposes, the level in the fair value hierarchy which is reported, is determined based on the lowest level input that is significant to the fair value measurement in its entirety.
In computing the NAV of the Funds, fair value is based on market valuations with respect to portfolio securities for which market quotations are readily available. Pursuant to Board approved policies, the Funds rely on independent third-party pricing services to provide the current market value of securities. Those pricing services value equity securities, including exchange-traded funds, exchange-traded notes, closed-end funds and preferred stocks, traded on a securities exchange at the last reported sales price on the principal exchange. Equity securities quoted by NASDAQ are valued at the NASDAQ Official Closing Price. If there is no reported sale on the principal exchange, equity securities are valued at the mean between the most recent quoted bid and asked price. When using the market quotations or close prices provided by the pricing service and when the market is considered active, the security will be classified as a Level 1 security. Investments in open-end mutual funds, including money market mutual funds, are generally priced at the ending NAV provided by the pricing service of the funds and are generally categorized as Level 1 securities.
65
Fuller & Thaler Funds
Notes to the Financial Statements (continued)
September 30, 2020
In the event that market quotations are not readily available, the Adviser determines that the market quotation or the price provided by the pricing service does not accurately reflect the current fair value, or certain restricted or illiquid securities are being valued, such securities are valued as determined in good faith by the Trust’s Valuation Committee, based on recommendations from a pricing committee comprised of certain officers of the Trust, certain employees of the Fund’s administrator, and representatives of the Adviser (together the “Pricing Review Committee”). These securities will be classified as Level 2 or 3 within the fair value hierarchy, depending on the inputs used.
In accordance with the Trust’s Portfolio Valuation Procedures, the Pricing Review Committee, in making its recommendations, is required to consider all appropriate factors relevant to the value of securities for which it has determined other pricing sources are not available or reliable as described above. No single standard exists for determining fair value, because fair value depends upon the circumstances of each individual case. As a general principle, the current fair value of an issue of securities being valued pursuant to the Trust’s Fair Value Guidelines would be the amount which the Funds might reasonably expect to receive for them upon their current sale. Methods which are in accordance with this principle may, for example, be based on (i) a multiple of earnings; (ii) a discount from market prices of a similar freely traded security (including a derivative security or a basket of securities traded on other markets, exchanges or among dealers); or (iii) yield to maturity with respect to debt issues, or a combination of these and other methods. Fair value pricing is permitted if, in accordance with the Trust’s Portfolio Valuation Procedures, the validity of market quotations appears to be questionable based on factors such as evidence of a thin market in the security based on a small number of quotations, a significant event occurs after the close of a market but before each Fund’s NAV calculation that may affect a security’s value, or other data calls into question the reliability of market quotations.
66
Fuller & Thaler Funds
Notes to the Financial Statements (continued)
September 30, 2020
The following is a summary of the inputs used to value the Funds’ investments as of September 30, 2020:
| | | Valuation Inputs | | | | | |
Small-Cap Equity Fund | | Level 1 | | | Level 2 | | | Level 3 | | | Total | |
Common Stocks(a) | | $ | 2,582,890,743 | | | $ | — | | | $ | — | | | $ | 2,582,890,743 | |
Preferred Stocks(a) | | | 669,961 | | | | — | | | | — | | | | 669,961 | |
Money Market Funds | | | 266,343,352 | | | | — | | | | — | | | | 266,343,352 | |
Total | | $ | 2,849,904,056 | | | $ | — | | | $ | — | | | $ | 2,849,904,056 | |
| | | | | | | | | | | | | | | | | |
Small-Cap Growth Fund | | | | | | | | | | | | |
Common Stocks(a) | | $ | 56,807,811 | | | $ | — | | | $ | — | | | $ | 56,807,811 | |
| | | | | | | | | | | | | | | | | |
Mid-Cap Value Fund | | | | | | | | | | | | |
Common Stocks(a) | | $ | 35,099,263 | | | $ | — | | | $ | — | | | $ | 35,099,263 | |
| | | | | | | | | | | | | | | | | |
Unconstrained Equity Fund | | | | | | | | | | | | |
Common Stocks(a) | | $ | 50,370,037 | | | $ | — | | | $ | — | | | $ | 50,370,037 | |
| | | | | | | | | | | | | | | | | |
Small-Mid Core Equity Fund | | | | | | | | | | | | |
Common Stocks(a) | | $ | 3,040,995 | | | $ | — | | | $ | — | | | $ | 3,040,995 | |
| | | | | | | | | | | | | | | | | |
Micro-Cap Equity Fund | | | | | | | | | | | | |
Common Stocks(a) | | $ | 5,662,653 | | | $ | — | | | $ | — | | | $ | 5,662,653 | |
(a) | Refer to Schedule of Investments for industry classifications. |
The Funds did not hold any investments at the end of the reporting period for which significant unobservable inputs (Level 3) were used in determining fair value; therefore, no reconciliation of Level 3 securities is included for this reporting period.
NOTE 4. FEES AND OTHER TRANSACTIONS WITH AFFILIATES AND OTHER SERVICE PROVIDERS
Under the terms of the investment advisory agreement (the “Agreement”), the Adviser manages each Fund’s investments subject to approval of the Board. As compensation for its management services, the Funds are obligated to pay the Adviser a fee computed and accrued daily and paid monthly as follows:
| | | Small-Cap
Equity
Fund | | | Small-Cap
Growth
Fund | | | Mid-Cap
Value
Fund | | |
Unconstrained
Equity
Fund
| | | Small-Mid
Core Equity
Fund | | | Micro-Cap
Equity
Fund | |
Investment Advisory fee rate | | | 0.60 | % | | | 0.85 | % | | | 0.75 | % | | | 0.85 | % | | | 0.80 | % | | | 1.50 | % |
Investment Advisory fee earned | | $ | 13,643,463 | | | $ | 237,040 | | | $ | 142,182 | | | $ | 243,017 | | | $ | 21,031 | | | $ | 54,269 | |
Fees waived by Adviser | | $ | — | | | $ | (153,508 | ) | | $ | (103,543 | ) | | $ | (88,162 | ) | | $ | (81,772 | ) | | $ | (87,750 | ) |
Payable to/(Receivable from) Adviser | | $ | 1,374,825 | | | $ | 25,178 | | | $ | 10,745 | | | $ | 27,618 | | | $ | (5,232 | ) | | $ | (342 | ) |
67
Fuller & Thaler Funds
Notes to the Financial Statements (continued)
September 30, 2020
The Adviser has contractually agreed to waive its management fee and/or reimburse expenses so that total annual operating expenses (excluding (i) interest; (ii) taxes; (iii) brokerage fees and commissions; (iv) other extraordinary expenses not incurred in the ordinary course of the Funds business; and (v) indirect expenses such as acquired fund fees and expenses) do not exceed the following percentages of each Fund’s average daily net assets through January 31, 2021 (“Expense Limitation”):
| | R6 Shares | | Institutional
Shares | | Investor
Shares | | A Shares | | C Shares | |
Small-Cap Equity Fund | 0.80% | | 0.99% | | 1.25% | | 1.30% | | 1.80% | |
Small-Cap Growth Fund | 0.90% | | 0.99% | | 1.25% | | 1.30% | | 1.80% | |
Mid-Cap Value Fund | 0.80% | | 0.90% | | 1.15% | | | | | |
Unconstrained Equity Fund | 0.90% | | 0.99% | | | | | | | |
Small-Mid Core Equity Fund | | | 0.95% | | | | | | | |
Micro-Cap Equity Fund | | | 1.75% | | | | | | | |
During any fiscal year that the Agreement between the Adviser and the Trust is in effect, the Adviser may recoup the sum of all fees previously waived or expenses reimbursed, less any reimbursement previously paid, provided that the Adviser is only permitted to recoup fees or expenses within 36 months from the date the fee waiver or expense reimbursement took effect and provided further that such recoupment can be achieved within the Expense Limitation currently in effect and the Expense Limitation in place when the waiver/reimbursement occurred. This expense cap agreement may be terminated by the Board at any time.
As of September 30, 2020, the Adviser may seek repayment of investment advisory fee waivers and expense reimbursements as follows:
Recoverable Through | | Small-Cap
Equity
Fund | | | Small-Cap
Growth
Fund | | | Mid-Cap
Value
Fund | | | Unconstrained
Equity
Fund | | | Small-Mid
Core Equity
Fund | | | Micro-Cap
Equity
Fund | |
September 30, 2021 | | $ | 30,316 | | | $ | 128,041 | | | $ | 129,738 | | | $ | — | | | $ | — | | | $ | — | |
September 30, 2022 | | | — | | | | 146,759 | | | | 130,638 | | | | 80,362 | | | | 78,855 | | | | 78,292 | |
September 30, 2023 | | | — | | | | 153,508 | | | | 103,543 | | | | 88,162 | | | | 81,772 | | | | 87,750 | |
| | | $ | 30,316 | | | $ | 428,308 | | | $ | 363,919 | | | $ | 168,524 | | | $ | 160,627 | | | $ | 166,042 | |
68
Fuller & Thaler Funds
Notes to the Financial Statements (continued)
September 30, 2020
The Trust retains Ultimus Fund Solutions, LLC (the “Administrator”) to provide the Funds with administration, fund accounting, transfer agent and compliance services, including all regulatory reporting. For the fiscal year ended September 30, 2020, fees incurred for administration, fund accounting, transfer agent and compliance services, and the amounts due to the Administrator at September 30, 2020 were as follows:
| | | Small-Cap
Equity
Fund | | | Small-Cap
Growth
Fund | | | Mid-Cap
Value
Fund | | | Unconstrained
Equity
Fund | | | Small-Mid
Core Equity
Fund | | | Micro-Cap
Equity
Fund | |
Administration | | $ | 734,975 | | | $ | 9,338 | | | $ | 6,410 | | | $ | 11,641 | | | $ | 7,867 | | | $ | 7,846 | |
Fund accounting | | | 261,642 | | | | 3,319 | | | | 2,281 | | | | 4,143 | | | | 2,801 | | | | 2,794 | |
Transfer agent | | | 296,370 | | | | 3,157 | | | | 5,713 | | | | 1,085 | | | | 1,329 | | | | 1,362 | |
Compliance services | | | 6,000 | | | | 6,000 | | | | 6,000 | | | | 6,000 | | | | 6,000 | | | | 6,000 | |
Payable to Administrator | | | 118,360 | | | | 2,651 | | | | 2,055 | | | | 2,228 | | | | 1,497 | | | | 1,502 | |
The Board supervises the business activities of the Trust. Each Trustee serves as a Trustee for the lifetime of the Trust or until the earlier of his or her retirement as a Trustee at age 78 (which may be extended for up to two years in an emeritus non-voting capacity at the pleasure and request of the Board), or until he/she dies, resigns, or is removed, whichever is sooner. “Independent Trustees,” meaning those Trustees who are not “interested persons” of the Trust, as defined in the Investment Company Act of 1940 (“1940 Act”), as amended, has received an annual retainer of $500 per Fund and $500 per Fund for each quarterly in-person Board meeting. Effective January 1, 2020, the annual retainer increased to $1,000 per Fund. In addition, each Independent Trustee may be compensated for preparation related to and participation in any special meetings of the Board and/or any Committee of the Board, with such compensation determined on a case-by-case basis based on the length and complexity of the meeting. The Trust also reimburses Trustees for out-of-pocket expense incurred in conjunction with attendance at Board meetings.
The officers and one trustee of the Trust are employees of the Administrator. Ultimus Fund Distributors, LLC (the “Distributor”) acts as the principal distributor of each Fund’s shares. The Distributor is a wholly-owned subsidiary of the Administrator.
The Funds have adopted a Distribution Plan (the “Plan) pursuant to Rule 12b-1 of the 1940 Act. The Plan provides that the Funds will pay the Distributor and/or any registered securities dealer, financial institution or any other person (the “Recipient”) a fee of 0.25% of the average daily net assets of each Fund’s Investor Shares and A Shares and 1.00% of the average daily net assets of each Fund’s C Shares in connection with the promotion and distribution of each Fund’s Investor Shares, A Shares and C Shares or the provision of personal services to shareholders, including, but not necessarily limited to, advertising, compensation to underwriters, dealers and selling personnel, the printing and mailing of prospectuses to other than current shareholders, the printing and mailing of sales literature and servicing shareholder accounts (“12b-1 Expenses”). Under the 12b-1 Plan, the 1.00% C Share 12b-1 fee includes a 0.25% service fee. Over time, 12b-1 fees will increase the cost an investment in a Fund’s
69
Fuller & Thaler Funds
Notes to the Financial Statements (continued)
September 30, 2020
Investor, A, and C Shares and may cost more than paying other types of sales charges because these fees are paid out of the Fund’s Investor, A, and C Shares on an ongoing basis. For the fiscal year ended September 30, 2020, 12b-1 expenses incurred by the Funds were as follows:
Distribution Fees | | Small-Cap
Equity Fund | | | Small-Cap
Growth Fund | | | Mid-Cap
Value Fund | |
Investor Shares | | $ | 338,636 | | | $ | 619 | | | $ | 3,930 | |
A Shares | | | 1,848 | | | | 46 | | | | — | |
C Shares | | | 17,402 | | | | 113 | | | | — | |
Payable for 12b-1 fees | | | 58,958 | | | | 265 | | | | 244 | |
The Funds have adopted an Administrative Services Plan (the “Plan”) for Institutional Shares, Investor Shares, and A Shares of the Funds. The Plan allows the Funds to pay financial intermediaries that provide services relating to Institutional Shares, Investor Shares, and A Shares. The Plan permits payments for the provision of certain administrative, recordkeeping and other non-distribution related services to Institutional Share, Investor Share and A Share shareholders. The Plan permits the Funds to make service fee payments at an annual rate of up to 0.25% of each Fund’s average daily net assets attributable to its A Shares and up to 0.20% of each Fund’s average daily net assets attributable to its Institutional Shares or Investor Shares. Because these fees are paid respectively out of the assets of each Fund’s Institutional Shares, Investor Shares and A Shares on an ongoing basis, over time they will increase the cost of an investment in Institutional Shares, Investor Shares and A Shares.
NOTE 5. PURCHASES AND SALES OF SECURITIES
For the fiscal year ended September 30, 2020, purchases and sales of investment securities, other than short-term investments were as follows:
| | | Purchases | | | Sales | |
Small-Cap Equity Fund | | $ | 1,960,925,452 | | | $ | 1,131,565,223 | |
Small-Cap Growth Fund | | | 66,616,329 | | | | 35,613,853 | |
Mid-Cap Value Fund | | | 28,862,525 | | | | 5,706,212 | |
Unconstrained Equity Fund | | | 49,736,268 | | | | 8,615,464 | |
Small-Mid Core Equity Fund | | | 1,571,021 | | | | 880,495 | |
Micro-Cap Equity Fund | | | 6,207,378 | | | | 2,917,722 | |
There were no purchases or sales of long-term U.S. government obligations during the fiscal year ended September 30, 2020.
70
Fuller & Thaler Funds
Notes to the Financial Statements (continued)
September 30, 2020
NOTE 6. FEDERAL TAX INFORMATION
At September 30, 2020, the net unrealized appreciation (depreciation) and tax cost of investments for tax purposes was as follows:
| | | Small-Cap
Equity
Fund | | | Small-Cap
Growth
Fund | | | Mid-Cap
Value
Fund | | | Unconstrained
Equity Fund | | | Small-Mid
Core Equity
Fund | | | Micro-Cap
Equity
Fund | |
Gross unrealized appreciation | | $ | 302,060,051 | | | $ | 11,329,588 | | | $ | 1,101,738 | | | $ | 7,091,113 | | | $ | 576,400 | | | $ | 918,568 | |
Gross unrealized depreciation | | | (200,882,690 | ) | | | (929,543 | ) | | | (2,750,264 | ) | | | (1,507,384 | ) | | | (306,407 | ) | | | (475,772 | ) |
Net unrealized appreciation/(depreciation) on investments | | $ | 101,177,361 | | | $ | 10,400,045 | | | $ | (1,648,526 | ) | | $ | 5,583,729 | | | $ | 269,993 | | | $ | 442,796 | |
Tax cost of investments | | $ | 2,748,726,695 | | | $ | 46,407,766 | | | $ | 36,747,789 | | | $ | 44,786,308 | | | $ | 2,771,002 | | | $ | 5,219,857 | |
The tax character of distributions paid for the fiscal years ended September 30, 2020 and September 30, 2019 were as follows:
| | | Small-Cap
Equity Fund | | | Mid-Cap
Value Fund | | | Unconstrained
Equity
Fund | | | Small-Mid
Core Equity
Fund | | | Micro-Cap
Equity
Fund | |
| | | 2020 | | | 2019 | | | 2020 | | | 2019 | | | 2020 | | | 2020 | | | 2020 | |
Distributions paid from: | | | | | | | | | | | | | | | | | | | | | | | | | | | | |
Ordinary income | | $ | 8,365,841 | | | $ | 4,754,639 | | | $ | 111,422 | | | $ | 76,590 | | | $ | 41,713 | | | $ | 57,119 | | | $ | 145,343 | |
Long-term capital gains | | | — | | | | — | | | | 98,695 | | | | 5,377 | | | | 85 | | | | 69 | | | | 633 | |
Total distributions paid | | $ | 8,365,841 | | | $ | 4,754,639 | | | $ | 210,117 | | | $ | 81,967 | | | $ | 41,798 | | | $ | 57,188 | | | $ | 145,976 | |
71
Fuller & Thaler Funds
Notes to the Financial Statements (continued)
September 30, 2020
At September 30, 2020, the components of accumulated earnings on a tax basis were as follows:
| | | Small-Cap
Equity
Fund | | | Small-Cap
Growth
Fund | | | Mid-Cap
Value
Fund | | | Unconstrained
Equity
Fund | | | Small-Mid
Core Equity
Fund | | | Micro-Cap
Equity
Fund | |
Undistributed ordinary income | | $ | 6,320,868 | | | $ | — | | | $ | 208,942 | | | $ | 30,848 | | | $ | 11,172 | | | $ | 32,418 | |
Undistributed long-term capital gains | | | — | | | | — | | | | — | | | | — | | | | — | | | | — | |
Accumulated capital and other Losses | | | (54,876,546 | ) | | | (173,734 | ) | | | (798,473 | ) | | | (200,901 | ) | | | (76,756 | ) | | | (768,108 | ) |
Unrealized appreciation/(depreciation) on investments(a) | | | 101,177,361 | | | | 10,400,045 | | | | (1,648,526 | ) | | | 5,583,729 | | | | 269,993 | | | | 442,795 | |
Total accumulated earnings/(deficit) | | $ | 52,621,683 | | | $ | 10,226,311 | | | $ | (2,238,057 | ) | | $ | 5,413,676 | | | $ | 204,409 | | | $ | (292,895 | ) |
(a) | The difference between book basis and tax basis unrealized appreciation (depreciation) is primarily attributable to the tax deferral of wash losses and return of capital adjustments. |
At September 30, 2020, the following Funds had net capital loss carryforwards which are available to offset future net capital gains, if any:
| | | | Small-Cap
Equity Fund | | | Small-Cap
Growth Fund | | | Mid-Cap
Value Fund | |
| | | | Short-Term | | | Long-Term | | | Short-Term | | | Long-Term | | | Short-Term | | | Long-Term | |
| Non-Expiring | | | | $ | 54,876,546 | | | $ | — | | | $ | 27,880 | | | $ | — | | | $ | 544,174 | | | $ | 254,299 | |
| | | | Unconstrained
Equity Fund | | | Small-Mid
Core Equity Fund | | | Micro-Cap
Equity Fund | |
| | | | Short-Term | | | Long-Term | | | Short-Term | | | Long-Term | | | Short-Term | | | Long-Term | |
| Non-Expiring | | | | $ | 200,901 | | | $ | — | | | $ | 24,011 | | | $ | 52,745 | | | $ | 646,086 | | | $ | 122,022 | |
Under current tax law, net investment losses after December 31 and capital losses realized after October 31 of the Funds fiscal year may be deferred and treated as occurring on the first business day of the following fiscal year for tax purposes. The Small-Cap Growth Fund had a Qualified Late Year Ordinary Loss in the amount of $145,854.
NOTE 7. SECTOR RISK
If a Fund has significant investments in the securities of issuers within a particular sector, any development affecting that sector will have a greater impact on the value of the net assets of the Fund than would be the case if the Fund did not have significant investments in that sector. In addition, this may increase the risk of loss in the Fund and increase the volatility of the Fund’s NAV per share. For instance, economic or market factors, regulatory changes or other developments may negatively impact all companies in a particular sector, and therefore the value of the Fund’s portfolio will be adversely affected. As of September 30, 2020, Small-Cap Growth Fund had 33.36% of the value of
72
Fuller & Thaler Funds
Notes to the Financial Statements (continued)
September 30, 2020
its net assets invested in stocks within the Technology sector, Unconstrained Equity Fund had 28.10% in the Industrials sector, and Micro-Cap Equity Fund had 32.28% in the Consumer Discretionary sector, respectively.
NOTE 8. COMMITMENTS AND CONTINGENCIES
The Trust indemnifies its officers and Trustees for certain liabilities that may arise from their performance of their duties to the Trust or the Funds. Additionally, in the normal course of business, the Trust enters into contracts that contain a variety of representations and warranties which provide general indemnifications. The Trust’s maximum exposure under these arrangements is unknown, as this would involve future claims that may be made against the Trust that have not yet occurred.
NOTE 9. ReFlow Liquidity Program
The Funds may participate in the ReFlow Fund, LLC (“ReFlow”) liquidity program, which is designed to provide an alternative liquidity source for mutual funds experiencing redemptions of their shares. In order to pay cash to shareholders who redeem their shares on a given day, a mutual fund typically must hold cash in its portfolio, liquidate portfolio securities, or borrow money, all of which impose certain costs on a fund. ReFlow provides participating mutual funds with another source of cash by standing ready to purchase shares from a fund equal to the amount of each fund’s net redemptions on a given day. ReFlow will purchase shares of a Fund at net asset value and will not be subject to any investment minimum applicable to such shares. ReFlow is prohibited from acquiring more than 3% of the outstanding voting securities of each Fund. ReFlow will periodically redeem its entire share position in a Fund. For use of the ReFlow service, each Fund will pay a fee to ReFlow at a rate determined by a daily auction with other participating mutual funds. During the fiscal year ended September 30, 2020, ReFlow liquidity program was not utilized by the Funds.
NOTE 10. SUBSEQUENT EVENTS
Management of the Funds has evaluated the need for disclosures and/or adjustments resulting from subsequent events through the date at which these financial statements were issued. Based upon this evaluation, management has determined there were no items requiring adjustment of the financial statements or additional disclosure.
NOTE 11. LIQUIDITY RISK MANAGEMENT PROGRAM (Unaudited)
The Funds have adopted and implemented a written liquidity risk management program (the “Program”) as required by Rule 22e-4 (the “Liquidity Rule”) under the 1940 Act. The Program is reasonably designed to assess and manage the Funds’ liquidity risk, taking into consideration, among other factors, the Funds’ investment strategy and the liquidity of its portfolio investments during normal and reasonably foreseeable stressed conditions; its short and long-term cash flow projections; and its cash holdings and access to other funding sources. The Board approved the appointment of the Liquidity Administrator Committee, comprising certain Trust officers and employees of the Adviser. The Liquidity Administrator Committee maintains Program oversight and reports to the Board on at least an annual basis regarding the Program’s operational effectiveness through a written report (the “Report”). The Program’s initial Report, which was presented to the Board for consideration at its meeting held on September 8, 2020, outlined the operation of the Program and the adequacy and effectiveness of the
73
Fuller & Thaler Funds
Notes to the Financial Statements (continued)
September 30, 2020
Program’s implementation. During the review period, the Funds did not experience unusual stress or disruption to its operations related to purchase and redemption activity. Also, during the review period the Funds held adequate levels of cash and highly liquid investments to meet shareholder redemption activities in accordance with applicable requirements. The Report concluded that the Program is reasonably designed to prevent violation of the Liquidity Rule and has been effectively implemented.
74
Report of Independent Registered Public Accounting Firm
To the Shareholders of Fuller & Thaler Behavioral Small-Cap Equity Fund, Fuller & Thaler Behavioral Small-Cap Growth Fund, Fuller & Thaler Behavioral Mid-Cap Value Fund, Fuller & Thaler Behavioral Unconstrained Equity Fund, Fuller & Thaler Behavioral Small-Mid Core Equity Fund, and Fuller & Thaler Behavioral Micro-Cap Equity Fund and the Board of Trustees of Capitol Series Trust
Opinion on the Financial Statements
We have audited the accompanying statements of assets and liabilities of Fuller & Thaler Behavioral Small-Cap Equity Fund, Fuller & Thaler Behavioral Small-Cap Growth Fund, Fuller & Thaler Behavioral Mid-Cap Value Fund, Fuller & Thaler Behavioral Unconstrained Equity Fund, Fuller & Thaler Behavioral Small-Mid Core Equity Fund, and Fuller & Thaler Behavioral Micro-Cap Equity Fund (collectively referred to as the “Funds”) (six of the funds constituting Capitol Series Trust (the “Trust”)), including the schedules of investments, as of September 30, 2020, and the related statements of operations and changes in net assets, and the financial highlights for each of the periods indicated in the table below and the related notes (collectively referred to as the “financial statements”). In our opinion, the financial statements present fairly, in all material respects, the financial position of each of the Funds (six of the funds constituting Capitol Series Trust) at September 30, 2020, and the results of their operations, changes in net assets and financial highlights for each of the periods indicated in the table below, in conformity with U.S. generally accepted accounting principles.
| Individual fund constituting the Capitol Series Trust | Statement of
Operations | Statements of
Changes in
Net Assets | Financial
Highlights |
| Fuller & Thaler Behavioral Small-Cap Equity Fund | For the year ended September 30, 2020 | For each of the two years in the period ended September 30, 2020 | For each of the four years in the period ended September 30, 2020 |
Fuller & Thaler Behavioral Small-Cap Growth Fund Fuller & Thaler Behavioral Mid-Cap Value Fund | For the year ended September 30, 2020 | For each of the two years in the period ended September 30, 2020 | For each of the two years in the period ended September 30, 2020 and the period from December 21, 2017 (commencement of operations) through September 30, 2018 |
Fuller & Thaler Behavioral Unconstrained Equity Fund Fuller & Thaler Behavioral Small-Mid Core Equity Fund | For the year ended September 30, 2020 | For the year ended September 30, 2020 and the period from December 26, 2018 (commencement of operations) through September 30, 2019 |
| Fuller & Thaler Behavioral Micro-Cap Equity Fund | For the year ended September 30, 2020 | For the year ended September 30, 2020 and the period from December 28, 2018 (commencement of operations) through September 30, 2019 |
75
Report of Independent Registered Public Accounting Firm (continued)
The financial highlights of Fuller & Thaler Behavioral Small-Cap Equity Fund for the year ended September 30, 2016 were audited by other auditors whose report dated November 29, 2016, expressed an unqualified opinion on those financial highlights.
Basis for Opinion
These financial statements are the responsibility of the Trust’s management. Our responsibility is to express an opinion on each of the Funds’ financial statements based on our audits. We are a public accounting firm registered with the Public Company Accounting Oversight Board (United States) (“PCAOB”) and are required to be independent with respect to the Trust in accordance with the U.S. federal securities laws and the applicable rules and regulations of the Securities and Exchange Commission and the PCAOB.
We conducted our audits in accordance with the standards of the PCAOB. Those standards require that we plan and perform the audit to obtain reasonable assurance about whether the financial statements are free of material misstatement, whether due to error or fraud. The Trust is not required to have, nor were we engaged to perform, an audit of the Trust’s internal control over financial reporting. As part of our audits we are required to obtain an understanding of internal control over financial reporting but not for the purpose of expressing an opinion on the effectiveness of the Trust’s internal control over financial reporting. Accordingly, we express no such opinion.
Our audits included performing procedures to assess the risks of material misstatement of the financial statements, whether due to error or fraud, and performing procedures that respond to those risks. Such procedures included examining, on a test basis, evidence regarding the amounts and disclosures in the financial statements. Our procedures included confirmation of securities owned as of September 30, 2020, by correspondence with the custodian and brokers or by other appropriate auditing procedures where replies from brokers were not received. Our audits also included evaluating the accounting principles used and significant estimates made by management, as well as evaluating the overall presentation of the financial statements. We believe that our audits provide a reasonable basis for our opinion.

We have served as the auditor of one or more Capitol Series Trust investment companies since 2017.
Cincinnati, Ohio
November 25, 2020
76
Summary of Fund Expenses (Unaudited)
As a shareholder of a Fund, you incur two types of costs: (1) transaction costs and (2) ongoing costs, including management fees and other Fund expenses. These examples are intended to help you understand your ongoing costs (in dollars) of investing in each Fund and to compare these costs with the ongoing costs of investing in other mutual funds. Each Fund’s example is based on an investment of $1,000 invested at the beginning of the period and held for the entire period from April 1, 2020 through September 30, 2020.
Actual Expenses
The first line of the table for each class provides information about actual account values and actual expenses. You may use the information in these lines, together with the amount you invested, to estimate the expenses that you paid over the period. Simply divide your account value by $1,000 (for example, an $8,600 account value divided by $1,000 = 8.60), then multiply the result by the number in the first line under the heading “Expenses Paid During Period” to estimate the expenses you paid on your account during this period.
Hypothetical Example for Comparison Purposes
The second line of the table for each class provides information about hypothetical account values and hypothetical expenses based on each Fund’s actual expense ratios and an assumed rate of return of 5% per year before expenses, which is not the Fund’s actual return. The hypothetical account values and expenses may not be used to estimate the actual ending account balances or expenses you paid for the period. You may use this information to compare the ongoing costs of investing in the Funds and other funds. To do so, compare this 5% hypothetical example with the 5% hypothetical examples that appear in the shareholder reports of other funds.
Expenses shown in the table are meant to highlight your ongoing costs only and do not reflect any transactional costs. Therefore, the second line of the table for each class is useful in comparing ongoing costs only and will not help you determine the relative total costs of owning different funds. In addition, if transaction costs were included, your costs would have been higher.
77
Summary of Fund Expenses (Unaudited) (continued)
| | | Beginning
Account Value,
April 1, 2020 | Ending
Account Value,
September 30,
2020 | Expenses
Paid During
Period(a) | Annualized
Expense
Ratio |
Small-Cap Equity Fund |
R6 Shares | Actual | $ 1,000.00 | $ 1,216.70 | $ 3.82 | 0.69% |
| | | | | | |
| | Hypothetical(b) | $ 1,000.00 | $ 1,021.55 | $ 3.49 | 0.69% |
| | | | | | |
Institutional Shares | Actual | $ 1,000.00 | $ 1,215.90 | $ 4.43 | 0.80% |
| | | | | | |
| | Hypothetical(b) | $ 1,000.00 | $ 1,021.00 | $ 4.04 | 0.80% |
| | | | | | |
Investor Shares | Actual | $ 1,000.00 | $ 1,214.60 | $ 5.98 | 1.08% |
| | | | | | |
| | Hypothetical(b) | $ 1,000.00 | $ 1,019.60 | $ 5.45 | 1.08% |
| | | | | | |
A Shares | Actual | $ 1,000.00 | $ 1,213.50 | $ 6.53 | 1.18% |
| | | | | | |
| | Hypothetical(b) | $ 1,000.00 | $ 1,019.10 | $ 5.96 | 1.18% |
| | | | | | |
C Shares | Actual | $ 1,000.00 | $ 1,211.00 | $ 9.34 | 1.69% |
| | | | | | |
| | Hypothetical(b) | $ 1,000.00 | $ 1,016.55 | $ 8.52 | 1.69% |
| | | | | | |
Small-Cap Growth Fund |
R6 Shares | Actual | $ 1,000.00 | $ 1,547.60 | $ 5.73 | 0.90% |
| | | | | | |
| | Hypothetical(b) | $ 1,000.00 | $ 1,020.50 | $ 4.55 | 0.90% |
| | | | | | |
Institutional Shares | Actual | $ 1,000.00 | $ 1,547.70 | $ 6.31 | 0.99% |
| | | | | | |
| | Hypothetical(b) | $ 1,000.00 | $ 1,020.05 | $ 5.00 | 0.99% |
| | | | | | |
Investor Shares | Actual | $ 1,000.00 | $ 1,545.20 | $ 7.95 | 1.25% |
| | | | | | |
| | Hypothetical(b) | $ 1,000.00 | $ 1,018.75 | $ 6.31 | 1.25% |
| | | | | | |
A Shares | Actual | $ 1,000.00 | $ 1,544.40 | $ 8.27 | 1.30% |
| | | | | | |
| | Hypothetical(b) | $ 1,000.00 | $ 1,018.50 | $ 6.56 | 1.30% |
| | | | | | |
C Shares | Actual | $ 1,000.00 | $ 1,541.90 | $ 11.44 | 1.80% |
| | | | | | |
| | Hypothetical(b) | $ 1,000.00 | $ 1,016.00 | $ 9.07 | 1.80% |
| | | | | | |
78
Summary of Fund Expenses (Unaudited) (continued)
| | | Beginning
Account Value,
April 1, 2020 | Ending
Account Value,
September 30,
2020 | Expenses
Paid During
Period(a) | Annualized
Expense
Ratio |
Mid-Cap Value Fund |
R6 Shares | Actual | $ 1,000.00 | $ 1,249.20 | $ 4.50 | 0.80% |
| | | | | | |
| | Hypothetical(b) | $ 1,000.00 | $ 1,021.00 | $ 4.04 | 0.80% |
| | | | | | |
Institutional Shares | Actual | $ 1,000.00 | $ 1,248.70 | $ 5.06 | 0.90% |
| | | | | | |
| | Hypothetical(b) | $ 1,000.00 | $ 1,020.50 | $ 4.55 | 0.90% |
| | | | | | |
Investor Shares | Actual | $ 1,000.00 | $ 1,247.50 | $ 6.46 | 1.15% |
| | | | | | |
| | Hypothetical(b) | $ 1,000.00 | $ 1,019.25 | $ 5.80 | 1.15% |
| | | | | | |
Unconstrained Equity Fund |
R6 Shares | Actual | $ 1,000.00 | $ 1,342.00 | $ 5.27 | 0.90% |
| | | | | | |
| | Hypothetical(b) | $ 1,000.00 | $ 1,020.50 | $ 4.55 | 0.90% |
| | | | | | |
Institutional Shares | Actual | $ 1,000.00 | $ 1,341.30 | $ 5.79 | 0.99% |
| | | | | | |
| | Hypothetical(b) | $ 1,000.00 | $ 1,020.05 | $ 5.00 | 0.99% |
| | | | | | |
Small-Mid Core Equity Fund |
Institutional Shares | Actual | $ 1,000.00 | $ 1,344.90 | $ 5.57 | 0.95% |
| | | | | | |
| | Hypothetical(b) | $ 1,000.00 | $ 1,020.25 | $ 4.80 | 0.95% |
| | | | | | |
Micro-Cap Equity Fund |
Institutional Shares | Actual | $ 1,000.00 | $ 1,414.20 | $ 10.56 | 1.75% |
| | | | | | |
| | Hypothetical(b) | $ 1,000.00 | $ 1,016.25 | $ 8.82 | 1.75% |
(a) | Expenses are equal to the Mid-Cap Value Fund’s annualized expense ratios, multiplied by the average account value over the period, multiplied by 183/366 (to reflect the one-half year period). |
(b) | Hypothetical assumes 5% annual return before expenses. |
79
Additional Federal Income Tax Information (Unaudited)
The Form 1099-DIV you receive in January 2021 will show the tax status of all distributions paid to your account in calendar year 2020. Shareholders are advised to consult their own tax adviser with respect to the tax consequences of their investment in the Fund. As required by the Internal Revenue Code and/or regulations, shareholders must be notified regarding the status of qualified dividend income for individuals and the dividends received deduction for corporations.
Qualified Dividend Income. The Funds designate the following percentage or up to the maximum amount of such dividends allowable pursuant to the Internal Revenue Code, as qualified dividend income eligible for the reduced tax rate.
| | | Small-Cap
Equity
Fund | | | Small-Cap
Growth
Fund | | | Mid-Cap
Value
Fund | | | Unconstrained
Equity
Fund | | | Small-Mid
Core Equity
Fund | | | Micro-Cap
Equity
Fund | |
Qualified Dividend Income | | | 100 | % | | | — | % | | | 100 | % | | | 97 | % | | | 42 | % | | | 9 | % |
Qualified Business Income. The Funds designate the following percentage of ordinary income dividends, or up to the maximum amount of such dividends allowable pursuant to the Internal Revenue Code, as qualified business income.
| | | Small-Cap
Equity
Fund | | | Small-Cap
Growth
Fund | | | Mid-Cap
Value
Fund | | | Unconstrained
Equity
Fund | | | Small-Mid
Core Equity
Fund | | | Micro-Cap
Equity
Fund | |
Qualified Business Income | | | — | % | | | — | % | | | — | % | | | 1 | % | | | 2 | % | | | — | % |
Dividends Received Deduction. Corporate shareholders are generally entitled to take the dividends received deduction on the portion of the Funds’ dividend distribution that qualifies under tax law. For the Funds’ calendar year 2019 ordinary income dividends, the following percentage qualifies for the corporate dividends received deduction.
| | | Small-Cap
Equity
Fund | | | Small-Cap
Growth
Fund | | | Mid-Cap
Value
Fund | | | Unconstrained
Equity
Fund | | | Small-Mid
Core Equity
Fund | | | Micro-Cap
Equity
Fund | |
Dividends Received Deduction | | | 100 | % | | | — | % | | | 100 | % | | | 83 | % | | | 41 | % | | | 11 | % |
The Funds designate the following amounts as long-term capital gains distributions. The amounts designated may not agree with long-term capital gains in the tax character of distribution table due to utilization of earnings and profits distributed to shareholders on redemption of shares.
| | | Small-Cap
Equity
Fund | | | Small-Cap
Growth
Fund | | | Mid-Cap
Value
Fund | | | Unconstrained
Equity
Fund | | | Small-Mid
Core Equity
Fund | | | Micro-Cap
Equity
Fund | |
Long-Term Capital Gains Distributions | | $ | — | | | $ | — | | | $ | 98,695 | | | $ | 85 | | | $ | 69 | | | $ | 633 | |
80
Trustees and Officers (Unaudited)
The Board supervises the business activities of the Trust and is responsible for protecting the interests of shareholders. The Chairman of the Board is Walter B. Grimm, who is an Independent Trustee of the Trust.
Each Trustee serves as a Trustee for the lifetime of the Trust or until the earlier of his or her retirement as a Trustee at age 78, death, resignation or removal. Officers are re-elected annually by the Board. The address of each Trustee and officer is 225 Pictoria Drive, Suite 450, Cincinnati, Ohio 45246.
As of the date of this report, the Trustees oversee the operations of 14 series.
Interested Trustee Background. The following table provides information regarding the Interested Trustee.
Name, (Age), Position with Trust,
Term of Position with Trust | Principal Occupation During
Past 5 Years and Other Directorships |
Robert G. Dorsey* Birth Year: 1957 TRUSTEE Began Serving: March 2017 | Principal Occupation(s): Vice Chairman of Ultimus Fund Solutions, LLC and its subsidiaries, except as otherwise noted for the FINRA-regulated broker-dealer entities (February 2019 to present); Interested Trustee of Ultimus Managers Trust (February 2012 to present). Previous Position(s): Managing Director and Co-Chief Executive Officer of Ultimus Fund Solutions, LLC (1999 to February 2019); President of Ultimus Fund Distributors, LLC (1999 to 2018). |
* | Mr. Dorsey is considered an “interested person” of the Trust within the meaning of Section 2(a)(19) of the 1940 Act because of his relationship with the Trust’s administrator, transfer agent, and distributors. |
Independent Trustee Background. The following table provides information regarding the Independent Trustees.
Name, (Age), Position with Trust,
Term of Position with Trust | Principal Occupation During
Past 5 Years and Other Directorships |
John C. Davis Birth Year: 1952 TRUSTEE Began Serving: July 2018 | Previous Position(s): Retired Partner of PricewaterhouseCoopers LLP (1974-2010); Consultant, Board of Trustees of Ultimus Managers Trust (2016 to 2019) and Former Trustee of Ultimus Managers Trust (2012 to 2016). |
Walter B. Grimm Birth Year: 1945 TRUSTEE AND CHAIR Began Serving: November 2013 | Principal Occupations(s): President, Leigh Management Group, LLC (consulting firm) (October 2005 to present); and President, Leigh Investments, Inc. (1988 to present); Board member, Boys & Girls Club of Coachella (2020 to present). |
Lori Kaiser Birth Year: 1963 TRUSTEE Began Serving: July 2018 | Principal Occupations(s): Founder and CEO, Kaiser Consulting since 1992. |
81
Trustees and Officers (Unaudited) (continued)
Name, (Age), Position with Trust,
Term of Position with Trust | Principal Occupation During
Past 5 Years and Other Directorships |
Janet Smith Meeks Birth Year: 1955 TRUSTEE Began Serving: July 2018 | Principal Occupations(s): Co-Founder and CEO, Healthcare Alignment Advisors, LLC (consulting company) since August 2015. Previous Position(s): President and Chief Operating Officer, Mount Carmel St. Ann’s Hospital (2006 to 2015). |
Mary M. Morrow Birth Year: 1958 TRUSTEE Began Serving: November 2013 | Principal Occupations(s): President, US Health Holdings (2020 to present). Previous Position(s): President (2019 to 2020) and Chief Operating Officer (2018 to 2019), Dignity Health Managed Services Organization; Chief Operating Officer, Pennsylvania Health and Wellness (fully owned subsidiary of Centene Corporation) (2016 to 2018); Vice President, Gateway Heath (2015 to 2016). |
Officers. The following table provides information regarding the Officers.
Name, (Age), Position with Trust,
Term of Position with Trust | Principal Occupation During
Past 5 Years and Other Directorships |
Matthew J. Miller Birth Year: 1976 PRESIDENT and CHIEF EXECUTIVE OFFICER Began Serving: September 2013 (as VP);
September 2018 (as President) | Principal Occupation(s): Assistant Vice President, Relationship Management, Ultimus Fund Solutions, LLC (December 2015 to present); Vice President, Valued Advisers Trust (December 2011 to present). Previous Position(s): Vice President, Relationship Management, Huntington Asset Services, Inc. (n/k/a Ultimus Asset Services, LLC) (2008 to December 2015). |
Zachary P. Richmond Birth Year: 1980 TREASURER AND CHIEF FINANCIAL OFFICER Began Serving: August 2014 | Principal Occupation(s): Vice President, Director of Financial Administration for Ultimus Fund Solutions, LLC (February 2019 to present). Previous Position(s): Assistant Vice President, Associate Director of Financial Administration for Ultimus Fund Solutions, LLC (December 2015 to February 2019); Manager, Fund Administration, Huntington Asset Services, Inc. (January 2011 to December 2015). |
Martin R. Dean Birth Year: 1963 CHIEF COMPLIANCE OFFICER Began Serving: May 2019 | Principal Occupation(s): Senior Vice President, Head of Fund Compliance, Ultimus Fund Solutions, LLC (January 2016 to present). Previous Position(s): Senior Vice President and Compliance Group Manager, Huntington Asset Services, Inc. (July 2013 to December 2015). |
82
Trustees and Officers (Unaudited) (continued)
Name, (Age), Position with Trust,
Term of Position with Trust | Principal Occupation During
Past 5 Years and Other Directorships |
Matthew J. Beck Birth Year: 1988 SECRETARY Began Serving: September 2018 | Principal Occupation(s): Senior Attorney, Ultimus Fund Solutions, LLC (May 2018 to present) and Secretary, Ultimus Managers Trust (July 2018 to present). Previous Position(s): Chief Compliance Officer, OBP Capital, LLC (May 2015 to May 2018); Secretary, Aspiration Funds (March 2015 to May 2018); Secretary, Starboard Investment Trust (September 2014 to May 2018); Secretary, Leeward Investment Trust (September 2014 to May 2018); Secretary, Hillman Capital Management Investment Trust (September 2014 to May 2018); Secretary, Spinnaker ETF Series (September 2014 to May 2018); Vice President and General Counsel, The Nottingham Company (July 2014 to May 2018). |
Other Information (Unaudited)
The Funds’ Statement of Additional Information (“SAI”) includes additional information about the trustees and is available without charge, upon request. You may call toll-free at (888) 912-4562 to request a copy of the SAI or to make shareholder inquiries.
83
FACTS | WHAT DO THE FULLER & THALER FUNDS (the “Funds”) DO WITH YOUR PERSONAL INFORMATION? |
| | |
Why? | Financial companies choose how they share your personal information. Federal law gives consumers the right to limit some but not all sharing. Federal law also requires us to tell you how we collect, share, and protect your personal information. Please read this notice carefully to understand what we do. |
| | |
What? | The types of personal information we collect and share depend on the product or service you have with us. This information can include: ■ Social Security number ■ account balances and account transactions ■ transaction or loss history and purchase history ■ checking account information and wire transfer instructions When you are no longer our customer, we continue to share your information as described in this notice. |
| | |
How? | All financial companies need to share customers’ personal information to run their everyday business. In the section below, we list the reasons financial companies can share their customers’ personal information; the reasons the Funds choose to share; and whether you can limit this sharing. |
Reasons we can share your personal information | Do the Funds share? |
For our everyday business purposes—
such as to process your transactions, maintain your account(s), respond to court orders and legal investigations, or report to credit bureaus | Yes |
For our marketing purposes—
to offer our products and services to you | No |
For joint marketing with other financial companies | No |
For our affiliates’ everyday business purposes—
information about your transactions and experiences | No |
For our affiliates’ everyday business purposes—
information about your creditworthiness | No |
For nonaffiliates to market to you | No |
Questions? | Call (888) 912-4562 |
84
Who we are |
Who is providing this notice? | Fuller & Thaler Funds
Ultimus Fund Distributors, LLC (Distributor)
Ultimus Fund Solutions, LLC (Administrator) |
What we do |
How do the Funds protect my personal information? | To protect your personal information from unauthorized access and use, we use security measures that comply with federal law. These measures include computer safeguards and secured files and buildings. Our service providers are held accountable for adhering to strict policies and procedures to prevent any misuse of your nonpublic personal information. |
How do the Funds collect my personal information? | We collect your personal information, for example, when you ■ open an account or deposit money ■ buy securities from us or sell securities to us ■ make deposits or withdrawals from your account ■ give us your account information ■ make a wire transfer ■ tell us who receives the money ■ tell us where to send the money ■ show your government-issued ID ■ show your driver’s license |
Why can’t I limit all sharing? | Federal law gives you the right to limit only ■ sharing for affiliates’ everyday business purposes — information about your creditworthiness ■ affiliates from using your information to market to you ■ sharing for nonaffiliates to market to you State laws and individual companies may give you additional rights to limit sharing. |
Definitions |
Affiliates | Companies related by common ownership or control. They can be financial and nonfinancial companies. ■ Fuller & Thaler Asset Management, Inc., the investment adviser to the Fund, could be deemed to be an affiliate. |
Nonaffiliates | Companies not related by common ownership or control. They can be financial and nonfinancial companies. ■ The Fuller & Thaler Funds do not share your personal information with nonaffiliates so they can market to you |
Joint marketing | A formal agreement between nonaffiliated financial companies that together market financial products or services to you. ■ The Fuller & Thaler Funds do not jointly market. |
85
Proxy Voting
A description of the policies and procedures that each Fund uses to determine how to vote proxies relating to portfolio securities and information regarding how each Fund voted those proxies during the most recent twelve month period ended June 30, are available (1) without charge upon request by calling the Funds at (888) 912-4562 and (2) in Fund documents filed with the Securities and Exchange Commission (“SEC”) on the SEC’s website at www.sec.gov.
TRUSTEES
Walter B. Grimm, Chairman
John C. Davis
Robert G. Dorsey
Lori Kaiser
Janet Smith Meeks
Mary M. Morrow
OFFICERS
Matthew J. Miller, Chief Executive Officer and President
Zachary P. Richmond, Chief Financial Officer and Treasurer
Martin R. Dean, Chief Compliance Officer
Matthew J. Beck, Secretary
INVESTMENT ADVISER
Fuller & Thaler Asset Management, Inc.
411 Borel Avenue, Suite 300
San Mateo, CA 94402
DISTRIBUTOR
Ultimus Fund Distributors, LLC
225 Pictoria Drive, Suite 450
Cincinnati, OH 45246
INDEPENDENT REGISTERED PUBLIC ACCOUNTING FIRM
Ernst & Young LLP
221 East 4th Street, Suite 2900
Cincinnati, OH 45202
LEGAL COUNSEL
Bernstein Shur
100 Middle Street, 6th Floor
Portland, ME 04104
CUSTODIAN
Huntington National Bank
41 South High Street
Columbus, OH 43215
ADMINISTRATOR, TRANSFER AGENT AND FUND ACCOUNTANT
Ultimus Fund Solutions, LLC
225 Pictoria Drive, Suite 450
Cincinnati, OH 45246
This report is intended only for the information of shareholders or those who have received the Funds’ prospectus which contains information about the Funds’ management fee and expenses. Please read the prospectus carefully before investing.
Distributed by Ultimus Fund Distributors, LLC
Member FINRA/SIPC

Alta Quality Growth Fund
Institutional Shares – AQLGX
Guardian Fundamental Global Equity Fund
Institutional Shares – GFGEX
Annual Report
September 30, 2020
Beginning on January 1, 2021, as permitted by regulations adopted by the Securities and Exchange Commission, paper copies of the Funds’ shareholder reports like this one will no longer be sent by mail, unless you specifically request paper copies of the reports from the Funds or from your financial intermediary such as a broker-dealer or bank. Instead, the reports will be made available on a website, and you will be notified by mail each time a report is posted and provided with a website link to access the report.
If you already elected to receive shareholder reports electronically, you will not be affected by this change and you need not take any action. You may elect to receive shareholder reports and other communications from the Funds electronically by contacting the Funds at (800) 957-0681 or, if you own these shares through a financial intermediary, you may contact your financial intermediary.
You may elect to receive all future reports in paper free of charge. You can inform the Funds that you wish to continue receiving paper copies of your shareholder reports by contacting the Funds at (800) 957-0681. If you own shares through a financial intermediary, you may contact your financial intermediary or follow instructions included with this document to elect to continue to receive paper copies of your shareholder reports. Your election to receive reports in paper will apply to all funds held with the fund complex or at your financial intermediary.
Alta Capital Management, LLC
6440 South Wasatch Boulevard, Suite 260
Salt Lake City, Utah 84121
(800) 957-0681
Alta Quality Growth Fund
Letter to Shareholders (Unaudited)
Dear Fellow Shareholders,
The past year has witnessed numerous historical events, none larger than the spread of the coronavirus (COVID-19). The virus evolved into a global pandemic, disrupting major economies, increasing financial market volatility, and abruptly ending the longest bull run in U.S. stock market history. The market descended from its February high to its March low in just 23 trading days, losing 35.4%. In a bipartisan move, the CARES Act was passed and the resulting fiscal stimulus, along with monetary stimulus from the Federal Reserve, aided both businesses and consumers and helped bolster investor confidence. Over the next 103 trading days, the market rose 51.5% to a record high close on August 18th, and a new bull market was declared in the process.
As the pandemic shocked the world economy, we immediately reviewed the financial health of our portfolio companies, ensuring they had the resources and access to capital to survive with potentially zero revenues for an indeterminate amount of time. We know our holdings to be financially healthy as these companies, in aggregate, possess half the debt level and twice the ability to meet their interest obligations on outstanding debt than that of the market. We were heartened to learn through these impromptu stress tests that our companies could bridge the gap, as well as emerge stronger on the other side as their competitors potentially faltered. We were also active in trading the portfolio. We trimmed or sold companies that had enjoyed relative outperformance and bought or added to companies of greater quality with better growth prospects trading at a rare discount.
The market is often called a discounting machine and can overweight the short term, particularly in times of increased uncertainty. Many investors gravitated towards companies with the promise of positive growth during the pandemic regardless of their profitability or valuation. This growth at any cost investment approach is unsustainable due to its disconnection from sound fundamentals. As the trend reverses, high-quality stocks with reasonable valuations stand ready to benefit from a broader based rally.
For this fiscal period, the Alta Quality Growth Fund returned 12.92%, which lagged the S&P 500® Index return of 15.15% by 2.23%. Sector allocation was a contributor while security selection was a detractor overall. Specifically, our positions in Apple (total return +108%), Thermo Fisher (+47%), S&P Global (+48%), Facebook (+47%), and Adobe (+46%), rounded out our top 5 performers. These companies are all leaders in their respective industries and saw limited and sometimes even positive impact to their business from the pandemic and economic slowdown. Our laggards for the period, Expedia Group (-51%), Wells Fargo (-47%), Phillips 66 (-43%), KAR Auction Services (-40%), and Raytheon Technologies (-26%) suffered at the hands of the COVID crisis (travel limitations), low-interest rates, or low inflation.
1
Alta Quality Growth Fund
Letter to Shareholders (Unaudited) (continued)
During the year, the Alta Quality Growth Fund’s sector weighting decisions versus the index were positive in eight of the eleven GICS sectors. Our decision to underweight Financials and Energy and overweight Consumer Discretionary had the greatest positive impact. Overweighting Industrials and underweighting Health Care and Materials resulted in an overall negative outcome.
We added the following eight new positions to the Alta Quality Growth Fund: PerkinElmer, Take-Two Interactive Software, Markel, Citrix, Match Group, Fiserv, Adobe, and Steris. During the period, we sold the following seven positions in their entirety: Middleby Corporation, Berkshire Hathaway, Union Pacific, Expedia Group, Wells Fargo, CVS Health, and Phillips 66. Each one of the buys brings to our portfolio a leader in their respective industries. The sales were a combination of companies that either reached our internal intrinsic valuation target (Union Pacific, Berkshire Hathaway) or companies whose outlook we determined had worsened for the foreseeable future for either company-specific, industry-specific or macroeconomic reasons. The Alta Quality Growth Fund ended the fiscal year with thirty-one holdings.
The Alta Quality Growth Fund seeks to invest in businesses that we believe have attractive fundamental characteristics with a supporting secular theme. We feel that companies with strong free cash flow, profitability throughout the economic cycle, durable competitive advantages, financial flexibility, and stable and growing margins deliver the best investment returns over the long term. Factors such as return on invested capital, revenue growth, and operating margins are analyzed as we vet candidates for the portfolio.
This past year has reminded us that time in the market is much more important than trying to time the market. Owning a portfolio that delivers earnings consistency superior to the overall market allows one to participate in market upside while dampening the downside’s adverse effects. We thank you for your confidence and support in the Alta Quality Growth Fund.
Sincerely,
Alta Capital Management, LLC
2
Guardian Fundamental Global Equity Fund
Letter to Shareholders (Unaudited)
Dear Fellow Shareholders,
The Guardian Fundamental Global Equity Fund (“Guardian Equity Fund”) finished its inaugural fiscal period on September 30, 2020. This marks roughly nine months since the Guardian Equity Fund’s inception date of December 19, 2019 and we are grateful for the trust and support of our shareholders. Alta Capital Management has managed U.S. growth equity portfolios for 39 years and we are excited to offer our trusted clients, through this Guardian Equity Fund and with the support of our affiliate GuardCap Asset Management Limited, a complementary global equity offering to our unique investment approach.
Investment performance for this fiscal year encompasses the period from the Guardian Equity Fund’s inception, December 19, 2019, to September 30, 2020. For this period, the Guardian Equity Fund returned 6.39%. In comparison, our benchmark, the MSCI World Index returned 2.52%. The Guardian Equity Fund’s underlying investment philosophy emphasizes long-term thinking, long-term forecasting, and long-term holding periods. This is in contrast to the trend of shortening holding periods and time horizons in the general market. Periods of greater uncertainty and volatility, such as we have experienced over the last six months, tend to exacerbate the market’s short-termism even further. We are not investing in companies based on expectations for financial results during the next quarter, but instead over the next 20 quarters or more.
When analyzing companies, we measure them against 10 “Confidence Criteria” – 5 Growth Criteria and 5 Quality Criteria. Companies must satisfy all criteria in order to be considered for inclusion in the Guardian Equity Fund. One of these criteria is the existence, and persistence, of a secular industry growth trend. To us, this means that regardless of economic conditions, market volatility, geopolitical risks, or other external factors, the subject company operates in an industry that is growing sustainably at above-average rates for at least the next 5 years. While none of us could have predicted a global pandemic and the resulting social or economic effects, many of these existing trends have rapidly accelerated as a result. For instance, the rapid digitization of our world has only accelerated since COVID-19 lockdowns were first put in place.
For this fiscal period, the Guardian Equity Fund outperformed the MSCI World Index due to stock selection. Specifically, our positions in Keyence (total return +32%), Nike (+27%), Mastercard (+14%), MarketAxess (+29%), and Novo Nordisk (+22%), rounded out our top 5 performers. Our laggards for the period included: Ulta Beauty (not held at period end, -41%), CME Group (-15%), Booking Holdings (-15%), ADP (-17%), and EssilorLuxottica (-11%).
The Guardian Equity Fund does not hold securities in the utilities, energy, or real estate sectors. It also avoids stocks in industries where company revenues have above-average sensitivity to the economic cycle, such as commodity producers and banks. Companies in these sectors and industries have historically failed to meet both Growth and Quality requirements of our 10 Confidence Criteria.
3
Guardian Fundamental Global Equity Fund
Letter to Shareholders (Unaudited) (continued)
During the fiscal period the Guardian Equity Fund sold two holdings: Ulta Beauty and Tiffany. Ulta was sold in March as the economic effects of the pandemic began to emerge. Ulta is a primarily a physical retail chain with only 13.5% of its sales online prior to the crisis. The pandemic forced the closure of all of its stores. The portfolio manager team felt that although the company’s balance sheet was reasonably robust, the impact of the crisis on its balance sheet was likely to be severe, and we exited the position. In April, the Guardian Equity Fund exited its position in Tiffany, whose shareholders had agreed to a takeover bid from LVMH. Given the impacts of the pandemic on revenues and company valuations, the portfolio managers felt the risks of the deal falling through or moving forward with a lower price outweighed the potential it would proceed as originally agreed.
The Guardian Equity Fund made one addition during the period, initiating a holding in global management consulting, technology services, and outsourcing company Accenture. With capabilities across forty industry groups, it counts three quarters of the Fortune 500 as clients. It collaborates with these businesses to help them become high performance organisations. Digital transformation is a key driver of growth for Accenture, and digital, security, and cloud, already represents 65% of group revenue. Focus on these high value areas is enabling it grow at a much faster rate than the overall market. From a quality point of view Accenture has net cash on the balance sheet and its capital light business model means that it is highly cash generative. It generates returns on invested capital in excess of twenty percent.
The current 23 portfolio holdings are those that the portfolio management team feels best represent its investment philosophy: growth drives returns, quality protects to the downside, and valuation matters. The team has built confidence over an exhaustive research process that these holdings will continue to remain high quality companies capable of sustaining above-average growth well beyond the normal market time horizon. We thank you for joining us in the inaugural year of the Guardian Equity Fund.
Sincerely,
Alta Capital Management, LLC
4
Investment Results (Unaudited)
Average Annual Total Returns(a) as of September 30, 2020
| | One Year | Since Inception
(12/19/2018) |
Alta Quality Growth Fund - Institutional Shares | 12.92% | 21.73% |
S&P 500® Index (b) | 15.15% | 20.25% |
Russell 1000® Growth Index (c) | 37.53% | 34.76% |
| | Expense Ratios(d) |
| | Institutional
Shares |
Gross | 1.54% |
With Applicable Waivers | 0.79% |
The performance quoted represents past performance, which does not guarantee future results. The investment return and principal value of an investment will fluctuate so that an investor’s shares, when redeemed, may be worth more or less than their original cost. The returns shown do not reflect deduction of taxes that a shareholder would pay on Alta Quality Growth Fund (“Alta Growth Fund”) distributions or the redemption of Alta Growth Fund shares. Current performance of the Alta Growth Fund may be lower or higher than the performance quoted. The Alta Growth Fund’s investment objectives, risks, charges and expenses must be considered carefully before investing. Performance data current to the most recent month end may be obtained by calling (800) 957-0681.
(a) Return figures reflect any change in price per share and assume the reinvestment of all distributions. The Alta Growth Fund’s returns reflect any fee reductions during the applicable period. If such fee reductions had not occurred, the quoted performance would have been lower.
(b) The S&P 500® Index is a widely recognized unmanaged index of equity securities and is representative of a broader domestic equity market and range of securities than is found in the Alta Growth Fund’s portfolio. Individuals cannot invest directly in an index; however, an individual can invest in exchange-traded funds or other investment vehicles that attempt to track the performance of a benchmark index.
(c) The Russell 1000® Growth Index is a widely recognized unmanaged index of equity securities and is representative of a broader domestic equity market and range of securities than is found in the Alta Growth Fund’s portfolio. Individuals cannot invest directly in an index; however, an individual can invest in exchange traded funds or other investment vehicles that attempt to track the performance of a benchmark index.
(d) The expense ratios are from the Alta Growth Fund’s prospectus dated January 28, 2020. Alta Capital Management, LLC, the Alta Growth Fund’s adviser (the “Adviser”), has contractually agreed to waive its management fee and/or reimburse expenses so that total annual operating expenses for the Alta Growth Fund (excluding (i) interest; (ii) taxes; (iii) brokerage fees and commissions; (iv) other extraordinary expenses not incurred in the ordinary course of the Alta Growth Fund’s business; (v) dividend expense on short sales; and (vi) indirect expenses such as acquired fund fees and expenses) do not exceed 0.79% of the average daily net assets of the Alta Growth Fund through January 31, 2021 (the “Expense Limitation”). The Expense Limitation is expected to continue from year to year thereafter. During any fiscal year that the Investment Advisory Agreement between the Adviser and Capitol Series Trust (the “Trust”) is in effect, the Adviser may recoup the sum of all fees previously waived or expenses reimbursed, less any reimbursement previously paid, provided that the Adviser is only permitted to recoup fees or expenses within 36 months from the date the fee waiver or expense reimbursement first occurred and provided further that such recoupment can be achieved within the Expense Limitation Agreement currently in effect and the Expense Limitation Agreement in place when the waiver/reimbursement occurred. This Expense Limitation Agreement may not be terminated by the Adviser prior to its expiration date, but the Board of Trustees (the “Board”) may terminate such agreement at any time. The Expense Limitation Agreement terminates automatically upon the termination of the Advisory Agreement with the Adviser. Additional information pertaining to the Alta Growth Fund’s expense ratios as of September 30, 2020, can be found in the financial highlights.
The Alta Growth Fund’s investment objectives, strategies, risks, charges and expenses must be considered carefully before investing. The prospectus contains this and other important information about the Alta Growth Fund and may be obtained by calling the same number as above. Please read it carefully before investing.
The Alta Growth Fund is distributed by Ultimus Fund Distributors, LLC, member FINRA/SIPC.
5
Investment Results (Unaudited) (continued)
Comparison of the Growth of a $10,000 Investment in the Alta Quality Growth Fund - Institutional Shares, the S&P 500® Index and the Russell 1000® Growth Index.
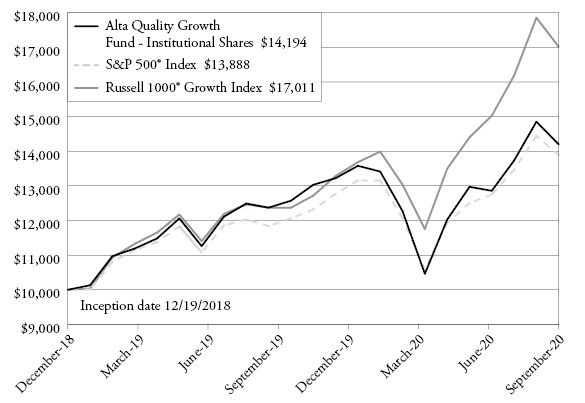
The chart above assumes an initial investment of $10,000 made on December 19, 2018 (commencement of operations) and held through September 30, 2020. THE FUND’S RETURNS REPRESENT PAST PERFORMANCE AND DO NOT GUARANTEE FUTURE RESULTS. The returns shown do not reflect deduction of taxes that a shareholder would pay on the Alta Growth Fund’s distributions or the redemption of the Alta Growth Fund’s shares. Investment returns and principal values will fluctuate so that your shares, when redeemed, may be worth more or less than their original purchase price.
Current performance may be lower or higher than the performance data quoted. For more information on the Alta Growth Fund, and to obtain performance data current to the most recent month-end, or to request a prospectus, please call (800) 957-0681. You should carefully consider the investment objectives, potential risks, management fees, and charges and expenses of the Alta Growth Fund before investing. The Alta Growth Fund’s prospectus contains this and other information about the Alta Growth Fund, and should be read carefully before investing.
The Alta Growth Fund is distributed by Ultimus Fund Distributors, LLC, member FINRA/SIPC.
6
Investment Results (Unaudited) (continued)
Total Returns(a) as of September 30, 2020
| | Since Inception
(12/19/2019) |
Guardian Fundamental Global Equity Fund - Institutional Shares | 6.39% |
MSCI World Index (b) | 2.52% |
| | Expense Ratios(c) |
| | Institutional
Shares |
Gross | 1.95% |
With Applicable Waivers | 0.99% |
The performance quoted represents past performance, which does not guarantee future results. The investment return and principal value of an investment will fluctuate so that an investor’s shares, when redeemed, may be worth more or less than their original cost. The returns shown do not reflect deduction of taxes that a shareholder would pay on Guardian Fundamental Global Equity Fund (“Guardian Equity Fund”) distributions or the redemption of Guardian Equity Fund shares. Current performance of the Guardian Equity Fund may be lower or higher than the performance quoted. The Guardian Equity Fund’s investment objectives, risks, charges and expenses must be considered carefully before investing. Performance data current to the most recent month end may be obtained by calling (800) 957-0681.
(a) Return figures reflect any change in price per share and assume the reinvestment of all distributions. The Guardian Equity Fund’s returns reflect any fee reductions during the applicable period. If such fee reductions had not occurred, the quoted performance would have been lower. Total returns for periods less than one year are not annualized.
(b) The MSCI World Index is an unmanaged free float-adjusted market capitalization index that is designed to measure global developed market equity performance. Currently the MSCI World Index consists of the following 23 developed market country indices: Australia, Austria, Belgium, Canada, Denmark, Finland, France, Germany, Hong Kong, Ireland, Israel, Italy, Japan, Netherlands, New Zealand, Norway, Portugal, Singapore, Spain, Sweden, Switzerland, the United Kingdom and the United States. The performance of the index is expressed in terms of U.S. dollars, and does not reflect the deduction of fees or taxes with a mutual fund, such as investment management and fund accounting fees. Individuals cannot invest directly in an index; however, an individual can invest in exchange-traded funds or other investment vehicles that attempt to track the performance of a benchmark index.
(c) The expense ratios are from the Guardian Equity Fund’s prospectus dated December 18, 2019. Alta Capital Management, LLC, the Guardian Equity Fund’s Adviser, has contractually agreed to waive its management fee and/or reimburse expenses so that total annual operating expenses for the Guardian Equity Fund (excluding (i) interest; (ii) taxes; (iii) brokerage fees and commissions; (iv) other extraordinary expenses not incurred in the ordinary course of the Guardian Equity Fund’s business; (v) dividend expense on short sales; and (vi) indirect expenses such as acquired fund fees and expenses) do not exceed 0.99% of the average daily net assets of the Guardian Equity Fund through January 31, 2021 (the “Expense Limitation”). The Expense Limitation is expected to continue from year to year thereafter. During any fiscal year that the Investment Advisory Agreement between the Adviser and Trust is in effect, the Adviser may recoup the sum of all fees previously waived or expenses reimbursed, less any reimbursement previously paid, provided that the Adviser is only permitted to recoup fees or expenses within 36 months from the date the fee waiver or expense reimbursement first occurred and provided further that such recoupment can be achieved within the Expense Limitation Agreement currently in effect and the Expense Limitation Agreement in place when the waiver/reimbursement occurred. This Expense Limitation Agreement may not be terminated by the Adviser prior to its expiration date, but the Board may terminate such agreement at any time. The Expense Limitation Agreement terminates automatically upon the termination of the Advisory Agreement with the Adviser. Additional information pertaining to the Guardian Equity Fund’s expense ratios as of September 30, 2020, can be found in the financial highlights.
The Guardian Equity Fund’s investment objectives, strategies, risks, charges and expenses must be considered carefully before investing. The prospectus contains this and other important information about the Guardian Equity Fund and may be obtained by calling the same number as above. Please read it carefully before investing.
The Guardian Equity Fund is distributed by Ultimus Fund Distributors, LLC, member FINRA/SIPC.
7
Investment Results (Unaudited) (continued)
Comparison of the Growth of a $10,000 Investment in the Guardian Fundamental Global Equity Fund - Institutional Shares, and the MSCI World Index.
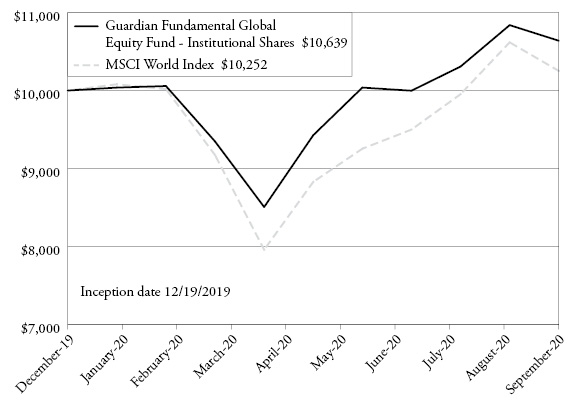
The chart above assumes an initial investment of $10,000 made on December 19, 2019 (commencement of operations) and held through September 30, 2020. THE FUND’S RETURNS REPRESENT PAST PERFORMANCE AND DO NOT GUARANTEE FUTURE RESULTS. The returns shown do not reflect deduction of taxes that a shareholder would pay on the Guardian Equity Fund’s distributions or the redemption of the Guardian Equity Fund’s shares. Investment returns and principal values will fluctuate so that your shares, when redeemed, may be worth more or less than their original purchase price.
Current performance may be lower or higher than the performance data quoted. For more information on the Guardian Equity Fund, and to obtain performance data current to the most recent month-end, or to request a prospectus, please call (800) 957-0681. You should carefully consider the investment objectives, potential risks, management fees, and charges and expenses of the Guardian Equity Fund before investing. The Guardian Equity Fund’s prospectus contains this and other information about the Guardian Equity Fund, and should be read carefully before investing.
The Guardian Equity Fund is distributed by Ultimus Fund Distributors, LLC, member FINRA/SIPC.
8
Portfolio Illustration (Unaudited)
September 30, 2020
Alta Quality Growth Fund Sector Holdings as of September 30, 2020.*
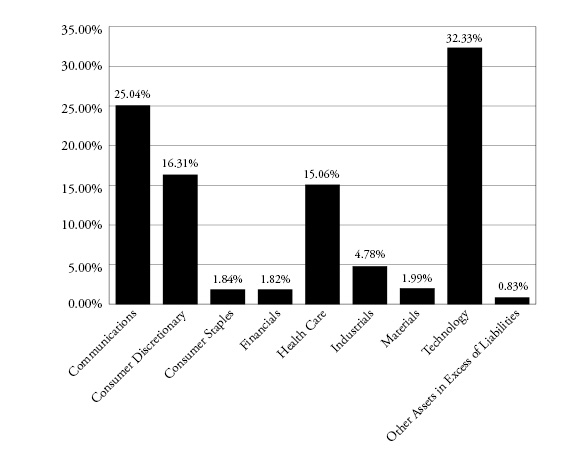
* | As a percentage of net assets. |
9
Portfolio Illustration (Unaudited) (continued)
September 30, 2020
Guardian Fundamental Global Equity Fund Sector Holdings as of September 30, 2020.*
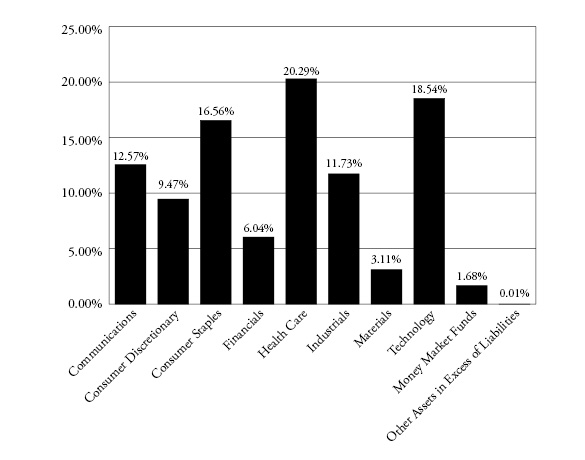
* | As a percentage of net assets. |
Availability of Portfolio Schedules (Unaudited)
The Funds file their complete schedule of portfolio holdings with the Securities and Exchange Commission (“SEC”) for the first and third quarters of each fiscal year as an exhibit to its reports on Form N-PORT. The Funds’ Form N-PORT reports are available on the SEC’s website at http://www.sec.gov.
10
Alta Quality Growth Fund
Schedule of Investments
September 30, 2020
| | Shares | | | Fair Value | |
COMMON STOCKS — 99.17% | | | | | | | | |
| | | | | | | | | |
Communications — 25.04% | | | | | | | | |
Alphabet, Inc., Class A(a) | | | 1,440 | | | $ | 2,110,464 | |
Booking Holdings, Inc.(a) | | | 1,050 | | | | 1,796,214 | |
Facebook, Inc., Class A(a) | | | 9,100 | | | | 2,383,290 | |
Match Group, Inc.(a) | | | 7,200 | | | | 796,680 | |
Take-Two Interactive Software, Inc.(a) | | | 5,800 | | | | 958,276 | |
Walt Disney Co. (The) | | | 12,850 | | | | 1,594,428 | |
| | | | | | | | 9,639,352 | |
Consumer Discretionary — 16.31% | | | | | | | | |
Fortune Brands Home & Security, Inc. | | | 9,700 | | | | 839,244 | |
Home Depot, Inc. (The) | | | 6,000 | | | | 1,666,260 | |
IAA, Inc.(a) | | | 16,000 | | | | 833,120 | |
KAR Auction Services, Inc. | | | 56,500 | | | | 813,600 | |
TJX Cos., Inc. (The) | | | 19,800 | | | | 1,101,870 | |
Ulta Beauty, Inc.(a) | | | 4,575 | | | | 1,024,709 | |
| | | | | | | | 6,278,803 | |
Consumer Staples — 1.84% | | | | | | | | |
Dollar Tree, Inc.(a) | | | 7,750 | | | | 707,885 | |
| | | | | | | | | |
Financials — 1.82% | | | | | | | | |
Markel Corp.(a) | | | 720 | | | | 701,064 | |
| | | | | | | | | |
Health Care — 15.06% | | | | | | | | |
Becton, Dickinson and Co. | | | 4,200 | | | | 977,256 | |
PerkinElmer, Inc. | | | 9,200 | | | | 1,154,692 | |
STERIS PLC | | | 6,950 | | | | 1,224,521 | |
Thermo Fisher Scientific, Inc. | | | 3,200 | | | | 1,412,864 | |
Zoetis, Inc. | | | 6,200 | | | | 1,025,294 | |
| | | | | | | | 5,794,627 | |
Industrials — 4.78% | | | | | | | | |
Amphenol Corp., Class A | | | 10,700 | | | | 1,158,489 | |
Raytheon Technologies Corp. | | | 11,850 | | | | 681,849 | |
| | | | | | | | 1,840,338 | |
Materials — 1.99% | | | | | | | | |
Sherwin-Williams Co. (The) | | | 1,100 | | | | 766,414 | |
| | See accompanying notes which are an integral part of these financial statements. | 11 |
Alta Quality Growth Fund
Schedule of Investments (continued)
September 30, 2020
| | Shares | | | Fair Value | |
COMMON STOCKS — (continued) | | | | | | | | |
| | | | | | | | | |
Technology — 32.33% | | | | | | | | |
Adobe Systems, Inc.(a) | | | 2,700 | | | $ | 1,324,161 | |
Apple, Inc. | | | 23,280 | | | | 2,696,056 | |
Broadridge Financial Solutions, Inc. | | | 8,200 | | | | 1,082,400 | |
Citrix Systems, Inc. | | | 6,800 | | | | 936,428 | |
Fiserv, Inc.(a) | | | 14,600 | | | | 1,504,529 | |
MasterCard, Inc., Class A | | | 3,750 | | | | 1,268,138 | |
S&P Global, Inc. | | | 3,000 | | | | 1,081,800 | |
Visa, Inc., Class A | | | 6,300 | | | | 1,259,811 | |
Zebra Technologies Corp., Class A(a) | | | 5,100 | | | | 1,287,546 | |
| | | | | | | | 12,440,869 | |
| | | | | | | | | |
Total Common Stocks/Investments — 99.17% (Cost $28,208,041) | | | | | | | 38,169,352 | |
| | | | | | | | | |
Other Assets in Excess of Liabilities — 0.83% | | | | | | | 320,828 | |
| | | | | | | | | |
NET ASSETS — 100.00% | | | | | | $ | 38,490,180 | |
(a) | Non-income producing security. |
12 | See accompanying notes which are an integral part of these financial statements. | |
Guardian Fundamental Global Equity Fund
Schedule of Investments
September 30, 2020
| | Shares | | | Fair Value | |
COMMON STOCKS — 98.31% | | | | | | | | |
| | | | | | | | | |
Communications — 12.57% | | | | | | | | |
Alphabet, Inc., Class A(a) | | | 1,205 | | | $ | 1,766,048 | |
Booking Holdings, Inc.(a) | | | 647 | | | | 1,106,810 | |
| | | | | | | | 2,872,858 | |
Consumer Discretionary — 9.47% | | | | | | | | |
Nike, Inc., Class B | | | 9,176 | | | | 1,151,955 | |
Yum China Holdings, Inc. (China) | | | 19,138 | | | | 1,013,357 | |
| | | | | | | | 2,165,312 | |
Consumer Staples — 16.56% | | | | | | | | |
Colgate-Palmolive Co. | | | 14,614 | | | | 1,127,470 | |
L’Oréal S.A. (France) | | | 2,107 | | | | 685,862 | |
Nestle S.A. (Switzerland) | | | 9,514 | | | | 1,129,233 | |
Reckitt Benckiser Group PLC (United Kingdom) | | | 8,649 | | | | 843,696 | |
| | | | | | | | 3,786,261 | |
Financials — 6.04% | | | | | | | | |
CME Group, Inc. | | | 8,257 | | | | 1,381,479 | |
| | | | | | | | | |
Health Care — 20.29% | | | | | | | | |
EssilorLuxottica SA (France)(a) | | | 8,263 | | | | 1,125,407 | |
Illumina, Inc.(a) | | | 3,154 | | | | 974,838 | |
Novo Nordisk A/S, Class B (Denmark) | | | 17,006 | | | | 1,176,450 | |
Stryker Corp. | | | 1,334 | | | | 277,966 | |
UnitedHealth Group, Inc. | | | 3,478 | | | | 1,084,336 | |
| | | | | | | | 4,638,997 | |
Industrials — 11.73% | | | | | | | | |
FANUC Corp. (Japan) | | | 3,700 | | | | 705,717 | |
Intertek Group PLC (United Kingdom) | | | 11,673 | | | | 954,023 | |
Keyence Corp. (Japan) | | | 2,200 | | | | 1,021,510 | |
| | | | | | | | 2,681,250 | |
Materials — 3.11% | | | | | | | | |
Novozymes A/S, Class B (Denmark) | | | 11,280 | | | | 710,266 | |
| | | | | | | | | |
Technology — 18.54% | | | | | | | | |
Accenture PLC, Class A (Ireland) | | | 2,216 | | | | 500,794 | |
Automatic Data Processing, Inc. | | | 4,190 | | | | 584,463 | |
MarketAxess Holdings, Inc. | | | 1,090 | | | | 524,933 | |
MasterCard, Inc., Class A | | | 6,080 | | | | 2,056,074 | |
Moody’s Corp. | | | 1,971 | | | | 571,294 | |
| | | | | | | | 4,237,558 | |
| | | | | | | | | |
Total Common Stocks (Cost $20,849,929) | | | | | | | 22,473,981 | |
| | See accompanying notes which are an integral part of these financial statements. | 13 |
Guardian Fundamental Global Equity Fund
Schedule of Investments (continued)
September 30, 2020
| | Shares | | | Fair Value | |
MONEY MARKET FUNDS — 1.68% | | | | | | | | |
Morgan Stanley Institutional Liquidity Funds Treasury Portfolio, Institutional Class, 0.01%(b) | | | 384,884 | | | $ | 384,884 | |
| | | | | | | | | |
Total Money Market Funds (Cost $384,884) | | | | | | | 384,884 | |
| | | | | | | | | |
Total Investments — 99.99% (Cost $21,234,813) | | | | | | | 22,858,865 | |
| | | | | | | | | |
Other Assets in Excess of Liabilities — 0.01% | | | | | | | 2,673 | |
| | | | | | | | | |
NET ASSETS — 100.00% | | | | | | $ | 22,861,538 | |
(a) | Non-income producing security. |
(b) | Rate disclosed is the seven day effective yield as of September 30, 2020. |
14 | See accompanying notes which are an integral part of these financial statements. | |
Alta Capital Funds
Statements of Assets and Liabilities
September 30, 2020
| | | Alta Quality
Growth Fund | | | Guardian
Fundamental Global
Equity Fund | |
Assets |
Investments in securities at fair value (cost $28,208,041 and $21,234,813) | | $ | 38,169,352 | | | $ | 22,858,865 | |
Cash and cash equivalents | | | 344,657 | | | | — | |
Foreign currency at value ($— and $7,991) | | | — | | | | 8,057 | |
Receivable for fund shares sold | | | 1,000 | | | | — | |
Dividends and interest receivable | | | 8,107 | | | | 16,290 | |
Deferred offering costs | | | — | | | | 3,076 | |
Prepaid expenses | | | 13,967 | | | | 8,373 | |
Total Assets | | | 38,537,083 | | | | 22,894,661 | |
Liabilities | | | | | | | | |
Payable for fund shares redeemed | | | 7,521 | | | | — | |
Payable to Adviser | | | 10,110 | | | | 1,315 | |
Payable to Administrator | | | 6,681 | | | | 6,747 | |
Payable to auditors | | | 15,250 | | | | 15,250 | |
Other accrued expenses | | | 7,341 | | | | 9,811 | |
Total Liabilities | | | 46,903 | | | | 33,123 | |
Net Assets | | $ | 38,490,180 | | | $ | 22,861,538 | |
Net Assets consist of: | | | | | | | | |
Paid-in capital | | $ | 29,102,875 | | | $ | 21,475,688 | |
Accumulated earnings | | | 9,387,305 | | | | 1,385,850 | |
Net Assets | | $ | 38,490,180 | | | $ | 22,861,538 | |
Institutional Shares: | | | | | | | | |
Net Assets | | $ | 38,490,180 | | | $ | 22,861,538 | |
Shares outstanding (unlimited number of shares authorized, no par value) | | | 2,788,456 | | | | 2,152,373 | |
Net asset value, offering and redemption price per share | | $ | 13.80 | | | $ | 10.62 | |
| | See accompanying notes which are an integral part of these financial statements. | 15 |
Alta Capital Funds
Statements of Operations
For the year ended September 30, 2020
| | | Alta Quality
Growth Fund | | | Guardian
Fundamental Global
Equity Fund(a) | |
Investment Income | | | | | | | | |
Dividend income (net of foreign taxes withheld of $— and $21,635) | | $ | 290,212 | | | $ | 198,461 | |
Interest income | | | 5,957 | | | | — | |
Total investment income | | | 296,169 | | | | 198,461 | |
Expenses | | | | | | | | |
Adviser | | | 238,889 | | | | 127,086 | |
Administration | | | 51,129 | | | | 34,727 | |
Legal | | | 19,910 | | | | 17,328 | |
Audit and tax preparation | | | 16,250 | | | | 18,250 | |
Trustee | | | 14,699 | | | | 11,250 | |
Compliance services | | | 14,000 | | | | 10,989 | |
Transfer agent | | | 12,000 | | | | 9,419 | |
Registration | | | 11,908 | | | | 1,802 | |
Report printing | | | 5,353 | | | | 5,036 | |
Custodian | | | 4,491 | | | | 10,050 | |
Offering | | | 2,715 | | | | 10,638 | |
Pricing | | | 762 | | | | 1,394 | |
Organizational | | | — | | | | 15,000 | |
Miscellaneous | | | 22,640 | | | | 16,314 | |
Total expenses | | | 414,746 | | | | 289,283 | |
Fees contractually waived and expenses reimbursed by Adviser | | | (163,191 | ) | | | (131,996 | ) |
Net operating expenses | | | 251,555 | | | | 157,287 | |
Net investment income | | | 44,614 | | | | 41,174 | |
Net Realized and Change in Unrealized Gain (Loss) on Investments |
Net realized loss on investment securities transactions | | | (325,867 | ) | | | (242,615 | ) |
Net realized loss on foreign currency translations | | | — | | | | (11,623 | ) |
Net change in unrealized appreciation of investment securities | | | 5,244,278 | | | | 1,624,052 | |
Net change in unrealized appreciation on foreign currency translations | | | — | | | | 29 | |
Net realized and change in unrealized gain on investments | | | 4,918,411 | | | | 1,369,843 | |
Net increase in net assets resulting from operations | | $ | 4,963,025 | | | $ | 1,411,017 | |
(a) | For the period December 19, 2019 (commencement of operations) to September 30, 2020. |
16 | See accompanying notes which are an integral part of these financial statements. | |
Alta Capital Funds
Statements of Changes in Net Assets
| | | Alta Quality Growth Fund | |
| | For the
Year Ended
September 30,
2020 | | | For the
Period Ended
September 30,
2019(a) | |
Increase (Decrease) in Net Assets due to: | | | | | | | | |
Operations | | | | | | | | |
Net investment income | | $ | 44,614 | | | $ | 84,414 | |
Net realized gain (loss) on investment securities transactions | | | (325,867 | ) | | | 462,811 | |
Net change in unrealized appreciation of investment securities | | | 5,244,278 | | | | 4,717,033 | |
Net increase in net assets resulting from operations | | | 4,963,025 | | | | 5,264,258 | |
Distributions to Shareholders from: | | | | | | | | |
Earnings | | | (840,020 | ) | | | — | |
Total distributions | | | (840,020 | ) | | | — | |
Capital Transactions - Institutional Shares | | | | | | | | |
Proceeds from shares sold | | | 7,483,844 | | | | 22,186,666 | |
Reinvestment of distributions | | | 656,317 | | | | — | |
Amount paid for shares redeemed | | | (1,218,802 | ) | | | (5,108 | ) |
Net increase in net assets resulting from capital transactions | | | 6,921,359 | | | | 22,181,558 | |
Total Increase in Net Assets | | | 11,044,364 | | | | 27,445,816 | |
Net Assets | | | | | | | | |
Beginning of period | | $ | 27,445,816 | | | $ | — | |
End of period | | $ | 38,490,180 | | | $ | 27,445,816 | |
Share Transactions - Institutional Shares | | | | | | | | |
Shares sold | | | 650,857 | | | | 2,184,019 | |
Shares issued in reinvestment of distributions | | | 50,139 | | | | — | |
Shares redeemed | | | (96,144 | ) | | | (415 | ) |
Net increase in shares | | | 604,852 | | | | 2,183,604 | |
(a) | For the period December 19, 2018 (commencement of operations) to September 30, 2019. |
| | See accompanying notes which are an integral part of these financial statements. | 17 |
Alta Capital Funds
Statements of Changes in Net Assets (continued)
| | | Guardian
Fundamental Global
Equity Fund | |
| | For the
Period Ended
September 30,
2020(b) | |
Increase (Decrease) in Net Assets due to: | | | | |
Operations | | | | |
Net investment income | | $ | 41,174 | |
Net realized loss on investment securities transactions and foreign currency translations | | | (254,238 | ) |
Net change in unrealized appreciation of investment securities and foreign currency translations | | | 1,624,081 | |
Net increase in net assets resulting from operations | | | 1,411,017 | |
Distributions to Shareholders from: | | | | |
Earnings | | | (35,805 | ) |
Total distributions | | | (35,805 | ) |
Capital Transactions - Institutional Shares | | | | |
Proceeds from shares sold | | | 21,459,478 | |
Reinvestment of distributions | | | 26,848 | |
Net increase in net assets resulting from capital transactions | | | 21,486,326 | |
Total Increase in Net Assets | | | 22,861,538 | |
Net Assets | | | | |
Beginning of period | | $ | — | |
End of period | | $ | 22,861,538 | |
Share Transactions - Institutional Shares | | | | |
Shares sold | | | 2,149,684 | |
Shares issued in reinvestment of distributions | | | 2,689 | |
Net increase in shares | | | 2,152,373 | |
(b) | For the period December 19, 2019 (commencement of operations) to September 30, 2020. |
18 | See accompanying notes which are an integral part of these financial statements. | |
Alta Quality Growth Fund – Institutional Shares
Financial Highlights
(For a share outstanding during each period)
| | | For the
Year Ended
September 30,
2020 | | | For the
Period Ended
September 30,
2019(a) | |
Net asset value, beginning of period | | $ | 12.57 | | | $ | 10.00 | |
Investment operations: | | | | | | | | |
Net investment income | | | 0.02 | | | | 0.04 | |
Net realized and unrealized gain on investments | | | 1.59 | | | | 2.53 | |
Total from investment operations | | | 1.61 | | | | 2.57 | |
Distributions from: | | | | | | | | |
Net investment income | | | (0.05 | ) | | | — | |
Net realized gains | | | (0.33 | ) | | | — | |
Total from distributions | | | (0.38 | ) | | | — | |
Net asset value, end of period | | $ | 13.80 | | | $ | 12.57 | |
Total Return(b) | | | 12.92 | % | | | 25.70 | %(c) |
| | | | | | | | | |
Ratios/Supplemental Data: | | | | | | | | |
Net assets, end of period (000 omitted) | | $ | 38,490 | | | $ | 27,446 | |
Before waiver or recoupment: | | | | | | | | |
Ratio of expenses to average net assets | | | 1.30 | % | | | 1.54 | %(d) |
After waiver or recoupment: | | | | | | | | |
Ratio of expenses to average net assets | | | 0.79 | % | | | 0.79 | %(d) |
Ratio of net investment income to average net assets | | | 0.14 | % | | | 0.45 | %(d) |
Portfolio turnover rate | | | 26 | % | | | 16 | %(c) |
(a) | For the period December 19, 2018 (commencement of operations) to September 30, 2019. |
(b) | Total return in the above table represents the rate that the investor would have earned or lost on an investment in the Alta Quality Growth Fund, assuming reinvestment of distributions. |
| | See accompanying notes which are an integral part of these financial statements. | 19 |
Guardian Fundamental Global Equity Fund – Institutional Shares
Financial Highlights
(For a share outstanding during the period)
| | | For the
Period Ended
September 30,
2020(a) | |
Net asset value, beginning of period | | $ | 10.00 | |
Investment operations: | | | | |
Net investment income | | | 0.02 | |
Net realized and unrealized gain on investments | | | 0.62 | |
Total from investment operations | | | 0.64 | |
Distributions from: | | | | |
Net investment income | | | (0.02 | ) |
Net realized gains | | | — | |
Total from distributions | | | (0.02 | ) |
Net asset value, end of period | | $ | 10.62 | |
Total Return(b) | | | 6.39 | %(c) |
| | | | | |
Ratios/Supplemental Data: | | | | |
Net assets, end of period (000 omitted) | | $ | 22,862 | |
Before waiver or recoupment: | | | | |
Ratio of expenses to average net assets | | | 1.82 | %(d) |
After waiver or recoupment: | | | | |
Ratio of expenses to average net assets | | | 0.99 | %(d) |
Ratio of net investment income to average net assets | | | 0.26 | %(d) |
Portfolio turnover rate | | | 10 | %(c) |
(a) | For the period December 19, 2019 (commencement of operations) to September 30, 2020. |
(b) | Total return in the above table represents the rate that the investor would have earned or lost on an investment in the Guardian Fundamental Global Equity Fund, assuming reinvestment of distributions. |
20 | See accompanying notes which are an integral part of these financial statements. | |
Alta Capital Funds
Notes to the Financial Statements
September 30, 2020
NOTE 1. ORGANIZATION
The Alta Quality Growth Fund (“Alta Growth Fund”) was organized as a diversified series and the Guardian Fundamental Global Equity Fund (“Guardian Equity Fund”) (each a “Fund” and, collectively the “Funds”) was organized as a non-diversified series of Capitol Series Trust (the “Trust”). The Trust is an open-end investment company established under the laws of Ohio by an Agreement and Declaration of Trust dated September 18, 2013 (the “Trust Agreement”). The Trust Agreement permits the Board of Trustees of the Trust (the “Board”) to issue an unlimited number of shares of beneficial interest of separate series without par value. The Funds’ investment adviser is Alta Capital Management, LLC (the “Adviser”). GuardCap Asset Management Limited, a U.K.-based affiliate of the Adviser, assists with the portfolio management of the Guardian Equity Fund through a “participating affiliate” arrangement. The investment objective of the Alta Growth Fund is to seek long-term growth of capital with lower than market volatility. The investment objective of the Guardian Equity Fund is to provide long-term capital appreciation.
Each Fund currently offers one class of shares, Institutional Shares. Each share represents an equal proportionate interest in the assets and liabilities belonging to the Funds and is entitled to such dividends and distributions out of income belonging to the Funds as are declared by the Board.
NOTE 2. SIGNIFICANT ACCOUNTING POLICIES
The Funds are investment companies and follow accounting and reporting guidance under Financial Accounting Standards Board Accounting Standards Codification (“ASC”) Topic 946, “Financial Services-Investment Companies.” The following is a summary of significant accounting policies followed by the Funds in the preparation of their financial statements. These policies are in conformity with the generally accepted accounting principles in the United States of America (“GAAP”).
Estimates – The preparation of financial statements in conformity with GAAP requires management to make estimates and assumptions that affect the reported amounts of assets and liabilities and disclosure of contingent assets and liabilities at the date of the financial statements and the reported amounts of increases and decreases in net assets from operations during the reporting period. Actual results could differ from those estimates.
Foreign Currency Translation – The accounting records of the Funds are maintained in U.S. dollars. Foreign currency amounts are translated into U.S. dollars at the current rate of exchange each business day to determine the value of investments, and other assets and liabilities. Purchases and sales of foreign securities, and income and expenses, are translated at the prevailing rate of exchange on the respective date of these transactions. The Funds do not isolate that portion of the results of operations resulting from changes in foreign
21
Alta Capital Funds
Notes to the Financial Statements (continued)
September 30, 2020
exchange rates on investments from fluctuation arising from changes in market prices of securities held. These fluctuations are included with the unrealized gain or loss from investments.
Federal Income Taxes – The Funds make no provision for federal income or excise tax. Each Fund has qualified and intends to qualify each year as a regulated investment company (“RIC”) under subchapter M of the Internal Revenue Code of 1986, as amended, by complying with the requirements applicable to RICs and by distributing substantially all of its taxable income. Each Fund also intends to distribute sufficient net investment income and net capital gains, if any, so that it will not be subject to excise tax on undistributed income and gains. If the required amount of net investment income or gains is not distributed, the Fund could incur a tax expense.
The Funds may be subject to taxes imposed by countries in which they invest. Such taxes are generally based on income and/or capital gains earned or repatriated. Taxes are accrued and applied to net investment income, net realized gains and unrealized appreciation as such income and/or gains are earned.
The Funds recognize tax benefits or expenses of uncertain tax positions only when the position is “more likely than not” to be sustained assuming examination by tax authorities. Management of the Funds has reviewed tax positions taken in tax years that remain subject to examination by all major tax jurisdictions, including federal (i.e., the previous year end and the interim tax period since then, as applicable) and has concluded that no provision for unrecognized tax benefits or expenses is required in these financial statements and does not expect this to change over the next twelve months. The Funds recognize interest and penalties, if any, related to unrecognized tax benefits as income tax expense in the Statements of Operations. During the period, the Funds did not incur any interest or penalties.
Expenses – Expenses incurred by the Trust that do not relate to a specific fund of the Trust are allocated to the individual funds based on each fund’s relative net assets or another appropriate basis (as determined by the Board).
Security Transactions and Related Income – Throughout the reporting period, security transactions are accounted for no later than one business day following the trade date. For financial reporting purposes, security transactions are accounted for on trade date on the last business day of the reporting period. The specific identification method is used for determining gains or losses for financial statements and income tax purposes. Dividend income is recorded on the ex-dividend date. Interest income is recorded on an accrual basis and includes, where applicable, the amortization of premium or accretion of discount. Withholding taxes on foreign dividends, if any, have been recorded for in accordance with the Funds’ understanding of the applicable country’s tax rules and rates.
22
Alta Capital Funds
Notes to the Financial Statements (continued)
September 30, 2020
Dividends and Distributions – The Alta Growth Fund intends to distribute its net investment income and net realized long-term and short-term capital gains, if any, at least annually. The Guardian Equity Fund intends to distribute its net investment income quarterly and its net realized long-term and short-term capital gains, if any, at least annually. Dividends and distributions to shareholders, which are determined in accordance with income tax regulations, are recorded on the ex-dividend date. The treatment for financial reporting purposes of distributions made to shareholders during the period from net investment income or net realized capital gains may differ from their ultimate treatment for federal income tax purposes. These differences are caused primarily by differences in the timing of the recognition of certain components of income, expense or realized capital gain for federal income tax purposes. Where such differences are permanent in nature, they are reclassified among the components of the net assets based on their ultimate characterization for federal income tax purposes. Any such reclassifications will have no effect on net assets, results of operations or net asset value (“NAV”) per share of the Funds.
For the fiscal year ended September 30, 2020, the Funds made the following reclassifications to increase (decrease) the components of net assets:
| | | Paid-In
Capital | | | Accumulated
Earnings
(Deficit) | |
Alta Growth Fund | | $ | — | | | $ | — | |
Guardian Equity Fund | | | (10,638 | ) | | | 10,638 | |
Organization and Offering Costs – The Adviser advanced some of the Funds’ organization and initial offering costs and was subsequently reimbursed by the Funds. Costs of $13,452 and $13,714 incurred in connection with the offering and initial registration of the Alta Growth Fund and Guardian Equity Fund, respectively, have been deferred and are being amortized on a straight-line basis over the first twelve months after commencement of operations. As of September 30, 2020, there were $0 and $3,076 in unamortized offering costs remaining in the Alta Growth Fund and Guardian Equity Fund, respectively. Costs of $15,000 incurred in connection with the organization of the Guardian Equity Fund were expensed as incurred.
NOTE 3. SECURITIES VALUATION AND FAIR VALUE MEASUREMENTS
Fair value is defined as the price that a Fund would receive upon selling an investment in a timely transaction to an independent buyer in the principal or most advantageous market of the investment. GAAP establishes a three-tier hierarchy to maximize the use of observable market data and minimize the use of unobservable inputs and to establish classification of fair value measurements for disclosure purposes.
23
Alta Capital Funds
Notes to the Financial Statements (continued)
September 30, 2020
Inputs refer broadly to the assumptions that market participants would use in pricing the asset or liability, including assumptions about risk (the risk inherent in a particular valuation technique used to measure fair value including a pricing model and/or the risk inherent in the inputs to the valuation technique). Inputs may be observable or unobservable. Observable inputs are inputs that reflect the assumptions market participants would use in pricing the asset or liability developed based on market data obtained and available from sources independent of the reporting entity. Unobservable inputs are inputs that reflect the reporting entity’s own assumptions about the assumptions market participants would use in pricing the asset or liability developed based on the best information available in the circumstances.
Various inputs are used in determining the value of each Fund’s investments. These inputs are summarized in the three broad levels listed below.
| | ● | Level 1 – unadjusted quoted prices in active markets for identical investments and/or registered investment companies where the value per share is determined and published and is the basis for current transactions for identical assets or liabilities at the valuation date |
| | ● | Level 2 – other significant observable inputs (including, but not limited to, quoted prices for an identical security in an inactive market, quoted prices for similar securities, interest rates, prepayment speeds, credit risk, etc.) |
| | ● | Level 3 – significant unobservable inputs (including the Funds’ own assumptions in determining fair value of investments based on the best information available) |
The inputs used to measure fair value may fall into different levels of the fair value hierarchy. In such cases, for disclosure purposes, the level in the fair value hierarchy which is reported, is determined based on the lowest level input that is significant to the fair value measurement in its entirety.
In computing the NAV of the Funds, fair value is based on market valuations with respect to portfolio securities for which market quotations are readily available. Pursuant to Board approved policies, the Funds rely on independent third-party pricing services to provide the current market value of securities. Those pricing services value equity securities, including exchange-traded funds, exchange-traded notes, closed-end funds and preferred stocks, traded on a securities exchange at the last reported sales price on the principal exchange. Equity securities quoted by NASDAQ are valued at the NASDAQ Official Closing Price. If there is no reported sale on the principal exchange, equity securities are valued at the mean between the most recent quoted bid and asked price. When using the market quotations or close prices provided by the pricing service and when the market is considered active, the security will be classified as a Level 1 security. Investments in open-end mutual funds, including money market mutual funds, are generally priced at the ending NAV provided by the pricing service of the funds and are generally categorized as Level 1 securities. Debt securities are valued using evaluated prices furnished by a pricing vendor selected by the Board and are generally classified as Level 2 securities.
24
Alta Capital Funds
Notes to the Financial Statements (continued)
September 30, 2020
In the event that market quotations are not readily available, the Adviser determines that the market quotation or the price provided by the pricing service does not accurately reflect the current fair value, or certain restricted or illiquid securities are being valued, such securities are valued as determined in good faith by the Trust’s Valuation Committee, based on recommendations from a pricing committee comprised of certain officers of the Trust, certain employees of the Fund’s administrator, and representatives of the Adviser (together the “Pricing Review Committee”). These securities will be classified as Level 2 or 3 within the fair value hierarchy, depending on the inputs used.
In accordance with the Trust’s Portfolio Valuation Procedures, the Pricing Review Committee, in making its recommendations with the Adviser’s participation, is required to consider all appropriate factors relevant to the value of securities for which it has determined other pricing sources are not available or reliable as described above. No single standard exists for determining fair value, because fair value depends upon the circumstances of each individual case. As a general principle, the current fair value of an issue of securities being valued pursuant to the Trust’s Fair Value Guidelines would be the amount which the Funds might reasonably expect to receive for them upon their current sale. Methods which are in accordance with this principle may, for example, be based on (i) a multiple of earnings; (ii) a discount from market prices of a similar freely traded security (including a derivative security or a basket of securities traded on other markets, exchanges or among dealers); or (iii) yield to maturity with respect to debt issues, or a combination of these and other methods. Fair value pricing is permitted if, in accordance with the Trust’s Portfolio Valuation Procedures, the validity of market quotations appears to be questionable based on factors such as evidence of a thin market in the security based on a small number of quotations, a significant event occurs after the close of a market but before each Fund’s NAV calculation that may affect a security’s value, or other data calls into question the reliability of market quotations.
The following is a summary of the inputs used to value the Funds’ investments as of September 30, 2020:
Alta Growth Fund | | Valuation Inputs | | | | |
Assets | | Level 1 | | | Level 2 | | | Level 3 | | | Total | |
Common Stocks(a) | | $ | 38,169,352 | | | $ | — | | | $ | — | | | $ | 38,169,352 | |
Total | | $ | 38,169,352 | | | $ | — | | | $ | — | | | $ | 38,169,352 | |
Guardian Equity Fund | | Valuation Inputs | | | | |
Assets | | Level 1 | | | Level 2 | | | Level 3 | | | Total | |
Common Stocks(a) | | $ | 22,473,981 | | | $ | — | | | $ | — | | | $ | 22,473,981 | |
Money Market Funds | | | 384,884 | | | | — | | | | — | | | $ | 384,884 | |
Total | | $ | 22,858,865 | | | $ | — | | | $ | — | | | $ | 22,858,865 | |
(a) | Refer to Schedule of Investments for sector classifications. |
25
Alta Capital Funds
Notes to the Financial Statements (continued)
September 30, 2020
The Funds did not hold any investments at the end of the reporting period for which significant unobservable inputs (Level 3) were used in determining fair value; therefore, no reconciliation of Level 3 securities is included for this reporting period.
NOTE 4. FEES AND OTHER TRANSACTIONS WITH AFFILIATES AND OTHER SERVICE PROVIDERS
Under the terms of the investment advisory agreements (the “Agreements”), the Adviser manages each Fund’s investments subject to approval of the Board. As compensation for its management services, the Funds are obligated to pay the Adviser a fee computed and accrued daily and paid monthly at an annual rate of 0.75% and 0.80% of the average daily net assets of the Alta Growth Fund and the Guardian Equity Fund, respectively. For the fiscal year ended September 30, 2020, the Adviser earned fees of $238,889 from the Alta Growth Fund. For the period December 19, 2019 (commencement of operations) to September 30, 2020 the Adviser earned fees of $127,086 from the Guardian Equity Fund. At September 30, 2020, the Alta Growth Fund and Guardian Equity Fund owed the Adviser $10,110 and $1,315, respectively, pursuant to the expense limitation agreement described below.
The Adviser has contractually agreed to waive its management fee and/or reimburse expenses so that total annual operating expenses (excluding (i) interest; (ii) taxes; (iii) brokerage fees and commissions; (iv) other extraordinary expenses not incurred in the ordinary course of each Fund’s business; (v) dividend expenses on short sales; and (vi) indirect expenses such as acquired fund fees and expenses) do not exceed 0.79% of the Alta Growth Fund’s and 0.99% of the Guardian Equity Fund’s average daily net assets through January 31, 2021 (“Expense Limitation”). During any fiscal year that the Agreements between the Adviser and the Trust is in effect, the Adviser may recoup the sum of all fees previously waived or expenses reimbursed, less any reimbursement previously paid, provided that the Adviser is only permitted to recoup fees or expenses within 36 months from the date the fee waiver or expense reimbursement took effect and provided further that such recoupment can be achieved within the Expense Limitation currently in effect and the Expense Limitation in place when the waiver/reimbursement occurred. This Expense Limitation agreement may not be terminated by the Adviser prior to its expiration date, but the Board may terminate such agreement at any time.
As of September 30, 2020, the Adviser may seek repayment of investment advisory fee waivers and expense reimbursements in the amount as follows:
Recoverable through | | Alta Growth
Fund | | | Guardian
Equity Fund | |
September 30, 2022 | | $ | 140,982 | | | $ | — | |
September 30, 2023 | | | 163,191 | | | | 131,996 | |
26
Alta Capital Funds
Notes to the Financial Statements (continued)
September 30, 2020
In rendering investment advisory services to the Guardian Equity Fund, the Adviser will use the resources of GuardCap Asset Management Limited (U.K.) (“GuardCap”), a non-US affiliate of the Adviser that is not registered under the Investment Advisers Act of 1940, as amended (the “Advisers Act”). Under the terms of a Participating Affiliate Memorandum of Understanding (“MOU”) between the Adviser and GuardCap, GuardCap is considered to be a “Participating Affiliate” of the Adviser, as that term is used in relief granted by the staff of the SEC allowing U.S.-registered advisers to use investment advisory and trading resources of unregistered advisory affiliates, subject to the regulatory supervision of the registered adviser. Under the same MOU, GuardCap and its employees who provide advisory and related services to the Guardian Equity Fund are considered to be “associated persons” of the Adviser, as that term is defined in the Advisers Act, for purposes of the Adviser’s required supervision.
The Trust retains Ultimus Fund Solutions, LLC (the “Administrator”) to provide the Funds with administration, fund accounting, transfer agent and compliance services, including all regulatory reporting. For the fiscal year ended September 30, 2020, fees incurred for these, and the amounts due to the Administrator at September 30, 2020 were as follows:
| | | Alta Growth
Fund | | | Guardian
Equity Fund(a) | |
Administration / fund accounting | | $ | 51,129 | | | $ | 34,727 | |
Transfer agent | | | 12,000 | | | | 9,419 | |
Compliance services | | | 14,000 | | | | 10,989 | |
Payable to Administrator | | | 6,681 | | | | 6,747 | |
(a) | For the period December 19, 2019 (commencement of operations) to September 30, 2020. |
The Board supervises the business activities of the Trust. Each Trustee serves as a Trustee for the lifetime of the Trust or until the earlier of his or her retirement as a Trustee at age 78 (which may be extended for up to two years in an emeritus non-voting capacity at the pleasure and request of the Board), or until he/she dies, resigns, or is removed, whichever is sooner. “Independent Trustees,” meaning those Trustees who are not “interested persons” of the Trust, as defined in the Investment Company Act of 1940 (“1940 Act”), as amended, have each received an annual retainer of $500 per Fund and $500 per Fund for each quarterly in-person Board meeting. Effective January 1, 2020, the annual retainer increased to $1,000 per Fund. In addition, each Independent Trustee may be compensated for preparation related to and participation in any special meetings of the Board and/or any Committee of the Board, with such compensation determined on a case-by-case basis based on the length and complexity of the meeting. The Trust also reimburses Trustees for out-of-pocket expense incurred in conjunction with attendance at Board meetings.
27
Alta Capital Funds
Notes to the Financial Statements (continued)
September 30, 2020
The officers and one trustee of the Trust are employees of the Administrator. Ultimus Fund Distributors, LLC (the “Distributor”) acts as the principal distributor of each Fund’s shares. The Distributor is a wholly-owned subsidiary of the Administrator.
NOTE 5. PURCHASES AND SALES OF SECURITIES
For the fiscal year ended September 30, 2020, purchases and sales of investment securities, other than short-term investments were as follows:
| | | Alta Growth
Fund | | | Guardian
Equity Fund | |
Purchases | | $ | 14,454,464 | | | $ | 23,010,447 | |
Sales | | $ | 8,181,928 | | | $ | 1,917,903 | |
There were no purchases or sales of long-term U.S. government obligations during the fiscal year ended September 30, 2020.
NOTE 6. FEDERAL TAX INFORMATION
At September 30, 2020, the net unrealized appreciation (depreciation) and tax cost of investments for tax purposes was as follows:
| | | Alta Growth
Fund | | | Guardian
Equity Fund | |
Gross unrealized appreciation | | $ | 10,406,423 | | | $ | 2,290,490 | |
Gross unrealized depreciation | | | (445,112 | ) | | | (684,506 | ) |
Net unrealized appreciation/(depreciation) on investments | | $ | 9,961,311 | | | $ | 1,605,984 | |
Tax cost of investments | | $ | 28,208,041 | | | $ | 21,252,881 | |
The tax character of distributions paid for the fiscal year ended September 30, 2020 was as follows:
| | | Alta Growth
Fund | | | Guardian
Equity Fund | |
Distributions paid from: | | | | | | | | |
Ordinary income | | $ | 840,020 | | | $ | 35,805 | |
Long-term capital gain | | | — | | | | — | |
Total distributions paid | | $ | 840,020 | | | $ | 35,805 | |
28
Alta Capital Funds
Notes to the Financial Statements (continued)
September 30, 2020
At September 30, 2020, the components of accumulated earnings (deficit) on a tax basis were as follows:
| | | Alta Growth
Fund | | | Guardian
Equity Fund | |
Undistributed ordinary income | | $ | 22,182 | | | $ | 13,885 | |
Accumulated capital and other losses | | | (596,188 | ) | | | (234,048 | ) |
Unrealized appreciation (depreciation) on investments(a) | | | 9,961,311 | | | | 1,606,013 | |
Total accumulated earnings (deficit) | | $ | 9,387,305 | | | $ | 1,385,850 | |
(a) | The difference between book basis and tax basis unrealized appreciation (depreciation) is primarily attributable to the tax deferral of wash losses. |
Certain qualified losses incurred after October 31, and within the current taxable year, are deemed to arise on the first business day of the Funds following taxable year. For the tax year ended September 30, 2020, the Alta Growth Fund deferred post October qualified losses in the amount of $596,188.
As of September 30, 2020, the Guardian Equity Fund had available for tax purposes an unused capital loss carryforward of $234,048 of short-term capital losses with no expiration, which was available to offset against future taxable net capital gains. To the extent that these carryforwards are used to offset future gains, it is probable that the amount offset will not be distributed to shareholders.
NOTE 7. SECTOR RISK
If the Alta Growth Fund has significant investments in the securities of issuers within a particular sector, any development affecting that sector will have a greater impact on the value of the net assets of the Alta Quality Fund than would be the case if the Alta Growth Fund did not have significant investments in that sector. In addition, this may increase the risk of loss in the Alta Growth Fund and increase the volatility of the Alta Growth Fund’s NAV per share. For instance, economic or market factors, regulatory changes or other developments may negatively impact all companies in a particular sector, and therefore the value of the Alta Growth Fund’s portfolio will be adversely affected. As of September 30, 2020, the Alta Growth Fund had 25.04% and 32.33% of the value of its net assets invested in securities within the Communications and Technology sectors, respectively.
NOTE 8. BENEFICIAL OWNERSHIP
The beneficial ownership, either directly or indirectly, of more than 25% of the voting securities of a fund creates a presumption of control of the fund, under Section 2(a) (9) of the 1940 Act. At September 30, 2020, Alexandria Bancorp Limited owned 73.3% and 93.1% of the Alta Growth Fund and the Guardian Equity Fund, respectively. As a result, Alexandria Bancorp Limited may be deemed to control the Funds.
29
Alta Capital Funds
Notes to the Financial Statements (continued)
September 30, 2020
NOTE 9. COMMITMENTS AND CONTINGENCIES
The Trust indemnifies its officers and Trustees for certain liabilities that may arise from their performance of their duties to the Trust or the Funds. Additionally, in the normal course of business, the Trust enters into contracts that contain a variety of representations and warranties which provide general indemnifications. The Trust’s maximum exposure under these arrangements is unknown, as this would involve future claims that may be made against the Trust that have not yet occurred.
NOTE 10. SUBSEQUENT EVENTS
Management of the Funds has evaluated the need for disclosures and/or adjustments resulting from subsequent events through the date at which these financial statements were issued. Based upon this evaluation, management has determined there were no items requiring adjustment of the financial statements or additional disclosure.
NOTE 11. LIQUIDITY RISK MANAGEMENT PROGRAM (Unaudited)
The Funds have adopted and implemented a written liquidity risk management program (the “Program”) as required by Rule 22e-4 (the “Liquidity Rule”) under the 1940 Act. The Program is reasonably designed to assess and manage the Funds’ liquidity risk, taking into consideration, among other factors, the Funds’ investment strategy and the liquidity of its portfolio investments during normal and reasonably foreseeable stressed conditions; its short and long-term cash flow projections; and its cash holdings and access to other funding sources. The Board approved the appointment of the Liquidity Administrator Committee, comprising certain Trust officers and employees of the Adviser. The Liquidity Administrator Committee maintains Program oversight and reports to the Board on at least an annual basis regarding the Program’s operational effectiveness through a written report (the “Report”). The Program’s initial Report, which was presented to the Board for consideration at its meeting held on September 8, 2020, outlined the operation of the Program and the adequacy and effectiveness of the Program’s implementation. During the review period, the Funds did not experience unusual stress or disruption to its operations related to purchase and redemption activity. Also, during the review period the Funds held adequate levels of cash and highly liquid investments to meet shareholder redemption activities in accordance with applicable requirements. The Report concluded that the Program is reasonably designed to prevent violation of the Liquidity Rule and has been effectively implemented.
30
Report of Independent Registered Public Accounting Firm
To the Shareholders of Alta Quality Growth Fund and Guardian Fundamental Global Equity Fund and the Board of Trustees of Capitol Series Trust
Opinion on the Financial Statements
We have audited the accompanying statements of assets and liabilities of the Alta Quality Growth Fund and Guardian Fundamental Global Equity Fund (collectively referred as the “Funds”) (two of the funds constituting Capitol Series Trust (the “Trust”)), including the schedules of investments, as of September 30, 2020, and the related statements of operations and changes in net assets, and the financial highlights for each of the periods indicated in the table below and the related notes (collectively referred to as the “financial statements”). In our opinion, the financial statements present fairly, in all material respects, the financial position of each of the Funds (two of the funds constituting Capitol Series Trust) at September 30, 2020, and the results of their operations, changes in net assets and financial highlights for each of the periods indicated in the table below, in conformity with U.S. generally accepted accounting principles.
Individual fund constituting the Capitol Series Trust | Statement of operations | Statements of changes in net assets | Financial
Highlights |
Alta Quality Growth Fund | For the year ended September 30, 2020 | For the year ended September 30, 2020 and the period from December 19, 2018 (commencement of operations) through September 30, 2019 |
Guardian Fundamental Global Equity Fund | For the period from December 19, 2019 (commencement of operations) through September 30, 2020 |
Basis for Opinion
These financial statements are the responsibility of the Trust’s management. Our responsibility is to express an opinion on each of the Fund’s financial statements based on our audits. We are a public accounting firm registered with the Public Company Accounting Oversight Board (United States) (“PCAOB”) and are required to be independent with respect to the Trust in accordance with the U.S. federal securities laws and the applicable rules and regulations of the Securities and Exchange Commission and the PCAOB.
We conducted our audits in accordance with the standards of the PCAOB. Those standards require that we plan and perform the audit to obtain reasonable assurance about whether the financial statements are free of material misstatement, whether due to error or fraud. The Trust is not required to have, nor were we engaged to perform, an audit of Trust’s internal control over financial reporting. As part of our audits we are required to obtain an understanding of internal control over financial reporting but not for the purpose of expressing an opinion on the effectiveness of the Trust’s internal control over financial reporting. Accordingly, we express no such opinion.
31
Report of Independent Registered Public Accounting Firm
(continued)
Our audits included performing procedures to assess the risks of material misstatement of the financial statements, whether due to error or fraud, and performing procedures that respond to those risks. Such procedures included examining, on a test basis, evidence regarding the amounts and disclosures in the financial statements. Our procedures included confirmation of securities owned as of September 30, 2020, by correspondence with the custodian. Our audits also included evaluating the accounting principles used and significant estimates made by management, as well as evaluating the overall presentation of the financial statements. We believe that our audits provide a reasonable basis for our opinion.

We have served as the auditor of one or more Capitol Series Trust investment companies since 2017.
Cincinnati, Ohio
November 25, 2020
32
Summary of Fund Expenses (Unaudited)
As a shareholder of a Fund, you incur two types of costs: (1) transaction costs and (2) ongoing costs, including management fees and other Fund expenses. These examples are intended to help you understand your ongoing costs (in dollars) of investing in each Fund and to compare these costs with the ongoing costs of investing in other mutual funds. Each Fund’s example is based on an investment of $1,000 invested at the beginning of the period and held for the entire period from April 1, 2020 through September 30, 2020.
Actual Expenses
The first line of the table below provides information about actual account values and actual expenses. You may use the information in this line, together with the amount you invested, to estimate the expenses that you paid over the period. Simply divide your account value by $1,000 (for example, an $8,600 account value divided by $1,000 = 8.6), then multiply the result by the number in the first line under the heading entitled “Expenses Paid During Period” to estimate the expenses you paid on your account during this period.
Hypothetical Example for Comparison Purposes
The second line of the table below provides information about hypothetical account values and hypothetical expenses based on the Fund’s actual expense ratio and an assumed rate of return of 5% per year before expenses, which is not the Fund’s actual return. The hypothetical account values and expenses may not be used to estimate the actual ending account balance or expenses you paid for the period. You may use this information to compare the ongoing costs of investing in the Fund and other funds. To do so, compare this 5% hypothetical example with the 5% hypothetical examples that appear in the shareholder reports of other funds.
Expenses shown in the table are meant to highlight your ongoing costs only and do not reflect any transactional costs. Therefore, the second line of the table below is useful in comparing ongoing costs only and will not help you determine the relative costs of owning different funds. In addition, if transaction costs were included, your costs would have been higher.
33
Summary of Fund Expenses (Unaudited) (continued)
| | | Beginning
Account Value
April 1,
2020 | Ending
Account Value
September 30,
2020 | Expenses Paid
During
Period(a) | Annualized
Expense
Ratio |
Alta Quality Growth Fund | | | |
Institutional Shares | Actual | $ 1,000.00 | $ 1,356.90 | $ 4.65 | 0.79% |
| | | | | | |
| | Hypothetical(b) | $ 1,000.00 | $ 1,021.05 | $ 3.99 | 0.79% |
| | | | | | |
Guardian Fundamental Global Equity Fund |
Institutional Shares | Actual | $ 1,000.00 | $ 1,250.70 | $ 5.57 | 0.99% |
| | | | | | |
| | Hypothetical(b) | $ 1,000.00 | $ 1,020.05 | $ 5.00 | 0.99% |
(a) | Expenses are equal to the Fund’s annualized expense ratios, multiplied by the average account value over the period, multiplied by 183/366 (to reflect the one-half year period). |
(b) | Hypothetical assumes 5% annual return before expenses. |
34
Additional Federal Income Tax Information (Unaudited)
The Form 1099-DIV you receive in January 2021 will show the tax status of all distributions paid to your account in calendar year 2020. Shareholders are advised to consult their own tax adviser with respect to the tax consequences of their investment in the Fund. As required by the Internal Revenue Code and/or regulations, shareholders must be notified regarding the status of qualified dividend income for individuals and the dividends received deduction for corporations.
Qualified Dividend Income. The Funds designate the following percentage or up to the maximum amount of such dividends allowable pursuant to the Internal Revenue Code, as qualified dividend income eligible for the reduced tax rate.
| | | Alta Quality
Growth Fund | | | Guardian
Fundamental
Global Equity
Fund | |
Qualified Dividend Income | | | 55 | % | | | 100 | % |
Qualified Business Income. The Funds designate the following percentage of ordinary income dividends, or up to the maximum amount of such dividends allowable pursuant to the Internal Revenue Code, as qualified business income.
| | | Alta Quality
Growth Fund | | | Guardian
Fundamental
Global Equity
Fund | |
Qualified Business Income | | | 0 | % | | | 0 | % |
Dividends Received Deduction. Corporate shareholders are generally entitled to take the dividends received deduction on the portion of the Funds’ dividend distribution that qualifies under tax law. For the Funds’ calendar year 2019 ordinary income dividends, the following percentage qualifies for the corporate dividends received deduction.
| | | Alta Quality
Growth Fund | | | Guardian
Fundamental
Global Equity
Fund | |
Dividends Received Deduction | | | 57 | % | | | 100 | % |
The Funds designate the following amounts as long-term capital gains distributions. The amounts designated may not agree with long-term capital gains in the tax character of distribution table due to utilization of earnings and profits distributed to shareholders on redemption of shares.
| | | Alta Quality
Growth Fund | | | Guardian
Fundamental
Global Equity
Fund | |
Long-Term Capital Gains Distributions | | $ | — | | | $ | — | |
35
Trustees and Officers (Unaudited)
The Board supervises the business activities of the Trust and is responsible for protecting the interests of shareholders. The Chairman of the Board is Walter B. Grimm, who is an Independent Trustee of the Trust.
Each Trustee serves as a Trustee for the lifetime of the Trust or until the earlier of his or her retirement as a Trustee at age 78, death, resignation or removal. Officers are re-elected annually by the Board. The address of each Trustee and officer is 225 Pictoria Drive, Suite 450, Cincinnati, Ohio 45246.
As of the date of this report, the Trustees oversee the operations of 14 series.
Interested Trustee Background. The following table provides information regarding the Interested Trustee.
Name, (Age), Position with Trust,
Term of Position with Trust | Principal Occupation During
Past 5 Years and Other Directorships |
Robert G. Dorsey* Birth Year: 1957 TRUSTEE Began Serving: March 2017 | Principal Occupation(s): Vice Chairman of Ultimus Fund Solutions, LLC and its subsidiaries, except as otherwise noted for the FINRA-regulated broker-dealer entities (February 2019 to present); Interested Trustee of Ultimus Managers Trust (February 2012 to present). Previous Position(s): Managing Director and Co-Chief Executive Officer of Ultimus Fund Solutions, LLC (1999 to February 2019); President of Ultimus Fund Distributors, LLC (1999 to 2018). |
* | Mr. Dorsey is considered an “interested person” of the Trust within the meaning of Section 2(a)(19) of the 1940 Act because of his relationship with the Trust’s administrator, transfer agent, and distributors. |
Independent Trustee Background. The following table provides information regarding the Independent Trustees.
Name, (Age), Position with Trust,
Term of Position with Trust | Principal Occupation During
Past 5 Years and Other Directorships |
John C. Davis Birth Year: 1952 TRUSTEE Began Serving: July 2018 | Previous Position(s): Retired Partner of PricewaterhouseCoopers LLP (1974-2010); Consultant, Board of Trustees of Ultimus Managers Trust (2016 to 2019) and Former Trustee of Ultimus Managers Trust (2012 to 2016). |
Walter B. Grimm Birth Year: 1945 TRUSTEE AND CHAIR Began Serving: November 2013 | Principal Occupations(s): President, Leigh Management Group, LLC (consulting firm) (October 2005 to present); and President, Leigh Investments, Inc. (1988 to present); Board member, Boys & Girls Club of Coachella (2020 to present). |
36
Trustees and Officers (Unaudited) (continued)
Name, (Age), Position with Trust,
Term of Position with Trust | Principal Occupation During
Past 5 Years and Other Directorships |
Lori Kaiser Birth Year: 1963 TRUSTEE Began Serving: July 2018 | Principal Occupations(s): Founder and CEO, Kaiser Consulting since 1992. |
Janet Smith Meeks Birth Year: 1955 TRUSTEE Began Serving: July 2018 | Principal Occupations(s): Co-Founder and CEO, Healthcare Alignment Advisors, LLC (consulting company) since August 2015. Previous Position(s): President and Chief Operating Officer, Mount Carmel St. Ann’s Hospital (2006 to 2015). |
Mary M. Morrow Birth Year: 1958 TRUSTEE Began Serving: November 2013 | Principal Occupations(s): President, US Health Holdings (2020 to present). Previous Position(s): President (2019 to 2020) and Chief Operating Officer (2018 to 2019), Dignity Health Managed Services Organization; Chief Operating Officer, Pennsylvania Health and Wellness (fully owned subsidiary of Centene Corporation) (2016 to 2018); Vice President, Gateway Heath (2015 to 2016). |
Officers. The following table provides information regarding the Officers.
Name, (Age), Position with Trust,
Term of Position with Trust | Principal Occupation During
Past 5 Years and Other Directorships |
Matthew J. Miller Birth Year: 1976 PRESIDENT and CHIEF EXECUTIVE OFFICER Began Serving: September 2013 (as VP); September 2018 (as President) | Principal Occupation(s): Assistant Vice President, Relationship Management, Ultimus Fund Solutions, LLC (December 2015 to present); Vice President, Valued Advisers Trust (December 2011 to present). Previous Position(s): Vice President, Relationship Management, Huntington Asset Services, Inc. (n/k/a Ultimus Asset Services, LLC) (2008 to December 2015). |
Zachary P. Richmond Birth Year: 1980 TREASURER AND CHIEF FINANCIAL OFFICER Began Serving: August 2014 | Principal Occupation(s): Vice President, Director of Financial Administration for Ultimus Fund Solutions, LLC (February 2019 to present). Previous Position(s): Assistant Vice President, Associate Director of Financial Administration for Ultimus Fund Solutions, LLC (December 2015 to February 2019); Manager, Fund Administration, Huntington Asset Services, Inc. (January 2011 to December 2015). |
37
Trustees and Officers (Unaudited) (continued)
Name, (Age), Position with Trust,
Term of Position with Trust | Principal Occupation During
Past 5 Years and Other Directorships |
Martin R. Dean Birth Year: 1963 CHIEF COMPLIANCE OFFICER Began Serving: May 2019 | Principal Occupation(s): Senior Vice President, Head of Fund Compliance, Ultimus Fund Solutions, LLC (January 2016 to present). Previous Position(s): Senior Vice President and Compliance Group Manager, Huntington Asset Services, Inc. (July 2013 to December 2015). |
Matthew J. Beck Birth Year: 1988 SECRETARY Began Serving: September 2018 | Principal Occupation(s): Senior Attorney, Ultimus Fund Solutions, LLC (May 2018 to present) and Secretary, Ultimus Managers Trust (July 2018 to present). Previous Position(s): Chief Compliance Officer, OBP Capital, LLC (May 2015 to May 2018); Secretary, Aspiration Funds (March 2015 to May 2018); Secretary, Starboard Investment Trust (September 2014 to May 2018); Secretary, Leeward Investment Trust (September 2014 to May 2018); Secretary, Hillman Capital Management Investment Trust (September 2014 to May 2018); Secretary, Spinnaker ETF Series (September 2014 to May 2018); Vice President and General Counsel, The Nottingham Company (July 2014 to May 2018). |
Other Information (Unaudited)
The Funds’ Statement of Additional Information (“SAI”) includes additional information about the trustees and is available without charge, upon request. You may call toll-free at (800) 957-0681 to request a copy of the SAI or to make shareholder inquiries.
38
FACTS | WHAT DO THE ALTA CAPITAL FUNDS (THE “FUNDS”) DO WITH YOUR PERSONAL INFORMATION? |
| | |
Why? | Financial companies choose how they share your personal information. Federal law gives consumers the right to limit some but not all sharing. Federal law also requires us to tell you how we collect, share, and protect your personal information. Please read this notice carefully to understand what we do. |
| | |
What? | The types of personal information we collect and share depend on the product or service you have with us. This information can include: ■ Social Security number ■ account balances and account transactions ■ transaction or loss history and purchase history ■ checking account information and wire transfer instructions When you are no longer our customer, we continue to share your information as described in this notice. |
| | |
How? | All financial companies need to share customers’ personal information to run their everyday business. In the section below, we list the reasons financial companies can share their customers’ personal information; the reason Funds choose to share; and whether you can limit this sharing. |
Reasons we can share your personal information | Do Funds share? |
For our everyday business purposes—
such as to process your transactions, maintain your account(s), respond to court orders and legal investigations, or report to credit bureaus | Yes |
For our marketing purposes—
to offer our products and services to you | No |
For joint marketing with other financial companies | No |
For our affiliates’ everyday business purposes—
information about your transactions and experiences | No |
For our affiliates’ everyday business purposes—
information about your creditworthiness | No |
For nonaffiliates to market to you | No |
Questions? | Call (800) 957-0681 |
39
Who we are |
Who is providing this notice? | Alta Capital Funds
Ultimus Fund Distributors, LLC (Distributor)
Ultimus Fund Solutions, LLC (Administrator) |
What we do |
How do Alta Capital Funds protect my personal information? | To protect your personal information from unauthorized access and use, we use security measures that comply with federal law. These measures include computer safeguards and secured files and buildings. Our service providers are held accountable for adhering to strict policies and procedures to prevent any misuse of your nonpublic personal information. |
How do Alta Capital Funds collect my personal information? | We collect your personal information, for example, when you ■ open an account or deposit money ■ buy securities from us or sell securities to us ■ make deposits or withdrawals from your account ■ give us your account information ■ make a wire transfer ■ tell us who receives the money ■ tell us where to send the money ■ show your government-issued ID ■ show your driver’s license |
Why can’t I limit all sharing? | Federal law gives you the right to limit only ■ sharing for affiliates’ everyday business purposes — information about your creditworthiness ■ affiliates from using your information to market to you ■ sharing for nonaffiliates to market to you State laws and individual companies may give you additional rights to limit sharing. |
Definitions |
Affiliates | Companies related by common ownership or control. They can be financial and nonfinancial companies. ■ Alta Capital Management, LLC, the investment adviser to the Funds, could be deemed to be an affiliate. |
Nonaffiliates | Companies not related by common ownership or control. They can be financial and nonfinancial companies. ■ The Funds do not share your personal information with nonaffiliates so they can market to you |
Joint marketing | A formal agreement between nonaffiliated financial companies that together market financial products or services to you. ■ The Funds do not jointly market. |
40
This page is intentionally left blank.
Proxy Voting (Unaudited)
A description of the policies and procedures that each Fund uses to determine how to vote proxies relating to portfolio securities and information regarding how each Fund voted those proxies during the most recent twelve month period ended June 30, are available (1) without charge upon request by calling the Funds at (800) 957-0681 and (2) in Fund documents filed with the Securities and Exchange Commission (“SEC”) on the SEC’s website at www.sec.gov.
TRUSTEES
Walter B. Grimm, Chairman
John C. Davis
Robert G. Dorsey
Lori Kaiser
Janet Smith Meeks
Mary M. Morrow
OFFICERS
Matthew J. Miller, Chief Executive Officer and President
Zachary P. Richmond, Chief Financial Officer and Treasurer
Martin R. Dean, Chief Compliance Officer
Matthew J. Beck, Secretary
INVESTMENT ADVISER
Alta Capital Management, LLC
6440 South Wasatch Boulevard, Suite 260
Salt Lake City, Utah 84121
DISTRIBUTOR
Ultimus Fund Distributors, LLC
225 Pictoria Drive, Suite 450
Cincinnati, OH 45246
INDEPENDENT REGISTERED PUBLIC ACCOUNTING FIRM
Ernst & Young LLP
221 East 4th Street, Suite 2900
Cincinnati, OH 45202
LEGAL COUNSEL
Bernstein Shur
100 Middle Street, 6th Floor
Portland, ME 04104
CUSTODIAN
Huntington National Bank
41 South High Street
Columbus, OH 43215
ADMINISTRATOR, TRANSFER AGENT AND FUND ACCOUNTANT
Ultimus Fund Solutions, LLC
225 Pictoria Drive, Suite 450
Cincinnati, OH 45246
This report is intended only for the information of shareholders or those who have received the Funds’ prospectus which contains information about the Funds’ management fee and expenses. Please read the prospectus carefully before investing.
Distributed by Ultimus Fund Distributors, LLC
Member FINRA/SIPC
Item 2. Code of Ethics.
As of the end of the period covered by this report, the registrant has adopted a code of ethics that applies to the registrant's principal executive officer, principal financial officer, principal accounting officer or controller, or persons performing similar functions, regardless of whether these individuals are employed by the registrant or a third party. Pursuant to Item 12(a)(1), a copy of registrant’s code of ethics is filed as an exhibit to this Form N-CSR. During the period covered by this report, the code of ethics has not been amended, and the registrant has not granted any waivers, including implicit waivers, from the provisions of the code of ethics.
Item 3. Audit Committee Financial Expert.
(a)(1) The registrant’s Board of Trustees has determined that the registrant has at least two audit committee financial experts serving on its audit committee.
(a)(2) The audit committee financial experts are Lori Kaiser and John C. Davis, who are both “independent” for purposes of this Item 3 of Form N-CSR.
Item 4. Principal Accountant Fees and Services.
| (a) | Audit Fees billed to the registrant by its principal accountants for the two most recent fiscal years: |
| Fuller & Thaler Behavioral Small-Cap Equity Fund: | FY 2020 | | $11,550 | |
| | FY 2019 | | $16,000 | |
| Fuller & Thaler Behavioral Small-Cap Growth Fund: | FY 2020 | | $11,550 | |
| | FY 2019 | | $16,000 | |
| Fuller & Thaler Behavioral Mid-Cap Value Fund: | FY 2020 | | $11,550 | |
| | FY 2019 | | $16,000 | |
| Fuller & Thaler Behavioral Unconstrained Equity Fund: | FY 2020 | | $10,100 | |
| | FY 2019 | | $14,000 | |
| Fuller & Thaler Behavioral Small-Mid Core Equity Fund: | FY 2020 | | $10,100 | |
| | FY 2019 | | $14,000 | |
| Fuller & Thaler Behavioral Micro-Cap Equity Fund: | FY 2020 | | $10,100 | |
| | FY 2019 | | $14,000 | |
| Alta Quality Growth Fund: | FY 2020 | | $11,550 | |
| | FY 2019 | | $16,000 | |
| Guardian Fundament Global Equity Fund: | FY 2020 | | $11,550 | |
(b) Audit-Related Fees billed to the registrant by its principal accountants for the two most recent fiscal years:
| Fuller & Thaler Behavioral Small-Cap Equity Fund: | FY 2020 | | $0 | |
| | FY 2019 | | $0 | |
| Fuller & Thaler Behavioral Small-Cap Growth Fund: | FY 2020 | | $0 | |
| | FY 2019 | | $0 | |
| Fuller & Thaler Behavioral Mid-Cap Value Fund: | FY 2020 | | $0 | |
| | FY 2019 | | $0 | |
| Fuller & Thaler Behavioral Unconstrained Equity Fund: | FY 2020 | | $0 | |
| | FY 2019 | | $0 | |
| Fuller & Thaler Behavioral Small-Mid Core Equity Fund: | FY 2020 | | $0 | |
| | FY 2019 | | $0 | |
| Fuller & Thaler Behavioral Micro-Cap Equity Fund: | FY 2020 | | $0 | |
| | FY 2019 | | $0 | |
| Alta Quality Growth Fund: | FY 2020 | | $0 | |
| | FY 2019 | | $0 | |
| Guardian Fundament Global Equity Fund: | FY 2020 | | $0 | |
c) Tax Fees billed to the registrant by its principal accountants for the two most recent fiscal years:
| Fuller & Thaler Behavioral Small-Cap Equity Fund: | FY 2020 | | $3,700 | |
| | FY 2019 | | $5,150 | |
| Fuller & Thaler Behavioral Small-Cap Growth Fund: | FY 2020 | | $3,700 | |
| | FY 2019 | | $5,150 | |
| Fuller & Thaler Behavioral Mid-Cap Value Fund: | FY 2020 | | $3,700 | |
| | FY 2019 | | $5,150 | |
| Fuller & Thaler Behavioral Unconstrained Equity Fund: | FY 2020 | | $3,700 | |
| | FY 2019 | | $5,150 | |
| Fuller & Thaler Behavioral Small-Mid Core Equity Fund: | FY 2020 | | $3,700 | |
| | FY 2019 | | $5,150 | |
| Fuller & Thaler Behavioral Micro-Cap Equity Fund: | FY 2020 | | $3,700 | |
| | FY 2019 | | $5,150 | |
| Alta Quality Growth Fund: | FY 2020 | | $3,700 | |
| | FY 2019 | | $5,150 | |
| Guardian Fundament Global Equity Fund: | FY 2020 | | $5,700 | |
Nature of the fees: Preparation of the 1120 RIC and Excise review
(d) All other fees billed to the registrant by its principal accountants for the two most recent fiscal years:
| Fuller & Thaler Behavioral Small-Cap Equity Fund: | FY 2020 | | $0 | |
| | FY 2019 | | $0 | |
| Fuller & Thaler Behavioral Small-Cap Growth Fund: | FY 2020 | | $0 | |
| | FY 2019 | | $0 | |
| Fuller & Thaler Behavioral Mid-Cap Value Fund: | FY 2020 | | $0 | |
| | FY 2019 | | $0 | |
| Fuller & Thaler Behavioral Unconstrained Equity Fund: | FY 2020 | | $0 | |
| | FY 2019 | | $0 | |
| Fuller & Thaler Behavioral Small-Mid Core Equity Fund: | FY 2020 | | $0 | |
| | FY 2019 | | $0 | |
| Fuller & Thaler Behavioral Micro-Cap Equity Fund: | FY 2020 | | $0 | |
| | FY 2019 | | $0 | |
| Alta Quality Growth Fund: | FY 2020 | | $0 | |
| | FY 2019 | | $0 | |
| Guardian Fundament Global Equity Fund: | FY 2020 | | $0 | |
| (e)(1) | Audit Committee’s Pre-Approval Policies |
The Audit Committee Charter requires the Audit Committee to be responsible for the selection, retention or termination of auditors and, in connection therewith, to (i) evaluate the proposed fees and other compensation, if any, to be paid to the auditors, (ii) evaluate the independence of the auditors, (iii) pre-approve all audit services and, when appropriate, any non-audit services provided by the independent auditors to the Trust, (iv) pre-approve, when appropriate, any non-audit services provided by the independent auditors to the Trust's investment adviser, or any entity controlling, controlled by, or under common control with the investment adviser and that provides ongoing services to the Trust if the engagement relates directly to the operations and financial reporting of the Trust, and (v) receive the auditors’ specific representations as to their independence;
(2) All of the services described in paragraphs (b) through (d) of Item 4 were pre-approved by the Audit Committee.
(f) During audit of registrant's financial statements for the most recent fiscal year, less than 50 percent of the hours expended on the principal accountant's engagement were attributed to work performed by persons other than the principal accountant's full-time, permanent employees.
(g) The aggregate non-audit fees billed by the registrant's accountant for services rendered to the registrant, and rendered to the registrant's investment adviser (not including any sub-adviser whose role is primarily portfolio management and is subcontracted with or overseen by another investment adviser), and any entity controlling, controlled by, or under common control with the adviser that provides ongoing services to the registrant:
| | | Registrant | Adviser |
| | FY 2020 | $31,600 | $0 |
| | FY 2019 | $36,050 | $0 |
(h) Not applicable. The auditor performed no services for the registrant’s investment adviser or any entity controlling, controlled by, or under common control with the investment adviser that provides ongoing services to the registrant.
Item 5. Audit Committee of Listed Registrants.
NOT APPLICABLE – applies to listed companies only
Item 6. Schedule of Investments.
Schedules filed with Item 1.
Item 7. Disclosure of Proxy Voting Policies and Procedures for Closed-End Management Investment Companies.
NOT APPLICABLE – applies to closed-end funds only
Item 8. Portfolio Managers of Closed-End Management Investment Companies.
NOT APPLICABLE – applies to closed-end funds only
Item 9. Purchases of Equity Securities by Closed-End Management Investment Company and Affiliated Purchasers.
NOT APPLICABLE – applies to closed-end funds only
Item 10. Submission of Matters to a Vote of Security Holders.
The guidelines applicable to shareholders desiring to submit recommendations for nominees to the Registrant's board of trustees are contained in the statement of additional information of the Trust with respect to the Fund(s) for which this Form N-CSR is being filed.
Item 11. Controls and Procedures.
(a) Based on their evaluation of the registrant’s disclosure controls and procedures (as defined in Rule 30a-3(c) under the Investment Company Act of 1940, as amended (the “Act”)) as of a date within 90 days of the filing date of this report, the registrant’s principal executive officer and principal financial officer have concluded that such disclosure controls and procedures are reasonably designed and are operating effectively to ensure that material information relating to the registrant is made known to them by others within those entities, particularly during the period in which this report is being prepared, and that the information required in filings on Form N-CSR is recorded, processed, summarized, and reported on a timely basis.
(b) There were no changes in the registrant’s internal control over financial reporting (as defined in Rule 30a-3(d) under the Investment Company Act of 1940) that occurred during the period covered by this report that have materially affected, or are reasonably likely to materially affect, the registrant’s internal control over financial reporting.
Item 12. Disclosure of Securities Lending Activities for Closed-End Management Investment Companies.
Not applicable.
Item 13. Exhibits.
(a)(1) Code is filed herewith.
(a)(2) Certifications by the registrant's principal executive officer and principal financial officer, pursuant to Section 302 of the Sarbanes- Oxley Act of 2002 and required by Rule 30a-2under the Investment Company Act of 1940 are filed herewith.
(a)(3) Not applicable.
(b) Certification pursuant to 18 U.S.C. Section 1350, as adopted pursuant to Section 906 of the Sarbanes-Oxley Act of 2002 is filed herewith.
SIGNATURES
Pursuant to the requirements of the Securities Exchange Act of 1934 and the Investment Company Act of 1940, the registrant has duly caused this report to be signed on its behalf by the undersigned, thereunto duly authorized.
| (Registrant) | Capitol Series Trust | |
| By (Signature and Title) | /s/ Matthew J. Miller | |
| | Matthew J. Miller, Chief Executive Officer and President | |
Pursuant to the requirements of the Securities Exchange Act of 1934 and the Investment Company Act of 1940, this report has been signed below by the following persons on behalf of the registrant and in the capacities and on the dates indicated.
| By (Signature and Title) | /s/ Matthew J. Miller | |
| | Matthew J. Miller, Chief Executive Officer and President | |
| By (Signature and Title) | /s/ Zachary P. Richmond | |
| | Zachary P. Richmond, Treasurer and Chief Financial Officer | |