UNITED STATES
SECURITIES AND EXCHANGE COMMISSION
Washington, D.C. 20549
FORM N-CSR
CERTIFIED SHAREHOLDER REPORT OF REGISTERED
MANAGEMENT INVESTMENT COMPANIES
Investment Company Act file number: 811-22895
Capitol Series Trust
(Exact name of registrant as specified in charter)
Ultimus Fund Solutions, LLC
225 Pictoria Drive, Suite 450
Cincinnati, OH 45246
(Address of principal executive offices) (Zip code)
Zachary P. Richmond
Ultimus Fund Solutions, LLC
225 Pictoria Drive, Suite 450
Cincinnati, OH 45246
(Name and address of agent for service)
| Registrant’s telephone number, including area code: | 513-587-3400 | |
| Date of fiscal year end: | August 31 | |
| | | |
| Date of reporting period: | August 31, 2020 | |
Item 1. Reports to Stockholders.

HEDEKER STRATEGIC APPRECIATION FUND
Institutional Shares – SAFFX
Annual Report
August 31, 2020
Beginning on January 1, 2021, as permitted by regulations adopted by the Securities and Exchange Commission, paper copies of the Fund’s shareholder reports like this one will no longer be sent by mail, unless you specifically request paper copies of the reports from the Fund or from your financial intermediary such as a broker-dealer or bank. Instead, the reports will be made available on a website, and you will be notified by mail each time a report is posted and provided with a website link to access the report.
If you already elected to receive shareholder reports electronically, you will not be affected by this change and you need not take any action. You may elect to receive shareholder reports and other communications from the Fund electronically by contacting the Fund at (800) 657-4450 or, if you own these shares through a financial intermediary, you may contact your financial intermediary.
You may elect to receive all future reports in paper free of charge. You can inform the Fund that you wish to continue receiving paper copies of your shareholder reports by contacting the Fund at (800) 657-4450. If you own shares through a financial intermediary, you may contact your financial intermediary or follow instructions included with this document to elect to continue to receive paper copies of your shareholder reports. Your election to receive reports in paper will apply to all funds held with the fund complex or at your financial intermediary.
Hedeker Wealth LLC
One Overlook Point, Suite 610
Lincolnshire, Illinois 60069
(800) 657-4450
Shareholder Letter (Unaudited) | August 31, 2020 |
Overview
Fiscal year 2020 was a uniquely difficult period to navigate through the markets. From the ongoing fight against Covid-19 to the renewed fervor for social justice reform, as well as the run-up to the 2020 Presidential election, this year was tumultuous. Gone are the days of only having to worry about the trade wars with China and the fallout from Brexit. Instead, yesteryear’s issues have been supplanted with concerns over a sustained economic recovery amidst record spikes in unemployment and jobless claims due to the pandemic. Despite all of the calamity, the overall market results have been encouraging. For the period of September 1, 2019 to August 31, 2020, the Hedeker Strategic Appreciation Fund (the “Fund”) returned 5.49% (net of fees). During the same period, the Fund’s benchmark, the Bloomberg Barclays U.S. Intermediate Government/Credit Index was up 5.95%.
Fiscal Year 2020
The three inputs that make up convertible securities valuations experienced a great deal of variance during fiscal year 2020. Volatility, as measured by the VIX (Chicago Board Options Exchange Volatility Index), ranged from 11.54 to as high as 82.69, its highest level since the index was created in 1990. Credit spreads, as measured by the Markit CDX High Yield Index, ranged from 275 bps to 871 bps, a fairly sizable spread. Interest rates also experienced a pronounced move, with the 10-year U.S. Treasury going from 1.94% in November 2019 to 0.50% in August 2020, the lowest level it has ever seen. Needless to say, convertible securities valuations fluctuated throughout the year. However, more important than valuations was the move in equity prices. While equity prices do not directly impact the theoretical valuation of a convertible bond, they do affect the actual price and movement of convertibles. During fiscal year 2020, the S&P 500® Index sold off nearly 34% from peak-to-trough, followed by a 58% recovery through August 31, 2020. Comparatively, the Fund sold off 22.4% from peak-to-trough, followed by a 28% recovery. Moves of such magnitude, in both directions in such a short time frame, are incredibly uncommon for equities and convertibles.
In response to these extraordinary circumstances, the Fed expanded its balance sheet to record levels in an effort to keep financial markets liquid and functioning. The Treasury Department did its part by helping to push through Congress the CARES Act stimulus package to deal with the economic fallout from the pandemic. Thus far, these actions have been exceedingly effective in supporting the economy, but it remains to be seen if further action will be necessary. The Fed remains committed to future accommodative policy, but the Treasury and Congress have yet to pass additional economic stimulus. Ultimately, the slowing and elimination of Covid-19 stands as the most important factor in a sustained economic recovery.
Historically, the Fund has invested in low delta convertible bonds in an effort to provide downside protection. However, the Adviser has determined that, in order to better participate in equity upside while targeting less downside participation, the Fund will increase its allocation to balanced, higher delta convertible securities. The change in portfolio construction will be subtle, but it will provide a greater probability of success in capturing the positive asymmetric profile of convertibles. Furthermore, a portfolio of balanced convertibles will generally provide higher current yields than equities and greater upside potential to bonds.
Conclusion
The events of 2020 have given us an opportunity to reflect on the best ways to achieve our goals. While the Fund’s final performance for fiscal year 2020 resulted in similar performance to its benchmark, the path there was a bumpy one. By refocusing the portfolio from low delta convertibles to higher delta, balanced convertibles, the Fund can achieve more consistent returns over time.
1
Ryan Casaquite
Portfolio Manager
Investors should carefully consider the investment objectives, risks, and charges and expenses of the fund before investing. The prospectus contains this and other information about the fund, and it should be read carefully before investing. Investors may obtain a copy of the prospectus by calling 800-657-4450.
Investing involves risk, including loss of principal. There is no guarantee that this, or any, investment strategy will be successful. A majority of the Fund’s assets will be invested in convertible securities that have credit ratings that are below investment grade or not rated. These “junk bonds” are considered speculative investments. Fixed income investments are affected by a number of risks, including fluctuation in interest rates, credit risk, and prepayment risk. In general, as prevailing interest rates rise, fixed income securities prices will fall. Some fixed income securities give the issuer the option to call, or redeem, the bonds before their maturity date. If an issuer “calls” its bonds during a time of declining interest rates, the Fund may have to invest the proceeds in an investment offering a lower yield. Convertible securities may be illiquid and difficult to value and may be subject to greater credit risk than other securities. Many of the convertible securities in which the Fund invests are issued by small or medium sized companies located in foreign and emerging markets. Investments in international markets present special risks including currency fluctuation, the potential for diplomatic and political instability, regulatory and liquidity risks, foreign taxation and differences in auditing and other financial standards. Risks of foreign investing are generally intensified for investments in emerging markets. Small and mid-cap investing involves greater risk not associated with investing in more established companies, such as greater price volatility, business risk, less liquidity and increased competitive threat.
Past performance does not guarantee future performance.
The Bloomberg Barclays Intermediate U.S. Government/Credit Index is a broad-based flagship benchmark that measures the non-securitized component of the Bloomberg Barclays U.S. Aggregate Index. The S&P 500® Index is a market capitalization weighted index that is widely used as a barometer of U.S. stock market performance. The Chicago Board Options Exchange Volatility Index (“the VIX”) reflects a market estimate of future volatility, based on the weighted average of the implied volatilities for a wide range of strikes. The Markit CDX High Yield Index is composed of 100 non-investment grade entities, distributed among 2 sub-indices: B, BB. You cannot invest directly in an index.
The Hedeker Strategic Appreciation Fund is distributed by Ultimus Fund Distributors, LLC.
2
Investment Results (Unaudited)
Average Annual Total Returns(a) as of August 31, 2020
| One Year | Since
Inception
(12/21/2016) | Expense Ratio(c) |
Hedeker Strategic Appreciation Fund | | | |
Institutional Shares | 5.49% | 2.68% | 1.42% |
Bloomberg Barclays U.S. Intermediate Government/Credit Index(b) | 5.95% | 4.37% | |
The performance quoted represents past performance, which does not guarantee future results. The investment return and principal value of an investment will fluctuate so that an investor’s shares, when redeemed, may be worth more or less than their original cost. The returns shown do not reflect deduction of taxes that a shareholder would pay on the Hedeker Strategic Appreciation Fund (the “Fund”) distributions or the redemption of Fund shares. Current performance of the Fund may be lower or higher than the performance quoted. The Fund’s investment objectives, risks, charges and expenses must be considered carefully before investing. Performance data current to the most recent month end may be obtained by calling (800) 657-4450.
(a) | Return figures reflect any change in price per share and assume the reinvestment of all distributions. |
(b) | The Bloomberg Barclays U.S. Intermediate Government/Credit Index (“Index”) is a broad-based flagship benchmark that measures the non-securitized component of the Bloomberg Barclays U.S. Aggregate Index. It includes investment grade, U.S. dollar-denominated, fixed-rate Treasuries, government-related and corporate securities. The returns of the Index do not reflect the deduction of fees and expenses, whereas the Fund returns are shown net of fees. An individual cannot invest directly in an index. |
(c) | The expense ratio is from the Fund’s prospectus dated December 30, 2019. Hedeker Wealth LLC, the Fund’s investment adviser (the “Adviser”), has contractually agreed, until December 31, 2020, to waive its management fee and/or reimburse expenses so that total annual operating expenses (excluding (i) interest; (ii) taxes; (iii) brokerage fees and commissions; (iv) other extraordinary expenses not incurred in the ordinary course of the Fund’s business; (v) dividend expenses on short sales; and (vi) indirect expenses such as acquired fund fees and expenses) do not exceed 1.75% of the Fund’s average daily net assets. (“Expense Limitation Agreement”). The Adviser is not expected to extend the Expense Limitation Agreement past December 31, 2020. During any fiscal year that the Investment Advisory Agreement between the Adviser and Capitol Series Trust (the “Trust”) is in effect, the Adviser may recoup the sum of all fees previously waived or expenses reimbursed, less any reimbursement previously paid, provided that the Adviser is only permitted to recoup fees or expenses within 36 months from the date the fee waiver or expense reimbursement first occurred and provided further that such recoupment can be achieved within the Expense Limitation Agreement currently in effect and the Expense Limitation Agreement in place when the waiver/reimbursement occurred. The Expense Limitation may not be terminated by the Adviser prior to its expiration date, but the Board of Trustees (the “Board”) may terminate such agreement at any time. The Institutional Shares expense ratio does not correlate to the corresponding ratio of expenses to average net assets included in the financial highlights section of this report, which reflects the operating expenses of the Fund, but does not include acquired fund fees and expenses. Additional information pertaining to the Fund’s expense ratios as of August 31, 2020, can be found in the financial highlights. |
The Fund’s investment objectives, strategies, risks, charges and expenses must be considered carefully before investing. The prospectus contains this and other important information about the Fund and may be obtained by calling (800) 657-4450. Please read it carefully before investing.
The Fund is distributed by Ultimus Fund Distributors, LLC, member FINRA/SIPC.
3
Investment Results (Unaudited) (continued)
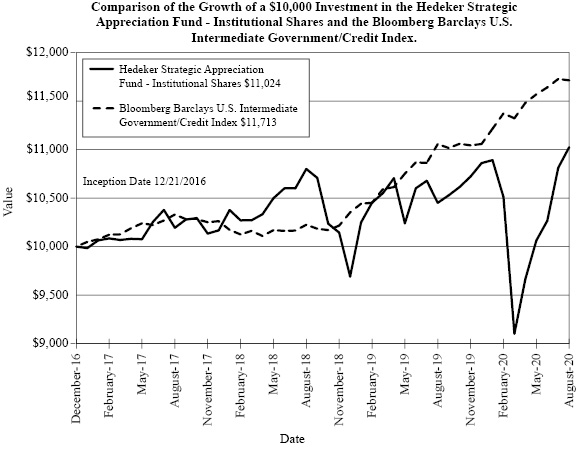
The chart above assumes an initial investment of $10,000 made on December 21, 2016 (commencement of operations) and held through August 31, 2020. THE FUND’S RETURNS REPRESENT PAST PERFORMANCE AND DO NOT GUARANTEE FUTURE RESULTS. The returns shown do not reflect deduction of taxes that a shareholder would pay on the Fund’s distributions or the redemption of the Fund’s shares. Investment returns and principal values will fluctuate so that your shares, when redeemed, may be worth more or less than their original purchase price.
Current performance may be lower or higher than the performance data quoted. For more information on the Fund, and to obtain performance data current to the most recent month-end, or to request a prospectus, please call (800) 657-4450. You should carefully consider the investment objectives, potential risks, management fees, and charges and expenses of the Fund before investing. The Fund’s prospectus contains this and other information about the Fund, and should be read carefully before investing.
The Fund is distributed by Ultimus Fund Distributors, LLC, Member FINRA/SIPC.
4
Portfolio Illustration (Unaudited)
August 31, 2020 |
|
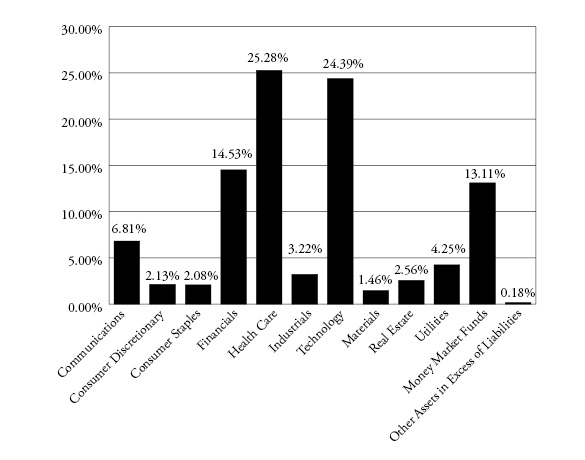
The following chart gives a visual breakdown of the Fund’s holdings as a percentage of net assets.
Availability of Portfolio Schedule (Unaudited)
The Fund files its complete schedule of portfolio holdings with the Securities and Exchange Commission (“SEC”) for the first and third quarters of each fiscal year as an exhibit to its reports on Form N-PORT. The Fund’s Form N-PORT reports are available on the SEC’s website at http://www.sec.gov.
5
Hedeker Strategic Appreciation Fund
Schedule of Investments
August 31, 2020
| | | Principal
Amount | | | Fair
Value | |
| CONVERTIBLE CORPORATE BONDS — 74.89% | | | | | | |
| | | | | | | |
| Communications — 6.81% | | | | | | |
| Liberty Interactive LLC, 4.00%, 11/15/2029 | | $ | 1,350,000 | | | $ | 999,000 | |
| Liberty Media Corp., 2.25%, 9/30/2046 | | | 2,000,000 | | | | 960,415 | |
| Liberty Media Corp. - Liberty Formula One, 1.00%, 1/30/2023 | | | 1,000,000 | | | | 1,230,112 | |
| Twitter, Inc., 1.00%, 9/15/2021 | | | 500,000 | | | | 498,754 | |
| Twitter, Inc., 0.25%, 6/15/2024 | | | 500,000 | | | | 540,099 | |
| | | | | | | | 4,228,380 | |
| Consumer Discretionary — 2.13% | | | | | | | | |
Carriage Services, Inc., 2.75%, 3/15/2021(a) | | | 300,000 | | | | 350,250 | |
| Quotient Technology, Inc., 1.75%, 12/1/2022 | | | 1,000,000 | | | | 972,830 | |
| | | | | | | | 1,323,080 | |
| Consumer Staples — 2.08% | | | | | | | | |
| Herbalife Nutrition Ltd., 2.63%, 3/15/2024 | | | 1,250,000 | | | | 1,294,648 | |
| | | | | | | | | |
| Financials — 9.89% | | | | | | | | |
| Apollo Commercial Real Estate Finance, Inc., 5.38%, 10/15/2023 | | | 500,000 | | | | 433,656 | |
| Ares Capital Corp., 3.75%, 2/1/2022 | | | 1,000,000 | | | | 1,015,000 | |
| Ares Capital Corp., 4.63%, 3/1/2024 | | | 750,000 | | | | 774,375 | |
| New Mountain Finance Corp., 5.75%, 8/15/2023 | | | 1,000,000 | | | | 997,550 | |
| Prospect Capital Corp., 4.95%, 7/15/2022 | | | 1,000,000 | | | | 1,003,758 | |
| Prospect Capital Corp., 6.38%, 3/1/2025 | | | 1,000,000 | | | | 1,005,000 | |
| Redwood Trust, Inc., 4.75%, 8/15/2023 | | | 1,000,000 | | | | 914,722 | |
| | | | | | | | 6,144,061 | |
| Health Care — 25.28% | | | | | | | | |
| Collegium Pharmaceutical, Inc., 2.63%, 2/15/2026 | | | 250,000 | | | | 238,200 | |
| CONMED Corp., 2.63%, 2/1/2024 | | | 1,000,000 | | | | 1,172,997 | |
| Exact Sciences Corp., 0.38%, 3/15/2027 | | | 1,000,000 | | | | 1,001,875 | |
| Gossamer Bio, Inc., 5.00%, 6/1/2027 | | | 2,000,000 | | | | 2,200,962 | |
| Illumina, Inc., 0.00%, 8/15/2023 | | | 500,000 | | | | 560,000 | |
| Illumina, Inc., 0.50%, 6/15/2021 | | | 500,000 | | | | 722,188 | |
| Insmed, Inc., 1.75%, 1/15/2025 | | | 1,000,000 | | | | 1,013,942 | |
| Jazz Investments I Ltd., 1.88%, 8/15/2021 | | | 500,000 | | | | 504,063 | |
| Jazz Investments I Ltd., 1.50%, 8/15/2024 | | | 500,000 | | | | 497,825 | |
| Karyopharm Therapeutics, Inc., 3.00%, 10/15/2025 | | | 1,000,000 | | | | 1,205,485 | |
| NeoGenomics, Inc., 1.25%, 5/1/2025 | | | 1,500,000 | | | | 1,924,188 | |
| Pacira BioSciences, Inc., 2.38%, 4/1/2022 | | | 1,000,000 | | | | 1,169,418 | |
| Repligen Corp., 0.38%, 7/15/2024 | | | 1,000,000 | | | | 1,486,863 | |
| Retrophin, Inc., 2.50%, 9/15/2025 | | | 1,000,000 | | | | 884,172 | |
| Vocera Communiciations, Inc., 1.50%, 5/15/2023 | | | 1,000,000 | | | | 1,111,875 | |
| | | | | | | | 15,694,053 | |
| Industrials — 1.75% | | | | | | | | |
| Mesa Laboratories, Inc., 1.38%, 8/15/2025 | | | 1,000,000 | | | | 1,086,168 | |
6 | See accompanying notes which are an integral part of these financial statements. | |
Hedeker Strategic Appreciation Fund
Schedule of Investments (continued)
August 31, 2020
| | | Principal
Amount | | | Fair
Value | |
| CONVERTIBLE CORPORATE BONDS — (continued) | | | | | | |
| | | | | | | |
| Real Estate — 2.56% | | | | | | |
| Hannon Armstrong Sustainable Infrastructure, 4.13%, 9/1/2022 | | $ | 1,000,000 | | | $ | 1,592,500 | |
| | | | | | | | | |
| Technology — 24.39% | | | | | | | | |
| Akamai Technologies, Inc., 0.13%, 5/1/2025 | | | 1,500,000 | | | | 2,006,139 | |
| Altair Engineering, Inc., 0.25%, 6/1/2024 | | | 1,000,000 | | | | 1,111,835 | |
| Guidewire Software, Inc., 1.25%, 3/15/2025 | | | 1,000,000 | | | | 1,194,709 | |
| II-VI, Inc., 0.25%, 9/1/2022 | | | 1,250,000 | | | | 1,472,019 | |
| New Relic, Inc., 0.50%, 5/1/2023 | | | 1,000,000 | | | | 971,022 | |
| Nuance Communications, Inc., 1.00%, 12/15/2035 | | | 1,000,000 | | | | 1,344,350 | |
| Nutanix, Inc., 0.00%, 1/15/2023 | | | 1,000,000 | | | | 988,945 | |
| Palo Alto Networks, Inc., 0.75%, 7/1/2023 | | | 1,000,000 | | | | 1,163,290 | |
| Pure Storage, Inc., 0.13%, 4/15/2023 | | | 1,000,000 | | | | 968,924 | |
| Q2 Holdings, Inc., 0.75%, 6/1/2026 | | | 1,000,000 | | | | 1,277,585 | |
| Rapid7, Inc., 1.25%, 8/1/2023 | | | 1,000,000 | | | | 1,632,999 | |
| Verint Systems, Inc., 1.50%, 6/1/2021 | | | 1,000,000 | | | | 1,013,159 | |
| | | | | | | | 15,144,976 | |
| Total Convertible Corporate Bonds (Cost $43,526,581) | | | | | | | 46,507,866 | |
| | | Shares | | | | |
| CONVERTIBLE PREFERRED STOCKS — 11.82% | | | | | | | | |
| | | | | | | | | |
| Financials — 4.64% | | | | | | | | |
| Bank of America Corp., Series L, 7.25% | | | 1,000 | | | | 1,496,030 | |
| Wells Fargo & Co., Series L, 7.50% | | | 1,000 | | | | 1,380,500 | |
| | | | | | | | 2,876,530 | |
| Industrials — 1.47% | | | | | | | | |
| Fortive Corp., Series A, 5.00% | | | 1,000 | | | | 913,660 | |
| | | | | | | | | |
| Materials — 1.46% | | | | | | | | |
| International Flavors & Fragrances, Inc., 6.00% | | | 20,000 | | | | 908,000 | |
| | | | | | | | | |
| Utilities — 4.25% | | | | | | | | |
| NextEra Energy, Inc., 4.87% | | | 40,000 | | | | 2,192,000 | |
| Southern Co. (The), Series 2019, 6.75% | | | 10,000 | | | | 450,000 | |
| | | | | | | | 2,642,000 | |
| Total Convertible Preferred Stocks (Cost $7,203,923) | | | | | | | 7,340,190 | |
| | See accompanying notes which are an integral part of these financial statements. | 7 |
Hedeker Strategic Appreciation Fund
Schedule of Investments (continued)
August 31, 2020
| | Shares | | | Fair
Value | |
MONEY MARKET FUNDS — 13.11% | | | | | | | | |
| | | | | | | | | |
Fidelity Investments Money Market Government Portfolio, Institutional Class, 0.05%(b) | | | 8,143,574 | | | $ | 8,143,574 | |
Total Money Market Funds (Cost $8,143,574) | | | | | | | 8,143,574 | |
| | | | | | | | | |
Total Investments — 99.82% (Cost $58,874,078) | | | | | | | 61,991,630 | |
| | | | | | | | | |
Other Assets in Excess of Liabilities — 0.18% | | | | | | | 109,608 | |
| | | | | | | | | |
NET ASSETS — 100.00% | | | | | | $ | 62,101,238 | |
(a) | Illiquid security. The total fair value of these securities as of August 31, 2020 was $350,250, representing 0.56% of net assets. |
(b) | Rate disclosed is the seven day effective yield as of August 31, 2020. |
8 | See accompanying notes which are an integral part of these financial statements. | |
Hedeker Strategic Appreciation Fund
Statement of Assets and Liabilities
August 31, 2020
Assets |
Investments in securities at fair value (cost $58,874,078) | | $ | 61,991,630 | |
Receivable for fund shares sold | | | 1,810,344 | |
Dividends and interest receivable | | | 289,801 | |
Prepaid expenses | | | 2,983 | |
Total Assets | | | 64,094,758 | |
Liabilities |
Payable for fund shares redeemed | | | 1,905,417 | |
Payable to Adviser | | | 51,919 | |
Payable to auditors | | | 16,700 | |
Payable to Administrator | | | 9,828 | |
Other accrued expenses | | | 9,656 | |
Total Liabilities | | | 1,993,520 | |
Net Assets | | $ | 62,101,238 | |
Net Assets consist of: | | | | |
Paid-in capital | | | 63,117,830 | |
Accumulated deficit | | | (1,016,592 | ) |
Net Assets | | $ | 62,101,238 | |
Shares outstanding (unlimited number of shares authorized, no par value) | | | 2,498,045 | |
Net asset value, offering and redemption price per share | | $ | 24.86 | |
| | See accompanying notes which are an integral part of these financial statements. | 9 |
Hedeker Strategic Appreciation Fund
Statement of Operations
For the year ended August 31, 2020
Investment Income | | | | |
Dividend income | | $ | 479,091 | |
Interest income | | | 1,600,236 | |
Total investment income | | | 2,079,327 | |
Expenses | | | | |
Adviser | | | 608,670 | |
Administration | | | 61,014 | |
Fund accounting | | | 38,501 | |
Legal | | | 21,570 | |
Audit and tax preparation | | | 19,450 | |
Trustee | | | 14,297 | |
Transfer agent | | | 12,000 | |
Report printing | | | 10,387 | |
Line of credit | | | 10,355 | |
Pricing | | | 9,801 | |
Custodian | | | 6,757 | |
Compliance services | | | 6,000 | |
Registration | | | 4,878 | |
Interest expense | | | 396 | |
Miscellaneous | | | 27,024 | |
Net operating expenses | | | 851,100 | |
Net investment income | | | 1,228,227 | |
Net Realized and Change in Unrealized Gain (Loss) on Investments |
Net realized loss on investment securities transactions | | | (610,245 | ) |
Net change in unrealized appreciation of investment securities | | | 2,214,231 | |
Net realized and change in unrealized gain on investments | | | 1,603,986 | |
Net increase in net assets resulting from operations | | $ | 2,832,213 | |
10 | See accompanying notes which are an integral part of these financial statements. | |
Hedeker Strategic Appreciation Fund
Statements of Changes in Net Assets
| | | For the
Year Ended
August 31, 2020 | | | For the
Year Ended
August 31, 2019 | |
Increase (Decrease) in Net Assets due to: | | | | | | | | |
Operations | | | | | | | | |
Net investment income | | $ | 1,228,227 | | | $ | 539,076 | |
Net realized loss on investment securities transactions and foreign currency translations | | | (610,245 | ) | | | (1,552,732 | ) |
Net change in unrealized appreciation (depreciation) of investment securities and foreign currency translations | | | 2,214,231 | | | | (884,259 | ) |
Net increase (decrease) in net assets resulting from operations | | | 2,832,213 | | | | (1,897,915 | ) |
Distributions to Shareholders from Earnings: | | | | | | | | |
Institutional Shares | | | (2,031,689 | ) | | | (1,776,026 | ) |
Total distributions | | | (2,031,689 | ) | | | (1,776,026 | ) |
Capital Transactions - Institutional Shares | | | | | | | | |
Proceeds from shares sold | | | 9,916,880 | | | | 11,103,161 | |
Reinvestment of distributions | | | 2,031,689 | | | | 1,776,026 | |
Amount paid for shares redeemed | | | (10,375,726 | ) | | | (9,771,834 | ) |
Net increase in net assets resulting from capital transactions | | | 1,572,843 | | | | 3,107,353 | |
Total Increase (Decrease) in Net Assets | | | 2,373,367 | | | | (566,588 | ) |
Net Assets | | | | | | | | |
Beginning of year | | | 59,727,871 | | | | 60,294,459 | |
End of year | | $ | 62,101,238 | | | $ | 59,727,871 | |
Share Transactions - Institutional Shares | | | | | | | | |
Shares sold | | | 405,778 | | | | 454,058 | |
Shares issued in reinvestment of distributions | | | 86,552 | | | | 73,503 | |
Shares redeemed | | | (443,831 | ) | | | (399,557 | ) |
Net increase in shares | | | 48,499 | | | | 128,004 | |
| | See accompanying notes which are an integral part of these financial statements. | 11 |
Hedeker Strategic Appreciation Fund - Institutional Shares
Financial Highlights
(For a share outstanding during each period)
| | | For the
Year Ended
August 31,
2020 | | | For the
Year Ended
August 31,
2019 | | | For the
Year Ended
August 31,
2018 | | | For the
Period Ended
August 31,
2017(a) | |
Net asset value, beginning of period | | $ | 24.38 | | | $ | 25.97 | | | $ | 25.47 | | | $ | 25.00 | |
| | | | | | | | | | | | | | | | | |
Investment operations: | | | | | | | | | | | | | | | | |
Net investment income | | | 0.48 | | | | 0.23 | | | | 0.41 | | | | 0.07 | |
Net realized and unrealized gain (loss) on investments | | | 0.80 | | | | (1.08 | ) | | | 1.06 | | | | 0.41 | |
Total from investment operations | | | 1.28 | | | | (0.85 | ) | | | 1.47 | | | | 0.48 | |
| | | | | | | | | | | | | | | | | |
Distributions from: | | | | | | | | | | | | | | | | |
Net investment income | | | (0.80 | ) | | | (0.74 | ) | | | (0.66 | ) | | | (0.01 | ) |
Net realized gains | | | — | | | | — | | | | (0.31 | ) | | | — | |
Total from distributions | | | (0.80 | ) | | | (0.74 | ) | | | (0.97 | ) | | | (0.01 | ) |
| | | | | | | | | | | | | | | | | |
Net asset value, end of period | | $ | 24.86 | | | $ | 24.38 | | | $ | 25.97 | | | $ | 25.47 | |
| | | | | | | | | | | | | | | | | |
Total Return(b) | | | 5.49 | % | | | (3.23 | )% | | | 5.94 | % | | | 1.94 | %(c) |
| | | | | | | | | | | | | | | | | |
Ratios/Supplemental Data: | | | | | | | | | | | | | | | | |
Net assets, end of period (000 omitted) | | $ | 62,101 | | | $ | 59,728 | | | $ | 60,294 | | | $ | 50,621 | |
Ratio of net expenses to average net assets | | | 1.40 | % | | | 1.41 | % | | | 1.44 | % | | | 1.56 | %(d) |
Ratio of net investment income to average net assets | | | 2.02 | % | | | 0.90 | % | | | 1.55 | % | | | 0.49 | %(d) |
Portfolio turnover rate | | | 73 | % | | | 121 | % | | | 163 | % | | | 113 | %(c) |
| | | | | | | | | | | | | | | | | |
(a) | For the period December 21, 2016 (commencement of operations) to August 31, 2017. |
(b) | Total return in the above table represents the rate that the investor would have earned or lost on an investment in the Fund, assuming reinvestment of distributions. |
12 | See accompanying notes which are an integral part of these financial statements. | |
Hedeker Strategic Appreciation Fund
Notes to the Financial Statements
August 31, 2020
NOTE 1. ORGANIZATION
The Hedeker Strategic Appreciation Fund (the “Fund”) was organized as a non-diversified series of Capitol Series Trust (the “Trust”) on December 15, 2016. The Fund subsequently became and now operates as a diversified series of the Trust. The Trust is an open-end investment company established under the laws of Ohio by an Agreement and Declaration of Trust dated September 18, 2013 (the “Trust Agreement”). The Trust Agreement permits the Board of Trustees of the Trust (the “Board”) to issue an unlimited number of shares of beneficial interest of separate series without par value. The Fund is one of a series of funds currently authorized by the Board. The Fund’s investment adviser is Hedeker Wealth LLC (the “Adviser”). The investment objective of the Fund is to seek superior risk-adjusted returns over a market cycle.
The Fund currently offers one class of shares, Institutional Shares. The Fund commenced operations on December 21, 2016. Each share represents an equal proportionate interest in the assets and liabilities belonging to the Fund and is entitled to such dividends and distributions out of income belonging to the Fund as are declared by the Board.
NOTE 2. SIGNIFICANT ACCOUNTING POLICIES
The Fund is an investment company and follows accounting and reporting guidance under Financial Accounting Standards Board Accounting Standards Codification (“ASC”) Topic 946, “Financial Services-Investment Companies.” The following is a summary of significant accounting policies followed by the Fund in the preparation of its financial statements. These policies are in conformity with generally accepted accounting principles in the United States of America (“GAAP”).
Estimates – The preparation of financial statements in conformity with GAAP requires management to make estimates and assumptions that affect the reported amounts of assets and liabilities and disclosure of contingent assets and liabilities at the date of the financial statements and the reported amounts of increases and decreases in net assets from operations during the reporting period. Actual results could differ from those estimates.
Foreign Currency Translation – The accounting records of the Fund are maintained in U.S. dollars. Foreign currency amounts are translated into U.S. dollars at the current rate of exchange each business day to determine the value of investments, and other assets and liabilities. Purchases and sales of foreign securities, and income and expenses, are translated at the prevailing rate of exchange on the respective date of these transactions. The Fund does not isolate that portion of the results of operations resulting from changes in foreign exchange rates on investments from fluctuation arising from changes in market prices of securities held. These fluctuations are included with the unrealized gain or loss from investments.
Federal Income Taxes – The Fund makes no provision for federal income or excise tax. The Fund has qualified and intends to qualify each year as a regulated investment company (“RIC”) under subchapter M of the Internal Revenue Code of 1986, as amended, by complying with the requirements applicable to RICs and by distributing substantially all of its taxable income. The Fund also intends to distribute sufficient net investment income and net realized capital gains, if any, so that it will not be subject to excise tax on undistributed income and gains. If the required amount of net investment income or gains is not distributed, the Fund could incur a tax expense.
13
Hedeker Strategic Appreciation Fund
Notes to the Financial Statements (continued)
August 31, 2020
The Fund may be subject to taxes imposed by countries in which it invests. Such taxes are generally based on income and/or capital gains earned or repatriated. Taxes are accrued and applied to net investment income, net realized gains and unrealized appreciation as such income and/or gains are earned.
The Fund recognizes tax benefits or expenses of uncertain tax positions only when the position is “more likely than not” to be sustained assuming examination by tax authorities. Management of the Fund has reviewed tax positions taken in tax years that remain subject to examination by all major tax jurisdictions, including federal (i.e., the previous three tax year ends and the interim tax period since then, as applicable) and has concluded that no provision for unrecognized tax benefits or expenses is required in these financial statements and does not expect this to change over the next twelve months. The Fund recognizes interest and penalties, if any, related to unrecognized tax benefits as income tax expense in the Statement of Operations. During the period, the Fund did not incur any interest or penalties.
Expenses – Expenses incurred by the Trust that do not relate to a specific fund of the Trust are allocated to the individual funds based on each fund’s relative net assets or another appropriate basis (as determined by the Board).
Security Transactions and Related Income – Throughout the reporting period, security transactions are accounted for no later than one business day following the trade date. For financial reporting purposes, security transactions are accounted for on trade date on the last business day of the reporting period. The specific identification method is used for determining gains or losses for financial statements and income tax purposes. Dividend income is recorded on the ex-dividend date. Interest income is recorded on an accrual basis and includes, where applicable, the amortization of premium or accretion of discount. Discounts and premiums on fixed income securities are accreted or amortized over the life of the respective securities using the effective interest method. Withholding taxes on foreign dividends, if any, have been recorded for in accordance with the Fund’s understanding of the applicable country’s tax rules and rates.
Dividends and Distributions – The Fund intends to distribute its net investment income and net realized long-term and short-term capital gains, if any, at least annually. Dividends and distributions to shareholders, which are determined in accordance with income tax regulations, are recorded on the ex-dividend date. The treatment for financial reporting purposes of distributions made to shareholders during the period from net investment income or net realized capital gains may differ from their ultimate treatment for federal income tax purposes. These differences are caused primarily by differences in the timing of the recognition of certain components of income, expense or realized capital gain for federal income tax purposes. Where such differences are permanent in nature, they are reclassified among the components of net assets based on their ultimate characterization for federal income tax purposes. Any such reclassifications will have no effect on net assets, results of operations or net asset value (“NAV”) per share of the Fund.
14
Hedeker Strategic Appreciation Fund
Notes to the Financial Statements (continued)
August 31, 2020
For the fiscal year ended August 31, 2020, the Fund made the following reclassifications to increase (decrease) the components of net assets:
| Paid-In Capital | Accumulated Earnings (Deficit) |
| $(517) | $517 |
Restricted and Illiquid Securities – Restricted securities are any securities which are subject to restriction on resale under federal securities law, including commercial paper issued in reliance on the exemption from registration afforded by Section 4(2) of Rule 144A under the Securities Act of 1933 (“1933 Act”) and loan participations. Illiquid securities are those that may not reasonably be expected to be sold or disposed of in current market conditions in seven calendar days or less without the conversion to cash significantly changing the market value of the investment. The Fund will not invest greater than 15% of its net assets in illiquid securities. As of August 31, 2020, the Fund held illiquid securities representing 0.56% of net assets.
NOTE 3. SECURITIES VALUATION AND FAIR VALUE MEASUREMENTS
Fair value is defined as the price that the Fund would receive upon selling an investment in a timely transaction to an independent buyer in the principal or most advantageous market of the investment. GAAP establishes a three-tier hierarchy to maximize the use of observable market data and minimize the use of unobservable inputs and to establish classification of fair value measurements for disclosure purposes.
Inputs refer broadly to the assumptions that market participants would use in pricing the asset or liability, including assumptions about risk (the risk inherent in a particular valuation technique used to measure fair value including a pricing model and/or the risk inherent in the inputs to the valuation technique). Inputs may be observable or unobservable. Observable inputs are inputs that reflect the assumptions market participants would use in pricing the asset or liability developed based on market data obtained and available from sources independent of the reporting entity. Unobservable inputs are inputs that reflect the reporting entity’s own assumptions about the assumptions market participants would use in pricing the asset or liability developed based on the best information available in the circumstances.
Various inputs are used in determining the value of the Fund’s investments. These inputs are summarized in the three broad levels listed below.
| | ● | Level 1 – unadjusted quoted prices in active markets for identical investments and/or registered investment companies where the value per share is determined and published and is the basis for current transactions for identical assets or liabilities at the valuation date |
| | ● | Level 2 – other significant observable inputs (including, but not limited to, quoted prices for an identical security in an inactive market, quoted prices for similar securities, interest rates, prepayment speeds, credit risk, etc.) |
| | ● | Level 3 – significant unobservable inputs (including the Fund’s own assumptions in determining fair value of investments based on the best information available) |
15
Hedeker Strategic Appreciation Fund
Notes to the Financial Statements (continued)
August 31, 2020
The inputs used to measure fair value may fall into different levels of the fair value hierarchy. In such cases, for disclosure purposes, the level in the fair value hierarchy which is reported, is determined based on the lowest level input that is significant to the fair value measurement in its entirety.
In computing the NAV of the Fund, fair value is based on market valuations with respect to portfolio securities for which market quotations are readily available. Pursuant to Board approved policies, the Fund relies on independent third-party pricing services to provide the current market value of securities. Those pricing services value equity securities, including exchange-traded funds, exchange-traded notes, closed-end funds and preferred stocks, traded on a securities exchange at the last reported sales price on the principal exchange. Equity securities quoted by NASDAQ are valued at the NASDAQ Official Closing Price. If there is no reported sale on the principal exchange, equity securities are valued at the mean between the most recent quoted bid and asked price. When using the market quotations or close prices provided by the pricing service and when the market is considered active, the security will be classified as a Level 1 security. Investments in open-end mutual funds, including money market mutual funds, are generally priced at the ending NAV provided by the pricing service of the funds and are generally categorized as Level 1 securities. Debt securities are valued using evaluated prices furnished by a pricing vendor selected by the Board and are generally classified as Level 2 securities.
In the event that market quotations are not readily available, the Adviser determines that the market quotation or the price provided by the pricing service does not accurately reflect the current fair value, or certain restricted or illiquid securities are being valued, such securities are valued as determined in good faith by the Trust’s Valuation Committee, based on recommendations from a pricing committee comprised of certain officers of the Trust, certain employees of the Fund’s administrator, and representatives of the Adviser (together the “Pricing Review Committee”). These securities will be classified as Level 2 or 3 within the fair value hierarchy, depending on the inputs used.
In accordance with the Trust’s Portfolio Valuation Procedures, the Pricing Review Committee, in making its recommendations with the Adviser’s participation, is required to consider all appropriate factors relevant to the value of securities for which it has determined other pricing sources are not available or reliable as described above. No single standard exists for determining fair value, because fair value depends upon the circumstances of each individual case. As a general principle, the current fair value of an issue of securities being valued pursuant to the Trust’s Fair Value Guidelines would be the amount which the Fund might reasonably expect to receive for them upon their current sale. Methods which are in accordance with this principle may, for example, be based on (i) a multiple of earnings; (ii) a discount from market prices of a similar freely traded security (including a derivative security or a basket of securities traded on other markets, exchanges or among dealers); or (iii) yield to maturity with respect to debt issues, or a combination of these and other methods. Fair value pricing is permitted if, in accordance with the Trust’s Portfolio Valuation Procedures, the validity of market quotations appears to be questionable based on factors such as evidence of a thin market in the security based on a small number of quotations, a significant event occurs after the close of a market but before the Fund’s NAV calculation that may affect a security’s value, or other data calls into question the reliability of market quotations.
The following is a summary of the inputs used to value the Fund’s investments as of August 31, 2020:
16
Hedeker Strategic Appreciation Fund
Notes to the Financial Statements (continued)
August 31, 2020
| | | Valuation Inputs | | | | | |
Assets | | Level 1 | | | Level 2 | | | Level 3 | | | Total | |
Convertible Corporate Bonds(a) | | $ | — | | | $ | 46,507,866 | | | $ | — | | | $ | 46,507,866 | |
Convertible Preferred Stocks(a) | | | 5,844,160 | | | | 1,496,030 | | | | — | | | | 7,340,190 | |
Money Market Funds | | | 8,143,574 | | | | — | | | | — | | | | 8,143,574 | |
Total | | $ | 13,987,734 | | | $ | 48,003,896 | | | $ | — | | | $ | 61,991,630 | |
(a) | Refer to Schedule of Investments for sector classifications. |
The Fund did not hold any investments at the end of the reporting period for which significant unobservable inputs (Level 3) were used in determining fair value; therefore, no reconciliation of Level 3 securities is included for this reporting period. The Fund did not hold any derivative instruments during the reporting period.
NOTE 4. FEES AND OTHER TRANSACTIONS WITH AFFILIATES AND OTHER SERVICE PROVIDERS
Under the terms of the investment advisory agreement (the “Agreement”), the Adviser manages the Fund’s investments subject to approval of the Board. As compensation for its management services, the Fund is obligated to pay the Adviser a fee computed and accrued daily and paid monthly at an annual rate of 1.00% of the Fund’s average daily net assets. For the fiscal year ended August 31, 2020, the Adviser earned fees of $608,670 from the Fund. At August 31, 2020, the Fund owed the Adviser $51,919.
The Adviser has contractually agreed to waive its management fee and/or reimburse expenses so that total annual operating expenses (excluding (i) interest; (ii) taxes; (iii) brokerage fees and commissions; (iv) other extraordinary expenses not incurred in the ordinary course of the Fund’s business; (v) dividend expenses on short sales; and (vi) indirect expenses such as acquired fund fees and expenses) and expenses) do not exceed 1.75% of the Fund’s Institutional Shares average daily net assets through December 31, 2020 (“Expense Limitation”). The Adviser is not expected to extend the Expense Limitation Agreement past December 31, 2020. During any fiscal year that the Agreement between the Adviser and the Trust is in effect, the Adviser may recoup the sum of all fees previously waived or expenses reimbursed, less any reimbursement previously paid, provided that the Adviser is only permitted to recoup fees or expenses within 36 months from the date the fee waiver or expense reimbursement took effect and provided further that such recoupment can be achieved within the Expense Limitation currently in effect and the Expense Limitation in place when the waiver/reimbursement occurred. This Expense Limitation may not be terminated by the Adviser prior to its expiration date, but the Board may terminate such agreement at any time. The Expense Limitation terminates automatically upon the termination of the Agreement with the Adviser. For the fiscal year ended August 31, 2020, the Adviser did not waive any fees in the Fund.
The Trust retains Ultimus Fund Solutions, LLC (the “Administrator”) to provide the Fund with administration, compliance, fund accounting and transfer agent services, including all regulatory reporting. For the fiscal year ended August 31, 2020, the Administrator earned fees of $61,014 for
17
Hedeker Strategic Appreciation Fund
Notes to the Financial Statements (continued)
August 31, 2020
administration services, $6,000 for compliance services, $38,501 for fund accounting services, and $12,000 for transfer agent services. At August 31, 2020, the Fund owed the Administrator $9,828 for such services.
The Board supervises the business activities of the Trust. Each Trustee serves as a Trustee for the lifetime of the Trust or until the earlier of his or her retirement as a Trustee at age 78 (which may be extended for up to two years in an emeritus non-voting capacity at the pleasure and request of the Board), or until he/she dies, resigns, or is removed, whichever is sooner. “Independent Trustees,” meaning those Trustees who are not “interested persons” of the Trust, as defined in the Investment Company Act of 1940 (“1940 Act”), as amended, has received an annual retainer of $500 per Fund and $500 per Fund for each quarterly in-person Board meeting. Effective January 1, 2020, the annual retainer increased to $1,000 per Fund. In addition, each Independent Trustee may be compensated for preparation related to and participation in any special meetings of the Board and/or any Committee of the Board, with such compensation determined on a case-by-case basis based on the length and complexity of the meeting. The Trust also reimburses Trustees for out-of-pocket expense incurred in conjunction with attendance at Board meetings.
The officers and one trustee of the Trust are employees of the Administrator. Ultimus Fund Distributors, LLC (the “Distributor”) acts as the principal distributor of the Fund’s shares. The Distributor is a wholly-owned subsidiary of the Administrator.
NOTE 5. PURCHASES AND SALES OF SECURITIES
For the fiscal year ended August 31, 2020, purchases and sales of investment securities, other than short-term investments, were $40,333,014 and $38,877,376, respectively.
There were no purchases or sales of long-term U.S. government obligations during the fiscal year ended August 31, 2020.
NOTE 6. FEDERAL TAX INFORMATION
At August 31, 2020, the net unrealized appreciation (depreciation) and tax cost of investments for tax purposes was as follows:
Gross unrealized appreciation | | $ | 2,663,023 | |
Gross unrealized depreciation | | | (604,443 | ) |
Net unrealized appreciation/(depreciation) on investments | | $ | 2,058,580 | |
Tax cost of investments | | $ | 59,933,050 | |
The tax character of distributions paid for the fiscal years ended August 31, 2020 and August 31, 2019 were as follows:
| | | 2020 | | | 2019 | |
Distributions paid from: | | | | | | | | |
Ordinary income(a) | | $ | 2,031,689 | | | $ | 1,776,026 | |
Total distributions paid | | $ | 2,031,689 | | | $ | 1,776,026 | |
18
Hedeker Strategic Appreciation Fund
Notes to the Financial Statements (continued)
August 31, 2020
(a) | Short-term capital gain distributions are treated as ordinary income for tax purposes. |
At August 31, 2020, the components of accumulated earnings (deficit) on a tax basis were as follows:
Undistributed ordinary income | | $ | 632,839 | |
Accumulated capital and other losses | | | (3,708,011 | ) |
Unrealized appreciation on investments(a) | | | 2,058,580 | |
Total accumulated deficit | | $ | (1,016,592 | ) |
(a) | The difference between book basis and tax basis unrealized appreciation (depreciation) is primarily attributable to interest accruals on complex securities and deemed dividends from convertible bonds. |
As of August 31, 2020, the Fund had available for tax purposes unused capital loss carryforwards of $3,708,011 long-term capital losses with no expiration, which is available to offset against future taxable net capital gains. To the extent that these carryforwards are used to offset future gains, it is probable that the amount offset will not be distributed to shareholders.
NOTE 7. LINE OF CREDIT
During the prior fiscal year ended August 31, 2019, the Trust, on behalf of the Fund, entered into in a short-term credit agreement (“Line of Credit”) with Huntington National Bank (“Huntington”), expiring on March 15, 2020. Under the terms of the agreement, the Fund could borrow up to the lesser of 30% of the Fund’s daily market value or $10 million at an interest rate equal to the London Interbank Offered Rate (“LIBOR”) plus 137.50 basis points. Effective August 12, 2019, the Line of Credit was closed and any remaining fees related to the Line of Credit were expensed in the fiscal year ended August 31, 2020.
NOTE 8. SECTOR RISK
If the Fund has significant investments in the securities of issuers within a particular sector, any development affecting that sector will have a greater impact on the value of the net assets of the Fund than would be the case if the Fund did not have significant investments in that sector. In addition, this may increase the risk of loss in the Fund and increase the volatility of the Fund’s NAV per share. For instance, economic or market factors, regulatory changes or other developments may negatively impact all companies in a particular sector, and therefore the value of the Fund’s portfolio will be adversely affected. As of August 31, 2020, the Fund had 25.28% of the value of its net assets invested in stocks within the Health Care sector.
NOTE 9. COMMITMENTS AND CONTINGENCIES
The Trust indemnifies its officers and Trustees for certain liabilities that may arise from their performance of their duties to the Trust or the Fund. Additionally, in the normal course of business, the Trust enters into contracts that contain a variety of representations and warranties which provide general indemnifications. The Trust’s maximum exposure under these arrangements is unknown, as this would involve future claims that may be made against the Trust that have not yet occurred.
19
Hedeker Strategic Appreciation Fund
Notes to the Financial Statements (continued)
August 31, 2020
NOTE 10. SUBSEQUENT EVENTS
Management of the Fund has evaluated the need for disclosures and/or adjustments resulting from subsequent events through the date at which these financial statements were issued. Based upon this evaluation, management has determined there were no items requiring adjustment of the financial statements or additional disclosure, other than the item below.
On October 22, 2020, the Board approved the liquidation of the Fund as being in the best interest of the Fund and its shareholders. It is anticipated that all outstanding shares of the Fund will be redeemed and will discontinue all operations on or about December 9, 2020. Shares of the Fund are no longer available for purchase as of the close of business on October 27, 2020.
NOTE 11. LIQUIDITY RISK MANAGEMENT PROGRAM (Unaudited)
The Fund has adopted and implemented a written liquidity risk management program (the “Program”) as required by Rule 22e-4 (the “Liquidity Rule”) under the 1940 Act. The Program is reasonably designed to assess and manage the Fund’s liquidity risk, taking into consideration, among other factors, the Fund’s investment strategy and the liquidity of its portfolio investments during normal and reasonably foreseeable stressed conditions; its short and long-term cash flow projections; and its cash holdings and access to other funding sources. The Board approved the appointment of the Liquidity Administrator Committee, comprising certain Trust officers and employees of the Adviser. The Liquidity Administrator Committee maintains Program oversight and reports to the Board on at least an annual basis regarding the Program’s operational effectiveness through a written report (the “Report”). The Program’s initial Report, which was presented to the Board for consideration at its meeting held on September 8, 2020, outlined the operation of the Program and the adequacy and effectiveness of the Program’s implementation. During the review period, the Fund did not experience unusual stress or disruption to its operations related to purchase and redemption activity. Also, during the review period the Fund held adequate levels of cash and highly liquid investments to meet shareholder redemption activities in accordance with applicable requirements. The Report concluded that the Program is reasonably designed to prevent violation of the Liquidity Rule and has been effectively implemented.
20
Report of Independent Registered Public Accounting Firm
To the Shareholders and the Board of Trustees of Hedeker Strategic Appreciation Fund
Opinion on the Financial Statements
We have audited the accompanying statement of assets and liabilities of Hedeker Strategic Appreciation Fund (the “Fund”) (one of the funds constituting Capitol Series Trust (the “Trust”)), including the schedule of investments, as of August 31, 2020, and the related statement of operations for the year then ended, the statements of changes in net assets for each of the two years in the period then ended, the financial highlights for each of the three years in the period then ended and the period from December 21, 2016 (commencement of operations) through August 31, 2017 and the related notes (collectively referred to as the “financial statements”). In our opinion, the financial statements present fairly, in all material respects, the financial position of the Fund (one of the funds constituting Capitol Series Trust) at August 31, 2020, the results of its operations for the year then ended, the changes in its net assets for each of the two years in the period then ended and its financial highlights for each of the three years in the period then ended and the period from December 21, 2016 (commencement of operations) through August 31, 2017, in conformity with U.S. generally accepted accounting principles.
Basis for Opinion
These financial statements are the responsibility of the Trust’s management. Our responsibility is to express an opinion on the Fund’s financial statements based on our audits. We are a public accounting firm registered with the Public Company Accounting Oversight Board (United States) (“PCAOB”) and are required to be independent with respect to the Trust in accordance with the U.S. federal securities laws and the applicable rules and regulations of the Securities and Exchange Commission and the PCAOB.
We conducted our audits in accordance with the standards of the PCAOB. Those standards require that we plan and perform the audit to obtain reasonable assurance about whether the financial statements are free of material misstatement, whether due to error or fraud. The Trust is not required to have, nor were we engaged to perform, an audit of Trust’s internal control over financial reporting. As part of our audits we are required to obtain an understanding of internal control over financial reporting but not for the purpose of expressing an opinion on the effectiveness of the Trust’s internal control over financial reporting. Accordingly, we express no such opinion.
Our audits included performing procedures to assess the risks of material misstatement of the financial statements, whether due to error or fraud, and performing procedures that respond to those risks. Such procedures included examining, on a test basis, evidence regarding the amounts and disclosures in the financial statements. Our procedures included confirmation of securities owned as of August 31, 2020, by correspondence with the custodian and brokers. Our audits also included evaluating the accounting principles used and significant estimates made by management, as well as evaluating the overall presentation of the financial statements. We believe that our audits provide a reasonable basis for our opinion.

We have served as the auditor of one or more Capitol Series Trust investment companies since 2017.
Cincinnati, Ohio
October 27, 2020
21
Summary of Fund Expenses (Unaudited)
As a shareholder of the Fund, you incur two types of costs: (1) transaction and (2) ongoing costs, including management fees and other Fund expenses. These examples are intended to help you understand your ongoing costs (in dollars) of investing in the Fund and to compare these costs with the ongoing costs of investing in other mutual funds. The example is based on an investment of $1,000 invested at the beginning of the period and held for the entire period from March 1, 2020 through August 31, 2020.
Actual Expenses
The first line of the table below provides information about actual account values and actual expenses. You may use the information in this line, together with the amount you invested, to estimate the expenses that you paid over the period. Simply divide your account value by $1,000 (for example, an $8,600 account value divided by $1,000 = 8.6), then multiply the result by the number in the first line under the heading entitled “Expenses Paid During Period” to estimate the expenses you paid on your account during this period.
Hypothetical Example for Comparison Purposes
The second line of the table below provides information about hypothetical account values and hypothetical expenses based on the Fund’s actual expense ratio and an assumed rate of return of 5% per year before expenses, which is not the Fund’s actual return. The hypothetical account values and expenses may not be used to estimate the actual ending account balance or expenses you paid for the period. You may use this information to compare the ongoing costs of investing in the Fund and other funds. To do so, compare this 5% hypothetical example with the 5% hypothetical examples that appear in the shareholder reports of other funds.
Expenses shown in the table are meant to highlight your ongoing costs only and do not reflect any transactional costs. Therefore, the second line of the table below is useful in comparing ongoing costs only and will not help you determine the relative costs of owning different funds. In addition, if transaction costs were included, your costs would have been higher.
| | Beginning
Account
Value
March 1,
2020 | Ending
Account
Value
August 31,
2020 | Expenses
Paid
During
Period(a) | Annualized
Expense
Ratio |
Hedeker Strategic Appreciation Fund |
Institutional Shares | Actual | $ 1,000.00 | $ 1,048.90 | $ 7.11 | 1.38% |
| | | | | | |
| | Hypothetical(b) | $ 1,000.00 | $ 1,018.20 | $ 7.00 | 1.38% |
(a) | Expenses are equal to the Fund’s annualized expense ratios, multiplied by the average account value over the period, multiplied by 184/366 (to reflect the one-half year period). |
(b) | Hypothetical assumes a 5% return before expenses. |
22
Additional Federal Income Tax Information (Unaudited)
The Form 1099-DIV you receive in January 2021 will show the tax status of all distributions paid to your account in calendar year 2020. Shareholders are advised to consult their own tax adviser with respect to the tax consequences of their investment in the Fund. As required by the Internal Revenue Code and/or regulations, shareholders must be notified regarding the status of qualified dividend income for individuals and the dividends received deduction for corporations.
Qualified Dividend Income. The Fund designates approximately 13% or up to the maximum amount of such dividends allowable pursuant to the Internal Revenue Code, as qualified dividend income eligible for a reduced tax rate.
Qualified Business Income. The Fund designates approximately 0% of its ordinary income dividends, or up to the maximum amount of such dividends allowable pursuant to the Internal Revenue Code, as qualified business income.
Dividends Received Deduction. Corporate shareholders are generally entitled to take the dividends received deduction on the portion of the Fund’s dividend distribution that qualifies under tax law. For the Fund’s calendar year 2020 ordinary income dividends, 13% qualifies for the corporate dividends received deduction.
23
Trustees and Officers (Unaudited)
The Board supervises the business activities of the Trust and is responsible for protecting the interests of shareholders. The Chairman of the Board is Walter B. Grimm, who is an Independent Trustee of the Trust.
Each Trustee serves as a Trustee for the lifetime of the Trust or until the earlier of his or her retirement as a Trustee at age 78, death, resignation or removal. Officers are re-elected annually by the Board. The address of each Trustee and officer is 225 Pictoria Drive, Suite 450, Cincinnati, Ohio 45246.
As of the date of this report, the Trustees oversee the operations of 14 series.
Interested Trustee Background. The following table provides information regarding the Interested Trustee.
Name, (Age), Position with Trust,
Term of Position with Trust | Principal Occupation During Past 5 Years and Other Directorships |
Robert G. Dorsey* Birth Year: 1957
TRUSTEE
Began Serving: March 2017 | Principal Occupation(s): Vice Chairman of Ultimus Fund Solutions, LLC and its subsidiaries, except as otherwise noted for the FINRA-regulated broker-dealer entities (February 2019 to present); Interested Trustee of Ultimus Managers Trust (February 2012 to present). Previous Position(s): Managing Director and Co-Chief Executive Officer of Ultimus Fund Solutions, LLC (1999 to February 2019); President of Ultimus Fund Distributors, LLC (1999 to 2018); President of Ultimus Managers Trust (February 2012 to October 2013). |
* | Mr. Dorsey is considered an “interested person” of the Trust within the meaning of Section 2(a)(19) of the 1940 Act because of his relationship with the Trust’s administrator, transfer agent, and distributors. |
Independent Trustee Background. The following table provides information regarding the Independent Trustees.
Name, (Age), Position with Trust,
Term of Position with Trust | Principal Occupation During Past 5 Years
and Other Directorships |
John C. Davis Birth Year: 1952 TRUSTEE Began Serving: July 2018 | Previous Position(s): Retired Partner of PricewaterhouseCoopers LLP (1974-2010); Consultant, Board of Trustees of Ultimus Managers Trust (2016 to 2019) and Former Trustee of Ultimus Managers Trust (2012 to 2016). |
24
Trustees and Officers (Unaudited) (continued)
Name, (Age), Position with Trust,
Term of Position with Trust | Principal Occupation During Past 5 Years
and Other Directorships |
Walter B. Grimm Birth Year: 1945 TRUSTEE AND CHAIR Began Serving: November 2013 | Principal Occupations(s): President, Leigh Management Group, LLC (consulting firm) (October 2005 to present); and President, Leigh Investments, Inc. (1988 to present). |
Lori Kaiser Birth Year: 1963 TRUSTEE Began Serving: July 2018 | Principal Occupations(s): Founder and CEO, Kaiser Consulting since 1992. |
Janet Smith Meeks Birth Year: 1955 TRUSTEE Began Serving: July 2018 | Principal Occupations(s): Co-Founder and CEO, Healthcare Alignment Advisors, LLC (consulting company) since August 2015. Previous Position(s): President and Chief Operating Officer, Mount Carmel St. Ann’s Hospital (2006 to 2015). |
Mary M. Morrow Birth Year: 1958 TRUSTEE Began Serving: November 2013 | Principal Occupations(s): Chief Operating Officer, Dignity Health Managed Services Organization (October 2018 to present). Previous Position(s): Consultant (managed care services) (April 2018 to September 2018); Chief Operating Officer, Pennsylvania Health and Wellness (fully owned subsidiary of Centene Corporation) (November 2016 to April 2018); Vice President, Strategic Initiatives, Gateway Heath (January 2015 to November 2016); Consulting Practice Manager, DST Health Solutions (August 2010 to January 2015). |
25
Trustees and Officers (Unaudited) (continued)
Officers. The following table provides information regarding the Officers.
Name, (Age), Position with Trust,
Term of Position with Trust | Principal Occupation During Past 5 Years
and Other Directorships |
Matthew J. Miller Birth Year: 1976 PRESIDENT and CHIEF EXECUTIVE OFFICER Began Serving: September 2013 (as VP); September 2018 (as President) | Principal Occupation(s): Assistant Vice President, Relationship Management, Ultimus Fund Solutions, LLC (December 2015 to present); Vice President, Valued Advisers Trust (December 2011 to present). Previous Position(s): Vice President, Relationship Management, Huntington Asset Services, Inc. (n/k/a Ultimus Asset Services, LLC) (2008 to December 2015). |
Zachary P. Richmond Birth Year: 1980 TREASURER AND CHIEF FINANCIAL OFFICER Began Serving: August 2014 | Principal Occupation(s): Vice President, Director of Financial Administration for Ultimus Fund Solutions, LLC (February 2019 to present). Previous Position(s): Assistant Vice President, Associate Director of Financial Administration for Ultimus Fund Solutions, LLC (December 2015 to February 2019); Manager, Fund Administration, Huntington Asset Services, Inc. (January 2011 to December 2015). |
Martin R. Dean Birth Year: 1963 CHIEF COMPLIANCE OFFICER Began Serving: May 2019 | Principal Occupation(s): Senior Vice President, Head of Fund Compliance, Ultimus Fund Solutions, LLC (since January 2016), Chief Compliance Officer, First Western Funds Trust (since April 2016); Chief Compliance Officer, Cross Shore Discovery Fund (since June 2016);Chief Compliance Officer, FSI Low Beta Absolute Return Fund (since November 2016); Chief Compliance Officer, Peachtree Alternative Strategies Fund (since January 2017); and Chief Compliance Officer, Dupree Mutual Funds (since August 2017). Previous Position(s): Interim Chief Compliance Officer, Valued Advisers Trust (May 2019 to March 2020); Chief Compliance Officer, Fenimore Asset Management Trust (May 2019 to February 2020); and Senior Vice President and Compliance Group Manager, Huntington Asset Services, Inc. (July 2013 to December 2015). |
26
Trustees and Officers (Unaudited) (continued)
Name, (Age), Position with Trust,
Term of Position with Trust | Principal Occupation During Past 5 Years and Other Directorships |
Matthew J. Beck Birth Year: 1988 SECRETARY Began Serving: September 2018 | Principal Occupation(s): Senior Attorney, Ultimus Fund Solutions, LLC (since May 2018) and Secretary, Ultimus Managers Trust (since July 2018). Previous Position(s): Chief Compliance Officer, OBP Capital, LLC (May 2015 to May 2018); Secretary, Aspiration Funds (March 2015 to May 2018); Secretary, Starboard Investment Trust (September 2014 to May 2018); Secretary, Leeward Investment Trust (September 2014 to May 2018); Secretary, Hillman Capital Management Investment Trust (September 2014 to May 2018); Secretary, Spinnaker ETF Series (September 2014 to May 2018); Vice President and General Counsel, The Nottingham Company (July 2014 to May 2018). |
27
FACTS | WHAT DOES HEDEKER STRATEGIC APPRECIATION FUND (THE “FUND”) DO WITH YOUR PERSONAL INFORMATION? |
| | |
Why? | Financial companies choose how they share your personal information. Federal law gives consumers the right to limit some but not all sharing. Federal law also requires us to tell you how we collect, share, and protect your personal information. Please read this notice carefully to understand what we do. |
| | |
What? | The types of personal information we collect and share depend on the product or service you have with us. This information can include: ■ Social Security number ■ account balances and account transactions ■ transaction or loss history and purchase history ■ checking account information and wire transfer instructions When you are no longer our customer, we continue to share your information as described in this notice. |
| | |
How? | All financial companies need to share customers’ personal information to run their everyday business. In the section below, we list the reasons financial companies can share their customers’ personal information; the reasons the Fund chooses to share; and whether you can limit this sharing. |
| | |
Reasons we can share your personal information | Does the Fund share? |
For our everyday business purposes—
such as to process your transactions, maintain your account(s), respond to court orders and legal investigations, or report to credit bureaus | Yes |
For our marketing purposes—
to offer our products and services to you | No |
For joint marketing with other financial companies | No |
For our affiliates’ everyday business purposes—
information about your transactions and experiences | No |
For our affiliates’ everyday business purposes—
information about your creditworthiness | No |
For nonaffiliates to market to you | No |
| | |
Questions? | Call (800) 657-4450 |
28
Who we are |
Who is providing this notice? | Hedeker Strategic Appreciation Fund
Ultimus Fund Distributors, LLC (Distributor)
Ultimus Fund Solutions, LLC (Administrator) |
What we do |
How does the Fund protect my personal information? | To protect your personal information from unauthorized access and use, we use security measures that comply with federal law. These measures include computer safeguards and secured files and buildings. Our service providers are held accountable for adhering to strict policies and procedures to prevent any misuse of your nonpublic personal information. |
How does the Fund collect my personal information? | We collect your personal information, for example, when you ■ open an account or deposit money ■ buy securities from us or sell securities to us ■ make deposits or withdrawals from your account or provide account information ■ give us your account information ■ make a wire transfer ■ tell us who receives the money ■ tell us where to send the money ■ show your government-issued ID ■ show your driver’s license |
Why can’t I limit all sharing? | Federal law gives you the right to limit only ■ sharing for affiliates’ everyday business purposes — information about your creditworthiness ■ affiliates from using your information to market to you ■ sharing for nonaffiliates to market to you State laws and individual companies may give you additional rights to limit sharing. |
Definitions |
Affiliates | Companies related by common ownership or control. They can be financial and nonfinancial companies. ■ Hedeker Wealth LLC, the investment adviser to the Fund, could be deemed to be an affiliate. |
Nonaffiliates | Companies not related by common ownership or control. They can be financial and nonfinancial companies. ■ The Fund does not share your personal information with nonaffiliates so they can market to you |
Joint marketing | A formal agreement between nonaffiliated financial companies that together market financial products or services to you. ■ The Fund doesn’t jointly market. |
29
OTHER INFORMATION
The Fund’s Statement of Additional Information (“SAI”) includes additional information about the trustees and is available without charge, upon request. You may call toll-free at (800) 657-4450 to request a copy of the SAI or to make shareholder inquiries.
PROXY VOTING
A description of the policies and procedures that the Fund uses to determine how to vote proxies relating to portfolio securities and information regarding how the Fund voted those proxies during the most recent twelve month period ended June 30, are available (1) without charge upon request by calling the Fund at (800) 657-4450 and (2) in Fund documents filed with the Securities and Exchange Commission (“SEC”) on the SEC’s website at www.sec.gov.
TRUSTEES Walter B. Grimm, Chairman John C. Davis Robert G. Dorsey Lori Kaiser Janet Smith Meeks Mary M. Morrow OFFICERS Matthew J. Miller, Chief Executive Officer and President Zachary P. Richmond, Chief Financial Officer and Treasurer Martin R. Dean, Chief Compliance Officer Matthew J. Beck, Secretary INVESTMENT ADVISER Hedeker Wealth LLC One Overlook Point, Suite 610 Lincolnshire, IL 60069 DISTRIBUTOR Ultimus Fund Distributors, LLC 225 Pictoria Drive, Suite 450 Cincinnati, OH 45246 | INDEPENDENT REGISTERED PUBLIC ACCOUNTING FIRM Ernst & Young LLP 221 East 4th Street, Suite 2900 Cincinnati, OH 45202 LEGAL COUNSEL Bernstein Shur 100 Middle Street, 6th Floor Portland, ME 04104 CUSTODIAN Huntington National Bank 41 South High Street Columbus, OH 43215 ADMINISTRATOR, TRANSFER AGENT AND FUND ACCOUNTANT Ultimus Fund Solutions, LLC 225 Pictoria Drive, Suite 450 Cincinnati, OH 45246 |
This report is intended only for the information of shareholders or those who have received the Fund’s prospectus which contains information about the Fund’s management fee and expenses. Please read the prospectus carefully before investing.
Distributed by Ultimus Fund Distributors, LLC
Member FINRA/SIPC

Preserver Alternative Opportunities Fund
Institutional Shares – PAOIX
Annual Report
August 31, 2020
Beginning on January 1, 2021, as permitted by regulations adopted by the Securities and Exchange Commission, paper copies of the Fund’s shareholder reports like this one will no longer be sent by mail, unless you specifically request paper copies of the reports from the Fund or from your financial intermediary such as a broker-dealer or bank. Instead, the reports will be made available on a website, and you will be notified by mail each time a report is posted and provided with a website link to access the report.
If you already elected to receive shareholder reports electronically, you will not be affected by this change and you need not take any action. You may elect to receive shareholder reports and other communications from the Fund electronically by contacting the Fund at (844) 838-2119 or, if you own these shares through a financial intermediary, you may contact your financial intermediary.
You may elect to receive all future reports in paper free of charge. You can inform the Fund that you wish to continue receiving paper copies of your shareholder reports by contacting the Fund at (844) 838-2119. If you own shares through a financial intermediary, you may contact your financial intermediary or follow instructions included with this document to elect to continue to receive paper copies of your shareholder reports. Your election to receive reports in paper will apply to all funds held with the fund complex or at your financial intermediary
Preserver Partners, LLC
425 Madison Avenue
Memphis, Tennessee 38103
(844) 838-2119 or (901) 755-4737
Dear Fellow Shareholders,
We are pleased to present the Annual Report for the Preserver Alternative Opportunities Fund (“Fund” or “PAOIX”). For the period September 1, 2019 through August 31, 2020, the Fund returned 11.46%. These returns outperformed the Fund’s primary benchmark, the Wilshire Liquid Alternative Index, which returned 1.25% during same period. For the three months ended August 31, 2020, PAOIX returned 9.44%. These returns exceeded Wilshire Liquid Alternative Index return of 4.04% for the three months ended August 31, 2020.
The Fund’s outperformance over the last year, compared to the benchmark’s return, was largely driven by its strong equity and fixed income returns in three of the last four quarters. The Fund has rebounded from the pandemic-induced selloff in the first quarter 2020. Global equities were down 34% from the early February high (in a month). It was both the fastest bear market and fastest recovery in history. While global credit markets were challenged with wider yield spreads and illiquidity during the sell-off, investment grade and high yield bond markets have recovered all of March’s double-digit losses.
The current equity and credit rallies are somewhat unloved by institutional investors because of their speed, breadth and the perception that they are seemingly untethered to economic realities. Riskier assets have rallied despite dismal economic data and U.S. Covid-19 cases rising to over six million as of September 8, 2020. Unemployment has remained high as many job losses are becoming permanent. Retail sales and Gross Domestic Product remain below pre-pandemic levels. The most logical rationale for this dichotomy is that massive monetary policy actions have kept markets open, functioning and liquid. The multiple rounds of fiscal stimulus have blunted the negative economic impact of Covid-19 by keeping millions of businesses open and providing funds directly to displaced workers. In the absence of widespread Covid-19 lockdowns, the worst of the economic damage may be over, although the recovery will be tied to progress fighting the virus and future government actions. It is likely that future economic growth will be positive from re-openings and strengthening of consumer, industrial and commercial demand.
As of August 31, 2020, the Fund’s current asset allocation is 54% Global Equities, 28% Fixed Income, 8% Preferred Stock, 3% in other securities, and 7% in Cash. The Fund held ninety-one positions including domestic and international equities, Treasury and corporate bonds, collateralized mortgage obligations (CMO), asset-backed bonds, preferred stocks, exchange-traded funds, structured notes, a closed-end fund, and a private fund comprised of equity tranches of collateralized loan obligations (CLO) warehouse facilities. The largest equity holding is NextEra Energy (NEE) and the largest fixed income holding is a short-term U.S. Treasury. The Fund’s subsidized 30 day yield as of August 31, 2020 is 1.29%. We are finding limited opportunities in cyclical and value-oriented equities and structured credit markets including non-agency mortgage-backed and asset-backed securities, which have been slower to rebound relative to equities and corporate credit. These markets are less liquid, more esoteric and are not receiving direct Federal Reserve support.
Your long-term investment horizon and confidence in our investment philosophy is essential to the execution of our strategy. We appreciate your continued support.
Sincerely,
Floyd Tyler, Ph.D., CFA
Portfolio Manager
1
Investment Results (Unaudited)
Average Annual Total Returns(a) as of August 31, 2020
| | One
Year | Three
Year | Since
Inception
(3/1/16) |
Preserver Alternative Opportunities Fund | | | |
Institutional Shares | 11.46% | 6.04% | 8.08% |
Wilshire Liquid Alternative Index (b) | 1.25% | 1.19% | 2.37% |
| | Expense Ratios(c) |
| | Institutional
Shares |
Gross | 1.78% |
With Applicable Waivers | 1.47% |
The performance quoted represents past performance, which does not guarantee future results. The investment return and principal value of an investment will fluctuate so that an investor’s shares, when redeemed, may be worth more or less than their original cost. The returns shown do not reflect deduction of taxes that a shareholder would pay on Preserver Alternative Opportunities Fund (the “Fund”) distributions or the redemption of Fund shares. Current performance of the Fund may be lower or higher than the performance quoted. The Fund’s investment objectives, risks, charges and expenses must be considered carefully before investing. Performance data current to the most recent month end may be obtained by calling (844) 838-2119.
(a) Average annual total returns reflect any change in price per share and assume the reinvestment of all distributions. The Fund’s returns reflect any fee waivers during the applicable period. If such fee waivers had not occurred, the quoted performance would have been lower.
(b) This table compares the Fund’s average annual total returns for the referenced periods to those of Wilshire Liquid Alternative Index. The Wilshire Liquid Alternative Index measures the collective performance of the five Wilshire Liquid Alternative Strategies that make up the Wilshire Liquid Alternative Universe. The Wilshire Liquid Alternative Index is designed to provide a broad measure of the Liquid Alternative Global Macro Index, Wilshire Liquid Alternative Relative Value Index, Wilshire Liquid Alternative Multi-Strategy Index, and Wilshire Liquid Alternative Event Driven Index. The index is an unmanaged benchmark that assumes reinvestment of all distributions and excludes the effect of taxes and fees. Individuals cannot invest directly in the index; however, an individual can invest in exchange-traded funds or other investment vehicles that attempt to track the performance of a benchmark index.
2
Investment Results (Unaudited) (continued)
(c) The expense ratios are from the Fund’s Prospectus dated December 30, 2019. Preserver Partners, LLC, the Fund’s investment adviser (the “Adviser”) has contractually agreed, through December 31, 2020, to waive its management fee and/or reimburse expenses so that total annual operating expenses (excluding (i) interest; (ii) taxes; (iii) brokerage fees and commissions; (iv) other extraordinary expenses not incurred in the ordinary course of the Fund’s business; (v) dividend expenses on short sales; and (vi) indirect expenses such as acquired fund fees and expenses) do not exceed 1.35% of the Fund’s average daily net assets through December 31, 2020 (“Expense Limitation Agreement”). During any fiscal year that the Investment Advisory Agreement between the Adviser and Capitol Series Trust is in effect, the Adviser may recoup the sum of all fees previously waived or expenses reimbursed, less any reimbursement previously paid, provided that the Adviser is only permitted to recoup fees or expenses within 36 months from the date the fee waiver or expense reimbursement first occurred and provided further that such recoupment can be achieved within the Expense Limitation Agreement currently in effect and the Expense Limitation Agreement in place when the waiver/reimbursement occurred. This Expense Limitation Agreement may not be terminated by the Adviser prior to its expiration date, but the Board of Trustees may terminate such agreement at any time. The Expense Limitation Agreement terminates automatically upon the termination of the Investment Advisory Agreement with the Adviser. Additional information pertaining to the Fund’s expense ratios as of August 31, 2020, can be found in the financial highlights.
The Fund’s investment objectives, strategies, risks, charges and expenses must be considered carefully before investing. The prospectus contains this and other important information about the Fund and may be obtained by calling (844) 838-2119. Please read it carefully before investing.
The Fund is distributed by Ultimus Fund Distributors, LLC, member FINRA/SIPC.
3
Investment Results (Unaudited) (continued)
Comparison of the Growth of a $10,000 Investment in the Preserver Alternative
Opportunities Fund - Institutional Shares and the Wilshire Liquid Alternative Index

The chart above assumes an initial investment of $10,000 made on March 1, 2016 (commencement of operations) and held through August 31, 2020. THE FUND’S RETURNS REPRESENT PAST PERFORMANCE AND DO NOT GUARANTEE FUTURE RESULTS. The returns shown do not reflect deduction of taxes that a shareholder would pay on the Fund’s distributions or the redemption of the Fund’s shares. Investment returns and principal values will fluctuate so that your shares, when redeemed, may be worth more or less than their original purchase price.
Current performance may be lower or higher than the performance data quoted. For more information on the Fund, and to obtain performance data current to the most recent month-end, or to request a prospectus, please call (844) 838-2119. You should carefully consider the investment objectives, potential risks, management fees, and charges and expenses of the Fund before investing. The Fund’s prospectus contains this and other information about the Fund and should be read carefully before investing.
The Fund is distributed by Ultimus Fund Distributors, LLC, Member FINRA/SIPC.
4
Portfolio Illustration (Unaudited)
August 31, 2020
The following chart gives a visual breakdown of the Fund’s holdings as a percentage of net assets.
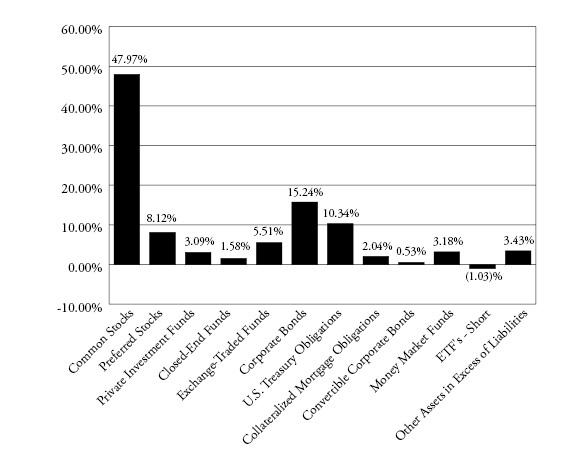
Availability of Portfolio Schedule (Unaudited)
The Fund files its complete schedule of portfolio holdings with the Securities and Exchange Commission (“SEC”) for the first and third quarters of each fiscal year as an exhibit to its reports on Form N-PORT. The Fund’s Form N-PORT reports are available on the SEC’s website at http://www.sec.gov.
5
Preserver Alternative Opportunities Fund
Schedule of Investments
August 31, 2020
| |
Shares
| | | Fair Value | |
COMMON STOCKS — 47.97% | | | | | | | | |
| | | | | | | | | |
Australia — 1.04% | | | | | | | | |
Consumer Discretionary — 1.04% | | | | | | | | |
Aristocrat Leisure Ltd. | | | 12,000 | | | $ | 251,080 | |
| | | | | | | | | |
Bermuda — 1.18% | | | | | | | | |
Financials — 1.18% | | | | | | | | |
Essent Group Ltd. | | | 8,000 | | | | 285,600 | |
| | | | | | | | | |
Canada — 0.96% | | | | | | | | |
Real Estate — 0.96% | | | | | | | | |
NorthWest Healthcare Properties REIT | | | 25,555 | | | | 231,579 | |
| | | | | | | | | |
France — 1.53% | | | | | | | | |
Industrials — 1.53% | | | | | | | | |
Schneider Electric SE | | | 3,000 | | | | 371,331 | |
| | | | | | | | | |
Japan — 1.80% | | | | | | | | |
Communications — 1.80% | | | | | | | | |
SoftBank Group Corp. | | | 7,000 | | | | 436,091 | |
| | | | | | | | | |
Switzerland — 1.07% | | | | | | | | |
Technology — 1.07% | | | | | | | | |
Garmin Ltd. | | | 2,500 | | | | 259,025 | |
| | | | | | | | | |
United Kingdom — 1.82% | | | | | | | | |
Technology — 1.82% | | | | | | | | |
IHS Markit Ltd. | | | 5,500 | | | | 439,561 | |
| | | | | | | | | |
United States — 38.57% | | | | | | | | |
Consumer Discretionary — 4.18% | | | | | | | | |
Fortune Brands Home & Security, Inc. | | | 3,500 | | | | 294,280 | |
Home Depot, Inc./The | | | 1,000 | | | | 285,040 | |
Taylor Morrison Home Corp.(a) | | | 8,000 | | | | 188,240 | |
Tiffany & Co. | | | 2,000 | | | | 245,000 | |
| | | | | | | | 1,012,560 | |
Consumer Staples — 2.09% | | | | | | | | |
Coca-Cola Co./The | | | 5,000 | | | | 247,650 | |
Constellation Brands, Inc., Class A | | | 1,400 | | | | 258,272 | |
| | | | | | | | 505,922 | |
Financials — 0.93% | | | | | | | | |
First Republic Bank | | | 2,000 | | | | 225,820 | |
6 | See accompanying notes which are an integral part of these financial statements. | |
Preserver Alternative Opportunities Fund
Schedule of Investments (continued)
August 31, 2020
| |
Shares
| | | Fair Value | |
COMMON STOCKS — (continued) |
| |
Health Care — 4.54% | | | | | | | | |
AbbVie, Inc. | | | 3,000 | | | $ | 287,310 | |
Danaher Corp. | | | 1,500 | | | | 309,705 | |
Stryker Corp. | | | 1,100 | | | | 217,976 | |
West Pharmaceutical Services, Inc. | | | 1,000 | | | | 283,960 | |
| | | | | | | | 1,098,951 | |
Industrials — 4.72% | | | | | | | | |
Carrier Global Corp. | | | 10,000 | | | | 298,500 | |
FedEx Corp. | | | 1,500 | | | | 329,760 | |
Honeywell International, Inc. | | | 1,600 | | | | 264,880 | |
Otis Worldwide Corp. | | | 4,000 | | | | 251,600 | |
| | | | | | | | 1,144,740 | |
Materials — 1.21% | | | | | | | | |
Air Products & Chemicals, Inc. | | | 1,000 | | | | 292,260 | |
| | | | | | | | | |
Real Estate — 4.12% | | | | | | | | |
Equinix, Inc.(b) | | | 500 | | | | 394,890 | |
Prologis, Inc.(b) | | | 3,000 | | | | 305,580 | |
Sun Communities, Inc. | | | 2,000 | | | | 298,160 | |
| | | | | | | | 998,630 | |
Technology — 14.47% | | | | | | | | |
Adobe Systems, Inc.(a) | | | 800 | | | | 410,712 | |
CoStar Group, Inc.(a) | | | 260 | | | | 220,636 | |
Global Payments, Inc. | | | 1,500 | | | | 264,930 | |
MasterCard, Inc., Class A | | | 1,000 | | | | 358,190 | |
Microsoft Corp.(b) | | | 2,000 | | | | 451,060 | |
Moody’s Corp.(b) | | | 1,000 | | | | 294,640 | |
Motorola Solutions, Inc. | | | 2,000 | | | | 309,500 | |
MSCI, Inc. | | | 700 | | | | 261,289 | |
Palo Alto Networks, Inc.(a) | | | 1,000 | | | | 257,410 | |
S&P Global, Inc. | | | 1,000 | | | | 366,421 | |
Varonis Systems, Inc.(a) | | | 2,500 | | | | 308,825 | |
| | | | | | | | 3,503,613 | |
Utilities — 2.31% | | | | | | | | |
NextEra Energy, Inc. | | | 2,000 | | | | 558,340 | |
Total United States | | | | | | | 9,340,836 | |
| | | | | | | | | |
Total Common Stocks (Cost $9,090,688) | | | | | | | 11,615,103 | |
| | See accompanying notes which are an integral part of these financial statements. | 7 |
Preserver Alternative Opportunities Fund
Schedule of Investments (continued)
August 31, 2020
| |
Shares
| | | Fair Value | |
PREFERRED STOCKS — 8.12% | | | | | | | | |
| | | | | | | | | |
United States — 8.12% | | | | | | | | |
Financials — 4.48% | | | | | | | | |
Capital One Financial Corp., Series J, 4.80% | | | 12,000 | | | $ | 291,240 | |
Citigroup, Inc., Series J, 7.13% | | | 5,000 | | | | 142,900 | |
Invesco Mortgage Capital, Inc., Series A, 7.75% | | | 15,000 | | | | 323,700 | |
New York Mortgage Trust, Inc., Series C, 7.88% | | | 15,593 | | | | 329,792 | |
| | | | | | | | 1,087,632 | |
Real Estate — 2.38% | | | | | | | | |
Annaly Capital Management, Inc., Series D, 7.50% | | | 10,000 | | | | 250,800 | |
Colony Capital, Inc., Series I, 7.15% | | | 15,100 | | | | 325,254 | |
| | | | | | | | 576,054 | |
Utilities — 1.26% | | | | | | | | |
CenterPoint Energy, Inc., Series B, 7.00% | | | 8,100 | | | | 304,155 | |
Total Preferred Stocks (Cost $1,767,690) | | | | | | | 1,967,841 | |
| | | | | | | | | |
EXCHANGE-TRADED FUNDS — 5.51% | | | | | | | | |
Amplify BlackSwan Growth & Treasury Core ETF | | | 7,000 | | | | 227,290 | |
iShares MSCI Europe Small-Cap ETF | | | 4,500 | | | | 237,610 | |
iShares MSCI Eurozone ETF | | | 7,000 | | | | 275,730 | |
SPDR Bloomberg Barclays Convertible Securities ETF | | | 5,000 | | | | 354,100 | |
SPDR Gold Shares ETF(a) | | | 1,300 | | | | 240,279 | |
Total Exchange-Traded Funds (Cost $1,214,483) | | | | | | | 1,335,009 | |
| | | | | | | | | |
PRIVATE INVESTMENT FUNDS — 3.09% | | | | | | | | |
Palmer Square Senior Loan Fund(c)(d) | | | 800,000 | | | | 748,485 | |
Total Private Investment Funds (Cost $800,000) | | | | | | | 748,485 | |
| | | | | | | | | |
CLOSED END FUNDS — 1.58% | | | | | | | | |
AllianzGI Convertible & Income Fund II | | | 45,500 | | | | 198,380 | |
Western Asset Mortgage Opportunity Fund, Inc. | | | 14,000 | | | | 183,540 | |
Total Closed End Funds (Cost $469,270) | | | | | | | 381,920 | |
8 | See accompanying notes which are an integral part of these financial statements. | |
Preserver Alternative Opportunities Fund
Schedule of Investments (continued)
August 31, 2020
| | Principal
Amount | | | Fair Value | |
CORPORATE BONDS — 15.24% |
| | | | | | | | | |
Netherlands — 1.35% | | | | | | | | |
Health Care — 1.35% | | | | | | | | |
Teva Pharmaceutical Finance Netherlands III BV, 6.75%, 3/1/2028 | | $ | 300,000 | | | $ | 327,548 | |
| | | | | | | | | |
United Kingdom — 0.97% | | | | | | | | |
Financials — 0.97% | | | | | | | | |
Barclays Bank PLC, MTN, 0.00%, 10/31/2024(e) | | | 100,000 | | | | 95,450 | |
Barclays Bank PLC, MTN, 0.00%, 1/31/2030(e) | | | 150,000 | | | | 139,065 | |
Total United Kingdom | | | | | | | 234,515 | |
| | | | | | | | | |
United States — 13.45% | | | | | | | | |
Communications — 0.87% | | | | | | | | |
CenturyLink, Inc., Series D, 7.20%, 12/1/2025 | | | 200,000 | | | | 211,229 | |
| | | | | | | | | |
Consumer Discretionary — 2.35% | | | | | | | | |
International Game Technology PLC, 5.35%, 10/15/2023 | | | 120,000 | | | | 120,900 | |
L Brands, Inc., 5.25%, 2/1/2028 | | | 200,000 | | | | 192,443 | |
Levi Strauss & Co., 5.00%, 5/1/2025 | | | 250,000 | | | | 256,536 | |
| | | | | | | | 569,879 | |
Financials — 7.82% | | | | | | | | |
Bank of America Corp., MTN, 2.33%, 10/1/2021 | | | 250,000 | | | | 250,399 | |
Bank of America Corp., Series FF, 5.88%, Perpetual | | | 250,000 | | | | 275,054 | |
BofA Finance LLC, MTN, 7.30%, 12/19/2025 | | | 200,000 | | | | 183,520 | |
Citibank NA, 2.13%, 10/20/2020 | | | 200,000 | | | | 200,262 | |
Citigroup, Inc., Series M, 6.30%, Perpetual(e) | | | 220,000 | | | | 235,807 | |
GS Finance Corp., MTN, 0.00%, 11/7/2025(e) | | | 100,000 | | | | 96,409 | |
PNC Bank NA, 4.05%, 7/26/2028 | | | 250,000 | | | | 295,991 | |
Stifel Financial Corp., 4.25%, 7/18/2024 | | | 200,000 | | | | 221,780 | |
Toronto-Dominion Bank/The, MTN, 0.00%, 1/22/2027 | | | 150,000 | | | | 134,895 | |
| | | | | | | | 1,894,117 | |
Health Care — 0.45% | | | | | | | | |
Tenet Healthcare Corp., 8.13%, 4/1/2022 | | | 100,000 | | | | 108,075 | |
| | | | | | | | | |
Industrials — 0.93% | | | | | | | | |
Timken Co./The, 3.88%, 9/1/2024 | | | 100,000 | | | | 106,193 | |
Triumph Group, Inc., 5.25%, 6/1/2022 | | | 150,000 | | | | 117,527 | |
| | | | | | | | 223,720 | |
Real Estate — 0.39% | | | | | | | | |
Senior Housing Properties Trust, 4.75%, 5/1/2024 | | | 100,000 | | | | 95,656 | |
| | | | | | | | | |
| | See accompanying notes which are an integral part of these financial statements. | 9 |
Preserver Alternative Opportunities Fund
Schedule of Investments (continued)
August 31, 2020
| | Principal
Amount | | | Fair Value | |
CORPORATE BONDS — (continued) |
| | | | | | | | | |
Utilities — 0.11% | | | | | | | | |
Ferrellgas Partners LP, 8.63%, 6/15/2020 | | $ | 100,000 | | | $ | 26,861 | |
Total United States | | | | | | | 3,257,200 | |
| | | | | | | | | |
Total Corporate Bonds (Cost $3,641,932) | | | | | | | 3,691,600 | |
| | | | | | | | | |
U.S. TREASURY OBLIGATIONS — 10.34% | | | | | | | | |
United States Treasury Inflation Indexed Bonds, 0.13%, 4/15/2025(f) | | | 240,000 | | | | 257,701 | |
United States Treasury Inflation Indexed Bonds, 0.38%, 7/15/2025(f) | | | 200,000 | | | | 238,359 | |
United States Treasury Inflation Indexed Bonds, 2.00%, 1/15/2026(f) | | | 167,000 | | | | 258,287 | |
United States Treasury Inflation Indexed Bonds, 0.88%, 2/15/2047(f) | | | 178,000 | | | | 253,486 | |
United States Treasury Notes, 1.13%, 2/28/2021 | | | 850,000 | | | | 854,093 | |
United States Treasury Notes, 1.63%, 2/15/2026 | | | 600,000 | | | | 642,188 | |
Total U.S. Treasury Obligations (Cost $2,379,062) | | | | | | | 2,504,114 | |
| | | | | | | | | |
COLLATERALIZED MORTGAGE OBLIGATIONS — 2.04% | | | | | | | | |
Banc of America Mortgage Securities, Inc., Series 2004-K, Class B3, 4.47%, 12/25/2034(e) | | | 20,403 | | | | 21,164 | |
Countrywide Alternative Loan Trust, Series 2003-J2, Class A1, 6.00%, 10/25/2033 | | | 42,090 | | | | 42,964 | |
Countrywide Home Loans Mortgage Pass Through Trust, Series 2004-HYB9, Class 1A1, 3.63%, 2/20/2035(e) | | | 21,188 | | | | 21,048 | |
GSR Mortgage Loan Trust, Series 2005-5F, Class 8A3, 0.68%, 6/25/2035 (1MO LIBOR + 50bps)(e) | | | 12,860 | | | | 12,050 | |
HarborView Mortgage Loan Trust, Series 2004-07, Class 2A1, 3.80%, 11/19/2034(e) | | | 86,144 | | | | 85,637 | |
Impac CMB Trust, Series 2005-08, Class 2B, 2.43%, 2/25/2036 (1MO LIBOR + 225bps)(e) | | | 118,118 | | | | 113,480 | |
Residential Asset Mortgage Products, Inc., Series 2001-RS2, Class MII2, 1.60%, 6/25/2031 (1MO LIBOR + 142.5bps)(e) | | | 199,758 | | | | 198,740 | |
Total Collateralized Mortgage Obligations (Cost $469,840) | | | | | | | 495,083 | |
| | | | | | | | | |
CONVERTIBLE CORPORATE BONDS — 0.53% | | | | | | | | |
| | | | | | | | | |
Industrials — 0.53% | | | | | | | | |
Atlas Air Worldwide Holdings, Inc., 2.25%, 6/1/2022 | | | 120,000 | | | | 127,663 | |
Total Convertible Corporate Bonds (Cost $114,580) | | | | | | | 127,663 | |
10 | See accompanying notes which are an integral part of these financial statements. | |
Preserver Alternative Opportunities Fund
Schedule of Investments (continued)
August 31, 2020
| |
Shares
| | | Fair Value | |
MONEY MARKET FUNDS — 3.18% | | | | | | | | |
Federated Hermes Government Obligations Fund, Institutional Class, 0.01%(g) | | | 771,174 | | | $ | 771,174 | |
Total Money Market Funds (Cost $771,174) | | | | | | | 771,174 | |
| | | | | | | | | |
Total Investments — 97.60% (Cost $20,718,719) | | | | | | | 23,637,992 | |
| | | | | | | | | |
Other Assets in Excess of Liabilities — 2.40% | | | | | | | 582,693 | |
| | | | | | | | | |
NET ASSETS — 100.00% | | | | | | $ | 24,220,685 | |
(a) | Non-income producing security. |
(b) | All or a portion of the security is held as collateral for unsettled security transactions and securities sold short. |
(c) | Illiquid security. The total fair value of these securities as of August 31, 2020 was $748,485, representing 3.09% of net assets. Redemption requires 30 days notice prior to the end of each calendar quarter, subject to the liquidity of the underlying holdings. |
(d) | Security is currently being valued according to the fair value procedures approved by the Board of Trustees. |
(e) | Variable rate security. Interest rate resets periodically. The rate shown is the effective interest rate as of August 31, 2020. For securities based on a published reference rate and spread, the reference rate and spread (in basis points) are indicated parenthetically. Certain variable rate securities are not based on a published reference rate and spread but are determined by the issuer or agent and are based on current market conditions. These securities, therefore, do not indicate a reference rate and spread. |
(f) | Principal amount of security is adjusted periodically based on changes in the Consumer Price Index. |
(g) | Rate disclosed is the seven day effective yield as of August 31, 2020. |
ETF – Exchange-Traded Fund
MTN – Medium Term Note
REIT – Real Estate Investment Trust
SPDR – Standard & Poor’s Depositary Receipt
| | See accompanying notes which are an integral part of these financial statements. | 11 |
Preserver Alternative Opportunities Fund
Schedule of Securities Sold Short
August 31, 2020
| |
Shares
| | | Fair Value | |
Exchange-Traded Funds - Short — (1.03%) | | | | | | | | |
Invesco DB US Dollar Index Bullish Fund | | | (10,000 | ) | | $ | (249,000 | ) |
Total Exchange-Traded Funds - Short (Proceeds Received $260,362) | | | | | | $ | (249,000 | ) |
12 | See accompanying notes which are an integral part of these financial statements. | |
Preserver Alternative Opportunities Fund
Statement of Assets and Liabilities
August 31, 2020
Assets |
Investments in securities at fair value (cost $20,718,719) | | $ | 23,637,992 | |
Cash held at broker for option contract and securities sold short transactions | | | 784,885 | |
Receivable for fund shares sold | | | 1,592 | |
Dividends and interest receivable | | | 73,036 | |
Tax reclaims receivable | | | 8,647 | |
Prepaid expenses | | | 6,839 | |
Total Assets | | | 24,512,991 | |
Liabilities | | | | |
Investments in securities sold short at fair value (proceeds received $260,362) | | | 249,000 | |
Payable for fund shares redeemed | | | 655 | |
Payable to Adviser | | | 8,333 | |
Payable to Administrator | | | 5,916 | |
Payable to auditors | | | 17,700 | |
Other accrued expenses | | | 10,702 | |
Total Liabilities | | | 292,306 | |
Net Assets | | $ | 24,220,685 | |
Net Assets consist of: | | | | |
Paid-in capital | | | 20,185,951 | |
Accumulated earnings | | | 4,034,734 | |
Net Assets | | $ | 24,220,685 | |
Institutional Shares: | | | | |
Net Assets | | $ | 24,220,685 | |
Shares outstanding | | | 1,898,974 | |
Net asset value, offering and redemption price per share(a) | | $ | 12.75 | |
(a) | A 2.00% redemption fee is imposed upon shares redeemed within 60 calendar days of their purchase. |
| | See accompanying notes which are an integral part of these financial statements. | 13 |
Preserver Alternative Opportunities Fund
Statement of Operations
For the year ended August 31, 2020
Investment Income | | | | |
Dividend income (net of foreign taxes withheld of $7,882) | | $ | 179,222 | |
Interest income | | | 317,042 | |
Total investment income | | | 496,264 | |
Expenses | | | | |
Adviser | | | 165,742 | |
Audit and tax preparation | | | 25,450 | |
Administration | | | 23,333 | |
Fund accounting | | | 23,333 | |
Legal | | | 22,637 | |
Trustee | | | 14,797 | |
Transfer agent | | | 13,334 | |
Registration | | | 13,254 | |
Pricing | | | 12,580 | |
Printing | | | 12,072 | |
Custodian | | | 6,011 | |
Compliance services | | | 6,000 | |
Interest | | | 495 | |
Miscellaneous | | | 37,327 | |
Total expenses | | | 376,365 | |
Fees contractually waived by Adviser | | | (77,724 | ) |
Net operating expenses | | | 298,641 | |
Net investment income | | | 197,623 | |
Net Realized and Change in Unrealized Gain (Loss) on Investments | | | | |
Net realized gain (loss) on: | | | | |
Investment securities transactions | | | 1,135,052 | |
Securities sold short | | | 32,248 | |
Written options | | | 23,322 | |
Foreign currency translations | | | (13,188 | ) |
Change in unrealized appreciation (depreciation) on: | | | | |
Investment securities and foreign currency translations | | | 1,090,585 | |
Securities sold short | | | 11,362 | |
Written options | | | (1,682 | ) |
Net realized and change in unrealized appreciation (depreciation) on investments | | | 2,277,699 | |
Net increase in net assets resulting from operations | | $ | 2,475,322 | |
14 | See accompanying notes which are an integral part of these financial statements. | |
Preserver Alternative Opportunities Fund
Statements of Changes in Net Assets
| | For the
Year Ended
August 31, 2020 | | | For the
Year Ended
August 31, 2019 | |
Increase (Decrease) in Net Assets due to: | | | | | | | | |
Operations | | | | | | | | |
Net investment income | | $ | 197,623 | | | $ | 403,599 | |
Net realized gain (loss) on investment securities, securities sold short, written option transactions and foreign currency translations | | | 1,177,434 | | | | (275,950 | ) |
Net change in unrealized appreciation (depreciation) of investment securities, securities sold short, written options and foreign currency translations | | | 1,100,265 | | | | (149,262 | ) |
Net increase (decrease) in net assets resulting from operations | | | 2,475,322 | | | | (21,613 | ) |
Distributions to Shareholders from Earnings: | | | | | | | | |
Institutional Shares | | | (351,268 | ) | | | (684,723 | ) |
Retail Shares | | | — | | | | (90,512 | ) |
Total distributions | | | (351,268 | ) | | | (775,235 | ) |
Capital Transactions - Institutional Shares | | | | | | | | |
Proceeds from shares sold | | | 3,100,864 | | | | 2,064,416 | |
Reinvestment of distributions | | | 336,308 | | | | 633,107 | |
Shares issued in connection with class consolidation(b) | | | — | | | | 1,812,018 | |
Amount paid for shares redeemed | | | (2,581,178 | ) | | | (3,415,867 | ) |
Proceeds from redemption fees(a) | | | 119 | | | | 6 | |
Total Institutional Shares | | | 856,113 | | | | 1,093,680 | |
Capital Transactions - Retail Shares(b) | | | | | | | | |
Proceeds from shares sold | | | | | | | 338,262 | |
Reinvestment of distributions | | | | | | | 89,642 | |
Shares redeemed in connection with class consolidation | | | | | | | (1,812,018 | ) |
Amount paid for shares redeemed | | | | | | | (1,045,774 | ) |
Proceeds from redemption fees(a) | | | | | | | 43 | |
Total Retail Shares | | | | | | | (2,429,845 | ) |
Net increase (decrease) in net assets resulting from capital transactions | | | 856,113 | | | | (1,336,165 | ) |
Total Increase (Decrease) in Net Assets | | | 2,980,167 | | | | (2,133,013 | ) |
Net Assets | | | | | | | | |
Beginning of year | | | 21,240,518 | | | | 23,373,531 | |
End of year | | $ | 24,220,685 | | | $ | 21,240,518 | |
| | See accompanying notes which are an integral part of these financial statements. | 15 |
Preserver Alternative Opportunities Fund
Statements of Changes in Net Assets (continued)
| | For the
Year Ended
August 31, 2020 | | | For the
Year Ended
August 31, 2019 | |
Share Transactions - Institutional Shares | | | | | | | | |
Shares sold | | | 264,491 | | | | 185,627 | |
Shares redeemed in connection with class consolidation(b) | | | — | | | | 165,943 | |
Shares issued in reinvestment of distributions | | | 28,072 | | | | 63,311 | |
Shares redeemed | | | (222,068 | ) | | | (314,525 | ) |
Total Institutional Shares | | | 70,495 | | | | 100,356 | |
Share Transactions - Retail Shares(b) | | | | | | | | |
Shares sold | | | | | | | 30,977 | |
Shares issued in connection with class consolidation | | | | | | | (166,255 | ) |
Shares issued in reinvestment of distributions | | | | | | | 8,982 | |
Shares redeemed | | | | | | | (97,151 | ) |
Total Retail Shares | | | | | | | (223,447 | ) |
(a) | A 2.00% redemption fee is imposed upon shares redeemed within 60 calendar days of their purchase. |
(b) | Effective February 12, 2019, the outstanding Retail Shares of the Fund were exchanged for Institutional Shares. |
16 | See accompanying notes which are an integral part of these financial statements. | |
Preserver Alternative Opportunities Fund - Institutional Shares
Financial Highlights
(For a share outstanding during each period)
| | | For the
Year Ended
August 31,
2020 | | | For the
Year Ended
August 31,
2019 | | | For the
Year Ended
August 31,
2018 | | | For the
Year Ended
August 31,
2017 | | | For the
Period
Ended
August 31,
2016(a) | |
Selected Per Share Data | | | | | | | | | | | | | | | | | | | | |
Net asset value, at beginning of period | | $ | 11.62 | | | $ | 11.98 | | | $ | 11.65 | | | $ | 10.62 | | | $ | 10.00 | |
Income from investment operations: | | | | | | | | | | | | | | | | | | | | |
Net investment income | | | 0.10 | | | | 0.21 | | | | 0.16 | | | | 0.18 | | | | 0.07 | |
Net realized and unrealized gain (loss) on investments | | | 1.22 | | | | (0.17 | ) | | | 0.53 | | | | 1.08 | | | | 0.55 | |
Total from investment operations | | | 1.32 | | | | 0.04 | | | | 0.69 | | | | 1.26 | | | | 0.62 | |
Less distributions to shareholders from: | | | | | | | | | | | | | | | | | | | | |
Net investment income | | | (0.19 | ) | | | (0.06 | ) | | | (0.16 | ) | | | (0.22 | ) | | | — | |
Net realized gains | | | — | | | | (0.34 | ) | | | (0.20 | ) | | | (0.01 | ) | | | — | |
Total distributions | | | (0.19 | ) | | | (0.40 | ) | | | (0.36 | ) | | | (0.23 | ) | | | — | |
Net asset value, at end of period | | $ | 12.75 | | | $ | 11.62 | | | $ | 11.98 | | | $ | 11.65 | | | $ | 10.62 | |
Total Return(b) | | | 11.46 | % | | | 0.88 | % | | | 6.05 | % | | | 12.04 | % | | | 6.20 | %(c) |
| | | | | | | | | | | | | | | | | | | | | |
Ratios and Supplemental Data: | | | | | | | | | | | | | | | | | | | | |
Net assets, end of period (000 omitted) | | $ | 24,221 | | | $ | 21,241 | | | $ | 20,705 | | | $ | 16,022 | | | $ | 9,659 | |
Before waiver or recoupment: | | | | | | | | | | | | | | | | | | | | |
Ratio of expenses to average net assets | | | 1.70 | % | | | 1.66 | % | | | 1.72 | % | | | 2.02 | % | | | 2.92 | %(d) |
After waiver or recoupment: | | | | | | | | | | | | | | | | | | | | |
Ratio of expenses to average net assets | | | 1.35 | % | | | 1.48 | % | | | 1.75 | % | | | 1.75 | % | | | 1.75 | %(d) |
Ratio of net investment income to average net assets | | | 0.90 | % | | | 1.96 | % | | | 1.25 | % | | | 1.62 | % | | | 1.44 | %(d) |
Portfolio turnover rate | | | 86 | % | | | 56 | % | | | 68 | % | | | 72 | % | | | 20 | %(c) |
(a) | For the period March 1, 2016 (commencement of operations) to August 31, 2016. |
(b) | Total return in the above table represents the rate that the investor would have earned or lost on an investment in the Fund, assuming reinvestment of distributions. Excludes redemption fee. |
| | See accompanying notes which are an integral part of these financial statements. | 17 |
Preserver Alternative Opportunities Fund
Notes to the Financial Statements
August 31, 2020
NOTE 1. ORGANIZATION
The Preserver Alternative Opportunities Fund (the “Fund”) was organized as a diversified series of Capitol Series Trust (the “Trust”) on September 16, 2015. The Trust is an open end investment company established under the laws of Ohio by an Agreement and Declaration of Trust dated September 18, 2013 (the “Trust Agreement”). The Trust Agreement permits the Board of Trustees of the Trust (the “Board”) to issue an unlimited number of shares of beneficial interest of separate series without par value. The Fund is one of a series of funds currently authorized by the Board. The Fund’s investment adviser is Preserver Partners, LLC (the “Adviser”). The investment objective of the Fund is to seek current income and capital appreciation with low volatility compared to the major equity and fixed income markets.
The Fund currently offers Institutional Shares. The Fund commenced operations on March 1, 2016. A 2.00% redemption fee is imposed on shares redeemed within 60 days of purchase. Effective on the close of business on February 12, 2019, Retail Shares were consolidated into Institutional Shares. Each share represents an equal proportionate interest in the assets and liabilities belonging to the Fund and is entitled to such dividends and distributions out of income belonging to the Fund as declared by the Board.
NOTE 2. SIGNIFICANT ACCOUNTING POLICIES
The Fund is an investment company and follows accounting and reporting guidance under Financial Accounting Standards Board Accounting Standards Codification (“ASC”) Topic 946, “Financial Services-Investment Companies.” The following is a summary of significant accounting policies followed by the Fund in the preparation of its financial statements. These policies are in conformity with generally accepted accounting principles in the United States of America (“GAAP”).
Estimates – The preparation of financial statements in conformity with GAAP requires management to make estimates and assumptions that affect the reported amounts of assets and liabilities and disclosure of contingent assets and liabilities at the date of the financial statements and the reported amounts of increases and decreases in net assets from operations during the reporting period. Actual results could differ from those estimates.
Foreign Currency Translation – The accounting records of the Fund are maintained in U.S. dollars. Foreign currency amounts are translated into U.S. dollars at the current rate of exchange each business day to determine the value of investments, and other assets and liabilities. Purchases and sales of foreign securities, and income and expenses, are translated at the prevailing rate of exchange on the respective date of these transactions. The Fund does not isolate that portion of the results of operations resulting from changes in foreign exchange rates on investments from fluctuation arising from changes in market prices of securities held. These fluctuations are included with the unrealized gain or loss from investments.
18
Preserver Alternative Opportunities Fund
Notes to the Financial Statements (continued)
August 31, 2020
Federal Income Taxes – The Fund makes no provision for federal income or excise tax. The Fund has qualified and intends to qualify each year as a regulated investment company (“RIC”) under subchapter M of the Internal Revenue Code of 1986, as amended, by complying with the requirements applicable to RICs and by distributing substantially all of its taxable income. The Fund also intends to distribute sufficient net investment income and net realized capital gains, if any, so that it will not be subject to excise tax on undistributed income and gains. If the required amount of net investment income or gains is not distributed, the Fund could incur a tax expense.
The Fund may be subject to taxes imposed by countries in which it invests. Such taxes are generally based on income and/or capital gains earned or repatriated. Taxes are accrued and applied to net investment income, net realized gains and unrealized appreciation as such income and/or gains are earned.
The Fund recognizes tax benefits or expenses of uncertain tax positions only when the position is “more likely than not” to be sustained assuming examination by tax authorities. Management of the Fund has reviewed tax positions taken in tax years that remain subject to examination by all major tax jurisdictions, including federal (i.e., the previous three tax year ends and the interim tax period since then, as applicable) and has concluded that no provision for unrecognized tax benefits or expenses is required in these financial statements and does not expect this to change over the next twelve months. The Fund recognizes interest and penalties, if any, related to unrecognized tax benefits as income tax expense in the Statement of Operations. During the period, the Fund did not incur any interest or penalties.
Expenses – Expenses incurred by the Trust that do not relate to a specific fund of the Trust are allocated to the individual funds based on each fund’s relative net assets or another appropriate basis (as determined by the Board).
Security Transactions and Related Income – Throughout the reporting period, security transactions are accounted for no later than one business day following the trade date. For financial reporting purposes, security transactions are accounted for on trade date on the last business day of the reporting period. The specific identification method is used for determining gains or losses for financial statements and income tax purposes. Dividend income is recorded on the ex-dividend date and interest income is recorded on an accrual basis. Dividend income from real estate investment trusts (REITs) and distributions from limited partnerships are recognized on the ex-date and included in dividend income. The calendar year-end classification of distributions received from REITs, which may include return of capital, during the fiscal year are reported subsequent to year end; accordingly, the Fund estimates the character of REIT distributions based on the most recent information available. Income or loss from limited partnerships is reclassified among the components of net assets upon receipt of K-1’s. Discounts and premiums on fixed income securities purchased are amortized or accreted over the life of the respective securities using the
19
Preserver Alternative Opportunities Fund
Notes to the Financial Statements (continued)
August 31, 2020
effective interest method. Withholding taxes on foreign dividends, if any, have been recorded for in accordance with the Fund’s understanding of the applicable country’s tax rules and rates.
Dividends and Distributions – The Fund intends to distribute its net investment income and net realized long-term and short-term capital gains, if any, at least annually. Dividends and distributions to shareholders, which are determined in accordance with income tax regulations, are recorded on the ex-dividend date. The treatment for financial reporting purposes of distributions made to shareholders during the period from net investment income or net realized capital gains may differ from their ultimate treatment for federal income tax purposes. These differences are caused primarily by differences in the timing of the recognition of certain components of income, expense or realized capital gain for federal income tax purposes. Where such differences are permanent in nature, they are reclassified among the components of net assets based on their ultimate characterization for federal income tax purposes. Any such reclassifications will have no effect on net assets, results of operations or net asset value (“NAV”) per share of the Fund.
For the fiscal year ended August 31, 2020, the Fund made the following reclassifications to increase (decrease) the components of net assets:
Paid-In Capital | Accumulated Earnings
(Deficit) |
$17,962 | $(17,962) |
Short Selling – The Fund may make short sales of securities. In a short sale, the Fund sells a security, which it does not own, in anticipation of a decline in the market value of the security. To complete the sale, the Fund must borrow the security (generally from the broker through which the short sale is made) in order to make delivery to the buyer. The Fund is then obligated to replace the security borrowed by purchasing it at the market price at the time of replacement. The Fund is said to have a “short position” in the securities sold until it delivers them to the broker. The period during which the Fund has a short position can range from as little as one day to more than a year. Until the security is replaced, the proceeds of the short sale are retained by the broker, and the Fund is required to pay to the broker a negotiated portion of any dividends or interest which accrue during the period of the loan.
Short sales by the Fund create opportunities to increase the Fund’s return but, at the same time, involve specific risk considerations and may be considered a speculative technique. Since the Fund, in effect, profits from a decline in the price of the securities sold short without the need to invest the full purchase price of the securities on the date of the short sale, the Fund’s NAV per share will tend to increase more when the securities it has sold short decrease in value, and decrease more when the securities it has sold short increase in value, than would otherwise be the case if it had not engaged in such short sales. The
20
Preserver Alternative Opportunities Fund
Notes to the Financial Statements (continued)
August 31, 2020
amount of any gain will be decreased, and the amount of any loss increased, by the amount of any premium, dividends, or interest the Fund may be required to pay in connection with the short sale. Furthermore, under adverse market conditions, the Fund might have difficulty purchasing securities to meet its short sale delivery obligations, and might have to sell portfolio securities to raise the capital necessary to meet its short sale obligations at a time when fundamental investment considerations would not favor such sales. Short sales may involve additional transactions costs and other expenses that may exceed the return on the position, which may cause the Fund to lose money.
The Fund is required to maintain a segregated account on the books of its custodian in an amount that, when combined with the amount of collateral deposited with the broker in connection with the short sale, equals the current market value of the security sold short. This segregation will not limit the Fund’s exposure to loss, and the Fund may incur investment risk with respect to the segregated assets to the extent that, but for the applicable segregation requirement, the Fund would sell the segregated assets. If the Fund does not maintain a segregated account, the Fund will “cover” the short sale by owning a call option on the shorted security with a strike price no higher than the price at which the security was sold short. The amount of restricted cash or cash equivalents held at the broker as collateral for securities sold short was $784,885 as of August 31, 2020.
Restricted and Illiquid Securities – Restricted securities are any securities which are subject to restriction on resale under federal securities law, including commercial paper issued in reliance on the exemption from registration afforded by Section 4(2) of Rule 144A under the Securities Act of 1933 (“1933 Act”) and loan participations, and interests in investment companies that are not registered under the Investment Company Act of 1940 (“1940 Act”) (each a “Private Fund”). Illiquid securities are those that may not reasonably be expected to be sold or disposed of in current market conditions in seven calendar days or less without the conversion to cash significantly changing the market value of the investment. The Fund intends to treat interests in Private Funds as illiquid securities. The Fund will not invest greater than 15% of its net assets in illiquid securities.
As of August 31, 2020, the Fund held illiquid securities representing 3.09% of net assets.
NOTE 3. DERIVATIVE TRANSACTIONS
The Fund may engage in options transactions, which are sometimes characterized as derivative transactions. The Fund uses derivative instruments for any purpose consistent with its investment objective, such as for hedging or obtaining market exposure. The Fund also may use derivative instruments to obtain market exposure (that is, for speculative purposes rather than hedging). The Adviser may establish a position in the derivatives market as a substitute for buying, selling, or holding certain securities. The use of derivative instruments may provide a less expensive, more expedient or more specifically focused way to invest than traditional securities would.
21
Preserver Alternative Opportunities Fund
Notes to the Financial Statements (continued)
August 31, 2020
Purchased/Written Option Contracts – The Fund may write or purchase option contracts to adjust risk and return of its overall investment positions. When the Fund writes or purchases an option, an amount equal to the premium received or paid by the Fund is recorded as a liability or an asset and is subsequently adjusted to the current market value of the option written or purchased. Premiums received or paid from writing or purchasing options that expire unexercised are treated by the Fund on the expiration date as realized gains or losses. The difference between the premium and the amount paid or received on affecting a closing purchase or sale transaction, including brokerage commissions, is also treated as a realized gain or loss. If an option is exercised, the premium paid or received is added to or subtracted from the cost of the purchase or proceeds from the sale in determining whether the Fund has realized a gain or loss on investment transactions. Investing in purchased and written options contracts exposes a Fund to equity price risk. The Fund did not hold any written options as of August 31, 2020.
The following table identifies the effect of derivative instruments on the Statement of Operations for the fiscal year ended August 31, 2020.
For the fiscal year ended August 31, 2020:
Derivatives | Location of Gain (Loss) on
Derivatives on Statement of
Operations | | Realized Gain
(Loss) on
Derivatives | | | Change in
Unrealized
Appreciation
(Depreciation)
on Derivatives | |
Equity Price Risk: | | | | | | | | | |
Options written | Net realized gain and change in unrealized appreciation (depreciation) on written options | | $ | 23,322 | | | $ | (1,682 | ) |
The following summarizes the average ending monthly fair value of derivatives outstanding during the fiscal year ended August 31, 2020:
Derivatives | | Average Market
Value | |
Options Written | | $ | (1,592 | ) |
The average monthly market value generally represents the Fund’s derivative activity throughout the period.
NOTE 4. SECURITIES VALUATION AND FAIR VALUE MEASUREMENTS
Fair value is defined as the price that the Fund would receive upon selling an investment in a timely transaction to an independent buyer in the principal or most advantageous market of the investment. GAAP establishes a three-tier hierarchy to maximize the use of observable market data and minimize the use of unobservable inputs and to establish classification of fair value measurements for disclosure purposes.
22
Preserver Alternative Opportunities Fund
Notes to the Financial Statements (continued)
August 31, 2020
Inputs refer broadly to the assumptions that market participants would use in pricing the asset or liability, including assumptions about risk (the risk inherent in a particular valuation technique used to measure fair value including a pricing model and/or the risk inherent in the inputs to the valuation technique). Inputs may be observable or unobservable. Observable inputs are inputs that reflect the assumptions market participants would use in pricing the asset or liability developed based on market data obtained and available from sources independent of the reporting entity. Unobservable inputs are inputs that reflect the reporting entity’s own assumptions about the assumptions market participants would use in pricing the asset or liability developed based on the best information available in the circumstances.
Various inputs are used in determining the value of the Fund’s investments. These inputs are summarized in the three broad levels listed below.
| | ● | Level 1 – unadjusted quoted prices in active markets for identical investments and/or registered investment companies where the value per share is determined and published and is the basis for current transactions for identical assets or liabilities at the valuation date |
| | ● | Level 2 – other significant observable inputs (including, but not limited to, quoted prices for an identical security in an inactive market, quoted prices for similar securities, interest rates, prepayment speeds, credit risk, etc.) |
| | ● | Level 3 – significant unobservable inputs (including the Fund’s own assumptions in determining fair value of investments based on the best information available) |
The inputs used to measure fair value may fall into different levels of the fair value hierarchy. In such cases, for disclosure purposes, the level in the fair value hierarchy which is reported, is determined based on the lowest level input that is significant to the fair value measurement in its entirety.
In computing the NAV of the Fund, fair value is based on market valuations with respect to portfolio securities for which market quotations are readily available. Pursuant to Board approved policies, the Fund relies on independent third-party pricing services to provide the current market value of securities. Those pricing services value equity securities, including exchange-traded funds, exchange-traded notes, closed-end funds and preferred stocks, traded on a securities exchange at the last reported sales price on the principal exchange. Equity securities quoted by NASDAQ are valued at the NASDAQ Official Closing Price. If there is no reported sale on the principal exchange, equity securities are valued at the mean between the most recent quoted bid and asked price. When using the market quotations or close prices provided by the pricing service and when the market is considered active, the security will be classified as a Level 1 security. Investments in open-end mutual funds, including money market mutual funds, are generally priced at the ending NAV provided by the pricing service of the funds and are generally categorized as Level 1 securities. Debt securities are valued using evaluated prices furnished by a pricing vendor selected by the Board and are generally classified as Level 2 securities.
23
Preserver Alternative Opportunities Fund
Notes to the Financial Statements (continued)
August 31, 2020
Option contracts are generally traded on an exchange and are generally valued at the last quoted sales price. If there is no such reported sale on the valuation date, long positions are valued at the most recent bid price, and short positions are valued at the most recent ask price. The option contracts will generally be categorized as Level 1 securities unless the market is considered inactive or the absence of a last bid or ask price, in which case, they will be categorized as Level 2 securities.
In the event that market quotations are not readily available, the Adviser determines that the market quotation or the price provided by the pricing service does not accurately reflect the current fair value, or certain restricted or illiquid securities are being valued, such securities are valued as determined in good faith by the Trust’s Valuation Committee, based on recommendations from a pricing committee comprised of certain officers of the Trust, certain employees of the Fund’s administrator, and representatives of the Adviser (together the “Pricing Review Committee”). These securities will be classified as Level 2 or 3 within the fair value hierarchy, depending on the inputs used.
Private Funds will be fair valued using the NAV as practical expedient, as provided by the Private Fund’s investment adviser or third party administrator. The fair value of the Fund’s investment in the Private Fund generally represents the amount the Fund would expect to receive if it were to liquidate its investment in the Private Fund. The Private Fund holds certain positions in non-marketable investments that are valued at estimated fair value, which may differ significantly from the values that would have been used had a ready market existed for these investments. All underlying investments held in the Private Fund are valued in accordance with the policies and procedures established by such Private Fund.
The Adviser will consider whether it is appropriate, in light of the relevant circumstances, to value shares at NAV as reported by the Private Fund for valuation purposes, or whether to adjust such reported value to reflect an adjusted fair value. In determining fair values as of August 31, 2020, the Adviser has, as a practical expedient, estimated fair value of the Private Fund using the NAV (or its equivalent) provided by the investment adviser or third party administrator of the Private Fund as of that date. All investments for which fair value is measured using the Private Fund’s net asset value as a practical expedient are not required to be included within the fair value hierarchy. Accordingly, Private Funds with a fair value of $748,485 was valued at its respective net asset value as of August 31, 2020, and is excluded from the fair value hierarchy.
The Fund’s interests in a Private Fund are also illiquid and subject to substantial restrictions on transferability. The Fund may not be able to acquire initial or additional interests in a Private Fund or withdraw all or a portion of its investment from a Private Fund promptly after it has made a decision to do so because of limitations set forth in that Private Fund’s governing documents.
24
Preserver Alternative Opportunities Fund
Notes to the Financial Statements (continued)
August 31, 2020
In accordance with the Trust’s Portfolio Valuation Procedures, the Pricing Review Committee, in making its recommendations with the Adviser’s participation, is required to consider all appropriate factors relevant to the value of securities for which it has determined other pricing sources are not available or reliable as described above. No single standard exists for determining fair value, because fair value depends upon the circumstances of each individual case. As a general principle, the current fair value of an issue of securities being valued pursuant to the Trust’s Fair Value Guidelines would be the amount which the Fund might reasonably expect to receive for them upon their current sale. Methods which are in accordance with this principle may, for example, be based on (i) a multiple of earnings; (ii) a discount from market prices of a similar freely traded security (including a derivative security or a basket of securities traded on other markets, exchanges or among dealers); or (iii) yield to maturity with respect to debt issues, or a combination of these and other methods. Fair value pricing is permitted if, in accordance with the Trust’s Portfolio Valuation Procedures, the validity of market quotations appears to be questionable based on factors such as evidence of a thin market in the security based on a small number of quotations, a significant event occurs after the close of a market but before the Fund’s NAV calculation that may affect a security’s value, or other data calls into question the reliability of market quotations.
The following is a summary of the inputs used to value the Fund’s investments as of August 31, 2020:
| | | Valuation Inputs | | | | | |
Assets | | Level 1 | | | Level 2 | | | Level 3 | | | Total | |
Common Stocks | | $ | 11,615,103 | | | $ | — | | | $ | — | | | $ | 11,615,103 | |
Preferred Stocks | | | 1,967,841 | | | | — | | | | — | | | | 1,967,841 | |
Closed End Funds | | | 381,920 | | | | — | | | | — | | | | 381,920 | |
Exchange-Traded Funds | | | 1,335,009 | | | | — | | | | — | | | | 1,335,009 | |
Corporate Bonds | | | — | | | | 3,691,600 | | | | — | | | | 3,691,600 | |
U.S. Treasury Obligations | | | — | | | | 2,504,114 | | | | — | | | | 2,504,114 | |
Collateralized Mortgage Obligations | | | — | | | | 495,083 | | | | — | | | | 495,083 | |
Convertible Corporate Bonds | | | — | | | | 127,663 | | | | — | | | | 127,663 | |
Money Market Funds | | | 771,174 | | | | — | | | | — | | | | 771,174 | |
Total | | $ | 16,071,047 | | | $ | 6,818,460 | | | $ | — | | | $ | 22,889,507 | |
Assets excluded from fair value hierarchy* | | | | | | | | | | | | | | $ | 748,485 | |
Total | | | | | | | | | | | | | | $ | 23,637,992 | |
* | The investment in the Private Fund is measured at fair value using the net asset value per share (or its equivalent) practical expedient and has not been classified in the fair value hierarchy. The fair value amounts presented in this table are intended to permit reconciliation of the fair value hierarchy to the amounts presented in the statement of assets and liabilities. |
25
Preserver Alternative Opportunities Fund
Notes to the Financial Statements (continued)
August 31, 2020
| | | Valuation Inputs | | | | | |
Liabilities | | Level 1 | | | Level 2 | | | Level 3 | | | Total | |
Exchange-Traded Funds | | $ | (249,000 | ) | | $ | — | | | $ | — | | | $ | (249,000 | ) |
Total | | $ | (249,000 | ) | | $ | — | | | $ | — | | | $ | (249,000 | ) |
NOTE 5. FEES AND OTHER TRANSACTIONS WITH AFFILIATES AND OTHER SERVICE PROVIDERS
Under the terms of the investment advisory agreement (the “Agreement”), the Adviser manages the Fund’s investments subject to approval of the Board. As compensation for its management services, the Fund is obligated to pay the Adviser a fee computed and accrued daily and paid monthly at an annual rate of 0.75% of the Fund’s average daily net assets. For the fiscal year ended August 31, 2020, the Adviser earned fees of $165,742 from the Fund. At August 31, 2020, the Fund owed the Adviser $8,333 in accordance with the expense limitation agreement described below.
The Adviser has contractually agreed to waive its management fee and/or reimburse expenses so that total annual operating expenses (excluding (i) interest; (ii) taxes; (iii) brokerage fees and commissions; (iv) other extraordinary expenses not incurred in the ordinary course of the Fund’s business; (v) dividend expenses on short sales; (vi) expenses incurred under a Rule 12b-1 plan of distribution; and (vii) indirect expenses such as acquired fund fees and expenses) do not exceed 1.35% of the Fund’s average daily net assets through December 31, 2020 (“Expense Limitation”). During any fiscal year that the Agreement between the Adviser and the Trust is in effect, the Adviser may recoup the sum of all fees previously waived or expenses reimbursed, less any reimbursement previously paid, provided that the Adviser is only permitted to recoup fees or expenses within 36 months from the date the fee waiver or expense reimbursement took effect and provided further that such recoupment can be achieved within the Expense Limitation currently in effect and the Expense Limitation in place when the waiver/reimbursement occurred. This expense cap agreement may be terminated by the Board at any time. As of August 31, 2020, the Adviser may seek repayment of investment advisory fee waivers and expense reimbursements in the amount as follows:
Recoverable through | | | |
August 31, 2022 | | $ | 33,930 | |
August 31, 2023 | | | 77,724 | |
The Trust retains Ultimus Asset Services, LLC (the “Administrator”) to provide the Fund with administration, accounting, transfer agent and compliance services, including all regulatory reporting. For the fiscal year ended August 31, 2020, the Administrator earned
26
Preserver Alternative Opportunities Fund
Notes to the Financial Statements (continued)
August 31, 2020
fees of $23,333 for administration services, $13,334 for transfer agent services, $23,333 for fund accounting services and $6,000 for compliance services. At August 31, 2020, the Fund owed the Administrator $5,916 for such services.
The Board supervises the business activities of the Trust. Each Trustee serves as a Trustee for the lifetime of the Trust or until the earlier of his or her retirement as a Trustee at age 78 (which may be extended for up to two years in an emeritus non-voting capacity at the pleasure and request of the Board), or until he/she dies, resigns, or is removed, whichever is sooner. “Independent Trustees,” meaning those Trustees who are not “interested persons” of the Trust, as defined in the Investment Company Act of 1940 (“1940 Act”), as amended, has received an annual retainer of $500 per Fund and $500 per Fund for each quarterly in-person Board meeting. Effective January 1, 2020, the annual retainer increased to $1,000 per Fund. In addition, each Independent Trustee may be compensated for preparation related to and participation in any special meetings of the Board and/or any Committee of the Board, with such compensation determined on a case-by-case basis based on the length and complexity of the meeting. The Trust also reimburses Trustees for out-of-pocket expense incurred in conjunction with attendance at Board meetings.
The officers and one trustee of the Trust are employees of the Administrator. Ultimus Fund Distributors, LLC (the “Distributor”) acts as the principal distributor of the Fund’s shares. The Distributor is a wholly-owned subsidiary of the Administrator.
NOTE 6. PURCHASES AND SALES OF SECURITIES
For the fiscal year ended August 31, 2020, purchases and sales of investment securities, other than short-term investments, were $16,767,644 and $17,249,362, respectively.
Purchases and sales of long-term U.S. Government obligations during the fiscal year ended August 31, 2020 were $741,811 and $0, respectively.
NOTE 7. FEDERAL TAX INFORMATION
At August 31, 2020, the net unrealized appreciation (depreciation) and tax cost of investments for tax purposes was as follows:
Gross unrealized appreciation | | $ | 3,366,754 | |
Gross unrealized depreciation | | | (453,536 | ) |
Net unrealized appreciation/(depreciation) on investments | | | 2,913,218 | |
Tax cost of investments and securities sold short | | $ | 20,475,774 | |
27
Preserver Alternative Opportunities Fund
Notes to the Financial Statements (continued)
August 31, 2020
The tax character of distributions paid for the fiscal years ended August 31, 2020 and August 31, 2019 were as follows:
| | 2020 | | | 2019 | |
Distributions paid from: | | | | | | | | |
Ordinary income(a) | | $ | 351,268 | | | $ | 398,284 | |
Long-term capital gains | | | — | | | | 376,951 | |
Total distributions paid | | $ | 351,268 | | | $ | 775,235 | |
(a) | Short-term capital gain distributions are treated as ordinary income for tax purposes. |
At August 31, 2020, the components of accumulated earnings (deficit) on a tax basis were as follows:
Undistributed ordinary income | | $ | 163,550 | |
Undistributed long-term capital gains | | | 957,819 | |
Unrealized appreciation on investments(a) | | | 2,913,365 | |
Total accumulated earnings | | $ | 4,034,734 | |
(a) | The difference between book basis and tax basis unrealized appreciation (depreciation) is primarily attributable to the mark-to-market adjustments on passive foreign investment companies, the tax treatment of return of capital adjustments and interest accruals on complex securities. |
NOTE 8. COMMITMENTS AND CONTINGENCIES
The Trust indemnifies its officers and Trustees for certain liabilities that may arise from their performance of their duties to the Trust or the Fund. Additionally, in the normal course of business, the Trust enters into contracts that contain a variety of representations and warranties which provide general indemnifications. The Trust’s maximum exposure under these arrangements is unknown, as this would involve future claims that may be made against the Trust that have not yet occurred.
NOTE 9. SUBSEQUENT EVENTS
Management of the Fund has evaluated the need for disclosures and/or adjustments resulting from subsequent events through the date at which these financial statements were issued. Based upon this evaluation, management has determined there were no items requiring adjustment of the financial statements or additional disclosure.
28
Preserver Alternative Opportunities Fund
Notes to the Financial Statements (continued)
August 31, 2020
NOTE 10. LIQUIDITY RISK MANAGEMENT PROGRAM (Unaudited)
The Fund has adopted and implemented a written liquidity risk management program (the “Program”) as required by Rule 22e-4 (the “Liquidity Rule”) under the 1940 Act. The Program is reasonably designed to assess and manage the Fund’s liquidity risk, taking into consideration, among other factors, the Fund’s investment strategy and the liquidity of its portfolio investments during normal and reasonably foreseeable stressed conditions; its short and long-term cash flow projections; and its cash holdings and access to other funding sources. The Board approved the appointment of the Liquidity Administrator Committee, comprising certain Trust officers and employees of the Adviser. The Liquidity Administrator Committee maintains Program oversight and reports to the Board on at least an annual basis regarding the Program’s operational effectiveness through a written report (the “Report”). The Program’s initial Report, which was presented to the Board for consideration at its meeting held on September 8, 2020, outlined the operation of the Program and the adequacy and effectiveness of the Program’s implementation. During the review period, the Fund did not experience unusual stress or disruption to its operations related to purchase and redemption activity. Also, during the review period the Fund held adequate levels of cash and highly liquid investments to meet shareholder redemption activities in accordance with applicable requirements. The Report concluded that the Program is reasonably designed to prevent violation of the Liquidity Rule and has been effectively implemented.
29
Report of Independent Registered Public Accounting Firm
To the Shareholders and the Board of Trustees of Preserver Alternative Opportunities Fund
Opinion on the Financial Statements
We have audited the accompanying statement of assets and liabilities of Preserver Alternative Opportunities Fund (the “Fund”) (one of the funds constituting Capitol Series Trust (the “Trust”)), including the schedule of investments and the schedule of securities sold short as of August 31, 2020, and the related statement of operations for the year then ended, the statements of changes in net assets for each of the two years in the period then ended, the financial highlights for each of the four years in the period then ended and the related notes (collectively referred to as the “financial statements”). In our opinion, the financial statements present fairly, in all material respects, the financial position of the Fund (one of the funds constituting Capitol Series Trust) at August 31, 2020, the results of its operations for the year then ended, the changes in its net assets for each of the two years in the period then ended and its financial highlights for each of the four years in the period then ended, in conformity with U.S. generally accepted accounting principles.
The financial highlights for the period from March 1, 2016 (commencement of operations) to August 31, 2016 were audited by other auditors whose report, dated October 26, 2016, expressed an unqualified opinion on those financial highlights.
Basis for Opinion
These financial statements are the responsibility of the Trust’s management. Our responsibility is to express an opinion on the Fund’s financial statements based on our audits. We are a public accounting firm registered with the Public Company Accounting Oversight Board (United States) (“PCAOB”) and are required to be independent with respect to the Trust in accordance with the U.S. federal securities laws and the applicable rules and regulations of the Securities and Exchange Commission and the PCAOB.
We conducted our audits in accordance with the standards of the PCAOB. Those standards require that we plan and perform the audit to obtain reasonable assurance about whether the financial statements are free of material misstatement, whether due to error or fraud. The Trust is not required to have, nor were we engaged to perform, an audit of Trust’s internal control over financial reporting. As part of our audit we are required to obtain an understanding of internal control over financial reporting but not for the purpose of expressing an opinion on the effectiveness of the Trust’s internal control over financial reporting. Accordingly, we express no such opinion.
30
Report of Independent Registered Public Accounting Firm
(Continued)
Our audits included performing procedures to assess the risks of material misstatement of the financial statements, whether due to error or fraud, and performing procedures that respond to those risks. Such procedures included examining, on a test basis, evidence regarding the amounts and disclosures in the financial statements. Our procedures included confirmation of securities owned as of August 31, 2020, by correspondence with the custodian and brokers. Our audits also included evaluating the accounting principles used and significant estimates made by management, as well as evaluating the overall presentation of the financial statements. We believe that our audits provide a reasonable basis for our opinion.

We have served as the auditor of one or more Capitol Series Trust investment companies since 2017.
Cincinnati, Ohio
October 27, 2020
31
Summary of Fund Expenses (Unaudited)
As a shareholder of the Fund, you incur two types of costs: (1) transaction and (2) ongoing costs, including management fees and other Fund expenses. These examples are intended to help you understand your ongoing costs (in dollars) of investing in the Fund and to compare these costs with the ongoing costs of investing in other mutual funds. The example is based on an investment of $1,000 invested at the beginning of the period and held for the entire period from March 1, 2020 through August 31, 2020.
Actual Expenses
The first line of the table for each class provides information about actual account values and actual expenses. You may use the information in these lines, together with the amount you invested, to estimate the expenses that you paid over the period. Simply divide your account value by $1,000 (for example, an $8,600 account value divided by $1,000 = 8.60), then multiply the result by the number in the first line under the heading “Expenses Paid During Period” to estimate the expenses you paid on your account during this period.
Hypothetical Example for Comparison Purposes
The second line of the table for each class provides information about hypothetical account values and hypothetical expenses based on the Fund’s actual expense ratios and an assumed rate of return of 5% per year before expenses, which is not the Fund’s actual return. The hypothetical account values and expenses may not be used to estimate the actual ending account balances or expenses you paid for the period. You may use this information to compare the ongoing costs of investing in the Fund and other funds. To do so, compare this 5% hypothetical example with the 5% hypothetical examples that appear in the shareholder reports of other funds.
Expenses shown in the table are meant to highlight your ongoing costs only and do not reflect any transactional costs. Therefore, the second line of the table below is useful in comparing ongoing costs only and will not help you determine the relative costs of owning different funds. In addition, if transaction costs were included, your costs would have been higher.
| | | Beginning
Account Value
March 1,
2020 | Ending
Account Value
August 31,
2020 | Expenses
Paid During
Period(a) | Annualized
Expense
Ratio |
Preserver Alternative Opportunities Fund | | | |
Institutional Class | Actual | $ 1,000.00 | $ 1,081.40 | $ 7.11 | 1.36% |
| | | | | | |
| | Hypothetical(b) | $ 1,000.00 | $ 1,018.30 | $ 6.90 | 1.36% |
(a) | Expenses are equal to the Fund’s annualized expense ratios, multiplied by the average account value over the period, multiplied by 184/366 (to reflect the one-half year period). |
(b) | Hypothetical assumes 5% annual return before expenses. |
32
Additional Federal Income Tax Information (Unaudited)
The Form 1099-DIV you receive in January 2021 will show the tax status of all distributions paid to your account in calendar year 2020. Shareholders are advised to consult their own tax adviser with respect to the tax consequences of their investment in the Fund. As required by the Internal Revenue Code and/or regulations, shareholders must be notified regarding the status of qualified dividend income for individuals and the dividends received deduction for corporations.
Qualified Dividend Income. The Fund designates approximately 64% or up to the maximum amount of such dividends allowable pursuant to the Internal Revenue Code, as qualified dividend income eligible for a reduced tax rate.
Qualified Business Income. The Fund designates approximately 8% of its ordinary income dividends, or up to the maximum amount of such dividends allowable pursuant to the Internal Revenue Code, as qualified business income.
Dividends Received Deduction. Corporate shareholders are generally entitled to take the dividends received deduction on the portion of the Fund’s dividend distribution that qualifies under tax law. For the Fund’s calendar year 2020 ordinary income dividends, 52% qualifies for the corporate dividends received deduction.
33
Trustees and Officers (Unaudited)
The Board supervises the business activities of the Trust and is responsible for protecting the interests of shareholders. The Chairman of the Board is Walter B. Grimm, who is an Independent Trustee of the Trust.
Each Trustee serves as a Trustee for the lifetime of the Trust or until the earlier of his or her retirement as a Trustee at age 78, death, resignation or removal. Officers are re-elected annually by the Board. The address of each Trustee and officer is 225 Pictoria Drive, Suite 450, Cincinnati, Ohio 45246.
As of the date of this report, the Trustees oversee the operations of 14 series.
Interested Trustee Background. The following table provides information regarding the Interested Trustee.
Name, (Age), Position with Trust,
Term of Position with Trust | Principal Occupation During
Past 5 Years and Other Directorships |
Robert G. Dorsey* Birth Year: 1957 TRUSTEE Began Serving: March 2017 | Principal Occupation(s): Vice Chairman of Ultimus Fund Solutions, LLC and its subsidiaries, except as otherwise noted for the FINRA-regulated broker-dealer entities (February 2019 to present); Interested Trustee of Ultimus Managers Trust (February 2012 to present). Previous Position(s): Managing Director and Co-Chief Executive Officer of Ultimus Fund Solutions, LLC (1999 to February 2019); President of Ultimus Fund Distributors, LLC (1999 to 2018); President of Ultimus Managers Trust (February 2012 to October 2013). |
* | Mr. Dorsey is considered an “interested person” of the Trust within the meaning of Section 2(a)(19) of the 1940 Act because of his relationship with the Trust’s administrator, transfer agent, and distributors. |
Independent Trustee Background. The following table provides information regarding the Independent Trustees.
Name, (Age), Position with Trust,
Term of Position with Trust | Principal Occupation During
Past 5 Years and Other Directorships |
John C. Davis Birth Year: 1952 TRUSTEE Began Serving: July 2018 | Previous Position(s): Retired Partner of PricewaterhouseCoopers LLP (1974-2010); Consultant, Board of Trustees of Ultimus Managers Trust (2016 to 2019) and Former Trustee of Ultimus Managers Trust (2012 to 2016). |
Walter B. Grimm Birth Year: 1945 TRUSTEE AND CHAIR Began Serving: November 2013 | Principal Occupations(s): President, Leigh Management Group, LLC (consulting firm) (October 2005 to present); and President, Leigh Investments, Inc. (1988 to present). |
34
Trustees and Officers (Unaudited) (continued)
Name, (Age), Position with Trust,
Term of Position with Trust | Principal Occupation During
Past 5 Years and Other Directorships |
Lori Kaiser Birth Year: 1963 TRUSTEE Began Serving: July 2018 | Principal Occupations(s): Founder and CEO, Kaiser Consulting since 1992. |
Janet Smith Meeks Birth Year: 1955 TRUSTEE Began Serving: July 2018 | Principal Occupations(s): Co-Founder and CEO, Healthcare Alignment Advisors, LLC (consulting company) since August 2015. Previous Position(s): President and Chief Operating Officer, Mount Carmel St. Ann’s Hospital (2006 to 2015). |
Mary M. Morrow Birth Year: 1958 TRUSTEE Began Serving: November 2013 | Principal Occupations(s): Chief Operating Officer, Dignity Health Managed Services Organization (October 2018 to present). Previous Position(s): Consultant (managed care services) (April 2018 to September 2018); Chief Operating Officer, Pennsylvania Health and Wellness (fully owned subsidiary of Centene Corporation) (November 2016 to April 2018); Vice President, Strategic Initiatives, Gateway Heath (January 2015 to November 2016); Consulting Practice Manager, DST Health Solutions (August 2010 to January 2015). |
Officers. The following table provides information regarding the Officers.
Name, (Age), Position with Trust,
Term of Position with Trust | Principal Occupation During
Past 5 Years and Other Directorships |
Matthew J. Miller Birth Year: 1976 PRESIDENT and CHIEF EXECUTIVE OFFICER Began Serving: September 2013 (as VP); September 2018 (as President) | Principal Occupation(s): Assistant Vice President, Relationship Management, Ultimus Fund Solutions, LLC (December 2015 to present); Vice President, Valued Advisers Trust (December 2011 to present). Previous Position(s): Vice President, Relationship Management, Huntington Asset Services, Inc. (n/k/a Ultimus Asset Services, LLC) (2008 to December 2015). |
35
Trustees and Officers (Unaudited) (continued)
Name, (Age), Position with Trust,
Term of Position with Trust | Principal Occupation During
Past 5 Years and Other Directorships |
Zachary P. Richmond Birth Year: 1980 TREASURER AND CHIEF FINANCIAL OFFICER Began Serving: August 2014 | Principal Occupation(s): Vice President, Director of Financial Administration for Ultimus Fund Solutions, LLC (February 2019 to present). Previous Position(s): Assistant Vice President, Associate Director of Financial Administration for Ultimus Fund Solutions, LLC (December 2015 to February 2019); Manager, Fund Administration, Huntington Asset Services, Inc. (January 2011 to December 2015). |
Martin R. Dean Birth Year: 1963 CHIEF COMPLIANCE OFFICER Began Serving: May 2019 | Principal Occupation(s): Senior Vice President, Head of Fund Compliance, Ultimus Fund Solutions, LLC (since January 2016), Chief Compliance Officer, First Western Funds Trust (since April 2016); Chief Compliance Officer, Cross Shore Discovery Fund (since June 2016);Chief Compliance Officer, FSI Low Beta Absolute Return Fund (since November 2016); Chief Compliance Officer, Peachtree Alternative Strategies Fund (since January 2017); and Chief Compliance Officer, Dupree Mutual Funds (since August 2017). Previous Position(s): Interim Chief Compliance Officer, Valued Advisers Trust (May 2019 to March 2020); Chief Compliance Officer, Fenimore Asset Management Trust (May 2019 to February 2020); and Senior Vice President and Compliance Group Manager, Huntington Asset Services, Inc. (July 2013 to December 2015). |
Matthew J. Beck Birth Year: 1988 SECRETARY Began Serving: September 2018 | Principal Occupation(s): Senior Attorney, Ultimus Fund Solutions, LLC (since May 2018) and Secretary, Ultimus Managers Trust (since July 2018). Previous Position(s): Chief Compliance Officer, OBP Capital, LLC (May 2015 to May 2018); Secretary, Aspiration Funds (March 2015 to May 2018); Secretary, Starboard Investment Trust (September 2014 to May 2018); Secretary, Leeward Investment Trust (September 2014 to May 2018); Secretary, Hillman Capital Management Investment Trust (September 2014 to May 2018); Secretary, Spinnaker ETF Series (September 2014 to May 2018); Vice President and General Counsel, The Nottingham Company (July 2014 to May 2018). |
36
Approval of Investment Advisory Agreement (Unaudited)
At a quarterly meeting of the Board of Trustees of Capitol Series Trust (“Trust”) held on June 10 - 11, 2020, the Trust’s Board of Trustees (the “Board”), including all of the Trustees who are not “interested persons” of the Trust as that term is defined in Section 2(a)(19) of the Investment Company Act of 1940, as amended (the “1940 Act”) (the “Independent Trustees”), considered and approved the continuation for an additional one-year period of the Investment Advisory Agreement between the Trust and Preserver Partners, LLC (“Preserver”) (the “Investment Advisory Agreement”) with respect to the Preserver Alternative Opportunities Fund (the “Preserver Fund”), a series of the Trust.
Prior to the meeting, the Trustees received and considered information from Preserver and the Trust’s administrator designed to provide the Trustees with the information necessary to evaluate the terms of the proposed renewal of the Investment Advisory Agreement between the Trust and Preserver, including, but not limited to: Preserver’s response to counsel’s due diligence letter requesting information relevant to renewal of the Investment Advisory Agreement; the operating expense limitation agreement currently in effect between Preserver and the Preserver Fund (the “Expense Limitation Agreement”); and Morningstar peer group expense and performance data for comparative purposes (the “Support Materials”). At various times, the Trustees reviewed the Support Materials with Preserver, with Trust management, and with counsel to the Independent Trustees. The Trustees noted the completeness of the Support Materials provided by Preserver, which included both responses and materials provided in response to initial and supplemental due diligence requests. The Support Materials, together with the information provided to and reviewed by the Board on a quarterly basis throughout the year, formed the primary, but not exclusive, basis for the Board’s determinations.
Before voting to approve the renewal of the Investment Advisory Agreement, the Trustees reviewed the terms and the form of Investment Advisory Agreement and the Support Materials with Trust management and with counsel to the Independent Trustees. The Trustees received and discussed a memorandum from such counsel delineating the legal standards governing their consideration of the renewal of the Investment Advisory Agreement, which memorandum described the various factors that the U.S. Courts and the U.S. Securities and Exchange Commission (“SEC”) over the years have suggested would be appropriate for trustee consideration, including the factors outlined in Gartenberg v. Merrill Lynch Asset Management Inc., 694 F.2d 923, 928 (2d Cir. 1982); cert. denied sub. nom. and Andre v. Merrill Lynch Ready Assets Trust, Inc., 461 U.S. 906 (1983). Representatives from Preserver also met with the Trustees and provided additional information to the Trustees regarding its services to the Preserver Fund, including but not limited to, information regarding its investment philosophy, the firm’s compliance culture, the ownership structure of Preserver, Preserver’s financial condition as reflected in its financial statements, the fund expenses that Preserver subsidizes, the resources that Preserver dedicates to servicing the Preserver Fund, Preserver’s profitability with respect to the Preserver Fund, Preserver’s marketing and distribution activities, succession planning, Preserver’s future plans with regard to the Preserver Fund, and other benefits that Preserver derives from its relationship with the Preserver Fund, among other topics.
37
In determining whether to approve the renewal of the Investment Advisory Agreement, the Trustees considered all factors they believed relevant, including the following, with respect to the Preserver Fund: (1) the nature, extent, and quality of the services provided by Preserver with respect to the Preserver Fund; (2) the cost of the services to be provided and the profits and losses realized by Preserver from services rendered to the Trust with respect to the Preserver Fund; (3) comparative fee and expense data for the Preserver Fund and other investment companies or institutional accounts with similar investment objectives; (4) the extent to which economies of scale would be realized as the Preserver Fund grows, and whether the advisory fees for the Fund reflect such economies of scale for the Preserver Fund’s benefit; and (5) other financial benefits to Preserver resulting from services rendered to the Preserver Fund. In their deliberations, the Trustees did not identify any particular information that was all-important or controlling.
After having received and reviewed the Support Materials, as well as quarterly investment performance, compliance, operating, and distribution reports on the Preserver Fund over an extended time period, the Trustees discussed the facts and factors relevant to their consideration of the continuation of the Investment Advisory Agreement, which incorporated and reflected their knowledge of Preserver’s ongoing services to the Preserver Fund since the Fund’s inception. Taking such information into account, the Board considered whether the overall arrangements between the Trust and Preserver as set forth in the Investment Advisory Agreement, including the investment advisory fees that the Preserver Fund pays to Preserver, continue to be fair and reasonable in light of the services Preserver performs, as well as such other matters as the Trustees considered relevant in the exercise of their reasonable business judgment. After reviewing the Support Materials and considering other information provided to the Board during the course of the year, the Board determined that it had all the information it deemed reasonably necessary to make an informed decision about the approval of the continuation of the Investment Advisory Agreement. The material factors and conclusions that formed the basis of the Trustees’ determination to approve the continuation of the Investment Advisory Agreement are summarized below.
Nature, Extent and Quality of Services Provided. The Trustees considered the scope of services that Preserver provides under the Investment Advisory Agreement, noting that such services include, but are not limited to, the following: (1) investing the Preserver Fund’s assets consistent with the Fund’s investment objective and investment policies; (2) determining the portfolio securities to be purchased, sold or otherwise disposed of and the timing of such transactions; (3) voting all proxies with respect to the Preserver Fund’s portfolio securities; (4) maintaining the required books and records for transactions that Preserver effects on behalf of the Fund; and (5) selecting broker-dealers to execute orders on behalf of the Preserver Fund. The Trustees also noted that Preserver performs certain distribution, marketing and compliance services for the Preserver Fund, including, but not limited to, exploring its efforts to host a conference for other investment advisors in Preserver’s locale in order to generate interest in the Preserver Fund. The Trustees considered Preserver’s capitalization and its assets under management, noting that Preserver’s assets under management, number of accounts, and the Preserver Fund’s assets under management have decreased, but also noting that Preserver had provided reasonable
38
explanations for such decreases. The Trustees further considered the investment philosophy and experience of the portfolio management team. The Trustees also noted the Preserver Fund’s performance compared to its prospectus benchmark. The Trustees considered that the Preserver Fund outperformed its current benchmark, the Wilshire Liquid Alternative Index for the one-year, three-year, and since inception periods ended March 31, 2020. The Trustees also considered the Preserver Fund’s performance compared to the 50% - 70% Equity Morningstar peer group category and the Adviser’s custom peer group. They noted that the Preserver Fund outperformed the median and average of the Morningstar peer group for the one- and three-year period ended March 31, 2020. They further noted that the Preserver Fund outperformed the average of its custom peer group for the one-year period ended March 31, 2020, outperformed the median and average of the peer group for the three-year period ended March 31, 2020, and underperformed the median of the Morningstar peer group for the one-year period ended March 31, 2020. The Trustees noted that the Morningstar 50% - 70% Equity peer group comparative data was filtered to include funds with a similar asset size to that of the Preserver Fund, and discussed the appropriateness of such a comparison. The Trustees concluded that they are satisfied with the nature, extent and quality of services that Preserver provides to the Preserver Fund under the Investment Advisory Agreement.
Cost of Advisory Services and Profitability. The Trustees considered the annual management fee that the Preserver Fund pays to Preserver under the Investment Advisory Agreement, as well as Preserver’s profitability from the services that it renders to the Fund. The Trustees further considered that Preserver has contractually agreed to reduce its management fees and, if necessary, reimburse the Preserver Fund for operating expenses, as specified in the Fund’s prospectus and Expense Limitation Agreement. The Trustees discussed Preserver’s ownership structure and overall financial condition, as well as the Preserver Fund’s profitability to the Adviser. In that regard, the Trustees noted that the Adviser had contractually agreed to waive its management fee and/or reimburse expenses so that the total operating expenses of the Preserver Fund did not exceed 1.35%. The Trustees noted that with this expense ratio cap in place, the Adviser had realized only a small profit from its management of the Preserver Fund in 2019. Based on all these factors, the Trustees concluded that both Preserver’s historical profitability and its projected profitability with respect to the Preserver Fund are reasonable.
Comparative Fee and Expense Data. The Trustees noted that Preserver charges a lower fee to the Preserver Fund than it charges to the private funds it manages. The Trustees further noted that those private funds have similar investment objectives to the Preserver Fund, but different portfolio compositions. The Trustees also observed that the Preserver Fund’s gross management fee of 0.75% is in line with the median and above the average management fee reported for the Fund’s 50% - 70% Equity Morningstar peer group. With respect to the Adviser’s custom peer group, the Trustees noted that the Preserver Fund’s gross management fee is below the average and median of the peer group. The Trustees also considered that the Preserver Fund’s total net expense ratio (after waivers and expense reimbursements) of 1.48% is above the average and median total net expense ratio reported for the 50% - 70% Equity Morningstar peer group and the custom peer group. They further noted that the Preserver Fund’s gross expense ratio is higher than the average and median gross expense
39
ratio reported for the 50% - 70% Equity Morningstar peer group and the median of the custom peer group, but is lower than the average gross expense ratio for the custom peer group. The Trustees also considered that the Morningstar peer group comparisons included in the Support Materials were based upon funds in the 50% - 70% Equity peer group with similar net asset levels of under $50 million, and discussed the appropriateness of such comparisons. The Trustees considered that even though the Preserver Fund’s total net expense ratio (after waivers and expense reimbursements) is above the average and median total net expense ratio reported for the 50% - 70% Equity Morningstar peer group and the Adviser’s custom peer group, Preserver is not unjustly enriched. While recognizing that it is difficult to compare advisory fees because the scope of advisory services provided may vary from one investment adviser to another, the Trustees concluded that Preserver’s advisory fee continues to be reasonable.
Economies of Scale. The Trustees considered whether the Preserver Fund may benefit from any economies of scale, but did not find that any material economies exist at this time. The Trustees noted that the advisory fees charged by Preserver does not contain any fee breakpoints, but concluded, due to the Preserver Fund’s asset size, that it is not necessary to consider the implementation of fee breakpoints at this time. In addition, the Board considered the fee structures of the Preserver Fund’s various service providers, noting that the Preserver Fund likely will not benefit from any economies of scale until fund assets increase.
Other Benefits. The Trustees also considered the extent to which Preserver utilizes soft dollar arrangements with respect to portfolio transactions, and noted that Preserver does not utilize such arrangements in connection with the execution of client transactions, and that affiliated brokers are not utilized to execute the portfolio transactions of the Preserver Fund. The Trustees concluded that, all things considered, Preserver will not receive additional material financial benefits from services rendered to the Preserver Fund. The Trustees also noted that Preserver does not have any affiliates that could directly or indirectly benefit from the Preserver Fund. The Trustees also considered the Adviser’s representation that its relationship with the Preserver Fund had a positive impact on the Adviser by providing greater exposure to a wider group of investors, including retail investors, because investment minimums are lower than for other Preserver products, investor financial requirements are eliminated, and daily liquidity is offered.
Based upon Preserver’s presentation to the Board and the Support Materials considered in connection with the continuation of the Investment Advisory Agreement, as well as the information provided throughout the course of the year, the Board concluded that the overall arrangements between the Trust and Preserver, as set forth in the Investment Advisory Agreement between the Trust and Preserver, are fair and reasonable in light of the services to be performed, investment advisory fees to be paid and such other matters as the Trustees considered relevant in the exercise of their reasonable judgment.
40
FACTS | WHAT DOES PRESERVER ALTERNATIVE OPPORTUNITIES FUND (THE “Fund”) DO WITH YOUR PERSONAL INFORMATION? |
| | |
Why? | Financial companies choose how they share your personal information. Federal law gives consumers the right to limit some but not all sharing. Federal law also requires us to tell you how we collect, share, and protect your personal information. Please read this notice carefully to understand what we do. |
| | |
What? | The types of personal information we collect and share depend on the product or service you have with us. This information can include: ● Social Security number ● account balances and account transactions ● transaction or loss history and purchase history ● checking account information and wire transfer instructions When you are no longer our customer, we continue to share your information as described in this notice. |
| | |
How? | All financial companies need to share customers’ personal information to run their everyday business. In the section below, we list the reasons financial companies can share their customers’ personal information; the reasons the Fund chooses to share; and whether you can limit this sharing. |
| | |
Reasons we can share your personal information | Does the Fund share? |
For our everyday business purposes—
such as to process your transactions, maintain your account(s), respond to court orders and legal investigations, or report to credit bureaus | Yes |
For our marketing purposes—
to offer our products and services to you | No |
For joint marketing with other financial companies | No |
For our affiliates’ everyday business purposes—
information about your transactions and experiences | No |
For our affiliates’ everyday business purposes—
information about your creditworthiness | No |
For nonaffiliates to market to you | No |
| | |
Questions? | Call (844) 838-2119 |
41
Who we are |
Who is providing this notice? | Preserver Alternative Opportunities Fund
Ultimus Fund Distributors, LLC(Distributor)
Ultimus Fund Solutions, LLC (Administrator) |
What we do |
How does the Fund protect my personal information? | To protect your personal information from unauthorized access and use, we use security measures that comply with federal law. These measures include computer safeguards and secured files and buildings. Our service providers are held accountable for adhering to strict policies and procedures to prevent any misuse of your nonpublic personal information. |
How does the Fund collect my personal information? | We collect your personal information, for example, when you ● open an account or deposit money ● buy securities from us or sell securities to us ● make deposits or withdrawals from your account or provide account information ● give us your account information ● make a wire transfer ● tell us who receives the money ● tell us where to send the money ● show your government-issued ID ● show your driver’s license |
Why can’t I limit all sharing? | Federal law gives you the right to limit only ● sharing for affiliates’ everyday business purposes—information about your creditworthiness ● affiliates from using your information to market to you ● sharing for nonaffiliates to market to you State laws and individual companies may give you additional rights to limit sharing. |
Definitions |
Affiliates | Companies related by common ownership or control. They can be financial and nonfinancial companies. ● Preserver Partners, LLC, the investment adviser to the Fund, could be deemed to be an affiliate. |
Nonaffiliates | Companies not related by common ownership or control. They can be financial and nonfinancial companies. ● The Fund does not share your personal information with nonaffiliates so they can market to you |
Joint marketing | A formal agreement between nonaffiliated financial companies that together market financial products or services to you. ● The Fund doesn’t jointly market. |
42
This page is intentionally left blank.
This page is intentionally left blank.
This page is intentionally left blank.
Other Information
The Fund’s Statement of Additional Information (“SAI”) includes additional information about the trustees and is available without charge, upon request. You may call toll-free at (844) 838-2119 to request a copy of the SAI or to make shareholder inquiries.
Proxy Voting
A description of the policies and procedures that the Fund uses to determine how to vote proxies relating to portfolio securities and information regarding how the Fund voted those proxies during the most recent twelve month period ended June 30, are available (1) without charge upon request by calling the Fund at (844) 838-2119 and (2) in Fund documents filed with the Securities and Exchange Commission (“SEC”) on the SEC’s website at www.sec.gov.
TRUSTEES
Walter B. Grimm, Chairman
John C. Davis
Robert G. Dorsey
Lori Kaiser
Janet Smith Meeks
Mary M. Morrow
OFFICERS
Matthew J. Miller, Chief Executive Officer
and President
Zachary P. Richmond, Chief Financial Officer and Treasurer
Martin R. Dean, Chief Compliance Officer
Matthew J. Beck, Secretary
INVESTMENT ADVISER
Preserver Partners, LLC
425 Madison Avenue
Memphis, TN 38103
DISTRIBUTOR
Ultimus Fund Distributors, LLC
225 Pictoria Drive, Suite 450
Cincinnati, OH 45246
INDEPENDENT REGISTERED PUBLIC ACCOUNTING FIRM
Ernst & Young LLP
221 East 4th Street, Suite 2900
Cincinnati, OH 45202
LEGAL COUNSEL
Bernstein Shur
100 Middle Street, 6th Floor
Portland, ME 04104
CUSTODIAN
Huntington National Bank
41 South High Street
Columbus, OH 43215
ADMINISTRATOR, TRANSFER AGENT AND FUND ACCOUNTANT
Ultimus Fund Solutions, LLC
225 Pictoria Drive, Suite 450
Cincinnati, OH 45246
This report is intended only for the information of shareholders or those who have received the Fund’s prospectus which contains information about the Fund’s management fee and expenses. Please read the prospectus carefully before investing.
Distributed by Ultimus Fund Distributors, LLC
Member FINRA/SIPC

Cornerstone Capital Access Impact Fund
Institutional Shares – CCIIX
Annual Report
August 31, 2020
Beginning on January 1, 2021, as permitted by regulations adopted by the Securities and Exchange Commission, paper copies of the Fund’s shareholder reports like this one will no longer be sent by mail, unless you specifically request paper copies of the reports from the Fund or from your financial intermediary such as a broker-dealer or bank. Instead, the reports will be made available on a website, and you will be notified by mail each time a report is posted and provided with a website link to access the report.
If you already elected to receive shareholder reports electronically, you will not be affected by this change and you need not take any action. You may elect to receive shareholder reports and other communications from the Fund electronically by contacting the Fund at (800) 986-6187 or, if you own these shares through a financial intermediary, you may contact your financial intermediary.
You may elect to receive all future reports in paper free of charge. You can inform the Fund that you wish to continue receiving paper copies of your shareholder reports by contacting the Fund at (800) 986-6187. If you own shares through a financial intermediary, you may contact your financial intermediary or follow instructions included with this document to elect to continue to receive paper copies of your shareholder reports. Your election to receive reports in paper will apply to all funds held with the fund complex or at your financial intermediary.
Cornerstone Capital, Inc.
550 Fifth Avenue, 11th Floor
New York, NY 10036
Telephone: (212) 874-7400
Shareholder Letter (Unaudited) | September 17, 2020 |
Dear Shareholders,
We are pleased to present you with our inaugural Annual Report for the Cornerstone Capital Access Impact Fund (“CCIIX” or “Fund”). The report encompasses performance from the Fund’s inception on November 13, 2019 (commencement of Fund operations) through August 31, 2020, the Fund’s fiscal year end.
The time period covered includes the COVID-19 pandemic, which continues to ravage the world with over 200,000 deaths in the U.S. alone. That said, we are pleased with how CCIIX has performed during this unprecedented time of significant market volatility. For the period from January 1, 2020 through August 31, 2020, the Fund had returned 27.91% vs. the benchmark MSCI All-Country World Index’s (“MSCI ACWI”) return of 4.75%. Return since inception was 35.20% compared to 9.49% for the benchmark. Performance benefitted from the Fund’s overweight position to Technology names, many of which outperformed as lockdown dragged on, and from the underweight to Energy stocks, which suffered extreme shocks during March due to a combined impact of the virus and a price war between Saudi Arabia and Russia. Three out of the four sub-advisers outperformed the MSCI ACWI by at least 1,000 basis points (10%) year to date.
We also completed our first Impact Assessment during 2020 using Cornerstone Capital Inc.’s proprietary Access Impact Framework(a). Overall CCIIX scored the second highest impact level available, comparing favorably to many of the peers we have analyzed using the framework. The two Access themes with the strongest alignment were Access to Fair Treatment and Equal Opportunity, and Access to Telecom Systems. The four sub-advisers in the Fund also scored well in terms of their own environmental, social and governance (ESG) and diversity profiles, with three of the sub-advisers engaging significantly with the companies in which they invest to improve those companies’ sustainability profiles.
We continue to invest with the dual mandate of earning a strong return for our investors while simultaneously generating impact through our investments, and we are confident that the performance in our first year demonstrates our ability to do just that. We look forward to working together with our valued shareholders for many years to come.
Best regards,
Erika Karp and Jennifer Leonard
Cornerstone Capital, Inc.
(a) | Access Impact Framework analyzes the impact generated by investments in terms of the United Nations Sustainable Development Goals (“SDGs”), using eleven “access themes” - investable concepts that relate concrete business activity to the high-level SDGs. For example, investments that broaden access to healthcare services or access to education align in support of Gender Equality (SDG 5) and Good Health & Well-Being (SDG 3). |
1
Investment Results (Unaudited)
Total Returns(a) as of August 31, 2020
| | Since Inception
(11/13/2019) |
Cornerstone Capital Access Impact Fund | |
Institutional Class | 35.20% |
MSCI All Country World Index(b) | 9.49% |
| | Expense Ratios(c) |
| | Institutional
Class |
Gross | 2.47% |
With Applicable Waivers | 1.35% |
The performance quoted represents past performance, which does not guarantee future results. The investment return and principal value of an investment will fluctuate so that an investor’s shares, when redeemed, may be worth more or less than their original cost. The returns shown do not reflect deduction of taxes that a shareholder would pay on Cornerstone Capital Access Impact Fund (the “Fund”) distributions or the redemption of Fund shares. Current performance of the Fund may be lower or higher than the performance quoted. The Fund’s investment objectives, risks, charges and expenses must be considered carefully before investing. Performance data current to the most recent month end may be obtained by calling (800) 986-6187.
(a) Return figures reflect any change in price per share and assume the reinvestment of all distributions. The Fund’s returns reflect any fee reductions during the applicable period and exclude the redemption fee. If such fee reductions had not occurred, the quoted performance would have been lower. Total returns for periods less than one year are not annualized.
(b) The MSCI All Country World Index (“Index”) is a widely followed, unmanaged group of stocks from 23 international markets and is not available for purchase. Investments in foreign securities involve risks that may be different from those of U.S. securities. Diversification does not ensure a profit or guarantee against loss. The Index returns assume reinvestment of all distributions and do not reflect the deduction of taxes and fees Individuals cannot invest directly in the Index.
(c) The expense ratios are from in the Fund’s prospectus dated October 1, 2019, and were based on estimated amounts for the current fiscal year. Cornerstone Capital Inc., the Fund’s investment adviser (the “Adviser”), has contractually agreed to waive its management fee and/or reimburse expenses so that total annual operating expenses for the Fund (excluding (i) interest; (ii) taxes; (iii) brokerage fees and commissions; (iv) other extraordinary expenses not incurred in the ordinary course of the Fund’s business; (v) dividend expense on short sales; and (vi) indirect expenses such as acquired fund fees and expenses) do not exceed 1.35% of the average daily net assets of the Fund through December 31, 2022 (the “Expense Limitation”). The Expense Limitation is expected to continue from year to year thereafter. During any fiscal year that the Investment Advisory Agreement (the “Advisory Agreement”) between the Adviser and Capitol Series Trust (the “Trust”) is in effect, the Adviser may recoup the sum of all fees previously waived or expenses reimbursed, less any reimbursement previously paid, provided that the Adviser is only permitted to recoup fees or expenses within 36 months from the date the fee waiver or expense reimbursement first occurred and provided further that such recoupment can be achieved within the Expense Limitation Agreement currently in effect and the Expense Limitation Agreement in place when the waiver/reimbursement occurred. This Expense Limitation Agreement may not be terminated by the Adviser prior to its expiration date, but the Board of Trustees may terminate such agreement at any time. The Expense Limitation Agreement terminates automatically upon the termination of the Advisory Agreement with the Adviser. Additional information pertaining to the Fund’s expense ratios as of August 31, 2020, can be found in the financial highlights.
The Fund’s investment objectives, strategies, risks, charges and expenses must be considered carefully before investing. The prospectus contains this and other important information about the Fund and may be obtained by calling the same number as above. Please read it carefully before investing.
The Fund is distributed by Ultimus Fund Distributors, LLC, member FINRA/SIPC.
2
Investment Results (Unaudited) (continued)
Comparison of the Growth of a $10,000 Investment in the
Cornerstone Capital Access Impact Fund - Institutional Class
and the MSCI All Country World Index.
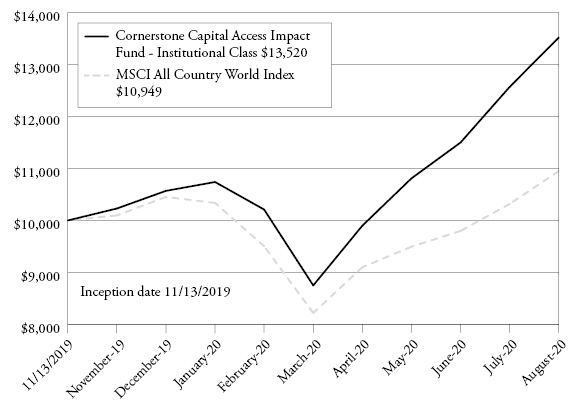
The chart above assumes an initial investment of $10,000 made on November 13, 2019 (commencement of operations) and held through August 31, 2020. THE FUND’S RETURNS REPRESENT PAST PERFORMANCE AND DO NOT GUARANTEE FUTURE RESULTS. The returns shown do not reflect deduction of taxes that a shareholder would pay on the Fund’s distributions or the redemption of the Fund’s shares. Investment returns and principal values will fluctuate so that your shares, when redeemed, may be worth more or less than their original purchase price.
Current performance may be lower or higher than the performance data quoted. For more information on the Fund, and to obtain performance data current to the most recent month-end, or to request a prospectus, please call (800) 986-6187. You should carefully consider the investment objectives, potential risks, management fees, and charges and expenses of the Fund before investing. The Fund’s prospectus contains this and other information about the Fund, and should be read carefully before investing.
The Fund is distributed by Ultimus Fund Distributors, LLC, Member FINRA/SIPC.
3
Portfolio Illustration (Unaudited)
August 31, 2020
The following chart gives a visual breakdown of the Fund’s holdings as a percentage of net assets.
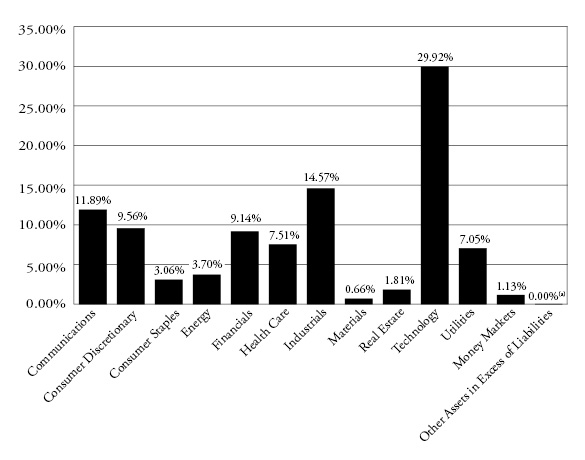
(a) | Rounds to less than 0.005% |
Availability of Portfolio Schedule (Unaudited)
The Fund files its complete schedule of portfolio holdings with the Securities and Exchange Commission (“SEC”) for the first and third quarters of each fiscal year as an exhibit to its reports on Form N-PORT. The Fund’s Form N-PORT reports are available on the SEC’s website at http://www.sec.gov.
4
Cornerstone Capital Access Impact Fund
Schedule of Investments
August 31, 2020
| | Shares | | | Fair Value | |
COMMON STOCKS — 98.87% | | | | | | | | |
Argentina — 1.70% | | | | | | | | |
Consumer Discretionary — 1.70% | | | | | | | | |
MercadoLibre, Inc.(a) | | | 110 | | | $ | 128,545 | |
| | | | | | | | | |
Australia — 0.60% | | | | | | | | |
Health Care — 0.31% | | | | | | | | |
CSL Ltd. | | | 109 | | | | 22,993 | |
| | | | | | | | | |
Technology — 0.29% | | | | | | | | |
Atlassian Corp. PLC, Class A(a) | | | 115 | | | | 22,052 | |
Total Australia | | | | | | | 45,045 | |
| | | | | | | | | |
Austria — 0.33% | | | | | | | | |
Industrials — 0.33% | | | | | | | | |
Andritz AG | | | 745 | | | | 24,922 | |
| | | | | | | | | |
Belgium — 0.24% | | | | | | | | |
Technology — 0.24% | | | | | | | | |
Materialise NV - ADR(a) | | | 440 | | | | 17,890 | |
| | | | | | | | | |
Brazil — 0.51% | | | | | | | | |
Consumer Staples — 0.30% | | | | | | | | |
Raia Drogasil S.A. | | | 1,139 | | | | 22,581 | |
| | | | | | | | | |
Utilities — 0.21% | | | | | | | | |
Cia de Saneamento de Minas Gerais S.A. | | | 1,800 | | | | 15,636 | |
Total Brazil | | | | | | | 38,217 | |
| | | | | | | | | |
Canada — 0.92% | | | | | | | | |
Communications — 0.39% | | | | | | | | |
Shopify, Inc., Class A(a) | | | 28 | | | | 29,859 | |
| | | | | | | | | |
Energy — 0.22% | | | | | | | | |
Canadian Solar, Inc.(a) | | | 510 | | | | 16,570 | |
| | | | | | | | | |
Industrials — 0.20% | | | | | | | | |
Stantec, Inc. | | | 472 | | | | 15,328 | |
| | | | | | | | | |
Technology — 0.11% | | | | | | | | |
Sierra Wireless, Inc.(a) | | | 645 | | | | 7,998 | |
Total Canada | | | | | | | 69,755 | |
| | See accompanying notes which are an integral part of these financial statements. | 5 |
Cornerstone Capital Access Impact Fund
Schedule of Investments (continued)
August 31, 2020
| | Shares | | | Fair Value | |
COMMON STOCKS — (continued) | | | | | | | | |
Cayman Islands — 0.15% | | | | | | | | |
Utilities — 0.15% | | | | | | | | |
Consolidated Water Co. Ltd. | | | 962 | | | $ | 11,573 | |
| | | | | | | | | |
China — 7.02% | | | | | | | | |
Communications — 2.09% | | | | | | | | |
Baidu, Inc. - ADR(a) | | | 115 | | | | 14,326 | |
Tencent Holdings Ltd. - ADR | | | 1,401 | | | | 95,744 | |
Tencent Holdings Ltd. | | | 700 | | | | 47,915 | |
| | | | | | | | 157,985 | |
Consumer Discretionary — 3.26% | | | | | | | | |
Alibaba Group Holding Ltd. - ADR(a) | | | 350 | | | | 100,460 | |
JD.com, Inc. - ADR(a) | | | 309 | | | | 24,300 | |
Kandi Technologies Corp.(a) | | | 1,110 | | | | 7,470 | |
Meituan Dianping(a) | | | 2,674 | | | | 88,188 | |
Pinduoduo, Inc. - ADR(a) | | | 290 | | | | 25,792 | |
| | | | | | | | 246,210 | |
Energy — 0.58% | | | | | | | | |
Daqo New Energy Corp. - ADR(a) | | | 260 | | | | 29,331 | |
JinkoSolar Holding Co. Ltd. - ADR(a) | | | 650 | | | | 14,846 | |
| | | | | | | | 44,177 | |
Financials — 0.81% | | | | | | | | |
ZhongAn Online P&C Insurance Co. Ltd.(a) | | | 9,230 | | | | 60,797 | |
| | | | | | | | | |
Technology — 0.28% | | | | | | | | |
Yeahka Ltd.(a) | | | 3,200 | | | | 21,512 | |
Total China | | | | | | | 530,681 | |
| | | | | | | | | |
Denmark — 0.97% | | | | | | | | |
Energy — 0.97% | | | | | | | | |
Vestas Wind Systems A/S | | | 324 | | | | 49,262 | |
Vestas Wind Systems A/S - ADR | | | 480 | | | | 24,178 | |
Total Denmark | | | | | | | 73,440 | |
| | | | | | | | | |
Finland — 0.12% | | | | | | | | |
Industrials — 0.12% | | | | | | | | |
Uponor Oyj | | | 531 | | | | 9,325 | |
| | | | | | | | | |
France — 3.38% | | | | | | | | |
Consumer Staples — 0.58% | | | | | | | | |
Danone S.A. | | | 372 | | | | 24,454 | |
Danone S.A. - ADR | | | 1,470 | | | | 19,213 | |
| | | | | | | | 43,667 | |
6 | See accompanying notes which are an integral part of these financial statements. | |
Cornerstone Capital Access Impact Fund
Schedule of Investments (continued)
August 31, 2020
| | Shares | | | Fair Value | |
COMMON STOCKS — (continued) | | | | | | | | |
France — (continued) | | | | | | | | |
Industrials — 0.77% | | | | | | | | |
Schneider Electric SE | | | 467 | | | $ | 57,804 | |
| | | | | | | | | |
Technology — 0.22% | | | | | | | | |
Dassault Systemes SE - ADR | | | 90 | | | | 16,990 | |
| | | | | | | | | |
Utilities — 1.81% | | | | | | | | |
Suez Environnement S.A. | | | 2,622 | | | | 45,374 | |
Veolia Environnement S.A. | | | 3,798 | | | | 91,528 | |
| | | | | | | | 136,902 | |
Total France | | | | | | | 255,363 | |
| | | | | | | | | |
Germany — 1.61% | | | | | | | | |
Communications — 0.23% | | | | | | | | |
Deutsche Telekom AG - ADR | | | 1,000 | | | | 17,620 | |
| | | | | | | | | |
Consumer Discretionary — 0.58% | | | | | | | | |
adidas AG(a) | | | 144 | | | | 43,740 | |
| | | | | | | | | |
Health Care — 0.19% | | | | | | | | |
Siemens Healthineers AG - ADR | | | 620 | | | | 14,119 | |
| | | | | | | | | |
Industrials — 0.33% | | | | | | | | |
Norma Group SE | | | 780 | | | | 25,181 | |
| | | | | | | | | |
Technology — 0.28% | | | | | | | | |
Infineon Technologies AG - ADR | | | 760 | | | | 21,074 | |
Total Germany | | | | | | | 121,734 | |
| | | | | | | | | |
Hong Kong — 2.03% | | | | | | | | |
Financials — 0.68% | | | | | | | | |
AIA Group Ltd. | | | 5,000 | | | | 51,483 | |
| | | | | | | | | |
Utilities — 1.35% | | | | | | | | |
Beijing Enterprises Water Group Ltd.(a) | | | 64,000 | | | | 25,186 | |
China Everbright International Ltd. | | | 44,000 | | | | 26,570 | |
China Water Affairs Group Ltd. | | | 34,000 | | | | 27,988 | |
Guangdong Investment Ltd.(a) | | | 14,000 | | | | 21,858 | |
| | | | | | | | 101,602 | |
Total Hong Kong | | | | | | | 153,085 | |
| | See accompanying notes which are an integral part of these financial statements. | 7 |
Cornerstone Capital Access Impact Fund
Schedule of Investments (continued)
August 31, 2020
| | Shares | | | Fair Value | |
COMMON STOCKS — (continued) | | | | | | | | |
India — 1.03% | | | | | | | | |
Financials — 1.03% | | | | | | | | |
HDFC Bank Ltd. - ADR(a) | | | 1,575 | | | $ | 78,120 | |
| | | | | | | | | |
Indonesia — 0.60% | | | | | | | | |
Financials — 0.60% | | | | | | | | |
Bank Central Asia Tbk PT | | | 21,000 | | | | 45,141 | |
| | | | | | | | | |
Ireland — 0.84% | | | | | | | | |
Industrials — 0.70% | | | | | | | | |
Trane Technologies PLC | | | 447 | | | | 52,920 | |
| | | | | | | | | |
Technology — 0.14% | | | | | | | | |
Seagate Technology PLC | | | 215 | | | | 10,318 | |
Total Ireland | | | | | | | 63,238 | |
| | | | | | | | | |
Israel — 0.29% | | | | | | | | |
Energy — 0.29% | | | | | | | | |
SolarEdge Technologies, Inc.(a) | | | 100 | | | | 22,115 | |
| | | | | | | | | |
Japan — 3.88% | | | | | | | | |
Communications — 1.41% | | | | | | | | |
SoftBank Corp. - ADR | | | 775 | | | | 23,979 | |
Yahoo Japan Corp. | | | 12,427 | | | | 82,723 | |
| | | | | | | | 106,702 | |
Financials — 0.51% | | | | | | | | |
SBI Holdings, Inc. | | | 1,700 | | | | 38,732 | |
| | | | | | | | | |
Industrials — 1.54% | | | | | | | | |
Kurita Water Industries Ltd. | | | 2,500 | | | | 78,369 | |
Recruit Holdings Co. Ltd. | | | 1,000 | | | | 38,014 | |
| | | | | | | | 116,383 | |
Technology — 0.42% | | | | | | | | |
Kyocera Corp. - ADR | | | 215 | | | | 12,388 | |
Tokyo Electron Ltd. - ADR | | | 300 | | | | 19,236 | |
| | | | | | | | 31,624 | |
Total Japan | | | | | | | 293,441 | |
| | | | | | | | | |
Kenya — 0.28% | | | | | | | | |
Communications — 0.28% | | | | | | | | |
Safaricom Ltd. | | | 75,288 | | | | 20,795 | |
8 | See accompanying notes which are an integral part of these financial statements. | |
Cornerstone Capital Access Impact Fund
Schedule of Investments (continued)
August 31, 2020
| | Shares | | | Fair Value | |
COMMON STOCKS — (continued) | | | | | | | | |
Mexico — 0.43% | | | | | | | | |
Materials — 0.43% | | | | | | | | |
Orbia Advance Corp. SAB de CV | | | 20,400 | | | $ | 32,773 | |
| | | | | | | | | |
Netherlands — 2.82% | | | | | | | | |
Health Care — 0.20% | | | | | | | | |
Koninklijke Philips N.V. | | | 321 | | | | 15,244 | |
| | | | | | | | | |
Industrials — 1.01% | | | | | | | | |
Aalberts N.V. | | | 1,069 | | | | 40,352 | |
Arcadis N.V. | | | 1,584 | | | | 36,378 | |
| | | | | | | | 76,730 | |
Technology — 1.61% | | | | | | | | |
Adyen N.V.(a) | | | 48 | | | | 80,916 | |
ASML Holding N.V. | | | 108 | | | | 40,497 | |
| | | | | | | | 121,413 | |
Total Netherlands | | | | | | | 213,387 | |
| | | | | | | | | |
Norway — 0.31% | | | | | | | | |
Industrials — 0.31% | | | | | | | | |
Tomra Systems ASA | | | 475 | | | | 23,022 | |
| | | | | | | | | |
Singapore — 1.60% | | | | | | | | |
Communications — 1.36% | | | | | | | | |
Sea Ltd. - ADR(a) | | | 670 | | | | 102,383 | |
| | | | | | | | | |
Energy — 0.03% | | | | | | | | |
Maxeon Solar Technologies Ltd.(a) | | | 121 | | | | 2,520 | |
| | | | | | | | | |
Real Estate — 0.12% | | | | | | | | |
City Developments Ltd. - ADR | | | 1,550 | | | | 8,990 | |
| | | | | | | | | |
Utilities — 0.09% | | | | | | | | |
SIIC Environment Holdings Ltd. | | | 46,000 | | | | 6,707 | |
Total Singapore | | | | | | | 120,600 | |
| | | | | | | | | |
South Africa — 0.34% | | | | | | | | |
Financials — 0.34% | | | | | | | | |
Discovery Ltd. | | | 3,618 | | | | 25,831 | |
| | See accompanying notes which are an integral part of these financial statements. | 9 |
Cornerstone Capital Access Impact Fund
Schedule of Investments (continued)
August 31, 2020
| | Shares | | | Fair Value | |
COMMON STOCKS — (continued) | | | | | | | | |
South Korea — 0.17% | | | | | | | | |
Technology — 0.17% | | | | | | | | |
LG Display Co., Ltd. - ADR | | | 2,050 | | | $ | 12,649 | |
| | | | | | | | | |
Spain — 0.29% | | | | | | | | |
Financials — 0.29% | | | | | | | | |
Banco Bilbao Vizcaya Argentaria S.A. | | | 7,402 | | | | 21,662 | |
| | | | | | | | | |
Switzerland — 2.65% | | | | | | | | |
Consumer Staples — 0.59% | | | | | | | | |
Nestle S.A. | | | 374 | | | | 44,914 | |
| | | | | | | | | |
Financials — 0.17% | | | | | | | | |
Swiss Reinsurance Co. Ltd. - ADR | | | 620 | | | | 12,518 | |
| | | | | | | | | |
Health Care — 1.18% | | | | | | | | |
CRISPR Therapeutics AG(a) | | | 170 | | | | 15,888 | |
Lonza Group AG | | | 39 | | | | 24,177 | |
Roche Holding AG | | | 140 | | | | 48,892 | |
| | | | | | | | 88,957 | |
Industrials — 0.25% | | | | | | | | |
ABB Ltd. - ADR | | | 760 | | | | 19,380 | |
| | | | | | | | | |
Technology — 0.46% | | | | | | | | |
Garmin Ltd. | | | 145 | | | | 15,023 | |
STMicroelectronics N.V. | | | 650 | | | | 19,663 | |
| | | | | | | | 34,686 | |
Total Switzerland | | | | | | | 200,455 | |
| | | | | | | | | |
Taiwan Province of China — 1.60% | | | | | | | | |
Technology — 1.60% | | | | | | | | |
Taiwan Semiconductor Manufacturing Co. Ltd. - ADR | | | 1,524 | | | | 120,777 | |
| | | | | | | | | |
United Kingdom — 5.35% | | | | | | | | |
Consumer Discretionary — 0.95% | | | | | | | | |
Bunzl PLC | | | 1,575 | | | | 50,980 | |
Whitbread PLC | | | 612 | | | | 20,684 | |
| | | | | | | | 71,664 | |
Consumer Staples — 0.90% | | | | | | | | |
Greggs PLC(a) | | | 1,152 | | | | 21,815 | |
Unilever PLC | | | 779 | | | | 46,432 | |
| | | | | | | | 68,247 | |
10 | See accompanying notes which are an integral part of these financial statements. | |
Cornerstone Capital Access Impact Fund
Schedule of Investments (continued)
August 31, 2020
| | Shares | | | Fair Value | |
COMMON STOCKS — (continued) | | | | | | | | |
United Kingdom — (continued) | | | | | | | | |
Industrials — 1.89% | | | | | | | | |
Costain Group PLC | | | 19,609 | | | $ | 14,177 | |
Ferguson PLC | | | 289 | | | | 28,488 | |
Pentair PLC | | | 1,812 | | | | 81,794 | |
Spirax-Sarco Engineering PLC | | | 133 | | | | 18,210 | |
| | | | | | | | 142,669 | |
Utilities — 1.61% | | | | | | | | |
Pennon Group PLC | | | 2,133 | | | | 28,677 | |
United Utilities Group PLC | | | 8,384 | | | | 93,131 | |
| | | | | | | | 121,808 | |
Total United Kingdom | | | | | | | 404,388 | |
| | | | | | | | | |
United States — 56.81% | | | | | | | | |
Communications — 6.13% | | | | | | | | |
Alphabet, Inc., Class A(a) | | | 48 | | | | 78,217 | |
Alphabet, Inc., Class C(a) | | | 13 | | | | 21,244 | |
AT&T, Inc. | | | 480 | | | | 14,309 | |
Booking Holdings, Inc.(a) | | | 21 | | | | 40,119 | |
Facebook, Inc., Class A(a) | | | 178 | | | | 52,190 | |
Pinterest, Inc.(a) | | | 2,482 | | | | 91,313 | |
Snap, Inc., Class A(a) | | | 2,233 | | | | 50,443 | |
Switch, Inc., Class A | | | 640 | | | | 11,008 | |
Zillow Group, Inc., Class C(a) | | | 1,212 | | | | 103,942 | |
| | | | | | | | 462,785 | |
Consumer Discretionary — 3.07% | | | | | | | | |
Amazon.com, Inc.(a) | | | 21 | | | | 72,470 | |
Fortune Brands Home & Security, Inc. | | | 607 | | | | 51,036 | |
Herman Miller, Inc. | | | 320 | | | | 7,625 | |
Interface, Inc. | | | 460 | | | | 3,478 | |
Steelcase, Inc., Class A | | | 550 | | | | 5,748 | |
Tesla, Inc.(a) | | | 160 | | | | 79,731 | |
Vail Resorts, Inc. | | | 55 | | | | 11,972 | |
| | | | | | | | 232,060 | |
Consumer Staples — 0.69% | | | | | | | | |
Beyond Meat, Inc.(a) | | | 120 | | | | 16,302 | |
Hain Celestial Group, Inc. (The)(a) | | | 405 | | | | 13,280 | |
Natural Grocers by Vitamin Cottage, Inc. | | | 545 | | | | 6,387 | |
United Natural Foods, Inc.(a) | | | 900 | | | | 16,245 | |
| | | | | | | | 52,214 | |
| | See accompanying notes which are an integral part of these financial statements. | 11 |
Cornerstone Capital Access Impact Fund
Schedule of Investments (continued)
August 31, 2020
| | Shares | | | Fair Value | |
COMMON STOCKS — (continued) | | | | | | | | |
United States — (continued) | | | | | | | | |
Energy — 1.61% | | | | | | | | |
Ameresco, Inc., Class A(a) | | | 470 | | | $ | 16,046 | |
Enphase Energy, Inc.(a) | | | 390 | | | | 30,120 | |
First Solar, Inc.(a) | | | 260 | | | | 19,913 | |
SunPower Corp.(a) | | | 970 | | | | 10,854 | |
Sunrun, Inc.(a) | | | 550 | | | | 31,105 | |
TPI Composites, Inc.(a) | | | 450 | | | | 13,820 | |
| | | | | | | | 121,858 | |
Financials — 4.71% | | | | | | | | |
Brookfield Renewable Corp. | | | 307 | | | | 15,642 | |
Charles Schwab Corp. (The) | | | 756 | | | | 26,860 | |
First Republic Bank | | | 224 | | | | 25,292 | |
Horizon Technology Finance Corp. | | | 450 | | | | 5,418 | |
Interactive Brokers Group, Inc., Class A | | | 917 | | | | 48,619 | |
Intercontinental Exchange, Inc. | | | 904 | | | | 96,032 | |
LendingClub Corp.(a) | | | 6,429 | | | | 34,267 | |
LendingTree, Inc.(a) | | | 277 | | | | 85,576 | |
Silvergate Capital Corp.(a) | | | 1,204 | | | | 17,976 | |
| | | | | | | | 355,682 | |
Health Care — 5.63% | | | | | | | | |
Agilent Technologies, Inc. | | | 457 | | | | 45,892 | |
Bluebird Bio, Inc.(a) | | | 230 | | | | 13,639 | |
Danaher Corp. | | | 345 | | | | 71,232 | |
Editas Medicine, Inc.(a) | | | 340 | | | | 11,978 | |
Exact Sciences Corp.(a) | | | 155 | | | | 11,670 | |
Gilead Sciences, Inc. | | | 245 | | | | 16,354 | |
Illumina, Inc.(a) | | | 50 | | | | 17,861 | |
Intellia Therapeutics, Inc.(a) | | | 570 | | | | 12,301 | |
Invitae Corp.(a) | | | 550 | | | | 19,228 | |
Moderna, Inc.(a) | | | 650 | | | | 42,178 | |
Seattle Genetics, Inc.(a) | | | 115 | | | | 18,209 | |
Teladoc Health, Inc.(a) | | | 160 | | | | 34,510 | |
Thermo Fisher Scientific, Inc. | | | 93 | | | | 39,895 | |
Translate Bio, Inc.(a) | | | 740 | | | | 10,427 | |
UnitedHealth Group, Inc. | | | 129 | | | | 40,319 | |
Vertex Pharmaceuticals, Inc.(a) | | | 70 | | | | 19,538 | |
| | | | | | | | 425,231 | |
12 | See accompanying notes which are an integral part of these financial statements. | |
Cornerstone Capital Access Impact Fund
Schedule of Investments (continued)
August 31, 2020
| | Shares | | | Fair Value | |
COMMON STOCKS — (continued) | | | | | | | | |
United States — (continued) | | | | | | | | |
Industrials — 7.12% | | | | | | | | |
Acuity Brands, Inc. | | | 100 | | | $ | 10,929 | |
Advanced Energy Industries, Inc.(a) | | | 180 | | | | 13,342 | |
Badger Meter, Inc. | | | 130 | | | | 8,020 | |
Deere & Co. | | | 271 | | | | 56,926 | |
Evoqua Water Technologies Corp.(a) | | | 419 | | | | 8,573 | |
Granite Construction, Inc. | | | 842 | | | | 15,653 | |
Ichor Holdings Ltd.(a) | | | 260 | | | | 6,542 | |
IDEX Corp. | | | 69 | | | | 12,436 | |
Itron, Inc.(a) | | | 560 | | | | 33,359 | |
Lindsay Corp. | | | 152 | | | | 15,189 | |
Mueller Water Products, Inc. - Series A | | | 4,294 | | | | 46,375 | |
Rexnord Corp. | | | 1,011 | | | | 29,279 | |
Roper Technologies, Inc. | | | 112 | | | | 47,844 | |
Schnitzer Steel Industries, Inc., Class A | | | 245 | | | | 4,836 | |
SPX Corp.(a) | | | 1,102 | | | | 46,097 | |
Toro Co. (The) | | | 300 | | | | 22,584 | |
Valmont Industries, Inc. | | | 511 | | | | 64,923 | |
Where Food Comes From, Inc.(a) | | | 2,300 | | | | 3,910 | |
Xylem, Inc. | | | 1,136 | | | | 91,084 | |
| | | | | | | | 537,901 | |
Materials — 0.23% | | | | | | | | |
Trex Co., Inc.(a) | | | 115 | | | | 17,191 | |
| | | | | | | | | |
Real Estate — 1.69% | | | | | | | | |
Alexandria Real Estate Equities, Inc. | | | 110 | | | | 18,522 | |
Crown Castle International Corp. | | | 110 | | �� | | 17,958 | |
CyrusOne, Inc. | | | 200 | | | | 16,706 | |
Digital Realty Trust, Inc. | | | 120 | | | | 18,677 | |
Equinix, Inc. | | | 25 | | | | 19,744 | |
Hannon Armstrong Sustainable Infrastructure, Inc. | | | 265 | | | | 11,252 | |
Iron Mountain, Inc. | | | 385 | | | | 11,585 | |
QTS Realty Trust, Inc., Class A | | | 200 | | | | 13,564 | |
| | | | | | | | 128,008 | |
Technology — 24.10% | | | | | | | | |
Adobe Systems, Inc.(a) | | | 84 | | | | 43,125 | |
Akamai Technologies, Inc.(a) | | | 140 | | | | 16,300 | |
Analog Devices, Inc. | | | 170 | | | | 19,870 | |
ANSYS, Inc.(a) | | | 55 | | | | 18,646 | |
| | See accompanying notes which are an integral part of these financial statements. | 13 |
Cornerstone Capital Access Impact Fund
Schedule of Investments (continued)
August 31, 2020
| | Shares | | | Fair Value | |
COMMON STOCKS — (continued) | | | | | | | | |
United States — (continued) | | | | | | | | |
Technology — (continued) | | | | | | | | |
Apple, Inc. | | | 992 | | | $ | 128,008 | |
Applied Materials, Inc. | | | 350 | | | | 21,560 | |
Arista Networks, Inc.(a) | | | 70 | | | | 15,642 | |
Autodesk, Inc.(a) | | | 90 | | | | 22,113 | |
Box, Inc., Class A(a) | | | 560 | | | | 10,993 | |
Brooks Automation, Inc. | | | 300 | | | | 15,489 | |
Cadence Design Systems, Inc.(a) | | | 200 | | | | 22,182 | |
Cloudera, Inc.(a) | | | 860 | | | | 11,361 | |
Cree, Inc.(a) | | | 210 | | | | 13,251 | |
DocuSign, Inc.(a) | | | 182 | | | | 40,586 | |
Extreme Networks, Inc.(a) | | | 1,060 | | | | 4,632 | |
Fortinet, Inc.(a) | | | 125 | | | | 16,501 | |
Guidewire Software, Inc.(a) | | | 297 | | | | 33,356 | |
International Business Machines Corp. | | | 190 | | | | 23,429 | |
Intuit, Inc. | | | 159 | | | | 54,917 | |
Lam Research Corp. | | | 50 | | | | 16,817 | |
Lumentum Holdings, Inc.(a) | | | 150 | | | | 12,900 | |
Marvell Technology Group Ltd. | | | 550 | | | | 21,329 | |
MasterCard, Inc., Class A | | | 122 | | | | 43,699 | |
Microchip Technology, Inc. | | | 150 | | | | 16,455 | |
Micron Technology, Inc.(a) | | | 300 | | | | 13,653 | |
Microsoft Corp. | | | 373 | | | | 84,123 | |
Monolithic Power Systems, Inc. | | | 80 | | | | 21,370 | |
NVIDIA Corp. | | | 121 | | | | 64,733 | |
Omnicell, Inc.(a) | | | 135 | | | | 9,002 | |
Oracle Corp. | | | 280 | | | | 16,022 | |
Palo Alto Networks, Inc.(a) | | | 65 | | | | 16,732 | |
PayPal Holdings, Inc.(a) | | | 316 | | | | 64,508 | |
Power Integrations, Inc. | | | 200 | | | | 11,194 | |
Proofpoint, Inc.(a) | | | 110 | | | | 12,064 | |
Pure Storage, Inc., Class A(a) | | | 640 | | | | 9,766 | |
QUALCOMM, Inc. | | | 200 | | | | 23,820 | |
salesforce.com, Inc.(a) | | | 120 | | | | 32,718 | |
Skyworks Solutions, Inc. | | | 125 | | | | 18,106 | |
Slack Technologies, Inc., Class A(a) | | | 850 | | | | 27,914 | |
Splunk, Inc.(a) | | | 385 | | | | 84,441 | |
Square, Inc., Class A(a) | | | 2,194 | | | | 350,075 | |
Teradyne, Inc. | | | 195 | | | | 16,569 | |
Texas Instruments, Inc. | | | 364 | | | | 51,743 | |
TransUnion | | | 313 | | | | 27,143 | |
Twilio, Inc., Class A(a) | | | 194 | | | | 52,333 | |
14 | See accompanying notes which are an integral part of these financial statements. | |
Cornerstone Capital Access Impact Fund
Schedule of Investments (continued)
August 31, 2020
| | Shares | | | Fair Value | |
COMMON STOCKS — (continued) | | | | | | | | |
United States — (continued) | | | | | | | | |
Technology — (continued) | | | | | | | | |
Ultra Clean Holdings, Inc.(a) | | | 370 | | | $ | 9,072 | |
Universal Display Corp. | | | 90 | | | | 15,795 | |
Verisk Analytics, Inc. | | | 110 | | | | 20,534 | |
Visa, Inc., Class A | | | 208 | | | | 44,094 | |
Workday, Inc., Class A(a) | | | 151 | | | | 36,196 | |
Xperi Corp. | | | 700 | | | | 8,771 | |
Zendesk, Inc.(a) | | | 100 | | | | 9,638 | |
Zscaler, Inc.(a) | | | 176 | | | | 25,228 | |
| | | | | | | | 1,820,518 | |
Utilities — 1.83% | | | | | | | | |
California Water Service Group | | | 200 | | | | 9,068 | |
Essential Utilities, Inc. | | | 1,452 | | | | 61,710 | |
Middlesex Water Co. | | | 140 | | | | 8,978 | |
Ormat Technologies, Inc. | | | 135 | | | | 8,217 | |
PICO Holdings, Inc.(a) | | | 3,101 | | | | 27,568 | |
SJW Group | | | 369 | | | | 23,074 | |
| | | | | | | | 138,615 | |
Total United States | | | | | | | 4,292,063 | |
| | | | | | | | | |
Total Common Stocks (Cost $5,649,234) | | | | | | | 7,470,032 | |
| | | | | | | | | |
MONEY MARKET FUNDS — 1.13% | | | | | | | | |
Morgan Stanley Institutional Liquidity Government Portfolio, Institutional Class, 0.02%(b) | | | 85,072 | | | | 85,072 | |
Total Money Market Funds (Cost $85,072) | | | | | | | 85,072 | |
| | | | | | | | | |
Total Investments — 100.00% (Cost $5,734,306) | | | | | | | 7,555,104 | |
| | | | | | | | | |
Other Assets in Excess of Liabilities — 0.00%(c) | | | | | | | 189 | |
| | | | | | | | | |
NET ASSETS — 100.00% | | | | | | $ | 7,555,293 | |
(a) | Non-income producing security. |
(b) | Rate disclosed is the seven day effective yield as of August 31, 2020. |
(c) | Rounds to less than 0.005% |
| | See accompanying notes which are an integral part of these financial statements. | 15 |
Cornerstone Capital Access Impact Fund
Statement of Assets and Liabilities
August 31, 2020
Assets |
Investments in securities, at fair value (cost $5,734,306) | | $ | 7,555,104 | |
Foreign currencies, at value (cost $878) | | | 876 | |
Cash | | | 567 | |
Receivable for fund shares sold | | | 100 | |
Receivable for investments sold | | | 23,185 | |
Dividends receivable | | | 3,445 | |
Tax reclaims receivable | | | 1,080 | |
Deferred offering cost | | | 10,532 | |
Receivable from Administrator | | | 7,979 | |
Receivable from Adviser | | | 21,859 | |
Prepaid expenses | | | 6,450 | |
Total Assets | | | 7,631,177 | |
Liabilities | | | | |
Payable for investments purchased | | | 37,994 | |
Payable to auditors | | | 16,650 | |
Payable to Administrator | | | 8,301 | |
Other accrued expenses | | | 12,939 | |
Total Liabilities | | | 75,884 | |
Net Assets | | $ | 7,555,293 | |
Net Assets consist of: | | | | |
Paid-in capital | | $ | 5,633,589 | |
Accumulated earnings | | | 1,921,704 | |
Net Assets | | $ | 7,555,293 | |
Institutional Shares: | | | | |
Shares outstanding (unlimited number of shares authorized, no par value) | | | 559,011 | |
Net asset value, offering and redemption price per share | | $ | 13.52 | |
16 | See accompanying notes which are an integral part of these financial statements. | |
Cornerstone Capital Access Impact Fund
Statement of Operations
For the period ended August 31, 2020(a)
Investment Income | | | | |
Dividend income (net of foreign taxes withheld of $4,173) | | $ | 52,495 | |
Total investment income | | | 52,495 | |
Expenses | | | | |
Organizational | | | 53,222 | |
Adviser | | | 46,172 | |
Offering | | | 41,101 | |
Fund accounting | | | 38,853 | |
Custodian | | | 38,797 | |
Legal | | | 33,083 | |
Audit and tax | | | 19,650 | |
Administration | | | 19,200 | |
Trustee | | | 11,225 | |
Transfer agent | | | 11,100 | |
Compliance services | | | 9,600 | |
Pricing | | | 8,921 | |
Report printing | | | 5,585 | |
Insurance | | | 1,510 | |
Registration | | | 1,418 | |
Miscellaneous | | | 22,835 | |
Total expenses | | | 362,272 | |
Fees contractually waived and expenses reimbursed by Adviser | | | (299,891 | ) |
Net operating expenses | | | 62,381 | |
Net investment loss | | | (9,886 | ) |
Net Realized and Change in Unrealized Gain (Loss) on Investments | | | | |
Net realized gain (loss) on: | | | | |
Investment securities | | | 126,763 | |
Foreign currency translations | | | (16,011 | ) |
Change in unrealized appreciation on: | | | | |
Investment securities | | | 1,820,798 | |
Foreign currency translations | | | 40 | |
Net realized and change in unrealized gain (loss) on investment securities and foreign currency translations | | | 1,931,590 | |
Net increase in net assets resulting from operations | | $ | 1,921,704 | |
(a) | For the period November 13, 2019 (commencement of operations) to August 31, 2020. |
| | See accompanying notes which are an integral part of these financial statements. | 17 |
Cornerstone Capital Access Impact Fund
Statement of Changes in Net Assets
| | For the
Period Ended
August 31, 2020(a) | |
Increase (Decrease) in Net Assets due to: | | | | |
Operations | | | | |
Net investment loss | | $ | (9,886 | ) |
Net realized gain on investment securities and foreign currency translations | | | 110,752 | |
Change in unrealized appreciation on investment securities and foreign currency translations | | | 1,820,838 | |
Net increase in net assets resulting from operations | | | 1,921,704 | |
Capital Transactions – Institutional Class | | | | |
Proceeds from shares sold | | | 5,633,649 | |
Amount paid for shares redeemed | | | (60 | ) |
Net increase in net assets resulting from capital transactions | | | 5,633,589 | |
Total Increase in Net Assets | | | 7,555,293 | |
Net Assets | | | | |
Beginning of period | | $ | — | |
End of period | | $ | 7,555,293 | |
Share Transactions – Institutional Class | | | | |
Shares sold | | | 559,017 | |
Shares redeemed | | | (6 | ) |
Net increase in shares outstanding | | | 559,011 | |
(a) | For the period November 13, 2019 (commencement of operations) to August 31, 2020. |
18 | See accompanying notes which are an integral part of these financial statements. | |
Cornerstone Capital Access Impact Fund – Institutional Class
Financial Highlights
(For a share outstanding during the period)
| | | For the
Period Ended
August 31, 2020(a) | |
Selected Per Share Data: | | | | |
Net asset value, beginning of period | | $ | 10.00 | |
Investment operations: | | | | |
Net investment loss | | | (0.02 | ) |
Net realized and unrealized gain on investments | | | 3.54 | |
Total from investment operations | | | 3.52 | |
Net asset value, end of period | | $ | 13.52 | |
Total Return(b) | | | 35.20 | %(c) |
| | | | | |
Ratios and Supplemental Data: | | | | |
Net assets, end of period (000 omitted) | | $ | 7,555 | |
Ratio of expenses to average net assets before waiver and reimbursement | | | 7.84 | %(d) |
Ratio of expenses to average net assets after waiver and reimbursement | | | 1.35 | %(d) |
Ratio of net investment loss to average net assets | | | (0.21 | )%(d) |
Portfolio turnover rate | | | 28 | %(c) |
(a) | For the period November 13, 2019 (commencement of operations) to August 31, 2020. |
(b) | Total return represents the rate that the investor would have earned or lost on an investment in the Fund, assuming reinvestment of distributions. |
| | See accompanying notes which are an integral part of these financial statements. | 19 |
Cornerstone Capital Access Impact Fund
Notes to the Financial Statements
August 31, 2020
NOTE 1. ORGANIZATION
The Cornerstone Capital Access Impact Fund (the “Fund”) was organized as a diversified series of Capitol Series Trust (the “Trust”) on September 9, 2019. The Trust is an open-end investment company established under the laws of Ohio by an Agreement and Declaration of Trust dated September 18, 2013 (the “Trust Agreement”). The Trust Agreement permits the Board of Trustees of the Trust (the “Board”) to issue an unlimited number of shares of beneficial interest of separate series without par value. The Fund is one of a series of funds currently authorized by the Board. The Fund’s investment adviser is Cornerstone Capital Inc. (the “Adviser”). The investment objective of the Fund is to seek long-term capital appreciation.
The Fund currently offers one class of shares, Institutional Shares. Each share represents an equal proportionate interest in the assets and liabilities belonging to the Fund and is entitled to such dividends and distributions out of income belonging to the Fund as are declared by the Board.
The Fund’s portfolio is currently managed by the Adviser and four independent investment management firms (the “Sub-Advisers”), and each invests a portion of the portfolio’s assets. As of August 31, 2020, Ark Investment Management, LLC, Green Alpha Advisors, LLC, KBI Global Investors (North America) Ltd. and Schroder Investment Management North America, Inc. managed approximately 34%, 26%, 19% and 21% of the portfolio, respectively.
NOTE 2. SIGNIFICANT ACCOUNTING POLICIES
The Fund is an investment company and follows accounting and reporting guidance under Financial Accounting Standards Board Accounting Standards Codification (“ASC”) Topic 946, “Financial Services-Investment Companies.” The following is a summary of significant accounting policies followed by the Fund in the preparation of its financial statements. These policies are in conformity with generally accepted accounting principles in the United States of America (“GAAP”).
Estimates – The preparation of financial statements in conformity with GAAP requires management to make estimates and assumptions that affect the reported amounts of assets and liabilities and disclosure of contingent assets and liabilities at the date of the financial statements and the reported amounts of increases and decreases in net assets from operations during the reporting period. Actual results could differ from those estimates.
Foreign Currency Translation – The accounting records of the Fund are maintained in U.S. dollars. Foreign currency amounts are translated into U.S. dollars at the current rate of exchange each business day to determine the value of investments, and other assets and liabilities. Purchases and sales of foreign securities, and income and expenses, are translated at the prevailing rate of exchange on the respective date of these transactions. The Fund
20
Cornerstone Capital Access Impact Fund
Notes to the Financial Statements (continued)
August 31, 2020
does not isolate that portion of the results of operations resulting from changes in foreign exchange rates on investments from fluctuation arising from changes in market prices of securities held. These fluctuations are included with the unrealized gain or loss from investments.
Federal Income Taxes – The Fund makes no provision for federal income or excise tax. The Fund has qualified and intends to qualify each year as a regulated investment company (“RIC”) under subchapter M of the Internal Revenue Code of 1986, as amended, by complying with the requirements applicable to RICs and by distributing substantially all of its taxable income. The Fund also intends to distribute sufficient net investment income and net realized capital gains, if any, so that it will not be subject to excise tax on undistributed income and gains. If the required amount of net investment income or gains is not distributed, the Fund could incur a tax expense.
The Fund may be subject to taxes imposed by countries in which it invests. Such taxes are generally based on income and/or capital gains earned or repatriated. Taxes are accrued and applied to net investment income, net realized gains and unrealized appreciation as such income and/or gains are earned.
The Fund recognizes tax benefits or expenses of uncertain tax positions only when the position is “more likely than not” to be sustained assuming examination by tax authorities. Management of the Fund has reviewed tax positions taken in tax years that remain subject to examination by all major tax jurisdictions, including federal (i.e., the previous year end and the interim tax period since then, as applicable) and has concluded that no provision for unrecognized tax benefits or expenses is required in these financial statements and does not expect this to change over the next twelve months. The Fund recognizes interest and penalties, if any, related to unrecognized tax benefits as income tax expense in the Statement of Operations. During the period November 13, 2019 (commencement of operations) to August 31, 2020, the Fund did not incur any interest or penalties.
Expenses – Expenses incurred by the Trust that do not relate to a specific fund of the Trust are allocated to the individual funds based on each fund’s relative net assets or another appropriate basis (as determined by the Board).
Security Transactions and Related Income – Throughout the reporting period, security transactions are accounted for no later than one business day following the trade date. For financial reporting purposes, security transactions are accounted for on trade date on the last business day of the reporting period. The specific identification method is used for determining gains or losses for financial statements and income tax purposes. Dividend income, less foreign taxes withheld, is recorded on the ex-dividend date. Withholding taxes on foreign dividends and foreign capital gain taxes have been provided for in accordance with the Fund’s understanding of the applicable country’s tax codes and regulations. Dividend income from real estate investment trusts (REITs) and distributions from limited
21
Cornerstone Capital Access Impact Fund
Notes to the Financial Statements (continued)
August 31, 2020
partnerships are recognized on the ex-date and included in dividend income. The calendar year-end classification of distributions received from REITs, which may include return of capital, during the fiscal year are reported subsequent to year end; accordingly, the Fund estimates the character of REIT distributions based on the most recent information available. Income or loss from limited partnerships is reclassified among the components of net assets upon receipt of K-1’s.
Dividends and Distributions – The Fund intends to distribute its net investment income and net realized long-term and short-term capital gains, if any, at least annually. Dividends and distributions to shareholders, which are determined in accordance with income tax regulations, are recorded on the ex-dividend date. The treatment for financial reporting purposes of distributions made to shareholders during the period from net investment income or net realized capital gains may differ from their ultimate treatment for federal income tax purposes. These differences are caused primarily by differences in the timing of the recognition of certain components of income, expense or realized capital gain for federal income tax purposes. Where such differences are permanent in nature, they are reclassified among the components of net assets based on their ultimate characterization for federal income tax purposes. Any such reclassifications will have no effect on net assets, results of operations or net asset value (“NAV”) per share of the Fund. For the period November 13, 2019 (commencement of operations) to August 31, 2020, the Fund did not have any reclassifications of net assets.
Organization and Offering Costs – The Adviser advanced some of the Fund’s organization and initial offering costs and was subsequently reimbursed by the Fund. Costs of $51,633 incurred in connection with the offering and initial registration of the Fund have been deferred and are being amortized on a straight-line basis over the first twelve months after commencement of operations. There were $10,532 in unamortized offering costs remaining as of August 31, 2020. Costs of $53,222 incurred in connection with the organization of the Fund were expensed as incurred.
NOTE 3. SECURITIES VALUATION AND FAIR VALUE MEASUREMENTS
Fair value is defined as the price that the Fund would receive upon selling an investment in a timely transaction to an independent buyer in the principal or most advantageous market of the investment. GAAP establishes a three-tier hierarchy to maximize the use of observable market data and minimize the use of unobservable inputs and to establish classification of fair value measurements for disclosure purposes.
Inputs refer broadly to the assumptions that market participants would use in pricing the asset or liability, including assumptions about risk (the risk inherent in a particular valuation technique used to measure fair value including a pricing model and/or the risk inherent in the inputs to the valuation technique). Inputs may be observable or unobservable. Observable inputs are inputs that reflect the assumptions market participants would use in
22
Cornerstone Capital Access Impact Fund
Notes to the Financial Statements (continued)
August 31, 2020
pricing the asset or liability developed based on market data obtained and available from sources independent of the reporting entity. Unobservable inputs are inputs that reflect the reporting entity’s own assumptions about the assumptions market participants would use in pricing the asset or liability developed based on the best information available in the circumstances.
Various inputs are used in determining the value of the Fund’s investments. These inputs are summarized in the three broad levels listed below.
| | ● | Level 1 – unadjusted quoted prices in active markets for identical investments and/or registered investment companies where the value per share is determined and published and is the basis for current transactions for identical assets or liabilities at the valuation date |
| | ● | Level 2 – other significant observable inputs (including, but not limited to, quoted prices for an identical security in an inactive market, quoted prices for similar securities, interest rates, prepayment speeds, credit risk, etc.) |
| | ● | Level 3 – significant unobservable inputs (including the Fund’s own assumptions in determining fair value of investments based on the best information available) |
The inputs used to measure fair value may fall into different levels of the fair value hierarchy. In such cases, for disclosure purposes, the level in the fair value hierarchy which is reported, is determined based on the lowest level input that is significant to the fair value measurement in its entirety.
In computing the NAV of the Fund, fair value is based on market valuations with respect to portfolio securities for which market quotations are readily available. Pursuant to Board approved policies, the Fund relies on independent third-party pricing services to provide the current market value of securities. Those pricing services value equity securities, including exchange-traded funds, exchange-traded notes, closed-end funds and preferred stocks, traded on a securities exchange at the last reported sales price on the principal exchange. Equity securities quoted by NASDAQ are valued at the NASDAQ Official Closing Price. If there is no reported sale on the principal exchange, equity securities are valued at the mean between the most recent quoted bid and asked price. When using the market quotations or close prices provided by the pricing service and when the market is considered active, the security will be classified as a Level 1 security. Investments in open-end mutual funds, including money market mutual funds, are generally priced at the ending NAV provided by the pricing service of the funds and are generally categorized as Level 1 securities. Debt securities are valued using evaluated prices furnished by a pricing vendor selected by the Board and are generally classified as Level 2 securities.
In the event that market quotations are not readily available, the Adviser determines that the market quotation or the price provided by the pricing service does not accurately reflect the current fair value, or certain restricted or illiquid securities are being valued, such
23
Cornerstone Capital Access Impact Fund
Notes to the Financial Statements (continued)
August 31, 2020
securities are valued as determined in good faith by the Trust’s Valuation Committee, based on recommendations from a pricing committee comprised of certain officers of the Trust, certain employees of the Fund’s administrator, and representatives of the Adviser (together the “Pricing Review Committee”). These securities will be classified as Level 2 or 3 within the fair value hierarchy, depending on the inputs used.
In accordance with the Trust’s Portfolio Valuation Procedures, the Pricing Review Committee, in making its recommendations with the Adviser’s participation, is required to consider all appropriate factors relevant to the value of securities for which it has determined other pricing sources are not available or reliable as described above. No single standard exists for determining fair value, because fair value depends upon the circumstances of each individual case. As a general principle, the current fair value of an issue of securities being valued pursuant to the Trust’s Fair Value Guidelines would be the amount which the Fund might reasonably expect to receive for them upon their current sale. Methods which are in accordance with this principle may, for example, be based on (i) a multiple of earnings; (ii) a discount from market prices of a similar freely traded security (including a derivative security or a basket of securities traded on other markets, exchanges or among dealers); or (iii) yield to maturity with respect to debt issues, or a combination of these and other methods. Fair value pricing is permitted if, in accordance with the Trust’s Portfolio Valuation Procedures, the validity of market quotations appears to be questionable based on factors such as evidence of a thin market in the security based on a small number of quotations, a significant event occurs after the close of a market but before the Fund’s NAV calculation that may affect a security’s value, or other data calls into question the reliability of market quotations.
The following is a summary of the inputs used to value the Fund’s investments as of August 31, 2020:
| | | Valuation Inputs | | | | | |
Assets | | Level 1 | | | Level 2 | | | Level 3 | | | Total | |
Common Stocks(a) | | $ | 7,470,032 | | | $ | — | | | $ | — | | | $ | 7,470,032 | |
Money Market Funds | | | 85,072 | | | | — | | | | — | | | | 85,072 | |
Total | | $ | 7,555,104 | | | $ | — | | | $ | — | | | $ | 7,555,104 | |
(a) | Refer to Schedule of Investments for sector classifications. |
The Fund did not hold any investments at the end of the reporting period for which significant unobservable inputs (Level 3) were used in determining fair value; therefore, no reconciliation of Level 3 securities is included for this reporting period.
NOTE 4. ADVISER FEES AND OTHER TRANSACTIONS
Under the terms of the investment advisory agreement (the “Agreement”), the Adviser manages the Fund’s investments subject to approval of the Board. The Adviser has entered into sub-advisory agreements with the Sub-Advisers, each of which manages a portion of
24
Cornerstone Capital Access Impact Fund
Notes to the Financial Statements (continued)
August 31, 2020
the assets of the Fund. The Adviser compensates each Sub-Adviser to manage their portion of the Fund’s assets. As compensation for its management services, the Fund is obligated to pay the Adviser a fee computed and accrued daily and paid monthly at an annual rate of 1.00% of the Fund’s average daily net assets. The sub-advisory fee paid to each sub-adviser is calculated as a percentage of the Fund’s average daily net assets, managed by each sub-adviser, and is paid by the Adviser. For the period November 13, 2019 (commencement of operations) to August 31, 2020, the Adviser earned fees of $46,172 from the Fund. At August 31, 2020, the Adviser owed the Fund $21,859 pursuant to the expense limitation agreement described below.
The Adviser has contractually agreed to waive its management fee and/or reimburse expenses so that total annual operating expenses (excluding (i) interest; (ii) taxes; (iii) brokerage fees and commissions; (iv) other extraordinary expenses not incurred in the ordinary course of the Fund’s business; (v) dividend expenses on short sales; and (vi) indirect expenses such as acquired fund fees and expenses) and expenses) do not exceed 1.35% of the Fund’s average daily net assets through December 31, 2022 (“Expense Limitation”). During any fiscal year that the Expense Limitation between the Adviser and the Trust is in effect, the Adviser may recoup the sum of all fees previously waived or expenses reimbursed, less any reimbursement previously paid, provided that the Adviser is only permitted to recoup fees or expenses within 36 months from the date the fee waiver or expense reimbursement took effect and provided further that such recoupment can be achieved within the Expense Limitation currently in effect and the Expense Limitation in place when the waiver/reimbursement occurred. This expense cap agreement may be terminated by the Board at any time. As of August 31, 2020, the Adviser may seek repayment of investment advisory fee waivers and expense reimbursements in the amount as follows:
Recoverable through | | | |
August 31, 2023 | | $ | 299,891 | |
The Trust retains Ultimus Fund Solutions, LLC (the “Administrator”) to provide the Fund with administration, compliance, fund accounting and transfer agent services, including all regulatory reporting. For the period November 13, 2019 (commencement of operations) to August 31, 2020, the Administrator earned fees of $19,200 for administration services, $9,600 for compliance services, $38,853 for fund accounting services, and $11,100 for transfer agent services. At August 31, 2020, the Fund owed the Administrator $8,301 for such services.
The Board supervises the business activities of the Trust. Each Trustee serves as a Trustee for the lifetime of the Trust or until the earlier of his or her retirement as a Trustee at age 78 (which may be extended for up to two years in an emeritus non-voting capacity at the pleasure and request of the Board), or until he/she dies, resigns, or is removed, whichever is sooner. “Independent Trustees,” meaning those Trustees who are not “interested persons” of
25
Cornerstone Capital Access Impact Fund
Notes to the Financial Statements (continued)
August 31, 2020
the Trust, as defined in the Investment Company Act of 1940 (“1940 Act”), as amended, has received an annual retainer of $500 per Fund and $500 per Fund for each quarterly in-person Board meeting. Effective January 1, 2020, the annual retainer increased to $1,000 per Fund. In addition, each Independent Trustee may be compensated for preparation related to and participation in any special meetings of the Board and/or any Committee of the Board, with such compensation determined on a case-by-case basis based on the length and complexity of the meeting. The Trust also reimburses Trustees for out-of-pocket expense incurred in conjunction with attendance at Board meetings.
The officers and one trustee of the Trust are employees of the Administrator. Ultimus Fund Distributors, LLC (the “Distributor”) acts as the principal distributor of the Fund’s shares. The Distributor is a wholly-owned subsidiaries of the Administrator.
NOTE 5. PURCHASES AND SALES OF SECURITIES
For the period November 13, 2019 (commencement of operations) to August 31, 2020, purchases and sales of investment securities, other than short-term investments, were $7,102,494 and $1,578,852, respectively.
There were no purchases or sales of long-term U.S. government obligations during the period November 13, 2019 (commencement of operations) to August 31, 2020.
NOTE 6. FEDERAL TAX INFORMATION
At August 31, 2020, the net unrealized appreciation (depreciation) and tax cost of investments for tax purposes was as follows:
Gross unrealized appreciation | | $ | 2,016,226 | |
Gross unrealized depreciation | | | (210,234 | ) |
Net unrealized appreciation on investments | | $ | 1,805,992 | |
Tax cost of investments | | $ | 5,749,112 | |
At August 31, 2020, the components of accumulated earnings (deficit) on a tax basis were as follows:
Undistributed ordinary income | | $ | 115,408 | |
Undistributed long-term capital gains | | | 264 | |
Unrealized appreciation on investments | | | 1,806,032 | |
Total accumulated earnings | | $ | 1,921,704 | |
26
Cornerstone Capital Access Impact Fund
Notes to the Financial Statements (continued)
August 31, 2020
NOTE 7. SECTOR RISK
If the Fund has significant investments in the securities of issuers within a particular sector, any development affecting that sector will have a greater impact on the value of the net assets of the Fund than would be the case if the Fund did not have significant investments in that sector. In addition, this may increase the risk of loss in the Fund and increase the volatility of the Fund’s NAV per share. For instance, economic or market factors, regulatory changes or other developments may negatively impact all companies in a particular sector, and therefore the value of the Fund’s portfolio will be adversely affected. As of August 31, 2020, the Fund had 29.92% of the value of their net assets invested in securities within the Technology sector.
NOTE 8. COMMITMENTS AND CONTINGENCIES
The Trust indemnifies its officers and Trustees for certain liabilities that may arise from their performance of their duties to the Trust or the Fund. Additionally, in the normal course of business, the Trust enters into contracts that contain a variety of representations and warranties which provide general indemnifications. The Trust’s maximum exposure under these arrangements is unknown, as this would involve future claims that may be made against the Trust that have not yet occurred.
NOTE 9. SUBSEQUENT EVENTS
Management of the Fund has evaluated the need for disclosures and/or adjustments resulting from subsequent events through the date at which these financial statements were issued. Based upon this evaluation, management has determined there were no items requiring adjustment of the financial statements or additional disclosure, other than the item below.
On October 22, 2020, the Board approved the liquidation of the Fund as being in the best interest of the Fund and its shareholders. It is anticipated that all outstanding shares of the Fund will be redeemed and will discontinue all operations on or about December 3, 2020. Shares of the Fund are no longer available for purchase as of the close of business on October 27, 2020.
27
Cornerstone Capital Access Impact Fund
Notes to the Financial Statements (continued)
August 31, 2020
NOTE 10. LIQUIDITY RISK MANAGEMENT PROGRAM (Unaudited)
The Fund has adopted and implemented a written liquidity risk management program (the “Program”) as required by Rule 22e-4 (the “Liquidity Rule”) under the 1940 Act. The Program is reasonably designed to assess and manage the Fund’s liquidity risk, taking into consideration, among other factors, the Fund’s investment strategy and the liquidity of its portfolio investments during normal and reasonably foreseeable stressed conditions; its short and long-term cash flow projections; and its cash holdings and access to other funding sources. The Board approved the appointment of the Liquidity Administrator Committee, comprising certain Trust officers and employees of the Adviser. The Liquidity Administrator Committee maintains Program oversight and reports to the Board on at least an annual basis regarding the Program’s operational effectiveness through a written report (the “Report”). The Program’s initial Report, which was presented to the Board for consideration at its meeting held on September 8, 2020, outlined the operation of the Program and the adequacy and effectiveness of the Program’s implementation. During the review period, the Fund did not experience unusual stress or disruption to its operations related to purchase and redemption activity. Also, during the review period the Fund held adequate levels of cash and highly liquid investments to meet shareholder redemption activities in accordance with applicable requirements. The Report concluded that the Program is reasonably designed to prevent violation of the Liquidity Rule and has been effectively implemented.
28
Report of Independent Registered Public Accounting Firm
To the Shareholders and the Board of Trustees of Cornerstone Capital Access Impact Fund
Opinion on the Financial Statements
We have audited the accompanying statement of assets and liabilities of Cornerstone Capital Access Impact Fund (the “Fund”) (one of the funds constituting Capitol Series Trust (the “Trust”)), including the schedule of investments, as of August 31, 2020, and the related statement of operations, statement of changes in net assets, and the financial highlights for the period from November 13, 2019 (commencement of operations) through August 31, 2020 and the related notes (collectively referred to as the “financial statements”). In our opinion, the financial statements present fairly, in all material respects, the financial position of the Fund (one of the funds constituting Capitol Series Trust) at August 31, 2020, the results of its operations, the changes in its net assets, and its financial highlights for the period from November 13, 2019 (commencement of operations) through August 31, 2020, in conformity with U.S. generally accepted accounting principles.
Basis for Opinion
These financial statements are the responsibility of the Trust’s management. Our responsibility is to express an opinion on the Fund’s financial statements based on our audits. We are a public accounting firm registered with the Public Company Accounting Oversight Board (United States) (PCAOB) and are required to be independent with respect to the Fund in accordance with the U.S. federal securities laws and the applicable rules and regulations of the Securities and Exchange Commission and the PCAOB.
We conducted our audit in accordance with the standards of the PCAOB. Those standards require that we plan and perform the audit to obtain reasonable assurance about whether the financial statements are free of material misstatement, whether due to error or fraud. The Trust is not required to have, nor were we engaged to perform, an audit of Trust’s internal control over financial reporting. As part of our audit we are required to obtain an understanding of internal control over financial reporting but not for the purpose of expressing an opinion on the effectiveness of the Trust’s internal control over financial reporting. Accordingly, we express no such opinion.
Our audits included performing procedures to assess the risks of material misstatement of the financial statements, whether due to error or fraud, and performing procedures that respond to those risks. Such procedures included examining, on a test basis, evidence regarding the amounts and disclosures in the financial statements. Our procedures included confirmation of securities owned as of August 31, 2020, by correspondence with the custodian and brokers or by other appropriate auditing procedures where replies from brokers were not received. Our audits also included evaluating the accounting principles
29
Report of Independent Registered Public Accounting Firm (continued)
used and significant estimates made by management, as well as evaluating the overall presentation of the financial statements. We believe that our audits provide a reasonable basis for our opinion.

We have served as the auditor of one or more Capitol Series Trust investment companies since 2017.
Cincinnati, Ohio
October 27, 2020
30
Summary of Fund Expenses (Unaudited)
As a shareholder of the Fund, you incur two types of costs: (1) transaction and (2) ongoing costs, including management fees and other Fund expenses. These examples are intended to help you understand your ongoing costs (in dollars) of investing in the Fund and to compare these costs with the ongoing costs of investing in other mutual funds. The example is based on an investment of $1,000 invested at the beginning of the period and held for the entire period from March 1, 2020 through August 31, 2020.
Actual Expenses
The first line of the table below provides information about actual account values and actual expenses. You may use the information in this line, together with the amount you invested, to estimate the expenses that you paid over the period. Simply divide your account value by $1,000 (for example, an $8,600 account value divided by $1,000 = 8.6), then multiply the result by the number in the first line under the heading entitled “Expenses Paid During Period” to estimate the expenses you paid on your account during this period.
Hypothetical Example for Comparison Purposes
The second line of the table below provides information about hypothetical account values and hypothetical expenses based on the Fund’s actual expense ratio and an assumed rate of return of 5% per year before expenses, which is not the Fund’s actual return. The hypothetical account values and expenses may not be used to estimate the actual ending account balance or expenses you paid for the period. You may use this information to compare the ongoing costs of investing in the Fund and other funds. To do so, compare this 5% hypothetical example with the 5% hypothetical examples that appear in the shareholder reports of other funds.
Expenses shown in the table are meant to highlight your ongoing costs only and do not reflect any transactional costs. Therefore, the second line of the table below is useful in comparing ongoing costs only and will not help you determine the relative costs of owning different funds. In addition, if transaction costs were included, your costs would have been higher.
| | | Beginning
Account Value
March 1,
2020 | Ending
Account Value
August 31,
2020 | Expenses Paid
During
Period(a) | Annualized
Expense
Ratio |
Cornerstone Capital Access Impact Fund | | | |
Institutional Class | Actual | $ 1,000.00 | $ 1,324.20 | $ 7.89 | 1.35% |
| | | | | | |
| | Hypothetical(b) | $ 1,000.00 | $ 1,018.35 | $ 6.85 | 1.35% |
(a) | Expenses are equal to the Fund’s annualized expense ratios, multiplied by the average account value over the period, multiplied by 184/366 (to reflect the one-half year period). |
(b) | Hypothetical assumes 5% annual return before expenses. |
31
Trustees and Officers (Unaudited)
The Board supervises the business activities of the Trust and is responsible for protecting the interests of shareholders. The Chairman of the Board is Walter B. Grimm, who is an Independent Trustee of the Trust.
Each Trustee serves as a Trustee for the lifetime of the Trust or until the earlier of his or her retirement as a Trustee at age 78, death, resignation or removal. Officers are re-elected annually by the Board. The address of each Trustee and officer is 225 Pictoria Drive, Suite 450, Cincinnati, Ohio 45246.
As of the date of this report, the Trustees oversee the operations of 14 series.
Interested Trustee Background. The following table provides information regarding the Interested Trustee.
Name, (Age), Position with Trust,
Term of Position with Trust | Principal Occupation During
Past 5 Years and Other Directorships |
Robert G. Dorsey* Birth Year: 1957 TRUSTEE Began Serving: March 2017 | Principal Occupation(s): Vice Chairman of Ultimus Fund Solutions, LLC and its subsidiaries, except as otherwise noted for the FINRA-regulated broker-dealer entities (February 2019 to present); Interested Trustee of Ultimus Managers Trust (February 2012 to present). Previous Position(s): Managing Director and Co-Chief Executive Officer of Ultimus Fund Solutions, LLC (1999 to February 2019); President of Ultimus Fund Distributors, LLC (1999 to 2018); President of Ultimus Managers Trust (February 2012 to October 2013). |
* | Mr. Dorsey is considered an “interested person” of the Trust within the meaning of Section 2(a)(19) of the 1940 Act because of his relationship with the Trust’s administrator, transfer agent, and distributors. |
Independent Trustee Background. The following table provides information regarding the Independent Trustees.
Name, (Age), Position with Trust,
Term of Position with Trust | Principal Occupation During
Past 5 Years and Other Directorships |
John C. Davis Birth Year: 1952 TRUSTEE Began Serving: July 2018 | Principal Occupations(s): Consultant (government services) since May 2011. Previous Position(s): Retired Partner of PricewaterhouseCoopers LLP (1974-2010); Consultant, Board of Trustees of Ultimus Managers Trust (2016 to 2019) and Former Trustee of Ultimus Managers Trust (2012 to 2016). |
32
Trustees and Officers (Unaudited) (continued)
Name, (Age), Position with Trust,
Term of Position with Trust | Principal Occupation During
Past 5 Years and Other Directorships |
Walter B. Grimm Birth Year: 1945 TRUSTEE AND CHAIR Began Serving: November 2013 | Principal Occupations(s): President, Leigh Management Group, LLC (consulting firm) (October 2005 to present); and President, Leigh Investments, Inc. (1988 to present). Previous Position(s): Chief Financial Officer, East West Private, LLC (consulting firm) (2009 to 2013). |
Lori Kaiser Birth Year: 1963 TRUSTEE Began Serving: July 2018 | Principal Occupations(s): Founder and CEO, Kaiser Consulting since 1992. |
Janet Smith Meeks Birth Year: 1955 TRUSTEE Began Serving: July 2018 | Principal Occupations(s): Co-Founder and CEO, Healthcare Alignment Advisors, LLC (consulting company) since August 2015. Previous Position(s): President and Chief Operating Officer, Mount Carmel St. Ann’s Hospital (2006 to 2015). |
Mary M. Morrow Birth Year: 1958 TRUSTEE Began Serving: November 2013 | Principal Occupations(s): Chief Operating Officer, Dignity Health Managed Services Organization (October 2018 to present). Previous Position(s): Consultant (managed care services) (April 2018 to September 2018); Chief Operating Officer, Pennsylvania Health and Wellness (fully owned subsidiary of Centene Corporation) (November 2016 to April 2018); Vice President, Strategic Initiatives, Gateway Heath (January 2015 to November 2016); Consulting Practice Manager, DST Health Solutions (August 2010 to January 2015). |
Officers. The following table provides information regarding the Officers.
Name, (Age), Position with Trust,
Term of Position with Trust | Principal Occupation During
Past 5 Years and Other Directorships |
Matthew J. Miller Birth Year: 1976 PRESIDENT and CHIEF EXECUTIVE
OFFICER Began Serving: September 2013 (as VP);
September 2018 (as President) | Principal Occupation(s): Assistant Vice President, Relationship Management, Ultimus Fund Solutions, LLC (December 2015 to present); Vice President, Valued Advisers Trust (December 2011 to present). Previous Position(s): Vice President, Relationship Management, Huntington Asset Services, Inc. (n/k/a Ultimus Asset Services, LLC) (2008 to December 2015). |
33
Trustees and Officers (Unaudited) (continued)
Name, (Age), Position with Trust,
Term of Position with Trust | Principal Occupation During
Past 5 Years and Other Directorships |
Zachary P. Richmond Birth Year: 1980 TREASURER AND CHIEF FINANCIAL OFFICER Began Serving: August 2014 | Principal Occupation(s): Vice President, Director of Financial Administration for Ultimus Fund Solutions, LLC (February 2019 to present). Previous Position(s): Assistant Vice President, Associate Director of Financial Administration for Ultimus Fund Solutions, LLC (December 2015 to February 2019); Manager, Fund Administration, Huntington Asset Services, Inc. (January 2011 to December 2015). |
Martin R. Dean Birth Year: 1963 CHIEF COMPLIANCE OFFICER Began Serving: May 2019 | Principal Occupation(s): Senior Vice President, Head of Fund Compliance, Ultimus Fund Solutions, LLC (January 2016 to present); Chief Compliance Officer, First Western Funds Trust (since April 2016); Chief Compliance Officer, Cross Shore Discovery Fund (since June 2016); Chief Compliance Officer, FSI Low Beta Absolute Return Fund (since November 2016); Chief Compliance Officer, Peachtree Alternative Strategies Fund (since January 2017); and Chief Compliance Officer, Dupree Mutual Funds (since August 2017). Previous Position(s): Senior Vice President and Compliance Group Manager, Huntington Asset Services, Inc. (July 2013 to December 2015). |
Matthew J. Beck Birth Year: 1988 SECRETARY Began Serving: September 2018 | Principal Occupation(s): Senior Attorney, Ultimus Fund Solutions, LLC (May 2018 to present). Previous Position(s): Chief Compliance Officer, OBP Capital, LLC (May 2015 to May 2018); Secretary, Aspiration Funds (March 2015 to May 2018); Secretary, Starboard Investment Trust (September 2014 to May 2018); Secretary, Leeward Investment Trust (September 2014 to May 2018); Secretary, Hillman Capital Management Investment Trust (September 2014 to May 2018); Secretary, Spinnaker ETF Series (September 2014 to May 2018); Vice President and General Counsel, The Nottingham Company (July 2014 to May 2018). |
34
FACTS | WHAT DOES CORNERSTONE CAPITAL ACCESS IMPACT FUND (THE “FUND”) DO WITH YOUR PERSONAL INFORMATION? |
| | |
Why? | Financial companies choose how they share your personal information. Federal law gives consumers the right to limit some but not all sharing. Federal law also requires us to tell you how we collect, share, and protect your personal information. Please read this notice carefully to understand what we do. |
| | |
What? | The types of personal information we collect and share depend on the product or service you have with us. This information can include: ■ Social Security number ■ account balances and account transactions ■ transaction or loss history and purchase history ■ checking account information and wire transfer instructions When you are no longer our customer, we continue to share your information as described in this notice. |
| | |
How? | All financial companies need to share customers’ personal information to run their everyday business. In the section below, we list the reasons financial companies can share their customers’ personal information; the reasons the Fund chooses to share; and whether you can limit this sharing. |
| | |
Reasons we can share your personal information | Does the Fund share? |
For our everyday business purposes—
such as to process your transactions, maintain your account(s), respond to court orders and legal investigations, or report to credit bureaus | Yes |
For our marketing purposes—
to offer our products and services to you | No |
For joint marketing with other financial companies | No |
For our affiliates’ everyday business purposes—
information about your transactions and experiences | No |
For our affiliates’ everyday business purposes—
information about your creditworthiness | No |
For nonaffiliates to market to you | No |
| | |
Questions? | Call (800) 986-6187 |
35
Who we are |
Who is providing this notice? | Cornerstone Capital Access Impact Fund
Ultimus Fund Distributors, LLC (Distributor)
Ultimus Fund Solutions, LLC (Administrator) |
What we do |
How does the Fund protect my personal information? | To protect your personal information from unauthorized access and use, we use security measures that comply with federal law. These measures include computer safeguards and secured files and buildings. Our service providers are held accountable for adhering to strict policies and procedures to prevent any misuse of your nonpublic personal information. |
How does the Fund collect my personal information? | We collect your personal information, for example, when you ■ open an account or deposit money ■ buy securities from us or sell securities to us ■ make deposits or withdrawals from your account or provide account information ■ give us your account information ■ make a wire transfer ■ tell us who receives the money ■ tell us where to send the money ■ show your government-issued ID ■ show your driver’s license |
Why can’t I limit all sharing? | Federal law gives you the right to limit only ■ sharing for affiliates’ everyday business purposes—information about your creditworthiness ■ affiliates from using your information to market to you ■ sharing for nonaffiliates to market to you State laws and individual companies may give you additional rights to limit sharing. |
Definitions |
Affiliates | Companies related by common ownership or control. They can be financial and nonfinancial companies. ■ Cornerstone Capital, Inc., the investment adviser to the Fund, could be deemed to be an affiliate. |
Nonaffiliates | Companies not related by common ownership or control. They can be financial and nonfinancial companies. ■ The Fund does not share your personal information with nonaffiliates so they can market to you. |
Joint marketing | A formal agreement between nonaffiliated financial companies that together market financial products or services to you. ■ The Fund doesn’t jointly market. |
36
This page is intentionally left blank.
Other Information
The Fund’s Statement of Additional Information (“SAI”) includes additional information about the trustees and is available without charge, upon request. You may call toll-free at (800) 986-6187 to request a copy of the SAI or to make shareholder inquiries.
Proxy Voting (Unaudited)
A description of the policies and procedures that the Fund uses to determine how to vote proxies relating to portfolio securities and information regarding how the Fund voted those proxies during the most recent twelve month period ended June 30, are available (1) without charge upon request by calling the Fund at (800) 986-6187 and (2) in Fund documents filed with the Securities and Exchange Commission (“SEC”) on the SEC’s website at www.sec.gov.
TRUSTEES
Walter B. Grimm, Chairman
John C. Davis
Robert G. Dorsey
Lori Kaiser
Janet Smith Meeks
Mary M. Morrow
OFFICERS
Matthew J. Miller, Chief Executive Officer and President
Zachary P. Richmond, Chief Financial Officer and Treasurer
Martin R. Dean, Chief Compliance Officer
Matthew J. Beck, Secretary
INVESTMENT ADVISER
Cornerstone Capital, Inc.
550 Fifth Avenue, 11th Floor
New York, NY 10036
DISTRIBUTOR
Ultimus Fund Distributors, LLC
225 Pictoria Drive, Suite 450
Cincinnati, OH 45246
INDEPENDENT REGISTERED PUBLIC ACCOUNTING FIRM
Ernst & Young LLP
221 East 4th Street, Suite 2900
Cincinnati, OH 45202
LEGAL COUNSEL
Bernstein Shur
100 Middle Street, 6th Floor
Portland, ME 04104
CUSTODIAN
Huntington National Bank
41 South High Street
Columbus, OH 43215
ADMINISTRATOR, TRANSFER AGENT AND FUND ACCOUNTANT
Ultimus Fund Solutions, LLC
225 Pictoria Drive, Suite 450
Cincinnati, OH 45246
This report is intended only for the information of shareholders or those who have received the Fund’s prospectus which contains information about the Fund’s management fee and expenses. Please read the prospectus carefully before investing.
Distributed by Ultimus Fund Distributors, LLC
Member FINRA/SIPC
Item 2. Code of Ethics.
As of the end of the period covered by this report, the registrant has adopted a code of ethics that applies to the registrant's principal executive officer, principal financial officer, principal accounting officer or controller, or persons performing similar functions, regardless of whether these individuals are employed by the registrant or a third party. Pursuant to Item 12(a)(1), a copy of registrant’s code of ethics is filed as an exhibit to this Form N-CSR. During the period covered by this report, the code of ethics has not been amended, and the registrant has not granted any waivers, including implicit waivers, from the provisions of the code of ethics.
Item 3. Audit Committee Financial Expert.
(a)(1) The registrant’s Board of Trustees has determined that the registrant has at least two audit committee financial experts serving on its audit committee.
(a)(2) The audit committee financial experts are Lori Kaiser and John C. Davis, who are both “independent” for purposes of this Item 3 of Form N-CSR.
Item 4. Principal Accountant Fees and Services.
(a) Audit Fees billed to the registrant by its principal accountants for the two most recent fiscal years:
| Preserver Alternative Opportunities Fund: | | | FY 2020 | | | $ | 15,000 | |
| | | | FY 2019 | | | $ | 21,000 | |
| Hedeker Strategic Appreciation Fund: | | | FY 2020 | | | $ | 14,000 | |
| | | | FY 2019 | | | $ | 19,500 | |
| Cornerstone Capital Access Impact Fund: | | | FY 2020 | | | $ | 12,950 | |
(b) Audit-Related Fees billed to the registrant by its principal accountants for the two most recent fiscal years:
| Preserver Alternative Opportunities Fund: | | | FY 2020 | | | $ | 0 | |
| | | | FY 2019 | | | $ | 0 | |
| Hedeker Strategic Appreciation Fund: | | | FY 2020 | | | $ | 0 | |
| | | | FY 2019 | | | $ | 0 | |
| Cornerstone Capital Access Impact Fund: | | | FY 2020 | | | $ | 0 | |
c) Tax Fees billed to the registrant by its principal accountants for the two most recent fiscal years:
| Preserver Alternative Opportunities Fund: | | | FY 2020 | | | $ | 3,700 | |
| | | | FY 2019 | | | $ | 5,150 | |
| Hedeker Strategic Appreciation Fund: | | | FY 2020 | | | $ | 3,700 | |
| | | | FY 2019 | | | $ | 5,150 | |
| Cornerstone Capital Access Impact Fund: | | | FY 2020 | | | $ | 3,700 | |
Nature of the fees: Preparation of the 1120 RIC and Excise review
(d) All other fees billed to the registrant by its principal accountants for the two most recent fiscal years:
| Preserver Alternative Opportunities Fund: | | | FY 2020 | | | $ | 0 | |
| | | | FY 2019 | | | $ | 0 | |
| Hedeker Strategic Appreciation Fund: | | | FY 2020 | | | $ | 0 | |
| | | | FY 2019 | | | $ | 0 | |
| Cornerstone Capital Access Impact Fund: | | | FY 2020 | | | $ | 0 | |
| (e)(1) | Audit Committee’s Pre-Approval Policies |
The Audit Committee Charter requires the Audit Committee to be responsible for the selection, retention or termination of auditors and, in connection therewith, to (i) evaluate the proposed fees and other compensation, if any, to be paid to the auditors, (ii) evaluate the independence of the auditors, (iii) pre-approve all audit services and, when appropriate, any non-audit services provided by the independent auditors to the Trust, (iv) pre-approve, when appropriate, any non-audit services provided by the independent auditors to the Trust's investment adviser, or any entity controlling, controlled by, or under common control with the investment adviser and that provides ongoing services to the Trust if the engagement relates directly to the operations and financial reporting of the Trust, and (v) receive the auditors’ specific representations as to their independence;
(2) All of the services described in paragraphs (b) through (d) of Item 4 were pre-approved by the Audit Committee.
(f) During audit of registrant's financial statements for the most recent fiscal year, less than 50 percent of the hours expended on the principal accountant's engagement were attributed to work performed by persons other than the principal accountant's full-time, permanent employees.
(g) The aggregate non-audit fees billed by the registrant's accountant for services rendered to the registrant, and rendered to the registrant's investment adviser (not including any sub-adviser whose role is primarily portfolio management and is subcontracted with or overseen by another investment adviser), and any entity controlling, controlled by, or under common control with the adviser that provides ongoing services to the registrant:
| | | | Registrant | | | Adviser | |
| | FY 2020 | | | $ | 11,100 | | | $ | 0 | |
| | FY 2019 | | | $ | 10,300 | | | $ | 0 | |
(h) Not applicable. The auditor performed no services for the registrant’s investment adviser or any entity controlling, controlled by, or under common control with the investment adviser that provides ongoing services to the registrant.
Item 5. Audit Committee of Listed Registrants.
NOT APPLICABLE – applies to listed companies only
Item 6. Schedule of Investments.
Schedules filed with Item 1.
Item 7. Disclosure of Proxy Voting Policies and Procedures for Closed-End Management Investment Companies.
NOT APPLICABLE – applies to closed-end funds only
Item 8. Portfolio Managers of Closed-End Management Investment Companies.
NOT APPLICABLE – applies to closed-end funds only
Item 9. Purchases of Equity Securities by Closed-End Management Investment Company and Affiliated Purchasers.
NOT APPLICABLE – applies to closed-end funds only
Item 10. Submission of Matters to a Vote of Security Holders.
The guidelines applicable to shareholders desiring to submit recommendations for nominees to the Registrant's board of trustees are contained in the statement of additional information of the Trust with respect to the Fund(s) for which this Form N-CSR is being filed.
Item 11. Controls and Procedures.
(a) Based on their evaluation of the registrant’s disclosure controls and procedures (as defined in Rule 30a-3(c) under the Investment Company Act of 1940, as amended (the “Act”)) as of a date within 90 days of the filing date of this report, the registrant’s principal executive officer and principal financial officer have concluded that such disclosure controls and procedures are reasonably designed and are operating effectively to ensure that material information relating to the registrant is made known to them by others within those entities, particularly during the period in which this report is being prepared, and that the information required in filings on Form N-CSR is recorded, processed, summarized, and reported on a timely basis.
(b) There were no changes in the registrant’s internal control over financial reporting (as defined in Rule 30a-3(d) under the Investment Company Act of 1940) that occurred during the second fiscal quarter of the period covered by this report that have materially affected, or are reasonably likely to materially affect, the registrant’s internal control over financial reporting.
Item 12. Disclosure of Securities Lending Activities for Closed-End Management Investment Companies.
Not applicable.
Item 13. Exhibits.
SIGNATURES
Pursuant to the requirements of the Securities Exchange Act of 1934 and the Investment Company Act of 1940, the registrant has duly caused this report to be signed on its behalf by the undersigned, thereunto duly authorized.
| (Registrant) | Capitol Series Trust | | |
| | | | |
| By (Signature and Title) | /s/ Matthew J. Miller | |
| | | Matthew J. Miller, Chief Executive Officer and President | |
| | | | |
| Date: | 10/29/2020 | | |
| | | | |
| Pursuant to the requirements of the Securities Exchange Act of 1934 and the Investment Company Act of 1940, this report has been signed below by the following persons on behalf of the registrant and in the capacities and on the dates indicated. |
| | | | |
| By (Signature and Title) | /s/ Matthew J. Miller | |
| | | Matthew J. Miller, Chief Executive Officer and President | |
| | | | |
| Date: | 10/29/2020 | | |
| | | | |
| By (Signature and Title) | /s/ Zachary P. Richmond | |
| | | Zachary P. Richmond, Treasurer and Chief Financial Officer | |
| | | | |
| Date | 10/29/2020 | | |