UNITED STATES
SECURITIES AND EXCHANGE COMMISSION
Washington, D.C. 20549
FORM N-CSR
CERTIFIED SHAREHOLDER REPORT OF REGISTERED
MANAGEMENT INVESTMENT COMPANIES
Investment Company Act file number: 811-22895
Capitol Series Trust
(Exact name of registrant as specified in charter)
Ultimus Fund Solutions, LLC
225 Pictoria Drive, Suite 450
Cincinnati, OH 45246
(Address of principal executive offices) (Zip code)
Zachary P. Richmond
Ultimus Fund Solutions, LLC
225 Pictoria Drive, Suite 450
Cincinnati, OH 45246
(Name and address of agent for service)
Registrant’s telephone number, including area code:513-587-3400
Date of fiscal year end:September 30
Date of reporting period:September 30, 2019
Item 1. Reports to Stockholders.
Fuller & Thaler Behavioral Small-Cap Equity Fund
Fuller & Thaler Behavioral Small-Cap Growth Fund
Fuller & Thaler Behavioral Mid-Cap Value Fund
Fuller & Thaler Behavioral Unconstrained Equity Fund
Fuller & Thaler Behavioral Small-Mid Core Equity Fund
Fuller & Thaler Behavioral Micro-Cap Equity Fund
Annual Report
September 30, 2019
Beginning on January 1, 2021, as permitted by regulations adopted by the Securities and Exchange Commission, paper copies of the Fund’s shareholder reports like this one will no longer be sent by mail, unless you specifically request paper copies of the reports from the Fund or from your financial intermediary such as a broker-dealer or bank. Instead, the reports will be made available on a website, and you will be notified by mail each time a report is posted and provided with a website link to access the report.
If you already elected to receive shareholder reports electronically, you will not be affected by this change and you need not take any action. You may elect to receive shareholder reports and other communications from the Fund electronically by contacting the Fund at (888) 912-4562 or, if you own these shares through a financial intermediary, you may contact your financial intermediary.
You may elect to receive all future reports in paper free of charge. You can inform the Fund that you wish to continue receiving paper copies of your shareholder reports by contacting the Fund at (888) 912-4562. If you own shares through a financial intermediary, you may contact your financial intermediary or follow instructions included with this document to elect to continue to receive paper copies of your shareholder reports. Your election to receive reports in paper will apply to all funds held with the fund complex or at your financial intermediary.

411 Borel Avenue, Suite 300
San Mateo, CA 94402
(888) 912-4562
Fuller & Thaler Funds
Management’s Discussion of Fund Performance (Unaudited)
September 30, 2019
Dear Shareholders:
As you may know, Fuller & Thaler’s investment process is based on decades of research into behavioral finance. Our very own Dr. Richard Thaler won the 2017 Nobel Prize® in Economics for his research on behavioral finance. Behavioral finance is the study of how investors actually behave, as opposed to how they should behave, when making investment decisions. Professional investors are human, and like all humans, they make mistakes. Investors make mistakes because they have emotions, use imperfect rules-of thumb, and have priorities beyond risk and return. We look for those mistakes. We predict when other investors – the “market” – have likely made a behavioral mistake, and in turn, have created a buying opportunity.
There are two kinds of mistakes that produce buying opportunities: over-reaction and under reaction. Other investors may over-react to bad news and losses (e.g., panic). Or investors may underreact to good news (e.g., not pay attention). At the individual stock level, we search for events that suggest this type of investor misbehavior. If these behaviors are present, we then analyze fundamentals. In summary, if an investor mistake is likely and the company has solid fundamentals – we buy the stock.
Our value strategies buy when others have likely over-reacted to bad news. Our growth strategies buy when others have likely under-reacted to good news. Our blend strategies combine both insights.
Our Funds deliver similar risk characteristics to their benchmarks. We believe our behavioral insights provide us with an opportunity to outperform.
Our behavioral process delivers returns primarily through stock selection. In general, we aim to deliver portfolios with similar sector composition and risk characteristics to that of each benchmark, but we will deviate when stock-specific opportunities arise.
For the 12-month period ended September 30, 2019, our Funds performed as follows:
The Institutional Shares of the Fuller & Thaler Behavioral Small-Cap Equity Fund returned -4.65% for the year. The Fund outperformed its U.S. small-cap equity benchmark, the Russell 2000® Index (-8.89%) by 4.24% over that period. The strongest performing stocks in the Fund during the period were Bruker Corp., Jabil, Inc., and Helen of Troy Ltd., while the weakest performers were Blucora, Inc., Tenneco, Inc., and Trinseo SA.
The Institutional Shares of the Fuller & Thaler Behavioral Small-Cap Growth Fund returned -19.46% for the year. The Fund underperformed its U.S. small-cap growth benchmark, the Russell 2000® Growth Index (-9.63%) by 9.83% over that period. The strongest performing stocks in the Fund during the period were Roku, Inc., SendGrid, Inc., and FTI Consulting, Inc., while the weakest performers were Sarepta Therapeutics, Inc., Staar Surgical Co., and Green Dot Corp.
The Institutional Shares of the Fuller & Thaler Behavioral Mid-Cap Value Fund returned 5.09% for the year. The Fund outperformed its U.S. mid-cap value benchmark, the Russell Mid-Cap® Value Index (1.60%) by 3.49% over that period. The strongest performing stocks in the Fund during the period were Crown Holdings, Inc., Dollar General Corp., and Dollar Tree, Inc., while the weakest performers were Antero Resources Corp., Patterson-UTI Energy, Inc., and Centene Corp.
1
Fuller & Thaler Funds
Management’s Discussion of Fund Performance (Unaudited) (Continued)
September 30, 2019
The Fuller & Thaler Behavioral Unconstrained Equity Fund commenced operations on December 26, 2018. For the since inception period ended September 30, 2019, the Institutional Shares of the Fund returned 29.05%. The Fund outperformed its U.S. all-cap benchmark, the Russell 3000® Index (22.06%) by 6.99% over that period. The strongest performing stocks in the Fund during the period were Cabot Microelectronics Corp., NewMarket Corp., and Generac Holdings, Inc., while the weakest performers were Xilinx, Inc., VeriSign, Inc., and Cooper-Standard Holdings, Inc.
The Fuller & Thaler Behavioral Small-Mid Core Equity Fund commenced operations on December 26, 2018. For the since inception period ended September 30, 2019, the Institutional Shares of the Fund returned 19.80%. The Fund outperformed its U.S. small-mid cap benchmark, the Russell 2500® Index (19.60%) by 0.20% over that period. The strongest performing stocks in the Fund during the period were Cabot Microelectronics Corp., NewMarket Corp., and STORE Capital Corp., while the weakest performers were ICU Medical, Inc., Altra Industrial Motion Corp., and Mohawk Industries, Inc.
The Fuller & Thaler Behavioral Micro-Cap Equity Fund commenced operations on December 28, 2018. For the since inception period ended September 30, 2019, the Institutional Shares of the Fund returned 8.50%. The Fund underperformed its U.S. micro-cap benchmark, the Russell MicroCap Index (8.79%) by 0.29% over that period. The strongest performing stocks in the Fund during the period were The Rubicon Project, Inc., Cardlytics, Inc., and Investors Real Estate Trust, while the weakest performers were Verso Corp., Everi Holdings, Inc., and Fluidigm Corp.
Looking forward, we see many opportunities. We believe that our unique, behaviorally driven investment process will continue to identify these opportunities and allow our Funds to outperform both our peers and our benchmark.
Finally, we thank you for your investments in our Funds.
Nobel Prize® is a trademark of the Nobel Foundation.
2
Investment Results (Unaudited)
Average Annual Total Returns* as of September 30, 2019
| | One Year | Three Year | Five Year | Since
Inception
(9/8/11) | Since
Inception
(12/19/18) |
Fuller & Thaler Behavioral Small-Cap Equity Fund | | | |
R6 Shares | -4.54% | 10.69% | 9.67% | 14.35% | |
Institutional Shares | -4.65% | 10.57% | 9.52% | 14.20% | |
Investor Shares | -4.89% | 10.33% | 9.32% | 13.98% | |
A Shares | | | | | 19.29% |
C Shares | | | | | 18.72% |
Russell 2000® Index(a) | -8.89% | 8.23% | 8.19% | 11.78% | 14.22% |
| | R6 Shares | Institutional
Shares | Investor
Shares | A Shares | C Shares |
Expense Ratios(b) | 0.75% | 0.85% | 1.14% | 1.25% | 1.75% |
The performance quoted represents past performance, which does not guarantee future results. The investment return and principal value of an investment will fluctuate so that an investor’s shares, when redeemed, may be worth more or less than their original cost. The returns shown do not reflect the deduction of taxes that a shareholder would pay on Fuller & Thaler Behavioral Small-Cap Equity Fund (the “Small-Cap Equity Fund”) distributions or the redemption of Small-Cap Equity Fund shares. Current performance of the Small-Cap Equity Fund may be lower or higher than the performance quoted. The Small-Cap Equity Fund’s investment objectives, risks, charges and expenses must be considered carefully before investing. Performance data current to the most recent month end may be obtained by calling (888) 912-4562.
* Return figures reflect any change in price per share and assume the reinvestment of all distributions. The Small-Cap Equity Fund’s returns reflect any fee waivers during the applicable periods. If such fee waivers had not occurred, the quoted performance would have been lower. Total returns for periods less than 1 year are not annualized. A Shares and C Shares performance have not been adjusted to include sales charges that may apply. If sales charges were reflected, the performance quoted would be lower. Prior to October 26, 2015, the performance reflected represents that of a series of Allianz Funds Multi-Strategy Trust for which Fuller & Thaler Asset Management, Inc. (the “Adviser”) served as the sole sub-adviser (“the Predecessor Fund”) (see Note 1).
(a) The Russell 2000® Index (“Russell 2000”) is a widely recognized unmanaged index of equity securities and is representative of a broader domestic equity market and range of securities than is found in the Small-Cap Equity Fund’s portfolio. The Russell 2000 measures the performance of the small cap segment of the U.S. equity universe. The Russell 2000 is a subset of the Russell 3000® Index and represents approximately 10% of total market capitalization of that index. Individuals cannot invest directly in an index; however, an individual can invest in exchange traded funds or other investment vehicles that attempt to track the performance of a benchmark index.
(b) The expense ratios are from the Small-Cap Equity Fund’s most recent prospectus dated December 19, 2018. The Adviser has contractually agreed to waive its management fee and/or reimburse Small-Cap Equity Fund expenses so that total annual operating expenses do not exceed 1.30%, 1.80%, 1.25%, 0.99% and 0.80% for A Shares, C Shares, Investor Shares, Institutional Shares and R6 Shares, respectively, of the average daily net assets for each class through January 31, 2020. Previously, effective February 1, 2018 through the effective date of the most recent prospectus, the Adviser had contractually agreed to waive its management fee and/or reimburse Small-Cap Equity Fund expenses so that total annual operating expenses do not exceed 1.25%, 0.97% and 0.80% for Investor Shares, Institutional Shares and R6 Shares, respectively, of the Small-Cap Equity Fund’s average daily net assets. Previously effective February 1, 2017 to January 1, 2018, the Adviser had contractually agreed to waive its management fee and/or reimburse Small-Cap Equity Fund Expenses so that total annual operating expenses to not exceed 1.05%, 0.90%, and 0.80% for Investor Shares, Institutional Shares and R6 Shares, respectively, of the Small-Cap Equity Fund’s average daily net assets. The expense limitation does not apply to (i) interest; (ii) taxes; (iii) brokerage fees and commissions; (iv) other
3
Investment Results (Unaudited) (continued)
extraordinary expenses not incurred in the ordinary course of the Small-Cap Equity Fund’s business; and (v) indirect expenses such as acquired fund fees and expenses. During any fiscal year that the Investment Advisory Agreement between the Adviser and Capitol Series Trust (the “Trust”) is in effect, the Adviser may recoup the sum of all fees previously waived or expenses reimbursed, less any reimbursement previously paid, provided that the Adviser is only permitted to recoup fees or expenses within 36 months from the date the fee waiver or expense reimbursement occurred and provided further that such recoupment can be achieved within the Expense Limitation Agreement currently in effect and the Expense Limitation Agreement in place when the waiver/reimbursement occurred. The Expense Limitation Agreement may not be terminated by the Adviser prior to its expiration date, but the Board of Trustees of the Trust (the “Board”) may terminate such agreement at any time. The Expense Limitation Agreement shall terminate automatically upon the termination of the Advisory Agreement. Additional information pertaining to the Small-Cap Equity Fund’s expense ratios as of September 30, 2019 can be found in the financial highlights.
Comparison of the Growth of a $1,000,000 Investment in the Fuller & Thaler Behavioral Small-Cap Equity Fund - R6 Shares and the Russell 2000® Index.

The chart above assumes an initial investment of $1,000,000 made on September 8, 2011 (commencement of operations) and held through September 30, 2019.THE SMALL-CAP EQUITY FUND’S RETURNS REPRESENT PAST PERFORMANCE AND DO NOT GUARANTEE FUTURE RESULTS. The returns shown do not reflect deduction of taxes that a shareholder would pay on the Small-Cap Equity Fund’s distributions or the redemption of the Small-Cap Equity Fund’s shares. Investment returns and principal values will fluctuate so that your shares, when redeemed, may be worth more or less than their original purchase price.
Current performance may be lower or higher than the performance data quoted. For more information on the Small-Cap Equity Fund, and to obtain performance data current to the most recent month-end, or to request a prospectus, please call (888) 912-4562. You should carefully consider the investment objectives, potential risks, management fees, and charges and expenses of the Small-Cap Equity Fund before investing. The Small-Cap Equity Fund’s prospectus contains this and other information about the Small-Cap Equity Fund, and should be read carefully before investing.
Prior to October 26, 2015, the performance reflected represents that of the Allianz Funds Multi-Strategy Trust for which the Adviser served as the sole sub-adviser (see Note 1). Visitwww.fullerthalerfunds.com for more current performance information.
The Small-Cap Equity Fund is distributed by Unified Financial Securities, LLC, Member FINRA/SIPC.
4
Investment Results (Unaudited) (continued)
Average Annual Total Returns* as of September 30, 2019
| | One Year | Since
Inception
(12/21/17) | Since
Inception
(12/19/18) |
Fuller & Thaler Behavioral Small-Cap Growth Fund | | | |
R6 Shares | -19.37% | 4.78% | |
Institutional Shares | -19.46% | 4.68% | |
Investor Shares | -19.64% | 4.43% | |
A Shares | | | 10.21% |
C Shares | | | 9.80% |
Russell 2000® Growth Index(a) | -9.63% | 2.29% | 15.89% |
| | Expense Ratios(b) |
| | R6 Shares | Institutional
Shares | Investor
Shares | A Shares | C Shares |
Gross | 4.42% | 4.55% | 4.77% | 4.92% | 5.42% |
With Applicable Waivers | 0.90% | 0.99% | 1.25% | 1.30% | 1.80% |
The performance quoted represents past performance, which does not guarantee future results. The investment return and principal value of an investment will fluctuate so that an investor’s shares, when redeemed, may be worth more or less than their original cost. The returns shown do not reflect the deduction of taxes that a shareholder would pay on Fuller & Thaler Behavioral Small-Cap Growth Fund (the “Small-Cap Growth Fund”) distributions or the redemption of Small-Cap Growth Fund shares. Current performance of the Small-Cap Growth Fund may be lower or higher than the performance quoted. The Small-Cap Growth Fund’s investment objectives, risks, charges and expenses must be considered carefully before investing. Performance data current to the most recent month end may be obtained by calling (888) 912-4562.
* Return figures reflect any change in price per share and assume the reinvestment of all distributions. The Small-Cap Growth Fund’s returns reflect any fee waivers during the applicable periods. If such fee waivers had not occurred, the quoted performance would have been lower. Total returns for periods less than 1 year are not annualized. A Shares and C Shares performance have not been adjusted to include sales charges that may apply. If sales charges were reflected, the performance quoted would be lower.
(a) The Russell 2000® Growth Index (“Russell 2000 Growth”) is a widely recognized unmanaged index of equity securities and is representative of a broader domestic equity market and range of securities than is found in the Small-Cap Growth Fund’s portfolio. Russell 2000 Growth measures the performance of those Russell 2000 companies with higher price/book ratios and higher forecasted growth values. Individuals cannot invest directly in an index; however, an individual can invest in exchange traded funds or other investment vehicles that attempt to track the performance of a benchmark index.
(b) The expense ratios are from the Small-Cap Growth Fund’s most recent prospectus dated December 19, 2018. The Adviser has contractually agreed to waive its management fee and/or reimburse Small-Cap Growth Fund expenses so that total annual operating expenses do not exceed 1.30%, 1.80% 1.25%, 0.99%, and 0.90% for A Shares, C Shares, Investor Shares, Institutional Shares and R6 Shares, respectively, of the average daily net assets for each class through January 31, 2020. Previously, effective December 20, 2017 through the effective date of the most recent prospectus, the Adviser had contractually agreed to waive its management fee and/or reimburse Small-Cap Growth Fund expenses so that total annual operating expenses do not exceed 1.24%, 0.99% and 0.90% for Investor Shares, Institutional Shares and R6 Shares, respectively, of the Fund’s average daily net assets. The expense limitation does not apply to (i) interest; (ii) taxes; (iii) brokerage fees and commissions; (iv) other extraordinary expenses not incurred in the ordinary course of the Small-Cap Growth Fund’s business; and (v) indirect expenses such as acquired fund fees and expenses. During any fiscal year that the Investment Advisory Agreement between the Adviser and the Trust is in
5
Investment Results (Unaudited) (continued)
effect, the Adviser may recoup the sum of all fees previously waived or expenses reimbursed, less any reimbursement previously paid, provided that the Adviser is only permitted to recoup fees or expenses within 36 months from the date the fee waiver or expense reimbursement occurred and provided further that such recoupment can be achieved within the Expense Limitation Agreement currently in effect and the Expense Limitation Agreement in place when the waiver/reimbursement occurred. The Expense Limitation Agreement may not be terminated by the Adviser prior to its expiration date, but the Board may terminate such agreement at any time. The Expense Limitation Agreement shall terminate automatically upon the termination of the Advisory Agreement. Additional information pertaining to the Small-Cap Growth Fund’s expense ratios as of September 30, 2019 can be found in the financial highlights.
Comparison of the Growth of a $1,000,000 Investment in the Fuller & Thaler Behavioral Small-Cap Growth Fund - R6 Shares and the Russell 2000® Growth Index.
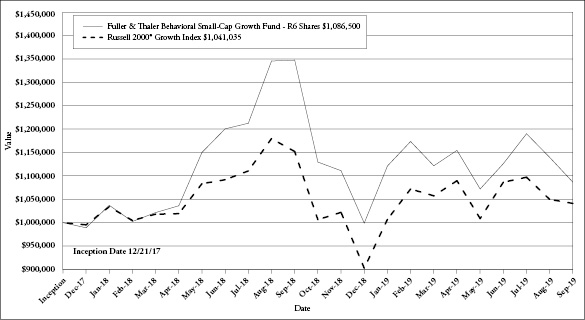
The chart above assumes an initial investment of $1,000,000 made on December 21, 2017 (commencement of operations) and held through September 30, 2019.THE SMALL-CAP GROWTH FUND’S RETURNS REPRESENT PAST PERFORMANCE AND DO NOT GUARANTEE FUTURE RESULTS. The returns shown do not reflect deduction of taxes that a shareholder would pay on the Small-Cap Growth Fund’s distributions or the redemption of the Small-Cap Growth Fund’s shares. Investment returns and principal values will fluctuate so that your shares, when redeemed, may be worth more or less than their original purchase price.
Current performance may be lower or higher than the performance data quoted. For more information on the Small-Cap Growth Fund, and to obtain performance data current to the most recent month-end, or to request a prospectus, please call (888) 912-4562. You should carefully consider the investment objectives, potential risks, management fees, and charges and expenses of the Small-Cap Growth Fund before investing. The Small-Cap Growth Fund’s prospectus contains this and other information about the Small-Cap Growth Fund, and should be read carefully before investing. Visit www.fullerthalerfunds.com for more current performance information.
The Small-Cap Growth Fund is distributed by Unified Financial Securities, LLC, Member FINRA/SIPC.
6
Investment Results (Unaudited) (continued)
Average Annual Total Returns* as of September 30, 2019
| | One Year | Since
Inception
(12/21/17) |
Fuller & Thaler Behavioral Mid-Cap Value Fund | | |
R6 Shares | 5.23% | 4.53% |
Institutional Shares | 5.09% | 4.45% |
Investor Shares | 4.84% | 4.14% |
Russell Midcap® Value Index(a) | 1.60% | 2.84% |
| | Expense Ratios(b) |
| | R6 Shares | Institutional
Shares | Investor
Shares |
Gross | 4.29% | 4.41% | 4.65% |
With Applicable Waivers | 0.80% | 0.90% | 1.15% |
The performance quoted represents past performance, which does not guarantee future results. The investment return and principal value of an investment will fluctuate so that an investor’s shares, when redeemed, may be worth more or less than their original cost. The returns shown do not reflect the deduction of taxes that a shareholder would pay on Fuller & Thaler Behavioral Mid-Cap Value Fund (the “Mid-Cap Value Fund”) distributions or the redemption of Mid-Cap Value Fund shares. Current performance of the Mid-Cap Value Fund may be lower or higher than the performance quoted. The Mid-Cap Value Fund’s investment objectives, risks, charges and expenses must be considered carefully before investing. Performance data current to the most recent month end may be obtained by calling (888) 912-4562.
* Return figures reflect any change in price per share and assume the reinvestment of all distributions. The Mid-Cap Value Fund’s returns reflect any fee waivers during the applicable periods. If such fee waivers had not occurred, the quoted performance would have been lower.
(a) The Russell Midcap® Value Index (“Russell Midcap Value”) is a widely recognized unmanaged index of equity securities and is representative of a broader domestic equity market and range of securities than is found in the Mid-Cap Value Fund’s portfolio. The Russell Midcap Value measures the performance of those Russell Midcap companies with lower price/book ratios and lower forecasted growth values. Individuals cannot invest directly in an index; however, an individual can invest in exchange traded funds or other investment vehicles that attempt to track the performance of a benchmark index.
(b) The expense ratios are from the Mid-Cap Value Fund’s most recent prospectus dated December 19, 2018. The Adviser has contractually agreed to waive its management fee and/or reimburse Mid-Cap Value Fund expenses so that total annual operating expenses do not exceed 1.15%, 0.90%, and 0.80% for Investor Shares, Institutional Shares and R6 Shares, respectively, of the average daily net assets for each class through January 31, 2020. Previously, effective December 20, 2017 through the effective date of the most recent prospectus, the Adviser had contractually agreed to waive its management fee and/or reimburse Mid-Cap Value Fund expenses so that total annual operating expenses do not exceed 1.14%, 0.89% and 0.80% for Investor Shares, Institutional Shares and R6 Shares, respectively, of the Mid-Cap Value Fund’s average daily net assets. The expense limitation does not apply to: (i) interest; (ii) taxes; (iii) brokerage fees and commissions; (iv) other extraordinary expenses not incurred in the ordinary course of the Mid-Cap Value Fund’s business; and (v) indirect expenses such as acquired fund fees and expenses. During any fiscal year that the Investment Advisory Agreement between the Adviser and the Trust is in effect, the Adviser may recoup the sum of all fees previously waived or expenses reimbursed, less any reimbursement previously paid, provided that the Adviser is only permitted to recoup fees or expenses within 36 months from the date the fee waiver or expense reimbursement occurred and provided further that such recoupment can be achieved within the Expense Limitation Agreement currently in effect and the Expense Limitation Agreement in place when the waiver/reimbursement occurred. This Expense Limitation Agreement may not be terminated by the Adviser prior to its expiration date, but the Board may
7
Investment Results (Unaudited) (continued)
terminate such agreement at any time. The Expense Limitation Agreement shall terminate automatically upon the termination of the Advisory Agreement. Additional information pertaining to the Mid-Cap Value Fund’s expense ratios as of September 30, 2019 can be found in the financial highlights.
Comparison of the Growth of a $1,000,000 Investment in the Fuller & Thaler Behavioral Mid-Cap Value Fund - R6 Shares and the Russell MidCap® Value Index.
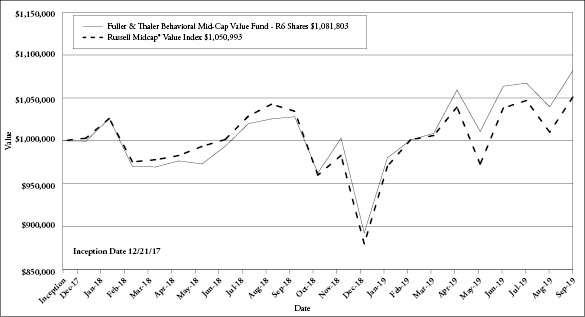
The chart above assumes an initial investment of $1,000,000 made on December 21, 2017 (commencement of operations) and held through September 30, 2019.THE MID-CAP VALUE FUND’S RETURNS REPRESENT PAST PERFORMANCE AND DO NOT GUARANTEE FUTURE RESULTS. The returns shown do not reflect deduction of taxes that a shareholder would pay on the Mid-Cap Value Fund’s distributions or the redemption of the Mid-Cap Value Fund’s shares. Investment returns and principal values will fluctuate so that your shares, when redeemed, may be worth more or less than their original purchase price.
Current performance may be lower or higher than the performance data quoted. For more information on the Mid-Cap Value Fund, and to obtain performance data current to the most recent month-end, or to request a prospectus, please call (888) 912-4562. You should carefully consider the investment objectives, potential risks, management fees, and charges and expenses of the Mid-Cap Value Fund before investing. The Mid-Cap Value Fund’s prospectus contains this and other information about the Mid-Cap Value Fund, and should be read carefully before investing. Visit www.fullerthalerfunds.com for more current performance information.
The Mid-Cap Value Fund is distributed by Unified Financial Securities, LLC, Member FINRA/SIPC.
8
Investment Results (Unaudited) (continued)
Total Returns* as of September 30, 2019
| | Since
Inception
(12/26/18) |
Fuller & Thaler Behavioral Unconstrained Equity Fund | |
R6 Shares | 29.15% |
Institutional Shares | 29.05% |
Russell 3000® Index(a) | 22.06% |
| | Expense Ratios(b) |
| | R6 Shares | Institutional
Shares |
Gross | 2.22% | 2.42% |
With Applicable Waivers | 0.90% | 0.99% |
The performance quoted represents past performance, which does not guarantee future results. The investment return and principal value of an investment will fluctuate so that an investor’s shares, when redeemed, may be worth more or less than their original cost. The returns shown do not reflect the deduction of taxes that a shareholder would pay on Fuller & Thaler Behavioral Unconstrained Equity Fund (the “Unconstrained Equity Fund”) distributions or the redemption of Unconstrained Equity Fund shares. Current performance of the Unconstrained Equity Fund may be lower or higher than the performance quoted. The Unconstrained Equity Fund’s investment objectives, risks, charges and expenses must be considered carefully before investing. Performance data current to the most recent month end may be obtained by calling (888) 912-4562.
* Return figures reflect any change in price per share and assume the reinvestment of all distributions. The Unconstrained Equity Fund’s returns reflect any fee waivers during the applicable periods. If such fee waivers had not occurred, the quoted performance would have been lower. Total returns for periods less than 1 year are not annualized.
(a) The Russell 3000® Index (“Russell 3000”) measures the performance of the broad U.S. equity market. The Russell 3000 represents the 3000 largest U.S. publicly traded companies as measured by market capitalization. Individuals cannot invest directly in an index; however, an individual can invest in exchange traded funds or other investment vehicles that attempt to track the performance of a benchmark index.
(b) The expense ratios are from the Unconstrained Equity Fund’s most recent prospectus dated December 19, 2018. The Adviser has contractually agreed to waive its management fee and/or reimburse Unconstrained Equity Fund expenses so that total annual operating expenses do not exceed 0.99% and 0.90% for Institutional Shares and R6 Shares, respectively, of the average daily net assets for each class through January 31, 2020. The expense limitation does not apply to: (i) interest; (ii) taxes; (iii) brokerage fees and commissions; (iv) other extraordinary expenses not incurred in the ordinary course of the Unconstrained Equity Fund’s business; and (v) indirect expenses such as acquired fund fees and expenses. During any fiscal year that the Investment Advisory Agreement between the Adviser and the Trust is in effect, the Adviser may recoup the sum of all fees previously waived or expenses reimbursed, less any reimbursement previously paid, provided that the Adviser is only permitted to recoup fees or expenses within 36 months from the date the fee waiver or expense reimbursement occurred and provided further that such recoupment can be achieved within the Expense Limitation Agreement currently in effect and the Expense Limitation Agreement in place when the waiver/reimbursement occurred. This Expense Limitation Agreement may not be terminated by the Adviser prior to its expiration date, but the Board may terminate such agreement at any time. The Expense Limitation Agreement shall terminate automatically upon the termination of the Advisory Agreement. Additional information pertaining to the Unconstrained Equity Fund’s expense ratios as of September 30, 2019 can be found in the financial highlights.
9
Investment Results (Unaudited) (continued)
Comparison of the Growth of a $1,000,000 Investment in the Fuller & Thaler Behavioral Unconstrained Equity Fund - R6 Shares and the Russell 3000® Index.
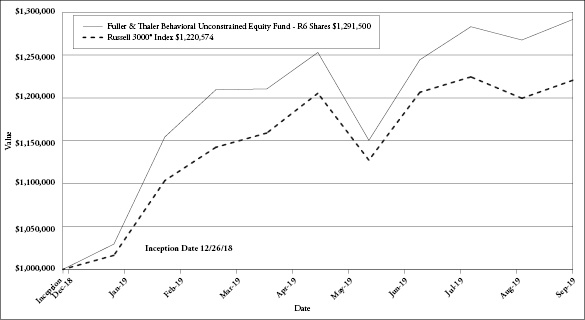
The chart above assumes an initial investment of $1,000,000 made on December 26, 2018 (commencement of operations) and held through September 30, 2019.THE UNCONSTRAINED EQUITY FUND’S RETURNS REPRESENT PAST PERFORMANCE AND DO NOT GUARANTEE FUTURE RESULTS. The returns shown do not reflect deduction of taxes that a shareholder would pay on the Unconstrained Equity Fund’s distributions or the redemption of the Unconstrained Equity Fund’s shares. Investment returns and principal values will fluctuate so that your shares, when redeemed, may be worth more or less than their original purchase price.
Current performance may be lower or higher than the performance data quoted. For more information on the Unconstrained Equity Fund, and to obtain performance data current to the most recent month-end, or to request a prospectus, please call (888) 912-4562. You should carefully consider the investment objectives, potential risks, management fees, and charges and expenses of the Unconstrained Equity Fund before investing. The Unconstrained Equity Fund’s prospectus contains this and other information about the Unconstrained Equity Fund, and should be read carefully before investing. Visit www.fullerthalerfunds.com for more current performance information.
The Unconstrained Equity Fund is distributed by Unified Financial Securities, LLC, Member FINRA/SIPC.
10
Investment Results (Unaudited) (continued)
Total Returns* as of September 30, 2019
| | Since
Inception
(12/26/18) |
Fuller & Thaler Behavioral Small-Mid Core Equity Fund | |
Institutional Shares | 19.80% |
Russell 2500® Index(a) | 19.60% |
| | Expense
Ratios(b) |
| | Institutional
Shares |
Gross | 2.37% |
With Applicable Waivers | 0.95% |
The performance quoted represents past performance, which does not guarantee future results. The investment return and principal value of an investment will fluctuate so that an investor’s shares, when redeemed, may be worth more or less than their original cost. The returns shown do not reflect the deduction of taxes that a shareholder would pay on Fuller & Thaler Behavioral Small-Mid Core Equity Fund (the “Small-Mid Core Equity Fund”) distributions or the redemption of Small-Mid Core Equity Fund shares. Current performance of the Small-Mid Core Equity Fund may be lower or higher than the performance quoted. The Small-Mid Core Equity Fund’s investment objectives, risks, charges and expenses must be considered carefully before investing. Performance data current to the most recent month end may be obtained by calling (888) 912-4562.
* Return figures reflect any change in price per share and assume the reinvestment of all distributions. The Small-Mid Core Equity Fund’s returns reflect any fee waivers during the applicable periods. If such fee waivers had not occurred, the quoted performance would have been lower. Total returns for periods less than 1 year are not annualized.
(a) The Russell 2500® Index (“Russell 2500”) is a widely recognized unmanaged index of equity securities and is representative of a broader domestic equity market and range of securities than is found in the Small-Mid Core Equity Fund’s portfolio. The Russell 2500 measures the performance of those Russell 2500 companies with lower price/book ratios and lower forecasted growth values. Individuals cannot invest directly in an index; however, an individual can invest in exchange traded funds or other investment vehicles that attempt to track the performance of a benchmark index.
(b) The expense ratios are from the Small-Mid Core Equity Fund’s most recent prospectus dated December 19, 2018. The Adviser has contractually agreed to waive its management fee and/or reimburse Small-Mid Core Equity Fund expenses so that total annual operating expenses do not exceed 0.95% of the Small-Mid Core Equity Fund’s Institutional Shares average daily net assets through January 31, 2020. The expense limitation does not apply to: (i) interest; (ii) taxes; (iii) brokerage fees and commissions; (iv) other extraordinary expenses not incurred in the ordinary course of the Small-Mid Core Equity Fund’s business; and (v) indirect expenses such as acquired fund fees and expenses. During any fiscal year that the Investment Advisory Agreement between the Adviser and the Trust is in effect, the Adviser may recoup the sum of all fees previously waived or expenses reimbursed, less any reimbursement previously paid, provided that the Adviser is only permitted to recoup fees or expenses within 36 months from the date the fee waiver or expense reimbursement occurred and provided further that such recoupment can be achieved within the Expense Limitation Agreement currently in effect and the Expense Limitation Agreement in place when the waiver/reimbursement occurred. This Expense Limitation Agreement may not be terminated by the Adviser prior to its expiration date, but the Board may terminate such agreement at any time. The Expense Limitation Agreement shall terminate automatically upon the termination of the Advisory Agreement. Additional information pertaining to the Small-Mid Core Equity Fund’s expense ratios as of September 30, 2019 can be found in the financial highlights.
11
Investment Results (Unaudited) (continued)
Comparison of the Growth of a $100,000 Investment in the Fuller & Thaler Behavioral Small-Mid Core Equity Fund - Institutional Shares and the Russell 2500® Index.

The chart above assumes an initial investment of $100,000 made on December 26, 2018 (commencement of operations) and held through September 30, 2019.THE SMALL-MID CORE EQUITY FUND’S RETURNS REPRESENT PAST PERFORMANCE AND DO NOT GUARANTEE FUTURE RESULTS. The returns shown do not reflect deduction of taxes that a shareholder would pay on the Small-Mid Core Equity Fund’s distributions or the redemption of the Small-Mid Core Equity Fund’s shares. Investment returns and principal values will fluctuate so that your shares, when redeemed, may be worth more or less than their original purchase price.
Current performance may be lower or higher than the performance data quoted. For more information on the Small-Mid Core Equity Fund, and to obtain performance data current to the most recent month-end, or to request a prospectus, please call (888) 912-4562. You should carefully consider the investment objectives, potential risks, management fees, and charges and expenses of the Small-Mid Core Equity Fund before investing. The Small-Mid Core Equity Fund’s prospectus contains this and other information about the Small-Mid Core Equity Fund, and should be read carefully before investing. Visit www.fullerthalerfunds.com for more current performance information.
The Small-Mid Core Equity Fund is distributed by Unified Financial Securities, LLC, Member FINRA/SIPC.
12
Investment Results (Unaudited) (continued)
Total Returns* as of September 30, 2019
| | Since
Inception
(12/28/18) |
Fuller & Thaler Behavioral Micro-Cap Equity Fund | |
Institutional Shares | 8.50% |
Russell Microcap® Index(a) | 8.79% |
| | Expense
Ratios(b) |
| | Institutional
Shares |
Gross | 3.07% |
With Applicable Waivers | 1.75% |
The performance quoted represents past performance, which does not guarantee future results. The investment return and principal value of an investment will fluctuate so that an investor’s shares, when redeemed, may be worth more or less than their original cost. The returns shown do not reflect the deduction of taxes that a shareholder would pay on Fuller & Thaler Behavioral Micro-Cap Equity Fund (the “Micro-Cap Equity Fund”) distributions or the redemption of Micro-Cap Equity Fund shares. Current performance of the Micro-Cap Equity Fund may be lower or higher than the performance quoted. The Micro-Cap Equity Fund’s investment objectives, risks, charges and expenses must be considered carefully before investing. Performance data current to the most recent month end may be obtained by calling (888) 912-4562.
* Return figures reflect any change in price per share and assume the reinvestment of all distributions. The Micro-Cap Equity Fund’s returns reflect any fee waivers during the applicable periods. If such fee waivers had not occurred, the quoted performance would have been lower. Total returns for periods less than 1 year are not annualized.
(a) The Russell Microcap® Index (“Russell Microcap”) measures the performance of the microcap segment of the U.S. equity market. Russell Microcap stocks make up less than 3% of the U.S. equity market (by market cap) and consist of the smallest 1,000 securities in the small cap Russell 2000® Index, plus the next smallest eligible securities by market cap. Individuals cannot invest directly in an index; however, an individual can invest in exchange traded funds or other investment vehicles that attempt to track the performance of a benchmark index.
(b) The expense ratios are from the Micro-Cap Equity Fund’s most recent prospectus dated December 19, 2018. The Adviser has contractually agreed to waive its management fee and/or reimburse Micro-Cap Equity Fund expenses so that total annual operating expenses do not exceed 1.75% of the Micro-Cap Equity Fund’s Institutional Shares average daily net assets through January 31, 2020. The expense limitation does not apply to: (i) interest; (ii) taxes; (iii) brokerage fees and commissions; (iv) other extraordinary expenses not incurred in the ordinary course of the Micro-Cap Equity Fund’s business; and (v) indirect expenses such as acquired fund fees and expenses. During any fiscal year that the Investment Advisory Agreement between the Adviser and the Trust is in effect, the Adviser may recoup the sum of all fees previously waived or expenses reimbursed, less any reimbursement previously paid, provided that the Adviser is only permitted to recoup fees or expenses within 36 months from the date the fee waiver or expense reimbursement occurred and provided further that such recoupment can be achieved within the Expense Limitation Agreement currently in effect and the Expense Limitation Agreement in place when the waiver/reimbursement occurred. This Expense Limitation Agreement may not be terminated by the Adviser prior to its expiration date, but the Board may terminate such agreement at any time. The Expense Limitation Agreement shall terminate automatically upon the termination of the Advisory Agreement. Additional information pertaining to the Micro-Cap Equity Fund’s expense ratios as of September 30, 2019 can be found in the financial highlights.
13
Investment Results (Unaudited) (continued)
Comparison of the Growth of a $100,000 Investment in the Fuller & Thaler Behavioral Micro-Cap Equity Fund - Institutional Shares and the Russell Microcap® Index.
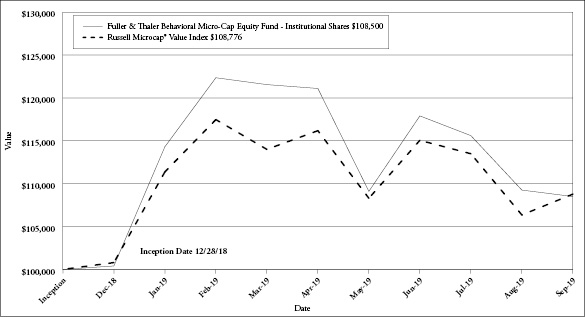
The chart above assumes an initial investment of $100,000 made on December 28, 2018 (commencement of operations) and held through September 30, 2019.THE MICRO-CAP EQUITY FUND’S RETURNS REPRESENT PAST PERFORMANCE AND DO NOT GUARANTEE FUTURE RESULTS. The returns shown do not reflect deduction of taxes that a shareholder would pay on the Micro-Cap Equity Fund’s distributions or the redemption of the Micro-Cap Equity Fund’s shares. Investment returns and principal values will fluctuate so that your shares, when redeemed, may be worth more or less than their original purchase price.
Current performance may be lower or higher than the performance data quoted. For more information on the Micro-Cap Equity Fund, and to obtain performance data current to the most recent month-end, or to request a prospectus, please call (888) 912-4562. You should carefully consider the investment objectives, potential risks, management fees, and charges and expenses of the Micro-Cap Equity Fund before investing. The Micro-Cap Equity Fund’s prospectus contains this and other information about the Micro-Cap Equity Fund, and should be read carefully before investing. Visit www.fullerthalerfunds.com for more current performance information.
The Micro-Cap Equity Fund is distributed by Unified Financial Securities, LLC, Member FINRA/SIPC.
14
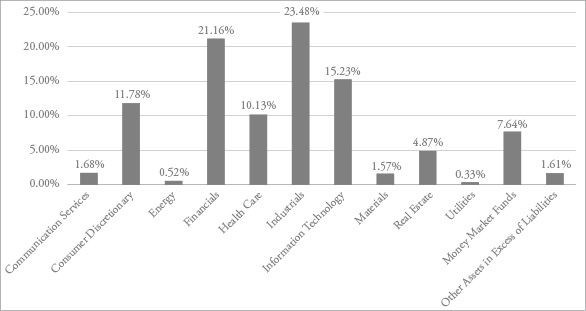
Portfolio Illustration (Unaudited)
September 30, 2019
Fuller & Thaler Behavioral Small-Cap Equity Fund Sector Holdings as of September 30, 2019.*
Fuller & Thaler Behavioral Small-Cap Growth Fund Sector Holdings as of September 30, 2019.*
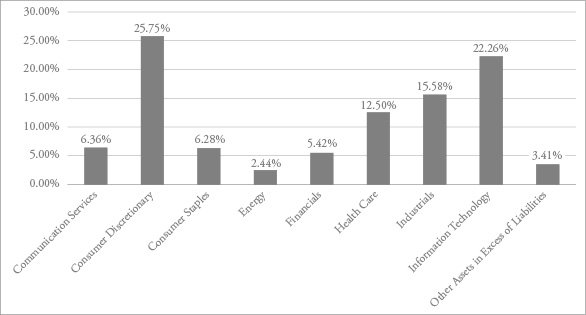
* | As a percentage of net assets. |
15
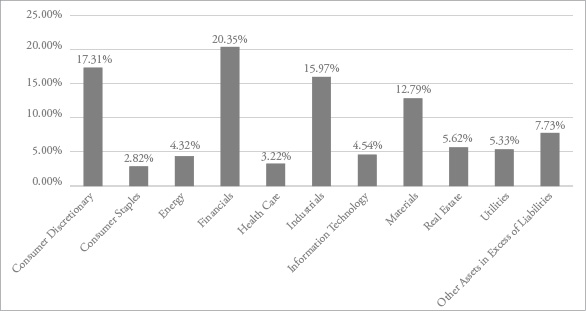
Portfolio Illustration (Unaudited)
September 30, 2019
Fuller & Thaler Behavioral Mid-Cap Value Fund Sector Holdings as of September 30, 2019.*
Fuller & Thaler Behavioral Unconstrained Equity Fund Sector Holdings as of September 30, 2019.*

* | As a percentage of net assets. |
16
Portfolio Illustration (Unaudited)
September 30, 2019
Fuller & Thaler Behavioral Small-Mid Core Equity Fund Sector Holdings as of September 30, 2019.*

Fuller & Thaler Behavioral Micro-Cap Equity Fund Sector Holdings as of September 30, 2019.*

* | As a percentage of net assets. |
Availability of Portfolio Schedules (Unaudited)
The Funds file their complete schedule of portfolio holdings with the Securities and Exchange Commission (“SEC”) for the first and third quarters of each fiscal year within sixty days after the end of the period. The Funds’ portfolio holdings are available on the SEC’s website at http://www.sec.gov.
17
Fuller & Thaler Behavioral Small-Cap Equity Fund
Schedule of Investments
September 30, 2019
| | Shares | | | Fair Value | |
COMMON STOCKS — 90.75% | | | | |
|
Banks — 12.87% |
BancorpSouth Bank | | | 702,341 | | | $ | 20,796,317 | |
Bank of Hawaii Corporation | | | 139,295 | | | | 11,969,619 | |
F.N.B. Corporation | | | 2,912,100 | | | | 33,576,513 | |
Farmers National Banc Corporation | | | 82,336 | | | | 1,192,225 | |
Financial Institutions, Inc. | | | 140,679 | | | | 4,245,692 | |
First Citizens BancShares, Inc., Class A | | | 64,675 | | | | 30,497,496 | |
Fulton Financial Corporation | | | 2,894,038 | | | | 46,825,535 | |
Hancock Whitney Corporation | | | 1,684,898 | | | | 64,523,170 | |
Lakeland Financial Corporation | | | 410,013 | | | | 18,032,372 | |
TowneBank | | | 182,988 | | | | 5,087,981 | |
TriState Capital Holdings, Inc.(a) | | | 555,492 | | | | 11,687,552 | |
| | | | | | | | 248,434,472 | |
Building Products — 3.12% |
Advanced Drainage Systems, Inc. | | | 371,400 | | | | 11,985,078 | |
Continental Building Products, Inc.(a) | | | 915,898 | | | | 24,994,856 | |
Cornerstone Building Brands, Inc.(a) | | | 1,273,458 | | | | 7,704,421 | |
Masonite International Corporation(a) | | | 186,331 | | | | 10,807,198 | |
Trex Company, Inc.(a) | | | 51,707 | | | | 4,701,718 | |
| | | | | | | | 60,193,271 | |
Capital Markets — 1.89% |
Blucora, Inc.(a) | | | 1,310,623 | | | | 28,361,882 | |
Hamilton Lane, Inc., Class A | | | 142,795 | | | | 8,133,603 | |
| | | | | | | | 36,495,485 | |
Chemicals — 0.71% | | | | | | | | |
Koppers Holdings, Inc.(a) | | | 41,600 | | | | 1,215,136 | |
Trinseo S.A. | | | 288,700 | | | | 12,399,665 | |
| | | | | | | | 13,614,801 | |
Commercial Services & Supplies — 1.19% |
Deluxe Corporation | | | 295,900 | | | | 14,546,444 | |
SP Plus Corporation(a) | | | 227,256 | | | | 8,408,472 | |
| | | | | | | | 22,954,916 | |
| | Shares | | | Fair Value | |
Construction & Engineering — 5.08% |
Comfort Systems USA, Inc. | | | 743,991 | | | $ | 32,906,721 | |
EMCOR Group, Inc. | | | 102,200 | | | | 8,801,464 | |
MasTec, Inc.(a) | | | 438,551 | | | | 28,475,116 | |
Quanta Services, Inc. | | | 741,600 | | | | 28,032,480 | |
| | | | | | | | 98,215,781 | |
Distributors — 0.86% |
Core-Mark Holding Company, Inc. | | | 514,450 | | | | 16,521,562 | |
| | | | | | | | | |
Electric Utilities — 0.18% |
Portland General Electric Company | | | 59,590 | | | | 3,359,088 | |
| | | | | | | | | |
Electrical Equipment — 2.00% |
Generac Holdings, Inc.(a) | | | 492,542 | | | | 38,585,740 | |
| | | | | | | | | |
Electronic Equipment, Instruments & Components — 6.83% |
Insight Enterprises, Inc.(a) | | | 279,926 | | | | 15,589,079 | |
Jabil, Inc. | | | 2,064,852 | | | | 73,859,756 | |
Sanmina Corporation(a) | | | 600,849 | | | | 19,293,261 | |
SYNNEX Corporation | | | 64,170 | | | | 7,244,793 | |
Tech Data Corporation(a) | | | 123,724 | | | | 12,896,990 | |
Vishay Precision Group, Inc.(a) | | | 88,898 | | | | 2,910,521 | |
| | | | | | | | 131,794,400 | |
Equity Real Estate Investment Trusts (REITs) — 4.51% |
Apple Hospitality REIT, Inc. | | | 585,380 | | | | 9,705,600 | |
Armada Hoffler Properties, Inc. | | | 367,600 | | | | 6,649,884 | |
City Office REIT, Inc. | | | 121,700 | | | | 1,751,263 | |
CorEnergy Infrastructure Trust, Inc. | | | 245,800 | | | | 11,606,676 | |
Industrial Logistics Properties Trust | | | 346,221 | | | | 7,357,196 | |
Office Properties Income Trust | | | 61,854 | | | | 1,895,207 | |
OUTFRONT Media, Inc. | | | 859,734 | | | | 23,883,411 | |
Xenia Hotels & Resorts, Inc. | | | 1,147,614 | | | | 24,237,608 | |
| | | | | | | | 87,086,845 | |
Health Care Equipment & Supplies — 1.06% |
Integra LifeSciences Holdings Corporation(a) | | | 136,219 | | | | 8,182,675 | |
Lantheus Holdings, Inc.(a) | | | 486,811 | | | | 12,201,918 | |
| | | | | | | | 20,384,593 | |
18 | See accompanying notes which are an integral part of these financial statements. | |
Fuller & Thaler Behavioral Small-Cap Equity Fund
Schedule of Investments (continued)
September 30, 2019
| | Shares | | | Fair Value | |
COMMON STOCKS — (continued) |
| |
Health Care Providers & Services — 2.66% |
Amedisys, Inc.(a) | | | 131,145 | | | $ | 17,181,306 | |
Chemed Corporation | | | 58,300 | | | | 24,344,332 | |
Select Medical Holdings Corporation(a) | | | 600,525 | | | | 9,950,699 | |
| | | | | | | | 51,476,337 | |
Hotels, Restaurants & Leisure — 0.94% |
Ruth’s Hospitality Group, Inc. | | | 891,129 | | | | 18,192,399 | |
| | | | | | | | | |
Household Durables — 3.68% |
Helen of Troy Ltd.(a) | | | 450,591 | | | | 71,040,177 | |
| | | | | | | | | |
Industrial Conglomerates — 0.33% |
Raven Industries, Inc. | | | 189,751 | | | | 6,349,068 | |
| | | | | | | | | |
Insurance — 4.95% |
James River Group Holdings Ltd. | | | 240,031 | | | | 12,299,188 | |
Kemper Corporation | | | 544,504 | | | | 42,444,087 | |
Primerica, Inc. | | | 321,508 | | | | 40,905,463 | |
| | | | | | | | 95,648,738 | |
IT Services — 5.25% |
CoreLogic, Inc.(a) | | | 222,300 | | | | 10,285,821 | |
CSG Systems International, Inc. | | | 770,324 | | | | 39,810,344 | |
EVERTEC, Inc. | | | 1,274,318 | | | | 39,784,208 | |
Perspecta, Inc. | | | 440,732 | | | | 11,511,920 | |
| | | | | | | | 101,392,293 | |
Leisure Products — 0.17% |
Johnson Outdoors, Inc., Class A | | | 57,010 | | | | 3,338,506 | |
| | | | | | | | | |
Life Sciences Tools & Services — 3.85% |
Bruker Corporation | | | 629,401 | | | | 27,649,586 | |
Medpace Holdings, Inc.(a) | | | 522,858 | | | | 43,940,986 | |
PRA Health Sciences, Inc.(a) | | | 28,800 | | | | 2,857,824 | |
| | | | | | | | 74,448,396 | |
Machinery — 0.50% |
Meritor, Inc.(a) | | | 523,056 | | | | 9,676,536 | |
| | | | | | | | | |
Marine — 0.25% |
Costamare, Inc. | | | 782,924 | | | | 4,752,349 | |
| | | | | | | | | |
| | Shares | | | Fair Value | |
Media — 1.68% |
AMC Networks, Inc., Class A(a) | | | 84,000 | | | $ | 4,129,440 | |
MSG Networks, Inc., Class A(a) | | | 217,500 | | | | 3,527,850 | |
Sinclair Broadcast Group, Inc., Class A | | | 578,794 | | | | 24,737,656 | |
| | | | | | | | 32,394,946 | |
Metals & Mining — 0.34% |
Gold Resource Corporation | | | 725,007 | | | | 2,211,271 | |
Worthington Industries, Inc. | | | 122,400 | | | | 4,412,520 | |
| | | | | | | | 6,623,791 | |
Mortgage Real Estate Investment Trusts (REITs) — 0.31% |
Invesco Mortgage Capital, Inc. | | | 389,400 | | | | 5,961,714 | |
| | | | | | | | | |
Multi-Utilities — 0.15% |
Unitil Corporation | | | 47,000 | | | | 2,981,680 | |
| | | | | | | | | |
Oil, Gas & Consumable Fuels — 0.52% |
W&T Offshore, Inc.(a) | | | 2,298,700 | | | | 10,045,319 | |
| | | | | | | | | |
Paper & Forest Products — 0.52% |
Louisiana-Pacific Corporation | | | 409,646 | | | | 10,069,099 | |
| | | | | | | | | |
Pharmaceuticals — 2.56% |
Horizon Therapeutics plc(a) | | | 1,012,629 | | | | 27,573,888 | |
Supernus Pharmaceuticals, Inc.(a) | | | 792,892 | | | | 21,788,672 | |
| | | | | | | | 49,362,560 | |
Professional Services — 2.92% |
CRA International, Inc. | | | 52,527 | | | | 2,204,558 | |
FTI Consulting, Inc.(a) | | | 445,988 | | | | 47,270,269 | |
Kforce, Inc. | | | 183,701 | | | | 6,950,327 | |
| | | | | | | | 56,425,154 | |
Real Estate Management & Development — 0.36% |
Marcus & Millichap, Inc.(a) | | | 150,405 | | | | 5,337,873 | |
RMR Group, Inc. (The), Class A | | | 35,825 | | | | 1,629,321 | |
| | | | | | | | 6,967,194 | |
Road & Rail — 3.64% |
Landstar System, Inc. | | | 624,020 | | | | 70,252,172 | |
| | | | | | | | | |
| | See accompanying notes which are an integral part of these financial statements. | 19 |
Fuller & Thaler Behavioral Small-Cap Equity Fund
Schedule of Investments (continued)
September 30, 2019
| | Shares | | | Fair Value | |
COMMON STOCKS — (continued) |
| |
Semiconductors & Semiconductor Equipment — 0.19% |
SMART Global Holdings, Inc.(a) | | | 145,100 | | | $ | 3,697,148 | |
| | | | | | | | | |
Software — 2.96% |
j2 Global, Inc. | | | 480,100 | | | | 43,602,682 | |
Progress Software Corporation | | | 354,300 | | | | 13,484,658 | |
| | | | | | | | 57,087,340 | |
Specialty Retail — 3.82% |
Designer Brands, Inc., Class A | | | 722,950 | | | | 12,376,904 | |
Murphy USA, Inc.(a) | | | 552,028 | | | | 47,087,988 | |
Rent-A-Center, Inc. | | | 420,289 | | | | 10,839,253 | |
Sleep Number Corporation(a) | | | 78,700 | | | | 3,251,884 | |
| | | | | | | | 73,556,029 | |
Textiles, Apparel & Luxury Goods — 2.31% |
Deckers Outdoor Corporation(a) | | | 303,300 | | | | 44,694,288 | |
| | | | | | | | | |
Thrifts & Mortgage Finance — 1.14% |
Federal Agricultural Mortgage Corporation, Class C | | | 106,750 | | | | 8,717,205 | |
Washington Federal, Inc. | | | 360,100 | | | | 13,320,099 | |
| | | | | | | | 22,037,304 | |
Trading Companies & Distributors — 4.45% |
Applied Industrial Technologies, Inc. | | | 401,240 | | | | 22,790,432 | |
BMC Stock Holdings, Inc.(a) | | | 466,176 | | | | 12,204,488 | |
Rush Enterprises, Inc., Class A | | | 166,700 | | | | 6,431,286 | |
WESCO International, Inc.(a) | | | 931,200 | | | | 44,483,424 | |
| | | | | | | | 85,909,630 | |
Total Common Stocks (Cost$1,648,520,951) | | | | | | | 1,752,021,121 | |
| | Shares | | | Fair Value | |
MONEY MARKET FUNDS — 7.64% |
Fidelity Investments Money Market Government Portfolio, Institutional Class, 1.87%(b) | | | 147,521,486 | | | $ | 147,521,486 | |
Total Money Market Funds (Cost$147,521,486) | | | | | | | 147,521,486 | |
Total Investments — 98.39% (Cost$1,796,042,437) | | | | | | | 1,899,542,607 | |
Other Assets in Excess of Liabilities — 1.61% | | | | | | | 31,160,123 | |
NET ASSETS — 100.00% | | | | | | $ | 1,930,702,730 | |
(a) | Non-income producing security. |
(b) | Rate disclosed is the seven day effective yield as of September 30, 2019. |
20 | See accompanying notes which are an integral part of these financial statements. | |
Fuller & Thaler Behavioral Small-Cap Growth Fund
Schedule of Investments
September 30, 2019
| | Shares | | | Fair Value | |
COMMON STOCKS — 96.59% | | | | |
| | | | | | | | | |
Air Freight & Logistics — 1.80% |
Air Transport Services Group, Inc.(a) | | | 13,442 | | | $ | 282,551 | |
| | | | | | | | | |
Airlines — 2.08% |
SkyWest, Inc. | | | 5,686 | | | | 326,376 | |
| | | | | | | | | |
Biotechnology — 2.19% |
Sarepta Therapeutics, Inc.(a) | | | 4,565 | | | | 343,836 | |
| | | | | | | | | |
Building Products — 2.81% |
Trex Company, Inc.(a) | | | 4,860 | | | | 441,920 | |
| | | | | | | | | |
Construction & Engineering — 2.31% |
MasTec, Inc.(a) | | | 5,600 | | | | 363,608 | |
| | | | | | | | | |
Consumer Finance — 3.97% |
Enova International, Inc.(a) | | | 10,040 | | | | 208,330 | |
EZCORP, Inc., Class A(a) | | | 17,518 | | | | 113,079 | |
OneMain Holdings, Inc. | | | 8,250 | | | | 302,610 | |
| | | | | | | | 624,019 | |
Diversified Consumer Services — 4.42% |
Grand Canyon Education, Inc.(a) | | | 2,630 | | | | 258,266 | |
Weight Watchers International, Inc.(a) | | | 11,550 | | | | 436,821 | |
| | | | | | | | 695,087 | |
Diversified Telecommunication Services — 1.88% |
Vonage Holdings Corporation(a) | | | 26,200 | | | | 296,060 | |
| | | | | | | | | |
Energy Equipment & Services — 2.44% |
Dril-Quip, Inc.(a) | | | 7,650 | | | | 383,877 | |
| | | | | | | | | |
Entertainment — 6.46% | | | | | | | | |
AMC Entertainment Holdings, Inc., Class A | | | 20,415 | | | | 218,441 | |
World Wrestling Entertainment, Inc., Class A | | | 7,090 | | | | 504,453 | |
Zynga, Inc., Class A(a) | | | 50,100 | | | | 291,582 | |
| | | | | | | | 1,014,476 | |
Food & Staples Retailing — 1.79% |
Grocery Outlet Holding Corporation(a) | | | 8,100 | | | $ | 280,908 | |
| | | | | | | | | |
Food Products — 4.49% |
Hostess Brands, Inc.(a) | | | 24,145 | | | | 337,668 | |
Simply Good Foods Company (The)(a) | | | 12,700 | | | | 368,173 | |
| | | | | | | | 705,841 | |
Health Care Equipment & Supplies — 4.04% |
Integer Holdings Corporation(a) | | | 4,240 | | | | 320,375 | |
Tandem Diabetes Care, Inc.(a) | | | 5,335 | | | | 314,658 | |
| | | | | | | | 635,033 | |
Health Care Providers & Services — 6.27% |
Amedisys, Inc.(a) | | | 3,220 | | | | 421,851 | |
Guardant Health, Inc.(a) | | | 3,950 | | | | 252,129 | |
HealthEquity, Inc.(a) | | | 5,450 | | | | 311,440 | |
| | | | | | | | 985,420 | |
Hotels, Restaurants & Leisure — 4.49% |
Churchill Downs, Inc. | | | 3,220 | | | | 397,525 | |
SeaWorld Entertainment, Inc.(a) | | | 11,675 | | | | 307,286 | |
| | | | | | | | 704,811 | |
Household Durables — 10.35% |
Helen of Troy Ltd.(a) | | | 2,200 | | | | 346,852 | |
Meritage Homes Corporation(a) | | | 5,300 | | | | 372,855 | |
Roku, Inc.(a) | | | 4,200 | | | | 427,392 | |
Skyline Champion Corporation(a) | | | 15,865 | | | | 477,378 | |
| | | | | | | | 1,624,477 | |
Insurance — 1.45% |
eHealth, Inc.(a) | | | 3,400 | | | | 227,086 | |
| | | | | | | | | |
Interactive Media & Services — 1.26% |
CarGurus, Inc.(a) | | | 6,390 | | | | 197,771 | |
| | | | | | | | | |
Machinery — 1.41% |
Chart Industries, Inc.(a) | | | 3,550 | | | | 221,378 | |
| | | | | | | | | |
Professional Services — 3.37% |
FTI Consulting, Inc.(a) | | | 4,995 | | | | 529,420 | |
| | | | | | | | | |
| | See accompanying notes which are an integral part of these financial statements. | 21 |
Fuller & Thaler Behavioral Small-Cap Growth Fund
Schedule of Investments (continued)
September 30, 2019
| | Shares | | | Fair Value | |
COMMON STOCKS — (continued) | | | | |
| | | | | | | | | |
Semiconductors & Semiconductor Equipment — 13.12% |
Ambarella, Inc.(a) | | | 5,900 | | | $ | 370,727 | |
Cirrus Logic, Inc.(a) | | | 6,000 | | | | 321,480 | |
Enphase Energy, Inc.(a) | | | 12,700 | | | | 282,321 | |
Lattice Semiconductor Corporation(a) | | | 18,250 | | | | 333,701 | |
MACOM Technology Solutions Holdings, Inc.(a) | | | 19,400 | | | | 417,002 | |
SunPower Corporation(a) | | | 30,600 | | | | 335,682 | |
| | | | | | | | 2,060,913 | |
Software — 9.08% |
Box, Inc., Class A(a) | | | 19,700 | | | | 326,232 | |
Five9, Inc.(a) | | | 5,700 | | | | 306,318 | |
Mimecast Ltd.(a) | | | 6,380 | | | | 227,575 | |
Progress Software Corporation | | | 6,640 | | | | 252,718 | |
Trade Desk, Inc. (The), Class A(a) | | | 1,670 | | | | 313,209 | |
| | | | | | | | 1,426,052 | |
Specialty Retail — 2.23% |
Rent-A-Center, Inc. | | | 13,575 | | | | 350,099 | |
| | | | | | | | | |
Textiles, Apparel & Luxury Goods — 2.88% |
Crocs, Inc.(a) | | | 16,300 | | | | 452,488 | |
TotalCommon Stocks/ Investments — 96.59% (Cost $14,578,388) | | | | | | | 15,173,507 | |
Other Assets in Excess of Liabilities — 3.41% | | | | | | | 536,112 | |
NET ASSETS — 100.00% | | | | | | $ | 15,709,619 | |
(a) | Non-income producing security. |
22 | See accompanying notes which are an integral part of these financial statements. | |
Fuller & Thaler Behavioral Mid-Cap Value Fund
Schedule of Investments
September 30, 2019
| | Shares | | | Fair Value | |
COMMON STOCKS — 92.27% | | | | |
| | | | | | | | | |
Aerospace & Defense — 2.46% |
Arconic, Inc. | | | 15,750 | | | $ | 409,499 | |
| | | | | | | | | |
Banks — 12.20% |
CIT Group, Inc. | | | 3,700 | | | | 167,647 | |
Commerce Bancshares, Inc. | | | 4,042 | | | | 245,147 | |
East West Bancorp, Inc. | | | 3,850 | | | | 170,517 | |
First Horizon National Corporation | | | 22,915 | | | | 371,223 | |
KeyCorp | | | 24,165 | | | | 431,103 | |
M&T Bank Corporation | | | 2,110 | | | | 333,317 | |
TCF Financial Corporation | | | 8,027 | | | | 305,588 | |
| | | | | | | | 2,024,542 | |
Building Products — 1.85% |
Johnson Controls International plc | | | 7,000 | | | | 307,230 | |
| | | | | | | | | |
Chemicals — 3.84% |
Celanese Corporation | | | 1,825 | | | | 223,179 | |
Sherwin-Williams Company (The) | | | 370 | | | | 203,452 | |
W.R. Grace & Company | | | 3,150 | | | | 210,294 | |
| | | | | | | | 636,925 | |
Commercial Services & Supplies — 1.64% |
Republic Services, Inc. | | | 3,150 | | | | 272,633 | |
| | | | | | | | | |
Communications Equipment — 1.17% |
CommScope Holding Company, Inc.(a) | | | 16,445 | | | | 193,393 | |
| | | | | | | | | |
Consumer Finance — 2.29% |
Synchrony Financial | | | 11,125 | | | | 379,251 | |
| | | | | | | | | |
Containers & Packaging — 8.95% |
Berry Global Group, Inc.(a) | | | 8,400 | | | | 329,868 | |
Crown Holdings, Inc.(a) | | | 7,130 | | | | 471,008 | |
Graphic Packaging Holding Company | | | 25,655 | | | | 378,411 | |
WestRock Company | | | 8,400 | | | | 306,180 | |
| | | | | | | | 1,485,467 | |
Electric Utilities — 4.37% |
Alliant Energy Corporation | | | 4,950 | | | $ | 266,954 | |
Edison International | | | 2,750 | | | | 207,405 | |
Pinnacle West Capital Corporation | | | 2,575 | | | | 249,955 | |
| | | | | | | | 724,314 | |
Electrical Equipment — 1.25% |
AMETEK, Inc. | | | 2,250 | | | | 206,595 | |
| | | | | | | | | |
Energy Equipment & Services — 0.86% |
Patterson-UTI Energy, Inc. | | | 16,630 | | | | 142,187 | |
| | | | | | | | | |
Equity Real Estate Investment Trusts (REITs) — 5.62% |
Brixmor Property Group, Inc. | | | 15,550 | | | | 315,510 | |
Colony Capital, Inc., Class A | | | 36,600 | | | | 220,332 | |
Public Storage | | | 1,000 | | | | 245,270 | |
Retail Properties of America, Inc., Class A | | | 12,250 | | | | 150,920 | |
| | | | | | | | 932,032 | |
Food Products — 2.82% |
Ingredion, Inc. | | | 2,685 | | | | 219,472 | |
J.M. Smucker Company (The) | | | 2,250 | | | | 247,545 | |
| | | | | | | | 467,017 | |
Health Care Providers & Services — 3.22% |
Centene Corporation(a) | | | 2,700 | | | | 116,802 | |
Henry Schein, Inc.(a) | | | 3,000 | | | | 190,500 | |
Laboratory Corporation of America Holdings(a) | | | 1,350 | | | | 226,800 | |
| | | | | | | | 534,102 | |
Hotels, Restaurants & Leisure — 2.16% |
Aramark | | | 8,215 | | | | 358,010 | |
| | | | | | | | | |
Household Durables — 4.96% |
Mohawk Industries, Inc.(a) | | | 1,820 | | | | 225,807 | |
Newell Brands, Inc. | | | 16,031 | | | | 300,101 | |
Whirlpool Corporation | | | 1,880 | | | | 297,717 | |
| | | | | | | | 823,625 | |
Industrial Conglomerates — 0.87% |
Roper Technologies, Inc. | | | 405 | | | | 144,423 | |
| | | | | | | | | |
| | See accompanying notes which are an integral part of these financial statements. | 23 |
Fuller & Thaler Behavioral Mid-Cap Value Fund
Schedule of Investments (continued)
September 30, 2019
| | Shares | | | Fair Value | |
COMMON STOCKS — (continued) | | | | |
| |
Insurance — 5.86% |
Assured Guaranty Ltd. | | | 4,250 | | | $ | 188,955 | |
Everest Re Group Ltd. | | | 1,185 | | | | 315,317 | |
Globe Life, Inc. | | | 2,050 | | | | 196,308 | |
Markel Corporation(a) | | | 230 | | | | 271,837 | |
| | | | | | | | 972,417 | |
IT Services — 1.63% |
Amdocs Ltd. | | | 4,100 | | | | 271,051 | |
| | | | | | | | | |
Machinery — 2.33% |
Donaldson Company, Inc. | | | 3,850 | | | | 200,508 | |
Snap-on, Inc. | | | 1,190 | | | | 186,283 | |
| | | | | | | | 386,791 | |
Multi-Line Retail — 4.64% |
Dollar General Corporation | | | 2,625 | | | | 417,218 | |
Dollar Tree, Inc.(a) | | | 3,090 | | | | 352,754 | |
| | | | | | | | 769,972 | |
Multi-Utilities — 0.96% |
CMS Energy Corporation | | | 2,500 | | | | 159,875 | |
| | | | | | | | | |
Oil, Gas & Consumable Fuels — 3.46% |
Antero Resources Corporation(a) | | | 14,600 | | | | 44,092 | |
Continental Resources, Inc.(a) | | | 8,900 | | | | 274,031 | |
Occidental Petroleum Corporation | | | 1,547 | | | | 68,795 | |
Pioneer Natural Resources Company | | | 1,490 | | | | 187,397 | |
| | | | | | | | 574,315 | |
Professional Services — 2.41% |
Nielsen Holdings plc | | | 6,150 | | | | 130,688 | |
Verisk Analytics, Inc. | | | 1,700 | | | | 268,838 | |
| | | | | | | | 399,526 | |
Road & Rail — 1.88% |
Kansas City Southern | | | 2,345 | | | $ | 311,908 | |
| | | | | | | | | |
Software — 0.99% |
Verint Systems, Inc.(a) | | | 3,850 | | | | 164,703 | |
| | | | | | | | | |
Specialty Retail — 5.55% |
Advance Auto Parts, Inc. | | | 1,000 | | | | 165,400 | |
CarMax, Inc.(a) | | | 4,660 | | | | 410,079 | |
O’Reilly Automotive, Inc.(a) | | | 865 | | | | 344,711 | |
| | | | | | | | 920,190 | |
Technology Hardware, Storage & Peripherals — 0.75% |
NCR Corporation(a) | | | 3,950 | | | | 124,662 | |
| | | | | | | | | |
Trading Companies & Distributors — 1.28% |
HD Supply Holdings, Inc.(a) | | | 5,400 | | | | 211,545 | |
TotalCommon Stocks/ Investments — 92.27% (Cost $14,397,491) | | | | | | | 15,308,200 | |
Other Assets in Excess of Liabilities — 7.73% | | | | | | | 1,281,570 | |
NET ASSETS — 100.00% | | | | | | $ | 16,589,770 | |
(a) | Non-income producing security. |
24 | See accompanying notes which are an integral part of these financial statements. | |
Fuller & Thaler Behavioral Unconstrained Equity Fund
Schedule of Investments
September 30, 2019
| | Shares | | | Fair Value | |
COMMON STOCKS — 97.00% | | | | |
| | | | | | | | | |
Airlines — 4.68% |
Southwest Airlines Company | | | 4,010 | | | $ | 216,580 | |
| | | | | | | | | |
Auto Components — 2.99% |
Cooper-Standard Holdings, Inc.(a) | | | 3,390 | | | | 138,583 | |
| | | | | | | | | |
Chemicals — 9.28% | | | | | | | | |
Ecolab, Inc. | | | 1,050 | | | | 207,942 | |
NewMarket Corporation | | | 470 | | | | 221,882 | |
| | | | | | | | 429,824 | |
Commercial Services & Supplies — 5.85% |
Cintas Corporation | | | 1,010 | | | | 270,781 | |
| | | | | | | | | |
Consumer Finance — 4.46% |
Synchrony Financial | | | 6,055 | | | | 206,415 | |
| | | | | | | | | |
Electrical Equipment — 5.87% |
Generac Holdings, Inc.(a) | | | 3,470 | | | | 271,840 | |
| | | | | | | | | |
Equity Real Estate Investment Trusts (REITs) — 2.99% |
Gaming and Leisure Properties, Inc. | | | 3,625 | | | | 138,620 | |
| | | | | | | | | |
Hotels, Restaurants & Leisure — 5.81% |
Yum China Holdings, Inc. | | | 5,920 | | | | 268,946 | |
| | | | | | | | | |
Internet & Direct Marketing Retail — 10.87% |
Booking Holdings, Inc.(a) | | | 109 | | | | 213,924 | |
eBay, Inc. | | | 7,435 | | | | 289,817 | |
| | | | | | | | 503,741 | |
IT Services — 3.85% |
VeriSign, Inc.(a) | | | 945 | | | | 178,255 | |
| | | | | | | | | |
Life Sciences Tools & Services — 3.47% |
Waters Corporation(a) | | | 720 | | | | 160,726 | |
| | | | | | | | | |
Machinery — 8.59% |
Allison Transmission Holdings, Inc. | | | 3,705 | | | | 174,320 | |
Parker-Hannifin Corporation | | | 1,240 | | | | 223,957 | |
| | | | | | | | 398,277 | |
Media — 3.97% |
Liberty Media Corporation - Liberty SiriusXM, Series C(a) | | | 4,385 | | | $ | 183,995 | |
| | | | | | | | | |
Road & Rail — 4.02% |
Union Pacific Corporation | | | 1,150 | | | | 186,277 | |
| | | | | | | | | |
Semiconductors & Semiconductor Equipment — 7.50% |
Cabot Microelectronics Corporation | | | 1,460 | | | | 206,166 | |
Xilinx, Inc. | | | 1,475 | | | | 141,453 | |
| | | | | | | | 347,619 | |
Specialty Retail — 12.80% |
O’Reilly Automotive, Inc.(a) | | | 425 | | | | 169,367 | |
Ross Stores, Inc. | | | 1,960 | | | �� | 215,305 | |
Tiffany & Company | | | 2,250 | | | | 208,417 | |
| | | | | | | | 593,089 | |
TotalCommon Stocks/ Investments — 97.00% (Cost $3,875,478) | | | | | | | 4,493,568 | |
Other Assets in Excess of Liabilities — 3.00% | | | | | | | 138,781 | |
NET ASSETS — 100.00% | | | | | | $ | 4,632,349 | |
(a) | Non-income producing security. |
| | See accompanying notes which are an integral part of these financial statements. | 25 |
Fuller & Thaler Behavioral Small-Mid Core Equity Fund
Schedule of Investments
September 30, 2019
| | Shares | | | Fair Value | |
COMMON STOCKS — 94.98% | | | | |
| | | | | | | | | |
Airlines — 3.26% |
Alaska Air Group, Inc. | | | 650 | | | $ | 42,192 | |
JetBlue Airways Corporation(a) | | | 2,335 | | | | 39,111 | |
| | | | | | | | 81,303 | |
Auto Components — 1.97% |
Cooper-Standard Holdings, Inc.(a) | | | 1,200 | | | | 49,056 | |
| | | | | | | | | |
Banks — 10.65% |
Investors Bancorp, Inc. | | | 6,030 | | | | 68,500 | |
Live Oak Bancshares, Inc. | | | 2,810 | | | | 50,861 | |
PacWest Bancorp | | | 1,055 | | | | 38,339 | |
Synovus Financial Corporation | | | 1,620 | | | | 57,931 | |
Western Alliance Bancorporation | | | 1,085 | | | | 49,997 | |
| | | | | | | | 265,628 | |
Biotechnology — 1.45% |
Exelixis, Inc.(a) | | | 2,050 | | | | 36,254 | |
| | | | | | | | | |
Chemicals — 3.31% |
NewMarket Corporation | | | 175 | | | | 82,616 | |
| | | | | | | | | |
Diversified Financial Services — 2.48% |
Voya Financial, Inc. | | | 1,135 | | | | 61,789 | |
| | | | | | | | | |
Electrical Equipment — 3.11% |
Generac Holdings, Inc.(a) | | | 990 | | | | 77,557 | |
| | | | | | | | | |
Electronic Equipment, Instruments & Components — 2.19% |
Keysight Technologies, Inc.(a) | | | 180 | | | | 17,505 | |
Zebra Technologies Corporation, Class A(a) | | | 180 | | | | 37,147 | |
| | | | | | | | 54,652 | |
Entertainment — 1.20% |
SciPlay Corporation(a) | | | 2,800 | | | | 29,960 | |
| | | | | | | | | |
Equity Real Estate Investment Trusts (REITs) — 10.35% |
American Assets Trust, Inc. | | | 1,060 | | | $ | 49,544 | |
Gaming and Leisure Properties, Inc. | | | 2,010 | | | | 76,862 | |
Site Centers Corporation | | | 2,365 | | | | 35,735 | |
STORE Capital Corporation | | | 2,565 | | | | 95,958 | |
| | | | | | | | 258,099 | |
Food Products — 3.00% |
Lancaster Colony Corporation | | | 540 | | | | 74,871 | |
| | | | | | | | | |
Gas Utilities — 2.62% |
UGI Corporation | | | 1,300 | | | | 65,351 | |
| | | | | | | | | |
Health Care Equipment & Supplies — 5.34% |
AngioDynamics, Inc.(a) | | | 4,405 | | | | 81,141 | |
Dentsply Sirona, Inc. | | | 975 | | | | 51,977 | |
| | | | | | | | 133,118 | |
Hotels, Restaurants & Leisure — 4.04% |
Ruth’s Hospitality Group, Inc. | | | 2,830 | | | | 57,775 | |
Yum China Holdings, Inc. | | | 950 | | | | 43,159 | |
| | | | | | | | 100,934 | |
Household Durables — 1.44% |
Mohawk Industries, Inc.(a) | | | 290 | | | | 35,980 | |
| | | | | | | | | |
Insurance — 2.49% |
Brown & Brown, Inc. | | | 1,725 | | | | 62,203 | |
| | | | | | | | | |
IT Services — 2.13% |
Leidos Holdings, Inc. | | | 620 | | | | 53,246 | |
| | | | | | | | | |
Leisure Products — 1.38% |
Hasbro, Inc. | | | 290 | | | | 34,420 | |
| | | | | | | | | |
Life Sciences Tools & Services — 2.06% |
Waters Corporation(a) | | | 230 | | | | 51,343 | |
| | | | | | | | | |
Machinery — 5.22% |
Allison Transmission Holdings, Inc. | | | 875 | | | | 41,169 | |
Altra Industrial Motion Corporation | | | 1,665 | | | | 46,112 | |
Oshkosh Corporation | | | 565 | | | | 42,827 | |
| | | | | | | | 130,108 | |
26 | See accompanying notes which are an integral part of these financial statements. | |
Fuller & Thaler Behavioral Small-Mid Core Equity Fund
Schedule of Investments (continued)
September 30, 2019
| | Shares | | | Fair Value | |
COMMON STOCKS — (continued) | | | | |
| |
Media — 1.38% |
Liberty Latin America Ltd., Class C(a) | | | 2,010 | | | $ | 34,361 | |
| | | | | | | | | |
Metals & Mining — 1.02% |
Steel Dynamics, Inc. | | | 850 | | | | 25,330 | |
| | | | | | | | | |
Oil, Gas & Consumable Fuels — 1.92% |
WPX Energy, Inc.(a) | | | 4,520 | | | | 47,867 | |
| | | | | | | | | |
Road & Rail — 1.84% |
Kansas City Southern | | | 345 | | | | 45,888 | |
| | | | | | | | | |
Semiconductors & Semiconductor Equipment — 9.09% |
Advanced Energy Industries, Inc.(a) | | | 655 | | | | 37,604 | |
Cabot Microelectronics Corporation | | | 580 | | | | 81,901 | |
Entegris, Inc. | | | 1,120 | | | | 52,707 | |
Power Integrations, Inc. | | | 600 | | | | 54,258 | |
| | | | | | | | 226,470 | |
Software — 2.22% | | | | | | | | |
Aspen Technology, Inc.(a) | | | 450 | | | | 55,385 | |
| | | | | | | | | |
Specialty Retail — 1.73% |
Tiffany & Company | | | 465 | | | | 43,073 | |
| | | | | | | | | |
Technology Hardware, Storage & Peripherals — 1.80% |
Xerox Holdings Corporation | | | 1,500 | | | $ | 44,865 | |
| |
Textiles, Apparel & Luxury Goods — 2.84% |
Carter’s, Inc. | | | 510 | | | | 46,517 | |
PVH Corporation | | | 275 | | | | 24,263 | |
| | | | | | | | 70,780 | |
| |
Trading Companies & Distributors — 1.45% |
HD Supply Holdings, Inc.(a) | | | 925 | | | | 36,237 | |
TotalCommon Stocks/ Investments — 94.98% (Cost $2,158,776) | | | | | | | 2,368,744 | |
Other Assets in Excess of Liabilities — 5.02% | | | | | | | 125,307 | |
NET ASSETS — 100.00% | | | | | | $ | 2,494,051 | |
(a) | Non-income producing security. |
| | See accompanying notes which are an integral part of these financial statements. | 27 |
Fuller & Thaler Behavioral Micro-Cap Equity Fund
Schedule of Investments
September 30, 2019
| | Shares | | | Fair Value | |
COMMON STOCKS — 98.31% | | | | |
| | | | | | | | | |
Biotechnology — 3.72% |
Corbus Pharamceuticals Holdings, Inc.(a) | | | 5,500 | | | $ | 26,785 | |
PDL BioPharma, Inc.(a) | | | 23,270 | | | | 50,263 | |
Rigel Pharmaceuticals, Inc.(a) | | | 14,900 | | | | 27,863 | |
| | | | | | | | 104,911 | |
Building Products — 1.60% |
Cornerstone Building Brands, Inc.(a) | | | 7,500 | | | | 45,374 | |
| | | | | | | | | |
Capital Markets — 3.52% |
B. Riley Financial, Inc. | | | 2,670 | | | | 63,065 | |
GAIN Capital Holdings, Inc. | | | 6,840 | | | | 36,115 | |
| | | | | | | | 99,180 | |
Chemicals — 4.93% |
Flotek Industries, Inc.(a) | | | 14,480 | | | | 31,856 | |
Intrepid Potash, Inc.(a) | | | 20,070 | | | | 65,629 | |
LSB Industries, Inc.(a) | | | 8,000 | | | | 41,440 | |
| | | | | | | | 138,925 | |
Communications Equipment — 3.43% |
Comtech Telecommunications Corporation | | | 1,380 | | | | 44,850 | |
Infinera Corporation(a) | | | 9,500 | | | | 51,775 | |
| | | | | | | | 96,625 | |
Construction & Engineering — 1.51% |
HC2 Holdings, Inc.(a) | | | 18,100 | | | | 42,535 | |
| | | | | | | | | |
Consumer Finance — 0.96% |
EZCORP, Inc., Class A(a) | | | 4,208 | | | | 27,163 | |
| | | | | | | | | |
Diversified Consumer Services — 2.04% |
Carriage Services, Inc. | | | 2,650 | | | | 54,166 | |
Zovio, Inc.(a) | | | 1,700 | | | | 3,349 | |
| | | | | | | | 57,515 | |
Electronic Equipment, Instruments & Components — 1.26% |
Arlo Technologies, Inc.(a) | | | 10,400 | | | | 35,464 | |
| | | | | | | | | |
Entertainment — 0.45% |
Global Eagle Entertainment, Inc.(a) | | | 17,600 | | | | 12,707 | |
| | | | | | | | | |
Equity Real Estate Investment Trusts (REITs) — 4.27% |
CatchMark Timber Trust, Inc., Class A | | | 4,700 | | | $ | 50,149 | |
Investors Real Estate Trust | | | 940 | | | | 70,190 | |
| | | | | | | | 120,339 | |
Food & Staples Retailing — 2.00% |
Natural Grocers by Vitamin Cottage, Inc.(a) | | | 5,640 | | | | 56,344 | |
| | | | | | | | | |
Food Products — 4.20% |
Freshpet, Inc.(a) | | | 1,000 | | | | 49,770 | |
Landec Corporation(a) | | | 3,800 | | | | 41,306 | |
Limoneira Company | | | 1,490 | | | | 27,356 | |
| | | | | | | | 118,432 | |
Health Care Equipment & Supplies — 3.73% |
Antares Pharma, Inc.(a) | | | 10,900 | | | | 36,461 | |
AxoGen, Inc.(a) | | | 2,800 | | | | 34,944 | |
Invacare Corporation | | | 4,500 | | | | 33,750 | |
| | | | | | | | 105,155 | |
Health Care Providers & Services — 3.41% |
Capital Senior Living Corporation(a) | | | 9,700 | | | | 42,486 | |
Cross Country Healthcare, Inc.(a) | | | 5,200 | | | | 53,560 | |
| | | | | | | | 96,046 | |
Hotels, Restaurants & Leisure — 7.43% |
Drive Shack, Inc.(a) | | | 10,020 | | | | 43,185 | |
Golden Entertainment, Inc.(a) | | | 3,042 | | | | 40,428 | |
Lindblad Expeditions Holdings, Inc.(a) | | | 2,410 | | | | 40,392 | |
PlayAGS, Inc.(a) | | | 4,100 | | | | 42,148 | |
Potbelly Corporation(a) | | | 9,900 | | | | 43,164 | |
| | | | | | | | 209,317 | |
Household Durables — 0.89% |
Lovesac Company (The)(a) | | | 1,350 | | | | 25,205 | |
| | | | | | | | | |
Insurance — 2.11% |
Heritage Insurance Holdings, Inc.(a) | | | 3,980 | | | | 59,501 | |
| | | | | | | | | |
28 | See accompanying notes which are an integral part of these financial statements. | |
Fuller & Thaler Behavioral Micro-Cap Equity Fund
Schedule of Investments (continued)
September 30, 2019
| | Shares | | | Fair Value | |
COMMON STOCKS — (continued) | | | | |
| |
Internet & Direct Marketing Retail — 0.17% |
Waitr Holdings, Inc.(a) | | | 3,800 | | | $ | 4,883 | |
| | | | | | | | | |
IT Services — 4.09% |
Everi Holdings, Inc.(a) | | | 8,970 | | | | 75,886 | |
Limelight Networks, Inc.(a) | | | 13,090 | | | | 39,663 | |
| | | | | | | | 115,549 | |
Machinery — 0.95% |
Titan International, Inc. | | | 9,920 | | | | 26,784 | |
| | | | | | | | | |
Media — 6.27% |
Cardlytics, Inc.(a) | | | 1,650 | | | | 55,308 | |
Entravision Communications Corporation, Class A | | | 12,600 | | | | 40,068 | |
TechTarget, Inc.(a) | | | 2,050 | | | | 46,176 | |
WideOpenWest, Inc.(a) | | | 5,725 | | | | 35,266 | |
| | | | | | | | 176,818 | |
Mortgage Real Estate Investment Trusts (REITs) — 2.09% |
Exantas Capital Corporation | | | 5,170 | | | | 58,783 | |
| | | | | | | | | |
Multi-Line Retail — 0.71% |
Tuesday Morning Corporation(a) | | | 12,800 | | | | 20,096 | |
| | | | | | | | | |
Oil, Gas & Consumable Fuels — 3.60% |
Clean Energy Fuels Corporation(a) | | | 14,500 | | | | 29,943 | |
Pacific Ethanol, Inc.(a) | | | 19,700 | | | | 11,097 | |
W&T Offshore, Inc.(a) | | | 13,830 | | | | 60,437 | |
| | | | | | | | 101,477 | |
Paper & Forest Products — 2.78% |
Verso Corporation, Class A(a) | | | 6,340 | | | | 78,489 | |
| | | | | | | | | |
Personal Products — 2.30% |
e.l.f. Beauty, Inc.(a) | | | 3,700 | | | | 64,787 | |
| | | | | | | | | |
Pharmaceuticals — 1.35% |
Akorn, Inc.(a) | | | 10,000 | | | $ | 38,000 | |
| | | | | | | | | |
Professional Services — 0.86% |
Acacia Research Corporation(a) | | | 9,000 | | | | 24,120 | |
| | | | | | | | | |
Road & Rail — 1.01% |
USA Truck, Inc.(a) | | | 3,550 | | | | 28,507 | |
| | | | | | | | | |
Software — 8.49% |
Mitek Systems, Inc.(a) | | | 5,360 | | | | 51,724 | |
RealNetworks, Inc.(a) | | | 8,800 | | | | 14,608 | |
Rubicon Project, Inc. (The)(a) | | | 11,910 | | | | 103,736 | |
Smith Micro Software, Inc.(a) | | | 5,500 | | | | 29,893 | |
Telaria, Inc.(a) | | | 5,730 | | | | 39,594 | |
| | | | | | | | 239,555 | |
Specialty Retail — 4.21% |
Boot Barn Holdings, Inc.(a) | | | 2,530 | | | | 88,297 | |
Tile Shop Holdings, Inc. | | | 9,450 | | | | 30,146 | |
| | | | | | | | 118,443 | |
Technology Hardware, Storage & Peripherals — 3.57% |
Diebold Nixdorf, Inc.(a) | | | 5,980 | | | | 66,976 | |
Immersion Corporation(a) | | | 4,400 | | | | 33,660 | |
| | | | | | | | 100,636 | |
Textiles, Apparel & Luxury Goods — 2.97% |
Unifi, Inc.(a) | | | 1,975 | | | | 43,292 | |
Vera Bradley, Inc.(a) | | | 4,000 | | | | 40,400 | |
| | | | | | | | 83,692 | |
Trading Companies & Distributors — 1.43% |
CAI International, Inc.(a) | | | 1,850 | | | | 40,275 | |
TotalCommon Stocks/ Investments — 98.31% (Cost $2,703,348) | | | | | | | 2,771,632 | |
Other Assets in Excess of Liabilities — 1.69% | | | | | | | 47,542 | |
NET ASSETS — 100.00% | | | | | | $ | 2,819,174 | |
(a) | Non-income producing security. |
The industries shown on the schedules of investments are based on the Global Industry Classification Standard, or GICS® (“GICS”). The GICS was developed by and/or is the exclusive property of MSCI, Inc. and Standard & Poor’s Financial Services LLC (“S&P”). GICS is a service mark of MSCI, Inc. and S&P and has been licensed for use by Ultimus Fund Solutions, LLC.
| | See accompanying notes which are an integral part of these financial statements. | 29 |
Fuller & Thaler Funds
Statements of Assets and Liabilities
September 30, 2019
| | | Fuller & Thaler
Behavioral
Small-Cap
Equity Fund | | | Fuller & Thaler
Behavioral
Small-Cap
Growth Fund | | | Fuller & Thaler
Behavioral
Mid-Cap
Value Fund | | | Fuller & Thaler
Behavioral
Unconstrained
Equity Fund | |
Assets | | | | |
Investments in securities at fair value (cost $1,796,042,437, $14,578,388, $14,397,491 and $3,875,478) | | $ | 1,899,542,607 | | | $ | 15,173,507 | | | $ | 15,308,200 | | | $ | 4,493,568 | |
Cash and cash equivalents | | | 35,000,000 | | | | 416,115 | | | | 1,281,582 | | | | 157,219 | |
Receivable for fund shares sold | | | 3,206,668 | | | | 104,514 | | | | 1,200 | | | | 250 | |
Receivable for investments sold | | | 942,752 | | | | 23,963 | | | | — | | | | — | |
Dividends and interest receivable | | | 1,825,103 | | | | 4,957 | | | | 23,283 | | | | 2,955 | |
Deferred offering costs | | | — | | | | — | | | | — | | | | 2,301 | |
Receivable from Adviser | | | — | | | | 123 | | | | — | | | | 2,385 | |
Prepaid expenses | | | 117,581 | | | | 31,612 | | | | 9,885 | | | | 2,415 | |
Total Assets | | | 1,940,634,711 | | | | 15,754,791 | | | | 16,624,150 | | | | 4,661,093 | |
Liabilities | | | | | | | | | | | | | | | | |
Payable for investments purchased | | | 6,411,312 | | | | — | | | | — | | | | — | |
Payable for fund shares redeemed | | | 1,933,079 | | | | 12,366 | | | | — | | | | — | |
Payable to Adviser | | | 919,050 | | | | — | | | | 777 | | | | — | |
Accrued 12b-1 fees | | | 62,771 | | | | 88 | | | | 712 | | | | — | |
Accrued administrative services fees | | | 321,790 | | | | 2,283 | | | | 2,169 | | | | 385 | |
Payable to Administrator | | | 92,480 | | | | 1,500 | | | | 1,753 | | | | 1,500 | |
Payable to auditors | | | 22,150 | | | | 22,150 | | | | 22,150 | | | | 20,150 | |
Payable to trustees | | | 668 | | | | 668 | | | | 667 | | | | 667 | |
Other accrued expenses | | | 168,681 | | | | 6,117 | | | | 6,152 | | | | 6,042 | |
Total Liabilities | | | 9,931,981 | | | | 45,172 | | | | 34,380 | | | | 28,744 | |
Net Assets | | $ | 1,930,702,730 | | | $ | 15,709,619 | | | $ | 16,589,770 | | | $ | 4,632,349 | |
30 | See accompanying notes which are an integral part of these financial statements. | |
Fuller & Thaler Funds
Statements of Assets and Liabilities (continued)
September 30, 2019
| | | Fuller & Thaler
Behavioral
Small-Cap
Equity Fund | | | Fuller & Thaler
Behavioral
Small-Cap
Growth Fund | | | Fuller & Thaler
Behavioral
Mid-Cap
Value Fund | | | Fuller & Thaler
Behavioral
Unconstrained
Equity Fund | |
Net Assets consist of: | | | | | | | | | | | | | | | | |
Paid-in capital | | $ | 1,882,889,297 | | | $ | 16,030,994 | | | $ | 15,468,944 | | | $ | 3,978,780 | |
Accumulated earnings (deficit) | | | 47,813,433 | | | | (321,375 | ) | | | 1,120,826 | | | | 653,569 | |
Net Assets | | $ | 1,930,702,730 | | | $ | 15,709,619 | | | $ | 16,589,770 | | | $ | 4,632,349 | |
R6 Shares: | | | | | | | | | | | | | | | | |
Net Assets | | $ | 184,779,264 | | | $ | 2,191,156 | | | $ | 2,403,194 | | | $ | 1,367,524 | |
Shares outstanding (unlimited number of shares authorized, no par value) | | | 7,277,881 | | | | 100,856 | | | | 111,829 | | | | 52,945 | |
Net asset value, offering and redemption price per share | | $ | 25.39 | | | $ | 21.73 | | | $ | 21.49 | | | $ | 25.83 | |
Institutional Shares: | | | | | | | | | | | | | | | | |
Net Assets | | $ | 1,620,326,658 | | | $ | 13,359,466 | | | $ | 12,510,922 | | | $ | 3,264,825 | |
Shares outstanding (unlimited number of shares authorized, no par value) | | | 64,338,303 | | | | 615,849 | | | | 582,658 | | | | 126,503 | |
Net asset value, offering and redemption price per share | | $ | 25.18 | | | $ | 21.69 | | | $ | 21.47 | | | $ | 25.81 | |
Investor Shares: | | | | | | | | | | | | | | | | |
Net Assets | | $ | 124,549,780 | | | $ | 152,622 | | | $ | 1,675,654 | | | | | |
Shares outstanding (unlimited number of shares authorized, no par value) | | | 4,978,020 | | | | 7,067 | | | | 78,337 | | | | | |
Net asset value, offering and redemption price per share | | $ | 25.02 | | | $ | 21.60 | | | $ | 21.39 | | | | | |
A Shares: | | | | | | | | | | | | | | | | |
Net Assets | | $ | 575,020 | | | $ | 4,152 | | | | | | | | | |
Shares outstanding (unlimited number of shares authorized, no par value) | | | 22,960 | | | | 192 | | | | | | | | | |
Net asset value and redemption price per share | | $ | 25.04 | | | $ | 21.59 | (a) | | | | | | | | |
Maximum offering price per share (Note 1) | | $ | 26.57 | | | $ | 22.91 | | | | | | | | | |
C Shares: | | | | | | | | | | | | | | | | |
Net Assets | | $ | 472,008 | | | $ | 2,223 | | | | | | | | | |
Shares outstanding (unlimited number of shares authorized, no par value) | | | 18,942 | | | | 103 | | | | | | | | | |
Net asset value, offering and redemption price per share (Note 1) | | $ | 24.92 | | | $ | 21.51 | (a) | | | | | | | | |
(a) | Per share amounts may not recalculate due to rounding of net assets and/or shares outstanding. |
| | See accompanying notes which are an integral part of these financial statements. | 31 |
Fuller & Thaler Funds
Statements of Assets and Liabilities (continued)
September 30, 2019
| | | Fuller & Thaler
Behavioral
Small–Mid Core
Equity Fund | | | Fuller & Thaler
Behavioral
Micro-Cap
Equity Fund | |
Assets | | | | |
Investments in securities at fair value (cost $2,158,776 and $2,703,348) | | $ | 2,368,744 | | | $ | 2,771,632 | |
Cash and cash equivalents | | | 142,237 | | | | 65,321 | |
Receivable for fund shares sold | | | — | | | | 250 | |
Receivable for investments sold | | | — | | | | 5,530 | |
Dividends and interest receivable | | | 4,352 | | | | 1,394 | |
Deferred offering costs | | | 2,296 | | | | 2,405 | |
Receivable from Adviser | | | 3,919 | | | | 2,894 | |
Prepaid expenses | | | 997 | | | | 5,275 | |
Total Assets | | | 2,522,545 | | | | 2,854,701 | |
Liabilities | | | | | | | | |
Payable for investments purchased | | | — | | | | 6,787 | |
Accrued administrative services fees | | | 387 | | | | 327 | |
Payable to Administrator | | | 1,500 | | | | 1,500 | |
Payable to auditors | | | 20,150 | | | | 20,150 | |
Payable to trustees | | | 667 | | | | 667 | |
Other accrued expenses | | | 5,790 | | | | 6,096 | |
Total Liabilities | | | 28,494 | | | | 35,527 | |
Net Assets | | $ | 2,494,051 | | | $ | 2,819,174 | |
Net Assets consist of: | | | | | | | | |
Paid-in capital | | | 2,230,949 | | | | 2,605,042 | |
Accumulated earnings | | | 263,102 | | | | 214,132 | |
Net Assets | | $ | 2,494,051 | | | $ | 2,819,174 | |
Institutional Shares: | | | | | | | | |
Net Assets | | $ | 2,494,051 | | | $ | 2,819,174 | |
Shares outstanding (unlimited number of shares authorized, no par value) | | | 104,078 | | | | 129,904 | |
Net asset value, offering and redemption price per share | | $ | 23.96 | | | $ | 21.70 | |
32 | See accompanying notes which are an integral part of these financial statements. | |
Fuller & Thaler Funds
Statements of Operations
For the year ended September 30, 2019
| | | Fuller & Thaler
Behavioral
Small-Cap
Equity Fund | | | Fuller & Thaler
Behavioral
Small-Cap
Growth Fund | | | Fuller & Thaler
Behavioral
Mid-Cap
Value Fund | |
Investment Income: | | | | | | | | | | | | |
Dividend income | | $ | 18,346,069 | | | $ | 55,023 | | | $ | 246,452 | |
Interest income | | | 602,815 | | | | 13,213 | | | | 16,195 | |
Total investment income | | | 18,948,884 | | | | 68,236 | | | | 262,647 | |
Expenses: | | | | | | | | | | | | |
Adviser | | | 7,975,340 | | | | 113,668 | | | | 109,657 | |
Administrative services - Institutional Shares | | | 1,113,043 | | | | 6,794 | | | | 10,441 | |
Administration | | | 549,636 | | | | 9,250 | | | | 8,841 | |
12b-1 fees- Investor Shares | | | 304,188 | | | | 641 | | | | 2,728 | |
Fund accounting | | | 192,916 | | | | 5,737 | | | | 5,478 | |
Registration | | | 192,728 | | | | 44,455 | | | | 28,566 | |
Transfer agent | | | 169,707 | | | | 8,623 | | | | 12,065 | |
Administrative services - Investor Shares | | | 161,523 | | | | 337 | | | | 1,441 | |
Report printing | | | 89,812 | | | | 2,183 | | | | 3,038 | |
Custodian | | | 88,676 | | | | 5,152 | | | | 2,921 | |
Audit and tax preparation | | | 21,950 | | | | 21,200 | | | | 21,200 | |
Legal | | | 21,219 | | | | 15,594 | | | | 13,594 | |
Trustee | | | 15,975 | | | | 15,975 | | | | 15,975 | |
Compliance services | | | 6,000 | | | | 6,000 | | | | 6,000 | |
Interest | | | 8,188 | | | | 1,254 | | | | — | |
Pricing | | | 2,975 | | | | 1,097 | | | | 1,428 | |
12b-1 fees- C Shares(a) | | | 1,377 | | | | 20 | | | | — | |
12b-1 fees- A Shares(a) | | | 190 | | | | 8 | | | | — | |
Administrative services - A Shares(a) | | | 66 | | | | 1 | | | | — | |
Offering | | | — | | | | 2,551 | | | | 2,551 | |
Miscellaneous | | | 182,643 | | | | 18,362 | | | | 16,520 | |
Total expenses | | | 11,098,152 | | | | 278,902 | | | | 262,444 | |
Fees contractually waived and expenses reimbursed by Adviser | | | — | | | | (146,759 | ) | | | (130,638 | ) |
Net operating expenses | | | 11,098,152 | | | | 132,143 | | | | 131,806 | |
Net investment income (loss) | | | 7,850,732 | | | | (63,907 | ) | | | 130,841 | |
Net Realized and Change in Unrealized Gain (Loss) on Investments | | | | | | | | | | | | |
Net realized gain (loss) on investment securities transactions | | | (56,026,826 | ) | | | (636,228 | ) | | | 110,623 | |
Net change in unrealized appreciation (depreciation) of investment securities | | | 16,735,595 | | | | (1,388,291 | ) | | | 657,880 | |
Net realized and change in unrealized gain(loss) on investments | | | (39,291,231 | ) | | | (2,024,519 | ) | | | 768,503 | |
Net increase (decrease) in net assets resultingfrom operations | | $ | (31,440,499 | ) | | $ | (2,088,426 | ) | | $ | 899,344 | |
(a) | For the period December 19, 2018 (commencement of operations) to September 30, 2019. |
| | See accompanying notes which are an integral part of these financial statements. | 33 |
Fuller & Thaler Funds
Statements of Operations (continued)
For the period ended September 30, 2019
| | | Fuller & Thaler
Behavioral
Unconstrained
Equity Fund(a) | | | Fuller & Thaler
Behavioral
Small–Mid Core
Equity Fund(a) | | | Fuller & Thaler
Behavioral
Micro-Cap
Equity Fund(b) | |
Investment Income: | | | | | | | | | | | | |
Dividend income | | $ | 34,825 | | | $ | 26,312 | | | $ | 11,697 | |
Interest income | | | 2,090 | | | | 2,001 | | | | 1,463 | |
Total investment income | | | 36,915 | | | | 28,313 | | | | 13,160 | |
Expenses: | | | | | | | | | | | | |
Adviser | | | 22,973 | | | | 13,441 | | | | 33,382 | |
Audit and tax preparation | | | 20,150 | | | | 20,150 | | | | 20,150 | |
Trustee | | | 10,925 | | | | 10,925 | | | | 10,925 | |
Administration | | | 5,992 | | | | 6,028 | | | | 6,081 | |
Legal | | | 9,285 | | | | 9,285 | | | | 9,285 | |
Organizational | | | 8,500 | | | | 8,500 | | | | 8,500 | |
Offering | | | 7,949 | | | | 7,939 | | | | 7,803 | |
Compliance services | | | 4,500 | | | | 4,500 | | | | 4,500 | |
Fund accounting | | | 2,163 | | | | 2,176 | | | | 2,195 | |
Custodian | | | 1,639 | | | | 1,153 | | | | 1,743 | |
Administrative services - Institutional Shares | | | 1,343 | | | | 1,183 | | | | 771 | |
Report printing | | | 1,034 | | | | 1,005 | | | | 1,012 | |
Registration | | | 928 | | | | 618 | | | | 2,124 | |
Transfer agent | | | 846 | | | | 796 | | | | 723 | |
Pricing | | | 656 | | | | 920 | | | | 1,417 | |
Miscellaneous | | | 7,195 | | | | 6,203 | | | | 6,637 | |
Total expenses | | | 106,078 | | | | 94,822 | | | | 117,248 | |
Fees contractually waived and expenses reimbursed by Adviser | | | (80,362 | ) | | | (78,855 | ) | | | (78,292 | ) |
Net operating expenses | | | 25,716 | | | | 15,967 | | | | 38,956 | |
Net investment income (loss) | | | 11,199 | | | | 12,346 | | | | (25,796 | ) |
Net Realized and Change in Unrealized Gain (Loss) on Investments | | | | | | | | | | | | |
Net realized gain on investment securities transactions | | | 24,280 | | | | 40,759 | | | | 171,644 | |
Net change in unrealized appreciation of investment securities | | | 618,090 | | | | 209,968 | | | | 68,284 | |
Net realized and change in unrealizedgain on investments | | | 642,370 | | | | 250,727 | | | | 239,928 | |
Net increase in net assets resulting from operations | | $ | 653,569 | | | $ | 263,073 | | | $ | 214,132 | |
(a) | For the period December 26, 2018 (commencement of operations) to September 30, 2019. |
(b) | For the period December 28, 2018 (commencement of operations) to September 30, 2019. |
34 | See accompanying notes which are an integral part of these financial statements. | |
Fuller & Thaler Funds
Statements of Changes in Net Assets
| | | Fuller & Thaler Behavioral
Small-Cap Equity Fund | |
| | | For the
Year Ended
September 30,
2019 | | | For the
Year Ended
September 30,
2018 | |
Increase (Decrease) in Net Assets due to: | | | | | | | | |
Operations | | | | | | | | |
Net investment income | | $ | 7,850,732 | | | $ | 3,527,469 | |
Net realized loss on investment securities transactions | | | (56,026,826 | ) | | | (4,567,832 | ) |
Net change in unrealized appreciation of investment securities | | | 16,735,595 | | | | 65,964,173 | |
Net increase (decrease) in net assets resulting from operations | | | (31,440,499 | ) | | | 64,923,810 | |
Distributions to Shareholders from Earnings: | | | | | | | | |
R6 Shares | | | (345,172 | ) | | | (14,523 | ) |
Institutional Shares | | | (4,169,332 | ) | | | (689,675 | ) |
Investor Shares | | | (240,135 | ) | | | (79,066 | ) |
Total distributions | | | (4,754,639 | ) | | | (783,264 | ) |
Capital Transactions: | | | | | | | | |
R6 Shares: | | | | | | | | |
Proceeds from shares sold | | | 167,152,718 | | | | 52,389,519 | |
Reinvestment of distributions | | | 82,247 | | | | 14,523 | |
Amount paid for shares redeemed | | | (41,626,197 | ) | | | (3,549,671 | ) |
Total R6 Shares | | | 125,608,768 | | | | 48,854,371 | |
Institutional Shares: | | | | | | | | |
Proceeds from shares sold | | | 1,148,853,620 | | | | 793,552,447 | |
Reinvestment of distributions | | | 3,701,007 | | | | 580,420 | |
Amount paid for shares redeemed | | | (417,586,406 | ) | | | (100,901,596 | ) |
Total Institutional Shares | | | 734,968,221 | | | | 693,231,271 | |
Investor Shares: | | | | | | | | |
Proceeds from shares sold | | | 54,581,003 | | | | 118,880,389 | |
Reinvestment of distributions | | | 209,986 | | | | 66,724 | |
Amount paid for shares redeemed | | | (65,404,119 | ) | | | (41,736,564 | ) |
Total Investor Shares | | | (10,613,130 | ) | | | 77,210,549 | |
A Shares:(a) | | | | | | | | |
Proceeds from shares sold | | | 869,422 | | | | | |
Reinvestment of distributions | | | — | | | | | |
Amount paid for shares redeemed | | | (303,818 | ) | | | | |
Total A Shares | | | 565,604 | | | | | |
C Shares:(a) | | | | | | | | |
Proceeds from shares sold | | | 468,216 | | | | | |
Reinvestment of distributions | | | — | | | | | |
Amount paid for shares redeemed | | | (13,539 | ) | | | | |
Total C Shares | | | 454,677 | | | | | |
Net increase in net assets resulting from capital transactions | | | 850,984,140 | | | | 819,296,191 | |
Total Increase in Net Assets | | | 814,789,002 | | | | 883,436,737 | |
| | See accompanying notes which are an integral part of these financial statements. | 35 |
Fuller & Thaler Funds
Statements of Changes in Net Assets (continued)
| | | Fuller & Thaler Behavioral
Small-Cap Equity Fund | |
| | | For the
Year Ended
September 30,
2019 | | | For the
Year Ended
September 30,
2018 | |
Net Assets | | | | | | | | |
Beginning of year | | | 1,115,913,728 | | | | 232,476,991 | |
End of year | | $ | 1,930,702,730 | | | $ | 1,115,913,728 | |
Share Transactions: | | | | | | | | |
R6 Shares: | | | | | | | | |
Shares sold | | | 6,995,374 | | | | 2,040,985 | |
Shares issued in reinvestment of distributions | | | 3,707 | | | | 588 | |
Shares redeemed | | | (1,782,681 | ) | | | (134,335 | ) |
Total R6 Shares | | | 5,216,400 | | | | 1,907,238 | |
Institutional Shares: | | | | | | | | |
Shares sold | | | 47,638,982 | | | | 31,347,924 | |
Shares issued in reinvestment of distributions | | | 168,075 | | | | 23,782 | |
Shares redeemed | | | (17,968,154 | ) | | | (4,029,103 | ) |
Total Institutional Shares | | | 29,838,903 | | | | 27,342,603 | |
Investor Shares: | | | | | | | | |
Shares sold | | | 2,274,387 | | | | 4,790,070 | |
Shares issued in reinvestment of distributions | | | 9,575 | | | | 2,736 | |
Shares redeemed | | | (2,800,812 | ) | | | (1,660,712 | ) |
Total Investor Shares | | | (516,850 | ) | | | 3,132,094 | |
A Shares:(a) | | | | | | | | |
Shares sold | | | 35,118 | | | | | |
Shares issued in reinvestment of distributions | | | — | | | | | |
Shares redeemed | | | (12,158 | ) | | | | |
Total A Shares | | | 22,960 | | | | | |
C Shares:(a) | | | | | | | | |
Shares sold | | | 19,485 | | | | | |
Shares issued in reinvestment of distributions | | | — | | | | | |
Shares redeemed | | | (543 | ) | | | | |
Total C Shares | | | 18,942 | | | | | |
(a) | For the period December 19, 2018 (commencement of operations) to September 30, 2019. |
36 | See accompanying notes which are an integral part of these financial statements. | |
Fuller & Thaler Funds
Statements of Changes in Net Assets (continued)
| | | Fuller & Thaler Behavioral
Small-Cap Growth Fund | |
| | | For the
Year Ended
September 30,
2019 | | | For the
Period Ended
September 30,
2018(a) | |
Increase (Decrease) in Net Assets due to: | | | | | | | | |
Operations | | | | | | | | |
Net investment loss | | $ | (63,907 | ) | | $ | (30,354 | ) |
Net realized loss on investment securities transactions | | | (636,228 | ) | | | (232,539 | ) |
Net change in unrealized appreciation (depreciation) of investment securities | | | (1,388,291 | ) | | | 1,983,410 | |
Net increase (decrease) in net assets resulting from operations | | | (2,088,426 | ) | | | 1,720,517 | |
Capital Transactions: | | | | | | | | |
R6 Shares: | | | | | | | | |
Proceeds from shares sold | | | 19,141 | | | | 3,231,018 | |
Reinvestment of distributions | | | — | | | | — | |
Amount paid for shares redeemed | | | (259,557 | ) | | | (1,040,070 | ) |
Total R6 Shares | | | (240,416 | ) | | | 2,190,948 | |
Institutional Shares: | | | | | | | | |
Proceeds from shares sold | | | 11,671,932 | | | | 9,023,606 | |
Reinvestment of distributions | | | — | | | | — | |
Amount paid for shares redeemed | | | (6,143,583 | ) | | | (657,514 | ) |
Total Institutional Shares | | | 5,528,349 | | | | 8,366,092 | |
Investor Shares: | | | | | | | | |
Proceeds from shares sold | | | 173,932 | | | | 464,219 | |
Reinvestment of distributions | | | — | | | | — | |
Amount paid for shares redeemed | | | (400,342 | ) | | | (11,289 | ) |
Total Investor Shares | | | (226,410 | ) | | | 452,930 | |
A Shares:(b) | | | | | | | | |
Proceeds from shares sold | | | 4,020 | | | | | |
Reinvestment of distributions | | | — | | | | | |
Amount paid for shares redeemed | | | — | | | | | |
Total A Shares | | | 4,020 | | | | | |
C Shares:(b) | | | | | | | | |
Proceeds from shares sold | | | 2,535 | | | | | |
Reinvestment of distributions | | | — | | | | | |
Amount paid for shares redeemed | | | (520 | ) | | | | |
Total C Shares | | | 2,015 | | | | | |
Net increase in net assets resulting from capital transactions | | | 5,067,558 | | | | 11,009,970 | |
Total Increase in Net Assets | | | 2,979,132 | | | | 12,730,487 | |
Net Assets | | | | | | | | |
Beginning of period | | | 12,730,487 | | | | — | |
End of period | | $ | 15,709,619 | | | $ | 12,730,487 | |
| | See accompanying notes which are an integral part of these financial statements. | 37 |
Fuller & Thaler Funds
Statements of Changes in Net Assets (continued)
| | | Fuller & Thaler Behavioral
Small-Cap Growth Fund | |
| | | For the
Year Ended
September 30,
2019 | | | For the
Period Ended
September 30,
2018(a) | |
Share Transactions: | | | | | | | | |
R6 Shares: | | | | | | | | |
Shares sold | | | 841 | | | | 161,053 | |
Shares issued in reinvestment of distributions | | | — | | | | — | |
Shares redeemed | | | (11,034 | ) | | | (50,004 | ) |
Total R6 Shares | | | (10,193 | ) | | | 111,049 | |
Institutional Shares: | | | | | | | | |
Shares sold | | | 529,959 | | | | 369,518 | |
Shares issued in reinvestment of distributions | | | — | | | | — | |
Shares redeemed | | | (257,814 | ) | | | (25,814 | ) |
Total Institutional Shares | | | 272,145 | | | | 343,704 | |
Investor Shares: | | | | | | | | |
Shares sold | | | 7,568 | | | | 18,360 | |
Shares issued in reinvestment of distributions | | | — | | | | — | |
Shares redeemed | | | (18,397 | ) | | | (464 | ) |
Total Investor Shares | | | (10,829 | ) | | | 17,896 | |
A Shares:(b) | | | | | | | | |
Shares sold | | | 192 | | | | | |
Shares issued in reinvestment of distributions | | | — | | | | | |
Shares redeemed | | | — | | | | | |
Total A Shares | | | 192 | | | | | |
C Shares:(b) | | | | | | | | |
Shares sold | | | 125 | | | | | |
Shares issued in reinvestment of distributions | | | — | | | | | |
Shares redeemed | | | (22 | ) | | | | |
Total C Shares | | | 103 | | | | | |
(a) | For the period December 21, 2017 (commencement of operations) to September 30, 2018. |
(b) | For the period December 19, 2018 (commencement of operations) to September 30, 2019. |
38 | See accompanying notes which are an integral part of these financial statements. | |
Fuller & Thaler Funds
Statements of Changes in Net Assets (continued)
| | | Fuller & Thaler Behavioral
Mid-Cap Value Fund | |
| | | For the
Year Ended
September 30,
2019 | | | For the
Period Ended
September 30,
2018(a) | |
Increase (Decrease) in Net Assets due to: | | | | | | | | |
Operations | | | | | | | | |
Net investment income | | $ | 130,841 | | | $ | 41,013 | |
Net realized gain on investment securities transactions | | | 110,623 | | | | 9,512 | |
Net change in unrealized appreciation of investment securities | | | 657,880 | | | | 252,829 | |
Net increase in net assets resulting from operations | | | 899,344 | | | | 303,354 | |
Distributions to Shareholders from Earnings: | | | | | | | | |
R6 Shares | | | (14,740 | ) | | | — | |
Institutional Shares | | | (65,069 | ) | | | — | |
Investor Shares | | | (2,158 | ) | | | — | |
Total distributions | | | (81,967 | ) | | | — | |
Capital Transactions: | | | | | | | | |
R6 Shares: | | | | | | | | |
Proceeds from shares sold | | | 55,299 | | | | 3,293,787 | |
Reinvestment of distributions | | | 14,741 | | | | — | |
Amount paid for shares redeemed | | | (127,587 | ) | | | (995,571 | ) |
Total R6 Shares | | | (57,547 | ) | | | 2,298,216 | |
Institutional Shares: | | | | | | | | |
Proceeds from shares sold | | | 4,551,931 | | | | 10,465,676 | |
Reinvestment of distributions | | | 65,069 | | | | — | |
Amount paid for shares redeemed | | | (3,336,153 | ) | | | (77,002 | ) |
Total Institutional Shares | | | 1,280,847 | | | | 10,388,674 | |
Investor Shares: | | | | | | | | |
Proceeds from shares sold | | | 1,528,567 | | | | 376,162 | |
Reinvestment of distributions | | | 2,158 | | | | — | |
Amount paid for shares redeemed | | | (308,132 | ) | | | (39,906 | ) |
Total Investor Shares | | | 1,222,593 | | | | 336,256 | |
Net increase in net assets resulting from capital transactions | | | 2,445,893 | | | | 13,023,146 | |
Total Increase in Net Assets | | | 3,263,270 | | | | 13,326,500 | |
Net Assets | | | | | | | | |
Beginning of period | | | 13,326,500 | | | | — | |
End of period | | $ | 16,589,770 | | | $ | 13,326,500 | |
| | See accompanying notes which are an integral part of these financial statements. | 39 |
Fuller & Thaler Funds
Statements of Changes in Net Assets (continued)
| | | Fuller & Thaler Behavioral
Mid-Cap Value Fund | |
| | | For the
Year Ended
September 30,
2019 | | | For the
Period Ended
September 30,
2018(a) | |
Share Transactions: | | | | | | | | |
R6 Shares: | | | | | | | | |
Shares sold | | | 2,796 | | | | 164,813 | |
Shares issued in reinvestment of distributions | | | 782 | | | | — | |
Shares redeemed | | | (6,558 | ) | | | (50,004 | ) |
Total R6 Shares | | | (2,980 | ) | | | 114,809 | |
Institutional Shares: | | | | | | | | |
Shares sold | | | 227,539 | | | | 520,459 | |
Shares issued in reinvestment of distributions | | | 3,454 | | | | — | |
Shares redeemed | | | (165,038 | ) | | | (3,756 | ) |
Total Institutional Shares | | | 65,955 | | | | 516,703 | |
Investor Shares: | | | | | | | | |
Shares sold | | | 77,055 | | | | 18,784 | |
Shares issued in reinvestment of distributions | | | 115 | | | | — | |
Shares redeemed | | | (15,636 | ) | | | (1,981 | ) |
Total Investor Shares | | | 61,534 | | | | 16,803 | |
(a) | For the period December 21, 2017 (commencement of operations) to September 30, 2018. |
40 | See accompanying notes which are an integral part of these financial statements. | |
Fuller & Thaler Funds
Statements of Changes in Net Assets (continued)
| | | Fuller & Thaler
Behavioral
Unconstrained
Equity Fund | | | Fuller & Thaler
Behavioral
Small–Mid Core
Equity Fund | |
| | | For the
Period Ended
September 30,
2019(a) | | | For the
Period Ended
September 30,
2019(a) | |
Increase (Decrease) in Net Assets due to: | | | | | | | | |
Operations | | | | | | | | |
Net investment income | | $ | 11,199 | | | $ | 12,346 | |
Net realized gain on investment securities transactions | | | 24,280 | | | | 40,759 | |
Net change in unrealized appreciation of investment securities | | | 618,090 | | | | 209,968 | |
Net increase in net assets resulting from operations | | | 653,569 | | | | 263,073 | |
Capital Transactions: | | | | | | | | |
R6 Shares: | | | | | | | | |
Proceeds from shares sold | | | 2,131,873 | | | | | |
Reinvestment of distributions | | | — | | | | | |
Amount paid for shares redeemed | | | (1,242,996 | ) | | | | |
Total R6 Shares | | | 888,877 | | | | | |
Institutional Shares: | | | | | | | | |
Proceeds from shares sold | | | 3,089,903 | | | | 2,230,978 | |
Reinvestment of distributions | | | — | | | | — | |
Amount paid for shares redeemed | | | — | | | | — | |
Total Institutional Shares | | | 3,089,903 | | | | 2,230,978 | |
Net increase in net assets resulting from capital transactions | | | 3,978,780 | | | | 2,230,978 | |
Total Increase in Net Assets | | | 4,632,349 | | | | 2,494,051 | |
Net Assets | | | | | | | | |
Beginning of period | | | — | | | | — | |
End of period | | $ | 4,632,349 | | | $ | 2,494,051 | |
Share Transactions: | | | | | | | | |
R6 Shares: | | | | | | | | |
Shares sold | | | 103,931 | | | | | |
Shares issued in reinvestment of distributions | | | — | | | | | |
Shares redeemed | | | (50,986 | ) | | | | |
Total R6 Shares | | | 52,945 | | | | | |
Institutional Shares: | | | | | | | | |
Shares sold | | | 126,503 | | | | 104,078 | |
Shares issued in reinvestment of distributions | | | — | | | | — | |
Shares redeemed | | | — | | | | — | |
Total Institutional Shares | | | 126,503 | | | | 104,078 | |
(a) | For the period December 26, 2018 (commencement of operations) to September 30, 2019. |
| | See accompanying notes which are an integral part of these financial statements. | 41 |
Fuller & Thaler Funds
Statements of Changes in Net Assets (continued)
| | | Fuller & Thaler
Behavioral
Micro-Cap
Equity Fund | |
| | | For the
Period Ended
September 30,
2019(a) | |
Increase (Decrease) in Net Assets due to: | | | | |
Operations | | | | |
Net investment loss | | $ | (25,796 | ) |
Net realized gain on investment securities transactions | | | 171,644 | |
Net change in unrealized appreciation of investment securities | | | 68,284 | |
Net increase in net assets resulting from operations | | | 214,132 | |
Capital Transactions: | | | | |
Institutional Shares: | | | | |
Proceeds from shares sold | | | 2,605,042 | |
Reinvestment of distributions | | | — | |
Amount paid for shares redeemed | | | — | |
Total Institutional Shares | | | 2,605,042 | |
Net increase in net assets resulting from capital transactions | | | 2,605,042 | |
Total Increase in Net Assets | | | 2,819,174 | |
Net Assets | | | | |
Beginning of period | | | — | |
End of period | | $ | 2,819,174 | |
Share Transactions: | | | | |
Institutional Shares: | | | | |
Shares sold | | | 129,904 | |
Shares issued in reinvestment of distributions | | | — | |
Shares redeemed | | | — | |
Total Institutional Shares | | | 129,904 | |
(a) | For the period December 28, 2018 (commencement of operations) to September 30, 2019. |
42 | See accompanying notes which are an integral part of these financial statements. | |
Fuller & Thaler Behavioral Small-Cap Equity Fund – R6 Shares
Financial Highlights
(For a share outstanding during each period)
| | | For the Years Ended
September 30, | | | For the
Period Ended
September
30, | | | For the
Year Ended
November
30, | |
| | | 2019 | | | 2018 | | | 2017 | | | 2016 | | | 2015(a) | | | 2014 | |
Net asset value, beginning of period | | $ | 26.76 | | | $ | 24.25 | | | $ | 18.97 | | | $ | 18.84 | | | $ | 25.83 | | | $ | 23.74 | |
Income from investment operations: | | | | | | | | | | | | | | | | | | | | | | | | |
Net investment income(b) | | | 0.17 | | | | 0.18 | | | | 0.18 | | | | 0.25 | | | | 0.25 | | | | 0.31 | |
Net realized and unrealized gain (loss) on investments | | | (1.40 | ) | | | 2.40 | | | | 5.19 | | | | 2.42 | | | | (0.96 | ) | | | 2.81 | |
Total from investment operations | | | (1.23 | ) | | | 2.58 | | | | 5.37 | | | | 2.67 | | | | (0.71 | ) | | | 3.12 | |
Less distributions to shareholders from: | | | | | | | | | | | | | | | | | | | | | | | | |
Net investment income | | | (0.14 | ) | | | (0.07 | ) | | | (0.09 | ) | | | (0.28 | ) | | | (0.42 | ) | | | (0.19 | ) |
Net realized gains | | | — | | | | — | | | | — | | | | (2.26 | ) | | | (5.86 | ) | | | (0.84 | ) |
Total from distributions | | | (0.14 | ) | | | (0.07 | ) | | | (0.09 | ) | | | (2.54 | ) | | | (6.28 | ) | | | (1.03 | ) |
Net asset value, end of period | | $ | 25.39 | | | $ | 26.76 | | | $ | 24.25 | | | $ | 18.97 | | | $ | 18.84 | | | $ | 25.83 | |
Total Return(c) | | | (4.54 | )% | | | 10.68 | % | | | 28.35 | % | | | 16.14 | % | | | (4.09 | )%(d) | | | 13.79 | % |
| | | | | | | | | | | | | | | | | | | | | | | | | |
Ratios and Supplemental Data: | | | | | | | | | | | | | | | | | | | | | | | | |
Net assets, end of period (000 omitted) | | $ | 184,779 | | | $ | 55,160 | | | $ | 3,740 | | | $ | 3,174 | | | $ | 15,677 | | | $ | 74,044 | |
Before waiver or recoupment: | | | | | | | | | | | | | | | | | | | | | | | | |
Ratio of expenses to average net assets | | | 0.72 | % | | | 0.74 | % | | | 1.30 | % | | | 2.65 | % | | | 0.99 | %(e)(f) | | | 0.76 | % |
After waiver or recoupment: | | | | | | | | | | | | | | | | | | | | | | | | |
Ratio of net expenses to average net assets | | | 0.72 | % | | | 0.76 | % | | | 0.75 | % | | | 0.64 | % | | | 0.55 | %(e)(f) | | | 0.55 | % |
Ratio of net investment income to average net assets | | | 0.69 | % | | | 0.71 | % | | | 0.81 | % | | | 1.33 | % | | | 1.33 | %(e)(f) | | | 1.29 | % |
Portfolio turnover(g) | | | 38 | % | | | 35 | % | | | 26 | % | | | 194 | % | | | 108 | %(d) | | | 89 | % |
(a) | Fiscal year end changed from November 30th to September 30th. |
(b) | Per share net investment income has been calculated using the average shares method. |
(c) | Total return in the above table represents the rate that the investor would have earned or lost on an investment in the Small-Cap Equity Fund, assuming reinvestment of distributions. |
(f) | Certain expenses incurred by the Small-Cap Equity Fund were not annualized. |
(g) | Portfolio turnover is calculated on the basis on the Fund as a whole without distinguishing among the classes of shares. |
| | See accompanying notes which are an integral part of these financial statements. | 43 |
Fuller & Thaler Behavioral Small-Cap Equity Fund – Institutional Shares
Financial Highlights
(For a share outstanding during each period)
| | | For the Years Ended
September 30, | | | For the
Period Ended
September
30, | | | For the
Year Ended
November
30, | |
| | | 2019 | | | 2018 | | | 2017 | | | 2016 | | | 2015(a) | | | 2014 | |
Net asset value, beginning of period | | $ | 26.55 | | | $ | 24.07 | | | $ | 18.85 | | | $ | 18.77 | | | $ | 25.84 | | | $ | 23.74 | |
Income from investment operations: | | | | | | | | | | | | | | | | | | | | | | | | |
Net investment income(b) | | | 0.15 | | | | 0.15 | | | | 0.20 | | | | 0.23 | | | | 0.23 | | | | 0.31 | |
Net realized and unrealized gain (loss) on investments | | | (1.40 | ) | | | 2.39 | | | | 5.11 | | | | 2.38 | | | | (0.97 | ) | | | 2.78 | |
Total from investment operations | | | (1.25 | ) | | | 2.54 | | | | 5.31 | | | | 2.61 | | | | (0.74 | ) | | | 3.09 | |
Less distributions to shareholders from: | | | | | | | | | | | | | | | | | | | | | | | | |
Net investment income | | | (0.12 | ) | | | (0.06 | ) | | | (0.09 | ) | | | (0.27 | ) | | | (0.47 | ) | | | (0.15 | ) |
Net realized gains | | | — | | | | — | | | | — | | | | (2.26 | ) | | | (5.86 | ) | | | (0.84 | ) |
Total from distributions | | | (0.12 | ) | | | (0.06 | ) | | | (0.09 | ) | | | (2.53 | ) | | | (6.33 | ) | | | (0.99 | ) |
Net asset value, end of period | | $ | 25.18 | | | $ | 26.55 | | | $ | 24.07 | | | $ | 18.85 | | | $ | 18.77 | | | $ | 25.84 | |
Total Return(c) | | | (4.65 | )% | | | 10.59 | % | | | 28.20 | % | | | 15.86 | % | | | (4.21 | )%(d) | | | 13.64 | % |
| | | | | | | | | | | | | | | | | | | | | | | | | |
Ratios and Supplemental Data: | | | | | | | | | | | | | | | | | | | | | | | | |
Net assets, end of period (000 omitted) | | $ | 1,620,327 | | | $ | 915,898 | | | $ | 172,238 | | | $ | 2,113 | | | $ | 100 | | | $ | 117 | |
Before waiver or recoupment: | | | | | | | | | | | | | | | | | | | | | | | | |
Ratio of expenses to average net assets | | | 0.82 | % | | | 0.84 | % | | | 1.39 | % | | | 2.75 | % | | | 1.23 | %(e)(f) | | | 0.81 | % |
After waiver or recoupment: | | | | | | | | | | | | | | | | | | | | | | | | |
Ratio of net expenses to average net assets | | | 0.82 | % | | | 0.86 | % | | | 0.85 | % | | | 0.74 | % | | | 0.65 | %(e)(f) | | | 0.65 | % |
Ratio of net investment income to average net assets | | | 0.60 | % | | | 0.59 | % | | | 0.90 | % | | | 1.70 | % | | | 1.25 | %(e)(f) | | | 1.29 | % |
Portfolio turnover(g) | | | 38 | % | | | 35 | % | | | 26 | % | | | 194 | % | | | 108 | %(d) | | | 89 | % |
(a) | Fiscal year end changed from November 30th to September 30th. |
(b) | Per share net investment income has been calculated using the average shares method. |
(c) | Total return in the above table represents the rate that the investor would have earned or lost on an investment in the Small-Cap Equity Fund, assuming reinvestment of distributions. |
(f) | Certain expenses incurred by the Small-Cap Equity Fund were not annualized. |
(g) | Portfolio turnover is calculated on the basis on the Fund as a whole without distinguishing among the classes of shares. |
44 | See accompanying notes which are an integral part of these financial statements. | |
Fuller & Thaler Behavioral Small-Cap Equity Fund – Investor Shares
Financial Highlights
(For a share outstanding during each period)
| | | For the Years Ended
September 30, | | | For the
Period Ended
September
30, | | | For the
Year Ended
November
30, | |
| | | 2019 | | | 2018 | | | 2017 | | | 2016 | | | 2015(a) | | | 2014 | |
Net asset value, beginning of period | | $ | 26.36 | | | $ | 23.91 | | | $ | 18.75 | | | $ | 18.70 | | | $ | 25.67 | | | $ | 23.72 | |
Income from investment operations: | | | | | | | | | | | | | | | | | | | | | | | | |
Net investment income(b) | | | 0.09 | | | | 0.08 | | | | 0.15 | | | | 0.20 | | | | 0.20 | | | | 0.24 | |
Net realized and unrealized gain (loss) on investments | | | (1.38 | ) | | | 2.39 | | | | 5.09 | | | | 2.38 | | | | (0.96 | ) | | | 2.79 | |
Total from investment operations | | | (1.29 | ) | | | 2.47 | | | | 5.24 | | | | 2.58 | | | | (0.76 | ) | | | 3.03 | |
Less distributions to shareholders from: | | | | | | | | | | | | | | | | | | | | | | | | |
Net investment income | | | (0.05 | ) | | | (0.02 | ) | | | (0.08 | ) | | | (0.27 | ) | | | (0.35 | ) | | | (0.24 | ) |
Net realized gains | | | — | | | | — | | | | — | | | | (2.26 | ) | | | (5.86 | ) | | | (0.84 | ) |
Total from distributions | | | (0.05 | ) | | | (0.02 | ) | | | (0.08 | ) | | | (2.53 | ) | | | (6.21 | ) | | | (1.08 | ) |
Net asset value, end of period | | $ | 25.02 | | | $ | 26.36 | | | $ | 23.91 | | | $ | 18.75 | | | $ | 18.70 | | | $ | 25.67 | |
Total Return(c) | | | (4.89 | )% | | | 10.35 | % | | | 27.97 | % | | | 15.74 | % | | | (4.33 | )%(d) | | | 13.43 | % |
| | | | | | | | | | | | | | | | | | | | | | | | | |
Ratios and Supplemental Data: | | | | | | | | | | | | | | | | | | | | | | | | |
Net assets, end of period (000 omitted) | | $ | 124,550 | | | $ | 144,856 | | | $ | 56,500 | | | $ | 4,319 | | | $ | 853 | | | $ | 10,023 | |
Before waiver or recoupment: | | | | | | | | | | | | | | | | | | | | | | | | |
Ratio of expenses to average net assets | | | 1.10 | % | | | 1.13 | % | | | 1.65 | % | | | 2.90 | % | | | 1.27 | %(e)(f) | | | 1.02 | % |
After waiver or recoupment: | | | | | | | | | | | | | | | | | | | | | | | | |
Ratio of net expenses to average net assets | | | 1.10 | % | | | 1.10 | % | | | 1.00 | % | | | 0.89 | % | | | 0.81 | %(e)(f) | | | 0.82 | % |
Ratio of net investment income to average net assets | | | 0.38 | % | | | 0.32 | % | | | 0.70 | % | | | 1.32 | % | | | 1.11 | %(e)(f) | | | 1.02 | % |
Portfolio turnover(g) | | | 38 | % | | | 35 | % | | | 26 | % | | | 194 | % | | | 108 | %(d) | | | 89 | % |
(a) | Fiscal year end changed from November 30th to September 30th. |
(b) | Per share net investment income has been calculated using the average shares method. |
(c) | Total return in the above table represents the rate that the investor would have earned or lost on an investment in the Small-Cap Equity Fund, assuming reinvestment of distributions. |
(f) | Certain expenses incurred by the Small-Cap Equity Fund were not annualized. |
(g) | Portfolio turnover is calculated on the basis on the Fund as a whole without distinguishing among the classes of shares. |
| | See accompanying notes which are an integral part of these financial statements. | 45 |
Fuller & Thaler Behavioral Small-Cap Equity Fund – A Shares
Financial Highlights
(For a share outstanding during the period)
| | | For the
Period Ended
September 30,
2019(a) | |
Net asset value, beginning of period | | $ | 20.99 | |
Income from investment operations: | | | | |
Net investment income | | | 0.07 | |
Net realized and unrealized gain on investments | | | 3.98 | |
Total from investment operations | | | 4.05 | |
Net asset value, end of period | | $ | 25.04 | |
Total Return(b) | | | 19.29 | %(c) |
| | | | | |
Ratios and Supplemental Data: | | | | |
Net assets, end of period (000 omitted) | | $ | 575 | |
Before waiver or recoupment: | | | | |
Ratio of expenses to average net assets | | | 1.01 | %(d) |
After waiver or recoupment: | | | | |
Ratio of net expenses to average net assets | | | 1.01 | %(d) |
Ratio of net investment income to average net assets | | | 0.37 | %(d) |
Portfolio turnover(e) | | | 38 | %(c) |
(a) | For the period December 19, 2018 (commencement of operations) to September 30, 2019. |
(b) | Total return in the above table represents the rate that the investor would have earned or lost on an investment in the Small-Cap Equity Fund, assuming reinvestment of distributions. |
(e) | Portfolio turnover is calculated on the basis on the Small-Cap Equity Fund as a whole without distinguishing among the classes of shares. |
46 | See accompanying notes which are an integral part of these financial statements. | |
Fuller & Thaler Behavioral Small-Cap Equity Fund – C Shares
Financial Highlights
(For a share outstanding during the period)
| | | For the
Period Ended
September 30,
2019(a) | |
Net asset value, beginning of period | | $ | 20.99 | |
Income from investment operations: | | | | |
Net investment loss(b) | | | (0.09 | ) |
Net realized and unrealized gain on investments | | | 4.02 | |
Total from investment operations | | | 3.93 | |
Net asset value, end of period | | $ | 24.92 | |
Total Return(c) | | | 18.72 | %(d) |
| | | | | |
Ratios and Supplemental Data: | | | | |
Net assets, end of period (000 omitted) | | $ | 472 | |
Before waiver or recoupment: | | | | |
Ratio of expenses to average net assets | | | 1.72 | %(e) |
After waiver or recoupment: | | | | |
Ratio of net expenses to average net assets | | | 1.72 | %(e) |
Ratio of net investment loss to average net assets | | | (0.46 | )%(e) |
Portfolio turnover(f) | | | 38 | %(d) |
(a) | For the period December 19, 2018 (commencement of operations) to September 30, 2019. |
(b) | Per share net investment income has been calculated using the average shares method. |
(c) | Total return in the above table represents the rate that the investor would have earned or lost on an investment in the Small-Cap Equity Fund, assuming reinvestment of distributions. |
(f) | Portfolio turnover is calculated on the basis on the Small-Cap Equity Fund as a whole without distinguishing among the classes of shares. |
| | See accompanying notes which are an integral part of these financial statements. | 47 |
Fuller & Thaler Behavioral Small-Cap Growth Fund - R6 Shares
Financial Highlights
(For a share outstanding during each period)
| | | For the
Year Ended
September 30,
2019 | | | For the
Period Ended
September 30,
2018(a) | |
Net asset value, beginning of period | | $ | 26.95 | | | $ | 20 .00 | |
Income from investment operations: | | | | | | | | |
Net investment loss(b) | | | (0.10 | ) | | | (0.11 | ) |
Net realized and unrealized gain (loss) on investments | | | (5.12 | ) | | | 7.06 | |
Total from investment operations | | | (5.22 | ) | | | 6.95 | |
Net asset value, end of period | | $ | 21.73 | | | $ | 26.95 | |
Total Return(c) | | | (19.37 | )% | | | 34.75 | %(d) |
| | | | | | | | | |
Ratios and Supplemental Data: | | | | | | | | |
Net assets, end of period (000 omitted) | | $ | 2,191 | | | $ | 2,993 | |
Before waiver or recoupment: | | | | | | | | |
Ratio of expenses to average net assets | | | 2.19 | %(f) | | | 4.42 | %(e) |
After waiver or recoupment: | | | | | | | | |
Ratio of net expenses to average net assets | | | 0.92 | %(f) | | | 0.90 | %(e) |
Ratio of net investment loss to average net assets | | | (0.45 | )% | | | (0.60 | )%(e) |
Portfolio turnover(g) | | | 127 | % | | | 71 | %(d) |
(a) | For the period December 21, 2017 (commencement of operations) to September 30, 2018. |
(b) | Per share net investment income has been calculated using the average shares method. |
(c) | Total return in the above table represents the rate that the investor would have earned or lost on an investment in the Small-Cap Growth Fund, assuming reinvestment of distributions. |
(f) | Includes interest expense of 0.02% for the fiscal year ended September 30, 2019. |
(g) | Portfolio turnover is calculated on the basis on the Small-Cap Growth Fund as a whole without distinguishing among the classes of shares. |
48 | See accompanying notes which are an integral part of these financial statements. | |
Fuller & Thaler Behavioral Small-Cap Growth Fund - Institutional Shares
Financial Highlights
(For a share outstanding during each period)
| | | For the
Year Ended
September 30,
2019 | | | For the
Period Ended
September 30,
2018(a) | |
Net asset value, beginning of period | | $ | 26.93 | | | $ | 20.00 | |
Income from investment operations: | | | | | | | | |
Net investment loss(b) | | | (0.11 | ) | | | (0.14 | ) |
Net realized and unrealized gain (loss) on investments | | | (5.13 | ) | | | 7.07 | |
Total from investment operations | | | (5.24 | ) | | | 6.93 | |
Net asset value, end of period | | $ | 21.69 | | | $ | 26.93 | |
Total Return(c) | | | (19.46 | )% | | | 34.65 | %(d) |
| | | | | | | | | |
Ratios and Supplemental Data: | | | | | | | | |
Net assets, end of period (000 omitted) | | $ | 13,359 | | | $ | 9,257 | |
Before waiver or recoupment: | | | | | | | | |
Ratio of expenses to average net assets | | | 2.25 | %(f) | | | 4.55 | %(e) |
After waiver or recoupment: | | | | | | | | |
Ratio of net expenses to average net assets | | | 1.00 | %(f) | | | 0.99 | %(e) |
Ratio of net investment loss to average net assets | | | (0.48 | )% | | | (0.70 | )%(e) |
Portfolio turnover(g) | | | 127 | % | | | 71 | %(d) |
(a) | For the period December 21, 2017 (commencement of operations) to September 30, 2018. |
(b) | Per share net investment income has been calculated using the average shares method. |
(c) | Total return in the above table represents the rate that the investor would have earned or lost on an investment in the Small-Cap Growth Fund, assuming reinvestment of distributions. |
(f) | Includes interest expense of 0.01% for the fiscal year ended September 30, 2019. |
(g) | Portfolio turnover is calculated on the basis on the Small-Cap Growth Fund as a whole without distinguishing among the classes of shares. |
| | See accompanying notes which are an integral part of these financial statements. | 49 |
Fuller & Thaler Behavioral Small-Cap Growth Fund - Investor Shares
Financial Highlights
(For a share outstanding during each period)
| | | For the
Year Ended
September 30,
2019 | | | For the
Period Ended
September 30,
2018(a) | |
Net asset value, beginning of period | | $ | 26.88 | | | $ | 20.00 | |
Income from investment operations: | | | | | | | | |
Net investment loss(b) | | | (0.19 | ) | | | (0.18 | ) |
Net realized and unrealized gain (loss) on investments | | | (5.09 | ) | | | 7.06 | |
Total from investment operations | | | (5.28 | ) | | | 6.88 | |
Net asset value, end of period | | $ | 21.60 | | | $ | 26.88 | |
Total Return(c) | | | (19.64 | )% | | | 34.40 | %(d) |
| | | | | | | | | |
Ratios and Supplemental Data: | | | | | | | | |
Net assets, end of period (000 omitted) | | $ | 153 | | | $ | 481 | |
Before waiver or recoupment: | | | | | | | | |
Ratio of expenses to average net assets | | | 2.57 | %(f) | | | 4.77 | %(e) |
After waiver or recoupment: | | | | | | | | |
Ratio of net expenses to average net assets | | | 1.27 | %(f) | | | 1.24 | %(e) |
Ratio of net investment loss to average net assets | | | (0.85 | )% | | | (0.92 | )%(e) |
Portfolio turnover(g) | | | 127 | % | | | 71 | %(d) |
(a) | For the period December 21, 2017 (commencement of operations) to September 30, 2018. |
(b) | Per share net investment income has been calculated using the average shares method. |
(c) | Total return in the above table represents the rate that the investor would have earned or lost on an investment in the Small-Cap Growth Fund, assuming reinvestment of distributions. |
(f) | Includes interest expense of 0.02% for the fiscal year ended September 30, 2019. |
(g) | Portfolio turnover is calculated on the basis on the Small-Cap Growth Fund as a whole without distinguishing among the classes of shares. |
50 | See accompanying notes which are an integral part of these financial statements. | |
Fuller & Thaler Behavioral Small-Cap Growth Fund - A Shares
Financial Highlights
(For a share outstanding during the period)
| | | For the
Period Ended
September 30,
2019(a) | |
Net asset value, beginning of period | | $ | 19.59 | |
Income from investment operations: | | | | |
Net investment loss(b) | | | (0.13 | ) |
Net realized and unrealized gain on investments | | | 2.13 | |
Total from investment operations | | | 2.00 | |
Net asset value, end of period | | $ | 21.59 | |
Total Return(c) | | | 10.21 | %(c) |
| | | | | |
Ratios and Supplemental Data: | | | | |
Net assets, end of period (000 omitted) | | $ | 4 | |
Before waiver or recoupment: | | | | |
Ratio of expenses to average net assets | | | 2.15 | %(e) |
After waiver or recoupment: | | | | |
Ratio of net expenses to average net assets | | | 1.30 | %(e) |
Ratio of net investment loss to average net assets | | | (0.75 | )%(e) |
Portfolio turnover(f) | | | 127 | %(d) |
(a) | For the period December 19, 2018 (commencement of operations) through September 30, 2019. |
(b) | Per share net investment income has been calculated using the average shares method. |
(c) | Total return in the above table represents the rate that the investor would have earned or lost on an investment in the Small-Cap Growth Fund, assuming reinvestment of distributions. |
(f) | Portfolio turnover is calculated on the basis on the Small-Cap Growth Fund as a whole without distinguishing among the classes of shares. |
| | See accompanying notes which are an integral part of these financial statements. | 51 |
Fuller & Thaler Behavioral Small-Cap Growth Fund - C Shares
Financial Highlights
(For a share outstanding during the period)
| | | For the
Period Ended
September 30,
2019(a) | |
Net asset value, beginning of period | | $ | 19.59 | |
Income from investment operations: | | | | |
Net investment loss(b) | | | (0.22 | ) |
Net realized and unrealized gain on investments | | | 2.14 | |
Total from investment operations | | | 1.92 | |
Net asset value, end of period | | $ | 21.51 | |
Total Return(c) | | | 9.80 | %(d) |
| | | | | |
Ratios and Supplemental Data: | | | | |
Net assets, end of period (000 omitted) | | $ | 2 | |
Before waiver or recoupment: | | | | |
Ratio of expenses to average net assets | | | 2.87 | %(e) |
After waiver or recoupment: | | | | |
Ratio of net expenses to average net assets | | | 1.80 | %(e) |
Ratio of net investment loss to average net assets | | | (1.27 | )%(e) |
Portfolio turnover(f) | | | 127 | %(d) |
(a) | For the period December 19, 2018 (commencement of operations) through September 30, 2019. |
(b) | Per share net investment income has been calculated using the average shares method. |
(c) | Total return in the above table represents the rate that the investor would have earned or lost on an investment in the Small-Cap Growth Fund, assuming reinvestment of distributions. |
(f) | Portfolio turnover is calculated on the basis on the Small-Cap Growth Fund as a whole without distinguishing among the classes of shares. |
52 | See accompanying notes which are an integral part of these financial statements. | |
Fuller & Thaler Behavioral Mid-Cap Value Fund - R6 Shares
Financial Highlights
(For a share outstanding during each period)
| | | For the
Year Ended
September 30,
2019 | | | For the
Period Ended
September 30,
2018(a) | |
Net asset value, beginning of period | | $ | 20.56 | | | $ | 20.00 | |
Income from investment operations: | | | | | | | | |
Net investment income(b) | | | 0.20 | | | | 0.13 | |
Net realized and unrealized gain on investments | | | 0.85 | | | | 0.43 | |
Total from investment operations | | | 1.05 | | | | 0.56 | |
| | | | | | | | | |
Less distributions to shareholders from: | | | | | | | | |
Net investment income | | | (0.11 | ) | | | — | |
Net realized gains | | | (0.01 | ) | | | — | |
Total from distributions | | | (0.12 | ) | | | — | |
Net asset value, end of period | | $ | 21.49 | | | $ | 20.56 | |
Total Return(c) | | | 5.23 | % | | | 2.80 | %(d) |
| | | | | | | | | |
Ratios and Supplemental Data: | | | | | | | | |
Net assets, end of period (000 omitted) | | $ | 2,403 | | | $ | 2,361 | |
Before waiver or recoupment: | | | | | | | | |
Ratio of expenses to average net assets | | | 1.72 | % | | | 4.29 | %(e) |
After waiver or recoupment: | | | | | | | | |
Ratio of net expenses to average net assets | | | 0.80 | % | | | 0.80 | %(e) |
Ratio of net investment income to average net assets | | | 0.98 | % | | | 0.82 | %(e) |
Portfolio turnover(f) | | | 12 | % | | | 0.44 | %(d) |
(a) | For the period December 21, 2017 (commencement of operations) to September 30, 2018. |
(b) | Per share net investment income has been calculated using the average shares method. |
(c) | Total return in the above table represents the rate that the investor would have earned or lost on an investment in the Mid-Cap Value Fund, assuming reinvestment of distributions. |
(f) | Portfolio turnover is calculated on the basis on the Mid-Cap Value Fund as a whole without distinguishing among the classes of shares. |
| | See accompanying notes which are an integral part of these financial statements. | 53 |
Fuller & Thaler Behavioral Mid-Cap Value Fund - Institutional Shares
Financial Highlights
(For a share outstanding during each period)
| | | For the
Year Ended
September 30,
2019 | | | For the
Period Ended
September 30,
2018(a) | |
Net asset value, beginning of period | | $ | 20.56 | | | $ | 20.00 | |
Income from investment operations: | | | | | | | | |
Net investment income(b) | | | 0.18 | | | | 0.14 | |
Net realized and unrealized gain on investments | | | 0.85 | | | | 0.42 | |
Total from investment operations | | | 1.03 | | | | 0.56 | |
| | | | | | | | | |
Less distributions to shareholders from: | | | | | | | | |
Net investment income | | | (0.11 | ) | | | — | |
Net realized gains | | | (0.01 | ) | | | — | |
Total from distributions | | | (0.12 | ) | | | — | |
Net asset value, end of period | | $ | 21.47 | | | $ | 20.56 | |
Total Return(c) | | | 5.09 | % | | | 2.80 | %(d) |
| | | | | | | | | |
Ratios and Supplemental Data: | | | | | | | | |
Net assets, end of period (000 omitted) | | $ | 12,511 | | | $ | 10,621 | |
Before waiver or recoupment: | | | | | | | | |
Ratio of expenses to average net assets | | | 1.81 | % | | | 4.41 | %(e) |
After waiver or recoupment: | | | | | | | | |
Ratio of net expenses to average net assets | | | 0.90 | % | | | 0.89 | %(e) |
Ratio of net investment income to average net assets | | | 0.90 | % | | | 0.89 | %(e) |
Portfolio turnover(f) | | | 12 | % | | | 0.44 | %(d) |
(a) | For the period December 21, 2017 (commencement of operations) to September 30, 2018. |
(b) | Per share net investment income has been calculated using the average shares method. |
(c) | Total return in the above table represents the rate that the investor would have earned or lost on an investment in the Mid-Cap Value Fund, assuming reinvestment of distributions. |
(f) | Portfolio turnover is calculated on the basis on the Mid-Cap Value Fund as a whole without distinguishing among the classes of shares. |
54 | See accompanying notes which are an integral part of these financial statements. | |
Fuller & Thaler Behavioral Mid-Cap Value Fund - Investor Shares
Financial Highlights
(For a share outstanding during each period)
| | | For the
Year Ended
September 30,
2019 | | | For the
Period Ended
September 30,
2018(a) | |
Net asset value, beginning of period | | $ | 20.50 | | | $ | 20.00 | |
Income from investment operations: | | | | | | | | |
Net investment income(b) | | | 0.14 | | | | 0.10 | |
Net realized and unrealized gain on investments | | | 0.84 | | | | 0.40 | |
Total from investment operations | | | 0.98 | | | | 0.50 | |
| | | | | | | | | |
Less distributions to shareholders from: | | | | | | | | |
Net investment income | | | (0.08 | ) | | | — | |
Net realized gains | | | (0.01 | ) | | | — | |
Total from distributions | | | (0.09 | ) | | | — | |
Net asset value, end of period | | $ | 21.39 | | | $ | 20.50 | |
Total Return(c) | | | 4.84 | % | | | 2.50 | %(d) |
| | | | | | | | | |
Ratios and Supplemental Data: | | | | | | | | |
Net assets, end of period (000 omitted) | | $ | 1,676 | | | $ | 344 | |
Before waiver or recoupment: | | | | | | | | |
Ratio of expenses to average net assets | | | 2.10 | % | | | 4.65 | %(e) |
After waiver or recoupment: | | | | | | | | |
Ratio of net expenses to average net assets | | | 1.15 | % | | | 1.14 | %(e) |
Ratio of net investment income to average net assets | | | 0.70 | % | | | 0.65 | %(e) |
Portfolio turnover(f) | | | 12 | % | | | 0.44 | %(d) |
(a) | For the period December 21, 2017 (commencement of operations) to September 30, 2018. |
(b) | Per share net investment income has been calculated using the average shares method. |
(c) | Total return in the above table represents the rate that the investor would have earned or lost on an investment in the Mid-Cap Value Fund, assuming reinvestment of distributions. |
(f) | Portfolio turnover is calculated on the basis on the Mid-Cap Value Fund as a whole without distinguishing among the classes of shares. |
| | See accompanying notes which are an integral part of these financial statements. | 55 |
Fuller & Thaler Behavioral Unconstrained Equity Fund - R6 Shares
Financial Highlights
(For a share outstanding during the period)
| | | For the
Period Ended
September 30,
2019(a) | |
Net asset value, beginning of period | | $ | 20.00 | |
Income from investment operations: | | | | |
Net investment income(b) | | | 0.07 | |
Net realized and unrealized gain on investments | | | 5.76 | |
Total from investment operations | | | 5.83 | |
Net asset value, end of period | | $ | 25.83 | |
Total Return(c) | | | 29.15 | %(d) |
| | | | | |
Ratios and Supplemental Data: | | | | |
Net assets, end of period (000 omitted) | | $ | 1,368 | |
Before waiver or recoupment: | | | | |
Ratio of expenses to average net assets | | | 4.33 | %(e) |
After waiver or recoupment: | | | | |
Ratio of net expenses to average net assets | | | 0.90 | %(e) |
Ratio of net investment income to average net assets | | | 0.41 | %(e) |
Portfolio turnover(f) | | | 10 | %(d) |
(a) | For the period December 26, 2018 (commencement of operations) through September 30, 2019. |
(b) | Per share net investment income has been calculated using the average shares method. |
(c) | Total return in the above table represents the rate that the investor would have earned or lost on an investment in the Unconstrained Equity Fund, assuming reinvestment of distributions. |
(f) | Portfolio turnover is calculated on the basis on the Unconstrained Equity Fund as a whole without distinguishing among the classes of shares. |
56 | See accompanying notes which are an integral part of these financial statements. | |
Fuller & Thaler Behavioral Unconstrained Equity Fund - Institutional Shares
Financial Highlights
(For a share outstanding during the period)
| | | For the
Period Ended
September 30,
2019(a) | |
Net asset value, beginning of period | | $ | 20.00 | |
Income from investment operations: | | | | |
Net investment income(b) | | | 0.08 | |
Net realized and unrealized gain on investments | | | 5.73 | |
Total from investment operations | | | 5.81 | |
Net asset value, end of period | | $ | 25.81 | |
Total Return(c) | | | 29.05 | %(d) |
| | | | | |
Ratios and Supplemental Data: | | | | |
Net assets, end of period (000 omitted) | | $ | 3,265 | |
Before waiver or recoupment: | | | | |
Ratio of expenses to average net assets | | | 4.39 | %(e) |
After waiver or recoupment: | | | | |
Ratio of net expenses to average net assets | | | 0.99 | %(e) |
Ratio of net investment income to average net assets | | | 0.42 | %(e) |
Portfolio turnover(f) | | | 10 | %(d) |
(a) | For the period December 26, 2018 (commencement of operations) through September 30, 2019. |
(b) | Per share net investment income has been calculated using the average shares method. |
(c) | Total return in the above table represents the rate that the investor would have earned or lost on an investment in the Unconstrained Equity Fund, assuming reinvestment of distributions. |
(f) | Portfolio turnover is calculated on the basis on the Unconstrained Equity Fund as a whole without distinguishing among the classes of shares. |
| | See accompanying notes which are an integral part of these financial statements. | 57 |
Fuller & Thaler Behavioral Small-Mid Core Equity Fund - Institutional Shares
Financial Highlights
(For a share outstanding during the period)
| | | For the
Period Ended
September 30,
2019(a) | |
Net asset value, beginning of period | | $ | 20.00 | |
Income from investment operations: | | | | |
Net investment income(b) | | | 0.13 | |
Net realized and unrealized gain on investments | | | 3.83 | |
Total from investment operations | | | 3.96 | |
Net asset value, end of period | | $ | 23.96 | |
Total Return(c) | | | 19.80 | %(d) |
| | | | | |
Ratios and Supplemental Data: | | | | |
Net assets, end of period (000 omitted) | | $ | 2,494 | |
Before waiver or recoupment: | | | | |
Ratio of expenses to average net assets | | | 6.27 | %(e) |
After waiver or recoupment: | | | | |
Ratio of net expenses to average net assets | | | 0.95 | %(e) |
Ratio of net investment income to average net assets | | | 0.73 | %(e) |
Portfolio turnover | | | 25 | %(d) |
(a) | For the period December 26, 2018 (commencement of operations) through September 30, 2019. |
(b) | Per share net investment income has been calculated using the average shares method. |
(c) | Total return in the above table represents the rate that the investor would have earned or lost on an investment in the Small-Mid Core Equity Fund, assuming reinvestment of distributions. |
58 | See accompanying notes which are an integral part of these financial statements. | |
Fuller & Thaler Behavioral Micro-Cap Equity Fund - Institutional Shares
Financial Highlights
(For a share outstanding during the period)
| | | For the
Period Ended
September 30,
2019(a) | |
Net asset value, beginning of period | | $ | 20.00 | |
Income from investment operations: | | | | |
Net investment loss(b) | | | (0.20 | ) |
Net realized and unrealized gain on investments | | | 1.90 | |
Total from investment operations | | | 1.70 | |
Net asset value, end of period | | $ | 21.70 | |
Total Return(c) | | | 8.50 | %(d) |
| | | | | |
Ratios and Supplemental Data: | | | | |
Net assets, end of period (000 omitted) | | $ | 2,819 | |
Before waiver or recoupment: | | | | |
Ratio of expenses to average net assets | | | 5.28 | %(e) |
After waiver or recoupment: | | | | |
Ratio of net expenses to average net assets | | | 1.75 | %(e) |
Ratio of net investment loss to average net assets | | | (1.16 | )%(e) |
Portfolio turnover | | | 42 | %(d) |
(a) | For the period December 28, 2018 (commencement of operations) through September 30, 2019. |
(b) | Per share net investment income has been calculated using the average shares method. |
(c) | Total return in the above table represents the rate that the investor would have earned or lost on an investment in the Micro-Cap Equity Fund, assuming reinvestment of distributions. |
| | See accompanying notes which are an integral part of these financial statements. | 59 |
Fuller & Thaler Funds
Notes to the Financial Statements
September 30, 2019
NOTE 1. ORGANIZATION
The Fuller & Thaler Behavioral Small-Cap Equity Fund (the “Small-Cap Equity Fund”), the Fuller & Thaler Behavioral Small-Cap Growth Fund (the “Small-Cap Growth Fund”), the Fuller & Thaler Behavioral Mid-Cap Value Fund (the “Mid-Cap Value Fund”), the Fuller & Thaler Behavioral Unconstrained Equity Fund (the “Unconstrained Equity Fund”), the Fuller & Thaler Behavioral Small-Mid Core Equity Fund (the “Small-Mid Core Equity Fund”) and the Fuller & Thaler Behavioral Micro-Cap Equity Fund (the “Micro-Cap Equity Fund”) (each a “Fund” and, collectively the “Funds”) were each organized as a diversified series of Capitol Series Trust (the “Trust”). The Trust is an open-end investment company established under the laws of Ohio by an Agreement and Declaration of Trust dated September 18, 2013 (the “Trust Agreement”). The Trust Agreement permits the Board of Trustees of the Trust (“the Board”) to issue an unlimited number of shares of beneficial interest of separate series without par value. The Funds’ investment adviser is Fuller & Thaler Asset Management, Inc. (the “Adviser” or “Fuller & Thaler”). The investment objective of each Fund is to seek long-term capital appreciation.
The Small Cap Equity Fund and Small Cap Growth Fund each currently offer five share classes: R6 Shares, Institutional Shares, Investor Shares, A Shares and C Shares. The Mid-Cap Value Fund currently offers three share classes: R6 Shares, Institutional Shares and Investor Shares. The Unconstrained Equity Fund currently offers two share classes: R6 Shares and Institutional Shares. The Small-Mid Core Equity Fund and Micro-Cap Equity Fund each currently offers one share class: Institutional Shares. A Shares have a maximum sales charge on purchases of up to 5.75% and a Contingent Deferred Sales Charge (“CDSC”) on redemptions made within 12 months from the date of purchase and a CDSC of 0.50% on redemptions made more than 12 months but less than 18 months from the date of purchase. C Shares impose a 1.00% CDSC on redemptions made within 12 months from the date of purchase. A Shares and C Shares may be purchased without a sales charge under certain circumstances. Each share represents an equal proportionate interest in the assets and liabilities belonging to each Fund and is entitled to such dividends and distributions out of income belonging to each Fund as are declared by the Board.
The Small-Cap Equity Fund is the accounting successor to a series of Allianz Funds Multi-Strategy Trust, which commenced operations on September 8, 2011, and for which the Adviser served as the sole sub-adviser (the “Predecessor Fund”). In a transaction that was consummated on October 23, 2015 (the “Reorganization”), the Small-Cap Equity Fund acquired the assets and liabilities of: the A, C, and D Classes of the Predecessor Fund, which became the Investor Shares of the Small-Cap Equity Fund; the Class P Shares of the Predecessor Fund, which became the Institutional Shares of the Small-Cap Equity Fund; and the Institutional Shares of the Predecessor Fund, which became the R6 Shares of the Small-Cap Equity Fund.
NOTE 2. SIGNIFICANT ACCOUNTING POLICIES
The Funds are investment companies and follow accounting and reporting guidance under Financial Accounting Standards Board Accounting Standards Codification (“ASC”) Topic 946, “Financial Services-Investment Companies”. The following is a summary of significant accounting policies followed by the Funds in the preparation of their financial statements. These policies are in conformity with the generally accepted accounting principles in the United States of America (“GAAP”).
60
Fuller & Thaler Funds
Notes to the Financial Statements (continued)
September 30, 2019
Estimates– The preparation of financial statements in conformity with GAAP requires management to make estimates and assumptions that affect the reported amounts of assets and liabilities and disclosure of contingent assets and liabilities at the date of the financial statements and the reported amounts of increases and decreases in net assets from operations during the reporting period. Actual results could differ from those estimates.
Foreign Currency Translation – The accounting records of the Funds are maintained in U.S. dollars. Foreign currency amounts are translated into U.S. dollars at the current rate of exchange each business day to determine the value of investments, and other assets and liabilities. Purchases and sales of foreign securities, and income and expenses, are translated at the prevailing rate of exchange on the respective date of these transactions. The Funds do not isolate that portion of the results of operations resulting from changes in foreign exchange rates on investments from fluctuation arising from changes in market prices of securities held. These fluctuations are included with the unrealized gain or loss from investments.
Federal Income Taxes – The Funds make no provision for federal income or excise tax. Each Fund has qualified and intends to qualify each year as a regulated investment company (“RIC”) under subchapter M of the Internal Revenue Code of 1986, as amended, by complying with the requirements applicable to RICs and by distributing substantially all of its taxable income. Each Fund also intends to distribute sufficient net investment income and net capital gains, if any, so that it will not be subject to excise tax on undistributed income and gains. If the required amount of net investment income or gains is not distributed, the Fund could incur a tax expense.
The Funds may be subject to taxes imposed by countries in which they invest. Such taxes are generally based on income and/or capital gains earned or repatriated. Taxes are accrued and applied to net investment income, net realized gains and unrealized appreciation as such income and/or gains are earned.
The Funds recognize tax benefits or expenses of uncertain tax positions only when the position is “more likely than not” to be sustained assuming examination by tax authorities. Management of the Funds has reviewed tax positions taken in tax years that remain subject to examination by all major tax jurisdictions, including federal (i.e., the previous three tax year ends and the interim tax period since then, as applicable) and has concluded that no provision for unrecognized tax benefits or expenses is required in these financial statements and does not expect this to change over the next twelve months. The Funds recognize interest and penalties, if any, related to unrecognized tax benefits as income tax expense in the Statement of Operations. During the period, the Funds did not incur any interest or penalties.
Expenses– Expenses incurred by the Trust that do not relate to a specific fund of the Trust are allocated to the individual funds based on each fund’s relative net assets or another appropriate basis (as determined by the Board). Expenses specifically attributable to any class are borne by that class. Income, realized gains and losses, unrealized appreciation and depreciation, and Fund-wide expenses not allocated to a particular class shall be allocated to each class based on the net assets of that class in relation to the net assets of the entire Fund.
61
Fuller & Thaler Funds
Notes to the Financial Statements (continued)
September 30, 2019
Security Transactions and Related Income – Throughout the reporting period, security transactions are accounted for no later than one business day following the trade date. For financial reporting purposes, security transactions are accounted for on trade date on the last business day of the reporting period. The specific identification method is used for determining gains or losses for financial statements and income tax purposes. Dividend income is recorded on the ex-dividend date and interest income is recorded on an accrual basis. Dividend income from real estate investment trusts (REITs) and distributions from limited partnerships are recognized on the ex-date and included in dividend income. The calendar year-end classification of distributions received from REITs during the fiscal year are reported subsequent to year end; accordingly, the Fund estimates the character of REIT distributions based on the most recent information available. Income or loss from limited partnerships is reclassified among the components of net assets upon receipt of K-1’s. Discounts and premiums on fixed income securities purchased are amortized or accreted over the life of the respective securities using the effective interest method.
Dividends and Distributions – Each Fund intends to distribute its net investment income and net realized long-term and short-term capital gains, if any, at least annually. Dividends and distributions to shareholders, which are determined in accordance with income tax regulations, are recorded on the ex-dividend date. The treatment for financial reporting purposes of distributions made to shareholders during the period from net investment income or net realized capital gains may differ from their ultimate treatment for federal income tax purposes. These differences are caused primarily by differences in the timing of the recognition of certain components of income, expense or realized capital gain for federal income tax purposes. Where such differences are permanent in nature, they are reclassified among the components of the net assets based on their ultimate characterization for federal income tax purposes. Any such reclassifications will have no effect on net assets, results of operations or net asset value (“NAV”) per share of the Funds.
For the fiscal year ended September 30, 2019, the Funds made the following reclassifications to increase (decrease) the components of net assets, which were due to net operating losses and nondeductible excise taxes:
| | | Paid-In Capital | | | Accumulated
Earnings
(Deficit) | |
Small-Cap Growth Fund | | $ | (46,532 | ) | | $ | 46,532 | |
Small-Mid Core Equity Fund | | | (29 | ) | | | 29 | |
Organization and Offering Costs – The Adviser advanced some of the Funds’ organization and initial offering costs and was subsequently reimbursed by the Funds. Costs of $10,250, $10,235 and $10,208 incurred in connection with the offering and initial registration of the Unconstrained Equity Fund, Small-Mid Core Equity Fund and Micro-Cap Equity Fund, respectively, have been deferred and are being amortized on a straight-line basis over the first twelve months after commencement of operations. There were $2,301, $2,296 and $2,405 in unamortized offering costs remaining as of September 30, 2019 in the Unconstrained Equity Fund, Small-Mid Core Equity Fund and Micro-Cap Equity Fund, respectively. Costs of $8,500 incurred in connection with the organization of the Unconstrained Equity Fund, Small-Mid Core Equity Fund and Micro-Cap Equity Fund were expensed as incurred.
62
Fuller & Thaler Funds
Notes to the Financial Statements (continued)
September 30, 2019
NOTE 3. SECURITIES VALUATION AND FAIR VALUE MEASUREMENTS
Fair value is defined as the price that a Fund would receive upon selling an investment in a timely transaction to an independent buyer in the principal or most advantageous market of the investment. GAAP establishes a three-tier hierarchy to maximize the use of observable market data and minimize the use of unobservable inputs and to establish classification of fair value measurements for disclosure purposes.
Inputs refer broadly to the assumptions that market participants would use in pricing the asset or liability, including assumptions about risk (the risk inherent in a particular valuation technique used to measure fair value including a pricing model and/or the risk inherent in the inputs to the valuation technique). Inputs may be observable or unobservable. Observable inputs are inputs that reflect the assumptions market participants would use in pricing the asset or liability developed based on market data obtained and available from sources independent of the reporting entity. Unobservable inputs are inputs that reflect the reporting entity’s own assumptions about the assumptions market participants would use in pricing the asset or liability developed based on the best information available in the circumstances.
Various inputs are used in determining the value of each Fund’s investments. These inputs are summarized in the three broad levels listed below.
| | ● | Level 1 – unadjusted quoted prices in active markets for identical investments and/or registered investment companies where the value per share is determined and published and is the basis for current transactions for identical assets or liabilities at the valuation date |
| | ● | Level 2 – other significant observable inputs (including, but not limited to, quoted prices for an identical security in an inactive market, quoted prices for similar securities, interest rates, prepayment speeds, credit risk, etc.) |
| | ● | Level 3 – significant unobservable inputs (including the Funds’ own assumptions in determining fair value of investments based on the best information available) |
The inputs used to measure fair value may fall into different levels of the fair value hierarchy. In such cases, for disclosure purposes, the level in the fair value hierarchy which is reported, is determined based on the lowest level input that is significant to the fair value measurement in its entirety.
In computing the NAV of the Funds, fair value is based on market valuations with respect to portfolio securities for which market quotations are readily available. Pursuant to Board approved policies, the Funds rely on independent third-party pricing services to provide the current market value of securities. Those pricing services value equity securities, including exchange-traded funds, exchange-traded notes, closed-end funds and preferred stocks, traded on a securities exchange at the last reported sales price on the principal exchange. Equity securities quoted by NASDAQ are valued at the NASDAQ Official Closing Price. If there is no reported sale on the principal exchange, equity securities are valued at the mean between the most recent quoted bid and asked price. When using the market quotations or close prices provided by the pricing service and when the market is considered active, the security will be classified as a Level 1 security. Investments in open-end mutual funds, including money market mutual funds, are generally priced at the ending NAV provided by
63
Fuller & Thaler Funds
Notes to the Financial Statements (continued)
September 30, 2019
the pricing service of the funds and are generally categorized as Level 1 securities. Debt securities are valued using evaluated prices furnished by a pricing vendor selected by the Board and are generally classified as Level 2 securities.
In the event that market quotations are not readily available, the Adviser determines that the market quotation or the price provided by the pricing service does not accurately reflect the current fair value, or certain restricted or illiquid securities are being valued, such securities are valued as determined in good faith by the Trust’s Valuation Committee, based on recommendations from a pricing committee comprised of certain officers of the Trust, certain employees of the Fund’s administrator, and representatives of the Adviser (together the “Pricing Review Committee”). These securities will be classified as Level 2 or 3 within the fair value hierarchy, depending on the inputs used.
In accordance with the Trust’s Portfolio Valuation Procedures, the Pricing Review Committee, in making its recommendations, is required to consider all appropriate factors relevant to the value of securities for which it has determined other pricing sources are not available or reliable as described above. No single standard exists for determining fair value, because fair value depends upon the circumstances of each individual case. As a general principle, the current fair value of an issue of securities being valued pursuant to the Trust’s Fair Value Guidelines would be the amount which the Funds might reasonably expect to receive for them upon their current sale. Methods which are in accordance with this principle may, for example, be based on (i) a multiple of earnings; (ii) a discount from market prices of a similar freely traded security (including a derivative security or a basket of securities traded on other markets, exchanges or among dealers); or (iii) yield to maturity with respect to debt issues, or a combination of these and other methods. Fair value pricing is permitted if, in accordance with the Trust’s Portfolio Valuation Procedures, the validity of market quotations appears to be questionable based on factors such as evidence of a thin market in the security based on a small number of quotations, a significant event occurs after the close of a market but before each Fund’s NAV calculation that may affect a security’s value, or other data calls into question the reliability of market quotations.
64
Fuller & Thaler Funds
Notes to the Financial Statements (continued)
September 30, 2019
The following is a summary of the inputs used to value the Funds’ investments as of September 30, 2019:
| | | Valuation Inputs | | | | | |
Small-Cap Equity Fund | | Level 1 | | | Level 2 | | | Level 3 | | | Total | |
Common Stocks(a) | | $ | 1,752,021,121 | | | $ | — | | | $ | — | | | $ | 1,752,021,121 | |
Money Market Funds | | | 147,521,486 | | | | — | | | | — | | | | 147,521,486 | |
Total | | $ | 1,899,542,607 | | | $ | — | | | $ | — | | | $ | 1,899,542,607 | |
| | | | | | | | | | | | | | | | | |
Small-Cap Growth Fund | | | | | | | | | | | | |
Common Stocks(a) | | $ | 15,173,507 | | | $ | — | | | $ | — | | | $ | 15,173,507 | |
| | | | | | | | | | | | | | | | | |
Mid-Cap Value Fund | | | | | | | | | | | | |
Common Stocks(a) | | $ | 15,308,200 | | | $ | — | | | $ | — | | | $ | 15,308,200 | |
| | | | | | | | | | | | | | | | | |
Unconstrained Equity Fund | | | | | | | | | | | | |
Common Stocks(a) | | $ | 4,493,568 | | | $ | — | | | $ | — | | | $ | 4,493,568 | |
| | | | | | | | | | | | | | | | | |
Small-Mid Core Equity Fund | | | | | | | | | | | | |
Common Stocks(a) | | $ | 2,368,744 | | | $ | — | | | $ | — | | | $ | 2,368,744 | |
| | | | | | | | | | | | | | | | | |
Micro-Cap Equity Fund | | | | | | | | | | | | |
Common Stocks(a) | | $ | 2,771,632 | | | $ | — | | | $ | — | | | $ | 2,771,632 | |
(a) | Refer to Schedule of Investments for industry classifications. |
The Funds did not hold any investments at the end of the reporting period for which significant unobservable inputs (Level 3) were used in determining fair value; therefore, no reconciliation of Level 3 securities is included for this reporting period.
NOTE 4. FEES AND OTHER TRANSACTIONS WITH AFFILIATES AND OTHER SERVICE PROVIDERS
Under the terms of the investment advisory agreement (the “Agreement”), the Adviser manages each Fund’s investments subject to approval of the Board. As compensation for its management services, the Funds are obligated to pay the Adviser a fee computed and accrued daily and paid monthly as follows:
| | | Small-Cap
Equity
Fund | | | Small-Cap
Growth
Fund | | | Mid-Cap
Value
Fund | | |
Unconstrained
Equity
Fund
| | | Small-Mid
Core Equity
Fund | | | Micro-Cap
Equity
Fund | |
Investment Adviser fee rate | | | 0.60 | % | | | 0.85 | % | | | 0.75 | % | | | 0.85 | % | | | 0.80 | % | | | 1.50 | % |
Investment Adviser fee earned | | $ | 7,975,340 | | | $ | 113,668 | | | $ | 109,657 | | | $ | 22,973 | | | $ | 13,441 | | | $ | 33,382 | |
Fees waived by Adviser | | $ | — | | | $ | (146,759 | ) | | $ | (130,638 | ) | | $ | (80,362 | ) | | $ | (78,855 | ) | | $ | (78,292 | ) |
Payable to / (receivable from) Adviser | | $ | 919,050 | | | $ | (123 | ) | | $ | 777 | | | $ | (2,385 | ) | | $ | (3,919 | ) | | $ | (2,894 | ) |
65
Fuller & Thaler Funds
Notes to the Financial Statements (continued)
September 30, 2019
The Adviser has contractually agreed to waive its management fee and/or reimburse expenses so that total annual operating expenses (excluding (i) interest; (ii) taxes; (iii) brokerage fees and commissions; (iv) other extraordinary expenses not incurred in the ordinary course of the Funds business; and (v) indirect expenses such as acquired fund fees and expenses) do not exceed the following percentages of each Fund’s average daily net assets through January 31, 2020 (“Expense Limitation”):
| | | R6 Shares | | | Institutional
Shares | | | Investor
Shares | | | A Shares | | | C Shares | |
Small-Cap Equity Fund | | 0.80% | | | 0.99% | | | 1.25% | | | 1.30% | | | 1.80% | |
Small-Cap Growth Fund | | 0.90% | | | 0.99% | | | 1.25% | | | 1.30% | | | 1.80% | |
Mid-Cap Value Fund | | 0.80% | | | 0.90% | | | 1.15% | | | | | | | |
Unconstrained Equity Fund | | 0.90% | | | 0.99% | | | | | | | | | | |
Small-Mid Core Equity Fund | | | | | 0.95% | | | | | | | | | | |
Micro-Cap Equity Fund | | | | | 1.75% | | | | | | | | | | |
Prior to December 19, 2018, the Adviser contractually agreed to waive its management fee and/or reimburse expenses so that total annual operating expenses (excluding (i) interest; (ii) taxes; (iii) brokerage fees and commissions; (iv) other extraordinary expenses not incurred in the ordinary course of the Funds business; and (v) indirect expenses such as acquired fund fees and expenses) did not exceed 0.97% for the Institutional Shares of the Small-Cap Equity Fund; 1.24% for the Investor Shares of the Small-Cap Growth Fund; and 1.14% and 0.89% for the Investor Shares and Institutional Shares, respectively of the Mid-Cap Value Fund.
During any fiscal year that the Agreement between the Adviser and the Trust is in effect, the Adviser may recoup the sum of all fees previously waived or expenses reimbursed, less any reimbursement previously paid, provided that the Adviser is only permitted to recoup fees or expenses within 36 months from the date the fee waiver or expense reimbursement took effect and provided further that such recoupment can be achieved within the Expense Limitation currently in effect and the Expense Limitation in place when the waiver/reimbursement occurred. This expense cap agreement may be terminated by the Board at any time.
As of September 30, 2019, the Adviser may seek repayment of investment advisory fee waivers and expense reimbursements as follows:
Recoverable Through | | Small-Cap
Equity
Fund | | | Small-Cap
Growth
Fund | | | Mid-Cap
Value
Fund | | | Unconstrained
Equity
Fund | | | Small-Mid
Core Equity
Fund | | | Micro-Cap
Equity
Fund | |
September 30, 2020 | | $ | 160,343 | | | $ | — | | | $ | — | | | $ | — | | | $ | — | | | $ | — | |
September 30, 2021 | | | 30,316 | | | | 128,041 | | | | 129,738 | | | | — | | | | — | | | | — | |
September 30, 2022 | | | — | | | | 146,759 | | | | 130,638 | | | | 80,362 | | | | 78,855 | | | | 78,292 | |
| | | $ | 190,659 | | | $ | 274,800 | | | $ | 260,376 | | | $ | 80,362 | | | $ | 78,855 | | | $ | 78,292 | |
66
Fuller & Thaler Funds
Notes to the Financial Statements (continued)
September 30, 2019
The Trust retains Ultimus Fund Solutions, LLC (the “Administrator”) to provide the Funds with administration, fund accounting, transfer agent and compliance services, including all regulatory reporting. For the fiscal year ended September 30, 2019, fees incurred for administration, fund accounting, transfer agent and compliance services, and the amounts due to the Administrator at September 30, 2019 were as follows:
| | | Small-Cap
Equity
Fund | | | Small-Cap
Growth
Fund | | | Mid-Cap
Value
Fund | | | Unconstrained
Equity
Fund(a) | | | Small-Mid
Core Equity
Fund(a) | | | Micro-Cap
Equity
Fund(b) | |
Administration | | $ | 549,636 | | | $ | 9,250 | | | $ | 8,841 | | | $ | 5,992 | | | $ | 6,028 | | | $ | 6,081 | |
Fund accounting | | | 192,916 | | | | 5,737 | | | | 5,478 | | | | 2,163 | | | | 2,176 | | | | 2,195 | |
Transfer agent | | | 169,707 | | | | 8,623 | | | | 12,065 | | | | 846 | | | | 796 | | | | 723 | |
Compliance services | | | 6,000 | | | | 6,000 | | | | 6,000 | | | | 4,500 | | | | 4,500 | | | | 4,500 | |
Payable to Administrator | | | 92,480 | | | | 1,500 | | | | 1,753 | | | | 1,500 | | | | 1,500 | | | | 1,500 | |
(a) | For the period December 26, 2018 (commencement of operations) to September 30, 2019. |
(b) | For the period December 28, 2018 (commencement of operations) to September 30, 2019. |
The Board supervises the business activities of the Trust. Each Trustee serves as a Trustee for the lifetime of the Trust or until the earlier of his or her retirement as a Trustee at age 78 (which may be extended for up to two years in an emeritus non-voting capacity at the pleasure and request of the Board), or until he/she dies, resigns, or is removed, whichever is sooner. “Independent Trustees,” meaning those Trustees who are not “interested persons” of the Trust, as defined in the Investment Company Act of 1940 (“1940 Act”), as amended, each receives an annual retainer of $500 per Fund and $500 per Fund for each quarterly in-person Board meeting. In addition, the Trust reimburses Trustees for out-of-pocket expense incurred in conjunction with attendance at Board meetings.
The officers and one trustee of the Trust are employees of the Administrator. Unified Financial Securities, LLC (the “Distributor”) acts as the principal distributor of each Fund’s shares. The Distributor operates as a wholly-owned subsidiary of Ultimus Fund Solutions, LLC.
The Funds have adopted a Distribution Plan (the “Plan) pursuant to Rule 12b-1 of the 1940 Act. The Plan provides that the Funds will pay the Distributor and/or any registered securities dealer, financial institution or any other person (the “Recipient”) a fee of 0.25% of the average daily net assets of each Fund’s Investor Shares and A Shares and 1.00% of the average daily net assets of each Fund’s C Shares in connection with the promotion and distribution of each Fund’s Investor Shares, A Shares and C Shares or the provision of personal services to shareholders, including, but not necessarily limited to, advertising, compensation to underwriters, dealers and selling personnel, the printing and mailing of prospectuses to other than current shareholders, the printing and mailing of sales literature and servicing shareholder accounts (“12b-1 Expenses”). Under the 12b-1 Plan, the 1.00% C Share 12b-1 fee includes a 0.25% service fee. Over time, 12b-1 fees will increase the cost of your investment in
67
Fuller & Thaler Funds
Notes to the Financial Statements (continued)
September 30, 2019
a Fund’s Investor, A, and C Shares and may cost you more than paying other types of sales charges because these fees are paid out of the Fund’s Investor, A, and C Shares on an on-going basis. For the fiscal year ended September 30, 2019, 12b-1 expenses incurred by the Funds’ Funds were as follows:
| | Small-Cap
Equity Fund | | | Small-Cap
Growth Fund | | | Mid-Cap
Value Fund | |
Investor Shares | | $ | 304,188 | | | $ | 641 | | | $ | 2,728 | |
A Shares | | | 190 | | | | 8 | | | | — | |
C Shares | | | 1,377 | | | | 20 | | | | — | |
Payable for 12b-1 fees | | | 62,771 | | | | 88 | | | | 712 | |
The Funds have adopted an Administrative Services Plan (the “Plan”) for Institutional Shares, Investor Shares, and A Shares of the Funds. The Plan allows the Funds to pay financial intermediaries that provide services relating to Institutional Shares, Investor Shares, and A Shares. The Plan permits payments for the provision of certain administrative, recordkeeping and other non-distribution related services to Institutional Share, Investor Share and A Share shareholders. The Plan permits the Funds to make service fee payments at an annual rate of up to 0.25% of each Fund’s average daily net assets attributable to its A Shares and up to 0.20% of each Fund’s average daily net assets attributable to its Institutional Shares or Investor Shares. Because these fees are paid respectively out of the assets of each Fund’s Institutional Shares, Investor Shares and A Shares on an ongoing basis, over time they will increase the cost of an investment in Institutional Shares, Investor Shares and A Shares.
NOTE 5. PURCHASES AND SALES OF SECURITIES
For the fiscal year ended September 30, 2019, purchases and sales of investment securities, other than short-term investments were as follows:
| | | Purchases | | | Sales | |
Small-Cap Equity Fund | | $ | 1,232,332,564 | | | $ | 478,950,532 | |
Small-Cap Growth Fund | | | 21,548,723 | | | | 16,303,454 | |
Mid-Cap Value Fund | | | 3,179,975 | | | | 1,670,917 | |
Unconstrained Equity Fund | | | 4,212,246 | | | | 360,442 | |
Small-Mid Core Equity Fund | | | 2,647,230 | | | | 527,237 | |
Micro-Cap Equity Fund | | | 3,745,086 | | | | 1,207,816 | |
There were no purchases or sales of long-term U.S. government obligations during the fiscal year ended September 30, 2019.
68
Fuller & Thaler Funds
Notes to the Financial Statements (continued)
September 30, 2019
NOTE 6. FEDERAL TAX INFORMATION
At September 30, 2019, the net unrealized appreciation (depreciation) of investments for tax purposes were as follows:
| | | Small-Cap
Equity
Fund | | | Small-Cap
Growth
Fund | | | Mid-Cap
Value
Fund | | | Unconstrained
Equity Fund | | | Small-Mid
Core Equity
Fund | | | Micro-Cap
Equity
Fund | |
Gross unrealized appreciation | | $ | 160,112,386 | | | $ | 1,672,909 | | | $ | 1,819,013 | | | $ | 664,354 | | | $ | 278,204 | | | $ | 427,028 | |
Gross unrealized depreciation | | | (60,001,603 | ) | | | (1,083,859 | ) | | | (908,303 | ) | | | (46,661 | ) | | | (68,236 | ) | | | (358,872 | ) |
Net unrealized appreciation/(depreciation) on investments | | $ | 100,110,783 | | | $ | 589,050 | | | $ | 910,710 | | | $ | 617,693 | | | $ | 209,968 | | | $ | 68,156 | |
Tax cost of investments | | $ | 1,799,431,824 | | | $ | 14,584,457 | | | $ | 14,397,490 | | | $ | 3,875,875 | | | $ | 2,158,776 | | | $ | 2,703,476 | |
The tax character of distributions paid for the fiscal years ended September 30, 2019 and September 30, 2018 were as follows:
| | | Small-Cap
Equity Fund | | | Mid-Cap
Value Fund | |
| | | 2019 | | | 2018 | | | 2019 | |
Distributions paid from: | | | | | | | | | | | | |
Ordinary income(a) | | $ | 4,754,639 | | | $ | 783,264 | | | $ | 76,590 | |
Long-term capital gains | | | — | | | | — | | | | 5,377 | |
Total distributions paid | | $ | 4,754,639 | | | $ | 783,264 | | | $ | 81,967 | |
(a) | Short term capital gain distributions are treated as ordinary income for tax purposes. |
At September 30, 2019, the components of distributable earnings (accumulated losses) on a tax basis was as follows:
| | | Small-Cap
Equity
Fund | | | Small-Cap
Growth
Fund | | | Mid-Cap
Value
Fund | | | Unconstrained
Equity
Fund | | | Small-Mid
Core Equity
Fund | | | Micro-Cap
Equity
Fund | |
Undistributed ordinary income | | $ | 6,459,165 | | | $ | — | | | $ | 111,421 | | | $ | 35,807 | | | $ | 52,859 | | | $ | 145,343 | |
Undistributed long-term capital gains | | | — | | | | — | | | | 98,695 | | | | 69 | | | | 275 | | | | 633 | |
Accumulated capital and other losses | | | (58,756,515 | ) | | | (910,425 | ) | | | — | | | | — | | | | — | | | | — | |
Unrealized appreciation on investments(a) | | | 100,110,783 | | | | 589,050 | | | | 910,710 | | | | 617,693 | | | | 209,968 | | | | 68,156 | |
Total accumulated earnings | | $ | 47,813,433 | | | $ | (321,375 | ) | | $ | 1,120,826 | | | $ | 653,569 | | | $ | 263,102 | | | $ | 214,132 | |
(a) | The difference between book basis and tax basis unrealized appreciation (depreciation) is primarily attributable to the tax deferral of wash losses and return of capital adjustments. |
69
Fuller & Thaler Funds
Notes to the Financial Statements (continued)
September 30, 2019
As of September 30, 2019, the Small-Cap Equity Fund and the Small-Cap Growth Fund had available for tax purposes an unused capital loss carryforward of $58,756,514 and $858,121, respectively, of short-term capital losses with no expiration, which is available to offset against future taxable net capital gains. To the extent that this carryforward is used to offset future gains, it is probable that the amount offset will not be distributed to shareholders.
Under current tax law, net investment losses after December 31 and capital losses realized after October 31 of the Funds fiscal year may be deferred and treated as occurring on the first business day of the following fiscal year for tax purposes. As of September 30, 2019, the Small-Cap Growth Fund had a Qualified Late Year Ordinary Loss in the amount of $52,302.
NOTE 7. SECTOR RISK
If a Fund has significant investments in the securities of issuers within a particular sector, any development affecting that sector will have a greater impact on the value of the net assets of the Fund than would be the case if the Fund did not have significant investments in that sector. In addition, this may increase the risk of loss in the Fund and increase the volatility of the Fund’s NAV per share. For instance, economic or market factors, regulatory changes or other developments may negatively impact all companies in a particular sector, and therefore the value of the Fund’s portfolio will be adversely affected. As of September 30, 2019, Small-Cap Growth Fund had 25.75% of the value of its net assets invested in stocks within the Consumer Discretionary sector and the Unconstrained Equity Fund had 32.47% and 29.01% of the value of its net assets invested in stocks within the Consumer Discretionary and Industrials sectors, respectively.
NOTE 8. COMMITMENTS AND CONTINGENCIES
The Trust indemnifies its officers and Trustees for certain liabilities that may arise from their performance of their duties to the Trust or the Funds. Additionally, in the normal course of business, the Trust enters into contracts that contain a variety of representations and warranties which provide general indemnifications. The Trust’s maximum exposure under these arrangements is unknown, as this would involve future claims that may be made against the Trust that have not yet occurred.
NOTE 9. RECENT ACCOUNTING PRONOUNCEMENT
In August 2018, the FASB issued Accounting Standards Update (“ASU”) 2018-13, which changes the fair value measurement disclosure requirements of FASB ASC Topic 820, Fair Value Measurement. The update to Topic 820 includes new, eliminated, and modified disclosure requirements. ASU 2018- 13 is effective for fiscal years beginning after December 15, 2019, including interim periods, although early adoption is permitted. Management has evaluated the implications of certain provisions of ASU 2018-13 and has determined to early adopt all aspects related to the removal and modification of certain fair value measurement disclosures under the ASU effective immediately. The impact of the adoption was not material to the Funds’ financial statements.
70
Fuller & Thaler Funds
Notes to the Financial Statements (continued)
September 30, 2019
NOTE 10. SUBSEQUENT EVENTS
Management of the Funds has evaluated the need for disclosures and/or adjustments resulting from subsequent events through the date at which these financial statements were issued. Based upon this evaluation, management has determined there were no items requiring adjustment of the financial statements or additional disclosure.
71
Report of Independent Registered Public Accounting Firm
To the Shareholders of Fuller & Thaler Behavioral Small-Cap Equity Fund, Fuller & Thaler Behavioral Small-Cap Growth Fund, Fuller & Thaler Behavioral Mid-Cap Value Fund, Fuller & Thaler Behavioral Unconstrained Equity Fund, Fuller & Thaler Behavioral Small-Mid Core Equity Fund, and Fuller & Thaler Behavioral Micro-Cap Equity Fund and the Board of Trustees of Capitol Series Trust
Opinion on the Financial Statements
We have audited the accompanying statements of assets and liabilities of Fuller & Thaler Behavioral Small-Cap Equity Fund, Fuller & Thaler Behavioral Small-Cap Growth Fund, Fuller & Thaler Behavioral Mid-Cap Value Fund, Fuller & Thaler Behavioral Unconstrained Equity Fund, Fuller & Thaler Behavioral Small-Mid Core Equity Fund, and Fuller & Thaler Behavioral Micro-Cap Equity Fund (collectively referred to as the “Funds”) (six of the funds constituting Capitol Series Trust (the “Trust”)), including the schedules of investments, as of September 30, 2019, and the related statements of operations, changes in net assets, and the financial highlights for each of the periods indicated in the table below and the related notes (collectively referred to as the “financial statements”). In our opinion, the financial statements present fairly, in all material respects, the financial position of each of the Funds (six of the funds constituting Capitol Series Trust) at September 30, 2019, and the results of their operations, changes in net assets and financial highlights for each of the periods indicated in the table below, in conformity with U.S. generally accepted accounting principles.
Individual fund constituting the Capitol Series Trust | Statement of
operations | Statements of
changes in
net assets | Financial
highlights |
Fuller & Thaler Behavioral Small-Cap Equity Fund | For the year
ended
September 30, 2019 | For each of the two years in the period ended September 30, 2019 | For each of the three years in the period ended September 30, 2019 |
Fuller & Thaler Behavioral Small-Cap Growth Fund Fuller & Thaler Behavioral Mid-Cap Value Fund | For the year
ended
September 30, 2019 | For the year ended September 30, 2019 and the period from December 21, 2017 (commencement of operations) through September 30, 2018 |
Fuller & Thaler Behavioral Unconstrained Equity Fund
Fuller & Thaler Behavioral Small-Mid Core Equity Fund | For the period from December 26, 2018 (commencement of operations) through September 30, 2019 |
Fuller & Thaler Behavioral Micro-Cap Equity Fund | For the period from December 28, 2018 (commencement of operations) through September 30, 2019 |
The financial highlights of Fuller & Thaler Behavioral Small-Cap Equity Fund for year ended November 30, 2014, for the period December 1, 2014 to September 30, 2015, and for the year ended September 30, 2016 were audited by other auditors whose report dated November 29, 2016, expressed an unqualified opinion on those financial highlights.
72
Report of Independent Registered Public Accounting Firm (continued)
Basis for Opinion
These financial statements are the responsibility of the Trust’s management. Our responsibility is to express an opinion on each of the Funds’ financial statements based on our audits. We are a public accounting firm registered with the Public Company Accounting Oversight Board (United States) (“PCAOB”) and are required to be independent with respect to the Trust in accordance with the U.S. federal securities laws and the applicable rules and regulations of the Securities and Exchange Commission and the PCAOB.
We conducted our audits in accordance with the standards of the PCAOB. Those standards require that we plan and perform the audit to obtain reasonable assurance about whether the financial statements are free of material misstatement, whether due to error or fraud. The Trust is not required to have, nor were we engaged to perform, an audit of the Trust’s internal control over financial reporting. As part of our audits we are required to obtain an understanding of internal control over financial reporting but not for the purpose of expressing an opinion on the effectiveness of the Trust’s internal control over financial reporting. Accordingly, we express no such opinion.
Our audits included performing procedures to assess the risks of material misstatement of the financial statements, whether due to error or fraud, and performing procedures that respond to those risks. Such procedures included examining, on a test basis, evidence regarding the amounts and disclosures in the financial statements. Our procedures included confirmation of securities owned as of September 30, 2019, by correspondence with the custodian and brokers or by other appropriate auditing procedures where replies from brokers were not received. Our audits also included evaluating the accounting principles used and significant estimates made by management, as well as evaluating the overall presentation of the financial statements. We believe that our audits provide a reasonable basis for our opinion.

We have served as the auditor of one or more Capitol Series Trust investment companies since 2017.
Cincinnati, Ohio
November 25, 2019
73
Summary of Fund Expenses (Unaudited)
As a shareholder of one of the Funds, you incur two types of costs: (1) transaction costs and (2) ongoing costs, including management fees and other Fund expenses. These examples are intended to help you understand your ongoing costs (in dollars) of investing in each Fund and to compare these costs with the ongoing costs of investing in other mutual funds. Each Fund’s example is based on an investment of $1,000 invested at the beginning of the period and held for the entire period from April 1, 2019 through September 30, 2019.
Actual Expenses
The first line of the table for each class provides information about actual account values and actual expenses. You may use the information in these lines, together with the amount you invested, to estimate the expenses that you paid over the period. Simply divide your account value by $1,000 (for example, an $8,600 account value divided by $1,000 = 8.60), then multiply the result by the number in the first line under the heading “Expenses Paid During Period” to estimate the expenses you paid on your account during this period.
Hypothetical Example for Comparison Purposes
The second line of the table for each class provides information about hypothetical account values and hypothetical expenses based on each Fund’s actual expense ratios and an assumed rate of return of 5% per year before expenses, which is not the Fund’s actual return. The hypothetical account values and expenses may not be used to estimate the actual ending account balances or expenses you paid for the period. You may use this information to compare the ongoing costs of investing in the Funds and other funds. To do so, compare this 5% hypothetical example with the 5% hypothetical examples that appear in the shareholder reports of the other funds.
Expenses shown in the table are meant to highlight your ongoing costs only and do not reflect any transactional costs. Therefore, the second line of the table for each class is useful in comparing ongoing costs only and will not help you determine the relative total costs of owning different funds. In addition, if transaction costs were included, your costs would have been higher.
74
Summary of Fund Expenses (Unaudited) (continued)
| | | Beginning
Account Value
April 1, 2019 | Ending
Account Value
September 30,
2019 | Expenses
Paid During
Period(a) | Annualized
Expense
Ratio |
Small-Cap Equity Fund | | | |
R6 Shares | Actual | $ 1,000.00 | $ 1,051.80 | $ 3.70 | 0.72% |
| | | | | | |
| | Hypothetical(b) | $ 1,000.00 | $ 1,021.46 | $ 3.65 | 0.72% |
| | | | | | |
Institutional Shares | Actual | $ 1,000.00 | $ 1,050.90 | $ 4.22 | 0.82% |
| | | | | | |
| | Hypothetical(b) | $ 1,000.00 | $ 1,020.95 | $ 4.16 | 0.82% |
| | | | | | |
Investor Shares | Actual | $ 1,000.00 | $ 1,049.50 | $ 5.66 | 1.10% |
| | | | | | |
| | Hypothetical(b) | $ 1,000.00 | $ 1,019.54 | $ 5.58 | 1.10% |
| | | | | | |
A Shares | Actual | $ 1,000.00 | $ 1,049.90 | $ 5.50 | 1.07% |
| | | | | | |
| | Hypothetical(b) | $ 1,000.00 | $ 1,019.70 | $ 5.42 | 1.07% |
| | | | | | |
C Shares | Actual | $ 1,000.00 | $ 1,047.10 | $ 8.83 | 1.72% |
| | | | | | |
| | Hypothetical(b) | $ 1,000.00 | $ 1,016.44 | $ 8.69 | 1.72% |
Small-Cap Growth Fund | | | |
R6 Shares | Actual | $ 1,000.00 | $ 968.80 | $ 4.44 | 0.90% |
| | | | | | |
| | Hypothetical(b) | $ 1,000.00 | $ 1,020.56 | $ 4.56 | 0.90% |
| | | | | | |
Institutional Shares | Actual | $ 1,000.00 | $ 967.90 | $ 4.88 | 0.99% |
| | | | | | |
| | Hypothetical(b) | $ 1,000.00 | $ 1,020.11 | $ 5.01 | 0.99% |
| | | | | | |
Investor Shares | Actual | $ 1,000.00 | $ 966.90 | $ 6.21 | 1.26% |
| | | | | | |
| | Hypothetical(b) | $ 1,000.00 | $ 1,018.76 | $ 6.37 | 1.26% |
| | | | | | |
A Shares | Actual | $ 1,000.00 | $ 966.40 | $ 6.41 | 1.30% |
| | | | | | |
| | Hypothetical(b) | $ 1,000.00 | $ 1,018.55 | $ 6.58 | 1.30% |
| | | | | | |
C Shares | Actual | $ 1,000.00 | $ 964.10 | $ 8.86 | 1.80% |
| | | | | | |
| | Hypothetical(b) | $ 1,000.00 | $ 1,016.04 | $ 9.10 | 1.80% |
75
Summary of Fund Expenses (Unaudited) (continued)
| | | Beginning
Account Value
April 1, 2019 | Ending
Account Value
September 30,
2019 | Expenses
Paid During
Period(a) | Annualized
Expense
Ratio |
Mid-Cap Value Fund | | | |
R6 Shares | Actual | $ 1,000.00 | $ 1,072.40 | $ 4.16 | 0.80% |
| | | | | | |
| | Hypothetical(b) | $ 1,000.00 | $ 1,021.06 | $ 4.05 | 0.80% |
| | | | | | |
Institutional Shares | Actual | $ 1,000.00 | $ 1,071.40 | $ 4.70 | 0.90% |
| | | | | | |
| | Hypothetical(b) | $ 1,000.00 | $ 1,020.53 | $ 4.58 | 0.90% |
| | | | | | |
Investor Shares | Actual | $ 1,000.00 | $ 1,070.00 | $ 5.98 | 1.15% |
| | | | | | |
| | Hypothetical(b) | $ 1,000.00 | $ 1,019.29 | $ 5.84 | 1.15% |
Unconstrained Equity Fund | | | |
R6 Shares | Actual | $ 1,000.00 | $ 1,066.90 | $ 4.66 | 0.90% |
| | | | | | |
| | Hypothetical(b) | $ 1,000.00 | $ 1,020.56 | $ 4.58 | 0.90% |
| | | | | | |
Institutional Shares | Actual | $ 1,000.00 | $ 1,066.50 | $ 5.13 | 0.99% |
| | | | | | |
| | Hypothetical(b) | $ 1,000.00 | $ 1,020.11 | $ 5.01 | 0.99% |
Small-Mid Core Equity Fund | | | |
Institutional Shares | Actual | $ 1,000.00 | $ 1,033.20 | $ 4.84 | 0.95% |
| | | | | | |
| | Hypothetical(b) | $ 1,000.00 | $ 1,020.31 | $ 4.81 | 0.95% |
Micro-Cap Equity Fund | | | |
Institutional Shares | Actual | $ 1,000.00 | $ 892.60 | $ 8.30 | 1.75% |
| | | | | | |
| | Hypothetical(b) | $ 1,000.00 | $ 1,016.29 | $ 8.85 | 1.75% |
(a) | Expenses are equal to the Fund’s annualized expense ratios, multiplied by the average account value over the period, multiplied by 183/365 (to reflect the one-half year period). |
(b) | Hypothetical assumes 5% annual return before expenses. |
76
Additional Federal Income Tax Information (Unaudited)
The Form 1099-DIV you receive in January 2020 will show the tax status of all distributions paid to your account in calendar year 2019. Shareholders are advised to consult their own tax adviser with respect to the tax consequences of their investment in the Funds. As required by the Internal Revenue Code and/or regulations, shareholders must be notified regarding the status of qualified dividend income for individuals and the dividends received deduction for corporations.
Qualified Dividend Income. The Funds designate the following percentage or up to the maximum amount of such dividends allowable pursuant to the Internal Revenue Code, as qualified dividend income eligible for the reduced tax rate of 15%.
| | Qualified
Dividend
Income |
Small-Cap Equity Fund | 100.00% |
Small-Cap Growth Fund | —% |
Mid-Cap Value Fund | 98.56% |
Unconstrained Equity Fund | —% |
Small-Mid Core Equity Fund | —% |
Micro-Cap Equity Fund | —% |
Qualified Business Income. The Funds designate the following percentage of its ordinary income dividends, or up to the maximum amount of such dividends allowable pursuant to the Internal Revenue Code, as qualified business income.
| | Qualified
Business
Income |
Small-Cap Equity Fund | —% |
Small-Cap Growth Fund | —% |
Mid-Cap Value Fund | 1.46% |
Unconstrained Equity Fund | —% |
Small-Mid Core Equity Fund | —% |
Micro-Cap Equity Fund | —% |
Dividends Received Deduction.Corporate shareholders are generally entitled to take the dividends received deduction on the portion of the Funds’ dividend distribution that qualifies under tax law. For the Funds’ calendar year 2019 ordinary income dividends, the following percentage qualifies for the corporate dividends received deduction.
| | Dividends
Received
Deduction |
Small-Cap Equity Fund | 100.00% |
Small-Cap Growth Fund | —% |
Mid-Cap Value Fund | 100.00% |
Unconstrained Equity Fund | —% |
Small-Mid Core Equity Fund | —% |
Micro-Cap Equity Fund | —% |
For the fiscal year ended September 30, 2019, the Mid-Cap Value Fund designated $5,377 as 20% long-term capital gain distributions.
77
Trustees and Officers (Unaudited)
The Board supervises the business activities of the Trust and is responsible for protecting the interests of shareholders. The Chairman of the Board is Walter B. Grimm, who is an Independent Trustee of the Trust.
Each Trustee serves as a Trustee for the lifetime of the Trust or until the earlier of his or her retirement as a Trustee at age 78, death, resignation or removal. Officers are re-elected annually by the Board. The address of each Trustee and officer is 225 Pictoria Drive, Suite 450, Cincinnati, Ohio 45246.
As of the date of this report, the Trustees oversee the operations of 15 series.
Interested Trustee Background. The following table provides information regarding the Interested Trustee.
Name, Address, (Age), Position with Trust,
Term of Position with Trust | Principal Occupation During
Past 5 Years and Other Directorships |
Robert G. Dorsey* Age: 62 TRUSTEE Began Serving: March 2017 | Principal Occupation(s):Vice Chairman of Ultimus Fund Solutions, LLC and its subsidiaries, except as otherwise noted for the FINRA-regulated broker-dealer entities (February 2019 to present); Interested Trustee of Ultimus Managers Trust (February 2012 to present). Previous Position(s):Managing Director and Co-Chief Executive Officer of Ultimus Fund Solutions, LLC (1999 to February 2019); President of Ultimus Fund Distributors, LLC (1999 to 2018); President of Ultimus Managers Trust (February 2012 to October 2013). |
* | Mr. Dorsey is considered an “interested person” of the Trust within the meaning of Section 2(a)(19) of the 1940 Act because of his relationship with the Trust’s administrator, transfer agent, and distributors. |
Independent Trustee Background. The following table provides information regarding the Independent Trustees.
Name, Address, (Age), Position with Trust,
Term of Position with Trust | Principal Occupation During
Past 5 Years and Other Directorships |
John C. Davis Age: 67 TRUSTEE Began Serving: July 2018 | Principal Occupations(s):Consultant (government services) since May 2011. Previous Position(s):Retired Partner of PricewaterhouseCoopers LLP (1974-2010); Consultant, Board of Trustees of Ultimus Managers Trust (2016 to 2019) and Former Trustee of Ultimus Managers Trust (2012 to 2016). |
Walter B. Grimm Age: 74 TRUSTEE AND CHAIR Began Serving: November 2013 | Principal Occupations(s):President, Leigh Management Group, LLC (consulting firm) (October 2005 to present); and President, Leigh Investments, Inc. (1988 to present). Previous Position(s):Chief Financial Officer, East West Private, LLC (consulting firm) (2009 to 2013). |
78
Trustees and Officers (Unaudited) (continued)
Name, Address, (Age), Position with Trust,
Term of Position with Trust | Principal Occupation During
Past 5 Years and Other Directorships |
Lori Kaiser Age: 56 TRUSTEE Began Serving: July 2018 | Principal Occupations(s):Founder and CEO, Kaiser Consulting since 1992. |
Janet Smith Meeks Age: 64 TRUSTEE Began Serving: July 2018 | Principal Occupations(s):Co-Founder and CEO, Healthcare Alignment Advisors, LLC (consulting company) since August 2015. Previous Position(s): President and Chief Operating Officer, Mount Carmel St. Ann’s Hospital (2006 to 2015). |
Mary M. Morrow Age: 61 TRUSTEE Began Serving: November 2013 | Principal Occupations(s):Chief Operating Officer, Dignity Health Managed Services Organization (October 2018 to present). Previous Position(s):Consultant (managed care services) (April 2018 to September 2018); Chief Operating Officer, Pennsylvania Health and Wellness (fully owned subsidiary of Centene Corporation) (November 2016 to April 2018); Vice President, Strategic Initiatives, Gateway Heath (January 2015 to November 2016); Consulting Practice Manager, DST Health Solutions (August 2010 to January 2015). |
Officers. The following table provides information regarding the Officers.
Name, Address, (Age), Position with Trust,
Term of Position with Trust | Principal Occupation During
Past 5 Years and Other Directorships |
Matthew J. Miller Age: 43 PRESIDENT and CHIEF EXECUTIVE
OFFICER Began Serving: September 2013 (as VP);
September 2018 (as President) | Principal Occupation(s):Assistant Vice President, Relationship Management, Ultimus Fund Solutions, LLC (December 2015 to present). Previous Position(s):Vice President, Relationship Management, Huntington Asset Services, Inc. (n/k/a Ultimus Asset Services, LLC) (2008 to December 2015); Vice President, Transfer Agency Operations, Huntington Asset Services, Inc. (2002 to 2008). |
79
Trustees and Officers (Unaudited) (continued)
Name, Address, (Age), Position with Trust,
Term of Position with Trust | Principal Occupation During
Past 5 Years and Other Directorships |
Zachary P. Richmond Age: 39 TREASURER AND CHIEF FINANCIAL OFFICER Began Serving: August 2014 | Principal Occupation(s): Vice President, Director of Financial Administration for Ultimus Fund Solutions, LLC (February 2019 to present). Previous Position(s):Assistant Vice President, Associate Director of Financial Administration for Ultimus Fund Solutions, LLC (December 2015 to February 2019); Manager, Fund Administration, Huntington Asset Services, Inc. (January 2011 to December 2015). |
Martin R. Dean Age: 55 INTERIM CHIEF COMPLIANCE OFFICER Began Serving: May 2019 | Principal Occupation(s):Vice President, Director of Fund Compliance, Ultimus Fund Solutions, LLC (January 2016to present). Previous Position(s): Senior Vice President and Compliance Group Manager, Huntington Asset Services, Inc. (July 2013 to December 2015). |
Matthew J. Beck Age: 30 SECRETARY Began Serving: September 2018 | Principal Occupation(s):Senior Attorney, Ultimus Fund Solutions, LLC (May 2018 to present). Previous Position(s): Chief Compliance Officer, OBP Capital, LLC (May 2015 to May 2018); Vice President and General Counsel, The Nottingham Company (July 2014 to May 2018). |
Other Information (Unaudited)
The Funds’ Statement of Additional Information (“SAI”) includes additional information about the trustees and is available without charge, upon request. You may call toll-free at (888) 912-4562 to request a copy of the SAI or to make shareholder inquiries.
80
FACTS | WHAT DOES CAPITOL SERIES TRUST DO WITH YOUR PERSONAL INFORMATION? |
| | |
Why? | Financial companies choose how they share your personal information. Federal law gives consumers the right to limit some but not all sharing. Federal law also requires us to tell you how we collect, share, and protect your personal information. Please read this notice carefully to understand what we do. |
| | |
What? | The types of personal information we collect and share depend on the product or service you have with us. This information can include: ■ Social Security number ■ account balances and account transactions ■ transaction or loss history and purchase history ■ checking account information and wire transfer instructions When you areno longer our customer, we continue to share your information as described in this notice. |
| | |
How? | All financial companies need to share customers’ personal information to run their everyday business. In the section below, we list the reasons financial companies can share their customers’ personal information; the reasons Capitol Series Trust chooses to share; and whether you can limit this sharing. |
Reasons we can share your personal information | Does Capitol Series
Trust share? |
For our everyday business purposes—
such as to process your transactions, maintain your account(s), respond to court orders and legal investigations, or report to credit bureaus | Yes |
For our marketing purposes—
to offer our products and services to you | Yes |
For joint marketing with other financial companies | No |
For our affiliates’ everyday business purposes—
information about your transactions and experiences | No |
For our affiliates’ everyday business purposes—
information about your creditworthiness | No |
For nonaffiliates to market to you | No |
Questions? | Call 1-888-912-4562 |
81
Who we are |
Who is providing this notice? | Capitol Series Trust |
What we do |
How does Capitol Series Trust protect my personal information? | To protect your personal information from unauthorized access and use, we use security measures that comply with federal law. These measures include computer safeguards and secured files and buildings. |
How does Capitol Series Trust collect my personal information? | We collect your personal information, for example, when you ■ open an account or deposit money ■ buy securities from us or sell securities to us ■ make deposits or withdrawals from your account provide account information ■ give us your account information ■ make a wire transfer ■ tell us who receives the money ■ tell us where to send the money ■ show your government-issued ID ■ show your driver’s license |
Why can’t I limit all sharing? | Federal law gives you the right to limit only ■ sharing for affiliates’ everyday business purposes — information about your creditworthiness ■ affiliates from using your information to market to you ■ sharing for nonaffiliates to market to you State laws and individual companies may give you additional rights to limit sharing. |
Definitions |
Affiliates | Companies related by common ownership or control. They can be financial and nonfinancial companies. |
Nonaffiliates | Companies not related by common ownership or control. They can be financial and nonfinancial companies. ■Capitol Series Trust does not share your personal information with nonaffiliates so they can market to you. |
Joint marketing | A formal agreement between nonaffiliated financial companies that together market financial products or services to you. ■Capitol Series Trust doesn’t jointly market financial products or services to you. |
82
This page is intentionally left blank.
This page is intentionally left blank.
This page is intentionally left blank.
Proxy Voting (Unaudited)
A description of the policies and procedures that the Funds use to determine how to vote proxies relating to portfolio securities and information regarding how each Fund voted those proxies during the most recent twelve month period ended June 30 are available (1) without charge upon request by calling the Funds at (888) 912-4562 and (2) in the Funds’ documents filed with the Securities and Exchange Commission (“SEC”) on the SEC’s website at www.sec.gov.
TRUSTEES
Walter B. Grimm, Chairman
John C. Davis
Robert G. Dorsey
Lori Kaiser
Janet Smith Meeks
Mary M. Morrow
OFFICERS
Matthew J. Miller, Chief Executive Officer and President
Zachary P. Richmond, Treasurer and Chief Financial Officer
Martin R. Dean, Interim Chief Compliance Officer
Matthew J. Beck, Secretary
INVESTMENT ADVISER
Fuller & Thaler Asset Management, Inc.
411 Borel Avenue, Suite 300
San Mateo, CA 94402
DISTRIBUTOR
Unified Financial Securities, LLC
9465 Counselors Row, Suite 200
Indianapolis, IN 46240
INDEPENDENT REGISTERED PUBLIC ACCOUNTING FIRM
Ernst & Young LLP
221 East 4th Street, Suite 2900
Cincinnati, OH 45202
LEGAL COUNSEL
Bernstein Shur
100 Middle Street, 6th Floor
Portland, ME 04104
CUSTODIAN
Huntington National Bank
41 South High Street
Columbus, OH 43215
ADMINISTRATOR, TRANSFER AGENT AND FUND ACCOUNTANT
Ultimus Fund Solutions, LLC
225 Pictoria Drive, Suite 450
Cincinnati, OH 45246
This report is intended only for the information of shareholders or those who have received the Funds’ prospectus which contains information about the Funds’ management fee and expenses. Please read the prospectus carefully before investing.
Distributed by Unified Financial Securities, LLC
Member FINRA/SIPC

Alta Quality Growth Fund
Institutional Shares – AQLGX
Annual Report
September 30, 2019
Beginning on January 1, 2021, as permitted by regulations adopted by the Securities and Exchange Commission, paper copies of the Fund’s shareholder reports like this one will no longer be sent by mail, unless you specifically request paper copies of the reports from the Fund or from your financial intermediary such as a broker-dealer or bank. Instead, the reports will be made available on a website, and you will be notified by mail each time a report is posted and provided with a website link to access the report.
If you already elected to receive shareholder reports electronically, you will not be affected by this change and you need not take any action. You may elect to receive shareholder reports and other communications from the Fund electronically by contacting the Fund at (800) 957-0681 or, if you own these shares through a financial intermediary, you may contact your financial intermediary.
You may elect to receive all future reports in paper free of charge. You can inform the Fund that you wish to continue receiving paper copies of your shareholder reports by contacting the Fund at (800) 957-0681. If you own shares through a financial intermediary, you may contact your financial intermediary or follow instructions included with this document to elect to continue to receive paper copies of your shareholder reports. Your election to receive reports in paper will apply to all funds held with the fund complex or at your financial intermediary.
Alta Capital Management, LLC
6440 South Wasatch Boulevard, Suite 260
Salt Lake City, Utah 84121
(800) 957-0681
Dear Fellow Shareholders,
The Alta Quality Growth Fund (the “Fund”) finished its inaugural fiscal year on September 30, 2019. This marks roughly nine months since the Fund’s inception date of December 19, 2018 and we are grateful for the trust and support of our shareholders. Alta Capital Management has managed growth equity portfolios for 38 years and we are excited to offer our trusted clients, through this Fund, another way to participate in our unique investment approach.
Investment performance for this fiscal year encompasses the period from the Fund’s inception, December 19, 2018, to September 30, 2019. For this period, the Fund returned 25.70%. In comparison, our benchmark, the S&P 500® Index, returned 20.61%. Our underlying investment philosophy emphasizes long-term thinking and patience over short-term results. As such, we focus more on the long-term performance of our portfolios as we seek investments that can provide strong returns over an entire economic cycle. As the world’s developed economies have matured and monetary policy has become more transparent, these economic cycles have elongated. We, therefore, typically evaluate our investment performance over three, five and even ten-year periods rather than a few months. All that said, we are grateful the market has recognized the value we see in our portfolio companies and has rewarded them with higher prices since the inception of our Fund. We don’t recommend extrapolating a 25.70% return for every nine-month period, but we commit to continually manage the portfolio to target strong risk-adjusted returns.
Benjamin Graham, often considered a father of fundamental investing, once explained that in the short-run, the market is like a voting machine—tallying up which firms are popular and unpopular. In the long-run, however, the market is like a weighing machine—assessing the actual underlying business success of each company. We focus on the weighing machine in this example. The Alta Quality Growth Fund is off to a good start, but the true measure of our success won’t be measured until years from now.
For this fiscal period, the Fund outperformed on a relative basis primarily due to security selection rather than sector allocation. Specifically, our positions in Apple (total return +41%), Mastercard (+46%), Home Depot (+41%), Facebook (+34%) and Sherwin-Williams (+46%), rounded out our top 5 performers. Each of these positions are examples of the power of brands and the importance for management teams to execute well and have a solid strategic position within their respective industries. Our laggards for the period, Walgreens Boots Alliance (-23%) and Ulta Beauty (-22%) are examples of retail concepts that have hit soft patches in their respective same-store-sales growth.
From a sector perspective, our top-three performing sectors were Materials, Information Technology and Industrials. Our positions in both Sherwin-Williams and Ecolab outperformed within the Materials sector and we took profits in each (trimming Sherwin-Williams and selling Ecolab) as they either approached or passed our internal valuation targets.
We added the following four new positions to the Fund: Zoetis, KAR Auction Services, Zebra Technologies and Ulta Beauty. During the period, we sold the following six positions in their entirety: Starbucks, Fastenal, Novo-Nordisk, Pepsi, Cognizant Technology and
1
Ecolab. Each one of the buys brings to our portfolio a leader in their respective industries. The sells were a combination of companies that either reached our internal intrinsic valuation target (Starbucks, Fastenal, Pepsi and Ecolab) or companies whose outlook we determined had worsened for the foreseeable future for either company-specific or industry-specific reasons (Cognizant Technology and Novo-Nordisk). The Fund ended the fiscal year with thirty-one holdings.
To date, 2019 has been a strong year for stock returns but weak relative to expected earnings growth. As of this writing, S&P 500 earnings are only expected to grow 1.4% in 2019 following two straight years of double-digit earnings growth. Trade uncertainty and tariffs have contributed to some of the earnings slowdown as well as a general economic slowdown in much of the world’s economies. The primary market underpinnings remain positive, however. The U.S. economy continues to grow, valuations are not unreasonable, and inflation remains subdued. The Federal Reserve, after raising its target fed-funds rate four times in 2018, has now turned more accommodative and has cut rates twice in 2019. Our return expectations in this environment remain modest but positive.
We thank you for joining us in the inaugural year of the Fund. Results thus far have been positive but, as mentioned, it is the long-term track record on which we measure our success. We continue constructing a portfolio of quality companies with potential to allocate capital at high returns and consistently grow shareholder value.
Sincerely,
Alta Capital Management, LLC
2
Investment Results (Unaudited)
Total Returns(a) as of September 30, 2019
| | Since Inception
(12/19/2018) |
Alta Quality Growth Fund - Institutional Shares | 25.70% |
S&P 500® Index(b) | 20.61% |
Russell 1000® Growth Index(c) | 23.69% |
| | Expense Ratios(d) |
| | Institutional
Shares |
Gross | 1.92% |
With Applicable Waivers | 0.79% |
The performance quoted represents past performance, which does not guarantee future results. The investment return and principal value of an investment will fluctuate so that an investor’s shares, when redeemed, may be worth more or less than their original cost. The returns shown do not reflect deduction of taxes that a shareholder would pay on Alta Quality Growth Fund (the “Fund”) distributions or the redemption of Fund shares. Current performance of the Fund may be lower or higher than the performance quoted. The Fund’s investment objectives, risks, charges and expenses must be considered carefully before investing. Performance data current to the most recent month end may be obtained by calling (800) 957-0681.
(a) Return figures reflect any change in price per share and assume the reinvestment of all distributions. The Fund’s returns reflect any fee reductions during the applicable period. If such fee reductions had not occurred, the quoted performance would have been lower. Total returns for periods less than one year are not annualized.
(b) The S&P 500® Index (“Index”) is a widely recognized unmanaged index of equity securities and is representative of a broader domestic equity market and range of securities than is found in the Fund’s portfolio. Individuals cannot invest directly in the Index; however, an individual can invest in exchange-traded funds or other investment vehicles that attempt to track the performance of a benchmark index.
(c) The Russell 1000® Growth Index is a widely recognized unmanaged index of equity securities and is representative of a broader domestic equity market and range of securities than is found in the Fund’s portfolio. Individuals cannot invest directly in an index; however, an individual can invest in exchange traded funds or other investment vehicles that attempt to track the performance of a benchmark index.
(d) The expense ratios are from the Fund’s prospectus dated December 19, 2018. Alta Capital Management, LLC, the Fund’s adviser (the “Adviser”), has contractually agreed to waive its management fee and/or reimburse expenses so that total annual operating expenses for the Fund (excluding (i) interest; (ii) taxes; (iii) brokerage fees and commissions; (iv) other extraordinary expenses not incurred in the ordinary course of the Fund’s business; (v) dividend expense on short sales; and (vi) indirect expenses such as acquired fund fees and expenses) do not exceed 0.79% of the average daily net assets of the Fund through January 31, 2020 (the “Expense Limitation”). The Expense Limitation is expected to continued from year to year thereafter. During any fiscal year that the Investment Advisory Agreement between the Adviser and Capitol Series Trust (the “Trust”) is in effect, the Adviser may recoup the sum of all fees previously waived or expenses reimbursed, less any reimbursement previously paid, provided that the Adviser is only permitted to recoup fees or expenses within 36 months from the date the fee waiver or expemse reimbursement first occured and provided further that such recoupment can be achieved within the Expense Limitation Agreement currently in effect and the Expense Limitation Agreement in place when the waiver/reimbursement occurred. This Expense Limitation Agreement may not be terminated by the Adviser prior to its expiration date, but the Board of Trustees (the “Board”) may terminate such agreement at any time. The Expense Limitation Agreement terminates automatically upon the termination of the Advisory Agreement with the Adviser. Additional information pertaining to the Fund’s expense raios as of September 30, 2019, can be found in the financial highlights.
The Fund’s investment objectives, strategies, risks, charges and expenses must be considered carefully before investing. The prospectus contains this and other important information about the Fund and may be obtained by calling the same number as above. Please read it carefully before investing.
The Fund is distributed by Ultimus Fund Distributors, LLC, member FINRA/SIPC.
3
Investment Results (Unaudited) (continued)
Comparison of the Growth of a $10,000 Investment in the Alta Quality Growth Fund - Institutional Shares, the S&P 500® Index and the Russell 1000® Growth Index.

The chart above assumes an initial investment of $10,000 made on December 19, 2018 (commencement of operations) and held through September 30, 2019.THE FUND’S RETURNS REPRESENT PAST PERFORMANCE AND DO NOT GUARANTEE FUTURE RESULTS. The returns shown do not reflect deduction of taxes that a shareholder would pay on the Fund’s distributions or the redemption of the Fund’s shares. Investment returns and principal values will fluctuate so that your shares, when redeemed, may be worth more or less than their original purchase price.
Current performance may be lower or higher than the performance data quoted. For more information on the Fund, and to obtain performance data current to the most recent month-end, or to request a prospectus, please call (800) 957-0681. You should carefully consider the investment objectives, potential risks, management fees, and charges and expenses of the Fund before investing. The Fund’s prospectus contains this and other information about the Fund, and should be read carefully before investing.
The Fund is distributed by Ultimus Fund Distributors, LLC, member FINRA/SIPC.
4
Portfolio Illustration (Unaudited)
September 30, 2019
The following chart gives a visual breakdown of the Fund’s sector holdings as a percentage of net assets.
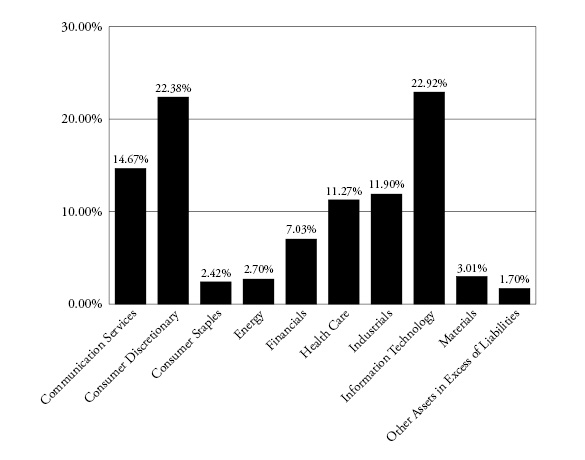
Availability of Portfolio Schedule (Unaudited)
The Fund files its complete schedule of portfolio holdings with the SEC for the first and third quarters of each fiscal year within sixty days after the end of the period. The Fund’s portfolio holdings are available on the SEC’s website at http://www.sec.gov.
5
Alta Quality Growth Fund
Schedule of Investments
September 30, 2019
| | Shares | | | Fair Value | |
COMMON STOCKS — 98.30% | | | | | | | | |
| | | | | | | | | |
Communication Services — 14.67% | | | | | | | | |
Alphabet, Inc., Class A(a) | | | 1,350 | | | $ | 1,648,539 | |
Facebook, Inc., Class A(a) | | | 7,650 | | | | 1,362,312 | |
Walt Disney Company (The) | | | 7,800 | | | | 1,016,496 | |
| | | | | | | | 4,027,347 | |
Consumer Discretionary — 22.38% | | | | | | | | |
Booking Holdings, Inc.(a) | | | 690 | | | | 1,354,201 | |
Dollar Tree, Inc.(a) | | | 9,900 | | | | 1,130,184 | |
Expedia Group, Inc. | | | 7,300 | | | | 981,193 | |
Home Depot, Inc. (The) | | | 5,050 | | | | 1,171,701 | |
TJX Companies, Inc. (The) | | | 16,200 | | | | 902,988 | |
Ulta Beauty, Inc.(a) | | | 2,400 | | | | 601,560 | |
| | | | | | | | 6,141,827 | |
Consumer Staples — 2.42% | | | | | | | | |
Walgreens Boots Alliance, Inc. | | | 12,000 | | | | 663,720 | |
| | | | | | | | | |
Energy — 2.70% | | | | | | | | |
Phillips 66 | | | 7,250 | | | | 742,400 | |
| | | | | | | | | |
Financials — 7.03% | | | | | | | | |
Berkshire Hathaway, Inc., Class B(a) | | | 3,050 | | | | 634,461 | |
S&P Global, Inc. | | | 2,545 | | | | 623,474 | |
Wells Fargo & Company | | | 13,300 | | | | 670,852 | |
| | | | | | | | 1,928,787 | |
Health Care — 11.27% | | | | | | | | |
Becton, Dickinson and Company | | | 3,300 | | | | 834,768 | |
CVS Health Corporation | | | 8,800 | | | | 555,016 | |
Thermo Fisher Scientific, Inc. | | | 3,200 | | | | 932,064 | |
Zoetis, Inc. | | | 6,200 | | | | 772,458 | |
| | | | | | | | 3,094,306 | |
Industrials — 11.90% | | | | | | | | |
Fortune Brands Home & Security, Inc. | | | 7,700 | | | | 421,190 | |
IAA, Inc.(a) | | | 8,300 | | | | 346,359 | |
KAR Auction Services, Inc. | | | 15,800 | | | | 387,890 | |
Middleby Corporation (The)(a) | | | 5,800 | | | | 678,020 | |
Union Pacific Corporation | | | 3,700 | | | | 599,326 | |
United Technologies Corporation | | | 6,100 | | | | 832,772 | |
| | | | | | | | 3,265,557 | |
6 | See accompanying notes which are an integral part of these financial statements. | |
Alta Quality Growth Fund
Schedule of Investments (continued)
September 30, 2019
| | Shares | | | Fair Value | |
COMMON STOCKS — (continued) | | | | | | | | |
| | | | | | | | | |
Information Technology — 22.92% | | | | | | | | |
Amphenol Corporation, Class A | | | 9,100 | | | $ | 878,150 | |
Apple, Inc. | | | 8,850 | | | | 1,982,135 | |
Broadridge Financial Solutions, Inc. | | | 6,300 | | | | 783,909 | |
Mastercard, Inc., Class A | | | 3,750 | | | | 1,018,387 | |
Visa, Inc., Class A | | | 5,500 | | | | 946,055 | |
Zebra Technologies Corporation, Class A(a) | | | 3,300 | | | | 681,021 | |
| | | | | | | | 6,289,657 | |
Materials — 3.01% | | | | | | | | |
Sherwin-Williams Company (The) | | | 1,500 | | | | 824,805 | |
| | | | | | | | | |
Total Investments — 98.30% (Cost $22,261,373) | | | | | | | 26,978,406 | |
| | | | | | | | | |
Other Assets in Excess of Liabilities — 1.70% | | | | | | | 467,410 | |
| | | | | | | | | |
NET ASSETS — 100.00% | | | | | | $ | 27,445,816 | |
(a) | Non-income producing security. |
The sectors shown on the schedule of investments are based on the Global Industry Classification Standard, or GICS® (“GICS”). The GICS was developed by and/or is the exclusive property of MSCI, Inc. and Standard & Poor’s Financial Services LLC (“S&P”). GICS is a service mark of MSCI, Inc. and S&P and has been licensed for use by Ultimus Fund Solutions, LLC.
| | See accompanying notes which are an integral part of these financial statements. | 7 |
Alta Quality Growth Fund
Statement of Assets and Liabilities
September 30, 2019
Assets |
Investments in securities at fair value (cost $22,261,373) | | $ | 26,978,406 | |
Cash and cash equivalents | | | 485,885 | |
Receivable for fund shares sold | | | 12,000 | |
Dividends and interest receivable | | | 10,096 | |
Deferred offering costs | | | 2,715 | |
Prepaid expenses | | | 3,558 | |
Total Assets | | | 27,492,660 | |
Liabilities | | | | |
Payable to Adviser | | | 6,045 | |
Payable to Administrator | | | 5,757 | |
Payable to auditors | | | 23,650 | |
Payable to trustees | | | 64 | |
Other accrued expenses | | | 11,328 | |
Total Liabilities | | | 46,844 | |
Net Assets | | $ | 27,445,816 | |
Net Assets consist of: | | | | |
Paid-in capital | | $ | 22,181,516 | |
Accumulated earnings | | | 5,264,300 | |
Net Assets | | $ | 27,445,816 | |
Institutional Shares: | | | | |
Net Assets | | $ | 27,445,816 | |
Shares outstanding (unlimited number of shares authorized, no par value) | | | 2,183,604 | |
Net asset value, offering and redemption price per share | | $ | 12.57 | |
8 | See accompanying notes which are an integral part of these financial statements. | |
Alta Quality Growth Fund
Statement of Operations
For the period ended September 30, 2019(a)
Investment Income | | | | |
Dividend income | | $ | 215,523 | |
Interest income | | | 17,212 | |
Total investment income | | | 232,735 | |
Expenses | | | | |
Adviser | | | 140,706 | |
Administration | | | 33,919 | |
Audit and tax preparation | | | 23,650 | |
Organizational | | | 12,500 | |
Compliance services | | | 10,989 | |
Offering | | | 10,737 | |
Trustee | | | 10,038 | |
Legal | | | 9,757 | |
Transfer agent | | | 9,420 | |
Report printing | | | 7,144 | |
Registration | | | 3,288 | |
Custodian | | | 2,700 | |
Miscellaneous | | | 14,455 | |
Total expenses | | | 289,303 | |
Fees contractually waived and expenses reimbursed by Adviser | | | (140,982 | ) |
Net operating expenses | | | 148,321 | |
Net investment income | | | 84,414 | |
Net Realized and Change in Unrealized Gain (Loss) on Investments | | | | |
Net realized gain on investment securities transactions | | | 462,811 | |
Net change in unrealized appreciation of investment securities | | | 4,717,033 | |
Net realized and change in unrealized gain on investments | | | 5,179,844 | |
Net increase in net assets resulting from operations | | $ | 5,264,258 | |
(a) | For the period December 19, 2018 (commencement of operations) to September 30, 2019. |
| | See accompanying notes which are an integral part of these financial statements. | 9 |
Alta Quality Growth Fund
Statement of Changes in Net Assets
| | For the
Period Ended
September 30, 2019(a) | |
Increase (Decrease) in Net Assets due to: | | | | |
Operations | | | | |
Net investment income | | $ | 84,414 | |
Net realized gain on investment securities transactions | | | 462,811 | |
Net change in unrealized appreciation of investment securities | | | 4,717,033 | |
Net increase in net assets resulting from operations | | | 5,264,258 | |
Capital Transactions – Institutional Shares | | | | |
Proceeds from shares sold | | | 22,186,666 | |
Amount paid for shares redeemed | | | (5,108 | ) |
Net increase in net assets resulting from capital transactions | | | 22,181,558 | |
Total Increase in Net Assets | | | 27,445,816 | |
Net Assets | | | | |
Beginning of period | | $ | — | |
End of period | | $ | 27,445,816 | |
Share Transactions– Institutional Shares | | | | |
Shares sold | | | 2,184,019 | |
Shares redeemed | | | (415 | ) |
Net increase in shares | | | 2,183,604 | |
(a) | For the period December 19, 2018 (commencement of operations) to September 30, 2019. |
10 | See accompanying notes which are an integral part of these financial statements. | |
Alta Quality Growth Fund - Institutional Shares
Financial Highlights
(For a share outstanding during the period)
| | | For the
Period Ended
September 30,
2019(a) | |
Selected Per Share Data | | | | |
Net asset value, beginning of period | | $ | 10.00 | |
Income from investment operations: | | | | |
Net investment income | | | 0.04 | |
Net realized and unrealized gain | | | 2.53 | |
Total from investment operations | | | 2.57 | |
Net asset value, end of period | | $ | 12.57 | |
Total Return(b) | | | 25.70 | %(c) |
| | | | | |
Ratios and Supplemental Data | | | | |
Net assets, end of period (000 omitted) | | $ | 27,446 | |
Before waiver or recoupment: | | | | |
Ratio of expenses to average net assets | | | 1.54 | %(d) |
After waiver or recoupment: | | | | |
Ratio of expenses to average net assets | | | 0.79 | %(d) |
Ratio of net investment income to average net assets | | | 0.45 | %(d) |
Portfolio turnover rate | | | 16 | %(c) |
(a) | For the period December 19, 2018 (commencement of operations) to September 30, 2019. |
(b) | Total return in the above table represents the rate that a shareholder would have earned or lost on an investment in the Fund, assuming reinvestment of dividends. |
| | See accompanying notes which are an integral part of these financial statements. | 11 |
Alta Quality Growth Fund
Notes to the Financial Statements
September 30, 2019
NOTE 1. ORGANIZATION
The Alta Quality Growth Fund (the “Fund”) was organized as a diversified series of Capitol Series Trust (the “Trust”) on December 18, 2018. The Trust is an open-end investment company established under the laws of Ohio by an Agreement and Declaration of Trust dated September 18, 2013 (the “Trust Agreement”). The Trust Agreement permits the Board of Trustees of the Trust (the “Board”) to issue an unlimited number of shares of beneficial interest of separate series without par value. The Fund is one of a series of funds currently authorized by the Board. The Fund’s investment adviser is Alta Capital Management, LLC (the “Adviser”). The investment objective of the Fund is to seek long-term growth of capital with lower than market volatility.
The Fund currently offers one class of shares, Institutional Shares. Each share represents an equal proportionate interest in the assets and liabilities belonging to the Fund and is entitled to such dividends and distributions out of income belonging to the Fund as are declared by the Board.
NOTE 2. SIGNIFICANT ACCOUNTING POLICIES
The Fund is an investment company and follows accounting and reporting guidance under Financial Accounting Standards Board Accounting Standards Codification (“ASC”) Topic 946, “Financial Services-Investment Companies”. The following is a summary of significant accounting policies followed by the Fund in the preparation of its financial statements. These policies are in conformity with generally accepted accounting principles in the United States of America (“GAAP”).
Estimates – The preparation of financial statements in conformity with GAAP requires management to make estimates and assumptions that affect the reported amounts of assets and liabilities and disclosure of contingent assets and liabilities at the date of the financial statements and the reported amounts of increases and decreases in net assets from operations during the reporting period. Actual results could differ from those estimates.
Federal Income Taxes – The Fund makes no provision for federal income or excise tax. The Fund intends to qualify each year as a regulated investment company (“RIC”) under subchapter M of the Internal Revenue Code of 1986, as amended, by complying with the requirements applicable to RICs and by distributing substantially all of its taxable income. The Fund also intends to distribute sufficient net investment income and net realized capital gains, if any, so that it will not be subject to excise tax on undistributed income and gains. If the required amount of net investment income or gains is not distributed, the Fund could incur a tax expense.
12
Alta Quality Growth Fund
Notes to the Financial Statements (continued)
September 30, 2019
The Fund may be subject to taxes imposed by countries in which it invests. Such taxes are generally based on income and/or capital gains earned or repatriated. Taxes are accrued and applied to net investment income, net realized gains and unrealized appreciation as such income and/or gains are earned.
The Fund recognizes tax benefits or expenses of uncertain tax positions only when the position is “more likely than not” to be sustained assuming examination by tax authorities. Management of the Fund has reviewed tax positions taken in tax years that remain subject to examination by all major tax jurisdictions, including federal (i.e., the interim tax period since commencement of operations) and has concluded that no provision for unrecognized tax benefits or expenses is required in these financial statements and does not expect this to change over the next twelve months. The Fund recognizes interest and penalties, if any, related to unrecognized tax benefits as income tax expense in the Statement of Operations. During the period, the Fund did not incur any interest or penalties.
Expenses – Expenses incurred by the Trust that do not relate to a specific fund of the Trust are allocated to the individual funds based on each fund’s relative net assets or another appropriate basis (as determined by the Board).
Security Transactions and Related Income – Throughout the reporting period, security transactions are accounted for no later than one business day following the trade date. For financial reporting purposes, security transactions are accounted for on trade date on the last business day of the reporting period. The specific identification method is used for determining gains or losses for financial statements and income tax purposes. Dividend income is recorded on the ex-dividend date. Interest income is recorded on an accrual basis and includes, where applicable, the amortization of premium or accretion of discount.
Dividends and Distributions – The Fund intends to distribute its net investment income and net realized long-term and short-term capital gains, if any, at least annually. Dividends and distributions to shareholders, which are determined in accordance with income tax regulations, are recorded on the ex-dividend date. The treatment for financial reporting purposes of distributions made to shareholders during the period from net investment income or net realized capital gains may differ from their ultimate treatment for federal income tax purposes. These differences are caused primarily by differences in the timing of the recognition of certain components of income, expense or realized capital gain for federal income tax purposes. Where such differences are permanent in nature, they are reclassified among the components of net assets based on their ultimate characterization for federal income tax purposes. Any such reclassifications will have no effect on net assets, results of operations or net asset value (“NAV”) per share of the Fund.
13
Alta Quality Growth Fund
Notes to the Financial Statements (continued)
September 30, 2019
For the period December 19, 2018 (commencement of operations) to September 30, 2019, the Fund made the following reclassifications to increase (decrease) the components of net assets, which were due to nondeductible excise taxes:
Paid-In Capital | Accumulated
Earnings |
$(42) | $42 |
Organization and Offering Costs – The Adviser advanced some of the Fund’s organization and initial offering costs and was subsequently reimbursed by the Fund. Costs of $13,452 incurred in connection with the offering and initial registration of the Fund have been deferred and are being amortized on a straight-line basis over the first twelve months after commencement of operations. There were $2,715 in unamortized offering costs remaining as of September 30, 2019. Costs of $12,500 incurred in connection with the organization of the Fund were expensed as incurred.
NOTE 3. SECURITIES VALUATION AND FAIR VALUE MEASUREMENTS
Fair value is defined as the price that the Fund would receive upon selling an investment in a timely transaction to an independent buyer in the principal or most advantageous market of the investment. GAAP establishes a three-tier hierarchy to maximize the use of observable market data and minimize the use of unobservable inputs and to establish classification of fair value measurements for disclosure purposes.
Inputs refer broadly to the assumptions that market participants would use in pricing the asset or liability, including assumptions about risk (the risk inherent in a particular valuation technique used to measure fair value including a pricing model and/or the risk inherent in the inputs to the valuation technique). Inputs may be observable or unobservable. Observable inputs are inputs that reflect the assumptions market participants would use in pricing the asset or liability developed based on market data obtained and available from sources independent of the reporting entity. Unobservable inputs are inputs that reflect the reporting entity’s own assumptions about the assumptions market participants would use in pricing the asset or liability developed based on the best information available in the circumstances.
Various inputs are used in determining the value of the Fund’s investments. These inputs are summarized in the three broad levels listed below.
| | ● | Level 1 – unadjusted quoted prices in active markets for identical investments and/or registered investment companies where the value per share is determined and published and is the basis for current transactions for identical assets or liabilities at the valuation date |
14
Alta Quality Growth Fund
Notes to the Financial Statements (continued)
September 30, 2019
| | ● | Level 2 – other significant observable inputs (including, but not limited to, quoted prices for an identical security in an inactive market, quoted prices for similar securities, interest rates, prepayment speeds, credit risk, etc.) |
| | ● | Level 3 – significant unobservable inputs (including the Fund’s own assumptions in determining fair value of investments based on the best information available) |
The inputs used to measure fair value may fall into different levels of the fair value hierarchy. In such cases, for disclosure purposes, the level in the fair value hierarchy which is reported, is determined based on the lowest level input that is significant to the fair value measurement in its entirety.
In computing the NAV of the Fund, fair value is based on market valuations with respect to portfolio securities for which market quotations are readily available. Pursuant to Board approved policies, the Fund relies on independent third-party pricing services to provide the current market value of securities. Those pricing services value equity securities, including exchange-traded funds, exchange-traded notes, closed-end funds and preferred stocks, traded on a securities exchange at the last reported sales price on the principal exchange. Equity securities quoted by NASDAQ are valued at the NASDAQ Official Closing Price. If there is no reported sale on the principal exchange, equity securities are valued at the mean between the most recent quoted bid and asked price. When using the market quotations or close prices provided by the pricing service and when the market is considered active, the security will be classified as a Level 1 security. Investments in open-end mutual funds, including money market mutual funds, are generally priced at the ending NAV provided by the pricing service of the funds and are generally categorized as Level 1 securities. Debt securities are valued using evaluated prices furnished by a pricing vendor selected by the Board and are generally classified as Level 2 securities.
In the event that market quotations are not readily available, the Adviser determines that the market quotation or the price provided by the pricing service does not accurately reflect the current fair value, or certain restricted or illiquid securities are being valued, such securities are valued as determined in good faith by the Trust’s Valuation Committee, based on recommendations from a pricing committee comprised of certain officers of the Trust, certain employees of the Fund’s administrator, and representatives of the Adviser (together the “Pricing Review Committee”). These securities will be classified as Level 2 or 3 within the fair value hierarchy, depending on the inputs used.
In accordance with the Trust’s Portfolio Valuation Procedures, the Pricing Review Committee, in making its recommendations, is required to consider all appropriate factors relevant to the value of securities for which it has determined other pricing sources are not available or reliable as described above. No single standard exists for determining fair value, because fair value depends upon the circumstances of each individual case. As a general principle, the current fair value of an issue of securities being valued pursuant to
15
Alta Quality Growth Fund
Notes to the Financial Statements (continued)
September 30, 2019
the Trust’s Fair Value Guidelines would be the amount which the Fund might reasonably expect to receive for them upon their current sale. Methods which are in accordance with this principle may, for example, be based on (i) a multiple of earnings; (ii) a discount from market prices of a similar freely traded security (including a derivative security or a basket of securities traded on other markets, exchanges or among dealers); or (iii) yield to maturity with respect to debt issues, or a combination of these and other methods. Fair value pricing is permitted if, in accordance with the Trust’s Portfolio Valuation Procedures, the validity of market quotations appears to be questionable based on factors such as evidence of a thin market in the security based on a small number of quotations, a significant event occurs after the close of a market but before the Fund’s NAV calculation that may affect a security’s value, or other data calls into question the reliability of market quotations.
The following is a summary of the inputs used to value the Fund’s investments as of September 30, 2019:
| | | Valuation Inputs | | | | | |
Assets | | Level 1 | | | Level 2 | | | Level 3 | | | Total | |
Common Stocks(a) | | $ | 26,978,406 | | | $ | — | | | $ | — | | | $ | 26,978,406 | |
(a) | Refer to Schedule of Investments for sector classifications. |
The Fund did not hold any investments at the end of the reporting period for which significant unobservable inputs (Level 3) were used in determining fair value; therefore, no reconciliation of Level 3 securities is included for this reporting period. The Fund did not hold any derivative instruments during the reporting period.
NOTE 4. FEES AND OTHER TRANSACTIONS WITH AFFILIATES AND OTHER SERVICE PROVIDERS
Under the terms of the investment advisory agreement (the “Agreement”), the Adviser manages the Fund’s investments subject to approval of the Board. As compensation for its management services, the Fund is obligated to pay the Adviser a fee computed and accrued daily and paid monthly at an annual rate of 0.75% of the Fund’s average daily net assets. For the period December 19, 2018 (commencement of operations) to September 30, 2019, the Adviser earned fees of $140,706 from the Fund. At September 30, 2019, the Fund owed the Adviser $6,045 in accordance with the expense limitation agreement described below.
The Adviser has contractually agreed to waive its management fee and/or reimburse expenses so that total annual operating expenses (excluding (i) interest; (ii) taxes; (iii) brokerage fees and commissions; (iv) other extraordinary expenses not incurred in the ordinary course of the Fund’s business; (v) dividend expenses on short sales; and (vi) indirect expenses such as acquired fund fees and expenses) do not exceed 0.79% of the Fund’s average daily net assets through January 31, 2020 (“Expense Limitation”). During any period that the Agreement between the Adviser and the Trust is in effect, the Adviser may recoup the sum
16
Alta Quality Growth Fund
Notes to the Financial Statements (continued)
September 30, 2019
of all fees previously waived or expenses reimbursed, less any reimbursement previously paid, provided that the Adviser is only permitted to recoup fees or expenses within 36 months from the date the fee waiver or expense reimbursement took effect and provided further that such recoupment can be achieved within the Expense Limitation currently in effect and the Expense Limitation in place when the waiver/reimbursement occurred. This expense cap agreement may be terminated by the Board at any time. As of September 30, 2019, the Adviser may seek repayment of investment advisory fee waivers and expense reimbursements in the amount of $140,982 from the Fund no later than September 30, 2022.
The Trust retains Ultimus Fund Solutions, LLC (the “Administrator”) to provide the Fund with administration, compliance, fund accounting and transfer agent services, including all regulatory reporting. For the period December 19, 2018 (commencement of operations) to September 30, 2019, the Administrator earned fees of $33,919 for fund accounting and administration services, $10,989 for compliance services and $9,420 for transfer agent services. At September 30, 2019, the Fund owed the Administrator $5,757 for such services.
The Board supervises the business activities of the Trust. Each Trustee serves as a Trustee for the lifetime of the Trust or until the earlier of his or her retirement as a Trustee at age 78 (which may be extended for up to two years in an emeritus non-voting capacity at the pleasure and request of the Board), or until he/she dies, resigns, or is removed, whichever is sooner. “Independent Trustees,” meaning those Trustees who are not “interested persons” of the Trust, as defined in the Investment Company Act of 1940 (“1940 Act”), as amended, each receives an annual retainer of $500 per Fund and $500 per Fund for each quarterly in-person Board meeting. In addition, the Trust reimburses Trustees for out-of-pocket expense incurred in conjunction with attendance at Board meetings.
The officers and one trustee of the Trust are members of management and/or employees of the Administrator. Ultimus Fund Distributors, LLC (the “Distributor”) acts as the principal distributor of the Fund’s shares. The Distributor operates as a wholly-owned subsidiary of Ultimus Fund Solutions, LLC.
NOTE 5. PURCHASES AND SALES OF SECURITIES
For the period December 19, 2018 (commencement of operations) to September 30, 2019, purchases and sales of investment securities, other than short-term investments, were $25,615,555 and $3,816,994, respectively.
There were no purchases or sales of long-term U.S. government obligations during the period December 19, 2018 (commencement of operations) to September 30, 2019.
17
Alta Quality Growth Fund
Notes to the Financial Statements (continued)
September 30, 2019
NOTE 6. FEDERAL TAX INFORMATION
At September 30, 2019, the net unrealized appreciation (depreciation) of investments for tax purposes was as follows:
Gross unrealized appreciation | | $ | 4,924,005 | |
Gross unrealized depreciation | | | (206,972 | ) |
Net unrealized appreciation/(depreciation) on investments | | $ | 4,717,033 | |
Tax cost of investments | | $ | 22,261,373 | |
At September 30, 2019, the components of distributable earnings (accumulated losses) on a tax basis were as follows:
Undistributed ordinary income | | $ | 547,267 | |
Accumulated capital and other losses | | | — | |
Unrealized appreciation (depreciation) on investments | | | 4,717,033 | |
Total accumulated earnings (deficit) | | $ | 5,264,300 | |
NOTE 7. COMMITMENTS AND CONTINGENCIES
The Trust indemnifies its officers and Trustees for certain liabilities that may arise from their performance of their duties to the Trust or the Fund. Additionally, in the normal course of business, the Trust enters into contracts that contain a variety of representations and warranties which provide general indemnifications. The Trust’s maximum exposure under these arrangements is unknown, as this would involve future claims that may be made against the Trust that have not yet occurred.
18
Alta Quality Growth Fund
Notes to the Financial Statements (continued)
September 30, 2019
NOTE 8. RECENT ACCOUNTING PRONOUNCEMENTS
In August 2018, the Financial Accounting Standards Board (“FASB”) issued Accounting Standards Update (“ASU”) 2018-13, which changes the fair value measurement disclosure requirements of FASB Accounting Standards Codification Topic 820, Fair Value Measurement. The update to Topic 820 includes new, eliminated, and modified disclosure requirements. ASU 2018-13 is effective for periods beginning after December 15, 2019, including interim periods, although early adoption is permitted. Management has evaluated the implications of certain provisions of ASU 2018-13 and has determined to early adopt all aspects related to the removal and modification of certain fair value measurement disclosures under the ASU effective immediately. The impact of the adoption was not material to the Fund’s financial statements.
NOTE 9. SUBSEQUENT EVENTS
Management of the Fund has evaluated the need for disclosures and/or adjustments resulting from subsequent events through the date at which these financial statements were issued. Based upon this evaluation, management has determined there were no items requiring adjustment of the financial statements or additional disclosure.
19
Report of Independent Registered Public Accounting Firm
To the Shareholders and the Board of Trustees of Capitol Series Trust
Opinion on the Financial Statements
We have audited the accompanying statement of assets and liabilities of the Alta Quality Growth Fund (the “Fund”) (one of the funds constituting Capitol Series Trust (the “Trust”)), including the schedule of investments, as of September 30, 2019, and the related statements of operations, changes in net assets, and the financial highlights for the period from December 19, 2018 (commencement of operations) through September 30, 2019 and the related notes (collectively referred to as the “financial statements”). In our opinion, the financial statements present fairly, in all material respects, the financial position of the Fund (one of the funds constituting Capitol Series Trust) at September 30, 2019, the results of its operations, the changes in net assets, and its financial highlights for the period from December 19, 2018 (commencement of operations) through September 30, 2019, in conformity with U.S. generally accepted accounting principles.
Basis for Opinion
These financial statements are the responsibility of the Trust’s management. Our responsibility is to express an opinion on the Fund’s financial statements based on our audits. We are a public accounting firm registered with the Public Company Accounting Oversight Board (United States) (“PCAOB”) and are required to be independent with respect to the Trust in accordance with the U.S. federal securities laws and the applicable rules and regulations of the Securities and Exchange Commission and the PCAOB.
We conducted our audits in accordance with the standards of the PCAOB. Those standards require that we plan and perform the audit to obtain reasonable assurance about whether the financial statements are free of material misstatement, whether due to error or fraud. The Trust is not required to have, nor were we engaged to perform, an audit of Trust’s internal control over financial reporting. As part of our audits we are required to obtain an understanding of internal control over financial reporting but not for the purpose of expressing an opinion on the effectiveness of the Trust’s internal control over financial reporting. Accordingly, we express no such opinion.
Our audits included performing procedures to assess the risks of material misstatement of the financial statements, whether due to error or fraud, and performing procedures that respond to those risks. Such procedures included examining, on a test basis, evidence regarding the amounts and disclosures in the financial statements. Our procedures included confirmation of securities owned as of September 30, 2019, by correspondence with the custodian and brokers. Our audits also included evaluating the accounting principles
20
Report of Independent Registered Public Accounting Firm
(continued)
used and significant estimates made by management, as well as evaluating the overall presentation of the financial statements. We believe that our audits provide a reasonable basis for our opinion.

We have served as the auditor of one or more Capitol Series Trust investment companies since 2017.
Cincinnati, Ohio
November 25, 2019
21
Summary of Fund Expenses (Unaudited)
As a shareholder of the Fund, you incur two types of costs: (1) transaction and (2) ongoing costs, including management fees and other Fund expenses. These examples are intended to help you understand your ongoing costs (in dollars) of investing in the Fund and to compare these costs with the ongoing costs of investing in other mutual funds. The example is based on an investment of $1,000 invested at the beginning of the period and held for the entire period from April 1, 2019 through September 30, 2019.
Actual Expenses
The first line of the table below provides information about actual account values and actual expenses. You may use the information in this line, together with the amount you invested, to estimate the expenses that you paid over the period. Simply divide your account value by $1,000 (for example, an $8,600 account value divided by $1,000 = 8.6), then multiply the result by the number in the first line under the heading entitled “Expenses Paid During Period” to estimate the expenses you paid on your account during this period.
Hypothetical Example for Comparison Purposes
The second line of the table below provides information about hypothetical account values and hypothetical expenses based on the Fund’s actual expense ratio and an assumed rate of return of 5% per year before expenses, which is not the Fund’s actual return. The hypothetical account values and expenses may not be used to estimate the actual ending account balance or expenses you paid for the period. You may use this information to compare the ongoing costs of investing in the Fund and other funds. To do so, compare this 5% hypothetical example with the 5% hypothetical examples that appear in the shareholder reports of the other funds.
Expenses shown in the table are meant to highlight your ongoing costs only and do not reflect any transactional costs. Therefore, the second line of the table below is useful in comparing ongoing costs only and will not help you determine the relative costs of owning different funds. In addition, if transaction costs were included, your costs would have been higher.
| | | Beginning
Account Value
April 1, 2019 | Ending
Account Value
September 30,
2019 | Expenses Paid
During
Period(a) | Annualized
Expense
Ratio |
Alta Quality Growth Fund | | | |
Institutional Shares | Actual | $ 1,000.00 | $ 1,094.90 | $ 4.15 | 0.79% |
| | | | | | |
| | Hypothetical(b) | $ 1,000.00 | $ 1,020.99 | $ 3.98 | 0.79% |
(a) | Expenses are equal to the Fund’s annualized expense ratios, multiplied by the average account value over the period, multiplied by 183/365 (to reflect the one-half year period). |
(b) | Hypothetical assumes 5% annual return before expenses. |
22
Trustees and Officers (Unaudited)
The Board supervises the business activities of the Trust and is responsible for protecting the interests of shareholders. The Chairman of the Board is Walter B. Grimm, who is an Independent Trustee of the Trust.
Each Trustee serves as a Trustee for the lifetime of the Trust or until the earlier of his or her retirement as a Trustee at age 78, death, resignation or removal. Officers are re-elected annually by the Board. The address of each Trustee and officer is 225 Pictoria Drive, Suite 450, Cincinnati, Ohio 45246.
As of the date of this report, the Trustees oversee the operations of 15 series.
Interested Trustee Background.The following table provides information regarding the Interested Trustee.
Name, Address, (Age), Position with Trust,
Term of Position with Trust | Principal Occupation During
Past 5 Years and Other Directorships |
Robert G. Dorsey* Age: 62 TRUSTEE Began Serving: March 2017 | Principal Occupation(s):Vice Chairman of Ultimus Fund Solutions, LLC and its subsidiaries, except as otherwise noted for the FINRA-regulated broker-dealer entities (February 2019 to present); Interested Trustee of Ultimus Managers Trust (February 2012 to present). Previous Position(s):Managing Director and Co-Chief Executive Officer of Ultimus Fund Solutions, LLC (1999 to February 2019); President of Ultimus Fund Distributors, LLC (1999 to 2018); President of Ultimus Managers Trust (February 2012 to October 2013). |
* | Mr. Dorsey is considered an “interested person” of the Trust within the meaning of Section 2(a)(19) of the 1940 Act because of his relationship with the Trust’s administrator, transfer agent, and distributors. |
Independent Trustee Background.The following table provides information regarding the Independent Trustees.
Name, Address, (Age), Position with Trust,
Term of Position with Trust | Principal Occupation During
Past 5 Years and Other Directorships |
John C. Davis Age: 67 TRUSTEE Began Serving: July 2018 | Principal Occupations(s):Consultant (government services) since May 2011. Previous Position(s):Retired Partner of PricewaterhouseCoopers LLP (1974-2010); Consultant, Board of Trustees of Ultimus Managers Trust (2016 to 2019) and Former Trustee of Ultimus Managers Trust (2012 to 2016). |
23
Trustees and Officers (Unaudited) (continued)
Name, Address, (Age), Position with Trust,
Term of Position with Trust | Principal Occupation During
Past 5 Years and Other Directorships |
Walter B. Grimm Age: 74 TRUSTEE AND CHAIR Began Serving: November 2013 | Principal Occupations(s):President, Leigh Management Group, LLC (consulting firm) (October 2005 to present); and President, Leigh Investments, Inc. (1988 to present). Previous Position(s):Chief Financial Officer, East West Private, LLC (consulting firm) (2009 to 2013). |
Lori Kaiser Age: 56 TRUSTEE Began Serving: July 2018 | Principal Occupations(s):Founder and CEO, Kaiser Consulting since 1992. |
Janet Smith Meeks Age: 64 TRUSTEE Began Serving: July 2018 | Principal Occupations(s):Co-Founder and CEO, Healthcare Alignment Advisors, LLC (consulting company) since August 2015. Previous Position(s):President and Chief Operating Officer, Mount Carmel St. Ann’s Hospital (2006 to 2015). |
Mary M. Morrow Age: 61 TRUSTEE Began Serving: November 2013 | Principal Occupations(s):Chief Operating Officer, Dignity Health Managed Services Organization (October 2018 to present). Previous Position(s):Consultant (managed care services) (April 2018 to September 2018); Chief Operating Officer, Pennsylvania Health and Wellness (fully owned subsidiary of Centene Corporation) (November 2016 to April 2018); Vice President, Strategic Initiatives, Gateway Heath (January 2015 to November 2016); Consulting Practice Manager, DST Health Solutions (August 2010 to January 2015). |
24
Trustees and Officers (Unaudited) (continued)
Officers.The following table provides information regarding the Officers.
Name, Address, (Age), Position with Trust,
Term of Position with Trust | Principal Occupation During
Past 5 Years and Other Directorships |
Matthew J. Miller Age: 43 PRESIDENT and CHIEF EXECUTIVE OFFICER Began Serving: September 2013 (as VP); September 2018 (as President) | Principal Occupation(s):Assistant Vice President, Relationship Management, Ultimus Fund Solutions, LLC (December 2015 to present). Previous Position(s):Vice President, Relationship Management, Huntington Asset Services, Inc. (n/k/a Ultimus Asset Services, LLC) (2008 to December 2015). |
Zachary P. Richmond Age: 39 TREASURER AND CHIEF FINANCIAL OFFICER Began Serving: August 2014 | Principal Occupation(s):Vice President, Director of Financial Administration for Ultimus Fund Solutions, LLC (February 2019 to present). Previous Position(s):Assistant Vice President, Associate Director of Financial Administration for Ultimus Fund Solutions, LLC (December 2015 to February 2019); Manager, Fund Administration, Huntington Asset Services, Inc. (January 2011 to December 2015). |
Martin R. Dean Age: 55 INTERIM CHIEF COMPLIANCE OFFICER Began Serving: May 2019 | Principal Occupation(s):Vice President, Director of Fund Compliance, Ultimus Fund Solutions, LLC (January 2016 to present). Previous Position(s):Senior Vice President and Compliance Group Manager, Huntington Asset Services, Inc. (July 2013 to December 2015). |
Matthew J. Beck Age: 30 SECRETARY Began Serving: September 2018 | Principal Occupation(s):Senior Attorney, Ultimus Fund Solutions, LLC (May 2018 to present). Previous Position(s): Chief Compliance Officer, OBP Capital, LLC (May 2015 to May 2018); Vice President and General Counsel, The Nottingham Company (July 2014 to May 2018). |
Other Information (Unaudited)
The Fund’s Statement of Additional Information (“SAI”) includes additional information about the trustees and is available without charge, upon request. You may call toll-free at (800) 957-0681 to request a copy of the SAI or to make shareholder inquiries.
25
FACTS | WHAT DOES CAPITOL SERIES TRUST DO WITH YOUR PERSONAL INFORMATION? |
| | |
Why? | Financial companies choose how they share your personal information. Federal law gives consumers the right to limit some but not all sharing. Federal law also requires us to tell you how we collect, share, and protect your personal information. Please read this notice carefully to understand what we do. |
| | |
What? | The types of personal information we collect and share depend on the product or service you have with us. This information can include: ■ Social Security number ■ account balances and account transactions ■ transaction or loss history and purchase history ■ checking account information and wire transfer instructions When you areno longer our customer, we continue to share your information as described in this notice. |
| | |
How? | All financial companies need to share customers’ personal information to run their everyday business. In the section below, we list the reasons financial companies can share their customers’ personal information; the reasons Capitol Series Trust chooses to share; and whether you can limit this sharing. |
Reasons we can share your personal information | Does Capitol Series
Trust share? |
For our everyday business purposes—
such as to process your transactions, maintain your account(s), respond to court orders and legal investigations, or report to credit bureaus | Yes |
For our marketing purposes—
to offer our products and services to you | Yes |
For joint marketing with other financial companies | No |
For our affiliates’ everyday business purposes—
information about your transactions and experiences | No |
For our affiliates’ everyday business purposes—
information about your creditworthiness | No |
For nonaffiliates to market to you | No |
Questions? | Call 1-800-957-0681 |
26
Who we are |
Who is providing this notice? | Capitol Series Trust |
What we do |
How does Capitol Series Trust protect my personal information? | To protect your personal information from unauthorized access and use, we use security measures that comply with federal law. These measures include computer safeguards and secured files and buildings. |
How does Capitol Series Trust collect my personal information? | We collect your personal information, for example, when you ■ open an account or deposit money ■ buy securities from us or sell securities to us ■ make deposits or withdrawals from your account provide account information ■ give us your account information ■ make a wire transfer ■ tell us who receives the money ■ tell us where to send the money ■ show your government-issued ID ■ show your driver’s license |
Why can’t I limit all sharing? | Federal law gives you the right to limit only ■ sharing for affiliates’ everyday business purposes — information about your creditworthiness ■ affiliates from using your information to market to you ■ sharing for nonaffiliates to market to you State laws and individual companies may give you additional rights to limit sharing. |
Definitions |
Affiliates | Companies related by common ownership or control. They can be financial and nonfinancial companies. |
Nonaffiliates | Companies not related by common ownership or control. They can be financial and nonfinancial companies. ■Capitol Series Trust does not share your personal information with nonaffiliates so they can market to you. |
Joint marketing | A formal agreement between nonaffiliated financial companies that together market financial products or services to you. ■Capitol Series Trust doesn’t jointly market financial products or services to you. |
27
This page is intentionally left blank.
This page is intentionally left blank.
Proxy Voting (Unaudited)
A description of the policies and procedures that the Fund uses to determine how to vote proxies relating to portfolio securities and information regarding how the Fund voted those proxies during the most recent twelve month period ended June 30 are available (1) without charge upon request by calling the Fund at (800) 957-0681 and (2) in Fund documents filed with the Securities and Exchange Commission (“SEC”) on the SEC’s website at www.sec.gov.
TRUSTEES
Walter B. Grimm, Chairman
John C. Davis
Robert G. Dorsey
Lori Kaiser
Janet Smith Meeks
Mary M. Morrow
OFFICERS
Matthew J. Miller, Chief Executive Officer and President
Zachary P. Richmond, Chief Financial Officer and Treasurer
Martin R. Dean, Interim Chief Compliance Officer
Matthew J. Beck, Secretary
INVESTMENT ADVISER
Alta Capital Management, LLC
6440 South Wasatch Boulevard, Suite 260
Salt Lake City, Utah 84121
DISTRIBUTOR
Ultimus Fund Distributors, LLC
225 Pictoria Drive, Suite 450
Cincinnati, Ohio 45246
INDEPENDENT REGISTERED PUBLIC ACCOUNTING FIRM
Ernst & Young LLP
221 East 4th Street, Suite 2900
Cincinnati, OH 45202
LEGAL COUNSEL
Bernstein Shur
100 Middle Street, 6th Floor
Portland, ME 04104
CUSTODIAN
Huntington National Bank
41 South High Street
Columbus, OH 43215
ADMINISTRATOR, TRANSFER AGENT AND FUND ACCOUNTANT
Ultimus Fund Solutions, LLC
225 Pictoria Drive, Suite 450
Cincinnati, OH 45246
This report is intended only for the information of shareholders or those who have received the Fund’s prospectus which contains information about the Fund’s management fee and expenses. Please read the prospectus carefully before investing.
Distributed by Ultimus Fund Distributors, LLC
Member FINRA/SIPC
Item 2. Code of Ethics.
As of the end of the period covered by this report, the registrant has adopted a code of ethics that applies to the registrant's principal executive officer, principal financial officer, principal accounting officer or controller, or persons performing similar functions, regardless of whether these individuals are employed by the registrant or a third party. Pursuant to Item 12(a)(1), a copy of registrant’s code of ethics is filed as an exhibit to this Form N-CSR. During the period covered by this report, the code of ethics has not been amended, and the registrant has not granted any waivers, including implicit waivers, from the provisions of the code of ethics.
Item 3. Audit Committee Financial Expert.
| (a)(1) | The registrant’s Board of Trustees has determined that the registrant has at least two audit committee financial experts serving on its audit committee. |
| (a)(2) | The audit committee financial experts are Lori Kaiser and John C. Davis, who are both “independent” for purposes of this Item 3 of Form N-CSR. |
Item 4. Principal Accountant Fees and Services.
| (a) | Audit Fees billed to the registrant by its principal accountants for the two most recent fiscal years: |
| Fuller & Thaler Behavioral Small-Cap Equity Fund: | FY 2019 | $16,000 |
| | FY 2018 | $15,500 |
| Fuller & Thaler Behavioral Small-Cap Growth Fund: | FY 2019 | $16,000 |
| | FY 2018 | $15,500 |
| Fuller & Thaler Behavioral Mid-Cap Value Fund: | FY 2019 | $16,000 |
| | FY 2018 | $15,500 |
| Fuller & Thaler Behavioral Unconstrained Equity Fund: | FY 2019 | $14,000 |
| Fuller & Thaler Behavioral Small-Mid Core Equity Fund: | FY 2019 | $14,000 |
| Fuller & Thaler Behavioral Micro-Cap Equity Fund: | FY 2019 | $14,000 |
| Alta Quality Growth Fund: | FY 2019 | $16,000 |
| (b) | Audit-Related Fees billed to the registrant by its principal accountants for the two most recent fiscal years: |
| Fuller & Thaler Behavioral Small-Cap Equity Fund: | FY 2019 | $0 |
| | FY 2018 | $0 |
| Fuller & Thaler Behavioral Small-Cap Growth Fund: | FY 2019 | $0 |
| | FY 2018 | $0 |
| Fuller & Thaler Behavioral Mid-Cap Value Fund: | FY 2019 | $0 |
| | FY 2018 | $0 |
| Fuller & Thaler Behavioral Unconstrained Equity Fund: | FY 2019 | $0 |
| Fuller & Thaler Behavioral Small-Mid Core Equity Fund: | FY 2019 | $0 |
| Fuller & Thaler Behavioral Micro-Cap Equity Fund: | FY 2019 | $0 |
| Alta Quality Growth Fund: | FY 2019 | $0 |
| c) | Tax Fees billed to the registrant by its principal accountants for the two most recent fiscal years: |
| Fuller & Thaler Behavioral Small-Cap Equity Fund: | FY 2019 | $5,150 |
| | FY 2018 | $5,000 |
| Fuller & Thaler Behavioral Small-Cap Growth Fund: | FY 2019 | $5,150 |
| | FY 2018 | $5,000 |
| Fuller & Thaler Behavioral Mid-Cap Value Fund: | FY 2019 | $5,150 |
| | FY 2018 | $5,000 |
| Fuller & Thaler Behavioral Unconstrained Equity Fund: | FY 2019 | $5,150 |
| Fuller & Thaler Behavioral Small-Mid Core Equity Fund: | FY 2019 | $5,150 |
| Fuller & Thaler Behavioral Micro-Cap Equity Fund: | FY 2019 | $5,150 |
| Alta Quality Growth Fund: | FY 2019 | $5,150 |
| Nature of the fees: | Preparation of the 1120 RIC and Excise review |
| (d) | All other fees billed to the registrant by its principal accountants for the two most recent fiscal years: |
| Fuller & Thaler Behavioral Small-Cap Equity Fund: | FY 2019 | $0 |
| | FY 2018 | $0 |
| Fuller & Thaler Behavioral Small-Cap Growth Fund: | FY 2019 | $0 |
| | FY 2018 | $0 |
| Fuller & Thaler Behavioral Mid-Cap Value Fund: | FY 2019 | $0 |
| | FY 2018 | $0 |
| Fuller & Thaler Behavioral Unconstrained Equity Fund: | FY 2019 | $0 |
| Fuller & Thaler Behavioral Small-Mid Core Equity Fund: | FY 2019 | $0 |
| Fuller & Thaler Behavioral Micro-Cap Equity Fund: | FY 2019 | $0 |
| Alta Quality Growth Fund: | FY 2019 | $0 |
| (e)(1) | Audit Committee’s Pre-Approval Policies |
The Audit Committee Charter requires the Audit Committee to be responsible for the selection, retention or termination of auditors and, in connection therewith, to (i) evaluate the proposed fees and other compensation, if any, to be paid to the auditors, (ii) evaluate the independence of the auditors, (iii) pre-approve all audit services and, when appropriate, any non-audit services provided by the independent auditors to the Trust, (iv) pre-approve, when appropriate, any non-audit services provided by the independent auditors to the Trust's investment adviser, or any entity controlling, controlled by, or under common control with the investment adviser and that provides ongoing services to the Trust if the engagement relates directly to the operations and financial reporting of the Trust, and (v) receive the auditors’ specific representations as to their independence;
| (2) | All of the services described in paragraphs (b) through (d) of Item 4 were pre-approved by the Audit Committee. |
(f) During audit of registrant's financial statements for the most recent fiscal year, less than 50 percent of the hours expended on the principal accountant's engagement were attributed to work performed by persons other than the principal accountant's full-time, permanent employees.
(g) The aggregate non-audit fees billed by the registrant's accountant for services rendered to the registrant, and rendered to the registrant's investment adviser (not including any sub-adviser whose role is primarily portfolio management and is subcontracted with or overseen by another investment adviser), and any entity controlling, controlled by, or under common control with the adviser that provides ongoing services to the registrant:
| | Registrant | Adviser |
| FY 2019 | $36,050 | $0 |
| FY 2018 | $15,000 | $0 |
(h) Not applicable. The auditor performed no services for the registrant’s investment adviser or any entity controlling, controlled by, or under common control with the investment adviser that provides ongoing services to the registrant.
Item 5.Audit Committee of Listed Registrants.
NOT APPLICABLE – applies to listed companies only
Item 6. Schedule of Investments.Schedule filed with Item 1.
Item 7. Disclosure of Proxy Voting Policies and Procedures for Closed-End Management Investment Companies.
NOT APPLICABLE – applies to closed-end funds only
Item 8. Portfolio Managers of Closed-End Management Investment Companies.
NOT APPLICABLE – applies to closed-end funds only
Item 9. Purchases of Equity Securities by Closed-End Management Investment Company and Affiliated Purchasers.
NOT APPLICABLE – applies to closed-end funds only
Item 10. Submission of Matters to a Vote of Security Holders.
The guidelines applicable to shareholders desiring to submit recommendations for nominees to the Registrant's board of trustees are contained in the statement of additional information of the Trust with respect to the Fund(s) for which this Form N-CSR is being filed.
Item 11. Controls and Procedures.
(a) Based on their evaluation of the registrant’s disclosure controls and procedures (as defined in Rule 30a-3(c) under the Investment Company Act of 1940, as amended (the “Act”)) as of a date within 90 days of the filing date of this report, the registrant’s principal executive officer and principal financial officer have concluded that such disclosure controls and procedures are reasonably designed and are operating effectively to ensure that material information relating to the registrant is made known to them by others within those entities, particularly during the period in which this report is being prepared, and that the information required in filings on Form N-CSR is recorded, processed, summarized, and reported on a timely basis.
(b) There were no changes in the registrant’s internal control over financial reporting (as defined in Rule 30a-3(d) under the Investment Company Act of 1940) that occurred during the second fiscal quarter of the period covered by this report that have materially affected, or are reasonably likely to materially affect, the registrant’s internal control over financial reporting.
Item 12. Disclosure of Securities Lending Activities for Closed-End Management Investment Companies.
Not applicable.
Item 13. Exhibits.
| (a)(1) | Code is filed herewith. |
| (a)(2) | Certifications by the registrant's principal executive officer and principal financial officer, pursuant to Section 302 of the Sarbanes- Oxley Act of 2002 and required by Rule 30a-2under the Investment Company Act of 1940 are filed herewith. |
| (b) | Certification pursuant to 18 U.S.C. Section 1350, as adopted pursuant to Section 906 of the Sarbanes-Oxley Act of 2002 is filed herewith. |
SIGNATURES
Pursuant to the requirements of the Securities Exchange Act of 1934 and the Investment Company Act of 1940, the registrant has duly caused this report to be signed on its behalf by the undersigned, thereunto duly authorized.
| (Registrant) | Capitol Series Trust | |
| By (Signature and Title) | /S/ Matthew J. Miller | |
| | Matthew J. Miller, Chief Executive Officer and President |
Pursuant to the requirements of the Securities Exchange Act of 1934 and the Investment Company Act of 1940, this report has been signed below by the following persons on behalf of the registrant and in the capacities and on the dates indicated.
| By (Signature and Title) | /S/ Matthew J. Miller | |
| | Matthew J. Miller, Chief Executive Officer and President |
| By (Signature and Title) | /S/ Zachary P. Richmond | |
| | Zachary P. Richmond, Treasurer and Chief Financial Officer |