UNITED STATES
SECURITIES AND EXCHANGE COMMISSION
Washington, D.C. 20549
FORM N-CSR
CERTIFIED SHAREHOLDER REPORT OF REGISTERED
MANAGEMENT INVESTMENT COMPANIES
Investment Company Act file number: 811-22895
Capitol Series Trust
(Exact name of registrant as specified in charter)
Ultimus Fund Solutions, LLC
225 Pictoria Drive, Suite 450
Cincinnati, OH 45246
(Address of principal executive offices) (Zip code)
Zachary P. Richmond
Ultimus Fund Solutions, LLC
225 Pictoria Drive, Suite 450
Cincinnati, OH 45246
(Name and address of agent for service)
Registrant’s telephone number, including area code:513-587-3400
Date of fiscal year end:August 31
Date of reporting period:August 31, 2019
Item 1. Reports to Stockholders.

HEDEKER STRATEGIC APPRECIATION FUND
Institutional Shares – SAFFX
Annual Report
August 31, 2019
Beginning on January 1, 2021, as permitted by regulations adopted by the Securities and Exchange Commission, paper copies of the Fund’s shareholder reports like this one will no longer be sent by mail, unless you specifically request paper copies of the reports from the Fund or from your financial intermediary such as a broker-dealer or bank. Instead, the reports will be made available on a website, and you will be notified by mail each time a report is posted and provided with a website link to access the report.
If you already elected to receive shareholder reports electronically, you will not be affected by this change and you need not take any action. You may elect to receive shareholder reports and other communications from the Fund electronically by contacting the Fund at (800) 657-4450 or, if you own these shares through a financial intermediary, you may contact your financial intermediary.
You may elect to receive all future reports in paper free of charge. You can inform the Fund that you wish to continue receiving paper copies of your shareholder reports by contacting the Fund at (800) 657-4450. If you own shares through a financial intermediary, you may contact your financial intermediary or follow instructions included with this document to elect to continue to receive paper copies of your shareholder reports. Your election to receive reports in paper will apply to all funds held with the fund complex or at your financial intermediary.
Hedeker Wealth LLC
One Overlook Point, Suite 610
Lincolnshire, Illinois 60069
(800) 657-4450
Dear Shareholder | August 31, 2019 |
Overview
Fiscal year 2019 was characterized by a number of balanced risks. The markets saw several developments throughout the year, both positive and negative, but can best be summarized by the actions of the Federal Reserve. Since August 31, 2018, the Federal Reserve hiked the Federal Funds Target Rate 25bps twice from 2.00% to 2.50%, then cut once to 2.25%. The Federal Reserve subsequently cut rates one more time in September 2019 to 2.00%, so we’re effectively unchanged over the last year. The move in the Fed funds rate underscores the delicate balance of risks currently playing out. For every positive data point such as historically low unemployment or steady GDP growth, exogenous risks hang in the balance such as the trade war with China, an unresolved Brexit, and slowing earnings growth. Despite these risks, we’ve had a rare V-shaped recovery in equities and credit markets. Unfortunately, the Hedeker Strategic Appreciation Fund (the “Fund”) underperformed during fiscal year 20191, posting a loss of -3.23% (net of fees). By comparison, the Fund’s benchmark, the Bloomberg Barclays Intermediate Government/Credit Index was up +8.12%.
Fiscal Year 2019
During fiscal year 2019, the S&P 500® Index was up +2.92% while the Russell 2000® Index was down -12.93%. This divergence between large-cap and small-cap equities encapsulates much of the Fund’s underperformance since the majority of the Fund was invested in small-cap companies.
Convertible valuations are made up of three inputs: volatility, credit spreads, and interest rates. All three inputs experienced meaningful moves during fiscal year 2019. Volatility, as measured by the Chicago Board Options Exchange Volatility Index (the “VIX”), increased by over 6 points, starting the period at 12.86 and finishing at 18.98. Moreover, the VIX ranged from 11.61 to 36.07, which is noteworthy since the VIX closed above 36 only four times since 2012. Credit spreads, as measured by the CDX HY Index, ranged from 312bps to 485bps during fiscal year 2019, but only changed by 10bps starting the period at 330bps and closing at 340bps. The most meaningful move was in interest rates. The 10-year U.S. Treasury yield was cut nearly in half, going from 2.86% to 1.50%. The 10-year U.S. Treasury yield peaked on November 8, 2018 at 3.24%. More importantly, this move lower in rates resulted in a flatter yield curve, with certain points on the curve inverting. The commonly quoted 2-year/10-year U.S. Treasury yield spread started somewhat flat at +23bps but ended the period inverted at -1bp.
To summarize, large-cap stocks were up modestly while small-cap stocks lagged behind. This divergence resulted in higher volatility and an inverted yield curve, but credit spreads remained stubbornly unchanged. Meanwhile, the aforementioned exogenous risks remain overhead. While it is impossible to predict the future, it is important to know where the risks lie. In July 2019, we began the process of diversifying the Fund’s small-cap exposure. Currently, the majority of the Fund is now invested in mid to large-cap companies. We’ve also improved the portfolio’s credit quality by reducing exposure to high yield and distressed securities. Lastly, we’ve tightened up our risk management and security selection process.
Closing Remarks
The Fund also changed portfolio managers towards the end of fiscal year 2019. This change has brought a renewed effort towards improving our process to better manage risk and hopefully improve performance going forward. The current environment calls for a steady hand and a disciplined process. With heightened volatility and credit spreads unchanged, it is prudent to remain ready for any outcome. By focusing on credit quality and favorable risk/reward profiles, we are confident in our ability to deliver consistent risk adjusted returns with low standard deviation during fiscal year 2020.
Ryan Casaquite
Portfolio Manager
1 | The Fund’s fiscal year is 9/1/2018 - 8/31/2019. |
1
Investors should carefully consider the investment objectives, risks, and charges and expenses of the fund before investing. The prospectus contains this and other information about the fund, and it should be read carefully before investing. Investors may obtain a copy of the prospectus by calling 800-657-4450.
Investing involves risk, including loss of principal. There is no guarantee that this, or any, investment strategy will be successful. A majority of the Fund’s assets will be invested in convertible securities that have credit ratings that are below investment grade or not rated. These “junk bonds” are considered speculative investments. Fixed income investments are affected by a number of risks, including fluctuation in interest rates, credit risk, and prepayment risk. In general, as prevailing interest rates rise, fixed income securities prices will fall. Some fixed income securities give the issuer the option to call, or redeem, the bonds before their maturity date. If an issuer “calls” its bonds during a time of declining interest rates, the Fund may have to invest the proceeds in an investment offering a lower yield. Convertible securities may be illiquid and difficult to value and may be subject to greater credit risk than other securities. Many of the convertible securities in which the Fund invests are issued by small or medium sized companies located in foreign and emerging markets. Investments in international markets present special risks including currency fluctuation, the potential for diplomatic and political instability, regulatory and liquidity risks, foreign taxation and differences in auditing and other financial standards. Risks of foreign investing are generally intensified for investments in emerging markets. Small and mid-cap investing involves greater risk not associated with investing in more established companies, such as greater price volatility, business risk, less liquidity and increased competitive threat.
Past performance does not guarantee future performance.
The S&P 500® Index is a market capitalization weighted index that is widely used as a barometer of U.S. stock market performance. The Russell 2000® Index is an index that measures the performance of the 2,000 smallest companies in the Russell 3000® Index. The Chicago Board Options Exchange Volatility Index (“the VIX”) reflects a market estimate of future volatility, based on the weighted average of the implied volatilities for a wide range of strikes. Markit CDX North America High Yield Index (“the CDX HY Index”) is composed of 100 non-investment grade entities, distributed among 2 sub-indices: B, BB. You cannot invest directly in an index.
The Hedeker Strategic Appreciation Fund is distributed by Ultimus Fund Distributors, LLC.
2
Investment Results (Unaudited)
Average Annual Total Returns(a) as of August 31, 2019
| One Year | Since
Inception
(12/21/2016) | Expense Ratio(c) |
Hedeker Strategic Appreciation Fund | | | |
Institutional Shares | (3.23)% | 1.65% | 1.46% |
Bloomberg Barclays Intermediate Government/Credit Index(b) | 8.12% | 3.80% | |
The performance quoted represents past performance, which does not guarantee future results. The investment return and principal value of an investment will fluctuate so that an investor’s shares, when redeemed, may be worth more or less than their original cost. The returns shown do not reflect deduction of taxes that a shareholder would pay on the Hedeker Strategic Appreciation Fund (the “Fund”) distributions or the redemption of Fund shares. Current performance of the Fund may be lower or higher than the performance quoted. The Fund’s investment objectives, risks, charges and expenses must be considered carefully before investing. Performance data current to the most recent month end may be obtained by calling (800) 657-4450.
(a) | Return figures reflect any change in price per share and assume the reinvestment of all distributions. |
(b) | The Bloomberg Barclays Intermediate Government/Credit Index (“Index”) is a broad-based flagship benchmark that measures the non-securitized component of the U.S. Aggregate Index. It includes investment grade, U.S. dollar-denominated, fixed-rate Treasuries, government-related and corporate securities. The returns of the Index do not reflect the deduction of fees and expenses, whereas the Fund returns are shown net of fees. An individual cannot invest directly in an index. |
(c) | The expense ratio is from the Fund’s prospectus dated December 31, 2018. Hedeker Wealth LLC, the Fund’s adviser (the “Adviser”), has contractually agreed, until December 31, 2019, to waive its management fee and/or reimburse expenses so that total annual operating expenses (excluding (i) interest; (ii) taxes; (iii) brokerage fees and commissions; (iv) other extraordinary expenses not incurred in the ordinary course of the Fund’s business; (v) dividend expenses on short sales; and (vi) indirect expenses such as acquired fund fees and expenses) do not exceed 1.75% of the Fund’s average daily net assets. (“Expense Limitation Agreement”). During any fiscal year that the Investment Advisory Agreement between the Adviser and Capitol Series Trust (the “Trust”) is in effect, the Adviser may recoup the sum of all fees previously waived or expenses reimbursed, less any reimbursement previously paid, provided that the Adviser is only permitted to recoup fees or expenses within 36 months from the date the fee waiver or expense reimbursement first occurred and provided further that such recoupment can be achieved within the Expense Limitation Agreement currently in effect and the Expense Limitation Agreement in place when the waiver/reimbursement occurred. The Expense Limitation Agreement may be terminated by the Board of Trustees (the “Board”) at any time. The Institutional Shares expense ratio does not correlate to the corresponding ratio of expenses to average net assets included in the financial highlights section of this report, which reflects the operating expenses of the Fund, but does not include acquired fund fees and expenses. Additional information pertaining to the Fund’s expense ratios as of August 31, 2019, can be found in the financial highlights. |
The Fund’s investment objectives, strategies, risks, charges and expenses must be considered carefully before investing. The prospectus contains this and other important information about the Fund and may be obtained by calling (800) 657-4450. Please read it carefully before investing.
The Fund is distributed by Ultimus Fund Distributors, LLC, member FINRA/SIPC.
3
Investment Results (Unaudited) (continued)

The chart above assumes an initial investment of $10,000 made on December 21, 2016 (commencement of operations) and held through August 31, 2019. THE FUND’S RETURNS REPRESENT PAST PERFORMANCE AND DO NOT GUARANTEE FUTURE RESULTS. The returns shown do not reflect deduction of taxes that a shareholder would pay on the Fund’s distributions or the redemption of the Fund’s shares. Investment returns and principal values will fluctuate so that your shares, when redeemed, may be worth more or less than their original purchase price.
Current performance may be lower or higher than the performance data quoted. For more information on the Fund, and to obtain performance data current to the most recent month-end, or to request a prospectus, please call (800) 657-4450. You should carefully consider the investment objectives, potential risks, management fees, and charges and expenses of the Fund before investing. The Fund’s prospectus contains this and other information about the Fund, and should be read carefully before investing.
The Fund is distributed by Ultimus Fund Distributors, LLC, Member FINRA/SIPC.
4
Portfolio Illustration (Unaudited)
August 31, 2019 |
|
The following chart gives a visual breakdown of the Fund’s holdings as a percentage of net assets.

Availability of Portfolio Schedule (Unaudited)
The Fund files its complete schedule of portfolio holdings with the SEC for the first and third quarters of each fiscal year within sixty days after the end of the period. The Fund’s portfolio holdings are available on the SEC’s website at http://www.sec.gov.
5
Hedeker Strategic Appreciation Fund
Schedule of Investments
August 31, 2019
| | Principal
Amount | | | Fair
Value | |
CONVERTIBLE CORPORATE BONDS — 93.35% | | | | | | | | |
| | | | | | | | | |
Communication Services — 3.95% | | | | | | | | |
Liberty Media Corporation, 2.25%, 9/30/2046 | | $ | 2,000,000 | | | $ | 1,104,671 | |
Liberty Media Corporation - Formula One Group, 1.00%, 1/30/2023 | | | 1,000,000 | | | | 1,254,129 | |
| | | | | | | | 2,358,800 | |
Consumer Discretionary — 1.87% | | | | | | | | |
Carriage Services, Inc., 2.75%, 3/15/2021 (a) | | | 300,000 | | | | 328,264 | |
Ctrip.com International Ltd., 1.99%, 7/1/2025 | | | 750,000 | | | | 790,313 | |
| | | | | | | | 1,118,577 | |
Consumer Staples — 1.13% | | | | | | | | |
Herbalife Nutrition Ltd., 2.63%, 3/15/2024 | | | 750,000 | | | | 674,910 | |
| | | | | | | | | |
Energy — 8.04% | | | | | | | | |
Helix Energy Solutions Group, Inc., 4.13%, 9/15/2023 | | | 1,000,000 | | | | 1,111,875 | |
Hurricane Energy plc, 7.50%, 7/24/2022 | | | 500,000 | | | | 657,473 | |
Newpark Resources, Inc., 4.00%, 12/1/2021(a) | | | 1,000,000 | | | | 1,059,077 | |
Whiting Petroleum Corporation, 1.25%, 4/1/2020 | | | 2,000,000 | | | | 1,970,854 | |
| | | | | | | | 4,799,279 | |
Financials — 19.18% | | | | | | | | |
Apollo Commercial Real Estate Finance, Inc., 5.38%, 10/15/2023 | | | 500,000 | | | | 508,573 | |
Ares Capital Corporation, 3.75%, 2/1/2022 | | | 1,000,000 | | | | 1,042,323 | |
Ares Capital Corporation, 4.63%, 3/1/2024 | | | 750,000 | | | | 802,500 | |
Encore Capital Group, Inc., 3.00%, 7/1/2020 | | | 1,627,000 | | | | 1,669,943 | |
Exantas Capital Corporation, 4.50%, 8/15/2022 | | | 1,000,000 | | | | 1,031,450 | |
EZCORP, Inc., 2.88%, 7/1/2024 | | | 750,000 | | | | 772,983 | |
Hannon Armstrong Sustainable Infrastructure Capital, Inc., 4.13%, 9/1/2022 | | | 1,000,000 | | | | 1,095,625 | |
New Mountain Finance Corporation, 5.75%, 8/15/2023 | | | 1,000,000 | | | | 1,047,865 | |
Prospect Capital Corporation, 4.95%, 7/15/2022 | | | 1,000,000 | | | | 1,034,724 | |
Prospect Capital Corporation, 6.38%, 3/1/2025 | | | 1,000,000 | | | | 1,058,358 | |
Redwood Trust, Inc., 4.75%, 8/15/2023 | | | 1,000,000 | | | | 1,001,079 | |
Resource Capital Corporation, 8.00%, 1/15/2020(a) | | | 375,000 | | | | 389,550 | |
| | | | | | | | 11,454,973 | |
Health Care — 20.65% | | | | | | | | |
Alder Biopharmaceuticals, Inc., 2.50%, 2/1/2025 | | | 400,000 | | | | 339,250 | |
Allscripts Healthcare Solutions, Inc., 1.25%, 7/1/2020 | | | 1,000,000 | | | | 994,980 | |
ANI Pharmaceuticals, Inc., 3.00%, 12/1/2019 | | | 750,000 | | | | 788,590 | |
BioMarin Pharmaceutical, Inc., 1.50%, 10/15/2020 | | | 300,000 | | | | 320,250 | |
BioMarin Pharmaceutical, Inc., 0.60%, 8/1/2024 | | | 1,000,000 | | | | 1,013,125 | |
Insmed, Inc., 1.75%, 1/15/2025 | | | 1,000,000 | | | | 823,018 | |
Medicines Company (The), 2.75%, 7/15/2023 | | | 1,050,000 | | | | 1,148,276 | |
PDL BioPharma, Inc., 2.75%, 12/1/2021 | | | 1,000,000 | | | | 986,543 | |
Repligen Corporation, 0.38%, 7/15/2024 | | | 1,000,000 | | | | 1,075,000 | |
6 | See accompanying notes which are an integral part of these financial statements. | |
Hedeker Strategic Appreciation Fund
Schedule of Investments (continued)
August 31, 2019
| | Principal
Amount | | | Fair
Value | |
CONVERTIBLE CORPORATE BONDS — (continued) |
| |
Health Care — (continued) |
Retrophin, Inc., 2.50%, 9/15/2025 | | $ | 2,000,000 | | | $ | 1,582,354 | |
Rocket Pharmaceuticals, Inc., 5.75%, 8/1/2021 | | | 1,000,000 | | | | 994,747 | |
Theravance Biopharma, Inc., 3.25%, 11/1/2023 | | | 500,000 | | | | 485,370 | |
Verastem, Inc., 5.00%, 11/1/2048 | | | 500,000 | | | | 228,750 | |
Wright Medical Group NV, 2.25%, 11/15/2021 | | | 500,000 | | | | 586,446 | |
Wright Medical Group NV, 1.63%, 6/15/2023 | | | 1,000,000 | | | | 964,471 | |
| | | | | | | | 12,331,170 | |
Industrials — 4.69% | | | | | | | | |
Atlas Air Worlwide Holdings, Inc., 1.88%, 6/1/2024 | | | 500,000 | | | | 424,688 | |
Macquarie Infrastructure Corporation, 2.00%, 10/1/2023 | | | 1,000,000 | | | | 908,837 | |
Team, Inc., 5.00%, 8/1/2023 | | | 1,385,000 | | | | 1,468,527 | |
| | | | | | | | 2,802,052 | |
Information Technology — 29.96% | | | | | | | | |
Altair Engineering, Inc., 0.25%, 6/1/2024 | | | 1,000,000 | | | | 1,016,689 | |
Guidewire Software, Inc., 1.25%, 3/15/2025 | | | 1,000,000 | | | | 1,102,200 | |
II-VI, Inc., 0.25%, 9/1/2022 | | | 1,250,000 | | | | 1,342,501 | |
InterDigital, Inc., 1.50%, 3/1/2020 | | | 1,558,000 | | | | 1,558,613 | |
Knowles Corporation, 3.25%, 11/1/2021 | | | 900,000 | | | | 1,161,215 | |
Liberty Interactive LLC, 4.00%, 11/15/2029 | | | 1,350,000 | | | | 982,125 | |
Microchip Technology, Inc., 1.63%, 2/15/2027 | | | 1,000,000 | | | | 1,218,301 | |
Nutanix, Inc., 0.00%, 1/15/2023 | | | 1,000,000 | | | | 926,182 | |
NXP Semiconductors NV, 1.00%, 12/1/2019 | | | 1,000,000 | | | | 1,051,875 | |
ON Semiconductor Corporation, 1.00%, 12/1/2020 | | | 1,000,000 | | | | 1,135,572 | |
Pure Storage, Inc., 0.13%, 4/15/2023 | | | 1,000,000 | | | | 983,750 | |
Square, Inc., 0.50%, 5/15/2023 | | | 1,000,000 | | | | 1,121,875 | |
TTM Technologies, Inc., 1.75%, 12/15/2020 | | | 1,000,000 | | | | 1,217,500 | |
Twitter, Inc., 0.25%, 9/15/2019 | | | 2,000,000 | | | | 2,003,188 | |
Verint Systems, Inc., 1.50%, 6/1/2021 | | | 1,000,000 | | | | 1,072,653 | |
| | | | | | | | 17,894,239 | |
Real Estate — 2.13% | | | | | | | | |
IH Merger Sub LLC, 3.50%, 1/15/2022 | | | 973,000 | | | | 1,272,486 | |
| | | | | | | | | |
Utilities — 1.75% | | | | | | | | |
Pattern Energy Group, Inc., 4.00%, 7/15/2020 | | | 1,000,000 | | | | 1,044,789 | |
Total Convertible Corporate Bonds (Cost $54,869,467) | | | | | | | 55,751,275 | |
| | See accompanying notes which are an integral part of these financial statements. | 7 |
Hedeker Strategic Appreciation Fund
Schedule of Investments (continued)
August 31, 2019
| | Shares | | | Fair
Value | |
CONVERTIBLE PREFERRED STOCKS — 5.71% | | | | | | | | |
| | | | | | | | | |
Energy — 0.35% | | | | | | | | |
Chesapeake Energy Corporation, 4.50% | | $ | 5,000 | | | $ | 209,200 | |
| | | | | | | | | |
Financials — 3.55% | | | | | | | | |
Capitala Finance Corporation, 5.75% | | | 33,203 | | | | 824,763 | |
Great Ajax Corporation, 7.25% | | | 20,196 | | | | 534,386 | |
Ready Capital Corporation, 7.00% | | | 28,537 | | | | 763,079 | |
| | | | | | | | 2,122,228 | |
Real Estate — 1.81% | | | | | | | | |
RLJ Lodging Trust, Series A, 7.80% | | | 40,000 | | | | 1,081,200 | |
Total Convertible Preferred Stocks (Cost $3,391,115) | | | | | | | 3,412,628 | |
| | | | | | | | | |
MONEY MARKET FUNDS - 1.32% | | | | | | | | |
Fidelity Investments Money Market Government Portfolio, Institutional Class, 2.05%(b) | | | 789,715 | | | | 789,715 | |
Total Money Market Funds (Cost $789,715) | | | | | | | 789,715 | |
| | | | | | | | | |
Total Investments — 100.38% (Cost $59,050,297) | | | | | | | 59,953,618 | |
| | | | | | | | | |
Liabilities in Excess of Other Assets — (0.38)% | | | | | | | (225,747 | ) |
| | | | | | | | | |
NET ASSETS — 100.00% | | | | | | $ | 59,727,871 | |
(a) | Illiquid security. The total fair value of these securities as of August 31, 2019 was $1,776,891, representing 2.97% of net assets. |
(b) | Rate disclosed is the seven day effective yield as of August 31, 2019. |
The sectors shown on the schedule of investments are based on the Global Industry Classification Standard, or GICS® (“GICS”). The GICS was developed by and/or is the exclusive property of MSCI, Inc. and Standard & Poor’s Financial Services LLC (“S&P”). GICS is a service mark of MSCI, Inc. and S&P and has been licensed for use by Ultimus Fund Solutions, LLC.
8 | See accompanying notes which are an integral part of these financial statements. | |
Hedeker Strategic Appreciation Fund
Statement of Assets and Liabilities
August 31, 2019
Assets |
Investments in securities at fair value (cost $59,050,297) | | $ | 59,953,618 | |
Receivable for investments sold | | | 4,028,306 | |
Dividends and interest receivable | | | 367,837 | |
Prepaid expenses | | | 2,795 | |
Total Assets | | | 64,352,556 | |
Liabilities |
Payable for fund shares redeemed | | | 3,600,000 | |
Payable for investments purchased | | | 933,627 | |
Payable to Adviser | | | 53,850 | |
Payable to auditors | | | 24,650 | |
Payable to Administrator | | | 9,979 | |
Payable to trustees | | | 600 | |
Other accrued expenses | | | 1,979 | |
Total Liabilities | | | 4,624,685 | |
Net Assets | | $ | 59,727,871 | |
Net Assets consist of: | | | | |
Paid-in capital | | $ | 61,545,504 | |
Accumulated deficit | | | (1,817,633 | ) |
Net Assets | | $ | 59,727,871 | |
Shares outstanding (unlimited number of shares authorized, no par value) | | | 2,449,546 | |
Net asset value, offering and redemption price per share | | $ | 24.38 | |
| | See accompanying notes which are an integral part of these financial statements. | 9 |
Hedeker Strategic Appreciation Fund
Statement of Operations
For the year ended August 31, 2019
Investment Income | | | | |
Dividend income | | $ | 418,680 | |
Interest income (net of foreign taxes withheld of $1,436) | | | 967,801 | |
Total investment income | | | 1,386,481 | |
Expenses | | | | |
Adviser | | | 599,548 | |
Administration | | | 60,061 | |
Fund accounting | | | 37,156 | |
Audit and tax preparation | | | 29,150 | |
Report printing | | | 17,134 | |
Trustee | | | 15,783 | |
Legal | | | 15,418 | |
Line of credit | | | 12,605 | |
Transfer agent | | | 12,000 | |
Pricing | | | 10,905 | |
Custodian | | | 6,573 | |
Compliance services | | | 6,000 | |
Registration | | | 5,507 | |
Interest expense | | | 1,906 | |
Miscellaneous | | | 17,659 | |
Net operating expenses | | | 847,405 | |
Net investment income | | | 539,076 | |
Net Realized and Change in Unrealized Gain (Loss) on Investments |
Net realized loss on investment securities transactions | | | (1,533,469 | ) |
Net realized loss on foreign currency translations | | | (19,263 | ) |
Net change in unrealized depreciation of investment securities and foreign currency translations | | | (884,259 | ) |
Net realized and change in unrealized loss on investments | | | (2,436,991 | ) |
Net decrease in net assets resulting from operations | | $ | (1,897,915 | ) |
10 | See accompanying notes which are an integral part of these financial statements. | |
Hedeker Strategic Appreciation Fund
Statements of Changes in Net Assets
| | | For the
Year Ended
August 31, 2019 | | | For the
Year Ended
August 31, 2018(a) | |
Increase (Decrease) in Net Assets due to: | | | | | | | | |
Operations | | | | | | | | |
Net investment income | | $ | 539,076 | | | $ | 856,669 | |
Net realized gain (loss) on investment securities transactions and foreign currency translations | | | (1,552,732 | ) | | | 334,949 | |
Net change in unrealized appreciation (depreciation) of investment securities and foreign currency translations | | | (884,259 | ) | | | 2,105,177 | |
Net increase (decrease) in net assets resulting from operations | | | (1,897,915 | ) | | | 3,296,795 | |
Distributions to Shareholders from Earnings: | | | | | | | | |
Institutional Shares | | | (1,776,026 | ) | | | (2,043,554 | ) |
Total distributions | | | (1,776,026 | ) | | | (2,043,554 | ) |
Capital Transactions - Institutional Shares | | | | | | | | |
Proceeds from shares sold | | | 11,103,161 | | | | 9,668,950 | |
Reinvestment of distributions | | | 1,776,026 | | | | 2,043,554 | |
Amount paid for shares redeemed | | | (9,771,834 | ) | | | (3,291,991 | ) |
Net increase in net assets resulting from capital transactions | | | 3,107,353 | | | | 8,420,513 | |
Total Increase (Decrease) in Net Assets | | | (566,588 | ) | | | 9,673,754 | |
Net Assets | | | | | | | | |
Beginning of year | | | 60,294,459 | | | | 50,620,705 | |
End of year | | $ | 59,727,871 | | | $ | 60,294,459 | |
Share Transactions - Institutional Shares | | | | | | | | |
Shares sold | | | 454,058 | | | | 381,318 | |
Shares issued in reinvestment of distributions | | | 73,503 | | | | 82,089 | |
Shares redeemed | | | (399,557 | ) | | | (129,091 | ) |
Net increase in shares | | | 128,004 | | | | 334,316 | |
(a) | For the year ended August 31, 2018, distributions to shareholders from earnings consisted of $1,407,245 from net investment income and $636,309 from net realized gains. As of August 31, 2018, accumulated net investment income was $143,662. |
| | See accompanying notes which are an integral part of these financial statements. | 11 |
Hedeker Strategic Appreciation Fund - Institutional Shares
Financial Highlights
(For a share outstanding during each period)
| | | For the
Year Ended
August 31, 2019 | | | For the
Year Ended
August 31, 2018 | | | For the
Period Ended
August 31, 2017(a) | |
Net asset value, beginning of period | | $ | 25.97 | | | $ | 25.47 | | | $ | 25.00 | |
| | | | | | | | | | | | | |
Investment operations: | | | | | | | | | | | | |
Net investment income | | | 0.23 | | | | 0.41 | | | | 0.07 | |
Net realized and unrealized gain (loss) on investments | | | (1.08 | ) | | | 1.06 | | | | 0.41 | |
Total from investment operations | | | (0.85 | ) | | | 1.47 | | | | 0.48 | |
| | | | | | | | | | | | | |
Distributions from: | | | | | | | | | | | | |
Net investment income | | | (0.74 | ) | | | (0.66 | ) | | | (0.01 | ) |
Net realized gains | | | — | | | | (0.31 | ) | | | — | |
Total from distributions | | | (0.74 | ) | | | (0.97 | ) | | | (0.01 | ) |
| | | | | | | | | | | | | |
Net asset value, end of period | | $ | 24.38 | | | $ | 25.97 | | | $ | 25.47 | |
| | | | | | | | | | | | | |
Total Return(b) | | | (3.23 | )% | | | 5.94 | % | | | 1.94 | %(c) |
| | | | | | | | | | | | | |
Ratios/Supplemental Data: | | | | | | | | | | | | |
Net assets, end of period (000 omitted) | | $ | 59,728 | | | $ | 60,294 | | | $ | 50,621 | |
Ratio of net expenses to average net assets | | | 1.41 | % | | | 1.44 | % | | | 1.56 | %(d) |
Ratio of net investment income to average net assets | | | 0.90 | % | | | 1.55 | % | | | 0.49 | %(d) |
Portfolio turnover rate | | | 121 | % | | | 163 | % | | | 113 | %(c) |
(a) | For the period December 21, 2016 (commencement of operations) to August 31, 2017. |
(b) | Total return in the above table represents the rate that the investor would have earned or lost on an investment in the Fund, assuming reinvestment of distributions. |
12 | See accompanying notes which are an integral part of these financial statements. | |
Hedeker Strategic Appreciation Fund
Notes to the Financial Statements
August 31, 2019
NOTE 1. ORGANIZATION
The Hedeker Strategic Appreciation Fund (the “Fund”) was organized as a non-diversified series of Capitol Series Trust (the “Trust”) on December 15, 2016. The Fund subsequently became and now operates as a diversified series of the Trust. The Trust is an open-end investment company established under the laws of Ohio by an Agreement and Declaration of Trust dated September 18, 2013 (the “Trust Agreement”). The Trust Agreement permits the Board of Trustees of the Trust (the “Board”) to issue an unlimited number of shares of beneficial interest of separate series without par value. The Fund is one of a series of funds currently authorized by the Board. The Fund’s investment adviser is Hedeker Wealth LLC (the “Adviser”). The investment objective of the Fund is to seek superior risk-adjusted returns over a market cycle.
The Fund currently offers one class of shares, Institutional Shares. The Fund commenced operations on December 21, 2016. Each share represents an equal proportionate interest in the assets and liabilities belonging to the Fund and is entitled to such dividends and distributions out of income belonging to the Fund as are declared by the Board.
NOTE 2. SIGNIFICANT ACCOUNTING POLICIES
The Fund is an investment company and follows accounting and reporting guidance under Financial Accounting Standards Board Accounting Standards Codification (“ASC”) Topic 946, “Financial Services-Investment Companies”. The following is a summary of significant accounting policies followed by the Fund in the preparation of its financial statements. These policies are in conformity with generally accepted accounting principles in the United States of America (“GAAP”).
Estimates – The preparation of financial statements in conformity with GAAP requires management to make estimates and assumptions that affect the reported amounts of assets and liabilities and disclosure of contingent assets and liabilities at the date of the financial statements and the reported amounts of increases and decreases in net assets from operations during the reporting period. Actual results could differ from those estimates.
Foreign Currency Translation – The accounting records of the Fund are maintained in U.S. dollars. Foreign currency amounts are translated into U.S. dollars at the current rate of exchange each business day to determine the value of investments, and other assets and liabilities. Purchases and sales of foreign securities, and income and expenses, are translated at the prevailing rate of exchange on the respective date of these transactions. The Fund does not isolate that portion of the results of operations resulting from changes in foreign exchange rates on investments from fluctuation arising from changes in market prices of securities held. These fluctuations are included with the unrealized gain or loss from investments.
Federal Income Taxes – The Fund makes no provision for federal income or excise tax. The Fund intends to qualify as a regulated investment company (“RIC”) under subchapter M of the Internal Revenue Code of 1986, as amended, by complying with the requirements applicable to RICs and by distributing substantially all of its taxable income. The Fund also intends to distribute sufficient net investment income and net realized capital gains, if any, so that it will not be subject to excise tax on undistributed income and gains. If the required amount of net investment income or gains is not distributed, the Fund could incur a tax expense.
13
Hedeker Strategic Appreciation Fund
Notes to the Financial Statements (continued)
August 31, 2019
The Fund may be subject to taxes imposed by countries in which it invests. Such taxes are generally based on income and/or capital gains earned or repatriated. Taxes are accrued and applied to net investment income, net realized gains and unrealized appreciation as such income and/or gains are earned.
The Fund recognizes tax benefits or expenses of uncertain tax positions only when the position is “more likely than not” to be sustained assuming examination by tax authorities. Management of the Fund has reviewed tax positions taken in tax years that remain subject to examination by all major tax jurisdictions, including federal (i.e., the previous three tax year ends and the interim tax period since then, as applicable) and has concluded that no provision for unrecognized tax benefits or expenses is required in these financial statements and does not expect this to change over the next twelve months. The Fund recognizes interest and penalties, if any, related to unrecognized tax benefits as income tax expense in the Statement of Operations. During the fiscal year ended August 31, 2019, the Fund did not incur any interest or penalties.
Expenses – Expenses incurred by the Trust that do not relate to a specific fund of the Trust are allocated to the individual funds based on each fund’s relative net assets or another appropriate basis (as determined by the Board).
Security Transactions and Related Income – Throughout the reporting period, security transactions are accounted for no later than one business day following the trade date. For financial reporting purposes, security transactions are accounted for on trade date on the last business day of the reporting period. The specific identification method is used for determining gains or losses for financial statements and income tax purposes. Dividend income is recorded on the ex-dividend date. Interest income is recorded on an accrual basis and includes, where applicable, the amortization of premium or accretion of discount. Discounts and premiums on fixed income securities are accreted or amortized over the life of the respective securities using the effective interest method.
Dividends and Distributions – The Fund intends to distribute its net investment income and net realized long-term and short-term capital gains, if any, at least annually. Dividends and distributions to shareholders, which are determined in accordance with income tax regulations, are recorded on the ex-dividend date. The treatment for financial reporting purposes of distributions made to shareholders during the period from net investment income or net realized capital gains may differ from their ultimate treatment for federal income tax purposes. These differences are caused primarily by differences in the timing of the recognition of certain components of income, expense or realized capital gain for federal income tax purposes. Where such differences are permanent in nature, they are reclassified among the components of net assets based on their ultimate characterization for federal income tax purposes. Any such reclassifications will have no effect on net assets, results of operations or net asset value (“NAV”) per share of the Fund. For the fiscal year ended August 31, 2019, the Fund did not have any reclassifications of net assets.
Restricted and Illiquid Securities – Restricted securities are any securities which are subject to restriction on resale under federal securities law, including commercial paper issued in reliance on the exemption from registration afforded by Section 4(2) of the Securities Act of 1933 (“1933 Act”), loan participations and interests in investment companies that are not registered under the Investment Company Act of 1940 (“1940 Act”) (each a “Private Fund”). Illiquid securities are those that may not
14
Hedeker Strategic Appreciation Fund
Notes to the Financial Statements (continued)
August 31, 2019
reasonably be expected to be sold or disposed of in current market conditions in seven calendar days or less without the conversion to cash significantly changing the market value of the investment. The Fund intends to treat interests in Private Funds as illiquid securities. The Fund will not invest greater than 15% of its net assets in illiquid securities.
As of August 31, 2019, the Fund held illiquid securities representing 2.97% of net assets.
NOTE 3. SECURITIES VALUATION AND FAIR VALUE MEASUREMENTS
Fair value is defined as the price that the Fund would receive upon selling an investment in a timely transaction to an independent buyer in the principal or most advantageous market of the investment. GAAP establishes a three-tier hierarchy to maximize the use of observable market data and minimize the use of unobservable inputs and to establish classification of fair value measurements for disclosure purposes.
Inputs refer broadly to the assumptions that market participants would use in pricing the asset or liability, including assumptions about risk (the risk inherent in a particular valuation technique used to measure fair value including a pricing model and/or the risk inherent in the inputs to the valuation technique). Inputs may be observable or unobservable. Observable inputs are inputs that reflect the assumptions market participants would use in pricing the asset or liability developed based on market data obtained and available from sources independent of the reporting entity. Unobservable inputs are inputs that reflect the reporting entity’s own assumptions about the assumptions market participants would use in pricing the asset or liability developed based on the best information available in the circumstances.
Various inputs are used in determining the value of the Fund’s investments. These inputs are summarized in the three broad levels listed below.
| | ● | Level 1 – unadjusted quoted prices in active markets for identical investments and/or registered investment companies where the value per share is determined and published and is the basis for current transactions for identical assets or liabilities at the valuation date |
| | ● | Level 2 – other significant observable inputs (including, but not limited to, quoted prices for an identical security in an inactive market, quoted prices for similar securities, interest rates, prepayment speeds, credit risk, etc.) |
| | ● | Level 3 – significant unobservable inputs (including the Fund’s own assumptions in determining fair value of investments based on the best information available) |
The inputs used to measure fair value may fall into different levels of the fair value hierarchy. In such cases, for disclosure purposes, the level in the fair value hierarchy which is reported, is determined based on the lowest level input that is significant to the fair value measurement in its entirety.
In computing the NAV of the Fund, fair value is based on market valuations with respect to portfolio securities for which market quotations are readily available. Pursuant to Board approved policies, the Fund relies on independent third-party pricing services to provide the current market value of securities. Those pricing services value equity securities, including exchange-traded funds, exchange-traded notes, closed-end funds and preferred stocks, traded on a securities exchange at
15
Hedeker Strategic Appreciation Fund
Notes to the Financial Statements (continued)
August 31, 2019
the last reported sales price on the principal exchange. Equity securities quoted by NASDAQ are valued at the NASDAQ Official Closing Price. If there is no reported sale on the principal exchange, equity securities are valued at the mean between the most recent quoted bid and asked price. When using the market quotations or close prices provided by the pricing service and when the market is considered active, the security will be classified as a Level 1 security. Investments in open-end mutual funds, including money market mutual funds, are generally priced at the ending NAV provided by the pricing service of the funds and are generally categorized as Level 1 securities. Debt securities are valued using evaluated prices furnished by a pricing vendor selected by the Board and are generally classified as Level 2 securities.
In the event that market quotations are not readily available, the Adviser determines that the market quotation or the price provided by the pricing service does not accurately reflect the current fair value, or certain restricted or illiquid securities are being valued, such securities are valued as determined in good faith by the Trust’s Valuation Committee, based on recommendations from a pricing committee comprised of various officers of the Trust, various employees of the Fund’s administrator, and representatives of the Adviser (together the “Pricing Review Committee”). These securities will be classified as Level 2 or 3 within the fair value hierarchy, depending on the inputs used.
In accordance with the Trust’s Portfolio Valuation Procedures, the Pricing Review Committee, in making its recommendations, is required to consider all appropriate factors relevant to the value of securities for which it has determined other pricing sources are not available or reliable as described above. No single standard exists for determining fair value, because fair value depends upon the circumstances of each individual case. As a general principle, the current fair value of an issue of securities being valued pursuant to the Trust’s Fair Value Guidelines would be the amount which the Fund might reasonably expect to receive for them upon their current sale. Methods which are in accordance with this principle may, for example, be based on (i) a multiple of earnings; (ii) a discount from market prices of a similar freely traded security (including a derivative security or a basket of securities traded on other markets, exchanges or among dealers); or (iii) yield to maturity with respect to debt issues, or a combination of these and other methods. Fair value pricing is permitted if, in accordance with the Trust’s Portfolio Valuation Procedures, the validity of market quotations appears to be questionable based on factors such as evidence of a thin market in the security based on a small number of quotations, a significant event occurs after the close of a market but before the Fund’s NAV calculation that may affect a security’s value, or other data calls into question the reliability of market quotations.
The following is a summary of the inputs used to value the Fund’s investments as of August 31, 2019:
| | | Valuation Inputs | | | | | |
Assets (a) | | Level 1 | | | Level 2 | | | Level 3 | | | Total | |
Convertible Corporate Bonds | | $ | — | | | $ | 55,751,275 | | | $ | — | | | $ | 55,751,275 | |
Convertible Preferred Stocks | | | 3,412,628 | | | | — | | | | — | | | | 3,412,628 | |
Money Market Funds | | | 789,715 | | | | — | | | | — | | | | 789,715 | |
Total | | $ | 4,202,343 | | | $ | 55,751,275 | | | $ | — | | | $ | 59,953,618 | |
(a) | Refer to Schedule of Investments for sector classifications. |
16
Hedeker Strategic Appreciation Fund
Notes to the Financial Statements (continued)
August 31, 2019
The Fund did not hold any investments at the end of the reporting period in which significant unobservable inputs (Level 3) were used in determining fair value; therefore, no reconciliation of Level 3 securities is included for this reporting period. The Fund did not hold any derivative instruments during the reporting period.
NOTE 4. FEES AND OTHER TRANSACTIONS WITH AFFILIATES AND OTHER SERVICE PROVIDERS
Under the terms of the investment advisory agreement (the “Agreement”), the Adviser manages the Fund’s investments subject to approval of the Board. As compensation for its management services, the Fund is obligated to pay the Adviser a fee computed and accrued daily and paid monthly at an annual rate of 1.00% of the Fund’s average daily net assets. For the fiscal year ended August 31, 2019, the Adviser earned fees of $599,548 from the Fund. At August 31, 2019, the Fund owed the Adviser $53,850, in accordance with the expense limitation agreement described in the next paragraph.
The Adviser has contractually agreed to waive its management fee and/or reimburse expenses so that total annual operating expenses (excluding (i) interest; (ii) taxes; (iii) brokerage fees and commissions; (iv) other extraordinary expenses not incurred in the ordinary course of the Fund’s business; (v) dividend expenses on short sales; and (vi) indirect expenses such as acquired fund fees and expenses) and expenses) do not exceed 1.75% of the Fund’s Institutional Shares average daily net assets through December 31, 2019 (“Expense Limitation”). During any fiscal year that the Agreement between the Adviser and the Trust is in effect, the Adviser may recoup the sum of all fees previously waived or expenses reimbursed, less any reimbursement previously paid, provided that the Adviser is only permitted to recoup fees or expenses within 36 months from the date the fee waiver or expense reimbursement first occurred and provided further that such recoupment can be achieved within the Expense Limitation Agreement currently in effect and the Expense Limitation Agreement in place when the waiver/reimbursement occurred. The Expense Limitation Agreement may not be terminated by the Adviser prior to its expiration date, but the Board may terminate such agreement at any time. The Expense Limitation terminates automatically upon the termination of the Agreement with the Adviser. For the fiscal year ended August 31, 2019, the Adviser did not waive any fees in the Fund.
The Trust retains Ultimus Fund Solutions, LLC (the “Administrator”) to provide the Fund with administration, compliance, fund accounting and transfer agent services, including all regulatory reporting. For the fiscal year ended August 31, 2019, the Administrator earned fees of $60,061 for administration services, $6,000 for compliance services, $37,156 for fund accounting services, and $12,000 for transfer agent services. At August 31, 2019, the Fund owed the Administrator $9,979 for such services.
The Board supervises the business activities of the Trust. Each Trustee serves as a Trustee for the lifetime of the Trust or until the earlier of his or her retirement as a Trustee at age 78 (which may be extended for up to two years in an emeritus non-voting capacity at the pleasure and request of the Board), or until he/she dies, resigns, or is removed, whichever is sooner. “Independent Trustees,” meaning those Trustees who are not “interested persons” as defined in the Investment Company Act of 1940 (“1940 Act”) of the Trust, each receives an annual retainer of $500 per Fund and $500 per Fund for each quarterly in-person Board meeting. In addition, the Trust reimburses Trustees for out-of-pocket expense incurred in conjunction with attendance at Board meetings.
17
Hedeker Strategic Appreciation Fund
Notes to the Financial Statements (continued)
August 31, 2019
The officers and one Trustee of the Trust are employees of the Administrator. Ultimus Fund Distributors, LLC (the “Distributor”) acts as the principal distributor of the Fund’s shares. The Distributor is a wholly-owned subsidiary of the Administrator.
NOTE 5. PURCHASES AND SALES OF SECURITIES
For the fiscal year ended August 31, 2019, purchases and sales of investment securities, other than short-term investments, were $63,736,437 and $63,184,153, respectively.
There were no purchases or sales of long-term U.S. government obligations during the fiscal year ended August 31, 2019.
NOTE 6. LINE OF CREDIT
During the year ended August 31, 2019, the Trust, on behalf of the Fund, entered into in a short-term credit agreement (“Line of Credit”) with Huntington National Bank (“Huntington”), expiring on March 15, 2020. Under the terms of the agreement, the Fund may borrow up to the lesser of 30% of the Fund’s daily market value or $5 million at an interest rate equal to the London Interbank Offered Rate (“LIBOR”) plus 137.50 basis points. Prior to August 12, 2019, the terms of the agreement allowed the Fund to borrow up to the lesser of 30% of the Fund’s daily market value or $10 million at an interest rate equal to the London Interbank Offered Rate (“LIBOR”) plus 137.50 basis points. The purpose of the agreement is to meet temporary or emergency cash needs, including redemption requests that might otherwise require the untimely disposition of securities. Huntington receives an annual facility fee of 0.125% on $5 million as well as an additional annual fee of 0.125% on any unused portion of the credit facility, invoiced quarterly, for providing the Line of Credit. The Fund will not borrow money, except (a) from a bank, provided that immediately after such borrowing there is an asset coverage of 300% for all borrowings of the Fund; or (b) from a bank or other persons for temporary purposes only, provided that such temporary borrowings are in an amount not exceeding 5% of the Fund’s total assets at the time when the borrowing is made. To the extent that the line of credit is utilized, it will be collateralized by securities in the Fund’s portfolio. As of and during the year ended August 31, 2019, the Fund had no outstanding borrowings under this Line of Credit.
NOTE 7. FEDERAL TAX INFORMATION
At August 31, 2019, the net unrealized appreciation (depreciation) of investments for tax purposes was as follows:
Gross unrealized appreciation | | $ | 1,377,690 | |
Gross unrealized depreciation | | | (1,311,287 | ) |
Net unrealized appreciation on investments | | $ | 66,403 | |
Tax cost of investments | | $ | 59,887,215 | |
18
Hedeker Strategic Appreciation Fund
Notes to the Financial Statements (continued)
August 31, 2019
The tax character of distributions paid for the fiscal years ended August 31, 2019 and August 31, 2018 were as follows:
| | 2019 | | | 2018 | |
Distributions paid from: | | | | | | | | |
Ordinary income | | $ | 1,776,026 | | | $ | 2,043,554 | |
Total distributions paid | | $ | 1,776,026 | | | $ | 2,043,554 | |
At August 31, 2019, the components of distributable earnings (accumulated losses) on a tax basis were as follows:
Undistributed ordinary income | | $ | 351,316 | |
Accumulated capital and other losses | | | (2,235,352 | ) |
Unrealized appreciation on investments (a) | | | 66,403 | |
Total accumulated deficit | | $ | (1,817,633 | ) |
(a) | The difference between book basis and tax basis unrealized appreciation (depreciation) is primarily attributable to the tax deferral of wash sales, interest accruals and deemed dividends from convertible bonds. |
As of August 31, 2019, the Fund had available for tax purposes unused capital loss carryforwards of $675,566 and $1,559,786, respectively, of short-term and long-term capital losses with no expiration, which is available to offset against future taxable net capital gains. To the extent that these carryforwards are used to offset future gains, it is probable that the amount offset will not be distributed to shareholders.
NOTE 8. SECTOR RISK
If the Fund has significant investments in the securities of issuers within a particular sector, any development affecting that sector will have a greater impact on the value of the net assets of the Fund than would be the case if the Fund did not have significant investments in that sector. In addition, this may increase the risk of loss in the Fund and increase the volatility of the Fund’s NAV per share. For instance, economic or market factors, regulatory changes or other developments may negatively impact all companies in a particular sector, and therefore the value of the Fund’s portfolio will be adversely affected. As of August 31, 2019, the Fund had 29.96% of the value of their net assets invested in securities within the Information Technology sector.
NOTE 9. COMMITMENTS AND CONTINGENCIES
The Trust indemnifies its officers and Trustees for certain liabilities that may arise from their performance of their duties to the Trust or the Fund. Additionally, in the normal course of business, the Trust enters into contracts that contain a variety of representations and warranties which provide general indemnifications. The Trust’s maximum exposure under these arrangements is unknown, as this would involve future claims that may be made against the Trust that have not yet occurred.
19
Hedeker Strategic Appreciation Fund
Notes to the Financial Statements (continued)
August 31, 2019
NOTE 10. RECENT ACCOUNTING PRONOUNCEMENTS
In August 2018, the Financial Accounting Standards Board (“FASB”) issued Accounting Standards Update (“ASU”) 2018-13, which changes the fair value measurement disclosure requirements of FASB Accounting Standards Codification Topic 820, Fair Value Measurement. The update to Topic 820 includes new, eliminated, and modified disclosure requirements. ASU 2018-13 is effective for fiscal years beginning after December 15, 2019, including interim periods, although early adoption is permitted. Management has evaluated the implications of certain provisions of ASU 2018-13 and has determined to early adopt all aspects related to the removal and modification of certain fair value measurement disclosures under the ASU effective immediately. The impact of the adoption was not material to the Fund’s financial statements.
NOTE 11. SUBSEQUENT EVENTS
Management of the Fund has evaluated the need for disclosures and/or adjustments resulting from subsequent events through the date at which these financial statements were issued. Based upon this evaluation, management has determined there were no items requiring adjustment of the financial statements or additional disclosure.
20
Report of Independent Registered Public Accounting Firm
To the Shareholders and the Board of Trustees of Hedeker Strategic Appreciation Fund
Opinion on the Financial Statements
We have audited the accompanying statement of assets and liabilities of Hedeker Strategic Appreciation Fund (the “Fund”) (one of the funds constituting Capitol Series Trust (the “Trust”)), including the schedule of investments, as of August 31, 2019, and the related statement of operations for the year then ended, the statements of changes in net assets for each of the two years in the period then ended, the financial highlights for each of the two years in the period ended August 31, 2019 and the period December 21, 2016 (commencement of operations) through August 31, 2017 and the related notes (collectively referred to as the “financial statements”). In our opinion, the financial statements present fairly, in all material respects, the financial position of the Fund (one of the funds constituting Capitol Series Trust) at August 31, 2019, the results of its operations for the year then ended, the changes in its net assets for each of the two years in the period then ended and its financial highlights for each of the two years in the period ended August 31, 2019 and the period December 21, 2016 (commencement of operations) through August 31, 2017, in conformity with U.S. generally accepted accounting principles.
Basis for Opinion
These financial statements are the responsibility of the Trust’s management. Our responsibility is to express an opinion on the Fund’s financial statements based on our audits. We are a public accounting firm registered with the Public Company Accounting Oversight Board (United States) (“PCAOB”) and are required to be independent with respect to the Trust in accordance with the U.S. federal securities laws and the applicable rules and regulations of the Securities and Exchange Commission and the PCAOB.
We conducted our audits in accordance with the standards of the PCAOB. Those standards require that we plan and perform the audit to obtain reasonable assurance about whether the financial statements are free of material misstatement, whether due to error or fraud. The Trust is not required to have, nor were we engaged to perform, an audit of Trust’s internal control over financial reporting. As part of our audits we are required to obtain an understanding of internal control over financial reporting but not for the purpose of expressing an opinion on the effectiveness of the Trust’s internal control over financial reporting. Accordingly, we express no such opinion.
Our audits included performing procedures to assess the risks of material misstatement of the financial statements, whether due to error or fraud, and performing procedures that respond to those risks. Such procedures included examining, on a test basis, evidence regarding the amounts and disclosures in the financial statements. Our procedures included confirmation of securities owned as of August 31, 2019, by correspondence with the custodian and brokers. Our audits also included evaluating the accounting principles used and significant estimates made by management, as well as evaluating the overall presentation of the financial statements. We believe that our audits provide a reasonable basis for our opinion.

We have served as the auditor of one or more Capitol Series Trust investment companies since 2017.
Cincinnati, Ohio
October 29, 2019
21
Summary of Fund Expenses (Unaudited)
As a shareholder of the Fund, you incur two types of costs: (1) transaction and (2) ongoing costs, including management fees and other Fund expenses. These examples are intended to help you understand your ongoing costs (in dollars) of investing in the Fund and to compare these costs with the ongoing costs of investing in other mutual funds. The example is based on an investment of $1,000 invested at the beginning of the period and held for the entire period from March 1, 2019 through August 31, 2019.
Actual Expenses
The first line of the table below provides information about actual account values and actual expenses. You may use the information in this line, together with the amount you invested, to estimate the expenses that you paid over the period. Simply divide your account value by $1,000 (for example, an $8,600 account value divided by $1,000 = 8.6), then multiply the result by the number in the first line under the heading entitled “Expenses Paid During Period” to estimate the expenses you paid on your account during this period.
Hypothetical Example for Comparison Purposes
The second line of the table below provides information about hypothetical account values and hypothetical expenses based on the Fund’s actual expense ratio and an assumed rate of return of 5% per year before expenses, which is not the Fund’s actual return. The hypothetical account values and expenses may not be used to estimate the actual ending account balance or expenses you paid for the period. You may use this information to compare the ongoing costs of investing in the Fund and other funds. To do so, compare this 5% hypothetical example with the 5% hypothetical examples that appear in the shareholder reports of the other funds.
Expenses shown in the table are meant to highlight your ongoing costs only and do not reflect any transactional costs. Therefore, the second line of the table below is useful in comparing ongoing costs only and will not help you determine the relative costs of owning different funds. In addition, if transaction costs were included, your costs would have been higher.
| | Beginning
Account
Value
March 1,
2019 | Ending
Account
Value
August 31,
2019 | Expenses
Paid
During
Period(a) | Annualized
Expense
Ratio |
Hedeker Strategic Appreciation Fund |
Institutional Shares | Actual | $ 1,000.00 | $ 999.90 | $ 7.31 | 1.45% |
| | | | | | |
| | Hypothetical(b) | $ 1,000.00 | $ 1,017.92 | $ 7.37 | 1.45% |
(a) | Expenses are equal to the Fund’s annualized expense ratios, multiplied by the average account value over the period, multiplied by 184/365 (to reflect the one-half year period). |
(b) | Hypothetical assumes 5% annual return before expenses. |
22
Additional Federal Income Tax Information (Unaudited)
The Form 1099-DIV you receive in January 2020 will show the tax status of all distributions paid to your account in calendar year 2019. Shareholders are advised to consult their own tax adviser with respect to the tax consequences of their investment in the Fund. As required by the Internal Revenue Code and/or regulations, shareholders must be notified regarding the status of qualified dividend income for individuals and the dividends received deduction for corporations.
Qualified Dividend Income. The Fund designates approximately6% or up to the maximum amount of such dividends allowable pursuant to the Internal Revenue Code, as qualified dividend income eligible for the reduced tax rate of 15%.
Qualified Business Income. The Fund designates approximately0% of its ordinary income dividends, or up to the maximum amount of such dividends allowable pursuant to the Internal Revenue Code, as qualified business income.
Dividends Received Deduction. Corporate shareholders are generally entitled to take the dividends received deduction on the portion of the Fund’s dividend distribution that qualifies under tax law. For the Fund’s calendar year 2019 ordinary income dividends,6% qualifies for the corporate dividends received deduction.
For the fiscal year ended August 31, 2019, the Fund designated $0 as 20% long-term capital gain distributions.
23
Trustees and Officers (Unaudited)
The Board supervises the business activities of the Trust and is responsible for protecting the interests of shareholders. The Chairman of the Board is Walter B. Grimm, who is an Independent Trustee of the Trust.
Each Trustee serves as a Trustee for the lifetime of the Trust or until the earlier of his or her retirement as a Trustee at age 78, death, resignation or removal. Officers are re-elected annually by the Board. The address of each Trustee and officer is 225 Pictoria Drive, Suite 450, Cincinnati, Ohio 45246.
As of the date of this report, the Trustees oversee the operations of 15 series.
Interested Trustee Background. The following table provides information regarding the Interested Trustee.
Name, Address, (Age), Position with Trust,
Term of Position with Trust | Principal Occupation During Past 5 Years
and Other Directorships |
Robert G. Dorsey* Age: 62 TRUSTEE Began Serving: March 2017 | Principal Occupation(s): Vice Chairman of Ultimus Fund Solutions, LLC and its subsidiaries, except as otherwise noted for the FINRA-regulated broker-dealer entities (February 2019 to present); Interested Trustee of Ultimus Managers Trust (February 2012 to present). Previous Position(s): Managing Director and Co-Chief Executive Officer of Ultimus Fund Solutions, LLC (1999 to February 2019); President of Ultimus Fund Distributors, LLC (1999 to 2018); President of Ultimus Managers Trust (February 2012 to October 2013). |
* | Mr. Dorsey is considered an “interested person” of the Trust within the meaning of Section 2(a)(19) of the 1940 Act because of his relationship with the Trust’s administrator, transfer agent, and distributors. |
Independent Trustee Background. The following table provides information regarding the Independent Trustees.
Name, Address, (Age), Position with Trust,
Term of Position with Trust | Principal Occupation During Past 5 Years
and Other Directorships |
John C. Davis Age: 67 TRUSTEE Began Serving: July 2018 | Principal Occupations(s): Consultant (government services) since May 2011. Previous Position(s): Retired Partner of PricewaterhouseCoopers LLP (1974-2010); Consultant, Board of Trustees of Ultimus Managers Trust (2016 to 2019) and Former Trustee of Ultimus Managers Trust (2012 to 2016). |
24
Trustees and Officers (Unaudited) (continued)
Name, Address, (Age), Position with Trust,
Term of Position with Trust | Principal Occupation During Past 5 Years
and Other Directorships |
Walter B. Grimm Age: 74 TRUSTEE AND CHAIR Began Serving: November 2013 | Principal Occupations(s): President, Leigh Management Group, LLC (consulting firm) (October 2005 to present); and President, Leigh Investments, Inc. (1988 to present). Previous Position(s): Chief Financial Officer, East West Private, LLC (consulting firm) (2009 to 2013). |
Lori Kaiser Age: 56 TRUSTEE Began Serving: July 2018 | Principal Occupations(s): Founder and CEO, Kaiser Consulting since 1992. |
Janet Smith Meeks Age: 64 TRUSTEE Began Serving: July 2018 | Principal Occupations(s): Co-Founder and CEO, Healthcare Alignment Advisors, LLC (consulting company) since August 2015. Previous Position(s): President and Chief Operating Officer, Mount Carmel St. Ann’s Hospital (2006 to 2015). |
Mary M. Morrow Age: 61 TRUSTEE Began Serving: November 2013 | Principal Occupations(s): Chief Operating Officer, Dignity Health Managed Services Organization (October 2018 to present). Previous Position(s): Consultant (managed care services) (April 2018 to September 2018); Chief Operating Officer, Pennsylvania Health and Wellness (fully owned subsidiary of Centene Corporation) (November 2016 to April 2018); Vice President, Strategic Initiatives, Gateway Heath (January 2015 to November 2016); Consulting Practice Manager, DST Health Solutions (August 2010 to January 2015). |
25
Trustees and Officers (Unaudited) (continued)
Officers. The following table provides information regarding the Officers.
Name, Address, (Age), Position with Trust,
Term of Position with Trust | Principal Occupation During Past 5 Years
and Other Directorships |
Matthew J. Miller Age: 43 PRESIDENT and CHIEF EXECUTIVE OFFICER Began Serving: September 2013 (as VP); September 2018 (as President) | Principal Occupation(s): Assistant Vice President, Relationship Management, Ultimus Fund Solutions, LLC (December 2015 to present); Vice President, Valued Advisers Trust (December 2011 to present). Previous Position(s): Vice President, Capitol Series Trust (September 2013 to March 2017); Chief Executive Officer and President, Capitol Series Trust (March 2017 to March 2018); Secretary, Capitol Series Trust (March 2018 to September 2018); Vice President, Relationship Management, Huntington Asset Services, Inc. (n/k/a Ultimus Asset Services, LLC) (2008 to December 2015); Vice President, The Huntington Funds (February 2010 to April 2015); Vice President, Transfer Agency Operations, Huntington Asset Services, Inc. (2002 to 2008); Employed in various positions with Huntington Asset Services, Inc. (July 1998 to 2002). |
Zachary P. Richmond Age: 39 TREASURER AND CHIEF FINANCIAL OFFICER Began Serving: August 2014 | Principal Occupation(s): Vice President, Director of Financial Administration for Ultimus Fund Solutions, LLC (February 2019 to present); Treasurer and Chief Financial Officer of Unified Series Trust (November 2014 to present); Treasurer and Chief Financial Officer of Commonwealth International Series Trust (September 2015 to present); Treasurer of Oak Associates Funds (April 2019 to present); Treasurer of Centaur Mutual Funds Trust (April 2019 to present). Previous Position(s): Assistant Vice President, Associate Director of Financial Administration for Ultimus Fund Solutions, LLC (December 2015 to February 2019); Manager, Fund Administration, Huntington Asset Services, Inc. (January 2011 to December 2015); Interim Treasurer and Chief Financial Officer of Unified Series Trust (August 2014 to November 2014); Assistant Treasurer of Unified Series Trust (May 2011 to August 2014). |
26
Trustees and Officers (Unaudited) (continued)
Name, Address, (Age), Position with Trust,
Term of Position with Trust | Principal Occupation During Past 5 Years
and Other Directorships |
Martin R. Dean Age: 55 INTERIM CHIEF COMPLIANCE OFFICER Began Serving: May 2019 | Principal Occupation(s): Vice President, Director of Fund Compliance, Ultimus Fund Solutions, LLC (since January 2016), Chief Compliance Officer, First Western Funds Trust (since April 2016); Chief Compliance Officer, Cross Shore Discovery Fund (since June 2016); Chief Compliance Officer, FSI Low Beta Absolute Return Fund (since November 2016); Chief Compliance Officer, Peachtree Alternative Strategies Fund (since January 2017); Chief Compliance Officer, Dupree Mutual Funds (since August 2017); Interim Chief Compliance Officer, Valued Advisers Trust (since May 2019); and Chief Compliance Officer, Fenimore Asset Management Trust (since May 2019). Previous Position(s): Senior Vice President and Compliance Group Manager, Huntington Asset Services, Inc. (July 2013 to December 2015); Director of Fund Accounting and Fund Administration Product, Citi Fund Services (January 2008 to June 2013). |
Other Information (Unaudited)
The Fund’s Statement of Additional Information (“SAI”) includes additional information about the trustees and is available without charge, upon request. You may call toll-free at (800) 657-4450 to request a copy of the SAI or to make shareholder inquiries.
27
FACTS | WHAT DOES CAPITOL SERIES TRUST DO WITH YOUR PERSONAL INFORMATION? |
| | |
Why? | Financial companies choose how they share your personal information. Federal law gives consumers the right to limit some but not all sharing. Federal law also requires us to tell you how we collect, share, and protect your personal information. Please read this notice carefully to understand what we do. |
| | |
What? | The types of personal information we collect and share depend on the product or service you have with us. This information can include: ■ Social Security number ■ account balances and account transactions ■ transactions or loss history and purchase history ■ checking account information and wire transfer instructions When you are no longer our customer, we continue to share your information as described in this notice. |
| | |
How? | All financial companies need to share customers’ personal information to run their everyday business. In the section below, we list the reasons financial companies can share their customers’ personal information; the reasons Capitol Series Trust chooses to share; and whether you can limit this sharing. |
| | |
Reasons we can share your personal information | Does Capitol Series
Trust share? |
For our everyday business purposes—
such as to process your transactions, maintain your account(s), respond to court orders and legal investigations, or report to credit bureaus | Yes |
For our marketing purposes—
to offer our products and services to you | Yes |
For joint marketing with other financial companies | No |
For our affiliates’ everyday business purposes—
information about your transactions and experiences | No |
For our affiliates’ everyday business purposes—
information about your creditworthiness | No |
For nonaffiliates to market to you | No |
| | |
Questions? | Call (800) 657-4450 |
28
Who we are |
Who is providing this notice? | Capitol Series Trust |
What we do |
How does Capitol Series Trust protect my personal information? | To protect your personal information from unauthorized access and use, we use security measures that comply with federal law. These measures include computer safeguards and secured files and buildings. |
How does Capitol Series Trust collect my personal information? | We collect your personal information, for example, when you ■ open an account or deposit money ■ buy securities from us or sell securities to us ■ make deposits or withdrawals from your account provide account information ■ give us your account information ■ make a wire transfer ■ tell us who receives the money ■ tell us where to send the money ■ show your government-issued ID ■ show your driver’s license |
Why can’t I limit all sharing? | Federal law gives you the right to limit only ■ sharing for affiliates’ everyday business purposes — information about your creditworthiness ■ affiliates from using your information to market to you ■ sharing for nonaffiliates to market to you State laws and individual companies may give you additional rights to limit sharing. |
Definitions |
Affiliates | Companies related by common ownership or control. They can be financial and nonfinancial companies. |
Nonaffiliates | Companies not related by common ownership or control. They can be financial and nonfinancial companies. ■ Capitol Series Trust does not share your personal information with nonaffiliates so they can market to you. |
Joint marketing | A formal agreement between nonaffiliated financial companies that together market financial products or services to you. ■ Capitol Series Trust doesn’t jointly market financial products or services to you. |
29
PROXY VOTING (Unaudited)
A description of the policies and procedures that the Fund uses to determine how to vote proxies relating to portfolio securities and information regarding how the Fund voted those proxies during the most recent twelve month period ended June 30 are available (1) without charge upon request by calling the Fund at (800) 657-4450 and (2) in Fund documents filed with the Securities and Exchange Commission (“SEC”) on the SEC’s website at www.sec.gov.
TRUSTEES
Walter B. Grimm, Chairman
John C. Davis
Robert G. Dorsey
Lori Kaiser
Janet Smith Meeks
Mary M. Morrow
OFFICERS
Matthew J. Miller, Chief Executive Officer and President
Zachary P. Richmond, Chief Financial Officer and Treasurer
Martin R. Dean, Interim Chief Compliance Officer
INVESTMENT ADVISER
Hedeker Wealth LLC
One Overlook Point, Suite 610
Lincolnshire, IL 60069
DISTRIBUTOR
Ultimus Fund Distributors, LLC
225 Pictoria Drive, Suite 450
Cincinnati, OH 45246
INDEPENDENT REGISTERED PUBLIC ACCOUNTING FIRM
Ernst & Young LLP
221 East 4th Street, Suite 2900
Cincinnati, OH 45202
LEGAL COUNSEL
Bernstein Shur
100 Middle Street, 6th Floor
Portland, ME 04104
CUSTODIAN
Huntington National Bank
41 South High Street
Columbus, OH 43215
ADMINISTRATOR, TRANSFER AGENT AND FUND ACCOUNTANT
Ultimus Fund Solutions, LLC
225 Pictoria Drive, Suite 450
Cincinnati, OH 45246
This report is intended only for the information of shareholders or those who have received the Fund’s prospectus which contains information about the Fund’s management fee and expenses. Please read the prospectus carefully before investing.
Distributed by Ultimus Fund Distributors, LLC
Member FINRA/SIPC
MESSAGE FROM THE CHIEF INVESTMENT OFFICER – (Unaudited)
At Meritage, we are value-driven investors. We buy stock in businesses when i) they score well in our comprehensive stock-ranking process (universe is global, all-cap and about 6,500 securities), and ii) they are selling for less than we believe they are worth. Our value discipline is intended to provide a margin of safety and is one of our primary risk management tools, along with managing position sizes and diversification.
Dear Fellow Shareholders:
During the six months ended August 31, 2019, since our semi-annual report of February 28, 2019, we have continued to see periods of high volatility within the equity markets. Stocks have recovered significantly from the recession fears of December 2018 and market indices have reach new highs in 2019. The improved outlook has been largely driven by renewed confidence that the Fed will have the capability to keep the U.S. economy out of recession. While our internal, independent macro analysis has not given any signals that a recession is imminent, we do take notice that economic growth and corporate sales and earnings growth are slowing and cyclical risk indicators are rising. We think some measure of caution remains appropriate around the equity markets.
For the fiscal year ended August 31, 2019, the broad market, as represented by the S&P 500, was up 2.92%. During the six months ended August 31, 2019, the S&P 500 was up 6.15%. Growth strategies have fared better than Value and Yield strategies again, as they have for a number of years, and non-U.S. stocks have lagged U.S. stocks.
We attribute our bottom-up value-centric security selection process for generating our strong long-term returns. We continue to refine and improve this process of rigorously searching for attractive mispriced securities, among all capitalization sizes and geographies throughout the world. A specific discussion of each Fund and its performance is included in Management’s Discussion of Fund Performance.
Thank you for your continued trust in us as stewards of your capital. As previously mentioned we have our own money invested alongside yours in each of our funds, and we remain committed to delivering attractive risk-adjusted returns over full market cycles.
Sincerely,
Mark Eveans, CFA
President and Chief Investment Officer
1
MANAGEMENT’S DISCUSSION OF FUND PERFORMANCE – (Unaudited)
Meritage Growth Equity Fund
For the fiscal year ended August 31, 2019, the Meritage Growth Equity Fund Institutional Class and Investor Class were down (0.24)% and (0.50)% respectively. These returns trailed those provided by the broad equity market (as represented by the S&P 500) and trailed the Fund’s primary benchmark, the Russell 1000 Growth Index, which gained 4.27%, and the Lipper Large Cap Growth Index which gained 4.32% during the same time frame.
For the six-month period ended August 31, 2019, the Meritage Growth Equity Fund Institutional Class and Investor Class returned 5.78% and 5.64%, respectively. The Fund’s returns trailed its primary benchmark, the Russell 1000 Growth Index, and the Lipper Large Cap Growth Index, which returned 9.20% and 7.59%, respectively, during the same time frame.
Communication Services and Information Technology were the best performing sectors, while Materials and Energy were the weakest sectors for the fiscal year ended August 31, 2019. From an attribution standpoint, the Fund’s performance benefited positively over the course of the last year with strong stock selection in the Communication Services and Information Technology sectors. An underweight to the Energy sector and an overweight to the Information Technology sector as compared to the benchmark were also positive impacts on performance. Stock selection within the Health Care and Consumer Discretionary sectors detracted from relative performance, along with cash holdings.
Regarding specific issues, the strongest gainers for the fiscal year were Hershey Company, up 51.4%, CyberArk Software Ltd, up 49.7%, and VMware Inc. Class A, up 45.9%.
The poorest performers for the fiscal year were Lumentum Holdings, down 43.9%, Align Technology Inc. down 39.3% and National Beverage Corp., down 35.7%.
Because we are a value-centric and process-driven Growth manager, most sector differences as compared to the benchmark are a result of either an under or overweight of specific, bottom-up, attractively valued growth opportunities identified by our process, within that particular sector.
We expect a continuation of low interest rates and below average economic growth for the world’s leading economies. We believe many investors share our view but have nevertheless, been willing to pay an excessive premium for well-known growth stocks. This is where we part company with the crowd, however, as we expect the value discipline embedded in our growth approach will yield better results over full market cycles.
Meritage Value Equity Fund
For the fiscal year ended August 31, 2019, the Meritage Value Equity Fund Institutional Class was down (6.90)%. This return lagged both the Russell 1000 Value Index benchmark, which returned a positive 0.62%, and the Lipper Large Cap Value Index which was down (0.58)%.
For the six months ended August 31, 2019, the Meritage Value Equity Fund Institutional Class had a negative return of (2.01)%, and lagged the Russell 1000 Value Index benchmark, which returned a positive 2.27% during the same time frame, as well as the Lipper Large Cap Value Index, which returned a positive 1.60%.
Consumer Discretionary and Utilities were the strongest performing sectors for the fiscal year, while Materials and Energy were the weakest performing sectors. From an attribution standpoint, positives included underweight sector allocation influences as compared to the benchmark for the Materials sector, as well as strong stock selection within the Consumer Discretionary sector. Subpar security selection in the Financials, Health Care and Information Technology sectors detracted from performance.
2
MANAGEMENT’S DISCUSSION OF FUND PERFORMANCE – (Unaudited) (continued)
Regarding individual issues, the strongest gainers for the fiscal year were Dollar General Corp., up 46.4%, AutoZone Inc., up 43.7%, and CDW Corp., up 33.5%.
The poorest performers for the fiscal year were Biogen Inc., down 33.3% Husky Energy, down 27.8%, and State Street Corp., down 27.4%.
As a value-centric and process driven manager, most sector differences as compared to the benchmark were the result of either an under or overweight of specific bottom-up valuation opportunities identified by our process.
We expect a continuation of low interest rates and below average economic growth for the world’s leading economies. We believe many investors share our view but have correspondingly been willing to pay an excessive premium for well-known stocks. This is where we part company with the crowd, however, as we expect the discipline embedded in our value approach will yield better results over full market cycles.
Meritage Yield-Focus Equity Fund
For the fiscal year ended August 31, 2019, the Meritage Yield-Focus Equity Fund Institutional Class and Investor Class were down (4.16)% and (4.45)% respectively. The Zacks Multi-Asset Income Index, which has specific asset structure and distinguished dividend yield characteristics somewhat similar to the Fund, was down (1.52)% during the same period.
For the six months ended August 31, 2019, the Meritage Yield-Focus Equity Fund Institutional Class and Investor Class were down (3.37)% and (3.54)% respectively. The Zacks Multi-Asset Income Index had a negative return of (0.72)% during the same time.
A founding premise of the Yield-Focus Equity Fund is to earn 50-75% of the expected long-term equity return in the form of cash dividends and distributions. The Fund invests in six key types of equity asset classes – common stocks, master limited partnerships, other limited partnerships, real estate investment trusts, business development companies, convertible preferred stocks and, in rare situations, straight preferred stocks. The Meritage comprehensive security selection process searches globally for attractive yield franchises.
Regarding asset class performance, REITs had the strongest relative performance for the fiscal year ended August 31, 2019, whereas Convertible Preferred Stocks and Limited Partnerships and Master Limited Partnerships had the lowest contributions to returns. The strongest performing sectors for the fiscal year were Utilities and Health Care, while Materials and Consumer Discretionary were the weakest performing sectors. The Fund’s overweight in the Utilities and Industrials sectors as well as superior stock selection in the Energy sector were positive contributors to performance. Performance was hurt by less favorable stock selection in the Utilities and Consumer Discretionary sectors.
In terms of specific issues, the strongest performers for the fiscal year end were Public Storage, up 36.5%, Merck & Co., Inc., up 29.6% and Target Corp., up 26.6%.
The poorest performers for the fiscal year end were Tenneco Inc. Class A, down 64.3%, Tapestry, Inc., down 44.5% and Designer Brands Inc., down 36.7%.
3
INVESTMENT RESULTS – (Unaudited)
| | Average Annual Total Returns
as of August 31, 2019 (a) | |
| | Fund/Index | 1 Year | 3 Year | 5 Year | Since Inception
(12/23/13) | |
| | Meritage Growth Equity Fund – Institutional Class | (0.24)% | 14.21% | 11.21% | 11.53% | |
| | Meritage Growth Equity Fund – Investor Class | (0.50)% | 13.91% | 10.93% | 11.24% | |
| | Russell 1000 Growth Index (b) | 4.27% | 17.03% | 13.06% | 13.52% | |
| | | | | | | |
| | | Expense Ratios (c) | | | |
| | | Institutional
Class | Investor
Class | | | |
| | Gross | 1.46% | 1.71% | | | |
| | With Applicable Waivers | 1.03% | 1.28% | | | |
The performance quoted represents past performance, which does not guarantee future results. The investment return and principal value of an investment will fluctuate so that an investor’s shares, when redeemed, may be worth more or less than their original cost. The returns shown do not reflect deduction of taxes that a shareholder would pay on Fund distributions or the redemption of Fund shares. The Fund’s investment objectives, risks, charges and expenses must be considered carefully before investing. Current performance of a Fund may be lower or higher than the performance quoted. Performance data current to the most recent month end may be obtained by calling (855) 261-0104.
The performance in the preceding table reflects any fee reductions during the applicable period. If such fee reductions had not occurred, the quoted performance would be lower.
(a) | Return figures reflect any change in price per share and assume the reinvestment of all distributions. |
(b) | The Russell 1000 Growth Index is a widely recognized unmanaged index of equity securities and is representative of a broader domestic equity market and range of securities than is found in the Fund’s portfolio. Individuals cannot invest directly in an index; however, an individual can invest in exchange traded funds or other investment vehicles that attempt to track the performance of a benchmark index. |
(c) | The expense ratios are from the Fund’s most recent prospectus dated December 31, 2018. The Adviser has contractually agreed to waive its management fee and/or reimburse expenses so that total annual operating expenses (excluding (i) interest; (ii) taxes; (iii) brokerage fees and commissions; (iv) other extraordinary expenses not incurred in the ordinary course of the Fund’s business; (v) dividend expenses on short sales; (vi) indirect expenses such as acquired fund fees and expenses; and (vii) expenses incurred under a Rule 12b-1 plan of distribution) do not exceed 1.00% of the Fund’s average daily net assets through December 31, 2019. During any fiscal year that the Investment Advisory Agreement between the Adviser and Capitol Series Trust is in effect, the Adviser may recoup the sum of all fees previously waived or expenses reimbursed, less any reimbursement previously paid, provided that the Adviser is only permitted to recoup fees or expenses within 36 months from the date the fee waiver or expense reimbursement first occurred and provided further that such recoupment can be achieved within the Expense Limitation Agreement currently in effect and the Expense Limitation Agreement in place when the waiver/reimbursement occurred. The Expense Limitation Agreement may not be terminated by the Adviser prior to its expiration date, but the Board may terminate such agreement at any time. The Expense Limitation Agreement terminates automatically upon the termination of the Advisory Agreement with the Adviser. Additional information pertaining to the Fund’s expense ratios as of August 31, 2019 can be found in the financial highlights. The Gross Expense Ratio and Expense Ratio with Applicable Waivers do not correlate to the corresponding ratios of expenses to average net assets included in the Financial Highlights section of this report, which reflect the operating expenses of the Fund and do not include acquired fund fees and expenses (“AFFE”). |
The Fund’s investment objective, strategies, risks, charges and expenses must be considered carefully before investing. The prospectus contains this and other important information about the investment company and may be obtained by calling (855) 261-0104. Please read it carefully before investing.
The Fund is distributed by Unified Financial Securities, LLC, Member FINRA/SIPC.
4
INVESTMENT RESULTS – (Unaudited) (continued)
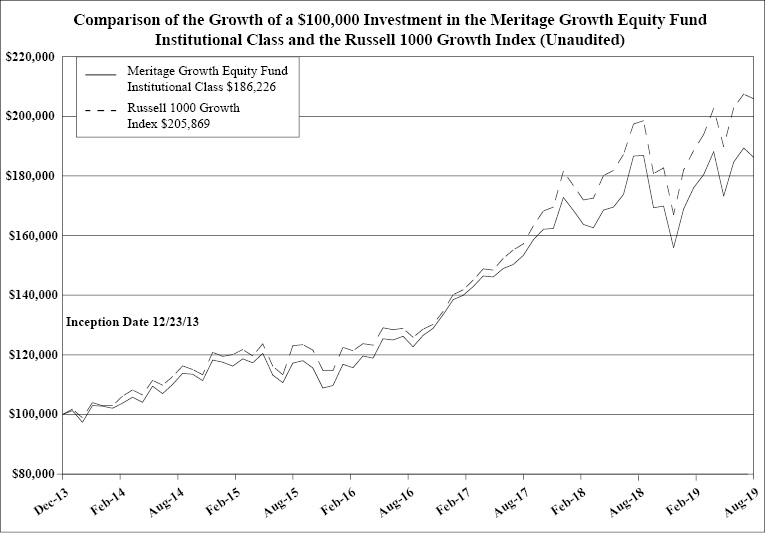
The chart above assumes an initial investment of $100,000 made on December 23, 2013 (commencement of operations) and held through August 31, 2019. THE FUND’S RETURNS REPRESENT PAST PERFORMANCE AND DO NOT GUARANTEE FUTURE RESULTS. The returns shown do not reflect deduction of taxes that a shareholder would pay on the Fund’s distributions or the redemption of the Fund’s shares. Investment returns and principal values will fluctuate so that your shares, when redeemed, may be worth more or less than their original purchase price.
The Russell 1000 Growth Index is a widely recognized unmanaged index of equity securities and is representative of a broader domestic equity market and range of securities than is found in the Fund’s portfolio. Individuals cannot invest directly in an Index; however, an individual can invest in exchange traded funds or other investment vehicles that attempt to track the performance of a benchmark index. The Index returns do not include expenses, which have been deducted from the Fund’s return. These performance figures include the change in value of the stocks in the index plus the reinvestment of dividends and are not annualized. The returns shown do not reflect deduction of taxes that a shareholder would pay on Fund distributions or the redemption of Fund shares.
Current performance may be lower or higher than the performance data quoted. For more information on the Fund, and to obtain performance data current to the most recent month-end, or to request a prospectus, please call (855) 261-0104. You should carefully consider the investment objectives, potential risks, management fees, and charges and expenses of the Fund before investing. The Fund’s prospectus contains this and other information about the Fund, and should be read carefully before investing.
The Fund is distributed by Unified Financial Securities, LLC, member FINRA/SIPC.
5
INVESTMENT RESULTS – (Unaudited) (continued)
| | Average Annual Total Returns
as of August 31, 2019 (a) | |
| | Fund/Index | 1 Year | 3 Year | 5 Year | Since Inception
(12/23/13) | |
| | Meritage Value Equity Fund – Institutional Class | (6.90)% | 5.34% | 3.74% | 5.02% | |
| | Russell 1000 Value Index (b) | 0.62% | 8.08% | 6.59% | 7.92% | |
| | | | | | | |
| | | Expense Ratios (c) | | | | |
| | | Institutional
Class | | | | |
| | Gross | 1.61% | | | | |
| | With Applicable Waivers | 1.04% | | | | |
The performance quoted represents past performance, which does not guarantee future results. The investment return and principal value of an investment will fluctuate so that an investor’s shares, when redeemed, may be worth more or less than their original cost. The returns shown do not reflect deduction of taxes that a shareholder would pay on Fund distributions or the redemption of Fund shares. The Fund’s investment objectives, risks, charges and expenses must be considered carefully before investing. Current performance of a Fund may be lower or higher than the performance quoted. Performance data current to the most recent month end may be obtained by calling (855) 261-0104.
The performance in the preceding table reflects any fee reductions during the applicable period. If such fee reductions had not occurred, the quoted performance would be lower.
(a) | Return figures reflect any change in price per share and assume the reinvestment of all distributions. |
(b) | The Russell 1000 Value Index is a widely recognized unmanaged index of equity securities and is representative of a broader domestic equity market and range of securities than is found in the Fund’s portfolio. Individuals cannot invest directly in an index; however, an individual can invest in exchange traded funds or other investment vehicles that attempt to track the performance of a benchmark index. |
(c) | The expense ratios are from the Fund’s most recent prospectus dated December 31, 2018. The Adviser has contractually agreed to waive its management fee and/or reimburse expenses so that total annual operating expenses (excluding (i) interest; (ii) taxes; (iii) brokerage fees and commissions; (iv) other extraordinary expenses not incurred in the ordinary course of the Fund’s business; (v) dividend expenses on short sales; (vi) indirect expenses such as acquired fund fees and expenses; and (vii) expenses incurred under a Rule 12b-1 plan of distribution) do not exceed 1.00% of the Fund’s average daily net assets through December 31, 2019. During any fiscal year that the Investment Advisory Agreement between the Adviser and Capitol Series Trust is in effect, the Adviser may recoup the sum of all fees previously waived or expenses reimbursed, less any reimbursement previously paid, provided that the Adviser is only permitted to recoup fees or expenses within 36 months from the date the fee waiver or expense reimbursement first occurred and provided further that such recoupment can be achieved within the Expense Limitation Agreement currently in effect and the Expense Limitation Agreement in place when the waiver/reimbursement occurred. The Expense Limitation Agreement may not be terminated by the Adviser prior to its expiration date, but the Board may terminate such agreement at any time. The Expense Limitation Agreement terminates automatically upon the termination of the Advisory Agreement with the Adviser. Additional information pertaining to the Fund’s expense ratios as of August 31, 2019 can be found in the financial highlights. The Gross Expense Ratio and Expense Ratio with Applicable Waivers do not correlate to the corresponding ratios of expenses to average net assets included in the Financial Highlights section of this report, which reflect the operating expenses of the Fund and do not include acquired fund fees and expenses (“AFFE”). |
The Fund’s investment objective, strategies, risks, charges and expenses must be considered carefully before investing. The prospectus contains this and other important information about the investment company and may be obtained by calling (855) 261-0104. Please read it carefully before investing.
The Fund is distributed by Unified Financial Securities, LLC, Member FINRA/SIPC.
6
INVESTMENT RESULTS – (Unaudited) (continued)
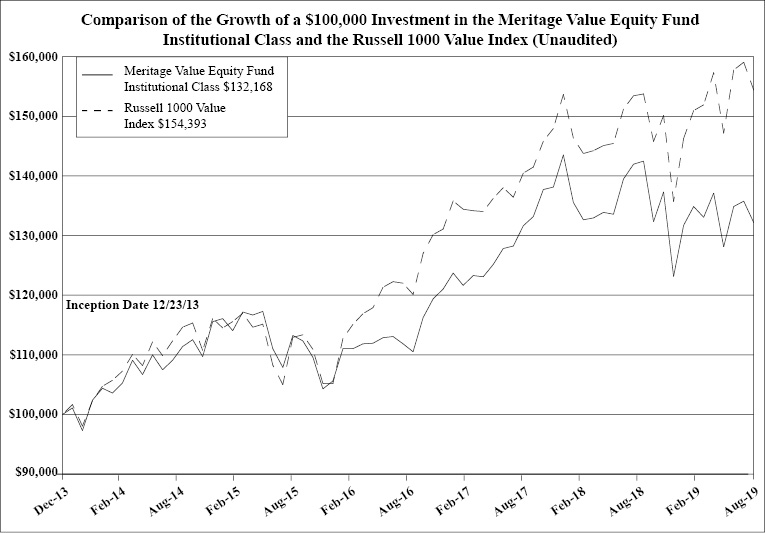
The chart above assumes an initial investment of $100,000 made on December 23, 2013 (commencement of operations) and held through August 31, 2019. THE FUND’S RETURNS REPRESENT PAST PERFORMANCE AND DO NOT GUARANTEE FUTURE RESULTS. The returns shown do not reflect deduction of taxes that a shareholder would pay on the Fund’s distributions or the redemption of the Fund’s shares. Investment returns and principal values will fluctuate so that your shares, when redeemed, may be worth more or less than their original purchase price.
The Russell 1000 Value Index is a widely recognized unmanaged index of equity securities and is representative of a broader domestic equity market and range of securities than is found in the Fund’s portfolio. Individuals cannot invest directly in an Index; however, an individual can invest in exchange traded funds or other investment vehicles that attempt to track the performance of a benchmark index. The Index returns do not include expenses, which have been deducted from the Fund’s return. These performance figures include the change in value of the stocks in the index plus the reinvestment of dividends and are not annualized. The returns shown do not reflect deduction of taxes that a shareholder would pay on Fund distributions or the redemption of Fund shares.
Current performance may be lower or higher than the performance data quoted. For more information on the Fund, and to obtain performance data current to the most recent month-end, or to request a prospectus, please call (855) 261-0104. You should carefully consider the investment objectives, potential risks, management fees, and charges and expenses of the Fund before investing. The Fund’s prospectus contains this and other information about the Fund, and should be read carefully before investing.
The Fund is distributed by Unified Financial Securities, LLC, member FINRA/SIPC.
7
INVESTMENT RESULTS – (Unaudited) (continued)
| | Average Annual Total Returns
as of August 31, 2019 (a) | |
| | Fund/Index | 1 Year | 3 Year | 5 Year | Since Inception
(12/23/13) | |
| | Meritage Yield- Focus Equity Fund – Institutional Class | (4.16)% | 5.11% | 2.15% | 4.05% | |
| | Meritage Yield-Focus Equity Fund – Investor Class | (4.45)% | 4.95% | 1.96% | 3.84% | �� |
| | Zacks Multi-Asset Income Index TR (b) | (1.52)% | 7.62% | 1.29% | 2.89% | |
| | | | | | | |
| | | Expense Ratios (c) | | | |
| | | Institutional
Class | Investor
Class | | | |
| | Gross | 1.66% | 1.91% | | | |
| | With Applicable Waivers | 1.16% | 1.41% | | | |
The performance quoted represents past performance, which does not guarantee future results. The investment return and principal value of an investment will fluctuate so that an investor’s shares, when redeemed, may be worth more or less than their original cost. The returns shown do not reflect deduction of taxes that a shareholder would pay on Fund distributions or the redemption of Fund shares. The Fund’s investment objectives, risks, charges and expenses must be considered carefully before investing. Current performance of a Fund may be lower or higher than the performance quoted. Performance data current to the most recent month end may be obtained by calling (855) 261-0104.
The performance in the preceding table reflects any fee reductions during the applicable period. If such fee reductions had not occurred, the quoted performance would be lower.
(a) | Return figures reflect any change in price per share and assume the reinvestment of all distributions. |
(b) | The Zacks Multi-Asset Income Index is comprised of approximately 125 to 150 securities selected, based on investment and other criteria, from a universe of domestic and international companies. The universe of securities within the index includes U.S. listed common stocks and ADRs paying dividends, real estate investment trusts, MLPs, closed end funds, Canadian royalty trusts and traditional preferred stocks. Individuals cannot invest directly in an Index; however, an individual can invest inexchange traded funds or other investment vehicles that attempt to track the performance of a benchmark index. |
(c) | The expense ratios are from the Fund’s most recent prospectus dated December 31, 2018. The Adviser has contractually agreed to waive its management fee and/or reimburse expenses so that total annual operating expenses (excluding (i) interest; (ii) taxes; (iii) brokerage fees and commissions; (iv) other extraordinary expenses not incurred in the ordinary course of the Fund’s business; (v) dividend expenses on short sales; (vi) indirect expenses such as acquired fund fees and expenses; and (vii) expenses incurred under a Rule 12b-1 plan of distribution) do not exceed 1.00% of the Fund’s average daily net assets through December 31, 2019. During any fiscal year that the Investment Advisory Agreement between the Adviser and Capitol Series Trust is in effect, the Adviser may recoup the sum of all fees previously waived or expenses reimbursed, less any reimbursement previously paid, provided that the Adviser is only permitted to recoup fees or expenses within 36 months from the date the fee waiver or expense reimbursement first occurred and provided further that such recoupment can be achieved within the Expense Limitation Agreement currently in effect and the Expense Limitation Agreement in place when the waiver/reimbursement occurred. The Expense Limitation Agreement may not be terminated by the Adviser prior to its expiration date, but the Board may terminate such agreement at any time. The Expense Limitation Agreement terminates automatically upon the termination of the Advisory Agreement with the Adviser. Additional information pertaining to the Fund’s expense ratios as of August 31, 2019 can be found in the financial highlights. The Gross Expense Ratio and Expense Ratio with Applicable Waivers do not correlate to the corresponding ratios of expenses to average net assets included in the Financial Highlights section of this report, which reflect the operating expenses of the Fund and do not include acquired fund fees and expenses (“AFFE”). |
The Fund’s investment objective, strategies, risks, charges and expenses must be considered carefully before investing. The prospectus contains this and other important information about the investment company and may be obtained by calling (855) 261-0104. Please read it carefully before investing.
The Fund is distributed by Unified Financial Securities, LLC, Member FINRA/SIPC.
8
INVESTMENT RESULTS – (Unaudited) (continued)

The chart above assumes an initial investment of $100,000 made on December 23, 2013 (commencement of operations) and held through August 31, 2019. THE FUND’S RETURNS REPRESENT PAST PERFORMANCE AND DO NOT GUARANTEE FUTURE RESULTS. The returns shown do not reflect deduction of taxes that a shareholder would pay on the Fund’s distributions or the redemption of the Fund’s shares. Investment returns and principal values will fluctuate so that your shares, when redeemed, may be worth more or less than their original purchase price.
The Zacks Multi-Asset Income Index is comprised of approximately 125 to 150 securities selected, based on investment and other criteria, from a universe of domestic and international companies. The universe of securities within the Index includes U.S. listed common stocks and ADRs paying dividends, real estate investment trusts, MLPs, closed end funds, Canadian royalty trusts and traditional preferred stocks. Individuals cannot invest directly in an Index; however, an individual can invest in exchange traded funds or other investment vehicles that attempt to track the performance of a benchmark index. The Index returns do not include expenses, which have been deducted from the Fund’s return. These performance figures include the change in value of the stocks in the index plus the reinvestment of dividends and are not annualized. The returns shown do not reflect deduction of taxes that a shareholder would pay on Fund distributions or the redemption of Fund shares.
Current performance may be lower or higher than the performance data quoted. For more information on the Fund, and to obtain performance data current to the most recent month-end, or to request a prospectus, please call (855) 261-0104. You should carefully consider the investment objectives, potential risks, management fees, and charges and expenses of the Fund before investing. The Fund’s prospectus contains this and other information about the Fund, and should be read carefully before investing.
The Fund is distributed by Unified Financial Securities, LLC, member FINRA/SIPC.
9
FUND HOLDINGS – (Unaudited)

The investment objective of the Meritage Growth Equity Fund is to seek growth of capital.
10
FUND HOLDINGS – (Unaudited) (continued)

The investment objective of the Meritage Value Equity Fund is to seek growth of capital. Income is a secondary objective.
11
FUND HOLDINGS – (Unaudited) (continued)
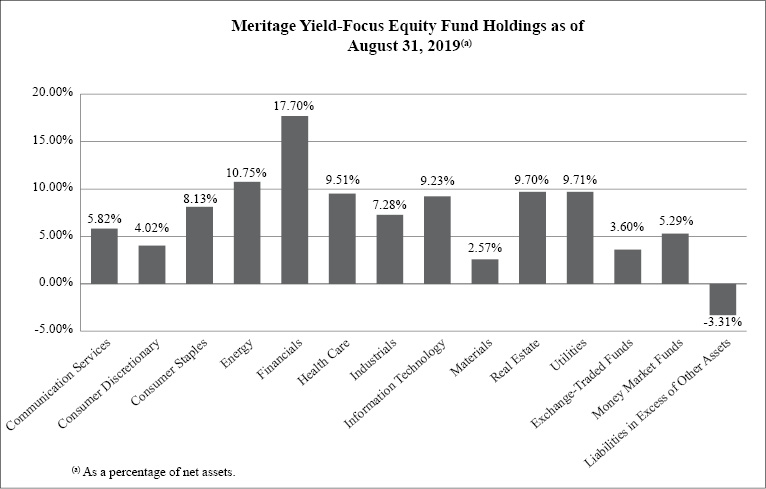
The investment objective of the Meritage Yield-Focus Equity Fund is to seek long-term growth of capital with an emphasis on high current income.
AVAILABILITY OF PORTFOLIO SCHEDULE – (Unaudited)
The Funds file their complete schedule of portfolio holdings with the Securities and Exchange Commission (the “SEC”) for the first and third quarters of each fiscal year within sixty days after the end of the period. The Funds’ portfolio holdings are available on the SEC’s website at http://www.sec.gov.
12
MERITAGE GROWTH EQUITY FUND
SCHEDULE OF INVESTMENTS
August 31, 2019
COMMON STOCKS — 93.16% | | Shares | | | Fair Value | |
Communication Services — 10.46% | | | | | | | | |
Alphabet, Inc., Class A(a) | | | 1,188 | | | $ | 1,414,350 | |
Facebook, Inc., Class A(a) | | | 4,015 | | | | 745,465 | |
IAC/InterActiveCorp(a) | | | 4,822 | | | | 1,227,874 | |
| | | | | | | | 3,387,689 | |
Consumer Discretionary — 16.91% | | | | | | | | |
Amazon.com, Inc.(a) | | | 935 | | | | 1,660,831 | |
Fox Factory Holding Corporation(a) | | | 5,730 | | | | 412,789 | |
Home Depot, Inc. (The) | | | 6,465 | | | | 1,473,439 | |
Lennar Corporation, Class A | | | 12,350 | | | | 629,850 | |
NIKE, Inc., Class B | | | 4,540 | | | | 383,630 | |
O’Reilly Automotive, Inc.(a) | | | 1,333 | | | | 511,552 | |
Starbucks Corporation | | | 4,175 | | | | 403,138 | |
| | | | | | | | 5,475,229 | |
Consumer Staples — 2.77% | | | | | | | | |
Hershey Company (The) | | | 3,500 | | | | 554,680 | |
Monster Beverage Corporation(a) | | | 5,850 | | | | 343,220 | |
| | | | | | | | 897,900 | |
Financials — 1.83% | | | | | | | | |
S&P Global, Inc. | | | 2,283 | | | | 594,014 | |
| | | | | | | | | |
Health Care — 9.81% | | | | | | | | |
Amedisys, Inc.(a) | | | 2,521 | | | | 324,478 | |
Amgen, Inc. | | | 1,522 | | | | 317,520 | |
Globus Medical, Inc., Class A(a) | | | 9,680 | | | | 494,357 | |
Intuitive Surgical, Inc.(a) | | | 818 | | | | 418,276 | |
Johnson & Johnson | | | 6,847 | | | | 878,881 | |
Stryker Corporation | | | 1,916 | | | | 422,785 | |
Veeva Systems, Inc., Class A(a) | | | 2,000 | | | | 320,760 | |
| | | | | | | | 3,177,057 | |
Industrials — 8.65% | | | | | | | | |
AMETEK, Inc. | | | 5,780 | | | | 496,675 | |
Boeing Company (The) | | | 816 | | | | 297,097 | |
HD Supply Holdings, Inc.(a) | | | 9,070 | | | | 352,914 | |
IDEX Corporation | | | 2,618 | | | | 431,211 | |
Ingersoll-Rand plc | | | 3,775 | | | | 457,114 | |
Nordson Corporation | | | 2,980 | | | | 405,161 | |
Sensata Technologies Holding plc(a) | | | 7,975 | | | | 363,501 | |
| | | | | | | | 2,803,673 | |
Information Technology — 42.73% | | | | | | | | |
Adobe Systems, Inc.(a) | | | 2,285 | | | | 650,105 | |
Apple, Inc. | | | 10,241 | | | | 2,137,706 | |
CyberArk Software Ltd.(a) | | | 8,800 | | | | 988,592 | |
Fiserv, Inc.(a) | | | 9,650 | | | | 1,031,971 | |
Fortinet, Inc.(a) | | | 3,930 | | | | 311,177 | |
See accompanying notes which are an integral part of these financial statements.
13
MERITAGE GROWTH EQUITY FUND
SCHEDULE OF INVESTMENTS – (continued)
August 31, 2019
COMMON STOCKS — 93.16% – continued | | Shares | | | Fair Value | |
Information Technology — 42.73% – continued | | | | | | | | |
Global Payments, Inc. | | | 2,000 | | | $ | 331,960 | |
Keysight Technologies, Inc.(a) | | | 3,630 | | | | 351,602 | |
KLA-Tencor Corporation | | | 2,620 | | | | 387,498 | |
Lam Research Corporation | | | 1,635 | | | | 344,184 | |
Mastercard, Inc., Class A | | | 5,568 | | | | 1,566,668 | |
Micron Technology, Inc.(a) | | | 14,135 | | | | 639,891 | |
Microsoft Corporation | | | 16,300 | | | | 2,247,118 | |
Novanta, Inc.(a) | | | 5,705 | | | | 427,875 | |
Paycom Software, Inc.(a) | | | 1,280 | | | | 320,154 | |
Xilinx, Inc. | | | 5,782 | | | | 601,675 | |
Zebra Technologies Corporation, Class A(a) | | | 7,327 | | | | 1,502,255 | |
| | | | | | | | 13,840,431 | |
Total Common Stocks (Cost $21,983,767) | | | | | | | 30,175,993 | |
| | | | | | | | | |
EXCHANGE-TRADED FUNDS — 4.11% | | | | | | | | |
Consumer Staples Select Sector SPDR Fund | | | 5,985 | | | | 363,409 | |
iShares Russell 1000 Growth Index Fund | | | 2,015 | | | | 322,259 | |
SPDR S&P Bank ETF | | | 15,775 | | | | 645,986 | |
Total Exchange-Traded Funds Cost ($1,309,275) | | | | | | | 1,331,654 | |
| | | | | | | | | |
MONEY MARKET FUNDS — 2.74% | | | | | | | | |
Morgan Stanley Institutional Liquidity Funds Treasury Securities Portfolio, Institutional Class, 1.92%(b) | | | 888,913 | | | | 888,913 | |
Total Money Market Funds (Cost $888,913) | | | | | | | 888,913 | |
Total Investments — 100.01% (Cost $24,181,955) | | | | | | | 32,396,560 | |
Liabilities in Excess of Other Assets — (0.01)% | | | | | | | (1,698 | ) |
NET ASSETS — 100.00% | | | | | | $ | 32,394,862 | |
(a) | Non-income producing security. |
(b) | Rate disclosed is the seven day effective yield as of August 31, 2019. |
ETF – Exchange-Traded Fund
SPDR – Standard & Poor’s Depositary Receipt
See accompanying notes which are an integral part of these financial statements.
14
MERITAGE VALUE EQUITY FUND
SCHEDULE OF INVESTMENTS
August 31, 2019
COMMON STOCKS — 91.78% | | Shares | | | Fair Value | |
Communication Services — 7.40% | | | | | | | | |
Alphabet, Inc., Class A(a) | | | 245 | | | $ | 291,680 | |
AT&T, Inc. | | | 6,780 | | | | 239,063 | |
CBS Corporation, Class B | | | 4,370 | | | | 183,802 | |
Comcast Corporation, Class A | | | 6,090 | | | | 269,544 | |
Verizon Communications, Inc. | | | 5,380 | | | | 312,900 | |
| | | | | | | | 1,296,989 | |
Consumer Discretionary — 7.19% | | | | | | | | |
Aaron’s, Inc. | | | 3,495 | | | | 224,064 | |
AutoZone, Inc.(a) | | | 202 | | | | 222,541 | |
Dollar General Corporation | | | 2,275 | | | | 355,105 | |
PulteGroup, Inc. | | | 6,920 | | | | 233,896 | |
Ross Stores, Inc. | | | 2,125 | | | | 225,272 | |
| | | | | | | | 1,260,878 | |
Consumer Staples — 4.57% | | | | | | | | |
Altria Group, Inc. | | | 5,530 | | | | 241,882 | |
Associated British Foods plc - ADR | | | 8,540 | | | | 237,924 | |
Walmart, Inc. | | | 2,810 | | | | 321,071 | |
| | | | | | | | 800,877 | |
Energy — 7.76% | | | | | | | | |
Chevron Corporation | | | 3,605 | | | | 424,381 | |
ConocoPhillips | | | 4,395 | | | | 229,331 | |
Imperial Oil Ltd. | | | 10,040 | | | | 246,281 | |
Royal Dutch Shell plc, Class A - ADR | | | 4,705 | | | | 261,598 | |
Total S.A. - ADR | | | 3,990 | | | | 199,181 | |
| | | | | | | | 1,360,772 | |
Financials — 18.08% | | | | | | | | |
Aflac, Inc. | | | 4,825 | | | | 242,119 | |
Ameriprise Financial, Inc. | | | 1,905 | | | | 245,707 | |
Bank of America Corporation | | | 7,860 | | | | 216,229 | |
Berkshire Hathaway, Inc., Class B(a) | | | 1,290 | | | | 262,399 | |
Capital One Financial Corporation | | | 2,410 | | | | 208,754 | |
Discover Financial Services | | | 2,820 | | | | 225,516 | |
Globe Life, Inc. | | | 4,097 | | | | 365,697 | |
JPMorgan Chase & Company | | | 2,425 | | | | 266,410 | |
Prudential Financial, Inc. | | | 3,050 | | | | 244,275 | |
Reinsurance Group of America, Inc. | | | 1,750 | | | | 269,448 | |
Voya Financial, Inc. | | | 4,095 | | | | 201,965 | |
Wells Fargo & Company | | | 4,705 | | | | 219,112 | |
Zions Bancorporation | | | 4,980 | | | | 204,628 | |
| | | | | | | | 3,172,259 | |
See accompanying notes which are an integral part of these financial statements.
15
MERITAGE VALUE EQUITY FUND
SCHEDULE OF INVESTMENTS – (continued)
August 31, 2019
COMMON STOCKS — 91.78% – continued | | Shares | | | Fair Value | |
Health Care — 13.55% | | | | | | | | |
Anthem, Inc. | | | 930 | | | $ | 243,214 | |
ICON plc(a) | | | 1,495 | | | | 230,514 | |
Integra LifeSciences Holdings Corporation(a) | | | 4,130 | | | | 247,883 | |
Johnson & Johnson | | | 1,865 | | | | 239,391 | |
Novo Nordisk A/S - ADR | | | 4,345 | | | | 226,418 | |
PRA Health Sciences, Inc.(a) | | | 2,235 | | | | 220,907 | |
Roche Holding AG - ADR | | | 7,440 | | | | 254,300 | |
Thermo Fisher Scientific, Inc. | | | 750 | | | | 215,295 | |
UnitedHealth Group, Inc. | | | 1,052 | | | | 246,168 | |
Universal Health Services, Inc., Class B | | | 1,755 | | | | 253,737 | |
| | | | | | | | 2,377,827 | |
Industrials — 9.27% | | | | | | | | |
EMCOR Group, Inc. | | | 2,640 | | | | 230,842 | |
Hexcel Corporation | | | 2,820 | | | | 237,303 | |
Hubbell, Inc. | | | 1,755 | | | | 230,151 | |
JetBlue Airways Corporation(a) | | | 14,085 | | | | 243,952 | |
Norfolk Southern Corporation | | | 1,405 | | | | 244,540 | |
Parker-Hannifin Corporation | | | 1,285 | | | | 213,014 | |
Southwest Airlines Company | | | 4,310 | | | | 225,499 | |
| | | | | | | | 1,625,301 | |
Information Technology — 9.17% | | | | | | | | |
Accenture plc, Class A | | | 1,195 | | | | 236,813 | |
Applied Materials, Inc. | | | 4,620 | | | | 221,852 | |
CDW Corporation | | | 1,851 | | | | 213,791 | |
CGI, Inc.(a) | | | 2,880 | | | | 226,022 | |
Intel Corporation | | | 4,655 | | | | 220,694 | |
Open Text Corporation | | | 5,360 | | | | 209,522 | |
WNS Holdings Ltd. - ADR(a) | | | 4,600 | | | | 279,588 | |
| | | | | | | | 1,608,282 | |
Materials — 1.32% | | | | | | | | |
BHP Billiton Ltd. - ADR | | | 4,695 | | | | 230,806 | |
| | | | | | | | | |
Real Estate — 5.59% | | | | | | | | |
Agree Realty Corporation | | | 3,315 | | | | 247,597 | |
Camden Property Trust | | | 2,065 | | | | 223,536 | |
Duke Realty Corporation | | | 6,925 | | | | 230,395 | |
Prologis, Inc. | | | 3,325 | | | | 278,037 | |
| | | | | | | | 979,565 | |
Utilities — 7.88% | | | | | | | | |
Ameren Corporation | | | 2,855 | | | | 220,263 | |
Consolidated Edison, Inc. | | | 2,485 | | | | 220,917 | |
IDACORP, Inc. | | | 3,341 | | | | 366,875 | |
See accompanying notes which are an integral part of these financial statements.
16
MERITAGE VALUE EQUITY FUND
SCHEDULE OF INVESTMENTS – (continued)
August 31, 2019
COMMON STOCKS — 91.78% – continued | | Shares | | | Fair Value | |
Utilities — 7.88% – continued | | | | | | | | |
Pinnacle West Capital Corporation | | | 3,725 | | | $ | 355,030 | |
Public Service Enterprise Group, Inc. | | | 3,620 | | | | 218,901 | |
| | | | | | | | 1,381,986 | |
Total Common Stocks (Cost $15,251,490) | | | | | | | 16,095,542 | |
| | | | | | | | | |
EXCHANGE-TRADED FUNDS — 6.56% | | | | | | | | |
Vanguard Value ETF | | | 10,603 | | | | 1,150,638 | |
Total Exchange-Traded Funds Cost ($1,149,537) | | | | | | | 1,150,638 | |
| | | | | | | | | |
MONEY MARKET FUNDS — 2.43% | | | | | | | | |
Morgan Stanley Institutional Liquidity Funds Treasury Securities Portfolio, Institutional Class, 1.92%(b) | | | 426,642 | | | | 426,642 | |
Total Money Market Funds (Cost $426,642) | | | | | | | 426,642 | |
Total Investments — 100.77% (Cost $16,827,669) | | | | | | | 17,672,822 | |
Liabilities in Excess of Other Assets — (0.77)% | | | | | | | (135,202 | ) |
NET ASSETS — 100.00% | | | | | | $ | 17,537,620 | |
(a) | Non-income producing security. |
(b) | Rate disclosed is the seven day effective yield as of August 31, 2019. |
ADR – American Depositary Receipt
ETF – Exchange-Traded Fund
See accompanying notes which are an integral part of these financial statements.
17
MERITAGE YIELD-FOCUS EQUITY FUND
SCHEDULE OF INVESTMENTS
August 31, 2019
COMMON STOCKS — 87.68% | | Shares | | | Fair Value | |
Communication Services — 5.82% | | | | | | | | |
AT&T, Inc. | | | 16,315 | | | $ | 575,267 | |
Verizon Communications, Inc. | | | 11,177 | | | | 650,054 | |
Viacom, Inc., Class B | | | 15,270 | | | | 381,445 | |
| | | | | | | | 1,606,766 | |
Consumer Discretionary — 4.02% | | | | | | | | |
Garmin Ltd. | | | 3,385 | | | | 276,114 | |
Target Corporation | | | 7,805 | | | | 835,448 | |
| | | | | | | | 1,111,562 | |
Consumer Staples — 8.13% | | | | | | | | |
British American Tobacco plc - ADR | | | 9,400 | | | | 329,940 | |
Imperial Brands plc - ADR | | | 23,135 | | | | 601,278 | |
Ingredion, Inc. | | | 4,345 | | | | 335,738 | |
Kimberly-Clark Corporation | | | 4,150 | | | | 585,607 | |
Unilever plc - ADR | | | 6,210 | | | | 392,348 | |
| | | | | | | | 2,244,911 | |
Energy — 10.75% | | | | | | | | |
Alliance Resource Partners LP(a) | | | 28,166 | | | | 435,728 | |
Energy Transfer Equity LP(a) | | | 28,950 | | | | 394,010 | |
Kinder Morgan, Inc. | | | 36,505 | | | | 739,956 | |
Phillips 66 | | | 4,570 | | | | 450,739 | |
Royal Dutch Shell plc, Class B - ADR | | | 8,440 | | | | 470,614 | |
Valero Energy Corporation | | | 6,370 | | | | 479,534 | |
| | | | | | | | 2,970,581 | |
Financials — 17.70% | | | | | | | | |
AllianceBernstein Holding LP(a) | | | 9,230 | | | | 261,024 | |
Ameriprise Financial, Inc. | | | 2,141 | | | | 276,146 | |
Bank of N.T. Butterfield & Son Ltd. (The) | | | 12,850 | | | | 354,146 | |
Citizens Financial Group, Inc. | | | 12,045 | | | | 406,398 | |
KeyCorp | | | 34,460 | | | | 572,036 | |
Lazard Ltd., Class A(a) | | | 19,060 | | | | 654,521 | |
MetLife, Inc. | | | 11,605 | | | | 514,102 | |
Morgan Stanley | | | 9,335 | | | | 387,309 | |
Old Republic International Corporation | | | 24,050 | | | | 561,808 | |
Principal Financial Group, Inc. | | | 9,560 | | | | 508,783 | |
State Street Corporation | | | 7,665 | | | | 393,291 | |
| | | | | | | | 4,889,564 | |
Health Care — 9.51% | | | | | | | | |
Amgen, Inc. | | | 2,447 | | | | 510,493 | |
Bristol-Myers Squibb Company | | | 12,260 | | | | 589,339 | |
CVS Health Corporation | | | 9,285 | | | | 565,642 | |
Merck & Company, Inc. | | | 5,675 | | | | 490,717 | |
Pfizer, Inc. | | | 13,220 | | | | 469,971 | |
| | | | | | | | 2,626,162 | |
See accompanying notes which are an integral part of these financial statements.
18
MERITAGE YIELD-FOCUS EQUITY FUND
SCHEDULE OF INVESTMENTS – (continued)
August 31, 2019
COMMON STOCKS — 87.68% – continued | | Shares | | | Fair Value | |
Industrials — 5.03% | | | | | | | | |
Hubbell, Inc. | | | 3,407 | | | $ | 446,794 | |
Mobile Mini, Inc. | | | 10,820 | | | | 338,233 | |
Siemens AG - ADR | | | 6,600 | | | | 329,406 | |
SKF AB - ADR | | | 16,880 | | | | 273,625 | |
| | | | | | | | 1,388,058 | |
Information Technology — 9.23% | | | | | | | | |
Broadcom, Inc. | | | 1,419 | | | | 401,066 | |
Cisco Systems, Inc. | | | 5,720 | | | | 267,753 | |
HP, Inc. | | | 15,450 | | | | 282,581 | |
Infosys Ltd. - ADR | | | 45,360 | | | | 521,186 | |
International Business Machines Corporation | | | 3,139 | | | | 425,429 | |
Seagate Technology plc | | | 7,755 | | | | 389,378 | |
Xperi Corporation | | | 14,330 | | | | 262,526 | |
| | | | | | | | 2,549,919 | |
Materials — 2.57% | | | | | | | | |
International Paper Company | | | 10,830 | | | | 423,453 | |
Packaging Corporation of America | | | 2,835 | | | | 285,144 | |
| | | | | | | | 708,597 | |
Real Estate — 9.70% | | | | | | | | |
Highwoods Properties, Inc. | | | 8,650 | | | | 373,767 | |
Industrial Logistics Properties Trust | | | 14,060 | | | | 300,743 | |
National Health Investors, Inc. | | | 8,440 | | | | 700,182 | |
Piedmont Office Realty Trust, Inc., Class A | | | 20,220 | | | | 399,143 | |
Public Storage | | | 1,794 | | | | 474,944 | |
Simon Property Group, Inc. | | | 2,896 | | | | 431,330 | |
| | | | | | | | 2,680,109 | |
Utilities — 5.22% | | | | | | | | |
PPL Corporation | | | 23,135 | | | | 683,639 | |
Public Service Enterprise Group, Inc. | | | 12,525 | | | | 757,387 | |
| | | | | | | | 1,441,026 | |
Total Common Stocks (Cost $22,640,441) | | | | | | | 24,217,255 | |
| | | | | | | | | |
CONVERTIBLE PREFERRED STOCKS — 6.74% | | | | | | | | |
| | | | | | | | | |
Industrials — 2.25% | | | | | | | | |
Stanley Black & Decker, Inc., 5.38% | | | 6,540 | | | | 622,085 | |
| | | | | | | | | |
Utilities — 4.49% | | | | | | | | |
Centerpoint Energy, Inc., Series B, 7.00% | | | 16,625 | | | | 822,106 | |
Dominion Energy, Inc., 7.25% 6/1/22 | | | 4,096 | | | | 417,587 | |
| | | | | | | | 1,239,693 | |
Total Convertible Preferred Stocks (Cost $1,946,780) | | | | | | | 1,861,778 | |
See accompanying notes which are an integral part of these financial statements.
19
MERITAGE YIELD-FOCUS EQUITY FUND
SCHEDULE OF INVESTMENTS – (continued)
August 31, 2019
EXCHANGE-TRADED FUNDS — 3.60% | | Shares | | | Fair Value | |
Invesco S&P 500 High Dividend Low Volatility ETF | | | 10,865 | | | $ | 440,141 | |
Vanguard High Dividend Yield ETF | | | 6,430 | | | | 554,009 | |
Total Exchange-Traded Funds Cost ($977,433) | | | | | | | 994,150 | |
| | | | | | | | | |
MONEY MARKET FUNDS — 5.29% | | | | | | | | |
Morgan Stanley Institutional Liquidity Funds Treasury Securities Portfolio, Institutional Class, 1.92%(b) | | | 1,461,992 | | | | 1,461,992 | |
Total Money Market Funds (Cost $1,461,992) | | | | | | | 1,461,992 | |
Total Investments — 103.31% (Cost $27,026,646) | | | | | | | 28,535,175 | |
Liabilities in Excess of Other Assets — (3.31)% | | | | | | | (913,877 | ) |
NET ASSETS — 100.00% | | | | | | $ | 27,621,298 | |
(a) | Master Limited Partnership |
(b) | Rate disclosed is the seven day effective yield as of August 31, 2019. |
ADR – American Depositary Receipt
ETF – Exchange-Traded Fund
The sectors shown on these schedules of investments are based on the Global Industry Classification Standard, or GICS® (“GICS”). The GICS was developed by and/or is the exclusive property of MSCI, Inc. and Standard & Poor’s Financial Services LLC (“S&P”). GICS is a service mark of MSCI, Inc. and S&P and has been licensed for use by Ultimus Fund Solutions, LLC.
See accompanying notes which are an integral part of these financial statements.
20
MERITAGE FUNDS
STATEMENTS OF ASSETS AND LIABILITIES
August 31, 2019
| | | Meritage Growth
Equity Fund | | | Meritage Value
Equity Fund | | | Meritage Yield-
Focus Equity Fund | |
Assets | | | | | | | | | | | | |
Investments in securities at value (cost $24,181,955, $16,827,669 and $27,026,646) | | $ | 32,396,560 | | | $ | 17,672,822 | | | $ | 28,535,175 | |
Receivable for fund shares sold | | | 63 | | | | — | | | | — | |
Receivable for investments sold | | | — | | | | 609,387 | | | | 646,276 | |
Dividends receivable | | | 25,464 | | | | 31,685 | | | | 116,289 | |
Receivable from Adviser | | | — | | | | 3,462 | | | | — | |
Prepaid expenses | | | 14,957 | | | | 9,158 | | | | 30,510 | |
Total Assets | | | 32,437,044 | | | | 18,326,514 | | | | 29,328,250 | |
| | | | | | | | | | | | | |
Liabilities | | | | | | | | | | | | |
Payable for fund shares redeemed | | | — | | | | — | | | | 20,616 | |
Payable for investments purchased | | | — | | | | 757,653 | | | | 1,649,621 | |
Payable to Adviser | | | 6,049 | | | | — | | | | 850 | |
Accrued 12b-1 fees - Investor class | | | 186 | | | | — | | | | 305 | |
Payable to Administrator | | | 8,650 | | | | 4,750 | | | | 8,150 | |
Payable to audit and tax | | | 21,150 | | | | 21,150 | | | | 21,150 | |
Other accrued expenses | | | 6,147 | | | | 5,341 | | | | 6,260 | |
Total Liabilities | | | 42,182 | | | | 788,894 | | | | 1,706,952 | |
Net Assets | | $ | 32,394,862 | | | $ | 17,537,620 | | | $ | 27,621,298 | |
| | | | | | | | | | | | | |
Net Assets consist of: | | | | | | | | | | | | |
Paid-in capital | | | 24,677,445 | | | | 15,959,884 | | | | 29,303,562 | |
Accumulated earnings (deficit) | | | 7,717,417 | | | | 1,577,736 | | | | (1,682,264 | ) |
Net Assets | | $ | 32,394,862 | | | $ | 17,537,620 | | | $ | 27,621,298 | |
| | | | | | | | | | | | | |
Net Assets: Institutional Class | | $ | 31,962,252 | | | $ | 17,537,620 | | | $ | 26,883,098 | |
Shares outstanding (unlimited number of shares authorized, no par value) | | | 2,078,393 | | | | 1,496,753 | | | | 2,570,698 | |
Net asset value, offering and redemption price per share | | $ | 15.38 | | | $ | 11.72 | | | $ | 10.46 | |
| | | | | | | | | | | | | |
Net Assets: Investor Class | | $ | 432,610 | | | $ | — | | | $ | 738,200 | |
Shares outstanding (unlimited number of shares authorized, no par value) | | | 28,491 | | | | — | | | | 69,883 | |
Net asset value, offering and redemption price per share | | $ | 15.18 | | | $ | — | | | $ | 10.56 | |
See accompanying notes which are an integral part of these financial statements.
21
MERITAGE FUNDS
STATEMENTS OF OPERATIONS
For the year ended August 31, 2019
| | | Meritage Growth
Equity Fund | | | Meritage Value
Equity Fund | | | Meritage Yield-
Focus Equity Fund | |
Investment Income | | | | | | | | | | | | |
Dividend income (net of foreign taxes withheld of $1,200, $12,682 and $27,564) | | $ | 297,553 | | | $ | 329,855 | | | $ | 1,250,829 | |
Total investment income | | | 297,553 | | | | 329,855 | | | | 1,250,829 | |
| | | | | | | | | | | | | |
Expenses | | | | | | | | | | | | |
Investment Adviser | | | 212,509 | | | | 119,176 | | | | 212,625 | |
Administration | | | 44,120 | | | | 24,515 | | | | 44,160 | |
Fund accounting | | | 29,250 | | | | 16,410 | | | | 29,440 | |
Transfer agent | | | 23,410 | | | | 13,108 | | | | 23,532 | |
Audit and tax preparation | | | 23,367 | | | | 23,367 | | | | 23,367 | |
Trustee | | | 19,006 | | | | 19,006 | | | | 19,006 | |
Registration | | | 13,967 | | | | 6,233 | | | | 29,321 | |
Legal | | | 13,221 | | | | 13,221 | | | | 13,251 | |
Report printing | | | 12,895 | | | | 9,490 | | | | 13,163 | |
Custodian | | | 4,820 | | | | 7,352 | | | | 5,301 | |
Insurance | | | 3,291 | | | | 3,199 | | | | 3,199 | |
Compliance services | | | 3,000 | | | | 3,000 | | | | 3,000 | |
Pricing | | | 2,621 | | | | 2,433 | | | | 2,852 | |
12b-1 fees- Investor class | | | 913 | | | | — | | | | 1,637 | |
Other | | | 17,035 | | | | 12,097 | | | | 21,208 | |
Total expenses | | | 423,425 | | | | 272,607 | | | | 445,062 | |
Fees contractually waived by Adviser | | | (139,228 | ) | | | (113,776 | ) | | | (159,986 | ) |
Net operating expenses | | | 284,197 | | | | 158,831 | | | | 285,076 | |
Net investment income | | | 13,356 | | | | 171,024 | | | | 965,753 | |
| | | | | | | | | | | | | |
Net Realized and Change in Unrealized Gain (Loss) on Investments | | | | | | | | | | | | |
Net realized gain (loss) on investment securities transactions | | | (495,070 | ) | | | 899,717 | | | | (547,187 | ) |
Net realized gain (loss) on foreign currency translations | | | — | | | | 83 | | | | (19 | ) |
Net change in unrealized appreciation (depreciation) of investment securities | | | 50,692 | | | | (2,455,877 | ) | | | (1,715,527 | ) |
Net realized and change in unrealized loss on investments | | | (444,378 | ) | | | (1,556,077 | ) | | | (2,262,733 | ) |
Net decrease in net assets resulting from operations | | $ | (431,022 | ) | | $ | (1,385,053 | ) | | $ | (1,296,980 | ) |
See accompanying notes which are an integral part of these financial statements.
22
MERITAGE GROWTH EQUITY FUND
STATEMENTS OF CHANGES IN NET ASSETS
| | | For the
Year Ended
August 31, 2019 | | | For the
Year Ended
August 31, 2018(a) | |
Increase (Decrease) in Net Assets due to: | | | | | | | | |
Operations | | | | | | | | |
Net investment income (loss) | | $ | 13,356 | | | $ | (38,817 | ) |
Net realized gain (loss) on investment securities transactions | | | (495,070 | ) | | | 1,955,602 | |
Net change in unrealized appreciation of investment securities | | | 50,692 | | | | 3,925,755 | |
Net increase (decrease) in net assets resulting from operations | | | (431,022 | ) | | | 5,842,540 | |
| | | | | | | | | |
Distributions to Shareholders from Earnings: | | | | | | | | |
Institutional Class | | | (1,767,689 | ) | | | (1,729,352 | ) |
Investor Class | | | (23,791 | ) | | | (18,215 | ) |
Total distributions | | | (1,791,480 | ) | | | (1,747,567 | ) |
| | | | | | | | | |
Capital Transactions - Institutional Class | | | | | | | | |
Proceeds from shares sold | | | 5,514,589 | | | | 3,425,215 | |
Reinvestment of distributions | | | 1,723,549 | | | | 1,671,004 | |
Amount paid for shares redeemed | | | (3,453,408 | ) | | | (2,296,869 | ) |
Total Institutional Class | | | 3,784,730 | | | | 2,799,350 | |
| | | | | | | | | |
Capital Transactions - Investor Class | | | | | | | | |
Proceeds from shares sold | | | 187,847 | | | | 78,167 | |
Reinvestment of distributions | | | 16,728 | | | | 17,846 | |
Amount paid for shares redeemed | | | (79,888 | ) | | | (96,358 | ) |
Total Investor Class | | | 124,687 | | | | (345 | ) |
Net increase in net assets resulting from capital transactions | | | 3,909,417 | | | | 2,799,005 | |
Total Increase in Net Assets | | | 1,686,915 | | | | 6,893,978 | |
| | | | | | | | | |
Net Assets | | | | | | | | |
Beginning of year | | | 30,707,947 | | | | 23,813,969 | |
End of year | | $ | 32,394,862 | | | $ | 30,707,947 | |
| | | | | | | | | |
Share Transactions - Institutional Class | | | | | | | | |
Shares sold | | | 365,997 | | | | 223,405 | |
Shares issued in reinvestment of distributions | | | 135,074 | | | | 114,374 | |
Shares redeemed | | | (243,463 | ) | | | (152,438 | ) |
Total Institutional Class | | | 257,608 | | | | 185,341 | |
| | | | | | | | | |
Share Transactions - Investor Class | | | | | | | | |
Shares sold | | | 13,227 | | | | 5,158 | |
Shares issued in reinvestment of distributions | | | 1,325 | | | | 1,231 | |
Shares redeemed | | | (5,409 | ) | | | (6,382 | ) |
Total Investor Class | | | 9,143 | | | | 7 | |
Net increase in shares outstanding | | | 266,751 | | | | 185,348 | |
(a) | For the year ended August 31, 2018, distributions to shareholders from earnings consisted of $10,776 from net investment income and $1,718,576 from net realized gains for Institutional Class, and $18,215 from net realized gains for Investor Class. As of August 31, 2018, accumulated undistributed net investment income was $0. |
See accompanying notes which are an integral part of these financial statements.
23
MERITAGE VALUE EQUITY FUND
STATEMENTS OF CHANGES IN NET ASSETS
| | | For the
Year Ended
August 31, 2019 | | | For the
Year Ended
August 31, 2018(a) | |
Increase (Decrease) in Net Assets due to: | | | | | | | | |
Operations | | | | | | | | |
Net investment income | | $ | 171,024 | | | $ | 110,127 | |
Net realized gain on investment securities transactions | | | 899,800 | | | | 1,227,676 | |
Net change in unrealized appreciation (depreciation) of investment securities | | | (2,455,877 | ) | | | 395,681 | |
Net increase (decrease) in net assets resulting from operations | | | (1,385,053 | ) | | | 1,733,484 | |
| | | | | | | | | |
Distributions to Shareholders from Earnings: | | | | | | | | |
Institutional Class | | | (1,182,385 | ) | | | (90,492 | ) |
Total distributions | | | (1,182,385 | ) | | | (90,492 | ) |
| | | | | | | | | |
Capital Transactions - Institutional Class | | | | | | | | |
Proceeds from shares sold | | | 4,727,777 | | | | 2,010,899 | |
Reinvestment of distributions | | | 1,156,126 | | | | 88,422 | |
Amount paid for shares redeemed | | | (3,924,253 | ) | | | (1,613,843 | ) |
Net increase in net assets resulting from capital transactions | | | 1,959,650 | | | | 485,478 | |
Total Increase (Decrease) in Net Assets | | | (607,788 | ) | | | 2,128,470 | |
| | | | | | | | | |
Net Assets | | | | | | | | |
Beginning of year | | | 18,145,408 | | | | 16,016,938 | |
End of year | | $ | 17,537,620 | | | $ | 18,145,408 | |
| | | | | | | | | |
Share Transactions - Institutional Class | | | | | | | | |
Shares sold | | | 399,264 | | | | 152,256 | |
Shares issued in reinvestment of distributions | | | 106,555 | | | | 6,594 | |
Shares redeemed | | | (333,022 | ) | | | (121,701 | ) |
Net increase in shares outstanding | | | 172,797 | | | | 37,149 | |
(a) | For the year ended August 31, 2018, distributions to shareholders from earnings consisted of $90,492 from net investment income for Institutional Class. As of August 31, 2018, accumulated undistributed net investment income was $106,308. |
See accompanying notes which are an integral part of these financial statements.
24
MERITAGE YIELD-FOCUS EQUITY FUND
STATEMENTS OF CHANGES IN NET ASSETS
| | | For the
Year Ended
August 31, 2019 | | | For the
Year Ended
August 31, 2018(a) | |
Increase (Decrease) in Net Assets due to: | | | | | | | | |
Operations | | | | | | | | |
Net investment income | | $ | 965,753 | | | $ | 897,238 | |
Net realized gain (loss) on investment securities transactions | | | (547,206 | ) | | | 2,209,239 | |
Net change in unrealized appreciation (depreciation) of investment securities | | | (1,715,527 | ) | | | 155,018 | |
Net increase (decrease) in net assets resulting from operations | | | (1,296,980 | ) | | | 3,261,495 | |
| | | | | | | | | |
Distributions to Shareholders from Earnings: | | | | | | | | |
Institutional Class | | | (901,779 | ) | | | (960,330 | ) |
Investor Class | | | (19,312 | ) | | | (22,119 | ) |
Total distributions | | | (921,091 | ) | | | (982,449 | ) |
| | | | | | | | | |
Capital Transactions - Institutional Class | | | | | | | | |
Proceeds from shares sold | | | 2,842,100 | | | | 2,137,663 | |
Reinvestment of distributions | | | 842,667 | | | | 922,386 | |
Amount paid for shares redeemed | | | (3,304,132 | ) | | | (2,717,314 | ) |
Total Institutional Class | | | 380,635 | | | | 342,735 | |
| | | | | | | | | |
Capital Transactions - Investor Class | | | | | | | | |
Proceeds from shares sold | | | 223,207 | | | | 93,361 | |
Reinvestment of distributions | | | 18,878 | | | | 20,316 | |
Amount paid for shares redeemed | | | (112,791 | ) | | | (153,647 | ) |
Total Investor Class | | | 129,294 | | | | (39,970 | ) |
Net increase in net assets resulting from capital transactions | | | 509,929 | | | | 302,765 | |
Total Increase (Decrease) in Net Assets | | | (1,708,142 | ) | | | 2,581,811 | |
| | | | | | | | | |
Net Assets | | | | | | | | |
Beginning of year | | | 29,329,440 | | | | 26,747,629 | |
End of year | | $ | 27,621,298 | | | $ | 29,329,440 | |
| | | | | | | | | |
Share Transactions - Institutional Class | | | | | | | | |
Shares sold | | | 265,459 | | | | 196,426 | |
Shares issued in reinvestment of distributions | | | 81,125 | | | | 85,974 | |
Shares redeemed | | | (314,537 | ) | | | (251,925 | ) |
Total Institutional Class | | | 32,047 | | | | 30,475 | |
| | | | | | | | | |
Share Transactions - Investor Class | | | | | | | | |
Shares sold | | | 20,661 | | | | 8,525 | |
Shares issued in reinvestment of distributions | | | 1,801 | | | | 1,873 | |
Shares redeemed | | | (10,433 | ) | | | (13,904 | ) |
Total Investor Class | | | 12,029 | | | | (3,506 | ) |
Net increase in shares outstanding | | | 44,076 | | | | 26,969 | |
(a) | For the year ended August 31, 2018, distributions to shareholders from earnings consisted of $960,330 from net investment income for Institutional Class, and $22,119 from net investment income for Investor Class. As of August 31, 2018, accumulated undistributed net investment income was $93,498. |
See accompanying notes which are an integral part of these financial statements.
25
MERITAGE GROWTH EQUITY FUND – INSTITUTIONAL CLASS
FINANCIAL HIGHLIGHTS
(For a share outstanding during each year)
| | | For the
Year Ended
August 31,
2019 | | | For the
Year Ended
August 31,
2018 | | | For the
Year Ended
August 31,
2017 | | | For the
Year Ended
August 31,
2016 | | | For the
Year Ended
August 31,
2015 | |
Selected Per Share Data: | | | | | | | | | | | | | | | | | | | | |
Net asset value, beginning of year | | $ | 16.69 | | | $ | 14.39 | | | $ | 12.11 | | | $ | 11.20 | | | $ | 10.95 | |
Investment operations: | | | | | | | | | | | | | | | | | | | | |
Net investment income (loss) | | | 0.01 | | | | (0.02 | ) | | | 0.02 | | | | 0.03 | | | | 0.01 | |
Net realized and unrealized gain (loss) on investments | | | (0.27 | ) | | | 3.36 | | | | 2.41 | | | | 1.12 | | | | 0.36 | |
Total from investment operations | | | (0.26 | ) | | | 3.34 | | | | 2.43 | | | | 1.15 | | | | 0.37 | |
| | | | | | | | | | | | | | | | | | | | | |
Less distributions to shareholders from: | | | | | | | | | | | | | | | | | | | | |
Net investment income | | | — | | | | (0.01 | ) | | | (0.03 | ) | | | (0.01 | ) | | | (0.01 | ) |
Net realized gains | | | (1.05 | ) | | | (1.03 | ) | | | (0.12 | ) | | | (0.23 | ) | | | (0.11 | ) |
Total distributions | | | (1.05 | ) | | | (1.04 | ) | | | (0.15 | ) | | | (0.24 | ) | | | (0.12 | ) |
Net asset value, end of year | | $ | 15.38 | | | $ | 16.69 | | | $ | 14.39 | | | $ | 12.11 | | | $ | 11.20 | |
| | | | | | | | | | | | | | | | | | | | | |
Total Return(a) | | | (0.24 | )% | | | 24.18 | % | | | 20.27 | % | | | 10.41 | % | | | 3.38 | % |
| | | | | | | | | | | | | | | | | | | | | |
Ratios and Supplemental Data: | | | | | | | | | | | | | | | | | | | | |
Net assets, end of year (000 omitted) | | $ | 31,962 | | | $ | 30,388 | | | $ | 23,537 | | | $ | 17,479 | | | $ | 13,331 | |
Ratio of net expenses to average net assets | | | 1.00 | % | | | 1.00 | % | | | 1.00 | % | | | 1.00 | % | | | 1.00 | % |
Ratio of expenses to average net assets before waiver | | | 1.49 | % | | | 1.43 | % | | | 1.55 | % | | | 1.60 | % | | | 1.66 | % |
Ratio of net investment income (loss) to average net assets | | | 0.05 | % | | | (0.14 | )% | | | 0.12 | % | | | 0.24 | % | | | 0.08 | % |
Portfolio turnover rate(b) | | | 70 | % | | | 74 | % | | | 82 | % | | | 73 | % | | | 84 | % |
(a) | Total return represents the rate that the investor would have earned or lost on an investment in the Fund, assuming reinvestment of distributions. |
(b) | Portfolio turnover is calculated on the basis on the Fund as a whole without distinguishing among the classes of shares. |
See accompanying notes which are an integral part of these financial statements.
26
MERITAGE GROWTH EQUITY FUND – INVESTOR CLASS
FINANCIAL HIGHLIGHTS
(For a share outstanding during each year)
| | | For the
Year Ended
August 31,
2019 | | | For the
Year Ended
August 31,
2018 | | | For the
Year Ended
August 31,
2017 | | | For the
Year Ended
August 31,
2016 | | | For the
Year Ended
August 31,
2015 | |
Selected Per Share Data: | | | | | | | | | | | | | | | | | | | | |
Net asset value, beginning of year | | $ | 16.53 | | | $ | 14.30 | | | $ | 12.03 | | | $ | 11.15 | | | $ | 10.92 | |
Investment operations: | | | | | | | | | | | | | | | | | | | | |
Net investment loss | | | (0.03 | ) | | | (0.06 | ) | | | — | (a) | | | — | (a) | | | (0.02 | ) |
Net realized and unrealized gain (loss) on investments | | | (0.27 | ) | | | 3.32 | | | | 2.39 | | | | 1.11 | | | | 0.37 | |
Total from investment operations | | | (0.30 | ) | | | 3.26 | | | | 2.39 | | | | 1.11 | | | | 0.35 | |
| | | | | | | | | | | | | | | | | | | | | |
Less distributions to shareholders from: | | | | | | | | | | | | | | | | | | | | |
Net investment income | | | — | | | | — | | | | — | | | | — | | | | (0.01 | ) |
Net realized gains | | | (1.05 | ) | | | (1.03 | ) | | | (0.12 | ) | | | (0.23 | ) | | | (0.11 | ) |
Total distributions | | | (1.05 | ) | | | (1.03 | ) | | | (0.12 | ) | | | (0.23 | ) | | | (0.12 | ) |
Net asset value, end of year | | $ | 15.18 | | | $ | 16.53 | | | $ | 14.30 | | | $ | 12.03 | | | $ | 11.15 | |
| | | | | | | | | | | | | | | | | | | | | |
Total Return(b) | | | (0.50 | )% | | | 23.78 | % | | | 20.02 | % | | | 10.13 | % | | | 3.17 | % |
| | | | | | | | | | | | | | | | | | | | | |
Ratios and Supplemental Data: | | | | | | | | | | | | | | | | | | | | |
Net assets, end of year (000 omitted) | | $ | 433 | | | $ | 320 | | | $ | 276 | | | $ | 367 | | | $ | 164 | |
Ratio of net expenses to average net assets | | | 1.25 | % | | | 1.25 | % | | | 1.25 | % | | | 1.25 | % | | | 1.25 | % |
Ratio of expenses to average net assets before waiver | | | 1.75 | % | | | 1.68 | % | | | 1.80 | % | | | 1.85 | % | | | 1.91 | % |
Ratio of net investment loss to average net assets | | | (0.22 | )% | | | (0.39 | )% | | | (0.10 | )% | | | (0.01 | )% | | | (0.17 | )% |
Portfolio turnover rate(c) | | | 70 | % | | | 74 | % | | | 82 | % | | | 73 | % | | | 84 | % |
(a) | Rounds to less than $0.005 per share. |
(b) | Total return represents the rate that the investor would have earned or lost on an investment in the Fund, assuming reinvestment of distributions. |
(c) | Portfolio turnover is calculated on the basis on the Fund as a whole without distinguishing among the classes of shares. |
See accompanying notes which are an integral part of these financial statements.
27
MERITAGE VALUE EQUITY FUND – INSTITUTIONAL CLASS
FINANCIAL HIGHLIGHTS
(For a share outstanding during each year)
| | | For the
Year Ended
August 31,
2019 | | | For the
Year Ended
August 31,
2018 | | | For the
Year Ended
August 31,
2017 | | | For the
Year Ended
August 31,
2016 | | | For the
Year Ended
August 31,
2015 | |
Selected Per Share Data: | | | | | | | | | | | | | | | | | | | | |
Net asset value, beginning of year | | $ | 13.71 | | | $ | 12.45 | | | $ | 11.07 | | | $ | 11.00 | | | $ | 11.00 | |
Investment operations: | | | | | | | | | | | | | | | | | | | | |
Net investment income | | | 0.13 | | | | 0.08 | | | | 0.07 | | | | 0.08 | | | | 0.10 | |
Net realized and unrealized gain (loss) on investments | | | (1.15 | ) | | | 1.25 | | | | 1.41 | | | | 0.12 | | | | 0.01 | (a) |
Total from investment operations | | | (1.02 | ) | | | 1.33 | | | | 1.48 | | | | 0.20 | | | | 0.11 | |
| | | | | | | | | | | | | | | | | | | | | |
Less distributions to shareholders from: | | | | | | | | | | | | | | | | | | | | |
Net investment income | | | (0.15 | ) | | | (0.07 | ) | | | (0.10 | ) | | | (0.09 | ) | | | (0.04 | ) |
Net realized gains | | | (0.82 | ) | | | — | | | | — | | | | (0.04 | ) | | | (0.07 | ) |
Total distributions | | | (0.97 | ) | | | (0.07 | ) | | | (0.10 | ) | | | (0.13 | ) | | | (0.11 | ) |
Net asset value, end of year | | $ | 11.72 | | | $ | 13.71 | | | $ | 12.45 | | | $ | 11.07 | | | $ | 11.00 | |
| | | | | | | | | | | | | | | | | | | | | |
Total Return(b) | | | (6.90 | )% | | | 10.70 | % | | | 13.41 | % | | | 1.85 | % | | | 0.94 | % |
| | | | | | | | | | | | | | | | | | | | | |
Ratios and Supplemental Data: | | | | | | | | | | | | | | | | | | | | |
Net assets, end of year (000 omitted) | | $ | 17,538 | | | $ | 18,145 | | | $ | 16,017 | | | $ | 13,854 | | | $ | 11,321 | |
Ratio of net expenses to average net assets | | | 1.00 | % | | | 1.00 | % | | | 1.00 | % | | | 1.00 | % | | | 1.00 | % |
Ratio of expenses to average net assets before waiver | | | 1.72 | % | | | 1.57 | % | | | 1.69 | % | | | 1.67 | % | | | 1.66 | % |
Ratio of net investment income to average net assets | | | 1.08 | % | | | 0.64 | % | | | 0.60 | % | | | 0.89 | % | | | 0.96 | % |
Portfolio turnover rate | | | 166 | % | | | 88 | % | | | 81 | % | | | 67 | % | | | 62 | % |
(a) | The amount shown for a share outstanding throughout the period does not accord with the change in aggregate gains and losses in the portfolio of securities during the period because of the timing of sales and purchases of fund shares in relation to fluctuating market values during the period. |
(b) | Total return represents the rate that the investor would have earned or lost on an investment in the Fund, assuming reinvestment of distributions. |
See accompanying notes which are an integral part of these financial statements.
28
MERITAGE YIELD-FOCUS EQUITY FUND – INSTITUTIONAL CLASS
FINANCIAL HIGHLIGHTS
(For a share outstanding during each year)
| | | For the
Year Ended
August 31,
2019 | | | For the
Year Ended
August 31,
2018 | | | For the
Year Ended
August 31,
2017 | | | For the
Year Ended
August 31,
2016 | | | For the
Year Ended
August 31,
2015 | |
Selected Per Share Data: | | | | | | | | | | | | | | | | | | | | |
Net asset value, beginning of year | | $ | 11.29 | | | $ | 10.41 | | | $ | 10.00 | | | $ | 9.44 | | | $ | 11.27 | |
Investment operations: | | | | | | | | | | | | | | | | | | | | |
Net investment income | | | 0.37 | | | | 0.35 | | | | 0.37 | | | | 0.32 | | | | 0.33 | |
Net realized and unrealized gain (loss) on investments | | | (0.85 | ) | | | 0.92 | | | | 0.40 | | | | 0.56 | | | | (1.71 | ) |
Total from investment operations | | | (0.48 | ) | | | 1.27 | | | | 0.77 | | | | 0.88 | | | | (1.38 | ) |
| | | | | | | | | | | | | | | | | | | | | |
Less distributions to shareholders from: | | | | | | | | | | | | | | | | | | | | |
Net investment income | | | (0.35 | ) | | | (0.39 | ) | | | (0.36 | ) | | | (0.32 | ) | | | (0.41 | ) |
Net realized gains | | | — | | | | — | | | | — | | | | — | | | | (0.03 | ) |
Return of capital | | | — | | | | — | | | | — | | | | — | | | | (0.01 | ) |
Total distributions | | | (0.35 | ) | | | (0.39 | ) | | | (0.36 | ) | | | (0.32 | ) | | | (0.45 | ) |
Net asset value, end of year | | $ | 10.46 | | | $ | 11.29 | | | $ | 10.41 | | | $ | 10.00 | | | $ | 9.44 | |
| | | | | | | | | | | | | | | | | | | | | |
Total Return(a) | | | (4.16 | )% | | | 12.40 | % | | | 7.79 | % | | | 9.58 | % | | | (12.56 | )% |
| | | | | | | | | | | | | | | | | | | | | |
Ratios and Supplemental Data: | | | | | | | | | | | | | | | | | | | | |
Net assets, end of year (000 omitted) | | $ | 26,883 | | | $ | 28,670 | | | $ | 26,103 | | | $ | 29,340 | | | $ | 28,316 | |
Ratio of net expenses to average net assets | | | 1.00 | % | | | 1.00 | % | | | 1.00 | % | | | 1.00 | % | | | 1.00 | % |
Ratio of expenses to average net assets before waiver | | | 1.56 | % | | | 1.50 | % | | | 1.48 | % | | | 1.49 | % | | | 1.44 | % |
Ratio of net investment income to average net assets | | | 3.41 | % | | | 3.22 | % | | | 3.49 | % | | | 3.41 | % | | | 3.17 | % |
Portfolio turnover rate(b) | | | 99 | % | | | 73 | % | | | 60 | % | | | 99 | % | | | 86 | % |
(a) | Total return represents the rate that the investor would have earned or lost on an investment in the Fund, assuming reinvestment of distributions. |
(b) | Portfolio turnover is calculated on the basis on the Fund as a whole without distinguishing among the classes of shares. |
See accompanying notes which are an integral part of these financial statements.
29
MERITAGE YIELD-FOCUS EQUITY FUND – INVESTOR CLASS
FINANCIAL HIGHLIGHTS
(For a share outstanding during each year)
| | | For the
Year Ended
August 31,
2019 | | | For the
Year Ended
August 31,
2018 | | | For the
Year Ended
August 31,
2017 | | | For the
Year Ended
August 31,
2016 | | | For the
Year Ended
August 31,
2015 | |
Selected Per Share Data: | | | | | | | | | | | | | | | | | | | | |
Net asset value, beginning of year | | $ | 11.40 | | | $ | 10.51 | | | $ | 9.98 | | | $ | 9.42 | | | $ | 11.25 | |
Investment operations: | | | | | | | | | | | | | | | | | | | | |
Net investment income | | | 0.30 | | | | 0.33 | | | | 0.32 | (a) | | | 0.32 | | | | 0.29 | |
Net realized and unrealized gain (loss) on investments | | | (0.81 | ) | | | 0.92 | | | | 0.46 | | | | 0.54 | | | | (1.70 | ) |
Total from investment operations | | | (0.51 | ) | | | 1.25 | | | | 0.78 | | | | 0.86 | | | | (1.41 | ) |
| | | | | | | | | | | | | | | | | | | | | |
Less distributions to shareholders from: | | | | | | | | | | | | | | | | | | | | |
Net investment income | | | (0.33 | ) | | | (0.36 | ) | | | (0.25 | ) | | | (0.30 | ) | | | (0.38 | ) |
Net realized gains | | | — | | | | — | | | | — | | | | — | | | | (0.03 | ) |
Return of capital | | | — | | | | — | | | | — | | | | — | | | | (0.01 | ) |
Total distributions | | | (0.33 | ) | | | (0.36 | ) | | | (0.25 | ) | | | (0.30 | ) | | | (0.42 | ) |
Net asset value, end of year | | $ | 10.56 | | | $ | 11.40 | | | $ | 10.51 | | | $ | 9.98 | | | $ | 9.42 | |
| | | | | | | | | | | | | | | | | | | | | |
Total Return(b) | | | (4.45 | )% | | | 12.09 | % | | | 7.93 | % | | | 9.35 | % | | | (12.85 | )% |
| | | | | | | | | | | | | | | | | | | | | |
Ratios and Supplemental Data: | | | | | | | | | | | | | | | | | | | | |
Net assets, end of year (000 omitted) | | $ | 738 | | | $ | 660 | | | $ | 644 | | | $ | 10,714 | | | $ | 10,708 | |
Ratio of net expenses to average net assets | | | 1.25 | % | | | 1.25 | % | | | 1.25 | % | | | 1.25 | % | | | 1.25 | % |
Ratio of expenses to average net assets before waiver | | | 1.82 | % | | | 1.75 | % | | | 1.73 | % | | | 1.74 | % | | | 1.69 | % |
Ratio of net investment income to average net assets | | | 3.16 | % | | | 2.97 | % | | | 3.18 | % | | | 3.17 | % | | | 2.84 | % |
Portfolio turnover rate(c) | | | 99 | % | | | 73 | % | | | 60 | % | | | 99 | % | | | 86 | % |
(a) | Per share amounts calculated using average shares method. |
(b) | Total return represents the rate that the investor would have earned or lost on an investment in the Fund, assuming reinvestment of distributions. |
(c) | Portfolio turnover is calculated on the basis on the Fund as a whole without distinguishing among the classes of shares. |
See accompanying notes which are an integral part of these financial statements.
30
MERITAGE FUNDS
NOTES TO THE FINANCIAL STATEMENTS
August 31, 2019
NOTE 1. ORGANIZATION
The Meritage Growth Equity Fund (the “Growth Equity Fund”), the Meritage Value Equity Fund (the “Value Equity Fund”), and the Meritage Yield-Focus Equity Fund (the “Yield-Focus Equity Fund”) (each a “Fund” and, collectively the “Funds”) were each organized as a diversified series of Capitol Series Trust (the “Trust”). The Trust is an open-end investment company established under the laws of Ohio by an Agreement and Declaration of Trust dated September 18, 2013 (the “Trust Agreement”). The Trust Agreement permits the Trust’s Board of Trustees (the “Board”) to issue an unlimited number of shares of beneficial interest of separate series without par value. The Growth Equity and Yield-Focus Equity Funds each offer two share classes, Institutional Class Shares and Investor Class Shares. The Value Equity Fund currently offers only Institutional Class Shares. The Funds commenced operations on December 23, 2013. The Funds’ investment adviser is Meritage Portfolio Management, Inc. (the “Adviser”). The investment objective of the Growth Equity Fund is to seek growth of capital. The investment objective of the Value Equity Fund is to seek growth of capital. Income is a secondary objective for the Value Equity Fund. The investment objective of the Yield-Focus Equity Fund is to seek long-term growth of capital with an emphasis on high current income.
Each Fund’s prospectus provides a description of the investment objective, policies and strategies, along with information on the classes of shares currently being offered.
NOTE 2. SIGNIFICANT ACCOUNTING POLICIES
The Funds are investment companies and follow accounting and reporting guidance under Financial Accounting Standards Board Accounting Standards Codification (“ASC”) Topic 946, “Financial Services-Investment Companies”. The following is a summary of significant accounting policies followed by the Funds in the preparation of their financial statements. These policies are in conformity with the generally accepted accounting principles in the United States of America (“GAAP”).
Estimates – The preparation of financial statements in conformity with GAAP requires management to make estimates and assumptions that affect the reported amounts of assets and liabilities and disclosure of contingent assets and liabilities at the date of the financial statements and the reported amounts of increases and decreases in net assets from operations during the reporting period. Actual results could differ from those estimates.
Foreign Currency Translation – The accounting records of the Funds are maintained in U.S. dollars. Foreign currency amounts are translated into U.S. dollars at the current rate of exchange each business day to determine the value of investments, and other assets and liabilities. Purchases and sales of foreign securities, and income and expenses, are translated at the prevailing rate of exchange on the respective date of these transactions. The Funds do not isolate that portion of the results of operations resulting from changes in foreign exchange rates on investments from fluctuation arising from changes in market prices of securities held. These fluctuations are included with the unrealized gain or loss from investments.
Federal Income Taxes – The Funds make no provision for federal income or excise tax. Each Fund has qualified and intends to qualify each year as a regulated investment company (“RIC”) under subchapter M of the Internal Revenue Code of 1986, as amended (the “Code”), by complying with the requirements applicable to RICs and by distributing substantially all of its taxable income. Each Fund also intends to distribute sufficient net investment income and net capital gains, if any, so that it will not be subject to excise tax on undistributed income and gains. If the required amount of net investment income or gains is not distributed, the Fund could incur a tax expense.
31
MERITAGE FUNDS
NOTES TO THE FINANCIAL STATEMENTS – (continued)
August 31, 2019
NOTE 2. SIGNIFICANT ACCOUNTING POLICIES – continued
The Funds may be subject to taxes imposed by countries in which it invests. Such taxes are generally based on income and/or capital gains earned or repatriated. Taxes are accrued and applied to net investment income, net realized gains and unrealized appreciation as such income and/or gains are earned.
The Funds recognize tax benefits or expenses of uncertain tax positions only when the position is “more likely than not” to be sustained assuming examination by tax authorities. Management of the Funds has reviewed tax positions taken in tax years that remain subject to examination by all major tax jurisdictions, including federal (i.e., the previous three tax year ends and the interim tax period since then, as applicable) and has concluded that no provision for unrecognized tax benefits or expenses is required in these financial statements and does not expect this to change over the next twelve months. The Funds recognize interest and penalties, if any, related to unrecognized tax benefits as income tax expense in the Statement of Operations. During the period, the Funds did not incur any interest or penalties.
Expenses – Expenses incurred by the Trust that do not relate to a specific fund of the Trust are allocated to the individual funds based on each fund’s relative net assets or another appropriate basis (as determined by the Board). Expenses specifically attributable to any class are borne by that class. Income, realized gains and losses, unrealized appreciation and depreciation, and Fund-wide expenses not allocated to a particular class shall be allocated to each class based on the net assets of that class in relation to the net assets of the entire Fund.
Security Transactions and Related Income – Throughout the reporting period, security transactions are accounted for no later than one business day following the trade date. For financial reporting purposes, security transactions are accounted for on trade date on the last business day of the reporting period. The specific identification method is used for determining gains or losses for financial statements and income tax purposes. Dividend income is recorded on the ex-dividend date and interest income is recorded on an accrual basis. Dividend income from real estate investment trusts (REITs) and distributions from limited partnerships are recognized on the ex-date and included in dividend income. The calendar year-end classification of distributions received from REITs during the fiscal year are reported subsequent to year end; accordingly, the Fund estimates the character of REIT distributions based on the most recent information available. Income or loss from limited partnerships is reclassified among the components of net assets upon receipt of K-1’s. Discounts and premiums on fixed income securities purchased are amortized or accreted over the life of the respective securities using the effective interest method.
Dividends and Distributions – Each Fund intends to distribute substantially all of its net investment income, if any, as dividends to its shareholders on at least an annual basis, except for Yield-Focus Fund which will normally distribute dividends on a quarterly basis. Each Fund intends to distribute its net realized long term capital gains and its net realized short term capital gains, if any, at least once a year. Dividends to shareholders, which are determined in accordance with income tax regulations, are recorded on the ex-dividend date. The treatment for financial reporting purposes of distributions made to shareholders during the period from net investment income or net realized capital gains may differ from their ultimate treatment for federal income tax purposes. These differences are caused primarily by differences in the timing of the recognition of certain components of income, expense or realized capital gains for federal income tax purposes. Where such differences are permanent in nature, they are reclassified in the components of the net assets based on their ultimate characterization for federal income tax purposes. Any such reclassifications will have no effects on net assets, results of operations or net asset values (“NAV”) per share of the Funds.
32
MERITAGE FUNDS
NOTES TO THE FINANCIAL STATEMENTS – (continued)
August 31, 2019
NOTE 2. SIGNIFICANT ACCOUNTING POLICIES – continued
For the fiscal year ended August 31, 2019, the Funds made the following reclassifications to increase (decrease) the components of net assets:
| | | Paid-In Capital | | | Accumulated
earnings
(deficit) | |
Growth Equity Fund | | $ | (1 | ) | | $ | 1 | |
Yield-Focus Equity Fund | | | (9,009 | ) | | | 9,009 | |
NOTE 3. SECURITIES VALUATION AND FAIR VALUE MEASUREMENTS
Fair value is defined as the price that a Fund would receive upon selling an investment in a timely transaction to an independent buyer in the principal or most advantageous market of the investment. GAAP establishes a three-tier hierarchy to maximize the use of observable market data and minimize the use of unobservable inputs and to establish classification of fair value measurements for disclosure purposes.
Inputs refer broadly to the assumptions that market participants would use in pricing the asset or liability, including assumptions about risk (the risk inherent in a particular valuation technique used to measure fair value including a pricing model and/or the risk inherent in the inputs to the valuation technique). Inputs may be observable or unobservable. Observable inputs are inputs that reflect the assumptions market participants would use in pricing the asset or liability developed based on market data obtained and available from sources independent of the reporting entity. Unobservable inputs are inputs that reflect the reporting entity’s own assumptions about the assumptions market participants would use in pricing the asset or liability developed based on the best information available in the circumstances.
Various inputs are used in determining the value of each Fund’s investments. These inputs are summarized in the three broad levels listed below.
| | ● | Level 1 – unadjusted quoted prices in active markets for identical investments and/or registered investment companies where the value per share is determined and published and is the basis for current transactions for identical assets or liabilities at the valuation date |
| | ● | Level 2 – other significant observable inputs (including, but not limited to, quoted prices for an identical security in an inactive market, quoted prices for similar securities, interest rates, prepayment speeds, credit risk, etc.) |
| | ● | Level 3 – significant unobservable inputs (including the Funds’ own assumptions in determining fair value of investments based on the best information available) |
The inputs used to measure fair value may fall into different levels of the fair value hierarchy. In such cases, for disclosure purposes, the level in the fair value hierarchy which is reported, is determined based on the lowest level input that is significant to the fair value measurement in its entirety.
In computing the NAV of the Funds, fair value is based on market valuations with respect to portfolio securities for which market quotations are readily available. Pursuant to Board approved policies, the Funds rely on independent third-party pricing services to provide the current market value of securities. Those pricing services value equity securities, including exchange-traded funds, exchange-traded notes, closed-end funds and convertible preferred
33
MERITAGE FUNDS
NOTES TO THE FINANCIAL STATEMENTS – (continued)
August 31, 2019
NOTE 3. SECURITIES VALUATION AND FAIR VALUE MEASUREMENTS – continued
stocks, traded on a securities exchange at the last reported sales price on the principal exchange. Equity securities quoted by NASDAQ are valued at the NASDAQ Official Closing Price. If there is no reported sale on the principal exchange, equity securities are valued at the mean between the most recent quoted bid and asked price. When using the market quotations or close prices provided by the pricing service and when the market is considered active, the security will be classified as a Level 1 security. Investments in open-end mutual funds, including money market mutual funds, are generally priced at the ending NAV provided by the pricing service of the funds and are generally categorized as Level 1 securities. Debt securities are valued using evaluated prices furnished by a pricing vendor selected by the Board and are generally classified as Level 2 securities.
In the event that market quotations are not readily available, the Adviser determines that the market quotation or the price provided by the pricing service does not accurately reflect the current fair value, or certain restricted or illiquid securities are being valued, such securities are valued as determined in good faith by the Trust’s Valuation Committee, based on recommendations from a pricing committee comprised of various officers of the Trust, various employees of the Fund’s administrator, and representatives of the Adviser (together the “Pricing Review Committee”). These securities will be classified as Level 2 or 3 within the fair value hierarchy, depending on the inputs used.
In accordance with the Trust’s Portfolio Valuation Procedures, the Pricing Review Committee, in making its recommendations, is required to consider all appropriate factors relevant to the value of securities for which it has determined other pricing sources are not available or reliable as described above. No single standard exists for determining fair value, because fair value depends upon the circumstances of each individual case. As a general principle, the current fair value of an issue of securities being valued pursuant to the Trust’s Fair Value Guidelines would be the amount which the Funds might reasonably expect to receive for them upon their current sale. Methods which are in accordance with this principle may, for example, be based on (i) a multiple of earnings; (ii) a discount from market prices of a similar freely traded security (including a derivative security or a basket of securities traded on other markets, exchanges or among dealers); or (iii) yield to maturity with respect to debt issues, or a combination of these and other methods. Fair value pricing is permitted if, in accordance with the Trust’s Portfolio Valuation Procedures, the validity of market quotations appears to be questionable based on factors such as evidence of a thin market in the security based on a small number of quotations, a significant event occurs after the close of a market but before each Fund’s NAV calculation that may affect a security’s value, or other data calls into question the reliability of market quotations.
The following is a summary of the inputs used to value the Funds’ investments as of August 31, 2019:
| | | Valuation Inputs | |
| | | Level 1 | | | Level 2 | | | Level 3 | | | Total | |
Growth Equity Fund | | | | | | | | | | | | | | | | |
Common Stocks(a) | | $ | 30,175,993 | | | $ | — | | | $ | — | | | $ | 30,175,993 | |
Exchange-Traded Funds | | | 1,331,654 | | | | — | | | | — | | | | 1,331,654 | |
Money Market Funds | | | 888,913 | | | | — | | | | — | | | | 888,913 | |
Total | | $ | 32,396,560 | | | $ | — | | | $ | — | | | $ | 32,396,560 | |
| | | | | | | | | | | | | | | | | |
Value Equity Fund | | | | | | | | | | | | | | | | |
Common Stocks(a) | | $ | 16,095,542 | | | $ | — | | | $ | — | | | $ | 16,095,542 | |
Exchange-Traded Funds | | | 1,150,638 | | | | — | | | | — | | | | 1,150,638 | |
Money Market Funds | | | 426,642 | | | | — | | | | — | | | | 426,642 | |
Total | | $ | 17,672,822 | | | $ | — | | | $ | — | | | $ | 17,672,822 | |
| | | | | | | | | | | | | | | | | |
34
MERITAGE FUNDS
NOTES TO THE FINANCIAL STATEMENTS – (continued)
August 31, 2019
NOTE 3. SECURITIES VALUATION AND FAIR VALUE MEASUREMENTS – continued
| | | Valuation Inputs | |
| | | Level 1 | | | Level 2 | | | Level 3 | | | Total | |
Yield-Focus Equity Fund | | | | | | | | | | | | | | | | |
Common Stocks(a) | | $ | 24,217,255 | | | $ | — | | | $ | — | | | $ | 24,217,255 | |
Convertible Preferred Stocks | | | 1,861,778 | | | | — | | | | — | | | | 1,861,778 | |
Exchange-Traded Funds | | | 994,150 | | | | — | | | | — | | | | 994,150 | |
Money Market Funds | | | 1,461,992 | | | | — | | | | — | | | | 1,461,992 | |
Total | | $ | 28,535,175 | | | $ | — | | | $ | — | | | $ | 28,535,175 | |
(a) | Refer to Schedule of Investments for sector classifications. |
The Funds did not hold any investments at the end of the reporting period for which significant unobservable inputs (Level 3) were used in determining fair value; therefore, no reconciliation of Level 3 securities is included for this reporting period.
NOTE 4. FEES AND OTHER TRANSACTIONS WITH AFFILIATES AND OTHER SERVICE PROVIDERS
Under the terms of the management agreement, on behalf of the Funds (the “Agreement”), the Adviser manages each Fund’s investments subject to approval of the Board. As compensation for its management services, each Fund is obligated to pay the Adviser a fee computed and accrued daily and paid monthly at an annual rate of 0.75% of the average daily net assets of each Fund. For the fiscal year ended August 31, 2019, the Adviser earned fees of $212,509 from the Growth Equity Fund, $119,176 from the Value Equity Fund and $212,625 from the Yield-Focus Equity Fund before the waiver/reimbursement described below. At August 31, 2019, the Growth Equity Fund owed the Adviser $6,049, the Yield-Focus Fund owed the Adviser $850, and the Adviser owed the Value Equity Fund $3,462.
The Adviser has contractually agreed to waive its management fee and/or reimburse so that total annual operating expenses (excluding (i) interest; (ii) taxes; (iii) brokerage fees and commissions; (iv) other extraordinary expenses not incurred in the ordinary course of the Fund’s business; (v) dividend expenses on short sales; (vi) expenses incurred under a Rule 12b-1 plan of distribution; and (vii) indirect expenses such as acquired fund fees and expenses) do not exceed 1.00% of each Fund’s average daily net assets through December 31, 2019 (“Expense Limitation”). During any fiscal year that the Investment Advisory Agreement between the Adviser and the Trust is in effect, the Adviser may recoup the sum of all fees previously waived or expenses reimbursed, less any reimbursement previously paid, provided that the Adviser is only permitted to recoup fees or expenses within 36 months from the date the fee waiver or expense reimbursement first occurred and provided further that such recoupment can be achieved within the Expense Limitation Agreement currently in effect and the Expense Limitation Agreement in place when the waiver/reimbursement occurred. This Expense Limitation Agreement may be terminated by the Board at any time. The Expense Limitation Agreement terminates automatically upon the termination of the Advisory Agreement with the Adviser.
35
MERITAGE FUNDS
NOTES TO THE FINANCIAL STATEMENTS – (continued)
August 31, 2019
NOTE 4. FEES AND OTHER TRANSACTIONS WITH AFFILIATES AND OTHER SERVICE PROVIDERS – continued
As of August 31, 2019, the Adviser may seek repayment of investment advisory fee waivers and expense reimbursements up to the amounts as follows:
Recoverable through | | Growth
Equity Fund | | | Value
Equity Fund | | | Yield-Focus
Equity Fund | |
August 31, 2020 | | $ | 110,633 | | | $ | 98,784 | | | $ | 152,868 | |
August 31, 2021 | | | 114,614 | | | | 98,202 | | | | 140,740 | |
August 31, 2022 | | | 139,228 | | | | 113,776 | | | | 159,986 | |
The Trust retains Ultimus Asset Services, LLC (the “Administrator”) to provide the Funds with non-investment related administration and compliance, fund accounting and transfer agent services. For the fiscal year ended August 31, 2019, fees incurred for administration, fund accounting, transfer agent and compliance services, and the amounts due to the Administrator at August 31, 2019 were as follows:
| | | Growth
Equity Fund | | | Value
Equity Fund | | | Yield-Focus
Equity Fund | |
Administration | | $ | 44,120 | | | $ | 24,515 | | | $ | 44,160 | |
Fund accounting | | | 29,250 | | | | 16,410 | | | | 29,440 | |
Transfer agent | | | 23,410 | | | | 13,108 | | | | 23,532 | |
Compliance services | | | 3,000 | | | | 3,000 | | | | 3,000 | |
Payable to Administrator | | | 8,650 | | | | 4,750 | | | | 8,150 | |
The Board supervises the business activities of the Trust. Each Trustee serves as a Trustee for the lifetime of the Trust or until the earlier of his or her retirement as a Trustee at age 78 (which may be extended for up to two years in an emeritus non-voting capacity at the pleasure and request of the Board), or until he/she dies, resigns, or is removed, whichever is sooner. “Independent Trustees,” meaning those Trustees who are not “interested persons” as defined in the Investment Company Act of 1940 (“1940 Act”) of the Trust, each receives an annual retainer of $500 per Fund and $500 per Fund for each quarterly in-person Board meeting. In addition, the Trust reimburses Trustees for out-of-pocket expense incurred in conjunction with attendance at Board meetings.
The officers and one Trustee of the Trust are employees of the Administrator. Unified Financial Securities, LLC (the “Distributor”) acts as the principal distributor of each Fund’s shares. Both the Administrator and the Distributor operate as wholly-owned subsidiaries of Ultimus Fund Solutions, LLC.
The Funds have adopted a Distribution Plan (the “Plan”) pursuant to Rule 12b-1 under the 1940 Act. The Plan provides that the Funds will pay the Distributor and/or any registered securities dealer, financial institution or any other person (the “Recipient”) a fee of 0.25% of the average daily net assets of each Fund’s Investor Shares in connection with the promotion and distribution of each Fund’s Investor Shares or the provision of personal services to shareholders, including, but not necessarily limited to, advertising, compensation to underwriters, dealers and selling personnel, the printing and mailing of prospectuses to other than current shareholders of Investor Shares, the printing and mailing of sales literature and servicing shareholder accounts (“12b-1 Expense”). The Funds or Distributor may pay all or a portion of these fees to any Recipient who renders assistance in distributing or promoting the sale of shares, or who provides certain shareholder services, pursuant to a written agreement. The Plan is a compensation plan, which means that compensation is provided regardless of 12b-1 expenses actually incurred. For the fiscal year ended August 31, 2019, Investor Shares 12b-1 expense incurred by the Growth Equity Fund was $913 and $1,637 for the Yield-Focus Equity Fund. At August 31, 2019, the Distributor was owed $186 by the Growth Equity Fund and $305 for the Yield-Focus Equity Fund for Investor Shares 12b-1 expenses.
36
MERITAGE FUNDS
NOTES TO THE FINANCIAL STATEMENTS – (continued)
August 31, 2019
NOTE 5. PURCHASES AND SALES OF SECURITIES
For the fiscal year ended August 31, 2019, purchases and sales of investment securities, other than short-term investments were as follows:
| | | Growth
Equity Fund | | | Value
Equity Fund | | | Yield-Focus
Equity Fund | |
Purchases | | $ | 21,329,211 | | | $ | 26,706,804 | | | $ | 28,231,958 | |
Sales | | | 19,100,762 | | | | 25,798,963 | | | | 26,949,952 | |
There were no purchases or sales of long-term U.S. government obligations during the fiscal year ended August 31, 2019.
NOTE 6. FEDERAL TAX INFORMATION
At August 31, 2019, the net unrealized appreciation (depreciation) of investments for tax purposes was as follows:
| | | Growth
Equity Fund | | | Value
Equity Fund | | | Yield-Focus
Equity Fund | |
Gross unrealized appreciation | | $ | 8,371,331 | | | $ | 1,248,161 | | | $ | 2,512,543 | |
Gross unrealized depreciation | | | (171,611 | ) | | | (450,524 | ) | | | (1,057,881 | ) |
Net unrealized appreciation/(depreciation) on investments | | $ | 8,199,720 | | | $ | 797,637 | | | $ | 1,454,662 | |
Tax cost of investments | | $ | 24,196,840 | | | $ | 16,875,185 | | | $ | 27,080,513 | |
The tax character of distributions for the fiscal years ended August 31, 2019 and August 31, 2018 were as follows:
| | | Growth Equity Fund | | | Value Equity Fund | | | Yield-Focus Equity Fund | |
| | | 2019 | | | 2018 | | | 2019 | | | 2018 | | | 2019 | | | 2018 | |
Distributions paid from: | | | | | | | | | | | | | | | | | | | | | | | | |
Ordinary Income(a) | | $ | 143,008 | | | $ | 22,259 | | | $ | 177,503 | | | $ | 90,492 | | | $ | 921,091 | | | $ | 982,449 | |
Net Long-Term Capital Gains | | | 1,648,471 | | | | 1,725,308 | | | | 1,004,882 | | | | — | | | | — | | | | — | |
Return of Capital | | | 1 | | | | — | | | | — | | | | — | | | | — | | | | — | |
Total Distributions Paid | | $ | 1,791,480 | | | $ | 1,747,567 | | | $ | 1,182,385 | | | $ | 90,492 | | | $ | 921,091 | | | $ | 982,449 | |
(a) | Short term capital gain distributions are treated as ordinary income for tax purposes. |
At August 31, 2019, the components of distributable earnings (accumulated losses) on a tax basis was as follows:
| | | Growth
Equity Fund | | | Value
Equity Fund | | | Yield-Focus
Equity Fund | |
Undistributed ordinary income | | $ | — | | | $ | 96,700 | | | $ | 147,153 | |
Undistributed long-term capital gains | | | — | | | | 683,399 | | | | — | |
Accumulated capital and other losses | | | (482,303 | ) | | | — | | | | (3,284,079 | ) |
Unrealized appreciation on investments(a) | | | 8,199,720 | | | | 797,637 | | | | 1,454,662 | |
Total accumulated earnings (deficit) | | $ | 7,717,417 | | | $ | 1,577,736 | | | $ | (1,682,264 | ) |
(a) | The difference between book basis and tax basis unrealized appreciation is primarily attributable to the tax deferral of wash losses, return of capital adjustments, interest accruals on trust preferred securities and mark-to-market of passive foreign investment companies. |
37
MERITAGE FUNDS
NOTES TO THE FINANCIAL STATEMENTS – (continued)
August 31, 2019
NOTE 6. FEDERAL TAX INFORMATION – continued
As of August 31, 2019, the Growth Equity and Yield-Focus Equity Fund had available for tax purposes an unused capital loss carryforward of $473,276 and $3,284,079, respectively, of short-term capital losses with no expiration, which was available to offset against future taxable net capital gains. To the extent that these carryforwards are used to offset future gains, it is probable that the amount offset will not be distributed to shareholders.
Certain qualified losses incurred after October 31, and within the current taxable year, are deemed to arise on the first business day of the Fund’s following taxable year. For the tax year ended August 31, 2019, the Growth Equity Fund deferred post October qualified losses in the amount of $9,027.
NOTE 7. COMMITMENTS AND CONTINGENCIES
The Trust indemnifies its officers and Trustees for certain liabilities that may arise from their performance of their duties to the Trust or the Funds. Additionally, in the normal course of business, the Trust enters into contracts that contain a variety of representations and warranties which provide general indemnifications. The Trust’s maximum exposure under these arrangements is unknown, as this would involve future claims that may be made against the Trust that have not yet occurred.
NOTE 8. RECENT ACCOUNTING PRONOUNCEMENT
In August 2018, the FASB issued Accounting Standards Update (“ASU”) 2018-13, which changes the fair value measurement disclosure requirements of FASB ASC Topic 820, Fair Value Measurement. The update to Topic 820 includes new, eliminated, and modified disclosure requirements. ASU 2018-13 is effective for fiscal years beginning after December 15, 2019, including interim periods, although early adoption is permitted. Management has evaluated the implications of certain provisions of ASU 2018-13 and has determined to early adopt all aspects related to the removal and modification of certain fair value measurement disclosures. The impact of the adoption was not material to the Funds’ financial statements.
NOTE 9. SUBSEQUENT EVENTS
Management of the Funds has evaluated the need for disclosures and/or adjustments resulting from subsequent events through the date at which these financial statements were issued. Based upon this evaluation, management has determined there were no items requiring adjustment of the financial statements or additional disclosure.
38
REPORT OF INDEPENDENT REGISTERED PUBLIC ACCOUNTING FIRM
To the Shareholders and the Board of Trustees of Meritage Growth Equity Fund, Meritage Value Equity Fund, and Meritage Yield-Focus Equity Fund
Opinion on the Financial Statements
We have audited the accompanying statements of assets and liabilities of Meritage Growth Equity Fund, Meritage Value Equity Fund, and Meritage Yield-Focus Equity Fund (collectively referred to as the “Funds”) (three of the funds constituting Capitol Series Trust (the “Trust”)), including the schedules of investments, as of August 31, 2019, and the related statements of operations for the year then ended, the statements of changes in net assets for each of the two years in the period then ended, the financial highlights for each of the three years in the period then ended and the related notes (collectively referred to as the “financial statements”). In our opinion, the financial statements present fairly, in all material respects, the financial position of the Funds (three of the funds constituting Capitol Series Trust) at August 31, 2019, the results of their operations for the year then ended, the changes in their net assets for each of the two years in the period then ended and their financial highlights for each of the three years in the period then ended, in conformity with U.S. generally accepted accounting principles.
The financial highlights for the year ended August 31, 2015 and the year ended August 31, 2016 were audited by other auditors whose report dated October 26, 2016, expressed an unqualified opinion on those financial highlights.
Basis for Opinion
These financial statements are the responsibility of the Trust’s management. Our responsibility is to express an opinion on each of the Funds’ financial statements based on our audits. We are a public accounting firm registered with the Public Company Accounting Oversight Board (United States) (“PCAOB”) and are required to be independent with respect to the Trust in accordance with the U.S. federal securities laws and the applicable rules and regulations of the Securities and Exchange Commission and the PCAOB.
We conducted our audits in accordance with the standards of the PCAOB. Those standards require that we plan and perform the audit to obtain reasonable assurance about whether the financial statements are free of material misstatement, whether due to error or fraud. The Trust is not required to have, nor were we engaged to perform, an audit of Trust’s internal control over financial reporting. As part of our audits we are required to obtain an understanding of internal control over financial reporting but not for the purpose of expressing an opinion on the effectiveness of the Trust’s internal control over financial reporting. Accordingly, we express no such opinion.
Our audits included performing procedures to assess the risks of material misstatement of the financial statements, whether due to error or fraud, and performing procedures that respond to those risks. Such procedures included examining, on a test basis, evidence regarding the amounts and disclosures in the financial statements. Our procedures included confirmation of securities owned as of August 31, 2019, by correspondence with the custodian and brokers or by other appropriate auditing procedures where replies from brokers were not received. Our audits also included evaluating the accounting principles used and significant estimates made by management, as well as evaluating the overall presentation of the financial statements. We believe that our audits provide a reasonable basis for our opinion.

We have served as the auditor of one or more Capitol Series Trust investment companies since 2017.
Cincinnati, Ohio
October 29, 2019
39
SUMMARY OF FUND EXPENSES – (Unaudited)
As a shareholder of one of the Funds, you incur two types of costs: (1) transaction costs and (2) ongoing costs, including management fees and other Fund expenses. These examples are intended to help you understand your ongoing costs (in dollars) of investing in each Fund and to compare these costs with the ongoing costs of investing in other mutual funds. Each Fund’s example is based on an investment of $1,000 invested at the beginning of the period and held for the entire period from March 1, 2019 through August 31, 2019.
Actual Expenses
The first line of the table for each class provides information about actual account values and actual expenses. You may use the information in these lines, together with the amount you invested, to estimate the expenses that you paid over the period. Simply divide your account value by $1,000 (for example, an $8,600 account value divided by $1,000 = 8.60), then multiply the result by the number in the first line under the heading “Expenses Paid During Period” to estimate the expenses you paid on your account during this period.
Hypothetical Example for Comparison Purposes
The second line of the table for each class provides information about hypothetical account values and hypothetical expenses based on each Fund’s actual expense ratios and an assumed rate of return of 5% per year before expenses, which is not the Fund’s actual return. The hypothetical account values and expenses may not be used to estimate the actual ending account balances or expenses you paid for the period. You may use this information to compare the ongoing costs of investing in the Funds and other funds. To do so, compare this 5% hypothetical example with the 5% hypothetical examples that appear in the shareholder reports of the other funds.
Expenses shown in the table are meant to highlight your ongoing costs only and do not reflect any transactional costs. Therefore, the second line of the table for each class is useful in comparing ongoing costs only and will not help you determine the relative total costs of owning different funds. In addition, if transaction costs were included, your costs would have been higher.
| | Beginning
Account Value
March 1, 2019 | Ending
Account Value
August 31, 2019 | Expenses
Paid During
Period(a) | Annualized
Expense
Ratio |
Meritage Growth Equity Fund
Institutional Class | | | | |
Actual | $ 1,000.00 | $ 1,057.80 | $ 5.19 | 1.00% |
Hypothetical(b) | $ 1,000.00 | $ 1,020.16 | $ 5.09 | 1.00% |
Investor Class | | | | |
Actual | $ 1,000.00 | $ 1,056.40 | $ 6.48 | 1.25% |
Hypothetical(b) | $ 1,000.00 | $ 1,018.90 | $ 6.36 | 1.25% |
Meritage Value Equity Fund
Institutional Class | | | | |
Actual | $ 1,000.00 | $ 979.90 | $ 4.99 | 1.00% |
Hypothetical(b) | $ 1,000.00 | $ 1,020.16 | $ 5.09 | 1.00% |
40
SUMMARY OF FUND EXPENSES – (Unaudited) (continued)
| | Beginning
Account Value
March 1, 2019 | Ending
Account Value
August 31, 2019 | Expenses
Paid During
Period(a) | Annualized
Expense
Ratio |
Meritage Yield-Focus Equity Fund
Institutional Class | | | | |
Actual | $ 1,000.00 | $ 966.30 | $ 4.96 | 1.00% |
Hypothetical(b) | $ 1,000.00 | $ 1,020.16 | $ 5.09 | 1.00% |
Investor Class | | | | |
Actual | $ 1,000.00 | $ 964.60 | $ 6.19 | 1.25% |
Hypothetical(b) | $ 1,000.00 | $ 1,018.90 | $ 6.36 | 1.25% |
(a) | Expenses are equal to the Fund’s annualized expense ratios, multiplied by the average account value over the period, multiplied by 184/365 (to reflect the one-half year period). |
(b) | Hypothetical assumes 5% annual return before expenses. |
41
TRUSTEES AND OFFICERS – (Unaudited)
The Board supervises the business activities of the Trust and is responsible for protecting the interests of shareholders. The Chairman of the Board is Walter B. Grimm, who is an Independent Trustee of the Trust.
Each Trustee serves as a Trustee for the lifetime of the Trust or until the earlier of his or her retirement as a Trustee at age 78, death, resignation or removal. Officers are re-elected annually by the Board. The address of each Trustee and officer is 225 Pictoria Drive, Suite 450, Cincinnati, Ohio 45246.
As of the date of this report, the Trustees oversee the operations of 15 series.
Interested Trustee Background. The following table provides information regarding the Interested Trustee.
Name, Address, (Age), Position with Trust,
Term of Position with Trust | Principal Occupation During Past 5 Years
and Other Directorships |
Robert G. Dorsey*
Age: 62
TRUSTEE
Began Serving: March 2017 | Principal Occupation(s): Vice Chairman of Ultimus Fund Solutions, LLC and its subsidiaries, except as otherwise noted for the FINRA-regulated broker-dealer entities (February 2019 to present); Interested Trustee of Ultimus Managers Trust (February 2012 to present).
Previous Position(s): Managing Director and Co-Chief Executive Officer of Ultimus Fund Solutions, LLC (1999 to February 2019); President of Ultimus Fund Distributors, LLC (1999 to 2018); President of Ultimus Managers Trust (February 2012 to October 2013). |
* | Mr. Dorsey is considered an “interested person” of the Trust within the meaning of Section 2(a)(19) of the 1940 Act because of his relationship with the Trust’s administrator, transfer agent, and distributors. |
Independent Trustee Background. The following table provides information regarding the Independent Trustees.
Name, Address, (Age), Position with Trust,
Term of Position with Trust | Principal Occupation During Past 5 Years
and Other Directorships |
John C. Davis
Age: 67
TRUSTEE
Began Serving: July 2018 | Principal Occupations(s): Consultant (government services) since May 2011.
Previous Position(s): Retired Partner of PricewaterhouseCoopers LLP (1974-2010); Consultant, Board of Trustees of Ultimus Managers Trust (2016 to 2019) and Former Trustee of Ultimus Managers Trust (2012 to 2016). |
Walter B. Grimm
Age: 74
TRUSTEE AND CHAIR
Began Serving: November 2013 | Principal Occupations(s): President, Leigh Management Group, LLC (consulting firm) (October 2005 to present); and President, Leigh Investments, Inc. (1988 to present).
Previous Position(s): Chief Financial Officer, East West Private, LLC (consulting firm) (2009 to 2013). |
42
TRUSTEES AND OFFICERS – (Unaudited) (continued)
Name, Address, (Age), Position with Trust,
Term of Position with Trust | Principal Occupation During Past 5 Years
and Other Directorships |
Lori Kaiser
Age: 56
TRUSTEE
Began Serving: July 2018 | Principal Occupations(s): Founder and CEO, Kaiser Consulting since 1992. |
Janet Smith Meeks
Age: 64
TRUSTEE
Began Serving: July 2018 | Principal Occupations(s): Co-Founder and CEO, Healthcare Alignment Advisors, LLC (consulting company) since August 2015.
Previous Position(s): President and Chief Operating Officer, Mount Carmel St. Ann’s Hospital (2006 to 2015). |
Mary M. Morrow
Age: 61
TRUSTEE
Began Serving: November 2013 | Principal Occupations(s): Chief Operating Officer, Dignity Health Managed Services Organization (October 2018 to present).
Previous Position(s): Consultant (managed care services) (April 2018 to September 2018); Chief Operating Officer, Pennsylvania Health and Wellness (fully owned subsidiary of Centene Corporation) (November 2016 to April 2018); Vice President, Strategic Initiatives, Gateway Heath (January 2015 to November 2016); Consulting Practice Manager, DST Health Solutions (August 2010 to January 2015). |
Officers. The following table provides information regarding the Officers.
Name, Address, (Age), Position with Trust,
Term of Position with Trust | Principal Occupation During Past 5 Years
and Other Directorships |
Matthew J. Miller
Age: 43
PRESIDENT and CHIEF EXECUTIVE OFFICER
Began Serving: September 2013 (as VP); September 2018 (as President) | Principal Occupation(s): Assistant Vice President, Relationship Management, Ultimus Fund Solutions, LLC (December 2015 to present); Vice President, Valued Advisers Trust (December 2011 to present).
Previous Position(s): Vice President, Capitol Series Trust (September 2013 to March 2017); Chief Executive Officer and President, Capitol Series Trust (March 2017 to March 2018); Secretary, Capitol Series Trust (March 2018 to September 2018); Vice President, Relationship Management, Huntington Asset Services, Inc. (n/k/a Ultimus Asset Services, LLC) (2008 to December 2015); Vice President, The Huntington Funds (February 2010 to April 2015); Vice President, Transfer Agency Operations, Huntington Asset Services, Inc. (2002 to 2008); Employed in various positions with Huntington Asset Services, Inc. (July 1998 to 2002). |
43
TRUSTEES AND OFFICERS – (Unaudited) (continued)
Name, Address, (Age), Position with Trust,
Term of Position with Trust | Principal Occupation During Past 5 Years
and Other Directorships |
Zachary P. Richmond
Age: 39
TREASURER AND CHIEF FINANCIAL OFFICER
Began Serving: August 2014 | Principal Occupation(s): Vice President, Director of Financial Administration for Ultimus Fund Solutions, LLC (February 2019 to present); Treasurer and Chief Financial Officer of Unified Series Trust (November 2014 to present); Treasurer and Chief Financial Officer of Commonwealth International Series Trust (September 2015 to present); Treasurer of Oak Associates Funds (April 2019 to present); Treasurer of Centaur Mutual Funds Trust (April 2019 to present).
Previous Position(s): Assistant Vice President, Associate Director of Financial Administration for Ultimus Fund Solutions, LLC (December 2015 to February 2019); Manager, Fund Administration, Huntington Asset Services, Inc. (January 2011 to December 2015); Interim Treasurer and Chief Financial Officer of Unified Series Trust (August 2014 to November 2014); Assistant Treasurer of Unified Series Trust (May 2011 to August 2014). |
Martin R. Dean
Age: 55
INTERIM CHIEF COMPLIANCE OFFICER
Began Serving: May 2019 | Principal Occupation(s): Vice President, Director of Fund Compliance, Ultimus Fund Solutions, LLC (since January 2016), Chief Compliance Officer, First Western Funds Trust (since April 2016); Chief Compliance Officer, Cross Shore Discovery Fund (since June 2016); Chief Compliance Officer, FSI Low Beta Absolute Return Fund (since November 2016); Chief Compliance Officer, Peachtree Alternative Strategies Fund (since January 2017); Chief Compliance Officer, Dupree Mutual Funds (since August 2017); Interim Chief Compliance Officer, Valued Advisers Trust (since May 2019); and Chief Compliance Officer, Fenimore Asset Management Trust (since May 2019).
Previous Position(s): Senior Vice President and Compliance Group Manager, Huntington Asset Services, Inc. (July 2013 to December 2015); Director of Fund Accounting and Fund Administration Product, Citi Fund Services (January 2008 to June 2013). |
OTHER INFORMATION (Unaudited)
The Fund’s Statement of Additional Information (“SAI”) includes additional information about the trustees and is available without charge, upon request. You may call toll-free at (855) 261-0104 to request a copy of the SAI or to make shareholder inquiries.
44
OTHER FEDERAL TAX INFORMATION – (Unaudited)
The Form 1099-DIV you receive in January 2020 will show the tax status of all distributions paid to your account in calendar year 2019. Shareholders are advised to consult their own tax advisor with respect to the tax consequences of their investment in the Fund. As required by the Internal Revenue Code and/or regulations, shareholders must be notified regarding the status of qualified dividend income for individuals and the dividends received deduction for corporations.
For the year ended August 31, 2019, the following Funds paid qualified dividend income:
Fund | Qualified
Dividend
Income |
Growth Equity Fund | 100.00% |
Value Equity Fund | 100.00% |
Yield-Focus Equity Fund | 97.56% |
For the taxable year ended August 31, 2019, the following percentage of ordinary income dividends paid by the Funds qualify for the dividends received deduction available to corporations:
Fund | Dividends
Received
Deduction |
Growth Equity Fund | 100.00% |
Value Equity Fund | 100.00% |
Yield-Focus Equity Fund | 82.01% |
The Funds designate the following percentage of ordinary income dividends, or up to the maximum amount of such dividends allowable pursuant to the Internal Revenue Code, as qualified business income.
Fund | Qualified
Business
Income |
Yield-Focus Fund | 2.44% |
The Funds designate the following amounts as 20% long-term capital gains distributions. The amounts designated may not agree with long term capital gains in the tax character of distribution table due to utilization of earnings and profits distributed to shareholders on redemption of shares.
Fund | | Long Term
Capital Gains
Paid Amount | |
Growth Equity Fund | | $ | 1,648,471 | |
Value Equity Fund | | | 1,004,882 | |
45
FACTS | WHAT DOES CAPITOL SERIES TRUST DO WITH YOUR PERSONAL INFORMATION? |
| | |
Why? | Financial companies choose how they share your personal information. Federal law gives consumers the right to limit some but not all sharing. Federal law also requires us to tell you how we collect, share, and protect your personal information. Please read this notice carefully to understand what we do. |
| | |
What? | The types of personal information we collect and share depend on the product or service you have with us. This information can include: ■ Social Security number ■ account balances and account transactions ■ transaction or loss history and purchase history ■ checking account information and wire transfer instructions When you are no longer our customer, we continue to share your information as described in this notice. |
| | |
How? | All financial companies need to share customers’ personal information to run their everyday business. In the section below, we list the reasons financial companies can share their customers’ personal information; the reasons Capitol Series Trust chooses to share; and whether you can limit this sharing. |
| | |
Reasons we can share your personal information | Does Capitol Series
Trust share? |
For our everyday business purposes—
such as to process your transactions, maintain your account(s), respond to court orders and legal investigations, or report to credit bureaus | Yes |
For our marketing purposes—
to offer our products and services to you | Yes |
For joint marketing with other financial companies | No |
For our affiliates’ everyday business purposes—
information about your transactions and experiences | No |
For our affiliates’ everyday business purposes—
information about your creditworthiness | No |
For nonaffiliates to market to you | No |
| | |
Questions? | Call 1-855-261-0104 |
46
Page 2 | |
| |
Who we are |
Who is providing this notice? | Capitol Series Trust |
What we do |
How does Capitol Series Trust protect my personal information? | To protect your personal information from unauthorized access and use, we use security measures that comply with federal law. These measures include computer safeguards and secured files and buildings. |
How does Capitol Series Trust collect my personal information? | We collect your personal information, for example, when you ■ open an account or deposit money ■ buy securities from us or sell securities to us ■ make deposits or withdrawals from your account provide account information ■ give us your account information ■ make a wire transfer ■ tell us who receives the money ■ tell us where to send the money ■ show your government-issued ID ■ show your driver’s license |
Why can’t I limit all sharing? | Federal law gives you the right to limit only ■ sharing for affiliates’ everyday business purposes—information about your creditworthiness ■ affiliates from using your information to market to you ■ sharing for nonaffiliates to market to you State laws and individual companies may give you additional rights to limit sharing. |
Definitions |
Affiliates | Companies related by common ownership or control. They can be financial and nonfinancial companies. |
Nonaffiliates | Companies not related by common ownership or control. They can be financial and nonfinancial companies. ■ Capitol Series Trust does not share your personal information with nonaffiliates so they can market to you. |
Joint marketing | A formal agreement between nonaffiliated financial companies that together market financial products or services to you. ■ Capitol Series Trust doesn’t jointly market financial products or services to you. |
47
This page intentionally left blank.
This page intentionally left blank.
PROXY VOTING – (Unaudited)
A description of the policies and procedures that the Funds use to determine how to vote proxies relating to portfolio securities and information regarding how each Fund voted those proxies during the most recent twelve month period ended June 30, is available (1) without charge upon request by calling the Funds at (855) 261-0104 and (2) in Funds documents filed with the Securities and Exchange Commission (“SEC”) on the SEC’s website at www.sec.gov.
TRUSTEES Walter B. Grimm, Chairman John C. Davis Robert G. Dorsey Lori Kaiser Janet Smith Meeks Mary M. Morrow OFFICERS Matthew J. Miller, Chief Executive Officer and President Zachary P. Richmond, Treasurer and Chief Financial Officer Martin R. Dean, Interim Chief Compliance Officer INVESTMENT ADVISER Meritage Portfolio Management, Inc. 7500 College Boulevard, Suite 1212 Overland Park, KS 66210 DISTRIBUTOR Unified Financial Securities, LLC 9465 Counselors Row, Suite 200 Indianapolis, IN 46240 | INDEPENDENT REGISTERED PUBLIC ACCOUNTING FIRM Ernst & Young LLP 221 East 4th Street, Suite 2900 Cincinnati, OH 45202 LEGAL COUNSEL Bernstein Shur 100 Middle Street, 6th Floor Portland, ME 04104 CUSTODIAN Huntington National Bank 41 South High Street Columbus, OH 43215 ADMINISTRATOR, TRANSFER AGENT AND FUND ACCOUNTANT Ultimus Asset Services, LLC 225 Pictoria Drive, Suite 450 Cincinnati, OH 45246 |
This report is intended only for the information of shareholders or those who have received the Funds’ prospectus which contains information about the Funds’ management fee and expenses. Please read the prospectus carefully before investing.
Distributed by Unified Financial Securities, LLC
Member FINRA/SIPC

Preserver Alternative Opportunities Fund
Institutional Shares – PAOIX
Annual Report
August 31, 2019
Beginning on January 1, 2021, as permitted by regulations adopted by the Securities and Exchange Commission, paper copies of the Fund’s shareholder reports like this one will no longer be sent by mail, unless you specifically request paper copies of the reports from the Fund or from your financial intermediary such as a broker-dealer or bank. Instead, the reports will be made available on a website, and you will be notified by mail each time a report is posted and provided with a website link to access the report.
If you already elected to receive shareholder reports electronically, you will not be affected by this change and you need not take any action. You may elect to receive shareholder reports and other communications from the Fund electronically by contacting the Fund at (844) 838-2119 or, if you own these shares through a financial intermediary, you may contact your financial intermediary.
You may elect to receive all future reports in paper free of charge. You can inform the Fund that you wish to continue receiving paper copies of your shareholder reports by contacting the Fund at (844) 838-2119. If you own shares through a financial intermediary, you may contact your financial intermediary or follow instructions included with this document to elect to continue to receive paper copies of your shareholder reports. Your election to receive reports in paper will apply to all funds held with the fund complex or at your financial intermediary
Preserver Partners, LLC
8700 Trail Lake Drive West, Suite 105
Memphis, Tennessee 38125
(844) 838-2119 or (901) 755-4737
Dear Fellow Shareholders,
We are pleased to present the Annual Report for the Preserver Alternative Opportunities Fund (the “Fund”) (PAOIX). For the period September 1, 2018 through August 31, 2019, the Preserver Alternative Opportunities Fund returned 0.88%. These returns trailed the Fund’s primary benchmark, the Wilshire Liquid Alternative Index, return of 1.15%, for the same period. For the three months ended August 31, 2019, the Fund returned 3.01%. These returns exceeded Wilshire Liquid Alternative Index return of 1.94% for the three months ended August 31, 2019.
The Fund’s slight underperformance over the last year, compared to the benchmark and category average return, was largely driven by its weak returns in the fourth quarter of 2018 as domestic and international equities and interest-rate sensitive securities experienced corrections due to trade tensions and rising interest rates. Within the Fund’s U.S. equities, we were overweight mid-large cap growth stocks, which were impacted by the market volatility. The sharp market dislocations created wider discounts in debt and hybrid securities and closed-end funds. The Fund added more debt and hybrid securities and closed-end funds to capitalize on attractive yields and discounted prices. Most of these securities were issued by money center banks such as Citigroup, Bank of America and Wells Fargo. We also added a private fund focused on providing equity capital to CLO warehouse lines.
The Fund has performed ahead of benchmarks this calendar year through August 2019. Falling U.S. short-term interest rates contributed to solid returns in bonds and interest-rate sensitive securities such as REITs, preferred stocks and utilities. Bond yields hit record lows across the yield curve in the U.S. and around the world. Equities have been reasonably strong due to favorable monetary policy and price multiple expansion in spite of very modest earnings growth during the first half of the year. It should not be overlooked that strong risk asset returns and sharply lower global interest rates is an atypical investing environment.
It is often suggested that it is the nature of capital markets to climb a wall of worry. Investors are rightly concerned about slowing global growth, muted inflation, the efficacy of monetary policy, political uncertainty and escalating trade tensions. While it can be challenging to take high-conviction, one-way bets on equities or safe-haven assets, we are finding selected opportunities to put your capital to work. We don’t make predictions about the direction of rates, economic growth or trade policy. While diversification across asset classes is important for portfolio construction and risk management, we have been careful to have exposure across the capital structure to securities that benefit from reflationary and deflationary trends, to growth and defensive sectors and to fixed and floating rate securities.
Your long-term investment horizon and confidence in our investment philosophy is essential to the execution of our strategy. We appreciate your continued support.
Sincerely,
Floyd Tyler, Ph.D., CFA
Portfolio Manager
1
Investment Results (Unaudited)
Average Annual Total Returns(a) as of August 31, 2019
| | One
Year | Three
Year | Since
Inception
(3/1/16) |
Preserver Alternative Opportunities Fund | | | |
Institutional Shares | 0.88% | 6.23% | 7.13% |
Wilshire Liquid Alternative Index (b) | 1.15% | 1.85% | 2.69% |
| | Expense Ratios(c) |
| | Institutional
Shares |
Gross | 1.83% |
With Applicable Waivers | 1.53% |
The performance quoted represents past performance, which does not guarantee future results. The investment return and principal value of an investment will fluctuate so that an investor’s shares, when redeemed, may be worth more or less than their original cost. The returns shown do not reflect deduction of taxes that a shareholder would pay on Preserver Alternative Opportunities Fund (the “Fund”) distributions or the redemption of Fund shares. Current performance of the Fund may be lower or higher than the performance quoted. The Fund’s investment objectives, risks, charges and expenses must be considered carefully before investing. Performance data current to the most recent month end may be obtained by calling (844) 838-2119.
(a) Average annual total returns reflect any change in price per share and assume the reinvestment of all distributions. The Fund’s returns reflect any fee waivers during the applicable period. If such fee waivers had not occurred, the quoted performance would have been lower.
(b) This table compares the Fund’s average annual total returns for the referenced periods to those of Wilshire Liquid Alternative Index. The Wilshire Liquid Alternative Index measures the collective performance of the five Wilshire Liquid Alternative Strategies that make up the Wilshire Liquid Alternative Universe. The Wilshire Liquid Alternative Index is designed to provide a broad measure of the Liquid Alternative Global Macro Index, Wilshire Liquid Alternative Relative Value Index, Wilshire Liquid Alternative Multi-Strategy Index, and Wilshire Liquid Alternative Event Driven Index. The index is an unmanaged benchmark that assumes reinvestment of all distributions and excludes the effect of taxes and fees. Individuals cannot invest directly in the index; however, an individual can invest in exchange-traded funds or other investment vehicles that attempt to track the performance of a benchmark index.
2
Investment Results (Unaudited) (continued)
(c) The expense ratios are from the Fund’s Prospectus dated December 31, 2018. Preserver Partners, LLC, the Fund’s adviser (the “Adviser”) has contractually agreed, through December 31, 2020, to waive its management fee and/or reimburse expenses so that total annual operating expenses (excluding (i) interest; (ii) taxes; (iii) brokerage fees and commissions; (iv) other extraordinary expenses not incurred in the ordinary course of the Fund’s business; (v) dividend expenses on short sales; (vi) expenses incurred under a Rule 12b-1 plan of distribution; and (vii) indirect expenses such as acquired fund fees and expenses) do not exceed 1.35% of the Fund’s average daily net assets through December 31, 2020 (“Expense Limitation Agreement”). During any fiscal year that the Investment Advisory Agreement between the Adviser and Capitol Series Trust is in effect, the Adviser may recoup the sum of all fees previously waived or expenses reimbursed, less any reimbursement previously paid, provided that the Adviser is only permitted to recoup fees or expenses within 36 months from the date the fee waiver or expense reimbursement first occurred and provided further that such recoupment can be achieved within the Expense Limitation Agreement currently in effect and the Expense Limitation Agreement in place when the waiver/reimbursement occurred. This Expense Limitation Agreement may not be terminated by the Adviser prior to its expiration date, but the Board of Trustees may terminate such agreement at any time. The Expense Limitation Agreement terminates automatically upon the termination of the Investment Advisory Agreement with the Adviser. Additional information pertaining to the Fund’s expense ratios as of August 31, 2019, can be found in the financial highlights.
The Fund’s investment objectives, strategies, risks, charges and expenses must be considered carefully before investing. The prospectus contains this and other important information about the Fund and may be obtained by calling (844) 838-2119. Please read it carefully before investing.
The Fund is distributed by Unified Financial Securities, LLC, member FINRA/SIPC.
3
Investment Results (Unaudited) (continued)
Comparison of the Growth of a $100,000 Investment in the Preserver Alternative
Opportunities Fund - Institutional Shares and the Wilshire Liquid Alternative Index
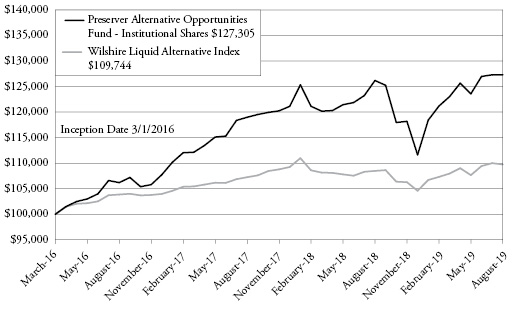
The chart above assumes an initial investment of $100,000 made on March 1, 2016 (commencement of operations) and held through August 31, 2019. THE FUND’S RETURNS REPRESENT PAST PERFORMANCE AND DO NOT GUARANTEE FUTURE RESULTS. The returns shown do not reflect deduction of taxes that a shareholder would pay on the Fund’s distributions or the redemption of the Fund’s shares. Investment returns and principal values will fluctuate so that your shares, when redeemed, may be worth more or less than their original purchase price.
Current performance may be lower or higher than the performance data quoted. For more information on the Fund, and to obtain performance data current to the most recent month-end, or to request a prospectus, please call (844) 838-2119. You should carefully consider the investment objectives, potential risks, management fees, and charges and expenses of the Fund before investing. The Fund’s prospectus contains this and other information about the Fund, and should be read carefully before investing.
The Fund is distributed by Unified Financial Securities, LLC, Member FINRA/SIPC.
4
Portfolio Illustration (Unaudited)
August 31, 2019
The following chart gives a visual breakdown of the Fund’s holdings as a percentage of net assets.
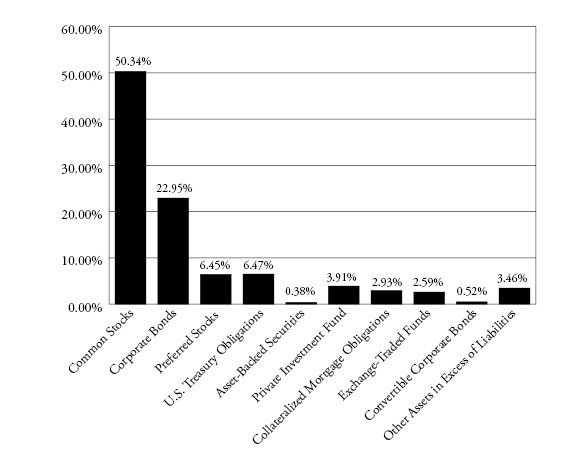
Availability of Portfolio Schedule (Unaudited)
The Fund files its complete schedule of portfolio holdings with the SEC for the first and third quarters of each fiscal year within sixty days after the end of the period. The Fund’s portfolio holdings are available on the SEC’s website at http://www.sec.gov.
5
Preserver Alternative Opportunities Fund
Schedule of Investments
August 31, 2019
| |
Shares
| | | Fair Value | |
COMMON STOCKS — 50.34% | | | | | | | | |
| | | | | | | | | |
Australia — 1.81% | | | | | | | | |
Consumer Discretionary — 1.81% | | | | | | | | |
Aristocrat Leisure Ltd. | | | 12,000 | | | $ | 240,421 | |
Domino’s Pizza Enterprises Ltd. | | | 5,000 | | | | 144,016 | |
| | | | | | | | 384,437 | |
Canada — 1.00% | | | | | | | | |
Real Estate — 1.00% | | | | | | | | |
NorthWest Healthcare Properties Real Estate Investment Trust | | | 24,372 | | | | 212,894 | |
| | | | | | | | | |
France — 2.38% | | | | | | | | |
Industrials — 2.38% | | | | | | | | |
Schneider Electric SE | | | 3,000 | | | | 251,160 | |
Thales SA | | | 2,200 | | | | 254,292 | |
| | | | | | | | 505,452 | |
Germany — 1.05% | | | | | | | | |
Real Estate — 1.05% | | | | | | | | |
Deutsche Wohnen SE | | | 6,278 | | | | 222,632 | |
| | | | | | | | | |
Japan — 4.77% | | | | | | | | |
Communication Services — 1.50% | | | | | | | | |
SoftBank Group Corporation | | | 7,000 | | | | 317,852 | |
| | | | | | | | | |
Consumer Discretionary — 1.59% | | | | | | | | |
McDonald’s Holdings Company Japan Ltd. | | | 7,200 | | | | 337,845 | |
| | | | | | | | | |
Information Technology — 1.68% | | | | | | | | |
Amano Corporation | | | 5,000 | | | | 149,429 | |
Keyence Corporation | | | 350 | | | | 207,224 | |
| | | | | | | | 356,653 | |
Total Japan | | | | | | | 1,012,350 | |
| | | | | | | | | |
Luxembourg — 1.23% | | | | | | | | |
Consumer Discretionary — 1.23% | | | | | | | | |
B&M European Value Retail S.A. | | | 60,000 | | | | 261,206 | |
| | | | | | | | | |
Sweden — 0.98% | | | | | | | | |
Industrials — 0.98% | | | | | | | | |
Volvo AB, B Shares | | | 15,000 | | | | 207,109 | |
| | | | | | | | | |
United Kingdom — 3.02% | | | | | | | | |
Health Care — 1.33% | | | | | | | | |
Abcam plc | | | 20,000 | | | | 281,550 | |
| | | | | | | | | |
6 | See accompanying notes which are an integral part of these financial statements. | |
Preserver Alternative Opportunities Fund
Schedule of Investments (continued)
August 31, 2019
| |
Shares
| | | Fair Value | |
COMMON STOCKS — (continued) |
| |
Industrials — 1.69% | | | | | | | | |
IHS Markit Ltd.(a) | | | 5,500 | | | $ | 360,855 | |
Total United Kingdom | | | | | | | 642,405 | |
| | | | | | | | | |
United States — 34.10% | | | | | | | | |
Communication Services — 2.62% | | | | | | | | |
AT&T, Inc. | | | 8,000 | | | | 282,080 | |
Walt Disney Company (The) | | | 2,000 | | | | 274,520 | |
| | | | | | | | 556,600 | |
Consumer Discretionary — 1.59% | | | | | | | | |
Starbucks Corporation | | | 3,500 | | | | 337,960 | |
| | | | | | | | | |
Consumer Staples — 1.39% | | | | | | | | |
Costco Wholesale Corporation | | | 1,000 | | | | 294,760 | |
| | | | | | | | | |
Energy — 2.01% | | | | | | | | |
Enterprise Products Partners LP(b)(c) | | | 15,000 | | | | 427,650 | |
| | | | | | | | | |
Financials — 8.08% | | | | | | | | |
Arbor Realty Trust, Inc. | | | 15,000 | | | | 188,250 | |
Berkshire Hathaway, Inc., Class B(a) | | | 1,400 | | | | 284,774 | |
Blackstone Group LP (The) | | | 7,000 | | | | 348,320 | |
MSCI, Inc. | | | 1,500 | | | | 351,944 | |
Progressive Corporation (The)(c) | | | 4,000 | | | | 303,200 | |
TriplePoint Venture Growth BDC Corporation | | | 15,000 | | | | 240,150 | |
| | | | | | | | 1,716,638 | |
Health Care — 2.71% | | | | | | | | |
Danaher Corporation | | | 2,400 | | | | 341,016 | |
UnitedHealth Group, Inc. | | | 1,000 | | | | 234,000 | |
| | | | | | | | 575,016 | |
Information Technology — 9.42% | | | | | | | | |
Adobe, Inc.(a) | | | 1,000 | | | | 284,510 | |
Broadridge Financial Solutions, Inc.(c) | | | 2,500 | | | | 323,600 | |
Mastercard, Inc., Class A(c) | | | 1,700 | | | | 478,329 | |
Microsoft Corporation | | | 2,500 | | | | 344,650 | |
Motorola Solutions, Inc. | | | 1,600 | | | | 289,456 | |
SS&C Technologies Holdings, Inc. | | | 6,000 | | | | 279,660 | |
| | | | | | | | 2,000,205 | |
| | See accompanying notes which are an integral part of these financial statements. | 7 |
Preserver Alternative Opportunities Fund
Schedule of Investments (continued)
August 31, 2019
| |
Shares
| | | Fair Value | |
COMMON STOCKS — (continued) |
| |
Real Estate — 4.22% | | | | | | | | |
Equinix, Inc. | | | 700 | | | $ | 389,396 | |
Prologis, Inc. | | | 3,000 | | | | 250,860 | |
Ventas, Inc. | | | 3,500 | | | | 256,865 | |
| | | | | | | | 897,121 | |
Utilities — 2.06% | | | | | | | | |
NextEra Energy, Inc. | | | 2,000 | | | | 438,160 | |
Total United States | | | | | | | 7,244,110 | |
| | | | | | | | | |
Total Common Stocks (Cost $9,152,574) | | | | | | | 10,692,595 | |
| | | | | | | | | |
PREFERRED STOCKS — 6.45% | | | | | | | | |
| | | | | | | | | |
United States — 6.45% | | | | | | | | |
Financials — 4.65% | | | | | | | | |
Bank of America Corporation, Series W, 6.63% | | | 8,100 | | | | 202,500 | |
Citigroup, Inc., Series J, 7.13% | | | 5,000 | | | | 143,450 | |
Invesco Mortgage Capital, Inc., Series A, 7.75% | | | 13,800 | | | | 365,700 | |
New York Mortgage Trust, Inc., Series C, 7.88% | | | 11,000 | | | | 274,670 | |
| | | | | | | | 986,320 | |
Real Estate — 1.80% | | | | | | | | |
Ashford Hospitality Trust, Inc., Series D, 8.45% | | | 5,909 | | | | 144,534 | |
Colony Capital, Inc., Series I, 7.15% | | | 11,000 | | | | 238,480 | |
| | | | | | | | 383,014 | |
Total Preferred Stocks (Cost $1,340,776) | | | | | | | 1,369,334 | |
| | | | | | | | | |
PRIVATE INVESTMENT FUNDS — 3.91% | | | | | | | | |
Palmer Square Senior Loan Fund(d)(e) | | | | | | | 830,960 | |
Total Private Investment Funds (Cost $800,000) | | | | | | | 830,960 | |
| | | | | | | | | |
EXCHANGE-TRADED FUNDS — 2.59% | | | | | | | | |
SPDR Bloomberg Barclays Convertible Securities ETF | | | 5,000 | | | | 263,450 | |
SPDR® Gold Shares | | | 2,000 | | | | 287,500 | |
Total Exchange-Traded Funds (Cost $499,889) | | | | | | | 550,950 | |
8 | See accompanying notes which are an integral part of these financial statements. | |
Preserver Alternative Opportunities Fund
Schedule of Investments (continued)
August 31, 2019
| | Principal
Amount | | | Fair Value | |
CORPORATE BONDS — 22.95% | | | | | | | | |
| | | | | | | | | |
Netherlands — 1.19% | | | | | | | | |
Health Care — 1.19% | | | | | | | | |
Teva Pharmaceutical Finance Netherlands III BV, 6.75%, 3/1/2028 | | $ | 300,000 | | | $ | 253,620 | |
| | | | | | | | | |
United States — 21.76% | | | | | | | | |
Communication Services — 1.71% | | | | | | | | |
CenturyLink, Inc., Series D, 7.20%, 12/1/2025 | | | 200,000 | | | | 203,000 | |
T-Mobile USA, Inc., 4.75%, 2/1/2028 | | | 150,000 | | | | 158,435 | |
| | | | | | | | 361,435 | |
Consumer Discretionary — 3.22% | | | | | | | | |
International Game Technology plc, 5.35%, 10/15/2023 | | | 120,000 | | | | 119,400 | |
L Brands, Inc., 5.25%, 2/1/2028 | | | 200,000 | | | | 183,000 | |
Levi Strauss & Company, 5.00%, 5/1/2025 | | | 250,000 | | | | 261,250 | |
Scientific Games International, Inc., 6.25%, 9/1/2020 | | | 120,000 | | | | 120,900 | |
| | | | | | | | 684,550 | |
Energy — 1.06% | | | | | | | | |
Genesis Energy LP, 6.75%, 8/1/2022 | | | 100,000 | | | | 101,460 | |
Range Resources Corporation, 4.88%, 5/15/2025 | | | 150,000 | | | | 123,750 | |
| | | | | | | | 225,210 | |
Financials — 11.31% | | | | | | | | |
Bank of America Corporation, MTN, 2.33%, 10/1/2021 | | | 250,000 | | | | 250,454 | |
Bank of America Corporation, Series FF, 5.88%, Perpetual | | | 250,000 | | | | 272,025 | |
Citibank N.A., 2.13%, 10/20/2020 | | | 200,000 | | | | 200,236 | |
Citigroup, Inc., Series M, 6.30%, Perpetual | | | 220,000 | | | | 233,687 | |
Goldman Sachs Group, Inc. (The), MTN, 3.25%, 11/30/2024 | | | 250,000 | | | | 250,886 | |
GS Finance Corporation, MTN, 0.00%, 9/2/2025(g) | | | 100,000 | | | | 100,556 | |
PNC Bank N.A., 4.05%, 7/26/2028 | | | 250,000 | | | | 280,060 | |
Stifel Financial Corporation, 4.25%, 7/18/2024 | | | 200,000 | | | | 211,865 | |
Wells Fargo & Company, MTN, 2.60%, 7/22/2020 | | | 350,000 | | | | 351,752 | |
Wells Fargo Bank N.A., 3.33%, 7/23/2021 | | | 250,000 | | | | 252,619 | |
| | | | | | | | 2,404,140 | |
Health Care — 1.46% | | | | | | | | |
DaVita HealthCare Partners, Inc., 5.00%, 5/1/2025 | | | 200,000 | | | | 201,000 | |
Tenet Healthcare Corporation, 8.13%, 4/1/2022 | | | 100,000 | | | | 108,115 | |
| | | | | | | | 309,115 | |
Industrials — 1.19% | | | | | | | | |
Timken Company (The), 3.88%, 9/1/2024 | | | 100,000 | | | | 105,048 | |
Triumph Group, Inc., 5.25%, 6/1/2022 | | | 150,000 | | | | 149,625 | |
| | | | | | | | 254,673 | |
| | See accompanying notes which are an integral part of these financial statements. | 9 |
Preserver Alternative Opportunities Fund
Schedule of Investments (continued)
August 31, 2019
| | Principal
Amount | | | Fair Value | |
CORPORATE BONDS — (continued) |
| |
Real Estate — 1.45% | | | | | | | | |
Iron Mountain, Inc., 5.75%, 8/15/2024 | | $ | 200,000 | | | $ | 203,000 | |
Senior Housing Properties Trust, 4.75%, 5/1/2024 | | | 100,000 | | | | 103,960 | |
| | | | | | | | 306,960 | |
Utilities — 0.36% | | | | | | | | |
Ferrellgas Partners LP, 8.63%, 6/15/2020 | | | 100,000 | | | | 75,670 | |
Total United States | | | | | | | 4,621,753 | |
| | | | | | | | | |
Total Corporate Bonds (Cost $4,782,515) | | | | | | | 4,875,373 | |
| | | | | | | | | |
U.S. TREASURY OBLIGATIONS — 6.47% | | | | | | | | |
United States Treasury Inflation Indexed Bonds, 0.38%, 7/15/2025(f) | | | 200,000 | | | | 221,501 | |
United States Treasury Notes, 1.13%, 2/28/2021 | | | 550,000 | | | | 545,950 | |
United States Treasury Notes, 1.63%, 2/15/2026 | | | 600,000 | | | | 606,329 | |
Total U.S. Treasury Obligations (Cost $1,329,211) | | | | | | | 1,373,780 | |
| | | | | | | | | |
COLLATERALIZED MORTGAGE OBLIGATIONS — 2.93% | | | | | | | | |
Banc of America Mortgage Securities, Inc., Series 2004-K, Class 1A2, 4.86%, 12/25/2034(g) | | | 50,591 | | | | 49,828 | |
Countrywide Alternative Loan Trust, Series 2003-J2, Class A1, 6.00%, 10/25/2033 | | | 44,964 | | | | 47,963 | |
Countrywide Home Loans Mortgage Pass Through Trust, Series 2004-HYB9, Class 1A1, 4.25%, 2/20/2035(g) | | | 29,807 | | | | 30,141 | |
GSR Mortgage Loan Trust, Series 2005-5F, Class 8A3, 2.65%, 6/25/2035 (1MO LIBOR + 50bps)(g) | | | 17,757 | | | | 16,878 | |
HarborView Mortgage Loan Trust, Series 2004-07, Class 2A1, 4.32%, 11/19/2034(g) | | | 106,909 | | | | 109,515 | |
Impac CMB Trust, Series 2005-08, Class 2B, 4.40%, 2/25/2036 (1MO LIBOR + 225bps)(g) | | | 137,351 | | | | 134,745 | |
Residential Asset Mortgage Products, Inc., Series 2001-RS2, Class MII2, 3.57%, 6/25/2031 (1MO LIBOR + 142.5bps)(g) | | | 233,907 | | | | 233,949 | |
Total Collateralized Mortgage Obligations (Cost $580,801) | | | | | | | 623,019 | |
| | | | | | | | | |
CONVERTIBLE CORPORATE BONDS — 0.52% | | | | | | | | |
| | | | | | | | | |
Industrials — 0.52% | | | | | | | | |
Atlas Air Worldwide Holdings, Inc., 2.25%, 6/1/2022 | | | 120,000 | | | | 109,800 | |
Total Convertible Corporate Bonds (Cost $111,684) | | | | | | | 109,800 | |
| | | | | | | | | |
10 | See accompanying notes which are an integral part of these financial statements. | |
Preserver Alternative Opportunities Fund
Schedule of Investments (continued)
August 31, 2019
| | Principal
Amount | | | Fair Value | |
ASSET-BACKED SECURITIES — 0.38% | | | | | | | | |
American Airlines, Inc. Pass Through Trust, Series 2013-2, Class B, 5.60%, 1/15/2022(h) | | $ | 78,367 | | | $ | 79,794 | |
Total Asset-Backed Securities (Cost $78,847) | | | | | | | 79,794 | |
| | | | | | | | | |
Total Investments — 96.54% (Cost $18,676,297) | | | | | | | 20,505,605 | |
| | | | | | | | | |
Other Assets in Excess of Liabilities — 3.46% | | | | | | | 734,913 | |
| | | | | | | | | |
NET ASSETS — 100.00% | | | | | | $ | 21,240,518 | |
(a) | Non-income producing security. |
(b) | Master Limited Partnership |
(c) | All or a portion of the security is held as collateral for unsettled security transactions and written options. |
(d) | Security is currently being valued according to the fair value procedures approved by the Board of Trustees. |
(e) | Illiquid security. The total fair value of these securities as of August 31, 2019 was $830,960, representing 3.91% of net assets. Redemption permitted with 30 days written notice prior to the end of any calendar quarter during withdrawal periods determined by the managing member. Withdrawal periods generally coincide with liquidity of underlying portfolio, however the timing of any potential liquidity event is unknown. |
(f) | Principal amount of security is adjusted periodically based on changes in the Consumer Price Index. |
(g) | Variable rate security. Interest rate resets periodically. The rate shown is the effective interest rate as of August 31, 2019. For securities based on a published reference rate and spread, the reference rate and spread (in basis points) are indicated parenthetically. Certain variable rate securities are not based on a published reference rate and spread but are determined by the issuer or agent and are based on current market conditions. These securities, therefore, do not indicate a reference rate and spread. |
(h) | Security exempt from registration under Rule 144A or Section 4(2) of the Securities Act of 1933. The security may be resold in transactions exempt from registration, normally to qualified institutional buyers. The total fair value of these securities as August 31, 2019 was $79,794, representing 0.38% of net assets. |
BDC – Business Development Company
ETF – Exchange-Traded Fund
MTN – Medium Term Note
SPDR – Standard & Poor’s Depositary Receipt
The sectors shown on the schedule of investments are based on the Global Industry Classification Standard, or GICS® (“GICS”). The GICS was developed by and/or is the exclusive property of MSCI, Inc. and Standard & Poor’s Financial Services LLC (“S&P”). GICS is a service mark of MSCI, Inc. and S&P and has been licensed for use by Ultimus Fund Solutions, LLC.
| | See accompanying notes which are an integral part of these financial statements. | 11 |
Preserver Alternative Opportunities Fund
Schedule of Open Written Option Contracts
August 31, 2019
Description | | Number of
Contracts | | | Notional
Amount | | | Exercise
Price | | Expiration
Date | | Fair Value | |
WRITTEN CALL OPTIONS — (0.00)%(a) |
Progressive Corporation (The) | | | (10 | ) | | $ | (75,800 | ) | | $ | 82.50 | | September 2019 | | $ | (90 | ) |
Total Written Call Options (Premiums Received $1,092) | | | | | | | | | | | | | | | | (90 | ) |
| | | | | | | | | | | | | | | | | | |
WRITTEN PUT OPTIONS — (0.00)% (a) |
SS&C Technologies Holdings, Inc. | | | (10 | ) | | | (46,610 | ) | | | 40.00 | | September 2019 | | | (70 | ) |
Total Written Put Options (Premiums Received $750) | | | | | | | | | | | | | | | | (70 | ) |
| | | | | | | | | | | | | | | | | | |
Total Written Options (Premiums Received $1,842) | | | | | | | | | | | | | | | $ | (160 | ) |
(a) | Rounds to less than (0.005)%. |
12 | See accompanying notes which are an integral part of these financial statements. | |
Preserver Alternative Opportunities Fund
Statement of Assets and Liabilities
August 31, 2019
Assets |
Investments in securities at fair value (cost $18,676,297) | | $ | 20,505,605 | |
Cash | | | 951,058 | |
Cash held at broker for option contract transactions | | | 99,954 | |
Receivable for fund shares sold | | | 41,024 | |
Dividends and interest receivable | | | 93,099 | |
Tax reclaims receivable | | | 9,012 | |
Prepaid expenses | | | 9,516 | |
Total Assets | | | 21,709,268 | |
Liabilities | | | | |
Written options, at value (premium received $1,842) | | | 160 | |
Payable for investments purchased | | | 431,220 | |
Payable to Adviser | | | 5,231 | |
Payable to Administrator | | | 4,667 | |
Payable to auditors | | | 21,150 | |
Payable to trustees | | | 100 | |
Other accrued expenses | | | 6,222 | |
Total Liabilities | | | 468,750 | |
Net Assets | | $ | 21,240,518 | |
Net Assets consist of: | | | | |
Paid-in capital | | | 19,311,876 | |
Accumulated earnings | | | 1,928,642 | |
Net Assets | | $ | 21,240,518 | |
Institutional Shares: | | | | |
Net Assets | | $ | 21,240,518 | |
Shares outstanding | | | 1,828,479 | |
Net asset value, offering and redemption price per share(a) | | $ | 11.62 | |
(a) | A 2.00% redemption fee is imposed upon shares redeemed within 60 calendar days of their purchase. |
| | See accompanying notes which are an integral part of these financial statements. | 13 |
Preserver Alternative Opportunities Fund
Statement of Operations
For the year ended August 31, 2019
Investment Income | | | | |
Dividend income (net of foreign taxes withheld of $14,535) | | $ | 386,486 | |
Interest income | | | 333,904 | |
Total investment income | | | 720,390 | |
Expenses | | | | |
Adviser | | | 157,825 | |
Administration | | | 23,928 | |
Fund accounting | | | 23,928 | |
Audit and tax preparation | | | 21,150 | |
Trustee | | | 15,757 | |
Transfer agent | | | 13,929 | |
Pricing | | | 13,286 | |
Legal | | | 12,918 | |
Printing | | | 10,808 | |
Registration | | | 10,192 | |
Custodian | | | 6,459 | |
Compliance services | | | 6,000 | |
12b-1 fees - Retail Shares(a) | | | 2,916 | |
Interest | | | 793 | |
Miscellaneous | | | 30,832 | |
Total expenses | | | 350,721 | |
Recoupment of prior expenses waived/reimbursed by Adviser | | | 9,472 | |
Fees contractually waived by Adviser | | | (43,402 | ) |
Net operating expenses | | | 316,791 | |
Net investment income | | | 403,599 | |
Net Realized and Change in Unrealized Gain (Loss) on Investments | | | | |
Net realized gain (loss) on: | | | | |
Investment securities transactions | | | (277,779 | ) |
Payment by Adviser for investment loss | | | 1,737 | |
Written options | | | 13,228 | |
Foreign currency translations | | | (13,136 | ) |
Net change in unrealized appreciation (depreciation) on: | | | | |
Investment securities and foreign currency translations | | | (150,944 | ) |
Written options | | | 1,682 | |
Net realized and change in unrealized appreciation (depreciation) on investments | | | (425,212 | ) |
Net decrease in net assets resulting from operations | | $ | (21,613 | ) |
(a) | Effective February 12, 2019, the outstanding Retail Shares of the Fund were exchanged for Institutional Shares. |
14 | See accompanying notes which are an integral part of these financial statements. | |
Preserver Alternative Opportunities Fund
Statements of Changes in Net Assets
| | For the
Year Ended
August 31, 2019 | | | For the
Year Ended
August 31, 2018(a) | |
Increase (Decrease) in Net Assets due to: | | | | | | | | |
Operations | | | | | | | | |
Net investment income | | $ | 403,599 | | | $ | 252,880 | |
Net realized gain (loss) on investment securities, written option transactions and foreign currency translations | | | (275,950 | ) | | | 975,565 | |
Net change in unrealized appreciation (depreciation) of investment securities, written options and foreign currency translations | | | (149,262 | ) | | | 2,712 | |
Net increase (decrease) in net assets resulting from operations | | | (21,613 | ) | | | 1,231,157 | |
Distributions to Shareholders from Earnings: | | | | | | | | |
Institutional Shares | | | (684,723 | ) | | | (515,218 | ) |
Retail Shares(b) | | | (90,512 | ) | | | (73,739 | ) |
Total distributions | | | (775,235 | ) | | | (588,957 | ) |
Capital Transactions - Institutional Shares(b) | | | | | | | | |
Proceeds from shares sold | | | 2,064,416 | | | | 5,063,761 | |
Reinvestment of distributions | | | 633,107 | | | | 513,700 | |
Shares issued in connection with class consolidation | | | 1,812,018 | | | | — | |
Amount paid for shares redeemed | | | (3,415,867 | ) | | | (1,465,745 | ) |
Proceeds from redemption fees(c) | | | 6 | | | | — | |
Total Institutional Shares | | | 1,093,680 | | | | 4,111,716 | |
Capital Transactions - Retail Shares(b) | | | | | | | | |
Proceeds from shares sold | | | 338,262 | | | | 1,182,902 | |
Reinvestment of distributions | | | 89,642 | | | | 73,225 | |
Shares redeemed in connection with class consolidation | | | (1,812,018 | ) | | | — | |
Amount paid for shares redeemed | | | (1,045,774 | ) | | | (846,215 | ) |
Proceeds from redemption fees(c) | | | 43 | | | | 106 | |
Total Retail Shares | | | (2,429,845 | ) | | | 410,018 | |
Net increase (decrease) in net assets resulting from capital transactions | | | (1,336,165 | ) | | | 4,521,734 | |
Total Increase (Decrease) in Net Assets | | | (2,133,013 | ) | | | 5,163,934 | |
Net Assets | | | | | | | | |
Beginning of year | | $ | 23,373,531 | | | $ | 18,209,597 | |
End of year | | $ | 21,240,518 | | | $ | 23,373,531 | |
| | See accompanying notes which are an integral part of these financial statements. | 15 |
Preserver Alternative Opportunities Fund
Statements of Changes in Net Assets (continued)
| | For the
Year Ended
August 31, 2019 | | | For the
Year Ended
August 31, 2018(a) | |
Share Transactions - Institutional Shares(b) | | | | | | | | |
Shares sold | | | 185,627 | | | | 434,546 | |
Shares issued in connection with class consolidation | | | 165,943 | | | | — | |
Shares issued in reinvestment of distributions | | | 63,311 | | | | 44,530 | |
Shares redeemed | | | (314,525 | ) | | | (126,344 | ) |
Total Institutional Shares | | | 100,356 | | | | 352,732 | |
Share Transactions - Retail Shares(b) | | | | | | | | |
Shares sold | | | 30,977 | | | | 101,517 | |
Shares redeemed in connection with class consolidation | | | (166,255 | ) | | | — | |
Shares issued in reinvestment of distributions | | | 8,982 | | | | 6,360 | |
Shares redeemed | | | (97,151 | ) | | | (72,592 | ) |
Total Retail Shares | | | (223,447 | ) | | | 35,285 | |
(a) | For the year ended August 31, 2018, distributions to shareholders from earnings consisted of net investment income in the amount of $227,584 (Institutional Shares) and $30,727 (Retail Shares) and net realized gains in the amount of $287,634 (Institutional Shares) and $43,012 (Retail Shares). As of August 31, 2018, accumulated undistributed net investment income was $82,446. |
(b) | Effective February 12, 2019, the outstanding Retail Shares of the Fund were exchanged for Institutional Shares. |
(c) | A 2.00% redemption fee is imposed upon shares redeemed within 60 calendar days of their purchase. |
16 | See accompanying notes which are an integral part of these financial statements. | |
Preserver Alternative Opportunities Fund - Institutional Shares
Financial Highlights
(For a share outstanding during each period)
| | | For the
Year Ended
August 31,
2019 | | | For the
Year Ended
August 31,
2018 | | | For the
Year Ended
August 31,
2017 | | | For the
Period Ended
August 31,
2016(a) | |
Selected Per Share Data | | | | | | | | | | | | | | | | |
Net asset value, at beginning of period | | $ | 11.98 | | | $ | 11.65 | | | $ | 10.62 | | | $ | 10.00 | |
Income from investment operations: | | | | | | | | | | | | | | | | |
Net investment income | | | 0.21 | | | | 0.16 | | | | 0.18 | | | | 0.07 | |
Net realized and unrealized gain (loss) on investments | | | (0.17 | ) | | | 0.53 | | | | 1.08 | | | | 0.55 | |
Total from investment operations | | | 0.04 | | | | 0.69 | | | | 1.26 | | | | 0.62 | |
Less distributions to shareholders from: | | | | | | | | | | | | | | | | |
Net investment income | | | (0.06 | ) | | | (0.16 | ) | | | (0.22 | ) | | | — | |
Net realized gains | | | (0.34 | ) | | | (0.20 | ) | | | (0.01 | ) | | | — | |
Total distributions | | | (0.40 | ) | | | (0.36 | ) | | | (0.23 | ) | | | — | |
Net asset value, at end of period | | $ | 11.62 | | | $ | 11.98 | | | $ | 11.65 | | | $ | 10.62 | |
Total Return(b) | | | 0.88 | % | | | 6.05 | % | | | 12.04 | % | | | 6.20 | %(c) |
| | | | | | | | | | | | | | | | | |
Ratios and Supplemental Data: | | | | | | | | | | | | | | | | |
Net assets, end of period (000 omitted) | | $ | 21,241 | | | $ | 20,705 | | | $ | 16,022 | | | $ | 9,659 | |
Before waiver or recoupment: | | | | | | | | | | | | | | | | |
Ratio of net expenses to average net assets | | | 1.66 | % | | | 1.72 | % | | | 2.02 | % | | | 2.92 | %(d) |
After waiver or recoupment: | | | | | | | | | | | | | | | | |
Ratio of expenses to average net assets | | | 1.48 | % | | | 1.75 | % | | | 1.75 | % | | | 1.75 | %(d) |
Ratio of net investment income to average net assets | | | 1.96 | % | | | 1.25 | % | | | 1.62 | % | | | 1.44 | %(d) |
Portfolio turnover rate | | | 56 | % | | | 68 | % | | | 72 | % | | | 20 | %(c) |
(a) | For the period March 1, 2016 (commencement of operations) to August 31, 2016. |
(b) | Total return in the above table represents the rate that the investor would have earned or lost on an investment in the Fund, assuming reinvestment of distributions. Excludes redemption fee. |
| | See accompanying notes which are an integral part of these financial statements. | 17 |
Preserver Alternative Opportunities Fund
Notes to the Financial Statements
August 31, 2019
NOTE 1. ORGANIZATION
The Preserver Alternative Opportunities Fund (the “Fund”) was organized as a diversified series of Capitol Series Trust (the “Trust”) on September 16, 2015. The Trust is an open end investment company established under the laws of Ohio by an Agreement and Declaration of Trust dated September 18, 2013 (the “Trust Agreement”). The Trust Agreement permits the Board of Trustees of the Trust (the “Board”) to issue an unlimited number of shares of beneficial interest of separate series without par value. The Fund is one of a series of funds currently authorized by the Board. The Fund’s investment adviser is Preserver Partners, LLC (the “Adviser”). The investment objective of the Fund is to seek current income and capital appreciation with low volatility compared to the major equity and fixed income markets.
The Fund currently offers Institutional Shares. The Fund commenced operations on March 1, 2016. A 2.00% redemption fee is imposed on shares redeemed within 60 days of purchase. Effective on the close of business on February 12, 2019, Retail Shares were consolidated into Institutional Shares. Each share represents an equal proportionate interest in the assets and liabilities belonging to the Fund and is entitled to such dividends and distributions out of income belonging to the Fund as declared by the Board.
NOTE 2. SIGNIFICANT ACCOUNTING POLICIES
The Fund is an investment company and follows accounting and reporting guidance under Financial Accounting Standards Board Accounting Standards Codification (“ASC”) Topic 946, “Financial Services-Investment Companies”. The following is a summary of significant accounting policies followed by the Fund in the preparation of its financial statements. These policies are in conformity with generally accepted accounting principles in the United States of America (“GAAP”).
Estimates – The preparation of financial statements in conformity with GAAP requires management to make estimates and assumptions that affect the reported amounts of assets and liabilities and disclosure of contingent assets and liabilities at the date of the financial statements and the reported amounts of increases and decreases in net assets from operations during the reporting period. Actual results could differ from those estimates.
Foreign Currency Translation – The accounting records of the Fund are maintained in U.S. dollars. Foreign currency amounts are translated into U.S. dollars at the current rate of exchange each business day to determine the value of investments, and other assets and liabilities. Purchases and sales of foreign securities, and income and expenses, are translated at the prevailing rate of exchange on the respective date of these transactions. The Fund does not isolate that portion of the results of operations resulting from changes in foreign exchange rates on investments from fluctuation arising from changes in market prices of securities held. These fluctuations are included with the unrealized gain or loss from investments.
18
Preserver Alternative Opportunities Fund
Notes to the Financial Statements (continued)
August 31, 2019
Federal Income Taxes – The Fund makes no provision for federal income or excise tax. The Fund has qualified and intends to qualify each year as a regulated investment company (“RIC”) under subchapter M of the Internal Revenue Code of 1986, as amended (the“Code”), by complying with the requirements applicable to RICs and by distributing substantially all of its taxable income. The Fund also intends to distribute sufficient net investment income and net realized capital gains, if any, so that it will not be subject to excise tax on undistributed income and gains. If the required amount of net investment income or gains is not distributed, the Fund could incur a tax expense.
The Fund may be subject to taxes imposed by countries in which it invests. Such taxes are generally based on income and/or capital gains earned or repatriated. Taxes are accrued and applied to net investment income, net realized gains and unrealized appreciation as such income and/or gains are earned.
The Fund recognizes tax benefits or expenses of uncertain tax positions only when the position is “more likely than not” to be sustained assuming examination by tax authorities. Management of the Fund has reviewed tax positions taken in tax years that remain subject to examination by all major tax jurisdictions, including federal (i.e., the previous three tax year ends and the interim tax period since then, as applicable) and has concluded that no provision for unrecognized tax benefits or expenses is required in these financial statements and does not expect this to change over the next twelve months. The Fund recognizes interest and penalties, if any, related to unrecognized tax benefits as income tax expense in the Statement of Operations. During the year, the Fund did not incur any interest or penalties.
Expenses – Expenses incurred by the Trust that do not relate to a specific fund of the Trust are allocated to the individual funds based on each fund’s relative net assets or another appropriate basis (as determined by the Board).
Security Transactions and Related Income – Throughout the reporting period, security transactions are accounted for no later than one business day following the trade date. For financial reporting purposes, security transactions are accounted for on trade date on the last business day of the reporting period. The specific identification method is used for determining gains or losses for financial statements and income tax purposes. Dividend income is recorded on the ex-dividend date and interest income is recorded on an accrual basis. Dividend income from real estate investment trusts (REITs) and distributions from limited partnerships are recognized on the ex-date and included in dividend income. The calendar year-end classification of distributions received from REITs during the fiscal year are reported subsequent to year end; accordingly, the Fund estimates the character of REIT distributions based on the most recent information available. Income or loss from limited partnerships is reclassified among the components of net assets upon receipt of K-1’s. Discounts and premiums on fixed income securities purchased are amortized or accreted over the life of the respective securities using the effective interest method.
19
Preserver Alternative Opportunities Fund
Notes to the Financial Statements (continued)
August 31, 2019
Dividends and Distributions – The Fund intends to distribute its net investment income and net realized long-term and short-term capital gains, if any, at least annually. Dividends and distributions to shareholders, which are determined in accordance with income tax regulations, are recorded on the ex-dividend date. The treatment for financial reporting purposes of distributions made to shareholders during the period from net investment income or net realized capital gains may differ from their ultimate treatment for federal income tax purposes. These differences are caused primarily by differences in the timing of the recognition of certain components of income, expense or realized capital gain for federal income tax purposes. Where such differences are permanent in nature, they are reclassified among the components of net assets based on their ultimate characterization for federal income tax purposes. Any such reclassifications will have no effect on net assets, results of operations or net asset value (“NAV”) per share of the Fund.For the fiscal year ended August 31, 2019, the Fund did not have any reclassifications of net assets.
Restricted and Illiquid Securities – Restricted securities are any securities which are subject to restriction on resale under federal securities law, including commercial paper issued in reliance on the exemption from registration afforded by Section 4(2) of the Securities Act of 1933 (“1933 Act”), loan participations and interests in investment companies that are not registered under the Investment Company Act of 1940 (“1940 Act”) (each a “Private Fund”).Illiquid securities are those that may not reasonably be expected to be sold or disposed of in current market conditions in seven calendar days or less without the conversion to cash significantly changing the market value of the investment. The Fund intends to treat interests inPrivate Funds as illiquid securities.The Fund will not invest greater than 15% of its net assets in illiquidsecurities.
As of August 31, 2019, the Fund held illiquid securities representing 3.91% of net assets.
20
Preserver Alternative Opportunities Fund
Notes to the Financial Statements (continued)
August 31, 2019
NOTE 3. DERIVATIVE TRANSACTIONS
The Fund may engage in options transactions, which are sometimes referred to as derivative transactions. The Fund uses derivative instruments for any purpose consistent with its investment objective, such as for hedging or obtaining market exposure. The Fund also may use derivative instruments to obtain market exposure (that is, for speculative purposes rather than hedging). The Adviser may establish a position in the derivatives market as a substitute for buying, selling, or holding certain securities. The use of derivative instruments may provide a less expensive, more expedient or more specifically focused way to invest than traditional securities would.
Purchased/Written Option Contracts – The Fund may write or purchase option contracts to adjust risk and return of its overall investment positions. When the Fund writes or purchases an option, an amount equal to the premium received or paid by the Fund is recorded as a liability or an asset and is subsequently adjusted to the current market value of the option written or purchased. Premiums received or paid from writing or purchasing options that expire unexercised are treated by the Fund on the expiration date as realized gains or losses. The difference between the premium and the amount paid or received on affecting a closing purchase or sale transaction, including brokerage commissions, is also treated as a realized gain or loss. If an option is exercised, the premium paid or received is added to or subtracted from the cost of the purchase or proceeds from the sale in determining whether the Fund has realized a gain or loss on investment transactions. Investing in purchased and written options contracts exposes a Fund to equity price risk.
The following tables identify the location and fair value of derivative instruments on the Statement of Assets and Liabilities as of August 31, 2019, and the effect of derivative instruments on the Statement of Operations for the fiscal year ended August 31, 2019.
As of August 31, 2019:
| | Location of Derivatives on
Statement of Assets and Liabilities |
Derivatives | Asset Derivatives | Liability Derivatives | | Fair Value | |
Equity Price Risk: | | | | | | |
Written Options | | Written options at fair value | | $ | (160 | ) |
21
Preserver Alternative Opportunities Fund
Notes to the Financial Statements (continued)
August 31, 2019
For the fiscal year ended August 31, 2019:
Derivatives | Location of Gain (Loss) on
Derivatives on Statement of
Operations | | Realized Gain
(Loss) on
Derivatives | | | Change in
Unrealized
Appreciation
(Depreciation)
on Derivatives | |
Equity Price Risk: | | | | | | | | | |
Written Options | Net realized gain on written options | | $ | 13,228 | | | | | |
| | Net change in unrealized appreciation on written options | | | | | | $ | 1,682 | |
The following summarizes the average ending monthly market value of derivatives outstanding during the fiscal year ended August 31, 2019:
| | Average Market
Value | |
Written Options | | $ | (1,916 | ) |
The average monthly market value generally represents the Fund’s derivative activity throughout the period.
In the ordinary course of business, the Fund may enter into transactions subject to enforceable netting agreements or other similar arrangements (“netting agreements”). Generally, the right to offset in netting agreements allows the Fund to offset the exposure it has on any transaction with a specific counterparty with any collateral it has received or delivered in connection with other transactions with that counterparty. Generally, the Fund manages their cash collateral and securities collateral on a counterparty basis.
The offsetting of financial liabilities and derivative liabilities as of August 31, 2019 are as follows:
| | | Gross
Amounts of | | | Gross
Amounts of | | | Gross
Amounts
Offset in
Statement | | | Net
Amounts of
Liabilities
Presented in
Statement of | | | Gross Amounts Not
Offset in Statement of
Assets and Liabilities | | | | | |
| | Recognized
Assets | | | Recognized
Liabilities | | | of Assets and
Liabilities | | | Assets and
Liabilities | | | Financial
Instruments* | | | Collateral
Pledged | | | Net
Amount | |
Written Options | | $ | — | | | $ | (160 | ) | | $ | — | | | $ | (160 | ) | | $ | 160 | | | $ | — | | | $ | — | |
* | Amounts in financial instruments in the table above are limited to the net amounts of liabilities presented on the Statement of Assets and Liabilities. |
22
Preserver Alternative Opportunities Fund
Notes to the Financial Statements (continued)
August 31, 2019
NOTE 4. SECURITIES VALUATION AND FAIR VALUE MEASUREMENTS
Fair value is defined as the price that the Fund would receive upon selling an investment in a timely transaction to an independent buyer in the principal or most advantageous market of the investment. GAAP establishes a three-tier hierarchy to maximize the use of observable market data and minimize the use of unobservable inputs and to establish classification of fair value measurements for disclosure purposes.
Inputs refer broadly to the assumptions that market participants would use in pricing the asset or liability, including assumptions about risk (the risk inherent in a particular valuation technique used to measure fair value including a pricing model and/or the risk inherent in the inputs to the valuation technique). Inputs may be observable or unobservable. Observable inputs are inputs that reflect the assumptions market participants would use in pricing the asset or liability developed based on market data obtained and available from sources independent of the reporting entity. Unobservable inputs are inputs that reflect the reporting entity’s own assumptions about the assumptions market participants would use in pricing the asset or liability developed based on the best information available in the circumstances.
Various inputs are used in determining the value of the Fund’s investments. These inputs are summarized in the three broad levels listed below.
| | ● | Level 1 – unadjusted quoted prices in active markets for identical investments and/or registered investment companies where the value per share is determined and published and is the basis for current transactions for identical assets or liabilities at the valuation date |
| | ● | Level 2 – other significant observable inputs (including, but not limited to, quoted prices for an identical security in an inactive market, quoted prices for similar securities, interest rates, prepayment speeds, credit risk, etc.) |
| | ● | Level 3 – significant unobservable inputs (including the Fund’s own assumptions in determining fair value of investments based on the best information available) |
The inputs used to measure fair value may fall into different levels of the fair value hierarchy. In such cases, for disclosure purposes, the level in the fair value hierarchy which is reported, is determined based on the lowest level input that is significant to the fair value measurement in its entirety.
In computing the NAV of the Fund, fair value is based on market valuations with respect to portfolio securities for which market quotations are readily available. Pursuant to Board approved policies, the Fund relies on independent third-party pricing services to provide the current market value of securities. Those pricing services value equity securities, including exchange-traded funds, exchange-traded notes, closed-end funds and preferred stocks, traded on a securities exchange at the last reported sales price on the principal exchange.
23
Preserver Alternative Opportunities Fund
Notes to the Financial Statements (continued)
August 31, 2019
Equity securities quoted by NASDAQ are valued at the NASDAQ Official Closing Price. If there is no reported sale on the principal exchange, equity securities are valued at the mean between the most recent quoted bid and asked price. When using the market quotations or close prices provided by the pricing service and when the market is considered active, the security will be classified as a Level 1 security. Investments in open-end mutual funds, including money market mutual funds, are generally priced at the ending NAV provided by the pricing service of the funds and are generally categorized as Level 1 securities. Debt securities are valued using evaluated prices furnished by a pricing vendor selected by the Board and are generally classified as Level 2 securities.
Option contracts are generally traded on an exchange and are generally valued at the last quoted sales price. If there is no such reported sale on the valuation date, long positions are valued at the most recent bid price, and short positions are valued at the most recent ask price. The option contracts will generally be categorized as Level 1 securities unless the market is considered inactive or the absence of a last bid or ask price, in which case, they will be categorized as Level 2 securities.
In the event that market quotations are not readily available, the Adviser determines that the market quotation or the price provided by the pricing service does not accurately reflect the current fair value, or certain restricted or illiquid securities are being valued, such securities are valued as determined in good faith by the Trust’s Valuation Committee, based on recommendations from a pricing committee comprised of various officers of the Trust, various employees of the Fund’s administrator, and representatives of the Adviser (together the “Pricing Review Committee”). These securities will be classified as Level 2 or 3 within the fair value hierarchy, depending on the inputs used.
Private investment funds exempt from registration as an investment company under the 1940 Act (each a “Private Fund”) will be fair valued using the NAV as practical expedient, as provided by the Private Fund’s investment adviser or third party administrator. The fair value of the Fund’s investment in the Private Fund generally represents the amount the Fund would expect to receive if it were to liquidate its investment in the Private Fund. The Private Fund holds certain positions in non-marketable investments that are valued at estimated fair value, which may differ significantly from the values that would have been used had a ready market existed for these investments. All underlying investments held in the Private Fund are valued in accordance with the policies and procedures established by such Private Fund.
The Adviser will consider whether it is appropriate, in light of the relevant circumstances, to value shares at NAV as reported by the Private Fund for valuation purposes, or whether to adjust such reported value to reflect an adjusted fair value. In determining fair values as of August 31, 2019, the Adviser has, as a practical expedient, estimated fair value of the Private Fund using the NAV (or its equivalent) provided by the investment adviser or third party administrator of the Private Fund as of that date. All investments for which fair value
24
Preserver Alternative Opportunities Fund
Notes to the Financial Statements (continued)
August 31, 2019
is measured using the Private Fund’s net asset value as a practical expedient are not required to be included within the fair value hierarchy. Accordingly, the Private Fund with a fair value of $830,960 was valued at its respective net asset value as of August 31, 2019, and is excluded from the fair value hierarchy.
The Fund’s interests in a Private Fund are also illiquid and subject to substantial restrictions on transferability. The Fund may not be able to acquire initial or additional interests in a Private Fund or withdraw all or a portion of its investment from a Private Fund promptly after it has made a decision to do so because of limitations set forth in that Private Fund’s governing documents.
In accordance with the Trust’s Portfolio Valuation Procedures, the Pricing Review Committee, in making its recommendations, is required to consider all appropriate factors relevant to the value of securities for which it has determined other pricing sources are not available or reliable as described above. No single standard exists for determining fair value, because fair value depends upon the circumstances of each individual case. As a general principle, the current fair value of an issue of securities being valued pursuant to the Trust’s Fair Value Guidelines would be the amount which the Fund might reasonably expect to receive for them upon their current sale. Methods which are in accordance with this principle may, for example, be based on (i) a multiple of earnings; (ii) a discount from market prices of a similar freely traded security (including a derivative security or a basket of securities traded on other markets, exchanges or among dealers); or (iii) yield to maturity with respect to debt issues, or a combination of these and other methods. Fair value pricing is permitted if, in accordance with the Trust’s Portfolio Valuation Procedures, the validity of market quotations appears to be questionable based on factors such as evidence of a thin market in the security based on a small number of quotations, a significant event occurs after the close of a market but before the Fund’s NAV calculation that may affect a security’s value, or other data calls into question the reliability of market quotations.
25
Preserver Alternative Opportunities Fund
Notes to the Financial Statements (continued)
August 31, 2019
The following is a summary of the inputs used to value the Fund’s investments as of August 31, 2019:
| | | Valuation Inputs | | | | | |
Assets | | Level 1 | | | Level 2 | | | Level 3 | | | Total | |
Common Stocks | | $ | 10,692,595 | | | $ | — | | | $ | — | | | $ | 10,692,595 | |
Preferred Stocks | | | 1,369,334 | | | | — | | | | — | | | | 1,369,334 | |
Exchange-Traded Funds | | | 550,950 | | | | — | | | | — | | | | 550,950 | |
Corporate Bonds | | | — | | | | 4,875,373 | | | | — | | | | 4,875,373 | |
U.S. Treasury Obligations | | | — | | | | 1,373,780 | | | | — | | | | 1,373,780 | |
Collateralized Mortgage Obligations | | | — | | | | 623,019 | | | | — | | | | 623,019 | |
Convertible Corporate Bonds | | | — | | | | 109,800 | | | | — | | | | 109,800 | |
Asset-Backed Securities | | | — | | | | 79,794 | | | | — | | | | 79,794 | |
Total | | $ | 12,612,879 | | | $ | 7,061,766 | | | $ | — | | | $ | 19,674,645 | |
Assets excluded from fair value hierarchy* | | | | | | | | | | | | | | $ | 830,960 | |
Total | | | | | | | | | | | | | | $ | 20,505,605 | |
* | The investment in the Private Fund is measured at fair value using the net asset value per share (or its equivalent) practical expedient and has not been classified in the fair value hierarchy. The fair value amounts presented in this table are intended to permit reconciliation of the fair value hierarchy to the amounts presented in the statement of assets and liabilities. |
| | | Valuation Inputs | | | | | |
Other Financial Instruments | | Level 1 | | | Level 2 | | | Level 3 | | | Total | |
Written Options | | $ | (160 | ) | | $ | — | | | $ | — | | | $ | (160 | ) |
Total | | $ | (160 | ) | | $ | — | | | $ | — | | | $ | (160 | ) |
NOTE 5. FEES AND OTHER TRANSACTIONS WITH AFFILIATES AND OTHER SERVICE PROVIDERS
Under the terms of the investment advisory agreement (the “Agreement”), the Adviser manages the Fund’s investments subject to approval of the Board. As compensation for its management services, the Fund is obligated to pay the Adviser a fee computed and accrued daily and paid monthly at an annual rate of 0.75% of the Fund’s average daily net assets. For the fiscal year ended August 31, 2019, the Adviser earned fees of $157,825 from the Fund. At August 31, 2019, the Fund owed the Adviser $5,231 in accordance with the expense limitation agreement described below.
The Adviser has contractually agreed to waive its management fee and/or reimburse expenses so that total annual operating expenses (excluding (i) interest; (ii) taxes; (iii) brokerage fees and commissions; (iv) other extraordinary expenses not incurred in the ordinary course of the Fund’s business; (v) dividend expenses on short sales; (vi) expenses incurred under a Rule 12b-1 plan of distribution; and (vii) indirect expenses such as acquired fund fees and expenses) do not exceed 1.35% of the Fund’s average daily net assets through December
26
Preserver Alternative Opportunities Fund
Notes to the Financial Statements (continued)
August 31, 2019
31, 2020 (“Expense Limitation”). Prior to December 31, 2018, the expense cap was 1.75%. During any fiscal year that the Agreement between the Adviser and the Trust is in effect, the Adviser may recoup the sum of all fees previously waived or expenses reimbursed, less any reimbursement previously paid, provided that the Adviser is only permitted to recoup fees or expenses within 36 months from the date the fee waiver or expense reimbursement took effect and provided further that such recoupment can be achieved within the Expense Limitation currently in effect and the Expense Limitation in place when the waiver/reimbursement occurred. This expense cap agreement may be terminated by the Board at any time. As of August 31, 2019, the Adviser may seek repayment of investment advisory fee waivers and expense reimbursements in the amount as follows:
Recoverable through | | | |
August 31, 2020 | | $ | 33,553 | |
August 31, 2022 | | | 33,930 | |
The Trust retains Ultimus Asset Services, LLC (the “Administrator”) to provide the Fund with administration, accounting, transfer agent and compliance services, including all regulatory reporting. For the fiscal year ended August 31, 2019, the Administrator earned fees of $23,928 for administration services, $23,928 for fund accounting services, $13,929 for transfer agent services and $6,000 for compliance services. At August 31, 2019, the Fund owed the Administrator $4,667 for such services.
The Board supervises the business activities of the Trust. Each Trustee serves as a Trustee for the lifetime of the Trust or until the earlier of his or her retirement as a Trustee at age 78 (which may be extended for up to two years in an emeritus non-voting capacity at the pleasure and request of the Board), or until he/she dies, resigns, or is removed, whichever is sooner. “Independent Trustees,” meaning those Trustees who are not “interested persons” as defined in the Investment Company Act of 1940 (“1940 Act”) of the Trust, each receives an annual retainer of $500 per Fund and $500 per Fund for each quarterly in-person Board meeting. In addition, the Trust reimburses Trustees for out-of-pocket expense incurred in conjunction with attendance at Board meetings.
The officers and one Trustee of the Trust are employees of the Administrator. Unified Financial Securities, LLC (the “Distributor”) acts as the principal distributor of the Fund’s shares. Both the Administrator and the Distributor operate as wholly-owned subsidiaries of Ultimus Fund Solutions, LLC.
The Fund adopted a Distribution Plan (the “Plan”) pursuant to Rule 12b-1 under the 1940 Act. The Plan provides that the Fund will pay the Distributor and/or any registered securities dealer, financial institution or any other person (the “Recipient”) a fee of 0.25% of the average daily net assets of the Fund’s Retail Shares in connection with the promotion and distribution of the Fund’s Retail Shares or the provision of personal services to shareholders, including, but not necessarily limited to, advertising, compensation to underwriters, dealers
27
Preserver Alternative Opportunities Fund
Notes to the Financial Statements (continued)
August 31, 2019
and selling personnel, the printing and mailing of prospectuses to other than current shareholders of Retail Shares, the printing and mailing of sales literature and servicing shareholder accounts (“12b-1 Expenses”). Effective as of the close of business on February 12, 2019, Retail Shares were consolidated into Institutional Shares, and the Fund currently offers only Institutional Shares. Payments under the Plan were not authorized or permitted after February 12, 2019. Under the Plan, the Fund or Distributor may pay all or a portion of these fees to any Recipient who renders assistance in distributing or promoting the sale of shares, or who provides certain shareholder services, pursuant to a written agreement. The Plan is a compensation plan, which means that compensation is provided regardless of whether 12b-1 Expenses are actually incurred. Accordingly, the 12b-1 Expenses of the Retail Shares of the Fund may be less than fees paid out by the class under the Plan. For the period from September 1, 2018 through August 31, 2019, Retail Shares 12b-1 expense incurred by the Fund was $2,916.
NOTE 6. PURCHASES AND SALES OF SECURITIES
For the fiscal year ended August 31, 2019, purchases and sales of investment securities, other than short-term investments, were $11,345,709 and $13,335,202, respectively.
Purchases and sales of long-term U.S. Government obligations during the fiscal year ended August 31, 2019 were $659,967 and $0, respectively.
NOTE 7. FEDERAL TAX INFORMATION
At August 31, 2019, the net unrealized appreciation (depreciation) of investments for tax purposes was as follows:
Gross unrealized appreciation | | $ | 2,245,177 | |
Gross unrealized depreciation | | | (405,670 | ) |
Net unrealized appreciation/(depreciation) on investments | | | 1,839,507 | |
Tax cost of investments | | | 18,665,938 | |
The tax character of distributions paid for the fiscal years ended August 31, 2019 and August 31, 2018 were as follows:
| | 2019 | | | 2018 | |
Distributions paid from: | | | | | | | | |
Ordinary income(a) | | $ | 398,284 | | | $ | 258,311 | |
Long-term capital gains | | | 376,951 | | | | 330,646 | |
Total distributions paid | | $ | 775,235 | | | $ | 588,957 | |
(a) | Short term capital gain distributions are treated as ordinary income for tax purposes. |
28
Preserver Alternative Opportunities Fund
Notes to the Financial Statements (continued)
August 31, 2019
At August 31, 2019, the components of distributable earnings (accumulated losses) on a tax basis was as follows:
Undistributed ordinary income | | $ | 348,221 | |
Undistributed long-term capital gains | | | — | |
Accumulated capital and other losses | | | (258,613 | ) |
Unrealized appreciation on investments(a) | | | 1,839,507 | |
Unrealized depreciation on foreign currency translations | | | (473 | ) |
Total accumulated earnings | | $ | 1,928,642 | |
(a) | The difference between book basis and tax basis unrealized appreciation (depreciation) is primarily attributable to the mark-to-market adjustments on passive foreign investment companies, the tax treatment of return of capital adjustments and interest accruals on complex securities. |
As of August 31, 2019, the Fund had available for tax purposes an unused capital loss carryforward of $258,613, of long-term capital losses with no expiration, which is available to offset against future taxable net capital gains. To the extent that this carryforward is used to offset future gains, it is probable that the amount offset will not be distributed to shareholders.
NOTE 8. COMMITMENTS AND CONTINGENCIES
The Trust indemnifies its officers and Trustees for certain liabilities that may arise from their performance of their duties to the Trust or the Fund. Additionally, in the normal course of business, the Trust enters into contracts that contain a variety of representations and warranties which provide general indemnifications. The Trust’s maximum exposure under these arrangements is unknown, as this would involve future claims that may be made against the Trust that have not yet occurred.
NOTE 9. RECENT ACCOUNTING PRONOUNCEMENTS
In August 2018, the Financial Accounting Standards Board (“FASB”) issued Accounting Standards Update (“ASU”) 2018-13, which changes the fair value measurement disclosure requirements of FASB Accounting Standards Codification Topic 820, Fair Value Measurement. The update to Topic 820 includes new, eliminated, and modified disclosure requirements. ASU 2018-13 is effective for fiscal years beginning after December 15, 2019, including interim periods, although early adoption is permitted. Management has evaluated the implications of certain provisions of ASU 2018-13 and has determined to early adopt all aspects related to the removal and modification of certain fair value measurement disclosures under the ASU effective immediately. The impact of the adoption was not material to the Fund’s financial statements.
29
Preserver Alternative Opportunities Fund
Notes to the Financial Statements (continued)
August 31, 2019
NOTE 10. SUBSEQUENT EVENTS
Management of the Fund has evaluated the need for disclosures and/or adjustments resulting from subsequent events through the date at which these financial statements were issued. Based upon this evaluation, management has determined there were no items requiring adjustment of the financial statements or additional disclosure.
30
Report of Independent Registered Public Accounting Firm
To the Shareholders and the Board of Trustees of Preserver Alternative Opportunities Fund
Opinion on the Financial Statements
We have audited the accompanying statement of assets and liabilities of Preserver Alternative Opportunities Fund (the “Fund”) (one of the funds constituting Capitol Series Trust (the “Trust”)), including the schedule of investments, as of August 31, 2019, the schedule of open written option contracts as of August 31, 2019, and the related statement of operations for the year then ended, the statements of changes in net assets for each of the two years in the period then ended, the financial highlights for each of the three years in the period then ended and the related notes (collectively referred to as the “financial statements”). In our opinion, the financial statements present fairly, in all material respects, the financial position of the Fund (one of the funds constituting Capitol Series Trust) at August 31, 2019, the results of its operations for the year then ended, the changes in its net assets for each of the two years in the period then ended and its financial highlights for each of the three years in the period then ended, in conformity with U.S. generally accepted accounting principles.
The financial highlights for the period from March 1, 2016 (commencement of operations) to August 31, 2016 were audited by other auditors whose report dated October 26, 2016, expressed an unqualified opinion on those financial highlights.
Basis for Opinion
These financial statements are the responsibility of the Trust’s management. Our responsibility is to express an opinion on the Fund’s financial statements based on our audits. We are a public accounting firm registered with the Public Company Accounting Oversight Board (United States) (“PCAOB”) and are required to be independent with respect to the Trust in accordance with the U.S. federal securities laws and the applicable rules and regulations of the Securities and Exchange Commission and the PCAOB.
We conducted our audits in accordance with the standards of the PCAOB. Those standards require that we plan and perform the audit to obtain reasonable assurance about whether the financial statements are free of material misstatement, whether due to error or fraud. The Trust is not required to have, nor were we engaged to perform, an audit of Trust’s internal control over financial reporting. As part of our audit we are required to obtain an understanding of internal control over financial reporting but not for the purpose of expressing an opinion on the effectiveness of the Trust’s internal control over financial reporting. Accordingly, we express no such opinion.
31
Report of Independent Registered Public Accounting Firm
(Continued)
Our audits included performing procedures to assess the risks of material misstatement of the financial statements, whether due to error or fraud, and performing procedures that respond to those risks. Such procedures included examining, on a test basis, evidence regarding the amounts and disclosures in the financial statements. Our procedures included confirmation of securities owned as of August 31, 2019, by correspondence with the custodian and brokers or by other appropriate auditing procedures where replies from brokers were not received. Our audits also included evaluating the accounting principles used and significant estimates made by management, as well as evaluating the overall presentation of the financial statements. We believe that our audits provide a reasonable basis for our opinion.

We have served as the auditor of one or more Capitol Series Trust investment companies since 2017.
Cincinnati, Ohio
October 29, 2019
32
Summary of Fund Expenses (Unaudited)
As a shareholder of the Fund, you incur two types of costs: (1) transaction and (2) ongoing costs, including management fees and other Fund expenses. These examples are intended to help you understand your ongoing costs (in dollars) of investing in the Fund and to compare these costs with the ongoing costs of investing in other mutual funds. The example is based on an investment of $1,000 invested at the beginning of the period and held for the entire period from March 1, 2019 through August 31, 2019.
Actual Expenses
The first line of the table for each class provides information about actual account values and actual expenses. You may use the information in these lines, together with the amount you invested, to estimate the expenses that you paid over the period. Simply divide your account value by $1,000 (for example, an $8,600 account value divided by $1,000 = 8.60), then multiply the result by the number in the first line under the heading “Expenses Paid During Period” to estimate the expenses you paid on your account during this period.
Hypothetical Example for Comparison Purposes
The second line of the table for each class provides information about hypothetical account values and hypothetical expenses based on the Fund’s actual expense ratios and an assumed rate of return of 5% per year before expenses, which is not the Fund’s actual return. The hypothetical account values and expenses may not be used to estimate the actual ending account balances or expenses you paid for the period. You may use this information to compare the ongoing costs of investing in the Fund and other funds. To do so, compare this 5% hypothetical example with the 5% hypothetical examples that appear in the shareholder reports of the other funds.
Expenses shown in the table are meant to highlight your ongoing costs only and do not reflect any transactional costs. Therefore, the second line of the table below is useful in comparing ongoing costs only and will not help you determine the relative costs of owning different funds. In addition, if transaction costs were included, your costs would have been higher.
| | | Beginning
Account Value
March 1, 2019 | Ending
Account Value
August 31, 2019 | Expenses
Paid During
Period(a) | Annualized
Expense
Ratio |
Preserver Alternative Opportunities Fund | | | |
Institutional Class | Actual | $ 1,000.00 | $ 1,050.60 | $ 7.00 | 1.35% |
| | | | | | |
| | Hypothetical(b) | $ 1,000.00 | $ 1,018.38 | $ 6.89 | 1.35% |
(a) | Expenses are equal to the Fund’s annualized expense ratios, multiplied by the average account value over the period, multiplied by 184/365 (to reflect the one-half year period). |
(b) | Hypothetical assumes 5% annual return before expenses. |
33
Additional Federal Income Tax Information (Unaudited)
The Form 1099-DIV you receive in January 2020 will show the tax status of all distributions paid to your account in calendar year 2019. Shareholders are advised to consult their own tax adviser with respect to the tax consequences of their investment in the Fund. As required by the Internal Revenue Code and/or regulations, shareholders must be notified regarding the status of qualified dividend income for individuals and the dividends received deduction for corporations.
Qualified Dividend Income. The Fund designates approximately51% or up to the maximum amount of such dividends allowable pursuant to the Internal Revenue Code, as qualified dividend income eligible for the reduced tax rate of 15%.
Qualified Business Income. The Fund designates approximately8% of its ordinary income dividends, or up to the maximum amount of such dividends allowable pursuant to the Internal Revenue Code, as qualified business income.
Dividends Received Deduction. Corporate shareholders are generally entitled to take the dividends received deduction on the portion of the Fund’s dividend distribution that qualifies under tax law. For the Fund’s calendar year 2019 ordinary income dividends,30% qualifies for the corporate dividends received deduction.
For the fiscal year ended August 31, 2019, the Fund designated $376,951 as 20% long-term capital gain distributions.
34
Trustees and Officers (Unaudited)
The Board supervises the business activities of the Trust and is responsible for protecting the interests of shareholders. The Chairman of the Board is Walter B. Grimm, who is an Independent Trustee of the Trust.
Each Trustee serves as a Trustee for the lifetime of the Trust or until the earlier of his or her retirement as a Trustee at age 78, death, resignation or removal. Officers are re-elected annually by the Board. The address of each Trustee and officer is 225 Pictoria Drive, Suite 450, Cincinnati, Ohio 45246.
As of the date of this report, the Trustees oversee the operations of 15 series.
Interested Trustee Background.The following table provides information regarding the Interested Trustee.
Name, Address, (Age), Position with Trust,
Term of Position with Trust | Principal Occupation During
Past 5 Years and Other Directorships |
Robert G. Dorsey* Age: 62 TRUSTEE Began Serving: March 2017 | Principal Occupation(s): Vice Chairman of Ultimus Fund Solutions, LLC and its subsidiaries, except as otherwise noted for the FINRA-regulated broker-dealer entities (February 2019 to present); Interested Trustee of Ultimus Managers Trust (February 2012 to present). Previous Position(s): Managing Director and Co-Chief Executive Officer of Ultimus Fund Solutions, LLC (1999 to February 2019); President of Ultimus Fund Distributors, LLC (1999 to 2018); President of Ultimus Managers Trust (February 2012 to October 2013). |
* | Mr. Dorsey is considered an “interested person” of the Trust within the meaning of Section 2(a)(19) of the 1940 Act because of his relationship with the Trust’s administrator, transfer agent, and distributors. |
Independent Trustee Background. The following table provides information regarding the Independent Trustees.
Name, Address, (Age), Position with Trust,
Term of Position with Trust | Principal Occupation During
Past 5 Years and Other Directorships |
John C. Davis Age: 67 TRUSTEE Began Serving: July 2018 | Principal Occupations(s): Consultant (government services) since May 2011. Previous Position(s): Retired Partner of PricewaterhouseCoopers LLP (1974-2010); Consultant, Board of Trustees of Ultimus Managers Trust (2016 to 2019) and Former Trustee of Ultimus Managers Trust (2012 to 2016). |
35
Trustees and Officers (Unaudited) (continued)
Name, Address, (Age), Position with Trust,
Term of Position with Trust | Principal Occupation During
Past 5 Years and Other Directorships |
Walter B. Grimm Age: 74 TRUSTEE AND CHAIR Began Serving: November 2013 | Principal Occupations(s): President, Leigh Management Group, LLC (consulting firm) (October 2005 to present); and President, Leigh Investments, Inc. (1988 to present). Previous Position(s): Chief Financial Officer, East West Private, LLC (consulting firm) (2009 to 2013). |
Lori Kaiser Age: 56 TRUSTEE Began Serving: July 2018 | Principal Occupations(s): Founder and CEO, Kaiser Consulting since 1992. |
Janet Smith Meeks Age: 64 TRUSTEE Began Serving: July 2018 | Principal Occupations(s): Co-Founder and CEO, Healthcare Alignment Advisors, LLC (consulting company) since August 2015. Previous Position(s): President and Chief Operating Officer, Mount Carmel St. Ann’s Hospital (2006 to 2015). |
Mary M. Morrow Age: 61 TRUSTEE Began Serving: November 2013 | Principal Occupations(s): Chief Operating Officer, Dignity Health Managed Services Organization (October 2018 to present). Previous Position(s): Consultant (managed care services) (April 2018 to September 2018); Chief Operating Officer, Pennsylvania Health and Wellness (fully owned subsidiary of Centene Corporation) (November 2016 to April 2018); Vice President, Strategic Initiatives, Gateway Heath (January 2015 to November 2016); Consulting Practice Manager, DST Health Solutions (August 2010 to January 2015). |
36
Trustees and Officers (Unaudited) (continued)
Officers. The following table provides information regarding the Officers.
Name, Address, (Age), Position with Trust,
Term of Position with Trust | Principal Occupation During
Past 5 Years and Other Directorships |
Matthew J. Miller Age: 43 PRESIDENT and CHIEF EXECUTIVE OFFICER Began Serving: September 2013 (as VP); September 2018 (as President) | Principal Occupation(s): Assistant Vice President, Relationship Management, Ultimus Fund Solutions, LLC (December 2015 to present); Vice President, Valued Advisers Trust (December 2011 to present). Previous Position(s): Vice President, Capitol Series Trust (September 2013 to March 2017); Chief Executive Officer and President, Capitol Series Trust (March 2017 to March 2018); Secretary, Capitol Series Trust (March 2018 to September 2018); Vice President, Relationship Management, Huntington Asset Services, Inc. (n/k/a Ultimus Asset Services, LLC) (2008 to December 2015); Vice President, The Huntington Funds (February 2010 to April 2015); Vice President, Transfer Agency Operations, Huntington Asset Services, Inc. (2002 to 2008); Employed in various positions with Huntington Asset Services, Inc. (July 1998 to 2002). |
Zachary P. Richmond Age: 39 TREASURER AND CHIEF FINANCIAL OFFICER Began Serving: August 2014 | Principal Occupation(s): Vice President, Director of Financial Administration for Ultimus Fund Solutions, LLC (February 2019 to present); Treasurer and Chief Financial Officer of Unified Series Trust (November 2014 to present); Treasurer and Chief Financial Officer of Commonwealth International Series Trust (September 2015 to present); Treasurer of Oak Associates Funds (April 2019 to present); Treasurer of Centaur Mutual Funds Trust (April 2019 to present). Previous Position(s): Assistant Vice President, Associate Director of Financial Administration for Ultimus Fund Solutions, LLC (December 2015 to February 2019); Manager, Fund Administration, Huntington Asset Services, Inc. (January 2011 to December 2015); Interim Treasurer and Chief Financial Officer of Unified Series Trust (August 2014 to November 2014); Assistant Treasurer of Unified Series Trust (May 2011 to August 2014). |
37
Trustees and Officers (Unaudited) (continued)
Name, Address, (Age), Position with Trust,
Term of Position with Trust | Principal Occupation During
Past 5 Years and Other Directorships |
Martin R. Dean Age: 55 INTERIM CHIEF COMPLIANCE OFFICER Began Serving: May 2019 | Principal Occupation(s): Vice President, Director of Fund Compliance, Ultimus Fund Solutions, LLC (since January 2016), Chief Compliance Officer, First Western Funds Trust (since April 2016); Chief Compliance Officer, Cross Shore Discovery Fund (since June 2016); Chief Compliance Officer, FSI Low Beta Absolute Return Fund (since November 2016); Chief Compliance Officer, Peachtree Alternative Strategies Fund (since January 2017); Chief Compliance Officer, Dupree Mutual Funds (since August 2017); Interim Chief Compliance Officer, Valued Advisers Trust (since May 2019); and Chief Compliance Officer, Fenimore Asset Management Trust (since May 2019). Previous Position(s): Senior Vice President and Compliance Group Manager, Huntington Asset Services, Inc. (July 2013 to December 2015); Director of Fund Accounting and Fund Administration Product, Citi Fund Services (January 2008 to June 2013). |
Other Information (Unaudited)
The Fund’s Statement of Additional Information (“SAI”) includes additional information about the trustees and is available without charge, upon request. You may call toll-free at (844) 838-2119 to request a copy of the SAI or to make shareholder inquiries.
38
Approval of Investment Advisory Agreement (Unaudited)
At a quarterly meeting of the Board of Trustees of Capitol Series Trust (“Trust”) held on June 3 - 4, 2019, the Trust’s Board of Trustees (the “Board”), including all of the Trustees who are not “interested persons” of the Trust as that term is defined in Section 2(a)(19) of the Investment Company Act of 1940, as amended (the “1940 Act”) (the “Independent Trustees”), considered and approved the continuation for an additional one-year period of the Investment Advisory Agreement between the Trust and Preserver Partners, LLC (“Preserver”) (the “Investment Advisory Agreement”) with respect to the Preserver Alternative Opportunities Fund (the “Preserver Fund”), a series of the Trust.
Prior to the meeting, the Trustees received and considered information from Preserver and the Trust’s administrator designed to provide the Trustees with the information necessary to evaluate the terms of the proposed renewal of the Investment Advisory Agreement between the Trust and Preserver, including, but not limited to: Preserver’s response to counsel’s due diligence letter requesting information relevant to renewal of the Investment Advisory Agreement; the operating expense limitation agreement currently in effect between Preserver and the Preserver Fund (the “Expense Limitation Agreement”); and Morningstar peer group expense and performance data for comparative purposes (the “Support Materials”). At various times, the Trustees reviewed the Support Materials with Preserver, with Trust management, and with counsel to the Independent Trustees. The completeness of the Support Materials provided by Preserver, which included both responses and materials provided in response to initial and supplemental due diligence requests, was noted. This information, together with the information provided to and reviewed by the Board during the nearly four years that the fund has been operational, formed the primary, but not exclusive, basis for the Board’s determinations.
Before voting to approve the renewal of the Investment Advisory Agreement, the Trustees reviewed the terms and the form of Investment Advisory Agreement and the Support Materials with Trust management and with counsel to the Independent Trustees. The Trustees received and discussed a memorandum from such counsel delineating the legal standards governing their consideration of the renewal of the Investment Advisory Agreement, which memorandum described the various factors that the U.S. Courts and the U.S. Securities and Exchange Commission (“SEC”) over the years have suggested would be appropriate for trustee consideration, including the factors outlined in Gartenberg v. Merrill Lynch Asset Management Inc., 694 F.2d 923, 928 (2d Cir. 1982); cert. denied sub. nom. and Andre v. Merrill Lynch Ready Assets Trust, Inc., 461 U.S. 906 (1983). Representatives from Preserver also met with the Trustees and provided additional information to the Trustees regarding its services to the Preserver Fund, including but not limited to, information regarding its investment philosophy, the firm’s compliance culture, the ownership structure of Preserver, Preserver’s financial condition as reflected in its financial statements, the fund expenses that Preserver subsidizes, the resources that Preserver dedicates to servicing the Preserver Fund, Preserver’s profitability with respect to the Preserver Fund, Preserver’s marketing and distribution activities, succession planning, Preserver’s future plans with regard to the Preserver Fund, and other benefits that Preserver derives from its relationship with the Preserver Fund, among other topics.
39
In determining whether to approve the renewal of the Investment Advisory Agreement, the Trustees considered all factors they believed relevant, including the following, with respect to the Preserver Fund: (1) the nature, extent, and quality of the services provided by Preserver with respect to the Preserver Fund; (2) the cost of the services to be provided and the profits and losses realized by Preserver from services rendered to the Trust with respect to the Preserver Fund; (3) comparative fee and expense data for the Preserver Fund and other investment companies or institutional accounts with similar investment objectives; (4) the extent to which economies of scale would be realized as the Preserver Fund grows, and whether the advisory fees for the Fund reflect such economies of scale for the Preserver Fund’s benefit; and (5) other financial benefits to Preserver resulting from services rendered to the Preserver Fund. In their deliberations, the Trustees did not identify any particular information that was all-important or controlling.
After having received and reviewed the Support Materials, as well as quarterly investment performance, compliance, operating, and distribution reports on the Preserver Fund over an extended time period, the Trustees discussed the facts and factors relevant to their consideration of the continuation of the Investment Advisory Agreement, which incorporated and reflected their knowledge of Preserver’s services to the Fund. Taking such information into account, the Board considered whether the overall arrangements between the Trust and Preserver as set forth in the Investment Advisory Agreement, including the investment advisory fees that the Preserver Fund pays to Preserver, continue to be fair and reasonable in light of the services Preserver performs, as well as such other matters as the Trustees considered relevant in the exercise of their reasonable business judgment. The material factors and conclusions that formed the basis of the Trustees’ determination to approve the continuation of the Investment Advisory Agreement are summarized below.
Nature, Extent and Quality of Services Provided.The Trustees considered the scope of services that Preserver provides under the Investment Advisory Agreement, noting that such services include, but are not limited to, the following: (1) investing the Preserver Fund’s assets consistent with the Fund’s investment objective and investment policies; (2) determining the portfolio securities to be purchased, sold or otherwise disposed of and the timing of such transactions; (3) voting all proxies with respect to the Preserver Fund’s portfolio securities; (4) maintaining the required books and records for transactions that Preserver effects on behalf of the Fund; and (5) selecting broker-dealers to execute orders on behalf of the Preserver Fund.The Trustees also noted that Preserver performs certain distribution, marketing and compliance services for the Preserver Fund, including, but not limited to, exploring the possibility of hosting a conference for other investment advisors inPreserver’s locale in order to generate interest in the Preserver Fund. The Trustees considered Preserver’s capitalization and its assets under management, noting that Preserver’s assets under management, number of accounts, and the Preserver Fund’s assets under management have decreased, but also noted that Preserver had provided reasonable explanations for such decreases. The Trustees further considered the investment philosophy and experience of the portfolio management team. The Trustees also noted the Preserver Fund’s performance compared to its benchmark. The Trustees considered that the Preserver Fund outperformed its current benchmark, the Wilshire Liquid Alternative Index for the one- and three-year periods ended March 31, 2019, while the Fund underperformed its
40
former benchmark, the Bloomberg Barclays U.S. Aggregate Bond Index, for the same one-year period and outperformed for the same three-year period. The Trustees also considered the Preserver Fund’s performance compared to the 50% - 70% Equity Morningstar peer group category and the Adviser’s custom peer group. They noted that the Preserver Fund slightly underperformed the median and average of the Morningstar peer group for the one-year and three-year periods ended March 31, 2019. They further noted that the Preserver Fund slightly underperformed the median and average of its custom peer group for the one-year period ended March 31, 2019, and outperformed the median and average of the custom peer group for the three-year period ended March 31, 2019. The Trustees noted that the Morningstar 50% - 70% Equity peer group comparative data was filtered to include funds with a similar asset size to that of the Preserver Fund, and discussed the appropriateness of such a comparison. The Trustees concluded that they are satisfied with the nature, extent and quality of services that Preserver provides to the Preserver Fund under the Investment Advisory Agreement.
Cost of Advisory Services and Profitability. The Trustees considered the annual management fee that the Preserver Fund pays to Preserver under the Investment Advisory Agreement, as well as Preserver’s profitability from the services that it renders to the Fund.The Trustees further considered that Preserver has contractually agreed to reduce its management fees and, if necessary, reimburse the Preserver Fund for operating expenses, as specified in the Fund’s prospectus and Expense Limitation Agreement. The Trustees discussed Preserver’s ownership structure and overall financial condition, as well as the Preserver Fund’s profitability to the Adviser.In that regard, the Trustees noted that while for the fiscal year ended December 31, 2018, the Adviser had contractually agreed to waive its management fee and/or reimburse expenses so that the total operating expenses of the Preserver Fund did not exceed 1.75%, effective December 31, 2018, it had contractually agreed to lower the expense ratio cap for the Fund to 1.35%.The Trustees noted that with these expense ratio caps in place, the Adviser had realized only a small profit from its management of the Preserver Fund in 2018, and expects to realize an even smaller profit from the Fund in 2019. The Trustees also considered that because of the downward change in the expense ratio cap effective December 31, 2018, Preserver will not be entitled to recoup certain fees and expenses that it had waived or reimbursed in prior years.Based on all these factors, the Trustees concluded that both Preserver’s historical profitability and its projected profitability with respect to the Preserver Fund are reasonable.
Comparative Fee and Expense Data. The Trustees noted that Preserver charges a lower fee to the Preserver Fund than it charges to the private funds it manages.The Trustees further noted that those private funds have similar investment objectives to the Preserver Fund, but different portfolio compositions. The Trustees also observed that the Preserver Fund’s gross management fee of 0.75% is in line with the median and above the average management fee reported for the 50% - 70% Equity Morningstar peer group.With respect to the Adviser’s custom peer group, the Trustees noted that the Preserver Fund’s gross management fee is below the average and median of the peer group.The Trustees also considered that the Preserver Fund’s total net expense ratio (after waivers and expense reimbursements) of1.35% is above the average and median total net expense ratioreported for the 50% - 70% Equity Morningstar peer group, but is below the average and median total net expense
41
ratio the Adviser’s custom peer group. They further noted that the Preserver Fund’s gross expense ratio is higher than the average and median gross expense ratio reported for the 50% - 70% Equity Morningstar peer group, but is only slightly higher than the average and median gross expense ratio for the Adviser’s custom peer group The Trustees also noted that the Morningstar peer group comparisons included in the Support Materials were based upon funds in the 50% - 70% Equity peer group with similar net asset levels of under $50 million, and discussed the appropriateness of such comparisons. The Trustees considered that even though the Preserver Fund’s total net expense ratio (after waivers and expense reimbursements) is above the average and median total net expense ratio reported for the 50% - 70% Equity Morningstar peer group, and its total gross expense ratio is above f the median and average reported for both the 50% - 70% Equity Morningstar peer group and the Adviser’s custom peer group, Preserver is not unjustly enriched. While recognizing that it is difficult to compare advisory fees because the scope of advisory services provided may vary from one investment adviser to another, the Trustees concluded that Preserver’s advisory fee continues to be reasonable.
Economies of Scale. The Trustees considered whether the Preserver Fund may benefit from any economies of scale, but did not find that any material economies exist at this time.The Trustees noted that the advisory fees charged by Preserver does not contain any fee breakpoints, but that due to the Preserver Fund’s asset size, the Board concluded that it is not necessary to consider the implementation of fee breakpoints at this time.In addition, the Board considered the fee structures of the Preserver Fund’s various service providers, noting that the Preserver Fund likely will not benefit from any economies of scale until fund assets increase.Finally, the Trustees further noted that the investment style of the Preserver Fund may mean that economies of scale are more difficult to achieve.
Other Benefits. The Trustees also considered the extent to which Preserver utilizes soft dollar arrangements with respect to portfolio transactions, and noted that Preserver does not utilize soft dollar arrangements in connection with the execution of client transactions, and that affiliated brokers are not utilized to execute the portfolio transactions of the Preserver Fund. The Trustees concluded that, all things considered, Preserver will not receive additional material financial benefits from services rendered to the Preserver Fund.The Trustees also noted that Preserve does not have any affiliates that could directly or indirectly benefit from the Preserver Fund. The Trustees also considered the Adviser’s representation that its relationship with the Preserver Fund had a positive impact on the Adviser by providing greater exposure to a wider group of investors, including retail investors, because investment minimums are lower than for other Preserver products, investor financial requirements are eliminated, and daily liquidity is offered.
Based upon Preserver’s presentation to the Board and the Support Materials considered in connection with the renewal of the Investment Advisory Agreement, as well as the information provided throughout the course of the year, the Board concluded that the overall arrangements between the Trust and Preserver, as set forth in the Investment Advisory Agreement between the Trust and Preserver, are fair and reasonable in light of the services to be performed, investment advisory fees to be paid and such other matters as the Trustees considered relevant in the exercise of their reasonable judgment.
42
FACTS | WHAT DOES CAPITOL SERIES TRUST DO WITH YOUR PERSONAL INFORMATION? |
| | |
Why? | Financial companies choose how they share your personal information. Federal law gives consumers the right to limit some but not all sharing. Federal law also requires us to tell you how we collect, share, and protect your personal information. Please read this notice carefully to understand what we do. |
| | |
What? | The types of personal information we collect and share depend on the product or service you have with us. This information can include: ■ Social Security number ■ account balances and account transactions ■ transaction or loss history and purchase history ■ checking account information and wire transfer instructions When you are no longer our customer, we continue to share your information as described in this notice. |
| | |
How? | All financial companies need to share customers’ personal information to run their everyday business. In the section below, we list the reasons financial companies can share their customers’ personal information; the reasons Capitol Series Trust chooses to share; and whether you can limit this sharing. |
| | |
Reasons we can share your personal information | Does Capitol Series
Trust share? |
For our everyday business purposes—
such as to process your transactions, maintain your account(s), respond to court orders and legal investigations, or report to credit bureaus | Yes |
For our marketing purposes—
to offer our products and services to you | Yes |
For joint marketing with other financial companies | No |
For our affiliates’ everyday business purposes—
information about your transactions and experiences | No |
For our affiliates’ everyday business purposes—
information about your creditworthiness | No |
For nonaffiliates to market to you | No |
| | |
Questions? | Call 1-844-838-2119 |
43
Who we are |
Who is providing this notice? | Capitol Series Trust |
What we do |
How does Capitol Series Trust protect my personal information? | To protect your personal information from unauthorized access and use, we use security measures that comply with federal law. These measures include computer safeguards and secured files and buildings. |
How does Capitol Series Trust collect my personal information? | We collect your personal information, for example, when you ■ open an account or deposit money ■ buy securities from us or sell securities to us ■ make deposits or withdrawals from your account provide account information ■ give us your account information ■ make a wire transfer ■ tell us who receives the money ■ tell us where to send the money ■ show your government-issued ID ■ show your driver’s license |
Why can’t I limit all sharing? | Federal law gives you the right to limit only ■ sharing for affiliates’ everyday business purposes — information about your creditworthiness ■ affiliates from using your information to market to you ■ sharing for nonaffiliates to market to you State laws and individual companies may give you additional rights to limit sharing. |
Definitions |
Affiliates | Companies related by common ownership or control. They can be financial and nonfinancial companies. |
Nonaffiliates | Companies not related by common ownership or control. They can be financial and nonfinancial companies. ■ Capitol Series Trust does not share your personal information with nonaffiliates so they can market to you. |
Joint marketing | A formal agreement between nonaffiliated financial companies that together market financial products or services to you. ■ Capitol Series Trust doesn’t jointly market financial products or services to you. |
44
This page is intentionally left blank.
Proxy Voting (Unaudited)
A description of the policies and procedures that the Fund uses to determine how to vote proxies relating to portfolio securities and information regarding how the Fund voted those proxies during the most recent twelve month period ended June 30 are available (1) without charge upon request by calling the Fund at (844) 838-2119 and (2) in Fund documents filed with the Securities and Exchange Commission (“SEC”) on the SEC’s website at www.sec.gov.
TRUSTEES
Walter B. Grimm, Chairman
John C. Davis
Robert G. Dorsey
Lori Kaiser
Janet Smith Meeks
Mary M. Morrow
OFFICERS
Matthew J. Miller, Chief Executive Officer and President
Zachary P. Richmond, Chief Financial Officer and Treasurer
Martin R. Dean, Interim Chief Compliance Officer
INVESTMENT ADVISER
Preserver Partners, LLC
8700 Trail Lake Drive West, Suite 105
Memphis, TN 38125
DISTRIBUTOR
Unified Financial Securities, LLC
9465 Counselors Row, Suite 200
Indianapolis, IN 46240
INDEPENDENT REGISTERED PUBLIC ACCOUNTING FIRM
Ernst & Young LLP
221 East 4th Street, Suite 2900
Cincinnati, OH 45202
LEGAL COUNSEL
Bernstein Shur
100 Middle Street, 6th Floor
Portland, ME 04104
CUSTODIAN
Huntington National Bank
41 South High Street
Columbus, OH 43215
ADMINISTRATOR, TRANSFER AGENT AND FUND ACCOUNTANT
Ultimus Asset Services, LLC
225 Pictoria Drive, Suite 450
Cincinnati, OH 45246
This report is intended only for the information of shareholders or those who have received the Fund’s prospectus which contains information about the Fund’s management fee and expenses. Please read the prospectus carefully before investing.
Distributed by Unified Financial Securities, LLC
Member FINRA/SIPC
Item 2. Code of Ethics.
As of the end of the period covered by this report, the registrant has adopted a code of ethics that applies to the registrant's principal executive officer, principal financial officer, principal accounting officer or controller, or persons performing similar functions, regardless of whether these individuals are employed by the registrant or a third party. Pursuant to Item 12(a)(1), a copy of registrant’s code of ethics is filed as an exhibit to this Form N-CSR. During the period covered by this report, the code of ethics has not been amended, and the registrant has not granted any waivers, including implicit waivers, from the provisions of the code of ethics.
Item 3. Audit Committee Financial Expert.
(a)(1) The registrant’s Board of Trustees has determined that the registrant has at least two audit committee financial experts serving on its audit committee.
(a)(2) The audit committee financial experts are Lori Kaiser and John C. Davis, who are both “independent” for purposes of this Item 3 of Form N-CSR.
Item 4. Principal Accountant Fees and Services.
(a) Audit Fees billed to the registrant by its principal accountants for the two most recent fiscal years:
| Meritage Funds: | FY 2019 | $48,000 |
| | FY 2018 | $46,500 |
| | | |
| Preserver Alternative Opportunities Fund: | FY 2019 | $21,000 |
| | FY 2018 | $15,500 |
| Hedeker Strategic Appreciation Fund: | FY 2019 | $19,500 |
| | FY 2018 | $19,000 |
(b) Audit-Related Fees billed to the registrant by its principal accountants for the two most recent fiscal years:
| Meritage Funds: | FY 2019 | $0 |
| | FY 2018 | $5,000 |
| | | |
| Preserver Alternative Opportunities Fund: | FY 2019 | $0 |
| | FY 2018 | $0 |
| Hedeker Strategic Appreciation Fund: | FY 2019 | $0 |
| | FY 2018 | $0 |
c) Tax Fees billed to the registrant by its principal accountants for the two most recent fiscal years:
| Meritage Funds: | FY 2019 | $15,450 |
| | FY 2018 | $15,000 |
| | | |
| Preserver Alternative Opportunities Fund: | FY 2019 | $5,150 |
| | FY 2018 | $5,000 |
| Hedeker Strategic Appreciation Fund: | FY 2019 | $5,150 |
| | FY 2018 | $5,000 |
(d) All other fees billed to the registrant by its principal accountants for the two most recent fiscal years:
| Meritage Funds: | FY 2019 | $0 |
| | FY 2018 | $0 |
| | | |
| Preserver Alternative Opportunities Fund: | FY 2019 | $0 |
| | FY 2018 | $0 |
| Hedeker Strategic Appreciation Fund: | FY 2019 | $0 |
| | FY 2018 | $0 |
| (e)(1) | Audit Committee’s Pre-Approval Policies |
The Audit Committee Charter requires the Audit Committee to be responsible for the selection, retention or termination of auditors and, in connection therewith, to (i) evaluate the proposed fees and other compensation, if any, to be paid to the auditors, (ii) evaluate the independence of the auditors, (iii) pre-approve all audit services and, when appropriate, any non-audit services provided by the independent auditors to the Trust, (iv) pre-approve, when appropriate, any non-audit services provided by the independent auditors to the Trust's investment adviser, or any entity controlling, controlled by, or under common control with the investment adviser and that provides ongoing services to the Trust if the engagement relates directly to the operations and financial reporting of the Trust, and (v) receive the auditors’ specific representations as to their independence;
(2) All of the services described in paragraphs (b) through (d) of Item 4 were pre-approved by the Audit Committee.
(f) During audit of registrant's financial statements for the most recent fiscal year, less than 50 percent of the hours expended on the principal accountant's engagement were attributed to work performed by persons other than the principal accountant's full-time, permanent employees.
(g) The aggregate non-audit fees billed by the registrant's accountant for services rendered to the registrant, and rendered to the registrant's investment adviser (not including any sub-adviser whose role is primarily portfolio management and is subcontracted with or overseen by another investment adviser), and any entity controlling, controlled by, or under common control with the adviser that provides ongoing services to the registrant:
| | Registrant | Adviser |
| FY 2019 | $25,750 | $0 |
| FY 2018 | $25,000 | $0 |
(h) Not applicable. The auditor performed no services for the registrant’s investment adviser or any entity controlling, controlled by, or under common control with the investment adviser that provides ongoing services to the registrant.
Item 5.Audit Committee of Listed Registrants.
NOT APPLICABLE – applies to listed companies only
Item 6.Schedule ofInvestments.Schedule filed with Item 1.
Item 7. Disclosure of Proxy Voting Policies and Procedures for Closed-End Management Investment Companies.
NOT APPLICABLE – applies to closed-end funds only
Item 8. Portfolio Managers of Closed-End Management Investment Companies.
NOT APPLICABLE – applies to closed-end funds only
Item 9. Purchases of Equity Securities by Closed-End Management Investment Company and Affiliated Purchasers.
NOT APPLICABLE – applies to closed-end funds only
Item 10. Submission of Matters to a Vote of Security Holders.
The guidelines applicable to shareholders desiring to submit recommendations for nominees to the Registrant's board of trustees are contained in the statement of additional information of the Trust with respect to the Fund(s) for which this Form N-CSR is being filed.
Item 11. Controls and Procedures.
(a) Based on their evaluation of the registrant’s disclosure controls and procedures (as defined in Rule 30a-3(c) under the Investment Company Act of 1940, as amended (the “Act”)) as of a date within 90 days of the filing date of this report, the registrant’s principal executive officer and principal financial officer have concluded that such disclosure controls and procedures are reasonably designed and are operating effectively to ensure that material information relating to the registrant is made known to them by others within those entities, particularly during the period in which this report is being prepared, and that the information required in filings on Form N-CSR is recorded, processed, summarized, and reported on a timely basis.
(b) There were no changes in the registrant’s internal control over financial reporting (as defined in Rule 30a-3(d) under the Investment Company Act of 1940) that occurred during the second fiscal quarter of the period covered by this report that have materially affected, or are reasonably likely to materially affect, the registrant’s internal control over financial reporting.
Item 12. Disclosure of Securities Lending Activities for Closed-End Management Investment Companies.
Not applicable.
Item 13. Exhibits.
| (a)(1) | Code is filed herewith. |
| (a)(2) | Certifications by the registrant's principal executive officer and principal financial officer, pursuant to Section 302 of the Sarbanes- Oxley Act of 2002 and required by Rule 30a-2under the Investment Company Act of 1940 are filed herewith. |
| (b) | Certification pursuant to 18 U.S.C. Section 1350, as adopted pursuant to Section 906 of the Sarbanes-Oxley Act of 2002 is filed herewith. |
SIGNATURES
Pursuant to the requirements of the Securities Exchange Act of 1934 and the Investment Company Act of 1940, the registrant has duly caused this report to be signed on its behalf by the undersigned, thereunto duly authorized.
| (Registrant) | Capitol Series Trust | | |
| | | | |
| By (Signature and Title) | /s/ Matthew J. Miller | |
| | | Matthew J. Miller, Chief Executive Officer and President | |
| | | | |
| Date: | 10/29/2019 | | |
| | | | |
| Pursuant to the requirements of the Securities Exchange Act of 1934 and the Investment Company Act of 1940, this report has been signed below by the following persons on behalf of the registrant and in the capacities and on the dates indicated. |
| | | | |
| | | | |
| By (Signature and Title) | /s/ Matthew J. Miller | |
| | | Matthew J. Miller, Chief Executive Officer and President | |
| | | | |
| Date: | 10/29/2019 | | |
| | | | |
| | | | |
| By (Signature and Title) | /s/ Zachary P. Richmond | |
| | | Zachary P. Richmond, Treasurer and Chief Financial Officer | |
| | | | |
| Date | 10/29/2019 | | |