UNITED STATES
SECURITIES AND EXCHANGE COMMISSION
Washington, D.C. 20549
FORM N-CSR
CERTIFIED SHAREHOLDER REPORT OF REGISTERED
MANAGEMENT INVESTMENT COMPANIES
| Investment Company Act file number: 811-22895 |
| Capitol Series Trust |
| (Exact name of registrant as specified in charter) |
Ultimus Asset Services, LLC 225 Pictoria Drive, Suite 450 Cincinnati, OH 45246 |
| (Address of principal executive offices) (Zip code) |
Zachary P. Richmond Ultimus Asset Services, LLC 225 Pictoria Drive, Suite 450 Cincinnati, OH 45246 |
| (Name and address of agent for service) |
| Registrant’s telephone number, including area code: | 513-587-3400 | |
| Date of fiscal year end: | August 31 | |
| | | |
| Date of reporting period: | August 31, 2018 | |
Item 1. Reports to Stockholders.

HEDEKER STRATEGIC APPRECIATION FUND
Institutional Shares – SAFFX
Annual Report
August 31, 2018
Hedeker Wealth LLC
One Overlook Point, Suite 610
Lincolnshire, Illinois 60069
(800) 657-4450
Letter to Shareholders | August 31, 2018 |
A Rolling Loan Gathers No Loss
A Year in Review
For fiscal year 2018, the Hedeker Strategic Appreciation Fund (the “Fund”) was up 5.94%, outperforming the Bloomberg Barclays Intermediate Government/Credit Index benchmark by 6.95%, net of fees1. It was a strong year with the S&P 500® Index up 20% and the Russell 2000® Index up an impressive 25%. The Federal Reserve raised interest rates 3 times, bringing the Fed Funds rate to 2.00-2.25% - while longer dated Treasuries lagged causing the 2yr / 10yr U.S. Treasury yield spread to bear flatten 23 basis points. Bond markets, as benchmarked by the Bloomberg Barclays U.S. Aggregate Bond Index, generated a loss of 1.05%.
We expect that rising interest rates coupled with tight credit spreads will cause headwinds for domestic bond markets. Decreased regulation, lower tax rates, strong balance sheets and measured monetary normalization are tailwinds we believe will support US equity market valuations into 2019. Substantial free cash flow earmarked for buybacks and dividends should add additional support.
Equity
Markets have been placated – June through September 2018, the S&P 500 Index did not see a single day close up or down by more than 1%. We have to look back to 1963 for the only other time in the history of the index this has occurred in a 3rd Quarter. Long periods of low volatility and high absolute return tends to mask risk. We have designed the portfolio to appreciate higher in a risk-on market while providing bond downside protection in a risk-off market. We relentlessly seek investments to improve the asymmetrical return profile of the portfolio. Throughout the year we have increased our equity exposure from 30% to 50% reflecting our positive view, in the short term, of risk-on in the U.S. equity market. However, we are mindful of the distortion of asset prices vs intrinsic value due to unprecedented central bank policies and the late stage investment cycle.
Rolling Loans
As global monetary policy moves back towards equilibrium, excess capital will be withdrawn, resulting in normalizing yields, increasing volatility and adjusting valuations to intrinsic value. This year the high yield debt market has generally produced strong performance, but we are cautious – the difference between the haves and have nots will grow as market participants become more selective in deal terms effectively removing periphery companies access to capital markets. While inflation has been modest, we have seen a pick-up in real yields which correlates strongly with late cycle spread widening and de-risking across asset classes.
We have reduced exposure to credit in our portfolio by decreasing exposure to names with the weakest capital levels and have also selectively increased exposure to names with strong equity upside catalysts.
Conclusion
We continue to find compelling and actionable asymmetrical investment ideas. While muted volatility has persisted for most of the year – several short, violent moves have provided excellent opportunities for our style of active management.
We expect 2019 to provide similar bouts of dislocation and we remain poised to capture fluctuations.
Sincerely,
Michael A. McClain, CFA
Portfolio Manager
| 1 | The Fund’s fiscal year is 9/1/2017 - 8/31/2018. |
1
Investors should carefully consider the investment objectives, risks, and charges and expenses of the fund before investing. The prospectus contains this and other information about the fund, and it should be read carefully before investing. Investors may obtain a copy of the prospectus by calling 800-657-4450.
Investing involves risk, including loss of principal. There is no guarantee that this, or any, investment strategy will be successful. A majority of the Fund’s assets will be invested in convertible securities that have credit ratings that are below investment grade or not rated. These “junk bonds” are considered speculative investments. Fixed income investments are affected by a number of risks, including fluctuation in interest rates, credit risk, and prepayment risk. In general, as prevailing interest rates rise, fixed income securities prices will fall. Some fixed income securities give the issuer the option to call, or redeem, the bonds before their maturity date. If an issuer “calls” its bonds during a time of declining interest rates, the Fund may have to invest the proceeds in an investment offering a lower yield. Convertible securities may be illiquid and difficult to value and may be subject to greater credit risk than other securities. Many of the convertible securities in which the Fund invests will be issued by small or medium sized companies located in foreign and emerging markets. Investments in international markets present special risks including currency fluctuation, the potential for diplomatic and political instability, regulatory and liquidity risks, foreign taxation and differences in auditing and other financial standards. Risks of foreign investing are generally intensified for investments in emerging markets. Small and mid-cap investing involves greater risk no associated with investing in more established companies, such as greater price volatility, business risk, less liquidity and increased competitive threat.
Past performance does not guarantee future performance.
The S&P 500® Index is a market capitalization weighted index that is widely used as a barometer of U.S. stock market performance. The Russell 2000® Index is an index that measures the performance of the 2,000 smallest companies in the Russell 3000® Index. The Bloomberg Barclays U.S. Aggregate Bond Index covers the U.S. investment grade fixed rate bond market (measuring bonds with maturities of at least one year), with index components for government and corporate securities, mortgage pass through securities, and asset-backed securities. You cannot invest directly in an index.
The Hedeker Strategic Appreciation Fund is distributed by Ultimus Fund Distributors, LLC.
2
Investment Results (Unaudited) | |
Average Annual Total Returns(a) as of August 31, 2018
| One Year | Since
Inception
(12/21/2016) | Expense Ratio(c) |
Hedeker Strategic Appreciation Fund | | | |
Institutional Shares | 5.94% | 4.65% | 1.57% |
Bloomberg Barclays Intermediate Government/Credit Index(b) | -1.01% | 1.32% | — |
The performance quoted represents past performance, which does not guarantee future results. The investment return and principal value of an investment will fluctuate so that an investor’s shares, when redeemed, may be worth more or less than their original cost. The returns shown do not reflect deduction of taxes that a shareholder would pay on the Hedeker Strategic Appreciation Fund (the “Fund”) distributions or the redemption of Fund shares. Current performance of the Fund may be lower or higher than the performance quoted. The Fund’s investment objectives, risks, charges and expenses must be considered carefully before investing. Performance data current to the most recent month end may be obtained by calling (800) 657-4450.
| (a) | Return figures reflect any change in price per share and assume the reinvestment of all distributions. |
| (b) | The Bloomberg Barclays Intermediate Government/Credit Index (“Index”) is a broad-based flagship benchmark that measures the non-securitized component of the U.S. Aggregate Index. It includes investment grade, U.S. dollar-denominated, fixed-rate Treasuries, government-related and corporate securities. The returns of the Index do not reflect the deduction of fees and expenses, whereas the Fund returns are shown net of fees. An individual cannot invest directly in an index. |
| (c) | Reflects the expense ratio as disclosed in the Fund’s prospectus dated December 29, 2017. Hedeker Wealth LLC (the “Adviser”), the Fund’s adviser, has contractually agreed, until December 31, 2018, to waive its management fee and/or reimburse expenses so that total annual operating expenses (excluding (i) interest; (ii) taxes; (iii) brokerage fees and commissions; (iv) other extraordinary expenses not incurred in the ordinary course of the Fund’s business; (v) dividend expenses on short sales; and (vi) indirect expenses such as acquired fund fees and expenses) do not exceed 1.75% of the Fund’s average daily net assets. This expense limitation agreement may be terminated by the Board of Trustees at any time. Additional information pertaining to the Fund’s expense ratios as of August 31, 2018, can be found in the financial highlights. The Institutional Shares Expense Ratio does not correlate to the corresponding ratio of expenses to average net assets included in the financial highlights section of the this annual report, which reflect the operating expenses of the Fund and do not include acquired fund fees and expenses (“AFFE”). |
The Fund’s investment objectives, strategies, risks, charges and expenses must be considered carefully before investing. The prospectus contains this and other important information about the Fund and may be obtained by calling (800) 657-4450. Please read it carefully before investing.
The Fund is distributed by Ultimus Fund Distributors, LLC, member FINRA/SIPC.
3
Investment Results (Unaudited) (continued) | |
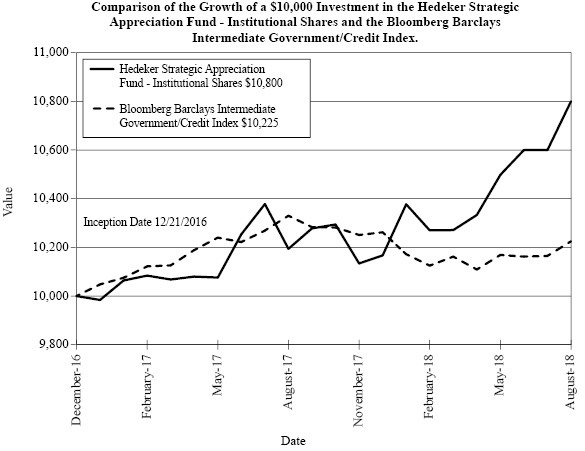
The chart above assumes an initial investment of $10,000 made on December 21, 2016 (commencement of operations) and held through August 31, 2018. THE FUND’S RETURNS REPRESENT PAST PERFORMANCE AND DO NOT GUARANTEE FUTURE RESULTS. The returns shown do not reflect deduction of taxes that a shareholder would pay on the Fund’s distributions or the redemption of the Fund’s shares. Investment returns and principal values will fluctuate so that your shares, when redeemed, may be worth more or less than their original purchase price.
Current performance may be lower or higher than the performance data quoted. For more information on the Fund, and to obtain performance data current to the most recent month-end, or to request a prospectus, please call (800) 657-4450. You should carefully consider the investment objectives, potential risks, management fees, and charges and expenses of the Fund before investing. The Fund’s prospectus contains this and other information about the Fund, and should be read carefully before investing.
The Fund is distributed by Ultimus Fund Distributors, LLC, Member FINRA/SIPC.
4
Portfolio Illustration (Unaudited)
August 31, 2018 |
|
The following chart gives a visual breakdown of the Fund’s holdings as a percentage of net assets.

Availability of Portfolio Schedule (Unaudited)
The Fund files its complete schedule of investments with the Securities and Exchange Commission (“SEC”) for the first and third quarter of each fiscal year on Form N-Q. The Fund’s Forms N-Q will be available at the SEC’s website at www.sec.gov. The Fund’s Forms N-Q may be reviewed and copied at the Public Reference Room in Washington, DC. Information on the operation of the Public Reference Room may be obtained by calling 1-800-SEC-0330.
5
Hedeker Strategic Appreciation Fund
Schedule of Investments
August 31, 2018
| | Principal
Amount | | | Fair
Value | |
CONVERTIBLE BONDS — 81.90% | | | | | | | | |
| | | | | | | | | |
Consumer Discretionary — 3.50% | | | | | | | | |
Booking Holdings, Inc., 0.90%, 9/15/2021 | | $ | 500,000 | | | $ | 583,801 | |
Carriage Services, Inc., 2.75%, 3/15/2021 | | | 300,000 | | | | 339,170 | |
Live Nation Entertainment, Inc., 2.50%, 5/15/2019 | | | 500,000 | | | | 728,192 | |
Vitamin Shoppe, Inc., 2.25%, 12/1/2020 | | | 525,000 | | | | 457,180 | |
| | | | | | | | 2,108,343 | |
Energy — 9.38% | | | | | | | | |
Golar LNG Ltd., 2.75%, 2/15/2022 | | | 1,250,000 | | | | 1,267,148 | |
Green Plains, Inc., 4.13%, 9/1/2022 | | | 1,250,000 | | | | 1,211,590 | |
Hurricane Energy plc, 7.50%, 7/24/2022 | | | 500,000 | | | | 671,000 | |
Oasis Petroleum, Inc., 2.63%, 9/15/2023 | | | 850,000 | | | | 1,119,521 | |
Tesla Energy Operations, Inc., 1.63%, 11/1/2019 | | | 1,000,000 | | | | 915,894 | |
Weatherford International plc, 5.88%, 7/1/2021 | | | 500,000 | | | | 469,240 | |
| | | | | | | | 5,654,393 | |
Financials — 12.51% | | | | | | | | |
AmTrust Financial Services, Inc., 2.75%, 12/15/2044 | | | 2,600,000 | | | | 2,522,779 | |
Encore Capital Group, Inc., 3.00%, 7/1/2020 | | | 1,000,000 | | | | 1,034,193 | |
EZCORP, Inc., 2.13%, 6/15/2019 | | | 500,000 | | | | 500,521 | |
GAIN Capital Holdings, Inc., 4.13%, 12/1/2018 | | | 500,000 | | | | 524,404 | |
GSV Capital Corporation, 5.25%, 9/15/2018 | | | 808,000 | | | | 814,060 | |
Hannon Armstrong Sustainable Infrastructure Capital, Inc., 4.13%, 9/1/2022 | | | 1,000,000 | | | | 975,439 | |
Resource Capital Corporation, 8.00%, 1/15/2020 | | | 375,000 | | | | 394,238 | |
Two Harbors Investment Corporation, 6.25%, 1/15/2022 | | | 750,000 | | | | 778,262 | |
| | | | | | | | 7,543,896 | |
Health Care — 29.26% | | | | | | | | |
Acorda Therapeutics, Inc., 1.75%, 6/15/2021 | | | 640,000 | | | | 625,600 | |
Alder Biopharmaceuticals, Inc., 2.50%, 2/1/2025 | | | 1,000,000 | | | | 1,130,500 | |
Allscripts Healthcare Solutions, Inc., 1.25%, 7/1/2020 | | | 1,000,000 | | | | 1,066,179 | |
AMAG Pharmaceuticals, Inc., 3.25%, 6/1/2022 | | | 900,000 | | | | 1,035,928 | |
ANI Pharmaceuticals, Inc., 3.00%, 12/1/2019 | | | 550,000 | | | | 591,574 | |
BioMarin Pharmaceutical, Inc., 1.50%, 10/15/2020 | | | 300,000 | | | | 366,451 | |
BioMarin Pharmaceutical, Inc., 0.60%, 8/1/2024 | | | 1,000,000 | | | | 1,063,338 | |
Clovis Oncology, Inc., 1.25%, 5/1/2025 | | | 1,000,000 | | | | 851,951 | |
Depomed, Inc., 2.50%, 9/1/2021 | | | 1,000,000 | | | | 815,942 | |
Exact Sciences Corporation, 1.00%, 1/15/2025 | | | 1,000,000 | | | | 1,192,395 | |
Insmed, Inc., 1.75%, 1/15/2025 | | | 1,000,000 | | | | 837,654 | |
Intercept Pharmaceuticals, Inc., 3.25%, 7/1/2023 | | | 1,000,000 | | | | 967,399 | |
Ionis Pharmaceuticals, Inc., 1.00%, 11/15/2021 | | | 500,000 | | | | 506,875 | |
Jazz Investments I Ltd., 1.88%, 8/15/2021 | | | 1,200,000 | | | | 1,290,303 | |
Medicines Company (The), 2.75%, 7/15/2023 | | | 1,050,000 | | | | 1,102,486 | |
Nevro Corporation, 1.75%, 6/1/2021 | | | 1,750,000 | | | | 1,795,121 | |
PDL BioPharma, Inc., 2.75%, 12/1/2021 | | | 500,000 | | | | 472,276 | |
6 | See accompanying notes which are an integral part of these financial statements. | |
Hedeker Strategic Appreciation Fund
Schedule of Investments (continued)
August 31, 2018
| | Principal
Amount | | | Fair
Value | |
CONVERTIBLE BONDS — (continued) | | | | | | | | |
| | | | | | | | | |
Health Care — (continued) | | | | | | | | |
Radius Health, Inc., 3.00%, 9/1/2024 | | $ | 750,000 | | | $ | 605,252 | |
Teligent, Inc., 3.75%, 12/15/2019 | | | 800,000 | | | | 765,785 | |
Theravance Biopharma, Inc., 3.25%, 11/1/2023 | | | 500,000 | | | | 554,812 | |
| | | | | | | | 17,637,821 | |
Industrials — 4.20% | | | | | | | | |
Astaldi SpA, 4.88%, 6/21/2024 | | | 500,000 | | | | 279,755 | |
Dycom Industries, Inc., 0.75%, 9/15/2021 | | | 1,000,000 | | | | 1,110,956 | |
Tutor Perini Corporation, 2.88%, 6/15/2021 | | | 1,100,000 | | | | 1,141,082 | |
| | | | | | | | 2,531,793 | |
Information Technology — 14.73% | | | | | | | | |
Envestnet, Inc., 1.75%, 12/15/2019 | | | 500,000 | | | | 565,049 | |
Harmonic, Inc., 4.00%, 12/1/2020 | | | 750,000 | | | | 875,625 | |
Integrated Device Technology, Inc., 0.88%, 11/15/2022 | | | 1,083,000 | | | | 1,520,542 | |
InterDigital, Inc., 1.50%, 3/1/2020 | | | 1,058,000 | | | | 1,283,711 | |
j2 Global, Inc., 3.25%, 6/15/2029 | | | 850,000 | | | | 1,107,617 | |
Knowles Corporation, 3.25%, 11/1/2021 | | | 900,000 | | | | 1,074,552 | |
Liberty Interactive LLC, 4.00%, 11/15/2029 | | | 1,350,000 | | | | 936,563 | |
NXP Semiconductors NV, 1.00%, 12/1/2019 | | | 500,000 | | | | 540,500 | |
OSI Systems, Inc., 1.25%, 9/1/2022 | | | 1,000,000 | | | | 979,615 | |
| | | | | | | | 8,883,774 | |
Materials — 0.84% | | | | | | | | |
Cemex SAB de CV, 3.72%, 3/15/2020 | | | 500,000 | | | | 507,934 | |
| | | | | | | | | |
Real Estate — 5.88% | | | | | | | | |
Colony NorthStar, Inc., 5.00%, 4/15/2023 | | | 1,000,000 | | | | 946,300 | |
Helical Bar Jersey Ltd., 4.00%, 6/17/2019 | | | 400,000 | | | | 526,049 | |
IH Merger Sub LLC, 3.50%, 1/15/2022 | | | 973,000 | | | | 1,092,390 | |
Redfin Corporation, 1.75%, 7/15/2023 | | | 1,000,000 | | | | 928,766 | |
Spirit Realty Capital, Inc., 2.88%, 5/15/2019 | | | 50,000 | | | | 49,950 | |
| | | | | | | | 3,543,455 | |
Utilities — 1.70% | | | | | | | | |
Just Energy Group, Inc., 6.50%, 7/29/2019 | | | 800,000 | | | | 778,000 | |
Pattern Energy Group, Inc., 4.00%, 7/15/2020 | | | 250,000 | | | | 249,250 | |
| | | | | | | | 1,027,250 | |
Total Convertible Bonds (Cost $47,804,047) | | | | | | | 49,438,659 | |
| | See accompanying notes which are an integral part of these financial statements. | 7 |
Hedeker Strategic Appreciation Fund
Schedule of Investments (continued)
August 31, 2018
| | Shares | | | Fair
Value | |
COMMON STOCKS — 0.00% | | | | |
| | | | | | | | | |
Financials — 0.00% | | | | | | | | |
KeyCorp | | | — | (a) | | $ | 2 | |
Total Common Stocks (Cost $2) | | | | | | | 2 | |
| | | | | | | | | |
CONVERTIBLE PREFERRED NOTES — 1.20% | | | | |
| | | | | | | | | |
Financials — 1.20% | | | | | | | | |
Great Ajax Corporation, 7.25%, 4/30/2024 | | | 28,196 | | | | 721,967 | |
Total Convertible Preferred Notes (Cost $721,478) | | | | | | | 721,967 | |
| | | | | | | | | |
CONVERTIBLE PREFERRED STOCKS — 7.05% | | | | |
| | | | | | | | | |
Energy — 0.46% | | | | | | | | |
Chesapeake Energy Corporation, 4.50% | | | 5,000 | | | | 277,550 | |
| | | | | | | | | |
Financials — 4.53% | | | | | | | | |
Capitala Finance Corporation, 5.75% | | | 33,203 | | | | 826,755 | |
NY Community Cap Trust V, 6.00% | | | 23,000 | | | | 1,148,390 | |
Sutherland Asset Management Corporation, 7.00% | | | 28,537 | | | | 747,669 | |
| | | | | | | | 2,722,814 | |
Real Estate — 2.06% | | | | | | | | |
Welltower, Inc., Series I, 6.50% | | | 20,000 | | | | 1,244,600 | |
Total Convertible Preferred Stocks (Cost $4,113,323) | | | | | | | 4,244,964 | |
| | | | | | | | | |
PREFERRED STOCKS — 1.76% | | | | |
| | | | | | | | | |
Real Estate — 1.76% | | | | | | | | |
RLJ Lodging Trust, Series A, 7.80% | | | 40,000 | | | | 1,064,000 | |
Total Preferred Stocks (Cost $1,032,216) | | | | | | | 1,064,000 | |
| | | | | | | | | |
EXCHANGE-TRADED FUNDS - 1.26% | | | | |
| | | | | | | | | |
SPDR S&P Oil & Gas Exploration & Production ETF | | | 18,000 | | | | 762,120 | |
Total Exchange-Traded Funds (Cost $773,026) | | | | | | | 762,120 | |
8 | See accompanying notes which are an integral part of these financial statements. | |
Hedeker Strategic Appreciation Fund
Schedule of Investments (continued)
August 31, 2018
| | Shares | | | Fair
Value | |
MONEY MARKET FUNDS - 6.27% | | | | | | | | |
Fidelity Investments Money Market Government Portfolio, Institutional Class, 1.86%(b) | | | 3,783,250 | | | $ | 3,783,250 | |
Total Money Market Funds (Cost $3,783,250) | | | | | | | 3,783,250 | |
| | | | | | | | | |
Total Investments — 99.54% (Cost $58,227,342) | | | | | | | 60,014,962 | |
| | | | | | | | | |
Other Assets in Excess of Liabilities — 0.46% | | | | | | | 279,497 | |
| | | | | | | | | |
NET ASSETS — 100.00% | | | | | | $ | 60,294,459 | |
| (a) | Shares held are less than 0.5. |
| (b) | Rate disclosed is the seven day effective yield as of August 31, 2018. |
ETF - Exchange-Traded Fund
SPDR - Standard & Poor’s Depositary Receipt
The sectors shown on the schedule of investments are based on the Global Industry Classification Standard, or GICS® (“GICS”). The GICS was developed by and/or is the exclusive property of MSCI, Inc. and Standard & Poor’s Financial Services LLC (“S&P”). GICS is a service mark of MSCI, Inc. and S&P and has been licensed for use by Ultimus Fund Solutions, LLC.
| | See accompanying notes which are an integral part of these financial statements. | 9 |
Hedeker Strategic Appreciation Fund
Statement of Assets and Liabilities
August 31, 2018
Assets |
Investments in securities at fair value (cost $58,227,342) | | $ | 60,014,962 | |
Dividends and interest receivable | | | 362,521 | |
Prepaid expenses | | | 3,072 | |
Total Assets | | | 60,380,555 | |
Liabilities |
Payable to Adviser | | | 50,630 | |
Payable to Administrator | | | 9,255 | |
Payable to auditors | | | 20,500 | |
Other accrued expenses | | | 5,711 | |
Total Liabilities | | | 86,096 | |
Net Assets | | $ | 60,294,459 | |
Net Assets consist of: | | | | |
Paid-in capital | | $ | 58,438,152 | |
Accumulated net investment income | | | 143,662 | |
Accumulated net realized loss from investments | | | (74,935 | ) |
Net unrealized appreciation on investments | | | 1,787,580 | |
Net Assets | | $ | 60,294,459 | |
Shares outstanding (unlimited number of shares authorized, no par value) | | | 2,321,542 | |
Net asset value, offering and redemption price per share | | $ | 25.97 | |
10 | See accompanying notes which are an integral part of these financial statements. | |
Hedeker Strategic Appreciation Fund
Statement of Operations
For the Year Ended August 31, 2018
Investment Income | | | | |
Dividend income | | $ | 328,849 | |
Interest income (net of foreign taxes withheld of $7,996) | | | 1,320,807 | |
Total investment income | | | 1,649,656 | |
Expenses | | | | |
Investment Adviser | | | 551,841 | |
Administration | | | 55,013 | |
Fund accounting | | | 33,902 | |
Audit and tax preparation | | | 30,850 | |
Legal | | | 30,411 | |
Pricing | | | 14,653 | |
Trustee | | | 12,057 | |
Transfer agent | | | 12,000 | |
Report printing | | | 10,456 | |
Offering | | | 7,233 | |
Custodian | | | 6,834 | |
Compliance services | | | 5,823 | |
Registration | | | 4,610 | |
Miscellaneous | | | 17,304 | |
Net operating expenses | | | 792,987 | |
Net investment income | | | 856,669 | |
Net Realized and Change in Unrealized Gain (Loss) on Investments |
Net realized gain on investment securities transactions | | | 344,880 | |
Net realized loss on foreign currency translations | | | (9,931 | ) |
Net change in unrealized appreciation of investment securities and foreign currency translations | | | 2,105,177 | |
Net realized and change in unrealized gain on investments | | | 2,440,126 | |
Net increase in net assets resulting from operations | | $ | 3,296,795 | |
| | See accompanying notes which are an integral part of these financial statements. | 11 |
Hedeker Strategic Appreciation Fund
Statements of Changes in Net Assets
| | | For the
Year Ended
August 31, 2018 | | | For the
Period Ended
August 31, 2017(a) | |
Increase (Decrease) in Net Assets due to: | | | | | | | | |
Operations | | | | | | | | |
Net investment income | | $ | 856,669 | | | $ | 144,861 | |
Net realized gain on investment securities transactions and foreign currency translations | | | 334,949 | | | | 803,809 | |
Net change in unrealized appreciation (depreciation) of investment securities and foreign currency translations | | | 2,105,177 | | | | (317,597 | ) |
Net increase in net assets resulting from operations | | | 3,296,795 | | | | 631,073 | |
Distributions From: | | | | | | | | |
Net investment income | | | (1,407,245 | ) | | | (28,007 | ) |
Net realized gains | | | (636,309 | ) | | | — | |
Total Distributions | | | (2,043,554 | ) | | | (28,007 | ) |
Capital Transactions - Institutional Shares | | | | | | | | |
Proceeds from shares sold | | | 9,668,950 | | | | 53,634,047 | |
Reinvestment of distributions | | | 2,043,554 | | | | 28,007 | |
Amount paid for shares redeemed | | | (3,291,991 | ) | | | (3,644,415 | ) |
Net increase in net assets resulting from capital transactions | | | 8,420,513 | | | | 50,017,639 | |
Total Increase in Net Assets | | | 9,673,754 | | | | 50,620,705 | |
Net Assets | | | | | | | | |
Beginning of period | | | 50,620,705 | | | | — | |
End of period | | $ | 60,294,459 | | | $ | 50,620,705 | |
Accumulated net investment income | | $ | 143,662 | | | $ | 122,392 | |
Share Transactions - Institutional Shares | | | | | | | | |
Shares sold | | | 381,318 | | | | 2,130,213 | |
Shares issued in reinvestment of distributions | | | 82,089 | | | | 1,093 | |
Shares redeemed | | | (129,091 | ) | | | (144,080 | ) |
Net increase in shares | | | 334,316 | | | | 1,987,226 | |
| (a) | For the period December 21, 2016 (commencement of operations) to August 31, 2017. |
12 | See accompanying notes which are an integral part of these financial statements. | |
Hedeker Strategic Appreciation Fund - Institutional Shares Financial Highlights Selected data for a share outstanding throughout each period. |
| | | For the
Year Ended
August 31, 2018 | | | For the
Period Ended
August 31, 2017(a) | |
Net asset value, at beginning of period | | $ | 25.47 | | | $ | 25.00 | |
| | | | | | | | | |
Income from investment operations: | | | | | | | | |
Net investment income | | | 0.41 | | | | 0.07 | |
Net realized and unrealized gain on investments | | | 1.06 | | | | 0.41 | |
Total from investment operations | | | 1.47 | | | | 0.48 | |
| | | | | | | | | |
Distributions from: | | | | | | | | |
Net investment income | | | (0.66 | ) | | | (0.01 | ) |
Net realized gains | | | (0.31 | ) | | | — | |
Total from distributions | | | (0.97 | ) | | | (0.01 | ) |
| | | | | | | | | |
Net asset value, at end of period | | $ | 25.97 | | | $ | 25.47 | |
| | | | | | | | | |
Total Return (b) | | | 5.94 | % | | | 1.94 | %(c) |
| | | | | | | | | |
Ratios/Supplemental Data: | | | | | | | | |
Net assets at end of period (thousands) | | $ | 60,294 | | | $ | 50,621 | |
Ratio of expenses to average net assets | | | 1.44 | % | | | 1.56 | %(d) |
Ratio of net investment income to average net assets | | | 1.55 | % | | | 0.49 | %(d) |
Portfolio turnover | | | 163 | % | | | 113 | %(c) |
| | | | | | | | | |
| (a) | For the period December 21, 2016 (commencement of operations) through August 31, 2017. |
| (b) | Total return in the above table represents the rate that the investor would have earned or lost on an investment in the Fund, assuming reinvestment of distributions. |
| | See accompanying notes which are an integral part of these financial statements. | 13 |
Hedeker Strategic Appreciation Fund
Notes to the Financial Statements
August 31, 2018
NOTE 1. ORGANIZATION
The Hedeker Strategic Appreciation Fund (the “Fund”) was organized as a non-diversified series of Capitol Series Trust (the “Trust”) on December 15, 2016. The Trust is an open-end investment company established under the laws of Ohio by an Agreement and Declaration of Trust dated September 18, 2013 (the “Trust Agreement”). The Trust Agreement permits the Board of Trustees of the Trust (the “Board”) to issue an unlimited number of shares of beneficial interest of separate series without par value. The Fund is one of a series of funds currently authorized by the Board. The Fund’s investment adviser is Hedeker Wealth LLC (the “Adviser”). The investment objective of the Fund is to seek superior risk-adjusted returns over a market cycle.
The Fund currently offers one class of shares, Institutional Shares. The Fund commenced operations on December 21, 2016. Each share represents an equal proportionate interest in the assets and liabilities belonging to the Fund and is entitled to such dividends and distributions out of income belonging to the Fund as are declared by the Board.
NOTE 2. SIGNIFICANT ACCOUNTING POLICIES
The Fund is an investment company and follows accounting and reporting guidance under Financial Accounting Standards Board Accounting Standards Codification (“ASC”) Topic 946, “Financial Services-Investments Companies”. The following is a summary of significant accounting policies followed by the Fund in the preparation of its financial statements. These policies are in conformity with generally accepted accounting principles in the United States of America (“GAAP”).
Estimates – The preparation of financial statements in conformity with GAAP requires management to make estimates and assumptions that affect the reported amounts of assets and liabilities and disclosure of contingent assets and liabilities at the date of the financial statements and the reported amounts of increases and decreases in net assets from operations during the reporting period. Actual results could differ from those estimates.
Securities Valuation – All investments in securities are recorded at their estimated fair value as described in Note 3.
Foreign Currency Translation – The accounting records of the Fund are maintained in U.S. dollars. Foreign currency amounts are translated into U.S. dollars at the current rate of exchange each business day to determine the value of investments, and other assets and liabilities. Purchases and sales of foreign securities, and income and expenses, are translated at the prevailing rate of exchange on the respective date of these transactions. The Fund does not isolate that portion of the results of operations resulting from changes in foreign exchange rates on investments from fluctuation arising from changes in market prices of securities held. These fluctuations are included with the net realized and unrealized gain or loss from investments.
Federal Income Taxes – The Fund makes no provision for federal income tax or excise tax. The Fund intends to qualify each year as a regulated investment company (“RIC”) under subchapter M of the Internal Revenue Code of 1986, as amended, by complying with the requirements applicable to RICs and by distributing substantially all of its taxable income. The Fund also intends to distribute
14
Hedeker Strategic Appreciation Fund
Notes to the Financial Statements (continued)
August 31, 2018
sufficient net investment income and net capital gains, if any, so that it will not be subject to excise tax on undistributed income and gains. If the required amount of net investment income or gains is not distributed, the Fund could incur a tax expense.
The Fund may be subject to taxes imposed by countries in which it invests. Such taxes are generally based on income and/or capital gains earned or repatriated. Taxes are accrued and applied to net investment income, net realized gains and unrealized appreciation as such income and/or gains are earned.
The Fund recognizes tax benefits or expenses of uncertain tax positions only when the position is “more likely than not” to be sustained assuming examination by tax authorities. Management of the Fund has reviewed tax positions taken in tax years that remain subject to examination by all major tax jurisdictions, including federal (i.e., the 2016 tax year end and the interim tax period since then, as applicable) and has concluded that no provision for unrecognized tax benefits or expenses is required in these financial statements and does not expect this to change over the next twelve months. The Fund recognizes interest and penalties, if any, related to unrecognized tax benefits as income tax expense in the Statement of Operations. During the fiscal year ended August 31, 2018, the Fund did not incur any interest or penalties.
Expenses – Expenses incurred by the Trust that do not relate to a specific fund of the Trust are allocated to the individual funds based on each fund’s relative net assets or another appropriate basis (as determined by the Board).
Security Transactions and Related Income – Throughout the reporting period, security transactions are accounted for no later than one business day following the trade date. For financial reporting purposes, security transactions are accounted for on trade date on the last business day of the reporting period. The specific identification method is used for determining gains or losses for financial statements and income tax purposes. Dividend income is recorded on the ex-dividend date. Interest income is recorded on an accrual basis and includes, where applicable, the amortization of premium or accretion of discount. Discounts and premiums on fixed income securities are accreted or amortized over the life of the respective securities using the effective interest method.
Dividends and Distributions – The Fund intends to distribute substantially all of its net investment income, if any, as dividends to its shareholders on a quarterly basis. The Fund intends to distribute its net realized long-term capital gains and its net realized short-term capital gains, if any, to its shareholders at least once a year. Distributions to shareholders are recorded on the ex-dividend date. The amounts of dividends from net investment income and distributions from net realized gains are determined in accordance with federal income tax regulations, which may differ from GAAP. These differences are caused primarily by differences in the timing of the recognition of certain components of income, expense or realized capital gains for federal income tax purposes. Where such differences are permanent in nature, they are reclassified in the components of net assets based on their ultimate characterization for federal income tax purposes. Any such reclassifications will have no effect on
15
Hedeker Strategic Appreciation Fund
Notes to the Financial Statements (continued)
August 31, 2018
net assets, results of operations or net asset values per share of the Fund. For the fiscal year ended August 31, 2018, the Fund made the following reclassifications of net assets, which was due to foreign currency reclassifications, deemed taxable dividends, and interest adjustments on complex securities:
Paid-in Capital | Accumulated Undistributed
Net Investment Income/(Loss) | Accumulated Net Realized
Gain/(Loss) on Investments |
$— | $571,846 | $(571,846) |
NOTE 3. SECURITIES VALUATION AND FAIR VALUE MEASUREMENTS
Fair value is defined as the price that the Fund would receive upon selling an investment in an orderly transaction to an independent buyer in the principal or most advantageous market of the investment. GAAP establishes a three-tier hierarchy to maximize the use of observable market data and minimize the use of unobservable inputs and to establish classification of fair value measurements for disclosure purposes.
Inputs refer broadly to the assumptions that market participants would use in pricing the asset or liability. Inputs may be observable or unobservable. Observable inputs are inputs that reflect the assumptions market participants would use in pricing the asset or liability developed based on market data obtained from sources independent of the reporting entity. Unobservable inputs are inputs that reflect the reporting entity’s own assumptions about the assumptions market participants would use in pricing the asset or liability developed based on the best information available in the circumstances.
Various inputs are used in determining the value of the Fund’s investments. These inputs are summarized in the three broad levels listed below.
| | ● | Level 1 – unadjusted quoted prices in active markets for identical investments and/or registered investment companies where the value per share is determined and published and is the basis for current transactions for identical assets or liabilities at the valuation date |
| | ● | Level 2 – other significant observable inputs (including, but not limited to, quoted prices for an identical security in an inactive market, quoted prices for similar securities, interest rates, prepayment speeds, credit risk, etc.) |
| | ● | Level 3 – significant unobservable inputs (including the Fund’s own assumptions in determining fair value of investments based on the best information available) |
The inputs used to measure fair value may fall into different levels of the fair value hierarchy. In such cases, for disclosure purposes, the level in the fair value hierarchy within which the fair value measurement falls in its entirety is determined based on the lowest level input that is significant to the fair value measurement in its entirety.
In computing the net asset value (“NAV”) of the Fund, fair value is based on market valuations with respect to portfolio securities for which market quotations are readily available. Pursuant to Board approved policies, the Fund relies on independent third-party pricing services to provide the current market value of securities. Those pricing services value equity securities, including exchange-traded funds and exchange-traded notes, traded on a securities exchange at the last reported sales price on
16
Hedeker Strategic Appreciation Fund
Notes to the Financial Statements (continued)
August 31, 2018
the principal exchange. Equity securities quoted by NASDAQ are valued at the NASDAQ Official Closing Price. If there is no reported sale on the principal exchange, equity securities are valued at the mean between the most recent quoted bid and asked price. When using the market quotations or close prices provided by the pricing service and when the market is considered active, the security will be classified as a Level 1 security. Investments in open-end mutual funds, including money market mutual funds, are generally priced at the ending NAV provided by the pricing service of the funds and are generally categorized as Level 1 securities. Debt securities are valued using evaluated prices furnished by a pricing vendor selected by the Board and are generally classified as Level 2 securities.
In the event that market quotations are not readily available, the Adviser determines that the market quotation or the price provided by the pricing service does not accurately reflect the current fair value, or certain restricted or illiquid securities are being valued, such securities are valued as determined in good faith by the Trust’s Valuation Committee, based on recommendations from a pricing committee comprised of various officers of the Trust, various employees of the Fund’s administrator, and representatives of the Adviser (together the “Pricing Review Committee”). These securities will be classified as Level 2 or 3 within the fair value hierarchy, depending on the inputs used.
In accordance with the Trust’s Valuation Procedures, the Pricing Review Committee in making its recommendations are required to consider all appropriate factors relevant to the value of securities for which it has determined other pricing sources are not available or reliable as described above. No single standard exists for determining fair value, because fair value depends upon the circumstances of each individual case. As a general principle, the current fair value of an issue of securities being valued pursuant to the Trust’s Fair Valuation Procedures would be the amount which the Fund might reasonably expect to receive for them upon their current sale. Methods which are in accordance with this principle may, for example, be based on (i) a multiple of earnings;(ii) a discount from market prices of a similar freely traded security (including a derivative security or a basket of securities traded on other markets, exchanges or among dealers); or (iii) yield to maturity with respect to debt issues, or a combination of these and other methods. Fair value pricing is permitted if, in accordance with the Trust’s Valuation Procedures, the validity of market quotations appears to be questionable based on factors such as evidence of a thin market in the security based on a small number of quotations, a significant event occurs after the close of a market but before the Fund’s NAV calculation that may affect a security’s value, or other data calls into question the reliability of market quotations.
The following is a summary of the inputs used to value the Fund’s investments as of August 31, 2018:
| | | Valuation Inputs | | | | | |
Assets | | Level 1 | | | Level 2 | | | Level 3 | | | Total | |
Convertible Bonds | | $ | — | | | $ | 49,438,659 | | | $ | — | | | $ | 49,438,659 | |
Common Stocks | | | 2 | | | | — | | | | — | | | | 2 | |
Convertible Preferred Notes | | | — | | | | 721,967 | | | | — | | | | 721,967 | |
Convertible Preferred Stocks | | | 4,244,964 | | | | — | | | | — | | | | 4,244,964 | |
Preferred Stocks | | | 1,064,000 | | | | — | | | | — | | | | 1,064,000 | |
Exchange-Traded Funds | | | 762,120 | | | | — | | | | — | | | | 762,120 | |
Money Market Funds | | | 3,783,250 | | | | — | | | | — | | | | 3,783,250 | |
Total | | $ | 9,854,336 | | | $ | 50,160,626 | | | $ | — | | | $ | 60,014,962 | |
17
Hedeker Strategic Appreciation Fund
Notes to the Financial Statements (continued)
August 31, 2018
The Fund did not hold any investments at the end of the reporting period in which significant unobservable inputs (Level 3) were used in determining fair value; therefore, no reconciliation of Level 3 securities is included for this reporting period. The Fund did not hold any derivative instruments during the reporting period.
The Trust recognizes transfers between fair value hierarchy levels at the end of the reporting period. Transfers from Level 1 to Level 2 represent securities which were valued using close prices at the beginning of the period but did not have close prices available at August 31, 2018 due to lack of trading activity. The following is a summary of the transfer between Level 1 and Level 2 of the fair value hierarchy as of August 31, 2018 based on input levels assigned at August 31, 2017:
| | Transfers from
Level 1 to
Level 2 | | | Transfers from
Level 2 to
Level 1 | |
Convertible Preferred Notes | | $ | 721,967 | | | $ | — | |
NOTE 4. FEES AND OTHER TRANSACTIONS WITH AFFILIATES AND OTHER SERVICE PROVIDERS
Under the terms of the investment advisory agreement (the “Agreement”), the Adviser manages the Fund’s investments subject to approval of the Board. As compensation for its management services, the Fund is obligated to pay the Adviser a fee computed and accrued daily and paid monthly at an annual rate of 1.00% of the Fund’s average daily net assets. For the fiscal year ended August 31, 2018, the Adviser earned fees of $551,841 from the Fund. At August 31, 2018, the Fund owed the Adviser $50,630.
The Adviser has contractually agreed to waive its management fee and/or reimburse expenses so that total annual operating expenses (excluding (i) interest; (ii) taxes; (iii) brokerage fees and commissions; (iv) other extraordinary expenses not incurred in the ordinary course of the Fund’s business; (v) dividend expenses on short sales; and (vi) indirect expenses such as acquired fund fees and expenses) and expenses) do not exceed 1.75% of the Fund’s Institutional Shares average daily net assets through December 31, 2018 (“Expense Limitation”). During any fiscal year that the Agreement between the Adviser and the Trust is in effect, the Adviser may recoup the sum of all fees previously waived or expenses reimbursed, less any reimbursement previously paid, provided that the Adviser is only permitted to recoup fees or expenses within 36 months from the date the fee waiver or expense reimbursement took effect and provided further that such recoupment can be achieved within the Expense Limitation currently in effect and the Expense Limitation in place when the waiver/reimbursement occurred. This expense cap agreement may be terminated by the Board at any time.
The Trust retains Ultimus Fund Solutions, LLC (the “Administrator”) to provide the Fund with administration, compliance, fund accounting and transfer agent services, including all regulatory reporting. For the fiscal year ended August 31, 2018, the Administrator earned fees of $55,013 for administration services, $5,823 for compliance services, $33,902 for fund accounting services, and $12,000 for transfer agent services. At August 31, 2018, the Fund owed the Administrator $9,255 for such services.
18
Hedeker Strategic Appreciation Fund
Notes to the Financial Statements (continued)
August 31, 2018
The Board supervises the business activities of the Trust. Each Trustee serves as a Trustee for the lifetime of the Trust or until the earlier of his or her retirement as a Trustee at age 78 (which may be extended for up to two years in an emeritus non-voting capacity at the pleasure and request of the Board), or until he/she dies, resigns, or is removed, whichever is sooner. “Independent Trustees,” meaning those Trustees who are not “interested persons” as defined in the Investment Company Act of 1940 (“1940 Act”) of the Trust, each receives an annual retainer of $500 per Fund and $500 per Fund for each quarterly in-person Board meeting. In addition, the Trust reimburses Trustees for out-of-pocket expense incurred in conjunction with attendance at Board meetings. Prior to July 1, 2018, each Trustee received $20,000 annual compensation from the Trust. Prior to January 1, 2018, each Trustee received $15,000 annual compensation from the Trust, each Committee Chairperson received an additional annual compensation of $1,000 from the Trust, and Independent Trustees also received $1,000 for attending each special in-person meeting and up to $1,000 for attending special telephonic meetings, depending on the length of the telephonic meeting.
The officers and one Trustee of the Trust are employees of the Administrator. Ultimus Fund Distributors, LLC (the Distributor”) acts as the principal distributor of the Fund’s shares. The Distributor operates as a wholly-owned subsidiary of Ultimus Fund Solutions, LLC.
NOTE 5. PURCHASES AND SALES OF SECURITIES
For the fiscal year ended August 31, 2018, purchases and sales of investment securities, other than short-term investments were as follows:
Purchases | | $ | 90,462,072 | |
Sales | | $ | 86,163,388 | |
There were no purchases or sales of long-term U.S. government obligations during the fiscal year ended August 31, 2018.
NOTE 6. FEDERAL TAX INFORMATION
As of August 31, 2018, the net unrealized appreciation (depreciation) of investments for tax purposes was as follows:
Gross Unrealized Appreciation | | $ | 2,586,348 | |
Gross Unrealized (Depreciation) | | | (1,173,389 | ) |
Net Unrealized Appreciation on Investments | | $ | 1,412,959 | |
At August 31, 2018, the aggregate cost of securities for federal income tax purposes was $58,602,003 for the Fund.
19
Hedeker Strategic Appreciation Fund
Notes to the Financial Statements (continued)
August 31, 2018
The tax characterization of distributions for the fiscal years ended August 31, 2018 and 2017, were as follows:
| | 2018 | | | 2017 | |
Distributions paid from: | | | | | | | | |
Ordinary income | | $ | 2,043,554 | | | $ | 28,007 | |
At August 31, 2018, the components of distributable earnings (accumulated losses) on a tax basis was as follows:
Undistributed Ordinary Income | | $ | 448,727 | |
Accumulated Capital and Other Losses | | | (5,339 | ) |
Unrealized Appreciation (Depreciation) on investments (a) | | | 1,412,959 | |
Unrealized Appreciation (Depreciation) on foreign currency translations | | | (40 | ) |
Total Accumulated Earnings (Deficit) | | $ | 1,856,307 | |
| (a) | The difference between book basis and tax basis unrealized appreciation (depreciation) is primarily attributable to the tax deferral of wash sales, interest accruals on complex securities and deemed dividends from convertible bonds. |
Certain capital losses incurred after October 31, and within the current taxable year, are deemed to arise on the first business day of the Fund’s following taxable year. For the tax year ended August 31, 2018, the Fund deferred post October capital losses in the amount of $5,339.
NOTE 7. COMMITMENTS AND CONTINGENCIES
The Fund indemnifies its officers and trustees for certain liabilities that may arise from the performance of their duties to the Fund. Additionally, in the normal course of business, the Fund enters into contracts that contain a variety of representations and warranties which provide general indemnifications. The Fund’s maximum exposure under these arrangements is unknown, as this would involve future claims that may be made against the Fund that have not yet occurred.
NOTE 8. SUBSEQUENT EVENTS
Management has evaluated events or transactions from August 31, 2018 through the date these financial statements were issued that would merit recognition or disclosure in the financial statements. There were no subsequent events to report that would have a material impact in the Funds’ financial statements.
20
Hedeker Strategic Appreciation Fund
Notes to the Financial Statements (continued)
August 31, 2018
NOTE 9. Shareholder Meeting Results (Unaudited)
On June 19, 2018, a special meeting of shareholders of the Trust was held for the purpose of voting on the election of four Trustees to serve on the Board of Trustees. Below are the voting results from the special meeting.
| For | Withhold | % of Total
Voted in Favor |
John C. Davis | 35,759,555 | 385,270 | 98.93% |
Janet S. Meeks | 35,772,739 | 372,086 | 98.97% |
Lori A. Kaiser | 35,775,501 | 369,324 | 98.98% |
Robert G. Dorsey | 35,597,330 | 547,495 | 98.49% |
The shareholders voted in favor of the proposal to approve four Trustees to serve on the Board of Trustees. Mr. Davis, Ms. Meeks and Ms. Kaiser were each elected as Independent Trustees and began their service to the Trust effective July 1, 2018. Mr. Dorsey was elected as Interested Trustee at the meeting.
21
Report of Independent Registered Public Accounting Firm
To the Shareholders and the Board of Trustees of Hedeker Strategic Appreciation Fund
Opinion on the Financial Statements
We have audited the accompanying statement of assets and liabilities of Hedeker Strategic Appreciation Fund (the “Fund”) (one of the funds constituting Capitol Series Trust (the “Trust”)), including the schedule of investments, as of August 31, 2018, and the related statement of operations for the year then ended, the statements of changes in net assets and the financial highlights for the year ended August 31, 2018 and the period December 21, 2016 (commencement of operations) through August 31, 2017 and the related notes (collectively referred to as the “financial statements”). In our opinion, the financial statements present fairly, in all material respects, the financial position of the Fund (one of the funds constituting Capitol Series Trust) at August 31, 2018, the results of its operations for the year then ended, the changes in its net assets and the financial highlights for the year ended August 31, 2018 and the period December 21, 2016 (commencement of operations) through August 31, 2017, in conformity with U.S. generally accepted accounting principles.
Basis for Opinion
These financial statements are the responsibility of the Trust’s management. Our responsibility is to express an opinion on the Fund’s financial statements based on our audits. We are a public accounting firm registered with the Public Company Accounting Oversight Board (United States) (PCAOB) and are required to be independent with respect to the Trust in accordance with the U.S. federal securities laws and the applicable rules and regulations of the Securities and Exchange Commission and the PCAOB.
We conducted our audits in accordance with the standards of the PCAOB. Those standards require that we plan and perform the audit to obtain reasonable assurance about whether the financial statements are free of material misstatement, whether due to error or fraud. The Trust is not required to have, nor were we engaged to perform, an audit of Trust’s internal control over financial reporting. As part of our audits we are required to obtain an understanding of internal control over financial reporting but not for the purpose of expressing an opinion on the effectiveness of the Trust’s internal control over financial reporting. Accordingly, we express no such opinion.
Our audits included performing procedures to assess the risks of material misstatement of the financial statements, whether due to error or fraud, and performing procedures that respond to those risks. Such procedures included examining, on a test basis, evidence regarding the amounts and disclosures in the financial statements. Our procedures included confirmation of securities owned as of August 31, 2018, by correspondence with the custodian and brokers. Our audits also included evaluating the accounting principles used and significant estimates made by management, as well as evaluating the overall presentation of the financial statements. We believe that our audits provide a reasonable basis for our opinion.

We have served as the auditor of one or more Capitol Series Trust investment companies since 2017.
Grandview Heights, Ohio
October 25, 2018
22
Summary of Fund Expenses (Unaudited)
As a shareholder of the Fund, you incur two types of costs: (1) transaction costs and (2) ongoing costs, including management fees, and other Fund expenses. These examples are intended to help you understand your ongoing costs (in dollars) of investing in the Fund and to compare these costs with the ongoing costs of investing in other mutual funds.
The Example is based on an investment of $1,000 invested at the beginning of the period and held for the entire period from March 1, 2018 through August 31, 2018.
Actual Expenses
The first line of the table provides information about actual account values and actual expenses. You may use the information in this line, together with the amount you invested, to estimate the expenses that you paid over the period. Simply divide your account value by $1,000 (for example, an $8,600 account value divided by $1,000 = 8.60), then multiply the result by the number in the first line under the heading “Expenses Paid During Period” to estimate the expenses you paid on your account during this period.
Hypothetical Example for Comparison Purposes
The second line of the table provides information about hypothetical account values and hypothetical expenses based on the Fund’s actual expense ratios and an assumed rate of return of 5% per year before expenses, which is not the Fund’s actual return. The hypothetical account values and expenses may not be used to estimate the actual ending account balances or expenses you paid for the period. You may use this information to compare the ongoing costs of investing in the Fund and other funds. To do so, compare this 5% hypothetical example with the 5% hypothetical examples that appear in the shareholder reports of the other funds.
Expenses shown in the table are meant to highlight your ongoing costs only and do not reflect any transactional costs such as the fee imposed on sales charges. Therefore, the second line of the table is useful in comparing ongoing costs only and will not help you determine the relative total costs of owning different funds. In addition, if transaction costs were included, your costs would have been higher.
| | Beginning
Account
Value
March 1,
2018 | Ending
Account
Value
August 31,
2018 | Expenses
Paid
During
Period(a) | Annualized
Expense
Ratio |
Hedeker Strategic Appreciation Fund |
Institutional Shares | Actual | $ 1,000.00 | $ 1,051.60 | $ 7.48 | 1.45% |
| | | | | | |
| | Hypothetical(b) | $ 1,000.00 | $ 1,017.91 | $ 7.36 | 1.45% |
| (a) | Expenses are equal to the Fund’s annualized expense ratios, multiplied by the average account value over the period, multiplied by 184/365 (to reflect the one-half year period). |
| (b) | Hypothetical Assumes a 5% return before expenses. |
23
Additional Federal Income Tax Information (Unaudited)
The Form 1099-DIV you receive in January 2019 will show the tax status of all distributions paid to your account in calendar year 2018. Shareholders are advised to consult their own tax adviser with respect to the tax consequences of their investment in the Fund. As required by the Internal Revenue Code and/or regulations, shareholders must be notified regarding the status of qualified dividend income for individuals and the dividends received deduction for corporations.
Qualified Dividend Income. The Fund designates approximately 12% or up to the maximum amount of such dividends allowable pursuant to the Internal Revenue Code, as qualified dividend income eligible for the reduced tax rate of 15%.
Dividends Received Deduction. Corporate shareholders are generally entitled to take the dividends received deduction on the portion of the Fund’s dividend distribution that qualifies under tax law. For the Fund’s calendar year 2018 ordinary income dividends, 12% qualifies for the corporate dividends received deduction.
24
Trustees and Officers (Unaudited)
The Board supervises the business activities of the Trust and is responsible for protecting the interests of shareholders. The Chairman of the Board is Walter B. Grimm, who is an Independent Trustee of the Trust.
Each Trustee serves as a Trustee for the lifetime of the Trust or until the earlier of his or her retirement as a Trustee at age 78, death, resignation or removal. Officers are re-elected annually by the Board. The address of each Trustee and officer is 225 Pictoria Drive, Suite 450, Cincinnati, Ohio 45246.
As of the date of this report, the Trustees oversee the operations of 10 series.
Interested Trustee Background. The following table provides information regarding the Interested Trustee.
Name, Address, (Age), Position with Trust,
Term of Position with Trust | Principal Occupation During Past 5 Years
and Other Directorships |
Robert G. Dorsey*
Age: 61
TRUSTEE
Began Serving: March 2017 | Principal Occupation(s): Managing Director and Co-Chief Executive Officer of Ultimus Fund Solutions, LLC and its subsidiaries, except as otherwise noted for the FINRA-regulated broker-dealer entities (1999 to present); Interested Trustee of Ultimus Managers Trust (February 2012 to present). Previous Position(s): President of Ultimus Fund Distributors, LLC (1999 to 2018); President of Ultimus Managers Trust (February 2012 to October 2013). |
| * | Mr. Dorsey is considered an “interested person” of the Trust within the meaning of Section 2(a)(19) of the 1940 Act because of his relationship with the Trust’s administrator, transfer agent, and distributors. |
Independent Trustee Background. The following table provides information regarding the Independent Trustees.
Name, Address, (Age), Position with Trust,
Term of Position with Trust | Principal Occupation During Past 5 Years
and Other Directorships |
John C. Davis
Age: 66
TRUSTEE
Began Serving: July 2018 | Principal Occupations(s): Consultant (government services) since May 2011. Consultant, Board of Trustees of Ultimus Managers Trust (since 2016). Previous Position(s): Retired Partner of PricewaterhouseCoopers LLP (1974-2010); Former Trustee of Ultimus Managers Trust (2012-2016). |
25
Trustees and Officers (Unaudited) (continued)
Name, Address, (Age), Position with Trust,
Term of Position with Trust | Principal Occupation During Past 5 Years
and Other Directorships |
Walter B. Grimm
Age: 73
TRUSTEE AND CHAIR
Began Serving: November 2013 | Principal Occupations(s): President, Leigh Management Group, LLC (consulting firm) (October 2005 to present); and President, Leigh Investments, Inc. (1988 to present); Board member, Boys & Girls Club of Coachella Valley (April 2018 to present); Board member, Axxia Pharmaceutical (January 2015 to present). Previous Position(s): Chief Financial Officer, East West Private, LLC (consulting firm) (2009 to 2013). |
Lori Kaiser
Age: 55
TRUSTEE
Began Serving: July 2018 | Principal Occupations(s): Founder and CEO, Kaiser Consulting since 1992. |
Janet Smith Meeks
Age: 63
TRUSTEE
Began Serving: July 2018 | Principal Occupations(s): Co-Founder and CEO, Healthcare Alignment Advisors, LLC (consulting company) since August 2015. Previous Position(s): President and Chief Operating Officer, Mount Carmel Health System (2004-2015). |
Mary M. Morrow
Age: 60
TRUSTEE
Began Serving: November 2013 | Principal Occupations(s): Chief Operating Officer, Dignity Health Managed Services Organization (October 2018 to present). Previous Position(s): Independent Consultant (managed care services (April 2018 to October 2018); Chief Operating Officer, Pennsylvania Health and Wellness (fully owned subsidiary of Centene Corporation) (November 2016 to April 2018); Vice President, Strategic Initiatives, Gateway Heath (January 2015 to November 2016); Consulting Practice Manager, DST Health Solutions (August 2010 to January 2015); Director, Service and Client Relations, EBDS (August 2008 – May 2009); Independent Consultant, Healthcare Servicing May 2009 – August 2010). |
26
Trustees and Officers (Unaudited) (continued)
Officers. The following table provides information regarding the Officers.
Name, Address, (Age), Position with Trust,
Term of Position with Trust | Principal Occupation During Past 5 Years
and Other Directorships |
Matthew J. Miller
Age: 42
PRESIDENT and CHIEF EXECUTIVE OFFICER
Began Serving: September 2013 (as VP); September 2018 (as President) | Principal Occupation(s): Assistant Vice President, Relationship Management, Ultimus Fund Solutions, LLC (December 2015 to present); Vice President, Valued Advisers Trust (December 2011 to present). Previous Position(s): Vice President, Capitol Series Trust (September 2013 to March 2017); Chief Executive Officer and President, Capitol Series Trust (March 2017 to March 2018); Secretary, Capitol Series Trust (March 2018 to September 2018); Vice President, Relationship Management, Huntington Asset Services, Inc. (n/k/a Ultimus Asset Services, LLC) (2008 to December 2015); Vice President, The Huntington Funds (February 2010 to April 2015); Vice President, Transfer Agency Operations, Huntington Asset Services, Inc. (2002 to 2008); Employed in various positions with Huntington Asset Services, Inc. (July 1998 to 2002). |
Zachary P. Richmond
Age: 38
TREASURER AND CHIEF FINANCIAL OFFICER
Began Serving: August 2014 | Principal Occupation(s): Assistant Vice President, Associate Director of Financial Administration, Ultimus Fund Solutions, LLC (December 2015 to present); Treasurer and Chief Financial Officer, Unified Series Trust (August 2014 to present); Treasurer and Chief Financial Officer, Commonwealth International Series Trust (September 2015 to present). Previous Position(s): Assistant Vice President, Fund Administration, Huntington Asset Services, Inc. (n/k/a Ultimus Asset Services, LLC) (January 2011 to December 2015); and Assistant Treasurer, Unified Series Trust (2011 to August 2014). |
27
Trustees and Officers (Unaudited) (continued)
Name, Address, (Age), Position with Trust,
Term of Position with Trust | Principal Occupation During Past 5 Years
and Other Directorships |
Brandon Kipp
Age: 35
CHIEF COMPLIANCE OFFICER
Began Serving: October 2017 | Principal Occupation(s): Senior Fund Compliance Officer, Ultimus Fund Solutions, LLC (since July 2017) and Chief Compliance Officer, Valued Advisers Trust (since October 2017). Previous Position(s): Assistant Vice President and Compliance Manager, UMB Fund Services, Inc. (March 2014 to July 2017); Officer and Lead Fund Administrator, UMB Fund Services, Inc. (May 2012 to March 2014). |
Matthew J. Beck
Age: 30
SECRETARY
Began Serving: September 2018 | Principal Occupation(s): Senior Attorney, Ultimus Fund Solutions, LLC (since May 2018) and Secretary, Ultimus Managers Trust (since July 2018). Previous Position(s): Chief Compliance Officer, OBP Capital, LLC (May 2015 to May 2018); Secretary, Aspiration Funds (March 2015 to May 2018); Secretary, Starboard Investment Trust (September 2014 to May 2018); Secretary, Leeward Investment Trust (September 2014 to May 2018); Secretary, Hillman Capital Management Investment Trust (September 2014 to May 2018); Secretary, Spinnaker ETF Series (September 2014 to May 2018); Vice President and General Counsel, The Nottingham Company (July 2014 to May 2018). |
Stephen L. Preston
Age: 52
ANTI-MONEY LAUNDERING OFFICER
Began Serving: December 2016 | Principal Occupation(s): Chief Compliance Officer, Ultimus Fund Solutions, LLC and Ultimus Fund Distributors, LLC from June 2011 to present. |
Other Information (Unaudited)
The Fund’s Statement of Additional Information (“SAI”) includes additional information about the trustees and is available without charge, upon request. You may call toll-free at (800) 657-4450 to request a copy of the SAI or to make shareholder inquiries.
28
FACTS | WHAT DOES CAPITOL SERIES TRUST DO WITH YOUR PERSONAL INFORMATION? |
Why? | Financial companies choose how they share your personal information. Federal law gives consumers the right to limit some but not all sharing. Federal law also requires us to tell you how we collect, share, and protect your personal information. Please read this notice carefully to understand what we do. |
What? | The types of personal information we collect and share depend on the product or service you have with us. This information can include: ■ Social Security number ■ account balances and account transactions ■ account transactions, transaction or loss history and purchase history ■ checking account information and wire transfer instructions When you are no longer our customer, we continue to share your information as described in this notice. |
How? | All financial companies need to share customers’ personal information to run their everyday business. In the section below, we list the reasons financial companies can share their customers’ personal information; the reasons Capitol Series Trust chooses to share; and whether you can limit this sharing. |
Reasons we can share your personal information | Does Capitol Series
Trust share? |
For our everyday business purposes—
such as to process your transactions, maintain your account(s), respond to court orders and legal investigations, or report to credit bureaus | Yes |
For our marketing purposes—
to offer our products and services to you | Yes |
For joint marketing with other financial companies | No |
For our affiliates’ everyday business purposes—
information about your transactions and experiences | No |
For our affiliates’ everyday business purposes—
information about your creditworthiness | No |
For nonaffiliates to market to you | No |
Questions? | Call 1-800-657-4450 |
29
Who we are |
Who is providing this notice? | Capitol Series Trust |
What we do |
How does Capitol Series Trust protect my personal information? | To protect your personal information from unauthorized access and use, we use security measures that comply with federal law. These measures include computer safeguards and secured files and buildings. |
How does Capitol Series Trust collect my personal information? | We collect your personal information, for example, when you ■ open an account or deposit money ■ buy securities from us or sell securities to us ■ make deposits or withdrawals from your account provide account information ■ give us your account information ■ make a wire transfer ■ tell us who receives the money ■ tell us where to send the money ■ show your government-issued ID ■ show your driver’s license |
Why can’t I limit all sharing? | Federal law gives you the right to limit only ■ sharing for affiliates’ everyday business purposes — information about your creditworthiness ■ affiliates from using your information to market to you ■ sharing for nonaffiliates to market to you State laws and individual companies may give you additional rights to limit sharing. |
Definitions |
Affiliates | Companies related by common ownership or control. They can be financial and nonfinancial companies. |
Nonaffiliates | Companies not related by common ownership or control. They can be financial and nonfinancial companies. ■ Capitol Series Trust does not share your personal information with nonaffiliates so they can market to you. |
Joint marketing | A formal agreement between nonaffiliated financial companies that together market financial products or services to you. ■ Capitol Series Trust doesn’t jointly market financial products or services to you. |
30
This page is intentionally left blank.
This page is intentionally left blank.
This page is intentionally left blank.
PROXY VOTING (Unaudited)
A description of the policies and procedures that the Fund uses to determine how to vote proxies relating to portfolio securities and information regarding how the Fund voted those proxies during the most recent twelve month period ended June 30, is available without charge upon request by (1) calling the Fund at (800) 657-4450 and (2) from Fund documents filed with the Securities and Exchange Commission (“SEC”) on the SEC’s website at www.sec.gov.
TRUSTEES
Walter B. Grimm
Mary M. Morrow
John C. Davis
Lori Kaiser
Janet Smith Meeks
Robert G. Dorsey
OFFICERS
Matthew J. Miller, Chief Executive Officer/President
Zachary P. Richmond, Chief Financial Officer/Treasurer
Brandon R. Kipp, Chief Compliance Officer
INVESTMENT ADVISER
Hedeker Wealth LLC
One Overlook Point, Suite 610
Lincolnshire, IL 60069
DISTRIBUTOR
Ultimus Fund Distributors, LLC
225 Pictoria Drive, Suite 450
Cincinnati, OH 45246
INDEPENDENT REGISTERED PUBLIC ACCOUNTING FIRM
Ernst & Young LLP
800 Yard Street, Suite 500
Grandview Heights, OH 43212
LEGAL COUNSEL
Bernstein Shur
100 Middle Street, 6th Floor
Portland, ME 04104
CUSTODIAN
Huntington National Bank
41 South High Street
Columbus, OH 43215
ADMINISTRATOR, TRANSFER AGENT AND FUND ACCOUNTANT
Ultimus Fund Solutions, LLC
225 Pictoria Drive, Suite 450
Cincinnati, OH 45246
This report is intended only for the information of shareholders or those who have received the Fund’s prospectus which contains information about the Fund’s management fee and expenses. Please read the prospectus carefully before investing.
Distributed by Ultimus Fund Distributors, LLC
Member FINRA/SIPC
MESSAGE FROM THE CHIEF INVESTMENT OFFICER – (Unaudited)
At Meritage, we are value-driven investors. We buy stock in businesses when they i) score well in our comprehensive stock-ranking process (universe is global, all-cap and about 6,500 securities), and ii) are selling for less than we believe they are worth. Our value discipline is intended to provide a margin of safety and is one of our primary risk management tools, along with managing position sizes and diversification.
Dear Fellow Shareholders:
During the six months ended August 31, 2018, since our semi-annual report of February 28, 2018, the broad equity market as represented by the S&P 500 was up 8.0%. For the fiscal year ended August 31, 2018, the S&P was up 19.7%.
As mentioned in our semi-annual report, a policy agenda that includes lower corporate and individual tax rates, a rollback in business regulation, infrastructure spending and the repatriation of foreign corporate earnings back to the U.S. have been enthusiastically embraced by the stock market. For the most part, the markets have held up reasonably well as the Administration has laid out its objectives regarding trade. Current market levels at close to all-time highs imply that an all-out trade war with China is an unlikely outcome. However, the rhetoric around trade policy has ramped up and is causing increased angst among investors, as is potential pressure on corporate profit margins coming from wage increases and tighter monetary conditions.
As always, we attribute our bottom-up value-centric security selection process for generating our strong long-term returns. We continue to refine and improve this process of rigorously searching for attractive mispriced securities, among all capitalization sizes and geographies throughout the world. Our investment focus leads us to be a little more cautious in our security selection given the market cycle extended run, with an eye for higher quality and more domestic exposure in portfolios.
We explore this topic further in the following pages. A specific discussion of each Fund and its performance is included in Management’s Discussion of Fund Performance.
Thank you for your continued trust in us as stewards of your capital. As previously mentioned we have our own money invested alongside yours in each of our funds, and we remain committed to delivering attractive risk-adjusted returns over full market cycles.
Sincerely,
Mark Eveans, CFA
President and Chief Investment Officer
1
MANAGEMENT’S DISCUSSION OF FUND PERFORMANCE – (Unaudited)
Meritage Growth Equity Fund
For the fiscal year ended August 31, 2018, the Meritage Growth Equity Fund Institutional Class and Investor Class returned 24.2% and 23.8%, respectively. These returns were better than those provided by the broad equity market (as represented by the S&P 500) but trailed the Fund’s primary benchmark, the Russell 1000 Growth Index, which returned 27.2%, and the Lipper Large Cap Growth Index, which returned 25.4% during the same time frame.
For the six months ended August 31, 2018, which is the period since our semi-annual report, the Meritage Growth Equity Fund Institutional Class and Investor Class returned 10.8% and 10.6%, respectively. These returns lagged the Russell 1000 Growth Index benchmark which returned 11.7% during the same time frame, but were better than the Lipper Large Cap Growth Index return of 10.4%.
Consumer Discretionary, Information Technology and Health Care sectors were the best performing sectors for the fiscal year ended August 31, 2018. From an attribution standpoint, the Fund’s relative performance over the course of the last 12 months was helped by strong security selection in the Information Technology, Health Care and Consumer Discretionary sectors. Stock selection in the Industrials sector and modest cash balances held back relative performance.
Regarding specific issues, the strongest gainers for the year were Amazon.com, Inc., up 105.3%, Qualys, Inc., up 89.4% and Globus Medical, Inc., up 76.2%.
The poorest performers for the year were Meritor, Inc., down 23.4%, Applied Optoelectronics, Inc., down 18.6% and Momo, Inc., down 18.5%.
As a value-centric and process driven Growth manager, most sector differences as compared to the benchmark are a result of either an under or overweight of specific, bottom-up, attractively valued growth opportunities identified by our process, within that particular sector.
As noted in previous report discussions, we expect a continuation of low interest rates and below average economic growth for the world’s leading economies. We believe many investors share our view and have correspondingly been willing to pay an excessive premium for well-known growth names. This is where we part company with the crowd, however, as we expect the value discipline embedded in our growth approach to yield better results over full market cycles.
Meritage Value Equity Fund
For the fiscal year ended August 31, 2018, the Meritage Value Equity Fund Institutional Class returned 10.7%. This return lagged both the Russell 1000 Value Index benchmark which returned 12.5% and the Lipper Large Cap Value Index return of 14.8% during the same time frame.
For the six months ended August 31, 2018, which is the period since our semi-annual report, the Meritage Value Equity Fund Institutional Class returned 4.7%. This return trailed slightly the Russell 1000 Value Index benchmark which returned 4.9% during the same time frame, as well as the Lipper Large Cap Value Index return of 5.3%.
For fiscal year ended August 31, 2018, the best performing sectors were Energy, Consumer Discretionary and Industrials. From an attribution standpoint, the Fund’s overweight in the Health Care and Information Technology sectors, coupled with an underweights in the Telecommunication and Consumer Staples sectors were positive factors. Superior stock selection in the Industrials and Consumer Discretionary sectors were significant positive factors. An underweight in the Energy sector along with under-performing security selections in the Financials and Information Technology sectors held back the Fund returns.
2
MANAGEMENT’S DISCUSSION OF FUND PERFORMANCE – (Unaudited) (continued)
Regarding individual issues, the strongest gainers for the year were WNS Holdings LTD, up 48.1%, Ross Stores, Inc., up 46.2%, and Adtalem Global Education, Inc., up 39.9%.
The poorest performers for the year were Celgene Corporation, down 25.1%, Briggs & Stratton Corporation, down 25.0% and Unum Group, down 20.2%.
As a value-centric and process driven manager, most sector differences as compared to the benchmark are the result of either an under or overweight of specific bottom-up valuation opportunities identified by our process.
We expect a continuation of low interest rates and below average economic growth for the world’s leading economies. We believe many investors share our view and have correspondingly been willing to pay a premium for well-known stocks. This is where we part company with the crowd, however, as we expect the discipline embedded in our value approach will yield better results over full market cycles.
Meritage Yield-Focus Equity Fund
For the fiscal year ended August 31, 2018, the Meritage Yield-Focus Equity Fund Institutional Class and Investor Class returned 12.4% and 12.1%, respectively. The Zacks Multi-Asset Income Index has specific asset structure and distinguished dividend yield characteristics similar to the Fund. The Russell 3000 Value Index is a long-term general purpose value-centric benchmark without specificity regarding the Fund’s distinct yield-focus style. The Fund’s returns trailed slightly the 12.5% return for the Zacks Multi-Asset Income Index and the 13.0% total return for the Russell 3000 Value Index during the same time.
For the six months ended August 31, 2018, which is the period since our Semi-Annual Report, the Meritage Yield-Focus Equity Fund Institutional Class and Investor Class returned 7.9% and 7.8% respectively. These returns significantly exceeded the Zacks Multi-Asset Index which returned 6.5% and the Russell 3000 Value Index, which returned 5.5% during the same time frame.
A founding premise of the Yield-Focus Equity Fund is to earn 50–75% of the expected long-term equity return in the form of cash dividends and distributions. The strategy invests in six key types of equity asset classes – common stocks, master limited partnerships, other limited partnerships, real estate investment trusts, business development companies, convertible preferred stocks and, in rare situations, straight preferred stocks. The Meritage comprehensive security selection process searches globally for attractive yield franchises.
Regarding equity asset class performance for the fiscal year ended August 31, 2018, Limited Partnerships and MLPs were the strongest relative performers. Business Development Companies and convertible preferred stocks had the lowest absolute returns. The best performing sectors were Energy, Information Technology and Consumer Discretionary while strong stock selection helped relative performance in the Telecommunication, Utilities and Consumer Discretionary sectors. Performance was hurt by less favorable stock selection in the Consumer Staples and Real Estate sectors.
In terms of specific issues, the strongest performers for the year were Valero Energy Corporation, up 81.4%, Target Corporation, up 66.2% and DSW Inc., up 62.7%.
The poorest performers for the year were Philip Morris International Inc., down 30.3%, CBL & Associates Properties Inc., down 29.1% and Invesco Ltd., down 23.5%.
3
INVESTMENT RESULTS – (Unaudited)
| | Average Annual Total Returns
as of August 31, 2018 (a) | |
| | Fund/Index | 1 Year | 3 Year | Since Inception
(12/23/13) | |
| | Meritage Growth Equity Fund – Institutional Class | 24.18% | 18.14% | 14.22% | |
| | Meritage Growth Equity Fund – Investor Class | 23.78% | 17.83% | 13.91% | |
| | Russell 1000 Growth Index (b) | 27.23% | 19.33% | 15.59% | |
| | | | | | |
| | | Expense Ratios (c) | | |
| | | Institutional Class | Investor Class | | |
| | Gross | 1.59% | 1.84% | | |
| | With Applicable Waivers | 1.04% | 1.29% | | |
The performance quoted represents past performance, which does not guarantee future results. The investment return and principal value of an investment will fluctuate so that an investor’s shares, when redeemed, may be worth more or less than their original cost. The returns shown do not reflect deduction of taxes that a shareholder would pay on Fund distributions or the redemption of Fund shares. The Fund’s investment objectives, risks, charges and expenses must be considered carefully before investing. Current performance of a Fund may be lower or higher than the performance quoted. Performance data current to the most recent month end may be obtained by calling 1-855-261-0104.
The performance in the preceding table reflects any fee reductions during the applicable period. If such fee reductions had not occurred, the quoted performance would be lower.
| (a) | Return figures reflect any change in price per share and assume the reinvestment of all distributions. |
| (b) | The Russell 1000 Growth Index is a widely recognized unmanaged index of equity securities and is representative of a broader domestic equity market and range of securities than is found in the Fund’s portfolio. Individuals cannot invest directly in an index; however, an individual can invest in exchange traded funds or other investment vehicles that attempt to track the performance of a benchmark index. |
| (c) | The expense ratios are from the Fund’s most recent prospectus dated June 4, 2018. The Adviser has contractually agreed to waive or limit its fees and assume other expenses of the Fund through December 31, 2019, so that total annual fund operating expenses do not exceed 1.00% of the Fund’s average daily net assets. This operating expense limitation does not apply to brokerage fees and commissions, borrowing costs (such as interest and dividend expenses on securities sold short), taxes, 12b-1 fees, extraordinary expenses and indirect expenses (such as “acquired fund fees and expenses”). Additional information pertaining to the Fund’s expense ratios as of August 31, 2018 can be found in the financial highlights. |
The Fund’s investment objective, strategies, risks, charges and expenses must be considered carefully before investing. The prospectus contains this and other important information about the investment company and may be obtained by calling 1-855-261-0104. Please read it carefully before investing.
The Fund is distributed by Unified Financial Securities, LLC, Member FINRA/SIPC.
4
INVESTMENT RESULTS – (Unaudited) (continued)
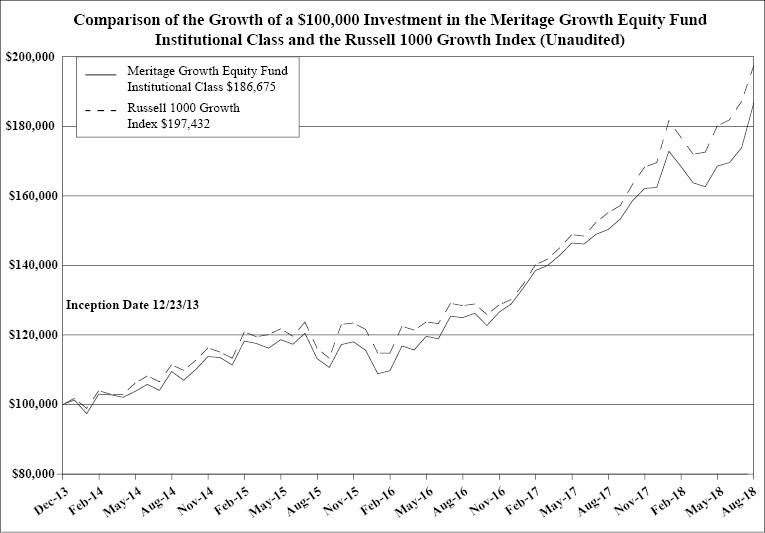
The chart above assumes an initial investment of $100,000 made on December 23, 2013 (commencement of operations) and held through August 31, 2018. THE FUND’S RETURNS REPRESENT PAST PERFORMANCE AND DO NOT GUARANTEE FUTURE RESULTS. The returns shown do not reflect deduction of taxes that a shareholder would pay on the Fund’s distributions or the redemption of the Fund’s shares. Investment returns and principal values will fluctuate so that your shares, when redeemed, may be worth more or less than their original purchase price.
The Russell 1000 Growth Index is a widely recognized unmanaged index of equity securities and is representative of a broader domestic equity market and range of securities than is found in the Fund’s portfolio. Individuals cannot invest directly in an Index; however, an individual can invest in exchange traded funds or other investment vehicles that attempt to track the performance of a benchmark index. The Index returns do not include expenses, which have been deducted from the Fund’s return. These performance figures include the change in value of the stocks in the index plus the reinvestment of dividends and are not annualized. The returns shown do not reflect deduction of taxes that a shareholder would pay on Fund distributions or the redemption of Fund shares.
Current performance may be lower or higher than the performance data quoted. For more information on the Fund, and to obtain performance data current to the most recent month-end, or to request a prospectus, please call 1-855-261-0104. You should carefully consider the investment objectives, potential risks, management fees, and charges and expenses of the Fund before investing. The Fund’s prospectus contains this and other information about the Fund, and should be read carefully before investing.
The Fund is distributed by Unified Financial Securities, LLC, member FINRA/SIPC.
5
INVESTMENT RESULTS – (Unaudited) (continued)
| | Average Annual Total Returns
as of August 31, 2018 (a) | |
| | Fund/Index | 1 Year | 3 Year | Since Inception
(12/23/13) | |
| | Meritage Value Equity Fund – Institutional Class | 10.70% | 8.54% | 7.75% | |
| | Russell 1000 Value Index (b) | 12.47% | 12.32% | 9.55% | |
| | | | | | |
| | | Expense Ratios (c) | | | |
| | | Institutional Class | | | |
| | Gross | 1.73% | | | |
| | With Applicable Waivers | 1.04% | | | |
The performance quoted represents past performance, which does not guarantee future results. The investment return and principal value of an investment will fluctuate so that an investor’s shares, when redeemed, may be worth more or less than their original cost. The returns shown do not reflect deduction of taxes that a shareholder would pay on Fund distributions or the redemption of Fund shares. The Fund’s investment objectives, risks, charges and expenses must be considered carefully before investing. Current performance of a Fund may be lower or higher than the performance quoted. Performance data current to the most recent month end may be obtained by calling 1-855-261-0104.
The performance in the preceding table reflects any fee reductions during the applicable period. If such fee reductions had not occurred, the quoted performance would be lower.
| (a) | Return figures reflect any change in price per share and assume the reinvestment of all distributions. |
| (b) | The Russell 1000 Value Index is a widely recognized unmanaged index of equity securities and is representative of a broader domestic equity market and range of securities than is found in the Fund’s portfolio. Individuals cannot invest directly in an index; however, an individual can invest in exchange traded funds or other investment vehicles that attempt to track the performance of a benchmark index. |
| (c) | The expense ratios are from the Fund’s most recent prospectus dated June 4, 2018. The Adviser has contractually agreed to waive or limit its fees and assume other expenses of the Fund through December 31, 2019, so that total annual fund operating expenses do not exceed 1.00% of the Fund’s average daily net assets. This operating expense limitation does not apply to brokerage fees and commissions, borrowing costs (such as interest and dividend expenses on securities sold short), taxes, 12b-1 fees, extraordinary expenses and indirect expenses (such as “acquired fund fees and expenses”). Additional information pertaining to the Fund’s expense ratios as of August 31, 2018 can be found in the financial highlights. |
The Fund’s investment objective, strategies, risks, charges and expenses must be considered carefully before investing. The prospectus contains this and other important information about the investment company and may be obtained by calling 1-855-261-0104. Please read it carefully before investing.
The Fund is distributed by Unified Financial Securities, LLC, Member FINRA/SIPC.
6
INVESTMENT RESULTS – (Unaudited) (continued)
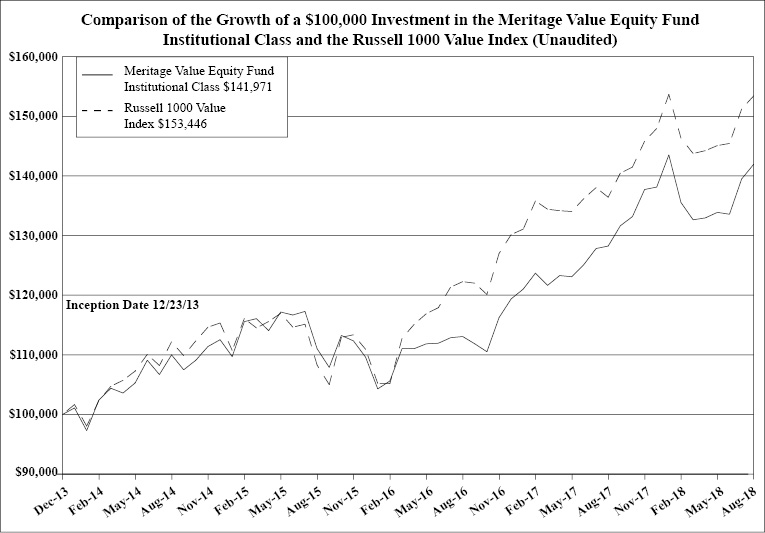
The chart above assumes an initial investment of $100,000 made on December 23, 2013 (commencement of operations) and held through August 31, 2018. THE FUND’S RETURNS REPRESENT PAST PERFORMANCE AND DO NOT GUARANTEE FUTURE RESULTS. The returns shown do not reflect deduction of taxes that a shareholder would pay on the Fund’s distributions or the redemption of the Fund’s shares. Investment returns and principal values will fluctuate so that your shares, when redeemed, may be worth more or less than their original purchase price.
The Russell 1000 Value Index is a widely recognized unmanaged index of equity securities and is representative of a broader domestic equity market and range of securities than is found in the Fund’s portfolio. Individuals cannot invest directly in an Index; however, an individual can invest in exchange traded funds or other investment vehicles that attempt to track the performance of a benchmark index. The Index returns do not include expenses, which have been deducted from the Fund’s return. These performance figures include the change in value of the stocks in the index plus the reinvestment of dividends and are not annualized. The returns shown do not reflect deduction of taxes that a shareholder would pay on Fund distributions or the redemption of Fund shares.
Current performance may be lower or higher than the performance data quoted. For more information on the Fund, and to obtain performance data current to the most recent month-end, or to request a prospectus, please call 1-855-261-0104. You should carefully consider the investment objectives, potential risks, management fees, and charges and expenses of the Fund before investing. The Fund’s prospectus contains this and other information about the Fund, and should be read carefully before investing.
The Fund is distributed by Unified Financial Securities, LLC, member FINRA/SIPC.
7
INVESTMENT RESULTS – (Unaudited) (continued)
| | Average Annual Total Returns
as of August 31, 2018 (a) | |
| | Fund/Index | 1 Year | 3 Year | Since Inception
(12/23/13) | |
| | Meritage Yield-Focus Equity Fund – Institutional Class | 12.40% | 9.91% | 5.89% | |
| | Meritage Yield-Focus Equity Fund – Investor Class | 12.09% | 9.78% | 5.70% | |
| | Zacks Multi-Asset Income Index TR(b) | 12.50% | 10.04% | 3.85% | |
| | Russell 3000 Value Index(c) | 13.04% | 12.58% | 9.53% | |
| | | | | | |
| | | Expense Ratios (d) | | |
| | | Institutional Class | Investor Class | | |
| | Gross | 1.81% | 2.06% | | |
| | With Applicable Waivers | 1.33% | 1.58% | | |
The performance quoted represents past performance, which does not guarantee future results. The investment return and principal value of an investment will fluctuate so that an investor’s shares, when redeemed, may be worth more or less than their original cost. The returns shown do not reflect deduction of taxes that a shareholder would pay on Fund distributions or the redemption of Fund shares. The Fund’s investment objectives, risks, charges and expenses must be considered carefully before investing. Current performance of a Fund may be lower or higher than the performance quoted. Performance data current to the most recent month end may be obtained by calling 1-855-261-0104.
The performance in the preceding table reflects any fee reductions during the applicable period. If such fee reductions had not occurred, the quoted performance would be lower.
| (a) | Return figures reflect any change in price per share and assume the reinvestment of all distributions. |
| (b) | Effective December 14, 2017 for performance reflected in this prospectus, the Yield-Focus Equity Fund’s benchmark was updated from the Russell 3000 Value Index to the Zacks Multi-Asset Income Index based on the Adviser’s determination that the Zacks Multi-Asset Income Index more closely aligns with the investment strategy of the Fund. The Trust’s Board approved this change to the Fund’s benchmark in December 2017. |
| | The Zacks Multi-Asset Income Index is comprised of approximately 125 to 150 securities selected, based on investment and other criteria, from a universe of domestic and international companies. The universe of securities within the index includes U.S. listed common stocks and ADRs paying dividends, real estate investment trusts, MLPs, closed end funds, Canadian royalty trusts and traditional preferred stocks. Individuals cannot invest directly in an index. |
| (c) | The Russell 3000 Value Index is a widely recognized unmanaged index of equity securities and is representative of a broader domestic equity market and range of securities than is found in the Fund’s portfolio. Individuals cannot invest directly in an index; however, an individual can invest in exchange traded funds or other investment vehicles that attempt to track the performance of a benchmark index. |
| (d) | The expense ratios are from the Fund’s most recent prospectus dated June 4, 2018. The Adviser has contractually agreed to waive or limit its fees and assume other expenses of the Fund through December 31, 2019, so that total annual fund operating expenses do not exceed 1.00% of the Fund’s average daily net assets. This operating expense limitation does not apply to brokerage fees and commissions, borrowing costs (such as interest and dividend expenses on securities sold short), taxes, 12b-1 fees, extraordinary expenses and indirect expenses (such as “acquired fund fees and expenses”). Additional information pertaining to the Fund’s expense ratios as of August 31, 2018 can be found in the financial highlights. |
The Fund’s investment objective, strategies, risks, charges and expenses must be considered carefully before investing. The prospectus contains this and other important information about the investment company and may be obtained by calling 1-855-261-0104. Please read it carefully before investing.
The Fund is distributed by Unified Financial Securities, LLC, Member FINRA/SIPC.
8
INVESTMENT RESULTS – (Unaudited) (continued)
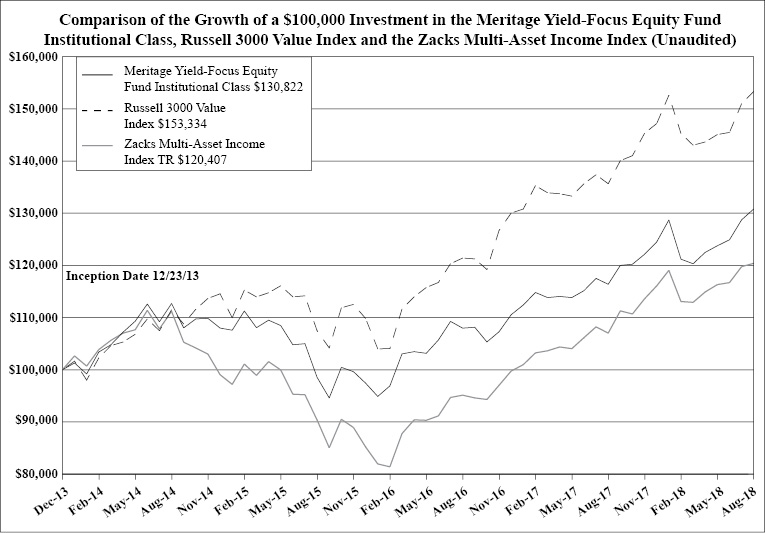
The chart above assumes an initial investment of $100,000 made on December 23, 2013 (commencement of operations) and held through August 31, 2018. THE FUND’S RETURNS REPRESENT PAST PERFORMANCE AND DO NOT GUARANTEE FUTURE RESULTS. The returns shown do not reflect deduction of taxes that a shareholder would pay on the Fund’s distributions or the redemption of the Fund’s shares. Investment returns and principal values will fluctuate so that your shares, when redeemed, may be worth more or less than their original purchase price.
The Zacks Multi-Asset Income Index is comprised of approximately 125 to 150 securities selected, based on investment and other criteria, from a universe of domestic and international companies. The universe of securities within the Index includes U.S. listed common stocks and ADRs paying dividends, real estate investment trusts, MLPs, closed end funds, Canadian royalty trusts and traditional preferred stocks. Individuals cannot invest directly in an Index.
The Russell 3000 Value Index is a widely recognized unmanaged index of equity securities and is representative of a broader domestic equity market and range of securities than is found in the Fund’s portfolio. Individuals cannot invest directly in an Index; however, an individual can invest in exchange traded funds or other investment vehicles that attempt to track the performance of a benchmark index. The Index returns do not include expenses, which have been deducted from the Fund’s return. These performance figures include the change in value of the stocks in the index plus the reinvestment of dividends and are not annualized. The returns shown do not reflect deduction of taxes that a shareholder would pay on Fund distributions or the redemption of Fund shares.
Current performance may be lower or higher than the performance data quoted. For more information on the Fund, and to obtain performance data current to the most recent month-end, or to request a prospectus, please call 1-855-261-0104. You should carefully consider the investment objectives, potential risks, management fees, and charges and expenses of the Fund before investing. The Fund’s prospectus contains this and other information about the Fund, and should be read carefully before investing.
The Fund is distributed by Unified Financial Securities, LLC, member FINRA/SIPC.
9
FUND HOLDINGS – (Unaudited)
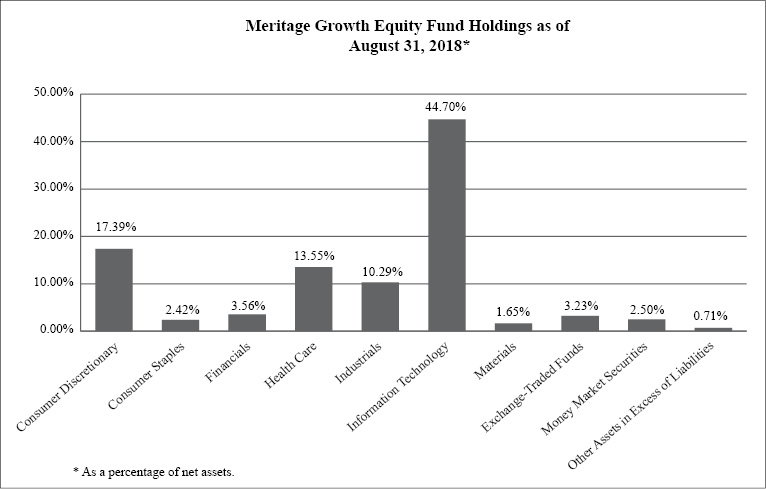
The investment objective of the Meritage Growth Equity Fund is to seek growth of capital.
10
FUND HOLDINGS – (Unaudited) (continued)
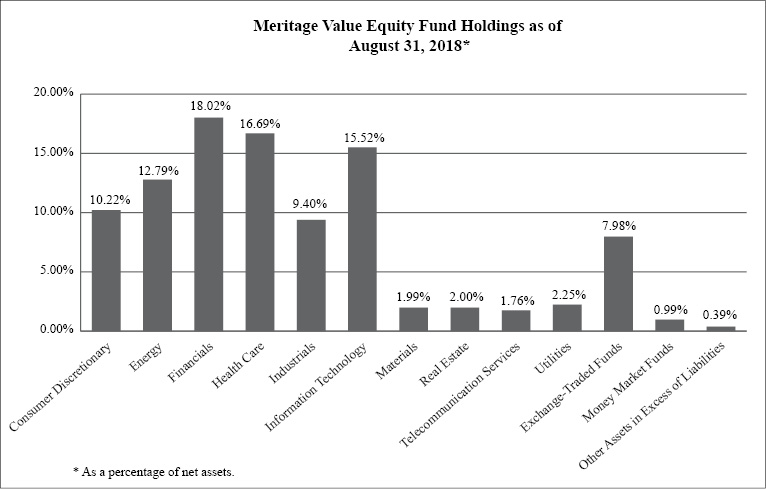
The investment objective of the Meritage Value Equity Fund is to seek growth of capital. Income is a secondary objective.
11
FUND HOLDINGS – (Unaudited) (continued)
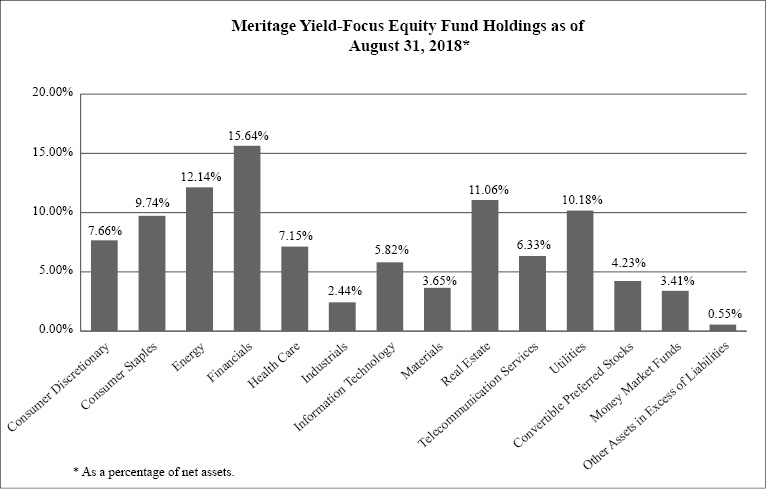
The investment objective of the Meritage Yield-Focus Equity Fund is to seek long-term growth of capital with an emphasis on high current income.
AVAILABILITY OF PORTFOLIO SCHEDULE – (Unaudited)
The Funds will file their complete schedule of investments with the Securities and Exchange Commission (“SEC”) for the first and third quarter of each fiscal year on Form N-Q. The Funds’ Forms N-Q will be available at the SEC’s website at www.sec.gov. The Form N-Q may be reviewed and copied at the Public Reference Room in Washington, DC. Information on the operation of the Public Reference Room may be obtained by calling 1-800-SEC-0330.
12
MERITAGE GROWTH EQUITY FUND
SCHEDULE OF INVESTMENTS
August 31, 2018
COMMON STOCKS — 93.56% | | Shares | | | Fair Value | |
Consumer Discretionary — 17.39% | | | | | | | | |
Amazon.com, Inc.(a) | | | 875 | | | $ | 1,761,121 | |
Best Buy Company, Inc. | | | 5,000 | | | | 397,800 | |
Home Depot, Inc. (The) | | | 6,080 | | | | 1,220,681 | |
Nordstrom, Inc. | | | 8,430 | | | | 529,826 | |
O'Reilly Automotive, Inc.(a) | | | 1,228 | | | | 411,896 | |
Sony Corporation - ADR | | | 7,760 | | | | 441,001 | |
Urban Outfitters, Inc.(a) | | | 6,050 | | | | 281,204 | |
Walt Disney Company (The) | | | 2,640 | | | | 295,733 | |
| | | | | | | | 5,339,262 | |
Consumer Staples — 2.42% | | | | | | | | |
Monster Beverage Corporation(a) | | | 5,400 | | | | 328,806 | |
National Beverage Corporation(a) | | | 3,515 | | | | 414,208 | |
| | | | | | | | 743,014 | |
Financials — 3.56% | | | | | | | | |
BlackRock, Inc. | | | 735 | | | | 352,109 | |
Green Dot Corporation, Class A(a) | | | 3,520 | | | | 301,558 | |
S&P Global, Inc. | | | 2,123 | | | | 439,568 | |
| | | | | | | | 1,093,235 | |
Health Care — 13.55% | | | | | | | | |
Amgen, Inc. | | | 2,456 | | | | 490,733 | |
Centene Corporation(a) | | | 3,910 | | | | 572,737 | |
Express Scripts Holding Company(a) | | | 5,730 | | | | 504,355 | |
Globus Medical, Inc., Class A(a) | | | 8,900 | | | | 474,103 | |
Innoviva, Inc.(a) | | | 16,130 | | | | 234,208 | |
Intuitive Surgical, Inc.(a) | | | 1,119 | | | | 626,640 | |
Johnson & Johnson | | | 3,382 | | | | 455,521 | |
Mettler-Toledo International, Inc.(a) | | | 731 | | | | 427,240 | |
WellCare Health Plans, Inc.(a) | | | 1,239 | | | | 374,884 | |
| | | | | | | | 4,160,421 | |
Industrials — 10.29% | | | | | | | | |
AMETEK, Inc. | | | 5,365 | | | | 412,890 | |
Deluxe Corporation | | | 6,265 | | | | 371,013 | |
Fortive Corporation | | | 4,300 | | | | 361,114 | |
Graco, Inc. | | | 7,510 | | | | 353,045 | |
Ingersoll-Rand plc | | | 3,460 | | | | 350,463 | |
Meritor, Inc.(a) | | | 14,075 | | | | 304,865 | |
Nordson Corporation | | | 2,795 | | | | 388,561 | |
Sensata Technologies Holding plc(a) | | | 11,695 | | | | 619,251 | |
| | | | | | | | 3,161,202 | |
Information Technology — 44.70% | | | | | | | | |
Adobe Systems, Inc.(a) | | | 1,844 | | | | 485,912 | |
Alphabet, Inc., Class A(a) | | | 1,088 | | | | 1,340,197 | |
Apple, Inc. | | | 9,471 | | | | 2,155,884 | |
See accompanying notes which are an integral part of these financial statements.
13
MERITAGE GROWTH EQUITY FUND
SCHEDULE OF INVESTMENTS – (continued)
August 31, 2018
COMMON STOCKS — 93.56% – continued | | Shares | | | Fair Value | |
Information Technology — 44.70% – continued | | | | | | | | |
Facebook, Inc., Class A(a) | | | 1,570 | | | $ | 275,896 | |
Fiserv, Inc.(a) | | | 9,030 | | | | 723,032 | |
Fortinet, Inc.(a) | | | 7,295 | | | | 611,029 | |
IAC/InterActiveCorp(a) | | | 3,211 | | | | 633,209 | |
Lumentum Holdings, Inc.(a) | | | 10,035 | | | | 681,377 | |
Mastercard, Inc., Class A | | | 9,066 | | | | 1,954,267 | |
Microsoft Corporation | | | 14,090 | | | | 1,582,730 | |
Novanta, Inc.(a) | | | 5,245 | | | | 401,767 | |
Orbotech Limited(a) | | | 5,520 | | | | 353,170 | |
Stamps.com, Inc.(a) | | | 1,511 | | | | 375,408 | |
Tencent Holdings Limited - ADR | | | 6,270 | | | | 270,488 | |
Tokyo Electron Limited - ADR | | | 7,335 | | | | 311,591 | |
Ultimate Software Group, Inc. (The)(a) | | | 1,272 | | | | 393,900 | |
Zebra Technologies Corporation, Class A(a) | | | 6,852 | | | | 1,176,762 | |
| | | | | | | | 13,726,619 | |
Materials — 1.65% | | | | | | | | |
Eagle Materials, Inc. | | | 5,495 | | | | 507,353 | |
Total Common Stocks (Cost $20,673,750) | | | | | | | 28,731,106 | |
| | | | | | | | | |
EXCHANGE-TRADED FUNDS — 3.23% | | | | | | | | |
Consumer Staples Select Sector SPDR Fund | | | 5,485 | | | | 294,983 | |
SPDR S&P Bank ETF | | | 8,120 | | | | 401,290 | |
SPDR S&P Oil & Gas Exploration & Production ETF | | | 7,000 | | | | 296,381 | |
Total Exchange-Traded Funds (Cost $886,097) | | | | | | | 992,654 | |
| | | | | | | | | |
MONEY MARKET FUNDS — 2.50% | | | | | | | | |
Morgan Stanley Institutional Liquidity Funds Treasury Securities Portfolio, Institutional Class, 1.84%(b) | | | 767,467 | | | | 767,467 | |
Total Money Market Funds (Cost $767,467) | | | | | | | 767,467 | |
Total Investments — 99.29% (Cost $22,327,314) | | | | | | | 30,491,227 | |
Other Assets in Excess of Liabilities — 0.71% | | | | | | | 216,720 | |
NET ASSETS — 100.00% | | | | | | $ | 30,707,947 | |
| (a) | Non-income producing security. |
| (b) | Rate disclosed is the seven day effective yield as of August 31, 2018. |
ADR – American Depositary Receipt
ETF – Exchange-Traded Fund
SPDR – Standard & Poor's Depositary Receipt
The sectors shown on the schedule of investments are based on the Global Industry Classification Standard, or GICS® (“GICS”). The GICS was developed by and/or is the exclusive property of MSCI, Inc. and Standard & Poor’s Financial Services LLC (“S&P”). GICS is a service mark of MSCI, Inc. and S&P and has been licensed for use by Ultimus Fund Solutions, LLC.
See accompanying notes which are an integral part of these financial statements.
14
MERITAGE VALUE EQUITY FUND
SCHEDULE OF INVESTMENTS
August 31, 2018
COMMON STOCKS — 90.64% | | Shares | | | Fair Value | |
Consumer Discretionary — 10.22% | | | | | | | | |
Adtalem Global Education, Inc.(a) | | | 8,490 | | | $ | 406,247 | |
AutoZone, Inc.(a) | | | 518 | | | | 397,244 | |
Dollar General Corporation | | | 2,770 | | | | 298,412 | |
Gentex Corporation | | | 14,780 | | | | 345,556 | |
Helen of Troy Limited(a) | | | 3,420 | | | | 406,809 | |
| | | | | | | | 1,854,268 | |
Energy — 12.79% | | | | | | | | |
Chevron Corporation | | | 3,225 | | | | 382,034 | |
China Petroleum & Chemical Corporation - ADR | | | 4,885 | | | | 485,128 | |
CNOOC Limited - ADR | | | 1,803 | | | | 320,411 | |
Equinor ASA - ADR | | | 13,595 | | | | 350,343 | |
Husky Energy, Inc. | | | 20,315 | | | | 335,401 | |
Royal Dutch Shell PLC, Class A - ADR | | | 6,850 | | | | 446,826 | |
| | | | | | | | 2,320,143 | |
Financials — 18.02% | | | | | | | | |
Athene Holding Limited, Class A(a) | | | 5,715 | | | | 283,807 | |
Discover Financial Services | | | 4,730 | | | | 369,508 | |
Lincoln National Corporation | | | 4,610 | | | | 302,324 | |
Northern Trust Corporation | | | 3,705 | | | | 398,139 | |
Prudential Financial, Inc. | | | 3,685 | | | | 362,051 | |
Reinsurance Group of America, Inc. | | | 2,240 | | | | 319,984 | |
State Street Corporation | | | 5,030 | | | | 437,158 | |
Synchrony Financial | | | 11,485 | | | | 363,730 | |
Torchmark Corporation | | | 4,927 | | | | 433,182 | |
| | | | | | | | 3,269,883 | |
Health Care — 16.69% | | | | | | | | |
Aetna, Inc. | | | 1,700 | | | | 340,459 | |
Anthem, Inc. | | | 1,130 | | | | 299,145 | |
Biogen, Inc.(a) | | | 1,044 | | | | 369,044 | |
Bristol-Myers Squibb Company | | | 7,220 | | | | 437,171 | |
Cigna Corporation | | | 2,210 | | | | 416,231 | |
Emergent BioSolutions, Inc.(a) | | | 6,340 | | | | 393,080 | |
PRA Health Sciences, Inc.(a) | | | 3,910 | | | | 412,896 | |
UnitedHealth Group, Inc. | | | 1,342 | | | | 360,273 | |
| | | | | | | | 3,028,299 | |
Industrials — 9.40% | | | | | | | | |
Acuity Brands, Inc. | | | 2,590 | | | | 395,855 | |
CSX Corporation | | | 4,720 | | | | 350,035 | |
Herman Miller, Inc. | | | 7,240 | | | | 277,292 | |
Regal-Beloit Corporation | | | 4,145 | | | | 346,937 | |
Spirit AeroSystems Holdings, Inc., Class A | | | 3,930 | | | | 336,015 | |
| | | | | | | | 1,706,134 | |
See accompanying notes which are an integral part of these financial statements.
15
MERITAGE VALUE EQUITY FUND
SCHEDULE OF INVESTMENTS – (continued)
August 31, 2018
COMMON STOCKS — 90.64% – continued | | Shares | | | Fair Value | |
Information Technology — 15.52% | | | | | | | | |
CDW Corporation | | | 4,835 | | | $ | 423,353 | |
Cognizant Technology Solutions Corporation, Class A | | | 4,750 | | | | 372,542 | |
KLA-Tencor Corporation | | | 3,200 | | | | 371,872 | |
Kulicke & Soffa Industries, Inc. | | | 7,000 | | | | 180,530 | |
MAXIMUS, Inc. | | | 5,215 | | | | 346,798 | |
Synopsys, Inc.(a) | | | 3,595 | | | | 367,193 | |
Vishay Intertechnology, Inc. | | | 19,320 | | | | 459,816 | |
WNS Holdings Limited - ADR(a) | | | 5,675 | | | | 294,135 | |
| | | | | | | | 2,816,239 | |
Materials — 1.99% | | | | | | | | |
Louisiana-Pacific Corporation | | | 12,385 | | | | 361,147 | |
| | | | | | | | | |
Real Estate — 2.00% | | | | | | | | |
Host Hotels & Resorts, Inc. | | | 16,830 | | | | 362,350 | |
| | | | | | | | | |
Telecommunication Services — 1.76% | | | | | | | | |
Nippon Telegraph and Telephone Corporation - ADR | | | 7,210 | | | | 320,196 | |
| | | | | | | | | |
Utilities — 2.25% | | | | | | | | |
Entergy Corporation | | | 4,885 | | | | 408,337 | |
Total Common Stocks (Cost $13,221,096) | | | | | | | 16,446,996 | |
| | | | | | | | | |
EXCHANGE-TRADED FUNDS — 7.98% | | | | | | | | |
iShares Russell 1000 Value ETF | | | 2,831 | | | | 359,820 | |
Utilities Select Sector SPDR® Fund (The) | | | 13,275 | | | | 709,814 | |
Vanguard Real Estate ETF | | | 4,500 | | | | 378,225 | |
Total Exchange-Traded Funds Cost ($1,372,726) | | | | | | | 1,447,859 | |
| | | | | | | | | |
MONEY MARKET FUNDS — 0.99% | | | | | | | | |
Morgan Stanley Institutional Liquidity Funds Treasury Securities Portfolio, Institutional Class, 1.84%(b) | | | 179,502 | | | | 179,502 | |
Total Money Market Funds (Cost $179,502) | | | | | | | 179,502 | |
Total Investments — 99.61% (Cost $14,773,324) | | | | | | | 18,074,357 | |
Other Assets in Excess of Liabilities — 0.39% | | | | | | | 71,051 | |
NET ASSETS — 100.00% | | | | | | $ | 18,145,408 | |
| (a) | Non-income producing security. |
| (b) | Rate disclosed is the seven day effective yield as of August 31, 2018. |
ADR – American Depositary Receipt
ETF – Exchange-Traded Fund
SPDR – Standard & Poor's Depositary Receipt
The sectors shown on the schedule of investments are based on the Global Industry Classification Standard, or GICS® (“GICS”). The GICS was developed by and/or is the exclusive property of MSCI, Inc. and Standard & Poor’s Financial Services LLC (“S&P”). GICS is a service mark of MSCI, Inc. and S&P and has been licensed for use by Ultimus Fund Solutions, LLC.
See accompanying notes which are an integral part of these financial statements.
16
MERITAGE YIELD-FOCUS EQUITY FUND
SCHEDULE OF INVESTMENTS
August 31, 2018
COMMON STOCKS — 91.81% | | Shares | | | Fair Value | |
Consumer Discretionary — 7.66% | | | | | | | | |
DSW, Inc., Class A | | | 14,040 | | | $ | 466,969 | |
Extended Stay America, Inc. | | | 18,070 | | | | 364,653 | |
GameStop Corporation, Class A | | | 17,795 | | | | 236,140 | |
Garmin Limited | | | 7,205 | | | | 490,949 | |
General Motors Company | | | 7,240 | | | | 261,002 | |
Target Corporation | | | 4,890 | | | | 427,875 | |
| | | | | | | | 2,247,588 | |
Consumer Staples — 9.74% | | | | | | | | |
Altria Group, Inc. | | | 9,515 | | | | 556,818 | |
General Mills, Inc. | | | 11,670 | | | | 536,936 | |
Imperial Brands PLC - ADR | | | 11,670 | | | | 414,752 | |
Kimberly-Clark Corporation | | | 4,120 | | | | 476,025 | |
Philip Morris International, Inc. | | | 6,165 | | | | 480,192 | |
Unilever PLC - ADR | | | 6,895 | | | | 392,119 | |
| | | | | | | | 2,856,842 | |
Energy — 12.14% | | | | | | | | |
Alliance Resource Partners LP(a) | | | 28,016 | | | | 563,122 | |
Enterprise Products Partners LP(a) | | | 18,220 | | | | 521,092 | |
Kinder Morgan, Inc. | | | 36,630 | | | | 648,351 | |
Plains GP Holdings LP, Class A(a) | | | 27,345 | | | | 704,953 | |
Repsol SA - ADR | | | 28,385 | | | | 546,127 | |
Royal Dutch Shell PLC, Class B - ADR | | | 8,550 | | | | 576,099 | |
| | | | | | | | 3,559,744 | |
Financials — 15.64% | | | | | | | | |
AllianceBernstein Holding LP(a) | | | 19,990 | | | | 600,699 | |
Invesco Limited | | | 16,950 | | | | 408,495 | |
Lazard Limited, Class A(a) | | | 9,130 | | | | 439,518 | |
MetLife, Inc. | | | 11,670 | | | | 535,536 | |
Old Republic International Corporation | | | 24,610 | | | | 545,850 | |
PacWest Bancorp | | | 5,740 | | | | 289,813 | |
People's United Financial, Inc. | | | 26,345 | | | | 487,646 | |
Power Financial Corporation | | | 14,715 | | | | 343,080 | |
Principal Financial Group, Inc. | | | 9,660 | | | | 533,135 | |
Solar Capital Ltd.(b) | | | 18,605 | | | | 404,659 | |
| | | | | | | | 4,588,431 | |
Health Care — 7.15% | | | | | | | | |
AbbVie, Inc. | | | 3,885 | | | | 372,882 | |
Merck & Company, Inc. | | | 10,475 | | | | 718,481 | |
Pfizer, Inc. | | | 13,595 | | | | 564,464 | |
Roche Holding AG - ADR | | | 14,250 | | | | 441,180 | |
| | | | | | | | 2,097,007 | |
Industrials — 2.44% | | | | | | | | |
Cummins, Inc. | | | 5,044 | | | | 715,239 | |
See accompanying notes which are an integral part of these financial statements.
17
MERITAGE YIELD-FOCUS EQUITY FUND
SCHEDULE OF INVESTMENTS – (continued)
August 31, 2018
COMMON STOCKS — 91.81% – continued | | Shares | | | Fair Value | |
Information Technology — 5.82% | | | | | | | | |
HP, Inc. | | | 12,695 | | | $ | 312,932 | |
International Business Machines Corporation | | | 5,394 | | | | 790,113 | |
QUALCOMM, Inc. | | | 8,780 | | | | 603,274 | |
| | | | | | | | 1,706,319 | |
Materials — 3.65% | | | | | | | | |
Domtar Corporation | | | 5,935 | | | | 302,092 | |
Norbord, Inc. | | | 11,250 | | | | 428,849 | |
Rio Tinto PLC - ADR | | | 7,085 | | | | 340,293 | |
| | | | | | | | 1,071,234 | |
Real Estate — 11.06% | | | | | | | | |
Medical Properties Trust, Inc. | | | 29,465 | | | | 443,448 | |
National Health Investors, Inc. | | | 8,445 | | | | 669,267 | |
Piedmont Office Realty Trust, Inc., Class A | | | 23,805 | | | | 472,291 | |
Simon Property Group, Inc. | | | 2,911 | | | | 532,800 | |
Uniti Group, Inc. | | | 15,790 | | | | 328,748 | |
VEREIT, Inc. | | | 60,780 | | | | 475,300 | |
Xenia Hotel & Resorts, Inc. | | | 13,290 | | | | 322,415 | |
| | | | | | | | 3,244,269 | |
Telecommunication Services — 6.33% | | | | | | | | |
AT&T, Inc. | | | 21,840 | | | | 697,570 | |
China Mobile Limited - ADR | | | 10,670 | | | | 512,053 | |
Verizon Communications, Inc. | | | 11,902 | | | | 647,112 | |
| | | | | | | | 1,856,735 | |
Utilities — 10.18% | | | | | | | | |
CenterPoint Energy, Inc. | | | 22,435 | | | | 623,469 | |
Duke Energy Corporation | | | 8,060 | | | | 654,794 | |
Entergy Corporation | | | 6,970 | | | | 582,622 | |
PPL Corporation | | | 23,130 | | | | 687,887 | |
Public Service Enterprise Group, Inc. | | | 8,320 | | | | 435,552 | |
| | | | | | | | 2,984,324 | |
Total Common Stocks (Cost $23,678,455) | | | | | | | 26,927,732 | |
| | | | | | | | | |
CONVERTIBLE PREFERRED STOCKS — 4.23% | | | | | | | | |
Industrials — 1.27% | | | | | | | | |
Stanley Black & Decker, Inc., 5.38% | | | 3,430 | | | | 372,464 | |
| | | | | | | | | |
Information Technology — 2.96% | | | | | | | | |
Belden, Inc., 6.75% | | | 8,935 | | | | 868,425 | |
Total Convertible Preferred Stocks (Cost $1,266,110) | | | | | | | 1,240,889 | |
See accompanying notes which are an integral part of these financial statements.
18
MERITAGE YIELD-FOCUS EQUITY FUND
SCHEDULE OF INVESTMENTS – (continued)
August 31, 2018
MONEY MARKET FUNDS — 3.41% | | Shares | | | Fair Value | |
Morgan Stanley Institutional Liquidity Funds Treasury Securities Portfolio, Institutional Class, 1.84%(c) | | | 1,000,382 | | | $ | 1,000,382 | |
Total Money Market Funds (Cost $1,000,382) | | | | | | | 1,000,382 | |
Total Investments — 99.45% (Cost $25,944,947) | | | | | | | 29,169,003 | |
Other Assets in Excess of Liabilities — 0.55% | | | | | | | 160,437 | |
NET ASSETS — 100.00% | | | | | | $ | 29,329,440 | |
| (a) | Master Limited Partnership |
| (b) | Business Development Company |
| (c) | Rate disclosed is the seven day effective yield as of August 31, 2018. |
ADR – American Depositary Receipt
REIT – Real Estate Investment Trust
The sectors shown on the schedule of investments are based on the Global Industry Classification Standard, or GICS® (“GICS”). The GICS was developed by and/or is the exclusive property of MSCI, Inc. and Standard & Poor's Financial Services LLC (“S&P”). GICS is a service mark of MSCI, Inc. and S&P and has been licensed for use by Ultimus Fund Solutions, LLC.
See accompanying notes which are an integral part of these financial statements.
19
MERITAGE FUNDS
STATEMENTS OF ASSETS AND LIABILITIES
August 31, 2018
| | | Meritage Growth
Equity Fund | | | Meritage Value
Equity Fund | | | Meritage Yield-
Focus Equity Fund | |
Assets | | | | | | | | | | | | |
Investments in securities at value (cost $22,327,314, $14,773,324 and $25,944,947) | | $ | 30,491,227 | | | $ | 18,074,357 | | | $ | 29,169,003 | |
Receivable for fund shares sold | | | 238,699 | | | | 59,950 | | | | — | |
Dividends receivable | | | 27,237 | | | | 25,584 | | | | 143,710 | |
Tax reclaims receivable | | | 952 | | | | — | | | | 18,071 | |
Prepaid Trustee | | | 3,823 | | | | 3,823 | | | | 3,823 | |
Prepaid expenses | | | 24,492 | | | | 11,603 | | | | 30,760 | |
Total Assets | | | 30,786,430 | | | | 18,175,317 | | | | 29,365,367 | |
| | | | | | | | | | | | | |
Liabilities | | | | | | | | | | | | |
Payable for investments purchased | | | 40,972 | | | | — | | | | — | |
Payable to Adviser | | | 6,229 | | | | 1,253 | | | | 4,886 | |
Accrued 12b-1 fees - Investor class | | | 125 | | | | — | | | | 281 | |
Payable to Administrator | | | 7,768 | | | | 4,954 | | | | 7,904 | |
Payable to audit and tax | | | 20,950 | | | | 20,950 | | | | 20,950 | |
Other accrued expenses | | | 2,439 | | | | 2,752 | | | | 1,906 | |
Total Liabilities | | | 78,483 | | | | 29,909 | | | | 35,927 | |
Net Assets | | $ | 30,707,947 | | | $ | 18,145,408 | | | $ | 29,329,440 | |
| | | | | | | | | | | | | |
Net Assets consist of: | | | | | | | | | | | | |
Paid-in capital | | | 20,768,029 | | | | 14,000,234 | | | | 28,802,642 | |
Accumulated undistributed net investment income (loss) | | | — | | | | 106,308 | | | | 93,498 | |
Accumulated undistributed net realized gain (loss) from investment transactions and foreign currency translations | | | 1,776,005 | | | | 737,836 | | | | (2,790,756 | ) |
Net unrealized appreciation on investments | | | 8,163,913 | | | | 3,301,030 | | | | 3,224,056 | |
Net Assets | | $ | 30,707,947 | | | $ | 18,145,408 | | | $ | 29,329,440 | |
| | | | | | | | | | | | | |
Net Assets: Institutional Class | | $ | 30,388,047 | | | $ | 18,145,408 | | | $ | 28,669,672 | |
Shares outstanding (unlimited number of shares authorized, no par value) | | | 1,820,785 | | | | 1,323,956 | | | | 2,538,651 | |
Net asset value, offering and redemption price per share | | $ | 16.69 | | | $ | 13.71 | | | $ | 11.29 | |
| | | | | | | | | | | | | |
Net Assets: Investor Class | | $ | 319,900 | | | | | | | $ | 659,768 | |
Shares outstanding (unlimited number of shares authorized, no par value) | | | 19,348 | | | | | | | | 57,854 | |
Net asset value, offering and redemption price per share | | $ | 16.53 | | | | | | | $ | 11.40 | |
See accompanying notes which are an integral part of these financial statements.
20
MERITAGE FUNDS
STATEMENTS OF OPERATIONS
For the year ended August 31, 2018
| | | Meritage Growth
Equity Fund | | | Meritage Value
Equity Fund | | | Meritage Yield-
Focus Equity Fund | |
Investment Income | | | | | | | | | | | | |
Dividend income (net of foreign taxes withheld of $1,295, $8,521 and $30,731) | | $ | 229,606 | | | $ | 281,570 | | | $ | 1,177,802 | |
Total investment income | | | 229,606 | | | | 281,570 | | | | 1,177,802 | |
| | | | | | | | | | | | | |
Expenses | | | | | | | | | | | | |
Investment Adviser | | | 200,685 | | | | 128,548 | | | | 209,119 | |
Administration | | | 42,255 | | | | 26,847 | | | | 43,591 | |
Fund accounting | | | 28,042 | | | | 17,995 | | | | 29,060 | |
Audit and tax preparation | | | 22,840 | | | | 22,840 | | | | 23,100 | |
Transfer agent | | | 22,433 | | | | 14,318 | | | | 23,442 | |
Registration | | | 13,487 | | | | 12,935 | | | | 31,105 | |
Legal | | | 12,666 | | | | 12,666 | | | | 15,966 | |
Report printing | | | 7,104 | | | | 4,750 | | | | 7,207 | |
Trustee | | | 6,600 | | | | 6,600 | | | | 6,600 | |
Custodian | | | 4,287 | | | | 3,750 | | | | 4,455 | |
Insurance | | | 3,898 | | | | 3,701 | | | | 4,584 | |
Pricing | | | 2,202 | | | | 2,260 | | | | 2,695 | |
12b-1 fees- Investor class | | | 733 | | | | — | | | | 1,675 | |
Other | | | 15,805 | | | | 12,435 | | | | 18,705 | |
Total expenses | | | 383,037 | | | | 269,645 | | | | 421,304 | |
Fees contractually waived by Adviser | | | (114,614 | ) | | | (98,202 | ) | | | (140,740 | ) |
Net operating expenses | | | 268,423 | | | | 171,443 | | | | 280,564 | |
Net investment income (loss) | | | (38,817 | ) | | | 110,127 | | | | 897,238 | |
| | | | | | | | | | | | | |
Net Realized and Change in Unrealized Gain (Loss) on Investments | | | | | | | | | | | | |
Net realized gain on investment securities transactions | | | 1,955,602 | | | | 1,227,815 | | | | 2,208,744 | |
Net realized gain (loss) on foreign currency translations | | | — | | | | (139 | ) | | | 495 | |
Net change in unrealized appreciation of investment securities | | | 3,925,755 | | | | 395,681 | | | | 155,018 | |
Net realized and change in unrealized gain on investments | | | 5,881,357 | | | | 1,623,357 | | | | 2,364,257 | |
Net increase in net assets resulting from operations | | $ | 5,842,540 | | | $ | 1,733,484 | | | $ | 3,261,495 | |
See accompanying notes which are an integral part of these financial statements.
21
MERITAGE GROWTH EQUITY FUND
STATEMENTS OF CHANGES IN NET ASSETS
| | | For the Year Ended
August 31, 2018 | | | For the Year Ended
August 31, 2017 | |
Increase (Decrease) in Net Assets due to: | | | | | | | | |
Operations | | | | | | | | |
Net investment income (loss) | | $ | (38,817 | ) | | $ | 23,986 | |
Net realized gain on investment securities transactions | | | 1,955,602 | | | | 1,852,658 | |
Net change in unrealized appreciation (depreciation) of investment securities | | | 3,925,755 | | | | 1,792,047 | |
Net increase in net assets resulting from operations | | | 5,842,540 | | | | 3,668,691 | |
| | | | | | | | | |
Distributions From: | | | | | | | | |
Net investment income - Institutional Class | | | (10,776 | ) | | | (44,491 | ) |
Net realized gains - Institutional Class | | | (1,718,576 | ) | | | (171,541 | ) |
Net realized gains - Investor Class | | | (18,215 | ) | | | (1,047 | ) |
Total distributions | | | (1,747,567 | ) | | | (217,079 | ) |
| | | | | | | | | |
Capital Transactions - Institutional Class | | | | | | | | |
Proceeds from shares sold | | | 3,425,215 | | | | 4,352,696 | |
Reinvestment of distributions | | | 1,671,004 | | | | 208,934 | |
Amount paid for shares redeemed | | | (2,296,869 | ) | | | (1,928,779 | ) |
Total Institutional Class | | | 2,799,350 | | | | 2,632,851 | |
| | | | | | | | | |
Capital Transactions - Investor Class | | | | | | | | |
Proceeds from shares sold | | | 78,167 | | | | 211,276 | |
Reinvestment of distributions | | | 17,846 | | | | 1,047 | |
Amount paid for shares redeemed | | | (96,358 | ) | | | (328,967 | ) |
Total Investor Class | | | (345 | ) | | | (116,644 | ) |
Net increase in net assets resulting from capital transactions | | | 2,799,005 | | | | 2,516,207 | |
Total Increase in Net Assets | | | 6,893,978 | | | | 5,967,819 | |
| | | | | | | | | |
Net Assets | | | | | | | | |
Beginning of year | | | 23,813,969 | | | | 17,846,150 | |
End of year | | $ | 30,707,947 | | | $ | 23,813,969 | |
Accumulated undistributed net investment income (loss) | | $ | — | | | $ | 10,347 | |
| | | | | | | | | |
Share Transactions - Institutional Class | | | | | | | | |
Shares sold | | | 223,405 | | | | 327,228 | |
Shares issued in reinvestment of distributions | | | 114,374 | | | | 16,822 | |
Shares redeemed | | | (152,438 | ) | | | (152,144 | ) |
Total Institutional Class | | | 185,341 | | | | 191,906 | |
| | | | | | | | | |
Share Transactions - Investor Class | | | | | | | | |
Shares sold | | | 5,158 | | | | 15,392 | |
Shares issued in reinvestment of distributions | | | 1,231 | | | | 85 | |
Shares redeemed | | | (6,382 | ) | | | (26,638 | ) |
Total Investor Class | | | 7 | | | | (11,161 | ) |
Net increase in shares outstanding | | | 185,348 | | | | 180,745 | |
See accompanying notes which are an integral part of these financial statements.
22
MERITAGE VALUE EQUITY FUND
STATEMENTS OF CHANGES IN NET ASSETS
| | | For the Year Ended
August 31, 2018 | | | For the Year Ended
August 31, 2017 | |
Increase (Decrease) in Net Assets due to: | | | | | | | | |
Operations | | | | | | | | |
Net investment income | | $ | 110,127 | | | $ | 92,024 | |
Net realized gain on investment securities transactions and foreign currency translations | | | 1,227,676 | | | | 140,802 | |
Net change in unrealized appreciation (depreciation) of investment securities | | | 395,681 | | | | 1,534,876 | |
Net increase in net assets resulting from operations | | | 1,733,484 | | | | 1,767,702 | |
| | | | | | | | | |
Distributions From: | | | | | | | | |
Net investment income - Institutional Class | | | (90,492 | ) | | | (115,272 | ) |
Net investment income - Investor Class(a) | | | — | | | | (67 | ) |
Total distributions | | | (90,492 | ) | | | (115,339 | ) |
| | | | | | | | | |
Capital Transactions - Institutional Class | | | | | | | | |
Proceeds from shares sold | | | 2,010,899 | | | | 2,914,903 | |
Reinvestment of distributions | | | 88,422 | | | | 113,051 | |
Amount paid for shares redeemed | | | (1,613,843 | ) | | | (2,517,719 | ) |
Total Institutional Class | | | 485,478 | | | | 510,235 | |
| | | | | | | | | |
Capital Transactions - Investor Class(a) | | | | | | | | |
Proceeds from shares sold | | | — | | | | 922 | |
Reinvestment of distributions | | | — | | | | 67 | |
Amount paid for shares redeemed | | | — | | | | (11,012 | ) |
Total Investor Class | | | — | | | | (10,023 | ) |
Net increase in net assets resulting from capital transactions | | | 485,478 | | | | 500,212 | |
Total Increase in Net Assets | | | 2,128,470 | | | | 2,152,575 | |
| | | | | | | | | |
Net Assets | | | | | | | | |
Beginning of year | | | 16,016,938 | | | | 13,864,363 | |
End of year | | $ | 18,145,408 | | | $ | 16,016,938 | |
Accumulated undistributed net investment income | | $ | 106,308 | | | $ | 90,491 | |
| | | | | | | | | |
Share Transactions - Institutional Class | | | | | | | | |
Shares sold | | | 152,256 | | | | 247,653 | |
Shares issued in reinvestment of distributions | | | 6,594 | | | | 9,729 | |
Shares redeemed | | | (121,701 | ) | | | (222,567 | ) |
Total Institutional Class | | | 37,149 | | | | 34,815 | |
| | | | | | | | | |
Share Transactions - Investor Class(a) | | | | | | | | |
Shares issued in reinvestment of distributions | | | — | | | | 6 | |
Shares redeemed | | | — | | | | (946 | ) |
Total Investor Class | | | — | | | | (940 | ) |
Net increase in shares outstanding | | | 37,149 | | | | 33,875 | |
| (a) | Meritage Value Equity Fund – Investor Class liquidated on February 3, 2017. |
See accompanying notes which are an integral part of these financial statements.
23
MERITAGE YIELD-FOCUS EQUITY FUND
STATEMENTS OF CHANGES IN NET ASSETS
| | | For the Year Ended
August 31, 2018 | | | For the Year Ended
August 31, 2017 | |
Increase (Decrease) in Net Assets due to: | | | | | | | | |
Operations | | | | | | | | |
Net investment income | | $ | 897,238 | | | $ | 1,113,120 | |
Net realized gain on investment securities transactions and foreign currency translations | | | 2,209,239 | | | | 1,746,129 | |
Net change in unrealized appreciation (depreciation) of investment securities | | | 155,018 | | | | (239,221 | ) |
Net increase in net assets resulting from operations | | | 3,261,495 | | | | 2,620,028 | |
| | | | | | | | | |
Distributions From: | | | | | | | | |
Net investment income - Institutional Class | | | (960,330 | ) | | | (925,897 | ) |
Net investment income - Investor Class | | | (22,119 | ) | | | (141,974 | ) |
Total distributions | | | (982,449 | ) | | | (1,067,871 | ) |
| | | | | | | | | |
Capital Transactions - Institutional Class | | | | | | | | |
Proceeds from shares sold | | | 2,137,663 | | | | 2,700,387 | |
Reinvestment of distributions | | | 922,386 | | | | 877,453 | |
Amount paid for shares redeemed | | | (2,717,314 | ) | | | (7,887,178 | ) |
Total Institutional Class | | | 342,735 | | | | (4,309,338 | ) |
| | | | | | | | | |
Capital Transactions - Investor Class | | | | | | | | |
Proceeds from shares sold | | | 93,361 | | | | 565,477 | |
Reinvestment of distributions | | | 20,316 | | | | 136,022 | |
Amount paid for shares redeemed | | | (153,647 | ) | | | (11,250,540 | ) |
Total Investor Class | | | (39,970 | ) | | | (10,549,041 | ) |
Net increase (decrease) in net assets resulting from capital transactions | | | 302,765 | | | | (14,858,379 | ) |
Total Increase (Decrease) in Net Assets | | | 2,581,811 | | | | (13,306,222 | ) |
| | | | | | | | | |
Net Assets | | | | | | | | |
Beginning of year | | | 26,747,629 | | | | 40,053,851 | |
End of year | | $ | 29,329,440 | | | $ | 26,747,629 | |
Accumulated undistributed net investment income | | $ | 93,498 | | | $ | 82,891 | |
| | | | | | | | | |
Share Transactions - Institutional Class | | | | | | | | |
Shares sold | | | 196,426 | | | | 264,568 | |
Shares issued in reinvestment of distributions | | | 85,974 | | | | 86,151 | |
Shares redeemed | | | (251,925 | ) | | | (775,089 | ) |
Total Institutional Class | | | 30,475 | | | | (424,370 | ) |
| | | | | | | | | |
Share Transactions - Investor Class | | | | | | | | |
Shares sold | | | 8,525 | | | | 56,078 | |
Shares issued in reinvestment of distributions | | | 1,873 | | | | 13,555 | |
Shares redeemed | | | (13,904 | ) | | | (1,081,302 | ) |
Total Investor Class | | | (3,506 | ) | | | (1,011,669 | ) |
Net increase (decrease) in shares outstanding | | | 26,969 | | | | (1,436,039 | ) |
See accompanying notes which are an integral part of these financial statements.
24
MERITAGE GROWTH EQUITY FUND – INSTITUTIONAL CLASS
FINANCIAL HIGHLIGHTS
(For a share outstanding during each period)
| | | For the
Year Ended
August 31,
2018 | | | For the
Year Ended
August 31,
2017 | | | For the
Year Ended
August 31,
2016 | | | For the
Year Ended
August 31,
2015 | | | For the
Period Ended
August 31,
2014(a) | |
Selected Per Share Data: | | | | | | | | | | | | | | | | | | | | |
Net asset value, beginning of period | | $ | 14.39 | | | $ | 12.11 | | | $ | 11.20 | | | $ | 10.95 | | | $ | 10.00 | |
Investment operations: | | | | | | | | | | | | | | | | | | | | |
Net investment income (loss) | | | (0.02 | ) | | | 0.02 | | | | 0.03 | | | | 0.01 | | | | 0.01 | |
Net realized and unrealized gain on investments | | | 3.36 | | | | 2.41 | | | | 1.12 | | | | 0.36 | | | | 0.94 | |
Total from investment operations | | | 3.34 | | | | 2.43 | | | | 1.15 | | | | 0.37 | | | | 0.95 | |
| | | | | | | | | | | | | | | | | | | | | |
Less distributions to shareholders: | | | | | | | | | | | | | | | | | | | | |
From net investment income | | | (0.01 | ) | | | (0.03 | ) | | | (0.01 | ) | | | (0.01 | ) | | | — | |
From net realized gains | | | (1.03 | ) | | | (0.12 | ) | | | (0.23 | ) | | | (0.11 | ) | | | — | |
Total distributions | | | (1.04 | ) | | | (0.15 | ) | | | (0.24 | ) | | | (0.12 | ) | | | — | |
Net asset value, end of period | | $ | 16.69 | | | $ | 14.39 | | | $ | 12.11 | | | $ | 11.20 | | | $ | 10.95 | |
| | | | | | | | | | | | | | | | | | | | | |
Total Return (b) | | | 24.18 | % | | | 20.27 | % | | | 10.41 | % | | | 3.38 | % | | | 9.50 | %(c) |
| | | | | | | | | | | | | | | | | | | | | |
Ratios and Supplemental Data: | | | | | | | | | | | | | | | | | | | | |
Net assets, end of period (000 omitted) | | $ | 30,388 | | | $ | 23,537 | | | $ | 17,479 | | | $ | 13,331 | | | $ | 10,642 | |
Ratio of net expenses to average net assets | | | 1.00 | % | | | 1.00 | % | | | 1.00 | % | | | 1.00 | % | | | 1.00 | %(d) |
Ratio of expenses to average net assets before waiver | | | 1.43 | % | | | 1.55 | % | | | 1.60 | % | | | 1.66 | % | | | 3.49 | %(d) |
Ratio of net investment income (loss) to average net assets | | | (0.14 | )% | | | 0.12 | % | | | 0.24 | % | | | 0.08 | % | | | 0.22 | %(d) |
Portfolio turnover rate (e) | | | 74 | % | | | 82 | % | | | 73 | % | | | 84 | % | | | 94 | %(c) |
| (a) | For the period December 23, 2013 (commencement of operations) to August 31, 2014. |
| (b) | Total return in the above table represents the rate that the investor would have earned or lost on an investment in the Fund, assuming reinvestment of dividends. |
| (e) | Portfolio turnover is calculated on the basis on the Fund as a whole without distinguishing among the classes of shares. |
See accompanying notes which are an integral part of these financial statements.
25
MERITAGE GROWTH EQUITY FUND – INVESTOR CLASS
FINANCIAL HIGHLIGHTS
(For a share outstanding during each period)
| | | For the
Year Ended
August 31,
2018 | | | For the
Year Ended
August 31,
2017 | | | For the
Year Ended
August 31,
2016 | | | For the
Year Ended
August 31,
2015 | | | For the
Period Ended
August 31,
2014(a) | |
Selected Per Share Data: | | | | | | | | | | | | | | | | | | | | |
Net asset value, beginning of period | | $ | 14.30 | | | $ | 12.03 | | | $ | 11.15 | | | $ | 10.92 | | | $ | 10.00 | |
Investment operations: | | | | | | | | | | | | | | | | | | | | |
Net investment income (loss) | | | (0.06 | ) | | | — | (b) | | | — | (b) | | | (0.02 | ) | | | — | (b) |
Net realized and unrealized gain on investments | | | 3.32 | | | | 2.39 | | | | 1.11 | | | | 0.37 | | | | 0.92 | |
Total from investment operations | | | 3.26 | | | | 2.39 | | | | 1.11 | | | | 0.35 | | | | 0.92 | |
| | | | | | | | | | | | | | | | | | | | | |
Less distributions to shareholders: | | | | | | | | | | | | | | | | | | | | |
From net investment income | | | — | | | | — | | | | — | | | | (0.01 | ) | | | — | |
From net realized gains | | | (1.03 | ) | | | (0.12 | ) | | | (0.23 | ) | | | (0.11 | ) | | | — | |
Total distributions | | | (1.03 | ) | | | (0.12 | ) | | | (0.23 | ) | | | (0.12 | ) | | | — | |
Net asset value, end of period | | $ | 16.53 | | | $ | 14.30 | | | $ | 12.03 | | | $ | 11.15 | | | $ | 10.92 | |
| | | | | | | | | | | | | | | | | | | | | |
Total Return (c) | | | 23.78 | % | | | 20.02 | % | | | 10.13 | % | | | 3.17 | % | | | 9.20 | %(d) |
| | | | | | | | | | | | | | | | | | | | | |
Ratios and Supplemental Data: | | | | | | | | | | | | | | | | | | | | |
Net assets, end of period (000 omitted) | | $ | 320 | | | $ | 276 | | | $ | 367 | | | $ | 164 | | | $ | 136 | |
Ratio of net expenses to average net assets | | | 1.25 | % | | | 1.25 | % | | | 1.25 | % | | | 1.25 | % | | | 1.25 | %(e) |
Ratio of expenses to average net assets before waiver | | | 1.68 | % | | | 1.80 | % | | | 1.85 | % | | | 1.91 | % | | | 3.32 | %(e) |
Ratio of net investment income (loss) to average net assets | | | (0.39 | )% | | | (0.10 | )% | | | (0.01 | )% | | | (0.17 | )% | | | 0.01 | %(e) |
Portfolio turnover rate (f) | | | 74 | % | | | 82 | % | | | 73 | % | | | 84 | % | | | 94 | %(d) |
| (a) | For the period December 23, 2013 (commencement of operations) to August 31, 2014. |
| (b) | Amount is less than $0.01. |
| (c) | Total return in the above table represents the rate that the investor would have earned or lost on an investment in the Fund, assuming reinvestment of dividends. |
| (f) | Portfolio turnover is calculated on the basis on the Fund as a whole without distinguishing among the classes of shares. |
See accompanying notes which are an integral part of these financial statements.
26
MERITAGE VALUE EQUITY FUND – INSTITUTIONAL CLASS
FINANCIAL HIGHLIGHTS
(For a share outstanding during each period)
| | | For the
Year Ended
August 31,
2018 | | | For the
Year Ended
August 31,
2017 | | | For the
Year Ended
August 31,
2016 | | | For the
Year Ended
August 31,
2015 | | | For the
Period Ended
August 31,
2014(a) | |
Selected Per Share Data: | | | | | | | | | | | | | | | | | | | | |
Net asset value, beginning of period | | $ | 12.45 | | | $ | 11.07 | | | $ | 11.00 | | | $ | 11.00 | | | $ | 10.00 | |
Investment operations: | | | | | | | | | | | | | | | | | | | | |
Net investment income | | | 0.08 | | | | 0.07 | | | | 0.08 | | | | 0.10 | | | | 0.04 | |
Net realized and unrealized gain on investments | | | 1.25 | | | | 1.41 | | | | 0.12 | | | | 0.01 | (b) | | | 0.96 | |
Total from investment operations | | | 1.33 | | | | 1.48 | | | | 0.20 | | | | 0.11 | | | | 1.00 | |
| | | | | | | | | | | | | | | | | | | | | |
Less distributions to shareholders: | | | | | | | | | | | | | | | | | | | | |
From net investment income | | | (0.07 | ) | | | (0.10 | ) | | | (0.09 | ) | | | (0.04 | ) | | | — | |
From net realized gains | | | — | | | | — | | | | (0.04 | ) | | | (0.07 | ) | | | — | |
Total distributions | | | (0.07 | ) | | | (0.10 | ) | | | (0.13 | ) | | | (0.11 | ) | | | — | |
Net asset value, end of period | | $ | 13.71 | | | $ | 12.45 | | | $ | 11.07 | | | $ | 11.00 | | | $ | 11.00 | |
| | | | | | | | | | | | | | | | | | | | | |
Total Return (c) | | | 10.70 | % | | | 13.41 | % | | | 1.85 | % | | | 0.94 | % | | | 10.00 | %(d) |
| | | | | | | | | | | | | | | | | | | | | |
Ratios and Supplemental Data: | | | | | | | | | | | | | | | | | | | | |
Net assets, end of period (000 omitted) | | $ | 18,145 | | | $ | 16,017 | | | $ | 13,854 | | | $ | 11,321 | | | $ | 9,673 | |
Ratio of net expenses to average net assets | | | 1.00 | % | | | 1.00 | % | | | 1.00 | % | | | 1.00 | % | | | 1.00 | %(e) |
Ratio of expenses to average net assets before waiver | | | 1.57 | % | | | 1.69 | % | | | 1.67 | % | | | 1.66 | % | | | 3.58 | %(e) |
Ratio of net investment income to average net assets | | | 0.64 | % | | | 0.60 | % | | | 0.89 | % | | | 0.96 | % | | | 0.86 | %(e) |
Portfolio turnover rate (f) | | | 88 | % | | | 81 | % | | | 67 | % | | | 62 | % | | | 50 | %(d) |
| (a) | For the period December 23, 2013 (commencement of operations) to August 31, 2014. |
| (b) | The amount shown for a share outstanding throughout the period does not accord with the aggregate gains and losses in the portfolio securities during the period because of the timing of sales and purchases of fund shares in relation to fluctuating market values during the period. |
| (c) | Total return in the above table represents the rate that the investor would have earned or lost on an investment in the Fund, assuming reinvestment of dividends. |
| (f) | Portfolio turnover is calculated on the basis on the Fund as a whole without distinguishing among the classes of shares. |
See accompanying notes which are an integral part of these financial statements.
27
MERITAGE YIELD-FOCUS EQUITY FUND – INSTITUTIONAL CLASS
FINANCIAL HIGHLIGHTS
(For a share outstanding during each period)
| | | For the
Year Ended
August 31,
2018 | | | For the
Year Ended
August 31,
2017 | | | For the
Year Ended
August 31,
2016 | | | For the
Year Ended
August 31,
2015 | | | For the
Period Ended
August 31,
2014(a) | |
Selected Per Share Data: | | | | | | | | | | | | | | | | | | | | |
Net asset value, beginning of period | | $ | 10.41 | | | $ | 10.00 | | | $ | 9.44 | | | $ | 11.27 | | | $ | 10.00 | |
Investment operations: | | | | | | | | | | | | | | | | | | | | |
Net investment income | | | 0.35 | | | | 0.37 | | | | 0.32 | | | | 0.33 | | | | 0.10 | |
Net realized and unrealized gain (loss) on investments | | | 0.92 | | | | 0.40 | | | | 0.56 | | | | (1.71 | ) | | | 1.17 | |
Total from investment operations | | | 1.27 | | | | 0.77 | | | | 0.88 | | | | (1.38 | ) | | | 1.27 | |
| | | | | | | | | | | | | | | | | | | | | |
Less distributions to shareholders: | | | | | | | | | | | | | | | | | | | | |
From net investment income | | | (0.39 | ) | | | (0.36 | ) | | | (0.32 | ) | | | (0.41 | ) | | | — | |
From net realized gains | | | — | | | | — | | | | — | | | | (0.03 | ) | | | — | |
From return of capital | | | — | | | | — | | | | — | | | | (0.01 | ) | | | — | |
Total distributions | | | (0.39 | ) | | | (0.36 | ) | | | (0.32 | ) | | | (0.45 | ) | | | — | |
Net asset value, end of period | | $ | 11.29 | | | $ | 10.41 | | | $ | 10.00 | | | $ | 9.44 | | | $ | 11.27 | |
| | | | | | | | | | | | | | | | | | | | | |
Total Return (b) | | | 12.40 | % | | | 7.79 | % | | | 9.58 | % | | | (12.56 | )% | | | 12.70 | %(c) |
| | | | | | | | | | | | | | | | | | | | | |
Ratios and Supplemental Data: | | | | | | | | | | | | | | | | | | | | |
Net assets, end of period (000 omitted) | | $ | 28,670 | | | $ | 26,103 | | | $ | 29,340 | | | $ | 28,316 | | | $ | 26,436 | |
Ratio of net expenses to average net assets | | | 1.00 | % | | | 1.00 | % | | | 1.00 | % | | | 1.00 | % | | | 1.00 | %(d) |
Ratio of expenses to average net assets before waiver | | | 1.50 | % | | | 1.48 | % | | | 1.49 | % | | | 1.44 | % | | | 2.62 | %(d) |
Ratio of net investment income to average net assets | | | 3.22 | % | | | 3.49 | % | | | 3.41 | % | | | 3.17 | % | | | 2.70 | %(d) |
Portfolio turnover rate (e) | | | 73 | % | | | 60 | % | | | 99 | % | | | 86 | % | | | 63 | %(c) |
| (a) | For the period December 23, 2013 (commencement of operations) to August 31, 2014. |
| (b) | Total return in the above table represents the rate that the investor would have earned or lost on an investment in the Fund, assuming reinvestment of dividends. |
| (e) | Portfolio turnover is calculated on the basis on the Fund as a whole without distinguishing among the classes of shares. |
See accompanying notes which are an integral part of these financial statements.
28
MERITAGE YIELD-FOCUS EQUITY FUND – INVESTOR CLASS
FINANCIAL HIGHLIGHTS
(For a share outstanding during each period)
| | | For the
Year Ended
August 31,
2018 | | | For the
Year Ended
August 31,
2017 | | | For the
Year Ended
August 31,
2016 | | | For the
Year Ended
August 31,
2015 | | | For the
Period Ended
August 31,
2014(a) | |
Selected Per Share Data: | | | | | | | | | | | | | | | | | | | | |
Net asset value, beginning of period | | $ | 10.51 | | | $ | 9.98 | | | $ | 9.42 | | | $ | 11.25 | | | $ | 10.00 | |
Investment operations: | | | | | | | | | | | | | | | | | | | | |
Net investment income | | | 0.33 | | | | 0.32 | (b) | | | 0.32 | | | | 0.29 | | | | 0.01 | |
Net realized and unrealized gain (loss) on investments | | | 0.92 | | | | 0.46 | | | | 0.54 | | | | (1.70 | ) | | | 1.24 | |
Total from investment operations | | | 1.25 | | | | 0.78 | | | | 0.86 | | | | (1.41 | ) | | | 1.25 | |
| | | | | | | | | | | | | | | | | | | | | |
Less distributions to shareholders: | | | | | | | | | | | | | | | | | | | | |
From net investment income | | | (0.36 | ) | | | (0.25 | ) | | | (0.30 | ) | | | (0.38 | ) | | | — | |
From net realized gains | | | — | | | | — | | | | — | | | | (0.03 | ) | | | — | |
From return of capital | | | — | | | | — | | | | — | | | | (0.01 | ) | | | — | |
Total distributions | | | (0.36 | ) | | | (0.25 | ) | | | (0.30 | ) | | | (0.42 | ) | | | — | |
Net asset value, end of period | | $ | 11.40 | | | $ | 10.51 | | | $ | 9.98 | | | $ | 9.42 | | | $ | 11.25 | |
| | | | | | | | | | | | | | | | | | | | | |
Total Return (c) | | | 12.09 | % | | | 7.93 | % | | | 9.35 | % | | | (12.85 | )% | | | 12.50 | %(d) |
| | | | | | | | | | | | | | | | | | | | | |
Ratios and Supplemental Data: | | | | | | | | | | | | | | | | | | | | |
Net assets, end of period (000 omitted) | | $ | 660 | | | $ | 644 | | | $ | 10,714 | | | $ | 10,708 | | | $ | 2,627 | |
Ratio of net expenses to average net assets | | | 1.25 | % | | | 1.25 | % | | | 1.25 | % | | | 1.25 | % | | | 1.25 | %(e) |
Ratio of expenses to average net assets before waiver | | | 1.75 | % | | | 1.73 | % | | | 1.74 | % | | | 1.69 | % | | | 2.46 | %(e) |
Ratio of net investment income to average net assets | | | 2.97 | % | | | 3.18 | % | | | 3.17 | % | | | 2.84 | % | | | 2.26 | %(e) |
Portfolio turnover rate (f) | | | 73 | % | | | 60 | % | | | 99 | % | | | 86 | % | | | 63 | %(d) |
| (a) | For the period December 23, 2013 (commencement of operations) to August 31, 2014. |
| (b) | Calculated using the average shares method. |
| (c) | Total return in the above table represents the rate that the investor would have earned or lost on an investment in the Fund, assuming reinvestment of dividends. |
| (f) | Portfolio turnover is calculated on the basis on the Fund as a whole without distinguishing among the classes of shares. |
See accompanying notes which are an integral part of these financial statements.
29
MERITAGE FUNDS
NOTES TO THE FINANCIAL STATEMENTS
August 31, 2018
NOTE 1. ORGANIZATION
The Meritage Growth Equity Fund (the “Growth Equity Fund”), the Meritage Value Equity Fund (the “Value Equity Fund”), and the Meritage Yield-Focus Equity Fund (the “Yield-Focus Equity Fund”) (each a “Fund” and, collectively the “Funds”) were organized as a diversified series of the Capitol Series Trust (the “Trust”). The Trust is an open-end investment company established under the laws of Ohio by an Agreement and Declaration of Trust dated September 18, 2013 (the “Trust Agreement”). The Trust Agreement permits the Trust’s Board of Trustees (the “Board”) to issue an unlimited number of shares of beneficial interest of separate series without par value. The Growth Equity and Yield-Focus Equity Funds each offer two share classes, Institutional Class Shares and Investor Class Shares. As disclosed in a prospectus supplement dated February 15, 2017, the Value Equity Fund discontinued the sale of its Investor Shares, and continues to offer Institutional Shares. The Funds commenced operations on December 23, 2013. The Funds’ investment adviser is Meritage Portfolio Management, Inc. (the “Adviser”). The investment objective of the Growth Equity Fund is to seek growth of capital. The investment objective of the Value Equity Fund is to seek growth of capital. Income is a secondary objective for the Value Equity Fund. The investment objective of the Yield-Focus Equity Fund is to seek long-term growth of capital with an emphasis on high current income.
Each Fund’s prospectus provides a description of the investment objective, policies and strategies, along with information on the classes of shares currently being offered.
NOTE 2. SIGNIFICANT ACCOUNTING POLICIES
The Funds are investment companies and follow accounting and reporting guidance under Financial Accounting Standards Board Accounting Standards Codification (“ASC”) Topic 946, “Financial Services-Investment Companies”. The following is a summary of significant accounting policies consistently followed by each Fund in the preparation of its financial statements. These policies are in conformity with generally accepted accounting principles in the United States of America (“GAAP”).
Estimates – The preparation of financial statements in conformity with GAAP requires management to make estimates and assumptions that affect the reported amounts of assets and liabilities and disclosure of contingent assets and liabilities at the date of the financial statements and the reported amounts of increases and decreases in net assets from operations during the reporting period. Actual results could differ from those estimates.
Securities Valuation – All investments in securities are recorded at their estimated fair value as described in Note 3.
Foreign Currency Translation – The accounting records of the Funds are maintained in U.S. dollars. Foreign currency amounts are translated into U.S. dollars at the current rate of exchange each business day to determine the value of investments, and other assets and liabilities. Purchases and sales of foreign securities, and income and expenses, are translated at the prevailing rate of exchange on the respective date of these transactions. The Fund does not isolate that portion of the results of operations resulting from changes in foreign exchange rates on investments from fluctuation arising from changes in market prices of securities held. These fluctuations are included with the net realized and unrealized gain or loss from investments.
Federal Income Taxes – The Funds make no provision for federal income or excise tax. Each Fund has qualified and intends to qualify each year as a regulated investment company (“RIC”) under subchapter M of the Internal Revenue Code of 1986, as amended, by complying with the requirements applicable to RICs and by distributing substantially all of its taxable income. Each Fund also intends to distribute sufficient net investment income and net capital gains, if any, so that it will not be subject to excise tax on undistributed income and gains. If the required amount of net investment income or gains is not distributed, the Funds could incur a tax expense.
30
MERITAGE FUNDS
NOTES TO THE FINANCIAL STATEMENTS – (continued)
August 31, 2018
NOTE 2. SIGNIFICANT ACCOUNTING POLICIES – continued
The Funds may be subject to taxes imposed by countries in which it invests. Such taxes are generally based on income and/or capital gains earned or repatriated. Taxes are accrued and applied to net investment income, net realized gains and unrealized appreciation as such income and/or gains are earned.
The Funds recognize tax benefits or expenses of uncertain tax positions only when the position is “more likely than not” to be sustained assuming examination by tax authorities. Management of the Funds has reviewed tax positions taken in tax years that remain subject to examination by all major tax jurisdictions, including federal (i.e., the previous three tax year ends and the interim tax period since then, as applicable) and has concluded that no provision for unrecognized tax benefits or expenses is required in these financial statements and does not expect this to change over the next twelve months. The Funds recognize interest and penalties, if any, related to unrecognized tax benefits as income tax expense in the Statement of Operations. During the year, the Funds did not incur any interest or penalties.
Expenses – Expenses incurred by the Trust that do not relate to a specific fund of the Trust are allocated to the individual funds based on each Fund’s relative net assets or another appropriate basis (as determined by the Board). Expenses attributable to any class are borne by that class. Income, realized gains and losses, unrealized appreciation and depreciation, and expenses are allocated to each class based on the net assets in relation to the relative net assets of the Fund.
Security Transactions and Related Income – Throughout the reporting period, security transactions are accounted for no later than one business day following the trade date. For financial reporting purposes, security transactions are accounted for on trade date on the last business day of the reporting period. The specific identification method is used for determining gains or losses for financial statements and income tax purposes. Dividend income is recorded on the ex-dividend date and interest income is recorded on an accrual basis. Dividend income from real estate investment trusts (REITs) and distributions from limited partnerships are recognized on the ex-date and included in dividend income. The calendar year-end classification of distributions received from REITs during the fiscal year are reported subsequent to year end; accordingly, the Fund estimates the character of REIT distributions based on the most recent information available. Income or loss from limited partnerships is reclassified among the components of net assets upon receipt of K-1’s. Discounts and premiums on fixed income securities purchased are amortized over the life of the respective securities or accreted using the effective interest method.
Dividends and Distributions – Each Fund intends to distribute substantially all of its net investment income, if any, as dividends to its shareholders on at least an annual basis, except for Yield-Focus Fund which will normally distribute dividends on a quarterly basis. Each Fund intends to distribute its net realized long term capital gains and its net realized short term capital gains, if any, at least once a year. Dividends to shareholders, which are determined in accordance with income tax regulations, are recorded on the ex-dividend date. The treatment for financial reporting purposes of distributions made to shareholders during the period from net investment income or net realized capital gains may differ from their ultimate treatment for federal income tax purposes. These differences are caused primarily by differences in the timing of the recognition of certain components of income, expense or realized capital gains for federal income tax purposes. Where such differences are permanent in nature, they are reclassified in the components of the net assets based on their ultimate characterization for federal income tax purposes. Any such reclassifications will have no effects on net assets, results of operations or net asset values per share of the Funds.
31
MERITAGE FUNDS
NOTES TO THE FINANCIAL STATEMENTS – (continued)
August 31, 2018
NOTE 2. SIGNIFICANT ACCOUNTING POLICIES – continued
For the year ended August 31, 2018, the Funds made the following reclassifications to increase (decrease) the components of net assets, which were due to return of capital distributions from underlying investments, dispositions of complex securities, net operating losses and nondeductible expenses:
| | | Paid-In Capital | | | Accumulated
Undistributed
Net Investment
Income (Loss) | | | Accumulated
Net Realized
Gain (Loss)
from
Investments | |
Growth Equity Fund | | $ | — | | | $ | 39,246 | | | $ | (39,246 | ) |
Value Equity Fund | | | — | | | | (3,818 | ) | | | 3,818 | |
Yield-Focus Equity Fund | | | (8,077 | ) | | | 95,818 | | | | (87,741 | ) |
NOTE 3. SECURITIES VALUATION AND FAIR VALUE MEASUREMENTS
Fair value is defined as the price that a Fund would receive upon selling an investment in an orderly transaction to an independent buyer in the principal or most advantageous market of the investment. GAAP established a three-tier hierarchy to maximize the use of observable market data and minimize the use of unobservable inputs and to establish classification of fair value measurements for disclosure purposes.
Inputs refer broadly to the assumptions that market participants would use in pricing the asset or liability. Inputs may be observable or unobservable. Observable inputs are inputs that reflect the assumptions market participants would use in pricing the asset or liability developed based on market data obtained from sources independent of the reporting entity. Unobservable inputs are inputs that reflect the reporting entity’s own assumptions about the assumptions market participants would use in pricing the asset or liability developed based on the best information available in the circumstances.
Various inputs are used in determining the value of each Fund’s investments. These inputs are summarized in the three broad levels listed below.
| | ● | Level 1 – unadjusted quoted prices in active markets for identical investments and/or registered investment companies where the value per share is determined and published and is the basis for current transactions for identical assets or liabilities at the valuation date |
| | ● | Level 2 – other significant observable inputs (including, but not limited to, quoted prices for an identical security in an inactive market, quoted prices for similar securities, interest rates, prepayment speeds, credit risk, etc.) |
| | ● | Level 3 – significant unobservable inputs (including the Funds’ own assumptions in determining fair value of investments based on the best information available) |
The inputs used to measure fair value may fall into different levels of the fair value hierarchy. In such cases, for disclosure purposes, the level in the fair value hierarchy within which the fair value measurement falls in its entirety, is determined based on the lowest level input that is significant to the fair value measurement in its entirety.
32
MERITAGE FUNDS
NOTES TO THE FINANCIAL STATEMENTS – (continued)
August 31, 2018
NOTE 3. SECURITIES VALUATION AND FAIR VALUE MEASUREMENTS – continued
In computing the net asset value (‘NAV”) of the Funds, fair value is based on market valuations with respect to portfolio securities for which market quotations are readily available. Pursuant to Board approved policies, the Funds rely on independent third-party pricing services to provide the current market value of securities. Those pricing services value equity securities, including exchange-traded funds and convertible preferred stocks, traded on a securities exchange at the last reported sales price on the principal exchange. Equity securities quoted by NASDAQ are valued at the NASDAQ Official Closing Price. If there is no reported sale on the principal exchange, equity securities are valued at the mean between the most recent quoted bid and asked price. When using the market quotations or close prices provided by the pricing service and when the market is considered active, the security will be classified as a Level 1 security. Investments in open-end mutual funds, including money market mutual funds, are generally priced at the ending NAV provided by the pricing service of the funds and are generally categorized as Level 1 securities. Debt securities are valued using evaluated prices furnished by a pricing vendor selected by the Board and are generally classified as Level 2 securities.
In the event that market quotations are not readily available, the Adviser determines that the market quotation or the price provided by the pricing service does not accurately reflect the current fair value, or certain restricted or illiquid securities are being valued, such securities are valued as determined in good faith by the Trust’s Valuation Committee, based on recommendations from a pricing committee comprised of various officers of the Trust, various employees of the Fund’s administrator, and representatives of the Adviser (together the “Pricing Review Committee”). These securities will be classified as Level 2 or 3 within the fair value hierarchy, depending on the inputs used.
In accordance with the Trust’s Valuation Procedures, the Pricing Review Committee in making its recommendations is required to consider all appropriate factors relevant to the value of securities for which it has determined other pricing sources are not available or reliable as described above. No single standard exists for determining fair value, because fair value depends upon the circumstances of each individual case. As a general principle, the current fair value of an issue of securities being valued pursuant to the Trust’s Fair Valuation Procedures would be the amount which the Funds might reasonably expect to receive for them upon their current sale. Methods which are in accordance with this principle may, for example, be based on (i) a multiple of earnings; (ii) a discount from market prices of a similar freely traded security (including a derivative security or a basket of securities traded on other markets, exchanges or among dealers); or (iii) yield to maturity with respect to debt issues, or a combination of these and other methods. Fair value pricing is permitted if, in accordance with the Trust’s Valuation Procedures, the validity of market quotations appears to be questionable based on factors such as evidence of a thin market in the security based on a small number of quotations, a significant event occurs after the close of a market but before each Fund’s NAV calculation that may affect a security’s value, or other data calls into question the reliability of market quotations.
The following is a summary of the inputs used to value the Funds’ investments as of August 31, 2018:
| | | Valuation Inputs | |
| | | Level 1 | | | Level 2 | | | Level 3 | | | Total | |
Growth Equity Fund | | | | | | | | | | | | | | | | |
Common Stocks | | $ | 28,731,106 | | | $ | — | | | $ | — | | | $ | 28,731,106 | |
Exchange-Traded Funds | | | 992,654 | | | | — | | | | — | | | | 992,654 | |
Money Market Funds | | | 767,467 | | | | — | | | | — | | | | 767,467 | |
Total | | $ | 30,491,227 | | | $ | — | | | $ | — | | | $ | 30,491,227 | |
33
MERITAGE FUNDS
NOTES TO THE FINANCIAL STATEMENTS – (continued)
August 31, 2018
NOTE 3. SECURITIES VALUATION AND FAIR VALUE MEASUREMENTS – continued
| | | Valuation Inputs | |
| | | Level 1 | | | Level 2 | | | Level 3 | | | Total | |
Value Equity Fund | | | | | | | | | | | | | | | | |
Common Stocks | | $ | 16,446,996 | | | $ | — | | | $ | — | | | $ | 16,446,996 | |
Exchange-Traded Funds | | | 1,447,859 | | | | — | | | | — | | | | 1,447,859 | |
Money Market Funds | | | 179,502 | | | | — | | | | — | | | | 179,502 | |
Total | | $ | 18,074,357 | | | $ | — | | | $ | — | | | $ | 18,074,357 | |
| | | | | | | | | | | | | | | | | |
Yield-Focus Equity Fund | | | | | | | | | | | | | | | | |
Common Stocks | | $ | 26,584,652 | | | $ | 343,080 | | | $ | — | | | $ | 26,927,732 | |
Convertible Preferred Stocks | | | — | | | | 1,240,889 | | | | — | | | | 1,240,889 | |
Money Market Funds | | | 1,000,382 | | | | — | | | | — | | | | 1,000,382 | |
Total | | $ | 27,585,034 | | | $ | 1,583,969 | | | $ | — | | | $ | 29,169,003 | |
The Funds did not hold any investments at any time during the reporting period in which significant unobservable inputs were used in determining fair value; therefore, no reconciliation of Level 3 securities is included for this reporting period. The Funds did not hold any derivative instruments during the reporting period.
The Trust recognizes transfers between fair value hierarchy levels at the end of the reporting period. Transfers from Level 1 to Level 2 represent securities which were valued using unadjusted close prices at the beginning of the period but close prices were not available at August 31, 2018. The opposite holds true for transfers from Level 2 to Level 1. The following is a summary of the transfer between Level 1 and Level 2 of the fair value hierarchy as of August 31, 2018 based on input levels assigned at August 31, 2017 for Yield-Focus Equity Fund:
| | | Transfers from
Level 1 to
Level 2 | | | Transfers from
Level 2 to
Level 1 | |
Common Stocks | | $ | 343,080 | | | $ | — | |
Convertible Preferred Stocks | | | 868,425 | | | | — | |
NOTE 4. FEES AND OTHER TRANSACTIONS WITH AFFILIATES
Under the terms of the management agreement, on behalf of the Funds (the “Agreement”), the Adviser manages each Fund’s investments subject to approval of the Board. As compensation for its management services, each Fund is obligated to pay the Adviser a fee computed and accrued daily and paid monthly at an annual rate of 0.75% of the average daily net assets of each Fund. For the fiscal year ended August 31, 2018, the Adviser earned fees of $200,685 from the Growth Equity Fund, $128,548 from the Value Equity Fund and $209,119 from the Yield-Focus Equity Fund before the waiver/reimbursement described below. At August 31, 2018, the Growth Equity Fund owed the Adviser $6,229, the Value Equity Fund owed the Adviser $1,253 and the Yield-Focus Fund owed the Adviser $4,886.
The Adviser has contractually agreed to waive its management fee and/or reimburse expenses so that total annual operating expenses (excluding (i) interest; (ii) taxes; (iii) brokerage fees and commissions; (iv) other extraordinary expenses not incurred in the ordinary course of the Fund’s business; (v) dividend expenses on short sales; (vi) expenses incurred under a Rule 12b-1 plan of distribution; and (vii) indirect expenses such as acquired fund
34
MERITAGE FUNDS
NOTES TO THE FINANCIAL STATEMENTS – (continued)
August 31, 2018
NOTE 4. FEES AND OTHER TRANSACTIONS WITH AFFILIATES – continued
fees and expenses) do not exceed 1.00% of each Fund’s average daily net assets through December 31, 2019 (“Expense Limitation”). During any fiscal year that the Investment Advisory Agreement between the Adviser and the Trust is in effect, the Adviser may recoup the sum of all fees previously waived or expenses reimbursed, less any reimbursement previously paid, provided that the Adviser is only permitted to recoup fees or expenses within 36 months from the date the fee waiver or expense reimbursement took effect and provided further that such recoupment can be achieved within the Expense Limitation Agreement currently in effect and the Expense Limitation Agreement in place when the waiver/reimbursement occurred. This Expense Limitation Agreement may be terminated by the Board at any time.
As of August 31, 2018, the Adviser may seek repayment of investment advisory fee waivers and expense reimbursements up to the amounts of $319,175, $285,604 and $479,620 from the Growth Equity Fund, Value Equity Fund and Yield-Focus Equity Fund, respectively, no later than August 31, 2021.
The Trust retains Ultimus Asset Services, LLC (the “Administrator”) to provide the Funds with non-investment related administration and compliance, fund accounting and transfer agent services. For the year ended August 31, 2018, fees incurred for administration, fund accounting and transfer agent services, and the amounts due to the Administrator at August 31, 2018 were as follows:
| | | Growth
Equity Fund | | | Value
Equity Fund | | | Yield-Focus
Equity Fund | |
Administration | | $ | 42,255 | | | $ | 26,847 | | | $ | 43,591 | |
Fund Accounting | | | 28,042 | | | | 17,995 | | | | 29,060 | |
Transfer Agent | | | 22,433 | | | | 14,318 | | | | 23,442 | |
Payable to Administrator | | | 7,768 | | | | 4,954 | | | | 7,904 | |
The Board supervises the business activities of the Trust. Each Trustee serves as a Trustee for the lifetime of the Trust or until the earlier of his or her retirement as a Trustee at age 78 (which may be extended for up to two years in an emeritus non-voting capacity at the pleasure and request of the Board), or until he/she dies, resigns, or is removed, whichever is sooner. “Independent Trustees,” meaning those Trustees who are not “interested persons” as defined in the Investment Company Act of 1940 (“1940 Act”) of the Trust, each receives an annual retainer of $500 per Fund and $500 per Fund for each quarterly in-person Board meeting. In addition, the Trust reimburses Trustees for out-of-pocket expense incurred in conjunction with attendance at Board meetings.
Prior to July 1, 2018, each Trustee received $20,000 annual compensation from the Trust. Prior to January 1, 2018, each Trustee received $15,000 annual compensation from the Trust. Each Committee Chairperson received an additional annual compensation of $1,000 from the Trust, and Independent Trustees also received $1,000 for attending each special in-person meeting and up to $1,000 for attending special telephonic meetings, depending on the length of the telephonic meeting.
The officers and one Trustee of the Trust are employees of the Administrator. Unified Financial Securities, LLC (the “Distributor”) acts as the principal distributor of the Fund’s shares. Both the Administrator and the Distributor operate as wholly-owned subsidiaries of Ultimus Fund Solutions, LLC.
The Funds have adopted a Distribution Plan (the “Plan”) pursuant to Rule 12b-1 under the 1940 Act. The Plan provides that the Funds will pay the Distributor and/or any registered securities dealer, financial institution or any other person (the “Recipient”) a fee of 0.25% of the average daily net assets of each Fund’s Investor Shares in connection with the promotion and distribution of each Fund’s Investor Shares or the provision of personal services
35
MERITAGE FUNDS
NOTES TO THE FINANCIAL STATEMENTS – (continued)
August 31, 2018
NOTE 4. FEES AND OTHER TRANSACTIONS WITH AFFILIATES – continued
to shareholders, including, but not necessarily limited to, advertising, compensation to underwriters, dealers and selling personnel, the printing and mailing of prospectuses to other than current shareholders of Investor Shares, the printing and mailing of sales literature and servicing shareholder accounts (“12b-1 Expense”). The Funds or Distributor may pay all or a portion of these fees to any Recipient who renders assistance in distributing or promoting the sale of shares, or who provides certain shareholder services, pursuant to a written agreement. The Plan is a compensation plan, which means that compensation is provided regardless of 12b-1 expenses actually incurred. For the year ended August 31, 2018, Investor Shares 12b-1 expense incurred by the Growth Equity Fund was $733 and $1,675 for the Yield-Focus Equity Fund. At August 31, 2018, the Distributor was owed $125 by the Growth Equity Fund and $281 for the Yield Focus Equity Fund for Investor Shares 12b-1 expenses.
NOTE 5. PURCHASES AND SALES OF SECURITIES
For the year ended August 31, 2018, purchases and sales of investment securities, excluding short-term securities were as follows:
Fund | | Purchases | | | Sales | |
Growth Equity Fund | | $ | 20,533,467 | | | $ | 18,929,482 | |
Value Equity Fund | | | 15,141,702 | | | | 14,574,428 | |
Yield-Focus Equity Fund | | | 19,773,076 | | | | 19,994,217 | |
There were no purchases or sales of long-term U.S. government obligations during the fiscal year ended August 31, 2018.
NOTE 6. FEDERAL TAX INFORMATION
At August 31, 2018, the net unrealized appreciation (depreciation) of investments for tax purposes was as follows:
| | | Tax Cost of
Securities | | | Unrealized
Appreciation | | | Unrealized
Depreciation | | | Net
Unrealized
Appreciation/
(Depreciation) | |
Growth Equity Fund | | $ | 22,342,789 | | | $ | 8,339,942 | | | $ | (191,504 | ) | | $ | 8,148,438 | |
Value Equity Fund | | | 14,794,618 | | | | 3,374,994 | | | | (95,258 | ) | | | 3,279,736 | |
Yield-Focus Equity Fund | | | 26,086,198 | | | | 3,657,986 | | | | (575,181 | ) | | | 3,082,805 | |
The tax character of distributions paid during the year ended August 31, 2018 and 2017, were as follows:
2018
| | | Ordinary
Income | | | Net
Long-Term
Capital Gains | | | Return of
Capital | | | Total
Distributions
Paid | |
Growth Equity Fund | | $ | 22,259 | | | $ | 1,725,308 | | | $ | — | | | $ | 1,747,567 | |
Value Equity Fund | | | 90,492 | | | | — | | | | — | | | | 90,492 | |
Yield-Focus Equity Fund | | | 982,449 | | | | — | | | | — | | | | 982,449 | |
36
MERITAGE FUNDS
NOTES TO THE FINANCIAL STATEMENTS – (continued)
August 31, 2018
NOTE 6. FEDERAL TAX INFORMATION – continued
2017
| | | Ordinary
Income | | | Net
Long-Term
Capital Gains | | | Return of
Capital | | | Total
Distributions
Paid | |
Growth Equity Fund | | $ | 44,491 | | | $ | 172,588 | | | $ | — | | | $ | 217,079 | |
Value Equity Fund | | | 115,339 | | | | — | | | | — | | | | 115,339 | |
Yield-Focus Equity Fund | | | 1,067,872 | | | | — | | | | — | | | | 1,067,872 | |
At August 31, 2018, the components of distributable earnings (accumulated losses) on a tax basis were as follows:
2018
| | | Ordinary
Income | | | Undistributed
Long-Term
Capital Gains | | | Accumulated
Capital and
Other Losses | | | Unrealized
Appreciation
(Depreciation) | | | Total
Accumulated
Earnings
(Losses) | |
Growth Equity Fund | | $ | 143,008 | | | $ | 1,648,472 | | | $ | — | | | $ | 8,148,438 | | | $ | 9,939,918 | |
Value Equity Fund | | | 106,308 | | | | 759,130 | | | | — | | | | 3,279,736 | | | | 4,145,174 | |
Yield-Focus Equity Fund | | | 93,498 | | | | — | | | | (2,649,508 | ) | | | 3,082,805 | | | | 526,795 | |
The difference between book basis and tax basis unrealized appreciation is primarily attributable to the tax deferral of wash losses, return of capital adjustments, interest accruals on trust preferred securities and mark-to-market of passive foreign investment companies.
As of August 31, 2018, the Yield-Focus Equity Fund had available for tax purposes an unused capital loss carryforward of $2,649,508 of short-term capital losses with no expiration, which was available to offset against future taxable net capital gains. To the extent that these carryforwards are used to offset future gains, it is probable that the amount offset will not be distributed to shareholders. During the fiscal year ended August 31, 2018, the Value Equity Fund and Yield-Focus Equity Fund, respectively, utilized $450,714 and $4,735,987 in available capital loss carryforwards.
NOTE 7. COMMITMENTS AND CONTINGENCIES
The Funds indemnify their officers and trustees for certain liabilities that may arise from the performance of their duties to the Funds. Additionally, in the normal course of business, the Funds enter into contracts that contain a variety of representations and warranties which provide general indemnifications. The Funds’ maximum exposure under these arrangements is unknown, as this would involve future claims that may be made against the Funds that have not yet occurred.
NOTE 8. SUBSEQUENT EVENTS
Management has evaluated events or transactions from August 31, 2018 through the date these financial statements were issued that would merit recognition or disclosure in the financial statements. There were no subsequent events to report that would have a material impact in the Funds’ financial statements.
37
MERITAGE FUNDS
NOTES TO THE FINANCIAL STATEMENTS – (continued)
August 31, 2018
NOTE 9. SHAREHOLDER MEETING RESULTS (Unaudited)
On June 19, 2018, a special meeting of shareholders of the Trust was held for the purpose of voting on the election of four Trustees to serve on the Board of Trustees. Below are the voting results from the special meeting.
| | For | Withhold | % of Total Voted in Favor |
| John C. Davis | 35,759,555 | 385,270 | 98.93% |
| Janet S. Meeks | 35,772,739 | 372,086 | 98.97% |
| Lori A. Kaiser | 35,775,501 | 369,324 | 98.98% |
| Robert G. Dorsey | 35,597,330 | 547,495 | 98.49% |
The shareholders voted in favor of the proposal to approve four Trustees to serve on the Board of Trustees. Mr. Davis, Ms. Meeks and Ms. Kaiser were each elected as Independent Trustees and began their service to the Trust effective July 1, 2018. Mr. Dorsey was elected as Interested Trustee at the meeting.
38
REPORT OF INDEPENDENT REGISTERED PUBLIC ACCOUNTING FIRM
To the Shareholders and the Board of Trustees of Meritage Growth Equity Fund, Meritage Value Equity Fund, and Meritage Yield-Focus Equity Fund
Opinion on the Financial Statements
We have audited the accompanying statements of assets and liabilities of Meritage Growth Equity Fund, Meritage Value Equity Fund, and Meritage Yield-Focus Equity Fund (collectively referred to as the “Funds”) (three of the funds constituting Capitol Series Trust (the “Trust”)), including the schedules of investments, as of August 31, 2018, and the related statements of operations for the year then ended, the statements of changes in net assets for each of the two years in the period then ended, the financial highlights for each of the two years in the period then ended and the related notes (collectively referred to as the “financial statements”). In our opinion, the financial statements present fairly, in all material respects, the financial position of the Funds (three of the funds constituting Capitol Series Trust) at August 31, 2018, the results of their operations for the year then ended, the changes in their net assets for each of the two years in the period then ended and their financial highlights for each of the two years in the period then ended, in conformity with U.S. generally accepted accounting principles.
The financial highlights for the period from December 23, 2013 (commencement of operations) to August 31, 2014, the year ended August 31, 2015 and the year ended August 31, 2016 were audited by other auditors whose report dated October 26, 2016, expressed an unqualified opinion on those financial highlights.
Basis for Opinion
These financial statements are the responsibility of the Trust’s management. Our responsibility is to express an opinion on each of the Funds’ financial statements based on our audits. We are a public accounting firm registered with the Public Company Accounting Oversight Board (United States) (PCAOB) and are required to be independent with respect to the Trust in accordance with the U.S. federal securities laws and the applicable rules and regulations of the Securities and Exchange Commission and the PCAOB.
We conducted our audits in accordance with the standards of the PCAOB. Those standards require that we plan and perform the audit to obtain reasonable assurance about whether the financial statements are free of material misstatement, whether due to error or fraud. The Trust is not required to have, nor were we engaged to perform, an audit of Trust’s internal control over financial reporting. As part of our audits we are required to obtain an understanding of internal control over financial reporting but not for the purpose of expressing an opinion on the effectiveness of the Trust’s internal control over financial reporting. Accordingly, we express no such opinion.
Our audits included performing procedures to assess the risks of material misstatement of the financial statements, whether due to error or fraud, and performing procedures that respond to those risks. Such procedures included examining, on a test basis, evidence regarding the amounts and disclosures in the financial statements. Our procedures included confirmation of securities owned as of August 31, 2018, by correspondence with the custodian and brokers or by other appropriate auditing procedures where replies from brokers were not received. Our audits also included evaluating the accounting principles used and significant estimates made by management, as well as evaluating the overall presentation of the financial statements. We believe that our audits provide a reasonable basis for our opinion.

We have served as the auditor of one or more Capitol Series Trust investment companies since 2017.
Grandview Heights, Ohio
October 25, 2018
39
SUMMARY OF FUND EXPENSES – (Unaudited)
As a shareholder of a Fund, you incur ongoing costs, including management fees and other Fund expenses. This Example is intended to help you understand your ongoing costs (in dollars) of investing in the Fund and to compare these costs with the ongoing costs of investing in other mutual funds. The Example is based on an investment of $1,000 invested at the beginning of the period, and held for the entire period from March 1, 2018 to August 31, 2018.
Actual Expenses
The first line of the table below provides information about actual account values and actual expenses. You may use the information in this line, together with the amount you invested, to estimate the expenses that you paid over the period. Simply divide your account value by $1,000 (for example, an $8,600 account value divided by $1,000 = $8.60), then multiply the result by the number in the first line under the heading entitled “Expenses Paid During the Period” to estimate the expenses you paid on your account during this period.
Hypothetical Example for Comparison Purposes
The second line of the table below provides information about hypothetical account values and hypothetical expenses based on the Fund’s actual expense ratio and an assumed rate of return of 5% per year before expenses, which is not the Fund’s actual return. The hypothetical account values and expenses may not be used to estimate the actual ending account balance or expenses you paid for the period. You may use this information to compare the ongoing costs of investing in the Fund and other funds. To do so, compare this 5% hypothetical example with the 5% hypothetical examples that appear in the shareholder reports of the other funds.
Please note that the expenses shown in the table are meant to highlight your ongoing costs only. Therefore, the second line of the table below is useful in comparing ongoing costs only and will not help you determine the relative costs of owning different funds.
| | Beginning
Account Value
March 1, 2018 | Ending
Account Value
August 31, 2018 | Expenses
Paid During
Period* | Annualized
Expense
Ratio |
Meritage Growth Equity Fund
Institutional Class | | | | |
Actual | $ 1,000.00 | $ 1,108.20 | $ 5.31 | 1.00% |
Hypothetical** | $ 1,000.00 | $ 1,020.16 | $ 5.09 | 1.00% |
Investor Class | | | | |
Actual | $ 1,000.00 | $ 1,106.40 | $ 6.64 | 1.25% |
Hypothetical** | $ 1,000.00 | $ 1,018.90 | $ 6.36 | 1.25% |
Meritage Value Equity Fund
Institutional Class | | | | |
Actual | $ 1,000.00 | $ 1,047.40 | $ 5.16 | 1.00% |
Hypothetical** | $ 1,000.00 | $ 1,020.16 | $ 5.09 | 1.00% |
Meritage Yield-Focus Equity Fund
Institutional Class | | | | |
Actual | $ 1,000.00 | $ 1,079.40 | $ 5.24 | 1.00% |
Hypothetical** | $ 1,000.00 | $ 1,020.16 | $ 5.09 | 1.00% |
Investor Class | | | | |
Actual | $ 1,000.00 | $ 1,078.20 | $ 6.55 | 1.25% |
Hypothetical** | $ 1,000.00 | $ 1,018.90 | $ 6.36 | 1.25% |
| * | Expenses are equal to the Fund’s annualized expense ratio multiplied by the average account value over the period, multiplied by 184/365. |
| ** | Assumes 5% return before expenses. |
40
TRUSTEES AND OFFICERS – (Unaudited)
The Board supervises the business activities of the Trust and is responsible for protecting the interests of shareholders. The Chairman of the Board is Walter B. Grimm, who is an Independent Trustee of the Trust.
Each Trustee serves as a Trustee for the lifetime of the Trust or until the earlier of his or her retirement as a Trustee at age 78, death, resignation or removal. Officers are re-elected annually by the Board. The address of each Trustee and officer is 225 Pictoria Drive, Suite 450, Cincinnati, Ohio 45246.
As of the date of this report, the Trustees oversee the operations of 10 series.
Interested Trustee Background. The following table provides information regarding the Interested Trustee.
Name, Address, (Age), Position with Trust,
Term of Position with Trust | Principal Occupation During Past 5 Years
and Other Directorships |
Robert G. Dorsey*
Age: 61 TRUSTEE Began Serving: March 2017 | Principal Occupation(s): Managing Director and Co-Chief Executive Officer of Ultimus Fund Solutions, LLC and its subsidiaries, except as otherwise noted for the FINRA-regulated broker-dealer entities (1999 to present); Interested Trustee of Ultimus Managers Trust (February 2012 to present). Previous Position(s): President of Ultimus Fund Distributors, LLC (1999 to 2018); President of Ultimus Managers Trust (February 2012 to October 2013). |
| * | Mr. Dorsey is considered an “interested person” of the Trust within the meaning of Section 2(a)(19) of the 1940 Act because of his relationship with the Trust’s administrator, transfer agent, and distributors. |
Independent Trustee Background. The following table provides information regarding the Independent Trustees.
Name, Address, (Age), Position with Trust,
Term of Position with Trust | Principal Occupation During Past 5 Years
and Other Directorships |
John C. Davis Age: 66 TRUSTEE Began Serving: July 2018 | Principal Occupations(s): Consultant (government services) since May 2011. Consultant, Board of Trustees of Ultimus Managers Trust (since 2016). Previous Position(s): Retired Partner of PricewaterhouseCoopers LLP (1974-2010); Former Trustee of Ultimus Managers Trust (2012-2016). |
Walter B. Grimm Age: 73 TRUSTEE AND CHAIR Began Serving: November 2013 | Principal Occupations(s): President, Leigh Management Group, LLC (consulting firm) (October 2005 to present); and President, Leigh Investments, Inc. (1988 to present); Board member, Boys & Girls Club of Coachella Valley (April 2018 to present); Board member, Axxia Pharmaceutical (January 2015 to present). Previous Position(s): Chief Financial Officer, East West Private, LLC (consulting firm) (2009 to 2013). |
41
TRUSTEES AND OFFICERS – (Unaudited) (continued)
Name, Address, (Age), Position with Trust,
Term of Position with Trust | Principal Occupation During Past 5 Years
and Other Directorships |
Lori Kaiser Age: 55 TRUSTEE Began Serving: July 2018 | Principal Occupations(s): Founder and CEO, Kaiser Consulting since 1992. |
Janet Smith Meeks Age: 63 TRUSTEE Began Serving: July 2018 | Principal Occupations(s): Co-Founder and CEO, Healthcare Alignment Advisors, LLC (consulting company) since August 2015. Previous Position(s): President and Chief Operating Officer, Mount Carmel Health System (2004-2015). |
Mary M. Morrow Age: 60 TRUSTEE Began Serving: November 2013 | Principal Occupations(s): Chief Operating Officer, Dignity Health Managed Services Organization (October 2018 to present). Previous Position(s): Independent Consultant (managed care services (April 2018 to October 2018); Chief Operating Officer, Pennsylvania Health and Wellness (fully owned subsidiary of Centene Corporation) (November 2016 to April 2018); Vice President, Strategic Initiatives, Gateway Heath (January 2015 to November 2016); Consulting Practice Manager, DST Health Solutions (August 2010 to January 2015); Director, Service and Client Relations, EBDS (August 2008 – May 2009); Independent Consultant, Healthcare Servicing May 2009 – August 2010). |
42
TRUSTEES AND OFFICERS – (Unaudited) (continued)
Officers. The following table provides information regarding the Officers.
Name, Address, (Age), Position with Trust,
Term of Position with Trust | Principal Occupation During Past 5 Years
and Other Directorships |
Matthew J. Miller Age: 42 PRESIDENT and CHIEF EXECUTIVE OFFICER Began Serving: September 2013 (as VP); September 2018 (as President) | Principal Occupation(s): Assistant Vice President, Relationship Management, Ultimus Fund Solutions, LLC (December 2015 to present); Vice President, Valued Advisers Trust (December 2011 to present). Previous Position(s): Vice President, Capitol Series Trust (September 2013 to March 2017); Chief Executive Officer and President, Capitol Series Trust (March 2017 to March 2018); Secretary, Capitol Series Trust (March 2018 to September 2018); Vice President, Relationship Management, Huntington Asset Services, Inc. (n/k/a Ultimus Asset Services, LLC) (2008 to December 2015); Vice President, The Huntington Funds (February 2010 to April 2015); Vice President, Transfer Agency Operations, Huntington Asset Services, Inc. (2002 to 2008); Employed in various positions with Huntington Asset Services, Inc. (July 1998 to 2002). |
Zachary P. Richmond Age: 38 TREASURER AND CHIEF FINANCIAL OFFICER Began Serving: August 2014 | Principal Occupation(s): Assistant Vice President, Associate Director of Financial Administration, Ultimus Fund Solutions, LLC (December 2015 to present); Treasurer and Chief Financial Officer, Unified Series Trust (August 2014 to present); Treasurer and Chief Financial Officer, Commonwealth International Series Trust (September 2015 to present). Previous Position(s): Assistant Vice President, Fund Administration, Huntington Asset Services, Inc. (n/k/a Ultimus Asset Services, LLC) (January 2011 to December 2015); and Assistant Treasurer, Unified Series Trust (2011 to August 2014). |
Brandon Kipp Age: 35 CHIEF COMPLIANCE OFFICER Began Serving: October 2017 | Principal Occupation(s): Senior Fund Compliance Officer, Ultimus Fund Solutions, LLC (since July 2017) and Chief Compliance Officer, Valued Advisers Trust (since October 2017). Previous Position(s): Assistant Vice President and Compliance Manager, UMB Fund Services, Inc. (March 2014 to July 2017); Officer and Lead Fund Administrator, UMB Fund Services, Inc. (May 2012 to March 2014). |
43
TRUSTEES AND OFFICERS – (Unaudited) (continued)
Name, Address, (Age), Position with Trust,
Term of Position with Trust | Principal Occupation During Past 5 Years
and Other Directorships |
Matthew J. Beck Age: 30 SECRETARY Began Serving: September 2018 | Principal Occupation(s): Senior Attorney, Ultimus Fund Solutions, LLC (since May 2018) and Secretary, Ultimus Managers Trust (since July 2018). Previous Position(s): Chief Compliance Officer, OBP Capital, LLC (May 2015 to May 2018); Secretary, Aspiration Funds (March 2015 to May 2018); Secretary, Starboard Investment Trust (September 2014 to May 2018); Secretary, Leeward Investment Trust (September 2014 to May 2018); Secretary, Hillman Capital Management Investment Trust (September 2014 to May 2018); Secretary, Spinnaker ETF Series (September 2014 to May 2018); Vice President and General Counsel, The Nottingham Company (July 2014 to May 2018). |
Stephen L. Preston Age: 52 ANTI-MONEY LAUNDERING OFFICER Began Serving: December 2016 | Principal Occupation(s): Chief Compliance Officer, Ultimus Fund Solutions, LLC and Ultimus Fund Distributors, LLC from June 2011 to present. |
OTHER INFORMATION (Unaudited)
The Fund’s Statement of Additional Information (“SAI”) includes additional information about the trustees and is available without charge, upon request. You may call toll-free at (855) 261-0104 to request a copy of the SAI or to make shareholder inquiries.
44
OTHER FEDERAL TAX INFORMATION – (Unaudited)
The Form 1099-DIV you receive in January 2019 will show the tax status of all distributions paid to your account in calendar year 2018. Shareholders are advised to consult their own tax advisor with respect to the tax consequences of their investment in the Fund. As required by the Internal Revenue Code and/or regulations, shareholders must be notified regarding the status of qualified dividend income for individuals and the dividends received deduction for corporations.
For the year ended August 31, 2018, the following Funds paid qualified dividend income:
Fund | | Qualified
Dividend
Income | |
Growth Equity Fund | | | 100.00% | |
Value Equity Fund | | | 100.00% | |
Yield-Focus Equity Fund | | | 99.70% | |
For the taxable year ended August 31, 2018, the following percentage of ordinary income dividends paid by the Funds qualify for the dividends received deduction available to corporations:
Fund | | Dividends
Received
Deduction | |
Growth Equity Fund | | | 100.00% | |
Value Equity Fund | | | 100.00% | |
Yield-Focus Equity Fund | | | 79.86% | |
The Funds designate the following amounts as long-term capital gains distributions. The amounts designated may not agree with long term capital gains in the tax character of distribution table due to utilization of earnings and profits distributed to shareholders on redemption of shares.
Fund | | Long Term
Capital Gains
Paid Amount | |
Growth Equity Fund | | $ | 1,725,308 | |
45
FACTS | WHAT DOES CAPITOL SERIES TRUST DO WITH YOUR PERSONAL INFORMATION? |
Why? | Financial companies choose how they share your personal information. Federal law gives consumers the right to limit some but not all sharing. Federal law also requires us to tell you how we collect, share, and protect your personal information. Please read this notice carefully to understand what we do. |
What? | The types of personal information we collect and share depend on the product or service you have with us. This information can include: �� Social Security number ■ account balances and account transactions ■ account transactions, transaction or loss history and purchase history ■ checking account information and wire transfer instructions When you are no longer our customer, we continue to share your information as described in this notice. |
How? | All financial companies need to share customers’ personal information to run their everyday business. In the section below, we list the reasons financial companies can share their customers’ personal information; the reasons Capitol Series Trust chooses to share; and whether you can limit this sharing. |
Reasons we can share your personal information | Does Capitol Series
Trust share? |
For our everyday business purposes—
such as to process your transactions, maintain your account(s), respond to court orders and legal investigations, or report to credit bureaus | Yes |
For our marketing purposes—
to offer our products and services to you | Yes |
For joint marketing with other financial companies | No |
For our affiliates’ everyday business purposes—
information about your transactions and experiences | No |
For our affiliates’ everyday business purposes—
information about your creditworthiness | No |
For nonaffiliates to market to you | No |
Questions? | Call 1-855-261-0104 |
46
| Who we are | |
Who is providing this notice? | Capitol Series Trust |
| What we do | |
How does Capitol Series Trust protect my personal information? | To protect your personal information from unauthorized access and use, we use security measures that comply with federal law. These measures include computer safeguards and secured files and buildings. |
How does Capitol Series Trust collect my personal information? | We collect your personal information, for example, when you ■ open an account or deposit money ■ buy securities from us or sell securities to us ■ make deposits or withdrawals from your account provide account information ■ give us your account information ■ make a wire transfer ■ tell us who receives the money ■ tell us where to send the money ■ show your government-issued ID ■ show your driver’s license |
Why can’t I limit all sharing? | Federal law gives you the right to limit only ■ sharing for affiliates’ everyday business purposes — information about your creditworthiness ■ affiliates from using your information to market to you ■ sharing for nonaffiliates to market to you State laws and individual companies may give you additional rights to limit sharing. |
| Definitions | |
Affiliates | Companies related by common ownership or control. They can be financial and nonfinancial companies. |
Nonaffiliates | Companies not related by common ownership or control. They can be financial and nonfinancial companies. ■ Capitol Series Trust does not share your personal information with nonaffiliates so they can market to you. |
Joint marketing | A formal agreement between nonaffiliated financial companies that together market financial products or services to you. ■ Capitol Series Trust doesn’t jointly market financial products or services to you. |
47
This page intentionally left blank.
This page intentionally left blank.
PROXY VOTING – (Unaudited)
A description of the policies and procedures that the Funds use to determine how to vote proxies relating to portfolio securities and information regarding how each Fund voted those proxies during the most recent twelve month period ended June 30, is available without charge upon request by (1) calling the Funds at (855) 261-0104 and (2) from Funds documents filed with the Securities and Exchange Commission (“SEC”) on the SEC’s website at www.sec.gov.
TRUSTEES Walter B. Grimm, Chairman John C. Davis Robert G. Dorsey Lori Kaiser Janet Smith Meeks Mary M. Morrow OFFICERS Matthew J. Miller, Chief Executive Officer and President Zachary P. Richmond, Treasurer and Chief Financial Officer Brandon R. Kipp, Chief Compliance Officer INVESTMENT ADVISER Meritage Portfolio Management, Inc. 7500 College Boulevard, Suite 1212 Overland Park, KS 66210 DISTRIBUTOR Unified Financial Securities, LLC 9465 Counselors Row, Suite 200 Indianapolis, IN 46240 | INDEPENDENT REGISTERED PUBLIC ACCOUNTING FIRM Ernst & Young LLP 800 Yard Street, Suite 200 Grandview Heights, OH 43212 LEGAL COUNSEL Bernstein Shur 100 Middle Street, 6th Floor Portland, ME 04104 CUSTODIAN Huntington National Bank 41 South High Street Columbus, OH 43215 ADMINISTRATOR, TRANSFER AGENT AND FUND ACCOUNTANT Ultimus Asset Services, LLC 225 Pictoria Drive, Suite 450 Cincinnati, OH 45246 |
This report is intended only for the information of shareholders or those who have received the Funds’ prospectus which contains information about the Funds’ management fee and expenses. Please read the prospectus carefully before investing.
Distributed by Unified Financial Securities, LLC
Member FINRA/SIPC

Preserver Alternative Opportunities Fund
Institutional Shares – PAOIX
Retail Shares – PAORX
Annual Report
August 31, 2018
Preserver Partners, LLC
8700 Trail Lake Drive West, Suite 105
Memphis, Tennessee 38125
(844) 838-2119 or (901) 755-4737
Dear Fellow Shareholders,
We are pleased to present the Annual Report for the Preserver Alternative Opportunities Fund (“Fund”). For the period September 1, 2017 through August 31, 2018, the Fund’s Institutional Class (PAOIX) and Retail Class (PAORX) returned 6.05% and 5.76%, respectively. These returns exceeded the Fund’s primary benchmark, the Wilshire Liquid Alternative Index return of 1.15%, and the Morningstar Multi-Alternative Category Average (a) return of 2.02%, for the same period. For the three months ended August 31, 2018, PAOIX returned 3.90% and PAORX returned 3.83%. These returns also exceeded Wilshire Liquid Alternative Index return of 0.64% and the Morningstar Multi-Alternative Category Average return of 0.81%, for the three months ended August 31, 2018.
The Fund’s outperformance, compared to the category and benchmark, was driven by its domestic equity allocation and current income. The Fund has more exposure to U.S. equities and will likely remain so until there are signs of slowing profit growth and/or an economic recession. The steadily rising U.S. equity market since April masked a big defensive rotation across sectors since late May. The strength in the U.S. dollar has been a headwind to international equities. The modest positive gains in global equity indices are entirely attributable to gains in U.S. equities.
Rising U.S. short-term interest rates contributed to negative returns in fixed coupon bonds and bond-proxy equities such as REITs, preferred stocks and utilities. We are taking a long-term perspective with these securities. In addition, the Fund held short-duration bonds across different fixed income segments. Bond yields, particularly short-term, are beginning to get interesting and will lift the overall attractiveness of related strategies such as closed-end funds, structured credit and preferred securities.
The Fund had a successful year generating attractive risk-adjusted returns and an increase in fund assets. Your long-term investment horizon and confidence in our investment philosophy is essential to the execution of our strategy. We appreciate your continued support.
Sincerely,
Floyd Tyler, Ph.D., CFA
Portfolio Manager
(a) | These funds offer investors exposure to several different alternative investment tactics. Funds in this category have a majority of their assets exposed to alternative strategies. An investor’s exposure to different tactics may change slightly over time in response to market movements. Funds in this category include both funds with static allocation to alternative strategies and funds tactically allocating among alternative strategies and asset classes. The gross short exposure is greater than 20%. |
1
Investment Results (Unaudited)
Average Annual Total Returns(a) as of August 31, 2018
| | One Year | Since
Inception
(3/1/16) |
Preserver Alternative Opportunities Fund | | |
Institutional Shares | 6.05% | 9.73% |
Retail Shares | 5.76% | 9.45% |
Wilshire Liquid Alternative Index (b) | 1.15% | 3.31% |
Bloomberg Barclays U.S. Aggregate Bond Index (b) | -1.05% | 1.23% |
| | Expense Ratios(c) |
| | Institutional
Shares | Retail
Shares |
Gross | 2.32% | 2.57% |
With Applicable Waivers | 2.05% | 2.30% |
The performance quoted represents past performance, which does not guarantee future results. The investment return and principal value of an investment will fluctuate so that an investor’s shares, when redeemed, may be worth more or less than their original cost. The returns shown do not reflect deduction of taxes that a shareholder would pay on Preserver Alternative Opportunities Fund (the “Fund”) distributions or the redemption of Fund shares. Current performance of the Fund may be lower or higher than the performance quoted. The Fund’s investment objectives, risks, charges and expenses must be considered carefully before investing. Performance data current to the most recent month end may be obtained by calling (844) 838-2119.
| (a) | Average annual total returns reflect any change in price per share and assume the reinvestment of all distributions. The Fund’s returns reflect any fee waivers during the applicable period. If such fee waivers had not occurred, the quoted performance would have been lower. |
| (b) | The Wilshire Liquid Alternative Index measures the collective performance of the five Wilshire Liquid Alternative Strategies that make up the Wilshire Liquid Alternative Universe. The Wilshire Liquid Alternative Index is designed to provide a broad measure of the Liquid Alternative Global Macro Index, Wilshire Liquid Alternative Relative Value Index, Wilshire Liquid Alternative Multi-Strategy Index, and Wilshire Liquid Alternative Event driven Index. The Bloomberg Barclays U.S. Aggregate Bond Index (the “Index”) covers the U.S. investment grade fixed rate bond market (measuring bonds with maturities of at least one year), with index components for government and corporate securities, mortgage pass through securities, and asset-backed securities. The Index is an unmanaged benchmark that assumes reinvestment of all distributions and excludes the effect of taxes and fees. Individuals cannot invest directly in this Index; however, an individual can invest in exchange traded funds or other investment vehicles that attempt to track the performance of a benchmark index. |
| (c) | The expense ratios are from the Fund’s prospectus dated December 29, 2017. Preserver Partners, LLC (the “Adviser”), the Fund’s adviser, has contractually agreed to waive its management fee and/or reimburse expenses so that total annual operating expenses (excluding (i) interest; (ii) taxes; (iii) brokerage fees and commissions; (iv) other extraordinary expenses not incurred in the ordinary course of the Fund’s business; (v) dividend expenses on short sales; (vi) expenses incurred under a Rule 12b-1 plan of distribution; and (vii) indirect expenses such as acquired fund fees and expenses) do not exceed 1.75% of the Fund’s average daily net assets through December 31, 2018. This expense cap agreement may be terminated by the Board of Trustees at any time. Additional information pertaining to the Fund’s expense ratios as of August 31, 2018, can be found in the financial highlights. The Institutional and Retail Shares Gross Expense Ratios and Expense Ratios with Applicable Waivers do not correlate to the corresponding ratios of expenses to average net assets included in the financial highlights section of the this annual report, which reflect the operating expenses of the Fund and do not include acquired fund fees and expenses (“AFFE”). |
The Fund’s investment objectives, strategies, risks, charges and expenses must be considered carefully before investing. The prospectus contains this and other important information about the Fund and may be obtained by calling (844) 838-2119. Please read it carefully before investing.
The Fund is distributed by Unified Financial Securities, LLC, member FINRA/SIPC.
2
Investment Results (Unaudited) (continued)
Comparison of the Growth of a $100,000 Investment in the Preserver Alternative
Opportunities Fund - Institutional Shares, Wilshire Liquid Alternative Index and the Bloomberg Barclays U.S. Aggregate Bond Index.
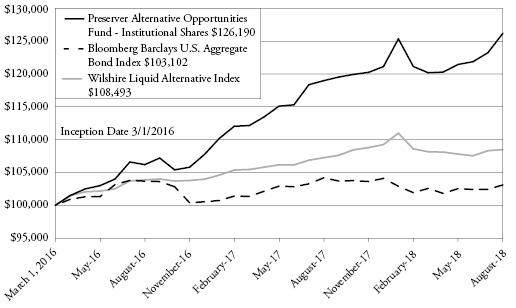
The chart above assumes an initial investment of $100,000 made on March 1, 2016 (commencement of operations) and held through August 31, 2018. THE FUND’S RETURNS REPRESENT PAST PERFORMANCE AND DO NOT GUARANTEE FUTURE RESULTS. The returns shown do not reflect deduction of taxes that a shareholder would pay on the Fund’s distributions or the redemption of the Fund’s shares. Investment returns and principal values will fluctuate so that your shares, when redeemed, may be worth more or less than their original purchase price.
Current performance may be lower or higher than the performance data quoted. For more information on the Fund, and to obtain performance data current to the most recent month-end, or to request a prospectus, please call (844) 838-2119. You should carefully consider the investment objectives, potential risks, management fees, and charges and expenses of the Fund before investing. The Fund’s prospectus contains this and other information about the Fund, and should be read carefully before investing.
The Fund is distributed by Unified Financial Securities, LLC, Member FINRA/SIPC.
3
Portfolio Illustration (Unaudited)
August 31, 2018
The following chart gives a visual breakdown of the Fund’s holdings as a percentage of net assets.
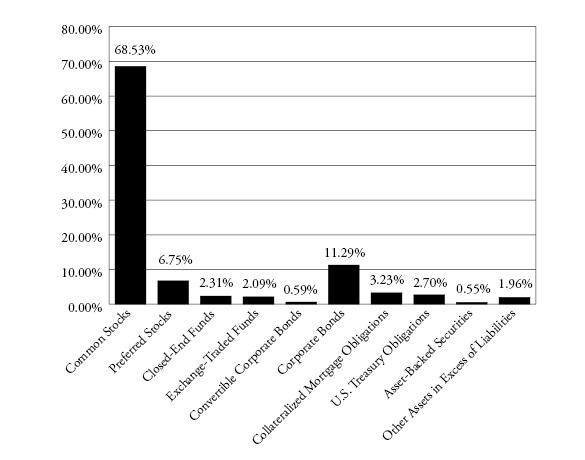
Availability of Portfolio Schedule (Unaudited)
The Fund files its complete schedule of investments with the Securities and Exchange Commission (“SEC”) as of the end of the first and third quarters of each fiscal on Form N-Q. The Fund’s Forms N-Q are available at the SEC’s website at www.sec.gov. The Forms N-Q may be reviewed and copied at the Public Reference Room in Washington DC. Information on the operation of the Public Reference Room may be obtained by calling 1-800-SEC-0330.
4
Preserver Alternative Opportunities Fund
Schedule of Investments
August 31, 2018
Shares | | | | Fair Value | |
COMMON STOCKS — 68.53% | | | | |
| | | | | | | | | |
| | | | | Australia — 2.71% | | | | |
| | | | | Consumer Discretionary — 1.99% | | | | |
| | | 12,000 | | Aristocrat Leisure Ltd. | | $ | 272,485 | |
| | | 5,000 | | Domino's Pizza Enterprises Ltd. | | | 194,436 | |
| | | | | | | | 466,921 | |
| | | | | Industrials — 0.72% | | | | |
| | | 32,339 | | Sydney Airport | | | 167,599 | |
| | | | | Total Australia | | | 634,520 | |
| | | | | | | | | |
| | | | | Canada — 0.84% | | | | |
| | | | | Real Estate — 0.84% | | | | |
| | | 22,660 | | NorthWest Healthcare Properties Real Estate Investment Trust | | | 196,387 | |
| | | | | | | | | |
| | | | | France — 1.33% | | | | |
| | | | | Industrials — 1.33% | | | | |
| | | 2,200 | | Thales SA | | | 309,890 | |
| | | | | | | | | |
| | | | | Germany — 4.54% | | | | |
| | | | | Consumer Discretionary — 1.60% | | | | |
| | | 1,500 | | adidas AG | | | 374,173 | |
| | | | | | | | | |
| | | | | Consumer Staples — 0.86% | | | | |
| | | 1,800 | | Henkel AG & Company KGaA | | | 200,894 | |
| | | | | | | | | |
| | | | | Industrials — 0.76% | | | | |
| | | 2,600 | | KION Group AG | | | 177,518 | |
| | | | | | | | | |
| | | | | Real Estate — 1.32% | | | | |
| | | 6,120 | | Deutsche Wohnen SE | | | 309,303 | |
| | | | | Total Germany | | | 1,061,888 | |
| | | | | | | | | |
| | | | | Ireland — 2.05% | | | | |
| | | | | Health Care — 2.05% | | | | |
| | | 2,500 | | Allergan plc | | | 479,275 | |
| | | | | | | | | |
| | | | | Japan — 4.04% | | | | |
| | | | | Consumer Discretionary — 1.35% | | | | |
| | | 7,200 | | McDonald's Holdings Company Japan Ltd. | | | 316,284 | |
| | | | | | | | | |
| | | | | Information Technology — 1.30% | | | | |
| | | 5,000 | | Amano Corporation | | | 104,555 | |
| | | 350 | | Keyence Corporation | | | 198,141 | |
| | | | | | | | 302,696 | |
| | See accompanying notes which are an integral part of these financial statements. | 5 |
Preserver Alternative Opportunities Fund
Schedule of Investments (continued)
August 31, 2018
Shares | | | | Fair Value | |
COMMON STOCKS — (continued) | | | | |
| | | | | | | | | |
| | | | | Telecommunication Services — 1.39% | | | | |
| | | 3,500 | | SoftBank Group Corporation | | $ | 324,512 | |
| | | | | Total Japan | | | 943,492 | |
| | | | | | | | | |
| | | | | Luxembourg — 1.37% | | | | |
| | | | | Consumer Discretionary — 1.37% | | | | |
| | | 60,000 | | B&M European Value Retail S.A. | | | 320,837 | |
| | | | | | | | | |
| | | | | Mexico — 1.33% | | | | |
| | | | | Industrials — 1.33% | | | | |
| | | 3,000 | | Grupo Aeroportuario del Pacifico SAB de CV - ADR | | | 309,930 | |
| | | | | | | | | |
| | | | | Sweden — 1.10% | | | | |
| | | | | Industrials — 1.10% | | | | |
| | | 15,000 | | Volvo AB, B Shares | | | 258,265 | |
| | | | | | | | | |
| | | | | United Arab Emirates — 1.52% | | | | |
| | | | | Health Care — 1.52% | | | | |
| | | 7,000 | | NMC Health plc | | | 356,071 | |
| | | | | | | | | |
| | | | | United Kingdom — 6.37% | | | | |
| | | | | Consumer Discretionary — 1.06% | | | | |
| | | 3,000 | | WPP plc - ADR | | | 248,400 | |
| | | | | | | | | |
| | | | | Financials — 1.66% | | | | |
| | | 15,000 | | Burford Capital Ltd. | | | 388,504 | |
| | | | | | | | | |
| | | | | Health Care — 1.68% | | | | |
| | | 20,000 | | Abcam plc | | | 393,041 | |
| | | | | | | | | |
| | | | | Industrials — 1.97% | | | | |
| | | 15,000 | | Ashtead Group plc | | | 459,283 | |
| | | | | Total United Kingdom | | | 1,489,228 | |
| | | | | | | | | |
| | | | | United States — 41.33% | | | | |
| | | | | Consumer Discretionary — 4.10% | | | | |
| | | 1,200 | | Churchill Downs, Inc. | | | 339,120 | |
| | | 6,000 | | Norwegian Cruise Line Holdings Ltd.(a) | | | 321,660 | |
| | | 1,000 | | Vail Resorts, Inc. | | | 298,050 | |
| | | | | | | | 958,830 | |
| | | | | Consumer Staples — 1.33% | | | | |
| | | 7,000 | | Coca-Cola Company (The) | | | 311,990 | |
6 | See accompanying notes which are an integral part of these financial statements. | |
Preserver Alternative Opportunities Fund
Schedule of Investments (continued)
August 31, 2018
Shares | | | | Fair Value | |
COMMON STOCKS — (continued) | | | | |
| | | | | | | | | |
| | | | | Energy — 2.08% | | | | |
| | | 17,000 | | Enterprise Products Partners LP (b) (c) | | $ | 486,200 | |
| | | | | | | | | |
| | | | | Financials — 5.66% | | | | |
| | | 2,000 | | Berkshire Hathaway, Inc., Class B (a) (c) | | | 417,440 | |
| | | 7,000 | | Blackstone Group LP (The) | | | 258,370 | |
| | | 5,000 | | Progressive Corporation (The) | | | 337,650 | |
| | | 1,500 | | S&P Global, Inc. | | | 310,575 | |
| | | | | | | | 1,324,035 | |
| | | | | Health Care — 3.20% | | | | |
| | | 2,000 | | Eli Lilly & Company | | | 211,300 | |
| | | 2,000 | | UnitedHealth Group, Inc. | | | 536,920 | |
| | | | | | | | 748,220 | |
| | | | | Industrials — 4.54% | | | | |
| | | 5,000 | | Axon Enterprise, Inc.(a) | | | 341,300 | |
| | | 1,500 | | FedEx Corporation | | | 365,925 | |
| | | 1,000 | | W.W. Grainger, Inc. | | | 354,070 | |
| | | | | | | | 1,061,295 | |
| | | | | Information Technology — 14.48% | | | | |
| | | 2,000 | | Adobe Systems, Inc.(a) | | | 527,019 | |
| | | 400 | | Alphabet, Inc., Class A(a) | | | 492,720 | |
| | | 2,000 | | Apple, Inc. | | | 455,260 | |
| | | 2,000 | | Broadridge Financial Solutions, Inc. | | | 270,280 | |
| | | 2,000 | | Mastercard, Inc., Class A (c) | | | 431,120 | |
| | | 2,500 | | Microsoft Corporation | | | 280,825 | |
| | | 3,500 | | Motorola Solutions, Inc. | | | 449,260 | |
| | | 8,000 | | SS&C Technologies Holdings, Inc. | | | 474,720 | |
| | | | | | | | 3,381,204 | |
| | | | | Real Estate — 4.34% | | | | |
| | | 800 | | Equinix, Inc. | | | 348,904 | |
| | | 11,000 | | HCP, Inc. | | | 297,330 | |
| | | 2,000 | | Simon Property Group, Inc. | | | 366,060 | |
| | | | | | | | 1,012,294 | |
| | | | | Utilities — 1.60% | | | | |
| | | 2,200 | | NextEra Energy, Inc. | | | 374,220 | |
| | | | | Total United States | | | 9,658,288 | |
| | | | | | | | | |
| | | | | Total Common Stocks (Cost $13,943,607) | | | 16,018,071 | |
| | See accompanying notes which are an integral part of these financial statements. | 7 |
Preserver Alternative Opportunities Fund
Schedule of Investments (continued)
August 31, 2018
Shares | | | | Fair Value | |
PREFERRED STOCKS — 6.75% | | | | |
| | | | | | | | | |
| | | | | United States — 6.75% | | | | |
| | | | | Energy — 0.86% | | | | |
| | | 6,000 | | Kinder Morgan, Inc., Series A, 9.75% | | $ | 200,460 | |
| | | | | | | | | |
| | | | | Financials — 3.74% | | | | |
| | | 10,000 | | Invesco Mortgage Capital, Inc., Series A, 7.75% | | | 253,500 | |
| | | 11,000 | | New York Mortgage Trust, Inc., Series C, 7.88% | | | 270,820 | |
| | | 14,000 | | Wells Fargo & Co., Series J, 8.00% | | | 349,440 | |
| | | | | | | | 873,760 | |
| | | | | Industrials — 0.97% | | | | |
| | | 5,000 | | Stericycle, Inc., 5.25% | | | 226,700 | |
| | | | | | | | | |
| | | | | Real Estate — 1.18% | | | | |
| | | 11,100 | | Jernigan Capital, Inc., Series B, 7.00% | | | 276,390 | |
| | | | | Total Preferred Stocks (Cost $1,727,363) | | | 1,577,310 | |
| | | | | | | | | |
CLOSED-END FUNDS — 2.31% | | | | |
| | | 25,000 | | Eaton Vance Limited Duration Income Fund | | | 318,000 | |
| | | 15,000 | | Pioneer Diversified High Income Trust | | | 221,850 | |
| | | | | Total Closed-End Funds (Cost $562,735) | | | 539,850 | |
| | | | | | | | | |
EXCHANGE-TRADED FUNDS — 2.09% | | | | |
| | | 9,000 | | SPDR Bloomberg Barclays Convertible Securities ETF | | | 489,150 | |
| | | | | Total Exchange-Traded Funds (Cost $443,069) | | | 489,150 | |
| | | | | | | | | |
Principal
Amount | | | | | | |
CONVERTIBLE CORPORATE BONDS — 0.59% | | | | |
| | | | | | | | |
| | | | | United States — 0.59% | | | | |
| | | | | Industrials — 0.59% | | | | |
| | $ | 120,000 | | Atlas Air Worldwide Holdings, Inc., 2.25%, 6/1/2022 | | | 137,231 | |
| | | | | Total Convertible Corporate Bonds (Cost $108,927) | | | 137,231 | |
| | | | | | | | | |
CORPORATE BONDS — 11.29% | | | | |
| | | | | | | | |
| | | | | United States — 11.29% | | | | |
| | | | | Consumer Discretionary — 1.76% | | | | |
| | | 120,000 | | International Game Technology plc, 5.35%, 10/15/2023 | | | 119,718 | |
| | | 200,000 | | L Brands, Inc., 5.25%, 2/1/2028 | | | 172,250 | |
| | | 120,000 | | Scientific Games International, Inc., 6.25%, 9/1/2020 | | | 120,000 | |
| | | | | | | | 411,968 | |
8 | See accompanying notes which are an integral part of these financial statements. | |
Preserver Alternative Opportunities Fund
Schedule of Investments (continued)
August 31, 2018
Principal
Amount | | | | Fair Value | |
CORPORATE BONDS — (continued) | | | | |
| | | | | | | | | |
| | | | | Energy — 1.06% | | | | |
| | $ | 100,000 | | Genesis Energy LP, 6.75%, 8/1/2022 | | $ | 102,500 | |
| | | 150,000 | | Range Resources Corporation, 4.88%, 5/15/2025 | | | 144,375 | |
| | | | | | | | 246,875 | |
| | | | | Financials — 1.70% | | | | |
| | | 200,000 | | Citibank N.A., 2.13%, 10/20/2020 | | | 195,797 | |
| | | 200,000 | | Stifel Financial Corporation, 4.25%, 7/18/2024 | | | 201,903 | |
| | | | | | | | 397,700 | |
| | | | | Health Care — 1.80% | | | | |
| | | 150,000 | | Community Health Systems, Inc., 8.13%, 6/30/2024(d) | | | 124,125 | |
| | | 200,000 | | DaVita HealthCare Partners, Inc., 5.00%, 5/1/2025 | | | 190,500 | |
| | | 100,000 | | Tenet Healthcare Corporation, 8.13%, 4/1/2022 | | | 106,000 | |
| | | | | | | | 420,625 | |
| | | | | Industrials — 1.02% | | | | |
| | | 100,000 | | Timken Company (The), 3.88%, 9/1/2024 | | | 98,363 | |
| | | 150,000 | | Triumph Group, Inc., 5.25%, 6/1/2022 | | | 141,375 | |
| | | | | | | | 239,738 | |
| | | | | Materials — 0.80% | | | | |
| | | 200,000 | | AK Steel Corporation, 6.38%, 10/15/2025 | | | 187,000 | |
| | | | | | | | | |
| | | | | Real Estate — 1.28% | | | | |
| | | 200,000 | | Iron Mountain, Inc., 5.75%, 8/15/2024 | | | 198,750 | |
| | | 100,000 | | Senior Housing Properties Trust, 4.75%, 5/1/2024 | | | 100,069 | |
| | | | | | | | 298,819 | |
| | | | | Telecommunication Services — 1.45% | | | | |
| | | 200,000 | | CenturyLink, Inc., Series D, 7.20%, 12/1/2025 | | | 197,466 | |
| | | 150,000 | | T-Mobile USA, Inc., 4.75%, 2/1/2028 | | | 141,458 | |
| | | | | | | | 338,924 | |
| | | | | Utilities — 0.42% | | | | |
| | | 100,000 | | Ferrellgas Partners LP, 8.63%, 6/15/2020 | | | 98,500 | |
| | | | | Total Corporate Bonds (Cost $2,656,943) | | | 2,640,149 | |
| | | | | | | | |
COLLATERALIZED MORTGAGE OBLIGATIONS — 3.23% | | | | |
| | | 85,933 | | Banc of America Mortgage Securities, Inc., Series 2004-K, Class 1A2, 3.85%, 12/25/2034 (e) | | | 83,116 | |
| | | 53,174 | | Countrywide Alternative Loan Trust, Series 2003-J2, Class A1, 6.00%, 10/25/2033 | | | 55,921 | |
| | | 46,795 | | Countrywide Home Loans Mortgage Pass Through Trust, Series 2004-HYB9, Class 1A1, 3.60%, 2/20/2035 (d) (e) | | | 47,358 | |
| | | 21,644 | | GSR Mortgage Loan Trust, Series 2005-5F, Class 8A3, 2.56%, 6/25/2035 (1MO LIBOR + 50bps)(f) | | | 20,811 | |
| | See accompanying notes which are an integral part of these financial statements. | 9 |
Preserver Alternative Opportunities Fund
Schedule of Investments (continued)
August 31, 2018
Principal
Amount | | | | Fair Value | |
COLLATERALIZED MORTGAGE OBLIGATIONS — (continued) | | | | |
| | | | | | | | | |
| | $ | 119,190 | | HarborView Mortgage Loan Trust, Series 2004-07, Class 2A1, 3.75%, 11/19/2034 (e) | | $ | 120,909 | |
| | | 167,507 | | Impac CMB Trust, Series 2005-08, Class 2B, 4.32%, 2/25/2036 (1MO LIBOR + 225bps)(f) | | | 162,031 | |
| | | 265,241 | | Residential Asset Mortgage Products, Inc., Series 2001-RS2, Class MII2, 3.49%, 6/25/2031 (1MO LIBOR + 142.5bps)(f) | | | 264,646 | |
| | | | | Total Collateralized Mortgage Obligations (Cost $708,204) | | | 754,792 | |
| | | | | | | | | |
U.S. TREASURY OBLIGATIONS — 2.70% | | | | |
| | | 200,000 | | United States Treasury Inflation Indexed Bonds, 0.38%, 7/15/2025 (e) | | | 208,102 | |
| | | 200,000 | | United States Treasury Notes, 1.13%, 2/28/2021 | | | 192,609 | |
| | | 250,000 | | United States Treasury Notes, 1.63%, 2/15/2026 | | | 230,069 | |
| | | | | Total U.S. Treasury Obligations (Cost $658,310) | | | 630,780 | |
| | | | | | | | | |
ASSET-BACKED SECURITIES — 0.55% | | | | |
| | | 126,311 | | American Airlines, Inc. Pass Through Trust - Series 2013-2, Class B, 5.60%, 1/15/2022 (d) | | | 128,996 | |
| | | | | Total Asset-Backed Securities (Cost $127,381) | | | 128,996 | |
| | | | | | | | | |
| | | | | Total Investments — 98.04% (Cost $20,936,539) | | | 22,916,329 | |
| | | | | | | | | |
| | | | | Other Assets in Excess of Liabilities — 1.96% | | | 457,202 | |
| | | | | | | | | |
| | | | | NET ASSETS — 100.00% | | $ | 23,373,531 | |
(a) | Non-income producing security. |
(b) | Master Limited Partnership |
(c) | All or a portion of the security is held as collateral for unsettled security transactions. |
(d) | Security exempt from registration under Rule 144A or Section 4(2) of the Securities Act of 1933. The security may be resold in transactions exempt from registration, normally to qualified institutional buyers. |
(e) | Variable or Floating Rate Security. Rate fluctuations may be used on index changes, prepayment or underlying positions and/or other variables. Rate presented is as of August 31, 2018. |
(f) | Variable rate security. The rate shown is the effective interest rate as of August 31, 2018. The benchmark on which the rate is calculated is shown parenthetically. |
(g) | Principal amount of security is adjusted periodically based on changes in the Consumer Price Index. |
ADR – American Depositary Receipt
ETF – Exchange-Traded Fund
SPDR – Standard & Poor’s Depositary Receipt
The sectors shown on the schedule of investments are based on the Global Industry Classification Standard, or GICS® (“GICS”). The GICS was developed by and/or is the exclusive property of MSCI, Inc. and Standard & Poor’s Financial Services LLC (“S&P”). GICS is a service mark of MSCI, Inc. and S&P and has been licensed for use by Ultimus Fund Solutions, LLC.
10 | See accompanying notes which are an integral part of these financial statements. | |
Preserver Alternative Opportunities Fund
Statement of Assets and Liabilities
August 31, 2018
Assets |
Investments in securities at fair value (cost $20,936,539) | | $ | 22,916,329 | |
Cash | | | 708,690 | |
Receivable for fund shares sold | | | 22,508 | |
Receivable for investments sold | | | 73,474 | |
Dividends and interest receivable | | | 73,774 | |
Tax reclaims receivable | | | 10,324 | |
Prepaid expenses | | | 5,127 | |
Total Assets | | | 23,810,226 | |
Liabilities | | | | |
Payable for investments purchased | | | 385,836 | |
Payable to Adviser | | | 14,758 | |
Accrued 12b-1 fees - Retail shares | | | 1,076 | |
Payable to Administrator | | | 7,166 | |
Other accrued expenses | | | 27,859 | |
Total Liabilities | | | 436,695 | |
Net Assets | | $ | 23,373,531 | |
Net Assets consist of: | | | | |
Paid-in capital | | $ | 20,648,041 | |
Accumulated undistributed net investment income | | | 82,446 | |
Accumulated undistributed net realized gain from investments | | | 663,265 | |
Net unrealized appreciation on investments | | | 1,979,779 | |
Net Assets | | $ | 23,373,531 | |
Institutional Shares: | | | | |
Net Assets | | $ | 20,705,213 | |
Shares outstanding | | | 1,728,123 | |
Net asset value, offering and redemption price per share(a) | | $ | 11.98 | |
Retail Shares: | | | | |
Net Assets | | $ | 2,668,318 | |
Shares outstanding | | | 223,447 | |
Net asset value, offering and redemption price per share(a) | | $ | 11.94 | |
(a) | A 2.00% redemption fee is imposed upon shares redeemed within 60 calendar days of their purchase. |
| | See accompanying notes which are an integral part of these financial statements. | 11 |
Preserver Alternative Opportunities Fund
Statement of Operations
For the Year Ended August 31, 2018
Investment Income | | | | |
Dividend income (net of foreign taxes withheld of $19,643) | | $ | 410,308 | |
Interest income | | | 211,771 | |
Total investment income | | | 622,079 | |
Expenses | | | | |
Investment Adviser | | | 155,569 | |
Administration | | | 36,000 | |
Fund accounting | | | 30,000 | |
Audit and tax preparation | | | 23,750 | |
Transfer agent | | | 20,000 | |
Printing | | | 13,749 | |
Legal | | | 13,528 | |
Registration | | | 12,275 | |
Pricing | | | 10,051 | |
Trustee | | | 9,647 | |
Custodian | | | 7,200 | |
12b-1 fees - Retail Shares | | | 6,171 | |
Miscellaneous | | | 24,534 | |
Total expenses | | | 362,474 | |
Recoupment of prior expenses waived/reimbursed by Adviser | | | 6,725 | |
Net operating expenses | | | 369,199 | |
Net investment income | | | 252,880 | |
Net Realized and Change in Unrealized Gain (Loss) on Investments | | | | |
Net realized gain on investment securities transactions | | | 1,018,122 | |
Net realized loss on foreign currency translations | | | (42,557 | ) |
Net change in unrealized appreciation of investment securities and foreign currency translations | | | 2,712 | |
Net realized and change in unrealized gain on investments | | | 978,277 | |
Net increase in net assets resulting from operations | | $ | 1,231,157 | |
12 | See accompanying notes which are an integral part of these financial statements. | |
Preserver Alternative Opportunities Fund
Statements of Changes in Net Assets
| | For the
Year Ended
August 31, 2018 | | | For the
Year Ended
August 31, 2017 | |
Increase (Decrease) in Net Assets due to: | | | | | | | | |
Operations | | | | | | | | |
Net investment income | | $ | 252,880 | | | $ | 232,740 | |
Long-term capital gain dividends from investment companies | | | — | | | | 2,063 | |
Net realized gain on investment securities transactions and foreign currency translations | | | 975,565 | | | | 97,105 | |
Net change in unrealized appreciation of investment securities and foreign currency translations | | | 2,712 | | | | 1,405,573 | |
Net increase in net assets resulting from operations | | | 1,231,157 | | | | 1,737,481 | |
Distributions From: | | | | | | | | |
Net investment income: | | | | | | | | |
Institutional Shares | | | (227,584 | ) | | | (239,216 | ) |
Retail Shares | | | (30,727 | ) | | | (28,812 | ) |
Net realized gains: | | | | | | | | |
Institutional Shares | | | (287,634 | ) | | | (7,459 | ) |
Retail Shares | | | (43,012 | ) | | | (995 | ) |
Total distributions | | | (588,957 | ) | | | (276,482 | ) |
Capital Transactions – Institutional Shares | | | | | | | | |
Proceeds from shares sold | | | 5,063,761 | | | | 5,835,841 | |
Reinvestment of distributions | | | 513,700 | | | | 244,577 | |
Amount paid for shares redeemed | | | (1,465,745 | ) | | | (1,014,138 | ) |
Proceeds from redemption fees(a) | | | — | | | | 72 | |
Total Institutional Shares | | | 4,111,716 | | | | 5,066,352 | |
Capital Transactions – Retail Shares | | | | | | | | |
Proceeds from shares sold | | | 1,182,902 | | | | 882,175 | |
Reinvestment of distributions | | | 73,225 | | | | 29,807 | |
Amount paid for shares redeemed | | | (846,215 | ) | | | (630,505 | ) |
Proceeds from redemption fees(a) | | | 106 | | | | 32 | |
Total Retail Shares | | | 410,018 | | | | 281,509 | |
Net increase in net assets resulting from capital transactions | | | 4,521,734 | | | | 5,347,861 | |
Total Increase in Net Assets | | | 5,163,934 | | | | 6,808,860 | |
(a) | A 2.00% redemption fee is imposed upon shares redeemed within 60 calendar days of their purchase. |
| | See accompanying notes which are an integral part of these financial statements. | 13 |
Preserver Alternative Opportunities Fund
Statements of Changes in Net Assets (continued)
| | For the
Year Ended
August 31, 2018 | | | For the
Year Ended
August 31, 2017 | |
Net Assets | | | | | | | | |
Beginning of year | | $ | 18,209,597 | | | $ | 11,400,737 | |
End of year | | $ | 23,373,531 | | | $ | 18,209,597 | |
Accumulated undistributed net investment income (loss) | | $ | 82,446 | | | $ | (17,172 | ) |
Share Transactions – Institutional Shares | | | | | | | | |
Shares sold | | | 434,546 | | | | 535,360 | |
Shares issued in reinvestment of distributions | | | 44,530 | | | | 23,205 | |
Shares redeemed | | | (126,344 | ) | | | (92,631 | ) |
Total Institutional Shares | | | 352,732 | | | | 465,934 | |
Share Transactions – Retail Shares | | | | | | | | |
Shares sold | | | 101,517 | | | | 80,710 | |
Shares issued in reinvestment of distributions | | | 6,360 | | | | 2,828 | |
Shares redeemed | | | (72,592 | ) | | | (59,689 | ) |
Total Retail Shares | | | 35,285 | | | | 23,849 | |
14 | See accompanying notes which are an integral part of these financial statements. | |
Preserver Alternative Opportunities Fund - Institutional Shares
Financial Highlights
(For a share outstanding during each period)
| | | For the
Year Ended
August 31,
2018 | | | For the
Year Ended
August 31,
2017 | | | For the
Period Ended
August 31,
2016(a) | |
Selected Per Share Data | | | | | | | | | | | | |
Net asset value, at beginning of period | | $ | 11.65 | | | $ | 10.62 | | | $ | 10.00 | |
Income from investment operations: | | | | | | | | | | | | |
Net investment income | | | 0.16 | | | | 0.18 | | | | 0.07 | |
Net realized and unrealized gain on investments | | | 0.53 | | | | 1.08 | | | | 0.55 | |
Total from investment operations | | | 0.69 | | | | 1.26 | | | | 0.62 | |
Less distributions to shareholders from: | | | | | | | | | | | | |
Net investment income | | | (0.16 | ) | | | (0.22 | ) | | | — | |
Net realized gains | | | (0.20 | ) | | | (0.01 | ) | | | — | |
Total distributions | | | (0.36 | ) | | | (0.23 | ) | | | — | |
Net asset value, at end of period | | $ | 11.98 | | | $ | 11.65 | | | $ | 10.62 | |
Total Return(b) | | | 6.05 | % | | | 12.04 | % | | | 6.20 | %(c) |
| | | | | | | | | | | | | |
Ratios and Supplemental Data: | | | | | | | | | | | | |
Net assets, end of period (000 omitted) | | $ | 20,705 | | | $ | 16,022 | | | $ | 9,659 | |
Before waiver or recoupment: | | | | | | | | | | | | |
Ratio of expenses to average net assets | | | 1.72 | % | | | 2.02 | % | | | 2.92 | %(d) |
After waiver or recoupment: | | | | | | | | | | | | |
Ratio of expenses to average net assets | | | 1.75 | % | | | 1.75 | % | | | 1.75 | %(d) |
Ratio of net investment income to average net assets | | | 1.25 | % | | | 1.62 | % | | | 1.44 | %(d) |
Portfolio turnover rate(e) | | | 68 | % | | | 72 | % | | | 20 | %(c) |
(a) | For the period March 1, 2016 (commencement of operations) to August 31, 2016. |
(b) | Total return in the above table represents the rate that the investor would have earned or lost on an investment in the Fund, assuming reinvestment of distributions. Excludes redemption fee. |
(e) | Portfolio turnover rate is calculated on the basis of the Fund as a whole without distinguishing among the classes of shares. |
| | See accompanying notes which are an integral part of these financial statements. | 15 |
Preserver Alternative Opportunities Fund - Retail Shares
Financial Highlights
(For a share outstanding during each period)
| | | For the
Year Ended
August 31,
2018 | | | For the
Year Ended
August 31,
2017 | | | For the
Period Ended
August 31,
2016(a) | |
Selected Per Share Data | | | | | | | | | | | | |
Net asset value, at beginning of period | | $ | 11.63 | | | $ | 10.60 | | | $ | 10.00 | |
Income from investment operations: | | | | | | | | | | | | |
Net investment income | | | 0.12 | | | | 0.17 | | | | 0.05 | |
Net realized and unrealized gain on investments | | | 0.54 | | | | 1.07 | | | | 0.55 | |
Total from investment operations | | | 0.66 | | | | 1.24 | | | | 0.60 | |
Less distributions to shareholders from: | | | | | | | | | | | | |
Net investment income | | | (0.15 | ) | | | (0.20 | ) | | | — | |
Net realized gains | | | (0.20 | ) | | | (0.01 | ) | | | — | |
Total distributions | | | (0.35 | ) | | | (0.21 | ) | | | — | |
Net asset value, at end of period | | $ | 11.94 | | | $ | 11.63 | | | $ | 10.60 | |
Total Return(b) | | | 5.76 | % | | | 11.84 | % | | | 6.00 | %(c) |
| | | | | | | | | | | | | |
Ratios and Supplemental Data: | | | | | | | | | | | | |
Net assets, end of period (000 omitted) | | $ | 2,668 | | | $ | 2,187 | | | $ | 1,742 | |
Before waiver or recoupment: | | | | | | | | | | | | |
Ratio of expenses to average net assets | | | 1.97 | % | | | 2.27 | % | | | 3.17 | %(d) |
After waiver or recoupment: | | | | | | | | | | | | |
Ratio of expenses to average net assets | | | 2.00 | % | | | 2.00 | % | | | 2.00 | %(d) |
Ratio of net investment income to average net assets | | | 0.99 | % | | | 1.38 | % | | | 1.19 | %(d) |
Portfolio turnover rate(e) | | | 68 | % | | | 72 | % | | | 20 | %(c) |
(a) | For the period March 1, 2016 (commencement of operations) to August 31, 2016. |
(b) | Total return in the above table represents the rate that the investor would have earned or lost on an investment in the Fund, assuming reinvestment of distributions. Excludes redemption fee. |
(e) | Portfolio turnover rate is calculated on the basis of the Fund as a whole without distinguishing among the classes of shares. |
16 | See accompanying notes which are an integral part of these financial statements. | |
Preserver Alternative Opportunities Fund
Notes to the Financial Statements
August 31, 2018
NOTE 1. ORGANIZATION
The Preserver Alternative Opportunities Fund (the “Fund”) was organized as a diversified series of Capitol Series Trust (the “Trust”) on September 16, 2015. The Trust is an open end investment company established under the laws of Ohio by an Agreement and Declaration of Trust dated September 18, 2013 (the “Trust Agreement”). The Trust Agreement permits the Board of Trustees of the Trust (the “Board”) to issue an unlimited number of shares of beneficial interest of separate series without par value. The Fund is one of a series of funds currently authorized by the Board. The Fund’s investment adviser is Preserver Partners, LLC (the “Adviser”). The investment objective of the Fund is to seek current income and capital appreciation with low volatility compared to the major equity and fixed income markets.
The Fund currently offers two classes of shares, Institutional Shares and Retail Shares. The Fund commenced operations on March 1, 2016. Each share represents an equal proportionate interest in the assets and liabilities belonging to the Fund and is entitled to such dividends and distributions out of income belonging to the Fund as are declared by the Board. Both share classes impose a 2.00% redemption fee on shares redeemed within 60 days of purchase.
NOTE 2. SIGNIFICANT ACCOUNTING POLICIES
The Fund is an investment company and follows accounting and reporting guidance under Financial Accounting Standards Board Accounting Standards Codification (“ASC”) Topic 946, “Financial Services-Investment Companies”. The following is a summary of significant accounting policies followed by the Fund in the preparation of its financial statements. These policies are in conformity with generally accepted accounting principles in the United States of America (“GAAP”).
Estimates – The preparation of financial statements in conformity with GAAP requires management to make estimates and assumptions that affect the reported amounts of assets and liabilities and disclosure of contingent assets and liabilities at the date of the financial statements and the reported amounts of increases and decreases in net assets from operations during the reporting period. Actual results could differ from those estimates.
Securities Valuation – All investments in securities are recorded at their estimated fair value as described in Note 3.
Foreign Currency Translation – The accounting records of the Fund are maintained in U.S. dollars. Foreign currency amounts are translated into U.S. dollars at the current rate of exchange each business day to determine the value of investments, and other assets and liabilities. Purchases and sales of foreign securities, and income and expenses, are translated at the prevailing rate of exchange on the respective date of these transactions. The Fund does not isolate that portion of the results of operations resulting from changes in foreign exchange rates on investments from fluctuation arising from changes in market prices of securities held. These fluctuations are included with the unrealized gain or loss from investments.
17
Preserver Alternative Opportunities Fund
Notes to the Financial Statements (continued)
August 31, 2018
Federal Income Taxes – The Fund makes no provision for federal income tax or excise tax. The Fund has qualified and intends to qualify each year as a regulated investment company (“RIC”) under subchapter M of the Internal Revenue Code of 1986, as amended, by complying with the requirements applicable to RICs and by distributing substantially all of its taxable income. The Fund also intends to distribute sufficient net investment income and net capital gains, if any, so that it will not be subject to excise tax on undistributed income and gains. If the required amount of net investment income or gains is not distributed, the Fund could incur a tax expense.
The Fund may be subject to taxes imposed by countries in which it invests. Such taxes are generally based on income and/or capital gains earned or repatriated. Taxes are accrued and applied to net investment income, net realized gains and unrealized appreciation as such income and/or gains are earned.
The Fund recognizes tax benefits or expenses of uncertain tax positions only when the position is “more likely than not” to be sustained assuming examination by tax authorities. Management of the Fund has reviewed tax positions taken in tax years that remain subject to examination by all major tax jurisdictions, including federal (i.e., the previous two tax year ends and the interim tax period since then, as applicable) and has concluded that no provision for unrecognized tax benefits or expenses is required in these financial statements and does not expect this to change over the next twelve months. The Fund recognizes interest and penalties, if any, related to unrecognized tax benefits as income tax expense in the Statement of Operations. During the year, the Fund did not incur any interest or penalties.
Expenses – Expenses incurred by the Trust that do not relate to a specific fund of the Trust are allocated to the individual funds based on each fund’s relative net assets or another appropriate basis (as determined by the Board). Expenses specifically attributable to any class are borne by that class. Income, realized gains and losses, unrealized appreciation and depreciation, and expenses are allocated to each class based on the net assets in relation to the relative net assets of the Fund.
Security Transactions and Related Income – Throughout the reporting period, security transactions are accounted for no later than one business day following the trade date. For financial reporting purposes, security transactions are accounted for on trade date on the last business day of the reporting period. The specific identification method is used for determining gains or losses for financial statements and income tax purposes. Dividend income is recorded on the ex-dividend date and interest income is recorded on an accrual basis. Dividend income from real estate investment trusts (REITs) and distributions from limited partnerships are recognized on the ex-date and included in dividend income. The calendar year-end classification of distributions received from REITs during the fiscal year are reported subsequent to year end; accordingly, the Fund estimates the character of REIT distributions based on the most recent information available. Income or loss from limited
18
Preserver Alternative Opportunities Fund
Notes to the Financial Statements (continued)
August 31, 2018
partnerships is reclassified among the components of net assets upon receipt of K-1’s. Discounts and premiums on fixed income securities purchased are amortized or accreted over the life of the respective securities using the effective interest method.
Dividends and Distributions – The Fund intends to distribute substantially all of its net investment income and net realized long-term and short-term capital gains, if any, at least annually. Distributions to shareholders, which are determined in accordance with income tax regulations, are recorded on the ex-dividend date. The treatment for financial reporting purposes of distributions made to shareholders during the period from net investment income or net realized capital gains may differ from their ultimate treatment for federal income tax purposes. These differences are caused primarily by differences in the timing of the recognition of certain components of income, expense or realized capital gains for federal income tax purposes. Where such differences are permanent in nature, they are reclassified in the components of net assets based on their ultimate characterization for federal income tax purposes. Any such reclassifications will have no effect on net assets, results of operations or net asset values per share of the Fund. For the fiscal year ended August 31, 2018, the Fund made the following reclassifications of net assets, which was due to foreign currency reclassifications, investments in passive foreign investment companies, and use of tax equalization:
Paid-in Capital | Accumulated
Undistributed Net
Investment Income | Accumulated Net
Realized Gain from
Investments |
$12,471 | $105,049 | $(117,520) |
NOTE 3. SECURITIES VALUATION AND FAIR VALUE MEASUREMENTS
Fair value is defined as the price that the Fund would receive upon selling an investment in an orderly transaction to an independent buyer in the principal or most advantageous market of the investment. GAAP establishes a three-tier hierarchy to maximize the use of observable market data and minimize the use of unobservable inputs and to establish classification of fair value measurements for disclosure purposes.
Inputs refer broadly to the assumptions that market participants would use in pricing the asset or liability. Inputs may be observable or unobservable. Observable inputs are inputs that reflect the assumptions market participants would use in pricing the asset or liability developed based on market data obtained from sources independent of the reporting entity. Unobservable inputs are inputs that reflect the reporting entity’s own assumptions about the assumptions market participants would use in pricing the asset or liability developed based on the best information available in the circumstances.
19
Preserver Alternative Opportunities Fund
Notes to the Financial Statements (continued)
August 31, 2018
Various inputs are used in determining the value of the Fund’s investments. These inputs are summarized in the three broad levels listed below.
| | ● | Level 1 – unadjusted quoted prices in active markets for identical investments and/or registered investment companies where the value per share is determined and published and is the basis for current transactions for identical assets or liabilities at the valuation date |
| | ● | Level 2 – other significant observable inputs (including, but not limited to, quoted prices for an identical security in an inactive market, quoted prices for similar securities, interest rates, prepayment speeds, credit risk, etc.) |
| | ● | Level 3 – significant unobservable inputs (including the Fund’s own assumptions in determining fair value of investments based on the best information available) |
The inputs used to measure fair value may fall into different levels of the fair value hierarchy. In such cases, for disclosure purposes, the level in the fair value hierarchy within which the fair value measurement falls in its entirety is determined based on the lowest level input that is significant to the fair value measurement in its entirety.
In computing the net asset value (“NAV”) of the Fund, fair value is based on market valuations with respect to portfolio securities for which market quotations are readily available. Pursuant to Board approved policies, the Fund relies on independent third-party pricing services to provide the current market value of securities. Those pricing services value equity securities, including exchange-traded funds, closed-end funds and preferred stocks, traded on a securities exchange at the last reported sales price on the principal exchange. Equity securities quoted by NASDAQ are valued at the NASDAQ Official Closing Price. If there is no reported sale on the principal exchange, equity securities are valued at the mean between the most recent quoted bid and asked price. When using the market quotations or close prices provided by the pricing service and when the market is considered active, the security will be classified as a Level 1 security. Investments in open-end mutual funds, including money market mutual funds, are generally priced at the ending NAV provided by the pricing service of the funds and are generally categorized as level 1 securities. Debt securities are valued using evaluated prices furnished by a pricing vendor selected by the Board and are generally classified as Level 2 securities.
In the event that market quotations are not readily available, the Adviser determines that the market quotation or the price provided by the pricing service does not accurately reflect the current fair value, or certain restricted or illiquid securities are being valued, such securities are valued as determined in good faith by the Trust’s Valuation Committee, based on recommendations from a pricing committee comprised of various officers of the Trust, various employees of the Fund’s administrator, and representatives of the Adviser (together the “Pricing Review Committee”). These securities will be classified as Level 2 or 3 within the fair value hierarchy, depending on the inputs used.
20
Preserver Alternative Opportunities Fund
Notes to the Financial Statements (continued)
August 31, 2018
In accordance with the Trust’s Valuation Procedures, the Pricing Review Committee in making its recommendations is required to consider all appropriate factors relevant to the value of securities for which it has determined other pricing sources are not available or reliable as described above. No single standard exists for determining fair value, because fair value depends upon the circumstances of each individual case. As a general principle, the current fair value of an issue of securities being valued pursuant to the Trust’s Fair Valuation Procedures would be the amount which the Fund might reasonably expect to receive for them upon their current sale. Methods which are in accordance with this principle may, for example, be based on (i) a multiple of earnings; (ii) a discount from market prices of a similar freely traded security (including a derivative security or a basket of securities traded on other markets, exchanges or among dealers); or (iii) yield to maturity with respect to debt issues, or a combination of these and other methods. Fair value pricing is permitted if, in accordance with the Trust’s Valuation Procedures, the validity of market quotations appears to be questionable based on factors such as evidence of a thin market in the security based on a small number of quotations, a significant event occurs after the close of a market but before the Fund’s NAV calculation that may affect a security’s value, or other data calls into question the reliability of market quotations.
The following is a summary of the inputs used to value the Fund’s investments as of August 31, 2018:
| | | Valuation Inputs | | | | | |
Asset Category | | Level 1 | | | Level 2 | | | Level 3 | | | Total | |
Common Stocks | | $ | 16,018,071 | | | $ | — | | | $ | — | | | $ | 16,018,071 | |
Preferred Stocks | | | 1,577,310 | | | | — | | | | — | | | | 1,577,310 | |
Closed-End Funds | | | 539,850 | | | | — | | | | — | | | | 539,850 | |
Exchange-Traded Funds | | | 489,150 | | | | — | | | | — | | | | 489,150 | |
Convertible Corporate Bonds | | | — | | | | 137,231 | | | | — | | | | 137,231 | |
Corporate Bonds | | | — | | | | 2,640,149 | | | | — | | | | 2,640,149 | |
Collateralized Mortgage Obligations | | | — | | | | 754,792 | | | | — | | | | 754,792 | |
U.S. Treasury Obligations | | | — | | | | 630,780 | | | | — | | | | 630,780 | |
Asset-Backed Securities | | | — | | | | 128,996 | | | | — | | | | 128,996 | |
Total | | $ | 18,624,381 | | | $ | 4,291,948 | | | $ | — | | | $ | 22,916,329 | |
The Fund did not hold any investments at the end of the reporting period in which other significant unobservable inputs (Level 3) were used in determining fair value; therefore, no reconciliation of Level 3 securities is included for this reporting period. The Fund did not hold any derivative instruments during the reporting period.
The Trust recognizes transfers between fair value hierarchy levels at the end of the reporting period. There were no transfers between any levels as of August 31, 2018 based on input levels assigned at August 31, 2017.
21
Preserver Alternative Opportunities Fund
Notes to the Financial Statements (continued)
August 31, 2018
NOTE 4. FEES AND OTHER TRANSACTIONS WITH AFFILIATES AND OTHER SERVICE PROVIDERS
Under the terms of the investment advisory agreement (the “Agreement”), the Adviser manages the Fund’s investments subject to approval of the Board. As compensation for its management services, the Fund is obligated to pay the Adviser a fee computed and accrued daily and paid monthly at an annual rate of 0.75% of the Fund’s average daily net assets. For the fiscal year ended August 31, 2018, the Adviser earned fees of $155,569 from the Fund. At August 31, 2018, the Fund owed the Adviser $14,758.
The Adviser has contractually agreed to waive its management fee and/or reimburse expenses so that total annual operating expenses (excluding (i) interest; (ii) taxes; (iii) brokerage fees and commissions; (iv) other extraordinary expenses not incurred in the ordinary course of the Fund’s business; (v) dividend expenses on short sales; (vi) expenses incurred under a Rule 12b-1 plan of distribution; and (vii) indirect expenses such as acquired fund fees and expenses) do not exceed 1.75% of the Fund’s average daily net assets through December 31, 2018 (“Expense Limitation”). During any fiscal year that the Agreement between the Adviser and the Trust is in effect, the Adviser may recoup the sum of all fees previously waived or expenses reimbursed, less any reimbursement previously paid, provided that the Adviser is only permitted to recoup fees or expenses within 36 months from the date the fee waiver or expense reimbursement took effect and provided further that such recoupment can be achieved within the Expense Limitation currently in effect and the Expense Limitation in place when the waiver/reimbursement occurred. This expense cap agreement may be terminated by the Board at any time. As of August 31, 2018, the Adviser may seek repayment of investment advisory fee waivers and expense reimbursements in the amount of $95,265 from the Fund no later than August 31, 2021.
The Trust retains Ultimus Asset Services, LLC (the “Administrator”) to provide the Fund with administration, accounting, transfer agent and compliance services, including all regulatory reporting. For the fiscal year ended August 31, 2018, the Administrator earned fees of $36,000 for administration services, $20,000 for transfer agent services, and $30,000 for fund accounting services. At August 31, 2018, the Fund owed the Administrator $7,166 for such services.
The Board supervises the business activities of the Trust. Each Trustee serves as a Trustee for the lifetime of the Trust or until the earlier of his or her retirement as a Trustee at age 78 (which may be extended for up to two years in an emeritus non-voting capacity at the pleasure and request of the Board), or until he/she dies, resigns, or is removed, whichever is sooner. “Independent Trustees,” meaning those Trustees who are not “interested persons” as defined in the Investment Company Act of 1940 (“1940 Act”) of the Trust, each receives an annual retainer of $500 per Fund and $500 per Fund for each quarterly in-person Board meeting. In addition, the Trust reimburses Trustees for out-of-pocket expense incurred in conjunction with attendance at Board meetings. Prior to July 1, 2018, each
22
Preserver Alternative Opportunities Fund
Notes to the Financial Statements (continued)
August 31, 2018
Trustee received $20,000 annual compensation from the Trust. Prior to January 1, 2018, each Trustee received $15,000 annual compensation from the Trust, each Committee Chairperson received an additional annual compensation of $1,000 from the Trust, and Independent Trustees also received $1,000 for attending each special in-person meeting and up to $1,000 for attending special telephonic meetings, depending on the length of the telephonic meeting.
The officers and one Trustee of the Trust are employees of the Administrator. Unified Financial Securities, LLC (the “Distributor”) acts as the principal distributor of the Fund’s shares. Both the Administrator and the Distributor operate as wholly-owned subsidiaries of Ultimus Fund Solutions, LLC.
The Fund has adopted a Distribution Plan (the “Plan”) pursuant to Rule 12b-1 under the 1940 Act. The Plan provides that the Fund will pay the Distributor and/or any registered securities dealer, financial institution or any other person (the “Recipient”) a fee of 0.25% of the average daily net assets of the Fund’s Retail Shares in connection with the promotion and distribution of the Fund’s Retail Shares or the provision of personal services to shareholders, including, but not necessarily limited to, advertising, compensation to underwriters, dealers and selling personnel, the printing and mailing of prospectuses to other than current shareholders of Retail Shares, the printing and mailing of sales literature and servicing shareholder accounts (“12b-1 Expenses”). The Fund or Distributor may pay all or a portion of these fees to any Recipient who renders assistance in distributing or promoting the sale of shares, or who provides certain shareholder services, pursuant to a written agreement. The Plan is a compensation plan, which means that compensation is provided regardless of whether 12b-1 Expenses are actually incurred. Accordingly, the 12b-1 Expenses of the Retail Shares of the Fund may be less than fees paid out by the class under the Plan. For the fiscal year ended August 31, 2018, Retail Shares 12b-1 expense incurred by the Fund was $6,171. At August 31, 2018, the Fund owed the Distributor $1,076 for Retail Shares 12b-1 expenses.
NOTE 5. PURCHASES AND SALES OF SECURITIES
For the fiscal year ended August 31, 2018, purchases and sales of investment securities, other than short-term investments, were as follows:
Purchases | | $ | 18,043,123 | |
Sales | | $ | 13,129,775 | |
There were no purchases or sales of long-term U.S. government obligations during the fiscal year ended August 31, 2018.
23
Preserver Alternative Opportunities Fund
Notes to the Financial Statements (continued)
August 31, 2018
NOTE 6. FEDERAL TAX INFORMATION
As of August 31, 2018, the net unrealized appreciation (depreciation) of investments for tax purposes was as follows:
Gross Unrealized Appreciation | | $ | 2,507,091 | |
Gross Unrealized Depreciation | | | (555,684 | ) |
Net Unrealized Appreciation on Investments | | $ | 1,951,407 | |
At August 31, 2018, the aggregate cost of securities for federal income tax purposes was $20,964,922 for the Fund.
The tax characterization of distributions for the fiscal years ended August 31, 2018 and 2017, was as follows:
| | 2018 | | | 2017 | |
Distributions paid from: | | | | | | | | |
Ordinary Income | | $ | 258,311 | | | $ | 271,945 | |
Long-Term Capital Gains | | | 330,646 | | | | 4,537 | |
Total Distributions Paid | | $ | 588,957 | | | $ | 276,482 | |
At August 31, 2018, the components of distributable earnings (accumulated losses) on a tax basis was as follows:
Undistributed Ordinary Income | | $ | 392,412 | |
Undistributed Long-Term Capital Gains | | | 381,682 | |
Unrealized Appreciation (Depreciation) on investments(a) | | | 1,951,407 | |
Unrealized Appreciation (Depreciation) on foreign currency translations | | | (11 | ) |
Total Accumulated Earnings (Deficit) | | $ | 2,725,490 | |
(a) | The difference between book basis and tax basis unrealized appreciation (depreciation) is primarily attributable to the mark-to-market adjustments on passive foreign investment companies, the tax treatment of return of capital adjustments and interest accruals on complex securities. |
NOTE 7. COMMITMENTS AND CONTINGENCIES
The Fund indemnifies its officers and trustees for certain liabilities that may arise from the performance of their duties to the Fund. Additionally, in the normal course of business, the Fund enters into contracts that contain a variety of representations and warranties which provide general indemnifications. The Fund’s maximum exposure under these arrangements is unknown, as this would involve future claims that may be made against the Fund that have not yet occurred.
24
Preserver Alternative Opportunities Fund
Notes to the Financial Statements (continued)
August 31, 2018
NOTE 8. SUBSEQUENT EVENTS
Management has evaluated events or transactions from August 31, 2018 through the date these financial statements were issued that would merit recognition or disclosure in the financial statements. There were no subsequent events to report that would have a material impact in the Fund’s financial statements.
NOTE 9. SHAREHOLDER MEETING RESULTS (Unaudited)
On June 19, 2018, a special meeting of shareholders of the Trust was held for the purpose of voting on the election of four Trustees to serve on the Board of Trustees. Below are the voting results from the special meeting.
| For | Withhold | % of Total
Voted in Favor |
John C. Davis | 35,759,555 | 385,270 | 98.93% |
Janet S. Meeks | 35,772,739 | 372,086 | 98.97% |
Lori A. Kaiser | 35,775,501 | 369,324 | 98.98% |
Robert G. Dorsey | 35,597,330 | 547,495 | 98.49% |
The shareholders voted in favor of the proposal to approve four Trustees to serve on the Board of Trustees. Mr. Davis, Ms. Meeks and Ms. Kaiser were each elected as Independent Trustees and began their service to the Trust effective July 1, 2018. Mr. Dorsey was elected as Interested Trustee at the meeting.
25
Report of Independent Registered Public Accounting Firm
To the Shareholders and the Board of Trustees of Preserver Alternative Opportunities Fund
Opinion on the Financial Statements
We have audited the accompanying statement of assets and liabilities of Preserver Alternative Opportunities Fund (the “Fund”) (one of the funds constituting Capitol Series Trust (the “Trust”)), including the schedule of investments, as of August 31, 2018, and the related statement of operations for the year then ended, the statements of changes in net assets for each of the two years in the period then ended, the financial highlights for each of the two years in the period then ended and the related notes (collectively referred to as the “financial statements”). In our opinion, the financial statements present fairly, in all material respects, the financial position of the Fund (one of the funds constituting Capitol Series Trust) at August 31, 2018, the results of its operations for the year then ended, the changes in its net assets for each of the two years in the period then ended and its financial highlights for each of the two years in the period then ended, in conformity with U.S. generally accepted accounting principles.
The financial highlights for the period from March 1, 2016 (commencement of operations) to August 31, 2016 were audited by other auditors whose report dated October 26, 2016, expressed an unqualified opinion on those financial highlights.
Basis for Opinion
These financial statements are the responsibility of the Trust’s management. Our responsibility is to express an opinion on the Fund’s financial statements based on our audits. We are a public accounting firm registered with the Public Company Accounting Oversight Board (United States) (PCAOB) and are required to be independent with respect to the Trust in accordance with the U.S. federal securities laws and the applicable rules and regulations of the Securities and Exchange Commission and the PCAOB.
We conducted our audits in accordance with the standards of the PCAOB. Those standards require that we plan and perform the audit to obtain reasonable assurance about whether the financial statements are free of material misstatement, whether due to error or fraud. The Trust is not required to have, nor were we engaged to perform, an audit of Trust’s internal control over financial reporting. As part of our audit we are required to obtain an understanding of internal control over financial reporting but not for the purpose of expressing an opinion on the effectiveness of the Trust’s internal control over financial reporting. Accordingly, we express no such opinion.
Our audits included performing procedures to assess the risks of material misstatement of the financial statements, whether due to error or fraud, and performing procedures that respond to those risks. Such procedures included examining, on a test basis, evidence regarding the amounts and disclosures in the financial statements. Our procedures included confirmation of securities owned as of August 31, 2018, by correspondence with the custodian and brokers. Our audits also included evaluating the accounting principles
26
Report of Independent Registered Public Accounting Firm
(Continued)
used and significant estimates made by management, as well as evaluating the overall presentation of the financial statements. We believe that our audits provide a reasonable basis for our opinion.

We have served as the auditor of one or more Capitol Series Trust investment companies since 2017.
Grandview Heights, Ohio
October 25, 2018
27
Summary of Fund Expenses (Unaudited)
As a shareholder of the Fund, you incur two types of costs: (1) transaction costs, including short-term redemption fees and (2) ongoing costs, including management fees, distribution and service (12b-1) fees, and other Fund expenses. These examples are intended to help you understand your ongoing costs (in dollars) of investing in the Fund and to compare these costs with the ongoing costs of investing in other mutual funds.
The example is based on an investment of $1,000 invested at the beginning of the period and held for the entire period from March 1, 2018 through August 31, 2018.
Actual Expenses
The first line of the table for each class provides information about actual account values and actual expenses. You may use the information in these lines, together with the amount you invested, to estimate the expenses that you paid over the period. Simply divide your account value by $1,000 (for example, an $8,600 account value divided by $1,000 = 8.60), then multiply the result by the number in the first line under the heading “Expenses Paid During Period” to estimate the expenses you paid on your account during this period.
Hypothetical Example for Comparison Purposes
The second line of the table for each class provides information about hypothetical account values and hypothetical expenses based on the Fund’s actual expense ratios and an assumed rate of return of 5% per year before expenses, which is not the Fund’s actual return. The hypothetical account values and expenses may not be used to estimate the actual ending account balances or expenses you paid for the period. You may use this information to compare the ongoing costs of investing in the Fund and other funds. To do so, compare this 5% hypothetical example with the 5% hypothetical examples that appear in the shareholder reports of the other funds.
Expenses shown in the table are meant to highlight your ongoing costs only and do not reflect any transactional costs, such as the fee imposed on sales charges and short-term redemptions. Therefore, the second line of the table for each class is useful in comparing ongoing costs only and will not help you determine the relative total costs of owning different funds. In addition, if transaction costs were included, your costs would have been higher.
28
Summary of Fund Expenses (Unaudited) (continued)
| | | Beginning
Account Value,
March 1, 2018 | Ending
Account Value,
August 31, 2018 | Expenses
Paid During
Period(a) | Annualized
Expense
Ratio |
Preserver Alternative Opportunities Fund | | | |
Institutional Shares | Actual | $ 1,000.00 | $ 1,041.70 | $ 9.01 | 1.75% |
| | | | | | |
| | Hypothetical(b) | $ 1,000.00 | $ 1,016.38 | $ 8.89 | 1.75% |
| | | | | | |
Retail Shares | Actual | $ 1,000.00 | $ 1,040.10 | $ 10.28 | 2.00% |
| | | | | | |
| | Hypothetical(b) | $ 1,000.00 | $ 1,015.12 | $ 10.16 | 2.00% |
(a) | Expenses are equal to the Fund’s annualized expense ratios, multiplied by the average account value over the period, multiplied by 184/365 (to reflect the one-half year period). |
(b) | Hypothetical assumes 5% annual return before expenses. |
Additional Federal Income Tax Information (Unaudited)
The Form 1099-DIV you receive in January 2019 will show the tax status of all distributions paid to your account in calendar year 2018. Shareholders are advised to consult their own tax adviser with respect to the tax consequences of their investment in the Fund. As required by the Internal Revenue Code and/or regulations, shareholders must be notified regarding the status of qualified dividend income for individuals and the dividends received deduction for corporations.
Qualified Dividend Income. The Fund designates approximately 55% or up to the maximum amount of such dividends allowable pursuant to the Internal Revenue Code, as qualified dividend income eligible for the reduced tax rate of 15%.
Dividends Received Deduction. Corporate shareholders are generally entitled to take the dividends received deduction on the portion of the Fund’s dividend distribution that qualifies under tax law. For the Fund’s calendar year 2018 ordinary income dividends, 37% qualifies for the corporate dividends received deduction.
For the fiscal year ended August 31, 2018, the Fund designated $339,546 as 20% long-term capital gain distributions.
29
Trustees and Officers (Unaudited)
The Board supervises the business activities of the Trust and is responsible for protecting the interests of shareholders. The Chairman of the Board is Walter B. Grimm, who is an Independent Trustee of the Trust.
Each Trustee serves as a Trustee for the lifetime of the Trust or until the earlier of his or her retirement as a Trustee at age 78, death, resignation or removal. Officers are re-elected annually by the Board. The address of each Trustee and officer is 225 Pictoria Drive, Suite 450, Cincinnati, Ohio 45246.
As of the date of this report, the Trustees oversee the operations of 10 series.
Interested Trustee Background. The following table provides information regarding the Interested Trustee.
Name, Address, (Age), Position with Trust,
Term of Position with Trust | Principal Occupation During
Past 5 Years and Other Directorships |
Robert G. Dorsey* Age: 61 Trustee Began Serving: March 2017 | Principal Occupation(s): Managing Director and Co-Chief Executive Officer of Ultimus Fund Solutions, LLC and its subsidiaries, except as otherwise noted for the FINRA-regulated broker-dealer entities (1999 to present); Interested Trustee of Ultimus Managers Trust (February 2012 to present). Previous Position(s): President of Ultimus Fund Distributors, LLC (1999 to 2018); President of Ultimus Managers Trust (February 2012 to October 2013). |
* | Mr. Dorsey is considered an “interested person” of the Trust within the meaning of Section 2(a)(19) of the 1940 Act because of his relationship with the Trust’s administrator, transfer agent, and distributors. |
Independent Trustee Background. The following table provides information regarding the Independent Trustees.
Name, Address, (Age), Position with Trust,
Term of Position with Trust | Principal Occupation During
Past 5 Years and Other Directorships |
John C. Davis Age: 66 Trustee Began Serving: July 2018 | Principal Occupations(s): Consultant (government services) since May 2011. Consultant, Board of Trustees of Ultimus Managers Trust (since 2016). Previous Position(s): Retired Partner of PricewaterhouseCoopers LLP (1974-2010); Former Trustee of Ultimus Managers Trust (2012-2016). |
30
Trustees and Officers (Unaudited) (continued)
Name, Address, (Age), Position with Trust,
Term of Position with Trust | Principal Occupation During
Past 5 Years and Other Directorships |
Walter B. Grimm Age: 73 Trustee and Chair Began Serving: November 2013 | Principal Occupations(s): President, Leigh Management Group, LLC (consulting firm) (October 2005 to present); and President, Leigh Investments, Inc. (1988 to present); Board member, Boys & Girls Club of Coachella Valley (April 2018 to present); Board member, Axxia Pharmaceutical (January 2015 to present). Previous Position(s): Chief Financial Officer, East West Private, LLC (consulting firm) (2009 to 2013). |
Lori Kaiser Age: 55 Trustee Began Serving: July 2018 | Principal Occupations(s): Founder and CEO, Kaiser Consulting since 1992. |
Janet Smith Meeks Age: 63 Trustee Began Serving: July 2018 | Principal Occupations(s): Co-Founder and CEO, Healthcare Alignment Advisors, LLC (consulting company) since August 2015. Previous Position(s): President and Chief Operating Officer, Mount Carmel Health System (2004-2015). |
Mary M. Morrow Age: 60 Trustee Began Serving: November 2013 | Principal Occupations(s): Chief Operating Officer, Dignity Health Managed Services Organization (October 2018 to present). Previous Position(s): Independent Consultant (managed care services (April 2018 to October 2018); Chief Operating Officer, Pennsylvania Health and Wellness (fully owned subsidiary of Centene Corporation) (November 2016 to April 2018); Vice President, Strategic Initiatives, Gateway Heath (January 2015 to November 2016); Consulting Practice Manager, DST Health Solutions (August 2010 to January 2015); Director, Service and Client Relations, EBDS (August 2008 – May 2009); Independent Consultant, Healthcare Servicing May 2009 – August 2010). |
31
Trustees and Officers (Unaudited) (continued)
Officers. The following table provides information regarding the Officers.
Name, Address, (Age), Position with Trust,
Term of Position with Trust | Principal Occupation During
Past 5 Years and Other Directorships |
Matthew J. Miller Age: 42 President and Chief Executive Officer Began Serving: September 2013 (as VP); September 2018 (as President) | Principal Occupation(s): Assistant Vice President, Relationship Management, Ultimus Fund Solutions, LLC (December 2015 to present); Vice President, Valued Advisers Trust (December 2011 to present). Previous Position(s): Vice President, Capitol Series Trust (September 2013 to March 2017); Chief Executive Officer and President, Capitol Series Trust (March 2017 to March 2018); Secretary, Capitol Series Trust (March 2018 to September 2018); Vice President, Relationship Management, Huntington Asset Services, Inc. (n/k/a Ultimus Asset Services, LLC) (2008 to December 2015); Vice President, The Huntington Funds (February 2010 to April 2015); Vice President, Transfer Agency Operations, Huntington Asset Services, Inc. (2002 to 2008); Employed in various positions with Huntington Asset Services, Inc. (July 1998 to 2002). |
Zachary P. Richmond Age: 38 Treasurer and Chief Financial Officer Began Serving: August 2014 | Principal Occupation(s): Assistant Vice President, Associate Director of Financial Administration, Ultimus Fund Solutions, LLC (December 2015 to present); Treasurer and Chief Financial Officer, Unified Series Trust (August 2014 to present); Treasurer and Chief Financial Officer, Commonwealth International Series Trust (September 2015 to present). Previous Position(s): Assistant Vice President, Fund Administration, Huntington Asset Services, Inc. (n/k/a Ultimus Asset Services, LLC) (January 2011 to December 2015); and Assistant Treasurer, Unified Series Trust (2011 to August 2014). |
Brandon Kipp Age: 35 Chief Compliance Officer Began Serving: October 2017 | Principal Occupation(s): Senior Fund Compliance Officer, Ultimus Fund Solutions, LLC (since July 2017) and Chief Compliance Officer, Valued Advisers Trust (since October 2017). Previous Position(s): Assistant Vice President and Compliance Manager, UMB Fund Services, Inc. (March 2014 to July 2017); Officer and Lead Fund Administrator, UMB Fund Services, Inc. (May 2012 to March 2014). |
32
Trustees and Officers (Unaudited) (continued)
Name, Address, (Age), Position with Trust,
Term of Position with Trust | Principal Occupation During
Past 5 Years and Other Directorships |
Matthew J. Beck Age: 30 Secretary Began Serving: September 2018 | Principal Occupation(s): Senior Attorney, Ultimus Fund Solutions, LLC (since May 2018) and Secretary, Ultimus Managers Trust (since July 2018). Previous Position(s): Chief Compliance Officer, OBP Capital, LLC (May 2015 to May 2018); Secretary, Aspiration Funds (March 2015 to May 2018); Secretary, Starboard Investment Trust (September 2014 to May 2018); Secretary, Leeward Investment Trust (September 2014 to May 2018); Secretary, Hillman Capital Management Investment Trust (September 2014 to May 2018); Secretary, Spinnaker ETF Series (September 2014 to May 2018); Vice President and General Counsel, The Nottingham Company (July 2014 to May 2018). |
Stephen L. Preston Age: 52 Anti-Money Laundering Officer Began Serving: December 2016 | Principal Occupation(s): Chief Compliance Officer, Ultimus Fund Solutions, LLC and Ultimus Fund Distributors, LLC from June 2011 to present. |
Other Information (Unaudited)
The Fund’s Statement of Additional Information (“SAI”) includes additional information about the trustees and is available without charge, upon request. You may call toll-free at (844) 838-2119 to request a copy of the SAI or to make shareholder inquiries.
33
Approval of Investment Advisory Agreement (Unaudited)
At a quarterly meeting of the Board of Trustees of Capitol Series Trust (“Trust”) held on June 13 - 14, 2018, the Trust’s Board of Trustees (the “Board”), including all of the Trustees who are not “interested persons” of the Trust as that term is defined in Section 2(a)(19) of the Investment Company Act of 1940, as amended (the “1940 Act”) (the “Independent Trustees”), considered and approved the continuation for an additional one-year period of the Investment Advisory Agreement between the Trust and Preserver Partners, LLC (“Preserver”) (the “Investment Advisory Agreement”) with respect to the Preserver Alternative Opportunities Fund (the “Preserver Fund”), a series of the Trust.
Prior to the meeting, the Trustees received and considered information from Preserver and the Trust’s administrator designed to provide the Trustees with the information necessary to evaluate the terms of the proposed renewal of the Investment Advisory Agreement between the Trust and Preserver, including, but not limited to: Preserver’s response to counsel’s due diligence letter requesting information relevant to renewal of the Investment Advisory Agreement; the operating expense limitation agreement currently in effect between Preserver and the Preserver Fund (the “Expense Limitation Agreement”); and Morningstar peer group expense and performance data for comparative purposes (the “Support Materials”). At various times, the Trustees reviewed the Support Materials with Preserver, Trust management, and with counsel to the Independent Trustees. The completeness of the Support Materials provided by Preserver, which included both responses and materials provided in response to initial and supplemental due diligence requests, was noted. This information, together with the information provided to and reviewed by the Board throughout the course of the prior three years, formed the primary, but not exclusive, basis for the Board’s determinations. Before voting to approve the renewal of the Investment Advisory Agreement, the Trustees reviewed the terms and the form of Investment Advisory Agreement and the Support Materials with Trust management and with counsel to the Independent Trustees. The Trustees received and discussed a memorandum from such counsel delineating the legal standards governing their consideration of the renewal of the Investment Advisory Agreement, which memorandum described the various factors that the U.S. Securities and Exchange Commission (“SEC”) and U.S. Courts over the years have suggested would be appropriate for trustee consideration, including the factors outlined in Gartenberg v. Merrill Lynch Asset Management Inc., 694 F.2d 923, 928 (2d Cir. 1982); cert. denied sub. nom. and Andre v. Merrill Lynch Ready Assets Trust, Inc., 461 U.S. 906 (1983). A representative from Preserver also met with the Trustees and provided additional information to the Trustees regarding its services to the Preserver Fund, including but not limited to, information regarding its investment philosophy, the firm’s compliance culture, the ownership structure of Preserver, Preserver’s financial condition as reflected in its financial statements, Fund expenses that Preserver subsidizes, the resources that Preserver dedicates to servicing the Preserver Fund, Preserver’s profitability with respect to the Preserver Fund, Preserver’s marketing and distribution activities and plans for the Preserver Fund, Preserver��s succession planning, Preserver’s future plans with regard to the Preserver Fund, and other benefits that Preserver derives from its relationship with the Preserver Fund, among other topics.
34
After having received and reviewed the Support Materials, as well as quarterly investment performance, compliance, operating, and distribution reports on the Preserver Fund over an extended time period, the Trustees discussed the facts and factors relevant to the continuation of the Investment Advisory Agreement, which incorporated and reflected their knowledge of Preserver’s services to the Fund. Taking such information into account, the Board considered whether the overall arrangements between the Trust and Preserver as set forth in the Investment Advisory Agreement, including the investment advisory fees that the Preserver Fund pays to Preserver, continue to be fair and reasonable in light of the services Preserver performs, as well as such other matters as the Trustees considered relevant in the exercise of their reasonable business judgment.
In determining whether to approve the renewal of the Investment Advisory Agreement, the Trustees considered all factors they believed relevant, including the following, with respect to the Preserver Fund: (1) the nature, extent, and quality of the services provided by Preserver with respect to the Preserver Fund; (2) the cost of the services to be provided and the profits and losses realized by Preserver from services rendered to the Trust with respect to the Preserver Fund; (3) comparative fee and expense data for the Preserver Fund and other investment companies or institutional accounts with similar investment objectives; (4) the extent to which economies of scale would be realized as the Preserver Fund grows, and whether the advisory fees for the Fund reflect such economies of scale for the Preserver Fund’s benefit; and (5) other financial benefits to Preserver resulting from services rendered to the Preserver Fund. The material factors and conclusions that formed the basis of the Trustees’ determination to approve the continuation of the Investment Advisory Agreement are summarized below. In their deliberations, the Trustees did not identify any particular information that was all-important or controlling.
Nature, Extent and Quality of Services Provided. The Trustees considered the scope of services that Preserver provides under the Investment Advisory Agreement, noting that such services include, but are not limited to, the following: (1) investing the Preserver Fund’s assets consistent with the Fund’s investment objective and investment policies; (2) determining the portfolio securities to be purchased, sold or otherwise disposed of and the timing of such transactions; (3) voting all proxies with respect to the Preserver Fund’s portfolio securities; (4) maintaining the required books and records for transactions that Preserver effects on behalf of the Fund; and (5) selecting broker-dealers to execute orders on behalf of the Preserver Fund. The Trustees also noted that Preserver performs or will perform certain distribution, marketing and compliance services for the Preserver Fund, including, but not limited to, launching a new website for the Preserver Fund, engaging a marketing consultant or hiring a new employee focused on marketing, and attending key industry seminars. The Trustees considered Preserver’s capitalization and its assets under management, noting that Preserver’s assets under management and number of accounts have both increased. The Trustees also noted that there have been net purchases in the Preserver Fund and that the Preserver Fund’s assets under management have also increased. The Trustees further considered the investment philosophy and experience of the portfolio management team. The Trustees also noted the Preserver Fund’s performance compared to its benchmark. The Trustees considered that the Preserver Fund outperformed its benchmark for the one-year period ended March 31, 2018. The Trustees also considered the
35
Preserver Fund’s performance compared to its Morningstar peer group category. They noted that the Preserver Fund outperformed the median and average of its peer group for the one-year period ended March 31, 2018. The Trustees noted that the peer group comparison provided was filtered to include funds with a similar asset size to that of the Preserver Fund, and discussed the appropriateness of such a comparison. The Trustees concluded that they are satisfied with the nature, extent and quality of services that Preserver provides to the Preserver Fund under the Investment Advisory Agreement.
Cost of Advisory Services and Profitability. The Trustees considered the annual management fee that the Preserver Fund pays to Preserver under the Investment Advisory Agreement, as well as Preserver’s profitability from the services that it renders to the Fund. The Trustees further considered that Preserver has contractually agreed to reduce its management fees and, if necessary, reimburse the Preserver Fund for operating expenses, as specified in the Fund’s prospectus and Expense Limitation Agreement. The Trustees noted that Preserver is not yet profitable with respect to the advisory services it provides to the Preserver Fund. The Trustees also noted that, based on the pro forma profitability analysis provided by Preserver, that Preserver expects the services it provides to the Preserver Fund to be profitable in the coming year, and that such anticipated profits are reasonable.
Comparative Fee and Expense Data. The Trustees noted that Preserver charges a lower fee to the Preserver Fund than it charges to the private funds it manages. The Trustees further noted that those private funds have similar investment objectives to the Preserver Fund, but different portfolio compositions. The Trustees also observed that the Preserver Fund’s gross management fee is below the average and median management fee reported for its relevant Morningstar peer group. The Trustees also considered that the Preserver Fund’s total net expense ratio (after waivers and expense reimbursements) is above the average and median total net expense ratios (after waivers and expense reimbursements) reported for its relevant Morningstar peer group. The Trustees considered that even though the Preserver Fund’s total net expense ratio (after waivers and expense reimbursements) is above that of the median and average reported for its relevant Morningstar peer group, Preserver is not unjustly enriched. The Trustees also noted that the peer group comparisons included in the Support Materials were based upon funds in its peer group with similar net asset levels of under $25 million, and discussed the appropriateness of such comparisons. While recognizing that it is difficult to compare advisory fees because the scope of advisory services provided may vary from one investment adviser to another, the Trustees concluded that Preserver’s advisory fee continues to be reasonable.
Economies of Scale. The Trustees considered whether the Preserver Fund may benefit from any economies of scale, but did not find that any material economies exist at this time. The Trustees noted that the advisory fees charged by Preserver does not contain any fee breakpoints, but that due to the Preserver Fund’s asset size, the Board concluded that it is not necessary to consider the implementation of fee breakpoints at this time. In addition, the Board considered the fee structures of the Preserver Fund’s various service providers, noting that the Preserver Fund likely will not benefit from any economies of scale until fund assets increase. The Trustees also noted that the fact that the advisory fee charged by Preserver to the Preserver Fund is below the average and median of its peer group seems
36
to indicate that some economies of scale may already be reflected in the fee. Finally, the Trustees further noted that the investment style of the Preserver Fund may mean that economies of scale are more difficult to achieve.
Other Benefits. The Trustees considered the amount of 12b-1 fees generated by the Preserver Fund with respect to the Fund’s Retail Class, noting that such fees were small and that Preserver was subsidizing distribution and marketing activities from its own profits. The Trustees also considered the extent to which Preserver utilizes soft dollar arrangements with respect to portfolio transactions, and noted that Preserver does not utilize soft dollar arrangements in connection with the execution of client transactions, and that affiliated brokers are not utilized to execute the portfolio transactions of the Preserver Fund. The Trustees concluded that, all things considered, Preserver will not receive material additional financial benefits from services rendered to the Preserver Fund. The Trustees also noted that Preserve does not have any affiliates that could directly or indirectly benefit from the Preserver Fund.
Based upon Preserver’s presentation to the Board and the Support Materials considered in connection with the renewal of the Investment Advisory Agreement, as well as the information provided throughout the course of the year, the Board concluded that the overall arrangements between the Trust and Preserver, as set forth in the Investment Advisory Agreement between the Trust and Preserver, are fair and reasonable in light of the services to be performed, investment advisory fees to be paid and such other matters as the Trustees considered relevant in the exercise of their reasonable judgment.
37
FACTS | WHAT DOES CAPITOL SERIES TRUST DO WITH YOUR PERSONAL INFORMATION? |
Why? | Financial companies choose how they share your personal information. Federal law gives consumers the right to limit some but not all sharing. Federal law also requires us to tell you how we collect, share, and protect your personal information. Please read this notice carefully to understand what we do. |
What? | The types of personal information we collect and share depend on the product or service you have with us. This information can include: ■ Social Security number ■ account balances and account transactions ■ account transactions, transaction or loss history and purchase history ■ checking account information and wire transfer instructions When you are no longer our customer, we continue to share your information as described in this notice. |
How? | All financial companies need to share customers’ personal information to run their everyday business. In the section below, we list the reasons financial companies can share their customers’ personal information; the reasons Capitol Series Trust chooses to share; and whether you can limit this sharing. |
Reasons we can share your personal information | Does Capitol Series
Trust share? |
For our everyday business purposes—
such as to process your transactions, maintain your account(s), respond to court orders and legal investigations, or report to credit bureaus | Yes |
For our marketing purposes—
to offer our products and services to you | Yes |
For joint marketing with other financial companies | No |
For our affiliates’ everyday business purposes—
information about your transactions and experiences | No |
For our affiliates’ everyday business purposes—
information about your creditworthiness | No |
For nonaffiliates to market to you | No |
Questions? | Call 1-844-838-2119 |
38
Who we are |
Who is providing this notice? | Capitol Series Trust |
What we do |
How does Capitol Series Trust protect my personal information? | To protect your personal information from unauthorized access and use, we use security measures that comply with federal law. These measures include computer safeguards and secured files and buildings. |
How does Capitol Series Trust collect my personal information? | We collect your personal information, for example, when you ■ open an account or deposit money ■ buy securities from us or sell securities to us ■ make deposits or withdrawals from your account provide account information ■ give us your account information ■ make a wire transfer ■ tell us who receives the money ■ tell us where to send the money ■ show your government-issued ID ■ show your driver’s license |
Why can’t I limit all sharing? | Federal law gives you the right to limit only ■ sharing for affiliates’ everyday business purposes — information about your creditworthiness ■ affiliates from using your information to market to you ■ sharing for nonaffiliates to market to you State laws and individual companies may give you additional rights to limit sharing. |
Definitions |
Affiliates | Companies related by common ownership or control. They can be financial and nonfinancial companies. |
Nonaffiliates | Companies not related by common ownership or control. They can be financial and nonfinancial companies. ■ Capitol Series Trust does not share your personal information with nonaffiliates so they can market to you. |
Joint marketing | A formal agreement between nonaffiliated financial companies that together market financial products or services to you. ■ Capitol Series Trust doesn’t jointly market financial products or services to you. |
39
This page is intentionally left blank.
This page is intentionally left blank.
Proxy Voting (Unaudited)
A description of the policies and procedures that the Fund uses to determine how to vote proxies relating to portfolio securities and information regarding how the Fund voted those proxies during the most recent twelve month period ended June 30, is available without charge upon request by (1) calling the Fund at (844) 838-2119 and (2) from Fund documents filed with the Securities and Exchange Commission (“SEC”) on the SEC’s website at www.sec.gov.
TRUSTEES
Walter B. Grimm, Chairman
Mary M. Morrow
John C. Davis
Lori Kaiser
Janet Smith Meeks
Robert G. Dorsey
OFFICERS
Matthew J. Miller, Chief Executive Officer/President
Zachary P. Richmond, Chief Financial Officer/Treasurer
Brandon R. Kipp, Chief Compliance Officer
INVESTMENT ADVISER
Preserver Partners, LLC
8700 Trail Lake Drive West, Suite 105
Memphis, TN 38125
DISTRIBUTOR
Unified Financial Securities, LLC
9465 Counselors Row, Suite 200
Indianapolis, IN 46240
INDEPENDENT REGISTERED PUBLIC ACCOUNTING FIRM
Ernst & Young LLP
800 Yard Street, Suite 500
Grandview Heights, OH 43212
LEGAL COUNSEL
Bernstein Shur
100 Middle Street, 6th Floor
Portland, ME 04104
CUSTODIAN
Huntington National Bank
41 South High Street
Columbus, OH 43215
ADMINISTRATOR, TRANSFER AGENT AND FUND ACCOUNTANT
Ultimus Asset Services, LLC
225 Pictoria Drive, Suite 450
Cincinnati, OH 45246
This report is intended only for the information of shareholders or those who have received the Fund’s prospectus which contains information about the Fund’s management fee and expenses. Please read the prospectus carefully before investing.
Distributed by Unified Financial Securities, LLC
Member FINRA/SIPC
Item 2. Code of Ethics.
As of the end of the period covered by this report, the registrant has adopted a code of ethics that applies to the registrant's principal executive officer, principal financial officer, principal accounting officer or controller, or persons performing similar functions, regardless of whether these individuals are employed by the registrant or a third party. Pursuant to Item 12(a)(1), a copy of registrant’s code of ethics is filed as an exhibit to this Form N-CSR. During the period covered by this report, the code of ethics has not been amended, and the registrant has not granted any waivers, including implicit waivers, from the provisions of the code of ethics.
Item 3. Audit Committee Financial Expert.
(a) The registrant’s board of trustees has determined that the registrant does not have an audit committee financial expert. The committee members and the full Board considered a possibility of adding a member that would qualify as an expert. The audit committee determined that, although none of its members meet the technical definition of an audit committee expert, the committee has sufficient financial expertise to adequately perform its duties under the Audit Committee Charter without the addition of a qualified expert.
Item 4. Principal Accountant Fees and Services.
(a) Audit Fees billed to the registrant by its principal accountants for the two most recent fiscal years:
| Meritage Funds: | FY 2018 | $46,500 |
| | FY 2017 | $46,500 |
| | | |
| Preserver Alternative Opportunities Fund: | FY 2018 | $15,500 |
| | FY 2017 | $15,500 |
| | | |
| Hedeker Strategic Appreciation Fund: | FY 2018 | $19,000 |
| | FY 2017 | $22,900 |
(b) Audit-Related Fees billed to the registrant by its principal accountants for the two most recent fiscal years:
| Meritage Funds: | FY 2018 | $5,000 |
| | FY 2017 | $0 |
| | | |
| Preserver Alternative Opportunities Fund: | FY 2018 | $0 |
| | FY 2017 | $0 |
| | | |
| Hedeker Strategic Appreciation Fund: | FY 2018 | $0 |
| | FY 2017 | $0 |
(c) Tax Fees billed to the registrant by its principal accountants for the two most recent fiscal years:
| Meritage Funds: | FY 2018 | $15,000 |
| | FY 2017 | $15,000 |
| | | |
| Preserver Alternative Opportunities Fund: | FY 2018 | $5,000 |
| | FY 2017 | $5,000 |
| | | |
| Hedeker Strategic Appreciation Fund: | FY 2018 | $5,000 |
| | FY 2017 | $7,500 |
Nature of the fees: Preparation of the 1120 RIC and Excise review
(d) All other fees billed to the registrant by its principal accountants for the two most recent fiscal years:
| Meritage Funds: | FY 2018 | $0 |
| | FY 2017 | $0 |
| | | |
| Preserver Alternative Opportunities Fund: | FY 2018 | $0 |
| | FY 2017 | $0 |
| | | |
| Hedeker Strategic Appreciation Fund: | FY 2018 | $0 |
| | FY 2017 | $0 |
| (e)(1) | Audit Committee’s Pre-Approval Policies |
The Audit Committee Charter requires the Audit Committee to be responsible for the selection, retention or termination of auditors and, in connection therewith, to (i) evaluate the proposed fees and other compensation, if any, to be paid to the auditors, (ii) evaluate the independence of the auditors, (iii) pre-approve all audit services and, when appropriate, any non-audit services provided by the independent auditors to the Trust, (iv) pre-approve, when appropriate, any non-audit services provided by the independent auditors to the Trust's investment adviser, or any entity controlling, controlled by, or under common control with the investment adviser and that provides ongoing services to the Trust if the engagement relates directly to the operations and financial reporting of the Trust, and (v) receive the auditors’ specific representations as to their independence;
| (2) | Percentages of Services Approved by the Audit Committee |
| Registrant | |
| Audit-Related Fees: | 100% |
| Tax Fees: | 100% |
| All Other Fees: | 0% |
(f) During audit of registrant's financial statements for the most recent fiscal year, less than 50 percent of the hours expended on the principal accountant's engagement were attributed to work performed by persons other than the principal accountant's full-time, permanent employees.
(g) The aggregate non-audit fees billed by the registrant's accountant for services rendered to the registrant, and rendered to the registrant's investment adviser (not including any sub-adviser whose role is primarily portfolio management and is subcontracted with or overseen by another investment adviser), and any entity controlling, controlled by, or under common control with the adviser that provides ongoing services to the registrant:
| | Registrant | Adviser |
| FY 2018 | $25,000 | $0 |
| FY 2017 | $27,500 | $0 |
(h) Not applicable. The auditor performed no services for the registrant’s investment adviser or any entity controlling, controlled by, or under common control with the investment adviser that provides ongoing services to the registrant.
Item 5. Audit Committee of Listed Registrants.
NOT APPLICABLE – applies to listed companies only
Item 6. Schedule of Investments. Schedule filed with Item 1.
Item 7. Disclosure of Proxy Voting Policies and Procedures for Closed-End Management Investment Companies.
NOT APPLICABLE – applies to closed-end funds only
Item 8. Portfolio Managers of Closed-End Management Investment Companies.
NOT APPLICABLE – applies to closed-end funds only
Item 9. Purchases of Equity Securities by Closed-End Management Investment Company and Affiliated Purchasers.
NOT APPLICABLE – applies to closed-end funds only
Item 10. Submission of Matters to a Vote of Security Holders.
The guidelines applicable to shareholders desiring to submit recommendations for nominees to the Registrant's board of trustees are contained in the statement of additional information of the Trust with respect to the Fund(s) for which this Form N-CSR is being filed.
Item 11. Controls and Procedures.
(a) Based on their evaluation of the registrant’s disclosure controls and procedures (as defined in Rule 30a-3(c) under the Investment Company Act of 1940, as amended (the “Act”)) as of a date within 90 days of the filing date of this report, the registrant’s principal executive officer and principal financial officer have concluded that such disclosure controls and procedures are reasonably designed and are operating effectively to ensure that material information relating to the registrant is made known to them by others within those entities, particularly during the period in which this report is being prepared, and that the information required in filings on Form N-CSR is recorded, processed, summarized, and reported on a timely basis.
(b) There were no changes in the registrant’s internal control over financial reporting (as defined in Rule 30a-3(d) under the Investment Company Act of 1940) that occurred during the second fiscal quarter of the period covered by this report that have materially affected, or are reasonably likely to materially affect, the registrant’s internal control over financial reporting.
Item 12. Disclosure of Securities Lending Activities for Closed-End Management Investment Companies.
NOT APPLICABLE – applies to closed-end funds only
Item 13. Exhibits.
| (a)(1) | Code is filed herewith. |
| (a)(2) | Certifications by the registrant's principal executive officer and principal financial officer, pursuant to Section 302 of the Sarbanes-Oxley Act of 2002 and required by Rule 30a-2under the Investment Company Act of 1940 are filed herewith. |
| (b) | Certifications pursuant to Rule 30a-2(b) are furnished herewith. |
SIGNATURES
Pursuant to the requirements of the Securities Exchange Act of 1934 and the Investment Company Act of 1940, the registrant has duly caused this report to be signed on its behalf by the undersigned, thereunto duly authorized.
| (Registrant) | Capitol Series Trust | | |
| | | | |
| By (Signature and Title) | /s/ Matthew J. Miller | |
| | | Matthew J. Miller, Chief Executive Officer and President |
| | | | |
| Date | 10/25/2018 | | |
Pursuant to the requirements of the Securities Exchange Act of 1934 and the Investment Company Act of 1940, this report has been signed below by the following persons on behalf of the registrant and in the capacities and on the dates indicated.
| By (Signature and Title) | /s/ Matthew J. Miller | |
| | | Matthew J. Miller, Chief Executive Officer and President |
| | | | |
| Date | 10/25/2018 | | |
| | | | |
| By (Signature and Title) | /s/ Zachary P. Richmond | |
| | | Zachary P. Richmond, Treasurer and Chief Financial Officer |
| | | | |
| Date | 10/25/2018 | | |