UNITED STATES
SECURITIES AND EXCHANGE COMMISSION
Washington, D.C. 20549
FORM N-CSR
CERTIFIED SHAREHOLDER REPORT OF REGISTERED
MANAGEMENT INVESTMENT COMPANIES
Investment Company Act file number: 811-22895
Capitol Series Trust
(Exact name of registrant as specified in charter)
Ultimus Asset Services, LLC
225 Pictoria Drive, Suite 450
Cincinnati, OH 45246
(Address of principal executive offices) (Zip code)
Zachary P. Richmond
Ultimus Asset Services, LLC
225 Pictoria Drive, Suite 450
Cincinnati, OH 45246
(Name and address of agent for service)
Registrant’s telephone number, including area code: 513-587-3400
Date of fiscal year end: September 30
Date of reporting period: September 30, 2017
Item 1. Reports to Stockholders.
Fuller & Thaler Behavioral Small-Cap Equity Fund
Annual Report
September 30, 2017

411 Borel Avenue, Suite 300
San Mateo, CA 94402
(888) 912-4562
Fuller & Thaler Behavioral Small-Cap Equity Fund
Annual Report Commentary
September 30, 2017
For the period of October 1, 2016, through September 30, 2017, as provided by Raife Giovinazzo, CFA, PhD, Portfolio Manager.
For the 12-month period ended September 30, 2017, the Institutional Shares of the Fuller & Thaler Behavioral Small-Cap Equity Fund (the “Fund”) returned 28.20%. The Fund outperformed its U.S. small-cap equity benchmark, the Russell 2000® Index, by 7.46% over that period.
On average, our sector allocation detracted from performance; however, our behavioral process delivered superior stock selection which allowed the fund to outperform overall. In general, we aim to deliver a portfolio with similar sector composition and risk characteristics to that of our benchmark, but we will deviate when stock-specific opportunities arise.
Our investment process is based on decades of research into behavioral finance. On October 9th, our very own Dr. Richard Thaler won the 2017 Nobel Prize® in Economics for his research on behavioral finance!
Behavioral finance is the study of how investors actually behave, as opposed to how they should behave, when making investment decisions. Professional investors are human, and like all humans, they make mistakes. Investors make mistakes because they have emotions, use imperfect rules-of-thumb, and have priorities beyond risk and return. We look for those mistakes. We predict when other investors – the “market” – have likely made a behavioral mistake, and in turn, have created a buying opportunity.
There are two kinds of mistakes that produce buying opportunities: over-reaction and under-reaction. Other investors may over-react to bad news and losses (e.g., panic). Or they may under-react to good news (e.g., not pay attention). At the individual stock level, we search for events that suggest this type of investor misbehavior. If these behaviors are present, we then check fundamentals. In summary, if an investor mistake is likely and the company has solid fundamentals – we buy the stock.
While investors make mistakes in asset classes of all types and sizes, we believe they make even more mistakes in small-cap stocks. Why? Small-cap stocks receive less attention, making mistakes even more likely. Furthermore, there are four times more small-cap stocks than large-cap stocks – providing four times the opportunity set. Our fund invests in a portfolio of U.S. small-cap stocks and delivers similar risk characteristics to the Russell 2000. We believe our behavioral insights provide us with an opportunity to outperform.
Overall, our fund outperformed the major US stock indexes this past year, and has outperformed since inception. Looking forward, we see many opportunities. We believe our unique, behaviorally-driven investment process will continue to identify these opportunities and allow our fund to outperform both our peers and our benchmark.
Nobel Prize® is a trademark of the Nobel Foundation.
1
Investment Results (Unaudited)
Average Annual Total Returns* as of September 30, 2017
| | | | | | | | | | | | | | | | |
| | | One
Year | | | Three
Year | | | Five
Year | | | Since
Inception
(9/8/11) | |
Fuller & Thaler Behavioral Small-Cap Equity Fund | | | | | | | | | | | | | |
R6 Shares (formerly, Institutional Shares) | | | 28.35% | | | | 14.52% | | | | 16.80% | | | | 18.44% | |
Investor Shares (formerly, A Shares) | | | 27.97% | | | | 14.16% | | | | 16.43% | | | | 18.07% | |
Institutional Shares (formerly, Select Shares) | | | 28.20% | | | | 14.33% | | | | 16.63% | | | | 18.27% | |
Russell 2000® Index(a) | | | 20.74% | | | | 12.18% | | | | 13.79% | | | | 15.03% | |
| | |
| | | | | | Expense Ratios(b) | |
| | | | | | R6 Shares | | | Investor
Shares | | | Institutional
Shares | |
Gross | | | | | | | 2.67% | | | | 3.12% | | | | 2.87% | |
With Applicable Waivers | | | | | | | 0.82% | | | | 1.07% | | | | 0.92% | |
The performance quoted represents past performance, which does not guarantee future results. The investment return and principal value of an investment will fluctuate so that an investor’s shares, when redeemed, may be worth more or less than their original cost. The returns shown do not reflect the deduction of taxes that a shareholder would pay on Fuller & Thaler Behavioral Small-Cap Equity Fund (the “Fund”) distributions or the redemption of Fund shares. Current performance of the Fund may be lower or higher than the performance quoted. The Fund’s investment objectives, risks, charges and expenses must be considered carefully before investing. Performance data current to the most recent month end may be obtained by calling (888) 912-4562.
* Return figures reflect any change in price per share and assume the reinvestment of all distributions. The Fund’s returns reflect any fee waivers during the applicable periods. If such fee waivers had not occurred, the quoted performance would have been lower. Prior to October 26, 2015, the performance reflected represents that of a series of Allianz Funds Multi-Strategy Trust for which the Adviser served as the sole sub-adviser (the “Predecessor Fund”) (see Note 1).
(a) The Russell 2000® Index (“Russell 2000”) is a widely recognized unmanaged index of equity securities and is representative of a broader domestic equity market and range of securities than is found in the Fund’s portfolio. The Russell 2000 measures the performance of the small cap segment of the U.S. equity universe. The Russell 2000 is a subset of the Russell 3000® Index and represents approximately 10% of total market capitalization of that index. Individuals cannot invest directly in an index; however, an individual can invest in exchange traded funds or other investment vehicles that attempt to track the performance of a benchmark index.
(b) The expense ratios are from the Fund’s prospectus dated January 31, 2017. Fuller & Thaler Asset Management, Inc. (the “Adviser”) has contractually agreed to waive its management fee and/or reimburse certain operating expenses so that total annual operating expenses, excluding interest, taxes, brokerage fees and commission, other extraordinary expense not incurred in the ordinary course of the Fund’s business and indirect expenses such as acquired fund fees and expenses, do not exceed 0.80%, 1.05% and 0.90% for R6 Shares, Investor Shares, and Institutional Shares, respectively, of the Fund’s average daily net assets through January 31, 2018, and 0.80%, 1.25% and 0.97% for R6 Shares, Investor Shares, and Institutional Shares, respectively, of the Fund’s average daily net assets through January 31, 2019. Additional information pertaining to the Fund’s expense ratios as of September 30, 2017 can be found on the financial highlights.
The Fund’s investment objectives, strategies, risks, charges and expenses must be considered carefully before investing. The Fund’s prospectus contains this and other important information about the Fund and may be obtained by calling (888) 912-4562. Please read it carefully before investing.
The Fund is distributed by Unified Financial Securities, LLC, member FINRA/SIPC.
2
Investment Results (Unaudited) (continued)
Comparison of the Growth of a $1,000,000 Investment in the Fuller & Thaler Behavioral Small-Cap Equity Fund - R6 Shares and the Russell 2000® Index.
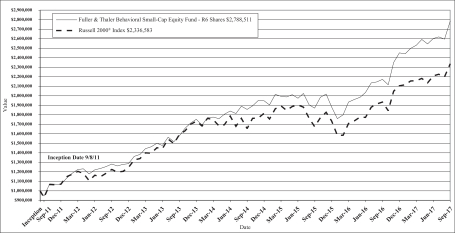
The chart above assumes an initial investment of $1,000,000 made on September 8, 2011 (commencement of operations) and held through September 30, 2017. THE FUND’S RETURNS REPRESENT PAST PERFORMANCE AND DO NOT GUARANTEE FUTURE RESULTS. The returns shown do not reflect deduction of taxes that a shareholder would pay on the Fund’s distributions or the redemption of the Fund’s shares. Investment returns and principal values will fluctuate so that your shares, when redeemed, may be worth more or less than their original purchase price.
Current performance may be lower or higher than the performance data quoted. For more information on the Fund, and to obtain performance data current to the most recent month-end, or to request a prospectus, please call (888) 912-4562. You should carefully consider the investment objectives, potential risks, management fees, and charges and expenses of the Fund before investing. The Fund’s prospectus contains this and other information about the Fund, and should be read carefully before investing.
The Fund is the successor to the investment performance of a series of Allianz Funds Multi-Strategy Trust for which the Adviser served as the sole sub-adviser (the “Predecessor Fund”), as a result of the reorganization of the Predecessor Fund into the Fund on October 23, 2015 (see Note 1). The Fund’s performance during the periods reflected in the chart prior to that date may have been different from that of the Predecessor Fund due to differences in their principal investment strategies, as well as fees and expenses. Visit www.fullerthalerfunds.com for more current performance information.
The Fund is distributed by Unified Financial Securities, LLC, Member FINRA/SIPC.
3
Portfolio Illustration (Unaudited)
September 30, 2017
Fuller & Thaler Behavioral Small-Cap Equity Fund Holdings as of September 30, 2017*
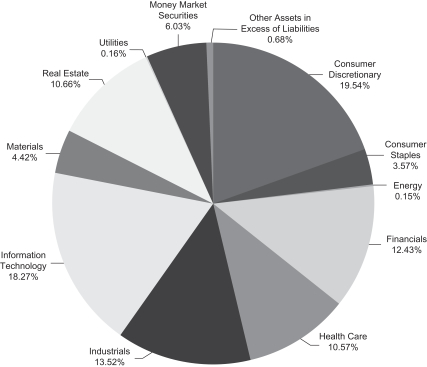
| * | As a percentage of net assets. |
Availability of Portfolio Schedule (Unaudited)
The Fund files its complete schedule of portfolio holdings with the Securities and Exchange Commission (“SEC”) for the first and third quarters of each fiscal year on Form N-Q. The Fund’s Forms N-Q are available at the SEC’s website at www.sec.gov. The Fund’s Forms N-Q may be reviewed and copied at the Public Reference Room in Washington DC. Information on the operation of the Public Reference Room may be obtained by calling 1-800-SEC-0330.
4
Fuller & Thaler Behavioral Small-Cap Equity Fund
Schedule of Investments
September 30, 2017
| | | | | | | | |
| Shares | | | | | Fair Value | |
| | Common Stocks – 93.29%
| | | | |
| |
| | | | Auto Components – 1.13% | |
| | 21,300 | | | Visteon Corp. * | | $ | 2,636,301 | |
| | | | | | | | |
| |
| | | | Automobiles – 1.92% | |
| | 35,400 | | | Thor Industries, Inc. | | | 4,457,214 | |
| | | | | | | | |
| |
| | | | Banks – 4.69% | |
| | 118,836 | | | Farmers National Banc Corp. | | | 1,788,482 | |
| | 87,100 | | | Financial Institutions, Inc. | | | 2,508,480 | |
| | 19,884 | | | Northrim Bancorp, Inc. | | | 694,946 | |
| | 40,846 | | | Old Line Bancshares, Inc. | | | 1,143,688 | |
| | 66,100 | | | TowneBank | | | 2,214,350 | |
| | 99,600 | | | TriState Capital Holdings, Inc. * | | | 2,280,840 | |
| | 7,420 | | | WashingtonFirst Bankshares, Inc. | | | 264,078 | |
| | | | | | | | |
| | | | | | | 10,894,864 | |
| | | | | | | | |
| |
| | | | Building Products – 1.84% | |
| | 47,500 | | | Trex Co., Inc. * | | | 4,278,325 | |
| | | | | | | | |
| |
| | | | Capital Markets – 0.48% | |
| | 25,700 | | | Moelis & Co. – Class A | | | 1,106,385 | |
| | | | | | | | |
| |
| | | | Chemicals – 3.65% | |
| | 31,100 | | | Innophos Holdings, Inc. | | | 1,529,809 | |
| | 52,300 | | | KMG Chemicals, Inc. | | | 2,870,224 | |
| | 14,600 | | | Koppers Holdings, Inc. * | | | 673,790 | |
| | 50,900 | | | Trinseo S.A. | | | 3,415,390 | |
| | | | | | | | |
| | | | | | | 8,489,213 | |
| | | | | | | | |
| |
| | | | Commercial Services & Supplies – 4.09% | |
| | 65,000 | | | Casella Waste Systems, Inc. – Class A * | | | 1,222,000 | |
| | 68,100 | | | Healthcare Services Group, Inc. | | | 3,675,357 | |
| | 37,700 | | | Quad Graphics, Inc. | | | 852,397 | |
| | 94,900 | | | SP Plus Corp. * | | | 3,748,550 | |
| | | | | | | | |
| | | | | | | 9,498,304 | |
| | | | | | | | |
| | | | Communications Equipment – 2.15% | |
| | 419,800 | | | Extreme Networks, Inc. * | | | 4,991,422 | |
| | | | | | | | |
| |
| | | | Construction & Engineering – 2.17% | |
| | 119,100 | | | Comfort Systems USA, Inc. | | | 4,251,870 | |
| | 21,400 | | | Quanta Services, Inc. * | | | 799,718 | |
| | | | | | | | |
| | | | | | | 5,051,588 | |
| | | | | | | | |
| |
| | | | Diversified Consumer Services – 2.00% | |
| | 63,000 | | | Capella Education Co. | | | 4,419,450 | |
| | 9,300 | | | Collectors Universe, Inc. | | | 222,921 | |
| | | | | | | | |
| | | | | | | 4,642,371 | |
| | | | | | | | |
| |
| | | | Electronic Equipment, Instruments & Components – 5.08% | |
| | 39,400 | | | Control4 Corp. * | | | 1,160,724 | |
| | 8,900 | | | Insight Enterprises, Inc. * | | | 408,688 | |
| | 31,300 | | | Sanmina Corp. * | | | 1,162,795 | |
| | 27,900 | | | SYNNEX Corp. | | | 3,529,629 | |
| | 299,300 | | | TTM Technologies, Inc. * | | | 4,600,241 | |
| | 38,700 | | | Vishay Precision Group, Inc. * | | | 944,280 | |
| | | | | | | | |
| | | | | | | 11,806,357 | |
| | | | | | | | |
| |
| | | | Equity Real Estate Investment Trusts (REITs) – 8.77% | |
| | 426,900 | | | Armada Hoffler Properties, Inc. | | | 5,895,489 | |
| | 35,880 | | | CorEnergy Infrastructure Trust, Inc. | | | 1,268,358 | |
| | 278,100 | | | Franklin Street Properties Corp. | | | 2,953,422 | |
| | 122,500 | | | InfraREIT, Inc. | | | 2,740,325 | |
| | 3,800 | | | OUTFRONT Media, Inc. | | | 95,684 | |
| | 69,300 | | | Select Income REIT | | | 1,623,006 | |
| | 275,900 | | | Xenia Hotels & Resorts, Inc. | | | 5,807,695 | |
| | | | | | | | |
| | | | | | | 20,383,979 | |
| | | | | | | | |
See accompanying notes which are an integral part of these financial statements.
5
Fuller & Thaler Behavioral Small-Cap Equity Fund
Schedule of Investments (continued)
September 30, 2017
| | | | | | | | |
| Shares | | | | | Fair Value | |
| | Common Stocks – (continued) | | | | |
| |
| | | | Food Products – 0.09% | |
| | 3,100 | | | John B. Sanfilippo & Son, Inc. | | $ | 208,661 | |
| | | | | | | | |
| |
| | | | Health Care Equipment & Supplies – 0.43% | |
| | 11,500 | | | Masimo Corp. * | | | 995,440 | |
| | | | | | | | |
| |
| | | | Hotels Restaurants & Leisure – 6.19% | |
| | 70,800 | | | Bob Evans Farms, Inc. | | | 5,487,708 | |
| | 74,700 | | | Del Frisco’s Restaurant Group, Inc. * | | | 1,086,885 | |
| | 7,500 | | | Marcus Corp./The | | | 207,750 | |
| | 362,900 | | | Ruth’s Hospitality Group, Inc. | | | 7,602,755 | |
| | | | | | | | |
| | | | | | | 14,385,098 | |
| | | | | | | | |
| |
| | | | Household Durables – 0.35% | |
| | 22,200 | | | Beazer Homes USA, Inc. * | | | 416,028 | |
| | 4,600 | | | NACCO Industries, Inc. – Class A | | | 394,680 | |
| | | | | | | | |
| | | | | | | 810,708 | |
| | | | | | | | |
| |
| | | | Household Products – 3.48% | |
| | 217,600 | | | Central Garden & Pet Co. – Class A * | | | 8,092,544 | |
| | | | | | | | |
| |
| | | | Insurance – 3.07% | |
| | 21,000 | | | Heritage Insurance Holdings, Inc. | | | 277,410 | |
| | 37,400 | | | James River Group Holdings Ltd. | | | 1,551,352 | |
| | 253,400 | | | State National Companies, Inc. | | | 5,318,866 | |
| | | | | | | | |
| | | | | | | 7,147,628 | |
| | | | | | | | |
| |
| | | | Internet Software & Services – 2.80% | |
| | 257,000 | | | Blucora, Inc. * | | | 6,502,100 | |
| | | | | | | | |
| |
| | | | IT Services – 3.06% | |
| | 109,800 | | | Convergys Corp. | | | 2,842,722 | |
| | 106,500 | | | CSG Systems International, Inc. | | | 4,270,650 | |
| | | | | | | | |
| | | | | | | 7,113,372 | |
| | | | | | | | |
| | | | Leisure Products – 0.59% | |
| | 18,800 | | | Johnson Outdoors, Inc. – Class A | | | 1,377,664 | |
| | | | | | | | |
| |
| | | | Life Sciences Tools & Services – 4.66% | |
| | 191,400 | | | Bruker Corp. | | | 5,694,150 | |
| | 52,600 | | | PRA Health Sciences, Inc. * | | | 4,006,542 | |
| | 33,900 | | | VWR Corp. * | | | 1,122,429 | |
| | | | | | | | |
| | | | | | | 10,823,121 | |
| | | | | | | | |
| |
| | | | Machinery – 0.39% | |
| | 60,200 | | | Spartan Motors, Inc. | | | 665,210 | |
| | 8,100 | | | SPX Corp. * | | | 237,654 | |
| | | | | | | | |
| | | | | | | 902,864 | |
| | | | | | | | |
| |
| | | | Metals & Mining – 0.77% | |
| | 479,100 | | | Gold Resource Corp. | | | 1,796,625 | |
| | | | | | | | |
| |
| | | | Mortgage Real Estate Investment Trusts (REITS) – 0.43% | |
| | 58,100 | | | Invesco Mortgage Capital, Inc. | | | 995,253 | |
| | | | | | | | |
| |
| | | | Multi-Utilities – 0.16% | |
| | 7,400 | | | Unitil Corp. | | | 366,004 | |
| | | | | | | | |
| |
| | | | Oil, Gas & Consumable Fuels – 0.15% | |
| | 10,400 | | | World Fuel Services Corp. | | | 352,664 | |
| | | | | | | | |
| |
| | | | Pharmaceuticals – 5.48% | |
| | 84,600 | | | Catalent, Inc. * | | | 3,377,232 | |
| | 145,100 | | | Corcept Therapeutics, Inc. * | | | 2,800,430 | |
| | 177,250 | | | Phibro Animal Health Corp. – Class A | | | 6,567,112 | |
| | | | | | | | |
| | | | | | | 12,744,774 | |
| | | | | | | | |
| |
| | | | Professional Services – 0.37% | |
| | 20,900 | | | CRA International, Inc. | | | 857,945 | |
| | | | | | | | |
| |
| | | | Real Estate Management & Development – 1.89% | |
| | 18,200 | | | HFF, Inc. – Class A * | | | 719,992 | |
| | 30,100 | | | Marcus & Millichap, Inc. * | | | 812,399 | |
See accompanying notes which are an integral part of these financial statements.
6
Fuller & Thaler Behavioral Small-Cap Equity Fund
Schedule of Investments (continued)
September 30, 2017
| | | | | | | | |
| Shares | | | | | Fair Value | |
| | Common Stocks – (continued) | | | | |
| |
| | | | Real Estate Management & Development – (continued) | |
| | 55,625 | | | RMR Group, Inc./The – Class A | | $ | 2,856,343 | |
| | | | | | | | |
| | | | | | | 4,388,734 | |
| | | | | | | | |
| |
| | | | Road & Rail – 3.75% | |
| | 87,600 | | | Landstar System, Inc. | | | 8,729,340 | |
| | | | | | | | |
| |
| | | | Semiconductors & Semiconductor Equipment – 5.19% | |
| | 31,700 | | | Alpha & Omega SemiConductor Ltd. * | | | 522,733 | |
| | 23,300 | | | Cirrus Logic, Inc. * | | | 1,242,356 | |
| | 336,300 | | | Ultra Clean Holdings, Inc. * | | | 10,297,506 | |
| | | | | | | | |
| | | | | | | 12,062,595 | |
| | | | | | | | |
| |
| | | | Specialty Retail – 7.21% | |
| | 327,750 | | | DSW, Inc. – Class A | | | 7,040,070 | |
| | 406,100 | | | Sally Beauty Holdings, Inc. * | | | 7,951,438 | |
| | 47,900 | | | Select Comfort Corp. * | | | 1,487,295 | |
| | 2,200 | | | Winmark Corp. | | | 289,850 | |
| | | | | | | | |
| | | | | | | 16,768,653 | |
| | | | | | | | |
| |
| | | | Textiles, Apparel & Luxury Goods – 0.15% | |
| | 14,800 | | | Perry Ellis International, Inc. * | | | 350,168 | |
| | | | | | | | |
| |
| | | | Thrifts & Mortgage Finance – 3.76% | |
| | 34,900 | | | Federal Agricultural Mortgage Corp. – Class C | | | 2,538,626 | |
| | | | Thrifts & Mortgage Finance – (continued) | |
| | 492,800 | | | NMI Holdings, Inc. – Class A * | | | 6,110,720 | |
| | 9,500 | | | Western New England Bancorp, Inc. | | | 103,550 | |
| | | | | | | | |
| | | | | | | 8,752,896 | |
| | | | | | | | |
| |
| | | | Trading Companies & Distributors – 0.90% | |
| | 45,400 | | | Rush Enterprises, Inc. –Class A * | | | 2,101,566 | |
| | | | | | | | |
| | | | Total Common Stocks (Cost $196,062,338) | | | 216,862,740 | |
| | | | | | | | |
| |
| | | | Money Market Securities – 6.03% | |
| | 14,023,321 | | | Fidelity Investments Money Market Government Portfolio – Institutional Class, 0.95%(a) | | | 14,023,321 | |
| | | | | | | | |
| | | | Total Money Market Securities (Cost $14,023,321) | | | 14,023,321 | |
| | | | | | | | |
| | | | Total Investments – 99.32% (Cost $210,085,659) | | | 230,886,061 | |
| | | | | | | | |
| | | | Other Assets in Excess of Liabilities – 0.68% | | | 1,590,930 | |
| | | | | | | | |
| | | | NET ASSETS – 100.00% | | $ | 232,476,991 | |
| | | | | | | | |
| (a) | | Rate disclosed is the seven day effective yield as of September 30, 2017. |
| * | | Non-income producing security. |
The industries shown on the schedule of investments are based on the Global Industry Classification Standard, or GICS® (“GICS”). The GICS was developed by and/or is the exclusive property of MSCI, Inc. and Standard & Poor’s Financial Services LLC (“S&P”). GICS is a service mark of MSCI, Inc. and S&P and has been licensed for use by the Administrator.
See accompanying notes which are an integral part of these financial statements.
7
Fuller & Thaler Behavioral Small-Cap Equity Fund
Statement of Assets and Liabilities
September 30, 2017
| | | | |
Assets | | | | |
Investments in securities at fair value (cost $210,085,659) | | $ | 230,886,061 | |
Receivable for fund shares sold | | | 1,435,874 | |
Dividends receivable | | | 304,746 | |
Prepaid expenses | | | 64,876 | |
Total Assets | | | 232,691,557 | |
Liabilities | | | | |
Payable for fund shares redeemed | | | 30,219 | |
Payable to Adviser | | | 71,035 | |
Payable to Administrator | | | 19,035 | |
Accrued 12b-1 fees – Investor Shares(a) | | | 16,845 | |
Accrued administrative service fees – Investor Shares(a) | | | 4,969 | |
Accrued administrative service fees – Institutional Shares(b) | | | 20,983 | |
Payable to auditors | | | 18,225 | |
Other accrued expenses | | | 33,255 | |
Total Liabilities | | | 214,566 | |
Net Assets | | $ | 232,476,991 | |
Net Assets consist of: | | | | |
Paid-in capital | | $ | 212,609,906 | |
Accumulated undistributed net investment income | | | 617,927 | |
Accumulated undistributed net realized loss from investment transactions | | | (1,551,244 | ) |
Net unrealized appreciation on investments | | | 20,800,402 | |
Net Assets | | $ | 232,476,991 | |
R6 Shares(c): | | | | |
Net Assets | | $ | 3,739,637 | |
Shares outstanding (unlimited number of shares authorized, no par value) | | | 154,243 | |
Net asset value, offering and redemption price per share | | $ | 24.25 | |
Investor Shares(a): | | | | |
Net Assets | | $ | 56,499,536 | |
Shares outstanding (unlimited number of shares authorized, no par value) | | | 2,362,776 | |
Net asset value, offering and redemption price per share | | $ | 23.91 | |
Institutional Shares(b): | | | | |
Net Assets | | $ | 172,237,818 | |
Shares outstanding (unlimited number of shares authorized, no par value) | | | 7,156,797 | |
Net asset value, offering and redemption price per share | | $ | 24.07 | |
| (a) | | A Shares were renamed Investor Shares on January 30, 2017. |
| (b) | | Select Shares were renamed Institutional Shares on January 30, 2017. |
| (c) | | Institutional Shares were renamed R6 Shares on January 30, 2017. |
8
See accompanying notes which are an integral part of these financial statements.
Fuller & Thaler Behavioral Small-Cap Equity Fund
Statement of Operations
For the year ended September 30, 2017
| | | | |
Investment Income: | | | | |
Dividend income (net of foreign taxes withheld of $51) | | $ | 1,417,797 | |
Total investment income | | | 1,417,797 | |
Expenses: | | | | |
Investment Adviser | | | 480,124 | |
12b-1—Investor Shares(a) | | | 73,577 | |
Administrative services – Investor Shares(a) | | | 36,322 | |
Administrative services – Institutional Shares(b) | | | 49,235 | |
Registration | | | 78,021 | |
Administration | | | 69,873 | |
Fund accounting | | | 36,831 | |
Transfer agent | | | 24,853 | |
Printing | | | 24,156 | |
Audit | | | 22,255 | |
Custodian | | | 16,424 | |
Legal | | | 15,425 | |
Trustee | | | 8,231 | |
Pricing | | | 3,780 | |
Miscellaneous | | | 45,161 | |
Total expenses | | | 984,268 | |
Fees contractually waived by Adviser | | | (230,667 | ) |
Net operating expenses | | | 753,601 | |
Net investment income | | | 664,196 | |
Net Realized and Change in Unrealized Gain (Loss) on Investments | |
Net realized loss on investment securities transactions | | | (21,674 | ) |
Net change in unrealized appreciation of investment securities | | | 20,060,434 | |
Net realized and change in unrealized gain (loss) on investments | | | 20,038,760 | |
Net increase in net assets resulting from operations | | $ | 20,702,956 | |
| (a) | | A Shares were renamed Investor Shares on January 30, 2017. |
| (b) | | Select Shares were renamed Institutional Shares on January 30, 2017. |
9
See accompanying notes which are an integral part of these financial statements.
Fuller & Thaler Behavioral Small-Cap Equity Fund
Statements of Changes in Net Assets
| | | | | | | | |
| | | For the
Year Ended
September 30, 2017 | | | For the
Year Ended
September 30, 2016 | |
Increase (Decrease) in Net Assets due to: Operations | | | | | | | | |
Net investment income | | $ | 664,196 | | | $ | 150,399 | |
Net realized loss on investment securities transactions | | | (21,674 | ) | | | (1,039,731 | ) |
Net change in unrealized appreciation of investment securities | | | 20,060,434 | | | | 1,066,736 | |
Net increase in net assets resulting from operations | | | 20,702,956 | | | | 177,404 | |
Distributions From: | | | | | | | | |
Net investment income: | | | | | | | | |
R6 Shares(a) | | | (14,527 | ) | | | (227,200 | ) |
Investor Shares(b) | | | (56,063 | ) | | | (40,148 | ) |
Institutional Shares(c) | | | (58,034 | ) | | | (265 | ) |
Net realized gains: | | | | | | | | |
R6 Shares(a) | | | – | | | | (1,854,228 | ) |
Investor Shares(b) | | | – | | | | (336,805 | ) |
Institutional Shares(c) | | | – | | | | (2,229 | ) |
Total Distributions | | | (128,624 | ) | | | (2,460,875 | ) |
Capital Transactions: | | | | | | | | |
R6 Shares(a): | | | | | | | | |
Proceeds from shares sold | | | 247,681 | | | | 901,044 | |
Reinvestment of distributions | | | 14,527 | | | | 2,081,427 | |
Amount paid for shares redeemed | | | (531,371 | ) | | | (13,082,906 | ) |
Total R6 Shares | | | (269,163 | ) | | | (10,100,435 | ) |
Investor Shares(b): | | | | | | | | |
Proceeds from shares sold | | | 60,961,777 | | | | 2,166,579 | |
Shares issued in connection with Reorganization(d) | | | – | | | | 2,552,871 | |
Reinvestment of distributions | | | 31,779 | | | | 368,436 | |
Amount paid for shares redeemed | | | (14,978,940 | ) | | | (1,478,847 | ) |
Total Investor Shares | | | 46,014,616 | | | | 3,609,039 | |
C Shares(d): | | | | | | | | |
Proceeds from shares sold | | | – | | | | 6,815 | |
Shares redeemed in connection with Reorganization(d) | | | – | | | | (429,826 | ) |
Amount paid for shares redeemed | | | – | | | | (310,842 | ) |
Total C Shares | | | – | | | | (733,853 | ) |
D Shares(d): | | | | | | | | |
Proceeds from shares sold | | | – | | | | 7,358 | |
Shares redeemed in connection with Reorganization(d) | | | – | | | | (2,123,045 | ) |
Amount paid for shares redeemed | | | – | | | | (26,679 | ) |
Total D Shares | | | – | | | | (2,142,366 | ) |
10
See accompanying notes which are an integral part of these financial statements.
Fuller & Thaler Behavioral Small-Cap Equity Fund
Statements of Changes in Net Assets (continued)
| | | | | | | | |
| | | For the
Year Ended
September 30, 2017 | | | For the
Year Ended
September 30, 2016 | |
Capital Transactions (continued): | | | | | | | | |
Institutional Shares(c): | | | | | | | | |
Proceeds from shares sold | | $ | 162,256,005 | | | $ | 1,968,894 | |
Reinvestment of distributions | | | 53,301 | | | | 2,495 | |
Amount paid for shares redeemed | | | (5,758,532 | ) | | | (86,707 | ) |
Total Institutional Shares | | | 156,550,774 | | | | 1,884,682 | |
Net increase (decrease) in net assets resulting from capital transactions | | | 202,296,227 | | | | (7,482,933 | ) |
Total Increase (Decrease) in Net Assets | | | 222,870,559 | | | | (9,766,404 | ) |
Net Assets | | | | | | | | |
Beginning of year | | | 9,606,432 | | | | 19,372,836 | |
End of year | | $ | 232,476,991 | | | $ | 9,606,432 | |
Accumulated net investment income included in net assets at end of year | | $ | 617,927 | | | $ | 93,225 | |
Share Transactions : | | | | | | | | |
R6 Shares(a): | | | | | | | | |
Shares sold | | | 11,180 | | | | 53,346 | |
Shares issued in reinvestment of distributions | | | 670 | | | | 126,147 | |
Shares redeemed | | | (24,920 | ) | | | (844,178 | ) |
Total R6 Shares | | | (13,070 | ) | | | (664,685 | ) |
Investor Shares(b): | | | | | | | | |
Shares sold | | | 2,811,839 | | | | 117,652 | |
Shares issued in connection with Reorganization (d) | | | – | | | | 129,981 | |
Shares issued in reinvestment of distributions | | | 1,484 | | | | 22,521 | |
Shares redeemed | | | (680,863 | ) | | | (85,474 | ) |
Total Investor Shares | | | 2,132,460 | | | | 184,680 | |
C Shares(d): | | | | | | | | |
Shares sold | | | – | | | | 359 | |
Shares redeemed in connection with Reorganization | | | – | | | | (22,500 | ) |
Shares redeemed | | | – | | | | (16,472 | ) |
Total C Shares | | | – | | | | (38,613 | ) |
D Shares(d): | | | | | | | | |
Shares sold | | | – | | | | 382 | |
Shares redeemed in connection with Reorganization | | | – | | | | (109,062 | ) |
Shares redeemed | | | – | | | | (1,388 | ) |
Total D Shares | | | – | | | | (110,068 | ) |
Institutional Shares(c): | | | | | | | | |
Shares sold | | | 7,301,493 | | | | 110,957 | |
Shares issued in reinvestment of distributions | | | 2,477 | | | | 152 | |
Shares redeemed | | | (259,270 | ) | | | (4,363 | ) |
Total Institutional Shares | | | 7,044,700 | | | | 106,746 | |
| (a) | | Institutional Shares were renamed R6 Shares on January 30, 2017. |
| (b) | | A Shares were renamed Investor Shares on January 30, 2017. |
| (c) | | Select Shares were renamed Institutional Shares on January 30, 2017. |
| (d) | | C shares and D shares were share classes of the Predecessor Fund. They were converted to A shares when the Predecessor Fund reorganized into the Fund on October 23, 2015. |
11
See accompanying notes which are an integral part of these financial statements.
Fuller & Thaler Behavioral Small-Cap Equity Fund – R6 Shares
(formerly, Institutional Shares)
Financial Highlights
Selected data for a share outstanding throughout each period.
| | | | | | | | | | | | | | | | | | | | | | | | |
| | | Years ended
September 30, | | | Period
ended
September 30,
2015(a) | | | Years ended
November 30, | |
| | | 2017 | | | 2016 | | | | 2014 | | | 2013 | | | 2012 | |
Net asset value, at beginning of period | | | $18.97 | | | | $18.84 | | | | $25.83 | | | | $23.74 | | | | $19.10 | | | | $16.06 | |
| | | | | | | | | | | | | | | | | | | | | | | | |
| | | | | | |
Income from investment operations: | | | | | | | | | | | | | | | | | | | | | | | | |
| | | | | | |
Net investment income(b) | | | 0.18 | | | | 0.25 | | | | 0.25 | | | | 0.31 | | | | 0.30 | | | | 0.34 | |
| | | | | | |
Net realized and unrealized gain (loss) on investments | | | 5.19 | | | | 2.42 | | | | (0.96 | ) | | | 2.81 | | | | 5.73 | | | | 2.77 | |
| | | | | | | | | | | | | | | | | | | | | | | | |
| | | | | | |
Total from investment operations | | | 5.37 | | | | 2.67 | | | | (0.71 | ) | | | 3.12 | | | | 6.03 | | | | 3.11 | |
| | | | | | | | | | | | | | | | | | | | | | | | |
| | | | | | |
Distributions from: | | | | | | | | | | | | | | | | | | | | | | | | |
| | | | | | |
Net investment income | | | (0.09 | ) | | | (0.28 | ) | | | (0.42 | ) | | | (0.19 | ) | | | (0.30 | ) | | | (0.07 | ) |
| | | | | | |
Net realized gain | | | – | | | | (2.26 | ) | | | (5.86 | ) | | | (0.84 | ) | | | (1.09 | ) | | | – | |
| | | | | | | | | | | | | | | | | | | | | | | | |
| | | | | | |
Total from distributions | | | (0.09 | ) | | | (2.54 | ) | | | (6.28 | ) | | | (1.03 | ) | | | (1.39 | ) | | | (0.07 | ) |
| | | | | | | | | | | | | | | | | | | | | | | | |
Net asset value, at end of period | | | $24.25 | | | | $18.97 | | | | $18.84 | | | | $25.83 | | | | $23.74 | | | | $19.10 | |
| | | | | | | | | | | | | | | | | | | | | | | | |
| | | | | | |
Total Return(c) | | | 28.35 | % | | | 16.14 | % | | | (4.09 | )%(d) | | | 13.79 | % | | | 34.02 | % | | | 19.46 | % |
| | | | | | | | | | | | | | | | | | | | | | | | |
Ratios/Supplemental Data: | | | | | | | | | | | | | | | | | | | | | | | | |
| | | | | | |
Net assets at end of period (thousands) | | | $3,740 | | | | $3,174 | | | | $15,677 | | | | $74,044 | | | | $48,281 | | | | $17,172 | |
| | | | | | |
Before waiver: | | | | | | | | | | | | | | | | | | | | | | | | |
| | | | | | |
Ratio of expenses to average net assets | | | 1.30 | % | | | 2.65 | % | | | 0.99 | %(e)(f) | | | 0.76 | % | | | 1.05 | % | | | 2.32 | % |
| | | | | | |
After waiver: | | | | | | | | | | | | | | | | | | | | | | | | |
| | | | | | |
Ratio of expenses to average net assets | | | 0.75 | % | | | 0.64 | % | | | 0.55 | %(e)(f) | | | 0.55 | % | | | 0.55 | % | | | 0.55 | % |
| | | | | | |
Ratio of net investment income to average net assets | | | 0.81 | % | | | 1.33 | % | | | 1.33 | %(e)(f) | | | 1.29 | % | | | 1.44 | % | | | 1.88 | % |
| | | | | | |
Portfolio turnover(g) | | | 26 | % | | | 194 | % | | | 108 | %(d) | | | 89 | % | | | 64 | % | | | 76 | % |
| (a) | | Fiscal year end changed from November 30th to September 30th. |
| (b) | | Per share net investment income has been calculated using the average shares method. |
| (c) | | Total return in the above table represents the rate that the investor would have earned or lost on an investment in the Fund, assuming reinvestment of distributions. |
| (f) | | Certain expenses incurred by the Fund were not annualized. |
| (g) | | Portfolio turnover is calculated on the basis on the Fund as a whole without distinguishing among the classes of shares. |
12
See accompanying notes which are an integral part of these financial statements.
Fuller & Thaler Behavioral Small-Cap Equity Fund – Investor Shares
(formerly, A Shares)
Financial Highlights
Selected data for a share outstanding throughout each period.
| | | | | | | | | | | | | | | | | | | | | | | | |
| | | Years ended
September 30, | | | Period
ended
September 30,
2015(a) | | | Years ended
November 30, | |
| | | 2017 | | | 2016 | | | | 2014 | | | 2013 | | | 2012 | |
Net asset value, at beginning of period | | | $18.75 | | | | $18.70 | | | | $25.67 | | | | $23.72 | | | | $19.04 | | | | $16.05 | |
| | | | | | | | | | | | | | | | | | | | | | | | |
| | | | | | |
Income from investment operations: | | | | | | | | | | | | | | | | | | | | | | | | |
| | | | | | |
Net investment income(b) | | | 0.15 | | | | 0.20 | | | | 0.20 | | | | 0.24 | | | | 0.24 | | | | 0.29 | |
| | | | | | |
Net realized and unrealized gain (loss) on investments | | | 5.09 | | | | 2.38 | | | | (0.96 | ) | | | 2.79 | | | | 5.73 | | | | 2.76 | |
| | | | | | | | | | | | | | | | | | | | | | | | |
| | | | | | |
Total from investment operations | | | 5.24 | | | | 2.58 | | | | (0.76 | ) | | | 3.03 | | | | 5.97 | | | | 3.05 | |
| | | | | | | | | | | | | | | | | | | | | | | | |
| | | | | | |
Distributions from: | | | | | | | | | | | | | | | | | | | | | | | | |
| | | | | | |
Net investment income | | | (0.08 | ) | | | (0.27 | ) | | | (0.35 | ) | | | (0.24 | ) | | | (0.20 | ) | | | (0.06 | ) |
| | | | | | |
Net realized gain | | | – | | | | (2.26 | ) | | | (5.86 | ) | | | (0.84 | ) | | | (1.09 | ) | | | – | |
| | | | | | | | | | | | | | | | | | | | | | | | |
| | | | | | |
Total from distributions | | | (0.08 | ) | | | (2.53 | ) | | | (6.21 | ) | | | (1.08 | ) | | | (1.29 | ) | | | (0.06 | ) |
| | | | | | | | | | | | | | | | | | | | | | | | |
Net asset value, at end of period | | | $23.91 | | | | $18.75 | | | | $18.70 | | | | $25.67 | | | | $23.72 | | | | $19.04 | |
| | | | | | | | | | | | | | | | | | | | | | | | |
| | | | | | |
Total Return(c) | | | 27.97 | % | | | 15.74 | % | | | (4.33 | )%(d) | | | 13.43 | % | | | 33.61 | % | | | 19.07 | % |
| | | | | | | | | | | | | | | | | | | | | | | | |
Ratios/Supplemental Data: | | | | | | | | | | | | | | | | | | | | | | | | |
| | | | | | |
Net assets at end of period (thousands) | | | $56,500 | | | | $4,319 | | | | $853 | | | | $10,023 | | | | $8,607 | | | | $49 | |
| | | | | | |
Before waiver: | | | | | | | | | | | | | | | | | | | | | | | | |
| | | | | | |
Ratio of expenses to average net assets | | | 1.65 | % | | | 2.90 | % | | | 1.27 | %(e)(f) | | | 1.02 | % | | | 1.25 | % | | | 2.76 | % |
| | | | | | |
After waiver: | | | | | | | | | | | | | | | | | | | | | | | | |
| | | | | | |
Ratio of expenses to average net assets | | | 1.00 | % | | | 0.89 | % | | | 0.81 | %(e)(f) | | | 0.82 | % | | | 0.83 | % | | | 0.90 | % |
| | | | | | |
Ratio of net investment income to average net assets | | | 0.70 | % | | | 1.32 | % | | | 1.11 | %(e)(f) | | | 1.02 | % | | | 1.09 | % | | | 1.59 | % |
| | | | | | |
Portfolio turnover(g) | | | 26 | % | | | 194 | % | | | 108 | %(d) | | | 89 | % | | | 64 | % | | | 76 | % |
| (a) | | Fiscal year end changed from November 30th to September 30th. |
| (b) | | Per share net investment income has been calculated using the average shares method. |
| (c) | | Total return in the above table represents the rate that the investor would have earned or lost on an investment in the Fund, assuming reinvestment of distributions. |
| (f) | | Certain expenses incurred by the Fund were not annualized. |
| (g) | | Portfolio turnover is calculated on the basis on the Fund as a whole without distinguishing among the classes of shares. |
13
See accompanying notes which are an integral part of these financial statements.
Fuller & Thaler Behavioral Small-Cap Equity Fund – Institutional Shares
(formerly, Select Shares)
Financial Highlights
Selected data for a share outstanding throughout each period.
| | | | | | | | | | | | | | | | | | | | | | | | |
| | | Years ended
September 30, | | | Period
ended
September 30,
2015(a) | | | Years ended
November 30, | |
| | | 2017 | | | 2016 | | | | 2014 | | | 2013 | | | 2012 | |
Net asset value, at beginning of period | | $ | 18.85 | | | $ | 18.77 | | | $ | 25.84 | | | $ | 23.74 | | | $ | 19.09 | | | $ | 16.05 | |
| | | | | | | | | | | | | | | | | | | | | | | | |
| | | | | | |
Income from investment operations: | | | | | | | | | | | | | | | | | | | | | | | | |
| | | | | | |
Net investment income(b) | | | 0.20 | | | | 0.23 | | | | 0.23 | | | | 0.31 | | | | 0.29 | | | | 0.32 | |
| | | | | | |
Net realized and unrealized gain (loss) on investments | | | 5.11 | | | | 2.38 | | | | (0.97 | ) | | | 2.78 | | | | 5.71 | | | | 2.79 | |
| | | | | | | | | | | | | | | | | | | | | | | | |
| | | | | | |
Total from investment operations | | | 5.31 | | | | 2.61 | | | | (0.74 | ) | | | 3.09 | | | | 6.00 | | | | 3.11 | |
| | | | | | | | | | | | | | | | | | | | | | | | |
| | | | | | |
Distributions from: | | | | | | | | | | | | | | | | | | | | | | | | |
| | | | | | |
Net investment income | | | (0.09 | ) | | | (0.27 | ) | | | (0.47 | ) | | | (0.15 | ) | | | (0.26 | ) | | | (0.07 | ) |
| | | | | | |
Net realized gain | | | – | | | | (2.26 | ) | | | (5.86 | ) | | | (0.84 | ) | | | (1.09 | ) | | | – | |
| | | | | | | | | | | | | | | | | | | | | | | | |
| | | | | | |
Total from distributions | | | (0.09 | ) | | | (2.53 | ) | | | (6.33 | ) | | | (0.99 | ) | | | (1.35 | ) | | | (0.07 | ) |
| | | | | | | | | | | | | | | | | | | | | | | | |
Net asset value, at end of period | | $ | 24.07 | | | $ | 18.85 | | | $ | 18.77 | | | $ | 25.84 | | | $ | 23.74 | | | $ | 19.09 | |
| | | | | | | | | | | | | | | | | | | | | | | | |
| | | | | | |
Total Return(c) | | | 28.20 | % | | | 15.86 | % | | | (4.21 | )%(d) | | | 13.64 | % | | | 33.83 | % | | | 19.43 | % |
| | | | | | | | | | | | | | | | | | | | | | | | |
Ratios/Supplemental Data: | | | | | | | | | | | | | | | | | | | | | | | | |
| | | | | | |
Net assets at end of period (thousands) | | $ | 172,238 | | | $ | 2,113 | | | $ | 100 | | | $ | 117 | | | $ | 17 | | | $ | 13 | |
| | | | | | |
Before waiver: | | | | | | | | | | | | | | | | | | | | | | | | |
| | | | | | |
Ratio of expenses to average net assets | | | 1.39 | % | | | 2.75 | % | | | 1.23 | %(e)(f’) | | | 0.81 | % | | | 1.20 | % | | | 2.38 | % |
| | | | | | |
After waiver: | | | | | | | | | | | | | | | | | | | | | | | | |
| | | | | | |
Ratio of expenses to average net assets | | | 0.85 | % | | | 0.74 | % | | | 0.65 | %(e)(f’) | | | 0.65 | % | | | 0.65 | % | | | 0.65 | % |
| | | | | | |
Ratio of net investment income to average net assets | | | 0.90 | % | | | 1.70 | % | | | 1.25 | %(e)(f’) | | | 1.29 | % | | | 1.42 | % | | | 1.76 | % |
| | | | | | |
Portfolio turnover(g) | | | 26 | % | | | 194 | % | | | 108 | %(d) | | | 89 | % | | | 64 | % | | | 76 | % |
| (a) | | Fiscal year end changed from November 30th to September 30th. |
| (b) | | Per share net investment income has been calculated using the average shares method. |
| (c) | | Total return in the above table represents the rate that the investor would have earned or lost on an investment in the Fund, assuming reinvestment of distributions. |
| (f) | | Certain expenses incurred by the Fund were not annualized. |
| (g) | | Portfolio turnover is calculated on the basis on the Fund as a whole without distinguishing among the classes of shares. |
14
See accompanying notes which are an integral part of these financial statements.
Fuller & Thaler Behavioral Small-Cap Equity Fund
Notes to Financial Statements
September 30, 2017
NOTE 1. ORGANIZATION
The Fuller & Thaler Behavioral Small-Cap Equity Fund (“the Fund”) (formerly, the Fuller & Thaler Behavioral Core Equity Fund) was organized as a diversified series of Capitol Series Trust (the “Trust”) on March 18, 2015. The Trust is an open-end investment company established under the laws of Ohio by an Agreement and Declaration of Trust dated September 18, 2013 (the “Trust Agreement”). The Trust Agreement permits the Board of Trustees of the Trust (“the Board”) to issue an unlimited number of shares of beneficial interest of separate series without par value. The Fund is one of a series of funds currently authorized by the Board. The Fund’s investment adviser is Fuller & Thaler Asset Management, Inc. (the “Adviser” or “Fuller & Thaler”). The investment objective of the Fund is to seek long-term capital appreciation.
The Fund currently offers three share classes: R6 Shares (formerly Institutional Shares), Investor Shares (formerly A Shares) and Institutional Shares (formerly Select Shares). Each share represents an equal proportionate interest in the assets and liabilities belonging to the Fund and is entitled to such dividends and distributions out of income belonging to the Fund as are declared by the Board.
Reorganization – The Fuller & Thaler Behavioral Small-Cap Equity Fund is the legal successor to a series of Allianz Funds Multi-Strategy Trust, an unaffiliated registered investment company, which commenced operations on September 8, 2011, and for which the Adviser served as the sole sub-adviser (the “Predecessor Fund”). On October 23, 2015, the Fund (which had no prior activity or net assets) acquired all the net assets of the Predecessor Fund pursuant to a plan of reorganization (the “Reorganization”).
The Reorganization was accomplished by a tax-free exchange of 171,108 shares of the Fund’s Class A Shares, valued at $3,360,777 for the 41,127, 22,500 and 109,062 shares, respectively, of the Class A Shares, Class C Shares and Class D Shares of the Predecessor Fund outstanding on October 23, 2015; 830,504 shares of the Fund’s Institutional Shares, valued at $16,440,186 for the 830,504 shares of the Institutional Shares of the Predecessor Fund outstanding on October 23, 2015; and 4,856 shares of the Fund’s Select Shares, valued at $95,761 for the 4,856 shares, of the Class P Shares of the Predecessor Fund outstanding on October 23, 2015.
For financial reporting purposes, assets received and shares issued by the Fund were recorded at fair value; however, the cost basis of the investments received from the Predecessor Fund was carried forward to align ongoing reporting of the Fund’s realized and unrealized gains and losses with amounts distributable to shareholders for tax purposes. Immediately prior to the merger, the net assets of the Predecessor Fund were $19,896,724, including $676,339 of unrealized appreciation, $230,311 of undistributed net investment income, and $1,642,910 of accumulated realized gain.
The accounting and performance history of the Class A, Class P and Institutional Class Shares of the Predecessor Fund were re-designated as that of the Class A, Select and Institutional Shares of the Fund, respectively.
The Reorganization shifted the investment advisory responsibility from Allianz Global Investors Fund Management LLC to Fuller & Thaler. Prior to the Reorganization, Fuller & Thaler served as the Predecessor Fund’s sub-adviser, thus maintaining the continuity of the portfolio management.
15
Fuller & Thaler Behavioral Small-Cap Equity Fund
Notes to Financial Statements (continued)
September 30, 2017
NOTE 2. SIGNIFICANT ACCOUNTING POLICIES
The Fund is an investment company and follows accounting and reporting guidance under Financial Accounting Standards Board Accounting Standards Codification (“ASC”) Topic 946, “Financial Services-Investment Companies”. The following is a summary of significant accounting policies consistently followed by the Fund in the preparation of its financial statements. The policies are in conformity with accounting principles generally accepted in the United States of America (“GAAP”).
Estimates – The preparation of financial statements in conformity with GAAP requires management to make estimates and assumptions that affect the reported amounts of assets and liabilities and disclosure of contingent assets and liabilities at the date of the financial statements and the reported amounts of increases and decreases in net assets from operations during the reporting period. Actual results could differ from those estimates.
Securities Valuation – All investments in securities are recorded at their estimated fair value as described in Note 3.
Foreign Currency Translation – The accounting records of the Fund are maintained in U.S. dollars. Foreign currency amounts are translated into U.S. dollars at the current rate of exchange each business day to determine the value of investments, and other assets and liabilities. Purchases and sales of foreign securities, and income and expenses, are translated at the prevailing rate of exchange on the respective date of these transactions. The Fund does not isolate that portion of the results of operations resulting from changes in foreign exchange rates on investments from fluctuation arising from changes in market prices of securities held. These fluctuations are included with the unrealized gain or loss from investments.
Federal Income Taxes – The Fund makes no provision for federal income tax or excise tax. The Fund has qualified and intends to qualify each year as a regulated investment company (“RIC”) under subchapter M of the Internal Revenue Code of 1986, as amended, by complying with the requirements applicable to RICs and by distributing substantially all of its taxable income. The Fund also intends to distribute sufficient net investment income and net capital gains, if any, so that it will not be subject to excise tax on undistributed income and gains. If the required amount of net investment income or gains is not distributed, the Fund could incur a tax expense.
The Fund may be subject to taxes imposed by countries in which it invests. Such taxes are generally based on income and/or capital gains earned or repatriated. Taxes are accrued and applied to net investment income, net realized gains and unrealized appreciation as such income and/or gains are earned.
The Fund recognizes tax benefits or expenses of uncertain tax positions only when the position is “more likely than not” to be sustained assuming examination by tax authorities. Management of the Fund has reviewed tax positions taken in tax years that remain subject to examination by all major tax jurisdictions, including federal (i.e., the previous three tax year ends and the interim tax period since then, as applicable) and has concluded that no provision for unrecognized tax benefits or expenses is required in these financial statements and does not expect this to change over the
16
Fuller & Thaler Behavioral Small-Cap Equity Fund
Notes to Financial Statements (continued)
September 30, 2017
next twelve months. The Fund recognizes interest and penalties, if any, related to unrecognized tax benefits as income tax expense in the Statement of Operations. During the year, the Fund did not incur any interest or penalties.
Expenses – Expenses incurred by the Trust that do not relate to a specific fund of the Trust are allocated to the individual funds based on each fund’s relative net assets or another appropriate basis (as determined by the Board). Expenses specifically attributable to any class are borne by that class. Income, realized gains and losses, unrealized appreciation and depreciation, and expenses are allocated to each class based on the net assets in relation to the relative net assets of the Fund.
Security Transactions and Related Income – Throughout the reporting period, security transactions are accounted for no later than one business day following the trade date. For financial reporting purposes, security transactions are accounted for on trade date on the last business day of the reporting period. The specific identification method is used for determining gains or losses for financial statements and income tax purposes. Dividend income is recorded on the ex-dividend date and interest income is recorded on an accrual basis. Dividend income from real estate investment trusts (REITs) and distributions from limited partnerships are recognized on the ex-date and included in dividend income. The calendar year-end classification of distributions received from REITs during the fiscal year are reported subsequent to year end; accordingly, the Fund estimates the character of REIT distributions based on the most recent information available. Income or loss from limited partnerships is reclassified among the components of net assets upon receipt of K-1’s. Discounts and premiums on fixed income securities purchased are amortized or accreted over the life of the respective securities using the effective interest method. Withholding taxes on foreign dividends have been provided for in accordance with the Fund’s understanding of the applicable country’s tax rules and rates.
Dividends and Distributions – The Fund intends to distribute substantially all of its net investment income, net realized long-term capital gains and its net realized short-term capital gains, if any, at least once a year. Distributions to shareholders are recorded on the ex-dividend date. The amounts of dividends from net investment income and distributions from net realized gains are determined in accordance with federal income tax regulations, which may differ from GAAP. These differences are caused primarily by differences in the timing of the recognition of certain components of income, expense or realized capital gains for federal income tax purposes. Where such differences are permanent in nature, they are reclassified in the components of net assets based on their ultimate characterization for federal income tax purposes. Any such reclassifications will have no effect on net assets, results of operations or net asset values per share of the Fund. For the fiscal year ended September 30, 2017, the Fund made the following reclassifications of net assets:
| | | | | | | | |
Paid-in
Capital | | Accumulated
Undistributed Net
Investment Income | | | Accumulated Net
Realized Loss from
Investments | |
$ (1) | | $ | (10,870 | ) | | $ | 10,871 | |
17
Fuller & Thaler Behavioral Small-Cap Equity Fund
Notes to Financial Statements (continued)
September 30, 2017
NOTE 3. SECURITIES VALUATION AND FAIR VALUE MEASUREMENTS
Fair value is defined as the price that the Fund would receive upon selling an investment in an orderly transaction to an independent buyer in the principal or most advantageous market of the investment. GAAP establishes a three-tier hierarchy to maximize the use of observable market data and minimize the use of unobservable inputs and to establish classification of fair value measurements for disclosure purposes.
Inputs refer broadly to the assumptions that market participants would use in pricing the asset or liability, including assumptions about risk (the risk inherent in a particular valuation technique used to measure fair value such as pricing model and/or the risk inherent in the inputs to the valuation technique). Inputs may be observable or unobservable. Observable inputs are inputs that reflect the assumptions market participants would use in pricing the asset or liability developed based on market data obtained from sources independent of the reporting entity. Unobservable inputs are inputs that reflect the reporting entity’s own assumptions about the assumptions market participants would use in pricing the asset or liability developed based on the best information available in the circumstances.
Various inputs are used in determining the value of the Fund’s investments. These inputs are summarized in the three broad levels listed below.
| | • | | Level 1 – unadjusted quoted prices in active markets for identical investments and/or registered investment companies where the value per share is determined and published and is the basis for current transactions for identical assets or liabilities at the valuation date. |
| | • | | Level 2 – other significant observable inputs (including, but not limited to, quoted prices for an identical security in an inactive market, quoted prices for similar securities, interest rates, prepayment speeds, credit risk, etc.) |
| | • | | Level 3 – significant unobservable inputs (including the Fund’s own assumptions in determining fair value of investments based on the best information available) |
The inputs used to measure fair value may fall into different levels of the fair value hierarchy. In such cases, for disclosure purposes, the level in the fair value hierarchy within which the fair value measurement falls in its entirety, is determined based on the lowest level input that is significant to the fair value measurement in its entirety.
In computing the net asset value (“NAV”) of the Fund, fair value is based on market valuations with respect to portfolio securities for which market quotations are readily available. Pursuant to Board- approved policies, the Fund relies on independent third-party pricing services to provide the current market value of securities. Those pricing services value equity securities traded on a securities exchange at the last reported sales price on the principal exchange. Equity securities quoted by NASDAQ are valued at the NASDAQ Official Closing Price. If there is no reported sale on the principal exchange, equity securities are valued at the mean between the most recent quoted bid and asked price. When using the market quotations or close prices provided by the pricing service and when the market is considered active, the security will be classified as a Level 1 security.
Sometimes, an equity security owned by the Fund will be valued by the pricing service with factors other than market quotations or when the market is considered inactive. When this happens, the
18
Fuller & Thaler Behavioral Small-Cap Equity Fund
Notes to Financial Statements (continued)
September 30, 2017
security may be classified as a Level 2 security. When market quotations are not readily available, when the Fund determines that the market quotation or the price provided by the pricing service does not accurately reflect the current fair value, or when certain restricted or illiquid securities are being valued, such securities are valued as determined in good faith by the Adviser, in conformity with guidelines adopted by and subject to review by the Board. These securities are generally categorized as Level 3 securities.
Investments in open-end mutual funds, including money market mutual funds, are generally priced at the ending NAV provided by the pricing service of the mutual funds. These securities are categorized as Level 1 securities.
In accordance with the Trust’s valuation procedures, the Adviser is required to consider all appropriate factors relevant to the value of securities for which it has determined pricing sources are not available or reliable as described above. No single standard exists for determining fair value, because fair value depends upon the circumstances of each individual case. As a general principle, the current fair value of an issue of securities being valued by the Adviser would be the amount that the Fund might reasonably expect to receive for them upon their current sale. Methods which are in accordance with this principle may, for example, be based on (i) a multiple of earnings; (ii) a discount from market of a similar freely traded security (including a derivative security or a basket of securities traded on other markets, exchanges or among dealers); or (iii) yield to maturity with respect to debt issues, or a combination of these and other methods. Fair value pricing is permitted if, in the Adviser’s opinion, the validity of market quotations appears to be questionable based on factors such as evidence of a thin market in the security based on a small number of quotations, a significant event occurs after the close of a market but before the Fund’s NAV calculation that may affect a security’s value, or the Adviser is aware of any other data that calls into question the reliability of market quotations.
The following is a summary of the inputs used to value the Fund’s investments as of September 30, 2017:
| | | | | | | | | | | | | | | | |
| | | Valuation Inputs | | | | |
| | | Level 1 | | | Level 2 | | | Level 3 | | | Total | |
Common Stocks * | | $ | 216,862,740 | | | $ | – | | | $ | – | | | $ | 216,862,740 | |
Money Market Securities | | | 14,023,321 | | | | – | | | | – | | | | 14,023,321 | |
Total | | $ | 230,886,061 | | | $ | – | | | $ | – | | | $ | 230,886,061 | |
| * | | Refer to Schedule of Investments for industry classifications. |
The Fund did not hold any investments during the reporting period in which other significant observable inputs (Level 2) were used in determining fair value. The Fund did not hold any investments during the reporting period in which significant unobservable inputs (Level 3) were used in determining fair value; therefore, no reconciliation of Level 3 securities is included for this reporting period. The Fund did not hold any derivative instruments during the reporting period.
The Trust recognizes transfers between fair value hierarchy levels at the end of the reporting period. There were no transfers between any levels as of September 30, 2017 based on input levels assigned at September 30, 2016.
19
Fuller & Thaler Behavioral Small-Cap Equity Fund
Notes to Financial Statements (continued)
September 30, 2017
NOTE 4. FEES AND OTHER TRANSACTIONS WITH AFFILIATES AND OTHER SERVICE PROVIDERS
Under the terms of the investment advisory agreement (the “Agreement”), the Adviser manages the Fund’s investments subject to approval of the Board. As compensation for its management services, the Fund is obligated to pay the Adviser a fee computed and accrued daily and paid monthly at an annual rate of 0.60% of the Fund’s average daily net assets. For the fiscal year ended September 30, 2017, the Adviser earned fees of $480,124 from the Fund. At September 30, 2017, the Fund owed the Adviser $71,035.
The Adviser has contractually agreed to waive its management fee and/or reimburse expenses so that total annual operating expenses (excluding (i) interest; (ii) taxes; (iii) brokerage fees and commissions; (iv) other extraordinary expenses not incurred in the ordinary course of the Fund’s business; and (v) indirect expenses such as acquired fund fees and expenses) do not exceed 0.80%, 1.05% and 0.90% for R6 Shares, Investor Shares and Institutional Shares, respectively, of the Fund’s average daily net assets through January 31, 2018, and 0.80%, 1.25% and 0.97% for R6 Shares, Investor Shares and Institutional Shares, respectively, of the Fund’s average daily net assets through January 31, 2019. During any fiscal year that the Agreement between the Adviser and the Trust is in effect, the Adviser may recoup the sum of all fees previously waived or expenses reimbursed for a period of 36 months following the month during which such fee waiver or expense reimbursement was made, less any reimbursement previously paid, if such recoupment can be achieved within the Expense Limitation as well as any expense limitation in effect at the time the reimbursement is made. This expense cap agreement may be terminated by the Board at any time. As of September 30, 2017, the Adviser may seek repayment of investment advisory fee waivers and expense reimbursements in the amount of $433,004 from the Fund no later than September 30, 2020.
The Trust retains Ultimus Asset Services, LLC (the “Administrator”) to provide the Fund with administration, accounting, transfer agent and compliance services, including all regulatory reporting. For the fiscal year ended September 30, 2017, the Administrator earned fees of $69,873 for administration services, $24,853 for transfer agent services, and $36,831 for fund accounting services. At September 30, 2017, the Fund owed the Administrator $19,035 for such services.
The Board supervises the business activities of the Trust. Each Trustee serves as a Trustee for the lifetime of the Trust or until the earlier of his or her retirement as a Trustee at age 75, death, resignation or removal. “Independent Trustees,” which means that they are not “interested persons” as defined in the Investment Company Act of 1940 (“1940 Act”) of the Trust, each receive annual compensation of $15,000 from the Trust. Each Committee Chairperson receives an additional annual compensation of $1,000 from the Trust. Independent Trustees also receive $1,000 for attending each special in-person meeting and up to $1,000 for attending special telephonic meetings, depending on the length of the telephonic meeting. In addition, the Trust reimburses Trustees for out-of-pocket expense incurred in conjunction with attendance at meetings.
The officers and one Trustee of the Trust are employees of the Administrator. Unified Financial Securities, LLC (the “Distributor”) acts as the principal distributor of the Fund’s shares. Both the Administrator and the Distributor operate as wholly-owned subsidiaries of Ultimus Fund Solutions, LLC.
20
Fuller & Thaler Behavioral Small-Cap Equity Fund
Notes to Financial Statements (continued)
September 30, 2017
The Fund has adopted a Distribution Plan (the “Plan”) pursuant to Rule 12b-1 under the 1940 Act. The Plan provides that the Fund will pay the Distributor and/or any registered securities dealer, financial institution or any other person (the “Recipient”) a fee of 0.25% of the average daily net assets of the Fund’s Investor Shares in connection with the promotion and distribution of the Fund’s Investor Shares or the provision of personal services to shareholders, including, but not necessarily limited to, advertising, compensation to underwriters, dealers and selling personnel, the printing and mailing of prospectuses to other than current Investor Shares shareholders, the printing and mailing of sales literature and servicing shareholder accounts (“12b-1 Expenses”). The Fund or Distributor may pay all or a portion of these fees to any Recipient who renders assistance in distributing or promoting the sale of shares, or who provides certain shareholder services, pursuant to a written agreement. The Plan is a compensation plan, which means that compensation is provided regardless of whether 12b-1 Expenses are actually incurred. Accordingly, the 12b-1 Expenses of the Investor Shares of the Fund may be less than fees paid out by the class under the Plan. For the fiscal year ended September 30, 2017, Investor Shares 12b-1 expense incurred by the Fund was $73,577. At September 30, 2017, the Fund owed the Distributor $16,845 for Investor Shares 12b-1 expenses.
The Fund has adopted an Administrative Services Plan (the “Services Plan”) for Investor Shares and Institutional Shares of the Fund. The Services Plan allows the Fund to use Investor Shares or Institutional Shares to pay financial intermediaries that provide services relating to Investor Shares and Institutional Shares. The Services Plan permits payments for the provision of certain administrative, record keeping and other services to Investor Shares and Institutional Shares shareholders. The Services Plan permits the Fund to make service fee payments at an annual rate of up to 0.20% of the Fund’s average daily net assets attributable to its Investor Shares or Institutional Shares.
Effective January 30, 2017, in conjunction with the change in the share class name to Investor Shares from A Shares, the maximum sales charge on purchases of 5.50% as a percentage of the original purchase price was eliminated. For the period from October 1, 2016 through January 30, 2017, the Distributor received $15,302 from commissions earned on sales of Investor Shares, of which $13,272 was re-allowed to intermediaries of the Fund.
NOTE 5. PURCHASES AND SALES OF SECURITIES
For the fiscal year ended September 30, 2017, purchases and sales of investment securities, other than short-term investments were as follows:
| | | | |
Purchases | | $ | 208,484,993 | |
Sales | | $ | 20,359,740 | |
There were no purchases or sales of long-term U.S. government obligations during the fiscal year ended September 30, 2017.
21
Fuller & Thaler Behavioral Small-Cap Equity Fund
Notes to Financial Statements (continued)
September 30, 2017
NOTE 6. FEDERAL TAX INFORMATION
As of September 30, 2017, the net unrealized appreciation (depreciation) of investments for tax purposes was as follows:
| | | | |
Gross Unrealized Appreciation | | $ | 22,904,360 | |
Gross Unrealized Depreciation | | | (2,128,881 | ) |
Net Unrealized Appreciation (Depreciation) | | $ | 20,775,479 | |
At September 30, 2017, the aggregate cost of securities for federal income tax purposes was $210,110,582 for the Fund. The difference between book basis and tax basis unrealized appreciation is primarily attributable to the tax deferral of wash losses.
The tax character of distributions paid during the fiscal years ended September 30, 2017 and September 30, 2016, were as follows:
| | | | | | | | |
| | | 2017 | | | 2016 | |
Distributions paid from: | | | | | | | | |
Ordinary Income | | $ | 128,624 | | | $ | 299,373 | |
Net Long-Term Capital Gains | | | – | | | | 2,161,502 | |
Total Distributions Paid | | $ | 128,624 | | | $ | 2,460,875 | |
At September 30, 2017, the components of distributable earnings (accumulated losses) on a tax basis were as follows:
| | | | |
Undistributed Ordinary Income | | $ | 616,219 | |
Accumulated Capital and Other Losses | | | (1,524,613 | ) |
Unrealized Appreciation (Depreciation) | | | 20,775,479 | |
Total Accumulated Earnings (Deficit) | | $ | 19,867,085 | |
The difference between book basis and tax basis unrealized appreciation is primarily attributable to the tax deferral of wash losses.
As of September 30, 2017, the Fund had available for tax purposes an unused capital loss carryforward of $1,524,613 of short-term capital losses with no expiration, which is available to offset against future taxable net capital gains. To the extent that this carryforward is used to offset future gains, it is probable that the amount offset will not be distributed to shareholders.
NOTE 7. BENEFICIAL OWNERSHIP
The beneficial ownership, either directly or indirectly, of 25% or more of the voting securities of a fund creates a presumption of control of a fund, under Section 2(a) (9) of the 1940 Act. At September 30, 2017, Charles Schwab & Co., Inc. (“Schwab”) owned 41% of the outstanding shares of the Fund. It is not known whether Schwab or any of the underlying beneficial owners owned or controlled 25% or more of the voting securities of the Fund.
22
Fuller & Thaler Behavioral Small-Cap Equity Fund
Notes to Financial Statements (continued)
September 30, 2017
NOTE 8. COMMITMENTS AND CONTINGENCIES
The Fund indemnifies its officers and trustees for certain liabilities that may arise from the performance of their duties to the Fund. Additionally, in the normal course of business, the Fund enters into contracts that contain a variety of representations and warranties which provide general indemnifications. The Fund’s maximum exposure under these arrangements is unknown, as this would involve future claims that may be made against the Fund that have not yet occurred.
NOTE 9. SUBSEQUENT EVENTS
Management has evaluated events or transactions from September 30, 2017 through the date these financial statements were issued that would merit recognition or disclosure in the financial statements. There were no subsequent events to report that would have a material impact in the Fund’s financial statements.
23
Report of Independent Registered Public Accounting Firm
The Board of Trustees and Shareholders of
Capitol Series Trust
We have audited the accompanying statement of assets and liabilities, including the schedule of investments, of the Fuller & Thaler Behavioral Small-Cap Equity Fund (the “Fund”), a series of the Capitol Series Trust, as of September 30, 2017, and the related statements of operations, changes in net assets and financial highlights for the year then ended. These financial statements and financial highlights are the responsibility of the Fund’s management. Our responsibility is to express an opinion on these financial statements and financial highlights based on our audit. The statement of changes in net assets and financial highlights of the Fund for the periods presented through September 30, 2016, were audited by other auditors whose report dated November 29, 2016, expressed an unqualified opinion on those statements of changes in net assets and financial highlights.
We conducted our audit in accordance with the standards of the Public Company Accounting Oversight Board (United States). Those standards require that we plan and perform the audit to obtain reasonable assurance about whether the financial statements and financial highlights are free of material misstatement. We were not engaged to perform an audit of the Fund’s internal control over financial reporting. Our audit included consideration of internal control over financial reporting as a basis for designing audit procedures that are appropriate in the circumstances, but not for the purpose of expressing an opinion on the effectiveness of the Fund’s internal control over financial reporting. Accordingly, we express no such opinion. An audit also includes examining, on a test basis, evidence supporting the amounts and disclosures in the financial statements and financial highlights, assessing the accounting principles used and significant estimates made by management, and evaluating the overall financial statement presentation. Our procedures included confirmation of securities owned as of September 30, 2017, by correspondence with the custodian and brokers. We believe that our audit provides a reasonable basis for our opinion.
In our opinion, the financial statements and financial highlights referred to above present fairly, in all material respects, the financial position of the Fund as of September 30, 2017, the results of its operations, changes in its net assets and financial highlights for the year then ended in conformity with U.S. generally accepted accounting principles.

Grandview Heights, Ohio
November 22, 2017
24
Summary of Fund Expenses (Unaudited)
As a shareholder of the Fund, you incur two types of costs: (1) transaction costs and (2) ongoing costs, including management fees, distribution and service (12b-1) fees, and other Fund expenses. These examples are intended to help you understand your ongoing costs (in dollars) of investing in the Fund and to compare these costs with the ongoing costs of investing in other mutual funds.
The Example is based on an investment of $1,000 invested at the beginning of the period and held for the entire period from April 1, 2017 through September 30, 2017.
Actual Expenses
The first line of the table for each class provides information about actual account values and actual expenses. You may use the information in these lines, together with the amount you invested, to estimate the expenses that you paid over the period. Simply divide your account value by $1,000 (for example, an $8,600 account value divided by $1,000 = 8.60), then multiply the result by the number in the first line under the heading “Expenses Paid During Period” to estimate the expenses you paid on your account during this period.
Hypothetical Example for Comparison Purposes
The second line of the table for each class provides information about hypothetical account values and hypothetical expenses based on the Fund’s actual expense ratios and an assumed rate of return of 5% per year before expenses, which is not the Fund’s actual return. The hypothetical account values and expenses may not be used to estimate the actual ending account balances or expenses you paid for the period. You may use this information to compare the ongoing costs of investing in the Fund and other funds. To do so, compare this 5% hypothetical example with the 5% hypothetical examples that appear in the shareholder reports of the other funds.
Expenses shown in the table are meant to highlight your ongoing costs only. Therefore, the second line of the table for each class is useful in comparing ongoing costs only and will not help you determine the relative total costs of owning different funds. In addition, if transaction costs were included, your costs would have been higher.
25
Summary of Fund Expenses (Unaudited) (continued)
| | | | | | | | | | | | | | | | | | |
| | | | | Beginning
Account
Value,
April 1, 2017 | | | Ending
Account
Value,
September 30, 2017 | | | Expenses
Paid
During
Period(a) | | | Annualized
Expense
Ratio | |
Fuller & Thaler Behavioral Small-Cap Equity Fund | | | | | | | | | |
R6 Shares | | Actual | | $ | 1,000.00 | | | $ | 1,101.30 | | | $ | 4.21 | | | | 0.80 | % |
| | | | | | | | | | | | | | | | | | |
| | Hypothetical(b) | | $ | 1,000.00 | | | $ | 1,021.06 | | | $ | 4.05 | | | | 0.80 | % |
| | | | | | | | | | | | | | | | | | |
Investor Shares | | Actual | | $ | 1,000.00 | | | $ | 1,099.80 | | | $ | 5.53 | | | | 1.05 | % |
| | | | | | | | | | | | | | | | | | |
| | Hypothetical(b) | | $ | 1,000.00 | | | $ | 1,019.80 | | | $ | 5.32 | | | | 1.05 | % |
| | | | | | | | | | | | | | | | | | |
Institutional Shares | | Actual | | $ | 1,000.00 | | | $ | 1,100.60 | | | $ | 4.74 | | | | 0.90 | % |
| | | | | | | | | | | | | | | | | | |
| | Hypothetical(b) | | $ | 1,000.00 | | | $ | 1,020.56 | | | $ | 4.56 | | | | 0.90 | % |
| | | | | | | | | | | | | | | | | | |
| (a) | | Expenses are equal to the Fund’s annualized expense ratios, multiplied by the average account value over the period, multiplied by 183/365 (to reflect the one-half year period). |
| (b) | | Hypothetical assumes 5% annual return before expenses. |
Additional Federal Income Tax Information (Unaudited)
The Form 1099-DIV you receive in January 2018 will show the tax status of all distributions paid to your account in calendar year 2017. Shareholders are advised to consult their own tax adviser with respect to the tax consequences of their investment in the Fund. As required by the Internal Revenue Code and/or regulations, shareholders must be notified regarding the status of qualified dividend income for individuals and the dividends received deduction for corporations.
Qualified Dividend Income. The Fund designates approximately 93% or up to the maximum amount of such dividends allowable pursuant to the Internal Revenue Code, as qualified dividend income eligible for the reduced tax rate of 15%.
Dividends Received Deduction. Corporate shareholders are generally entitled to take the dividends received deduction on the portion of the Fund’s dividend distribution that qualifies under tax law. For the Fund’s calendar year 2017 ordinary income dividends, 100% qualifies for the corporate dividends received deduction.
26
Trustees and Officers (Unaudited)
The Board of Trustees supervises the business activities of the Trust. Each Trustee serves as a trustee until termination of the Trust unless the Trustee dies, resigns, retires or is removed.
The following tables provide information regarding the Trustees and Officers.
Independent Trustees
| | |
Name, Address,* Age, Position with Trust,**
Term of Position with Trust | | Principal Occupation During Past 5 Years
and Other Directorships |
| | |
Walter B. Grimm Age: 72 Trustee Began Serving: November 2013 | | Principal Occupations(s): President, Leigh Management Group, LLC (consulting firm) (October 2005 to present); President, Leigh Investments, Inc. (1988 to present); and Chief Financial Officer, East West Private, LLC (consulting firm) (March 2009 to present). |
| | |
Mary M. Morrow Age: 59 Trustee Began Serving: November 2013 | | Principal Occupations(s): Chief Operating Officer, Pennsylvania Health and Wellness (fully owned subsidiary of Centene Corporation) (November 2016 to present). Previous Position(s): Vice President, Strategic Initiatives, Gateway Heath (January 2015 to November 2016); Consulting Practice Manager, DST Health Solutions (August 2010 to January 2015). |
| * | | The address for each trustee is 225 Pictoria Drive, Suite 450, Cincinnati, OH 45246. |
| ** | | The Trust currently consists of 8 series. |
Interested Trustees & Officers
| | |
Name, Address,* Age, Position with Trust,**
Term of Position with Trust | | Principal Occupation During Past 5 Years and Other Directorships |
| | |
Robert G. Dorsey*** Age: 60 Chairman of the Board and Trustee Began Serving: March 2017 | | Principal Occupation(s): President and Managing Director of Ultimus Fund Solutions, LLC and Ultimus Fund Distributors, LLC (1999 to present); Interested Trustee of Ultimus Managers Trust (February 2012 to present). Previous Position(s): President of Ultimus Managers Trust (June 2012 to October 2013). |
| | |
Matthew J. Miller Age: 41 Chief Executive Officer and President Began Serving: September 2013 | | Principal Occupation(s): Assistant Vice President, Relationship Management, Ultimus Fund Solutions, LLC (December 2015 to present); Vice President, Valued Advisers Trust (December 2011 to present). Previous Position(s): Vice President, Relationship Management, Huntington Asset Services, Inc. (n/k/a Ultimus Asset Services, LLC) (2008 to December 2015); Vice President, The Huntington Funds (February 2010 to April 2015); Vice President, Transfer Agency Operations, Huntington Asset Services, Inc. (2002 to 2008); Employed in various positions with Huntington Asset Services, Inc. (July 1998 to 2002). |
27
Trustees and Officers (Unaudited) (continued)
| | |
Name, Address,* Age, Position with Trust,**
Term of Position with Trust | | Principal Occupation During Past 5 Years and Other Directorships |
| | |
Zachary P. Richmond Age: 37 Treasurer and Chief Financial Officer Began Serving: August 2014 | | Principal Occupation(s): Assistant Vice President, Associate Director of Financial Administration, Ultimus Fund Solutions, LLC (December 2015 to present); Treasurer and Chief Financial Officer, Unified Series Trust (August 2014 to present); Treasurer and Chief Financial Officer, Commonwealth International Series Trust (September 2015 to present). Previous Position(s): Assistant Vice President, Fund Administration, Huntington Asset Services, Inc. (n/k/a Ultimus Asset Services, LLC) (January 2011 to December 2015); and Assistant Treasurer, Unified Series Trust (2011 to August 2014). |
| | |
Brandon Kipp Age: 34 Chief Compliance Officer Began Serving: October 2017 | | Principal Occupation(s): Senior Fund Compliance Officer, Ultimus Fund Solutions, LLC (since July 2017) and Chief Compliance Officer, Valued Advisers Trust (since October 2017). Previous Position(s): Assistant Vice President and Compliance Manager, UMB Fund Services, Inc. (March 2014 to July 2017); Officer and Lead Fund Administrator, UMB Fund Services, Inc. (May 2012 to March 2014). |
| | |
Stacey Havens Age: 51 Vice President Began Serving: September 2013 | | Principal Occupation(s): Assistant Vice President, Relationship Management, Ultimus Fund Solutions, LLC (December 2015 to present). Previous Position(s): Vice President, Huntington Asset Services, Inc. (n/k/a Ultimus Asset Services, LLC) (July 1993 to December 2015). |
| | |
Tiffany R. Franklin Age: 41 Secretary Began Serving: December 2015 | | Principal Occupation(s): Senior Paralegal, Ultimus Fund Solutions, LLC (December 2015 to present); Assistant Secretary, Wilshire Mutual Funds, Inc. and Wilshire Variable Insurance Trust (October 2016 to present); and Assistant Secretary, Cross Shore Discovery Fund (2017 to present; and Assistant Secretary, Caldwell & Orkin Funds, Inc. (June 2017 to present). Previous Position(s): Paralegal, Huntington Asset Services, Inc. (n/k/a Ultimus Asset Services, LLC) (April 2012 to December 2015); Assistant Secretary, Capitol Series Trust (September 2013 to December 2015); Assistant Secretary, The Huntington Funds, (November 2012 to December 2015); Assistant Secretary, Huntington Strategy Shares (November 2012 to December 2015); Secretary, The Huntington Funds (December 2015 to March 2016); and Secretary, Huntington Strategy Shares (December 2015 to March 2016). |
28
Trustees and Officers (Unaudited) (continued)
| | |
Name, Address,* Age, Position with Trust,**
Term of Position with Trust | | Principal Occupation During Past 5 Years and Other Directorships |
| | |
Stephen L. Preston Age: 51 Anti-Money Laundering Compliance Officer Began Serving: December 2016 | | Principal Occupation(s): Chief Compliance Officer, Ultimus Fund Solutions, LLC and Ultimus Fund Distributors, LLC from June 2011 to present. |
| * | | The address for each trustee and officer is 225 Pictoria Drive, Suite 450, Cincinnati, OH 45246. |
| ** | | The Trust currently consists of 8 series. |
| *** | | Mr. Dorsey is considered an “interested person” of the Trust within the meaning of Section 2(a)(19) of the 1940 Act because of his relationship with the Trust’s administrator, transfer agent, and distributors. |
OTHER INFORMATION (Unaudited)
The Fund’s Statement of Additional Information (“SAI”) includes additional information about the trustees and is available without charge, upon request. You may call toll-free at (888) 912-4562 to request a copy of the SAI or to make shareholder inquiries.
29
Approval of Investment Advisory Agreement
Fuller & Thaler Asset Management, Inc. (Unaudited)
At a special meeting of the Board of Trustees of Capitol Series Trust (“Trust”) on March 13, 2017, the Trust’s Board of Trustees (“Board”), including all of the Trustees who are not “interested persons” of the Trust (“Independent Trustees”) as that term is defined in Section 2(a)(19) of the Investment Company Act of 1940, as amended (the “1940 Act”), considered and approved the continuation for an additional one-year period of the Investment Advisory Agreement between the Trust and Fuller & Thaler Asset Management, Inc. (“Fuller & Thaler”) (the “Investment Advisory Agreement”) with respect to the Fuller & Thaler Behavioral Small-Cap Equity Fund (the “Fuller & Thaler Fund”), a series of the Trust.
Prior to the meeting, the Trustees received and considered information from Fuller & Thaler and the Trust’s administrator designed to provide the Trustees with the information necessary to evaluate the terms of the proposed renewal of the Investment Advisory Agreement between the Trust and Fuller & Thaler, including, but not limited to: Fuller & Thaler’s response to counsel’s due diligence letter requesting information relevant to renewal of the Investment Advisory Agreement; the operating expense limitation agreement currently in effect between Fuller & Thaler and the Fuller & Thaler Fund (the “Expense Limitation Agreement”); and Morningstar expense and performance data for comparative purposes (the “Support Materials”). The Trustees reviewed the Support Materials at various times with Fuller & Thaler, Trust management, and counsel to the Independent Trustees. This information, together with the information provided to and reviewed by the Board throughout the course of the prior two years, formed the primary, but not exclusive, basis for the Board’s determinations. Before voting to approve the renewal of the Investment Advisory Agreement, the Trustees reviewed the terms and the form of Investment Advisory Agreement and the Support Materials with Trust management and with counsel to the Independent Trustees. The Trustees received and discussed a memorandum from such counsel delineating the legal standards governing their consideration of the renewal of the Investment Advisory Agreement, which memorandum described the various factors that the U.S. Securities and Exchange Commission (“SEC”) and U.S. Courts over the years have suggested would be appropriate for trustee consideration, including the factors outlined in Gartenberg v. Merrill Lynch Asset Management Inc., 694 F.2d 923, 928 (2d Cir. 1982); cert. denied sub. nom. and Andre v. Merrill Lynch Ready Assets Trust, Inc., 461 U.S. 906 (1983). Representatives from Fuller & Thaler also met with the Trustees at a quarterly meeting of the Board held on March 9, 2017, and provided additional information to the Trustees regarding its services to the Fuller & Thaler Fund, including but not limited to, information regarding its investment philosophy, the firm’s compliance culture, the ownership structure of Fuller & Thaler, financial statements of Fuller & Thaler, Fund expenses subsidized by Fuller & Thaler, resources available to service the Fuller & Thaler Fund, Fuller & Thaler’s expenses and profitability with respect to the Fuller & Thaler Fund, Fuller & Thaler’s future plans with regard to the Fuller & Thaler Fund, and other benefits that Fuller & Thaler derived from its relationship with the Fuller & Thaler Fund, among other topics.
After having received and reviewed the Support Materials, as well as quarterly investment performance, compliance, operating, and distribution reports on the Fuller & Thaler Fund over an extended time period, the Trustees discussed the facts and factors relevant to the continuation of the Investment Advisory Agreement, which incorporated and reflected their knowledge of Fuller & Thaler’s services to the Fund. Taking such information into account, the Board considered whether the overall arrangements between the Trust and Fuller & Thaler as set forth in the Investment Advisory Agreement, including the investment advisory fees that the Fuller & Thaler Fund pays to Fuller & Thaler, continue to be fair and reasonable in light of the services Fuller & Thaler performs,
30
Approval of Investment Advisory Agreement
Fuller & Thaler Asset Management, Inc. (Unaudited) (continued)
as well as such other matters as the Trustees considered relevant in the exercise of their reasonable business judgment.
In determining whether to approve the renewal of the Investment Advisory Agreement with respect to the Fuller & Thaler Fund, the Trustees considered all factors they believed relevant, including the following: (1) the nature, extent, and quality of the services provided by Fuller & Thaler with respect to the Fuller & Thaler Fund; (2) the cost of the services to be provided and the profits and losses realized by Fuller & Thaler from services rendered to the Trust with respect to the Fuller & Thaler Fund; (3) comparative fee and expense data for the Fuller & Thaler Fund and other investment companies or institutional accounts with similar investment objectives; (4) the extent to which economies of scale would be realized as the Fuller & Thaler Fund grows, and whether the advisory fees for the Fund reflect such economies of scale for the Fuller & Thaler Fund’s benefit; and (5) other financial benefits to Fuller & Thaler resulting from services rendered to the Fuller & Thaler Fund. The material factors and conclusions that formed the basis of the Trustees’ determination to approve the continuation of the Investment Advisory Agreement are summarized below. In their deliberations, the Trustees did not identify any particular information that was all-important or controlling.
Nature, Extent and Quality of Services Provided. The Trustees considered the scope of services that Fuller & Thaler provides under the Investment Advisory Agreement, noting that such services include, but are not limited to, the following: (1) investing the Fuller & Thaler Fund’s assets consistent with the Fund’s investment objective and investment policies; (2) determining the portfolio securities to be purchased, sold or otherwise disposed of and the timing of such transactions; (3) voting all proxies with respect to the Fuller & Thaler Fund’s portfolio securities; (4) maintaining the required books and records for transactions that Fuller & Thaler effects on behalf of the Fund; and (5) selecting broker-dealers to execute orders on behalf of the Fuller & Thaler Fund. The Trustees also noted that Fuller & Thaler performs certain activities related to distribution, marketing and sales, compliance and risk management, shareholder servicing, reporting, and other operational services for the Fuller & Thaler Fund. The Trustees considered Fuller & Thaler’s capitalization and its assets under management, noting that Fuller & Thaler’s assets under management, both in the Fuller & Thaler Fund and across the firm, have increased steadily. The Trustees further considered the investment philosophy and experience of the portfolio management team. The Trustees considered the Fuller & Thaler Fund’s performance compared to its benchmark across various time frames, noting that the Fund outperformed its benchmark for the one-year, five-year and since-inception periods ended December 31, 2016. The Trustees also considered the Fuller & Thaler Fund’s performance compared to its Morningstar peer group category, noting that the Fund is outperforming the median and average of its peer group for the one-, three- and five-year periods ended January 31, 2017. The Trustees noted that the peer group comparison provided was filtered to include funds with a similar asset size to that of the Fuller & Thaler Fund, and discussed the appropriateness of such a comparison. The Trustees concluded that they are satisfied with the nature, extent and quality of services that Fuller & Thaler provides to the Fuller & Thaler Fund under the Investment Advisory Agreement.
Cost of Advisory Services and Profitability. The Trustees considered the annual management fee that the Fuller & Thaler Fund pays to Fuller & Thaler under the Investment Advisory Agreement, as well as Fuller & Thaler’s profitability from the services that it renders to the Fund. In that regard, the Trustees noted that Fuller & Thaler subsidizes the costs of distribution services rendered to the Fuller & Thaler Fund in excess of amounts accrued and payable pursuant to the Fund’s Rule 12b-1
31
Approval of Investment Advisory Agreement
Fuller & Thaler Asset Management, Inc. (Unaudited) (continued)
Distribution Plan. The Trustees considered that Fuller & Thaler has contractually agreed to reduce its management fees and, if necessary, reimburse the Fuller & Thaler Fund for operating expenses, as specified in the Fund’s prospectus. The Trustees also noted that while Fuller & Thaler has not yet been profitable with respect to its services to the Fuller & Thaler Fund, it is profitable overall, with sufficient capital to fulfill its contractual responsibilities under the Investment Advisory Agreement.
Comparative Fee and Expense Data. The Trustees also considered the annual management fee that the Fuller & Thaler Fund pays to Fuller & Thaler under the Investment Advisory Agreement. They noted that the Fuller & Thaler Fund’s gross management fee of 60 basis points is below the average and median management fee reported for its relevant Morningstar peer group. The Trustees also noted that the peer group comparisons included in the Support Materials were based upon the institutional share class of funds in its peer group with similar net asset levels of between $50 million and $150 million. The Trustees also considered that Fuller & Thaler has contractually agreed to reduce its management fees and, if necessary, reimburse the Fuller & Thaler Fund for operating expenses, as specified in the Fund’s prospectus. The Trustees also noted that the Fuller & Thaler Fund’s total expense ratio (after waivers and expense reimbursements) is below the average and median total expense ratios (after waivers and expense reimbursements) reported for the same Morningstar peer group. Lastly, the Trustees considered that the advisory fee that Fuller & Thaler charges to the Fund are lower than the fees that Fuller & Thaler charges to separately managed accounts that it advises in the same investment strategy. They noted however, that there are structural differences and differences in the services provided between the Fund and separately managed accounts. While recognizing that it is difficult to compare advisory fees because the scope of advisory services provided may vary from one investment vehicle to another and from one investment adviser to another , the Trustees concluded that the Fuller & Thaler Fund’s advisory fee continues to be reasonable.
Economies of Scale. The Trustees considered whether the Fuller & Thaler Fund may benefit from any economies of scale, but did not find that any material economies exist at this time. The Trustees noted that the advisory fees charged by Fuller & Thaler do not contain any fee breakpoints, but also concluded that due to the Fuller & Thaler Fund’s asset size, it is not necessary for the Board to consider the implementation of fee breakpoints at this time. The Board finally noted that the Fuller & Thaler Fund likely will not benefit from any economies of scale until fund assets increase.
Other Benefits. The Trustees considered the extent to which Fuller & Thaler utilizes soft dollar arrangements with respect to portfolio transactions, and noted that while Fuller & Thaler does utilize soft dollar arrangements consistent with the Section 28(e) safe harbor in connection with the execution of client transactions, affiliated brokers are not utilized to execute the portfolio transactions of the Fuller & Thaler Fund. After considering all factors that they deemed to be relevant, the Trustees concluded that Fuller & Thaler will not receive material additional financial benefits from services that it renders to the Fuller & Thaler Fund.
Based upon Fuller & Thaler’s presentation to the Board and the Support Materials considered in connection with the renewal of the Investment Advisory Agreement, as well as the information provided throughout the course of the year, the Board concluded that the overall arrangements between the Trust and Fuller & Thaler with respect to the Fuller and Thaler Fund, as set forth in the Investment Advisory Agreement between the Trust and Fuller & Thaler, are fair and reasonable in light of the services to be performed, investment advisory fees to be paid and such other matters as the Trustees considered relevant in the exercise of their reasonable judgment.
32
| | |
FACTS | | WHAT DOES CAPITOL SERIES TRUST DO WITH YOUR PERSONAL INFORMATION? |
| | |
| Why? | | Financial companies choose how they share your personal information. Federal law gives consumers the right to limit some but not all sharing. Federal law also requires us to tell you how we collect, share, and protect your personal information. Please read this notice carefully to understand what we do. |
| | |
| What? | | The types of personal information we collect and share depend on the product or service you have with us. This information can include: • Social Security number • account balances and account transactions • account transactions, transaction or loss history and purchase history • checking account information and wire transfer instructions When you are no longer our customer, we continue to share your information as described in this notice. |
| | |
| How? | | All financial companies need to share customers’ personal information to run their everyday business. In the section below, we list the reasons financial companies can share their customers’ personal information; the reasons Capitol Series Trust chooses to share; and whether you can limit this sharing. |
| | |
| Reasons we can share your personal information | | Does Capitol Series
Trust share? |
For our everyday business purposes — such as to process your transactions, maintain your account(s), respond to court orders and legal investigations, or report to credit bureaus | | Yes |
For our marketing purposes — to offer our products and services to you | | Yes |
| For joint marketing with other financial companies | | No |
For our affiliates’ everyday business purposes — information about your transactions and experiences | | No |
For our affiliates’ everyday business purposes — information about your creditworthiness | | No |
| For nonaffiliates to market to you | | No |
| | |
| Questions? | | Call 1-888-912-4562. |
33
| | |
| Who we are | | |
| Who is providing this notice? | | Capitol Series Trust |
| What we do | | |
| How does Capitol Series Trust protect my personal information? | | To protect your personal information from unauthorized access and use, we use security measures that comply with federal law. These measures include computer safeguards and secured files and buildings. |
| How does Capitol Series Trust collect my personal information? | | We collect your personal information, for example, when you • open an account or deposit money • buy securities from us or sell securities to us • make deposits or withdrawals from your account provide account information • give us your account information • make a wire transfer • tell us who receives the money • tell us where to send the money • show your government-issued ID • show your driver’s license |
Why can’t I limit all
sharing? | | Federal law gives you the right to limit only • sharing for affiliates’ everyday business purposes — information about your creditworthiness • affiliates from using your information to market to you • sharing for nonaffiliates to market to you State laws and individual companies may give you additional rights to limit sharing. |
| Definitions | | |
| Affiliates | | Companies related by common ownership or control. They can be financial and nonfinancial companies. |
| Nonaffiliates | | Companies not related by common ownership or control. They can be financial and nonfinancial companies. ◾ Capitol Series Trust does not share your personal information with nonaffiliates so they can market to you. |
| Joint marketing | | A formal agreement between nonaffiliated financial companies that together market financial products or services to you. ◾ Capitol Series Trust doesn’t jointly market financial products or services to you. |
34
PROXY VOTING (Unaudited)
A description of the policies and procedures that the Fund uses to determine how to vote proxies relating to portfolio securities and information regarding how the Fund voted those proxies during the most recent twelve month period ended June 30, is available without charge upon request by (1) calling the Fund at (888) 912-4562 and (2) from Fund documents filed with the Securities and Exchange Commission (“SEC”) on the SEC’s website at www.sec.gov.
TRUSTEES
Robert G. Dorsey, Chairman
Walter B. Grimm
Mary M. Morrow
OFFICERS
Matthew J. Miller, Chief Executive Officer and President
Brandon Kipp, Chief Compliance Officer
Stacey Havens, Vice President
Zachary P. Richmond, Treasurer and Chief Financial Officer
Tiffany R. Franklin, Secretary
Stephen L. Preston, Anti-Money Laundering Compliance Officer
INVESTMENT ADVISER
Fuller & Thaler Asset Management, Inc.
411 Borel Avenue, Suite 300
San Mateo, CA 94402
DISTRIBUTOR
Unified Financial Securities, LLC
9465 Counselors Row, Suite 200
Indianapolis, IN 46240
INDEPENDENT REGISTERED PUBLIC ACCOUNTING FIRM
Ernst & Young LLP
800 Yard Street, Suite 500
Grandview Heights, OH 43212
LEGAL COUNSEL
Bernstein Shur
100 Middle Street, 6th Floor
Portland, ME 04104
CUSTODIAN
Huntington National Bank
41 South High Street
Columbus, OH 43215
ADMINISTRATOR, TRANSFER AGENT AND FUND ACCOUNTANT
Ultimus Asset Services, LLC
225 Pictoria Drive, Suite 450
Cincinnati, OH 45246
This report is intended only for the information of shareholders or those who have received the Fund’s prospectus which contains information about the Fund’s management fee and expenses. Please read the prospectus carefully before investing.
Distributed by Unified Financial Securities, LLC
Member FINRA/SIPC
Item 2. Code of Ethics.
As of the end of the period covered by this report, the registrant has adopted a code of ethics that applies to the registrant’s principal executive officer, principal financial officer, principal accounting officer or controller, or persons performing similar functions, regardless of whether these individuals are employed by the registrant or a third party. Pursuant to Item 12(a)(1), a copy of registrant’s code of ethics is filed as an exhibit to this Form N-CSR. During the period covered by this report, the code of ethics has not been amended, and the registrant has not granted any waivers, including implicit waivers, from the provisions of the code of ethics.
Item 3. Audit Committee Financial Expert.
(a) The registrant’s board of trustees has determined that the registrant does not have an audit committee financial expert. The committee members and the full Board considered a possibility of adding a member that would qualify as an expert. The audit committee determined that, although none of its members meet the technical definition of an audit committee expert, the committee has sufficient financial expertise to adequately perform its duties under the Audit Committee Charter without the addition of a qualified expert.
Item 4. Principal Accountant Fees and Services.
(a) Audit Fees billed to the registrant by its principal accountants for the two most recent fiscal years:
| | | | | | | | |
Fuller & Thaler Behavioral Small-Cap Equity Fund: | | | FY 2017 | | | $ | 15,500 | |
| | | FY 2016 | | | $ | 18,000 | |
(b) Audit-Related Fees billed to the registrant by its principal accountants for the two most recent fiscal years:
| | | | | | | | |
Fuller & Thaler Behavioral Small-Cap Equity Fund: | | | FY 2017 | | | $ | 0 | |
| | | FY 2016 | | | $ | 0 | |
c) Tax Fees billed to the registrant by its principal accountants for the two most recent fiscal years:
| | | | | | | | |
Fuller & Thaler Behavioral Small-Cap Equity Fund: | | | FY 2017 | | | $ | 5,000 | |
| | | FY 2016 | | | $ | 5,875 | |
Nature of the fees: Preparation of the 1120 RIC and Excise review
(d) All other fees billed to the registrant by its principal accountants for the two most recent fiscal years:
| | | | | | | | |
Fuller & Thaler Behavioral Small-Cap Equity Fund: | | | FY 2017 | | | $ | 0 | |
| | | FY 2016 | | | $ | 0 | |
| (e) | (1) Audit Committee’s Pre-Approval Policies |
The Audit Committee Charter requires the Audit Committee to be responsible for the selection, retention or termination of auditors and, in connection therewith, to (i) evaluate the proposed fees and other compensation, if any, to be paid to the auditors, (ii) evaluate the independence of the auditors, (iii) pre-approve all audit services and, when appropriate, any non-audit services provided by the independent auditors to the Trust, (iv) pre-approve, when appropriate, any non-audit services provided by the independent auditors to the Trust’s investment adviser, or any entity controlling, controlled by, or under common control with the investment adviser and that provides ongoing services to the Trust if the engagement relates directly to the operations and financial reporting of the Trust, and (v) receive the auditors’ specific representations as to their independence;
| | (2) Percentages of Services Approved by the Audit Committee |
| | | | |
Registrant | | | |
Audit-Related Fees: | | | N/A | |
Tax Fees: | | | 100 | % |
All Other Fees: | | | N/A | |
(f) During audit of registrant’s financial statements for the most recent fiscal year, less than 50 percent of the hours expended on the principal accountant’s engagement were attributed to work performed by persons other than the principal accountant’s full-time, permanent employees.
(g) The aggregate non-audit fees billed by the registrant’s accountant for services rendered to the registrant, and rendered to the registrant’s investment adviser (not including any sub-adviser whose role is primarily portfolio management and is subcontracted with or overseen by another investment adviser), and any entity controlling, controlled by, or under common control with the adviser that provides ongoing services to the registrant:
| | | | | | | | |
| | | Registrant | | | Adviser | |
FY 2017 | | $ | 5,000 | | | $ | 0 | |
FY 2016 | | $ | 5,875 | | | $ | 0 | |
(h) Not applicable. The auditor performed no services for the registrant’s investment adviser or any entity controlling, controlled by, or under common control with the investment adviser that provides ongoing services to the registrant.
Item 5. Audit Committee of Listed Registrants.
NOT APPLICABLE – applies to listed companies only
Item 6. Schedule of Investments.
Schedule filed with Item 1.
Item 7. Disclosure of Proxy Voting Policies and Procedures for Closed-End Management Investment Companies.
NOT APPLICABLE – applies to closed-end funds only
Item 8. Portfolio Managers of Closed-End Management Investment Companies.
NOT APPLICABLE – applies to closed-end funds only
Item 9. Purchases of Equity Securities by Closed-End Management Investment Company and Affiliated Purchasers.
NOT APPLICABLE – applies to closed-end funds only
Item 10. Submission of Matters to a Vote of Security Holders.
The guidelines applicable to shareholders desiring to submit recommendations for nominees to the Registrant’s board of trustees are contained in the statement of additional information of the Trust with respect to the Fund(s) for which this Form N-CSR is being filed.
Item 11. Controls and Procedures.
(a) Based on their evaluation of the registrant’s disclosure controls and procedures (as defined in Rule 30a-3(c) under the Investment Company Act of 1940, as amended (the “Act”)) as of a date within 90 days of the filing date of this report, the registrant’s principal executive officer and principal financial officer have concluded that such disclosure controls and procedures are reasonably designed and are operating effectively to ensure that material information relating to the registrant is made known to them by others within those entities, particularly during the period in which this report is being prepared, and that the information required in filings on Form N-CSR is recorded, processed, summarized, and reported on a timely basis.
(b) There were no changes in the registrant’s internal control over financial reporting (as defined in Rule 30a-3(d) under the Investment Company Act of 1940) that occurred during the second fiscal quarter of the period covered by this report that have materially affected, or are reasonably likely to materially affect, the registrant’s internal control over financial reporting.
Item 12. Disclosure of Securities Lending Activities for Closed-End Management Investment Companies.
Not applicable
Item 13. Exhibits.
(a)(1) Code is filed herewith.
(a)(2) Certifications by the registrant’s principal executive officer and principal financial officer, pursuant to Section 302 of the Sarbanes-Oxley Act of 2002 and required by Rule 30a-2 under the Investment Company Act of 1940 are filed herewith.
(a)(3) Not applicable.
(b) Certifications pursuant to Rule 30a-2(b) are furnished herewith.
SIGNATURES
Pursuant to the requirements of the Securities Exchange Act of 1934 and the Investment Company Act of 1940, the registrant has duly caused this report to be signed on its behalf by the undersigned, thereunto duly authorized.
| | |
| (Registrant) | | Capitol Series Trust |
| | |
| By (Signature and Title) | | /s/ Matthew J. Miller |
| | Matthew J. Miller, Chief Executive Officer and President |
Pursuant to the requirements of the Securities Exchange Act of 1934 and the Investment Company Act of 1940, this report has been signed below by the following persons on behalf of the registrant and in the capacities and on the dates indicated.
| | |
| By (Signature and Title) | | /s/ Matthew J. Miller |
| | Matthew J. Miller, Chief Executive Officer and President |
| | |
| By (Signature and Title) | | /s/ Zachary P. Richmond |
| | Zachary P. Richmond, Treasurer and Chief Financial Officer |