UNITED STATES
SECURITIES AND EXCHANGE COMMISSION
Washington, D.C. 20549
FORM N-CSR
CERTIFIED SHAREHOLDER REPORT OF REGISTERED
MANAGEMENT INVESTMENT COMPANIES
Investment Company Act file number: 811-22895
Capitol Series Trust
(Exact name of registrant as specified in charter)
Ultimus Asset Services, LLC
2960 North Meridian Street, Suite 300
Indianapolis, IN46208
(Address of principal executive offices) (Zip code)
Zachary P. Richmond
Ultimus Asset Services, LLC
2960 N. Meridian St. Suite 300
Indianapolis, IN 46208
(Name and address of agent for service)
Registrant’s telephone number, including area code: 513-587-3400
Date of fiscal year end: August 31
Date of reporting period: August 31, 2017
Item 1. Reports to Stockholders.


Where discipline meets common sense.
Annual Report
August 31, 2017
Meritage Growth Equity Fund MPGEX/MPGIX
Meritage Value Equity Fund MVEBX
Meritage Yield-Focus Equity Fund MPYEX/MPYIX
| | | | |
| 913.345.7000 | | www.meritageportfoliofunds.com | | 7500 College Blvd., Suite 1212, Overland Park, KS 66210 |
MESSAGE FROM THE CHIEF INVESTMENT OFFICER – (Unaudited)
At Meritage, we are value-driven investors. We buy stock in businesses when they i) score well in our comprehensive stock-ranking process (universe is global, all-cap and about 6,500 securities), and ii) are selling for less than we believe they are worth. Our value discipline is intended to provide a margin of safety and is one of our primary risk management tools, along with managing position sizes and diversification.
Dear Fellow Shareholders:
During the six months ended August 31, 2017, since our semi-annual report of February 28, 2017, the broad equity market as represented by the S&P 500 was up 5.7%. For the fiscal year ended August 31, 2017, the S&P was up 16.2%.
As mentioned in our semi-annual report, reaction to the prospect of significantly positive growth tax change, reduced regulatory pressure, along with higher spending for defense, safety and infrastructure are all factors helping the equity market environment. Despite major geopolitical risks, continued low interest rates plus gradually improving world GNP trends should produce a relatively stable market environment, in which our selection process can work effectively.
Notably, our Value strategy performed well in the past year as compared to its benchmark and our Growth strategy continued to perform well, in line with its respective market benchmark for the year and well ahead of the S&P 500. Our Yield-Focus strategy turned in a positive year, but trailed its most comparable benchmark, the Zacks Multi-Asset Income Index.
As always, the primary mechanism generating our strong long term returns was responsible for our results in fiscal 2017. Our robust bottom up value-centric security selection process continues to be refined and improved and rigorously searched for attractive mispriced securities, among all capitalization sizes and geographies throughout the world.
We explore this topic further in the following pages. A specific discussion of each Fund and its performance is included in Management’s Discussion of Fund Performance.
Thank you for your continued trust in us as stewards of your capital. As previously mentioned we have our own money invested alongside yours in each of our funds, and we remain committed to delivering attractive risk-adjusted returns over full market cycles.
Sincerely,
Mark Eveans, CFA
President and Chief Investment Officer
1
MANAGEMENT’S DISCUSSION OF FUND PERFORMANCE – (Unaudited)
Meritage Growth Equity Fund
For the fiscal year ended August 31, 2017, the Meritage Growth Equity Fund Institutional Class and Investor Class returned 20.3% and 20.0%, respectively. These returns were better than those provided by the broad equity market (as represented by the S&P 500) and closely tracked the Fund’s primary benchmark, the Russell 1000 Growth Index which returned 20.8% and the Lipper Large Cap Growth Index which returned 21.6% during the same time frame.
For the six months ended August 31, 2017, which is the period since our Semi-Annual Report, the Meritage Growth Equity Fund Institutional Class and Investor Class returned 8.5% and 8.4%, respectively. These returns lagged the Russell 1000 Growth Index benchmark which returned 10.7% during the same time frame, as well as the Lipper Large Cap Growth Index return of 12.9%.
From an attribution standpoint, the Fund’s strong performance over the course of the last 12 months, compared to the benchmark, was driven primarily by an over-weight for most of the period as compared to the benchmark in the Information Technology sector. Our stock selection in that sector was also superior. The interaction of these two factors was a significant positive. Sector underweights for Consumer Staples, Telecommunications, Real Estate, Energy and Materials were also positive factors for the Fund.
Regarding specific issues, the strongest gainers for the year were Nvidia Corp., up 181.6%, Coherent Inc., up 84.6% and II-VI Inc., up 68.0%.
The poorest performers for the year were Gibraltar Industries, down 27.3%, Acuity Brands Inc., down 23.7% and McKesson Corp., down 23.2%.
As a value-centric and process driven Growth manager, most sector differences as compared to the benchmark are a result of either an under or overweight of specific, bottom-up, attractively valued growth opportunities identified by our process, within that particular sector.
We expect a continuation of abnormally low interest rates and below average economic growth for the world’s leading economies. We believe many investors share our view and have correspondingly been willing to pay an excessive premium for well-known growth names. This is where we part company with the crowd, however, as we expect the value discipline embedded in our growth approach to yield better results over full market cycles.
Meritage Value Equity Fund
For the fiscal year ended August 31, 2017, the Meritage Value Equity Fund Institutional Class returned 13.4%. This return exceeded the Russell 1000 Value Index benchmark which returned 11.6% during the same time frame, and closely tracked the Lipper Large Cap Value Index return of 13.7%.
For the six months ended August 31, 2017, which is the period since our Semi-Annual Report, the Meritage Value Equity Fund Institutional Class returned 3.7%. This return significantly exceeded the Russell 1000 Value Index benchmark which returned 0.5% during the same time frame, as well as the Lipper Large Cap Value Index return of 1.9%.
From an attribution standpoint, the Fund’s overweight in the Health Care and Information Technology sectors, coupled with superior stock selection in both sectors were significant positive factors. An underweight in the Energy sector along with superior stock selection was also helpful to Fund performance. An underweight in the Consumer Discretionary and Consumer Staples sectors along with under-performing security selections in those sectors held back the Fund returns.
2
MANAGEMENT’S DISCUSSION OF FUND PERFORMANCE – (Unaudited) (continued)
Regarding individual issues, the strongest gainers for the year were Teradyne Inc., up 70.7%, Spirit AeroSystems Holdings, up 63.4%, and UnitedHealth Group Inc., up 48.6%.
The poorest performers for the year were Teva Pharmaceutical Industries, down 23.1%, World Fuel Services Corp., down 20.7% and Taro Pharmaceutical Industries, down 19.8%.
As a value-centric and process driven manager, most sector differences as compared to the benchmark are the result of either an under or overweight of specific bottom-up valuation opportunities identified by our process.
We expect a continuation of abnormally low interest rates and below average economic growth for the world’s leading economies. We believe many investors share our view and have correspondingly been willing to pay a premium for well-known stocks. This is where we part company with the crowd, however, as we expect the discipline embedded in our value approach will yield better results over full market cycles.
Meritage Yield-Focus Equity Fund
For the fiscal year ended August 31, 2017, the Meritage Yield-Focus Equity Fund Institutional Class and Investor Class returned 7.8% and 7.9%, respectively. These returns broadly trailed the 11.7% total return for the Russell 3000 Value Index, a general value market benchmark, and the Zacks Multi-Asset Income Index, a style-specific peer index, which returned 12.5% during the same time.
For the six months ended August 31, 2017, which is the period since our Semi-Annual Report, the Meritage Yield-Focus Equity Fund Institutional Class and Investor Class returned 1.4% and 1.3% respectively. These returns exceeded the Russell 3000 Value Index, which returned 0.3% during the time period, but trailed the Zacks Multi-Asset Index, which returned 3.7% during the same time frame.
A founding premise of the Yield-Focus Equity Fund is to earn 50–75% of the expected long-term equity return in the form of cash dividends and distributions. The strategy invests in six key types of equity asset classes – common stocks, master limited partnerships, other limited partnerships, real estate investment trusts, business development companies, convertible preferred stocks and, in rare situations, straight preferred stocks. The Meritage comprehensive security selection process searches globally for attractive yield franchises.
For fiscal year ended August 31, 2017, regarding equity asset class performance, convertible preferred stocks and MLPs were the strongest relative performers. REITs and straight preferred stocks had the lowest absolute returns. The best performing sectors were Energy, Consumer Staples, Industrials and Materials where strong stock selection helped relative performance. Performance was hurt by less favorable stock selection in the Utilities, Telecommunications, Consumer Discretionary and Financials sectors.
In terms of specific issues, the strongest performers for the year were Boeing Company, up 90.8%, HP Inc., up 37.1% and Reynolds American Inc., up 36.4%.
The poorest performers for the year were GameStop Corp, down 42.3%, Gannett Co., down 28.1% and CenturyLink, Inc., down 22.2%.
We use two benchmarks in assessing the performance of the Yield-Focus Equity Fund. The Russell 3000 Value Index is a long-term general purpose value-centric benchmark without specificity regarding the Fund’s distinct yield-focus style. The Zacks Multi-Asset Income Index has specific asset structure and distinguished dividend yield characteristics similar to the Fund.
3
INVESTMENT RESULTS – (Unaudited)
Average Annual Total Returns as of August 31, 2017 (a)
| | | | | | | | | | | | | | |
Fund/Index | | 1 Year | | | 3 Year | | | Since Inception
(12/23/13) | |
Meritage Growth Equity Fund – Institutional Class | | | 20.27 | % | | | 11.14 | % | | | 11.66 | % |
Meritage Growth Equity Fund – Investor Class | | | 20.02 | % | | | 10.89 | % | | | 11.38 | % |
Russell 1000 Growth Index (b) | | | 20.81 | % | | | 11.67 | % | | | 12.62 | % |
| | | | | | | | |
| | | Expense Ratios (c) | |
| | | Institutional Class | | | Investor Class | |
Gross | | | 1.63 | % | | | 1.88 | % |
With Applicable Waivers | | | 1.03 | % | | | 1.28 | % |
The performance quoted represents past performance, which does not guarantee future results. The investment return and principal value of an investment will fluctuate so that an investor’s shares, when redeemed, may be worth more or less than their original cost. The returns shown do not reflect deduction of taxes that a shareholder would pay on Fund distributions or the redemption of Fund shares. The Fund’s investment objectives, risks, charges and expenses must be considered carefully before investing. Current performance of a Fund may be lower or higher than the performance quoted. Performance data current to the most recent month end may be obtained by calling 1-855-261-0104.
The performance in the preceding table reflects any fee reductions during the applicable period. If such fee reductions had not occurred, the quoted performance would be lower.
| (a) | Return figures reflect any change in price per share and assume the reinvestment of all distributions. |
| (b) | The Russell 1000 Growth Index is a widely recognized unmanaged index of equity securities and is representative of a broader domestic equity market and range of securities than is found in the Fund’s portfolio. Individuals cannot invest directly in an index; however, an individual can invest in exchange traded funds or other investment vehicles that attempt to track the performance of a benchmark index. |
| (c) | The expense ratios are from the Fund’s prospectus dated December 29, 2016. The Adviser has contractually agreed to waive or limit its fees and assume other expenses of the Fund through December 31, 2017, so that total annual fund operating expenses do not exceed 1.00% of the Fund’s average daily net assets. This operating expense limitation does not apply to brokerage fees and commissions, borrowing costs (such as interest and dividend expenses on securities sold short), taxes, 12b-1 fees, extraordinary expenses and indirect expenses (such as “acquired fund fees and expenses”). Additional information pertaining to the Fund’s expense ratios as of August 31, 2017 can be found in the financial highlights. |
The Fund’s investment objective, strategies, risks, charges and expenses must be considered carefully before investing. The prospectus contains this and other important information about the investment company and may be obtained by calling 1-855-261-0104. Please read it carefully before investing.
The Fund is distributed by Unified Financial Securities, LLC, Member FINRA/SIPC.
4
INVESTMENT RESULTS – (Unaudited) (continued)
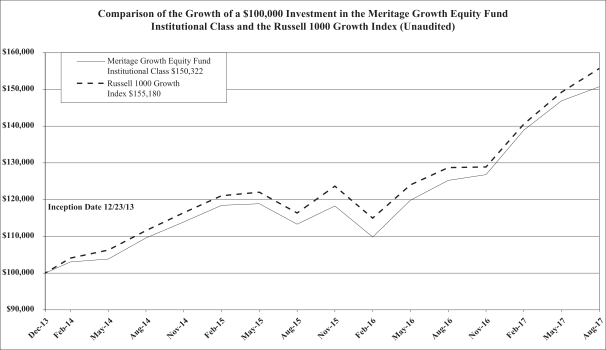
The chart above assumes an initial investment of $100,000 made on December 23, 2013 (commencement of operations) and held through August 31, 2017. THE FUND’S RETURNS REPRESENT PAST PERFORMANCE AND DO NOT GUARANTEE FUTURE RESULTS. The returns shown do not reflect deduction of taxes that a shareholder would pay on the Fund’s distributions or the redemption of the Fund’s shares. Investment returns and principal values will fluctuate so that your shares, when redeemed, may be worth more or less than their original purchase price.
The Russell 1000 Growth Index is a widely recognized unmanaged index of equity securities and is representative of a broader domestic equity market and range of securities than is found in the Fund’s portfolio. Individuals cannot invest directly in an Index; however, an individual can invest in exchange traded funds or other investment vehicles that attempt to track the performance of a benchmark index. The Index returns do not include expenses, which have been deducted from the Fund’s return. These performance figures include the change in value of the stocks in the index plus the reinvestment of dividends and are not annualized. The returns shown do not reflect deduction of taxes that a shareholder would pay on Fund distributions or the redemption of Fund shares.
Current performance may be lower or higher than the performance data quoted. For more information on the Fund, and to obtain performance data current to the most recent month-end, or to request a prospectus, please call 1-855-261-0104. You should carefully consider the investment objectives, potential risks, management fees, and charges and expenses of the Fund before investing. The Fund’s prospectus contains this and other information about the Fund, and should be read carefully before investing.
The Fund is distributed by Unified Financial Securities, LLC, member FINRA/SIPC..
5
INVESTMENT RESULTS – (Unaudited) (continued)
Average Annual Total Returns as of August 31, 2017 (a)
| | | | | | | | | | | | |
Fund/Index | | 1 Year | | | 3 Year | | | Since Inception
(12/23/13) | |
Meritage Value Equity Fund – Institutional Class | | | 13.41 | % | | | 5.25 | % | | | 6.96 | % |
Russell 1000 Value Index (b) | | | 11.58 | % | | | 6.74 | % | | | 8.77 | % |
| | | | |
| | | Expense Ratios (c) | |
| | | Institutional Class | |
Gross | | | 1.71 | % |
With Applicable Waivers | | | 1.04 | % |
The performance quoted represents past performance, which does not guarantee future results. The investment return and principal value of an investment will fluctuate so that an investor’s shares, when redeemed, may be worth more or less than their original cost. The returns shown do not reflect deduction of taxes that a shareholder would pay on Fund distributions or the redemption of Fund shares. The Fund’s investment objectives, risks, charges and expenses must be considered carefully before investing. Current performance of a Fund may be lower or higher than the performance quoted. Performance data current to the most recent month end may be obtained by calling 1-855-261-0104.
The performance in the preceding table reflects any fee reductions during the applicable period. If such fee reductions had not occurred, the quoted performance would be lower.
| (a) | Return figures reflect any change in price per share and assume the reinvestment of all distributions. |
| (b) | The Russell 1000 Value Index is a widely recognized unmanaged index of equity securities and is representative of a broader domestic equity market and range of securities than is found in the Fund’s portfolio. Individuals cannot invest directly in an index; however, an individual can invest in exchange traded funds or other investment vehicles that attempt to track the performance of a benchmark index. |
| (c) | The expense ratios are from the Fund’s prospectus dated December 29, 2016. The Adviser has contractually agreed to waive or limit its fees and assume other expenses of the Fund through December 31, 2017, so that total annual fund operating expenses do not exceed 1.00% of the Fund’s average daily net assets. This operating expense limitation does not apply to brokerage fees and commissions, borrowing costs (such as interest and dividend expenses on securities sold short), taxes, 12b-1 fees, extraordinary expenses and indirect expenses (such as “acquired fund fees and expenses”). Additional information pertaining to the Fund’s expense ratios as of August 31, 2017 can be found in the financial highlights. |
The Fund’s investment objective, strategies, risks, charges and expenses must be considered carefully before investing. The prospectus contains this and other important information about the investment company and may be obtained by calling 1-855-261-0104. Please read it carefully before investing.
The Fund is distributed by Unified Financial Securities, LLC, Member FINRA/SIPC.
6
INVESTMENT RESULTS – (Unaudited) (continued)
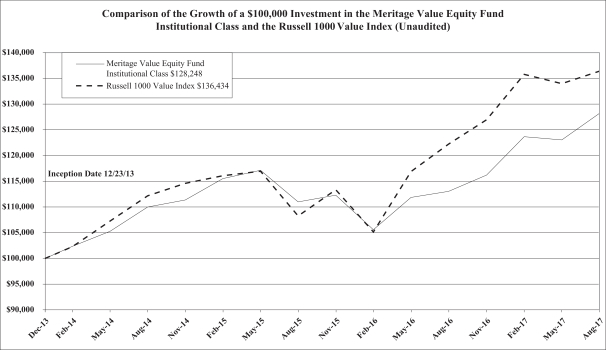
The chart above assumes an initial investment of $100,000 made on December 23, 2013 (commencement of operations) and held through August 31, 2017. THE FUND’S RETURNS REPRESENT PAST PERFORMANCE AND DO NOT GUARANTEE FUTURE RESULTS. The returns shown do not reflect deduction of taxes that a shareholder would pay on the Fund’s distributions or the redemption of the Fund’s shares. Investment returns and principal values will fluctuate so that your shares, when redeemed, may be worth more or less than their original purchase price.
The Russell 1000 Value Index is a widely recognized unmanaged index of equity securities and is representative of a broader domestic equity market and range of securities than is found in the Fund’s portfolio. Individuals cannot invest directly in an Index; however, an individual can invest in exchange traded funds or other investment vehicles that attempt to track the performance of a benchmark index. The Index returns do not include expenses, which have been deducted from the Fund’s return. These performance figures include the change in value of the stocks in the index plus the reinvestment of dividends and are not annualized. The returns shown do not reflect deduction of taxes that a shareholder would pay on Fund distributions or the redemption of Fund shares.
Current performance may be lower or higher than the performance data quoted. For more information on the Fund, and to obtain performance data current to the most recent month-end, or to request a prospectus, please call 1-855-261-0104. You should carefully consider the investment objectives, potential risks, management fees, and charges and expenses of the Fund before investing. The Fund’s prospectus contains this and other information about the Fund, and should be read carefully before investing.
The Fund is distributed by Unified Financial Securities, LLC, member FINRA/SIPC.
7
INVESTMENT RESULTS – (Unaudited) (continued)
Average Annual Total Returns as of August 31, 2017 (a)
| | | | | | | | | | | | |
Fund/Index | | 1 Year | | | 3 Year | | | Since Inception
(12/23/13) | |
Meritage Yield-Focus Equity Fund – Institutional Class | | | 7.79 | % | | | 1.08 | % | | | 4.19 | % |
Meritage Yield-Focus Equity Fund – Investor Class | | | 7.93 | % | | | 0.95 | % | | | 4.03 | % |
Russell 3000 Value Index (b) | | | 11.73 | % | | | 6.76 | % | | | 8.60 | % |
Zacks Multi-Asset Income Index TR (c) | | | 12.51 | % | | | -1.27 | % | | | 1.63 | % |
| | | | | | | | |
| | | Expense Ratios (d) | |
| | | Institutional Class | | | Investor Class | |
Gross | | | 1.64 | % | | | 1.89 | % |
With Applicable Waivers | | | 1.15 | % | | | 1.40 | % |
The performance quoted represents past performance, which does not guarantee future results. The investment return and principal value of an investment will fluctuate so that an investor’s shares, when redeemed, may be worth more or less than their original cost. The returns shown do not reflect deduction of taxes that a shareholder would pay on Fund distributions or the redemption of Fund shares. The Fund’s investment objectives, risks, charges and expenses must be considered carefully before investing. Current performance of a Fund may be lower or higher than the performance quoted. Performance data current to the most recent month end may be obtained by calling 1-855-261-0104.
The performance in the preceding table reflects any fee reductions during the applicable period. If such fee reductions had not occurred, the quoted performance would be lower.
| (a) | Return figures reflect any change in price per share and assume the reinvestment of all distributions. |
| (b) | The Russell 3000 Value Index is a widely recognized unmanaged index of equity securities and is representative of a broader domestic equity market and range of securities than is found in the Fund’s portfolio. Individuals cannot invest directly in an index; however, an individual can invest in exchange traded funds or other investment vehicles that attempt to track the performance of a benchmark index. |
| (c) | The Zacks Multi-Asset Income Index is comprised of approximately 125 to 150 securities selected, based on investment and other criteria, from a universe of domestic and international companies. The universe of securities within the index includes U.S. listed common stocks and ADRs paying dividends, real estate investment trusts, MLPs, closed end funds, Canadian royalty trusts and traditional preferred stocks. Individuals cannot invest directly in an index. |
| (d) | The expense ratios are from the Fund’s prospectus dated December 29, 2016. The Adviser has contractually agreed to waive or limit its fees and assume other expenses of the Fund through December 31, 2017, so that total annual fund operating expenses do not exceed 1.00% of the Fund’s average daily net assets. This operating expense limitation does not apply to brokerage fees and commissions, borrowing costs (such as interest and dividend expenses on securities sold short), taxes, 12b-1 fees, extraordinary expenses and indirect expenses (such as “acquired fund fees and expenses”). Additional information pertaining to the Fund’s expense ratios as of August 31, 2017 can be found in the financial highlights. |
The Fund’s investment objective, strategies, risks, charges and expenses must be considered carefully before investing. The prospectus contains this and other important information about the investment company and may be obtained by calling 1-855-261-0104. Please read it carefully before investing.
The Fund is distributed by Unified Financial Securities, LLC, Member FINRA/SIPC.
8
INVESTMENT RESULTS – (Unaudited) (continued)
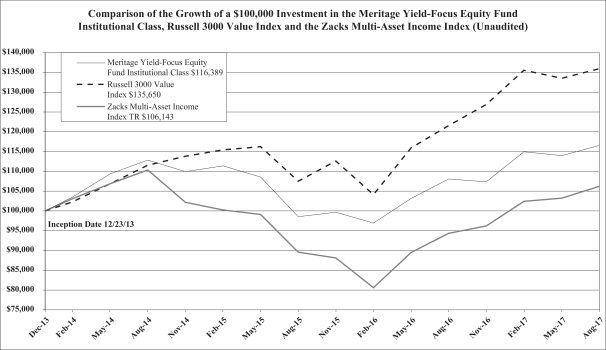
The chart above assumes an initial investment of $100,000 made on December 23, 2013 (commencement of operations) and held through August 31, 2017. THE FUND’S RETURNS REPRESENT PAST PERFORMANCE AND DO NOT GUARANTEE FUTURE RESULTS. The returns shown do not reflect deduction of taxes that a shareholder would pay on the Fund’s distributions or the redemption of the Fund’s shares. Investment returns and principal values will fluctuate so that your shares, when redeemed, may be worth more or less than their original purchase price.
The Russell 3000 Value Index is a widely recognized unmanaged index of equity securities and is representative of a broader domestic equity market and range of securities than is found in the Fund’s portfolio. Individuals cannot invest directly in an Index; however, an individual can invest in exchange traded funds or other investment vehicles that attempt to track the performance of a benchmark index. The Index returns do not include expenses, which have been deducted from the Fund’s return. These performance figures include the change in value of the stocks in the index plus the reinvestment of dividends and are not annualized. The returns shown do not reflect deduction of taxes that a shareholder would pay on Fund distributions or the redemption of Fund shares.
The Zacks Multi-Asset Income Index is comprised of approximately 125 to 150 securities selected, based on investment and other criteria, from a universe of domestic and international companies. The universe of securities within the Index includes U.S. listed common stocks and ADRs paying dividends, real estate investment trusts, MLPs, closed end funds, Canadian royalty trusts and traditional preferred stocks. Individuals cannot invest directly in an Index.
Current performance may be lower or higher than the performance data quoted. For more information on the Fund, and to obtain performance data current to the most recent month-end, or to request a prospectus, please call 1-855-261-0104. You should carefully consider the investment objectives, potential risks, management fees, and charges and expenses of the Fund before investing. The Fund’s prospectus contains this and other information about the Fund, and should be read carefully before investing.
The Fund is distributed by Unified Financial Securities, LLC, member FINRA/SIPC.
9
FUND HOLDINGS – (Unaudited)
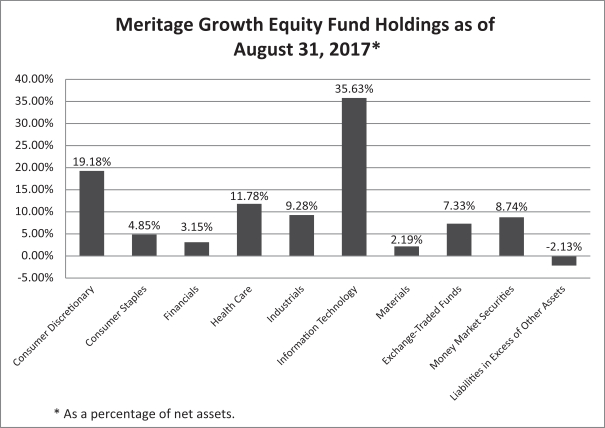
The investment objective of the Meritage Growth Equity Fund is to seek growth of capital.
10
FUND HOLDINGS – (Unaudited) (continued)
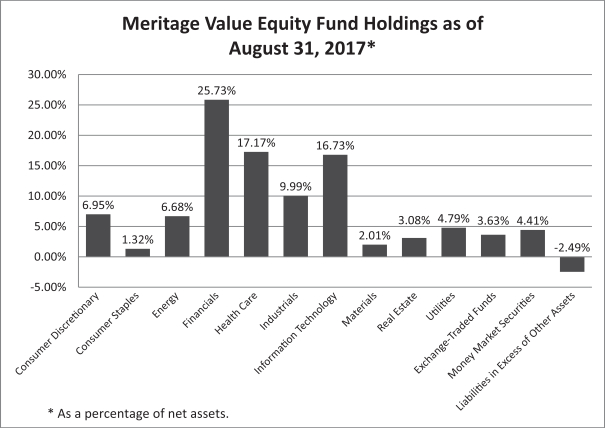
The investment objective of the Meritage Value Equity Fund is to seek growth of capital. Income is a secondary objective.
11
FUND HOLDINGS – (Unaudited) (continued)
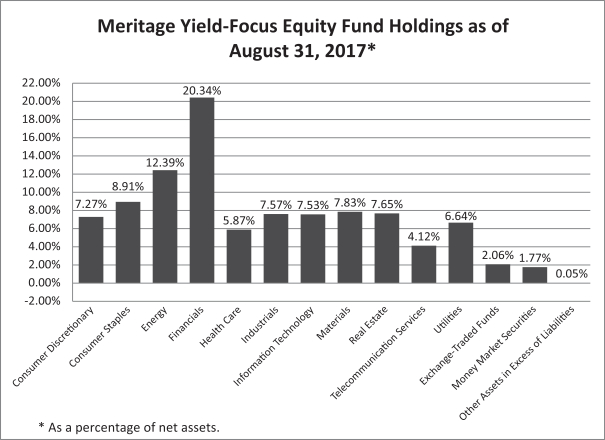
The investment objective of the Meritage Yield-Focus Equity Fund is to seek long-term growth of capital with an emphasis on high current income.
AVAILABILITY OF PORTFOLIO SCHEDULE – (Unaudited)
The Funds will file their complete schedule of portfolio holdings with the Securities and Exchange Commission (“SEC”) for the first and third quarter of each fiscal year on Form N-Q. The Funds’ Forms N-Q will be available at the SEC’s website at www.sec.gov. The Form N-Q may be reviewed and copied at the Public Reference Room in Washington, DC. Information on the operation of the Public Reference Room may be obtained by calling 1-800-SEC-0330.
12
MERITAGE GROWTH EQUITY FUND
SCHEDULE OF INVESTMENTS
August 31, 2017
| | | | | | | | |
| COMMON STOCKS – 86.06% | | Shares | | | Fair Value | |
Consumer Discretionary – 19.18% | |
Amazon.com, Inc. * | | | 850 | | | $ | 833,510 | |
Brunswick Corp. | | | 9,650 | | | | 506,432 | |
Delphi Automotive PLC | | | 4,290 | | | | 413,556 | |
Home Depot, Inc./The | | | 5,920 | | | | 887,230 | |
Priceline Group, Inc./The * | | | 405 | | | | 750,092 | |
Steven Madden Ltd. * | | | 7,030 | | | | 298,072 | |
Thor Industries, Inc. | | | 8,095 | | | | 879,441 | |
| | | | | | | | |
| | | | | | | 4,568,333 | |
| | | | | | | | |
Consumer Staples – 4.85% | |
Colgate-Palmolive Co. | | | 5,060 | | | | 362,498 | |
Monster Beverage Corp. * | | | 5,280 | | | | 294,730 | |
Reckitt Benckiser Group PLC | | | 25,800 | | | | 498,585 | |
| | | | | | | | |
| | | | | | | 1,155,813 | |
| | | | | | | | |
Financials – 3.15% | |
Aon PLC | | | 2,510 | | | | 349,292 | |
Everest Re Group Ltd. | | | 1,586 | | | | 400,433 | |
| | | | | | | | |
| | | | | | | 749,725 | |
| | | | | | | | |
Health Care – 11.78% | |
Amgen, Inc. | | | 2,421 | | | | 430,381 | |
Globus Medical, Inc., Class A * | | | 8,795 | | | | 265,873 | |
Intuitive Surgical, Inc. * | | | 361 | | | | 362,686 | |
Johnson & Johnson | | | 5,510 | | | | 729,359 | |
Masimo Corp. * | | | 2,915 | | | | 245,968 | |
Mettler-Toledo International, Inc. * | | | 706 | | | | 427,194 | |
Teleflex, Inc. | | | 1,617 | | | | 342,400 | |
| | | | | | | | |
| | | | | | | 2,803,861 | |
| | | | | | | | |
Industrials – 9.28% | |
AMETEK, Inc. | | | 5,245 | | | | 331,746 | |
Deluxe Corp. | | | 6,185 | | | | 428,930 | |
Ingersoll-Rand PLC | | | 3,370 | | | | 287,764 | |
Koninklijke Philips NV | | | 8,095 | | | | 307,529 | |
Nordson Corp. | | | 2,665 | | | | 291,285 | |
Snap-on, Inc. | | | 1,400 | | | | 206,598 | |
Trex Co., Inc. * | | | 4,690 | | | | 356,440 | |
| | | | | | | | |
| | | | | | | 2,210,292 | |
| | | | | | | | |
Information Technology – 35.63% | |
Alphabet, Inc., Class A * | | | 1,105 | | | | 1,055,540 | |
Apple, Inc. | | | 8,734 | | | | 1,432,376 | |
Applied Materials, Inc. | | | 8,330 | | | | 375,850 | |
See accompanying notes which are an integral part of these financial statements.
13
MERITAGE GROWTH EQUITY FUND
SCHEDULE OF INVESTMENTS – (continued)
August 31, 2017
| | | | | | | | |
| COMMON STOCKS – 86.06% – continued | | Shares | | | Fair Value | |
Information Technology – 35.63% – continued | | | | | | | | |
Autohome, Inc. ADR * | | | 5,995 | | | $ | 385,299 | |
Coherent, Inc. * | | | 1,382 | | | | 322,448 | |
Electronic Arts, Inc. * | | | 3,635 | | | | 441,652 | |
Facebook, Inc., Class A * | | | 1,610 | | | | 276,872 | |
Fiserv, Inc. * | | | 4,395 | | | | 543,705 | |
Flex Ltd. * | | | 18,065 | | | | 293,918 | |
MasterCard, Inc., Class A | | | 7,075 | | | | 943,097 | |
Microsoft Corp. | | | 13,720 | | | | 1,025,844 | |
Momo, Inc. * | | | 12,840 | | | | 494,725 | |
Tencent Holdings Ltd. ADR | | | 21,100 | | | | 893,163 | |
| | | | | | | | |
| | | | | | | 8,484,489 | |
| | | | | | | | |
Materials – 2.19% | |
Eagle Materials, Inc. | | | 5,355 | | | | 520,774 | |
| | | | | | | | |
TOTAL COMMON STOCKS (Cost $16,385,933) | | | | | | | 20,493,287 | |
| | | | | | | | |
EXCHANGE-TRADED FUNDS – 7.33% | |
Consumer Staples Select Sector SPDR Fund | | | 14,660 | | | | 802,049 | |
iShares Nasdaq Biotechnology ETF | | | 1,826 | | | | 608,697 | |
SPDR S&P Bank ETF | | | 8,015 | | | | 334,386 | |
| | | | | | | | |
TOTAL EXCHANGE-TRADED FUNDS (Cost $1,614,328) | | | | | | | 1,745,132 | |
| | | | | | | | |
MONEY MARKET SECURITIES – 8.74% | |
Morgan Stanley Institutional Liquidity Funds Treasury Securities Portfolio, Institutional Class, 0.85% (a) | | | 2,082,567 | | | | 2,082,567 | |
| | | | | | | | |
TOTAL MONEY MARKET SECURITIES (Cost $2,082,567) | | | | | | | 2,082,567 | |
| | | | | | | | |
TOTAL INVESTMENTS – 102.13% (Cost $20,082,828) | | | | | | | 24,320,986 | |
| | | | | | | | |
Liabilities in Excess of Other Assets – (2.13)% | | | | | | | (507,017 | ) |
| | | | | | | | |
NET ASSETS – 100.00% | | | | | | $ | 23,813,969 | |
| | | | | | | | |
| | (a) | Rate disclosed is the seven day effective yield as of August 31, 2017. |
| | * | Non-income producing security. |
ADR – American Depositary Receipt
ETF – Exchange-Traded Fund
SPDR – Standard & Poor’s Depository Receipts
The sectors shown on the schedule of investments are based on Global Industry Classification Standard, or GICS® (“GICS”). The GICS was developed by and/or is the exclusive property of MSCI, Inc. and Standard & Poor’s Financial Services LLC (“S&P”). GICS is a service mark of MSCI, Inc. and S&P and has been licensed for use by Ultimus Asset Services, LLC.
See accompanying notes which are an integral part of these financial statements.
14
MERITAGE VALUE EQUITY FUND
SCHEDULE OF INVESTMENTS
August 31, 2017
| | | | | | | | |
| COMMON STOCKS – 94.45% | | Shares | | | Fair Value | |
Consumer Discretionary – 6.95% | | | | | | | | |
Adtalem Global Education, Inc. * | | | 8,305 | | | $ | 284,031 | |
Big Lots, Inc. | | | 5,900 | | | | 280,840 | |
Helen of Troy Ltd. * | | | 3,330 | | | | 300,699 | |
Ross Stores, Inc. | | | 4,230 | | | | 247,244 | |
| | | | | | | | |
| | | | | | | 1,112,814 | |
| | | | | | | | |
Consumer Staples – 1.32% | |
Ingredion, Inc. | | | 1,710 | | | | 211,732 | |
| | | | | | | | |
Energy – 6.68% | |
Chevron Corp. | | | 3,150 | | | | 339,003 | |
China Petroleum & Chemical Corp. ADR | | | 4,730 | | | | 362,507 | |
Royal Dutch Shell PLC ADR | | | 6,665 | | | | 367,775 | |
| | | | | | | | |
| | | | | | | 1,069,285 | |
| | | | | | | | |
Financials – 25.73% | |
Aspen Insurance Holdings Ltd. | | | 5,920 | | | | 267,584 | |
Berkshire Hathaway, Inc., Class B * | | | 2,369 | | | | 429,168 | |
Citigroup, Inc. | | | 5,180 | | | | 352,395 | |
Fidelity & Guaranty Life | | | 6,170 | | | | 192,813 | |
Horace Mann Educators Corp. | | | 7,290 | | | | 256,243 | |
Northern Trust Corp. | | | 3,580 | | | | 316,830 | |
Prudential Financial, Inc. | | | 3,575 | | | | 364,936 | |
Reinsurance Group of America, Inc. | | | 3,360 | | | | 451,752 | |
State Street Corp. | | | 4,905 | | | | 453,663 | |
Torchmark Corp. | | | 4,772 | | | | 367,301 | |
Unum Group | | | 6,105 | | | | 294,139 | |
Voya Financial, Inc. | | | 9,810 | | | | 375,036 | |
| | | | | | | | |
| | | | | | | 4,121,860 | |
| | | | | | | | |
Health Care – 17.17% | |
Aetna, Inc. | | | 2,570 | | | | 405,289 | |
Biogen, Inc. * | | | 1,560 | | | | 493,834 | |
Celgene Corp. * | | | 2,935 | | | | 407,760 | |
Cigna Corp. | | | 1,920 | | | | 349,555 | |
ICON PLC * | | | 3,465 | | | | 392,896 | |
PRA Health Sciences, Inc. * | | | 3,810 | | | | 294,894 | |
UnitedHealth Group, Inc. | | | 2,040 | | | | 405,756 | |
| | | | | | | | |
| | | | | | | 2,749,984 | |
| | | | | | | | |
Industrials – 9.99% | |
Herman Miller, Inc. | | | 4,940 | | | | 166,231 | |
Raytheon Co. | | | 2,030 | | | | 369,480 | |
Regal-Beloit Corp. | | | 4,020 | | | | 303,108 | |
See accompanying notes which are an integral part of these financial statements.
15
MERITAGE VALUE EQUITY FUND
SCHEDULE OF INVESTMENTS – (continued)
August 31, 2017
| | | | | | | | |
| COMMON STOCKS – 94.45% – continued | | Shares | | | Fair Value | |
Industrials – 9.99% – continued | |
Southwest Airlines Co. | | | 6,270 | | | $ | 326,918 | |
Spirit AeroSystems Holdings, Inc. | | | 5,835 | | | | 434,707 | |
| | | | | | | | |
| | | | | | | 1,600,444 | |
| | | | | | | | |
Information Technology – 16.73% | | | | | | | | |
Benchmark Electronics, Inc. * | | | 9,435 | | | | 306,637 | |
Check Point Software Technologies Ltd. * | | | 1,715 | | | | 191,857 | |
MAXIMUS, Inc. | | | 5,060 | | | | 307,547 | |
Sanmina Corp. * | | | 8,030 | | | | 300,723 | |
Skyworks Solutions, Inc. | | | 3,170 | | | | 333,991 | |
Synopsys, Inc. * | | | 3,535 | | | | 284,285 | |
Teradyne, Inc. | | | 6,880 | | | | 244,997 | |
Vishay Intertechnology, Inc. | | | 18,740 | | | | 331,698 | |
WNS Holdings Ltd. ADR * | | | 10,815 | | | | 378,525 | |
| | | | | | | | |
| | | | | | | 2,680,260 | |
| | | | | | | | |
Materials – 2.01% | | | | | | | | |
Cemex SAB de CV ADR * | | | 17,277 | | | | 160,849 | |
Louisiana-Pacific Corp. * | | | 6,320 | | | | 161,034 | |
| | | | | | | | |
| | | | | | | 321,883 | |
| | | | | | | | |
Real Estate – 3.08% | | | | | | | | |
Host Hotels & Resorts, Inc. | | | 8,890 | | | | 161,087 | |
Welltower, Inc. | | | 4,535 | | | | 332,053 | |
| | | | | | | | |
| | | | | | | 493,140 | |
| | | | | | | | |
Utilities – 4.79% | | | | | | | | |
Ameren Corp. | | | 6,520 | | | | 391,135 | |
Entergy Corp. | | | 4,745 | | | | 375,662 | |
| | | | | | | | |
| | | | | | | 766,797 | |
| | | | | | | | |
TOTAL COMMON STOCKS (Cost $12,191,384) | | | | | | | 15,128,199 | |
| | | | | | | | |
EXCHANGE-TRADED FUNDS – 3.63% | |
Energy Select Sector SPDR Fund | | | 4,845 | | | | 305,090 | |
Vanguard REIT ETF | | | 3,285 | | | | 276,071 | |
| | | | | | | | |
TOTAL EXCHANGE-TRADED FUNDS (Cost $612,627) | | | | | | | 581,161 | |
| | | | | | | | |
MONEY MARKET SECURITIES – 4.41% | | | | | | | | |
Morgan Stanley Institutional Liquidity Funds Treasury Securities Portfolio, Institutional Class, 0.85% (a) | | | 707,199 | | | | 707,199 | |
| | | | | | | | |
TOTAL MONEY MARKET SECURITIES (Cost $707,199) | | | | | | | 707,199 | |
| | | | | | | | |
TOTAL INVESTMENTS – 102.49% (Cost $13,511,210) | | | | | | | 16,416,559 | |
| | | | | | | | |
Liabilities in Excess of Other Assets – (2.49)% | | | | | | | (399,621 | ) |
| | | | | | | | |
NET ASSETS – 100.00% | | | | | | $ | 16,016,938 | |
| | | | | | | | |
See accompanying notes which are an integral part of these financial statements.
16
MERITAGE VALUE EQUITY FUND
SCHEDULE OF INVESTMENTS – (continued)
August 31, 2017
| | (a) | Rate disclosed is the seven day effective yield as of August 31, 2017. |
| | * | Non-income producing security. |
ADR – American Depositary Receipt
ETF – Exchange-Traded Fund
REIT – Real Estate Investment Trust
SPDR – Standard & Poor’s Depository Receipts
The sectors shown on the schedule of investments are based on Global Industry Classification Standard, or GICS® (“GICS”). The GICS was developed by and/or is the exclusive property of MSCI, Inc. and Standard & Poor’s Financial Services LLC (“S&P”). GICS is a service mark of MSCI, Inc. and S&P and has been licensed for use by Ultimus Asset Services, LLC.
See accompanying notes which are an integral part of these financial statements.
17
MERITAGE YIELD-FOCUS EQUITY FUND
SCHEDULE OF INVESTMENTS
August 31, 2017
| | | | | | | | |
| COMMON STOCKS – 90.51% | | Shares | | | Fair Value | |
Consumer Discretionary – 7.27% | | | | | | | | |
GameStop Corp., Class A | | | 18,310 | | | $ | 338,735 | |
Garmin Ltd. | | | 11,765 | | | | 605,897 | |
Staples, Inc. | | | 44,130 | | | | 450,788 | |
Target Corp. | | | 10,085 | | | | 549,935 | |
| | | | | | | | |
| | | | | | | 1,945,355 | |
| | | | | | | | |
Consumer Staples – 8.91% | | | | | | | | |
Altria Group, Inc. | | | 9,765 | | | | 619,101 | |
British American Tobacco PLC | | | 4,795 | | | | 297,865 | |
Imperial Brands PLC ADR | | | 8,875 | | | | 371,419 | |
Philip Morris International, Inc. | | | 5,795 | | | | 677,609 | |
Unilever PLC ADR | | | 7,155 | | | | 416,493 | |
| | | | | | | | |
| | | | | | | 2,382,487 | |
| | | | | | | | |
Energy – 12.39% | | | | | | | | |
Alliance Holdings GP LP (a) | | | 10,870 | | | | 299,468 | |
Enterprise Products Partners LP (a) | | | 18,705 | | | | 487,639 | |
Phillips 66 Partners LP (a) | | | 8,805 | | | | 420,703 | |
Plains GP Holdings LP, Class A (a) | | | 21,845 | | | | 491,076 | |
Repsol SA ADR | | | 29,140 | | | | 501,208 | |
Shell Midstream Partners LP (a) | | | 10,092 | | | | 279,246 | |
Total SA ADR | | | 9,690 | | | | 504,268 | |
Valero Energy Corp. | | | 4,840 | | | | 329,604 | |
| | | | | | | | |
| | | | | | | 3,313,212 | |
| | | | | | | | |
Financials – 20.34% | | | | | | | | |
AllianceBernstein Holding LP (a) | | | 20,560 | | | | 482,132 | |
Ares Capital Corp. (b) | | | 26,140 | | | | 419,808 | |
AXA SA ADR | | | 14,700 | | | | 425,124 | |
Banco Latinoamericano de Comercio Exterior SA, Class E | | | 13,880 | | | | 374,205 | |
Bank of Montreal | | | 5,615 | | | | 403,101 | |
Federated Investors, Inc., Class B | | | 19,275 | | | | 526,400 | |
Invesco Ltd. | | | 18,060 | | | | 592,007 | |
Lazard Ltd., Class A (a) | | | 9,405 | | | | 403,380 | |
National Australia Bank Ltd. ADR | | | 21,120 | | | | 254,602 | |
Old Republic International Corp. | | | 25,210 | | | | 481,259 | |
Power Financial Corp. | | | 15,120 | | | | 407,786 | |
Solar Capital Ltd. (b) | | | 19,060 | | | | 407,312 | |
Valley National Bancorp | | | 23,650 | | | | 264,644 | |
| | | | | | | | |
| | | | | | | 5,441,760 | |
| | | | | | | | |
Health Care – 3.76% | | | | | | | | |
Merck & Co., Inc. | | | 8,330 | | | | 531,954 | |
Pfizer, Inc. | | | 13,945 | | | | 473,014 | |
| | | | | | | | |
| | | | | | | 1,004,968 | |
| | | | | | | | |
See accompanying notes which are an integral part of these financial statements.
18
MERITAGE YIELD-FOCUS EQUITY FUND
SCHEDULE OF INVESTMENTS – (continued)
August 31, 2017
| | | | | | | | |
| COMMON STOCKS – 90.51% – continued | | Shares | | | Fair Value | |
Industrials – 6.16% | | | | | | | | |
Boeing Co./The | | | 2,930 | | | $ | 702,204 | |
Eaton Corp. PLC | | | 6,260 | | | | 449,218 | |
Lockheed Martin Corp. | | | 1,625 | | | | 496,259 | |
| | | | | | | | |
| | | | | | | 1,647,681 | |
| | | | | | | | |
Information Technology – 5.44% | | | | | | | | |
HP, Inc. | | | 24,890 | | | | 474,901 | |
International Business Machines Corp. | | | 3,073 | | | | 439,531 | |
QUALCOMM, Inc. | | | 5,540 | | | | 289,576 | |
Western Union Co./The | | | 13,210 | | | | 249,933 | |
| | | | | | | | |
| | | | | | | 1,453,941 | |
| | | | | | | | |
Materials – 7.83% | | | | | | | | |
Domtar Corp. | | | 13,480 | | | | 545,131 | |
Innophos Holdings, Inc. | | | 6,025 | | | | 275,102 | |
Lyondellbasell Industries NV, Class A | | | 4,165 | | | | 377,307 | |
Norbord, Inc. | | | 8,140 | | | | 280,260 | |
Rio Tinto PLC ADR | | | 12,590 | | | | 617,917 | |
| | | | | | | | |
| | | | | | | 2,095,717 | |
| | | | | | | | |
Real Estate – 7.65% | | | | | | | | |
Brandywine Realty Trust | | | 23,960 | | | | 411,633 | |
CBL & Associates Properties, Inc. | | | 24,260 | | | | 194,080 | |
Medical Properties Trust, Inc. | | | 49,420 | | | | 650,367 | |
Uniti Group, Inc. | | | 13,750 | | | | 264,825 | |
VEREIT, Inc. | | | 62,090 | | | | 524,040 | |
| | | | | | | | |
| | | | | | | 2,044,945 | |
| | | | | | | | |
Telecommunication Services – 4.12% | | | | | | | | |
AT&T, Inc. | | | 12,265 | | | | 459,447 | |
CenturyLink, Inc. | | | 10,310 | | | | 203,313 | |
Verizon Communications, Inc. | | | 9,157 | | | | 439,261 | |
| | | | | | | | |
| | | | | | | 1,102,021 | |
| | | | | | | | |
Utilities – 6.64% | | | | | | | | |
Entergy Corp. | | | 7,115 | | | | 563,295 | |
Exelon Corp. | | | 15,425 | | | | 584,145 | |
Public Service Enterprise Group, Inc. | | | 13,445 | | | | 629,764 | |
| | | | | | | | |
| | | | | | | 1,777,204 | |
| | | | | | | | |
TOTAL COMMON STOCKS (Cost $21,279,716) | | | | | | | 24,209,291 | |
| | | | | | | | |
See accompanying notes which are an integral part of these financial statements.
19
MERITAGE YIELD-FOCUS EQUITY FUND
SCHEDULE OF INVESTMENTS – (continued)
August 31, 2017
| | | | | | | | |
| CONVERTIBLE PREFERRED STOCKS – 5.61% | | Shares | | | Fair Value | |
Health Care – 2.11% | | | | | | | | |
Anthem, Inc., 5.25% | | | 10,730 | | | $ | 563,110 | |
| | | | | | | | |
Industrials – 1.41% | | | | | | | | |
Stericycle, Inc., 5.25% | | | 6,365 | | | | 378,336 | |
| | | | | | | | |
Information Technology – 2.09% | | | | | | | | |
Belden, Inc., 6.75% | | | 5,295 | | | | 560,158 | |
| | | | | | | | |
TOTAL CONVERTIBLE PREFERRED STOCKS (Cost $1,387,821) | | | | | | | 1,501,604 | |
| | | | | | | | |
EXCHANGE-TRADED FUNDS – 2.06% | | | | | | | | |
SPDR S&P International Dividend ETF | | | 13,515 | | | | 550,736 | |
| | | | | | | | |
TOTAL EXCHANGE-TRADED FUNDS (Cost $525,056) | | | | | | | 550,736 | |
| | | | | | | | |
MONEY MARKET SECURITIES – 1.77% | | | | | | | | |
Morgan Stanley Institutional Liquidity Funds Treasury Securities Portfolio, Institutional Class, 0.85% (c) | | | 472,651 | | | | 472,651 | |
| | | | | | | | |
TOTAL MONEY MARKET SECURITIES (Cost $472,651) | | | | | | | 472,651 | |
| | | | | | | | |
TOTAL INVESTMENTS – 99.95% (Cost $23,665,244) | | | | | | | 26,734,282 | |
| | | | | | | | |
Other Assets in Excess of Liabilities – 0.05% | | | | | | | 13,347 | |
| | | | | | | | |
NET ASSETS – 100.00% | | | | | | $ | 26,747,629 | |
| | | | | | | | |
| | (a) | Master Limited Partnership |
| | (b) | Business Development Company |
| | (c) | Rate disclosed is the seven day effective yield as of August 31, 2017. |
| | ADR | – American Depositary Receipt |
| | ETF | – Exchange-Traded Fund |
| | SPDR – Standard | & Poor’s Depository Receipt |
The sectors shown on the schedule of investments are based on Global Industry Classification Standard, or GICS® (“GICS”). The GICS was developed by and/or is the exclusive property of MSCI, Inc. and Standard & Poor’s Financial Services LLC (“S&P”). GICS is a service mark of MSCI, Inc. and S&P and has been licensed for use by Ultimus Asset Services, LLC.
See accompanying notes which are an integral part of these financial statements.
20
MERITAGE FUNDS
STATEMENTS OF ASSETS AND LIABILITIES
August 31, 2017
| | | | | | | | | | | | |
| | | Meritage Growth
Equity Fund | | | Meritage Value
Equity Fund | | | Meritage Yield-
Focus Equity Fund | |
Assets | | | | | | | | | | | | |
Investments in securities at value
(cost $20,082,828, $13,511,210 and $23,665,244) | | $ | 24,320,986 | | | $ | 16,416,559 | | | $ | 26,734,282 | |
Receivable for investments sold | | | 146,991 | | | | – | | | | 475,551 | |
Dividends receivable | | | 29,853 | | | | 18,999 | | | | 95,317 | |
Tax reclaims receivable | | | 952 | | | | – | | | | 12,889 | |
Receivable from Adviser | | | – | | | | 327 | | | | – | |
Prepaid expenses | | | 5,629 | | | | 5,134 | | | | 11,956 | |
| | | | | | | | | | | | |
Total Assets | | | 24,504,411 | | | | 16,441,019 | | | | 27,329,995 | |
| | | | | | | | | | | | |
| | | |
Liabilities | | | | | | | | | | | | |
Payable for fund shares redeemed | | | – | | | | – | | | | 7,000 | |
Payable for investments purchased | | | 653,672 | | | | 391,723 | | | | 531,844 | |
Payable to Adviser | | | 3,201 | | | | – | | | | 6,417 | |
Accrued 12b-1 fees – Investor class | | | 111 | | | | – | | | | 268 | |
Payable to Administrator | | | 6,772 | | | | 4,977 | | | | 8,395 | |
Payable to auditor | | | 20,500 | | | | 20,500 | | | | 20,500 | |
Other accrued expenses | | | 6,186 | | | | 6,881 | | | | 7,942 | |
| | | | | | | | | | | | |
Total Liabilities | | | 690,442 | | | | 424,081 | | | | 582,366 | |
| | | | | | | | | | | | |
| | | |
Net Assets | | $ | 23,813,969 | | | $ | 16,016,938 | | | $ | 26,747,629 | |
| | | | | | | | | | | | |
Net Assets consist of: | | | | | | | | | | | | |
Paid-in capital | | $ | 17,969,024 | | | $ | 13,514,756 | | | $ | 28,507,954 | |
Accumulated undistributed net investment income | | | 10,347 | | | | 90,491 | | | | 82,891 | |
Accumulated undistributed net realized gain (loss) from investment transactions and foreign currency translations | | | 1,596,440 | | | | (493,658 | ) | | | (4,912,254 | ) |
Net unrealized appreciation (depreciation) on investments | | | 4,238,158 | | | | 2,905,349 | | | | 3,069,038 | |
| | | | | | | | | | | | |
| | | |
Net Assets | | $ | 23,813,969 | | | $ | 16,016,938 | | | $ | 26,747,629 | |
| | | | | | | | | | | | |
| | | |
Net Assets: Institutional Class | | $ | 23,537,485 | | | $ | 16,016,938 | | | $ | 26,103,017 | |
| | | | | | | | | | | | |
Shares outstanding
(unlimited number of shares authorized, no par value) | | | 1,635,444 | | | | 1,286,807 | | | | 2,508,176 | |
| | | | | | | | | | | | |
Net asset value, offering and redemption price per share | | $ | 14.39 | | | $ | 12.45 | | | $ | 10.41 | |
| | | | | | | | | | | | |
| | | |
Net Assets: Investor Class | | $ | 276,484 | | | | | | | $ | 644,612 | |
| | | | | | | | | | | | |
Shares outstanding
(unlimited number of shares authorized, no par value) | | | 19,341 | | | | | | | | 61,360 | |
| | | | | | | | | | | | |
Net asset value, offering and redemption price per share | | $ | 14.30 | | | | | | | $ | 10.51 | |
| | | | | | | | | | | | |
See accompanying notes which are an integral part of these financial statements.
21
MERITAGE FUNDS
STATEMENTS OF OPERATIONS
For the year ended August 31, 2017
| | | | | | | | | | | | |
| | | Meritage Growth
Equity Fund | | | Meritage Value
Equity Fund | | | Meritage Yield-
Focus Equity Fund | |
Investment Income | | | | | | | | | | | | |
Dividend income
(net of foreign taxes withheld of $419, $6,188 and $15,342) | | $ | 225,156 | | | $ | 236,244 | | | $ | 1,449,736 | |
| | | | | | | | | | | | |
Total investment income | | | 225,156 | | | | 236,244 | | | | 1,449,736 | |
| | | | | | | | | | | | |
| | | |
Expenses | | | | | | | | | | | | |
Investment Adviser | | | 150,353 | | | | 108,026 | | | | 242,188 | |
Administration | | | 33,679 | | | | 24,175 | | | | 54,346 | |
Fund accounting | | | 22,454 | | | | 16,115 | | | | 36,431 | |
Audit | | | 22,785 | | | | 22,785 | | | | 22,785 | |
Registration | | | 15,447 | | | | 12,542 | | | | 34,049 | |
Transfer agent | | | 18,061 | | | | 12,968 | | | | 29,195 | |
Legal | | | 11,954 | | | | 11,357 | | | | 14,602 | |
Custodian | | | 5,188 | | | | 6,078 | | | | 6,709 | |
Insurance | | | 5,434 | | | | 5,188 | | | | 6,315 | |
Report printing | | | 5,873 | | | | 3,857 | | | | 6,881 | |
Trustee | | | 4,768 | | | | 4,755 | | | | 4,818 | |
12b-1 – Investor class | | | 447 | | | | 11 | (a) | | | 13,274 | |
Pricing | | | 2,104 | | | | 2,198 | | | | 2,474 | |
Other | | | 13,256 | | | | 12,949 | | | | 15,417 | |
| | | | | | | | | | | | |
Total expenses | | | 311,803 | | | | 243,004 | | | | 489,484 | |
Fees waived by Adviser | | | (110,633 | ) | | | (98,784 | ) | | | (152,868 | ) |
| | | | | | | | | | | | |
Net operating expenses | | | 201,170 | | | | 144,220 | | | | 336,616 | |
| | | | | | | | | | | | |
Net investment income | | | 23,986 | | | | 92,024 | | | | 1,113,120 | |
| | | | | | | | | | | | |
| |
Net Realized and Unrealized Gain (Loss) on Investments | | | | | |
Net realized gain on investment securities transactions | | | 1,852,658 | | | | 140,802 | | | | 1,746,269 | |
Net realized loss on foreign currency translations | | | – | | | | – | | | | (140 | ) |
Net change in unrealized appreciation (depreciation) of investment securities | | | 1,792,047 | | | | 1,534,876 | | | | (239,221 | ) |
| | | | | | | | | | | | |
Net realized and unrealized gain on investments | | | 3,644,705 | | | | 1,675,678 | | | | 1,506,908 | |
| | | | | | | | | | | | |
Net increase in net assets resulting from operations | | $ | 3,668,691 | | | $ | 1,767,702 | | | $ | 2,620,028 | |
| | | | | | | | | | | | |
| (a) | Meritage Value Equity Fund – Investor Class liquidated on February 3, 2017. |
See accompanying notes which are an integral part of these financial statements.
22
MERITAGE GROWTH EQUITY FUND
STATEMENTS OF CHANGES IN NET ASSETS
| | | | | | | | |
| | | For the Year
Ended
August 31, 2017 | | | For the Year
Ended
August 31, 2016 | |
Increase (Decrease) in Net Assets due to: | | | | | | | | |
Operations | | | | | | | | |
Net investment income | | $ | 23,986 | | | $ | 37,576 | |
Net realized gain (loss) on investment securities transactions | | | 1,852,658 | | | | (76,545 | ) |
Net change in unrealized appreciation (depreciation) of investment securities | | | 1,792,047 | | | | 1,687,088 | |
| | | | | | | | |
Net increase in net assets resulting from operations | | | 3,668,691 | | | | 1,648,119 | |
| | | | | | | | |
| | |
Distributions | | | | | | | | |
From net investment income – Institutional Class | | | (44,491 | ) | | | (8,254 | ) |
From net realized gains – Institutional Class | | | (171,541 | ) | | | (306,530 | ) |
From net realized gains – Investor Class | | | (1,047 | ) | | | (3,439 | ) |
| | | | | | | | |
Total distributions | | | (217,079 | ) | | | (318,223 | ) |
| | | | | | | | |
| | |
Capital Transactions – Institutional Class | | | | | | | | |
Proceeds from shares sold | | | 4,352,696 | | | | 3,937,403 | |
Reinvestment of distributions | | | 208,934 | | | | 306,740 | |
Amount paid for shares redeemed | | | (1,928,779 | ) | | | (1,405,523 | ) |
| | | | | | | | |
Total Institutional Class | | | 2,632,851 | | | | 2,838,620 | |
| | | | | | | | |
| | |
Capital Transactions – Investor Class | | | | | | | | |
Proceeds from shares sold | | | 211,276 | | | | 209,178 | |
Reinvestment of distributions | | | 1,047 | | | | 2,111 | |
Amount paid for shares redeemed | | | (328,967 | ) | | | (29,277 | ) |
| | | | | | | | |
Total Investor Class | | | (116,644 | ) | | | 182,012 | |
| | | | | | | | |
Net increase in net assets resulting from capital transactions | | | 2,516,207 | | | | 3,020,632 | |
| | | | | | | | |
Total Increase in Net Assets | | | 5,967,819 | | | | 4,350,528 | |
| | | | | | | | |
| | |
Net Assets | | | | | | | | |
Beginning of year | | | 17,846,150 | | | | 13,495,622 | |
| | | | | | | | |
End of year | | $ | 23,813,969 | | | $ | 17,846,150 | |
| | | | | | | | |
Accumulated undistributed net investment income included in net assets at end of year | | $ | 10,347 | | | $ | 38,921 | |
| | | | | | | | |
| | |
Share Transactions – Institutional Class | | | | | | | | |
Shares sold | | | 327,228 | | | | 347,376 | |
Shares issued in reinvestment of distributions | | | 16,822 | | | | 27,169 | |
Shares redeemed | | | (152,144 | ) | | | (121,465 | ) |
| | | | | | | | |
Total Institutional Class | | | 191,906 | | | | 253,080 | |
| | | | | | | | |
| | |
Share Transactions – Investor Class | | | | | | | | |
Shares sold | | | 15,392 | | | | 18,178 | |
Shares issued in reinvestment of distributions | | | 85 | | | | 188 | |
Shares redeemed | | | (26,638 | ) | | | (2,612 | ) |
| | | | | | | | |
Total Investor Class | | | (11,161 | ) | | | 15,754 | |
| | | | | | | | |
Net increase in shares outstanding | | | 180,745 | | | | 268,834 | |
| | | | | | | | |
See accompanying notes which are an integral part of these financial statements.
23
MERITAGE VALUE EQUITY FUND
STATEMENTS OF CHANGES IN NET ASSETS
| | | | | | | | |
| | | For the Year
Ended
August 31, 2017 | | | For the Year
Ended
August 31, 2016 | |
Increase (Decrease) in Net Assets due to: | | | | | | | | |
Operations | | | | | | | | |
Net investment income | | $ | 92,024 | | | $ | 117,793 | |
Net realized gain (loss) on investment securities transactions | | | 140,802 | | | | (615,738 | ) |
Net change in unrealized appreciation (depreciation) of investment securities | | | 1,534,876 | | | | 784,958 | |
| | | | | | | | |
Net increase in net assets resulting from operations | | | 1,767,702 | | | | 287,013 | |
| | | | | | | | |
Distributions | | | | | | | | |
From net investment income – Institutional Class | | | (115,272 | ) | | | (105,233 | ) |
From net investment income – Investor Class | | | (67 | )(a) | | | (66 | ) |
From net realized gains – Institutional Class | | | – | | | | (50,500 | ) |
From net realized gains – Investor Class | | | – | | | | (39 | ) |
| | | | | | | | |
Total distributions | | | (115,339 | ) | | | (155,838 | ) |
| | | | | | | | |
| | |
Capital Transactions – Institutional Class | | | | | | | | |
Proceeds from shares sold | | | 2,914,903 | | | | 3,408,257 | |
Reinvestment of distributions | | | 113,051 | | | | 153,110 | |
Amount paid for shares redeemed | | | (2,517,719 | ) | | | (1,159,673 | ) |
| | | | | | | | |
Total Institutional Class | | | 510,235 | | | | 2,401,694 | |
| | | | | | | | |
| | |
Capital Transactions – Investor Class(a) | | | | | | | | |
Proceeds from shares sold | | | 922 | | | | – | |
Reinvestment of distributions | | | 67 | | | | 105 | |
Amount paid for shares redeemed | | | (11,012 | ) | | | – | |
| | | | | | | | |
Total Investor Class | | | (10,023 | ) | | | 105 | |
| | | | | | | | |
Net increase in net assets resulting from capital transactions | | | 500,212 | | | | 2,401,799 | |
| | | | | | | | |
Total Increase in Net Assets | | | 2,152,575 | | | | 2,532,974 | |
| | | | | | | | |
| | |
Net Assets | | | | | | | | |
Beginning of year | | | 13,864,363 | | | | 11,331,389 | |
| | | | | | | | |
End of year | | $ | 16,016,938 | | | $ | 13,864,363 | |
| | | | | | | | |
Accumulated undistributed net investment income included in net assets at end of year | | $ | 90,491 | | | $ | 115,339 | |
| | | | | | | | |
| | |
Share Transactions – Institutional Class | | | | | | | | |
Shares sold | | | 247,653 | | | | 313,214 | |
Shares issued in reinvestment of distributions | | | 9,729 | | | | 14,164 | |
Shares redeemed | | | (222,567 | ) | | | (104,992 | ) |
| | | | | | | | |
Total Institutional Class | | | 34,815 | | | | 222,386 | |
| | | | | | | | |
| | |
Share Transactions – Investor Class(a) | | | | | | | | |
Shares sold | | | – | | | | | |
Shares issued in reinvestment of distributions | | | 6 | | | | 10 | |
Shares redeemed | | | (946 | ) | | | – | |
| | | | | | | | |
Total Investor Class | | | (940 | ) | | | 10 | |
| | | | | | | | |
Net increase in shares outstanding | | | 33,875 | | | | 222,396 | |
| | | | | | | | |
| (a) | Meritage Value Equity Fund – Investor Class liquidated on February 3, 2017. |
See accompanying notes which are an integral part of these financial statements.
24
MERITAGE YIELD-FOCUS EQUITY FUND
STATEMENTS OF CHANGES IN NET ASSETS
| | | | | | | | |
| | | For the Year
Ended
August 31, 2017 | | | For the Year
Ended
August 31, 2016 | |
Increase (Decrease) in Net Assets due to: | | | | | | | | |
Operations | | | | | | | | |
Net investment income | | $ | 1,113,120 | | | $ | 1,268,575 | |
Net realized gain (loss) on investment securities transactions | | | 1,746,129 | | | | (4,040,548 | ) |
Net change in unrealized appreciation (depreciation) of investment securities and foreign currency translations | | | (239,221 | ) | | | 6,318,403 | |
| | | | | | | | |
Net increase in net assets resulting from operations | | | 2,620,028 | | | | 3,546,430 | |
| | | | | | | | |
Distributions | | | | | | | | |
From net investment income – Institutional Class | | | (925,897 | ) | | | (982,202 | ) |
From net investment income – Investor Class | | | (141,974 | ) | | | (267,892 | ) |
| | | | | | | | |
Total distributions | | | (1,067,871 | ) | | | (1,250,094 | ) |
| | | | | | | | |
| | |
Capital Transactions – Institutional Class | | | | | | | | |
Proceeds from shares sold | | | 2,700,387 | | | | 11,584,316 | |
Reinvestment of distributions | | | 877,453 | | | | 949,085 | |
Amount paid for shares redeemed | | | (7,887,178 | ) | | | (13,279,431 | ) |
| | | | | | | | |
Total Institutional Class | | | (4,309,338 | ) | | | (746,030 | ) |
| | | | | | | | |
Capital Transactions – Investor Class | | | | | | | | |
Proceeds from shares sold | | | 565,477 | | | | 5,341,482 | |
Reinvestment of distributions | | | 136,022 | | | | 255,968 | |
Amount paid for shares redeemed | | | (11,250,540 | ) | | | (6,117,689 | ) |
| | | | | | | | |
Total Investor Class | | | (10,549,041 | ) | | | (520,239 | ) |
| | | | | | | | |
Net decrease in net assets resulting from capital transactions | | | (14,858,379 | ) | | | (1,266,269 | ) |
| | | | | | | | |
Total Increase (Decrease) in Net Assets | | | (13,306,222 | ) | | | 1,030,067 | |
| | | | | | | | |
| | |
Net Assets | | | | | | | | |
Beginning of year | | | 40,053,851 | | | | 39,023,784 | |
| | | | | | | | |
End of year | | $ | 26,747,629 | | | $ | 40,053,851 | |
| | | | | | | | |
Accumulated undistributed net investment income included in net assets at end of year | | $ | 82,891 | | | $ | 48,558 | |
| | | | | | | | |
| | |
Share Transactions – Institutional Class | | | | | | | | |
Shares sold | | | 264,568 | | | | 1,240,531 | |
Shares issued in reinvestment of distributions | | | 86,151 | | | | 101,101 | |
Shares redeemed | | | (775,089 | ) | | | (1,409,707 | ) |
| | | | | | | | |
Total Institutional Class | | | (424,370 | ) | | | (68,075 | ) |
| | | | | | | | |
| | |
Share Transactions – Investor Class | | | | | | | | |
Shares sold | | | 56,078 | | | | 560,884 | |
Shares issued in reinvestment of distributions | | | 13,555 | | | | 27,331 | |
Shares redeemed | | | (1,081,302 | ) | | | (651,855 | ) |
| | | | | | | | |
Total Investor Class | | | (1,011,669 | ) | | | (63,640 | ) |
| | | | | | | | |
Net decrease in shares outstanding | | | (1,436,039 | ) | | | (131,715 | ) |
| | | | | | | | |
See accompanying notes which are an integral part of these financial statements.
25
MERITAGE GROWTH EQUITY FUND – INSTITUTIONAL CLASS
FINANCIAL HIGHLIGHTS
(For a share outstanding during each period)
| | | | | | | | | | | | | | | | |
| | | For the
Year Ended
August 31, 2017 | | | For the
Year Ended
August 31, 2016 | | | For the
Year Ended
August 31, 2015 | | | For the
Period Ended
August 31, 2014 (a) | |
Selected Per Share Data: | | | | | | | | | | | | | | | | |
Net asset value, beginning of period | | $ | 12.11 | | | $ | 11.20 | | | $ | 10.95 | | | $ | 10.00 | |
| | | | | | | | | | | | | | | | |
Investment operations: | | | | | | | | | | | | | | | | |
Net investment income | | | 0.02 | | | | 0.03 | | | | 0.01 | | | | 0.01 | |
Net realized and unrealized gain on investments | | | 2.41 | | | | 1.12 | | | | 0.36 | | | | 0.94 | |
| | | | | | | | | | | | | | | | |
Total from investment operations | | | 2.43 | | | | 1.15 | | | | 0.37 | | | | 0.95 | |
| | | | | | | | | | | | | | | | |
Less distributions to shareholders: | | | | | | | | | | | | | | | | |
From net investment income | | | (0.03 | ) | | | (0.01 | ) | | | (0.01 | ) | | | – | |
From net realized gains | | | (0.12 | ) | | | (0.23 | ) | | | (0.11 | ) | | | – | |
| | | | | | | | | | | | | | | | |
Total distributions | | | (0.15 | ) | | | (0.24 | ) | | | (0.12 | ) | | | – | |
| | | | | | | | | | | | | | | | |
Net asset value, end of period | | $ | 14.39 | | | $ | 12.11 | | | $ | 11.20 | | | $ | 10.95 | |
| | | | | | | | | | | | | | | | |
| | | | |
Total Return (b) | | | 20.27 | % | | | 10.41 | % | | | 3.38 | % | | | 9.50 | %(c) |
| | | | |
Ratios and Supplemental Data: | | | | | | | | | | | | | | | | |
Net assets, end of period (000 omitted) | | $ | 23,537 | | | $ | 17,479 | | | $ | 13,331 | | | $ | 10,642 | |
Ratio of net expenses to average net assets | | | 1.00 | % | | | 1.00 | % | | | 1.00 | % | | | 1.00 | %(d) |
Ratio of expenses to average net assets before waiver | | | 1.55 | % | | | 1.60 | % | | | 1.66 | % | | | 3.49 | %(d) |
Ratio of net investment income to average net assets | | | 0.12 | % | | | 0.24 | % | | | 0.08 | % | | | 0.22 | %(d) |
Portfolio turnover rate (e) | | | 82 | % | | | 73 | % | | | 84 | % | | | 94 | %(c) |
| (a) | For the period December 23, 2013 (commencement of operations) to August 31, 2014. |
| (b) | Total return in the above table represents the rate that the investor would have earned or lost on an investment in the Fund, assuming reinvestment of dividends. |
| (e) | Portfolio turnover is calculated on the basis on the Fund as a whole without distinguishing among the classes of shares. |
See accompanying notes which are an integral part of these financial statements.
26
MERITAGE GROWTH EQUITY FUND – INVESTOR CLASS
FINANCIAL HIGHLIGHTS
(For a share outstanding during each period)
| | | | | | | | | | | | | | | | |
| | | For the
Year Ended
August 31, 2017 | | | For the
Year Ended
August 31, 2016 | | | For the
Year Ended
August 31, 2015 | | | For the
Period Ended
August 31, 2014 (a) | |
Selected Per Share Data: | | | | | | | | | | | | | | | | |
Net asset value, beginning of period | | $ | 12.03 | | | $ | 11.15 | | | $ | 10.92 | | | $ | 10.00 | |
| | | | | | | | | | | | | | | | |
Investment operations: | | | | | | | | | | | | | | | | |
Net investment income (loss) | | | – | (b) | | | – | (b) | | | (0.02 | ) | | | – | (b) |
Net realized and unrealized gain on investments | | | 2.39 | | | | 1.11 | | | | 0.37 | | | | 0.92 | |
| | | | | | | | | | | | | | | | |
Total from investment operations | | | 2.39 | | | | 1.11 | | | | 0.35 | | | | 0.92 | |
| | | | | | | | | | | | | | | | |
Less distributions to shareholders: | | | | | | | | | | | | | | | | |
From net investment income | | | – | | | | – | | | | (0.01 | ) | | | – | |
From net realized gains | | | (0.12 | ) | | | (0.23 | ) | | | (0.11 | ) | | | – | |
| | | | | | | | | | | | | | | | |
Total distributions | | | (0.12 | ) | | | (0.23 | ) | | | (0.12 | ) | | | – | |
| | | | | | | | | | | | | | | | |
Net asset value, end of period | | $ | 14.30 | | | $ | 12.03 | | | $ | 11.15 | | | $ | 10.92 | |
| | | | | | | | | | | | | | | | |
| | | | |
Total Return (c) | | | 20.02 | % | | | 10.13 | % | | | 3.17 | % | | | 9.20 | %(d) |
| | | | |
Ratios and Supplemental Data: | | | | | | | | | | | | | | | | |
Net assets, end of period (000 omitted) | | $ | 276 | | | $ | 367 | | | $ | 164 | | | $ | 136 | |
Ratio of net expenses to average net assets | | | 1.25 | % | | | 1.25 | % | | | 1.25 | % | | | 1.25 | %(e) |
Ratio of expenses to average net assets before waiver | | | 1.80 | % | | | 1.85 | % | | | 1.91 | % | | | 3.32 | %(e) |
Ratio of net investment income (loss) to average net assets | | | (0.10 | )% | | | (0.01 | )% | | | (0.17 | )% | | | 0.01 | %(e) |
Portfolio turnover rate (f) | | | 82 | % | | | 73 | % | | | 84 | % | | | 94 | %(d) |
| (a) | For the period December 23, 2013 (commencement of operations) to August 31, 2014. |
| (b) | Amount is less than $0.01. |
| (c) | Total return in the above table represents the rate that the investor would have earned or lost on an investment in the Fund, assuming reinvestment of dividends. |
| (f) | Portfolio turnover is calculated on the basis on the Fund as a whole without distinguishing among the classes of shares. |
See accompanying notes which are an integral part of these financial statements.
27
MERITAGE VALUE EQUITY FUND – INSTITUTIONAL CLASS
FINANCIAL HIGHLIGHTS
(For a share outstanding during each period)
| | | | | | | | | | | | | | | | |
| | | For the
Year Ended
August 31, 2017 | | | For the
Year Ended
August 31, 2016 | | | For the
Year Ended
August 31, 2015 | | | For the
Period Ended
August 31, 2014 (a) | |
Selected Per Share Data: | | | | | | | | | | | | | | | | |
Net asset value, beginning of period | | $ | 11.07 | | | $ | 11.00 | | | $ | 11.00 | | | $ | 10.00 | |
| | | | | | | | | | | | | | | | |
Investment operations: | | | | | | | | | | | | | | | | |
Net investment income | | | 0.07 | | | | 0.08 | | | | 0.10 | | | | 0.04 | |
Net realized and unrealized gain on investments | | | 1.41 | | | | 0.12 | | | | 0.01 | (b) | | | 0.96 | |
| | | | | | | | | | | | | | | | |
Total from investment operations | | | 1.48 | | | | 0.20 | | | | 0.11 | | | | 1.00 | |
| | | | | | | | | | | | | | | | |
Less distributions to shareholders: | | | | | | | | | | | | | | | | |
From net investment income | | | (0.10 | ) | | | (0.09 | ) | | | (0.04 | ) | | | – | |
From net realized gains | | | – | | | | (0.04 | ) | | | (0.07 | ) | | | – | |
| | | | | | | | | | | | | | | | |
Total distributions | | | (0.10 | ) | | | (0.13 | ) | | | (0.11 | ) | | | – | |
| | | | | | | | | | | | | | | | |
Net asset value, end of period | | $ | 12.45 | | | $ | 11.07 | | | $ | 11.00 | | | $ | 11.00 | |
| | | | | | | | | | | | | | | | |
| | | | |
Total Return (c) | | | 13.41 | % | | | 1.85 | % | | | 0.94 | % | | | 10.00 | %(d) |
| | | | |
Ratios and Supplemental Data: | | | | | | | | | | | | | | | | |
Net assets, end of period (000 omitted) | | $ | 16,017 | | | $ | 13,854 | | | $ | 11,321 | | | $ | 9,673 | |
Ratio of net expenses to average net assets | | | 1.00 | % | | | 1.00 | % | | | 1.00 | % | | | 1.00 | %(e) |
Ratio of expenses to average net assets before waiver | | | 1.69 | % | | | 1.67 | % | | | 1.66 | % | | | 3.58 | %(e) |
Ratio of net investment income to average net assets | | | 0.60 | % | | | 0.89 | % | | | 0.96 | % | | | 0.86 | %(e) |
Portfolio turnover rate (f) | | | 81 | % | | | 67 | % | | | 62 | % | | | 50 | %(d) |
| (a) | For the period December 23, 2013 (commencement of operations) to August 31, 2014. |
| (b) | The amount shown for a share outstanding throughout the period does not accord with the aggregate gains and losses in the portfolio securities during the period because of the timing of sales and purchases of fund shares in relation to fluctuating market values during the period. |
| (c) | Total return in the above table represents the rate that the investor would have earned or lost on an investment in the Fund, assuming reinvestment of dividends. |
| (f) | Portfolio turnover is calculated on the basis on the Fund as a whole without distinguishing among the classes of shares. |
See accompanying notes which are an integral part of these financial statements.
28
MERITAGE YIELD-FOCUS EQUITY FUND – INSTITUTIONAL CLASS
FINANCIAL HIGHLIGHTS
(For a share outstanding during each period)
| | | | | | | | | | | | | | | | |
| | | For the
Year Ended
August 31, 2017 | | | For the
Year Ended
August 31, 2016 | | | For the
Year Ended
August 31, 2015 | | | For the
Period Ended
August 31, 2014 (a) | |
Selected Per Share Data: | | | | | | | | | | | | | | | | |
Net asset value, beginning of period | | $ | 10.00 | | | $ | 9.44 | | | $ | 11.27 | | | $ | 10.00 | |
| | | | | | | | | | | | | | | | |
Investment operations: | | | | | | | | | | | | | | | | |
Net investment income | | | 0.37 | | | | 0.32 | | | | 0.33 | | | | 0.10 | |
Net realized and unrealized gain (loss) on investments | | | 0.40 | | | | 0.56 | | | | (1.71 | ) | | | 1.17 | |
| | | | | | | | | | | | | | | | |
Total from investment operations | | | 0.77 | | | | 0.88 | | | | (1.38 | ) | | | 1.27 | |
| | | | | | | | | | | | | | | | |
Less distributions to shareholders: | | | | | | | | | | | | | | | | |
From net investment income | | | (0.36 | ) | | | (0.32 | ) | | | (0.41 | ) | | | – | |
From net realized gains | | | – | | | | – | | | | (0.03 | ) | | | – | |
From return of capital | | | – | | | | – | | | | (0.01 | ) | | | – | |
| | | | | | | | | | | | | | | | |
Total distributions | | | (0.36 | ) | | | (0.32 | ) | | | (0.45 | ) | | | – | |
| | | | | | | | | | | | | | | | |
Net asset value, end of period | | $ | 10.41 | | | $ | 10.00 | | | $ | 9.44 | | | $ | 11.27 | |
| | | | | | | | | | | | | | | | |
| | | | |
Total Return (b) | | | 7.79 | % | | | 9.58 | % | | | (12.56 | )% | | | 12.70 | %(c) |
| | | | |
Ratios and Supplemental Data: | | | | | | | | | | | | | | | | |
Net assets, end of period (000 omitted) | | $ | 26,103 | | | $ | 29,340 | | | $ | 28,316 | | | $ | 26,436 | |
Ratio of net expenses to average net assets | | | 1.00 | % | | | 1.00 | % | | | 1.00 | % | | | 1.00 | %(d) |
Ratio of expenses to average net assets before waiver | | | 1.48 | % | | | 1.49 | % | | | 1.44 | % | | | 2.62 | %(d) |
Ratio of net investment income to average net assets | | | 3.49 | % | | | 3.41 | % | | | 3.17 | % | | | 2.70 | %(d) |
Portfolio turnover rate (e) | | | 60 | % | | | 99 | % | | | 86 | % | | | 63 | %(c) |
| (a) | For the period December 23, 2013 (commencement of operations) to August 31, 2014. |
| (b) | Total return in the above table represents the rate that the investor would have earned or lost on an investment in the Fund, assuming reinvestment of dividends. |
| (e) | Portfolio turnover is calculated on the basis on the Fund as a whole without distinguishing among the classes of shares. |
See accompanying notes which are an integral part of these financial statements.
29
MERITAGE YIELD-FOCUS EQUITY FUND – INVESTOR CLASS
FINANCIAL HIGHLIGHTS
(For a share outstanding during each period)
| | | | | | | | | | | | | | | | |
| | | For the
Year Ended
August 31, 2017 | | | For the
Year Ended
August 31, 2016 | | | For the
Year Ended
August 31, 2015 | | | For the
Period Ended
August 31, 2014 (a) | |
Selected Per Share Data: | | | | | | | | | | | | | | | | |
Net asset value, beginning of period | | $ | 9.98 | | | $ | 9.42 | | | $ | 11.25 | | | $ | 10.00 | |
| | | | | | | | | | | | | | | | |
Investment operations: | | | | | | | | | | | | | | | | |
Net investment income | | | 0.32 | (b) | | | 0.32 | | | | 0.29 | | | | 0.01 | |
Net realized and unrealized gain (loss) on investments | | | 0.46 | | | | 0.54 | | | | (1.70 | ) | | | 1.24 | |
| | | | | | | | | | | | | | | | |
Total from investment operations | | | 0.78 | | | | 0.86 | | | | (1.41 | ) | | | 1.25 | |
| | | | | | | | | | | | | | | | |
Less distributions to shareholders: | | | | | | | | | | | | | | | | |
From net investment income | | | (0.25 | ) | | | (0.30 | ) | | | (0.38 | ) | | | – | |
From net realized gains | | | – | | | | – | | | | (0.03 | ) | | | – | |
From return of capital | | | – | | | | – | | | | (0.01 | ) | | | – | |
| | | | | | | | | | | | | | | | |
Total distributions | | | (0.25 | ) | | | (0.30 | ) | | | (0.42 | ) | | | – | |
| | | | | | | | | | | | | | | | |
Net asset value, end of period | | $ | 10.51 | | | $ | 9.98 | | | $ | 9.42 | | | $ | 11.25 | |
| | | | | | | | | | | | | | | | |
| | | | |
Total Return (c) | | | 7.93 | % | | | 9.35 | % | | | (12.85 | )% | | | 12.50 | %(d) |
| | | | |
Ratios and Supplemental Data: | | | | | | | | | | | | | | | | |
Net assets, end of period (000 omitted) | | $ | 644 | | | $ | 10,714 | | | $ | 10,708 | | | $ | 2,627 | |
Ratio of net expenses to average net assets | | | 1.25 | % | | | 1.25 | % | | | 1.25 | % | | | 1.25 | %(e) |
Ratio of expenses to average net assets before waiver | | | 1.73 | % | | | 1.74 | % | | | 1.69 | % | | | 2.46 | %(e) |
Ratio of net investment income to average net assets | | | 3.18 | % | | | 3.17 | % | | | 2.84 | % | | | 2.26 | %(e) |
Portfolio turnover rate (f) | | | 60 | % | | | 99 | % | | | 86 | % | | | 63 | %(d) |
| (a) | For the period December 23, 2013 (commencement of operations) to August 31, 2014. |
| (b) | Calculated using the average shares method. |
| (c) | Total return in the above table represents the rate that the investor would have earned or lost on an investment in the Fund, assuming reinvestment of dividends. |
| (f) | Portfolio turnover is calculated on the basis on the Fund as a whole without distinguishing among the classes of shares. |
See accompanying notes which are an integral part of these financial statements.
30
MERITAGE FUNDS
NOTES TO THE FINANCIAL STATEMENTS
August 31, 2017
NOTE 1. ORGANIZATION
The Meritage Growth Equity Fund (the “Growth Equity Fund”), the Meritage Value Equity Fund (the “Value Equity Fund”), and the Meritage Yield-Focus Equity Fund (the “Yield-Focus Equity Fund”) (each a “Fund” and, collectively the “Funds”) were organized as a diversified series of the Capitol Series Trust (the “Trust”). The Trust is an open-end investment company established under the laws of Ohio by an Agreement and Declaration of Trust dated September 18, 2013 (the “Trust Agreement”). The Trust Agreement permits the Trust’s Board of Trustees (the “Board”) to issue an unlimited number of shares of beneficial interest of separate series without par value. The Growth Equity and Yield-Focus Equity Funds each offer two share classes, Institutional Class Shares and Investor Class Shares. As disclosed in a prospectus supplement dated February 15, 2017, the Value Equity Fund has discontinued the sale of its Investor Shares, and will continue to offer Institutional Shares. The Funds commenced operations on December 23, 2013. The Funds’ investment adviser is Meritage Portfolio Management, Inc. (the “Adviser”). The investment objective of the Growth Equity Fund is to seek growth of capital. The investment objective of the Value Equity Fund is to seek growth of capital. Income is a secondary objective for the Value Equity Fund. The investment objective of the Yield-Focus Equity Fund is to seek long-term growth of capital with an emphasis on high current income.
Each Fund’s prospectus provides a description of the investment objective, policies and strategies, along with information on the classes of shares currently being offered.
NOTE 2. SIGNIFICANT ACCOUNTING POLICIES
The Funds are investment companies and follow accounting and reporting guidance under Financial Accounting Standards Board Accounting Standards Codification (“ASC”) Topic 946, “Financial Services-Investment Companies”. The following is a summary of significant accounting policies consistently followed by each Fund in the preparation of its financial statements. These policies are in conformity with generally accepted accounting principles in the United States of America (“GAAP”).
Estimates – The preparation of financial statements in conformity with GAAP requires management to make estimates and assumptions that affect the reported amounts of assets and liabilities and disclosure of contingent assets and liabilities at the date of the financial statements and the reported amounts of increases and decreases in net assets from operations during the reporting period. Actual results could differ from those estimates.
Securities Valuation – All investments in securities are recorded at their estimated fair value as described in Note 3.
Foreign Currency Translation – The accounting records of the Funds are maintained in U.S. dollars. Foreign currency amounts are translated into U.S. dollars at the current rate of exchange each business day to determine the value of investments, and other assets and liabilities. Purchases and sales of foreign securities, and income and expenses, are translated at the prevailing rate of exchange on the respective date of these transactions. The Fund does not isolate that portion of the results of operations resulting from changes in foreign exchange rates on investments from fluctuation arising from changes in market prices of securities held. These fluctuations are included with the net realized and unrealized gain or loss from investments.
Federal Income Taxes – The Funds make no provision for federal income or excise tax. Each Fund has qualified and intends to qualify each year as a regulated investment company (“RIC”) under subchapter M of the Internal Revenue Code of 1986, as amended, by complying with the requirements applicable to RICs and by distributing
31
MERITAGE FUNDS
NOTES TO THE FINANCIAL STATEMENTS – (continued)
August 31, 2017
NOTE 2. SIGNIFICANT ACCOUNTING POLICIES – continued
substantially all of its taxable income. Each Fund also intends to distribute sufficient net investment income and net capital gains, if any, so that it will not be subject to excise tax on undistributed income and gains. If the required amount of net investment income or gains is not distributed, the Funds could incur a tax expense.
The Funds may be subject to taxes imposed by countries in which it invests. Such taxes are generally based on income and/or capital gains earned or repatriated. Taxes are accrued and applied to net investment income, net realized gains and unrealized appreciation as such income and/or gains are earned.
The Funds recognize tax benefits or expenses of uncertain tax positions only when the position is “more likely than not” to be sustained assuming examination by tax authorities. Management of the Funds has reviewed tax positions taken in tax years that remain subject to examination by all major tax jurisdictions, including federal (i.e., the previous three tax year ends and the interim tax period since then, as applicable) and has concluded that no provision for unrecognized tax benefits or expenses is required in these financial statements and does not expect this to change over the next twelve months. The Funds recognize interest and penalties, if any, related to unrecognized tax benefits as income tax expense in the Statement of Operations. During the year, the Funds did not incur any interest or penalties.
Expenses – Expenses incurred by the Trust that do not relate to a specific fund of the Trust are allocated to the individual funds based on each Fund’s relative net assets or another appropriate basis (as determined by the Board). Expenses attributable to any class are borne by that class. Income, realized gains and losses, unrealized appreciation and depreciation, and expenses are allocated to each class based on the net assets in relation to the relative net assets of the Fund.
Security Transactions and Related Income – Throughout the reporting period, security transactions are accounted for no later than one business day following the trade date. For financial reporting purposes, security transactions are accounted for on trade date on the last business day of the reporting period. The specific identification method is used for determining gains or losses for financial statements and income tax purposes. Dividend income is recorded on the ex-dividend date and interest income is recorded on an accrual basis. Dividend income from real estate investment trusts (REITs) and distributions from limited partnerships are recognized on the ex-date and included in dividend income. The calendar year-end classification of distributions received from REITs during the fiscal year are reported subsequent to year end; accordingly, the Fund estimates the character of REIT distributions based on the most recent information available. Income or loss from limited partnerships is reclassified among the components of net assets upon receipt of K-1’s. Discounts and premiums on fixed income securities purchased are amortized over the life of the respective securities or accreted using the effective interest method.
Dividends and Distributions – Each Fund intends to distribute substantially all of its net investment income, if any, as dividends to its shareholders on at least an annual basis, except for Yield-Focus Fund Each Fund which will normally distribute dividends on a quarterly basis. Each Fund intends to distribute its net realized long term capital gains and its net realized short term capital gains, if any, at least once a year. Dividends to shareholders, which are determined in accordance with income tax regulations, are recorded on the ex-dividend date. The treatment for financial reporting purposes of distributions made to shareholders during the period from net investment income or net realized capital gains may differ from their ultimate treatment for federal income tax purposes. These differences are caused primarily by differences in the timing of the recognition of certain components of income, expense or realized capital gains for federal income tax purposes. Where such differences are permanent in nature, they are reclassified in the components of the net assets based on their ultimate
32
MERITAGE FUNDS
NOTES TO THE FINANCIAL STATEMENTS – (continued)
August 31, 2017
NOTE 2. SIGNIFICANT ACCOUNTING POLICIES – continued
characterization for federal income tax purposes. Any such reclassifications will have no effects on net assets, results of operations or net asset values per share of the Funds. For the year ended August 31, 2017, the Funds made the following reclassifications to increase (decrease) the components of net assets, which were due to return of capital distributions from underlying investments, dispositions of complex securities and nondeductible expenses:
| | | | | | | | | | | | |
| | | Paid-In Capital | | | Accumulated Undistributed
Net Investment
Income (Loss) | | | Accumulated Net Realized
Gain (Loss) from
Investments | |
Growth Equity Fund | | $ | (3 | ) | | $ | (8,069 | ) | | $ | 8,072 | |
Value Equity Fund | | | – | | | | (1,533 | ) | | | 1,533 | |
Yield-Focus Equity Fund | | | (8,455 | ) | | | (10,916 | ) | | | 19,371 | |
NOTE 3. SECURITIES VALUATION AND FAIR VALUE MEASUREMENTS
Fair value is defined as the price that a Fund would receive upon selling an investment in an orderly transaction to an independent buyer in the principal or most advantageous market of the investment. GAAP established a three-tier hierarchy to maximize the use of observable market data and minimize the use of unobservable inputs and to establish classification of fair value measurements for disclosure purposes.
Inputs refer broadly to the assumptions that market participants would use in pricing the asset or liability. Inputs may be observable or unobservable. Observable inputs are inputs that reflect the assumptions market participants would use in pricing the asset or liability developed based on market data obtained from sources independent of the reporting entity. Unobservable inputs are inputs that reflect the reporting entity’s own assumptions about the assumptions market participants would use in pricing the asset or liability developed based on the best information available in the circumstances.
Various inputs are used in determining the value of each Fund’s investments. These inputs are summarized in the three broad levels listed below.
| | • | | Level 1 – unadjusted quoted prices in active markets for identical investments and/or registered investment companies where the value per share is determined and published and is the basis for current transactions for identical assets or liabilities at the valuation date |
| | • | | Level 2 – other significant observable inputs (including, but not limited to, quoted prices for an identical security in an inactive market, quoted prices for similar securities, interest rates, prepayment speeds, credit risk, etc.) |
| | • | | Level 3 – significant unobservable inputs (including the Funds’ own assumptions in determining fair value of investments based on the best information available) |
The inputs used to measure fair value may fall into different levels of the fair value hierarchy. In such cases, for disclosure purposes, the level in the fair value hierarchy within which the fair value measurement falls in its entirety, is determined based on the lowest level input that is significant to the fair value measurement in its entirety.
33
MERITAGE FUNDS
NOTES TO THE FINANCIAL STATEMENTS – (continued)
August 31, 2017
NOTE 3. SECURITIES VALUATION AND FAIR VALUE MEASUREMENTS – continued
In computing the net asset value (‘NAV”) of the Funds, fair value is based on market valuations with respect to portfolio securities for which market quotations are readily available. Pursuant to Board approved policies, the Funds rely on independent third-party pricing services to provide the current market value of securities. Those pricing services value equity securities, including exchange-traded funds and convertible preferred stocks, traded on a securities exchange at the last reported sales price on the principal exchange. Equity securities quoted by NASDAQ are valued at the NASDAQ Official Closing Price. If there is no reported sale on the principal exchange, equity securities are valued at the mean between the most recent quoted bid and asked price. If a non-exchange traded security does not trade on a particular day, then the mean between the last quoted closing bid and asked price will be used. When using the market quotations or close prices provided by the pricing service and when the market is considered active, the security will be classified as a Level 1 security.
Sometimes, an equity security owned by a Fund will be valued by the pricing service with factors other than market quotations or when the market is considered inactive. When this happens, the security may be classified as a Level 2 security. When market quotations are not readily available, when the Fund determines that the market quotation or the price provided by the pricing service does not accurately reflect the current fair value, or when certain restricted or illiquid securities are being valued, such securities are valued as determined in good faith by the Adviser, in conformity with guidelines adopted by and subject to review by the Board. These securities are generally categorized as Level 3 securities.
Investments in open-end mutual funds, including money market mutual funds, are generally priced at the ending NAV provided by the service agent of the funds. These securities are categorized as Level 1 securities.
In accordance with the Trust’s valuation procedures, the Adviser is required to consider all appropriate factors relevant to the value of securities for which it has determined other pricing sources are not available or reliable as described above. No single standard exists for determining fair value, because fair value depends upon the circumstances of each individual case. As a general principle, the current fair value of an issue of securities being valued by the Adviser would be the amount which the Funds might reasonably expect to receive for them upon their current sale. Methods which are in accordance with this principle may, for example, be based on (i) a multiple of earnings; (ii) a discount from market of a similar freely traded security (including a derivative security or a basket of securities traded on other markets, exchanges or among dealers); or (iii) yield to maturity with respect to debt issues, or a combination of these and other methods. Fair value pricing is permitted if, in the Adviser’s opinion, the validity of market quotations appears to be questionable based on factors such as evidence of a thin market in the security based on a small number of quotations, a significant event occurs after the close of a market but before a Fund’s NAV calculation that may affect a security’s value, or the Adviser is aware of any other data that calls into question the reliability of market quotations.
The following is a summary of the inputs used to value the Funds’ investments as of August 31, 2017:
| | | | | | | | | | | | | | | | |
| | | Valuation Inputs | |
| Growth Equity Fund | | Level 1 | | | Level 2 | | | Level 3 | | | Total | |
Common Stocks | | $ | 20,493,287 | | | $ | – | | | $ | – | | | $ | 20,493,287 | |
Exchange-Traded Funds | | | 1,745,132 | | | | – | | | | – | | | | 1,745,132 | |
Money Market Securities | | | 2,082,567 | | | | – | | | | – | | | | 2,082,567 | |
Total | | $ | 24,320,986 | | | $ | – | | | $ | – | | | $ | 24,320,986 | |
34
MERITAGE FUNDS
NOTES TO THE FINANCIAL STATEMENTS – (continued)
August 31, 2017
NOTE 3. SECURITIES VALUATION AND FAIR VALUE MEASUREMENTS – continued
| | | | | | | | | | | | | | | | |
| | | Valuation Inputs | |
| Value Equity Fund | | Level 1 | | | Level 2 | | | Level 3 | | | Total | |
Common Stocks | | $ | 15,128,199 | | | $ | – | | | $ | – | | | $ | 15,128,199 | |
Exchange-Traded Funds | | | 581,161 | | | | – | | | | – | | | | 581,161 | |
Money Market Securities | | | 707,199 | | | | – | | | | – | | | | 707,199 | |
Total | | $ | 16,416,559 | | | $ | – | | | $ | – | | | $ | 16,416,559 | |
Yield-Focus Equity Fund | | | | | | | | | | | | | | | | |
Common Stocks | | $ | 24,209,291 | | | $ | – | | | $ | – | | | $ | 24,209,291 | |
Convertible Preferred Stocks | | | 1,501,604 | | | | – | | | | – | | | | 1,501,604 | |
Exchange-Traded Funds | | | 550,736 | | | | – | | | | – | | | | 550,736 | |
Money Market Securities | | | 472,651 | | | | – | | | | – | | | | 472,651 | |
Total | | $ | 26,734,282 | | | $ | – | | | $ | – | | | $ | 26,734,282 | |
The Funds did not hold any investments at any time during the reporting period in which significant unobservable inputs were used in determining fair value; therefore, no reconciliation of Level 3 securities is included for this reporting period. The Funds did not hold any derivative instruments during the reporting period.
The Trust recognizes transfers between fair value hierarchy levels at the end of the reporting period. There were no transfers between any levels as of August 31, 2017 based on input levels assigned as August 31, 2016.
NOTE 4. FEES AND OTHER TRANSACTIONS WITH AFFILIATES
Under the terms of the management agreement, on behalf of the Funds (the “Agreement”), the Adviser manages each Fund’s investments subject to oversight of the Board. As compensation for its management services each Fund is obligated to pay the Adviser a fee computed and accrued daily and paid monthly at an annual rate of 0.75% of the average daily net assets of each Fund. For the fiscal year ended August 31, 2017, the Adviser earned fees of $150,353 from the Growth Equity Fund, $108,026 from the Value Equity Fund and $242,188 from the Yield-Focus Equity Fund before the reimbursements described below. At August 31, 2017, the Growth Equity Fund owed the Adviser $3,201 and the Yield-Focus Fund owed the Adviser $6,417. At August 31, 2017, the Value Equity Fund was due $327 from the Adviser.
The Adviser has contractually agreed to waive its management fee and/or reimburse expenses so that total annual operating expenses (excluding (i) interest; (ii) taxes; (iii) brokerage fees and commissions; (iv) other extraordinary expenses not incurred in the ordinary course of the Fund’s business; (v) dividend expenses on short sales; (vi) expenses incurred under a Rule 12b-1 plan of distribution; and (vii) indirect expenses such as acquired fund fees and expenses) do not exceed 1.00% of each Fund’s average daily net assets through December 31, 2017 (“Expense Limitation”). During any fiscal year that the Investment Advisory Agreement between the Adviser and the Trust is in effect, the Adviser may recoup the sum of all fees previously waived or expenses reimbursed for a period of 36 months following the month during which such fee waiver or expense reimbursement was made, less any reimbursement previously paid, if such recoupment can be achieved within the Expense Limitation as well as any expense limitation in effect at the time the reimbursement is made. This expense cap agreement may be terminated by the Board at any time.
35
MERITAGE FUNDS
NOTES TO THE FINANCIAL STATEMENTS – (continued)
August 31, 2017
NOTE 4. FEES AND OTHER TRANSACTIONS WITH AFFILIATES – continued
As of August 31, 2017, the Adviser may seek repayment of investment advisory fee waivers and expense reimbursements up to the amounts of $288,287, $259,836 and $529,840 from the Growth Equity Fund, Value Equity Fund and Yield-Focus Equity Fund, respectively, no later than August 31, 2020.
The Trust retains Ultimus Asset Services, LLC (the “Administrator”) to provide the Funds with non-investment related administration and compliance, fund accounting and transfer agent services. For the year ended August 31, 2017, fees incurred for administration, fund accounting and transfer agent services, and the amounts due to the Administrator at August 31, 2017 were as follows:
| | | | | | | | | | | | |
| | | Growth
Equity Fund | | | Value Equity
Fund | | | Yield-Focus
Equity Fund | |
Administration | | $ | 33,679 | | | $ | 24,175 | | | $ | 54,346 | |
Fund Accounting | | | 22,454 | | | | 16,115 | | | | 36,431 | |
Transfer Agent | | | 18,061 | | | | 12,968 | | | | 29,195 | |
Payable to Administrator | | | 6,772 | | | | 4,977 | | | | 8,395 | |
The Board supervises the business activities of the Trust. Each Trustee serves as a Trustee for the lifetime of the Trust or until the earlier of his or her retirement as a Trustee at age 75, death, resignation or is removed. “Independent Trustees,” which means that they are not “interested persons” as defined in the 1940 Act of the Trust each receives annual compensation of $15,000 from the Trust. Each Committee Chairperson receives an additional annual compensation of $1,000 from the Trust. Independent Trustees also receive $1,000 for attending each special in-person meeting and up to $1,000 for attending special telephonic meetings, depending on the length of the telephonic meeting. In addition, the Trust reimburses Trustees for out-of-pocket expense incurred in conjunction with attendance at meetings.
The officers and one Trustee of the Trust are employees of Ultimus. Unified Financial Securities, LLC (the “Distributor”) acts as the principal distributor of the Fund’s shares. Both Ultimus and the Distributor operate as wholly-owned subsidiaries of Ultimus Fund Solutions, LLC.
The Funds have adopted a Distribution Plan (the “Plan”) pursuant to Rule 12b-1 under the 1940 Act. The Plan provides that the Funds will pay the Distributor and/or any registered securities dealer, financial institution or any other person (the “Recipient”) a fee of 0.25% of the average daily net assets of each Fund’s Investor Shares in connection with the promotion and distribution of each Fund’s Investor Shares or the provision of personal services to shareholders, including, but not necessarily limited to, advertising, compensation to underwriters, dealers and selling personnel, the printing and mailing of prospectuses to other than current shareholders of Investor Shares, the printing and mailing of sales literature and servicing shareholder accounts (“12b-1 Expense”). The Funds or Distributor may pay all or a portion of these fees to any Recipient who renders assistance in distributing or promoting the sale of shares, or who provides certain shareholder services, pursuant to a written agreement. The Plan is a compensation plan, which means that compensation is provided regardless of 12b-1 expenses actually incurred. For the year ended August 31, 2017, Investor Shares 12b-1 expense incurred by the Growth Equity Fund was $447, $11 for the Value Equity Fund, and $13,274 for the Yield-Focus Equity Fund. At August 31, 2017, the Distributor was owed $111 by the Growth Equity Fund and $268 for the Yield Focus Equity Fund for Investor Shares 12b-1 expenses.
36
MERITAGE FUNDS
NOTES TO THE FINANCIAL STATEMENTS – (continued)
August 31, 2017
NOTE 5. PURCHASES AND SALES OF SECURITIES
For the year ended August 31, 2017, purchases and sales of investment securities, excluding short-term securities were as follows:
| | | | | | | | |
Fund | | Purchases | | | Sales | |
Growth Equity Fund | | $ | 16,978,276 | | | $ | 15,735,988 | |
Value Equity Fund | | | 11,703,951 | | | | 11,430,883 | |
Yield-Focus Equity Fund | | | 18,693,088 | | | | 33,159,607 | |
There were no purchases or sales of long-term U.S. government obligations during the fiscal year ended August 31, 2017.
NOTE 6. BENEFICIAL OWNERSHIP
The beneficial ownership, either directly or indirectly, of 25% or more of the voting securities of a fund creates a presumption of control of a fund, under Section 2(a)(9) of the Investment Company Act of 1940. At August 31, 2017, National Financial Services LLC (“NFS”) and Charles Schwab & Co. Inc. (“Schwab”) owned, as record shareholder, 49.34% and 46.61%, respectively, of the outstanding shares of the Growth Equity Fund. At August 31, 2017, NFS and Schwab owned, as record shareholder, 52.70% and 44.57%, respectively, of the outstanding shares of the Value Equity Fund. At August 31, 2017, NFS and Schwab owned, as record shareholder, 61.75% and 30.30%, respectively, of the outstanding shares of the Yield-Focus Equity Fund. It is not known whether NFS, Schwab or any of the underlying beneficial owners owned or controlled 25% or more of the voting securities of the Funds.
NOTE 7. FEDERAL TAX INFORMATION
At August 31, 2017, the net unrealized appreciation (depreciation) of investments for tax purposes was as follows:
| | | | | | | | | | | | | | | | |
| | | Tax Cost of
Securities | | | Gross
Unrealized
Appreciation | | | Gross
Unrealized
Depreciation | | | Net Unrealized
Appreciation | |
Growth Equity Fund | | | 20,100,658 | | | | 4,420,932 | | | | (200,604 | ) | | | 4,220,328 | |
Value Equity Fund | | | 13,551,723 | | | | 3,001,719 | | | | (136,883 | ) | | | 2,864,836 | |
Yield-Focus Equity Fund | | | 23,902,864 | | | | 3,262,022 | | | | (430,604 | ) | | | 2,831,418 | |
The tax character of distributions paid during the year ended August 31, 2017 and 2016, were as follows:
2017
| | | | | | | | | | | | | | | | |
| | | Ordinary
Income | | | Net Long-Term
Capital Gains | | | Return of
Captial | | | Total
Distributions
Paid | |
Growth Equity Fund | | $ | 44,491 | | | $ | 172,588 | | | $ | – | | | $ | 217,079 | |
Value Equity Fund | | | 115,339 | | | | – | | | | – | | | | 115,339 | |
Yield-Focus Equity Fund | | | 1,067,872 | | | | – | | | | – | | | | 1,067,872 | |
37
MERITAGE FUNDS
NOTES TO THE FINANCIAL STATEMENTS – (continued)
August 31, 2017
NOTE 7. FEDERAL TAX INFORMATION – continued
2016
| | | | | | | | | | | | | | | | |
| | | Ordinary
Income | | | Net Long-Term
Capital Gains | | | Return of
Capital | | | Total
Distributions
Paid | |
Growth Equity Fund | | $ | 208,724 | | | $ | 109,499 | | | $ | – | | | $ | 318,223 | |
Value Equity Fund | | | 105,289 | | | | 50,549 | | | | – | | | | 155,838 | |
Yield-Focus Equity Fund | | | 1,250,094 | | | | – | | | | – | | | | 1,250,094 | |
At August 31, 2017, the components of distributable earnings (accumulated losses) on a tax basis were as follows:
| | | | | | | | | | | | | | | | | | | | |
| | | Ordinary
Income | | | Undistributed
Long-Term
Capital Gains | | | Accumulated
Capital and
Other Losses | | | Unrealized
Appreciation/
(Depreciation | | | Total
Accumulated
Earnings
(Losses) | |
Growth Equity Fund | | $ | 10,347 | | | $ | 1,614,270 | | | $ | – | | | $ | 4,220,328 | | | $ | 5,844,945 | |
Value Equity Fund | | | 90,491 | | | | – | | | | (453,145 | ) | | | 2,864,836 | | | $ | 2,502,182 | |
Yield-Focus Equity Fund | | | 126,541 | | | | – | | | | (4,718,284 | ) | | | 2,831,418 | | | $ | (1,760,325 | ) |
The difference between book basis and tax basis unrealized appreciation is primarily attributable to the tax deferral of wash losses, return of capital adjustments, interest accruals on trust preferred securities and mark-to-market of passive foreign investment companies.
As of August 31, 2017, the Value Equity Fund and Yield-Focus Equity Fund, respectively, had available for tax purposes an unused capital loss carryforward of $453,145, and $4,718,284 of short-term capital losses with no expiration, which was available to offset against future taxable net capital gains. To the extent that these carryforwards are used to offset future gains, it is probable that the amount offset will not be distributed to shareholders.
NOTE 8. COMMITMENTS AND CONTINGENCIES
The Funds indemnify their officers and trustees for certain liabilities that may arise from the performance of their duties to the Funds. Additionally, in the normal course of business, the Funds enter into contracts that contain a variety of representations and warranties which provide general indemnifications. The Funds’ maximum exposure under these arrangements is unknown, as this would involve future claims that may be made against the Funds that have not yet occurred.
NOTE 9. SUBSEQUENT EVENTS
Management has evaluated events or transactions from August 31, 2017 through the date these financial statements were issued that would merit recognition or disclosure in the financial statements. There were no subsequent events to report that would have a material impact in the Funds’ financial statements.
38
REPORT OF INDEPENDENT REGISTERED PUBLIC ACCOUNTING FIRM
The Board of Trustees and Shareholders of
Capitol Series Trust
We have audited the accompanying statements of assets and liabilities, including the schedules of investments, of the Meritage Growth Equity Fund, Meritage Value Equity Fund, and Meritage Yield-Focus Equity Fund (the “Funds”), each a series of the Capitol Series Trust, as of August 31, 2017, and the related statements of operations, changes in net assets and financial highlights for the year then ended. These financial statements and financial highlights are the responsibility of the Funds’ management. Our responsibility is to express an opinion on these financial statements and financial highlights based on our audits. The statements of changes in net assets and financial highlights of the Funds for the periods presented through August 31, 2016, were audited by other auditors whose report dated October 26, 2016, expressed an unqualified opinion on those statements of changes in net assets and financial highlights.
We conducted our audits in accordance with the standards of the Public Company Accounting Oversight Board (United States). Those standards require that we plan and perform the audit to obtain reasonable assurance about whether the financial statements and financial highlights are free of material misstatement. We were not engaged to perform an audit of the Funds’ internal control over financial reporting. Our audits included consideration of internal control over financial reporting as a basis for designing audit procedures that are appropriate in the circumstances, but not for the purpose of expressing an opinion on the effectiveness of the Funds’ internal control over financial reporting. Accordingly, we express no such opinion. An audit also includes examining, on a test basis, evidence supporting the amounts and disclosures in the financial statements and financial highlights, assessing the accounting principles used and significant estimates made by management, and evaluating the overall financial statement presentation. Our procedures included confirmation of securities owned as of August 31, 2017, by correspondence with the custodians and brokers or by other appropriate auditing procedures where replies from custodians or brokers were not received. We believe that our audits provide a reasonable basis for our opinion.
In our opinion, the financial statements and financial highlights referred to above present fairly, in all material respects, the financial position of the Funds as of August 31, 2017, the results of their operations, changes in their net assets and financial highlights for the year then ended in conformity with U.S. generally accepted accounting principles.

Grandview Heights, Ohio
October 27, 2017
39
SUMMARY OF FUND EXPENSES – (Unaudited)
As a shareholder of a Fund, you incur ongoing costs, including management fees and other Fund expenses. This Example is intended to help you understand your ongoing costs (in dollars) of investing in the Fund and to compare these costs with the ongoing costs of investing in other mutual funds. The Example is based on an investment of $1,000 invested at the beginning of the period, and held for the entire period from March 1, 2017 to August 31, 2017.
Actual Expenses
The first line of the table below provides information about actual account values and actual expenses. You may use the information in this line, together with the amount you invested, to estimate the expenses that you paid over the period. Simply divide your account value by $1,000 (for example, an $8,600 account value divided by $1,000 = $8.60), then multiply the result by the number in the first line under the heading entitled “Expenses Paid During the Period” to estimate the expenses you paid on your account during this period.
Hypothetical Example for Comparison Purposes
The second line of the table below provides information about hypothetical account values and hypothetical expenses based on the Fund’s actual expense ratio and an assumed rate of return of 5% per year before expenses, which is not the Fund’s actual return. The hypothetical account values and expenses may not be used to estimate the actual ending account balance or expenses you paid for the period. You may use this information to compare the ongoing costs of investing in the Fund and other funds. To do so, compare this 5% hypothetical example with the 5% hypothetical examples that appear in the shareholder reports of the other funds.
Please note that the expenses shown in the table are meant to highlight your ongoing costs only. Therefore, the second line of the table below is useful in comparing ongoing costs only and will not help you determine the relative costs of owning different funds.
| | | | | | | | | | | | | | | | |
| | | Beginning
Account Value
March 1, 2017 | | | Ending
Account Value
August 31, 2017 | | | Expenses Paid
During the
Period* | | | Annualized
Expense
Ratio | |
Meritage Growth Equity Fund | | | | | | | | | | | | | | | | |
Institutional Class | | | | | | | | | | | | | | | | |
Actual | | $ | 1,000.00 | | | $ | 1,085.20 | | | $ | 5.26 | | | | 1.00 | % |
Hypothetical** | | $ | 1,000.00 | | | $ | 1,020.16 | | | $ | 5.09 | | | | 1.00 | % |
Investor Class | | | | | | | | | | | | | | | | |
Actual | | $ | 1,000.00 | | | $ | 1,084.20 | | | $ | 6.57 | | | | 1.25 | % |
Hypothetical** | | $ | 1,000.00 | | | $ | 1,018.90 | | | $ | 6.36 | | | | 1.25 | % |
Meritage Value Equity Fund | | | | | | | | | | | | | | | | |
Institutional Class | | | | | | | | | | | | | | | | |
Actual | | $ | 1,000.00 | | | $ | 1,036.60 | | | $ | 5.13 | | | | 1.00 | % |
Hypothetical** | | $ | 1,000.00 | | | $ | 1,020.16 | | | $ | 5.09 | | | | 1.00 | % |
Meritage Yield-Focus Equity Fund | | | | | | | | | | | | | | | | |
Institutional Class | | | | | | | | | | | | | | | | |
Actual | | $ | 1,000.00 | | | $ | 1,013.70 | | | $ | 5.08 | | | | 1.00 | % |
Hypothetical** | | $ | 1,000.00 | | | $ | 1,020.16 | | | $ | 5.09 | | | | 1.00 | % |
Investor Class | | | | | | | | | | | | | | | | |
Actual | | $ | 1,000.00 | | | $ | 1,013.20 | | | $ | 6.34 | | | | 1.25 | % |
Hypothetical** | | $ | 1,000.00 | | | $ | 1,018.90 | | | $ | 6.36 | | | | 1.25 | % |
| * | Expenses are equal to the Fund’s annualized expense ratio multiplied by the average account value over the period, multiplied by 184/365. |
| ** | Assumes 5% return before expenses. |
40
TRUSTEES AND OFFICERS (Unaudited)
The Board of Trustees supervises the business activities of the Trust. Each Trustee serves as a trustee until termination of the Trust unless the Trustee dies, resigns, retires or is removed.
The following tables provide information regarding the Trustees and Officers.
| | |
| Independent Trustees | | |
Name, Address,* Age, Position with Trust,** Term of Position with Trust | | Principal Occupation During Past 5 Years and Other Directorships |
Walter B. Grimm Age: 72 Trustee Began Serving: November 2013 | | Principal Occupations(s): President, Leigh Management Group, LLC (consulting firm) (October 2005 to present); President, Leigh Investments, Inc. (1988 to present); and Chief Financial Officer, East West Private, LLC (consulting firm) (March 2009 to present). |
Mary M. Morrow Age: 59 Trustee Began Serving: November 2013 | | Principal Occupations(s): Chief Operating Officer, Pennsylvania Health and Wellness (fully owned subsidiary of Centene Corporation) (November 2016 to present). Previous Position(s): Vice President, Strategic Initiatives, Gateway Heath (January 2015 to November 2016); Consulting Practice Manager, DST Health Solutions (August 2010 to January 2015); Director, Service and Client Relations, EBDS (August 2008 – May 2009); Independent Consultant, Healthcare Servicing May 2009 – August 2010). |
| * | The address for each trustee is 225 Pictoria Drive, Suite 450, Cincinnati, OH 45246. |
| ** | The Trust currently consists of 8 series. |
| | |
| Interested Trustees & Officers | | |
Name, Address,* Age, Position with Trust,** Term of Position with Trust | | Principal Occupation During Past 5 Years and Other Directorships |
Robert G. Dorsey*** Age: 60 Chairman of the Board and Trustee Began Serving: March 2017 | | Principal Occupation(s): President and Managing Director of Ultimus Fund Solutions, LLC and Ultimus Fund Distributors, LLC (1999 to present); Interested Trustee of Ultimus Managers Trust (February 2012 to present). Previous Position(s): President of Ultimus Managers Trust (June 2012 to October 2013). |
Matthew J. Miller Age: 41 Chief Executive Officer and President Began Serving: September 2013 | | Principal Occupation(s): Assistant Vice President, Relationship Management, Ultimus Fund Solutions, LLC (December 2015 to present); Vice President, Valued Advisers Trust (December 2011 to present). Previous Position(s): Vice President, Relationship Management, Huntington Asset Services, Inc. (n/k/a Ultimus Asset Services, LLC) (2008 to December 2015); Vice President, The Huntington Funds (February 2010 to April 2015); Vice President, Transfer Agency Operations, Huntington Asset Services, Inc. (2002 to 2008); Employed in various positions with Huntington Asset Services, Inc. (July 1998 to 2002). |
41
TRUSTEES AND OFFICERS (Unaudited) (continued)
| | |
| Interested Trustees & Officers – continued | | |
Name, Address,* Age, Position with Trust,** Term of Position with Trust | | Principal Occupation During Past 5 Years and Other Directorships |
Zachary P. Richmond Age: 37 Treasurer and Chief Financial Officer Began Serving: August 2014 | | Principal Occupation(s): Assistant Vice President, Associate Director of Financial Administration, Ultimus Fund Solutions, LLC (December 2015 to present); Treasurer and Chief Financial Officer, Unified Series Trust (August 2014 to present); Treasurer and Chief Financial Officer, Commonwealth International Series Trust (September 2015 to present). Previous Position(s): Assistant Vice President, Fund Administration, Huntington Asset Services, Inc. (n/k/a Ultimus Asset Services, LLC) (January 2011 to December 2015); and Assistant Treasurer, Unified Series Trust (2011 to August 2014). |
John C. Swhear Age: 56 Chief Compliance Officer Began Serving: September 2013 | | Principal Occupation(s): Assistant Vice President, Associate Director of Fund Administration, Ultimus Fund Solutions, LLC (May 2017 to present); Chief Compliance Officer of Unified Financial Securities, LLC (the Distributor) (July 2007 to present); Chief Compliance Officer, Vice President of Valued Advisers Trust (August 2008 to present); and Assistant Secretary, First Western Funds Trust (April 2017 to present). Previous Position(s): Associate Director of Compliance, Ultimus Fund Solutions, LLC (December 2015 to May 2017); President, Unified Series Trust (March 2012 to January 2016); Director, Huntington Asset Services, Inc. (n/k/a Ultimus Asset Services, LLC) (July 2014 to December 2015); Vice President of Legal Administration and Compliance, Huntington Asset Services, Inc. (April 2007 to December 2015); Director of Unified Financial Securities, Inc. (n/k/a Unified Financial Securities, LLC) (July 2014 to December 2015); Secretary, The Huntington Funds (April 2010 to February 2012); and Senior Vice President, Unified Series Trust (May 2007 to March 2012). |
Stacey Havens Age: 51 Vice President Began Serving: September 2013 | | Principal Occupation(s): Assistant Vice President, Relationship Management, Ultimus Fund Solutions, LLC (December 2015 to present). Previous Position(s): Vice President, Huntington Asset Services, Inc. (n/k/a Ultimus Asset Services, LLC) (July 1993 to December 2015). |
42
TRUSTEES AND OFFICERS (Unaudited) (continued)
| | |
| Interested Trustees & Officers – continued | | |
Name, Address,* Age, Position with Trust,** Term of Position with Trust | | Principal Occupation During Past 5 Years and Other Directorships |
Tiffany R. Franklin Age: 41 Secretary Began Serving: December 2015 | | Principal Occupation(s): Senior Paralegal, Ultimus Fund Solutions, LLC (December 2015 to present); Assistant Secretary, Wilshire Mutual Funds, Inc. and Wilshire Variable Insurance Trust (October 2016 to present); and Assistant Secretary, Cross Shore Discovery Fund (2017 to present; and Assistant Secretary, Caldwell & Orkin Funds, Inc. (June 2017 to present). Previous Position(s): Paralegal, Huntington Asset Services, Inc. (n/k/a Ultimus Asset Services, LLC) (April 2012 to December 2015); Assistant Secretary, Capitol Series Trust (September 2013 to December 2015); Assistant Secretary, The Huntington Funds, (November 2012 to December 2015); Assistant Secretary, Huntington Strategy Shares (November 2012 to December 2015); Secretary, The Huntington Funds (December 2015 to March 2016); and Secretary, Huntington Strategy Shares (December 2015 to March 2016). |
| * | The address for each trustee and officer is 225 Pictoria Drive, Suite 450, Cincinnati, OH 45246. |
| ** | The Trust currently consists of 8 series. |
| *** | Mr. Dorsey is considered an “interested person” of the Trust within the meaning of Section 2(a)(19) of the 1940 Act because of his relationship with the Trust’s administrator, transfer agent, and distributors. |
OTHER INFORMATION (Unaudited)
The Fund’s Statement of Additional Information (“SAI”) includes additional information about the trustees and is available without charge, upon request. You may call toll-free at (855) 261-0104 to request a copy of the SAI or to make shareholder inquiries.
43
OTHER FEDERAL TAX INFORMATION (Unaudited)
The Form 1099-DIV you receive in January 2018 will show the tax status of all distributions paid to your account in calendar year 2017. Shareholders are advised to consult their own tax advisor with respect to the tax consequences of their investment in the Fund. As required by the Internal Revenue Code and/or regulations, shareholders must be notified regarding the status of qualified dividend income for individuals and the dividends received deduction for corporations.
For the year ended August 31, 2017, the following Funds paid qualified dividend income:
| | | | |
Fund | | Qualified Dividend
Income | |
Growth Equity Fund | | | 100.00 | % |
Value Equity Fund | | | 100.00 | % |
Yield-Focus Equity Fund | | | 93.98 | % |
For the taxable year ended August 31, 2017, the following percentage of ordinary income dividends paid by the Funds qualify for the dividends received deduction available to corporations:
| | | | |
Fund | | Dividends Received
Deduction | |
Growth Equity Fund | | | 100.00 | % |
Value Equity Fund | | | 100.00 | % |
Yield-Focus Equity Fund | | | 76.89 | % |
The Funds designate the following amounts as long-term capital gains distributions. The amounts designated may not agree with long term capital gains in the tax character of distribution table due to utilization of earnings and profits distributed to shareholders on redemption of shares.
| | | | |
Fund | | Long Term
Capital Gains
Paid Amount | |
Growth Equity Fund | | $ | 172,588 | |
44
| | |
| | |
FACTS | | WHAT DOES CAPITOL SERIES TRUST DO WITH YOUR PERSONAL INFORMATION? |
| | |
| | |
Why? | | Financial companies choose how they share your personal information. Federal law gives consumers the right to limit some but not all sharing. Federal law also requires us to tell you how we collect, share, and protect your personal information. Please read this notice carefully to understand what we do. |
| | |
| | |
What? | | The types of personal information we collect and share depend on the product or service you have with us. This information can include: ◾ Social Security number ◾ account balances and account transactions ◾ account transactions, transaction or loss history and purchase history ◾ checking account information and wire transfer instructions When you are no longer our customer, we continue to share your information as described in this notice. |
| | |
How? | | All financial companies need to share customers’ personal information to run their everyday business. In the section below, we list the reasons financial companies can share their customers’ personal information; the reasons Capitol Series Trust chooses to share; and whether you can limit this sharing. |
| | |
Reasons we can share your personal information | | Does Capitol Series
Trust share? |
For our everyday business purposes – such as to process your transactions, maintain your account(s), respond to court orders and legal investigations, or report to credit bureaus | | Yes |
For our marketing purposes – to offer our products and services to you | | Yes |
For joint marketing with other financial companies | | No |
For our affiliates’ everyday business purposes – information about your transactions and experiences | | No |
For our affiliates’ everyday business purposes – information about your creditworthiness | | No |
For nonaffiliates to market to you | | No |
| | |
Questions? | | Call 1-855-261-0104 |
45
| | |
| Who we are | | |
Who is providing this notice? | | Capitol Series Trust |
What we do | | |
How does Capitol Series Trust protect my personal information? | | To protect your personal information from unauthorized access and use, we use security measures that comply with federal law. These measures include computer safeguards and secured files and buildings. |
| How does Capitol Series Trust collect my personal information? | | We collect your personal information, for example, when you ◾ open an account or deposit money ◾ buy securities from us or sell securities to us ◾ make deposits or withdrawals from your account provide account information ◾ give us your account information ◾ make a wire transfer ◾ tell us who receives the money ◾ tell us where to send the money ◾ show your government-issued ID ◾ show your driver’s license |
| Why can’t I limit all sharing? | | Federal law gives you the right to limit only ◾ sharing for affiliates’ everyday business purposes – information about your creditworthiness ◾ affiliates from using your information to market to you ◾ sharing for nonaffiliates to market to you State laws and individual companies may give you additional rights to limit sharing. |
| | |
| Definitions | | |
| | |
| Affiliates | | Companies related by common ownership or control. They can be financial and nonfinancial companies. |
| | |
| Nonaffiliates | | Companies not related by common ownership or control. They can be financial and nonfinancial companies. ◾ Capitol Series Trust does not share your personal information with nonaffiliates so they can market to you. |
| | |
| Joint marketing | | A formal agreement between nonaffiliated financial companies that together market financial products or services to you. ◾ Capitol Series Trust doesn’t jointly market financial products or services to you. |
46
PROXY VOTING – (Unaudited)
A description of the policies and procedures that the Funds use to determine how to vote proxies relating to portfolio securities and information regarding how each Fund voted those proxies during the most recent twelve month period ended June 30, is available without charge upon request by (1) calling the Funds at (855) 261-0104 and (2) from Funds documents filed with the Securities and Exchange Commission (“SEC”) on the SEC’s website at www.sec.gov.
TRUSTEES
Robert G. Dorsey, Chairman
Walter B. Grimm
Mary M. Morrow
OFFICERS
Matthew J. Miller, Chief Executive Officer and President
John C. Swhear, Chief Compliance Officer, and Vice-President
Stacey Havens, Vice President
Zachary P. Richmond, Treasurer and Chief Financial Officer
Tiffany R. Franklin, Secretary
INVESTMENT ADVISER
Meritage Portfolio Management, Inc.
7500 College Boulevard, Suite 1212
Overland Park, KS 66210
DISTRIBUTOR
Unified Financial Securities, LLC
9465 Counselors Row, Suite 200
Indianapolis, IN 46240
INDEPENDENT REGISTERED PUBLIC ACCOUNTING FIRM
Ernst & Young LLP
800 Yard Street, Suite 200
Grandview Heights, OH 43212
LEGAL COUNSEL
Bernstein Shur
100 Middle Street, 6th Floor
Portland, ME 04104
CUSTODIAN
Huntington National Bank
41 South High Street
Columbus, OH 43215
ADMINISTRATOR, TRANSFER AGENT AND FUND ACCOUNTANT
Ultimus Asset Services, LLC
225 Pictoria Drive, Suite 450
Cincinnati, OH 45246
This report is intended only for the information of shareholders or those who have received the Funds’ prospectus which contains information about the Funds’ management fee and expenses. Please read the prospectus carefully before investing.
Distributed by Unified Financial Securities, LLC
Member FINRA/SIPC

Preserver Alternative Opportunities Fund
Institutional Shares – PAOIX
Retail Shares – PAORX
Annual Report
August 31, 2017
PreserverPartners, LLC
8700 Trail Lake Drive West, Suite 105
Memphis, Tennessee 38125
(844) 838-2119 or (901) 755-4737
Dear Fellow Shareholders,
We are pleased to present the Annual Report for the Preserver Alternative Opportunities Fund (“Fund”). For the period September 1, 2016 through August 31, 2017, the Preserver Alternative Opportunities Fund’s Institutional Class (PAOIX) and Retail Class (PAORX) returned 12.04% and 11.84%, respectively. These returns exceeded the Fund’s primary benchmark, the Bloomberg Barclays U.S. Aggregate Bond Index return of 0.49%, and the Morningstar Multi-Alternative Category Average(a) return of 3.54%, for the same period. For the three months ended August 31, 2017, PAOIX returned 3.37% and PAORX returned 3.38%. These returns also exceeded Bloomberg Barclays U.S. Aggregate Bond Index return of 1.23% and the Morningstar Multi-Alternative Category Average return of 1.06%, for the three months ended August 31, 2017.
The Fund’s outperformance, compared to the category and benchmark, was driven by its equity and corporate bond allocations and current income. The Fund has allocations to global equities, closed-end funds, non-agency mortgage-backed securities, preferred stocks, corporate bonds and U.S. Treasury bonds. Within the underlying securities, Burford Capital, Ltd. (up 369%), Adidas AG (up 82%), and Smart Metering Systems (up 58%) were the strongest gainers from our cost basis. The weakest performers from our cost basis were Calbee, Inc. (down 15%), Stericycle, Inc. Series A Preferred (down 14%), and KMI, Inc. Series A Preferred (down 9%). The Fund sold its investment in a reinsurance interval fund due to lowered return expectations prior to Hurricanes Harvey and Irma in September. The Fund also redeemed its investments in a private investment fund focused on participating mortgages. At present, there are no illiquid or sub-advised portfolios in the Fund. Annual portfolio turnover was approximately 70%.
While we echo the consensus opinion that U.S. equity valuations are stretched, we believe U.S. fixed income markets are even less appealing, leaving limited options for beta-driven returns. Given the current environment, the Fund has larger than normal allocations to global equities and equity-linked securities and will likely remain so until there are signs of an economic recession. Bond yields have once again defied conventional wisdom and are at the same levels they were one year ago. Closed-end funds and preferred securities have limited appeal but there is some value in residential and commercial mortgage-backed securities.
The Fund had a successful year and has provided attractive risk-adjusted returns. Your long-term investment horizon and confidence in our investment philosophy is essential to the execution of our strategy. We appreciate your continued support.
Sincerely,
Floyd Tyler, Ph.D., CFA
Portfolio Manager
| (a) | | These funds offer investors exposure to several different alternative investment tactics. Funds in this category have a majority of their assets exposed to alternative strategies. An investor’s exposure to different tactics may change slightly over time in response to market movements. Funds in this category include both funds with static allocation to alternative strategies and funds tactically allocating among alternative strategies and asset classes. The gross short exposure is greater than 20%. |
1
Investment Results (Unaudited)
Average Annual Total Returns(a) as of August 31, 2017
| | | | | | | | |
| | | One Year | | | Since
Inception
(3/1/16) | |
Preserver Alternative Opportunities Fund | | | | | | | | |
Institutional Shares | | | 12.04 | % | | | 12.25 | % |
Retail Shares | | | 11.84 | % | | | 11.98 | % |
Bloomberg Barclays U.S. Aggregate Bond Index (b) | | | 0.49 | % | | | 2.77 | % |
| | | Expense Ratios(c) | |
| |
| Institutional
Shares |
| |
| Retail
Shares |
|
Gross | | | 3.22 | % | | | 3.47 | % |
With Applicable Waivers | | | 2.05 | % | | | 2.30 | % |
The performance quoted represents past performance, which does not guarantee future results. The investment return and principal value of an investment will fluctuate so that an investor’s shares, when redeemed, may be worth more or less than their original cost. The returns shown do not reflect deduction of taxes that a shareholder would pay on Preserver Alternative Opportunities Fund (the “Fund”) distributions or the redemption of Fund shares. Current performance of the Fund may be lower or higher than the performance quoted. The Fund’s investment objectives, risks, charges and expenses must be considered carefully before investing. Performance data current to the most recent month end may be obtained by calling (844) 838-2119.
(a) Return figures reflect any change in price per share and assume the reinvestment of all distributions. The Fund’s returns reflect any fee waivers during the applicable period. If such fee waivers had not occurred, the quoted performance would have been lower.
(b) The Bloomberg Barclays U.S. Aggregate Bond Index (the “Index”) covers the U.S. investment grade fixed rate bond market (measuring bonds with maturities of at least one year), with index components for government and corporate securities, mortgage pass through securities, and asset-backed securities. The Index is an unmanaged benchmark that assumes reinvestment of all distributions and excludes the effect of taxes and fees. Individuals cannot invest directly in this Index; however, an individual can invest in exchange traded funds or other investment vehicles that attempt to track the performance of a benchmark index.
(c) The expense ratios are from the Fund’s prospectus dated December 29, 2016. PreserverPartners, LLC (the “Adviser”), the Fund’s adviser, has contractually agreed to waive its management fee and/or reimburse expenses so that total annual operating expenses (excluding (i) interest; (ii) taxes; (iii) brokerage fees and commissions; (iv) other extraordinary expenses not incurred in the ordinary course of the Fund’s business; (v) dividend expenses on short sales; (vi) expenses incurred under a Rule 12b-1 plan of distribution; and (vii) indirect expenses such as acquired fund fees and expenses) do not exceed 1.75% of the Fund’s average daily net assets through December 29, 2017. This expense cap agreement may be terminated by the Board of Trustees at any time. Additional information pertaining to the Fund’s expense ratios as of August 31, 2017, can be found in the financial highlights.
The Fund’s investment objectives, strategies, risks, charges and expenses must be considered carefully before investing. The prospectus contains this and other important information about the Fund and may be obtained by calling (844) 838-2119. Please read it carefully before investing.
The Fund is distributed by Unified Financial Securities, LLC, member FINRA/SIPC.
2
Investment Results (Unaudited) (continued)
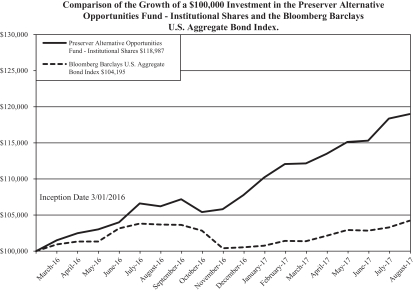
The chart above assumes an initial investment of $100,000 made on March 1, 2016 (commencement of operations) and held through August 31, 2017. THE FUND’S RETURNS REPRESENT PAST PERFORMANCE AND DO NOT GUARANTEE FUTURE RESULTS. The returns shown do not reflect deduction of taxes that a shareholder would pay on the Fund’s distributions or the redemption of the Fund’s shares. Investment returns and principal values will fluctuate so that your shares, when redeemed, may be worth more or less than their original purchase price.
Current performance may be lower or higher than the performance data quoted. For more information on the Fund, and to obtain performance data current to the most recent month-end, or to request a prospectus, please call (844) 838-2119. You should carefully consider the investment objectives, potential risks, management fees, and charges and expenses of the Fund before investing. The Fund’s prospectus contains this and other information about the Fund, and should be read carefully before investing.
The Fund is distributed by Unified Financial Securities, LLC, Member FINRA/SIPC.
3
Portfolio Illustration (Unaudited)
August 31, 2017
The following chart gives a visual breakdown of the Fund’s holdings as a percentage of the fair value of portfolio investments.
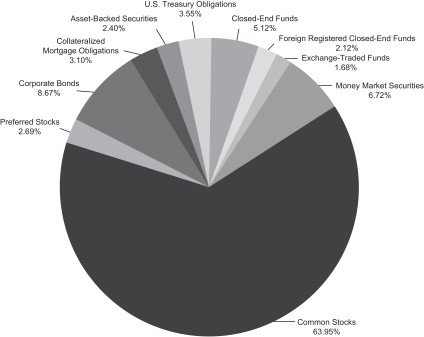
Availability of Portfolio Schedule (Unaudited)
The Fund files its complete schedule of portfolio holdings with the Securities and Exchange Commission (“SEC”) for the first and third quarters of each fiscal year on Form N-Q. The Fund’s Forms N-Q are available at the SEC’s website at www.sec.gov. The Fund’s Forms N-Q may be reviewed and copied at the Public Reference Room in Washington DC. Information on the operation of the Public Reference Room may be obtained by calling 1-800-SEC-0330.
4
Preserver Alternative Opportunities Fund
Schedule of Investments
August 31, 2017
| | | | | | | | |
| Shares | | | | | Fair Value | |
| | COMMON STOCKS – 63.97% | |
| | |
| | | | Australia – 2.10% | | | | |
| | | | Consumer Discretionary – 1.11% | | | | |
| | 12,000 | | | Aristocrat Leisure Ltd. | | $ | 201,940 | |
| | | | | | | | |
| | |
| | | | Industrials – 0.99% | | | | |
| | 30,716 | | | Sydney Airport | | | 180,682 | |
| | | | | | | | |
| | | | | | | 382,622 | |
| | | | | | | | |
| | | | Canada – 2.24% | | | | |
| | | | Real Estate – 0.79% | | | | |
| | 16,226 | | | NorthWest Healthcare Properties Real Estate Investment Trust | | | 142,932 | |
| | | | | | | | |
| | |
| | | | Utilities – 1.45% | | | | |
| | 6,000 | | | Brookfield Infrastructure Partners LP | | | 264,780 | |
| | | | | | | | |
| | | | | | | 407,712 | |
| | | | | | | | |
| | | | Denmark – 1.05% | | | | |
| | | | Consumer Discretionary – 1.05% | | | | |
| | 1,800 | | | Pandora A/S | | | 191,324 | |
| | | | | | | | |
| | | | | | | 191,324 | |
| | | | | | | | |
| | | | France – 1.34% | | | | |
| | | | Industrials – 1.34% | | | | |
| | 2,200 | | | Thales SA | | | 243,571 | |
| | | | | | | | |
| | | | | | | 243,571 | |
| | | | | | | | |
| | | | Germany – 5.40% | | | | |
| | | | Consumer Discretionary – 0.98% | | | | |
| | 800 | | | adidas AG | | | 179,571 | |
| | | | | | | | |
| | |
| | | | Consumer Staples – 1.20% | | | | |
| | 1,800 | | | Henkel AG & Co. KGaA | | | 217,929 | |
| | | | | | | | |
| | |
| | | | Financials – 0.59% | | | | |
| | 1,800 | | | AURELIUS SE & Co. KGaA | | | 106,779 | |
| | | | | | | | |
| | |
| | | | Materials – 1.23% | | | | |
| | 3,000 | | | LANXESS AG | | | 223,750 | |
| | | | | | | | |
| | |
| | | | Real Estate – 1.40% | | | | |
| | 6,000 | | | Deutsche Wohnen SE | | | 254,857 | |
| | | | | | | | |
| | | | | | | 982,886 | |
| | | | | | | | |
| | | | Israel – 1.52% | | | | |
| | | | Industrials – 1.52% | | | | |
| | 2,000 | | | Elbit Systems Ltd. | | | 276,380 | |
| | | | | | | | |
| | | | | | | 276,380 | |
| | | | | | | | |
See accompanying notes which are an integral part of these financial statements.
5
Preserver Alternative Opportunities Fund
Schedule of Investments (continued)
August 31, 2017
| | | | | | | | |
| Shares | | | | | Fair Value | |
| | COMMON STOCKS – (continued) | |
| | |
| | | | Japan – 7.07% | | | | |
| | | | Consumer Discretionary – 3.28% | | | | |
| | 7,200 | | | McDonald’s Holdings Co. Japan Ltd. | | $ | 319,920 | |
| | 7,000 | | | Sony Corp. ADR | | | 277,410 | |
| | | | | | | | |
| | | | | | | 597,330 | |
| | | | | | | | |
| | |
| | | | Consumer Staples – 1.12% | | | | |
| | 6,000 | | | Calbee, Inc. | | | 205,203 | |
| | | | | | | | |
| | |
| | | | Information Technology – 2.67% | | | | |
| | 10,000 | | �� | Amano Corp. | | | 234,037 | |
| | 9,500 | | | Nippon Ceramic Co. Ltd. | | | 252,060 | |
| | | | | | | | |
| | | | | | | 486,097 | |
| | | | | | | | |
| | | | | | | 1,288,630 | |
| | | | | | | | |
| | | | Switzerland – 1.28% | | | | |
| | | | Financials – 1.28% | | | | |
| | 1,650 | | | Chubb Ltd. | | | 233,343 | |
| | | | | | | | |
| | | | | | | 233,343 | |
| | | | | | | | |
| | | | United Kingdom – 8.33% | | | | |
| | | | Financials – 5.33% | | | | |
| | 45,000 | | | Burford Capital Ltd. | | | 673,344 | |
| | 2,000 | | | Willis Towers Watson PLC | | | 296,940 | |
| | | | | | | | |
| | | | | | | 970,284 | |
| | | | | | | | |
| | |
| | | | Health Care – 1.51% | | | | |
| | 20,000 | | | Abcam PLC | | | 275,209 | |
| | | | | | | | |
| | |
| | | | Information Technology – 1.49% | | | | |
| | 30,000 | | | Smart Metering Systems PLC | | | 271,976 | |
| | | | | | | | |
| | | | | | | 1,517,469 | |
| | | | | | | | |
| | | | United States – 33.64% | | | | |
| | | | Consumer Discretionary – 4.04% | | | | |
| | 7,000 | | | Liberty Media Corp.-Liberty Formula One, Class C* | | | 275,100 | |
| | 2,000 | | | Marriott International, Inc., Class A | | | 207,160 | |
| | 1,000 | | | Mohawk Industries, Inc.* | | | 253,120 | |
| | | | | | | | |
| | | | | | | 735,380 | |
| | | | | | | | |
| | |
| | | | Energy – 2.97% | | | | |
| | 9,000 | | | Enterprise Products Partners LP(a)(b) | | | 234,630 | |
| | 4,000 | | | EQT Midstream Partners LP(a) | | | 305,480 | |
| | | | | | | | |
| | | | | | | 540,110 | |
| | | | | | | | |
See accompanying notes which are an integral part of these financial statements.
6
Preserver Alternative Opportunities Fund
Schedule of Investments (continued)
August 31, 2017
| | | | | | | | |
| Shares | | | | | Fair Value | |
| | COMMON STOCKS – (continued) | |
| | |
| | | | Financials – 8.63% | | | | |
| | 2,000 | | | Berkshire Hathaway, Inc., Class B(b)* | | $ | 362,320 | |
| | 600 | | | BlackRock, Inc. | | | 251,406 | |
| | 8,000 | | | Blackstone Group LP/The(a) | | | 261,840 | |
| | 2,500 | | | First Republic Bank | | | 242,625 | |
| | 15,000 | | | Great Ajax Corp. | | | 212,700 | |
| | 5,000 | | | Western Alliance Bancorp.* | | | 241,150 | |
| | | | | | | | |
| | | | | | | 1,572,041 | |
| | | | | | | | |
| | | | Health Care – 3.91% | | | | |
| | 2,000 | | | Laboratory Corp. of America Holdings* | | | 313,740 | |
| | 2,000 | | | UnitedHealth Group, Inc. | | | 397,800 | |
| | | | | | | | |
| | | | | | | 711,540 | |
| | | | | | | | |
| | | | Industrials – 4.96% | | | | |
| | 4,000 | | | AMETEK, Inc. | | | 253,000 | |
| | 2,000 | | | FedEx Corp. | | | 428,760 | |
| | 13,000 | | | Fortress Transportation & Infrastructure Investors LLC | | | 221,650 | |
| | | | | | | | |
| | | | | | | 903,410 | |
| | | | | | | | |
| | | | Information Technology – 1.70% | | | | |
| | 2,000 | | | Adobe Systems, Inc.* | | | 310,320 | |
| | | | | | | | |
| | |
| | | | Materials – 1.48% | | | | |
| | 2,300 | | | Monsanto Co. | | | 269,560 | |
| | | | | | | | |
| | |
| | | | Real Estate – 4.81% | | | | |
| | 2,500 | | | Digital Realty Trust, Inc. | | | 295,850 | |
| | 12,240 | | | Landmark Infrastructure Partners LP(a) | | | 202,572 | |
| | 3,000 | | | Prologis, Inc. | | | 190,080 | |
| | 1,200 | | | Simon Property Group, Inc. | | | 188,220 | |
| | | | | | | | |
| | | | | | | 876,722 | |
| | | | | | | | |
| | |
| | | | Utilities – 1.14% | | | | |
| | 7,000 | | | CenterPoint Energy, Inc. | | | 207,340 | |
| | | | | | | | |
| | | | | | | 6,126,423 | |
| | | | | | | | |
| | | | Total Common Stocks (Cost $9,894,160) | | | 11,650,360 | |
| | | | | | | | |
|
| | PREFERRED STOCKS – 2.68% | |
| | |
| | | | United States – 2.68% | | | | |
| | | | Energy – 1.15% | | | | |
| | 5,000 | | | Kinder Morgan, Inc., Series A, 9.75% | | | 210,850 | |
| | | | | | | | |
| | |
| | | | Industrials – 0.98% | | | | |
| | 3,000 | | | Stericycle, Inc., 5.25% | | | 178,320 | |
| | | | | | | | |
| | |
| | | | Real Estate – 0.55% | | | | |
| | 4,000 | | | Invesco Mortgage Capital, Inc., Series A, 7.75% | | | 100,400 | |
| | | | | | | | |
| | | | Total Preferred Stocks (Cost $537,154) | | | 489,570 | |
| | | | | | | | |
See accompanying notes which are an integral part of these financial statements.
7
Preserver Alternative Opportunities Fund
Schedule of Investments (continued)
August 31, 2017
| | | | | | | | |
Principal
Amount | | | | | Fair Value | |
| | CORPORATE BONDS – 8.67% | |
| | |
| | | | United States – 8.67% | | | | |
| | | | Consumer Discretionary – 1.95% | | | | |
| $ | 120,000 | | | International Game Technology PLC, 5.35%, 10/15/23 | | $ | 124,200 | |
| | 110,000 | | | Ruby Tuesday, Inc., 7.63%, 5/15/20 | | | 110,000 | |
| | 120,000 | | | Scientific Games International, Inc., 6.25%, 9/1/20 | | | 121,200 | |
| | | | | | | | |
| | | | | | | 355,400 | |
| | | | | | | | |
| | | | Energy – 0.56% | | | | |
| | 100,000 | | | Genesis Energy LP, 6.75%, 8/1/22 | | | 101,750 | |
| | | | | | | | |
| | |
| | | | Financials – 1.14% | | | | |
| | 200,000 | | | Stifel Financial Corp., 4.25%, 7/18/24 | | | 206,632 | |
| | | | | | | | |
| | |
| | | | Health Care – 1.25% | | | | |
| | 130,000 | | | CHS/Community Health Systems, Inc., 7.13%, 7/15/20 | | | 122,769 | |
| | 100,000 | | | Tenet Healthcare Corp., 8.13%, 4/1/22 | | | 105,250 | |
| | | | | | | | |
| | | �� | | | | 228,019 | |
| | | | | | | | |
| | |
| | | | Industrials – 2.13% | | | | |
| | 120,000 | | | Atlas Air Worldwide Holdings, Inc., 2.25%, 6/1/22 | | | 142,350 | |
| | 100,000 | | | Timken Co./The, 3.88%, 9/1/24 | | | 102,382 | |
| | 150,000 | | | Triumph Group, Inc., 5.25%, 6/1/22 | | | 143,625 | |
| | | | | | | | |
| | | | | | | 388,357 | |
| | | | | | | | |
| | |
| | | | Materials – 0.56% | | | | |
| | 100,000 | | | United States Steel Corp., 7.00%, 2/1/18 | | | 102,025 | |
| | | | | | | | |
| | |
| | | | Real Estate – 0.58% | | | | |
| | 100,000 | | | Senior Housing Properties Trust, 4.75%, 5/1/24 | | | 105,737 | |
| | | | | | | | |
| | |
| | | | Utilities – 0.50% | | | | |
| | 100,000 | | | Ferrellgas Partners LP, 8.63%, 6/15/20 | | | 91,000 | |
| | | | | | | | |
| | | | Total Corporate Bonds (Cost $1,483,575) | | | 1,578,920 | |
| | | | | | | | |
|
| | COLLATERALIZED MORTGAGE OBLIGATIONS – 3.09% | |
| | 92,849 | | | Banc of America Mortgage Securities, Inc., Series 2004-K, Class B3, 3.69%, 12/25/34(c) | | | 89,300 | |
| | 55,492 | | | Countrywide Alternative Loan Trust, Series 2003-J2, Class A1, 6.00%, 10/25/33 | | | 57,842 | |
| | 72,387 | | | Countrywide Home Loans Mortgage Pass Through Trust, Series 2004-HYB9, Class 1A1, 3.35%, 2/20/35(c) | | | 73,237 | |
| | 28,317 | | | GSR Mortgage Loan Trust, Series 2005-5F, Class 8A3, 1.73%, 6/25/35(c) | | | 27,057 | |
| | 134,746 | | | HarborView Mortgage Loan Trust, Series 2004-07, Class 2A1, 3.07%, 11/19/34(c) | | | 133,467 | |
| | 189,499 | | | Impac CMB Trust, Series 2005-08, Class 2B, 3.48%, 2/25/36(c) | | | 183,190 | |
| | | | | | | | |
| | | | Total Collateralized Mortgage Obligations (Cost $537,275) | | | 564,093 | |
| | | | | | | | |
See accompanying notes which are an integral part of these financial statements.
8
Preserver Alternative Opportunities Fund
Schedule of Investments (continued)
August 31, 2017
| | | | | | | | |
Principal
Amount | | | | | Fair Value | |
| | ASSET-BACKED SECURITIES – 2.40% | |
| $ | 141,489 | | | American Airlines, Inc. Pass Through Trust, Series 2013-2, Class B, 5.60%, 7/15/20(d) | | $ | 148,386 | |
| | 289,497 | | | Residential Asset Mortgage Products, Inc., Series 2001-RS2, 2.66%, 6/25/31(c) | | | 288,914 | |
| | | | | | | | |
| | | | Total Asset-Backed Securities (Cost $407,158) | | | 437,300 | |
| | | | | | | | |
| |
| | U.S. TREASURY OBLIGATIONS — 3.55% | | | | |
| | 200,000 | | | United States Treasury Inflation Indexed Bonds, 0.38%, 7/15/25(e) | | | 208,420 | |
| | 200,000 | | | United States Treasury Note, 1.13%, 2/28/21 | | | 197,285 | |
| | 250,000 | | | United States Treasury Note, 1.63%, 2/15/26 | | | 241,489 | |
| | | | | | | | |
| | | | Total U.S. Treasury Obligations (Cost $651,591) | | | 647,194 | |
| | | | | | | | |
| | |
Shares | | | | | | |
| | CLOSED-END FUNDS — 5.12% | | | | |
| | 10,000 | | | Eaton Vance Limited Duration Income Fund | | | 139,400 | |
| | 13,000 | | | Pioneer Diversified High Income Trust | | | 213,200 | |
| | 17,500 | | | Pioneer Municipal High Income Advantage Trust | | | 205,100 | |
| | 13,000 | | | Western Asset Emerging Markets Debt Fund, Inc. | | | 203,190 | |
| | 17,000 | | | Western Asset Global High Income Fund, Inc. | | | 172,380 | |
| | | | | | | | |
| | | | Total Closed-End Funds (Cost $877,026) | | | 933,270 | |
| | | | | | | | |
| |
| | FOREIGN REGISTERED CLOSED-END FUNDS — 2.12% | | | | |
| | 12,000 | | | Third Point Offshore Investors Ltd. | | | 193,980 | |
| | 49,265 | | | VinaCapital Vietnam Opportunity Fund Ltd. | | | 192,812 | |
| | | | | | | | |
| | | | Total Foreign Registered Closed-End Funds (Cost $346,346) | | | 386,792 | |
| | | | | | | | |
| |
| | EXCHANGE-TRADED FUNDS — 1.68% | | | | |
| | 6,000 | | | SPDR Bloomberg Barclays Convertible Securities ETF | | | 306,120 | |
| | | | | | | | |
| | | | Total Exchange-Traded Funds (Cost $282,513) | | | 306,120 | |
| | | | | | | | |
| |
| | MONEY MARKET SECURITIES — 6.72% | | | | |
| | 1,223,602 | | | Fidelity Investments Money Market Government Portfolio, Class I, 0.89%(f) | | | 1,223,602 | |
| | | | | | | | |
| | | | Total Money Market Securities (Cost $1,223,602) | | | 1,223,602 | |
| | | | | | | | |
| | |
| | | | Total Investments – 100.04% (Cost $16,240,400) | | $ | 18,217,221 | |
| | | | | | | | |
| | |
| | | | Liabilities in Excess of Other Assets – (0.04)% | | | (7,624 | ) |
| | | | | | | | |
| | |
| | | | NET ASSETS – 100.00% | | $ | 18,209,597 | |
| | | | | | | | |
See accompanying notes which are an integral part of these financial statements.
9
Preserver Alternative Opportunities Fund
Schedule of Investments (continued)
August 31, 2017
| (a) | | Master Limited Partnership |
| (b) | | All or a portion of the security is held as collateral for unsettled security transactions. |
| (c) | | Variable or Floating Rate Security. Rate fluctuations may be based on index changes, prepayment or underlying positions and/or other variables. Rate presented is as of August 31, 2017. |
| (d) | | Security exempt from registration under Rule 144A or Section 4(2) of the Securities Act of 1933. The security may be resold in transactions exempt from registration, normally to qualified institutional buyers. |
| (e) | | Principal amount of security is adjusted periodically based on changes in the Consumer Price Index. |
| (f) | | Rate disclosed is the seven day effective yield as of August 31, 2017. |
| * | | Non-income producing security. |
| ADR | | – American Depositary Receipt |
The sectors shown on the schedule of investments are based on the Global Industry Classification Standard, or GICS® (“GICS”). The GICS was developed by and/or is the exclusive property of MSCI, Inc. and Standard & Poor’s Financial Services LLC (“S&P”). GICS is a service mark of MSCI, Inc. and S&P and has been licensed for use by the Administrator.
See accompanying notes which are an integral part of these financial statements.
10
Preserver Alternative Opportunities Fund
Statement of Assets and Liabilities
August 31, 2017
| | | | |
Assets | | | | |
Investments in securities at fair value (cost $16,240,400) | | $ | 18,217,221 | |
Receivable for fund shares sold | | | 100 | |
Dividends and interest receivable | | | 44,533 | |
Tax reclaims receivable | | | 4,219 | |
Prepaid expenses | | | 7,153 | |
Total Assets | | | 18,273,226 | |
Liabilities | | | | |
Payable for fund shares redeemed | | | 12,145 | |
Payable to Adviser | | | 10,921 | |
Payable to Administrator | | | 7,167 | |
Accrued 12b-1 fees – Retail class | | | 882 | |
Payable to auditors | | | 20,500 | |
Other accrued expenses | | | 12,014 | |
Total Liabilities | | | 63,629 | |
Net Assets | | $ | 18,209,597 | |
Net Assets consist of: | | | | |
Paid-in capital | | $ | 16,113,836 | |
Accumulated undistributed net investment loss | | | (17,172 | ) |
Accumulated undistributed net realized gain from investments | | | 135,866 | |
Net unrealized appreciation on investments | | | 1,977,067 | |
Net Assets | | $ | 18,209,597 | |
Institutional Shares: | | | | |
Net Assets | | $ | 16,022,208 | |
Shares outstanding | | | 1,375,391 | |
Net asset value (“NAV”), offering and redemption price per share(a) | | $ | 11.65 | |
Retail Shares: | | | | |
Net Assets | | $ | 2,187,389 | |
Shares outstanding | | | 188,162 | |
Net asset value (“NAV”), offering and redemption price per share(a) | | $ | 11.63 | |
| (a) | | A 2.00% redemption fee is imposed upon shares redeemed within 60 calendar days of their purchase. |
11
See accompanying notes which are an integral part of these financial statements.
Preserver Alternative Opportunities Fund
Statement of Operations
For the year ended August 31, 2017
| | | | |
Investment Income | | | | |
Dividend income (net of foreign taxes withheld of $8,964) | | $ | 328,473 | |
Interest income | | | 164,823 | |
Total investment income | | | 493,296 | |
Expenses | | | | |
Investment Adviser | | | 109,653 | |
Administration | | | 28,501 | |
Fund accounting | | | 22,500 | |
Audit | | | 20,762 | |
Registration | | | 16,895 | |
Printing | | | 16,250 | |
Transfer agent | | | 14,749 | |
Pricing | | | 13,194 | |
Offering | | | 10,332 | |
Legal | | | 9,162 | |
Trustee | | | 6,967 | |
Custodian | | | 6,829 | |
12b-1 fees – Retail Shares | | | 4,436 | |
Miscellaneous | | | 20,604 | |
Total expenses | | | 300,834 | |
Fees contractually waived by Adviser | | | (40,278 | ) |
Net operating expenses | | | 260,556 | |
Net investment income | | | 232,740 | |
Net Realized and Change in Unrealized Gain (Loss) on Investments | | | | |
Long-term capital gain dividends from investment companies | | | 2,063 | |
Net realized gain on investment securities transactions | | | 126,031 | |
Net realized loss on foreign currency translations | | | (28,926 | ) |
Net change in unrealized appreciation of investment securities and foreign currency translations | | | 1,405,573 | |
Net realized and change in unrealized gain on investments | | | 1,504,741 | |
Net increase in net assets resulting from operations | | $ | 1,737,481 | |
12
See accompanying notes which are an integral part of these financial statements.
Preserver Alternative Opportunities Fund
Statements of Changes in Net Assets
| | | | | | | | |
| | | For the Year Ended
August 31, 2017 | | | For the Period Ended
August 31, 2016(a) | |
Increase (Decrease) in Net Assets due to: Operations | | | | | | | | |
Net investment income | | $ | 232,740 | | | $ | 73,829 | |
Long-term capital gain dividends from investment companies | | | 2,063 | | | | — | |
Net realized gain (loss) on investment securities transactions and foreign currency translations | | | 97,105 | | | | (10,611 | ) |
Net change in unrealized appreciation of investment securities and foreign currency translations | | | 1,405,573 | | | | 571,494 | |
Net increase in net assets resulting from operations | | | 1,737,481 | | | | 634,712 | |
Distributions From: | | | | | | | | |
Net investment income: | | | | | | | | |
Institutional Shares | | | (239,216 | ) | | | — | |
Retail Shares | | | (28,812 | ) | | | — | |
Net realized gains: | | | | | | | | |
Institutional Shares | | | (7,459 | ) | | | — | |
Retail Shares | | | (995 | ) | | | — | |
Total distributions | | | (276,482 | ) | | | — | |
Capital Transactions – Institutional Shares | | | | | | | | |
Proceeds from shares sold | | | 5,835,841 | | | | 9,304,557 | |
Reinvestment of distributions | | | 244,577 | | | | — | |
Amount paid for shares redeemed | | | (1,014,138 | ) | | | (197,744 | ) |
Proceeds from redemption fees(b) | | | 72 | | | | — | |
Total Institutional Shares | | | 5,066,352 | | | | 9,106,813 | |
Capital Transactions – Retail Shares | | | | | | | | |
Proceeds from shares sold | | | 882,175 | | | | 1,687,743 | |
Reinvestment of distributions | | | 29,807 | | | | — | |
Amount paid for shares redeemed | | | (630,505 | ) | | | (28,531 | ) |
Proceeds from redemption fees(b) | | | 32 | | | | — | |
Total Retail Shares | | | 281,509 | | | | 1,659,212 | |
Net increase in net assets resulting from capital transactions | | | 5,347,861 | | | | 10,766,025 | |
Total Increase in Net Assets | | | 6,808,860 | | | | 11,400,737 | |
Net Assets | | | | | | | | |
Beginning of period | | | 11,400,737 | | | | — | |
End of period | | $ | 18,209,597 | | | $ | 11,400,737 | |
Accumulated undistributed net investment income (loss) included in net assets at end of period | | $ | (17,172 | ) | | $ | 54,410 | |
Share Transactions – Institutional Shares | | | | | | | | |
Shares sold | | | 535,360 | | | | 928,043 | |
Shares issued in reinvestment of distributions | | | 23,205 | | | | — | |
Shares redeemed | | | (92,631 | ) | | | (18,586 | ) |
Total Institutional Shares | | | 465,934 | | | | 909,457 | |
Share Transactions – Retail Shares | | | | | | | | |
Shares sold | | | 80,710 | | | | 167,001 | |
Shares issued in reinvestment of distributions | | | 2,828 | | | | — | |
Shares redeemed | | | (59,689 | ) | | | (2,688 | ) |
Total Retail Shares | | | 23,849 | | | | 164,313 | |
| (a) | | For the period March 1, 2016 (commencement of operations) through August 31, 2016. |
| (b) | | A 2.00% redemption fee is imposed upon shares redeemed within 60 calendar days of their purchase. |
13
See accompanying notes which are an integral part of these financial statements.
Preserver Alternative Opportunities Fund - Institutional Shares
Financial Highlights
Selected data for a share outstanding throughout each period.
| | | | | | | | |
| | | For the
year ended
August 31, 2017 | | | For the
period ended
August 31, 2016(a) | |
Net asset value, at beginning of period | | | $10.62 | | | | $10.00 | |
| | | | | | | | |
| | |
Income from investment operations: | | | | | | | | |
| | |
Net investment income | | | 0.18 | | | | 0.07 | |
| | |
Net realized and unrealized gain on investments | | | 1.08 | | | | 0.55 | |
| | | | | | | | |
| | |
Total from investment operations | | | 1.26 | | | | 0.62 | |
| | | | | | | | |
| | |
Distributions from: | | | | | | | | |
| | |
Net investment income | | | (0.22 | ) | | | — | |
| | |
Net realized gain | | | (0.01 | ) | | | — | |
| | | | | | | | |
| | |
Total from distributions | | | (0.23 | ) | | | — | |
| | | | | | | | |
| | |
Net asset value, at end of period | | | $11.65 | | | | $10.62 | |
| | | | | | | | |
| | |
Total Return(b) | | | 12.04 | % | | | 6.20 | %(c) |
| | | | | | | | |
Ratios/Supplemental Data: | |
| | |
Net assets at end of period (thousands) | | | $16,022 | | | | $9,659 | |
| | |
Before waiver: | | | | | | | | |
| | |
Ratio of expenses to average net assets | | | 2.02 | % | | | 2.92 | %(d) |
| | |
After waiver: | | | | | | | | |
| | |
Ratio of expenses to average net assets | | | 1.75 | % | | | 1.75 | %(d) |
| | |
Ratio of net investment income to average net assets | | | 1.62 | % | | | 1.44 | %(d) |
| | |
Portfolio turnover(e) | | | 72 | % | | | 20 | %(c) |
| (a) | | For the period March 1, 2016 (commencement of operations) through August 31, 2016. |
| (b) | | Total return in the above table represents the rate that the investor would have earned or lost on an investment in the Fund, assuming reinvestment of distributions. Excludes redemption fee. |
| (e) | | Portfolio turnover is calculated on the basis on the Fund as a whole without distinguishing among the classes of shares. |
14
See accompanying notes which are an integral part of these financial statements.
Preserver Alternative Opportunities Fund - Retail Shares
Financial Highlights
Selected data for a share outstanding throughout each period.
| | | | | | | | |
| | | For the
year ended
August 31, 2017 | | | For the
period ended
August 31, 2016(a) | |
Net asset value, at beginning of period | | | $10.60 | | | | $10.00 | |
| | | | | | | | |
| | |
Income from investment operations: | | | | | | | | |
| | |
Net investment income | | | 0.17 | | | | 0.05 | |
| | |
Net realized and unrealized gain on investments | | | 1.07 | | | | 0.55 | |
| | | | | | | | |
| | |
Total from investment operations | | | 1.24 | | | | 0.60 | |
| | | | | | | | |
| | |
Distributions from: | | | | | | | | |
| | |
Net investment income | | | (0.20 | ) | | | — | |
| | |
Net realized gain | | | (0.01 | ) | | | — | |
| | | | | | | | |
| | |
Total from distributions | | | (0.21 | ) | | | — | |
| | | | | | | | |
| | |
Net asset value, at end of period | | | $11.63 | | | | $10.60 | |
| | | | | | | | |
| | |
Total Return(b) | | | 11.84 | % | | | 6.00 | %(c) |
| | | | | | | | |
Ratios/Supplemental Data: | |
| | |
Net assets at end of period (thousands) | | | $2,187 | | | | $1,742 | |
| | |
Before waiver: | | | | | | | | |
| | |
Ratio of expenses to average net assets | | | 2.27 | % | | | 3.17 | %(d) |
| | |
After waiver: | | | | | | | | |
| | |
Ratio of expenses to average net assets | | | 2.00 | % | | | 2.00 | %(d) |
| | |
Ratio of net investment income to average net assets | | | 1.38 | % | | | 1.19 | %(d) |
| | |
Portfolio turnover(e) | | | 72 | % | | | 20 | %(c) |
| (a) | | For the period March 1, 2016 (commencement of operations) through August 31, 2016. |
| (b) | | Total return in the above table represents the rate that the investor would have earned or lost on an investment in the Fund, assuming reinvestment of distributions. Excludes redemption fee. |
| (e) | | Portfolio turnover is calculated on the basis on the Fund as a whole without distinguishing among the classes of shares. |
15
See accompanying notes which are an integral part of these financial statements.
Preserver Alternative Opportunities Fund
Notes to the Financial Statements
August 31, 2017
NOTE 1. ORGANIZATION
The Preserver Alternative Opportunities Fund (the “Fund”) was organized as a diversified series of Capitol Series Trust (the “Trust”) on September 16, 2015. The Trust is an open-end investment company established under the laws of Ohio by an Agreement and Declaration of Trust dated September 18, 2013 (the “Trust Agreement”). The Trust Agreement permits the Board of Trustees of the Trust (the “Board”) to issue an unlimited number of shares of beneficial interest of separate series without par value. The Fund is one of a series of funds currently authorized by the Board. The Fund’s investment adviser is PreserverPartners, LLC (the “Adviser”). The investment objective of the Fund is to seek current income and capital appreciation with low volatility compared to the major equity and fixed income markets.
The Fund currently offers two classes of shares, Institutional Shares and Retail Shares. The Fund commenced operations on March 1, 2016. Each share represents an equal proportionate interest in the assets and liabilities belonging to the Fund and is entitled to such dividends and distributions out of income belonging to the Fund as are declared by the Board. Both share classes impose a 2.00% redemption fee on shares redeemed within 60 days of purchase.
NOTE 2. SIGNIFICANT ACCOUNTING POLICIES
The Fund is an investment company and follows accounting and reporting guidance under Financial Accounting Standards Board Accounting Standards Codification (“ASC”) Topic 946, “Financial Services-Investment Companies”. The following is a summary of significant accounting policies followed by the Fund in the preparation of its financial statements. These policies are in conformity with generally accepted accounting principles in the United States of America (“GAAP”).
Estimates – The preparation of financial statements in conformity with GAAP requires management to make estimates and assumptions that affect the reported amounts of assets and liabilities and disclosure of contingent assets and liabilities at the date of the financial statements and the reported amounts of increases and decreases in net assets from operations during the reporting period. Actual results could differ from those estimates.
Securities Valuation – All investments in securities are recorded at their estimated fair value as described in Note 3.
Foreign Currency Translation – The accounting records of the Fund are maintained in U.S. dollars. Foreign currency amounts are translated into U.S. dollars at the current rate of exchange each business day to determine the value of investments, and other assets and liabilities. Purchases and sales of foreign securities, and income and expenses, are translated at the prevailing rate of exchange on the respective date of these transactions. The Fund does not isolate that portion of the results of operations resulting from changes in foreign exchange rates on investments from fluctuation arising from changes in market prices of securities held. These fluctuations are included with the unrealized gain or loss from investments.
Federal Income Taxes – The Fund makes no provision for federal income tax or excise tax. The Fund has qualified and intends to qualify each year as a regulated investment company (“RIC”) under subchapter M of the Internal Revenue Code of 1986, as amended, by complying with the
16
Preserver Alternative Opportunities Fund
Notes to Financial Statements (continued)
August 31, 2017
requirements applicable to RICs and by distributing substantially all of its taxable income. The Fund also intends to distribute sufficient net investment income and net capital gains, if any, so that it will not be subject to excise tax on undistributed income and gains. If the required amount of net investment income or gains is not distributed, the Fund could incur a tax expense.
The Fund may be subject to taxes imposed by countries in which it invests. Such taxes are generally based on income and/or capital gains earned or repatriated. Taxes are accrued and applied to net investment income, net realized gains and unrealized appreciation as such income and/or gains are earned.
The Fund recognizes tax benefits or expenses of uncertain tax positions only when the position is “more likely than not” to be sustained assuming examination by tax authorities. Management of the Fund has reviewed tax positions taken in tax years that remain subject to examination by all major tax jurisdictions, including federal (i.e., the 2016 tax year end and the interim tax period since then, as applicable) and has concluded that no provision for unrecognized tax benefits or expenses is required in these financial statements and does not expect this to change over the next twelve months. The Fund recognizes interest and penalties, if any, related to unrecognized tax benefits as income tax expense in the Statement of Operations. During the year, the Fund did not incur any interest or penalties.
Expenses – Expenses incurred by the Trust that do not relate to a specific fund of the Trust are allocated to the individual funds based on each fund’s relative net assets or another appropriate basis (as determined by the Board). Expenses specifically attributable to any class are borne by that class. Income, realized gains and losses, unrealized appreciation and depreciation, and expenses are allocated to each class based on the net assets in relation to the relative net assets of the Fund.
Security Transactions and Related Income – Throughout the reporting period, security transactions are accounted for no later than one business day following the trade date. For financial reporting purposes, security transactions are accounted for on trade date on the last business day of the reporting period. The specific identification method is used for determining gains or losses for financial statements and income tax purposes. Dividend income is recorded on the ex-dividend date and interest income is recorded on an accrual basis. Dividend income from real estate investment trusts (REITs) and distributions from limited partnerships are recognized on the ex-date and included in dividend income. The calendar year-end classification of distributions received from REITs during the fiscal year are reported subsequent to year end; accordingly, the Fund estimates the character of REIT distributions based on the most recent information available. Income or loss from limited partnerships is reclassified among the components of net assets upon receipt of K-1’s. Discounts and premiums on fixed income securities purchased are amortized or accreted over the life of the respective securities using the effective interest method.
Dividends and Distributions – The Fund intends to distribute substantially all of its net investment income, if any, as dividends to its shareholders on a quarterly basis. The Fund intends to distribute its net realized long term capital gains and its net realized short term capital gains, if any, at least once a year. Distributions to shareholders are recorded on the ex-dividend date. The amount of dividends from net investment income and distributions from net realized gains are determined in accordance with federal income tax regulations, which may differ from GAAP. These
17
Preserver Alternative Opportunities Fund
Notes to Financial Statements (continued)
August 31, 2017
differences are caused primarily by differences in the timing of the recognition of certain components of income, expense or realized capital gains for federal income tax purposes. Where such differences are permanent in nature, they are reclassified in the components of net assets based on their ultimate characterization for federal income tax purposes. Any such reclassifications will have no effect on net assets, results of operations or net asset values per share of the Fund. For the fiscal year ended August 31, 2017, the Fund made the following reclassifications of net assets, which was due to foreign currency reclassifications and return of capital distributions from underlying securities:
| | | | | | | | |
Paid-in
Capital | | Accumulated
Undistributed
Net Investment
Income | | | Accumulated
Net Realized
Gain from
Investments | |
| $(50) | | $ | (36,294 | ) | | $ | 36,344 | |
NOTE 3. SECURITIES VALUATION AND FAIR VALUE MEASUREMENTS
Fair value is defined as the price that the Fund would receive upon selling an investment in an orderly transaction to an independent buyer in the principal or most advantageous market of the investment. GAAP establishes a three-tier hierarchy to maximize the use of observable market data and minimize the use of unobservable inputs and to establish classification of fair value measurements for disclosure purposes.
Inputs refer broadly to the assumptions that market participants would use in pricing the asset or liability. Inputs may be observable or unobservable. Observable inputs are inputs that reflect the assumptions market participants would use in pricing the asset or liability developed based on market data obtained from sources independent of the reporting entity. Unobservable inputs are inputs that reflect the reporting entity’s own assumptions about the assumptions market participants would use in pricing the asset or liability developed based on the best information available in the circumstances.
Various inputs are used in determining the value of the Fund’s investments. These inputs are summarized in the three broad levels listed below.
| | • | | Level 1 – unadjusted quoted prices in active markets for identical investments and/or registered investment companies where the value per share is determined and published and is the basis for current transactions for identical assets or liabilities at the valuation date |
| | • | | Level 2 – other significant observable inputs (including, but not limited to, quoted prices for an identical security in an inactive market, quoted prices for similar securities, interest rates, prepayment speeds, credit risk, etc.) |
| | • | | Level 3 – significant unobservable inputs (including the Fund’s own assumptions in determining fair value of investments based on the best information available) |
The inputs used to measure fair value may fall into different levels of the fair value hierarchy. In such cases, for disclosure purposes, the level in the fair value hierarchy within which the fair value measurement falls in its entirety is determined based on the lowest level input that is significant to the fair value measurement in its entirety.
18
Preserver Alternative Opportunities Fund
Notes to Financial Statements (continued)
August 31, 2017
In computing the net asset value (“NAV”) of the Fund, fair value is based on market valuations with respect to portfolio securities for which market quotations are readily available. Pursuant to Board approved policies, the Fund relies on independent third-party pricing services to provide the current market value of securities. Those pricing services value equity securities, including exchange-traded funds and preferred stocks, traded on a securities exchange at the last reported sales price on the principal exchange. Equity securities quoted by NASDAQ are valued at the NASDAQ Official Closing Price. If there is no reported sale on the principal exchange, equity securities are valued at the mean between the most recent quoted bid and asked price. When using the market quotations or close prices provided by the pricing service and when the market is considered active, the security will be classified as a Level 1 security.
Sometimes, an equity security owned by the Fund will be valued by the pricing service with factors other than market quotations or when the market is considered inactive. When this happens, the security may be classified as a Level 2 security. When market quotations are not readily available, when the Fund determines that the market quotation or the price provided by the pricing service does not accurately reflect the current fair value, or when certain restricted or illiquid securities are being valued, such securities are valued as determined in good faith by the Adviser, in conformity with guidelines adopted by and subject to review by the Board. These securities are generally categorized as Level 3 securities.
Investments in open-end mutual funds, including money market mutual funds, are generally priced at the ending NAV provided by the service agent of the funds. These securities are categorized as Level 1 securities.
Debt securities are valued using evaluated prices furnished by a pricing vendor selected by the Board. If the Adviser decides that a price provided by the pricing service does not accurately reflect the fair value of the securities or when prices are not readily available from a pricing service, securities are valued at fair value as determined by the Adviser, in conformity with guidelines adopted by and subject to review of the Board. These valuations are typically categorized as Level 2 or Level 3 in the fair value hierarchy, depending on the inputs used.
In accordance with the Trust’s valuation procedures, the Adviser is required to consider all appropriate factors relevant to the value of securities for which it has determined other pricing sources are not available or reliable as described above. No single standard exists for determining fair value, because fair value depends upon the circumstances of each individual case. As a general principle, the current fair value of an issue of securities being valued by the Adviser would be the amount that the Fund might reasonably expect to receive for them upon their current sale. Methods which are in accordance with this principle may, for example, be based on (i) a multiple of earnings; (ii) a discount from market prices of a similar freely traded security (including a derivative security or a basket of securities traded on other markets, exchanges or among dealers); or (iii) yield to maturity with respect to debt issues, or a combination of these and other methods. Fair value pricing is permitted if, in the Adviser’s opinion, the validity of market quotations appears to be questionable based on factors such as evidence of a thin market in the security based on a small number of quotations, a significant event occurs after the close of a market but before the Fund’s NAV calculation that may affect a security’s value, or the Adviser is aware of any other data that calls into question the reliability of market quotations.
19
Preserver Alternative Opportunities Fund
Notes to Financial Statements (continued)
August 31, 2017
The following is a summary of the inputs used to value the Fund’s investments as of August 31, 2017:
| | | | | | | | | | | | | | | | |
| | | Valuation Inputs | | | | |
| Asset Category | | Level 1 | | | Level 2 | | | Level 3 | | | Total | |
Common Stocks | | $ | 11,650,360 | | | $ | – | | | $ | – | | | $ | 11,650,360 | |
Preferred Stocks | | | 489,570 | | | | – | | | | – | | | | 489,570 | |
Corporate Bonds | | | – | | | | 1,578,920 | | | | – | | | | 1,578,920 | |
Collateralized Mortgage Obligations | | | – | | | | 564,093 | | | | – | | | | 564,093 | |
Asset-Backed Securities | | | – | | | | 437,300 | | | | – | | | | 437,300 | |
U.S. Treasury Obligations | | | – | | | | 647,194 | | | | – | | | | 647,194 | |
Closed-End Funds | | | 933,270 | | | | – | | | | – | | | | 933,270 | |
Foreign Registered Closed-End Funds | | | 386,792 | | | | – | | | | – | | | | 386,792 | |
Exchange-Traded Funds | | | 306,120 | | | | – | | | | – | | | | 306,120 | |
Money Market Securities | | | 1,223,602 | | | | – | | | | – | | | | 1,223,602 | |
Total | | $ | 14,989,714 | | | $ | 3,227,507 | | | $ | – | | | $ | 18,217,221 | |
The Fund did not hold any investments during the reporting period for which significant unobservable inputs (Level 3) were used in determining fair value; therefore, no reconciliation of Level 3 securities is included for this reporting period. The Fund did not hold any derivative instruments during the reporting period.
The Trust recognizes transfers between fair value hierarchy levels at the end of the reporting period. There were no transfers between any levels as of August 31, 2017 based on input levels assigned at August 31, 2016.
NOTE 4. FEES AND OTHER TRANSACTIONS WITH AFFILIATES AND OTHER SERVICE PROVIDERS
Under the terms of the investment advisory agreement (the “Agreement”), the Adviser manages the Fund’s investments subject to approval of the Board. As compensation for its management services, the Fund is obligated to pay the Adviser a fee computed and accrued daily and paid monthly at an annual rate of 0.75% of the Fund’s average daily net assets. For the fiscal year ended August 31, 2017, the Adviser earned fees of $109,653 from the Fund. At August 31, 2017, the Fund owed the Adviser $10,921.
The Adviser has contractually agreed to waive its management fee and/or reimburse expenses so that total annual operating expenses (excluding (i) interest; (ii) taxes; (iii) brokerage fees and commissions; (iv) other extraordinary expenses not incurred in the ordinary course of the Fund’s business; (v) dividend expenses on short sales; (vi) expenses incurred under a Rule 12b-1 plan of distribution; and (vii) indirect expenses such as acquired fund fees and expenses) do not exceed 1.75% of the Fund’s average daily net assets through December 29, 2017 (“Expense Limitation”). During any fiscal year that the Agreement between the Adviser and the Trust is in effect, the Adviser may recoup the sum of all fees previously waived or expenses reimbursed for a period of 36 months following the month during which such fee waiver or expense reimbursement was made, less any reimbursement previously paid, if such recoupment can be achieved within the Expense Limitation as well as any expense limitation in effect at the time the reimbursement is made. This expense cap agreement may be terminated by the Board at any time. As of August 31, 2017, the Adviser may seek repayment of investment advisory fee waivers and expense reimbursements in the amount of $101,990 from the Fund no later than August 31, 2020.
The Trust retains Ultimus Asset Services, LLC (the “Administrator”) to provide the Fund with administration, accounting, transfer agent and compliance services, including all regulatory
20
Preserver Alternative Opportunities Fund
Notes to Financial Statements (continued)
August 31, 2017
reporting. For the fiscal year ended August 31, 2017, the Administrator earned fees of $28,501 for administration services, $14,749 for transfer agent services, and $22,500 for fund accounting services. At August 31, 2017, the Fund owed the Administrator $7,167 for such services.
The Board supervises the business activities of the Trust. Each Trustee serves as a Trustee for the lifetime of the Trust or until the earlier of his or her retirement as a Trustee at age 75, death, resignation or removal. “Independent Trustees,” which means that they are not “interested persons” as defined in the 1940 Act of the Trust, each receive annual compensation of $15,000 from the Trust. Each Committee Chairperson receives an additional annual compensation of $1,000 from the Trust. Independent Trustees also receive $1,000 for attending each special in-person meeting and up to $1,000 for attending special telephonic meetings, depending on the length of the telephonic meeting. In addition, the Trust reimburses Trustees for out-of-pocket expense incurred in conjunction with attendance at meetings.
The officers and one Trustee of the Trust are employees of the Administrator. Unified Financial Securities, LLC (the “Distributor”) acts as the principal distributor of the Fund’s shares. Both the Administrator and the Distributor operate as wholly-owned subsidiaries of Ultimus Fund Solutions, LLC.
The Fund has adopted a Distribution Plan (the “Plan”) pursuant to Rule 12b-1 under the 1940 Act. The Plan provides that the Fund will pay the Distributor and/or any registered securities dealer, financial institution or any other person (the “Recipient”) a fee of 0.25% of the average daily net assets of the Fund’s Retail Shares in connection with the promotion and distribution of the Fund’s Retail Shares or the provision of personal services to shareholders, including, but not necessarily limited to, advertising, compensation to underwriters, dealers and selling personnel, the printing and mailing of prospectuses to other than current shareholders of Retail Shares, the printing and mailing of sales literature and servicing shareholder accounts (“12b-1 Expenses”). The Fund or Distributor may pay all or a portion of these fees to any Recipient who renders assistance in distributing or promoting the sale of shares, or who provides certain shareholder services, pursuant to a written agreement. The Plan is a compensation plan, which means that compensation is provided regardless of whether 12b-1 Expenses are actually incurred. Accordingly, the 12b-1 Expenses of the Retail Shares of the Fund may be less than fees paid out by the class under the Plan. For the fiscal year ended August 31, 2017, Retail Shares 12b-1 expense incurred by the Fund was $4,436. At August 31, 2017, the Fund owed the Distributor $882 for Retail Shares 12b-1 expenses.
NOTE 5. PURCHASES AND SALES OF SECURITIES
For the fiscal year ended August 31, 2017, purchases and sales of investment securities, other than short-term investments, were as follows:
| | | | |
Purchases | | $ | 14,598,535 | |
Sales | | $ | 9,830,280 | |
There were no purchases or sales of long-term U.S. government obligations during the fiscal year ended August 31, 2017.
NOTE 6. FEDERAL TAX INFORMATION
As of August 31, 2017, the net unrealized appreciation (depreciation) of investments for tax purposes was as follows:
| | | | |
Gross Unrealized Appreciation | | $ | 1,938,369 | |
Gross Unrealized Depreciation | | | (131,000 | ) |
Net Unrealized Appreciation (Depreciation) | | $ | 1,807,369 | |
21
Preserver Alternative Opportunities Fund
Notes to Financial Statements (continued)
August 31, 2017
At August 31, 2017, the aggregate cost of securities for federal income tax purposes was $16,410,098 for the Fund.
The tax characterization of distributions for the fiscal year ended August 31, 2017, was as follows:
| | | | |
| | | 2017 | |
Distributions paid from: | | | | |
Ordinary Income | | $ | 271,945 | |
Long-Term Capital Gains | | $ | 4,537 | |
Total Distributions Paid | | $ | 276,482 | |
At August 31, 2017, the Fund’s most recent fiscal year end, the components of distributable earnings (accumulated losses) on a tax basis was as follows:
| | | | |
Undistributed Ordinary Income | | $ | 152,521 | |
Undistributed Long-Term Capital Gains | | | 135,871 | |
Unrealized Appreciation (Depreciation)(a) | | | 1,807,369 | |
Total Accumulated Earnings (Deficit) | | $ | 2,095,761 | |
| (a) | | The difference between book basis and tax basis unrealized appreciation (depreciation) is primarily attributable to the mark-to-market adjustments on passive foreign investment companies, the tax treatment of return of capital adjustments and interest accruals on complex securities. |
NOTE 7. BENEFICIAL OWNERSHIP
The beneficial ownership, either directly or indirectly, of 25% or more of the voting securities of a fund creates a presumption of control of a fund, under Section 2(a) (9) of the 1940 Act. At August 31, 2017, Charles Schwab & Co., Inc. (“Schwab”) owned, as record shareholder, 78% of the outstanding shares of the Fund. It is not known whether Schwab or any of the underlying beneficial owners owned or controlled 25% or more of the voting securities of the Fund.
NOTE 8. COMMITMENTS AND CONTINGENCIES
The Fund indemnifies its officers and trustees for certain liabilities that may arise from the performance of their duties to the Fund. Additionally, in the normal course of business, the Fund enters into contracts that contain a variety of representations and warranties which provide general indemnifications. The Fund’s maximum exposure under these arrangements is unknown, as this would involve future claims that may be made against the Fund that have not yet occurred.
NOTE 9. SUBSEQUENT EVENTS
Management has evaluated events or transactions from August 31, 2017 through the date these financial statements were issued that would merit recognition or disclosure in the financial statements. There were no subsequent events to report that would have a material impact in the Funds’ financial statements.
22
Report of Independent Registered Public Accounting Firm
The Board of Trustees and Shareholders of
Capitol Series Trust
We have audited the accompanying statement of assets and liabilities, including the schedule of investments, of the Preserver Alternative Opportunities Fund (the “Fund”), a series of the Capitol Series Trust, as of August 31, 2017, and the related statements of operations, changes in net assets and financial highlights for the year then ended. These financial statements and financial highlights are the responsibility of the Fund’s management. Our responsibility is to express an opinion on these financial statements and financial highlights based on our audit. The statement of changes in net assets and financial highlights of the Fund for the periods presented through August 31, 2016, were audited by other auditors whose report dated October 26, 2016, expressed an unqualified opinion on those statements of changes in net assets and financial highlights.
We conducted our audit in accordance with the standards of the Public Company Accounting Oversight Board (United States). Those standards require that we plan and perform the audit to obtain reasonable assurance about whether the financial statements and financial highlights are free of material misstatement. We were not engaged to perform an audit of the Fund’s internal control over financial reporting. Our audit included consideration of internal control over financial reporting as a basis for designing audit procedures that are appropriate in the circumstances, but not for the purpose of expressing an opinion on the effectiveness of the Fund’s internal control over financial reporting. Accordingly, we express no such opinion. An audit also includes examining, on a test basis, evidence supporting the amounts and disclosures in the financial statements and financial highlights, assessing the accounting principles used and significant estimates made by management, and evaluating the overall financial statement presentation. Our procedures included confirmation of securities owned as of August 31, 2017, by correspondence with the custodian and brokers. We believe that our audit provides a reasonable basis for our opinion.
In our opinion, the financial statements and financial highlights referred to above present fairly, in all material respects, the financial position of the Fund as of August 31, 2017, the results of its operations, changes in its net assets and financial highlights for the year then ended in conformity with U.S. generally accepted accounting principles.

Grandview Heights, Ohio
October 27, 2017
23
Summary of Fund Expenses (Unaudited)
As a shareholder of the Fund, you incur two types of costs: (1) transaction costs, including short-term redemption fees and (2) ongoing costs, including management fees, distribution and service (12b-1) fees, and other Fund expenses. These examples are intended to help you understand your ongoing costs (in dollars) of investing in the Fund and to compare these costs with the ongoing costs of investing in other mutual funds.
The example is based on an investment of $1,000 invested at the beginning of the period and held for the entire period from March 1, 2017 through August 31, 2017.
Actual Expenses
The first line of the table for each class provides information about actual account values and actual expenses. You may use the information in these lines, together with the amount you invested, to estimate the expenses that you paid over the period. Simply divide your account value by $1,000 (for example, an $8,600 account value divided by $1,000 = 8.60), then multiply the result by the number in the first line under the heading “Expenses Paid During Period” to estimate the expenses you paid on your account during this period.
Hypothetical Example for Comparison Purposes
The second line of the table for each class provides information about hypothetical account values and hypothetical expenses based on the Fund’s actual expense ratios and an assumed rate of return of 5% per year before expenses, which is not the Fund’s actual return. The hypothetical account values and expenses may not be used to estimate the actual ending account balances or expenses you paid for the period. You may use this information to compare the ongoing costs of investing in the Fund and other funds. To do so, compare this 5% hypothetical example with the 5% hypothetical examples that appear in the shareholder reports of the other funds.
Expenses shown in the table are meant to highlight your ongoing costs only and do not reflect any transactional costs such as the fee imposed on sales charges and short-term redemptions. Therefore, the second line of the table for each class is useful in comparing ongoing costs only and will not help you determine the relative total costs of owning different funds. In addition, if transaction costs were included, your costs would have been higher.
24
Summary of Fund Expenses (Unaudited) (continued)
| | | | | | | | | | | | | | | | | | |
| | | | | Beginning
Account
Value,
March 1, 2017 | | | Ending
Account
Value,
August 31, 2017 | | | Expenses
Paid
During
Period(a) | | | Annualized
Expense
Ratio | |
Preserver Alternative Opportunities Fund | | | | | | | | | | | | | |
Institutional Shares | | Actual | | $ | 1,000.00 | | | $ | 1,062.00 | | | $ | 9.10 | | | | 1.75 | % |
| | | | | | | | | | | | | | | | | | |
| | Hypothetical(b) | | $ | 1,000.00 | | | $ | 1,016.38 | | | $ | 8.89 | | | | 1.75 | % |
| | | | | | | | | | | | | | | | | | |
Retail Shares | | Actual | | $ | 1,000.00 | | | $ | 1,060.20 | | | $ | 10.39 | | | | 2.00 | % |
| | | | | | | | | | | | | | | | | | |
| | Hypothetical(b) | | $ | 1,000.00 | | | $ | 1,015.12 | | | $ | 10.16 | | | | 2.00 | % |
| (a) | | Expenses are equal to the Fund’s annualized expense ratios, multiplied by the average account value over the period, multiplied by 184/365 (to reflect the one-half year period). |
| (b) | | Hypothetical assumes 5% annual return before expenses. |
Additional Federal Income Tax Information (Unaudited)
The Form 1099-DIV you receive in January 2018 will show the tax status of all distributions paid to your account in calendar year 2017. Shareholders are advised to consult their own tax adviser with respect to the tax consequences of their investment in the Fund. As required by the Internal Revenue Code and/or regulations, shareholders must be notified regarding the status of qualified dividend income for individuals and the dividends received deduction for corporations.
Qualified Dividend Income. The Fund designates approximately 43% or up to the maximum amount of such dividends allowable pursuant to the Internal Revenue Code, as qualified dividend income eligible for the reduced tax rate of 15%.
Dividends Received Deduction. Corporate shareholders are generally entitled to take the dividends received deduction on the portion of the Fund’s dividend distribution that qualifies under tax law. For the Fund’s calendar year 2017 ordinary income dividends, 30% qualifies for the corporate dividends received deduction.
For the fiscal year ended August 31, 2017, the Fund designated $4,537 as 20% long-term capital gain distributions.
25
Trustees and Officers (Unaudited)
The Board of Trustees supervises the business activities of the Trust. Each Trustee serves as a trustee until termination of the Trust unless the Trustee dies, resigns, retires or is removed.
The following tables provide information regarding the Trustees and Officers.
Independent Trustees
| | |
Name, Address,* Age,
Position with Trust,** Term of
Position with Trust | | Principal Occupation During
Past 5 Years and Other Directorships |
Walter B. Grimm Age: 72 Trustee Began Serving: November 2013 | | Principal Occupations(s): President, Leigh Management Group, LLC (consulting firm) (October 2005 to present); President, Leigh Investments, Inc. (1988 to present); and Chief Financial Officer, East West Private, LLC (consulting firm) (March 2009 to present). |
Mary M. Morrow Age: 59 Trustee Began Serving: November 2013 | | Principal Occupations(s): Chief Operating Officer, Pennsylvania Health and Wellness (fully owned subsidiary of Centene Corporation) (November 2016 to present). Previous Position(s): Vice President, Strategic Initiatives, Gateway Heath (January 2015 to November 2016); Consulting Practice Manager, DST Health Solutions (August 2010 to January 2015); Director, Service and Client Relations, EBDS (August 2008 – May 2009); Independent Consultant, Healthcare Servicing May 2009 – August 2010). |
| * | | The address for each trustee is 225 Pictoria Drive, Suite 450, Cincinnati, OH 45246. |
| ** | | The Trust currently consists of 8 series. |
Interested Trustees & Officers
| | |
Name, Address,* Age,
Position with Trust,** Term of
Position with Trust | | Principal Occupation During
Past 5 Years and Other Directorships |
Robert G. Dorsey*** Age: 60 Chairman of the Board and Trustee Began Serving: March 2017 | | Principal Occupation(s): President and Managing Director of Ultimus Fund Solutions, LLC and Ultimus Fund Distributors, LLC (1999 to present); Interested Trustee of Ultimus Managers Trust (February 2012 to present). Previous Position(s): President of Ultimus Managers Trust (June 2012 to October 2013). |
26
Trustees and Officers (Unaudited) (continued)
| | |
Name, Address,* Age,
Position with Trust,** Term of
Position with Trust | | Principal Occupation During
Past 5 Years and Other Directorships |
Matthew J. Miller Age: 41 Chief Executive Officer and President Began Serving: September 2013 | | Principal Occupation(s): Assistant Vice President, Relationship Management, Ultimus Fund Solutions, LLC (December 2015 to present); Vice President, Valued Advisers Trust (December 2011 to present). Previous Position(s): Vice President, Relationship Management, Huntington Asset Services, Inc. (n/k/a Ultimus Asset Services, LLC) (2008 to December 2015); Vice President, The Huntington Funds (February 2010 to April 2015); Vice President, Transfer Agency Operations, Huntington Asset Services, Inc. (2002 to 2008); Employed in various positions with Huntington Asset Services, Inc. (July 1998 to 2002). |
Zachary P. Richmond Age: 37 Treasurer and Chief Financial Officer Began Serving: August 2014 | | Principal Occupation(s): Assistant Vice President, Associate Director of Financial Administration, Ultimus Fund Solutions, LLC (December 2015 to present); Treasurer and Chief Financial Officer, Unified Series Trust (August 2014 to present); Treasurer and Chief Financial Officer, Commonwealth International Series Trust (September 2015 to present). Previous Position(s): Assistant Vice President, Fund Administration, Huntington Asset Services, Inc. (n/k/a Ultimus Asset Services, LLC) (January 2011 to December 2015); and Assistant Treasurer, Unified Series Trust (2011 to August 2014). |
27
Trustees and Officers (Unaudited) (continued)
| | |
Name, Address,* Age,
Position with Trust,** Term of
Position with Trust | | Principal Occupation During
Past 5 Years and Other Directorships |
John C. Swhear Age: 56 Chief Compliance Officer Began Serving: September 2013 | | Principal Occupation(s): Assistant Vice President, Associate Director of Fund Administration, Ultimus Fund Solutions, LLC (May 2017 to present); Chief Compliance Officer of Unified Financial Securities, LLC (the Distributor) (July 2007 to present); Chief Compliance Officer, Vice President of Valued Advisers Trust (August 2008 to present); Secretary, The Cutler Trust (August 2017 to present); and Assistant Secretary, First Western Funds Trust (April 2017 to present). Previous Position(s): Associate Director of Compliance, Ultimus Fund Solutions, LLC (December 2015 to May 2017); President, Unified Series Trust (March 2012 to January 2016); Director, Huntington Asset Services, Inc. (n/k/a Ultimus Asset Services, LLC) (July 2014 to December 2015); Vice President of Legal Administration and Compliance, Huntington Asset Services, Inc. (April 2007 to December 2015); Director of Unified Financial Securities, Inc. (n/k/a Unified Financial Securities, LLC) (July 2014 to December 2015); Secretary, The Huntington Funds (April 2010 to February 2012); and Senior Vice President, Unified Series Trust (May 2007 to March 2012). |
Stacey Havens Age: 51 Vice President Began Serving: September 2013 | | Principal Occupation(s): Assistant Vice President, Relationship Management, Ultimus Fund Solutions, LLC (December 2015 to present). Previous Position(s): Vice President, Huntington Asset Services, Inc. (n/k/a Ultimus Asset Services, LLC) (July 1993 to December 2015). |
28
Trustees and Officers (Unaudited) (continued)
| | |
Name, Address,* Age,
Position with Trust,** Term of
Position with Trust | | Principal Occupation During
Past 5 Years and Other Directorships |
Tiffany R. Franklin Age: 41 Secretary Began Serving: December 2015 | | Principal Occupation(s): Senior Paralegal, Ultimus Fund Solutions, LLC (December 2015 to present); Assistant Secretary, Wilshire Mutual Funds, Inc. and Wilshire Variable Insurance Trust (October 2016 to present); and Assistant Secretary, Cross Shore Discovery Fund (2017 to present; and Assistant Secretary, Caldwell & Orkin Funds, Inc. (June 2017 to present). Previous Position(s): Paralegal, Huntington Asset Services, Inc. (n/k/a Ultimus Asset Services, LLC) (April 2012 to December 2015); Assistant Secretary, Capitol Series Trust (September 2013 to December 2015); Assistant Secretary, The Huntington Funds, (November 2012 to December 2015); Assistant Secretary, Huntington Strategy Shares (November 2012 to December 2015); Secretary, The Huntington Funds (December 2015 to March 2016); and Secretary, Huntington Strategy Shares (December 2015 to March 2016). |
Stephen L. Preston Age: 51 Anti-Money Laundering Compliance Officer Began Serving: December 2016 | | Principal Occupation(s): Chief Compliance Officer, Ultimus Fund Solutions, LLC and Ultimus Fund Distributors, LLC from June 2011 to present. |
| * | | The address for each trustee and officer is 225 Pictoria Drive, Suite 450, Cincinnati, OH 45246. |
| ** | | The Trust currently consists of 8 series. |
| *** | | Mr. Dorsey is considered an “interested person” of the Trust within the meaning of Section 2(a)(19) of the 1940 Act because of his relationship with the Trust’s administrator, transfer agent, and distributors. |
Other Information (Unaudited)
The Fund’s Statement of Additional Information (“SAI”) includes additional information about the trustees and is available without charge, upon request. You may call toll-free at (844) 838-2119 to request a copy of the SAI or to make shareholder inquiries.
29
Approval of Investment Advisory Agreement (Unaudited)
At a quarterly meeting of the Board of Trustees of Capitol Series Trust (“Trust”) on June 19, 2017, the Trust’s Board of Trustees (“Board”), including all of the Trustees who are not “interested persons” of the Trust (“Independent Trustees”) as that term is defined in Section 2(a)(19) of the Investment Company Act of 1940, as amended (the “1940 Act”), considered and approved the continuation for a additional one-year period of the Investment Advisory Agreement between the Trust and Preserver Partners, LLC (“Preserver”) (the “Investment Advisory Agreement”) with respect to the Preserver Alternative Opportunities Fund (the “Preserver Fund”), a series of the Trust.
Prior to the meeting, the Trustees received and considered information from Preserver and the Trust’s administrator designed to provide the Trustees with the information necessary to evaluate the terms of the proposed renewal of the Investment Advisory Agreement between the Trust and Preserver, including, but not limited to: Preserver’s response to counsel’s due diligence letter requesting information relevant to renewal of the Investment Advisory Agreement; the operating expense limitation agreement currently in effect between Preserver and the Preserver Fund (the “Expense Limitation Agreement”); and Morningstar expense and performance data for comparative purposes (the “Support Materials”). At various times, the Trustees reviewed the Support Materials with Preserver, Trust management, and with counsel to the Independent Trustees. This information, together with the information provided to and reviewed by the Board throughout the course of the prior two years, formed the primary, but not exclusive, basis for the Board’s determinations. Before voting to approve the renewal of the Investment Advisory Agreement, the Trustees reviewed the terms and the form of Investment Advisory Agreement and the Support Materials with Trust management and with counsel to the Independent Trustees. The Trustees received and discussed a memorandum from such counsel delineating the legal standards governing their consideration of the renewal of the Investment Advisory Agreement, which memorandum described the various factors that the U.S. Securities and Exchange Commission (“SEC”) and U.S. Courts over the years have suggested would be appropriate for trustee consideration, including the factors outlined in Gartenberg v. Merrill Lynch Asset Management Inc., 694 F.2d 923, 928 (2d Cir. 1982); cert. denied sub. nom. and Andre v. Merrill Lynch Ready Assets Trust, Inc., 461 U.S. 906 (1983). Representatives from Preserver also met with the Trustees and provided additional information to the Trustees regarding its services to the Preserver Fund, including but not limited to, information regarding its investment philosophy, the firm’s compliance culture, the ownership structure of Preserver, financial statements of Preserver, Fund expenses subsidized by Preserver, resources available to service the Preserver Fund, expenses and profitability, Preserver’s future plans with regard to the Preserver Fund, and other benefits that Preserver derived from its relationship with the Preserver Fund, among other topics. Representatives of Preserver also discussed with the Board, as they had at prior Board meetings, that while Preserver had initially contemplated that a sub-adviser would be utilized to advise a portion of the Fund, and that a subadvisory agreement with Semper Capital Management (“Semper”) had been initially approved by the Board at its September 16, 2015 meeting, the sub-advisory model was never implemented, and Preserver was not seeking re-approval of the Sub-Advisory Agreement with Semper. Preserver’s representatives further represented to the Board that Preserver intends to continue to advise the Fund’s entire portfolio indefinitely.
After having received and reviewed the Support Materials, as well as quarterly investment performance, compliance, operating, and distribution reports on the Preserver Fund over an extended time period, the Trustees discussed the facts and factors relevant to the continuation of the Investment Advisory Agreement, which incorporated and reflected their knowledge of
30
Preserver’s services to the Fund. Taking such information into account, the Board considered whether the overall arrangements between the Trust and Preserver as set forth in the Investment Advisory Agreement, including the investment advisory fees that the Preserver Fund pays to Preserver, continue to be fair and reasonable in light of the services Preserver performs, as well as such other matters as the Trustees considered relevant in the exercise of their reasonable business judgment.
In determining whether to approve the renewal of the Investment Advisory Agreement, the Trustees considered all factors they believed relevant, including the following, with respect to the Preserver Fund: (1) the nature, extent, and quality of the services provided by Preserver with respect to the Preserver Fund; (2) the cost of the services to be provided and the profits and losses realized by Preserver from services rendered to the Trust with respect to the Preserver Fund; (3) comparative fee and expense data for the Preserver Fund and other investment companies or institutional accounts with similar investment objectives; (4) the extent to which economies of scale would be realized as the Preserver Fund grows, and whether the advisory fees for the Fund reflect such economies of scale for the Preserver Fund’s benefit; and (5) other financial benefits to Preserver resulting from services rendered to the Preserver Fund. The material factors and conclusions that formed the basis of the Trustees’ determination to approve the continuation of the Investment Advisory Agreement are summarized below. In their deliberations, the Trustees did not identify any particular information that was all-important or controlling.
Nature, Extent and Quality of Services Provided. The Trustees considered the scope of services that Preserver provides under the Investment Advisory Agreement, noting that such services include, but are not limited to, the following: (1) investing the Preserver Fund’s assets consistent with the Fund’s investment objective and investment policies; (2) determining the portfolio securities to be purchased, sold or otherwise disposed of and the timing of such transactions; (3) voting all proxies with respect to the Preserver Fund’s portfolio securities; (4) maintaining the required books and records for transactions that Preserver effects on behalf of the Fund; and (5) selecting broker-dealers to execute orders on behalf of the Preserver Fund. The Trustees also noted that Preserver performs certain marketing and compliance services for the Preserver Fund. The Trustees considered Preserver’s capitalization and its assets under management, noting that Preserver’s assets under management and number of accounts have both increased. The Trustees further considered the investment philosophy and experience of the portfolio management team. The Trustees also noted the Preserver Fund’s performance compared to its benchmark. The Trustees considered that the Preserver Fund outperformed its benchmark for the one-year and since-inception periods ended March 31, 2017. The Trustees also considered the Preserver Fund’s performance compared to its Morningstar peer group category. They noted that the Preserver Fund outperformed the median and average of its peer group for the one-year period ended May 31, 2017. The Trustees noted that the peer group comparison provided was filtered to include funds with a similar asset size to that of the Preserver Fund (less than $25 million), and discussed the appropriateness of such a comparison. The Trustees concluded that they are satisfied with the nature, extent and quality of services that Preserver provides to the Preserver Fund under the Investment Advisory Agreement.
Cost of Advisory Services and Profitability. The Trustees considered Preserver’s profitability from the services that it renders to the Fund. The Trustees noted that Preserver is not yet profitable as a result of its advisory services to the Preserver Fund, and in particular that Preserver had incurred a loss and had significant fee waivers and reimbursements to the Fund under its operating expenses limitation agreement during the one year period ending April 30, 2017. The Trustees also noted
31
that Preserver anticipated making a small profit for the one year period ending April 30, 2018 according to the pro forma profit/loss analysis that it provided to the Board. The Trustees also noted that while Preserver has not yet been profitable with respect to its services to the Preserver Fund, it is profitable overall, with sufficient capital to fulfill its contractual responsibilities under the Investment Advisory Agreement
Comparative Fee and Expense Data. The Trustees also considered the annual management fee that the Preserver Fund pays to Preserver under the Investment Advisory Agreement. They noted that the Preserver Fund’s gross management fee of 75 basis points is below both the average and median management fee reported for its relevant Morningstar peer group. The Trustees noted that the peer group comparisons of fee and expense data included in the Support Materials were also based upon funds with similar net asset levels of under $25 million. The Trustees also considered that Preserver has contractually agreed to reduce its management fees and, if necessary, reimburse the Preserver Fund for operating expenses, as specified in the Fund’s prospectus. The Trustees further noted that the Preserver Fund’s total net expense ratio for both the institutional and retail share classes (after waivers and expense reimbursements) is above the average and median total net expense ratios (after waivers and expense reimbursements) reported for the same Morningstar peer group. The Trustees determined however, that even though the Preserver Fund’s total net expense ratio (after waivers and expense reimbursements) was somewhat above the median and average reported for its relevant Morningstar peer group, the net expense ratio is not out of line with the Fund’s peer group. The Trustees finally considered that the advisory fees that Preserver charges to the Fund are lower than the fees that Preserver charges to a limited partnership that it advises in the same investment strategy, the only institutional account in the same strategy. They noted however, that there are structural differences and differences in the services provided to the two funds. While recognizing that it is difficult to compare advisory fees because the scope of advisory services provided may vary from one investment adviser to another, the Trustees concluded that the Preserver Fund’s advisory fee continues to be reasonable.
Economies of Scale. The Trustees considered whether the Preserver Fund may benefit from any economies of scale, but did not find that any material economies exist at this time. The Trustees noted that the advisory fees charged by Preserver do not contain any fee breakpoints, but that due to the Preserver Fund’s asset size, the Board concluded that it is not necessary to consider the implementation of fee breakpoints at this time. In addition, the Board noted that the Preserver Fund likely will not benefit from any economies of scale until fund assets increase.
Other Benefits. The Trustees considered the extent to which Preserver utilizes soft dollar arrangements with respect to portfolio transactions, and noted that Preserver does not utilize such soft dollar arrangements, and that no affiliated brokers are utilized to execute the portfolio transactions of the Preserver Fund. The Trustees concluded that, all things considered, Preserver will not receive material additional financial benefits from services rendered to the Preserver Fund.
Based upon Preserver’s presentation to the Board and the Support Materials considered in connection with the renewal of the Investment Advisory Agreement, as well as the information provided throughout the course of the year, the Board concluded that the overall arrangements between the Trust and Preserver, as set forth in the Investment Advisory Agreement between the Trust and Preserver, are fair and reasonable in light of the services to be performed, investment advisory fees to be paid and such other matters as the Trustees considered relevant in the exercise of their reasonable judgment.
32
| | | | |
| | |
FACTS | | WHAT DOES CAPITOL SERIES TRUST DO WITH YOUR PERSONAL INFORMATION? |
| | | | |
| | |
Why? | | Financial companies choose how they share your personal information. Federal law gives consumers the right to limit some but not all sharing. Federal law also requires us to tell you how we collect, share, and protect your personal information. Please read this notice carefully to understand what we do. |
| | | | |
| | |
What? | | The types of personal information we collect and share depend on the product or service you have with us. This information can include: ◾ Social Security number ◾ account balances and account transactions ◾ account transactions, transaction or loss history and purchase history ◾ checking account information and wire transfer instructions When you are no longer our customer, we continue to share your information as described in this notice. |
| | | | |
| | |
How? | | All financial companies need to share customers’ personal information to run their everyday business. In the section below, we list the reasons financial companies can share their customers’ personal information; the reasons Capitol Series Trust chooses to share; and whether you can limit this sharing. |
| | |
Reasons we can share your personal information | | Does Capitol Series Trust share? |
For our everyday business purposes –
such as to process your transactions, maintain your account(s), respond to court orders and legal investigations, or report to credit bureaus | | Yes |
For our marketing purposes – to offer our products and services to you | | Yes |
For joint marketing with other financial companies | | No |
For our affiliates’ everyday business purposes – information about your transactions and experiences | | No |
For our affiliates’ everyday business purposes – information about your creditworthiness | | No |
For nonaffiliates to market to you | | No |
| | |
Questions? | | Call 1-844-838-2119. |
33
| | |
Who we are | | |
Who is providing this notice? | | Capitol Series Trust |
What we do | | |
| How does Capitol Series Trust protect my personal information? | | To protect your personal information from unauthorized access and use, we use security measures that comply with federal law. These measures include computer safeguards and secured files and buildings. |
| How does Capitol Series Trust collect my personal information? | | We collect your personal information, for example, when you ◾ open an account or deposit money ◾ buy securities from us or sell securities to us ◾ make deposits or withdrawals from your account provide account information ◾ give us your account information ◾ make a wire transfer ◾ tell us who receives the money ◾ tell us where to send the money ◾ show your government-issued ID ◾ show your driver’s license |
| Why can’t I limit all sharing? | | Federal law gives you the right to limit only ◾ sharing for affiliates’ everyday business purposes – information about your creditworthiness ◾ affiliates from using your information to market to you ◾ sharing for nonaffiliates to market to you State laws and individual companies may give you additional rights to limit sharing. |
| | |
Definitions | | |
| Affiliates | | Companies related by common ownership or control. They can be financial and nonfinancial companies. |
| Nonaffiliates | | Companies not related by common ownership or control. They can be financial and nonfinancial companies. ◾ Capitol Series Trust does not share your personal information with nonaffiliates so they can market to you. |
| Joint marketing | | A formal agreement between nonaffiliated financial companies that together market financial products or services to you. ◾ Capitol Series Trust doesn’t jointly market financial products or services to you. |
34
PROXY VOTING (Unaudited)
A description of the policies and procedures that the Fund uses to determine how to vote proxies relating to portfolio securities and information regarding how the Fund voted those proxies during the most recent twelve month period ended June 30, is available without charge upon request by (1) calling the Fund at (844) 838-2119 and (2) from Fund documents filed with the Securities and Exchange Commission (“SEC”) on the SEC���s website at www.sec.gov.
TRUSTEES
Robert G. Dorsey, Chairman
Walter B. Grimm
Mary M. Morrow
OFFICERS
Matthew J. Miller, Chief Executive Officer and President
John C. Swhear, Chief Compliance Officer
Stacey Havens, Vice President
Zachary P. Richmond, Treasurer and Chief Financial Officer
Tiffany R. Franklin, Secretary
Stephen L. Preston, Anti-Money Laundering Compliance Officer
INVESTMENT ADVISER
PreserverPartners, LLC
8700 Trail Lake Drive West, Suite 105
Memphis, TN 38125
DISTRIBUTOR
Unified Financial Securities, LLC
9465 Counselors Row, Suite 200
Indianapolis, IN 46240
INDEPENDENT REGISTERED PUBLIC ACCOUNTING FIRM
Ernst & Young LLP
800 Yard Street, Suite 500
Grandview Heights, OH 43212
LEGAL COUNSEL
Bernstein Shur
100 Middle Street, 6th Floor
Portland, ME 04104
CUSTODIAN
Huntington National Bank
41 South High Street
Columbus, OH 43215
ADMINISTRATOR, TRANSFER AGENT AND FUND ACCOUNTANT
Ultimus Asset Services, LLC
225 Pictoria Drive, Suite 450
Cincinnati, OH 45246
This report is intended only for the information of shareholders or those who have received the Fund’s prospectus which contains information about the Fund’s management fee and expenses. Please read the prospectus carefully before investing.
Distributed by Unified Financial Securities, LLC
Member FINRA/SIPC

HEDEKER STRATEGIC APPRECIATION FUND
Institutional Shares – SAFFX
Annual Report
August 31, 2017
Hedeker Wealth LLC
One Overlook Point, Suite 610
Lincolnshire, Illinois 60069
(800) 657-4450
| | | | |
| Letter to Shareholders | | | August 31, 2017 | |
You miss 100% of the shots you don’t take – Wayne Gretzky
We are very pleased to share our first management letter with investors. I would like to start by thanking all the initial investors that expressed interest in this strategy as a mutual fund – your requests were the catalyst that created the Hedeker Strategic Appreciation Fund (the “Fund”).
Throughout the year our opportunistic style allowed us to capture alpha. We sought to exploit asymmetrical investments by targeting equity exposure in companies with positive fundamental or technical characteristics but also exhibited an attractive credit or bond profile. We have been patient through-out the year waiting for event driven opportunities to come to us. Divergent monetary policy and geopolitical events allowed us to enter macro strategies at valuations we deemed attractive.
The Fund is currently positioned with a 30% equity exposure to the Russell 2000® Index (“Russell 2000”). We view the Russell 2000 as uniquely positioned given the potential positive catalysts in tax reform, deregulation, slower than expected withdrawal of monetary stimulus and an upcoming earnings season with a weak U.S. dollar.
We are very pleased to report through August 31, 2017 the Fund has outperformed its equity exposure by capturing approximately 48% of the Russell 2000 return while keeping a volatility profile similar to U.S. Corporate Bonds. We view this outperformance being driven by strong security selection.
We continue to expect tailwinds for the Fund vs other debt strategies as rising rate environments are historically a difficult time for many debt investors total return prospects. As rates have, and we continue to expect, slowly grind higher we would look to our equity component to act as a natural hedge to the duration risk of our debt exposure. We anticipate the Federal Reserve to continue on its path of interest rate hikes with the risk being more dovish than hawkish.
Valuations continue to be influenced by central bank stimulus and policy decisions in Washington. This type of price action is notoriously very difficult to accurately forecast consistently and can have unintended consequences. Negative interest rates and extended periods of low levels of volatility are two examples. While low volatility does not mean you have the all clear to ramp-up risk or the market is overly complacent it does mean the short-term pricing deviations are expected to be muted. The “crowding out” of volatility is being driven by the unprecedented levels of accommodative monetary policy. As central banks are slowly removing the proverbial punch bowl, fiscal policy is looking to fill the void. This has emboldened market participants causing pullbacks to be more shallow and quicker to recover.
With that in mind, there are air pockets in asset valuation and liquidity driven tail risks that we are monitoring closely. A recent rise in algorithmic and black box machine driven learning within active investors coupled with an enormous capital inflow into passive strategies may cause liquidity issues and significant price dislocations. This could be triggered by passive investors as a herd rushing for the exits, especially in ETFs with the underling securities being far less liquid, and algorithmic and black box strategies reducing VAR or other risk-limits in times of stress. This may be exacerbated as investors have been pushed out of their preferred habit seeking increasingly lower levels of return per unit of risk due to the trillions of dollars of simulative capital which flowed into financial assets increasing valuations versus real assets which are inflationary.
1
We thrive in disjointed frequently emotional risk-off markets, often finding very attractive event driven investment opportunities. We are managing our 30% equity exposure conservatively with our downside protection of the bond floor. We view the U.S. economy as being in the 7th inning of the economic cycle and believe that we are properly positioned to grow higher with the equity market should the animal spirits continue but are defensively positioned on the downside should a risk-off event materialize faster than expected.
Sincerely,
Michael McClain, CFA
Portfolio Manager
Investors should carefully consider the investment objectives, risks, and charges and expenses of the fund before investing. The prospectus contains this and other information about the fund, and it should be read carefully before investing. Investors may obtain a copy of the prospectus by calling 800-657-4450.
Investing involves risk, including loss of principal. There is no guarantee that this, or any, investment strategy will be successful. A majority of the Fund’s assets will be invested in convertible securities that have credit ratings that are below investment grade or not rated. These “junk bonds” are considered speculative investments. Fixed income investments are affected by a number of risks, including fluctuation in interest rates, credit risk, and prepayment risk. In general, as prevailing interest rates rise, fixed income securities prices will fall. Some fixed income securities give the issuer the option to call, or redeem, the bonds before their maturity date. If an issuer “calls” its bonds during a time of declining interest rates, the Fund may have to invest the proceeds in an investment offering a lower yield. Convertible securities may be illiquid and difficult to value and may be subject to greater credit risk than other securities. Many of the convertible securities in which the Fund invests will be issued by small or medium sized companies located in foreign and emerging markets. Investments in international markets present special risks including currency fluctuation, the potential for diplomatic and political instability, regulatory and liquidity risks, foreign taxation and differences in auditing and other financial standards. Risks of foreign investing are generally intensified for investments in emerging markets. Small and mid cap investing involves greater risk no associated with investing in more established companies, such as greater price volatility, business risk, less liquidity and increased competitive threat.
Past performance does not guarantee future performance.
Russell 2000® Index is an index that measures the performance of the 2,000 smallest companies in the Russell 3000® Index. You cannot invest directly in an index.
The Hedeker Strategic Appreciation Fund is distributed by Ultimus Fund Distributors, LLC.
2
Investment Results (Unaudited)
Total Return(a) as of August 31, 2017
| | | | |
| | | Since
Inception
(12/21/2016) | |
Hedeker Strategic Appreciation Fund | | | | |
Institutional Shares | | | 1.94 | % |
Bloomberg Barclays Intermediate Government/Credit Index (b) | | | 3.30 | % |
| | | Expense Ratio(c) | |
| |
| Institutional
Shares |
|
| | | | |
Gross Expense Ratio | | | 1.47 | % |
The performance quoted represents past performance, which does not guarantee future results. The investment return and principal value of an investment will fluctuate so that an investor’s shares, when redeemed, may be worth more or less than their original cost. The returns shown do not reflect deduction of taxes that a shareholder would pay on the Hedeker Strategic Appreciation Fund (the “Fund”) distributions or the redemption of Fund shares. Current performance of the Fund may be lower or higher than the performance quoted. The Fund’s investment objectives, risks, charges and expenses must be considered carefully before investing. Performance data current to the most recent month end may be obtained by calling (800) 657-4450.
(a) Return figures reflect any change in price per share and assume the reinvestment of all distributions. Total returns for less than one year are not annualized.
(b) The Bloomberg Barclays Intermediate Government/Credit Index (“Index”) is a broad-based flagship benchmark that measures the non-securitized component of the US Aggregate Index. It includes investment grade, US dollar-denominated, fixed-rate Treasuries, government-related and corporate securities. The returns of the Index do not reflect the deduction of fees and expenses, whereas the Fund returns are shown net of fees. An individual cannot invest directly in an index.
(c) The expense ratio as disclosed in the Fund’s prospectus dated December 21, 2016, is based on estimated amounts for the current fiscal year. Hedeker Wealth LLC (the “Adviser”), the Fund’s adviser, has contractually agreed, until December 31, 2018, to waive its management fee and/or reimburse expenses so that total annual operating expenses (excluding (i) interest; (ii) taxes; (iii) brokerage fees and commissions; (iv) other extraordinary expenses not incurred in the ordinary course of the Fund’s business; (v) dividend expenses on short sales; and (vi) indirect expenses such as acquired fund fees and expenses) do not exceed 1.75% of the Fund’s average daily net assets. This expense cap agreement may be terminated by the Board of Trustees at any time. Additional information pertaining to the Fund’s expense ratios as of August 31, 2017, can be found in the financial highlights.
The Fund’s investment objectives, strategies, risks, charges and expenses must be considered carefully before investing. The prospectus contains this and other important information about the Fund and may be obtained by calling (800) 657-4450. Please read it carefully before investing.
The Fund is distributed by Ultimus Fund Distributors, LLC, member FINRA/SIPC.
3
Investment Results (Unaudited) (continued)
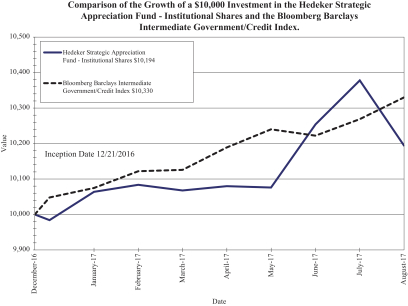
The chart above assumes an initial investment of $10,000 made on December 21, 2016 (commencement of operations) and held through August 31, 2017. THE FUND’S RETURNS REPRESENT PAST PERFORMANCE AND DO NOT GUARANTEE FUTURE RESULTS. The returns shown do not reflect deduction of taxes that a shareholder would pay on the Fund’s distributions or the redemption of the Fund’s shares. Investment returns and principal values will fluctuate so that your shares, when redeemed, may be worth more or less than their original purchase price.
Current performance may be lower or higher than the performance data quoted. For more information on the Fund, and to obtain performance data current to the most recent month-end, or to request a prospectus, please call (800) 657-4450. You should carefully consider the investment objectives, potential risks, management fees, and charges and expenses of the Fund before investing. The Fund’s prospectus contains this and other information about the Fund, and should be read carefully before investing.
The Fund is distributed by Ultimus Fund Distributors, LLC, Member FINRA/SIPC.
4
Portfolio Illustration (Unaudited)
August 31, 2017
The following chart gives a visual breakdown of the Fund’s holdings as a percentage of the fair value of portfolio investments.
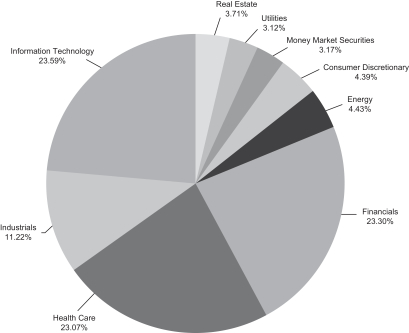
Availability of Portfolio Schedule (Unaudited)
The Fund files its complete schedule of portfolio holdings with the Securities and Exchange Commission (“SEC”) for the first and third quarter of each fiscal year on Form N-Q. The Fund’s Forms N-Q will be available at the SEC’s website at www.sec.gov. The Fund’s Forms N-Q may be reviewed and copied at the Public Reference Room in Washington, DC. Information on the operation of the Public Reference Room may be obtained by calling 1-800-SEC-0330.
5
Hedeker Strategic Appreciation Fund
Schedule of Investments
August 31, 2017
| | | | | | | | |
Principal
Amount | | | | | Fair Value | |
| | CONVERTIBLE BONDS – 92.00% | |
| |
| | | | Consumer Discretionary – 4.47% | |
| $ | 300,000 | | | Carriage Services, Inc., 2.75%, 3/15/2021 | | $ | 365,250 | |
| | 500,000 | | | Ctrip.com International Ltd., 1.00%, 7/1/2020 | | | 564,687 | |
| | 325,000 | | | Global Eagle Entertainment, Inc., 2.75%, 2/15/2035 | | | 207,610 | |
| | 300,000 | | | Horizon Global Corp., 2.75%, 7/1/2022 | | | 310,688 | |
| | 400,000 | | | Steinhoff Finance Holding N.V., 1.25%, 8/11/2022 | | | 444,648 | |
| | 500,000 | | | Vitamin Shoppe, Inc., 2.25%, 12/1/2020 | | | 370,650 | |
| | | | | | | | |
| | | | | | | 2,263,533 | |
| | | | | | | | |
| |
| | | | Energy – 4.02% | |
| | 25,000 | | | Cheniere Energy, Inc., 4.25%, 3/15/2045 | | | 17,297 | |
| | 300,000 | | | DHT Holdings, Inc., 4.50%, 10/1/2019 | | | 295,890 | |
| | 500,000 | | | Hurricane Energy PLC, 7.50%, 7/24/2022 | | | 521,117 | |
| | 850,000 | | | PDC Energy, Inc., 1.13%, 9/15/2021 | | | 770,312 | |
| | 400,000 | | | Tullow Oil Jersey Ltd., 6.63%, 7/12/2021 | | | 428,000 | |
| | | | | | | | |
| | | | | | | 2,032,616 | |
| | | | | | | | |
| |
| | | | Financials – 17.54% | |
| | 1,600,000 | | | AmTrust Financial Services, Inc., 2.75%, 12/15/2044 | | | 1,200,000 | |
| | 1,000,000 | | | Apollo Commercial Real Estate Finance, Inc., 4.75%, 8/23/2022 | | | 1,008,125 | |
| | 8,000 | | | BlackRock Capital Investment Corp., 5.50%, 2/15/2018 | | | 8,160 | |
| | 500,000 | | | GAIN Capital Holdings, Inc., 4.13%, 12/1/2018 | | | 506,562 | |
| | 808,000 | | | GSV Capital Corp., 5.25%, 9/15/2018 | | | 814,565 | |
| | 250,000 | | | Old Republic International Corp., 3.75%, 3/15/2018 | | | 311,908 | |
| | 500,000 | | | PRA Group, Inc., 3.00%, 8/1/2020 | | | 463,580 | |
| | 1,000,000 | | | Prospect Capital Corp., 4.95%, 7/15/2022 | | | 990,000 | |
| | 375,000 | | | Resource Capital Corp., 8.00%, 1/15/2020 | | | 407,029 | |
| | 1,050,000 | | | Safeguard Scientifics, Inc., 5.25%, 5/15/2018 | | | 1,098,615 | |
| | 1,200,000 | | | TCP Capital Corp., 5.25%, 12/15/2019 | | | 1,269,000 | |
| | 750,000 | | | Two Harbors Investment Corp., 6.25%, 1/15/2022 | | | 802,969 | |
| | | | | | | | |
| | | | | | | 8,880,513 | |
| | | | | | | | |
| |
| | | | Health Care – 23.51% | |
| | 1,243,000 | | | Aceto Corp., 2.00%, 11/1/2020 | | | 1,106,270 | |
| | 525,000 | | | Acorda Therapeutics, Inc., 1.75%, 6/15/2021 | | | 458,719 | |
| | 1,000,000 | | | Allscripts Healthcare Solutions, Inc., 1.25%, 7/1/2020 | | | 1,028,750 | |
| | 400,000 | | | AMAG Pharmaceuticals, Inc., 3.25%, 6/1/2022 | | | 370,520 | |
| | 1,050,000 | | | ANI Pharmaceuticals, Inc., 3.00%, 12/1/2019 | | | 1,113,000 | |
| | 300,000 | | | BioMarin Pharmaceutical, Inc., 1.50%, 10/15/2020 | | | 356,062 | |
| | 750,000 | | | Depomed, Inc., 2.50%, 9/1/2021 | | | 559,687 | |
| | 750,000 | | | Impax Laboratories, Inc., 2.00%, 6/15/2022 | | | 667,969 | |
| | 900,000 | | | Intercept Pharmaceuticals, Inc., 3.25%, 7/1/2023 | | | 918,000 | |
| | 1,350,000 | | | Jazz Investments I Ltd., 1.88%, 8/15/2021 | | | 1,438,594 | |
| | 550,000 | | | Medicines Co./The, 2.75%, 7/15/2023 | | | 577,844 | |
See accompanying notes which are an integral part of these financial statements.
6
Hedeker Strategic Appreciation Fund
Schedule of Investments (continued)
August 31, 2017
| | | | | | | | |
Principal
Amount | | | | | Fair Value | |
| | CONVERTIBLE BONDS – (continued) | |
| |
| | | | Health Care – (continued) | |
| $ | 750,000 | | | Nevro Corp., 1.75%, 6/1/2021 | | $ | 869,460 | |
| | 750,000 | | | PDL BioPharma, Inc., 2.75%, 12/1/2021 | | | 763,125 | |
| | 800,000 | | | Teligent, Inc., 3.75%, 12/15/2019 | | | 782,000 | |
| | 1,000,000 | | | Teva Pharmaceutical Finance Co. LLC, Series C, 0.25%, 2/1/2026 | | | 892,500 | |
| | | | | | | | |
| | | | | | | 11,902,500 | |
| | | | | | | | |
| |
| | | | Industrials – 11.44% | |
| | 500,000 | | | Astaldi SpA, 4.88%, 6/21/2024 | | | 583,929 | |
| | 300,000 | | | Carillion Finance (Jersey) Ltd., 2.50%, 12/19/2019 | | | 267,708 | |
| | 1,000,000 | | | Dycom Industries, Inc., 0.75%, 9/15/2021 | | | 1,107,500 | |
| | 1,217,000 | | | Echo Global Logistics, Inc., 2.50%, 5/1/2020 | | | 1,160,775 | |
| | 1,000,000 | | | Huron Consulting Group, Inc., 1.25%, 10/1/2019 | | | 928,125 | |
| | 300,000 | | | KeyW Holding Corp./The, 2.50%, 7/15/2019 | | | 278,640 | |
| | 300,000 | | | Trinity Industries, Inc., 3.88%, 6/1/2036 | | | 380,250 | |
| | 600,000 | | | Tutor Perini Corp., 2.88%, 6/15/2021 | | | 680,280 | |
| | 400,000 | | | Weatherford International PLC., 5.88%, 7/1/2021 | | | 403,808 | |
| | | | | | | | |
| | | | | | | 5,791,015 | |
| | | | | | | | |
| |
| | | | Information Technology – 24.04% | |
| | 1,000,000 | | | Cardtronics, PLC., 1.00%, 12/1/2020 | | | 928,125 | |
| | 500,000 | | | Electronics For Imaging, Inc., 0.75%, 9/1/2019 | | | 484,687 | |
| | 500,000 | | | Envestnet, Inc., 1.75%, 12/15/2019 | | | 508,750 | |
| | 1,150,000 | | | Finisar Corp., 0.50%, 12/15/2033 | | | 1,246,312 | |
| | 850,000 | | | Infinera Corp., 1.75%, 6/1/2018 | | | 879,750 | |
| | 800,000 | | | Integrated Device Technology, Inc., 0.88%, 11/15/2022 | | | 827,520 | |
| | 350,000 | | | j2 Global, Inc., 3.25%, 6/15/2029 | | | 440,562 | |
| | 850,000 | | | Liberty Interactive LLC, 4.00%, 11/15/2029 | | | 596,105 | |
| | 1,000,000 | | | ON Semiconductor Corp., 1.00%, 12/1/2020 | | | 1,150,000 | |
| | 800,000 | | | Pandora Media, Inc., 1.75%, 12/1/2020 | | | 754,500 | |
| | 1,600,000 | | | Synchronoss Technologies, Inc., 0.75%, 8/15/2019 | | | 1,514,000 | |
| | 800,000 | | | Veeco Instruments, Inc., 2.70%, 1/15/2023 | | | 738,500 | |
| | 1,200,000 | | | Verint Systems, Inc., 1.50%, 6/1/2021 | | | 1,158,000 | |
| | 850,000 | | | Viavi Solutions, Inc., 0.63%, 8/15/2033 | | | 919,594 | |
| | 25,000 | | | Yandex N.V., 1.13%, 12/15/2018 | | | 24,875 | |
| | | | | | | | |
| | | | | | | 12,171,280 | |
| | | | | | | | |
| |
| | | | Real Estate – 3.79% | |
| | 10,000 | | | Colony NorthStar, Inc., 3.88%, 1/15/2021 | | | 10,044 | |
| | 1,000,000 | | | Colony NorthStar, Inc., 5.00%, 4/15/2023 | | | 1,025,625 | |
| | 400,000 | | | Helical Bar Jersey Ltd., 4.00%, 6/17/2019 | | | 514,983 | |
| | 350,000 | | | RAIT Financial Trust, 4.00%, 10/1/2033 | | | 315,781 | |
| | 50,000 | | | Spirit Realty Capital, Inc., 2.88%, 5/15/2019 | | | 49,969 | |
| | | | | | | | |
| | | | | | | 1,916,402 | |
| | | | | | | | |
See accompanying notes which are an integral part of these financial statements.
7
Hedeker Strategic Appreciation Fund
Schedule of Investments (continued)
August 31, 2017
| | | | | | | | |
Principal
Amount | | | | | Fair Value | |
| | CONVERTIBLE BONDS – (continued) | |
| |
| | | | Utilities – 3.19% | |
| $ | 800,000 | | | Just Energy Group, Inc., 6.50%, 7/29/2019 | | $ | 822,000 | |
| | 750,000 | | | Pattern Energy Group, Inc., 4.00%, 7/15/2020 | | | 790,312 | |
| | | | | | | | |
| | | | | | | 1,612,312 | |
| | | | | | | | |
| | | | Total Convertible Bonds (Cost $46,842,007) | | | 46,570,171 | |
| | | | | | | | |
| | |
Shares | | | | | | |
| | CONVERTIBLE PREFERRED STOCKS – 5.88% | | | | |
| |
| | | | Energy – 0.49% | |
| | 5,000 | | | Chesapeake Energy Corp., 4.50% | | | 250,800 | |
| | | | | | | | |
| |
| | | | Financials – 5.39% | |
| | 33,203 | | | Capitala Finance Corp., 5.75% | | | 829,411 | |
| | 28,196 | | | Great Ajax Corp., 7.25% | | | 727,809 | |
| | 23,000 | | | NY Community Cap Trust V, 6.00% | | | 1,170,470 | |
| | | | | | | | |
| | | | | | | 2,727,690 | |
| | | | | | | | |
| | | | Total Convertible Preferred Stocks (Cost $2,983,034) | | | 2,978,490 | |
| | | | | | | | |
|
| | COMMON STOCKS – 0.81% | |
| |
| | | | Financials – 0.81% | |
| | 24,007 | | | KeyCorp | | | 413,162 | |
| | | | | | | | |
| | | | Total Common Stocks (Cost $454,141) | | | 413,162 | |
| | | | | | | | |
| |
| | MONEY MARKET SECURITIES – 3.24% | | | | |
| | 1,638,208 | | | Fidelity Investments Money Market Government Portfolio, Institutional Class, 0.93%(a) | | | 1,638,208 | |
| | | | | | | | |
| | | | Total Money Market Securities (Cost $1,638,208) | | | 1,638,208 | |
| | | | | | | | |
| | |
| | | | Total Investments – 101.93% (Cost $51,917,390) | | | 51,600,031 | |
| | | | | | | | |
| | |
| | | | Liabilities in Excess of Other Assets – (1.93)% | | | (979,326 | ) |
| | | | | | | | |
| | |
| | | | NET ASSETS – 100.00% | | $ | 50,620,705 | |
| | | | | | | | |
| (a) | | Rate disclosed is the seven day effective yield as of August 31, 2017. |
The sectors shown on the schedule of investments are based on Global Industry Classification Standard, or GICS® (“GICS”). The GICS was developed by and/or is the exclusive property of MSCI, Inc. and Standard & Poor’s Financial Services LLC (“S&P”). GICS is a service mark of MSCI, Inc. and S&P and has been licensed for use by the Administrator.
See accompanying notes which are an integral part of these financial statements.
8
Hedeker Strategic Appreciation Fund
Statement of Assets and Liabilities
August 31, 2017
| | | | |
Assets | | | | |
Investments in securities at fair value (cost $51,917,390) | | $ | 51,600,031 | |
Dividends and interest receivable | | | 294,624 | |
Deferred offering costs | | | 7,233 | |
Prepaid expenses | | | 747 | |
Total Assets | | | 51,902,635 | |
Liabilities | | | | |
Payable for investments purchased | | | 1,193,238 | |
Payable to Adviser | | | 42,286 | |
Payable to Administrator | | | 8,449 | |
Payable to auditors | | | 20,500 | |
Other accrued expenses | | | 17,457 | |
Total Liabilities | | | 1,281,930 | |
Net Assets | | $ | 50,620,705 | |
Net Assets consist of: | | | | |
Paid-in capital | | $ | 50,017,639 | |
Accumulated undistributed net investment income | | | 122,392 | |
Accumulated undistributed net realized gain from investments | | | 798,271 | |
Net unrealized depreciation on investments | | | (317,597 | ) |
Net Assets | | $ | 50,620,705 | |
Shares outstanding (unlimited number of shares authorized, no par value) | | | 1,987,226 | |
Net asset value (“NAV”), offering and redemption price per share | | $ | 25.47 | |
9
See accompanying notes which are an integral part of these financial statements.
Hedeker Strategic Appreciation Fund
Statement of Operations
For the period ended August 31, 2017(a)
| | | | |
Investment Income | | | | |
Dividend income | | $ | 86,958 | |
Interest income | | | 517,165 | |
Total investment income | | | 604,123 | |
Expenses | | | | |
Investment Adviser | | | 293,506 | |
Administration | | | 29,609 | |
Organizational | | | 22,500 | |
Fund accounting | | | 21,200 | |
Audit | | | 20,500 | |
Offering | | | 16,230 | |
Legal | | | 9,101 | |
Transfer agent | | | 8,355 | |
Printing | | | 5,878 | |
Pricing | | | 5,012 | |
Custodian | | | 4,589 | |
Compliance | | | 4,177 | |
Trustee | | | 2,710 | |
Registration | | | 786 | |
Miscellaneous | | | 15,109 | |
Net operating expenses | | | 459,262 | |
Net investment income | | | 144,861 | |
Net Realized and Change in Unrealized Gain (Loss) on Investments | | | | |
Net realized gain on investment securities transactions | | | 840,949 | |
Net realized loss on foreign currency translations | | | (37,140 | ) |
Net change in unrealized depreciation of investment securities and foreign currency translations | | | (317,597 | ) |
Net realized and change in unrealized gain on investments | | | 486,212 | |
Net increase in net assets resulting from operations | | $ | 631,073 | |
| (a) | | For the period December 21, 2016 (commencement of operations) to August 31, 2017. |
10
See accompanying notes which are an integral part of these financial statements.
Hedeker Strategic Appreciation Fund
Statement of Changes in Net Assets
| | | | |
| | | For the Period
Ended
August 31, 2017(a) | |
Increase (Decrease) in Net Assets due to: Operations | | | | |
Net investment income | | $ | 144,861 | |
Net realized gain on investment securities transactions and foreign currency translations | | | 803,809 | |
Net change in unrealized depreciation of investment securities and foreign currency translations | | | (317,597 | ) |
Net increase in net assets resulting from operations | | | 631,073 | |
Distributions From: | | | | |
Net investment income | | | (28,007 | ) |
Capital Transactions - Institutional Shares | | | | |
Proceeds from shares sold | | | 53,634,047 | |
Reinvestment of distributions | | | 28,007 | |
Amount paid for shares redeemed | | | (3,644,415 | ) |
Net increase in net assets resulting from capital transactions | | | 50,017,639 | |
Total Increase in Net Assets | | | 50,620,705 | |
Net Assets | | | | |
Beginning of period | | | — | |
End of period | | $ | 50,620,705 | |
Accumulated undistributed net investment income included in net assets at end of period | | $ | 122,392 | |
Share Transactions - Institutional Shares | | | | |
Shares sold | | | 2,130,213 | |
Shares issued in reinvestment of distributions | | | 1,093 | |
Shares redeemed | | | (144,080 | ) |
Net increase in shares outstanding | | | 1,987,226 | |
| (a) | | For the period December 21, 2016 (commencement of operations) to August 31, 2017. |
11
See accompanying notes which are an integral part of these financial statements.
Hedeker Strategic Appreciation Fund - Institutional Shares
Financial Highlights
Selected data for a share outstanding throughout the period.
| | | | |
| | | For the Period
Ended
August 31, 2017(a) | |
Net asset value, at beginning of period | | $ | 25.00 | |
| | | | |
| |
Income from investment operations: | | | | |
| |
Net investment income | | | 0.07 | |
| |
Net realized and unrealized gain on investments | | | 0.41 | |
| | | | |
| |
Total from investment operations | | | 0.48 | |
| | | | |
| |
Distributions from: | | | | |
| |
Net investment income | | | (0.01 | ) |
| | | | |
| |
Total from distributions | | | (0.01 | ) |
| | | | |
Net asset value, at end of period | | $ | 25.47 | |
| | | | |
| |
Total Return(b) | | | 1.94 | %(c) |
| | | | |
Ratios/Supplemental Data: | |
| |
Net assets at end of period (thousands) | | $ | 50,621 | |
| |
Ratio of expenses to average net assets | | | 1.56 | %(d) |
| |
Ratio of net investment income to average net assets | | | 0.49 | %(d) |
| |
Portfolio turnover | | | 113 | %(c) |
| (a) | | For the period December 21, 2016 (commencement of operations) through August 31, 2017. |
| (b) | | Total return in the above table represents the rate that the investor would have earned or lost on an investment in the Fund, assuming reinvestment of distributions. |
12
See accompanying notes which are an integral part of these financial statements.
Hedeker Strategic Appreciation Fund
Notes to the Financial Statements
August 31, 2017
NOTE 1. ORGANIZATION
The Hedeker Strategic Appreciation Fund (the “Fund”) was organized as a non-diversified series of Capitol Series Trust (the “Trust”) on December 15, 2016. The Trust is an open-end investment company established under the laws of Ohio by an Agreement and Declaration of Trust dated September 18, 2013 (the “Trust Agreement”). The Trust Agreement permits the Board of Trustees of the Trust (the “Board”) to issue an unlimited number of shares of beneficial interest of separate series without par value. The Fund is one of a series of funds currently authorized by the Board. The Fund’s investment adviser is Hedeker Wealth LLC (the “Adviser”). The investment objective of the Fund is to seek superior risk-adjusted returns over a market cycle.
The Fund currently offers one class of shares, Institutional Shares. The Fund commenced operations on December 21, 2016. Each share represents an equal proportionate interest in the assets and liabilities belonging to the Fund and is entitled to such dividends and distributions out of income belonging to the Fund as are declared by the Board.
NOTE 2. SIGNIFICANT ACCOUNTING POLICIES
The Fund is an investment company and follows accounting and reporting guidance under Financial Accounting Standards Board Accounting Standards Codification (“ASC”) Topic 946, “Financial Services-Investments Companies”. The following is a summary of significant accounting policies followed by the Fund in the preparation of its financial statements. These policies are in conformity with generally accepted accounting principles in the United States of America (“GAAP”).
Estimates – The preparation of financial statements in conformity with GAAP requires management to make estimates and assumptions that affect the reported amounts of assets and liabilities and disclosure of contingent assets and liabilities at the date of the financial statements and the reported amounts of increases and decreases in net assets from operations during the reporting period. Actual results could differ from those estimates.
Securities Valuation – All investments in securities are recorded at their estimated fair value as described in Note 3.
Federal Income Taxes – The Fund makes no provision for federal income tax or excise tax. The Fund intends to qualify each year as a regulated investment company (“RIC”) under subchapter M of the Internal Revenue Code of 1986, as amended, by complying with the requirements applicable to RICs and by distributing substantially all of its taxable income. The Fund also intends to distribute sufficient net investment income and net capital gains, if any, so that it will not be subject to excise tax on undistributed income and gains. If the required amount of net investment income or gains is not distributed, the Fund could incur a tax expense.
The Fund recognizes tax benefits or expenses of uncertain tax positions only when the position is “more likely than not” to be sustained assuming examination by tax authorities. Management of the Fund has reviewed tax positions taken in tax years that remain subject to examination by all major tax jurisdictions, including federal (i.e., the 2016 tax year end and the interim tax period since then, as applicable) and has concluded that no provision for unrecognized tax benefits or expenses is required in these financial statements and does not expect this to change over the next
13
Hedeker Strategic Appreciation Fund
Notes to the Financial Statements (continued)
August 31, 2017
twelve months. The Fund recognizes interest and penalties, if any, related to unrecognized tax benefits as income tax expense in the Statement of Operations. During the year, the Fund did not incur any interest or penalties.
Expenses – Expenses incurred by the Trust that do not relate to a specific fund of the Trust are allocated to the individual funds based on each fund’s relative net assets or another appropriate basis (as determined by the Board).
Security Transactions and Related Income – Throughout the reporting period, security transactions are accounted for no later than one business day following the trade date. For financial reporting purposes, security transactions are accounted for on trade date on the last business day of the reporting period. The specific identification method is used for determining gains or losses for financial statements and income tax purposes. Dividend income is recorded on the ex-dividend date. Interest income is recorded on an accrual basis and includes, where applicable, the amortization of premium or accretion of discount. Discounts and premiums on fixed income securities are accreted or amortized over the life of the respective securities using the effective interest method.
Dividends and Distributions – The Fund intends to distribute substantially all of its net investment income, if any, as dividends to its shareholders on a quarterly basis. The Fund intends to distribute its net realized long-term capital gains and its net realized short-term capital gains, if any, to its shareholders at least once a year. Distributions to shareholders are recorded on the ex-dividend date. The amounts of dividends from net investment income and distributions from net realized gains are determined in accordance with federal income tax regulations, which may differ from GAAP. These differences are caused primarily by differences in the timing of the recognition of certain components of income, expense or realized capital gains for federal income tax purposes. Where such differences are permanent in nature, they are reclassified in the components of net assets based on their ultimate characterization for federal income tax purposes. Any such reclassifications will have no effect on net assets, results of operations or net asset values per share of the Fund. For the period December 21, 2016 (commencement of operations) to August 31, 2017, the Fund made the following reclassifications of net assets, which was due to foreign currency reclassifications and deemed dividends from convertible bonds:
| | | | |
| Paid-in Capital | | Accumulated Undistributed
Net Investment Income | | Accumulated Net Realized
Gain from Investments |
$– | | $5,538 | | $(5,538) |
NOTE 3. SECURITIES VALUATION AND FAIR VALUE MEASUREMENTS
Fair value is defined as the price that the Fund would receive upon selling an investment in an orderly transaction to an independent buyer in the principal or most advantageous market of the investment. GAAP establishes a three-tier hierarchy to maximize the use of observable market data and minimize the use of unobservable inputs and to establish classification of fair value measurements for disclosure purposes.
Inputs refer broadly to the assumptions that market participants would use in pricing the asset or liability. Inputs may be observable or unobservable. Observable inputs are inputs that reflect the assumptions market participants would use in pricing the asset or liability developed based on
14
Hedeker Strategic Appreciation Fund
Notes to the Financial Statements (continued)
August 31, 2017
market data obtained from sources independent of the reporting entity. Unobservable inputs are inputs that reflect the reporting entity’s own assumptions about the assumptions market participants would use in pricing the asset or liability developed based on the best information available in the circumstances.
Various inputs are used in determining the value of the Fund’s investments. These inputs are summarized in the three broad levels listed below.
| | • | | Level 1 – unadjusted quoted prices in active markets for identical investments and/or registered investment companies where the value per share is determined and published and is the basis for current transactions for identical assets or liabilities at the valuation date |
| | • | | Level 2 – other significant observable inputs (including, but not limited to, quoted prices for an identical security in an inactive market, quoted prices for similar securities, interest rates, prepayment speeds, credit risk, etc.) |
| | • | | Level 3 – significant unobservable inputs (including the Fund’s own assumptions in determining fair value of investments based on the best information available) |
The inputs used to measure fair value may fall into different levels of the fair value hierarchy. In such cases, for disclosure purposes, the level in the fair value hierarchy within which the fair value measurement falls in its entirety is determined based on the lowest level input that is significant to the fair value measurement in its entirety.
In computing the net asset value (“NAV”) of the Fund, fair value is based on market valuations with respect to portfolio securities for which market quotations are readily available. Pursuant to Board approved policies, the Fund relies on independent third-party pricing services to provide the current market value of securities. Those pricing services value equity securities traded on a securities exchange at the last reported sales price on the principal exchange. Equity securities quoted by NASDAQ are valued at the NASDAQ Official Closing Price. If there is no reported sale on the principal exchange, equity securities are valued at the mean between the most recent quoted bid and asked price. When using the market quotations or close prices provided by the pricing service and when the market is considered active, the security will be classified as a Level 1 security.
Investments in open-end mutual funds, including money market mutual funds, are generally priced at the ending NAV provided by the pricing service of the funds. These securities are categorized as Level 1 securities.
Debt securities are valued using evaluated prices furnished by a pricing vendor selected by the Board. If the Adviser decides that a price provided by the pricing service does not accurately reflect the fair value of the securities or when prices are not readily available from a pricing service, securities are valued at fair value as determined by the Adviser, in conformity with guidelines adopted by and subject to review of the Board. These valuations are typically categorized as Level 2 or Level 3 in the fair value hierarchy, depending on the inputs used.
In accordance with the Trust’s valuation procedures, the Adviser is required to consider all appropriate factors relevant to the value of securities for which it has determined other pricing
15
Hedeker Strategic Appreciation Fund
Notes to the Financial Statements (continued)
August 31, 2017
sources are not available or reliable as described above. No single standard exists for determining fair value, because fair value depends upon the circumstances of each individual case. As a general principle, the current fair value of an issue of securities being valued by the Adviser would be the amount that the Fund might reasonably expect to receive for them upon their current sale. In determining the fair value of certain convertible bonds, the Adviser uses various inputs (including, but not limited to, listed equity prices, listed derivative prices, credit default swap spreads, corporate bond spreads, valuation models and historical prices) to determine a fair market midpoint price. If the fair market midpoint prices does not correlate to the price provided by the primary pricing vendor, the Adviser may utilize the price from other reliable, established sources to establish the fair value of certain convertible bonds.
The following is a summary of the inputs used to value the Fund’s investments as of August 31, 2017:
| | | | | | | | | | | | | | | | |
| | | Valuation Inputs | | | | |
| Assets | | Level 1 | | | Level 2 | | | Level 3 | | | Total | |
Convertible Bonds | | $ | — | | | $ | 46,570,171 | | | $ | — | | | $ | 46,570,171 | |
Convertible Preferred Stocks | | | 2,978,490 | | | | — | | | | — | | | | 2,978,490 | |
Common Stocks | | | 413,162 | | | | — | | | | — | | | | 413,162 | |
Money Market Securities | | | 1,638,208 | | | | — | | | | — | | | | 1,638,208 | |
Total | | $ | 5,029,860 | | | $ | 46,570,171 | | | $ | — | | | $ | 51,600,031 | |
The Fund did not hold any investments at any time during the reporting period in which significant unobservable inputs (Level 3) were used in determining fair value; therefore, no reconciliation of Level 3 securities is included for this reporting period. The Fund did not hold any derivative instruments during the reporting period.
The Trust recognizes transfers between fair value hierarchy levels at the end of the reporting period. There were no transfers between any levels as of August 31, 2017 based on input levels assigned on December 21, 2016 (commencement of operations).
NOTE 4. FEES AND OTHER TRANSACTIONS WITH AFFILIATES AND OTHER SERVICE PROVIDERS
Under the terms of the investment advisory agreement (the “Agreement”), the Adviser manages the Fund’s investments subject to approval of the Board. As compensation for its management services, the Fund is obligated to pay the Adviser a fee computed and accrued daily and paid monthly at an annual rate of 1.00% of the Fund’s average daily net assets. For the period December 21, 2016 (commencement of operations) to August 31, 2017 (the “Period”), the Adviser earned fees of $293,506 from the Fund. At August 31, 2017, the Fund owed the Adviser $42,286.
The Adviser has contractually agreed to waive its management fee and/or reimburse expenses so that total annual operating expenses (excluding (i) interest; (ii) taxes; (iii) brokerage fees and commissions; (iv) other extraordinary expenses not incurred in the ordinary course of the Fund’s business; (v) dividend expenses on short sales; and (vi) indirect expenses such as acquired fund fees and expenses; do not exceed 1.75% of the Fund’s average daily net assets through December 31, 2018. During any fiscal year that the Agreement between the Adviser and the Trust is in effect, the
16
Hedeker Strategic Appreciation Fund
Notes to the Financial Statements (continued)
August 31, 2017
Adviser may recoup the sum of all fees previously waived or expenses reimbursed for a period of 36 months following the month during which such fee waiver or expense reimbursement was made, less any reimbursement previously paid, if such recoupment can be achieved within the Expense Limitation as well as any expense limitation in effect at the time the reimbursement is made. This expense cap agreement may be terminated by the Board at any time. During the Period, the Adviser waived fees in the amount of $7,427 and subsequently recouped the full amount waived in accordance with the contractual expense limitation agreement.
The Trust retains Ultimus Fund Solutions, LLC (the “Administrator”) to provide the Fund with administration, compliance, fund accounting and transfer agent services, including all regulatory reporting. For the Period, the Administrator earned fees of $29,609 for administration services, $4,177 for compliance services, $21,200 for fund accounting services, and $8,355 for transfer agent services. At August 31, 2017, the Fund owed the Administrator $8,449 for such services.
The Board supervises the business activities of the Trust. Each Trustee serves as a Trustee for the lifetime of the Trust or until the earlier of his or her retirement as a Trustee at age 75, death, resignation or removal. “Independent Trustees,” which means that they are not “interested persons” as defined in the 1940 Act of the Trust, each receive annual compensation of $15,000 from the Trust. Each Committee Chairperson receives an additional annual compensation of $1,000 from the Trust. Independent Trustees also receive $1,000 for attending each special in-person meeting and up to $1,000 for attending special telephonic meetings, depending on the length of the telephonic meeting. In addition, the Trust reimburses Trustees for out-of-pocket expense incurred in conjunction with attendance at meetings.
The officers and one Trustee of the Trust are employees of the Administrator. Ultimus Fund Distributors, LLC (the Distributor”) acts as the principal distributor of the Fund’s shares. The Distributor operates as a wholly-owned subsidiary of Ultimus Fund Solutions, LLC.
NOTE 5. PURCHASES AND SALES OF SECURITIES
For the Period, purchases and sales of investment securities, other than short-term investments were as follows:
| | | | |
Purchases | | $ | 92,530,482 | |
Sales | | $ | 44,180,686 | |
There were no purchases or sales of long-term U.S. government obligations during the Period.
NOTE 6. FEDERAL TAX INFORMATION
As of August 31, 2017, the net unrealized appreciation (depreciation) of investments for tax purposes was as follows:
| | | | |
Gross unrealized appreciation | | $ | 932,111 | |
Gross unrealized depreciation | | | (1,297,662 | ) |
Net unrealized appreciation (depreciation) | | $ | (365,551 | ) |
17
Hedeker Strategic Appreciation Fund
Notes to the Financial Statements (continued)
August 31, 2017
At August 31, 2017, the aggregate cost of securities for federal income tax purposes was $51,965,344 for the Fund.
The tax characterization of distributions for the Period, was as follows:
| | | | |
| | | 2017 | |
Distributions paid from: | | | | |
Ordinary income | | $ | 28,007 | |
At August 31, 2017, the components of distributable earnings (accumulated losses) on a tax basis was as follows:
| | | | |
Undistributed Ordinary Income | | $ | 968,617 | |
Unrealized Appreciation (Depreciation) | | | (365,551 | ) |
Total Accumulated Earnings (Deficit) | | $ | 603,066 | |
The difference between book basis and tax basis unrealized appreciation (depreciation) is primarily attributable to the tax deferral of wash sales, interest accruals on complex securities and deemed dividends from convertible bonds.
NOTE 7. BENEFICIAL OWNERSHIP
The beneficial ownership, either directly or indirectly, of 25% or more of the voting securities of a fund creates a presumption of control of a fund, under Section 2(a) (9) of the Investment Company Act of 1940. At August 31, 2017, TD Ameritrade, Inc., owned, as record shareholder, 100% of the outstanding shares of the Fund. It is not known whether TD Ameritrade, Inc. or any of the underlying beneficial owners owned or controlled 25% or more of the voting securities of the Fund.
NOTE 8. COMMITMENTS AND CONTINGENCIES
The Fund indemnifies its officers and trustees for certain liabilities that may arise from the performance of their duties to the Fund. Additionally, in the normal course of business, the Fund enters into contracts that contain a variety of representations and warranties which provide general indemnifications. The Fund’s maximum exposure under these arrangements is unknown, as this would involve future claims that may be made against the Fund that have not yet occurred.
NOTE 9. SUBSEQUENT EVENTS
Management has evaluated events or transactions from August 31, 2017 through the date these financial statements were issued that would merit recognition or disclosure in the financial statements. There were no subsequent events to report that would have a material impact in the Funds’ financial statements.
18
Report of Independent Registered Public Accounting Firm
The Board of Trustees and Shareholders of
Capitol Series Trust
We have audited the accompanying statement of assets and liabilities, including the schedule of investments, of the Hedeker Strategic Appreciation Fund (the “Fund”), a series of the Capitol Series Trust, as of August 31, 2017, and the related statement of operations for the period December 21, 2016 (commencement of operations) through August 31, 2017, the statement of changes in net assets and financial highlights for the period then ended. The financial statements and financial highlights are the responsibility of the Fund’s management. Our responsibility is to express an opinion on the financial statements and financial highlights based on our audit.
We conducted our audit in accordance with the standards of the Public Company Accounting Oversight Board (United States). Those standards require that we plan and perform the audit to obtain reasonable assurance about whether the financial statements and financial highlights are free of material misstatement. We were not engaged to perform an audit of the Fund’s internal control over financial reporting. Our audit included consideration of internal control over financial reporting as a basis for designing audit procedures that are appropriate in the circumstances, but not for the purpose of expressing an opinion on the effectiveness of the Fund’s internal control over financial reporting. Accordingly, we express no such opinion. An audit also includes examining, on a test basis, evidence supporting the amounts and disclosures in the financial statements and financial highlights, assessing the accounting principles used and significant estimates made by management, and evaluating the overall financial statement presentation. Our procedures included confirmation of securities owned as of August 31, 2017, by correspondence with the custodian and brokers or by other appropriate auditing procedures where replies from brokers were not received. We believe that our audit provides a reasonable basis for our opinion.
In our opinion, the financial statements and financial highlights referred to above present fairly, in all material respects, the financial position of the Fund as of August 31, 2017, the results of its operations for the period December 21, 2016 (commencement of operations) through August 31, 2017, the changes in its net assets and financial highlights for the period then ended in conformity with U.S. generally accepted accounting principles.

Grandview Heights, Ohio
October 27, 2017
19
Summary of Fund Expenses (Unaudited)
As a shareholder of the Fund, you incur two types of costs: (1) transaction costs and (2) ongoing costs, including management fees, and other Fund expenses. These examples are intended to help you understand your ongoing costs (in dollars) of investing in the Fund and to compare these costs with the ongoing costs of investing in other mutual funds.
The Example is based on an investment of $1,000 invested at the beginning of the period and held for the entire period from March 1, 2017 through August 31, 2017.
Actual Expenses
The first line of the table provides information about actual account values and actual expenses. You may use the information in this line, together with the amount you invested, to estimate the expenses that you paid over the period. Simply divide your account value by $1,000 (for example, an $8,600 account value divided by $1,000 = 8.60), then multiply the result by the number in the first line under the heading “Expenses Paid During Period” to estimate the expenses you paid on your account during this period.
Hypothetical Example for Comparison Purposes
The second line of the table provides information about hypothetical account values and hypothetical expenses based on the Fund’s actual expense ratios and an assumed rate of return of 5% per year before expenses, which is not the Fund’s actual return. The hypothetical account values and expenses may not be used to estimate the actual ending account balances or expenses you paid for the period. You may use this information to compare the ongoing costs of investing in the Fund and other funds. To do so, compare this 5% hypothetical example with the 5% hypothetical examples that appear in the shareholder reports of the other funds.
Expenses shown in the table are meant to highlight your ongoing costs only and do not reflect any transactional costs such as the fee imposed on sales charges. Therefore, the second line of the table is useful in comparing ongoing costs only and will not help you determine the relative total costs of owning different funds. In addition, if transaction costs were included, your costs would have been higher.
20
Summary of Fund Expenses (Unaudited) (continued)
| | | | | | | | | | | | | | | | | | |
| | | | | Beginning
Account
Value
March 1,
2017 | | | Ending
Account
Value,
August 31,
2017 | | | Expenses
Paid
During
Period(a) | | | Annualized
Expense
Ratio | |
Hedeker Strategic Appreciation Fund | | | | | | | | | | | | | |
Institutional Shares | | Actual | | $ | 1,000.00 | | | $ | 1,010.90 | | | $ | 7.71 | | | | 1.52 | % |
| | | | | | | | | | | | | | | | | | |
| | Hypothetical(b) | | $ | 1,000.00 | | | $ | 1,017.54 | | | $ | 7.74 | | | | 1.52 | % |
| (a) | | Expenses are equal to the Fund’s annualized expense ratios, multiplied by the average account value over the period, multiplied by 184/365 (to reflect the one-half year period). |
| (b) | | Hypothetical Assumes a 5% return before expenses. |
Additional Federal Income Tax Information (Unaudited)
The Form 1099-DIV you receive in January 2018 will show the tax status of all distributions paid to your account in calendar year 2017. Shareholders are advised to consult their own tax adviser with respect to the tax consequences of their investment in the Fund. As required by the Internal Revenue Code and/or regulations, shareholders must be notified regarding the status of qualified dividend income for individuals and the dividends received deduction for corporations.
Qualified Dividend Income. The Fund designates approximately 5% or up to the maximum amount of such dividends allowable pursuant to the Internal Revenue Code, as qualified dividend income eligible for the reduced tax rate of 15%.
Dividends Received Deduction. Corporate shareholders are generally entitled to take the dividends received deduction on the portion of the Fund’s dividend distribution that qualifies under tax law. For the Fund’s calendar year 2017 ordinary income dividends, 6% qualifies for the corporate dividends received deduction.
21
Trustees and Officers (Unaudited)
The Board of Trustees supervises the business activities of the Trust. Each Trustee serves as a trustee until termination of the Trust unless the Trustee dies, resigns, retires or is removed.
The following tables provide information regarding the Trustees and Officers.
Independent Trustees
| | |
Name, Address,* Age, Position with Trust,** Term of Position with Trust | | Principal Occupation During Past 5 Years and Other Directorships |
Walter B. Grimm Age: 72 Trustee Began Serving: November 2013 | | Principal Occupations(s): President, Leigh Management Group, LLC (consulting firm) (October 2005 to present); President, Leigh Investments, Inc. (1988 to present); and Chief Financial Officer, East West Private, LLC (consulting firm) (March 2009 to present). |
Mary M. Morrow Age: 59 Trustee Began Serving: November 2013 | | Principal Occupations(s): Chief Operating Officer, Pennsylvania Health and Wellness (fully owned subsidiary of Centene Corporation) (November 2016 to present). Previous Position(s): Vice President, Strategic Initiatives, Gateway Heath (January 2015 to November 2016); Consulting Practice Manager, DST Health Solutions (August 2010 to January 2015); Director, Service and Client Relations, EBDS (August 2008 – May 2009); Independent Consultant, Healthcare Servicing May 2009 – August 2010). |
| * | | The address for each trustee is 225 Pictoria Drive, Suite 450, Cincinnati, OH 45246. |
| ** | | The Trust currently consists of 8 series. |
22
Trustees and Officers (Unaudited) (continued)
Interested Trustees & Officers
| | |
Name, Address,* Age, Position with Trust,** Term of Position with Trust | | Principal Occupation During Past 5 Years and Other Directorships |
Robert G. Dorsey*** Age: 60 Chairman of the Board and Trustee Began Serving: March 2017 | | Principal Occupation(s): President and Managing Director of Ultimus Fund Solutions, LLC and Ultimus Fund Distributors, LLC (1999 to present); Interested Trustee of Ultimus Managers Trust (February 2012 to present). Previous Position(s): President of Ultimus Managers Trust (June 2012 to October 2013). |
Matthew J. Miller Age: 41 Chief Executive Officer and President Began Serving: September 2013 | | Principal Occupation(s): Assistant Vice President, Relationship Management, Ultimus Fund Solutions, LLC (December 2015 to present); Vice President, Valued Advisers Trust (December 2011 to present). Previous Position(s): Vice President, Relationship Management, Huntington Asset Services, Inc. (n/k/a Ultimus Asset Services, LLC) (2008 to December 2015); Vice President, The Huntington Funds (February 2010 to April 2015); Vice President, Transfer Agency Operations, Huntington Asset Services, Inc. (2002 to 2008); Employed in various positions with Huntington Asset Services, Inc. (July 1998 to 2002). |
Zachary P. Richmond Age: 37 Treasurer and Chief Financial Officer Began Serving: August 2014 | | Principal Occupation(s): Assistant Vice President, Associate Director of Financial Administration, Ultimus Fund Solutions, LLC (December 2015 to present); Treasurer and Chief Financial Officer, Unified Series Trust (August 2014 to present); Treasurer and Chief Financial Officer, Commonwealth International Series Trust (September 2015 to present). Previous Position(s): Assistant Vice President, Fund Administration, Huntington Asset Services, Inc. (n/k/a Ultimus Asset Services, LLC) (January 2011 to December 2015); and Assistant Treasurer, Unified Series Trust (2011 to August 2014). |
23
Trustees and Officers (Unaudited) (continued)
| | |
Name, Address,* Age, Position with Trust,** Term of Position with Trust | | Principal Occupation During Past 5 Years and Other Directorships |
John C. Swhear Age: 56 Chief Compliance Officer Began Serving: September 2013 | | Principal Occupation(s): Assistant Vice President, Associate Director of Fund Administration, Ultimus Fund Solutions, LLC (May 2017 to present); Chief Compliance Officer of Unified Financial Securities, LLC (the Distributor) (July 2007 to present); Chief Compliance Officer, Vice President of Valued Advisers Trust (August 2008 to present); Secretary, The Cutler Trust (August 2017 to present); and Assistant Secretary, First Western Funds Trust (April 2017 to present). Previous Position(s): Associate Director of Compliance, Ultimus Fund Solutions, LLC (December 2015 to May 2017); President, Unified Series Trust (March 2012 to January 2016); Director, Huntington Asset Services, Inc. (n/k/a Ultimus Asset Services, LLC) (July 2014 to December 2015); Vice President of Legal Administration and Compliance, Huntington Asset Services, Inc. (April 2007 to December 2015); Director of Unified Financial Securities, Inc. (n/k/a Unified Financial Securities, LLC) (July 2014 to December 2015); Secretary, The Huntington Funds (April 2010 to February 2012); and Senior Vice President, Unified Series Trust (May 2007 to March 2012). |
Stacey Havens Age: 51 Vice President Began Serving: September 2013 | | Principal Occupation(s): Assistant Vice President, Relationship Management, Ultimus Fund Solutions, LLC (December 2015 to present). Previous Position(s): Vice President, Huntington Asset Services, Inc. (n/k/a Ultimus Asset Services, LLC) (July 1993 to December 2015). |
24
Trustees and Officers (Unaudited) (continued)
| | |
Name, Address,* Age, Position with Trust,** Term of Position with Trust | | Principal Occupation During Past 5 Years and Other Directorships |
Tiffany R. Franklin Age: 41 Secretary Began Serving: December 2015 | | Principal Occupation(s): Senior Paralegal, Ultimus Fund Solutions, LLC (December 2015 to present); Assistant Secretary, Wilshire Mutual Funds, Inc. and Wilshire Variable Insurance Trust (October 2016 to present); and Assistant Secretary, Cross Shore Discovery Fund (2017 to present; and Assistant Secretary, Caldwell & Orkin Funds, Inc. (June 2017 to present). Previous Position(s): Paralegal, Huntington Asset Services, Inc. (n/k/a Ultimus Asset Services, LLC) (April 2012 to December 2015); Assistant Secretary, Capitol Series Trust (September 2013 to December 2015); Assistant Secretary, The Huntington Funds, (November 2012 to December 2015); Assistant Secretary, Huntington Strategy Shares (November 2012 to December 2015); Secretary, The Huntington Funds (December 2015 to March 2016); and Secretary, Huntington Strategy Shares (December 2015 to March 2016). |
Stephen L. Preston Age: 51 Anti-Money Laundering Compliance Officer Began Serving: December 2016 | | Principal Occupation(s): Chief Compliance Officer, Ultimus Fund Solutions, LLC and Ultimus Fund Distributors, LLC from June 2011 to present. |
| * | | The address for each trustee and officer is 225 Pictoria Drive, Suite 450, Cincinnati, OH 45246. |
| ** | | The Trust currently consists of 8 series. |
| *** | | Mr. Dorsey is considered an “interested person” of the Trust within the meaning of Section 2(a)(19) of the 1940 Act because of his relationship with the Trust’s administrator, transfer agent, and distributors. |
Other Information (Unaudited)
The Fund’s Statement of Additional Information (“SAI”) includes additional information about the trustees and is available without charge, upon request. You may call toll-free at (800) 657-4450 to request a copy of the SAI or to make shareholder inquiries.
25
| | |
FACTS | | WHAT DOES CAPITOL SERIES TRUST DO WITH YOUR PERSONAL INFORMATION? |
| | |
| Why? | | Financial companies choose how they share your personal information. Federal law gives consumers the right to limit some but not all sharing. Federal law also requires us to tell you how we collect, share, and protect your personal information. Please read this notice carefully to understand what we do. |
| | |
| What? | | The types of personal information we collect and share depend on the product or service you have with us. This information can include: ◾ Social Security number ◾ account balances and account transactions ◾ account transactions, transaction or loss history and purchase history ◾ checking account information and wire transfer instructions When you are no longer our customer, we continue to share your information as described in this notice. |
| | |
| How? | | All financial companies need to share customers’ personal information to run their everyday business. In the section below, we list the reasons financial companies can share their customers’ personal information; the reasons Capitol Series Trust chooses to share; and whether you can limit this sharing. |
| | |
| Reasons we can share your personal information | | Does Capitol Series
Trust share? |
For our everyday business purposes — such as to process your transactions, maintain your account(s), respond to court orders and legal investigations, or report to credit bureaus | | Yes |
For our marketing purposes — to offer our products and services to you | | Yes |
| For joint marketing with other financial companies | | No |
For our affiliates’ everyday business purposes — information about your transactions and experiences | | No |
For our affiliates’ everyday business purposes — information about your creditworthiness | | No |
| For nonaffiliates to market to you | | No |
| | |
| Questions? | | Call 1-800-657-4450. |
26
| | |
| Who we are | | |
| Who is providing this notice? | | Capitol Series Trust |
| What we do | | |
| How does Capitol Series Trust protect my personal information? | | To protect your personal information from unauthorized access and use, we use security measures that comply with federal law. These measures include computer safeguards and secured files and buildings. |
| How does Capitol Series Trust collect my personal information? | | We collect your personal information, for example, when you ◾ open an account or deposit money ◾ buy securities from us or sell securities to us ◾ make deposits or withdrawals from your account provide account information ◾ give us your account information ◾ make a wire transfer ◾ tell us who receives the money ◾ tell us where to send the money ◾ show your government-issued ID ◾ show your driver’s license |
| Why can’t I limit all sharing? | | Federal law gives you the right to limit only ◾ sharing for affiliates’ everyday business purposes — information about your creditworthiness ◾ affiliates from using your information to market to you ◾ sharing for nonaffiliates to market to you State laws and individual companies may give you additional rights to limit sharing. |
| Definitions | | |
| Affiliates | | Companies related by common ownership or control. They can be financial and nonfinancial companies. |
| Nonaffiliates | | Companies not related by common ownership or control. They can be financial and nonfinancial companies. ◾ Capitol Series Trust does not share your personal information with nonaffiliates so they can market to you. |
| Joint marketing | | A formal agreement between nonaffiliated financial companies that together market financial products or services to you. ◾ Capitol Series Trust doesn’t jointly market financial products or services to you. |
27
PROXY VOTING (Unaudited)
A description of the policies and procedures that the Fund uses to determine how to vote proxies relating to portfolio securities and information regarding how the Fund voted those proxies during the most recent twelve month period ended June 30, is available without charge upon request by (1) calling the Fund at (800) 657-4450 and (2) from Fund documents filed with the Securities and Exchange Commission (“SEC”) on the SEC’s website at www.sec.gov.
TRUSTEES
Robert G. Dorsey, Chairman
Walter B. Grimm
Mary M. Morrow
OFFICERS
Matthew J. Miller, Chief Executive Officer and President
John C. Swhear, Chief Compliance Officer
Stacey Havens, Vice President
Zachary P. Richmond, Treasurer and Chief Financial Officer
Tiffany R. Franklin, Secretary
Stephen L. Preston, Anti-Money Laundering Compliance Officer
INVESTMENT ADVISER
Hedeker Wealth LLC
One Overlook Point, Suite 610
Lincolnshire, IL 60069
DISTRIBUTOR
Ultimus Fund Distributors, LLC
225 Pictoria Drive, Suite 450
Cincinnati, OH 45246
INDEPENDENT REGISTERED PUBLIC ACCOUNTING FIRM
Ernst & Young LLP
800 Yard Street, Suite 200
Grandview Heights, OH 43212
LEGAL COUNSEL
Bernstein Shur
100 Middle Street, 6th Floor
Portland, ME 04104
CUSTODIAN
Huntington National Bank
41 South High Street
Columbus, OH 43215
ADMINISTRATOR, TRANSFER AGENT AND FUND ACCOUNTANT
Ultimus Fund Solutions, LLC
225 Pictoria Drive, Suite 450
Cincinnati, OH 45246
This report is intended only for the information of shareholders or those who have received the Fund’s prospectus which contains information about the Fund’s management fee and expenses. Please read the prospectus carefully before investing.
Distributed by Ultimus Fund Distributors, LLC
Member FINRA/SIPC
Item 2. Code of Ethics.
As of the end of the period covered by this report, the registrant has adopted a code of ethics that applies to the registrant’s principal executive officer, principal financial officer, principal accounting officer or controller, or persons performing similar functions, regardless of whether these individuals are employed by the registrant or a third party. Pursuant to Item 12(a)(1), a copy of registrant’s code of ethics is filed as an exhibit to this Form N-CSR. During the period covered by this report, the code of ethics has not been amended, and the registrant has not granted any waivers, including implicit waivers, from the provisions of the code of ethics.
Item 3. Audit Committee Financial Expert.
(a)The registrant’s board of trustees has determined that the registrant does not have an audit committee financial expert. The committee members and the full Board considered a possibility of adding a member that would qualify as an expert. The audit committee determined that, although none of its members meet the technical definition of an audit committee expert, the committee has sufficient financial expertise to adequately perform its duties under the Audit Committee Charter without the addition of a qualified expert.
Item 4. Principal Accountant Fees and Services.
(a) Audit Fees billed to the registrant by its principal accountants for the two most recent fiscal years:
| | | | | | | | |
Meritage Funds: | | | FY 2017 | | | $ | 46,500 | |
| | | FY 2016 | | | $48,800 | |
| | | | | | | | |
| Preserver Alternative Opportunities Fund: | | | FY 2017 | | | $ | 15,500 | |
| | | FY 2016 | | | $ | 13,000 | |
| | |
| Hedeker Strategic Appreciation Fund: | | | FY 2017 | | | $ | 15,500 | |
(b) Audit-Related Fees billed to the registrant by its principal accountants for the two most recent fiscal years:
| | | | | | | | |
| Meritage Funds: | | | FY 2017 | | | $ | 0 | |
| | | FY 2016 | | | $ | 1,000 | |
| | |
| Preserver Alternative Opportunities Fund: | | | FY 2017 | | | $ | 0 | |
| | | FY 2016 | | | $ | 1,000 | |
| | |
| Hedeker Strategic Appreciation Fund: | | | FY 2017 | | | $ | 0 | |
c) Tax Fees billed to the registrant by its principal accountants for the two most recent fiscal years:
| | | | | | | | |
| Meritage Funds: | | | FY 2017 | | | $ | 15,000 | |
| | | FY 2016 | | | $ | 16,580 | |
| | |
| Preserver Alternative Opportunities Fund: | | | FY 2017 | | | $ | 5,000 | |
| | | FY 2016 | | | $ | 6,800 | |
| | |
| Hedeker Strategic Appreciation Fund: | | | FY 2017 | | | $ | 7,500 | |
Nature of the fees: Preparation of the 1120 RIC and Excise review and routine on-call services
(d) All other fees billed to the registrant by its principal accountants for the two most recent fiscal years:
| | | | | | | | |
| Meritage Funds: | | | FY 2017 | | | $ | 0 | |
| | | FY 2016 | | | $ | 0 | |
| | |
| Preserver Alternative Opportunities Fund: | | | FY 2017 | | | $ | 0 | |
| | | FY 2016 | | | $ | 0 | |
| | |
| Hedeker Strategic Appreciation Fund: | | | FY 2017 | | | $ | 0 | |
| (e) | (1) Audit Committee’s Pre-Approval Policies |
The Audit Committee Charter requires the Audit Committee to be responsible for the selection, retention or termination of auditors and, in connection therewith, to (i) evaluate the proposed fees and other compensation, if any, to be paid to the auditors, (ii) evaluate the independence of the auditors, (iii) pre-approve all audit services and, when appropriate, any non-audit services provided by the independent auditors to the Trust, (iv) pre-approve, when appropriate, any non-audit services provided by the independent auditors to the Trust’s investment adviser, or any entity controlling, controlled by, or under common control with the investment adviser and that provides ongoing services to the Trust if the engagement relates directly to the operations and financial reporting of the Trust, and (v) receive the auditors’ specific representations as to their independence;
| | (2) | Percentages of Services Approved by the Audit Committee |
Registrant
| | | | |
Audit-Related Fees: | | | N/A | |
Tax Fees: | | | 100 | % |
All Other Fees: | | | N/A | |
(f) During audit of registrant’s financial statements for the most recent fiscal year, less than 50 percent of the hours expended on the principal accountant’s engagement were attributed to work performed by persons other than the principal accountant’s full-time, permanent employees.
(g) The aggregate non-audit fees billed by the registrant’s accountant for services rendered to the registrant, and rendered to the registrant’s investment adviser (not including any sub-adviser whose role is primarily portfolio management and is subcontracted with or overseen by another investment adviser), and any entity controlling, controlled by, or under common control with the adviser that provides ongoing services to the registrant:
| | | | | | | | |
| | | Registrant | | | Adviser | |
FY 2017 | | $ | 27,500 | | | $ | 0 | |
FY 2016 | | $ | 23,380 | | | $ | 0 | |
(h) Not applicable. The auditor performed no services for the registrant’s investment adviser or any entity controlling, controlled by, or under common control with the investment adviser that provides ongoing services to the registrant.
Item 5. Audit Committee of Listed Registrants.
NOT APPLICABLE – applies to listed companies only
Item 6. Schedule of Investments. Schedules filed with Item 1.
Item 7. Disclosure of Proxy Voting Policies and Procedures for Closed-End Management Investment Companies.
NOT APPLICABLE – applies to closed-end funds only
Item 8. Portfolio Managers of Closed-End Management Investment Companies.
NOT APPLICABLE – applies to closed-end funds only
Item 9. Purchases of Equity Securities by Closed-End Management Investment Company and Affiliated Purchasers.
NOT APPLICABLE – applies to closed-end funds only
Item 10. Submission of Matters to a Vote of Security Holders.
The guidelines applicable to shareholders desiring to submit recommendations for nominees to the Registrant’s board of trustees are contained in the statement of additional information of the Trust with respect to the Fund(s) for which this Form N-CSR is being filed.
Item 11. Controls and Procedures.
(a) Based on their evaluation of the registrant’s disclosure controls and procedures (as defined in Rule 30a-3(c) under the Investment Company Act of 1940, as amended (the “Act”)) as of a date within 90 days of the filing date of this report, the registrant’s principal executive officer and principal financial officer have concluded that such disclosure controls and procedures are reasonably designed and are operating effectively to ensure that material information relating to the registrant is made known to them by others within those entities, particularly during the period in which this report is being prepared, and that the information required in filings on Form N-CSR is recorded, processed, summarized, and reported on a timely basis.
(b) There were no changes in the registrant’s internal control over financial reporting (as defined in Rule 30a-3(d) under the Investment Company Act of 1940) that occurred during the second fiscal quarter of the period covered by this report that have materially affected, or are reasonably likely to materially affect, the registrant’s internal control over financial reporting.
Item 12. Disclosure of Securities Lending Activities for Closed-End Management Investment Companies.
NOT APPLICABLE – applies to closed-end funds only
Item 13. Exhibits.
(a)(1) Code is filed herewith.
(a)(2) Certifications by the registrant’s principal executive officer and principal financial officer, pursuant to Section 302 of the Sarbanes- Oxley Act of 2002 and required by Rule 30a-2under the Investment Company Act of 1940 are filed herewith.
(a)(3) Not applicable.
(b) Certifications pursuant to Rule 30a-2(b) are furnished herewith.
SIGNATURES
Pursuant to the requirements of the Securities Exchange Act of 1934 and the Investment Company Act of 1940, the registrant
has duly caused this report to be signed on its behalf by the undersigned, thereunto duly authorized.
(Registrant) Capitol Series Trust
| | | | |
By (Signature and Title) | | /s/ Matthew J. Miller | | |
| | Matthew J. Miller, Chief Executive Officer and President | | |
| |
Date 10/30/17 | | |
Pursuant to the requirements of the Securities Exchange Act of 1934 and the Investment Company Act of 1940, this report has been signed below by the following persons on behalf of the registrant and in the capacities and on the dates indicated.
| | | | |
| By (Signature and Title) | | /s/ Matthew J. Miller | | |
| | Matthew J. Miller, Chief Executive Officer and President | | |
| |
Date 10/30/17 | | |
| | |
By (Signature and Title) | | /s/ Zachary P. Richmond | | |
| | Zachary P. Richmond, Treasurer and Chief Financial Officer | | |
| |
Date 10/30/17 | | |