UNITED STATES
SECURITIES AND EXCHANGE COMMISSION
Washington, D.C. 20549
FORM N-CSR
CERTIFIED SHAREHOLDER REPORT OF REGISTERED
MANAGEMENT INVESTMENT COMPANIES
Investment Company Act file number: 811-22895
Capitol Series Trust
(Exact name of registrant as specified in charter)
Ultimus Asset Services, LLC
225 Pictoria Drive, Suite 450
Cincinnati, OH 45246
(Address of principal executive offices) (Zip code)
Zachary P. Richmond
Ultimus Asset Services, LLC
225 Pictoria Drive, Suite 450
Cincinnati, OH 45246
(Name and address of agent for service)
Registrant’s telephone number, including area code: 513-587-3400
Date of fiscal year end: April 30
Date of reporting period: April 30, 2018
Item 1. Reports to Stockholders.

Canterbury Portfolio Thermostat Fund
Institutional Shares – CAPTX
Annual Report
April 30, 2018
Canterbury Investment Management, LLC
23 East Cedar Street
Zionsville, Indiana 46077
(844) 838-2121
Portfolio Managers’ Letter to Our Shareholders (Unaudited) April 30, 2018 |
We have entered an unprecedented time of innovation in new, cutting-edge technologies. This new age of enlightenment has led to the development of complex software algorithms, the growth of powerful investment platforms, and the evolution of unique liquid securities, such as Exchange Traded Funds (“ETFs”). The creation of ETFs has made it possible for investors to participate in highly diverse and specialized asset classes in ways that would have been unimaginable as late as the 1990s.
With these innovations have come the potential for momentous change, bringing opportunities to make game-changing improvements in how we invest. The full benefits of new technology, however, will not be realized until after the development of equally sophisticated applications have had a chance to catch up.
Just as personal computing devices heralded new opportunities, it was only in conjunction with applications, such as Google and mapping programs, that they really began to change our daily experience. The successful marriage of technology and applications has created many revolutionary advancements and in doing so, made possible what was before, impossible.
New Technologies Require New Strategies:
We have at our disposal all the investment tools necessary to manage any market environment – bull or bear. Unfortunately, as investment tools continue to advance, most portfolio management methods remain remarkably the same.
The primary challenge facing portfolio managers and investors is overcoming the years of “conventional wisdoms” that have been treated as unquestioned truths. Today, there are several conventional wisdoms in portfolio management. Assumptions like the risk/return relationship, subjective risk tolerance driving asset allocation, and a buy, hold, rebalance strategy have failed to manage the complexities of bear markets.
Breakthrough opportunities require equally innovative strategies to manage the complexities caused by many choices. Complex strategies can take a great deal of time to develop, program and stress test to provide statistically significant predictive value.
The Canterbury Portfolio Thermostat Fund (“CAPTX” or the “Fund”)
The Canterbury Portfolio Thermostat Fund is an adaptive, comprehensive, portfolio management strategy. The need for such a process arose from the recognition that there is no single fixed portfolio that can maintain stability through variable markets. Instead, the most “efficient portfolio” is the one that can adapt and potentially benefit from the existing market environment – Bull or Bear.
1
The financial markets and weather both experience variable, and sometimes hostile, environments over time. Just as the home thermostat constantly adapts to stabilize the indoor temperature, so too does the Portfolio Thermostat model by employing an adaptive portfolio strategy to adjust the fund’s ETFs holdings to move in concert with the ever-changing markets.
The period from August 2, 2016 to April 30, 2018 has highlighted the counterintuitive nature of supply and demand in markets. If you turn on your television, you will often hear about the latest world news that is supposedly driving the market’s movements. Many experts will tell you that markets dislike periods of high uncertainty or the anticipation of unknown outcomes to short-term events.
As I look at the last year, there have been several major short-term “unknowns”: Trump is elected President; North Korea launches a ballistic missile over Japan; hurricanes Harvey, Irma, and Maria cause billions of dollars in damages to the U.S. and Puerto Rico; wildfires scorch millions of acres in the western United States; Terrorist attacks on Las Vegas and Texas; the fight over Obamacare continues; United States cancels the Trans-Pacific Partnership and threatens tariffs, etc.
If markets are driven by news and events, one might have expected that risk and volatility were high in the last year through January of 2018. Contrary to popular beliefs, this period was the second longest streak of exceedingly low volatility, meaning the market’s risk was very low. Up to April 30th, 2018, the maximum drawdown in the S&P 500® Index (“S&P 500”) has only been -10.16%, which is a normal bull market correction. Regardless of all the uncertainties in the last year, the market’s risk has been limited.
The Fund has behaved in an efficient manner since inception. The highest recorded volatility reading, according to the Canterbury Volatility Index (CVI — Canterbury’s primary volatility indicator — CVI less than 90 or declining CVI is a bullish, stable sign), was CVI 72, and the maximum decline, from peak to trough, was -7.37%. These statistics show that CAPTX has been successful in meeting its primary objectives of maintaining an efficient portfolio with stable volatility and limited drawdowns.
The Fund met its primary internal objectives:
● | Fund has maintained a bullish “Portfolio State,” from its inception. |
● | The maximum, peak to trough decline (drawdown) is less than 10% (-7.37%). |
● | CAPTX’s maximum volatility was (CVI 72). Stable. |
● | The Fund has maintained an efficient “benefit of diversification” by adapting its holdings to combat variable environments. The benefit of diversification (“B.o.D”) is a measurement of correlation among a portfolio’s securities that utilizes CVI as its primary indicator. For |
2
example: the average position CVI of a portfolio is 100, but the Fund CVI is 70, then there would be a B.o.D of 30%. A B.o.D of 0 would mean securities within the portfolio are perfectly correlated; a B.o.D of 100 means the portfolio is perfectly hedged.
It is important to understand that random times like months, quarters or years have little or no correlation with markets. It only takes a few adjustments in the periods used to see a substantial difference in results.
● | The only important calendar is the investor’s life calendar. Investing is a lifetime process. |
● | The most important factor in long-term returns is risk management. One must have a methodology to limit portfolio declines to normal bull market corrections of 8% to 12% measured from the highest peak value. |
● | A portfolio should not trade-off return for lower risk by holding substantial amounts of cash or short-term bonds. Low risk can be maintained by holding the most efficient combination of securities to match the current market environment. The most efficient portfolio is the one that can produce the highest returns while incurring the least risk. |
CAPTX Benchmark Comparisons
It is important to remember the Canterbury Portfolio Thermostat Fund is an “adaptive portfolio strategy.” CAPTX adjusts its percentage asset allocations and diversification to match the existing market environment, while fixed style specific benchmarks do not adjust and therefore will have periods of outperformance and under performance.
CAPTX focuses on meeting several “internal” benchmarks, which were mentioned earlier. If the fund remained stable and has remained in a bullish Portfolio State since its inception, then it is meeting its objective.
Canterbury Portfolio Thermostat Fund vs. Benchmarks
Year Ended April 30, 2018
| | Return | Max Drawdown* |
Canterbury Portfolio Thermostat Fund | 6.85% | -7.37% |
Russell 3000® Index | 13.05% | -9.87% |
MSCI World Index | 13.84% | -9.61% |
Bloomberg Barclays US Treasury 20+ Index | 0.22% | -9.70% |
S&P 500® Index | 13.27% | -10.16% |
| | | |
60% S&P 500 / 40% Treasury Bond | 8.57% | |
70% MSCI World / 30% Treasury Notes | 7.51% | |
| * | Max Drawdown was calculated by taking the highest peak during the above period to the lowest low. Interactive Data provided the data that was used in the above calculations. |
3
The Benchmarks used above consist of the following from Orion Advisors.
60% S&P 500 / 40% Treasury Bond consists of S&P 500 and Bloomberg Barclays US Treasury 20 year Index.
70% MSCI World / 30% Treasury Notes consists of MSCI World Index and Bloomberg Barclays US Treasury 3-7 year Index.
These benchmarks are rebalanced daily.
Best and Worst Performing Holdings
Best | |
iShares U.S. Aerospace & Defense (ITA) | 26.39% |
First Trust Nasdaq 100 Technology Sector (QTEC) | 24.67% |
PowerShares MSCI Global Timber (CUT) | 22.98% |
| | |
Worst | |
iPath Bloomberg Copper Index (JJC) | -9.56% |
SPDR Gold Trust (GLD) | -6.43% |
Financials Select Sector SPDR (XLF) | -5.91% |
The Fund typically owns approximately 11 to 14 ETFs. These ETFs are chosen from a universe of over 200 Equity and Alternative to Global Equity Funds. The ETFs are selected for the portfolio based on their Security State rating (from 1 to 12), Volatility Weighted Relative Strength ranking, and their role in improving the benefit of diversification (portfolio efficiency).
Thomas L. Hardin, CMT
Chief Investment Officer
4
Investment Results (Unaudited) | |
Average Annual Total Returns(a) as of April 30, 2018
| One Year | Since
Inception
(8/2/16) |
Canterbury Portfolio Thermostat Fund, Institutional Shares | 6.85% | 7.33% |
MSCI World Index (b) | 13.84% | 15.00% |
Russell 3000® Index (c) | 13.05% | 14.98% |
| | Expense Ratios(d) Institutional Shares |
Gross | 3.43% |
With Applicable Waivers | 1.75% |
The performance quoted represents past performance, which does not guarantee future results. The investment return and principal value of an investment will fluctuate so that an investor’s shares, when redeemed, may be worth more or less than their original cost. The returns shown do not reflect deduction of taxes that a shareholder would pay on Canterbury Portfolio Thermostat Fund (the “Fund”) distributions or the redemption of Fund shares. Current performance of the Fund may be lower or higher than the performance quoted. The Fund’s investment objectives, risks, charges and expenses must be considered carefully before investing. Performance data current to the most recent month end may be obtained by calling (844) 838-2121.
| (a) | Return figures reflect any change in price per share and assume the reinvestment of all distributions. The Fund’s returns reflect any fee reductions during the applicable period and exclude the redemption fee. If such fee reductions had not occurred, the quoted performance would have been lower. |
| (b) | The MSCI World Index is an unmanaged free float-adjusted market capitalization index that is designed to measure global developed market equity performance. Currently the MSCI World Index consists of the following 23 developed market country indices: Australia, Austria, Belgium, Canada, Denmark, Finland, France, Germany, Hong Kong, Ireland, Israel, Italy, Japan, Netherlands, New Zealand, Norway, Portugal, Singapore, Spain, Sweden, Switzerland, the United Kingdom and the United States. The performance of the index is expressed in terms of U.S. dollars, and does not reflect the deduction of fees or taxes with a mutual fund, such as investment management and fund accounting fees. Individuals cannot invest directly in an index; however, an individual can invest in exchange traded funds or other investment vehicles that attempt to track the performance of a benchmark index. |
| (c) | The Russell 3000® Index is a widely recognized unmanaged index of equity securities and is representative of a broader domestic equity market and range of securities than is found in the Fund’s portfolio. Individuals cannot invest directly in an index; however, an individual can invest in exchange traded funds or other investment vehicles that attempt to track the performance of a benchmark index. |
| (d) | The expense ratios are from the Fund’s prospectus dated August 28, 2017. Canterbury Investment Management, LLC, the Fund’s adviser (the “Adviser”), has contractually agreed to waive its management fee and/or reimburse expenses so that total annual operating expenses for the Fund (excluding (i) interest; (ii) taxes; (iii) brokerage fees and commissions; (iv) other extraordinary expenses not incurred in the ordinary course of the Fund’s business; (v) dividend expense on short sales; and (vi) indirect expenses such as acquired fund fees and expenses) do not exceed 1.30% of the average daily net assets of the Fund’s Institutional Shares through January 1, 2019. So long as the Investment Advisory Agreement between the Adviser and Capitol Series Trust (the “Trust”) is in effect, the Adviser will recoup the sum of all fees previously waived or expenses reimbursed during any of the previous 36 months, less any reimbursement previously paid, if such recoupment can be achieved within the foregoing expense limits, as well as any expense limitation in effect at the time the reimbursement is made. This expense limitation agreement may be terminated by |
5
Investment Results (Unaudited) (continued) | |
the Board of Trustees (the “Board”) at any time. Additional information pertaining to the Fund’s expense ratios as of April 30, 2018, can be found in the financial highlights. The Institutional Shares Gross Expense Ratio and Expense Ratio with Applicable Waivers do not correlate to the corresponding ratios of expenses to average net assets included in the Financial Highlights section of the this Annual Report, which reflect the operating expenses of the Fund and do not include acquired fund fees and expenses (“AFFE”).
The Fund’s investment objectives, strategies, risks, charges and expenses must be considered carefully before investing. The prospectus contains this and other important information about the Fund and may be obtained by calling the same number as above. Please read it carefully before investing.
The Fund is distributed by Unified Financial Securities, LLC, member FINRA/SIPC.
6
Investment Results (Unaudited) (continued) | |
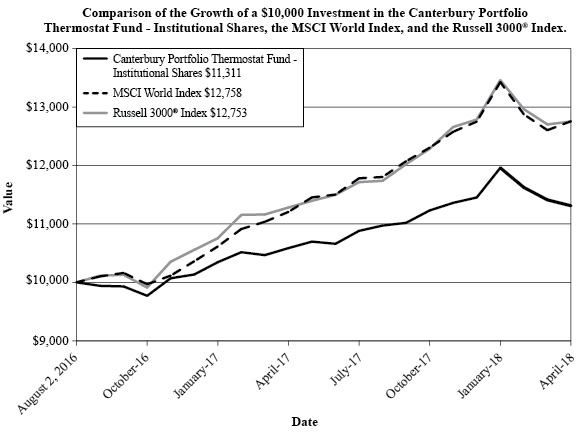
The chart above assumes an initial investment of $10,000 made on August 2, 2016 (commencement of operations) and held through April 30, 2018. THE FUND’S RETURNS REPRESENT PAST PERFORMANCE AND DO NOT GUARANTEE FUTURE RESULTS. The returns shown do not reflect deduction of taxes that a shareholder would pay on the Fund’s distributions or the redemption of the Fund’s shares. Investment returns and principal values will fluctuate so that your shares, when redeemed, may be worth more or less than their original purchase price.
Current performance may be lower or higher than the performance data quoted. For more information on the Fund, and to obtain performance data current to the most recent month-end, or to request a prospectus, please call (844) 838-2121. You should carefully consider the investment objectives, potential risks, management fees, and charges and expenses of the Fund before investing. The Fund’s prospectus contains this and other information about the Fund, and should be read carefully before investing.
The Fund is distributed by Unified Financial Securities, LLC, Member FINRA/SIPC.
7
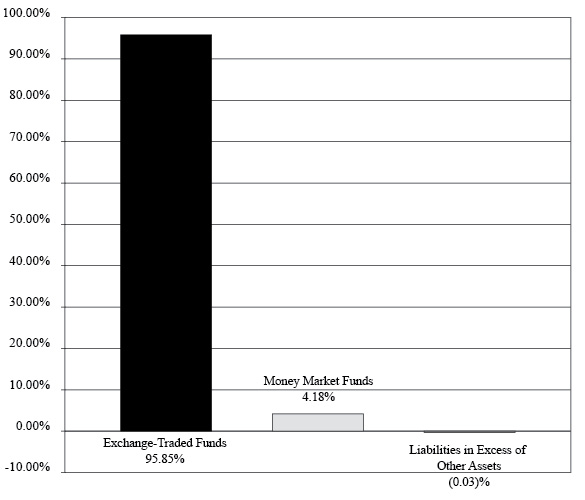
Portfolio Illustration (Unaudited)
April 30, 2018 |
|
The following chart gives a visual breakdown of the Fund’s holdings as a percentage of net assets.
Availability of Portfolio Schedule (Unaudited)
The Fund files its complete schedule of portfolio holdings with the Securities and Exchange Commission (“SEC”) for the first and third quarters of each fiscal year on Form N-Q. The Fund’s Forms N-Q are available at the SEC’s website at www.sec.gov. The Fund’s Forms N-Q may be reviewed and copied at the Public Reference Room in Washington DC. Information on the operation of the Public Reference Room may be obtained by calling 1-800-SEC-0330.
8
Canterbury Portfolio Thermostat Fund
Schedule of Investments
April 30, 2018
| | | Shares | | | Fair
Value | |
| EXCHANGE-TRADED FUNDS — 95.85% | | | | | | |
| Financial Select Sector SPDR Fund | | | 89,180 | | | $ | 2,447,991 | |
| iShares International Treasury Bond ETF | | | 54,665 | | | | 2,751,836 | |
| iShares MSCI EAFE ETF | | | 34,970 | | | | 2,473,778 | |
| iShares MSCI Emerging Markets ETF | | | 51,465 | | | | 2,414,738 | |
| iShares MSCI Thailand ETF | | | 17,940 | | | | 1,748,612 | |
| iShares Russell 1000 Growth ETF | | | 31,515 | | | | 4,300,222 | |
| iShares S&P SmallCap 600 Growth ETF | | | 16,090 | | | | 2,806,901 | |
| iShares U.S. Aerospace & Defense ETF | | | 12,500 | | | | 2,404,375 | |
| iShares U.S. Broker-Dealers & Securities Exchanges ETF | | | 32,280 | | | | 2,124,347 | |
| O'Shares FTSE US Quality Dividend ETF | | | 80,895 | | | | 2,438,984 | |
PowerShares CurrencyShares Japanese Yen Trust(a) | | | 31,615 | | | | 2,771,054 | |
| PowerShares MSCI Global Timber Portfolio | | | 74,490 | | | | 2,465,619 | |
| Technology Select Sector SPDR Fund | | | 37,390 | | | | 2,447,549 | |
| Total Exchange-Traded Funds Cost ($32,423,724) | | | | | | | 33,596,006 | |
| | | | | | | | | |
| MONEY MARKET FUNDS — 4.18% | | | | | | | | |
Morgan Stanley Institutional Liquidity Government Portfolio - Institutional Class, 1.61%(b) | | | 1,465,275 | | | | 1,465,275 | |
| Total Money Market Funds (Cost $1,465,275) | | | | | | | 1,465,275 | |
| | | | | | | | | |
| Total Investments — 100.03% (Cost $33,888,999) | | | | | | | 35,061,281 | |
| Liabilities in Excess of Other Assets — (0.03)% | | | | | | | (10,094 | ) |
| NET ASSETS — 100.00% | | | | | | $ | 35,051,187 | |
| (a) | Non-income producing security. |
| (b) | Rate disclosed is the seven day effective yield as of April 30, 2018. |
ETF - Exchange-Traded Fund
SPDR - Standard & Poor’s Depositary Receipt
See accompanying notes which are an integral part of these financial statements.
9
Canterbury Portfolio Thermostat Fund
Statement of Assets and Liabilities
April 30, 2018
| Assets |
| Investments in securities at fair value (cost $33,888,999) | | $ | 35,061,281 | |
| Receivable for fund shares sold | | | 23,149 | |
| Dividends receivable | | | 7,961 | |
| Prepaid expenses | | | 25,413 | |
| Total Assets | | | 35,117,804 | |
| Liabilities |
| Payable for fund shares redeemed | | | 9,307 | |
| Payable to Adviser | | | 20,623 | |
| Payable to Administrator | | | 6,168 | |
| Payable to auditors | | | 21,500 | |
| Other accrued expenses | | | 9,019 | |
| Total Liabilities | | | 66,617 | |
| Net Assets | | $ | 35,051,187 | |
| Net Assets consist of: | | | | |
| Paid-in capital | | $ | 33,654,733 | |
| Accumulated net investment loss | | | (29,790 | ) |
| Accumulated net realized gain from investments | | | 253,962 | |
| Net unrealized appreciation on investments | | | 1,172,282 | |
| Net Assets | | $ | 35,051,187 | |
| Shares outstanding (unlimited number of shares authorized, no par value) | | | 3,142,372 | |
Net asset value, offering and redemption price per share (a) | | $ | 11.15 | |
| (a) | Subject to certain exceptions, a 2.00% redemption fee is imposed upon shares redeemed within 90 calendar days of their purchase. |
10
See accompanying notes which are an integral part of these financial statements.
Canterbury Portfolio Thermostat Fund
Statement of Operations
For the Year Ended April 30, 2018
| Investment Income | | | |
| Dividend income | | $ | 445,242 | |
| Total investment income | | | 445,242 | |
| Expenses | | | | |
| Investment Adviser | | | 217,882 | |
| Registration | | | 40,212 | |
| Audit and tax preparation | | | 24,150 | |
| Administration | | | 23,751 | |
| Fund accounting | | | 22,250 | |
| Transfer agent | | | 19,563 | |
| Printing | | | 14,021 | |
| Legal | | | 12,698 | |
| Offering | | | 7,101 | |
| Custodian | | | 5,567 | |
| Trustee | | | 5,250 | |
| Insurance | | | 3,695 | |
| Pricing | | | 386 | |
| Miscellaneous | | | 22,270 | |
| Total expenses | | | 418,796 | |
| Fees contractually waived by Adviser | | | (104,040 | ) |
| Net operating expenses | | | 314,756 | |
| Net investment income | | | 130,486 | |
| Net Realized and Change in Unrealized Gain (Loss) on Investments |
| Net realized gain on investment securities transactions | | | 502,292 | |
| Net change in unrealized appreciation (depreciation) of investment securities | | | 410,400 | |
| Net realized and change in unrealized gain on investments | | | 912,692 | |
| Net increase in net assets resulting from operations | | $ | 1,043,178 | |
See accompanying notes which are an integral part of these financial statements.
11
Canterbury Portfolio Thermostat Fund
Statements of Changes in Net Assets
| | | For the
Year Ended
April 30, 2018 | | | For the
Period Ended
April 30, 2017(a) | |
Increase (Decrease) in Net Assets due to: Operations | | | | | | |
| Net investment income | | $ | 130,486 | | | $ | 42,227 | |
| Long term capital gain dividends from investment companies | | | — | | | | 2,663 | |
| Net realized gain (loss) on investment securities transactions | | | 502,292 | | | | (144,955 | ) |
| Net change in unrealized appreciation (depreciation) of investment securities | | | 410,400 | | | | 761,882 | |
| Net increase in net assets resulting from operations | | | 1,043,178 | | | | 661,817 | |
| Distributions From | | | | | | | �� | |
| Net investment income | | | (161,561 | ) | | | (43,204 | ) |
| Net realized gains | | | (104,432 | ) | | | — | |
| Total distributions | | | (265,993 | ) | | | (43,204 | ) |
| Capital Transactions - Institutional Shares | | | | | | | | |
| Proceeds from shares sold | | | 26,189,410 | | | | 15,550,642 | |
| Reinvestment of distributions | | | 265,993 | | | | 43,204 | |
| Amount paid for shares redeemed | | | (7,001,665 | ) | | | (1,428,319 | ) |
Proceeds from redemption fees(b) | | | 36,124 | | | | — | |
| Total Capital Transactions - Institutional Shares | | | 19,489,862 | | | | 14,165,527 | |
| Total Increase in Net Assets | | | 20,267,047 | | | | 14,784,140 | |
| Net Assets | | | | | | | | |
| Beginning of year | | | 14,784,140 | | | | — | |
| End of year | | $ | 35,051,187 | | | $ | 14,784,140 | |
| Accumulated net investment income (loss) | | $ | (29,790 | ) | | $ | 1,314 | |
| Share Transactions - Institutional Shares | | | | | | | | |
| Shares sold | | | 2,341,205 | | | | 1,537,028 | |
| Shares issued in reinvestment of distributions | | | 23,777 | | | | 4,265 | |
| Shares redeemed | | | (625,396 | ) | | | (138,507 | ) |
| Total Share Transactions- Institutional Shares | | | 1,739,586 | | | | 1,402,786 | |
| (a) | For the period August 2, 2016 (commencement of operations) through April 30, 2017. |
| (b) | Subject to certain exceptions, a 2.00% redemption fee is imposed upon shares redeemed within 90 calendar days of their purchase. |
12
See accompanying notes which are an integral part of these financial statements.
Canterbury Portfolio Thermostat Fund-Institutional Shares Financial Highlights Selected data for a share outstanding throughout each period. |
| | | For the
Year Ended
April 30, 2018 | | | For the
Period Ended
April 30, 2017(a) | |
| Net asset value, at beginning of period | | $ | 10.54 | | | $ | 10.00 | |
| Income from investment operations: | | | | | | | | |
| Net investment income | | | 0.06 | | | | 0.04 | |
| Net realized and unrealized gain on investments | | | 0.65 | | | | 0.54 | |
| Total from investment operations | | | 0.71 | | | | 0.58 | |
| Distributions from: | | | | | | | | |
| Net investment income | | | (0.07 | ) | | | (0.04 | ) |
| Net realized gain | | | (0.04 | ) | | | — | |
| Total from distributions | | | (0.11 | ) | | | (0.04 | ) |
| Paid-in capital for redemptions fees | | | 0.01 | | | | — | |
| Net asset value, at end of period | | $ | 11.15 | | | $ | 10.54 | |
Total Return (b) | | | 6.85 | % | | | 5.86 | %(c) |
| Ratios/Supplemental Data: | | | | | | | | |
| Net assets at end of period (thousands) | | $ | 35,051 | | | $ | 14,784 | |
| Before waiver: | | | | | | | | |
| Ratio of expenses to average net assets | | | 1.73 | % | | | 2.98 | %(d) |
| After waiver: | | | | | | | | |
| Ratio of expenses to average net assets | | | 1.30 | % | | | 1.30 | %(d) |
| Ratio of net investment income to average net assets | | | 0.54 | % | | | 0.63 | %(d) |
| Portfolio turnover | | | 116 | % | | | 92 | %(c) |
| (a) | For the period August 2, 2016 (commencement of operations) through April 30, 2017. |
| (b) | Total return in the above table represents the rate that the investor would have earned or lost on an investment in the Fund, assuming reinvestment of distributions. Excludes redemption fee. |
See accompanying notes which are an integral part of these financial statements.
13
Canterbury Portfolio Thermostat Fund
Notes to the Financial Statements
April 30, 2018
NOTE 1. ORGANIZATION
The Canterbury Portfolio Thermostat Fund (the “Fund”) was organized as a diversified series of Capitol Series Trust (the “Trust”) on December 17, 2015. The Trust is an open-end investment company established under the laws of Ohio by an Agreement and Declaration of Trust dated September 18, 2013 (the “Trust Agreement”). The Trust Agreement permits the Board of Trustees of the Trust (the “Board”) to issue an unlimited number of shares of beneficial interest of separate series without par value. The Fund is one of a series of funds currently authorized by the Board. The Fund’s investment adviser is Canterbury Investment Management, LLC (the “Adviser”). The investment objective of the Fund is to seek long-term risk-adjusted growth.
The Fund currently offers one class of shares, Institutional Shares. The Fund’s Investor Shares have been approved by the Board, but are not yet available for purchase and are not being offered at this time. The Fund’s Institutional Shares commenced operations on August 2, 2016. Each share represents an equal proportionate interest in the assets and liabilities belonging to the Fund and is entitled to such dividends and distributions out of income belonging to the Fund as are declared by the Board. Both share classes impose a 2.00% redemption fee on shares redeemed within 90 days of purchase.
NOTE 2. SIGNIFICANT ACCOUNTING POLICIES
The Fund is an investment company and follows accounting and reporting guidance under Financial Accounting Standards Board Accounting Standards Codification Topic 946, “Financial Services-Investments Companies”. The following is a summary of significant accounting policies followed by the Fund in the preparation of its financial statements. These policies are in conformity with generally accepted accounting principles in the United States of America (“GAAP”).
Estimates – The preparation of financial statements in conformity with GAAP requires management to make estimates and assumptions that affect the reported amounts of assets and liabilities and disclosure of contingent assets and liabilities at the date of the financial statements and the reported amounts of increases and decreases in net assets from operations during the reporting period. Actual results could differ from those estimates.
Securities Valuation – All investments in securities are recorded at their estimated fair value as described in Note 3.
Federal Income Taxes – The Fund makes no provision for federal income tax or excise tax. The Fund intends to qualify each year as a regulated investment company (“RIC”) under subchapter M of the Internal Revenue Code of 1986, as amended, by complying with the requirements applicable to RICs and by distributing substantially all of its taxable income. The Fund also intends to distribute sufficient net investment income and net capital gains, if any, so that it will not be subject to excise tax on undistributed income and gains. If the required amount of net investment income or gains is not distributed, the Fund could incur a tax expense.
The Fund recognizes tax benefits or expenses of uncertain tax positions only when the position is “more likely than not” to be sustained assuming examination by tax authorities. Management of the Fund has reviewed tax positions taken in tax years that remain subject to examination by all major tax jurisdictions, including federal (i.e., the last two tax year ends and the interim tax period since then, as applicable) and has concluded that no provision for unrecognized tax benefits or expenses is required in these financial
14
Canterbury Portfolio Thermostat Fund
Notes to the Financial Statements (continued)
April 30, 2018
statements and does not expect this to change over the next twelve months. The Fund recognizes interest and penalties, if any, related to unrecognized tax benefits as income tax expense in the Statement of Operations. During the period, the Fund did not incur any interest or penalties.
Expenses – Expenses incurred by the Trust that do not relate to a specific fund of the Trust are allocated to the individual funds based on each fund’s relative net assets or another appropriate basis (as determined by the Board). Expenses specifically attributable to any class are borne by that class. Income, realized gains and losses, unrealized appreciation and depreciation, and expenses are allocated to each class based on the net assets in relation to the relative net assets of the Fund.
Security Transactions and Related Income - Throughout the reporting period, security transactions are accounted for no later than one business day following the trade date. For financial reporting purposes, security transactions are accounted for on trade date on the last business day of the reporting period. The specific identification method is used for determining gains or losses for financial statements and income tax purposes. Dividend income is recorded on the ex-dividend date and interest income is recorded on an accrual basis.
Dividends and Distributions – The Fund intends to distribute substantially all of its net investment income, net realized long-term capital gains and net realized short-term capital gains, if any, to its shareholders at least once per year. Distributions to shareholders are recorded on the ex-dividend date. The amount of dividends from net investment income and distributions from net realized gains are determined in accordance with federal income tax regulations, which may differ from GAAP. These differences are caused primarily by differences in the timing of the recognition of certain components of income, expense or realized capital gains for federal income tax purposes. Where such differences are permanent in nature, they are reclassified in the components of net assets based on their ultimate characterization for federal income tax purposes. Any such reclassifications will have no effect on net assets, results of operations or net asset values per share of the Fund. For the fiscal year ended April 30, 2018, the Fund made the following reclassifications of net assets:
Paid-in Capital | Accumulated
Net Investment Loss | Accumulated Net Realized
Gain on Investments |
$ (656) | $(29) | $685 |
NOTE 3. SECURITIES VALUATION AND FAIR VALUE MEASUREMENTS
Fair value is defined as the price that the Fund would receive upon selling an investment in an orderly transaction to an independent buyer in the principal or most advantageous market of the investment. GAAP establishes a three-tier hierarchy to maximize the use of observable market data and minimize the use of unobservable inputs and to establish classification of fair value measurements for disclosure purposes.
Inputs refer broadly to the assumptions that market participants would use in pricing the asset or liability. Inputs may be observable or unobservable. Observable inputs are inputs that reflect the assumptions market participants would use in pricing the asset or liability developed based on market data obtained from sources independent of the reporting entity. Unobservable inputs are inputs that reflect the reporting entity’s own assumptions about the assumptions market participants would use in pricing the asset or liability developed based on the best information available in the circumstances.
15
Canterbury Portfolio Thermostat Fund
Notes to the Financial Statements (continued)
April 30, 2018
Various inputs are used in determining the value of the Fund’s investments. These inputs are summarized in the three broad levels listed below.
Level 1 – unadjusted quoted prices in active markets for identical investments and/or registered investment companies where the value per share is determined and published and is the basis for current transactions for identical assets or liabilities at the valuation date
Level 2 – other significant observable inputs (including, but not limited to, quoted prices for an identical security in an inactive market, quoted prices for similar securities, interest rates, prepayment speeds, credit risk, etc.)
Level 3 – significant unobservable inputs (including the Fund’s own assumptions in determining fair value of investments based on the best information available)
The inputs used to measure fair value may fall into different levels of the fair value hierarchy. In such cases, for disclosure purposes, the level in the fair value hierarchy within which the fair value measurement falls in its entirety is determined based on the lowest level input that is significant to the fair value measurement in its entirety.
In computing the net asset value (“NAV”) of the Fund, fair value is based on market valuations with respect to portfolio securities for which market quotations are readily available. Pursuant to Board approved policies, the Fund relies on independent third-party pricing services to provide the current market value of securities. Those pricing services value equity securities, including exchange-traded funds and exchange-traded notes, traded on a securities exchange at the last reported sales price on the principal exchange. Equity securities quoted by NASDAQ are valued at the NASDAQ Official Closing Price. If there is no reported sale on the principal exchange, equity securities are valued at the mean between the most recent quoted bid and asked price. When using the market quotations or close prices provided by the pricing service and when the market is considered active, the security will be classified as a Level 1 security. Investments in open-end mutual funds, including money market mutual funds, are generally
priced at the ending NAV provided by the pricing service of the funds and are generally categorized as Level 1 securities. Debt securities are valued using evaluated prices furnished by a pricing vendor selected by the Board and are generally classified as Level 2 securities.
In the event that market quotations are not readily available, the Adviser determines that the market quotation or the price provided by the pricing service does not accurately reflect the current fair value, or certain restricted or illiquid securities are being valued, such securities are valued as determined in good faith by the Trust’s Valuation Committee, based on recommendations from a pricing committee comprised of various officers of the Trust, various employees of the Fund’s administrator, and representatives of the Adviser (together the “Pricing Review Committee”). These securities will be classified as Level 2 or 3 within the fair value hierarchy, depending on the inputs used.
In accordance with the Trust’s Valuation Procedures, the Pricing Review Committee in making its recommendations is required to consider all appropriate factors relevant to the value of securities for which it has determined other pricing sources are not available or reliable as described above. No single standard exists for determining fair value, because fair value depends upon the circumstances of each individual case. As a general principle, the current fair value of an issue of securities being valued pursuant to the Trust’s Fair Valuation Procedures would be the amount which the Fund might reasonably expect to receive for them upon their current sale. Methods which are in accordance with this principle may, for example, be based
16
Canterbury Portfolio Thermostat Fund
Notes to the Financial Statements (continued)
April 30, 2018
on (i) a multiple of earnings; (ii) a discount from market prices of a similar freely traded security (including a derivative security or a basket of securities traded on other markets, exchanges or among dealers); or (iii) yield to maturity with respect to debt issues, or a combination of these and other methods. Fair value pricing is permitted if, in accordance with the Trust’s Valuation Procedures, the validity of market quotations appears to be questionable based on factors such as evidence of a thin market in the security based on a small number of quotations, a significant event occurs after the close of a market but before the Fund’s NAV calculation that may affect a security’s value, or other data calls into question the reliability of market quotations.
The following is a summary of the inputs used to value the Fund’s investments as of April 30, 2018:
| | | Valuation Inputs | |
| Assets | | Level 1 | | | Level 2 | | | Level 3 | | | Total | |
| Exchange-Traded Funds | | $ | 33,596,006 | | | $ | — | | | $ | — | | | $ | 33,596,006 | |
| Money Market Funds | | | 1,465,275 | | | | — | | | | — | | | | 1,465,275 | |
| Total | | $ | 35,061,281 | | | $ | — | | | $ | — | | | $ | 35,061,281 | |
The Fund did not hold any investments at the end of the reporting period for which other significant observable inputs (Level 2) were used in determining fair value. The Fund did not hold any investments during the reporting period for which significant unobservable inputs (Level 3) were used in determining fair value; therefore, no reconciliation of Level 3 securities is included for this reporting period. The Fund did not hold any derivative instruments during the reporting period.
The Trust recognizes transfers between fair value hierarchy levels at the end of the reporting period. There were no transfers between any levels as of April 30, 2018 based on input levels assigned at April 30, 2017.
NOTE 4. FEES AND OTHER TRANSACTIONS WITH AFFILIATES AND OTHER SERVICE PROVIDERS
Under the terms of the investment advisory agreement (the “Agreement”), the Adviser manages the Fund’s investments subject to approval of the Board. As compensation for its management services, the Fund is obligated to pay the Adviser a fee computed and accrued daily and paid monthly at an annual rate of 0.90% of the Fund’s average daily net assets. For the fiscal year ended April 30, 2018, the Adviser earned fees of $217,882 from the Fund. At April 30, 2018, the Fund owed the Adviser $20,623.
The Adviser has contractually agreed to waive its management fee and/or reimburse expenses so that total annual operating expenses (excluding (i) interest; (ii) taxes; (iii) brokerage fees and commissions; (iv) other extraordinary expenses not incurred in the ordinary course of the Fund’s business; (v) dividend expenses on short sales; and (vi) indirect expenses such as acquired fund fees and expenses) and expenses) do not exceed 1.30% of the Fund’s Institutional Shares average daily net assets through January 1, 2019 (“Expense Limitation”). During any fiscal year that the Agreement between the Adviser and the Trust is in effect, the Adviser may recoup the sum of all fees previously waived or expenses reimbursed for a period of 36 months following the month during which such fee waiver or expense reimbursement was made, less any reimbursement previously paid, if such recoupment can be achieved within the Expense Limitation as well as any expense limitation in effect at the time the reimbursement was made. This expense cap agreement may be terminated by the Board at any time.
17
Canterbury Portfolio Thermostat Fund
Notes to the Financial Statements (continued)
April 30, 2018
The amount subject to repayment by the Fund, pursuant to the aforementioned conditions, is $216,262, which is recoverable through April 30, 2021.
The Trust retains Ultimus Asset Services, LLC (the “Administrator”) to provide the Fund with administration, accounting, transfer agent and compliance services, including all regulatory reporting. For the fiscal year ended April 30, 2018, the Administrator earned fees of $23,751 for administration services, $22,250 for fund accounting services, and $19,563 for transfer agent services. At April 30, 2018, the Fund owed the Administrator $6,168 for such services.
The Board supervises the business activities of the Trust. Each Trustee serves as a Trustee for the lifetime of the Trust or until the earlier of his or her retirement as a Trustee at age 78 (which may be extended for up to two years in an emeritus non-voting capacity at the pleasure and request of the Board), or until he/she dies, resigns, or is removed, whichever is sooner. “Independent Trustees,” meaning those Trustees who are not “interested persons” as defined in the Investment Company Act of 1940 (“1940 Act”) of the Trust, each receive annual compensation of $20,000 from the Trust, to be paid in four quarterly installments of $5,000. In addition, the Audit Committee Chair receives an additional $1,000 annual fee, payable quarterly installments of $250. Independent Trustees are also paid $1,000 for in person Special Meetings. Fees for telephonic special meetings range from $250 per trustee to $1,000 per trustee, depending on the length of the meeting. In addition, the Trust reimburses Trustees for out-of-pocket expense incurred in conjunction with attendance at Board meetings.
The officers and one Trustee of the Trust are employees of the Administrator. Unified Financial Securities, LLC (the “Distributor”) acts as the principal distributor of the Fund’s shares. Both the Administrator and the Distributor operate as wholly-owned subsidiaries of Ultimus Fund Solutions, LLC.
NOTE 5. PURCHASES AND SALES OF SECURITIES
For the fiscal year ended April 30, 2018, purchases and sales of investment securities, other than short-term investments and short-term U.S. government obligations, were as follows:
Purchases | | $ | 45,014,394 | |
Sales | | $ | 26,451,630 | |
There were no purchases or sales of long-term U.S. government obligations during the fiscal year ended April 30, 2018.
NOTE 6. FEDERAL TAX INFORMATION
As of April 30, 2018, the net unrealized appreciation (depreciation) of investments for tax purposes was as follows:
| Gross Unrealized Appreciation | | $ | 1,610,259 | |
| Gross Unrealized Depreciation | | | (437,977 | ) |
| Net Unrealized Appreciation (Depreciation) | | $ | 1,172,282 | |
18
Canterbury Portfolio Thermostat Fund
Notes to the Financial Statements (continued)
April 30, 2018
At April 30, 2018, the aggregate cost of securities for federal income tax purposes was $33,888,999 for the Fund.
The tax character of distributions for the fiscal year ended April 30, 2018 and for the period August 2, 2016 (commencement of operations) through April 30, 2017 were as follows:
| | | 2018 | | | 2017 | |
| Distributions paid from: | | | | | | |
| Ordinary Income | | $ | 225,594 | | | $ | 43,204 | |
| Net Long-Term Capital Gains | | | 40,399 | | | | — | |
| Total Distributions Paid | | $ | 265,993 | | | $ | 43,204 | |
At April 30, 2018, the components of distributable earnings (accumulated losses) on a tax basis was as follows:
| Undistributed Long-Term Capital Gains | | $ | 327,554 | |
| Accumulated Capital and Other Losses | | | (103,382 | ) |
| Unrealized Appreciation (Depreciation) | | | 1,172,282 | |
| Total Accumulated Earnings (Deficit) | | $ | 1,396,454 | |
Under current tax law, net investment losses after December 31 and capital losses realized after October 31 of the Fund’s fiscal year may be deferred and treated as occurring on the first business day of the following fiscal year for tax purposes. The Fund deferred losses as follows:
Capital Loss | Qualified Late Year
Ordinary Loss |
$73,592 | $29,790 |
NOTE 7. BENEFICIAL OWNERSHIP
The beneficial ownership, either directly or indirectly, of 25% or more of the voting securities of a fund creates a presumption of control of a fund, under Section 2(a) (9) of the 1940 Act. At April 30, 2018, TD Ameritrade, Inc. (“TD Ameritrade”) owned, as record shareholder, 100% of the outstanding shares of the Fund. It is not known whether TD Ameritrade or any of the underlying beneficial owners owned or controlled 25% or more of the voting securities of the Fund.
NOTE 8. COMMITMENTS AND CONTINGENCIES
The Fund indemnifies its officers and trustees for certain liabilities that may arise from the performance of their duties to the Fund. Additionally, in the normal course of business, the Fund enters into contracts that contain a variety of representations and warranties which provide general indemnifications. The Fund’s maximum exposure under these arrangements is unknown, as this would involve future claims that may be made against the Fund that have not yet occurred.
19
Canterbury Portfolio Thermostat Fund
Notes to the Financial Statements (continued)
April 30, 2018
NOTE 9. SUBSEQUENT EVENTS
Management has evaluated events or transactions from April 30, 2018 through the date these financial statements were issued that would merit recognition or disclosure in the financial statements. There were no subsequent events to report that would have a material impact in the Funds’ financial statements.
Shareholder Meeting Results (Unaudited)
On June 19, 2018, a special meeting of shareholders of the Trust was held for the purpose of voting on the election of four Trustees to serve on the Board of Trustees. Below are the voting results from the special meeting.
| For | Withhold | % of Total Voted in Favor |
John C. Davis | 35,759,555 | 385,270 | 98.93% |
Janet S. Meeks | 35,772,739 | 372,086 | 98.97% |
Lori A. Kaiser | 35,775,501 | 369,324 | 98.98% |
Robert G. Dorsey | 35,597,330 | 547,495 | 98.49% |
The shareholders voted in favor of the proposal to approve four Trustees to serve on the Board of Trustees. Mr. Davis, Ms. Meeks and Ms. Kaiser were each elected as Independent Trustees and will begin their service to the Trust effective July 1, 2018. Mr. Dorsey was elected as Interested Trustee at the meeting.
20
Report of Independent Registered Public Accounting Firm
To the Shareholders and the Board of
Trustees of Canterbury Portfolio Thermostat Fund
Opinion on the Financial Statements
We have audited the accompanying statement of assets and liabilities of Canterbury Portfolio Thermostat Fund (the “Fund”) (one of the funds constituting Capitol Series Trust (the “Trust”)), including the schedule of investments, as of April 30, 2018, and the related statement of operations for the year then ended, the statements of changes in net assets and the financial highlights for the year ended April 30, 2018 and the period from August 2, 2016 (commencement of operations) through April 30, 2017 and the related notes (collectively referred to as the “financial statements”). In our opinion, the financial statements present fairly, in all material respects, the financial position of the Fund (one of the funds constituting Capitol Series Trust) at April 30, 2018, the results of its operations for the year then ended, the statements of changes in net assets and the financial highlights for the year ended April 30, 2018 and the period from August 2, 2016 (commencement of operations) through April 30, 2017, in conformity with U.S. generally accepted accounting principles.
Basis for Opinion
These financial statements are the responsibility of the Trust’s management. Our responsibility is to express an opinion on the Fund’s financial statements based on our audits. We are a public accounting firm registered with the Public Company Accounting Oversight Board (United States) (PCAOB) and are required to be independent with respect to the Fund in accordance with the U.S. federal securities laws and the applicable rules and regulations of the Securities and Exchange Commission and the PCAOB.
We conducted our audits in accordance with the standards of the PCAOB. Those standards require that we plan and perform the audit to obtain reasonable assurance about whether the financial statements are free of material misstatement, whether due to error or fraud. The Trust is not required to have, nor were we engaged to perform, an audit of Trust’s internal control over financial reporting. As part of our audit we are required to obtain an understanding of internal control over financial reporting but not for the purpose of expressing an opinion on the effectiveness of the Trust’s internal control over financial reporting. Accordingly, we express no such opinion.
Our audits included performing procedures to assess the risks of material misstatement of the financial statements, whether due to error or fraud, and performing procedures that respond to those risks. Such procedures included examining, on a test basis, evidence regarding the amounts and disclosures in the financial statements. Our procedures included confirmation of securities owned as of April 30, 2018, by correspondence with the custodian and brokers. Our audits also included evaluating the accounting principles used and significant estimates made by management, as well as evaluating the overall presentation of the financial statements. We believe that our audits provides a reasonable basis for our opinion.

We have served as the auditor of one or more Capitol Series Trust investment companies since 2017.
Grandview Heights, Ohio
June 25, 2018
21
Summary of Fund Expenses (Unaudited)
As a shareholder of the Fund, you incur two types of costs: (1) transaction costs, including short-term redemption fees and (2) ongoing costs, including management fees, and other Fund expenses. These examples are intended to help you understand your ongoing costs (in dollars) of investing in the Fund and to compare these costs with the ongoing costs of investing in other mutual funds.
The Example is based on an investment of $1,000 invested at the beginning of the period and held for the entire period (November 1, 2017 through April 30, 2018).
Actual Expenses
The first line of the table provides information about actual account values and actual expenses. You may use the information in this lines, together with the amount you invested, to estimate the expenses that you paid over the period. Simply divide your account value by $1,000 (for example, an $8,600 account value divided by $1,000 = 8.60), then multiply the result by the number in the first line under the heading “Expenses Paid During Period” to estimate the expenses you paid on your account during this period.
Hypothetical Example for Comparison Purposes
The second line of the table provides information about hypothetical account values and hypothetical expenses based on the Fund’s actual expense ratios and an assumed rate of return of 5% per year before expenses, which is not the Fund’s actual return. The hypothetical account values and expenses may not be used to estimate the actual ending account balances or expenses you paid for the period. You may use this information to compare the ongoing costs of investing in the Fund and other funds. To do so, compare this 5% hypothetical example with the 5% hypothetical examples that appear in the shareholder reports of the other funds.
Expenses shown in the table are meant to highlight your ongoing costs only and do not reflect any transactional costs such as the fee imposed on sales charges and short-term redemptions. Therefore, the second line of the table is useful in comparing ongoing costs only and will not help you determine the relative total costs of owning different funds. In addition, if transaction costs were included, your costs would have been higher.
| | | | Beginning
Account
Value
November 1, 2017 | | | Ending
Account
Value
April 30, 2018 | | | Expenses
Paid
During
Period(a) | | | Annualized
Expense
Ratio | |
| Canterbury Portfolio Thermostat Fund |
| Institutional Shares | Actual | | $ | 1,000.00 | | | $ | 1,007.20 | | | $ | 6.47 | | | | 1.30 | % |
| | Hypothetical(b) | | $ | 1,000.00 | | | $ | 1,018.35 | | | $ | 6.51 | | | | 1.30 | % |
| (a) | Expenses are equal to the Fund’s annualized expense ratios, multiplied by the average account value over the period, multiplied by 181/365 (to reflect the one-half year period). |
| (b) | Hypothetical Assumes a 5% return before expenses. |
22
Additional Federal Income Tax Information (Unaudited)
The Form 1099-DIV you receive in January 2019 will show the tax status of all distributions paid to your account in calendar year 2018. Shareholders are advised to consult their own tax adviser with respect to the tax consequences of their investment in the Fund. As required by the Internal Revenue Code and/or regulations, shareholders must be notified regarding the status of qualified dividend income for individuals and the dividends received deduction for corporations.
Qualified Dividend Income. The Fund designates approximately 100% or up to the maximum amount of such dividends allowable pursuant to the Internal Revenue Code, as qualified dividend income eligible for the reduced tax rate of 15%.
Dividends Received Deduction. Corporate shareholders are generally entitled to take the dividends received deduction on the portion of the Fund’s dividend distribution that qualifies under tax law. For the fiscal year ended April 30, 2018, 100% of ordinary income dividends paid by the Fund qualify for the dividends received deduction available to corporations.
For the fiscal year ended April 30, 2018, the Fund designated $40,399 as 20% long-term capital gain distributions.
23
Trustees and Officers (Unaudited)
The Board supervises the business activities of the Trust and is responsible for protecting the interests of shareholders. The Chair of the Board is Walter B. Grimm, who is an Independent Trustee of the Trust.
Each Trustee serves as a Trustee for the lifetime of the Trust or until the earlier of his or her retirement as a Trustee at age 78, death, resignation or removal. Officers are re-elected annually by the Board. The address of each Trustee and officer is 225 Pictoria Drive, Suite 450, Cincinnati, OH 45246.
As of the date of this report, the Trustees oversee the operations of 10 series.
Interested Trustee Background. The following table provides information regarding the Interested Trustee.
Name, Age, Position
with Trust, Term of
Position with Trust | Principal Occupation During Past 5 Years
and Other Trusteeships |
Robert G. Dorsey* Age: 61 Interested Trustee Began Serving: March 2017 | Principal Occupation(s): President and Managing Director of Ultimus Fund Solutions, LLC and Ultimus Fund Distributors, LLC (1999 to present; Interested Trustee of Ultimus Managers Trust (February 2012 to present). Interested Trustee of Capitol Series Trust (March 2016 to present). Previous Position(s): President and Managing Director of Ultimus Fund Distributors, LLC (1999 to 2018); President of Ultimus Managers Trust (June 2012 to October 2013). |
| * | Mr. Dorsey is considered an “interested person” of the Trust within the meaning of Section 2(a)(19) of the 1940 Act because of his relationship with the Trust’s administrator, transfer agent, and distributors. |
Independent Trustee Background. The following table provides information regarding the Independent Trustees.
Name, Age, Position
with Trust, Term of
Position with Trust | Principal Occupation During Past 5 Years
and Other Trusteeships |
Walter B. Grimm Age: 73 Trustee and Chairman Began Serving: November 2013 | Principal Occupations(s): President, Leigh Management Group, LLC (consulting firm) (October 2005 to present); President, Leigh Investments, Inc. (1988 to present); and Chief Financial Officer, East West Private, LLC (consulting firm) (March 2009 to present). |
Mary M. Morrow Age: 60 Trustee Began Serving: November 2013 | Principal Occupations(s): Chief Operating Officer, Pennsylvania Health and Wellness (fully owned subsidiary of Centene Corporation) (November 2016 to present). Previous Position(s): Vice President, Strategic Initiatives, Gateway Heath (January 2015 to November 2016); Consulting Practice Manager, DST Health Solutions (August 2010 to January 2015); Trustee, Service and Client Relations, EBDS (August 2008 – May 2009); Independent Consultant, Healthcare Servicing May 2009 – August 2010). |
24
Trustees and Officers (Unaudited) (continued)
Officers. The following table provides information regarding the Officers.
Name, Age, Position
with Trust, Term of
Position with Trust | Principal Occupation During Past 5 Years
and Other Trusteeships |
Dina A. Tantra Age: 48 Chief Executive Officer and President Began Serving: March 2018 | Principal Occupation(s): Executive Vice President and Director of Fund Administration and Compliance, Ultimus Fund Solutions, LLC (August 2017 to present). Previous Position(s): Managing Director, Foreside Financial Group, LLC (2016 to 2017); Trustee and President, Advisers Investment Trust (September 2012 to August 2017); Managing Director, Secretary and General Counsel, Beacon Hill Fund Services, Inc. (2008 to 2016); Secretary and General Counsel, BHIL Distributors, Inc. (2008 to 2016). |
Matthew J. Miller Age: 42 Vice President and Secretary Began Serving: March 2018 (Vice-President); April 2018 (Secretary) | Principal Occupation(s): Assistant Vice President, Relationship Management, Ultimus Fund Solutions, LLC (December 2015 to present); Vice President, Valued Advisers Trust (December 2011 to present). Previous Position(s): Vice President, Relationship Management, Huntington Asset Services, Inc. (n/k/a Ultimus Asset Services, LLC) (2008 to December 2015); Vice President, The Huntington Funds (February 2010 to April 2015); Vice President, Transfer Agency Operations, Huntington Asset Services, Inc. (2002 to 2008); Employed in various positions with Huntington Asset Services, Inc. (July 1998 to 2002). |
Zachary P. Richmond Age: 38 Treasurer and Chief Financial Officer Began Serving: August 2014 | Principal Occupation(s): Assistant Vice President, Associate Director of Financial Administration, Ultimus Fund Solutions, LLC (December 2015 to present); Treasurer and Chief Financial Officer, Unified Series Trust (August 2014 to present); Treasurer and Chief Financial Officer, Commonwealth International Series Trust (September 2015 to present). Previous Position(s): Assistant Vice President, Fund Administration, Huntington Asset Services, Inc. (n/k/a Ultimus Asset Services, LLC) (January 2011 to December 2015); and Assistant Treasurer, Unified Series Trust (2011 to August 2014). |
Brandon R. Kipp Age: 35 Chief Compliance Officer Began Serving: October 2017 | Principal Occupation(s): Senior Fund Compliance Officer, Ultimus Fund Solutions, LLC (since July 2017) and Chief Compliance Officer, Valued Advisers Trust (since October 2017). Previous Position(s): Assistant Vice President and Compliance Manager, UMB Fund Services, Inc. (March 2014 to July 2017); Officer and Lead Fund Administrator, UMB Fund Services, Inc. (May 2012 to March 2014). |
Stephen L. Preston Age: 52 Anti-Money Laundering Officer Began Serving: December 2016 | Principal Occupation(s): Chief Compliance Officer, Ultimus Fund Solutions, LLC, Ultimus Fund Distributors, LLC, and Unified Financial Securities from June 2011 to present. |
Other Information (Unaudited)
The Fund’s Statement of Additional Information (“SAI”) includes additional information about the trustees and is available without charge, upon request. You may call toll-free at (844) 838-2121 to request a copy of the SAI or to make shareholder inquiries.
25
Approval of Investment Advisory Agreement
Canterbury Investment Management, LLC (Unaudited)
At a quarterly meeting of the Board of Trustees of Capitol Series Trust (“Trust”) held on December 13 and 14, 2017, the Trust’s Board of Trustees (“Board”), including all of the Trustees who are not “interested persons” of the Trust (“Independent Trustees”) as that term is defined in Section 2(a)(19) of the Investment Company Act of 1940, as amended (the “1940 Act”), considered and approved the renewal for an additional one-year period of the Investment Advisory Agreement (“Investment Advisory Agreement”) between the Trust and Canterbury Investment Management, LLC (“Canterbury”) with respect to the Canterbury Portfolio Thermostat Fund (“Canterbury Fund” or “Fund”), a series of the Trust.
Prior to the meeting, the Trustees received and considered information from Canterbury and the Trust’s administrator designed to provide the Trustees with the information necessary to evaluate the terms of the proposed renewal of the Investment Advisory Agreement between the Trust and Canterbury, including, but not limited to: Canterbury’s responses to counsel’s due diligence letter counsel’s supplemental requests, each requesting information relevant to renewal of the Investment Advisory Agreement; the operating expense limitation agreement currently in effect between Canterbury and the Canterbury Fund (the “Expense Limitation Agreement”); and Morningstar comparative expense and performance data (collectively, the “Support Materials”). The Trustees noted the completeness of the Support Materials that Canterbury provided, and reviewed such Support Materials at various times with Canterbury, Trust management, and counsel to the Independent Trustees. This information, together with information provided to and reviewed by the Board concerning Canterbury and the Fund since the Fund’s inception, formed the primary, but not exclusive, basis for the Board’s determinations. Before voting to approve the renewal of the Investment Advisory Agreement, the Trustees reviewed with Trust management and with counsel to the Independent Trustees the terms and the form of Investment Advisory Agreement, as well as the Support Materials. The Trustees also received, reviewed and discussed a memorandum from such counsel delineating each Trustee’s duty of care and duty of loyalty obligations and application of the fiduciary duty standards of Section 36(b) of the 1940 Act, all of which govern their consideration of the renewal of the Investment Advisory Agreement. In addition, the memorandum described the various factors that the U.S. Securities and Exchange Commission (“SEC”) and U.S. Courts over the years have suggested are appropriate for trustee consideration in approving and reapproving fund advisory agreements, including the factors outlined in Gartenberg v. Merrill Lynch Asset Management Inc., 694 F.2d 923, 928 (2d Cir. 1982); cert. denied sub. nom. and Andre v. Merrill Lynch Ready Assets Trust, Inc., 461 U.S. 906 (1983). The Trustees noted the robust discussions that had taken place with representatives of Canterbury, and considered additional information that Canterbury had provided regarding its services to the Canterbury Fund, including but not limited to, information regarding Canterbury’s investment philosophy, the firm’s compliance culture, staffing and compensation, trading practices, liability insurance, the resources that Canterbury dedicates to servicing the Fund, Canterbury’s financial statements, Fund expenses that Canterbury subsidizes, Canterbury’s profitability with respect to the Canterbury Fund, Canterbury’s marketing and distribution plans for the Fund, and other benefits that Canterbury derives from its relationship with the Fund.
After having received and reviewed the Support Materials, as well as quarterly investment performance, compliance, operating, and distribution reports on the Canterbury Fund over an extended time period, the Trustees discussed the facts and factors relevant to the continuation of the Investment Advisory Agreement, which incorporated and reflected their knowledge of Canterbury’s services to the Fund. Taking such information into account, the Board considered whether the overall arrangements between the Trust and Canterbury as set forth in the Investment Advisory Agreement, including the investment advisory fees
26
Approval of Investment Advisory Agreement
Canterbury Investment Management, LLC (Unaudited) (continued)
that the Canterbury Fund pays to Canterbury, continue to be fair and reasonable in light of the services Canterbury performs, as well as such other matters as the Trustees considered relevant to the reapproval in the exercise of their reasonable business judgment.
In determining whether to approve the renewal of the Investment Advisory Agreement, the Trustees considered all factors they believed relevant with respect to the Canterbury Fund, including the following: (1) the nature, extent, and quality of the services to be provided by Canterbury; (2) the cost of the services to be provided and the profits to be realized by Canterbury from services rendered to the Trust and the Fund; (3) comparative fee and expense data for the Canterbury Fund and other investment companies with similar investment objectives; (4) the extent to which economies of scale would be realized as the Canterbury Fund grows and whether the proposed advisory fee for the Fund reflects these economies of scale for the Fund’s benefit; and (5) other financial benefits to Canterbury resulting from services to be rendered to the Canterbury Fund. The material factors and conclusions that formed the basis of the Trustees’ determination to approve the continuation of the Investment Advisory Agreement are summarized below. In their deliberations, the Trustees did not identify any particular information that was all-important or controlling.
Nature, Extent and Quality of Services Provided. The Trustees considered the scope of services that Canterbury provides under the Investment Advisory Agreement, noting that such services include, but are not limited to, the following: (1) investing the Canterbury Fund’s assets consistent with the Fund’s investment objective and investment policies; (2) determining the portfolio securities to be purchased, sold or otherwise disposed of and the timing of such transactions; (3) voting all proxies with respect to the Canterbury Fund’s portfolio securities; (4) maintaining the required books and records for transactions that Canterbury effects on behalf of the Fund; and (5) selecting broker-dealers to execute orders on behalf of the Canterbury Fund. The Trustees noted no changes to the services that Canterbury provides to the Canterbury Fund under the terms of the Investment Advisory Agreement. The Trustees considered Canterbury’s capitalization and its assets under management. The Trustees further considered the investment philosophy and investment industry experience of the portfolio managers, and noted Canterbury’s investment in internal resources and systems, including additional staff and the proprietary software and research algorithm developed by Canterbury and utilized to manage the Canterbury Fund’s portfolio in accordance with its investment strategy, all in an effort to promote growth in the Fund. The Trustees also noted the Canterbury Fund’s performance compared to its benchmark, including the fact that the Fund had underperformed its benchmark for the three month, one-year and since-inceptions periods ended September 30, 2017. The Trustees also considered the Canterbury Fund’s performance compared to its Morningstar peer group category. They noted that the Fund outperformed the average and median of its peer group for the one-year period ended September 30, 2017. The Trustees further noted that it is difficult to make meaningful comparisons with short-term results. The Trustees concluded that they are satisfied with the nature, extent and quality of services that Canterbury provides to the Canterbury Fund under the Investment Advisory Agreement.
Cost of Advisory Services and Profitability. The Trustees considered the annual management fee that the Canterbury Fund pays to Canterbury under the Investment Advisory Agreement, as well as Canterbury’s profitability from the services that it renders to the Fund. The Trustees noted that, while a Rule 12b-1 Distribution Plan had been approved on behalf of the Investor Shares of the Canterbury Fund, Investor Shares were not currently offered for purchase. The Trustees considered that Canterbury has contractually agreed to reduce its management fees and, if necessary, reimburse the Canterbury Fund for operating expenses, as specified in the Fund’s prospectus. The Trustees discussed the growth of assets of the Canterbury Fund over time, and the fact that Canterbury had only recently begun to receive net advisory
27
Approval of Investment Advisory Agreement
Canterbury Investment Management, LLC (Unaudited) (continued)
fees for its management of the Canterbury Fund. The Trustees further noted that Canterbury is not yet profitable with respect to the advisory services that it provides to the Canterbury Fund. The Board also noted Canterbury’s ability to recoup previously waived advisory fees on a prospective basis as the Fund’s assets grow and profitability increases.
Comparative Fee and Expense Data. The Trustees noted that the Canterbury Fund’s management fee was higher than the average and median gross management fee reported for its Morningstar peer group. The Trustees then noted that the Canterbury Fund’s gross and net total expense ratios (reflected with and without waivers and expense reimbursements) were above the average and median gross and net total expense ratios reported for its Morningstar peer group. It was noted that the peer group comparison was filtered by total net assets so that the Canterbury Fund was compared to other similarly sized funds, and discussed the appropriateness of this comparison. The Trustees also noted that the Canterbury Fund had recently been assigned to a different Morningstar peer group category and that Canterbury was appealing the change. They further considered the fees that Canterbury charges for separately managed accounts and sub-advisory relationships with similar investment objectives and strategies to that of the Fund, noting the differences in the services provided to these accounts compared to the services provided to the Canterbury Fund. In particular, they noted that Canterbury has additional responsibilities with respect to the Canterbury Fund, including compliance, reporting and operational responsibilities. While recognizing that it is difficult to compare advisory fees because the scope of advisory services provided may vary from one investment adviser to another, or form one investment product to another, the Trustees concluded that Canterbury’s advisory fee continues to be reasonable.
Economies of Scale. The Trustees considered whether the Canterbury Fund may benefit from any economies of scale, but did not find that any material economies exist at this time.
Other Benefits. The Trustees noted that Canterbury does not utilize soft dollar arrangements with respect to portfolio transactions and does not use affiliated brokers to execute the Canterbury Fund’s portfolio transactions. The Trustees noted that Canterbury was not affiliated with any of the ETF providers it utilizes and there were no economic or other benefits to the Adviser associated with the selection or use of any particular ETF providers for the Fund’s portfolio. The Trustees concluded that all things considered, Canterbury does not receive material additional financial benefits from services rendered to the Canterbury Fund.
Other Considerations. The Trustees also considered potential conflicts for Canterbury with respect to relationships forged with ETF providers. The Trustees noted that both they and Counsel have discussed with representatives of Canterbury their duty of loyalty relative to the selection of ETF providers and the conflicts that could develop relative to any relationship that Canterbury may form with a specific ETF provider. Based on the assurances and representations from Canterbury, the Trustees concluded that no such conflicts of interest currently exist that could adversely impact the Canterbury Fund.
Based upon Canterbury’s presentation to the Board and the Support Materials considered in connection with the renewal of the Investment Advisory Agreement, as well as the information provided throughout the course of the year and since the Canterbury Fund’s inception, the Board concluded that the overall arrangements between the Trust and Canterbury, as set forth in the Investment Advisory Agreement, are fair and reasonable in light of the services to be performed, the investment advisory fees to be paid and such other matters as the Trustees considered relevant in the exercise of their reasonable judgment.
28
| FACTS | WHAT DOES CAPITOL SERIES TRUST DO WITH YOUR PERSONAL INFORMATION? |
| | |
| Why? | Financial companies choose how they share your personal information. Federal law gives consumers the right to limit some but not all sharing. Federal law also requires us to tell you how we collect, share, and protect your personal information. Please read this notice carefully to understand what we do. |
| | |
| What? | The types of personal information we collect and share depend on the product or service you have with us. This information can include: ■ Social Security number ■ account balances and account transactions ■ account transactions, transaction or loss history and purchase history ■ checking account information and wire transfer instructions When you are no longer our customer, we continue to share your information as described in this notice. |
| | |
| How? | All financial companies need to share customers’ personal information to run their everyday business. In the section below, we list the reasons financial companies can share their customers’ personal information; the reasons Capitol Series Trust chooses to share; and whether you can limit this sharing. |
| Reasons we can share your personal information | Does Capitol Series Trust share? |
For our everyday business purposes— such as to process your transactions, maintain your account(s), respond to court orders and legal investigations, or report to credit bureaus | Yes |
For our marketing purposes— to offer our products and services to you | Yes |
| For joint marketing with other financial companies | No |
For our affiliates’ everyday business purposes— information about your transactions and experiences | No |
For our affiliates’ everyday business purposes— information about your creditworthiness | No |
| For nonaffiliates to market to you | No |
| Questions? | Call 1-844-838-2121 |
29
Who we are |
Who is providing this notice? | Capitol Series Trust |
What we do |
How does Capitol Series Trust protect my personal information? | To protect your personal information from unauthorized access and use, we use security measures that comply with federal law. These measures include computer safeguards and secured files and buildings. |
How does Capitol Series Trust collect my personal information? | We collect your personal information, for example, when you ■ open an account or deposit money ■ buy securities from us or sell securities to us ■ make deposits or withdrawals from your account provide account information ■ give us your account information ■ make a wire transfer ■ tell us who receives the money ■ tell us where to send the money ■ show your government-issued ID ■ show your driver’s license |
Why can’t I limit all sharing? | Federal law gives you the right to limit only ■ sharing for affiliates’ everyday business purposes — information about your creditworthiness ■ affiliates from using your information to market to you ■ sharing for nonaffiliates to market to you State laws and individual companies may give you additional rights to limit sharing. |
Definitions |
Affiliates | Companies related by common ownership or control. They can be financial and nonfinancial companies. |
Nonaffiliates | Companies not related by common ownership or control. They can be financial and nonfinancial companies. ■ Capitol Series Trust does not share your personal information with nonaffiliates so they can market to you. |
Joint marketing | A formal agreement between nonaffiliated financial companies that together market financial products or services to you. ■ Capitol Series Trust doesn’t jointly market financial products or services to you. |
30
This page is intentionally left blank.
This page is intentionally left blank.
This page is intentionally left blank.
PROXY VOTING (Unaudited)
A description of the policies and procedures that the Fund uses to determine how to vote proxies relating to portfolio securities and information regarding how the Fund voted those proxies during the most recent twelve month period ended June 30, is available without charge upon request by (1) calling the Fund at (844) 838-2121 and (2) from Fund documents filed with the Securities and Exchange Commission (“SEC”) on the SEC’s website at www.sec.gov.
TRUSTEES
Walter B. Grimm, Chairman
Mary M. Morrow
Robert G. Dorsey
OFFICERS
Dina A. Tantra, Chief Executive Officer/President
Zachary P. Richmond, Chief Financial Officer/Treasurer
Brandon R. Kipp, Chief Compliance Officer
INVESTMENT ADVISER
Canterbury Investment Management, LLC
23 East Cedar Street
Zionsville, IN 46077
DISTRIBUTOR
Unified Financial Securities, LLC
9465 Counselors Row, Suite 200
Indianapolis, IN 46240
INDEPENDENT REGISTERED PUBLIC ACCOUNTING FIRM
Ernst & Young LLP
800 Yard Street, Suite 500
Grandview Heights, OH 43212
LEGAL COUNSEL
Bernstein Shur
100 Middle Street, 6th Floor
Portland, ME 04104
CUSTODIAN
Huntington National Bank
41 South High Street
Columbus, OH 43215
ADMINISTRATOR, TRANSFER AGENT AND FUND ACCOUNTANT
Ultimus Asset Services, LLC
225 Pictoria Drive, Suite 450
Cincinnati, OH 45246
This report is intended only for the information of shareholders or those who have received the Fund’s prospectus which contains information about the Fund’s management fee and expenses. Please read the prospectus carefully before investing.
Distributed by Unified Financial Securities, LLC
Member FINRA/SIPC

FIRST SECURITY MUNICIPAL BOND FUND
Annual Report
April 30, 2018
First Security Fund Advisers, Inc.
First Security Center
521 President Clinton Avenue, Suite 800
Little Rock, Arkansas 72201
(800) 813-1421
| Letter from the President (Unaudited) | |
Thank you for investing in the First Security Municipal Bond Fund (the “Fund” or “FSARX”). The following is the Fund’s Annual Report covering the fiscal year ended April 30, 2018.
First Security Fund Advisers, Inc., is dedicated to providing exceptional municipal bond asset management for our shareholders. The year was eventful in the markets and the Fund and portfolio weathered it well. Jim Jones, the Fund’s portfolio manager, has relied on his 41 years of investment experience to manage the Fund. As a result, our Fund is grounded in fundamentals with the goal of managing the risk by diversification, credit quality, maturity, and sector.
We encourage you to maintain a strong relationship with your financial advisor, who can help guide you in building a portfolio for your unique investment goals and risk tolerance.
We appreciate the confidence and trust you have placed in our efforts. Thank you for being a shareholder.
My best,

Michael Loveless
President
1
| Portfolio Manager’s Letter (Unaudited) | |
Dear Fellow Shareholder,
We are pleased again to present the Annual Report for the First Security Municipal Bond Fund. 2018 promises to be a year of volatility in the fixed income sector. An active Federal Reserve continues to tighten through rate hikes and balance sheet reductions. The result should be a flat yield curve and tempered yield expectations. Bonds again should play an important role in portfolio diversification.
Additionally, there may be an interesting interplay between equity and fixed income markets. While the specter of inflation would hurt bond values, rising rates could precipitate a selloff in equities and result in a flight to quality bonds. Cognizant of this, our strategy remains constant.
FSARX will maintain higher quality securities and an intermediate Fund duration. A rise in yields would be disruptive but much more so in longer term, lower quality positions. We will also continue to focus on higher coupon holdings that will provide immediate current income for future reinvestment into expected higher rates.
The Fund’s methodology is illustrated below:
| Ratings Weight | % of Bonds |
| AAA | 11% |
| AA | 59% |
| A | 25% |
| BBB | 2% |
| NR | 3% |
| | 100% |
| Maturity Weight | % of Bonds |
| 1 - 5 Yrs | 5% |
| 5 - 7 Yrs | 4% |
| 7 - 10 Yrs | 32% |
| 10 - 15 Yrs | 56% |
| 15 - 20 Yrs | 2% |
| 20 - 30 Yrs | 1% |
| | 100% |
The portfolio credit structure consists of 41% general obligation positions and 59% revenue bonds. The Fund’s duration was approximately 6.03 years.
Thank you for your continued participation in the Fund.
Respectfully,

Jim Jones
Portfolio Manager
2
| Investment Results (Unaudited) | |
Average Annual Total Returns(a) as of April 30, 2018
| | One Year | Since
Inception
(5/29/2015) |
| First Security Municipal Bond Fund | | |
| Institutional Shares | 1.90% | 2.17% |
| A Shares with load | -0.28% | 1.44% |
| A Shares without load | 1.80% | 2.13% |
| Bloomberg Barclays Municipal Bond 1-15 Year Blend Index(b) | 0.82% | 1.96% |
| | Expense Ratios(c) |
| | Institutional
Shares | A Shares |
| Gross | 2.44% | 2.44% |
| With Applicable Waivers | 1.01% | 1.01% |
The performance quoted represents past performance, which does not guarantee future results. The investment return and principal value of an investment will fluctuate so that an investor’s shares, when redeemed, may be worth more or less than their original cost. The returns shown do not reflect deduction of taxes that a shareholder would pay on the First Security Municipal Bond Fund (the “Fund”) distributions or the redemption of Fund shares. Current performance of the Fund may be lower or higher than the performance quoted. The Fund’s investment objectives, risks, charges and expenses must be considered carefully before investing. Performance data current to the most recent month end may be obtained by calling 1-800-813-1421.
| (a) | Average annual total returns reflect any change in price per share and assume the reinvestment of all distributions. The Fund’s returns reflect any fee reductions during the applicable period. If such reductions had not occurred, the quoted performance would have been lower. Return figures for A Shares with load include the maximum 2.00% sales charge. |
| (b) | The Bloomberg Barclays Municipal Bond 1-15 Year Blend Index (“Index”) is an unmanaged index that represents the performance of municipal bonds with maturities from 1 to 15 years. The returns of the Index do not reflect the deduction of fees and expenses, whereas the fund returns are shown net of fees. An individual cannot invest directly in an index. |
| (c) | The expense ratios are from the Fund’s prospectus dated August 28, 2017. First Security Fund Advisers, Inc. (the “Adviser”), the Fund’s adviser, contractually has agreed, until August 31, 2018, to waive its management fee and/or reimburse expenses so that total annual operating expenses (excluding (i) interest; (ii) taxes; (iii) brokerage fees and commissions; (iv) other extraordinary expenses not incurred in the ordinary course of the Fund’s business; (v) dividend expenses on short sales; (vi) indirect expenses such as acquired fund fees and expenses; and (vii) expenses incurred under a Rule 12b-1 plan of distribution) do not exceed 0.99% of the Fund’s average daily net assets (“Expense Limitation Agreement”). So long as the Investment Advisory Agreement between the Adviser and Capitol Series Trust is in effect, the Advisory may recoup the sum of all fees previously waived or expenses reimbursed during any of the previous 36 months, less any reimbursement previously paid, if such recoupment can be achieved within the foregoing expense limits, as well as any expense limitation in effect at the time the reimbursement is made. This Expense Limitation Agreement may be terminated by the Board at any time. In addition, the Adviser voluntarily agreed to waive its fees and/or reimburse certain operating expenses of the Fund so that total annual operating expenses do not exceed 0.01% of the Fund’s average daily net assets. The voluntary waiver or reimbursement may be terminated at any time at the option of the Adviser and is not subject to recoupment. Additional information pertaining to the Fund’s expense ratios as of April 30, 2018, can be found in the financial highlights. |
The Fund’s investment objectives, strategies, risks, charges and expenses must be considered carefully before investing. The prospectus contains this and other important information about the Fund and may be obtained by calling the 1-800-813-1421. Please read it carefully before investing.
The Fund is distributed by Unified Financial Securities, LLC., member FINRA/SIPC.
3
| Investment Results (Unaudited) (continued) | |
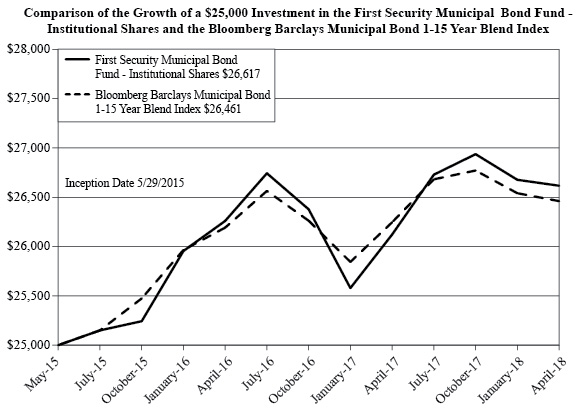
The chart above assumes an initial investment of $25,000 made on May 29, 2015 (commencement of operations) and held through April 30, 2018. THE FUND’S RETURNS REPRESENT PAST PERFORMANCE AND DO NOT GUARANTEE FUTURE RESULTS. The returns shown do not reflect deduction of taxes that a shareholder would pay on the Fund’s distributions or the redemption of the Fund’s shares. Investment returns and principal values will fluctuate so that your shares, when redeemed, may be worth more or less than their original purchase price.
The Bloomberg Barclays Municipal Bond 1-15 Year Blend Index is an unmanaged index that represents the performance of municipal bonds with maturities from 1 to 15 years. The returns of the Index do not reflect the deduction of fees and expenses, whereas the fund returns are shown net of fees. An individual cannot invest directly in an index.
Current performance may be lower or higher than the performance data quoted. For more information on the Fund, and to obtain performance data current to the most recent month-end, or to request a prospectus, please call 1-800-813-1421. You should carefully consider the investment objectives, potential risks, management fees, and charges and expenses of the Fund before investing. The Fund’s prospectus contains this and other information about the Fund, and should be read carefully before investing.
The Fund is distributed by Unified Financial Securities, LLC, Member FINRA/SIPC.
4
Portfolio Illustration (Unaudited)
April 30, 2018 | |
The following chart gives a visual breakdown of the Fund’s holdings by state as a percentage net assets.
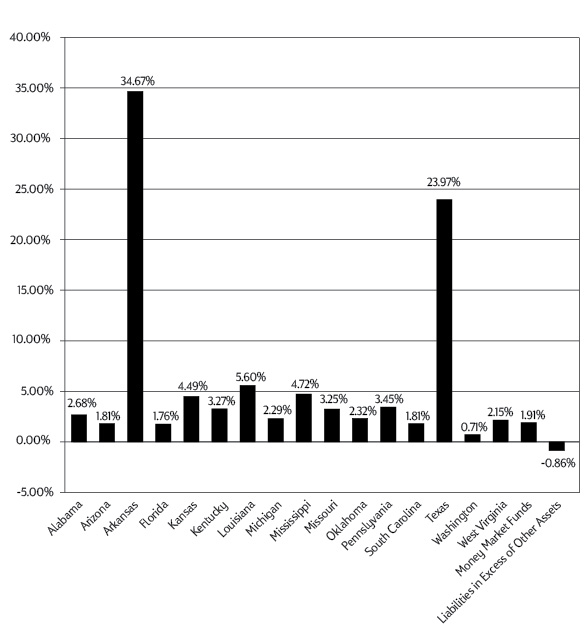
Availability of Portfolio Schedule (Unaudited)
The Fund files its complete schedule of portfolio holdings with the Securities and Exchange Commission (“SEC”) for the first and third quarters of each fiscal year on Form N-Q. The Fund’s Forms N-Q are available at the SEC’s website at www.sec.gov. The Fund’s Forms N-Q may be reviewed and copied at the Public Reference Room in Washington DC. Information on the operation of the Public Reference Room may be obtained by calling 1-800-SEC-0330.
5
First Security Municipal Bond Fund
Schedule of Investments
April 30, 2018
| | | Principal Amount | | | Fair Value | |
| | | | | | | |
| MUNICIPAL BONDS — 98.95% |
| | | | | | | |
| Alabama - 2.68% | | | | | | |
| City of Cullman, GO, 5.00%, 7/1/2021 | | $ | 100,000 | | | $ | 107,746 | |
| Tuscaloosa City Board of Education, Revenue, 5.00%, 8/1/2027 | | | 250,000 | | | | 291,243 | |
| | | | | | | | 398,989 | |
| Arizona - 1.81% | | | | | | | | |
| City of Glendale, Senior Excise Tax, Revenue, 4.00%, 7/1/2029 | | | 150,000 | | | | 159,666 | |
| Glendale Union School District No. 205, Series C, (BAM), GO, 5.00%, 7/1/2027 | | | 100,000 | | | | 110,810 | |
| | | | | | | | 270,476 | |
| Arkansas - 34.67% | | | | | | | | |
| Arkadelphia Public Education Facilities Board, Ouachita Baptist University, Revenue, 4.50%, 3/1/2033 | | | 250,000 | | | | 258,075 | |
| Arkansas Development Finance Authority, Episcopal Collegiate School, Revenue, 3.75%, 10/1/2031 | | | 50,000 | | | | 49,142 | |
| Arkansas Development Finance Authority, Hendrix College, Revenue, 4.50%, 10/1/2029 | | | 150,000 | | | | 159,162 | |
| Arkansas Development Finance Authority, Hendrix College, Revenue, 4.50%, 10/1/2030 | | | 150,000 | | | | 158,715 | |
| Arkansas State University, Jonesboro Campus, Revenue, 4.00%, 3/1/2025 | | | 150,000 | | | | 162,086 | |
| Arkansas State University, Jonesboro Campus, Student Fee, Series B, Revenue, 4.00%, 12/1/2028 | | | 350,000 | | | | 372,298 | |
| Arkansas State University, Revenue, 4.00%, 3/1/2029 | | | 100,000 | | | | 106,833 | |
| Batesville School District No. 1, GO, 3.00%, 2/1/2019 | | | 100,000 | | | | 100,907 | |
| City of Bryant, Sales & Use Tax, Series B, Revenue, 4.00%, 12/1/2031 | | | 330,000 | | | | 348,142 | |
| City of Fayetteville, GO, 4.00%, 1/1/2032 | | | 100,000 | | | | 106,086 | |
| City of Fort Smith Water & Sewer, Revenue, 5.00%, 10/1/2024 | | | 75,000 | | | | 84,906 | |
| City of Fort Smith Water & Sewer, Revenue, 5.00%, 10/1/2027 | | | 265,000 | | | | 299,614 | |
| City of Fort Smith Water & Sewer, Revenue, (BAM), 5.00%, 10/1/2027 | | | 250,000 | | | | 288,943 | |
| City of Little Rock, Capital Improvement, Revenue, 4.00%, 10/1/2030 | | | 100,000 | | | | 106,456 | |
| City of Rogers Water, Revenue, 4.00%, 11/1/2027 | | | 250,000 | | | | 265,888 | |
| City of Rogers Water, Revenue, 4.00%, 11/1/2028 | | | 200,000 | | | | 211,466 | |
| City of Springdale, Sales & Use Tax, Revenue, (BAM), 5.00%, 4/1/2037 (a) | | | 250,000 | | | | 275,455 | |
| Lake Hamilton School District No. 5, GO, 3.00%, 4/1/2029 | | | 25,000 | | | | 24,633 | |
| Pulaski County Arkansas Children's Hospital, Revenue, 5.00%, 3/1/2029 | | | 350,000 | | | | 403,476 | |
| Pulaski County Public Facilities Board, Baptist Health, Revenue, 5.00%, 12/1/2039 | | | 100,000 | | | | 109,299 | |
| Springdale Public Facilities Board Arkansas Children's Northwest Hospital, Revenue, 5.00%, 3/1/2025 | | | 100,000 | | | | 115,063 | |
| Springdale Public Facilities Board Arkansas Children's Northwest Hospital, Revenue, 5.00%, 3/1/2028 | | | 190,000 | | | | 220,860 | |
| State of Arkansas, Water, Waste Disposal & Pollution Abatement Facilities, GO, 4.00%, 7/1/2027 | | | 150,000 | | | | 165,935 | |
| University of Arkansas, Fort Smith Campus, Student Fee, Revenue, 5.00%, 12/1/2022 | | | 150,000 | | | | 168,134 | |
| University of Arkansas, Little Rock Campus, Student Fee, Revenue, 5.00%, 10/1/2028 | | | 50,000 | | | | 59,548 | |
6
See accompanying notes which are an integral part of these financial statements.
First Security Municipal Bond Fund
Schedule of Investments (continued)
April 30, 2018
| | | Principal Amount | | | Fair Value | |
| Arkansas - (continued) | | | | | | | | |
| University of Arkansas, Little Rock Campus, Student Fee, Revenue, 5.00%, 10/1/2031 | | $ | 40,000 | | | $ | 47,056 | |
| University of Arkansas, Medical Sciences, Series A, Revenue, 5.00%, 12/1/2026 | | | 25,000 | | | | 26,877 | |
| University of Arkansas, Revenue, 5.00%, 12/1/2026 | | | 100,000 | | | | 118,181 | |
| University of Arkansas, Revenue, 5.00%, 10/1/2029 | | | 150,000 | | | | 173,969 | |
| University of Arkansas, Revenue, 5.00%, 10/1/2030 | | | 150,000 | | | | 174,704 | |
| | | | | | | | 5,161,909 | |
| Florida - 1.76% | | | | | | | | |
| City of Winter Park Electric, Revenue, 5.00%, 10/1/2025 | | | 100,000 | | | | 116,453 | |
| Orange County Water Utility System, Revenue, 3.00%, 10/1/2032 | | | 150,000 | | | | 145,709 | |
| | | | | | | | 262,162 | |
| Kansas - 4.49% | | | | | | | | |
| Ford County Unified School District No. 443, Series A, (BAM), GO, 5.00%, 3/1/2024 | | | 100,000 | | | | 112,673 | |
| Johnson & Miami Counties Unified School District No. 230, Series B, GO, 5.00%, 9/1/2027 | | | 100,000 | | | | 118,115 | |
| Johnson County Unified School District No. 233, Series A, GO, 4.00%, 9/1/2031 | | | 100,000 | | | | 107,214 | |
| Johnson County Unified School District No. 233, Series C, GO, 4.00%, 9/1/2029 | | | 100,000 | | | | 108,086 | |
| Kansas State University Development Finance Authority, Series A, Revenue, 4.00%, 3/1/2028 | | | 100,000 | | | | 106,411 | |
| Wyandotte County-Kansas City Unified Government Utility System, Series B, Revenue, 5.00%, 9/1/2027 | | | 100,000 | | | | 115,439 | |
| | | | | | | | 667,938 | |
| Kentucky - 3.27% | | | | | | | | |
| Kenton County School District Finance Corporation, Revenue, (SEEK), 4.00%, 2/1/2028 | | | 150,000 | | | | 159,867 | |
| Kentucky State Property & Building Commission, Prerefunded, Revenue, 5.50%, 11/1/2028 | | | 110,000 | | | | 112,005 | |
| Madison County School District Finance Corporation, Revenue, (SEEK), 4.00%, 12/1/2025 | | | 200,000 | | | | 216,286 | |
| | | | | | | | 488,158 | |
| Louisiana - 5.60% | | | | | | | | |
| City of Ruston, Sales Tax, Revenue, (AGM), 5.00%, 6/1/2026 | | | 100,000 | | | | 115,418 | |
| City of Ruston, Sales Tax, Revenue, (AGM), 5.00%, 6/1/2031 | | | 300,000 | | | | 339,086 | |
| City of Shreveport, Water & Sewer Improvement, GO, 5.00%, 9/1/2029 | | | 150,000 | | | | 165,989 | |
| Monroe Special School District, GO, 4.00%, 3/1/2028 | | | 200,000 | | | | 212,048 | |
| | | | | | | | 832,541 | |
| Michigan - 2.29% | | | | | | | | |
| Saline Area Schools, GO, (Q-SBLF), 5.00%, 5/1/2031 | | | 300,000 | | | | 340,325 | |
| | | | | | | | | |
| Mississippi - 4.72% | | | | | | | | |
| City of Tupelo, GO, 4.00%, 7/1/2020 | | | 250,000 | | | | 259,883 | |
| Mississippi Development Bank, Revenue, 4.00%, 3/1/2027 | | | 200,000 | | | | 214,926 | |
See accompanying notes which are an integral part of these financial statements.
7
First Security Municipal Bond Fund
Schedule of Investments (continued)
April 30, 2018
| | | Principal Amount | | | Fair Value | |
| Mississippi - (continued) | | | | | | | | |
| Rankin County School District, GO, 5.00%, 10/1/2020 | | $ | 50,000 | | | $ | 53,493 | |
| University of Mississippi Educational Building Corporation, Series A, Revenue, 5.00%, 10/1/2025 | | | 150,000 | | | | 174,020 | |
| | | | | | | | 702,322 | |
| Missouri - 3.25% | | | | | | | | |
| Lincoln County Public Water Supply District No. 1, COP, 4.00%, 7/1/2031 | | | 200,000 | | | | 204,070 | |
| Missouri Joint Municipal Electric Utility Commission Power Project, Prairie Street Project, Series A, Revenue, 5.00%, 12/1/2030 | | | 250,000 | | | | 279,478 | |
| | | | | | | | 483,548 | |
| Oklahoma - 2.32% | | | | | | | | |
| Oklahoma Municipal Power Authority, Series A, Revenue, 5.00%, 1/1/2029 | | | 300,000 | | | | 345,449 | |
| | | | | | | | | |
| Pennsylvania - 3.45% | | | | | | | | |
| City of Lancaster, (AGM), GO, 5.00%, 11/1/2028 | | | 300,000 | | | | 343,067 | |
| Pennsylvania Turnpike Commission, Series A-1, Revenue, 5.00%, 12/1/2029 | | | 150,000 | | | | 170,805 | |
| | | | | | | | 513,872 | |
| South Carolina - 1.81% | | | | | | | | |
| County of Richland, GO, 4.00%, 3/1/2029 | | | 250,000 | | | | 269,678 | |
| | | | | | | | | |
| Texas - 23.97% | | | | | | | | |
| City of Athens, (AGM), GO, 4.00%, 8/1/2032 | | | 300,000 | | | | 313,937 | |
| City of Baytown, GO, 5.00%, 2/1/2026 | | | 50,000 | | | | 57,414 | |
| City of Corinth, GO, 5.00%, 2/15/2027 | | | 100,000 | | | | 116,355 | |
| City of Denton, GO, 5.00%, 2/15/2026 | | | 250,000 | | | | 291,460 | |
| City of Georgetown, GO, 5.00%, 8/15/2025 | | | 150,000 | | | | 174,290 | |
| City of McAllen Waterworks & Sewer, Revenue, 4.00%, 2/1/2028 | | | 100,000 | | | | 106,937 | |
| City of Mesquite Waterworks & Sewer System, Revenue, 5.00%, 3/1/2025 | | | 110,000 | | | | 126,569 | |
| City of Pearland, GO, 5.00%, 3/1/2029 | | | 250,000 | | | | 292,758 | |
| City of Pflugerville, GO, 5.00%, 8/1/2024 | | | 65,000 | | | | 72,116 | |
| City of San Marcos, GO, 5.00%, 8/15/2028 | | | 100,000 | | | | 113,336 | |
| City of Waxahachie, Series A, GO, 4.00%, 8/1/2031 | | | 230,000 | | | | 244,955 | |
| Crowley Independent School District, Series B, (PSF-GTD), GO, 4.00%, 8/1/2028 | | | 285,000 | | | | 309,033 | |
| Edinburg Consolidated Independent School District, (PSF-GTD), GO, 5.00%, 2/15/2028 | | | 200,000 | | | | 233,476 | |
| Garland Independent School District, (PSF - GTD), GO, 5.00%, 2/15/2029 | | | 50,000 | | | | 52,681 | |
| La Porte Independent School District, GO, 5.00%, 2/15/2027 | | | 100,000 | | | | 109,657 | |
| McKinney Independent School District, (PSF - GTD), GO, 4.00%, 2/15/2029 | | | 200,000 | | | | 217,116 | |
| Midland Independent School District, (PSF - GTD), GO, 5.00%, 2/15/2029 | | | 150,000 | | | | 173,369 | |
| Mount Pleasant Independent School District, Maintenance Tax, (AGM), GO, 5.00%, 8/15/2025 | | | 240,000 | | | | 271,411 | |
| San Jacinto River Authority, Revenue, (AGM), 5.00%, 10/1/2032 | | | 100,000 | | | | 103,875 | |
8
See accompanying notes which are an integral part of these financial statements.
First Security Municipal Bond Fund
Schedule of Investments (continued)
April 30, 2018
| | | | Principal Amount | | | | Fair Value | |
| Texas - (continued) | | | | | | | | |
| Tarrant Regional Water District, Revenue, 4.00%, 3/1/2032 | | $ | 100,000 | | | $ | 106,857 | |
| Weatherford Independent School District, (PSF - GTD), GO, 5.00%, 2/15/2023 | | | 70,000 | | | | 78,652 | |
| | | | | | | | 3,566,254 | |
| Washington - 0.71% | | | | | | | | |
| Port Everett, Revenue, 4.00%, 12/1/2031 | | | 100,000 | | | | 105,874 | |
| | | | | | | | | |
| West Virginia - 2.15% | | | | | | | | |
| City of Charleston Sewerage System, Revenue, 4.00%, 7/1/2029 | | | 100,000 | | | | 107,265 | |
| City of Charleston Sewerage System, Revenue, 4.00%, 7/1/2030 | | | 100,000 | | | | 106,519 | |
| City of Charleston Sewerage System, Revenue, 4.00%, 7/1/2031 | | | 100,000 | | | | 105,704 | |
| | | | | | | | 319,488 | |
| Total Municipal Bonds (Cost $15,243,707) | | | | | | | 14,728,983 | |
| | | | | | | | | |
| MONEY MARKET FUNDS - 1.91% | | | | | | | | |
| | | | Shares | | | | | |
| Federated Treasury Obligations Fund, Institutional Shares, 1.57% (b) | | | 283,583 | | | | 283,583 | |
| Total Money Market Funds (Cost $283,583) | | | | | | | 283,583 | |
| | | | | | | | | |
| Total Investments — 100.86% (Cost $15,527,290) | | | | | | | 15,012,566 | |
| | | | | | | | | |
| Liabilities in Excess of Other Assets — (0.86)% | | | | | | | (128,707 | ) |
| | | | | | | | | |
| NET ASSETS — 100.00% | | | | | | $ | 14,883,859 | |
| (a) | Security is purchased on a when-issued basis. |
| (b) | Rate disclosed is the seven day effective yield as of April 30, 2018. |
AGM - Assured Guaranty Municipal Corporation
BAM - Build America Mutual Assurance Company
COP - Certificate of Participation
GO - General Obligation
PSF-GTD - Permanent School Fund Guaranteed
Q-SBLF - Qualified School Bond Loan Fund
SEEK - Support Education Excellence in Kentucky Funding Program
See accompanying notes which are an integral part of these financial statements.
9
First Security Municipal Bond Fund
Statement of Assets and Liabilities
April 30, 2018
| Assets |
| Investments in securities at fair value (cost $15,527,290) | | $ | 15,012,566 | |
| Interest and dividends receivable | | | 153,738 | |
| Receivable from Adviser | | | 24,001 | |
| Prepaid expenses | | | 13,048 | |
| Total Assets | | | 15,203,353 | |
| Liabilities |
| Payable for investments purchased | | | 275,313 | |
| Payable for distributions to shareholders | | | 6,575 | |
| Payable to Administrator | | | 9,874 | |
| Payable to auditors | | | 17,000 | |
| Other accrued expenses | | | 10,732 | |
| Total Liabilities | | | 319,494 | |
| Net Assets | | $ | 14,883,859 | |
| Net Assets consist of: | | | | |
| Paid-in capital | | $ | 15,414,468 | |
| Accumulated undistributed net investment income | | | 5,778 | |
| Accumulated net realized loss from investments | | | (21,663 | ) |
| Net unrealized depreciation on investments | | | (514,724 | ) |
| Net Assets | | $ | 14,883,859 | |
| Net Assets: Institutional Shares | | $ | 2,531,741 | |
| Shares outstanding | | | 253,696 | |
| Net asset value, offering and redemption price per share | | $ | 9.98 | |
| Net Assets: A Shares | | $ | 12,352,118 | |
| Shares outstanding | | | 1,238,354 | |
| Net asset value and redemption price per share | | $ | 9.97 | |
| Maximum offering price (100%/(100%-maximum sales charge) of net asset value adjusted to the nearest cent) per share | | $ | 10.17 | |
| Maximum sales charge | | | 2.00 | % |
10
See accompanying notes which are an integral part of these financial statements.
First Security Municipal Bond Fund
Statement of Operations
For the year ended April 30, 2018
| Investment Income | | | |
| Dividend income | | $ | 3,254 | |
| Interest income | | | 416,603 | |
| Total investment income | | | 419,857 | |
| Expenses | | | | |
| Investment Adviser | | | 74,199 | |
| Administration | | | 53,500 | |
| Fund accounting | | | 35,000 | |
| Transfer agent | | | 30,000 | |
| Audit and tax preparation | | | 28,116 | |
| Legal | | | 19,318 | |
| Pricing | | | 17,116 | |
| Printing | | | 12,450 | |
| Registration | | | 6,810 | |
| Custodian | | | 6,000 | |
| Trustee | | | 5,598 | |
| Insurance | | | 3,802 | |
| Miscellaneous | | | 12,541 | |
| Total expenses | | | 304,450 | |
| Fees contractually waived and expenses reimbursed by Adviser | | | (154,533 | ) |
| Fees voluntarily waived and reimbursed by Adviser | | | (148,398 | ) |
| Net operating expenses | | | 1,519 | |
| Net investment income | | | 418,338 | |
| Net Realized and Change in Unrealized Gain (Loss) on Investments |
| Net realized loss on investment securities transactions | | | (13,895 | ) |
| Net change in unrealized appreciation (depreciation) of investment securities | | | (118,267 | ) |
| Net realized and change in unrealized loss on investments | | | (132,162 | ) |
| Net increase in net assets resulting from operations | | $ | 286,176 | |
See accompanying notes which are an integral part of these financial statements.
11
First Security Municipal Bond Fund
Statements of Changes in Net Assets
| | | For the
Year Ended
April 30, 2018 | | | For the
Year Ended
April 30, 2017 | |
Increase (Decrease) in Net Assets due to:
Operations | | | | | | |
| Net investment income | | $ | 418,338 | | | $ | 330,618 | |
| Net realized loss on investment securities transactions | | | (13,895 | ) | | | (6,664 | ) |
| Net change in unrealized appreciation (depreciation) of investment securities | | | (118,267 | ) | | | (481,134 | ) |
| Net increase (decrease) in net assets resulting from operations | | | 286,176 | | | | (157,180 | ) |
| Distributions From | | | | | | | | |
| Net investment income: | | | | | | | | |
| Institutional Shares | | | (62,277 | ) | | | (42,292 | ) |
| A Shares | | | (356,320 | ) | | | (283,628 | ) |
| Net realized gains: | | | | | | | | |
| Institutional Shares | | | — | | | | (269 | ) |
| A Shares | | | — | | | | (2,296 | ) |
| Total distributions | | | (418,597 | ) | | | (328,485 | ) |
| Capital Transactions – Institutional Shares | | | | | | | | |
| Proceeds from shares sold | | | 450,000 | | | | 490,250 | |
| Reinvestment of distributions | | | 62,277 | | | | 42,561 | |
| Amount paid for shares redeemed | | | (22,627 | ) | | | (18,382 | ) |
| Total Capital Transactions - Institutional Shares | | | 489,650 | | | | 514,429 | |
| Capital Transactions – A Shares | | | | | | | | |
| Proceeds from shares sold | | | 1,084,421 | | | | 9,821,048 | |
| Reinvestment of distributions | | | 275,005 | | | | 216,809 | |
| Amount paid for shares redeemed | | | (2,311,887 | ) | | | (712,188 | ) |
| Total Capital Transactions - A Shares | | | (952,461 | ) | | | 9,325,669 | |
| Net increase (decrease) in net assets resulting from capital transactions | | | (462,811 | ) | | | 9,840,098 | |
| Total Increase (Decrease) in Net Assets | | | (595,232 | ) | | | 9,354,433 | |
| Net Assets | | | | | | | | |
| Beginning of year | | | 15,479,091 | | | | 6,124,658 | |
| End of year | | $ | 14,883,859 | | | $ | 15,479,091 | |
| Accumulated net investment income | | $ | 5,778 | | | $ | 6,037 | |
| Share Transactions - Institutional Shares | | | | | | | | |
| Shares sold | | | 44,074 | | | | 49,024 | |
| Shares issued in reinvestment of distributions | | | 6,136 | | | | 4,196 | |
| Shares redeemed | | | (2,201 | ) | | | (1,746 | ) |
| Total Share Transactions- Institutional Shares | | | 48,009 | | | | 51,474 | |
| Share Transactions - A Shares | | | | | | | | |
| Shares sold | | | 106,074 | | | | 944,839 | |
| Shares issued in reinvestment of distributions | | | 27,083 | | | | 21,447 | |
| Shares redeemed | | | (226,706 | ) | | | (71,065 | ) |
| Total Share Transactions- A Shares | | | (93,549 | ) | | | 895,221 | |
12
See accompanying notes which are an integral part of these financial statements.
First Security Municipal Bond Fund - Institutional Shares Financial Highlights Selected data for a share outstanding throughout each period. |
| | | For the
Year Ended
April 30,
2018 | | | For the
Year Ended
April 30,
2017 | | | For the
Period Ended
April 30, 2016(a) | |
| Net asset value, at beginning of period | | $ | 10.07 | | | $ | 10.37 | | | $ | 10.00 | |
| Income from investment operations: | | | | | | | | | | | | |
| Net investment income | | | 0.28 | | | | 0.25 | | | | 0.14 | |
| Net realized and unrealized gain (loss) on investments | | | (0.09 | ) | | | (0.31 | ) | | | 0.36 | |
| Total from investment operations | | | 0.19 | | | | (0.06 | ) | | | 0.50 | |
| Distributions from: | | | | | | | | | | | | |
| Net investment income | | | (0.28 | ) | | | (0.24 | ) | | | (0.13 | ) |
| Net realized gains | | | — | | | | — | (b) | | | — | |
| Total from distributions | | | (0.28 | ) | | | (0.24 | ) | | | (0.13 | ) |
| Net asset value, at end of period | | $ | 9.98 | | | $ | 10.07 | | | $ | 10.37 | |
| Total Return (c) | | | 1.90 | % | | | (0.52 | )% | | | 5.04 | %(d) |
| Ratios/Supplemental Data: | | | | | | | | | | | | |
| Net assets at end of period (thousands) | | $ | 2,532 | | | $ | 2,072 | | | $ | 1,599 | |
| Before waiver: | | | | | | | | | | | | |
| Ratio of net expenses to average net assets | | | 2.01 | % | | | 2.42 | % | | | 9.13 | %(e) |
| After waiver: | | | | | | | | | | | | |
| Ratio of expenses to average net assets | | | 0.01 | % | | | 0.01 | % | | | 0.01 | %(e) |
| Ratio of net investment income to average net assets | | | 2.76 | % | | | 2.56 | % | | | 1.86 | %(e) |
| Portfolio turnover (f) | | | 7 | % | | | 5 | % | | | 26 | %(d) |
| (a) | For the period May 29, 2015 (commencement of operations) through April 30, 2016. |
| (b) | Amount is less than $0.005 per share. |
| (c) | Total return in the above table represents the rate that the investor would have earned or lost on an investment in the Fund, assuming reinvestment of distributions. |
| (f) | Portfolio turnover is calculated on the basis on the Fund as a whole without distinguishing among the classes of shares. |
See accompanying notes which are an integral part of these financial statements.
13
First Security Municipal Bond Fund - A Shares Financial Highlights Selected data for a share outstanding throughout each period. |
| | | For the
Year Ended
April 30,
2018 | | | For the
Year Ended
April 30,
2017 | | | For the
Period Ended
April 30, 2016(a) | |
| Net asset value, at beginning of period | | $ | 10.07 | | | $ | 10.36 | | | $ | 10.00 | |
| Income from investment operations: | | | | | | | | | | | | |
| Net investment income | | | 0.28 | | | | 0.24 | | | | 0.13 | |
| Net realized and unrealized gain (loss) on investments | | | (0.10 | ) | | | (0.29 | ) | | | 0.36 | |
| Total from investment operations | | | 0.18 | | | | (0.05 | ) | | | 0.49 | |
| Distributions from: | | | | | | | | | | | | |
| Net investment income | | | (0.28 | ) | | | (0.24 | ) | | | (0.13 | ) |
| Net realized gain | | | — | | | | — | (b) | | | — | |
| Total from distributions | | | (0.28 | ) | | | (0.24 | ) | | | (0.13 | ) |
| Net asset value, at end of period | | $ | 9.97 | | | $ | 10.07 | | | $ | 10.36 | |
| Total Return (c) | | | 1.80 | % | | | (0.43 | )% | | | 4.94 | %(d) |
| Ratios/Supplemental Data: | | | | | | | | | | | | |
| Net assets at end of period (thousands) | | $ | 12,352 | | | $ | 13,408 | | | $ | 4,526 | |
| Before waiver: | | | | | | | | | | | | |
| Ratio of net expenses to average net assets | | | 2.01 | % | | | 2.42 | % | | | 9.13 | %(e) |
| After waiver: | | | | | | | | | | | | |
| Ratio of expenses to average net assets | | | 0.01 | % | | | 0.01 | % | | | 0.01 | %(e) |
| Ratio of net investment income to average net assets | | | 2.76 | % | | | 2.56 | % | | | 1.86 | %(e) |
| Portfolio turnover (f) | | | 7 | % | | | 5 | % | | | 26 | %(d) |
| (a) | For the period May 29, 2015 (commencement of operations) through April 30, 2016. |
| (b) | Amount is less than $0.005 per share. |
| (c) | Total return in the above table represents the rate that the investor would have earned or lost on an investment in the Fund, assuming reinvestment of distributions and excludes any sales charges. |
| (f) | Portfolio turnover is calculated on the basis on the Fund as a whole without distinguishing among the classes of shares. |
14
See accompanying notes which are an integral part of these financial statements.
First Security Municipal Bond Fund
Notes to the Financial Statements
April 30, 2018
NOTE 1. ORGANIZATION
The First Security Municipal Bond Fund (the “Fund”) was organized as a diversified series of Capitol Series Trust (the “Trust”) on April 29, 2015. The Trust is an open-end investment company established under the laws of Ohio by an Agreement and Declaration of Trust dated September 18, 2013 (the “Trust Agreement”). The Trust Agreement permits the Board of Trustees of the Trust (the “Board”) to issue an unlimited number of shares of beneficial interest of separate series without par value. The Fund is one of a series of funds currently authorized by the Board. The Fund’s investment adviser is First Security Fund Advisers, Inc. (the “Adviser”). The investment objective of the Fund is to seek income and capital appreciation.
The Fund currently offers two classes of shares, Institutional Shares and A Shares. The Fund commenced operations on May 29, 2015. Each share represents an equal proportionate interest in the assets and liabilities belonging to the Fund and is entitled to such dividends and distributions out of income belonging to the Fund as are declared by the Board. Class A Shares currently have a maximum sales charge on purchases of 2.00% as a percentage of the original purchase price.
NOTE 2. SIGNIFICANT ACCOUNTING POLICIES
The Fund is an investment company and follows accounting and reporting guidance under Financial Accounting Standards Board Accounting Standards Codification (“ASC”) Topic 946, “Financial Services-Investments Companies”. The following is a summary of significant accounting policies followed by the Fund in the preparation of its financial statements. These policies are in conformity with generally accepted accounting principles in the United States of America (“GAAP”).
Estimates – The preparation of financial statements in conformity with GAAP requires management to make estimates and assumptions that affect the reported amounts of assets and liabilities and disclosure of contingent assets and liabilities at the date of the financial statements and the reported amounts of increases and decreases in net assets from operations during the reporting period. Actual results could differ from those estimates.
Securities Valuation – All investments in securities are recorded at their estimated fair value as described in Note 3.
Federal Income Taxes – The Fund makes no provision for federal income tax or excise tax. The Fund has qualified and intends to qualify each year as a regulated investment company (“RIC”) under subchapter M of the Internal Revenue Code of 1986, as amended, by complying with the requirements applicable to RICs and by distributing substantially all of its taxable income. The Fund also intends to distribute sufficient net investment income and net capital gains, if any, so that it will not be subject to excise tax on undistributed income and gains. If the required amount of net investment income or gains is not distributed, the Fund could incur a tax expense.
The Fund recognizes tax benefits or expenses of uncertain tax positions only when the position is “more likely than not” to be sustained assuming examination by tax authorities. Management of the Fund has reviewed tax positions taken in tax years that remain subject to examination by all major tax jurisdictions, including federal (i.e., the last three tax year ends and the interim tax period since then, as applicable) and has concluded that no provision for unrecognized tax benefits or expenses is required
15
First Security Municipal Bond Fund
Notes to the Financial Statements (continued)
April 30, 2018
in these financial statements and does not expect this to change over the next twelve months. The Fund recognizes interest and penalties, if any, related to unrecognized tax benefits as income tax expense in the Statement of Operations. During the year, the Fund did not incur any interest or penalties.
Expenses – Expenses incurred by the Trust that do not relate to a specific fund of the Trust are allocated to the individual funds based on each fund’s relative net assets or another appropriate basis (as determined by the Board). Expenses attributable to any class are borne by that class. Income, realized gains and losses, unrealized appreciation and depreciation, and expenses are allocated to each class based on the net assets of that class in relation to the relative net assets of the Fund.
Security Transactions and Related Income – Throughout the reporting period, security transactions are accounted for no later than one business day following the trade date. For financial reporting purposes, security transactions are accounted for on trade date on the last business day of the reporting period. The specific identification method is used for determining gains or losses for financial statements and income tax purposes. Dividend income is recorded on the ex-dividend date and interest income is recorded on an accrual basis. Discounts and premiums on securities purchased are amortized or accreted over the remaining life of the respective investment using the effective interest method.
Dividends and Distributions – The Fund intends to distribute substantially all of its net investment income, if any, as dividends to its shareholders on a monthly basis. The Fund intends to distribute its net realized long-term capital gains and its net realized short-term capital gains, if any, to its shareholders at least once a year. Distributions to shareholders, which are determined in accordance with income tax regulations, are recorded on the ex-dividend date. The treatment for financial reporting purposes of distributions made to shareholders during the period from net investment income or net realized capital gains may differ from their ultimate treatment for federal income tax purposes. These differences are caused primarily by differences in the timing of the recognition of certain components of income, expense or realized capital gains for federal income tax purposes. Where such differences are permanent in nature, they are reclassified in the components of net assets based on their ultimate characterization for federal income tax purposes. Any such reclassifications will have no effect on net assets, results of operations or net asset values per share of the Fund. For the fiscal year ended April 30, 2018, the Fund made the following reclassifications to increase (decrease) the components of net assets:
| Paid-In Capital | Accumulated Undistributed
Net Investment Income | Accumulated Net Realized
Loss from Investments |
| $ 1,104 | $ — | $ (1,104) |
When-Issued Securities and Forward Commitments – The Fund may purchase securities offered on a “when-issued” and “forward commitment” basis (including a delayed delivery basis). Securities purchased on a “when-issued” or “forward commitment basis” are securities not available for immediate delivery despite the fact that a market exists for those securities. A purchase is made on a “delayed delivery” basis when the transaction is structured to occur sometime in the future. When these transactions are negotiated, the price, which is generally expressed in yield terms, is fixed at the time the commitment is made, but delivery and payment for the securities take place at a later date. Normally, the settlement date occurs within 120 days of the commitment to purchase. During the period between a commitment and settlement, no payment is made for the securities purchased by the purchaser and, thus, no income
16
First Security Municipal Bond Fund
Notes to the Financial Statements (continued)
April 30, 2018
accrues to the purchaser from the transaction. At the time the Fund makes the commitment to purchase securities on a when-issued basis, forward commitment or delayed delivery basis, the Fund will record the transaction as a purchase and thereafter reflect the value each day of such securities in determining its NAV. No when-issued or forward commitments will be made by the Fund if, as a result, more than 25% of the Fund’s total assets would be committed to such transactions. Forward commitment transactions may also be conducted on a “to be announced” basis (“TBA Transaction”). In a TBA Transaction, the approximate purchase price is typically disclosed at the time of commitment, not the identity of the underlying security.
NOTE 3. SECURITIES VALUATION AND FAIR VALUE MEASUREMENTS
Fair value is defined as the price that the Fund would receive upon selling an investment in an orderly transaction to an independent buyer in the principal or most advantageous market of the investment. GAAP establishes a three-tier hierarchy to maximize the use of observable market data and minimize the use of unobservable inputs and to establish classification of fair value measurements for disclosure purposes.
Inputs refer broadly to the assumptions that market participants would use in pricing the asset or liability. Inputs may be observable or unobservable. Observable inputs are inputs that reflect the assumptions market participants would use in pricing the asset or liability developed based on market data obtained from sources independent of the reporting entity. Unobservable inputs are inputs that reflect the reporting entity’s own assumptions about the assumptions market participants would use in pricing the asset or liability developed based on the best information available in the circumstances.
Various inputs are used in determining the value of the Fund’s investments. These inputs are summarized in the three broad levels listed below.
| | ● | Level 1 – unadjusted quoted prices in active markets for identical investments and/or registered investment companies where the value per share is determined and published and is the basis for current transactions for identical assets or liabilities at the valuation date |
| | ● | Level 2 – other significant observable inputs (including, but not limited to, quoted prices for an identical security in an inactive market, quoted prices for similar securities, interest rates, prepayment speeds, credit risk, etc.) |
| | ● | Level 3 – significant unobservable inputs (including the Fund’s own assumptions in determining fair value of investments based on the best information available) |
The inputs used to measure fair value may fall into different levels of the fair value hierarchy. In such cases, for disclosure purposes, the level in the fair value hierarchy within which the fair value measurement falls in its entirety is determined based on the lowest level input that is significant to the fair value measurement in its entirety.
In computing the net asset value (“NAV”) of the Fund, fair value is based on market valuations with respect to portfolio securities for which market quotations are readily available. Pursuant to Board approved policies, the Fund relies on independent third-party pricing services to provide the current market value of securities. Those pricing services value equity securities, including exchange-traded funds and exchange-traded notes, traded on a securities exchange at the last reported sales price on the principal
17
First Security Municipal Bond Fund
Notes to the Financial Statements (continued)
April 30, 2018
exchange. Equity securities quoted by NASDAQ are valued at the NASDAQ Official Closing Price. If there is no reported sale on the principal exchange, equity securities are valued at the mean between the most recent quoted bid and asked price. When using the market quotations or close prices provided by the pricing service and when the market is considered active, the security will be classified as a Level 1 security. Investments in open-end mutual funds, including money market mutual funds, are generally priced at the ending NAV provided by the pricing service of the funds and are generally categorized as Level 1 securities. Debt securities are valued using evaluated prices furnished by a pricing vendor selected by the Board and are generally classified as Level 2 securities.
In the event that market quotations are not readily available, the Adviser determines that the market quotation or the price provided by the pricing service does not accurately reflect the current fair value, or certain restricted or illiquid securities are being valued, such securities are valued as determined in good faith by the Trust’s Valuation Committee, based on recommendations from a pricing committee comprised of various officers of the Trust, various employees of the Fund’s administrator, and representatives of the Adviser (together the “Pricing Review Committee”). These securities will be classified as Level 2 or 3 within the fair value hierarchy, depending on the inputs used.
In accordance with the Trust’s Valuation Procedures, the Pricing Review Committee in making its recommendations is required to consider all appropriate factors relevant to the value of securities for which it has determined other pricing sources are not available or reliable as described above. No single standard exists for determining fair value, because fair value depends upon the circumstances of each individual case. As a general principle, the current fair value of an issue of securities being valued pursuant to the Trust’s Fair Valuation Procedures would be the amount which the Fund might reasonably expect to receive for them upon their current sale. Methods which are in accordance with this principle may, for example, be based on (i) a multiple of earnings; (ii) a discount from market prices of a similar freely traded security (including a derivative security or a basket of securities traded on other markets, exchanges or among dealers); or (iii) yield to maturity with respect to debt issues, or a combination of these and other methods. Fair value pricing is permitted if, in accordance with the Trust’s Valuation Procedures, the validity of market quotations appears to be questionable based on factors such as evidence of a thin market in the security based on a small number of quotations, a significant event occurs after the close of a market but before the Fund’s NAV calculation that may affect a security’s value, or other data calls into question the reliability of market quotations.
The following is a summary of the inputs used to value the Fund’s investments as of April 30, 2018:
| | | Valuation Inputs | | | | |
| Assets | | Level 1 | | | Level 2 | | | Level 3 | | | Total | |
| Municipal Bonds | | $ | — | | | $ | 14,728,983 | | | $ | — | | | $ | 14,728,983 | |
| Money Market Funds | | | 283,583 | | | | — | | | | — | | | | 283,583 | |
| Total | | $ | 283,583 | | | $ | 14,728,983 | | | $ | — | | | $ | 15,012,566 | |
The Fund did not hold any investments at the end of the reporting period in which significant unobservable inputs (Level 3) were used in determining fair value; therefore, no reconciliation of Level 3 securities is included for this reporting period. The Fund did not hold any derivative instruments during the reporting period.
18
First Security Municipal Bond Fund
Notes to the Financial Statements (continued)
April 30, 2018
The Trust recognizes transfers between fair value hierarchy levels at the end of the reporting period. There were no transfers between any levels as of April 30, 2018 based on input levels assigned at April 30, 2017.
Risks – The Fund invests primarily in municipal debt obligations issued by various states and their political sub-divisions, agencies and public authorities to obtain funds for various public purposes. As a result, the ability of issuers of debt securities held by the Fund to meet its obligations may be affected by economic and political developments in a specific state or region.
NOTE 4. FEES AND OTHER TRANSACTIONS WITH AFFILIATES AND OTHER SERVICE PROVIDERS
Under the terms of the investment advisory agreement (the “Agreement”), the Adviser manages the Fund’s investments subject to approval of the Board. As compensation for its management services, the Fund is obligated to pay the Adviser a fee computed and accrued daily and paid monthly at an annual rate of 0.49% of the Fund’s average daily net assets. For the fiscal year ended April 30, 2018, the Adviser earned fees of $74,199 from the Fund. At April 30, 2018, the Adviser owed $24,001 of fee waivers and expense reimbursements to the Fund.
The Adviser has contractually agreed to waive its management fee and/or reimburse expenses so that total annual operating expenses (excluding (i) interest; (ii) taxes; (iii) brokerage fees and commissions; (iv) other extraordinary expenses not incurred in the ordinary course of the Fund’s business; (v) dividend expenses on short sales; (vi) indirect expenses such as acquired fund fees and expenses; and (vii) expenses incurred under a Rule 12b-1 plan of distribution) do not exceed 0.99% of the Fund’s average daily net assets through August 31, 2018 (“Expense Limitation”). During any fiscal year that the Agreement between the Adviser and the Trust is in effect, the Adviser may recoup the sum of all fees previously waived or expenses reimbursed for the period of 36 months following the month during which such fee waiver or expense reimbursement was made, less any reimbursement previously paid, if such recoupment can be achieved within the Expense Limitation as well as any expense limitation in effect at the time the reimbursement is made. This expense cap agreement may be terminated by the Board at any time. The amount subject to repayment by the Fund, pursuant to the aforementioned conditions, is $538,056, which is recoverable through April 30, 2021.
In addition, the Adviser voluntarily agreed to waive its fees and/or reimburse certain operating expenses of the Fund so that total annual operating expenses do not exceed 0.01% of the Fund’s average daily net assets. The voluntary waiver or reimbursement may be terminated at any time at the option of the Adviser and is not subject to recoupment.
The Trust retains Ultimus Asset Services, LLC (the “Administrator”) to provide the Fund with administration and compliance, fund accounting, and transfer agent services, including all regulatory reporting. For the fiscal year ended April 30, 2018, the Administrator earned fees of $53,500 for administration and compliance services, $35,000 for fund accounting services and $30,000 for transfer agent services. At April 30, 2018, the Fund owed the Administrator $9,874 for such services.
The Board supervises the business activities of the Trust. Each Trustee serves as a Trustee for the lifetime of the Trust or until the earlier of his or her retirement as a Trustee at age 78 (which may be extended for up to two years in an emeritus non-voting capacity at the pleasure and request of the Board), or until he/she dies, resigns, or is removed, whichever is sooner. “Independent Trustees,” meaning those Trustees
19
First Security Municipal Bond Fund
Notes to the Financial Statements (continued)
April 30, 2018
who are not “interested persons” as defined in the Investment Company Act of 1940 (“1940 Act”) of the Trust, each receives annual compensation of $20,000 from the Trust, to be paid in four quarterly installments of $5,000. In addition, the Audit Committee Chair receives an additional $1,000 annual fee, payable quarterly installments of $250. Independent Trustees are also paid $1,000 for in person Special Meetings. Fees for telephonic special meetings range from $250 per trustee to $1,000 per trustee, depending on the length of the meeting. In addition, the Trust reimburses Trustees for out-of-pocket expense incurred in conjunction with attendance at Board meetings.
The officers and one Trustee of the Trust are employees of the Administrator. Unified Financial Securities, LLC (the “Distributor”) acts as the principal distributor of the Fund’s shares. Both the Administrator and the Distributor operate as wholly-owned subsidiaries of Ultimus Fund Solutions, LLC.
The Fund has adopted but has yet to implement a Distribution Plan (the “Plan”) pursuant to Rule 12b-1 under the 1940 Act. The Plan provides that the Fund will pay the Distributor and/or any registered securities dealer, financial institution or any other person (the “Recipient”) a fee of 0.25% of the average daily net assets of the Fund’s A Shares in connection with the promotion and distribution of Fund’s A shares or the provision of personal services
to shareholders, including, but not necessarily limited to, advertising, compensation to underwriters, dealers and selling personnel, the printing and mailing of prospectuses to other than current Fund shareholders, the printing and mailing of sales literature and servicing shareholder accounts (“12b-1 Expenses”). The Fund or Distributor may pay all or a portion of these fees to any Recipient who renders assistance in distributing or promoting the sale of shares, or who provides certain shareholder services, pursuant to a written agreement. The Plan is a compensation plan, which means that compensation is provided regardless of whether 12b-1 Expenses are actually incurred. Accordingly, the 12b-1 Expenses of the A Shares of the Fund may be less than fees paid out by the class under the Plan. No 12b-1 fee is currently paid by the Fund and the Fund’s Board has not approved any payments under the plan.
NOTE 5. PURCHASES AND SALES OF SECURITIES
For the fiscal year ended April 30, 2018, purchases and sales of investment securities, other than short-term investments, were as follows:
| Purchases | | $ | 1,007,725 | |
| Sales | | $ | 1,298,479 | |
There were no purchases or sales of long-term U.S. government obligations during the fiscal year ended April 30, 2018.
NOTE 6. FEDERAL TAX INFORMATION
As of April 30, 2018, the net unrealized appreciation (depreciation) of investments for tax purposes was as follows:
| Gross Unrealized Appreciation | | $ | 14,404 | |
| Gross Unrealized Depreciation | | | (529,128 | ) |
| Net Unrealized Depreciation | | $ | (514,724 | ) |
20
First Security Municipal Bond Fund
Notes to the Financial Statements (continued)
April 30, 2018
At April 30, 2018, the aggregate cost of securities for federal income tax purposes was $15,527,290 for the Fund.
At April 30, 2018, the book basis and tax basis net unrealized depreciation was the same.
The tax character of distributions for the fiscal years ended April 30, 2018 and 2017, was as follows:
| | | 2018 | | | 2017 | |
| Distributions paid from: | | | | | | |
| Ordinary Income | | $ | 3,246 | | | $ | 5,823 | |
| Net Long-Term Capital Gains | | | — | | | | — | |
| Total Taxable Distrbutions | | $ | 3,246 | | | $ | 5,823 | |
| Tax-Exempt Distributions | | | 415,351 | | | | 322,662 | |
| Total Distributions | | $ | 418,597 | | | $ | 328,485 | |
At April 30, 2018, the components of distributable earnings (accumulated losses) on a tax basis was as follows
| Undistributed Tax-Exempt Income | | $ | 5,778 | |
| Accumulated Capital and Other Losses | | | (21,663 | ) |
| Unrealized Appreciation (Depreciation) | | | (514,724 | ) |
| Total Accumulated Earnings (Deficit) | | $ | (530,609 | ) |
As of April 30, 2018, the Fund has available for federal tax purposes an unused capital loss carryforward of $16,807 and $4,856 of long-term and short-term capital losses, respectively, with no expiration, which is available to offset against future taxable net capital gains. To the extent that these carryforwards are used to offset future gains, it is probable that the amount offset will not be distributed to shareholders.
NOTE 7. BENEFICIAL OWNERSHIP
The beneficial ownership, either directly or indirectly, of 25% or more of the voting securities of a fund creates a presumption of control of a fund, under Section 2(a) (9) of the Investment Company Act of 1940. At April 30, 2018 Crews & Associates, Inc. (“Crews”) owned, as record shareholder, 74% of the outstanding shares of the Fund. It is not known whether Crews or any of the underlying beneficial owners owned or controlled 25% or more of the voting securities of the Fund.
NOTE 8. COMMITMENTS AND CONTINGENCIES
The Fund indemnifies its officers and trustees for certain liabilities that may arise from the performance of their duties to the Fund. Additionally, in the normal course of business, the Fund enters into contracts that contain a variety of representations and warranties which provide general indemnifications. The Fund’s maximum exposure under these arrangements is unknown, as this would involve future claims that may be made against the Fund that have not yet occurred.
21
First Security Municipal Bond Fund
Notes to the Financial Statements (continued)
April 30, 2018
NOTE 9. SUBSEQUENT EVENTS
Management has evaluated events or transactions from April 30, 2018, through the date these financial statements were issued, that would merit recognition or disclosure in the financial statements. There were no subsequent events to report that would have a material impact in the Fund’s financial statements.
Shareholder Meeting Results (Unaudited)
On June 19, 2018, a special meeting of shareholders of the Trust was held for the purpose of voting on the election of four Trustees to serve on the Board of Trustees. Below are the voting results from the special meeting.
| | For | Withhold | % of Total Voted in Favor |
| John C. Davis | 35,759,555 | 385,270 | 98.93% |
| Janet S. Meeks | 35,772,739 | 372,086 | 98.97% |
| Lori A. Kaiser | 35,775,501 | 369,324 | 98.98% |
| Robert G. Dorsey | 35,597,330 | 547,495 | 98.49% |
The shareholders voted in favor of the proposal to approve four Trustees to serve on the Board of Trustees. Mr. Davis, Ms. Meeks and Ms. Kaiser were each elected as Independent Trustees and will begin their service to the Trust effective July 1, 2018. Mr. Dorsey was elected as Interested Trustee at the meeting.
22
Report of Independent Registered Public Accounting Firm
To the Shareholders and the Board of
Trustees of First Security Municipal Bond Fund
Opinion on the Financial Statements
We have audited the accompanying statement of assets and liabilities of First Security Municipal Bond Fund (the “Fund”) (one of the funds constituting Capitol Series Trust (the “Trust”)), including the schedule of investments, as of April 30, 2018, and the related statement of operations for the year then ended, the statements of changes in net assets for each of the two years in the period then ended, the financial highlights for each of the two years in the period then ended and the related notes (collectively referred to as the “financial statements”). In our opinion, the financial statements present fairly, in all material respects, the financial position of the Fund (one of the funds constituting Capitol Series Trust) at April 30, 2018, the results of its operations for the year then ended, the changes in its net assets for each of the two years in the period then ended and its financial highlights for each of the two years in the period then ended, in conformity with U.S. generally accepted accounting principles.
The financial highlights for the period from May 29, 2015 (commencement of operations) to April 30, 2016 were audited by other auditors whose report dated June 27, 2016, expressed an unqualified opinion on those financial highlights
Basis for Opinion
These financial statements are the responsibility of the Trust’s management. Our responsibility is to express an opinion on the Fund’s financial statements based on our audits. We are a public accounting firm registered with the Public Company Accounting Oversight Board (United States) (PCAOB) and are required to be independent with respect to the Fund in accordance with the U.S. federal securities laws and the applicable rules and regulations of the Securities and Exchange Commission and the PCAOB.
We conducted our audits in accordance with the standards of the PCAOB. Those standards require that we plan and perform the audit to obtain reasonable assurance about whether the financial statements are free of material misstatement, whether due to error or fraud. The Trust is not required to have, nor were we engaged to perform, an audit of Trust’s internal control over financial reporting. As part of our audit we are required to obtain an understanding of internal control over financial reporting but not for the purpose of expressing an opinion on the effectiveness of the Trust’s internal control over financial reporting. Accordingly, we express no such opinion.
Our audits included performing procedures to assess the risks of material misstatement of the financial statements, whether due to error or fraud, and performing procedures that respond to those risks. Such procedures included examining, on a test basis, evidence regarding the amounts and disclosures in the financial statements. Our procedures included confirmation of securities owned as of April 30, 2018, by correspondence with the custodian and brokers. Our audits also included evaluating the accounting principles used and significant estimates made by management, as well as evaluating the overall presentation of the financial statements. We believe that our audits provides a reasonable basis for our opinion.

We have served as the auditor of one or more Capitol Series Trust investment companies since 2017.
Grandview Heights, Ohio
June 25, 2018
23
Summary of Fund Expenses (Unaudited)
As a shareholder of the Fund, you incur two types of costs: (1) transaction costs, including sales charges (loads) on purchases and (2) ongoing costs, including management fees, and other Fund expenses. These examples are intended to help you understand your ongoing costs (in dollars) of investing in the Fund and to compare these costs with the ongoing costs of investing in other mutual funds.
The Example is based on an investment of $1,000 invested at the beginning of the period and held for the entire period from November 1, 2017 through April 30, 2018.
Actual Expenses
The first line of the table for each class provides information about actual account values and actual expenses. You may use the information in these lines, together with the amount you invested, to estimate the expenses that you paid over the period. Simply divide your account value by $1,000 (for example, an $8,600 account value divided by $1,000 = 8.60), then multiply the result by the number in the first line under the heading “Expenses Paid During Period” to estimate the expenses you paid on your account during this period.
Hypothetical Example for Comparison Purposes
The second line of the table for each class provides information about hypothetical account values and hypothetical expenses based on the Fund’s actual expense ratios and an assumed rate of return of 5% per year before expenses, which is not the Fund’s actual return. The hypothetical account values and expenses may not be used to estimate the actual ending account balances or expenses you paid for the period. You may use this information to compare the ongoing costs of investing in the Fund and other funds. To do so, compare this 5% hypothetical example with the 5% hypothetical examples that appear in the shareholder reports of the other funds.
Expenses shown in the table are meant to highlight your ongoing costs only and do not reflect any transactional costs such as the fee imposed on sales charges. Therefore, the second line of the table for each class is useful in comparing ongoing costs only and will not help you determine the relative total costs of owning different funds. In addition, if transaction costs were included, your costs would have been higher.
| | | | Beginning
Account
Value,
November 1, 2017 | | | Ending
Account
Value,
April 30, 2018 | | | Expenses
Paid
During
Period(a) | | | Annualized
Expense
Ratio | |
| First Security Municipal Bond Fund |
| Institutional Shares | Actual | | $ | 1,000.00 | | | $ | 988.10 | | | $ | 0.05 | | | | 0.01 | % |
| | Hypothetical(b) | | $ | 1,000.00 | | | $ | 1,024.74 | | | $ | 0.05 | | | | 0.01 | % |
| A Shares | Actual | | $ | 1,000.00 | | | $ | 987.20 | | | $ | 0.05 | | | | 0.01 | % |
| | Hypothetical(b) | | $ | 1,000.00 | | | $ | 1,024.74 | | | $ | 0.05 | | | | 0.01 | % |
| (a) | Expenses are equal to the Fund’s annualized expense ratios, multiplied by the average account value over the period, multiplied by 181/365 (to reflect the one-half year period). |
| (b) | Assumes a 5% return before expenses. |
24
Additional Federal Income Tax Information (Unaudited)
The Form 1099-DIV you receive in January 2019 will show the tax status of all distributions paid to your account in calendar year 2018. Shareholders are advised to consult their own tax adviser with respect to the tax consequences of their investment in the Fund. As required by the Internal Revenue Code and/or regulations, shareholders must be notified regarding the status of qualified dividend income for individuals and the dividends received deduction for corporations.
Qualified Dividend Income. The Fund designates approximately 0% or up to the maximum amount of such dividends allowable pursuant to the Internal Revenue Code, as qualified dividend income eligible for the reduced tax rate of 15%.
Dividends Received Deduction. Corporate shareholders are generally entitled to take the dividends received deduction on the portion of the Fund’s dividend distribution that qualifies under tax law. For the fiscal year ended April 30, 2018, 0% of ordinary income dividends paid by the Fund qualify for the dividends received deduction available to corporations.
For the fiscal year ended April 30, 2018, the Fund designated $415,351 as tax-exempt distributions.
Trustees and Officers (Unaudited)
The Board supervises the business activities of the Trust and is responsible for protecting the interests of shareholders. The Chair of the Board is Walter B. Grimm, who is an Independent Trustee of the Trust.
Each Trustee serves as a Trustee for the lifetime of the Trust or until the earlier of his or her retirement as a Trustee at age 78, death, resignation or removal. Officers are re-elected annually by the Board. The address of each Trustee and officer is 225 Pictoria Drive, Suite 450, Cincinnati, OH 45246.
As of the date of this report, the Trustees oversee the operations of 10 series.
Interested Trustee Background. The following table provides information regarding the Interested Trustee.
Name, Address, Age,
Position with Trust, Term of
Position with Trust | Principal Occupation During Past 5 Years
and Other Trusteeships |
Robert G. Dorsey* Age: 61 Interested Trustee Began Serving: March 2017 | Principal Occupation(s): President and Managing Director of Ultimus Fund Solutions, LLC and Ultimus Fund Distributors, LLC (1999 to present; Interested Trustee of Ultimus Managers Trust (February 2012 to present). Interested Trustee of Capitol Series Trust (March 2016 to present). Previous Position(s): President and Managing Director of Ultimus Fund Distributors, LLC (1999 to 2018); President of Ultimus Managers Trust (June 2012 to October 2013). |
| * | Mr. Dorsey is considered an “interested person” of the Trust within the meaning of Section 2(a)(19) of the 1940 Act because of his relationship with the Trust’s administrator, transfer agent, and distributors. |
25
Trustees and Officers (Unaudited) (continued)
Independent Trustee Background. The following table provides information regarding the Independent Trustees.
Name, Address, Age,
Position with Trust, Term of
Position with Trust | Principal Occupation During Past 5 Years
and Other Trusteeships |
Walter B. Grimm Age: 73 Trustee and Chairman Began Serving: November 2013 | Principal Occupations(s): President, Leigh Management Group, LLC (consulting firm) (October 2005 to present); President, Leigh Investments, Inc. (1988 to present); and Chief Financial Officer, East West Private, LLC (consulting firm) (March 2009 to present). |
Mary M. Morrow Age: 60 Trustee Began Serving: November 2013 | Principal Occupations(s): Chief Operating Officer, Pennsylvania Health and Wellness (fully owned subsidiary of Centene Corporation) (November 2016 to present). Previous Position(s): Vice President, Strategic Initiatives, Gateway Heath (January 2015 to November 2016); Consulting Practice Manager, DST Health Solutions (August 2010 to January 2015); Trustee, Service and Client Relations, EBDS (August 2008 – May 2009); Independent Consultant, Healthcare Servicing May 2009 – August 2010). |
Officers. The following table provides information regarding the Officers.
Name, Address, Age,
Position with Trust, Term of
Position with Trust | Principal Occupation During Past 5 Years
and Other Trusteeships |
Dina A. Tantra Age: 48 Chief Executive Officer and President Began Serving: March 2018 | Principal Occupation(s): Executive Vice President and Director of Fund Administration and Compliance, Ultimus Fund Solutions, LLC (August 2017 to present). Previous Position(s): Managing Director, Foreside Financial Group, LLC (2016 to 2017); Trustee and President, Advisers Investment Trust (September 2012 to August 2017); Managing Director, Secretary and General Counsel, Beacon Hill Fund Services, Inc. (2008 to 2016); Secretary and General Counsel, BHIL Distributors, Inc. (2008 to 2016). |
Matthew J. Miller Age: 42 Vice President and Secretary Began Serving: March 2018 (Vice-President); April 2018 (Secretary) | Principal Occupation(s): Assistant Vice President, Relationship Management, Ultimus Fund Solutions, LLC (December 2015 to present); Vice President, Valued Advisers Trust (December 2011 to present). Previous Position(s): Vice President, Relationship Management, Huntington Asset Services, Inc. (n/k/a Ultimus Asset Services, LLC) (2008 to December 2015); Vice President, The Huntington Funds (February 2010 to April 2015); Vice President, Transfer Agency Operations, Huntington Asset Services, Inc. (2002 to 2008); Employed in various positions with Huntington Asset Services, Inc. (July 1998 to 2002). |
26
Trustees and Officers (Unaudited) (continued)
Name, Address, Age,
Position with Trust, Term of
Position with Trust | Principal Occupation During Past 5 Years
and Other Trusteeships |
Zachary P. Richmond Age: 38 Treasurer and Chief Financial Officer Began Serving: August 2014 | Principal Occupation(s): Assistant Vice President, Associate Director of Financial Administration, Ultimus Fund Solutions, LLC (December 2015 to present); Treasurer and Chief Financial Officer, Unified Series Trust (August 2014 to present); Treasurer and Chief Financial Officer, Commonwealth International Series Trust (September 2015 to present). Previous Position(s): Assistant Vice President, Fund Administration, Huntington Asset Services, Inc. (n/k/a Ultimus Asset Services, LLC) (January 2011 to December 2015); and Assistant Treasurer, Unified Series Trust (2011 to August 2014). |
Brandon R. Kipp Age: 35 Chief Compliance Officer Began Serving: October 2017 | Principal Occupation(s): Senior Fund Compliance Officer, Ultimus Fund Solutions, LLC (since July 2017) and Chief Compliance Officer, Valued Advisers Trust (since October 2017). Previous Position(s): Assistant Vice President and Compliance Manager, UMB Fund Services, Inc. (March 2014 to July 2017); Officer and Lead Fund Administrator, UMB Fund Services, Inc. (May 2012 to March 2014). |
Stephen L. Preston Age: 52 Anti-Money Laundering Officer Began Serving: December 2016 | Principal Occupation(s): Chief Compliance Officer, Ultimus Fund Solutions, LLC, Ultimus Fund Distributors, LLC, and Unified Financial Securities from June 2011 to present. |
Other Information (Unaudited)
The Fund’s Statement of Additional Information (“SAI”) includes additional information about the trustees and is available without charge, upon request. You may call toll-free at (800) 813-1421 to request a copy of the SAI or to make shareholder inquiries.
27
| FACTS | WHAT DOES CAPITOL SERIES TRUST DO WITH YOUR PERSONAL INFORMATION? |
| | |
| Why? | Financial companies choose how they share your personal information. Federal law gives consumers the right to limit some but not all sharing. Federal law also requires us to tell you how we collect, share, and protect your personal information. Please read this notice carefully to understand what we do. |
| | |
What? | The types of personal information we collect and share depend on the product or service you have with us. This information can include: ■ Social Security number ■ account balances and account transactions ■ account transactions, transaction or loss history and purchase history ■ checking account information and wire transfer instructions When you are no longer our customer, we continue to share your information as described in this notice. |
| | |
| How? | All financial companies need to share customers’ personal information to run their everyday business. In the section below, we list the reasons financial companies can share their customers’ personal information; the reasons Capitol Series Trust chooses to share; and whether you can limit this sharing. |
| Reasons we can share your personal information | Does Capitol Series Trust share? |
For our everyday business purposes — such as to process your transactions, maintain your account(s), respond to court orders and legal investigations, or report to credit bureaus | Yes |
For our marketing purposes — to offer our products and services to you | Yes |
| For joint marketing with other financial companies | No |
For our affiliates’ everyday business purposes – information about your transactions and experiences | No |
For our affiliates’ everyday business purposes – information about your creditworthiness | No |
| For nonaffiliates to market to you | No |
| Questions? | Call 1-800-813-1421 |
28
| Who we are |
| Who is providing this notice? | Capitol Series Trust |
| What we do |
| How does Capitol Series Trust protect my personal information? | To protect your personal information from unauthorized access and use, we use security measures that comply with federal law. These measures include computer safeguards and secured files and buildings. |
| How does Capitol Series Trust collect my personal information? | We collect your personal information, for example, when you ■ open an account or deposit money ■ buy securities from us or sell securities to us ■ make deposits or withdrawals from your account provide account information ■ give us your account information ■ make a wire transfer ■ tell us who receives the money ■ tell us where to send the money ■ show your government-issued ID ■ show your driver’s license |
| Why can’t I limit all sharing? | Federal law gives you the right to limit only ■ sharing for affiliates’ everyday business purposes — information about your creditworthiness ■ affiliates from using your information to market to you ■ sharing for nonaffiliates to market to you State laws and individual companies may give you additional rights to limit sharing. |
| Definitions |
| Affiliates | Companies related by common ownership or control. They can be financial and nonfinancial companies. |
| Nonaffiliates | Companies not related by common ownership or control. They can be financial and nonfinancial companies. ■ Capitol Series Trust does not share your personal information with nonaffiliates so they can market to you. |
| Joint marketing | A formal agreement between nonaffiliated financial companies that together market financial products or services to you. ■ Capitol Series Trust doesn’t jointly market financial products or services to you. |
29
PROXY VOTING (Unaudited)
A description of the policies and procedures that the Fund uses to determine how to vote proxies relating to portfolio securities and information regarding how the Fund voted those proxies during the most recent twelve month period ended June 30, is available without charge upon request by (1) calling the Fund at (800) 813-1421 and (2) from Fund documents filed with the Securities and Exchange Commission (“SEC”) on the SEC’s website at www.sec.gov.
TRUSTEES
Walter B. Grimm, Chairman
Robert G. Dorsey
Mary M. Morrow
OFFICERS
Dina A. Tantra, Chief Executive Officer/President
Zachary P. Richmond, Chief Financial Officer/Treasurer
Brandon R. Kipp, Chief Compliance Officer
INVESTMENT ADVISER
First Security Fund Advisers, Inc.
First Security Center
521 President Clinton Avenue, Suite 800
Little Rock, AR 72201
DISTRIBUTOR
Unified Financial Securities, LLC
9465 Counselors Row, Suite 200
Indianapolis, IN 46240
INDEPENDENT REGISTERED PUBLIC ACCOUNTING FIRM
Ernst & Young LLP
800 Yard Street, Suite 200
Grandview Heights, OH 43212
LEGAL COUNSEL
Bernstein Shur
100 Middle Street, 6th Floor
Portland, ME 04104
CUSTODIAN
Huntington National Bank
41 South High Street
Columbus, OH 43215
ADMINISTRATOR, TRANSFER AGENT AND FUND ACCOUNTANT
Ultimus Asset Services, LLC
225 Pictoria Drive, Suite 450
Cincinnati, OH 45246
This report is intended only for the information of shareholders or those who have received the Fund’s prospectus which contains information about the Fund’s management fee and expenses. Please read the prospectus carefully before investing.
Distributed by Unified Financial Securities, LLC
Member FINRA/SIPC
Item 2. Code of Ethics.
As of the end of the period covered by this report, the registrant has adopted a code of ethics that applies to the registrant's principal executive officer, principal financial officer, principal accounting officer or controller, or persons performing similar functions, regardless of whether these individuals are employed by the registrant or a third party. Pursuant to Item 12(a)(1), a copy of registrant’s code of ethics is filed as an exhibit to this Form N-CSR. During the period covered by this report, the code of ethics has not been amended, and the registrant has not granted any waivers, including implicit waivers, from the provisions of the code of ethics.
Item 3. Audit Committee Financial Expert.
(a) The registrant’s board of trustees has determined that the registrant does not have an audit committee financial expert. The committee members and the full Board considered a possibility of adding a member that would qualify as an expert. The audit committee determined that, although none of its members meet the technical definition of an audit committee expert, the committee has sufficient financial expertise to adequately perform its duties under the Audit Committee Charter without the addition of a qualified expert.
Item 4. Principal Accountant Fees and Services.
(a) Audit Fees billed to the registrant by its principal accountants for the two most recent fiscal years:
| First Security Municipal Bond Fund: | FY 2018 | $16,500 |
| | FY 2017 | $16,500 |
| Canterbury Portfolio Thermostat Fund: | FY 2018 | $16,500 |
| | FY 2017 | $16,500 |
(b) Audit-Related Fees billed to the registrant by its principal accountants for the two most recent fiscal years:
| First Security Municipal Bond Fund: | FY 2018 | $0 |
| | FY 2017 | $0 |
| Canterbury Portfolio Thermostat Fund: | FY 2018 | $0 |
| | FY 2017 | $0 |
c) Tax Fees billed to the registrant by its principal accountants for the two most recent fiscal years:
| First Security Municipal Bond Fund: | FY 2018 | $5,000 |
| | FY 2017 | $5,000 |
| Canterbury Portfolio Thermostat Fund: | FY 2018 | $5,000 |
| | FY 2017 | $5,000 |
Nature of the fees: Preparation of the 1120 RIC and Excise review
(d) All other fees billed to the registrant by its principal accountants for the two most recent fiscal years:
| First Security Municipal Bond Fund: | FY 2018 | $0 |
| | FY 2017 | $0 |
| Canterbury Portfolio Thermostat Fund: | FY 2018 | $0 |
| | FY 2017 | $0 |
(e) (1) Audit Committee’s Pre-Approval Policies
The Audit Committee Charter requires the Audit Committee to be responsible for the selection, retention or termination of auditors and, in connection therewith, to (i) evaluate the proposed fees and other compensation, if any, to be paid to the auditors, (ii) evaluate the independence of the auditors, (iii) pre-approve all audit services and, when appropriate, any non-audit services provided by the independent auditors to the Trust, (iv) pre-approve, when appropriate, any non-audit services provided by the independent auditors to the Trust's investment adviser, or any entity controlling, controlled by, or under common control with the investment adviser and that provides ongoing services to the Trust if the engagement relates directly to the operations and financial reporting of the Trust, and (v) receive the auditors’ specific representations as to their independence;
(2) Percentages of Services Approved by the Audit Committee
| Registrant | |
| Audit-Related Fees: | 0 % |
| Tax Fees: | 100 % |
| All Other Fees: | 0 % |
(f) During audit of registrant's financial statements for the most recent fiscal year, less than 50 percent of the hours expended on the principal accountant's engagement were attributed to work performed by persons other than the principal accountant's full-time, permanent employees.
(g) The aggregate non-audit fees billed by the registrant's accountant for services rendered to the registrant, and rendered to the registrant's investment adviser (not including any sub-adviser whose role is primarily portfolio management and is subcontracted with or overseen by another investment adviser), and any entity controlling, controlled by, or under common control with the adviser that provides ongoing services to the registrant:
| | Registrant | Adviser |
| FY 2018 | $10,000 | $0 |
| FY 2017 | $10,000 | $0 |
(h) Not applicable. The auditor performed no services for the registrant’s investment adviser or any entity controlling, controlled by, or under common control with the investment adviser that provides ongoing services to the registrant.
Item 5. Audit Committee of Listed Registrants.
NOT APPLICABLE – applies to listed companies only
Item 6. Schedule of Investments. Schedule filed with Item 1.
Item 7. Disclosure of Proxy Voting Policies and Procedures for Closed-End Management Investment Companies.
NOT APPLICABLE – applies to closed-end funds only
Item 8. Portfolio Managers of Closed-End Management Investment Companies.
NOT APPLICABLE – applies to closed-end funds only
Item 9. Purchases of Equity Securities by Closed-End Management Investment Company and Affiliated Purchasers.
NOT APPLICABLE – applies to closed-end funds only
Item 10. Submission of Matters to a Vote of Security Holders.
The guidelines applicable to shareholders desiring to submit recommendations for nominees to the Registrant's board of trustees are contained in the statement of additional information of the Trust with respect to the Fund(s) for which this Form N-CSR is being filed.
Item 11. Controls and Procedures.
(a) Based on their evaluation of the registrant’s disclosure controls and procedures (as defined in Rule 30a-3(c) under the Investment Company Act of 1940, as amended (the “Act”)) as of a date within 90 days of the filing date of this report, the registrant’s principal executive officer and principal financial officer have concluded that such disclosure controls and procedures are reasonably designed and are operating effectively to ensure that material information relating to the registrant is made known to them by others within those entities, particularly during the period in which this report is being prepared, and that the information required in filings on Form N-CSR is recorded, processed, summarized, and reported on a timely basis.
(b) There were no changes in the registrant’s internal control over financial reporting (as defined in Rule 30a-3(d) under the Investment Company Act of 1940) that occurred during the second fiscal quarter of the period covered by this report that have materially affected, or are reasonably likely to materially affect, the registrant’s internal control over financial reporting.
Item 12. Disclosure of Securities Lending Activities for Closed-End Management Investment Companies.
Not applicable.
Item 13. Exhibits.
(a)(1) Code is filed herewith.
(a)(2) Certifications by the registrant's principal executive officer and principal financial officer, pursuant to Section 302 of the Sarbanes- Oxley Act of 2002 and required by Rule 30a-2under the Investment Company Act of 1940 are filed herewith.
(a)(3) Not applicable.
(b) Certifications pursuant to Rule 30a-2(b) are furnished herewith.
SIGNATURES
Pursuant to the requirements of the Securities Exchange Act of 1934 and the Investment Company Act of 1940, the registrant has duly caused this report to be signed on its behalf by the undersigned, thereunto duly authorized.
| (Registrant) | Capitol Series Trust | | |
| | | | |
| By (Signature and Title) | /s/ Dina A. Tantra | |
| | | Dina A. Tantra, Chief Executive Officer and President | |
| | | | |
| Date | 6/26/2018 | | |
Pursuant to the requirements of the Securities Exchange Act of 1934 and the Investment Company Act of 1940, this report has been signed below by the following persons on behalf of the registrant and in the capacities and on the dates indicated.
| By (Signature and Title) | /s/ Dina A. Tantra | |
| | | Dina A. Tantra, Chief Executive Officer and President | |
| | | | |
| Date | 6/26/2018 | | |
| By (Signature and Title) | /s/ Zachary P. Richmond | |
| | | Zachary P. Richmond, Treasurer and Chief Financial Officer |
| | | | |
| Date | 6/26/2018 | | |