UNITED STATES
SECURITIES AND EXCHANGE COMMISSION
Washington, D.C. 20549
FORM N-CSR
CERTIFIED SHAREHOLDER REPORT OF REGISTERED
MANAGEMENT INVESTMENT COMPANIES
Investment Company Act file number 811-22894
INVESTMENT MANAGERS SERIES TRUST II
(Exact name of registrant as specified in charter)
235 W. Galena Street
Milwaukee, WI 53212
(Address of principal executive offices) (Zip code)
Diane J. Drake
Mutual Fund Administration, LLC
2220 E. Route 66, Suite 226
Glendora, CA 91740
(Name and address of agent for service)
(626) 385-5777
Registrant's telephone number, including area code
Date of fiscal year end: September 30
Date of reporting period: September 30, 2023
Item 1. Report to Stockholders.
The registrant’s annual report transmitted to shareholders pursuant to Rule 30e-1 under the Investment Company Act of 1940, as amended (the “Investment Company Act”), is as follows:
The First Trust Capital Management Funds
Each a series of Investment Managers Series Trust II
Table of Contents
| Shareholder Letter | 1 |
| Fund Performance | 5 |
| Schedule of Investments | 9 |
| Statements of Assets and Liabilities | 30 |
| Statements of Operations | 32 |
| Statements of Changes in Net Assets | 33 |
| Statements of Cash Flows | 37 |
| Financial Highlights | 39 |
| Notes to Financial Statements | 44 |
| Report of Independent Registered Public Accounting Firm | 62 |
| Supplemental Information | 63 |
| Expense Examples | 74 |
This report and the financial statements contained herein are provided for the general information of the shareholders of the First Trust Capital Management Funds. This report is not authorized for distribution to prospective investors in the Funds unless preceded or accompanied by an effective prospectus.
www.firsttrustcapital.com

FIRST TRUST CAPITAL MANAGEMENT FUNDS
ANNUAL SHAREHOLDER LETTER
Contents
| Executive-Level Overview | Market Perspective |
| First Trust Merger Arbitrage Fund | VARAX | VARBX |
| First Trust Multi-Strategy Fund | FTMAX | FTMIX | FTMCX |
Executive-Level Overview
As we reflect on the past fiscal year, it is necessary to acknowledge the evolution of themes driving global economies and financial markets. Despite an aggressive monetary policy in response to rapid inflation, the economies in developed economies have shown resilience and to this point in time beaten consensus expectations. Notably, while headline inflation has shown signs of easing, core inflation remains persistently high, presenting a multifaceted challenge. These shifts in the macro backdrop signal the onset of a potentially new investment regime, necessitating a reevaluation of how risk assets will respond going forward. Our efforts to navigate this shifting landscape for investors remains our primary focus. The current market climate has continued to witness amplified volatility, both in equity and debt markets. When navigating inflection points in the macro landscape and short-term turbulence, the task of portfolio positioning and reacting to emerging data becomes increasingly complex. We have remained steadfast in our approach, focused on constructing resilient, uncorrelated portfolios that can generate positive absolute performance across various market cycles. This approach has proven to be prudent, and across our strategies we are proud to have provided investors some insulation from both negative outcomes and heightened volatility.
In this year's Annual Shareholder Letter, we will delve into the significant drivers of performance and the opportunities we have identified within each of our Fund's portfolios during the past fiscal year. It is within this context that we reiterate our commitment to adapting our investment strategies to the evolving market dynamics, all while maintaining a focus on generating long-term value for our investors.
First Trust Merger Arbitrage Fund
The First Trust Merger Arbitrage Fund Class A and I Shares (VARAX, VARBX) generated +3.58% (-2.34% net of sales load) and +3.82% returns over the one-year fiscal period ending September 30, 2023. Public market benchmarks such as the S&P 500 and the Bloomberg U.S. Aggregate Bond Index (“AGG”) achieved returns of +21.62% and +0.64%, respectively. We continue to be pleased with the Fund’s ability to generate returns not predicated on broader market movements and continue to expect the Fund’s performance to fall between its benchmarks. The Fund has continued to deliver positive returns despite a complicated macro backdrop characterized by elevated inflation, rising interest rates and geopolitical conflict. Specifically, the Fund generated positive returns in 10 of the last 12 months, averaging a +0.46% gain during each of the Fund’s positive months. In comparison, the AGG reported positive returns in just five of the last 12 months. During the seven months in which the AGG experienced negative returns, the Fund maintained an average monthly return of +0.30%, while the AGG averaged -1.34%.
To provide context for the S&P 500's outsized headline return, it's important to note that the public equities market experienced a significant downturn in 2022, reaching its lowest point in October, and has since made a partial recovery. The upward momentum has been substantially concentrated in U.S. technology mega-caps, due to a confluence of positive sentiment around their recession resiliency and themes in artificial intelligence. It's worth mentioning that just seven companies in the S&P 500 were responsible for generating roughly ~70% of the indices’ gains for the first half of the year.
First Trust Capital Management | 225 W. Wacker Drive | 21st Floor | Chicago, IL 60606 | P: 773.386.6700 | F: 847.386.2910
The Fund distinguishes itself by its ability to generate returns while maintaining a relatively low risk profile, with a realized volatility of only 1.41% over the trailing one-year period. Comparatively, the AGG and S&P 500 exhibited realized volatility of 8.75% and 20.53%, respectively. Additionally, correlation between the Fund and both indices over the past year remains low at -0.14 and 0.19, respectively. Our conviction remains in the Fund’s ability to provide a strong risk-adjusted return stream independent of broader market cycles.
The top five M&A deals in and as a percentage of the Fund as of 9/30/2023 were Activision Blizzard Inc. (ATVI) at 11.4%, Horizon Therapeutics (HZNP) at 4.5%, Denbury Inc. (DEN) at 4.1%, New Relic Inc. (NEWR) at 3.6%, and Hostess Brands (TWNK) at 2.4%.
The merger arbitrage landscape encountered considerable macroeconomic and regulatory pressure throughout the fiscal year, including the Federal Reserve’s interest rate policy creating uncertainty in corporate boardrooms and the current Federal Trade Commission (FTC) regime’s more stringent M&A enforcement policies. The confluence of these factors initially tempered deal activity, particularly earlier in the year. However, the recent pause in the rate-hiking cycle, alongside the FTC’s struggles in challenging deals (such as its failed attempt to block Microsoft’s acquisition of Activision Blizzard), have begun to create a more favorable environment for M&A. This positive trend has instilled greater confidence in boardrooms to pursue strategic acquisitions. As a result, we have seen an uptick in transactions offering attractive spreads while still presenting high probabilities of closure.
The Fund has navigated through many market cycles since 2000, and our team continues to leverage an established deep due diligence process to identify attractive risk-adjusted opportunities while considering the current macroeconomic environment. We maintain the belief that our strategy will continue to deliver a non-correlated return stream and we remain committed to allocating capital to what we consider the highest conviction merger arbitrage deals.
First Trust Multi-Strategy Fund
We are pleased to share the annual performance update for the First Trust Multi-Strategy Fund (FTMIX, FTMAX, FTMCX) for the fiscal year ending September 30, 2023, demonstrating the Fund's continued resilience and adaptability in the face of evolving market conditions. The Fund’s I, A, and C Share Classes returned +7.19%, +6.83% (+2.04% net of sales load) and +6.06%, respectively, for the fiscal year ending 9/30/2023. The Fund’s benchmark, the ICE BofAML 3-Month U.S. Treasury Bill Index, finished the fiscal year period with a +4.50% return. During the same period, the Bloomberg U.S. Aggregate Bond Index’s returned a muted +0.64% over the fiscal year period. Our ability to navigate market uncertainties and deliver positive returns underscores our commitment to maintaining a distinct, alternative return profile that remains independent of overall stock and bond market trends. As a reminder, we adhere to a multi-alternative approach within the Fund, utilizing three core strategies - Merger Arbitrage, Option Writing, and Structured Debt - carefully selected and positioned to optimize returns while effectively managing risk.
The merger arbitrage component of the portfolio provided a positive return of +1.90% over the 1-year period despite the challenges posed by regulatory hurdles in the M&A landscape. Having said that, we remain encouraged by the increased level of activity and interest in inorganic growth opportunities within corporate boardrooms seen over the year. This view is reflective of the portfolio's allocation to a range of attractive yielding and high probability of closure deals. Given today’s base rates, newly announced deals display historically attractive yields, and we believe the current opportunity set remains compelling for the strategy as we move ahead. As corporate boardrooms continue to evolve in response to changing market dynamics, we are well-positioned to capitalize on a diverse array of investment prospects, ensuring continued value accretion from the strategy.
Despite heightened levels of volatility and a downturn in equity markets towards the final quarter of the Fund’s fiscal year, the option writing strategy contributed +5.38% to the portfolio over the fiscal year timeframe. While market uncertainties resulted in fluctuations in the VIX during the 1-year period, the option strategy effectively capitalized on short-term implied volatility spikes, ensuring a steady yield of attractive premiums through the sale of options while still benefitting from the positive equity returns. We remain committed to leveraging the potential of this strategy to provide substantial upside equity participation with a downside cushion, particularly in a market characterized by ongoing fluctuations.
First Trust Capital Management | 225 W. Wacker Drive | 21st Floor | Chicago, IL 60606 | P: 773.386.6700 | F: 847.386.2910
During July, the Fund initiated a new mandate within alternative credit to a structured debt strategy we believe is better positioned in this environment to provide exposure to high-quality loans with shorter durations, and where the probability of defaults remains relatively low. Aside from its healthy income potential, we believe that the structured debt sleeve offers another layer of diversification benefits given each CLO position includes exposure to over 300+ underlying companies across various sectors and regions. FTMIX's structured debt strategy delivered a commendable return of 1.12% since its inception in July, reflecting our strategic focus on quality and duration. With a strategic allocation of 60% to BBB and 40% to BB CLO tranches, the structured debt sleeve continues to offer a stable income stream, consistently contributing to FTMIX's stated 6.00% distribution rate.
The portfolio allocations as of the end of the current fiscal year have been strategically adjusted to include 25% in the option writing strategy, 34% in the structured debt strategy, and 34% in the merger arbitrage strategy. Notably, our approach to managing the portfolio involves incremental shifts between strategy allocations, allowing for dynamic capital reallocation across strategies to capitalize on the most attractive opportunities within the market. This strategic positioning serves to maintain a relatively balanced exposure perspective, seeking to enhance performance across various market conditions. Our continued belief in the effectiveness of tactically weighted portfolios underscores our conviction that multi-alternative mutual funds can face challenges stemming from excessive diversification, ultimately leading to muted returns. In line with this philosophy, the Fund has a deliberate focus on achieving a well-balanced combination of underlying strategies. We remain committed to our philosophy, aiming to deliver consistent returns for our investors while maintaining a robust and stable risk profile as we navigate what seems to be an ever-changing market dynamic.
| As always, we want to thank you for your trust and confidence in First Trust Capital Management. We continue to work each day to maintain that confidence. |  |
Kind Regards,
Michael Peck, CFA President, Co-Chief Investment Officer mpeck@FirstTrustCapital.com | Brian R. Murphy Co-Chief Investment Officer bmurphy@FirstTrustCapital.com |
The views were those of the Portfolio Fund Managers as of September 30, 2023 and may not reflect their views on the date this material is first published or anytime thereafter. These views are intended to assist the shareholders of the Funds in understanding their investments and do not constitute investment advice. This material may contain discussions about investments that may or may not be held by the Funds as of the date of this material. All current and future holdings are subject to risk and to change.
First Trust Capital Management | 225 W. Wacker Drive | 21st Floor | Chicago, IL 60606 | P: 773.386.6700 | F: 847.386.2910
Mutual fund investing involves risk. Principal loss is possible. Investments in companies that are the subject of a publicly announced transaction carry the risk that the proposed or expected transaction may not be completed or may be completed on less favorable terms than originally expected, which may lower the Funds’ performance. Investments in foreign securities involve greater volatility and political, economic, and currency risks and difference in accounting methods. These risks are greater for emerging markets. Investments in small and medium sized companies involve additional risks such as limited liquidity or greater volatility. Derivatives involve special risks including correlation, counterparty, liquidity, operational, accounting and tax risks. These risks, in certain cases, may be greater than the risks presented by more traditional investments. The Funds may make short sales of securities, which involves the risk that losses may exceed the original amount invested. The Funds may use leverage which may exaggerate the effect of any securities or the Net Asset Value of the Funds, and money borrowed will be subjected to interest costs. In the case of an investment in a potential acquisition target, if the proposed merger, exchange offer or cash tender offer appears likely not to be consummated, in fact is not consummated, or is delayed, the market price of the security to be tendered or exchanged will usually decline sharply, resulting in a loss to the Funds. If a put or call option purchased by one of the Funds expires without being sold or exercised, the Fund will lose the premium it paid for the option. The risk involved in writing a covered call option is the lack of liquidity for the option. The Funds are non-diversified, meaning they may concentrate their assets in fewer individual holdings than a diversified fund. Therefore, the Funds are more exposed to individual stock volatility than a diversified fund. The Funds may invest in mortgage backed securities that include additional risks that investors should be aware of such as credit risk, prepayment risk, possible illiquidity and default, as well as increased susceptibility to adverse economic developments. Multi-investment management styles may lead to higher transaction expenses compared to a single investment management styles. Outcomes depend on the skill of the sub-advisers and funds (ETFs), which may trade at a discount to the aggregate value of the underlying securities, and, although expense ratios for ETFs are generally low, frequent trading of ETFs by the Funds can generate brokerage expenses. For a complete description of risks, please read the prospectus.
First Trust Capital Management L.P. is the Adviser to the First Trust Merger Arbitrage Fund and the First Trust Multi-Strategy Fund (collectively, the “Funds”). First Trust Portfolios L.P. is the distributor for the Funds and an affiliate of the Adviser.
First Trust Capital Management | 225 W. Wacker Drive | 21st Floor | Chicago, IL 60606 | P: 773.386.6700 | F: 847.386.2910
First Trust Merger Arbitrage Fund
FUND PERFORMANCE at September 30, 2023 (Unaudited)
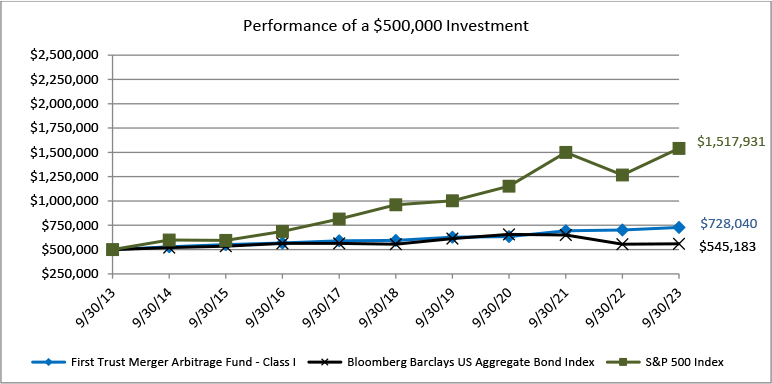
This graph compares a hypothetical $500,000 investment in the Fund’s Class I shares with a similar investment in the Bloomberg Barclays US Aggregate Bond Index and the S&P 500 Index during the periods shown. The performance graph above is shown for the Fund’s Class I shares. Class A shares performance may vary. Results include the reinvestment of all dividends and capital gains.
| Average Annual Total Returns as of September 30, 2023 | 1 Year | 5 Years | 10 Years |
| Before deducting maximum sales charge | | | |
| Class A1 | 3.58% | 3.79% | 3.51% |
| Class I2 | 3.82% | 4.11% | 3.83% |
| After deducting maximum sales charge | | | |
| Class A1 | -2.34% | 2.57% | 2.90% |
| Bloomberg Barclays US Aggregate Bond Index | 0.64% | 0.10% | 1.13% |
| S&P 500 Index | 21.62% | 9.92% | 11.91% |
| 1 | Maximum sales charge for Class A shares is 5.75%. No sales charge applies on investments of $1 million or more, but a contingent deferred sales charge of 1.00% will be imposed to the extent a finder’s fee was paid on certain redemptions of such shares within 12 months of the date of purchase. |
| 2 | Class I shares do not have any initial or deferred sales charge. |
The performance data quoted here represents past performance and past performance is not a guarantee of future results. Investment return and principal value will fluctuate so that an investor’s shares, when redeemed, may be worth more or less than their original cost. Current performance may be lower or higher than the performance information quoted. The most recent month end performance may be obtained by calling (877) 779-1999.
The expense ratios for Class A and Class I shares were 2.22% and 1.91%, respectively, which were the amounts stated in the current prospectus dated February 1, 2023. For the Fund’s current one year expense ratios, please refer to the Financial Highlights section of this report. The Fund’s advisor has contractually agreed to waive its fees and/or pay for operating expenses of the Fund to ensure that total annual fund operating expenses do not exceed 1.85% and 1.55% of the average daily net assets of the Fund’s Class A and Class I shares, respectively. This agreement is in effect until January 31, 2024, and it may be terminated before that date only by the Trust’s Board of Trustees.
First Trust Merger Arbitrage Fund
FUND PERFORMANCE at September 30, 2023 (Unaudited) – Continued
The Fund commenced investment operations on October 1, 2015, after the reorganization of Highland Capital Management Institutional Fund, LLC, a Delaware limited liability company which commenced operations on April 1, 2000 (the “Predecessor Fund”), into the Fund, pursuant to which the Predecessor Fund transferred substantially all of its assets into the Fund. As a result of the reorganization, the Fund is the accounting successor of the Predecessor Fund. The Predecessor Fund was not registered under the 1940 Act and, therefore, was not subject to certain restrictions imposed by the 1940 Act on registered investment companies and by the Internal Revenue Code of 1986, as amended, on regulated investment companies such as the Fund. Performance results shown in the graph and the performance table above for the period prior to October 1, 2015 reflect the performance of the Predecessor Fund.
Returns reflect the reinvestment of distributions made by the Fund, if any. The graph and the performance table shown do not reflect the deduction of taxes that a shareholder would pay on Fund distributions or the redemption of Fund shares. Shares redeemed within 30 days of purchase will be charged a redemption fee of 1.00%.
The Bloomberg Barclays US Aggregate Bond Index is market capitalization weighted and includes treasury securities, government agency bonds, mortgage backed bonds and corporate bonds. It excludes municipal bonds and treasury inflation-protected securities because of tax treatment. The S&P 500 Index includes a representative sample of 500 leading companies in leading industries of the U.S. economy and assumes any dividends are reinvested back into the index. These indices do not reflect expenses, fees or sales charge, which would lower performance. The indices are unmanaged and they are not available for investment.
First Trust Multi-Strategy Fund
FUND PERFORMANCE at September 30, 2023 (Unaudited)

This graph compares a hypothetical $100,000 investment in the Fund’s Class I shares with a similar investment in the ICE BofA Merrill Lynch 3-Month U.S. Treasury Bill Index during the periods shown. The performance graph above is shown for the Fund’s Class I shares. Class A shares and Class C shares performance may vary. Results include the reinvestment of all dividends and capital gains.
| Average Annual Total Returns as of September 30, 2023 | 1 Year | 5 Years | 10 Years |
| Before deducting maximum sales charge | | | |
| Class A1 | 6.83% | 3.86% | 3.31% |
| Class C2 | 6.06% | 3.07% | 2.54% |
| Class I3 | 7.19% | 4.16% | 3.62% |
| After deducting maximum sales charge | | | |
| Class A1 | 2.04% | 2.80% | 2.79% |
| Class C2 | 5.06% | 3.07% | 2.54% |
| ICE BofA Merrill Lynch 3-Month U.S. Treasury Bill Index | 4.50% | 1.72% | 1.12% |
| 1 | Maximum sales charge is 4.50%. No sales charge applies on investments of $250,000 or more, but a contingent deferred sales charge (“CDSC”) of 0.50% will be imposed to the extent a finder’s fee was paid on certain redemptions of such shares within 12 months of the date of purchase. |
| 2 | Class C Shares are subject to a CDSC of 1.00% on any shares sold within 12 months of the date of purchase. Class C shares commenced operations on November 14, 2022. The performance figures for Class C shares include the performance for the Class I shares for the periods prior to the inception date of Class C shares, adjusted for the difference in Class C shares and Class I shares expenses. Class C shares impose higher expenses than Class I shares. |
| 3 | Class I shares do not have any initial or deferred sales charge. |
The performance data quoted here represents past performance and past performance is not a guarantee of future results. Investment return and principal value will fluctuate so that an investor’s shares, when redeemed, may be worth more or less than their original cost. Current performance may be lower or higher than the performance information quoted. The most recent month end performance may be obtained by calling (877) 779-1999.
First Trust Multi-Strategy Fund
FUND PERFORMANCE at September 30, 2023 (Unaudited) – Continued
The expense ratios for Class A, Class C and Class I shares were 2.39%, 3.14% and 2.07%, respectively, which were the amounts stated in the current prospectus dated May 1, 2023, as amended July 28, 2023. For the Fund’s current one year expense ratios, please refer to the Financial Highlights section of this report. The Fund’s advisor has contractually agreed to waive its fees and/or pay for operating expenses of the Fund to ensure that total annual fund operating expenses do not exceed 1.85%, 2.60% and 1.55% of the average daily net assets of the Fund’s Class A, Class C and Class I shares, respectively. This agreement is in effect until January 31, 2024, and it may be terminated before that date only by the Trust’s Board of Trustees.
The Fund commenced investment operations on December 16, 2016, after the reorganization of Vivaldi Orinda Macro Opportunities Fund, which commenced operations on April 30, 2012 (the “Predecessor Fund”), into the Fund, pursuant to which the Predecessor Fund transferred substantially all of its assets into the Fund. As a result of the reorganization, the Fund is the accounting successor of the Predecessor Fund. Performance results shown in the graph and the performance table above for the period prior to December 16, 2016 reflect the performance of the Predecessor Fund.
Returns reflect the reinvestment of distributions made by the Fund, if any. The graph and the performance table shown do not reflect the deduction of taxes that a shareholder would pay on Fund distributions or the redemption of Fund shares.
The ICE BofA Merrill Lynch 3-Month U.S. Treasury Bill Index tracks the performance of the U.S. Dollar denominated U.S. Treasury Bills publicly issued in the U.S. Domestic Market with a remaining term to final maturity of less than 3 months. This index does not reflect expenses, fees or sales charges, which would lower performance. The index is unmanaged and it is not available for investment.
First Trust Merger Arbitrage Fund
SCHEDULE OF INVESTMENTS
As of September 30, 2023
Number
of Shares | | | | | Value | |
| | | | | COMMON STOCKS — 79.8% | | | | |
| | | | | COMPUTER SOFTWARE — 1.0% | | | | |
| | 778,624 | | | Avid Technology, Inc.* | | $ | 20,921,627 | |
| | | | | | | | | |
| | | | | DISTRIBUTION/WHOLESALE — 0.6% | | | | |
| | 70,707 | | | Veritiv Corp. | | | 11,942,412 | |
| | | | | | | | | |
| | | | | DIVERSIFIED MANUFACTURING — 1.4% | | | | |
| | 230,968 | | | Chase Corp. | | | 29,386,059 | |
| | | | | | | | | |
| | | | | ELECTRONIC MEASURING INSTRUMENTS — 1.5% | | | | |
| | 526,826 | | | National Instruments Corp. | | | 31,409,366 | |
| | | | | | | | | |
| | | | | ENTERPRISE SOFTWARE/SERVICE — 3.6% | | | | |
| | 859,410 | | | New Relic, Inc.*,1 | | | 73,582,684 | |
| | | | | | | | | |
| | | | | ENTERTAINMENT SOFTWARE — 11.4% | | | | |
| | 2,528,790 | | | Activision Blizzard, Inc.1 | | | 236,770,608 | |
| | | | | | | | | |
| | | | | FOOD-BAKING — 2.4% | | | | |
| | 1,488,833 | | | Hostess Brands, Inc. - Class A* | | | 49,593,027 | |
| | | | | | | | | |
| | | | | GAS-TRANSPORTATION — 0.5% | | | | |
| | 308,725 | | | Brookfield Infrastructure Corp. - Class A | | | 10,910,331 | |
| | | | | | | | | |
| | | | | HAZARDOUS WASTE DISPOSAL — 1.3% | | | | |
| | 607,908 | | | Heritage-Crystal Clean, Inc.* | | | 27,568,628 | |
| | | | | | | | | |
| | | | | MACHINERY-PUMPS — 1.1% | | | | |
| | 386,950 | | | CIRCOR International, Inc.* | | | 21,572,463 | |
| | | | | | | | | |
| | | | | MEDICAL INFORMATION SYSTEMS — 0.8% | | | | |
| | 667,649 | | | NextGen Healthcare, Inc.* | | | 15,843,311 | |
| | | | | | | | | |
| | | | | MEDICAL-BIOMEDICAL/GENERICS — 4.8% | | | | |
| | 296,450 | | | Abcam PLC* | | | 6,708,663 | |
| | 798,668 | | | Horizon Therapeutics PLC*,1 | | | 92,397,901 | |
| | | | | | | | 99,106,564 | |
| | | | | OIL COMP-EXPLORATION & PRODUCTION — 5.8% | | | | |
| | 857,750 | | | Denbury, Inc.*,1 | | | 84,068,077 | |
| | 1,754,941 | | | Earthstone Energy, Inc.* | | | 35,520,006 | |
| | | | | | | | 119,588,083 | |
| | | | | PIPELINES — 0.0% | | | | |
| | 1 | | | ONEOK, Inc.1 | | | 58 | |
First Trust Merger Arbitrage Fund
SCHEDULE OF INVESTMENTS - Continued
As of September 30, 2023
Number
of Shares | | | | | Value | |
| | | | | REINSURANCE — 1.7% | | | | |
| | 1,197,171 | | | Argo Group International Holdings Ltd.1 | | $ | 35,723,583 | |
| | | | | | | | | |
| | | | | REITS-HOTELS — 0.2% | | | | |
| | 320,599 | | | Hersha Hospitality Trust | | | 3,161,106 | |
| | | | | | | | | |
| | | | | REITS-SHOPPING CENTERS — 1.3% | | | | |
| | 2,606,443 | | | RPT Realty | | | 27,524,038 | |
| | | | | | | | | |
| | | | | SPECIFIED PURPOSE ACQUISITIONS — 40.4% | | | | |
| | 49,123 | | | 7GC & Co. Holdings, Inc. - Class A* | | | 519,476 | |
| | 42,539 | | | Accretion Acquisition Corp.* | | | 445,809 | |
| | 65,824 | | | Acropolis Infrastructure Acquisition Corp. - Class A* | | | 676,671 | |
| | 251,950 | | | Adit EdTech Acquisition Corp.* | | | 2,690,826 | |
| | 185,000 | | | Alchemy Investments Acquisition Corp. I - Class A* | | | 1,909,200 | |
| | 1,465,812 | | | Alpha Partners Technology Merger Corp.2 | | | 15,515,620 | |
| | 457,763 | | | Alpha Star Acquisition Corp.* | | | 4,985,039 | |
| | 524,847 | | | AlphaVest Acquisition Corp.2 | | | 5,547,633 | |
| | 20,633 | | | ALSP Orchid Acquisition Corp. I - Class A* | | | 226,963 | |
| | 980,000 | | | Andretti Acquisition Corp. - Class A2 | | | 10,535,000 | |
| | 1,083,465 | | | AP Acquisition Corp. - Class A2 | | | 11,896,446 | |
| | 1,236,798 | | | Apollo Strategic Growth Capital II - Class A2 | | | 12,998,747 | |
| | 275,220 | | | APx Acquisition Corp. I - Class A* | | | 3,019,163 | |
| | 2,976,332 | | | Ares Acquisition Corp. - Class A2 | | | 32,025,332 | |
| | 2,178,556 | | | Ares Acquisition Corp. II - Class A* | | | 22,373,770 | |
| | 986,367 | | | Battery Future Acquisition Corp. - Class A2 | | | 10,731,673 | |
| | 165,437 | | | Beard Energy Transition Acquisition Corp. - Class A* | | | 1,778,448 | |
| | 1,056,378 | | | BioPlus Acquisition Corp. - Class A2 | | | 11,440,574 | |
| | 383,773 | | | Black Mountain Acquisition Corp. - Class A* | | | 4,094,858 | |
| | 139,798 | | | Blue World Acquisition Corp. - Class A* | | | 1,523,798 | |
| | 470,000 | | | Bukit Jalil Global Acquisition I Ltd.2 | | | 4,831,600 | |
| | 525,843 | | | BurTech Acquisition Corp. - Class A2 | | | 5,558,160 | |
| | 1,049,802 | | | Cartesian Growth Corp. II* | | | 11,337,862 | |
| | 330,000 | | | Cartica Acquisition Corp. - Class A* | | | 3,550,800 | |
| | 108,838 | | | Cetus Capital Acquisition Corp. - Class A* | | | 1,138,445 | |
| | 127,987 | | | CF Acquisition Corp. IV - Class A* | | | 1,366,901 | |
| | 1,152,305 | | | CF Acquisition Corp. VII - Class A2 | | | 12,329,663 | |
| | 700,844 | | | Chenghe Acquisition Co. - Class A2 | | | 7,590,140 | |
| | 1,133,003 | | | Churchill Capital Corp. V - Class A2 | | | 11,783,231 | |
| | 295,635 | | | Churchill Capital Corp. VII - Class A* | | | 3,089,386 | |
| | 450,000 | | | Coliseum Acquisition Corp. - Class A* | | | 4,788,000 | |
| | 1,301,603 | | | Compass Digital Acquisition Corp. - Class A2 | | | 13,653,815 | |
| | 1,490,000 | | | Concord Acquisition Corp. II - Class A2 | | | 15,317,200 | |
| | 369,443 | | | Concord Acquisition Corp. III - Class A2 | | | 3,923,485 | |
First Trust Merger Arbitrage Fund
SCHEDULE OF INVESTMENTS - Continued
As of September 30, 2023
Number
of Shares | | | | | Value | |
| | | | | SPECIFIED PURPOSE ACQUISITIONS (Continued) | | | | |
| | 354,008 | | | Constellation Acquisition Corp. I - Class A2 | | $ | 3,819,746 | |
| | 730,810 | | | Denali Capital Acquisition Corp. - Class A2 | | | 7,980,445 | |
| | 8,894 | | | Distoken Acquisition Corp.* | | | 93,743 | |
| | 457,416 | | | DUET Acquisition Corp. - Class A2 | | | 4,898,925 | |
| | 2,959,581 | | | Enphys Acquisition Corp. - Class A2 | | | 31,075,600 | |
| | 174,667 | | | EVe Mobility Acquisition Corp. - Class A* | | | 1,865,444 | |
| | 1,239,485 | | | Everest Consolidator Acquisition Corp. - Class A2 | | | 13,411,228 | |
| | 407,409 | | | Feutune Light Acquisition Corp. - Class A2 | | | 4,351,128 | |
| | 302,584 | | | Finnovate Acquisition Corp. - Class A* | | | 3,295,140 | |
| | 750,001 | | | Fintech Ecosystem Development Corp. - Class A2 | | | 7,980,011 | |
| | 97,996 | | | Focus Impact Acquisition Corp. - Class A* | | | 1,063,257 | |
| | 905,798 | | | Forbion European Acquisition Corp. - Class A2 | | | 9,918,488 | |
| | 1,856,386 | | | FTAC Emerald Acquisition Corp. - Class A2 | | | 19,417,797 | |
| | 200,006 | | | Global Partner Acquisition Corp. II - Class A2 | | | 2,166,065 | |
| | 95,182 | | | Global Star Acquisition, Inc. - Class A* | | | 1,008,929 | |
| | 6,000 | | | Globalink Investment, Inc.* | | | 64,500 | |
| | 175,641 | | | Golden Star Acquisition Corp.* | | | 1,809,102 | |
| | 416,808 | | | Goldenstone Acquisition Ltd.2 | | | 4,464,014 | |
| | 1,342,238 | | | Gores Holdings IX, Inc. - Class A* | | | 13,945,853 | |
| | 1,200,186 | | | Haymaker Acquisition Corp. IV2 | | | 12,205,892 | |
| | 487,772 | | | Hennessy Capital Investment Corp. VI - Class A* | | | 5,038,685 | |
| | 106,107 | | | Horizon Space Acquisition I Corp.* | | | 1,118,368 | |
| | 886,700 | | | Inflection Point Acquisition Corp. II - Class A* | | | 9,053,207 | |
| | 79,890 | | | Integrated Rail and Resources Acquisition Corp. - Class A* | | | 869,203 | |
| | 958,670 | | | Investcorp Europe Acquisition Corp. I - Class A2 | | | 10,430,330 | |
| | 913,104 | | | Israel Acquisitions Corp.2 | | | 9,633,247 | |
| | 99,239 | | | IX Acquisition Corp. - Class A* | | | 1,081,705 | |
| | 960,000 | | | Jaguar Global Growth Corp. I2 | | | 10,195,200 | |
| | 95,465 | | | Juniper II Corp. - Class A* | | | 1,011,452 | |
| | 236,389 | | | Kensington Capital Acquisition Corp. V - Class A | | | 2,498,632 | |
| | 521,933 | | | Kernel Group Holdings, Inc. - Class A2 | | | 5,532,490 | |
| | 553,651 | | | L Catterton Asia Acquisition Corp. - Class A* | | | 5,885,310 | |
| | 527,035 | | | LatAmGrowth SPAC | | | 5,797,385 | |
| | 1,066,247 | | | Learn CW Investment Corp. - Class A* | | | 11,312,881 | |
| | 214,047 | | | LIV Capital Acquisition Corp. II - Class A* | | | 2,322,410 | |
| | 972,161 | | | Live Oak Crestview Climate Acquisition Corp. - Class A | | | 10,042,423 | |
| | 115,200 | | | Mars Acquisition Corp.* | | | 1,210,752 | |
| | 26,005 | | | Metal Sky Star Acquisition Corp.* | | | 284,235 | |
| | 243,191 | | | Mobiv Acquisition Corp. | | | 2,599,712 | |
| | 351,684 | | | Monterey Capital Acquisition Corp - Class A* | | | 3,731,367 | |
| | 678,185 | | | Mountain & Co. I Acquisition Corp. - Class A2 | | | 7,595,672 | |
| | 1,455,000 | | | Nabors Energy Transition Corp. II - Class A* | | | 14,797,350 | |
First Trust Merger Arbitrage Fund
SCHEDULE OF INVESTMENTS - Continued
As of September 30, 2023
Number
of Shares | | | | | Value | |
| | | | | SPECIFIED PURPOSE ACQUISITIONS (Continued) | | | | |
| | 463,760 | | | Oak Woods Acquisition Corp. - Class A2 | | $ | 4,841,654 | |
| | 109,566 | | | Papaya Growth Opportunity Corp. | | | 1,161,400 | |
| | 1,580,126 | | | Patria Latin American Opportunity Acquisition Corp. - Class A2 | | | 17,365,585 | |
| | 2,082,527 | | | Pearl Holdings Acquisition Corp. - Class A2 | | | 22,324,689 | |
| | 43,011 | | | Pegasus Digital Mobility Acquisition Corp. - Class A* | | | 470,540 | |
| | 442,247 | | | Pono Capital Three, Inc. - Class A* | | | 4,665,706 | |
| | 126,247 | | | PowerUp Acquisition Corp. - Class A* | | | 1,470,777 | |
| | 960,393 | | | Project Energy Reimagined Acquisition Corp. - Class A2 | | | 10,064,919 | |
| | 522,305 | | | PROOF Acquisition Corp. I - Class A2 | | | 5,609,556 | |
| | 79,083 | | | Pyrophyte Acquisition Corp. - Class A* | | | 862,795 | |
| | 475,680 | | | RCF Acquisition Corp. - Class A* | | | 5,203,939 | |
| | 400,000 | | | RF Acquisition Corp. - Class A2 | | | 4,260,000 | |
| | 2,302,100 | | | Rigel Resource Acquisition Corp. - Class A2 | | | 25,069,869 | |
| | 114,360 | | | Schultze Special Purpose Acquisition Corp. - Class A* | | | 1,212,216 | |
| | 6,982,678 | | | Screaming Eagle Acquisition Corp. - Class A2 | | | 73,038,812 | |
| | 1,015,738 | | | SDCL EDGE Acquisition Corp. - Class A2 | | | 10,766,823 | |
| | 295,242 | | | Seaport Global Acquisition II Corp. - Class A* | | | 3,156,137 | |
| | 225,568 | | | Semper Paratus Acquisition Corp.* | | | 2,447,413 | |
| | 437,934 | | | SK Growth Opportunities Corp. - Class A* | | | 4,703,411 | |
| | 3,740,658 | | | Slam Corp. - Class A2 | | | 40,324,293 | |
| | 2,076,489 | | | Spring Valley Acquisition Corp. II - Class A2 | | | 22,218,432 | |
| | 42,246 | | | Target Global Acquisition I Corp. - Class A* | | | 458,792 | |
| | 202,522 | | | TLGY Acquisition Corp. - Class A* | | | 2,226,729 | |
| | 2,941,659 | | | TortoiseEcofin Acquisition Corp. III - Class A2 | | | 30,828,586 | |
| | 399,144 | | | Trajectory Alpha Acquisition Corp. - Class A2 | | | 4,198,995 | |
| | 456,000 | | | Tristar Acquisition I Corp. - Class A | | | 4,874,686 | |
| | 500,000 | | | Twin Ridge Capital Acquisition Corp. | | | 5,320,000 | |
| | 514,627 | | | Valuence Merger Corp. I - Class A2 | | | 5,717,506 | |
| | | | | | | | 836,935,317 | |
| | | | | TOTAL COMMON STOCKS | | | | |
| | | | | (Cost $1,621,854,419) | | | 1,651,539,265 | |
| | | | | | | | | |
| | | | | MASTER LIMITED PARTNERSHIPS — 2.3% | | | | |
| | 357,131 | | | Green Plains Partners LP | | | 5,314,109 | |
| | 1,929,722 | | | Holly Energy Partners LP | | | 42,376,695 | |
| | | | | | | | | |
| | | | | TOTAL MASTER LIMITED PARTNERSHIPS | | | | |
| | | | | (Cost $47,816,554) | | | 47,690,804 | |
| | | | | | | | | |
| | | | | PREFERRED STOCKS — 0.8% | | | | |
| | | | | REAL ESTATE — 0.8% | | | | |
| | 219,553 | | | Hersha Hospitality Trust - Series C,
6.875%3 | | | 5,418,568 | |
First Trust Merger Arbitrage Fund
SCHEDULE OF INVESTMENTS - Continued
As of September 30, 2023
Number
of Shares | | | | | Value | |
| | | | | REAL ESTATE (Continued) | | | | |
| | 307,526 | | | Hersha Hospitality Trust - Series D,
6.500%3 | | $ | 7,611,269 | |
| | 179,233 | | | Hersha Hospitality Trust - Series E,
6.500%3 | | | 4,434,224 | |
| | | | | | | | 17,464,061 | |
| | | | | TOTAL PREFERRED STOCKS | | | | |
| | | | | (Cost $17,577,573) | | | 17,464,061 | |
Number
of Contracts | | | | | | |
| | | | | PURCHASED OPTIONS CONTRACTS — 0.0% | | | | |
| | | | | PUT OPTIONS — 0.0% | | | | |
| | | | | Activision Blizzard, Inc. | | | | |
| | 8,929 | | | Exercise Price: $85.00, Notional Amount: $75,896,500,
Expiration Date: October 20, 2023* | | | 544,669 | |
| | | | | TOTAL PUT OPTIONS | | | | |
| | | | | (Cost $449,374) | | | 544,669 | |
| | | | | TOTAL PURCHASED OPTIONS CONTRACTS | | | | |
| | | | | (Cost $449,374) | | | 544,669 | |
Number
of Shares | | | | | | |
| | | | | RIGHTS — 0.0% | | | | |
| | 287,741 | | | ABIOMED, Inc., Expiration Date: December 30, 2029*,1,4 | | | 293,496 | |
| | | | | TOTAL RIGHTS | | | | |
| | | | | (Cost $293,496) | | | 293,496 | |
| | | | | | | | | |
| | | | | UNITS — 0.8% | | | | |
| | | | | SPECIFIED PURPOSE ACQUISITIONS — 0.8% | | | | |
| | 314,640 | | | Aimfinity Investment Corp. I* | | | 3,357,209 | |
| | 1 | | | Haymaker Acquisition Corp. IV2 | | | 10 | |
| | 1,215,815 | | | Keen Vision Acquisition Corp.2 | | | 12,437,788 | |
| | | | | | | | 15,795,007 | |
| | | | | TOTAL UNITS | | | | |
| | | | | (Cost $15,620,749) | | | 15,795,007 | |
| | | | | | | | | |
| | | | | WARRANTS — 0.0% | | | | |
| | 92,500 | | | Alchemy Investments Acquisition Corp. I, Expiration Date: June 26, 2028* | | | 15,263 | |
| | 653 | | | Haymaker Acquisition Corp. IV, Expiration Date: September 12, 20282 | | | 137 | |
| | 443,350 | | | Inflection Point Acquisition Corp. II, Expiration Date: July 17, 2028* | | | 76,212 | |
| | 727,500 | | | Nabors Energy Transition Corp. II, Expiration Date: September 5, 2028* | | | 123,675 | |
| | | | | TOTAL WARRANTS | | | | |
| | | | | (Cost $0) | | | 215,287 | |
First Trust Merger Arbitrage Fund
SCHEDULE OF INVESTMENTS - Continued
As of September 30, 2023
Number
of Shares | | | | | Value | |
| | | | | SHORT-TERM INVESTMENTS — 16.1% | | | | |
| | 332,962,672 | | | Morgan Stanley Institutional Liquidity Fund - Government Portfolio - Institutional Class, 5.27%5 | | $ | 332,962,672 | |
| | | | | TOTAL SHORT-TERM INVESTMENTS | | | | |
| | | | | (Cost $332,962,672) | | | 332,962,672 | |
| | | | | | | | | |
| | | | | TOTAL INVESTMENTS — 99.8% | | | | |
| | | | | (Cost $2,036,574,837) | | | 2,066,505,261 | |
| | | | | | | | | |
| | | | | Assets in Excess of Other Liabilities — 0.2% | | | 3,603,093 | |
| | | | | TOTAL NET ASSETS — 100.0% | | $ | 2,070,108,354 | |
| | | | | | | | | |
| | | | | SECURITIES SOLD SHORT — (9.7)% | | | | |
| | | | | COMMON STOCKS — (9.7)% | | | | |
| | | | | ENERGY-ALTERNATE SOURCE — (0.2)% | | | | |
| | (144,640 | ) | | Green Plains, Inc.* | | | (4,353,664 | ) |
| | | | | | | | | |
| | | | | FOOD-CONFECTIONER — (0.3)% | | | | |
| | (44,797 | ) | | J M Smucker Co. | | | (5,505,999 | ) |
| | | | | | | | | |
| | | | | GAS-TRANSPORTATION — (0.4)% | | | | |
| | (268,116 | ) | | Brookfield Infrastructure Corp. - Class A | | | (9,475,219 | ) |
| | | | | | | | | |
| | | | | OIL COMP-EXPLORATION & PRODUCTION — (1.7)% | | | | |
| | (2,537,644 | ) | | Permian Resources Corp. | | | (35,425,510 | ) |
| | | | | | | | | |
| | | | | OIL COMP-INTEGRATED — (4.1)% | | | | |
| | (720,265 | ) | | Exxon Mobil Corp. | | | (84,688,759 | ) |
| | | | | | | | | |
| | | | | OIL REFINING & MARKETING — (1.7)% | | | | |
| | (607,861 | ) | | HF Sinclair Corp. | | | (34,605,527 | ) |
| | | | | | | | | |
| | | | | REITS-SHOPPING CENTERS — (1.3)% | | | | |
| | (1,576,637 | ) | | Kimco Realty Corp. | | | (27,733,045 | ) |
| | | | | TOTAL COMMON STOCKS | | | | |
| | | | | (Proceeds $201,849,169) | | | (201,787,723 | ) |
| | | | | TOTAL SECURITIES SOLD SHORT | | | | |
| | | | | (Proceeds $201,849,169) | | $ | (201,787,723 | ) |
Number
of Contracts | | | | | | |
| | | | | WRITTEN OPTIONS CONTRACTS — (0.0)% | | | | |
| | | | | CALL OPTIONS — (0.0)% | | | | |
| | | | | Activision Blizzard, Inc. | | | | |
| | (2,927 | ) | | Exercise Price: $95.00, Notional Amount: $(27,806,500),
Expiration Date: November 17, 2023* | | | (17,562 | ) |
First Trust Merger Arbitrage Fund
SCHEDULE OF INVESTMENTS - Continued
As of September 30, 2023
Number
of Contracts | | | | | Value | |
| | | | | CALL OPTIONS (Continued) | | | | |
| | (12,578 | ) | | Exercise Price: $95.00, Notional Amount: $(119,491,000),
Expiration Date: January 19, 2024* | | $ | (119,491 | ) |
| | | | | NextGen Healthcare, Inc. | | | | |
| | (1,366 | ) | | Exercise Price: $25.00, Notional Amount: $(3,415,000),
Expiration Date: January 19, 2024* | | | (10,245 | ) |
| | (521 | ) | | Exercise Price: $25.00, Notional Amount: $(1,302,500),
Expiration Date: March 15, 2024* | | | (2,605 | ) |
| | | | | Reata Pharmaceuticals, Inc. | | | | |
| | (834 | ) | | Exercise Price: $175.00, Notional Amount: $(14,595,000),
Expiration Date: October 20, 2023* | | | — | |
| | | | | TOTAL CALL OPTIONS | | | | |
| | | | | (Proceeds $126,517) | | | (149,903 | ) |
| | | | | TOTAL WRITTEN OPTIONS CONTRACTS | | | | |
| | | | | (Proceeds $126,517) | | $ | (149,903 | ) |
LP — Limited Partnership
PLC — Public Limited Company
| * | Non-income producing security. |
| 1 | All or a portion of this security is segregated as collateral for securities sold short and written options contracts. The market value of the securities pledged as collateral is $253,320,703, which represents 12.24% of the total net assets of the Fund. |
| 3 | Perpetual security. Maturity date is not applicable. |
| 4 | Level 3 securities fair valued under procedures established by the Board of Trustees. The total value of these securities is $293,496, which represents 0% of total net assets of the Fund. |
| 5 | The rate is the annualized seven-day yield at period end. |
See accompanying Notes to Financial Statements.
First Trust Merger Arbitrage Fund
SUMMARY OF INVESTMENTS
As of September 30, 2023
| Security Type/Sector | Percent of Total
Net Assets |
| Common Stocks | |
| Specified Purpose Acquisitions | 40.4% |
| Entertainment Software | 11.4% |
| Oil Comp-Exploration & Production | 5.8% |
| Medical-Biomedical/Generics | 4.8% |
| Enterprise Software/Service | 3.6% |
| Food-Baking | 2.4% |
| Reinsurance | 1.7% |
| Electronic Measuring Instruments | 1.5% |
| Diversified Manufacturing | 1.4% |
| Hazardous Waste Disposal | 1.3% |
| REITS-Shopping Centers | 1.3% |
| Machinery-Pumps | 1.1% |
| Computer Software | 1.0% |
| Medical Information Systems | 0.8% |
| Distribution/Wholesale | 0.6% |
| Gas-Transportation | 0.5% |
| REITS-Hotels | 0.2% |
| Pipelines | 0.0% |
| Total Common Stocks | 79.8% |
| Master Limited Partnerships | 2.3% |
| Preferred Stocks | 0.8% |
| Purchased Options Contracts | 0.0% |
| Rights | 0.0% |
| Units | |
| Specified Purpose Acquisitions | 0.8% |
| Warrants | 0.0% |
| Short-Term Investments | 16.1% |
| Total Investments | 99.8% |
| Other Assets in Excess of Liabilities | 0.2% |
| Total Net Assets | 100.0% |
Please refer to Schedule of Investments for information on securities sold short and written options contracts.
See accompanying Notes to Financial Statements.
First Trust Multi-Strategy Fund
SCHEDULE OF INVESTMENTS
As of September 30, 2023
Principal
Amount | | | | | Value | |
| | | | | ASSET-BACKED SECURITIES — 0.1% | | | | |
| $ | 100,000 | | | Lendingpoint Asset Securitization Trust
Series 2022-B, Class C, 8.450%, 10/15/20291,2 | | $ | 82,966 | |
| | | | | TOTAL ASSET-BACKED SECURITIES | | | | |
| | | | | (Cost $97,199) | | | 82,966 | |
| | | | | | | | | |
| | | | | COLLATERALIZED LOAN OBLIGATIONS — 32.0% | | | | |
| | 500,000 | | | AMMC CLO XXVI Ltd.
Series 2023-26A, Class E, 13.423% (3-Month Term SOFR+828 basis points), 4/15/20361 | | | 504,938 | |
| | 1,000,000 | | | Apidos CLO Ltd.
Series 2015-20A, Class DR, 11.270% (3-Month Term SOFR+596 basis points), 7/16/20311 | | | 932,208 | |
| | 500,000 | | | Apidos CLO XLI Ltd.
Series 2022-41A, Class E, 13.656% (3-Month Term SOFR+833 basis points), 10/20/20341 | | | 501,624 | |
| | 1,150,000 | | | Apidos CLO XXIV Ltd.
Series 2016-24A, Class DR, 11.388% (3-Month Term SOFR+606 basis points), 10/20/20301 | | | 1,087,365 | |
| | 950,000 | | | Ares L CLO Ltd.
Series 2018-50A, Class D, 8.470% (3-Month Term SOFR+316 basis points), 1/15/20321 | | | 923,221 | |
| | | | | Barings CLO Ltd. | | | | |
| | 750,000 | | | Series 2018-3A, Class E, 11.338% (3-Month Term SOFR+601 basis points), 7/20/20291,3 | | | 702,501 | |
| | 1,120,000 | | | Series 2018-2A, Class C, 8.270% (3-Month Term SOFR+296 basis points), 4/15/20301 | | | 1,101,616 | |
| | 1,000,000 | | | Benefit Street Partners CLO V-B Ltd.
Series 2018-5BA, Class C, 8.518% (3-Month Term SOFR+319 basis points), 4/20/20311 | | | 967,370 | |
| | 750,000 | | | Carlyle Global Market Strategies CLO Ltd.
Series 2014-4RA, Class D, 11.220% (3-Month Term SOFR+591 basis points), 7/15/20301 | | | 640,812 | |
| | 500,000 | | | Catamaran CLO Ltd.
Series 2018-1A, Class D, 9.263% (3-Month Term SOFR+391 basis points), 10/25/20311 | | | 482,324 | |
| | 750,000 | | | CIFC Funding III Ltd.
Series 2013-3RA, Class C, 8.507% (3-Month Term SOFR+316 basis points), 4/24/20311 | | | 734,278 | |
| | 1,000,000 | | | Crestline Denali CLO XIV Ltd.
Series 2016-1A, Class DR, 8.957% (3-Month Term SOFR+361 basis points), 10/23/20311 | | | 935,436 | |
| | 750,000 | | | Dryden 106 CLO Ltd.
Series 2022-106A, Class D, 11.008% (3-Month Term SOFR+570 basis points), 10/15/20351,3 | | | 765,563 | |
First Trust Multi-Strategy Fund
SCHEDULE OF INVESTMENTS - Continued
As of September 30, 2023
Principal
Amount | | | | | Value | |
| | | | | COLLATERALIZED LOAN OBLIGATIONS (Continued) | | | | |
| | | | | Eaton Vance CLO Ltd. | | | | |
| $ | 1,000,000 | | | Series 2018-1A, Class D, 8.770% (3-Month Term SOFR+346 basis points), 10/15/20301 | | $ | 965,969 | |
| | 450,000 | | | Series 2018-1A, Class E, 11.570% (3-Month Term SOFR+626 basis points), 10/15/20301 | | | 432,634 | |
| | 500,000 | | | Galaxy XXVII CLO Ltd.
Series 2018-27A, Class E, 11.413% (3-Month Term SOFR+604 basis points), 5/16/20311 | | | 468,422 | |
| | 750,000 | | | Galaxy XXVIII CLO Ltd.
Series 2018-28A, Class D, 8.570% (3-Month Term SOFR+326 basis points), 7/15/20311 | | | 719,732 | |
| | 500,000 | | | Generate VI CLO Ltd.
Series 6A, Class ER, 12.407% (3-Month Term SOFR+706 basis points), 1/22/20351 | | | 496,509 | |
| | 1,000,000 | | | Generate XII CLO Ltd.
Series 2023-12A, Class E, 13.739% (3-Month Term SOFR+840 basis points), 7/20/20361,3 | | | 1,003,075 | |
| | 1,450,000 | | | Gilbert Park CLO Ltd.
Series 2017-1A, Class D, 8.520% (3-Month Term SOFR+321 basis points), 10/15/20301,3 | | | 1,434,085 | |
| | 660,000 | | | GoldenTree Loan Opportunities IX Ltd.
Series 2014-9A, Class ER2, 11.291% (3-Month Term SOFR+592 basis points), 10/29/20291 | | | 660,045 | |
| | 500,000 | | | HPS Loan Management Ltd.
Series 2023-17A, Class E, 12.567% (3-Month Term SOFR+795 basis points), 4/23/20361 | | | 502,233 | |
| | 1,000,000 | | | Magnetite XXXV Ltd.
Series 2022-35A, Class E, 13.251% (3-Month Term SOFR+790 basis points), 10/25/20351 | | | 1,008,520 | |
| | 500,000 | | | Mountain View CLO IX Ltd.
Series 2015-9A, Class CR, 8.690% (3-Month Term SOFR+338 basis points), 7/15/20311 | | | 451,258 | |
| | 800,000 | | | Myers Park CLO Ltd.
Series 2018-1A, Class D, 8.638% (3-Month Term SOFR+331 basis points), 10/20/20301 | | | 768,413 | |
| | 500,000 | | | Neuberger Berman Loan Advisers CLO XXIV Ltd.
Series 2017-24A, Class E, 11.602% (3-Month Term SOFR+628 basis points), 4/19/20301 | | | 479,112 | |
| | 500,000 | | | Neuberger Berman Loan Advisers CLO XXV Ltd.
Series 2017-25A, Class DR, 8.422% (3-Month Term SOFR+311 basis points), 10/18/20291 | | | 491,403 | |
| | 750,000 | | | Octagon 60 Ltd.
Series 2022-1A, Class D1, 10.326% (3-Month Term SOFR+500 basis points), 10/20/20351 | | | 751,835 | |
First Trust Multi-Strategy Fund
SCHEDULE OF INVESTMENTS - Continued
As of September 30, 2023
Principal
Amount | | | | | Value | |
| | | | | COLLATERALIZED LOAN OBLIGATIONS (Continued) | | | | |
| $ | 1,000,000 | | | Octagon Investment Partners XVIII-R Ltd.
Series 2018-18A, Class C, 8.270% (3-Month Term SOFR+296 basis points), 4/16/20311 | | $ | 957,328 | |
| | 1,000,000 | | | OZLM XXII, Ltd.
Series 2018-22A, Class C, 8.220% (3-Month Term SOFR+291 basis points), 1/17/20311,3 | | | 948,151 | |
| | 590,000 | | | OZLM XXIII Ltd
Series 2019-23A, Class DR, 9.320% (3-Month Term SOFR+401 basis points), 4/15/20341 | | | 581,215 | |
| | 500,000 | | | Palmer Square Loan Funding Ltd.
Series 2020-1A, Class SUB, 0.000%, 2/19/20281,2,3,4,5 | | | 78,750 | |
| | 800,000 | | | Regatta XIV Funding Ltd.
Series 2018-3A, Class D, 8.813% (3-Month Term SOFR+346 basis points), 10/25/20311 | | | 791,991 | |
| | | | | Regatta XV Funding Ltd. | | | | |
| | 500,000 | | | Series 2018-4A, Class C, 8.913% (3-Month Term SOFR+356 basis points), 10/25/20311 | | | 492,754 | |
| | 500,000 | | | Series 2018-4A, Class D, 12.113% (3-Month Term SOFR+676 basis points), 10/25/20311 | | | 469,689 | |
| | 500,000 | | | Regatta XXV Funding Ltd.
Series 2023-1A, Class E, 13.664% (3-Month Term SOFR+841 basis points), 7/15/20361,3 | | | 506,185 | |
| | 525,000 | | | Shackleton CLO Ltd.
Series 2015-7RA, Class D, 8.900% (3-Month Term SOFR+359 basis points), 7/15/20311 | | | 498,074 | |
| | 1,000,000 | | | Signal Peak CLO V Ltd.
Series 2018-5A, Class E, 11.263% (3-Month Term SOFR+591 basis points), 4/25/20311 | | | 909,510 | |
| | 1,000,000 | | | Signal Peak CLO VII Ltd.
Series 2019-1A, Class D, 9.481% (3-Month Term SOFR+411 basis points), 4/30/20321 | | | 997,502 | |
| | 1,000,000 | | | Sound Point CLO XVII Ltd.
Series 2017-3A, Class C, 8.588% (3-Month Term SOFR+326 basis points), 10/20/20301,3 | | | 888,817 | |
| | 1,000,000 | | | Sound Point CLO XVIII Ltd.
Series 2017-4A, Class C, 8.088% (3-Month Term SOFR+276 basis points), 1/21/20311 | | | 890,289 | |
| | 655,000 | | | Stratus CLO Ltd.
Series 2022-1A, Class D, 9.576% (3-Month Term SOFR+425 basis points), 7/20/20301 | | | 655,832 | |
| | 1,225,000 | | | Symphony CLO XXXVIII Ltd.
Series 2023-38A, Class D, 8.120% (3-Month Term SOFR+520 basis points), 4/24/20361 | | | 1,235,412 | |
First Trust Multi-Strategy Fund
SCHEDULE OF INVESTMENTS - Continued
As of September 30, 2023
Principal
Amount | | | | | Value | |
| | | | | COLLATERALIZED LOAN OBLIGATIONS (Continued) | | | | |
| $ | 750,000 | | | Texas Debt Capital CLO Ltd.
Series 2023-2A, Class E, 12.826% (3-Month Term SOFR+766 basis points), 7/21/20351 | | $ | 754,312 | |
| | 750,000 | | | Upland CLO Ltd.
Series 2016-1A, Class CR, 8.488% (3-Month Term SOFR+316 basis points), 4/20/20311 | | | 713,116 | |
| | | | | Voya CLO Ltd. | | | | |
| | 425,000 | | | Series 2017-1A, Class C, 8.900% (3-Month Term SOFR+359 basis points), 4/17/20301,3 | | | 413,852 | |
| | 750,000 | | | Series 2014-1A, Class CR2, 8.372% (3-Month Term SOFR+306 basis points), 4/18/20311,3 | | | 646,525 | |
| | 1,000,000 | | | Series 2018-2A, Class D, 8.320% (3-Month Term SOFR+301 basis points), 7/15/20311 | | | 929,181 | |
| | | | | TOTAL COLLATERALIZED LOAN OBLIGATIONS | | | | |
| | | | | (Cost $34,908,900) | | | 35,270,986 | |
| | | | | | | | | |
| | | | | COLLATERALIZED MORTGAGE OBLIGATIONS — 0.1% | | | | |
| | 4,029,425 | | | Alternative Loan Trust
Series 2006-HY10, Class 1X, 0.476%, 5/25/20362,3 | | | 80,343 | |
| | | | | TOTAL COLLATERALIZED MORTGAGE OBLIGATIONS | | | | |
| | | | | (Cost $118,666) | | | 80,343 | |
Number
of Shares | | | | | | |
| | | | | COMMON STOCKS — 23.9% | | | | |
| | | | | COMPUTER SOFTWARE — 0.2% | | | | |
| | 8,371 | | | Avid Technology, Inc.*,5 | | | 224,929 | |
| | | | | | | | | |
| | | | | DISTRIBUTION/WHOLESALE — 0.2% | | | | |
| | 1,252 | | | Veritiv Corp. | | | 211,463 | |
| | | | | | | | | |
| | | | | DIVERSIFIED MANUFACTURING — 0.7% | | | | |
| | 5,734 | | | Chase Corp. | | | 729,537 | |
| | | | | | | | | |
| | | | | ELECTRONIC MEASURING INSTRUMENTS — 0.5% | | | | |
| | 8,358 | | | National Instruments Corp. | | | 498,304 | |
| | | | | | | | | |
| | | | | ENTERPRISE SOFTWARE/SERVICE — 1.2% | | | | |
| | 15,261 | | | New Relic, Inc.*,5 | | | 1,306,647 | |
| | | | | | | | | |
| | | | | ENTERTAINMENT SOFTWARE — 3.8% | | | | |
| | 45,207 | | | Activision Blizzard, Inc.5 | | | 4,232,731 | |
| | | | | | | | | |
| | | | | FOOD-BAKING — 0.8% | | | | |
| | 25,343 | | | Hostess Brands, Inc. - Class A* | | | 844,175 | |
First Trust Multi-Strategy Fund
SCHEDULE OF INVESTMENTS - Continued
As of September 30, 2023
Number
of Shares | | | | | Value | |
| | | | | GAS-TRANSPORTATION — 0.1% | | | | |
| | 4,055 | | | Brookfield Infrastructure Corp. - Class A6 | | $ | 143,320 | |
| | | | | | | | | |
| | | | | HAZARDOUS WASTE DISPOSAL — 0.4% | | | | |
| | 10,751 | | | Heritage-Crystal Clean, Inc.* | | | 487,558 | |
| | | | | | | | | |
| | | | | MACHINERY-PUMPS — 0.3% | | | | |
| | 6,720 | | | CIRCOR International, Inc.* | | | 374,640 | |
| | | | | | | | | |
| | | | | MEDICAL INFORMATION SYSTEMS — 0.3% | | | | |
| | 12,242 | | | NextGen Healthcare, Inc.* | | | 290,503 | |
| | | | | | | | | |
| | | | | MEDICAL-BIOMEDICAL/GENERICS — 1.6% | | | | |
| | 4,686 | | | Abcam PLC*,6 | | | 106,044 | |
| | 14,142 | | | Horizon Therapeutics PLC*,5,6 | | | 1,636,088 | |
| | | | | | | | 1,742,132 | |
| | | | | OIL COMP-EXPLORATION & PRODUCTION — 2.0% | | | | |
| | 16,889 | | | Denbury, Inc.*,5 | | | 1,655,252 | |
| | 29,239 | | | Earthstone Energy, Inc.* | | | 591,797 | |
| | | | | | | | 2,247,049 | |
| | | | | OIL COMP-INTEGRATED — 0.0% | | | | |
| | 1 | | | Chevron Corp. | | | 167 | |
| | | | | | | | | |
| | | | | PIPELINES — 0.0% | | | | |
| | 1 | | | ONEOK, Inc.5 | | | 45 | |
| | | | | | | | | |
| | | | | REINSURANCE — 0.6% | | | | |
| | 21,513 | | | Argo Group International Holdings Ltd.5,6 | | | 641,948 | |
| | | | | | | | | |
| | | | | REITS-HOTELS — 0.0% | | | | |
| | 3,739 | | | Hersha Hospitality Trust | | | 36,867 | |
| | | | | | | | | |
| | | | | REITS-SHOPPING CENTERS — 0.3% | | | | |
| | 35,325 | | | RPT Realty | | | 373,032 | |
| | | | | | | | | |
| | | | | SPECIFIED PURPOSE ACQUISITIONS — 10.9% | | | | |
| | 539 | | | 7GC & Co. Holdings, Inc. - Class A* | | | 5,700 | |
| | 5,000 | | | Accretion Acquisition Corp.*,5 | | | 52,400 | |
| | 3,517 | | | Acropolis Infrastructure Acquisition Corp. - Class A* | | | 36,155 | |
| | 2,437 | | | Adit EdTech Acquisition Corp.*,5 | | | 26,027 | |
| | 10,000 | | | Alpha Partners Technology Merger Corp.*,5,6 | | | 105,850 | |
| | 4,235 | | | Alpha Star Acquisition Corp.*,5,6 | | | 46,119 | |
| | 19,505 | | | AlphaVest Acquisition Corp.*,6 | | | 206,168 | |
| | 5,800 | | | Andretti Acquisition Corp. - Class A*,5,6 | | | 62,350 | |
| | 15,935 | | | AP Acquisition Corp. - Class A*,5,6 | | | 174,966 | |
First Trust Multi-Strategy Fund
SCHEDULE OF INVESTMENTS - Continued
As of September 30, 2023
Number
of Shares | | | | | Value | |
| | | | | SPECIFIED PURPOSE ACQUISITIONS (Continued) | | | | |
| | 6,894 | | | Apollo Strategic Growth Capital II - Class A5,6 | | $ | 72,456 | |
| | 1,025 | | | APx Acquisition Corp. I - Class A*,5,6 | | | 11,244 | |
| | 40,000 | | | Ares Acquisition Corp. - Class A*,5,6 | | | 430,400 | |
| | 25,000 | | | Ares Acquisition Corp. II - Class A*,5,6 | | | 256,750 | |
| | 31,602 | | | Battery Future Acquisition Corp. - Class A*,5,6 | | | 343,830 | |
| | 2,029 | | | Beard Energy Transition Acquisition Corp. - Class A* | | | 21,812 | |
| | 25,000 | | | BioPlus Acquisition Corp. - Class A*,5,6 | | | 270,750 | |
| | 24,725 | | | Black Mountain Acquisition Corp. - Class A*,5 | | | 263,816 | |
| | 1,894 | | | Blue World Acquisition Corp. - Class A*,6 | | | 20,645 | |
| | 16,503 | | | BlueRiver Acquisition Corp. - Class A*,6 | | | 174,189 | |
| | 20,000 | | | Bukit Jalil Global Acquisition 1 Ltd.*,6 | | | 205,600 | |
| | 15,628 | | | BurTech Acquisition Corp. - Class A*,5 | | | 165,188 | |
| | 9,910 | | | byNordic Acquisition Corp. - Class A* | | | 106,830 | |
| | 773 | | | C5 Acquisition Corp. - Class A* | | | 8,480 | |
| | 12,000 | | | Cartica Acquisition Corp. - Class A*,5,6 | | | 129,120 | |
| | 1,139 | | | Cetus Capital Acquisition Corp. - Class A*,5 | | | 11,914 | |
| | 2,266 | | | CF Acquisition Corp. IV - Class A* | | | 24,201 | |
| | 38,700 | | | CF Acquisition Corp. VII - Class A*,5 | | | 414,090 | |
| | 7,078 | | | Chenghe Acquisition Co. - Class A*,5,6 | | | 76,655 | |
| | 25,000 | | | Churchill Capital Corp. V - Class A*,5 | | | 260,000 | |
| | 2,466 | | | Churchill Capital Corp. VII - Class A*,5 | | | 25,770 | |
| | 15,000 | | | Coliseum Acquisition Corp. - Class A*,5,6 | | | 159,600 | |
| | 25,001 | | | Compass Digital Acquisition Corp. - Class A*,5,6 | | | 262,261 | |
| | 5,995 | | | Concord Acquisition Corp. III - Class A* | | | 63,667 | |
| | 10,000 | | | Constellation Acquisition Corp. I - Class A*,5,6 | | | 107,900 | |
| | 11,242 | | | Denali Capital Acquisition Corp. - Class A*,5,6 | | | 122,763 | |
| | 5 | | | Distoken Acquisition Corp.*,5,6 | | | 53 | |
| | 26,453 | | | DUET Acquisition Corp. - Class A* | | | 283,312 | |
| | 25,000 | | | Enphys Acquisition Corp. - Class A*,5,6 | | | 262,500 | |
| | 1,877 | | | EVe Mobility Acquisition Corp. - Class A*,6 | | | 20,046 | |
| | 25,000 | | | Everest Consolidator Acquisition Corp. - Class A* | | | 270,500 | |
| | 6,352 | | | Feutune Light Acquisition Corp. - Class A* | | | 67,839 | |
| | 21,876 | | | Finnovate Acquisition Corp. - Class A*,6 | | | 238,230 | |
| | 2,980 | | | Focus Impact Acquisition Corp. - Class A | | | 32,333 | |
| | 20,175 | | | Forbion European Acquisition Corp. - Class A*,5,6 | | | 220,916 | |
| | 30,182 | | | FTAC Emerald Acquisition Corp. - Class A* | | | 315,704 | |
| | 8,972 | | | Global Partner Acquisition Corp. II - Class A*,5,6 | | | 97,167 | |
| | 992 | | | Global Star Acquisition, Inc. - Class A*,5 | | | 10,515 | |
| | 1,880 | | | Golden Star Acquisition Corp.*,5,6 | | | 19,364 | |
| | 7,289 | | | Goldenstone Acquisition Ltd.*,5 | | | 78,065 | |
| | 10,000 | | | Gores Holdings IX, Inc. - Class A*,5 | | | 103,900 | |
| | 24,030 | | | Haymaker Acquisition Corp. IV*,6 | | | 244,385 | |
First Trust Multi-Strategy Fund
SCHEDULE OF INVESTMENTS - Continued
As of September 30, 2023
Number
of Shares | | | | | Value | |
| | | | | SPECIFIED PURPOSE ACQUISITIONS (Continued) | | | | |
| | 8,690 | | | Hennessy Capital Investment Corp. VI - Class A* | | $ | 89,768 | |
| | 1,015 | | | HH&L Acquisition Co. - Class A*,6 | | | 10,779 | |
| | 1,102 | | | Horizon Space Acquisition I Corp.*,5,6 | | | 11,615 | |
| | 123 | | | Iconic Sports Acquisition Corp. - Class A6 | | | 1,331 | |
| | 24,548 | | | Inflection Point Acquisition Corp. II - Class A*,5,6 | | | 250,635 | |
| | 10,415 | | | Investcorp Europe Acquisition Corp. I - Class A*,5,6 | | | 113,315 | |
| | 19,929 | | | Israel Acquisitions Corp.*,5,6 | | | 210,251 | |
| | 3,671 | | | IX Acquisition Corp. - Class A*,6 | | | 40,014 | |
| | 25,000 | | | Jaguar Global Growth Corp. I | | | 265,500 | |
| | 7,885 | | | Juniper II Corp. - Class A*,5 | | | 83,542 | |
| | 2,589 | | | Kensington Capital Acquisition Corp. V - Class A*,6 | | | 27,366 | |
| | 5,549 | | | Kernel Group Holdings, Inc. - Class A*,5,6 | | | 58,819 | |
| | 556 | | | L Catterton Asia Acquisition Corp. - Class A*,5,6 | | | 5,910 | |
| | 4,600 | | | LatAmGrowth SPAC | | | 49,496 | |
| | 20,000 | | | Learn CW Investment Corp. - Class A*,5,6 | | | 212,200 | |
| | 10,000 | | | LIV Capital Acquisition Corp. II - Class A*,5,6 | | | 108,500 | |
| | 16,712 | | | Live Oak Crestview Climate Acquisition Corp. - Class A*,5 | | | 172,635 | |
| | 2,352 | | | Mobiv Acquisition Corp.5 | | | 25,143 | |
| | 2,334 | | | Monterey Capital Acquisition Corp - Class A*,5 | | | 24,764 | |
| | 6,712 | | | Mountain & Co. I Acquisition Corp. - Class A*,5,6 | | | 75,174 | |
| | 25,000 | | | Nabors Energy Transition Corp. II - Class A*,6 | | | 254,250 | |
| | 3,817 | | | Oak Woods Acquisition Corp. - Class A*,5,6 | | | 39,849 | |
| | 25,000 | | | Patria Latin American Opportunity Acquisition Corp. - Class A*,5,6 | | | 274,750 | |
| | 25,000 | | | Pearl Holdings Acquisition Corp. - Class A*,5,6 | | | 268,000 | |
| | 1,546 | | | Pegasus Digital Mobility Acquisition Corp. - Class A*,6 | | | 16,913 | |
| | 4,304 | | | Pono Capital Three, Inc. - Class A*,6 | | | 45,407 | |
| | 1,354 | | | PowerUp Acquisition Corp. - Class A*,6 | | | 15,774 | |
| | 20,004 | | | Project Energy Reimagined Acquisition Corp. - Class A*,5,6 | | | 209,642 | |
| | 17,701 | | | PROOF Acquisition Corp. I - Class A*,5 | | | 190,109 | |
| | 6,829 | | | Pyrophyte Acquisition Corp. - Class A*,6 | | | 74,504 | |
| | 10,000 | | | RCF Acquisition Corp. - Class A*,5,6 | | | 109,400 | |
| | 5,000 | | | RF Acquisition Corp. - Class A*,5 | | | 53,250 | |
| | 22,560 | | | Rigel Resource Acquisition Corp. - Class A*,5,6 | | | 245,678 | |
| | 1,237 | | | Schultze Special Purpose Acquisition Corp. - Class A* | | | 13,112 | |
| | 10,006 | | | Screaming Eagle Acquisition Corp. - Class A*,5,6 | | | 104,663 | |
| | 14,769 | | | SDCL EDGE Acquisition Corp. - Class A*,5,6 | | | 156,551 | |
| | 3,172 | | | Seaport Global Acquisition II Corp. - Class A* | | | 33,909 | |
| | 2,335 | | | Semper Paratus Acquisition Corp.*,5,6 | | | 25,335 | |
| | 8,776 | | | Slam Corp. - Class A*,5,6 | | | 94,605 | |
| | 10,000 | | | Spring Valley Acquisition Corp. II - Class A*,5,6 | | | 107,000 | |
| | 2,691 | | | Swiftmerge Acquisition Corp. - Class A*,6 | | | 28,605 | |
| | 9,947 | | | Target Global Acquisition I Corp. - Class A*,6 | | | 108,024 | |
First Trust Multi-Strategy Fund
SCHEDULE OF INVESTMENTS - Continued
As of September 30, 2023
Number
of Shares | | | | | Value | |
| | | | | SPECIFIED PURPOSE ACQUISITIONS (Continued) | | | | |
| | 398 | | | TLGY Acquisition Corp. - Class A*,6 | | $ | 4,376 | |
| | 27,417 | | | TortoiseEcofin Acquisition Corp. III - Class A*,5,6 | | | 287,330 | |
| | 4,177 | | | Trajectory Alpha Acquisition Corp. - Class A*,5 | | | 43,942 | |
| | 25,298 | | | Tristar Acquisition I Corp. - Class A*,5,6 | | | 270,438 | |
| | 7,137 | | | Valuence Merger Corp. I - Class A*,5,6 | | | 79,292 | |
| | | | | | | | 11,981,960 | |
| | | | | TOTAL COMMON STOCKS | | | | |
| | | | | (Cost $26,074,589) | | | 26,367,007 | |
| | | | | MASTER LIMITED PARTNERSHIPS — 0.7% | | | | |
| | 5,848 | | | Green Plains Partners LP | | | 87,018 | |
| | 30,711 | | | Holly Energy Partners LP | | | 674,414 | |
| | | | | TOTAL MASTER LIMITED PARTNERSHIPS | | | | |
| | | | | (Cost $774,015) | | | 761,432 | |
| | | | | PREFERRED STOCKS — 0.2% | | | | |
| | | | | REAL ESTATE — 0.2% | | | | |
| | 2,906 | | | Hersha Hospitality Trust - Series C,
6.875%2,7 | | | 71,720 | |
| | 3,805 | | | Hersha Hospitality Trust - Series D,
6.500%2,7 | | | 94,174 | |
| | 2,165 | | | Hersha Hospitality Trust - Series E,
6.500%2,7 | | | 53,562 | |
| | | | | | | | 219,456 | |
| | | | | TOTAL PREFERRED STOCKS | | | | |
| | | | | (Cost $220,890) | | | 219,456 | |
Number
of Contracts | | | | | | |
| | | | | PURCHASED OPTIONS CONTRACTS — 29.7% | | | | |
| | | | | CALL OPTIONS — 13.3% | | | | |
| | | | | S&P 500 Index | | | | |
| | 100 | | | Exercise Price: $4,000.00, Notional Amount: $40,000,000,
Expiration Date: October 20, 2023* | | | 3,048,500 | |
| | 17 | | | Exercise Price: $1,000.00, Notional Amount: $1,700,000,
Expiration Date: December 15, 2023* | | | 5,592,915 | |
| | 166 | | | Exercise Price: $4,000.00, Notional Amount: $66,400,000,
Expiration Date: December 15, 2023* | | | 6,006,710 | |
| | | | | TOTAL CALL OPTIONS | | | | |
| | | | | (Cost $18,464,651) | | | 14,648,125 | |
| | | | | PUT OPTIONS — 16.4% | | | | |
| | | | | Activision Blizzard, Inc. | | | | |
First Trust Multi-Strategy Fund
SCHEDULE OF INVESTMENTS - Continued
As of September 30, 2023
Number
of Contracts | | | | | Value | |
| | | | | PUT OPTIONS (Continued) | | | | |
| | 159 | | | Exercise Price: $85.00, Notional Amount: $1,351,500,
Expiration Date: October 20, 2023* | | $ | 9,699 | |
| | | | | S&P 500 Index | | | | |
| | 100 | | | Exercise Price: $5,000.00, Notional Amount: $50,000,000,
Expiration Date: October 20, 2023* | | | 6,992,500 | |
| | 17 | | | Exercise Price: $2,000.00, Notional Amount: $3,400,000,
Expiration Date: December 15, 2023* | | | 723 | |
| | 166 | | | Exercise Price: $5,000.00, Notional Amount: $83,000,000,
Expiration Date: December 15, 2023* | | | 11,099,590 | |
| | | | | TOTAL PUT OPTIONS | | | | |
| | | | | (Cost $14,372,920) | | | 18,102,512 | |
| | | | | TOTAL PURCHASED OPTIONS CONTRACTS | | | | |
| | | | | (Cost $32,837,571) | | | 32,750,637 | |
Number
of Shares | | | | | | |
| | | | | RIGHTS — 0.0% | | | | |
| | 1,014 | | | ABIOMED, Inc., Expiration Date: December 30, 2029*,5,8 | | | 1,034 | |
| | | | | TOTAL RIGHTS | | | | |
| | | | | (Cost $1,034) | | | 1,034 | |
| | | | | | | | | |
| | | | | UNITS — 0.2% | | | | |
| | | | | SPECIFIED PURPOSE ACQUISITIONS — 0.2% | | | | |
| | 3,293 | | | Aimfinity Investment Corp. I*,5,6 | | | 35,136 | |
| | 20,570 | | | Keen Vision Acquisition Corp.*,5,6 | | | 210,431 | |
| | | | | | | | 245,567 | |
| | | | | TOTAL UNITS | | | | |
| | | | | (Cost $242,763) | | | 245,567 | |
| | | | | WARRANTS — 0.0% | | | | |
| | 6 | | | Haymaker Acquisition Corp. IV, Expiration Date: September 12, 2028*,6 | | | 1 | |
| | 12,274 | | | Inflection Point Acquisition Corp. II, Expiration Date: July 17, 2028*,6 | | | 2,110 | |
| | 12,500 | | | Nabors Energy Transition Corp. II, Expiration Date: September 5, 2028*,6 | | | 2,125 | |
| | | | | TOTAL WARRANTS | | | | |
| | | | | (Cost $0) | | | 4,236 | |
First Trust Multi-Strategy Fund
SCHEDULE OF INVESTMENTS - Continued
As of September 30, 2023
Number
of Shares | | | | | Value | |
| | | | | SHORT-TERM INVESTMENTS — 17.7% | | | | |
| | 19,492,854 | | | Morgan Stanley Institutional Liquidity Fund - Government Portfolio - Institutional Class, 5.27%5,9 | | $ | 19,492,855 | |
| | | | | TOTAL SHORT-TERM INVESTMENTS | | | | |
| | | | | (Cost $19,492,855) | | | 19,492,855 | |
| | | | | TOTAL INVESTMENTS — 104.6% | | | | |
| | | | | (Cost $114,768,482) | | | 115,276,519 | |
| | | | | Liabilities in Excess of Other Assets — (4.6)% | | | (5,089,049 | ) |
| | | | | TOTAL NET ASSETS — 100.0% | | $ | 110,187,470 | |
| | | | | SECURITIES SOLD SHORT — (3.2)% | | | | |
| | | | | COMMON STOCKS — (3.2)% | | | | |
| | | | | ENERGY-ALTERNATE SOURCE — (0.1)% | | | | |
| | (2,368 | ) | | Green Plains, Inc.* | | | (71,277 | ) |
| | | | | | | | | |
| | | | | FOOD-CONFECTIONER — (0.1)% | | | | |
| | (763 | ) | | J M Smucker Co. | | | (93,780 | ) |
| | | | | | | | | |
| | | | | GAS-TRANSPORTATION — (0.1)% | | | | |
| | (3,588 | ) | | Brookfield Infrastructure Corp. - Class A6 | | | (126,800 | ) |
| | | | | | | | | |
| | | | | OIL COMP-EXPLORATION & PRODUCTION — (0.5)% | | | | |
| | (42,281 | ) | | Permian Resources Corp. | | | (590,243 | ) |
| | | | | | | | | |
| | | | | OIL COMP-INTEGRATED — (1.5)% | | | | |
| | (14,182 | ) | | Exxon Mobil Corp. | | | (1,667,519 | ) |
| | | | | | | | | |
| | | | | OIL REFINING & MARKETING — (0.5)% | | | | |
| | (9,677 | ) | | HF Sinclair Corp. | | | (550,912 | ) |
| | | | | | | | | |
| | | | | REITS-SHOPPING CENTERS — (0.4)% | | | | |
| | (21,368 | ) | | Kimco Realty Corp. | | | (375,863 | ) |
| | | | | TOTAL COMMON STOCKS | | | | |
| | | | | (Proceeds $3,487,975) | | | (3,476,394 | ) |
| | | | | TOTAL SECURITIES SOLD SHORT | | | | |
| | | | | (Proceeds $3,487,975) | | $ | (3,476,394 | ) |
Number
of Contracts | | | | | | |
| | | | | WRITTEN OPTIONS CONTRACTS — (5.3)% | | | | |
| | | | | CALL OPTIONS — (3.5)% | | | | |
| | | | | Activision Blizzard, Inc. | | | | |
| | (52 | ) | | Exercise Price: $95.00, Notional Amount: $(494,000),
Expiration Date: November 17, 2023* | | | (312 | ) |
First Trust Multi-Strategy Fund
SCHEDULE OF INVESTMENTS - Continued
As of September 30, 2023
Number
of Contracts | | | | | Value | |
| | | | | CALL OPTIONS (Continued) | | | | |
| | (216 | ) | | Exercise Price: $95.00, Notional Amount: $(2,052,000),
Expiration Date: January 19, 2024* | | $ | (2,052 | ) |
| | | | | NextGen Healthcare, Inc. | | | | |
| | (17 | ) | | Exercise Price: $25.00, Notional Amount: $(42,500),
Expiration Date: January 19, 2024* | | | (128 | ) |
| | (7 | ) | | Exercise Price: $25.00, Notional Amount: $(17,500),
Expiration Date: March 15, 2024* | | | (35 | ) |
| | | | | Reata Pharmaceuticals, Inc. | | | | |
| | (11 | ) | | Exercise Price: $175.00, Notional Amount: $(192,500),
Expiration Date: October 20, 2023* | | | — | |
| | | | | S&P 500 Index | | | | |
| | (100 | ) | | Exercise Price: $5,000.00, Notional Amount: $(50,000,000),
Expiration Date: October 20, 2023* | | | (300 | ) |
| | (17 | ) | | Exercise Price: $2,000.00, Notional Amount: $(3,400,000),
Expiration Date: December 15, 2023* | | | (3,906,855 | ) |
| | (166 | ) | | Exercise Price: $5,000.00, Notional Amount: $(83,000,000),
Expiration Date: December 15, 2023* | | | (12,450 | ) |
| | | | | TOTAL CALL OPTIONS | | | | |
| | | | | (Proceeds $4,259,747) | | | (3,922,132 | ) |
| | | | | | | | | |
| | | | | PUT OPTIONS — (1.8)% | | | | |
| | | | | iShares 20 Plus Year Treasury Bond ETF | | | | |
| | (50 | ) | | Exercise Price: $89.00, Notional Amount: $(445,000),
Expiration Date: October 20, 2023* | | | (8,575 | ) |
| | (240 | ) | | Exercise Price: $90.00, Notional Amount: $(2,160,000),
Expiration Date: October 20, 2023* | | | (54,600 | ) |
| | (100 | ) | | Exercise Price: $93.00, Notional Amount: $(930,000),
Expiration Date: December 15, 2023* | | | (55,000 | ) |
| | (630 | ) | | Exercise Price: $95.00, Notional Amount: $(5,985,000),
Expiration Date: December 15, 2023* | | | (444,150 | ) |
| | | | | S&P 500 Index | | | | |
| | (100 | ) | | Exercise Price: $4,000.00, Notional Amount: $(40,000,000),
Expiration Date: October 20, 2023* | | | (68,500 | ) |
| | (12 | ) | | Exercise Price: $4,400.00, Notional Amount: $(5,280,000),
Expiration Date: October 20, 2023* | | | (141,540 | ) |
| | (8 | ) | | Exercise Price: $4,500.00, Notional Amount: $(3,600,000),
Expiration Date: October 20, 2023* | | | (163,120 | ) |
| | (14 | ) | | Exercise Price: $4,550.00, Notional Amount: $(6,370,000),
Expiration Date: October 20, 2023* | | | (353,640 | ) |
| | (17 | ) | | Exercise Price: $1,000.00, Notional Amount: $(1,700,000),
Expiration Date: December 15, 2023* | | | (51 | ) |
First Trust Multi-Strategy Fund
SCHEDULE OF INVESTMENTS - Continued
As of September 30, 2023
Number
of Contracts | | | | | Value | |
| | | | | PUT OPTIONS (Continued) | | | | |
| | (166 | ) | | Exercise Price: $4,000.00, Notional Amount: $(66,400,000),
Expiration Date: December 15, 2023* | | $ | (660,680 | ) |
| | | | | TOTAL PUT OPTIONS | | | | |
| | | | | (Proceeds $1,101,325) | | | (1,949,856 | ) |
| | | | | TOTAL WRITTEN OPTIONS CONTRACTS | | | | |
| | | | | (Proceeds $5,361,072) | | $ | (5,871,988 | ) |
ETF — Exchange-Traded Fund
LP — Limited Partnership
PLC — Public Limited Company
| * | Non-income producing security. |
| 1 | Security exempt from registration under Rule 144A of the Securities Act of 1933. These securities are restricted and may be resold in transactions exempt from registration normally to qualified institutional buyers. The total value of these securities is $35,353,952, which represents 32.09% of the total net assets of the Fund. |
| 5 | All or a portion of this security is segregated as collateral for securities sold short and written options contracts. The market value of the securities pledged as collateral is $11,325,526, which represents 10.28% of the total net assets of the Fund. |
| 6 | Foreign security denominated in U.S. Dollars. |
| 7 | Perpetual security. Maturity date is not applicable. |
| 8 | Level 3 securities fair valued under procedures established by the Board of Trustees. The total value of these securities is $1,034, which represents 0% of total net assets of the Fund. |
| 9 | The rate is the annualized seven-day yield at period end. |
See accompanying Notes to Financial Statements.
First Trust Multi-Strategy Fund
SUMMARY OF INVESTMENTS
As of September 30, 2023
| Security Type/Sector | Percent of Total
Net Assets |
| Asset-Backed Securities | 0.1% |
| Collateralized Loan Obligations | 32.0% |
| Collateralized Mortgage Obligations | 0.1% |
| Common Stocks | |
| Specified Purpose Acquisitions | 10.9% |
| Entertainment Software | 3.8% |
| Oil Comp-Exploration & Production | 2.0% |
| Medical-Biomedical/Generics | 1.6% |
| Enterprise Software/Service | 1.2% |
| Food-Baking | 0.8% |
| Diversified Manufacturing | 0.7% |
| Reinsurance | 0.6% |
| Electronic Measuring Instruments | 0.5% |
| Hazardous Waste Disposal | 0.4% |
| REITS-Shopping Centers | 0.3% |
| Medical Information Systems | 0.3% |
| Machinery-Pumps | 0.3% |
| Computer Software | 0.2% |
| Distribution/Wholesale | 0.2% |
| Gas-Transportation | 0.1% |
| Oil Comp-Integrated | 0.0% |
| REITS-Hotels | 0.0% |
| Pipelines | 0.0% |
| Total Common Stocks | 23.9% |
| Master Limited Partnerships | 0.7% |
| Preferred Stocks | 0.2% |
| Purchased Options Contracts | 29.7% |
| Rights | 0.0% |
| Units | |
| Specified Purpose Acquisitions | 0.2% |
| Warrants | 0.0% |
| Short-Term Investments | 17.7% |
| Total Investments | 104.6% |
| Liabilities in Excess of Other Assets | (4.6)% |
| Total Net Assets | 100.0% |
Please refer to Schedule of Investments for information on securities sold short and written options contracts.
See accompanying Notes to Financial Statements.
STATEMENTS OF ASSETS AND LIABILITIES
As of September 30, 2023
| | | First Trust Merger Arbitrage Fund | | | First Trust Multi-Strategy Fund | |
| Assets: | | | | | | | | |
| Investments, at cost | | $ | 1,423,734,628 | | | $ | 81,739,158 | |
| Investments in affiliated issuers, at cost | | | 612,390,835 | | | | 191,753 | |
| Purchased options contracts, at cost | | | 449,374 | | | | 32,837,571 | |
| Investments, at value | | $ | 1,436,333,541 | | | $ | 82,447,132 | |
| Investments in affiliated issuers, at value | | | 629,627,051 | | | | 78,750 | |
| Purchased options contracts, at value | | | 544,669 | | | | 32,750,637 | |
| Cash deposited with brokers for securities sold short and written options contracts | | | 199,636,882 | | | | 4,450,364 | |
| Receivables: | | | | | | | | |
| Investment securities sold | | | 70,648,992 | | | | 1,615,703 | |
| Fund shares sold | | | 1,784,391 | | | | 471,749 | |
| Dividends and interest | | | 3,142,892 | | | | 850,181 | |
| Prepaid expenses | | | 136,255 | | | | 26,357 | |
| Total assets | | | 2,341,854,673 | | | | 122,690,873 | |
| Liabilities: | | | | | | | | |
| Securities sold short, proceeds | | $ | 201,849,169 | | | $ | 3,487,975 | |
| Written options contracts, proceeds | | | 126,517 | | | | 5,361,072 | |
| Securities sold short, at value | | $ | 201,787,723 | | | $ | 3,476,394 | |
| Written options contracts, at value | | | 149,903 | | | | 5,871,988 | |
| Payables: | | | | | | | | |
| Investment securities purchased | | | 65,074,882 | | | | 2,987,261 | |
| Fund shares redeemed | | | 1,690,566 | | | | 18,194 | |
| Advisory fees | | | 2,152,793 | | | | 93,816 | |
| Shareholder servicing fees (Note 8) | | | 275,467 | | | | 14,363 | |
| Distribution fees (Note 7) | | | 13,759 | | | | 2,350 | |
| Fund services fees | | | 505,016 | | | | - | |
| Trustees' deferred compensation (Note 3) | | | 55,621 | | | | 10,463 | |
| Auditing fees | | | 16,048 | | | | 15,532 | |
| Trustees' fees and expenses | | | 6,632 | | | | 278 | |
| Shareholder reporting fees | | | 4,326 | | | | 2,551 | |
| Chief Compliance Officer fees | | | 3,261 | | | | 2,208 | |
| Legal fees | | | 833 | | | | 4,575 | |
| Accrued other expenses | | | 9,489 | | | | 3,430 | |
| Total liabilities | | | 271,746,319 | | | | 12,503,403 | |
| Commitments and contingencies (Note 3) | | | | | | | | |
| Net Assets | | $ | 2,070,108,354 | | | $ | 110,187,470 | |
STATEMENTS OF ASSETS AND LIABILITIES - Continued
As of September 30, 2023
| | | First Trust
Merger Arbitrage
Fund | | | First Trust
Multi-Strategy
Fund | |
| Components of Net Assets: | | | | | | | | |
| Paid-in capital (par value of $0.01 per share with an unlimited number of shares authorized) | | $ | 2,001,463,797 | | | $ | 111,126,677 | |
| Total distributable earnings (accumulated deficit) | | | 68,644,557 | | | | (939,207 | ) |
| Net Assets | | $ | 2,070,108,354 | | | $ | 110,187,470 | |
| Maximum Offering Price per Share: | | | | | | | | |
| Class A Shares: | | | | | | | | |
| Net assets applicable to shares outstanding | | $ | 53,504,932 | | | $ | 9,539,401 | |
| Number of shares issued and outstanding | | | 5,006,576 | | | | 404,813 | |
| Redemption price per share* | | $ | 10.69 | | | $ | 23.56 | |
| Maximum sales charge (5.75%, 4.50%, respectively, of offering price)** | | | 0.65 | | | | 1.11 | |
| Maximum offering price to public | | $ | 11.34 | | | $ | 24.67 | |
| Class C Shares:*** | | | | | | | | |
| Net assets applicable to shares outstanding | | $ | - | | | $ | 276,704 | |
| Number of shares issued and outstanding | | | - | | | | 11,488 | |
| Redemption price per share**** | | $ | - | | | $ | 24.09 | |
| Class I Shares: | | | | | | | | |
| Net assets applicable to shares outstanding | | $ | 2,016,603,422 | | | $ | 100,371,365 | |
| Number of shares issued and outstanding | | | 184,693,254 | | | | 4,178,706 | |
| Redemption price per share | | $ | 10.92 | | | $ | 24.02 | |
| * | A Contingent Deferred Sales Charge ("CDSC") of 1.00% and 0.50%, respectively, for the Merger Arbitrage Fund and Multi-Strategy Fund may be imposed on certain redemptions of shares within 12 months of the date of purchase to the extent a finder's fee was paid on the sale of such shares. |
| ** | There are no sales charges on investments of $1 million or more for Merger Arbitrage Fund and $250,000 or more for the Multi-Strategy Fund. On sales of $25,000 or more, the sales charge will be reduced for both Funds. |
| *** | Commenced public offering on November 14, 2022. |
| **** | A CDSC of 1.00% for the Multi-Strategy Fund may be imposed on any redemptions of shares within 12 months of the date of purchase. |
See accompanying Notes to Financial Statements.
STATEMENTS OF OPERATIONS
For the Year Ended September 30, 2023
| | | First Trust Merger Arbitrage Fund | | | First Trust Multi-Strategy Fund | |
| Investment income: | | | | | | | | |
| Dividends | | $ | 17,339,607 | | | $ | 110,883 | |
| Interest | | | 18,562,134 | | | | 1,214,264 | |
| Total investment income | | | 35,901,741 | | | | 1,325,147 | |
| Expenses: | | | | | | | | |
| Advisory fees | | | 29,881,876 | | | | 505,226 | |
| Shareholder servicing fees - Class A (Note 8) | | | 113,537 | | | | 5,749 | |
| Shareholder servicing fees - Class C (Note 8) | | | - | | | | 149 | |
| Shareholder servicing fees - Class I (Note 8) | | | 1,893,522 | | | | 37,750 | |
| Distribution fees - Class A (Note 7) | | | 188,966 | | | | 9,687 | |
| Distribution fees - Class C (Note 7) | | | - | | | | 999 | |
| Dividends on securities sold short | | | 6,930,971 | | | | 50,301 | |
| Fund services fees | | | 2,455,157 | | | | 39,369 | |
| Shareholder reporting fees | | | 174,265 | | | | 41,601 | |
| Registration fees | | | 173,541 | | | | 43,552 | |
| Miscellaneous | | | 50,935 | | | | 5,985 | |
| Trustees' fees and expenses | | | 47,894 | | | | 1,920 | |
| Legal fees | | | 40,178 | | | | 24,889 | |
| Insurance fees | | | 32,642 | | | | 422 | |
| Chief Compliance Officer fees | | | 18,406 | | | | 26,183 | |
| Auditing fees | | | 16,545 | | | | 16,079 | |
| Interest expense | | | - | | | | 86 | |
| Total expenses | | | 42,018,435 | | | | 809,947 | |
| Fees paid indirectly (Note 3) | | | - | | | | (95,810 | ) |
| Net expenses | | | 42,018,435 | | | | 714,137 | |
| Net investment income (loss) | | | (6,116,694 | ) | | | 611,010 | |
| | | | | | | | | |
| Realized and Unrealized Gain (Loss) | | | | | | | | |
| Net realized gain (loss) on: | | | | | | | | |
| Investments | | | 57,188,712 | | | | (1,052,633 | ) |
| Investments in affiliated issuers | | | 6,308,647 | | | | - | |
| Purchased options contracts | | | (2,381,629 | ) | | | 8,277,537 | |
| Securities sold short | | | 7,127,974 | | | | 3,410 | |
| Written options contracts | | | 964,162 | | | | (6,469,364 | ) |
| Net realized gain (loss) | | | 69,207,866 | | | | 758,950 | |
| Net change in unrealized appreciation/depreciation on: | | | | | | | | |
| Investments | | | 27,968,456 | | | | 1,780,749 | |
| Investments in affiliated issuers | | | 17,089,950 | | | | 44,499 | |
| Purchased options contracts | | | 95,295 | | | | 1,091,563 | |
| Securities sold short | | | (21,208,181 | ) | | | (27,949 | ) |
| Written options contracts | | | (260,061 | ) | | | (1,585,463 | ) |
| Net change in unrealized appreciation/depreciation | | | 23,685,459 | | | | 1,303,399 | |
| Net realized and unrealized gain (loss) | | | 92,893,325 | | | | 2,062,349 | |
| Net Increase (Decrease) in Net Assets from Operations | | $ | 86,776,631 | | | $ | 2,673,359 | |
See accompanying Notes to Financial Statements.
First Trust Merger Arbitrage Fund
STATEMENTS OF CHANGES IN NET ASSETS
| | | For the
Year Ended
September 30, 2023 | | | For the
Year Ended
September 30, 2022 | |
| Increase (Decrease) in Net Assets from: | | | | | | | | |
| Operations: | | | | | | | | |
| Net investment income (loss) | | $ | (6,116,694 | ) | | $ | (7,271,686 | ) |
| Net realized gain (loss) on investments, affiliated issuers, purchased options contracts, securities sold short and written options contracts | | | 69,207,866 | | | | 10,361,478 | |
| Net change in unrealized appreciation/depreciation on investments, affiliated issuers, purchased options contracts, securities sold short and written options contracts | | | 23,685,459 | | | | 10,648,494 | |
| Net increase (decrease) in net assets resulting from operations | | | 86,776,631 | | | | 13,738,286 | |
| | | | | | | | | |
| Distributions to Shareholders: | | | | | | | | |
| Distributions: | | | | | | | | |
| Class A | | | (652,633 | ) | | | (4,692,018 | ) |
| Class I | | | (20,127,121 | ) | | | (49,749,615 | ) |
| Total distributions to shareholders | | | (20,779,754 | ) | | | (54,441,633 | ) |
| | | | | | | | | |
| Capital Transactions: | | | | | | | | |
| Net proceeds from shares sold: | | | | | | | | |
| Class A | | | 35,024,444 | | | | 51,062,971 | |
| Class I | | | 1,256,230,520 | | | | 1,842,927,021 | |
| Reinvestment of distributions: | | | | | | | | |
| Class A | | | 637,869 | | | | 4,596,214 | |
| Class I | | | 18,674,296 | | | | 41,128,488 | |
| Cost of shares redeemed: | | | | | | | | |
| Class A1 | | | (64,408,013 | ) | | | (27,589,979 | ) |
| Class I2 | | | (1,417,379,505 | ) | | | (379,096,312 | ) |
| Net increase (decrease) in net assets from capital transactions | | | (171,220,389 | ) | | | 1,533,028,403 | |
| Total increase (decrease) in net assets | | | (105,223,512 | ) | | | 1,492,325,056 | |
| | | | | | | | | |
| Net Assets: | | | | | | | | |
| Beginning of period | | | 2,175,331,866 | | | | 683,006,810 | |
| End of period | | $ | 2,070,108,354 | | | $ | 2,175,331,866 | |
First Trust Merger Arbitrage Fund
STATEMENTS OF CHANGES IN NET ASSETS - Continued
| | | For the
Year Ended
September 30, 2023 | | | For the
Year Ended
September 30, 2022 | |
| Capital Share Transactions: | | | | | | | | |
| Shares sold: | | | | | | | | |
| Class A | | | 3,333,414 | | | | 4,878,329 | |
| Class I | | | 117,089,250 | | | | 174,102,221 | |
| Shares reinvested: | | | | | | | | |
| Class A | | | 60,924 | | | | 444,079 | |
| Class I | | | 1,750,168 | | | | 3,905,839 | |
| Shares redeemed: | | | | | | | | |
| Class A | | | (6,105,682 | ) | | | (2,645,420 | ) |
| Class I | | | (131,670,160 | ) | | | (35,680,305 | ) |
| Net increase (decrease) in capital share transactions | | | (15,542,086 | ) | | | 145,004,743 | |
| 1 | Net of redemption fee proceeds of $3,551 and $2,508, respectively. |
| 2 | Net of redemption fee proceeds of $111,245 and $68,332, respectively. |
See accompanying Notes to Financial Statements.
First Trust Multi-Strategy Fund
STATEMENTS OF CHANGES IN NET ASSETS
| | | For the
Year Ended
September 30, 2023 | | | For the
Year Ended
September 30, 2022 | |
| Increase (Decrease) in Net Assets from: | | | | | | | | |
| Operations: | | | | | | | | |
| Net investment income (loss) | | $ | 611,010 | | | $ | 529,135 | |
| Net realized gain (loss) on investments, purchased options contracts, securities sold short and written options contracts | | | 758,950 | | | | (865,463 | ) |
| Net change in unrealized appreciation/depreciation on investments, affiliated issuers, purchased options contracts, securities sold short and written options contracts | | | 1,303,399 | | | | (1,293,937 | ) |
| Net increase (decrease) in net assets resulting from operations | | | 2,673,359 | | | | (1,630,265 | ) |
| | | | | | | | | |
| Distributions to Shareholders: | | | | | | | | |
| Distributions: | | | | | | | | |
| Class A | | | (82,376 | ) | | | (17,718 | ) |
| Class C1 | | | (1,863 | ) | | | - | |
| Class I | | | (910,983 | ) | | | (358,557 | ) |
| From return of capital: | | | | | | | | |
| Class A | | | (139,592 | ) | | | (43,133 | ) |
| Class C | | | (3,474 | ) | | | - | |
| Class I | | | (1,393,838 | ) | | | (1,026,523 | ) |
| Total distributions to shareholders | | | (2,532,126 | ) | | | (1,445,931 | ) |
| | | | | | | | | |
| Capital Transactions: | | | | | | | | |
| Net proceeds from shares sold: | | | | | | | | |
| Class A | | | 9,049,820 | | | | 103,364 | |
| Class C1 | | | 271,780 | | | | - | |
| Class I | | | 104,899,128 | | | | 6,809,918 | |
| Reinvestment of distributions: | | | | | | | | |
| Class A | | | 217,639 | | | | 54,601 | |
| Class C1 | | | 5,293 | | | | - | |
| Class I | | | 2,118,657 | | | | 1,261,837 | |
| Cost of shares redeemed: | | | | | | | | |
| Class A | | | (800,619 | ) | | | (864,645 | ) |
| Class C1 | | | (231 | ) | | | - | |
| Class I | | | (25,079,247 | ) | | | (22,860,846 | ) |
| Net increase (decrease) in net assets from capital transactions | | | 90,682,220 | | | | (15,495,771 | ) |
| Total increase (decrease) in net assets | | | 90,823,453 | | | | (18,571,967 | ) |
| | | | | | | | | |
| Net Assets: | | | | | | | | |
| Beginning of period | | | 19,364,017 | | | | 37,935,984 | |
| End of period | | $ | 110,187,470 | | | $ | 19,364,017 | |
First Trust Multi-Strategy Fund
STATEMENTS OF CHANGES IN NET ASSETS - Continued
| | | For the
Year Ended
September 30, 2023 | | | For the
Year Ended
September 30, 2022 | |
| Capital Share Transactions: | | | | | | | | |
| Shares sold: | | | | | | | | |
| Class A | | | 384,114 | | | | 4,186 | |
| Class C1 | | | 11,278 | | | | - | |
| Class I | | | 4,364,731 | | | | 262,415 | |
| Shares reinvested: | | | | | | | | |
| Class A | | | 9,248 | | | | 2,224 | |
| Class C1 | | | 220 | | | | - | |
| Class I | | | 88,470 | | | | 50,313 | |
| Shares redeemed: | | | | | | | | |
| Class A | | | (34,212 | ) | | | (34,265 | ) |
| Class C1 | | | (10 | ) | | | - | |
| Class I | | | (1,047,578 | ) | | | (906,617 | ) |
| Net increase (decrease) in capital share transactions | | | 3,776,261 | | | | (621,744 | ) |
| 1 | Commenced public offering on November 14, 2022. |
See accompanying Notes to Financial Statements.
First Trust Merger Arbitrage Fund
STATEMENT OF CASH FLOWS
For the Year Ended September 30, 2023
| Increase (Decrease) in Cash: | | | |
| Cash flows provided by (used for) operating activities: | | | |
| Net increase (decrease) in net assets resulting from operations | | $ | 86,776,631 | |
| Adjustments to reconcile net increase (decrease) in net assets from operations to net cash provided by (used for) operating activities: | | | | |
| Purchases of long-term investments | | | (7,299,373,977 | ) |
| Sales of long-term investments | | | 7,753,619,363 | |
| Return of capital dividends received | | | 5,728,568 | |
| Proceeds from securities sold short | | | 691,349,550 | |
| Cover short securities | | | (586,055,938 | ) |
| Proceeds from written options | | | 1,031,401 | |
| Closed written options | | | (69,592 | ) |
| Purchases/Sales of short-term investments, net | | | (181,457,481 | ) |
| (Increase) Decrease in Assets: | | | | |
| Investment securities sold receivable | | | (69,526,877 | ) |
| Dividends and interest receivables | | | (2,060,676 | ) |
| Prepaid expenses and other assets | | | (35,784 | ) |
| Increase (Decrease) in Liabilities: | | | | |
| Investment securities purchased payable | | | (12,945,439 | ) |
| Advisory fees payable | | | (10,091 | ) |
| Accrued expenses | | | 178,174 | |
| Net realized (gain)/loss | | | (68,559,485 | ) |
| Net change in unrealized appreciation/depreciation | | | (23,685,459 | ) |
| Net cash provided by (used for) operating activities | | | 294,902,888 | |
| | | | | |
| Cash flows provided by (used for) financing activities: | | | | |
| Proceeds from shares sold | | | 1,305,560,880 | |
| Cost of shares redeemed | | | (1,484,974,921 | ) |
| Dividends paid to shareholders, net of reinvestments | | | (1,467,589 | ) |
| Net cash provided by (used for) financing activities | | | (180,881,630 | ) |
| | | | | |
| Net increase (decrease) in cash | | | 114,021,258 | |
| | | | | |
| Cash and cash equivalents | | | | |
| Beginning cash balance | | | - | |
| Beginning cash held at brokers | | | 85,615,624 | |
| Total beginning cash and cash equivalents | | | 85,615,624 | |
| | | | | |
| Ending cash balance | | | - | |
| Ending cash held at brokers | | | 199,636,882 | |
| Total ending cash and cash equivalents | | $ | 199,636,882 | |
| Non cash financing activities not included herein consist of $19,312,165 of reinvested dividends. | | | | |
See accompanying Notes to Financial Statements.
First Trust Multi-Strategy Fund
STATEMENT OF CASH FLOWS
For the Year Ended September 30, 2023
| Increase (Decrease) in Cash: | | | |
| Cash flows provided by (used for) operating activities: | | | |
| Net increase (decrease) in net assets resulting from operations | | $ | 2,673,359 | |
| Adjustments to reconcile net increase (decrease) in net assets from operations to net cash provided by (used for) operating activities: | | | | |
| Purchases of long-term investments | | | (266,340,723 | ) |
| Sales of long-term investments | | | 203,182,924 | |
| Return of capital dividends received | | | 338,219 | |
| Proceeds from securities sold short | | | 7,745,064 | |
| Cover short securities | | | (4,606,116 | ) |
| Proceeds from written options | | | 95,986,172 | |
| Closed written options | | | (106,129,931 | ) |
| Purchases/Sales of short-term investments, net | | | (15,001,545 | ) |
| (Increase) Decrease in Assets: | | | | |
| Investment securities sold receivable | | | (1,413,319 | ) |
| Dividends and interest receivables | | | (812,360 | ) |
| Prepaid expenses and other assets | | | (15,733 | ) |
| Increase (Decrease) in Liabilities: | | | | |
| Cash due to custodian payable | | | (453,036 | ) |
| Investment securities purchased payable | | | 2,646,721 | |
| Advisory fees payable | | | 73,663 | |
| Accrued expenses | | | 22,357 | |
| Net amortization on investments | | | (29,437 | ) |
| Net realized (gain)/loss | | | (722,987 | ) |
| Net change in unrealized appreciation/depreciation | | | (1,303,399 | ) |
| Net cash provided by (used for) operating activities | | | (84,160,107 | ) |
| | | | | |
| Cash flows provided by (used for) financing activities: | | | | |
| Proceeds from shares sold | | | 113,748,979 | |
| Cost of shares redeemed | | | (25,995,341 | ) |
| Dividends paid to shareholders, net of reinvestments | | | (190,537 | ) |
| Net cash provided by (used for) financing activities | | | 87,563,101 | |
| | | | | |
| Net increase (decrease) in cash | | | 3,402,994 | |
| | | | | |
| Cash and cash equivalents | | | | |
| Beginning cash balance | | | - | |
| Beginning cash held at brokers | | | 1,047,370 | |
| Total beginning cash and cash equivalents | | | 1,047,370 | |
| | | | | |
| Ending cash balance | | | - | |
| Ending cash held at brokers | | | 4,450,364 | |
| Total ending cash and cash equivalents | | $ | 4,450,364 | |
| Supplemental disclosure of interest expense paid | | $ | 86 | |
| Non cash financing activities not included herein consist of $2,341,589 of reinvested dividends. | | | | |
See accompanying Notes to Financial Statements.
First Trust Merger Arbitrage Fund
FINANCIAL HIGHLIGHTS
Class A
Per share operating performance.
For a capital share outstanding throughout each period.
| | | For the Year Ended September 30, | |
| | | 2023 | | | 2022 | | | 2021 | | | 2020 | | | 2019 | |
| Net asset value, beginning of period | | $ | 10.40 | | | $ | 11.16 | | | $ | 10.33 | | | $ | 10.86 | | | $ | 10.51 | |
| Income from Investment Operations: | | | | | | | | | | | | | | | | | | | | |
| Net investment income (loss)1 | | | (0.06 | ) | | | (0.09 | ) | | | (0.04 | ) | | | (0.14 | ) | | | - | 2 |
| Net realized and unrealized gain (loss) | | | 0.43 | | | | 0.18 | | | | 0.96 | | | | 0.19 | | | | 0.55 | |
| Total from investment operations | | | 0.37 | | | | 0.09 | | | | 0.92 | | | | 0.05 | | | | 0.55 | |
| | | | | | | | | | | | | | | | | | | | | |
| Less Distributions: | | | | | | | | | | | | | | | | | | | | |
| From net investment income | | | - | | | | (0.27 | ) | | | - | | | | - | | | | (0.10 | ) |
| From net realized gain | | | (0.08 | ) | | | (0.58 | ) | | | (0.09 | ) | | | (0.58 | ) | | | (0.10 | ) |
| Total distributions | | | (0.08 | ) | | | (0.85 | ) | | | (0.09 | ) | | | (0.58 | ) | | | (0.20 | ) |
| | | | | | | | | | | | | | | | | | | | | |
| Redemption Fee Proceeds1 | | | - | 2 | | | - | 2 | | | - | 2 | | | - | 2 | | | - | 2 |
| | | | | | | | | | | | | | | | | | | | | |
| Net asset value, end of period | | $ | 10.69 | | | $ | 10.40 | | | $ | 11.16 | | | $ | 10.33 | | | $ | 10.86 | |
| | | | | | | | | | | | | | | | | | | | | |
| Total return3 | | | 3.58 | % | | | 0.91 | % | | | 8.95 | % | | | 0.47 | % | | | 5.26 | % |
| | | | | | | | | | | | | | | | | | | | | |
| Ratios and Supplemental Data: | | | | | | | | | | | | | | | | | | | | |
| Net assets, end of period (in thousands) | | $ | 53,505 | | | $ | 80,293 | | | $ | 56,252 | | | $ | 43,870 | | | $ | 58,887 | |
| | | | | | | | | | | | | | | | | | | | | |
| Ratio of expenses to average net assets (including dividends and interest on securities sold short and interest expense): | | | | | | | | | | | | | | | | | | | | |
| Before fees waived and expenses absorbed/recovered4 | | | 2.07 | % | | | 2.19 | % | | | 2.08 | % | | | 2.40 | % | | | 2.78 | % |
| After fees waived and expenses absorbed/recovered4 | | | 2.07 | % | | | 2.19 | % | | | 2.08 | % | | | 2.40 | % | | | 2.78 | % |
| Ratio of net investment income (loss) to average net assets (including dividends and interest on securities sold short and interest expense): | | | | | | | | | | | | | | | | | | | | |
| Before fees waived and expenses absorbed/recovered | | | (0.57 | )% | | | (0.86 | )% | | | (0.38 | )% | | | (1.34 | )% | | | 0.03 | % |
| After fees waived and expenses absorbed/recovered | | | (0.57 | )% | | | (0.86 | )% | | | (0.38 | )% | | | (1.34 | )% | | | 0.03 | % |
| | | | | | | | | | | | | | | | | | | | | |
| Portfolio turnover rate | | | 367 | % | | | 294 | % | | | 459 | % | | | 644 | % | | | 716 | % |
| 1 | Based on average daily shares outstanding for the period. |
| 2 | Amount represents less than $0.01 per share. |
| 3 | Total returns would have been higher/lower had expenses not been recovered/waived and absorbed by the Advisor. Returns shown include Rule 12b-1 fees of up to 0.25% and do not reflect the deduction of taxes that a shareholder would pay on Fund distributions or the redemption of Fund shares. Returns shown do not include payment of sales load of 5.75% of offering price which is reduced on sales of $25,000 or more. Returns do not include payment of Contingent Deferred Sales Charge (“CDSC”) of 1.00% on certain redemptions of Class A shares made within 12 months of purchase. If the sales charge was included total returns would be lower. |
| 4 | If dividends and interest on securities sold short and interest expense had been excluded, the expense ratios would have been lowered by 0.29% for the year ended September 30, 2023. For the years ended September 30, 2022, 2021, 2020, and 2019, the ratios would have been lowered by 0.39%, 0.23%, 0.55%, and 0.95%, respectively. |
See accompanying Notes to Financial Statements.
First Trust Merger Arbitrage Fund
FINANCIAL HIGHLIGHTS
Class I
Per share operating performance.
For a capital share outstanding throughout each period.
| | | For the Year Ended September 30, | |
| | | 2023 | | | 2022 | | | 2021 | | | 2020 | | | 2019 | |
| Net asset value, beginning of period | | $ | 10.61 | | | $ | 11.36 | | | $ | 10.48 | | | $ | 10.97 | | | $ | 10.62 | |
| Income from Investment Operations: | | | | | | | | | | | | | | | | | | | | |
| Net investment income (loss)1 | | | (0.03 | ) | | | (0.06 | ) | | | (0.01 | ) | | | (0.11 | ) | | | 0.04 | |
| Net realized and unrealized gain (loss) | | | 0.43 | | | | 0.19 | | | | 0.98 | | | | 0.20 | | | | 0.54 | |
| Total from investment operations | | | 0.40 | | | | 0.13 | | | | 0.97 | | | | 0.09 | | | | 0.58 | |
| | | | | | | | | | | | | | | | | | | | | |
| Less Distributions: | | | | | | | | | | | | | | | | | | | | |
| From net investment income | | | (0.01 | ) | | | (0.30 | ) | | | - | | | | - | | | | (0.13 | ) |
| From net realized gain | | | (0.08 | ) | | | (0.58 | ) | | | (0.09 | ) | | | (0.58 | ) | | | (0.10 | ) |
| Total distributions | | | (0.09 | ) | | | (0.88 | ) | | | (0.09 | ) | | | (0.58 | ) | | | (0.23 | ) |
| | | | | | | | | | | | | | | | | | | | | |
| Redemption Fee Proceeds1 | | | - | 2 | | | - | 2 | | | - | 2 | | | - | 2 | | | - | 2 |
| | | | | | | | | | | | | | | | | | | | | |
| Net asset value, end of period | | $ | 10.92 | | | $ | 10.61 | | | $ | 11.36 | | | $ | 10.48 | | | $ | 10.97 | |
| | | | | | | | | | | | | | | | | | | | | |
| Total return3 | | | 3.82 | % | | | 1.27 | % | | | 9.30 | % | | | 0.85 | % | | | 5.52 | % |
| | | | | | | | | | | | | | | | | | | | | |
| Ratios and Supplemental Data: | | | | | | | | | | | | | | | | | | | | |
| Net assets, end of period (in thousands) | | $ | 2,016,603 | | | $ | 2,095,039 | | | $ | 626,755 | | | $ | 485,864 | | | $ | 576,943 | |
| | | | | | | | | | | | | | | | | | | | | |
| Ratio of expenses to average net assets (including dividends and interest on securities sold short and interest expense): | | | | | | | | | | | | | | | | | | | | |
| Before fees waived and expenses absorbed/recovered4 | | | 1.75 | % | | | 1.88 | % | | | 1.77 | % | | | 2.07 | % | | | 2.47 | % |
| After fees waived and expenses absorbed/recovered4 | | | 1.75 | % | | | 1.88 | % | | | 1.77 | % | | | 2.07 | % | | | 2.47 | % |
| Ratio of net investment income (loss) to average net assets (including dividends and interest on securities sold short and interest expense): | | | | | | | | | | | | | | | | | | | | |
| Before fees waived and expenses absorbed/recovered | | | (0.25 | )% | | | (0.55 | )% | | | (0.07 | )% | | | (1.01 | )% | | | 0.34 | % |
| After fees waived and expenses absorbed/recovered | | | (0.25 | )% | | | (0.55 | )% | | | (0.07 | )% | | | (1.01 | )% | | | 0.34 | % |
| | | | | | | | | | | | | | | | | | | | | |
| Portfolio turnover rate | | | 367 | % | | | 294 | % | | | 459 | % | | | 644 | % | | | 716 | % |
| 1 | Based on average daily shares outstanding for the period. |
| 2 | Amount represents less than $0.01 per share. |
| 3 | Total returns would have been higher/lower had expenses not been recovered/waived and absorbed by the Advisor. Returns shown do not reflect the deduction of taxes that a shareholder would pay on Fund distributions or the redemption of Fund shares. |
| 4 | If dividends and interest on securities sold short and interest expense had been excluded, the expense ratios would have been lowered by 0.29% for the year ended September 30, 2023. For the years ended September 30, 2022, 2021, 2020, and 2019, the ratios would have been lowered by 0.39%, 0.23%, 0.55%, and 0.95%, respectively. |
See accompanying Notes to Financial Statements.
First Trust Multi-Strategy Fund
FINANCIAL HIGHLIGHTS
Class A
Per share operating performance.
For a capital share outstanding throughout each period.
| | | For the Year Ended September 30, | |
| | | 2023 | | | 2022 | | | 2021 | | | 2020 | | | 2019 | |
| Net asset value, beginning of period | | $ | 23.20 | | | $ | 25.84 | | | $ | 23.90 | | | $ | 27.08 | | | $ | 25.62 | |
| Income from Investment Operations: | | | | | | | | | | | | | | | | | | | | |
| Net investment income (loss)1 | | | 0.27 | | | | 0.36 | | | | 0.86 | | | | 0.35 | | | | 0.41 | |
| Net realized and unrealized gain (loss) | | | 1.28 | | | | (1.82 | ) | | | 2.34 | | | | (0.98 | ) | | | 1.72 | |
| Net increase from payments by affiliates | | | - | | | | - | | | | - | 2,3 | | | - | | | | - | |
| Total from investment operations | | | 1.55 | | | | (1.46 | ) | | | 3.20 | | | | (0.63 | ) | | | 2.13 | |
| | | | | | | | | | | | | | | | | | | | | |
| Less Distributions: | | | | | | | | | | | | | | | | | | | | |
| From net investment income | | | (0.54 | ) | | | (0.24 | ) | | | (0.89 | ) | | | (0.58 | ) | | | (0.67 | ) |
| From net realized gain | | | - | | | | - | | | | - | | | | (1.62 | ) | | | - | |
| From return of capital | | | (0.65 | ) | | | (0.94 | ) | | | (0.37 | ) | | | (0.35 | ) | | | - | |
| Total distributions | | | (1.19 | ) | | | (1.18 | ) | | | (1.26 | ) | | | (2.55 | ) | | | (0.67 | ) |
| | | | | | | | | | | | | | | | | | | | | |
| Net asset value, end of period | | $ | 23.56 | | | $ | 23.20 | | | $ | 25.84 | | | $ | 23.90 | | | $ | 27.08 | |
| | | | | | | | | | | | | | | | | | | | | |
| Total return4 | | | 6.83 | % | | | (5.82 | )% | | | 13.53 | % | | | (2.45 | )% | | | 8.44 | % |
| | | | | | | | | | | | | | | | | | | | | |
| Ratios and Supplemental Data: | | | | | | | | | | | | | | | | | | | | |
| Net assets, end of period (in thousands) | | $ | 9,539 | | | $ | 1,059 | | | $ | 1,900 | | | $ | 2,460 | | | $ | 5,554 | |
| | | | | | | | | | | | | | | | | | | | | |
| Ratio of expenses to average net assets (including dividends and interest on securities sold short and interest expense): | | | | | | | | | | | | | | | | | | | | |
| Before fees waived and expenses absorbed/recovered5 | | | 2.18 | % | | | 2.33 | % | | | 2.29 | % | | | 2.19 | % | | | 2.49 | % |
| After fees waived and expenses absorbed/recovered5 | | | 1.96 | % | | | 2.02 | % | | | 2.05 | % | | | 2.10 | % | | | 2.33 | % |
| Ratio of net investment income (loss) to average net assets (including dividends and interest on securities sold short and interest expense): | | | | | | | | | | | | | | | | | | | | |
| Before fees waived and expenses absorbed/recovered | | | 0.93 | % | | | 1.12 | % | | | 3.12 | % | | | 1.30 | % | | | 1.42 | % |
| After fees waived and expenses absorbed/recovered | | | 1.15 | % | | | 1.43 | % | | | 3.36 | % | | | 1.39 | % | | | 1.58 | % |
| | | | | | | | | | | | | | | | | | | | | |
| Portfolio turnover rate | | | 254 | % | | | 190 | % | | | 170 | % | | | 223 | % | | | 286 | % |
| 1 | Based on average shares outstanding for the period. |
| 2 | Affiliate reimbursed the Fund $440 for errors during processing. The reimbursement had no impact to the Fund's performance. |
| 3 | Amount represents less than $0.01 per share. |
| 4 | Total returns would have been higher/lower had expenses not been recovered/waived and absorbed by the Advisor. Returns shown include Rule 12b-1 fees of up to 0.25% and do not reflect the deduction of taxes that a shareholder would pay on Fund distributions or the redemption of Fund shares. Returns shown do not include payment of sales load of 4.50% of offering price which is reduced on sales of $25,000 or more. Prior to August 22, 2022, returns shown did not include payment of sales load of 5.00% of offering price which was reduced on sales of $50,000 or more. Returns do not include payment of Contingent Deferred Sales Charge (“CDSC”) of 0.50% on certain redemptions of Class A shares made within 12 months of purchase. If the sales charge was included total returns would be lower. |
| 5 | If dividends and interest on securities sold short and interest expense had been excluded, the expense ratios would have been lowered by 0.12% for the year ended September 30, 2023. For the years ended September 30, 2022, 2021 ,2020, and 2019 the ratios would have been lowered by 0.17%, 0.27%, 0.31%, and 0.50%, respectively. |
See accompanying Notes to Financial Statements.
First Trust Multi-Strategy Fund
FINANCIAL HIGHLIGHTS
Class C
Per share operating performance.
For a capital share outstanding throughout each period.
| | | For the Period
November 14, 2022*
through
September 30, 2023 | |
| Net asset value, beginning of period | | $ | 23.78 | |
| Income from Investment Operations: | | | | |
| Net investment income (loss)1 | | | 0.08 | |
| Net realized and unrealized gain (loss) | | | 1.26 | |
| Total from investment operations | | | 1.34 | |
| | | | | |
| Less Distributions: | | | | |
| From net investment income | | | (0.48 | ) |
| From return of capital | | | (0.55 | ) |
| Total distributions | | | (1.03 | ) |
| | | | | |
| Net asset value, end of period | | $ | 24.09 | |
| | | | | |
| Total return2 | | | 5.75 | %3 |
| | | | | |
| Ratios and Supplemental Data: | | | | |
| Net assets, end of period (in thousands) | | $ | 277 | |
| | | | | |
| Ratio of expenses to average net assets (including dividends on securities sold short): | | | | |
| Before fees waived and expenses absorbed/recovered4 | | | 2.92 | %5 |
| After fees waived and expenses absorbed/recovered4 | | | 2.70 | %5 |
| Ratio of net investment income (loss) to average net assets (including dividends on securities sold short): | | | | |
| Before fees waived and expenses absorbed/recovered | | | 0.16 | %5 |
| After fees waived and expenses absorbed/recovered | | | 0.38 | %5 |
| | | | | |
| Portfolio turnover rate | | | 254 | %3 |
| * | Commencement of public offering. |
| 1 | Based on average daily shares outstanding for the period. |
| 2 | Total returns would have been higher/lower had expenses not been recovered/waived and absorbed by the Advisor. Returns shown include Rule 12b-1 fees of up to 1.00% and do not reflect the deduction of taxes that a shareholder would pay on Fund distributions or the redemption of Fund shares. Returns do not include payment of Contingent Deferred Sales Charge (“CDSC”) of 1.00% on any redemptions of Class C shares made within 12 months of purchase. If the sales charge was included total returns would be lower. |
| 4 | If dividends on securities sold short had been excluded, the expense ratios would have been lowered by 0.11% for the year ended September 30, 2023. |
See accompanying Notes to Financial Statements.
First Trust Multi-Strategy Fund
FINANCIAL HIGHLIGHTS
Class I
Per share operating performance.
For a capital share outstanding throughout each period.
| | | For the Year Ended September 30, | |
| | | 2023 | | | 2022 | | | 2021 | | | 2020 | | | 2019 | |
| Net asset value, beginning of period | | $ | 23.68 | | | $ | 26.36 | | | $ | 24.35 | | | $ | 27.57 | | | $ | 26.17 | |
| Income from Investment Operations: | | | | | | | | | | | | | | | | | | | | |
| Net investment income (loss)1 | | | 0.36 | | | | 0.44 | | | | 0.93 | | | | 0.42 | | | | 0.50 | |
| Net realized and unrealized gain (loss) | | | 1.30 | | | | (1.86 | ) | | | 2.41 | | | | (1.01 | ) | | | 1.74 | |
| Net increase from payments by affiliates | | | - | | | | - | | | | - | 2,3 | | | - | | | | - | |
| Total from investment operations | | | 1.66 | | | | (1.42 | ) | | | 3.34 | | | | (0.59 | ) | | | 2.24 | |
| | | | | | | | | | | | | | | | | | | | | |
| Less Distributions: | | | | | | | | | | | | | | | | | | | | |
| From net investment income | | | (0.59 | ) | | | (0.26 | ) | | | (0.94 | ) | | | (0.64 | ) | | | (0.84 | ) |
| From net realized gain | | | - | | | | - | | | | - | | | | (1.62 | ) | | | - | |
| From return of capital | | | (0.73 | ) | | | (1.00 | ) | | | (0.39 | ) | | | (0.37 | ) | | | - | |
| Total distributions | | | (1.32 | ) | | | (1.26 | ) | | | (1.33 | ) | | | (2.63 | ) | | | (0.84 | ) |
| | | | | | | | | | | | | | | | | | | | | |
| Net asset value, end of period | | $ | 24.02 | | | $ | 23.68 | | | $ | 26.36 | | | $ | 24.35 | | | $ | 27.57 | |
| | | | | | | | | | | | | | | | | | | | | |
| Total return4 | | | 7.19 | % | | | (5.54 | )% | | | 13.84 | % | | | (2.23 | )% | | | 8.80 | % |
| | | | | | | | | | | | | | | | | | | | | |
| Ratios and Supplemental Data: | | | | | | | | | | | | | | | | | | | | |
| Net assets, end of period (in thousands) | | $ | 100,371 | | | $ | 18,305 | | | $ | 36,036 | | | $ | 45,706 | | | $ | 47,554 | |
| | | | | | | | | | | | | | | | | | | | | |
| Ratio of expenses to average net assets (including dividends and interest on securities sold short and interest expense): | | | | | | | | | | | | | | | | | | | | |
| Before fees waived and expenses absorbed/recovered5 | | | 1.89 | % | | | 2.01 | % | | | 2.06 | % | | | 1.92 | % | | | 2.17 | % |
| After fees waived and expenses absorbed/recovered5 | | | 1.67 | % | | | 1.71 | % | | | 1.82 | % | | | 1.83 | % | | | 2.01 | % |
| Ratio of net investment income (loss) to average net assets (including dividends and interest on securities sold short and interest expense): | | | | | | | | | | | | | | | | | | | | |
| Before fees waived and expenses absorbed/recovered | | | 1.26 | % | | | 1.43 | % | | | 3.35 | % | | | 1.57 | % | | | 1.74 | % |
| After fees waived and expenses absorbed/recovered | | | 1.48 | % | | | 1.74 | % | | | 3.59 | % | | | 1.66 | % | | | 1.90 | % |
| | | | | | | | | | | | | | | | | | | | | |
| Portfolio turnover rate | | | 254 | % | | | 190 | % | | | 170 | % | | | 223 | % | | | 286 | % |
| 1 | Based on average shares outstanding for the period. |
| 2 | Affiliate reimbursed the Fund $440 for errors during processing. The reimbursement had no impact to the Fund's performance. |
| 3 | Amount represents less than $0.01 per share. |
| 4 | Total returns would have been higher/lower had expenses not been recovered/waived and absorbed by the Advisor. Returns shown do not reflect the deduction of taxes that a shareholder would pay on Fund distributions or the redemption of Fund shares. |
| 5 | If dividends and interest on securities sold short and interest expense had been excluded, the expense ratios would have been lowered by 0.12% for the year ended September 30, 2023. For the periods ended 2022, 2021, 2020 and September 30, 2019, the ratios would have been lowered by 0.17%, 0.27%, 0.31%, and 0.50%, respectively. |
See accompanying Notes to Financial Statements.
First Trust Capital Management Funds
NOTES TO FINANCIAL STATEMENTS
September 30, 2023
Note 1 – Organization
First Trust Merger Arbitrage Fund (the ‘‘Merger Arbitrage Fund’’) and First Trust Multi-Strategy Fund (the “Multi-Strategy Fund”) (each a “Fund” and collectively the ‘‘Funds’’) are organized as a diversified series of Investment Managers Series Trust II, a Delaware statutory trust (the “Trust”) which is registered as an open-end management investment company under the Investment Company Act of 1940, as amended (the “1940 Act”).
The Merger Arbitrage Fund seeks returns that are largely uncorrelated with the returns of the general stock market and capital appreciation. The Fund commenced investment operations on October 1, 2015 with Class A and Class I shares. Prior to that date, its only activity was the receipt of a $1,000 investment from principals of the Fund’s advisor and a transfer of 307,251 newly issued shares of the Fund’s Class I in exchange for the net assets of Highland Capital Management Institutional Fund, LLC, a Delaware limited liability company (the “Company”) valued at $3,073,511. This exchange was nontaxable. The primary assets received by the Fund were cash, interest receivable and securities of the Company with a fair value of $2,249,946 (identified cost of investments transferred were $2,271,450), totaling $3,073,511. For financial reporting purposes, assets received and shares issued by the Fund were recorded at fair value; however, the cost basis of the investments received from the Company was carried forward to align ongoing reporting of the Fund’s realized and unrealized gains and losses with amounts distributable to shareholders for tax purposes.
The Multi-Strategy Fund seeks to achieve long-term capital appreciation by pursuing positive absolute returns across market cycles. In pursuing its objective, the Fund seeks to generate attractive long-term returns with low sensitivity to traditional equity and fixed-income indices. The Fund commenced investment operations on December 16, 2016 with Class A and Class I shares. Prior to that date, the Fund acquired the assets and assumed the liabilities of Vivaldi Orinda Macro Opportunities Fund (the “Predecessor Fund”), a series of Advisors Series Trust. The reorganization was accomplished by the following tax-free exchange in which each shareholder of the Predecessor Fund received the same aggregate share net asset value in the corresponding classes as noted below:
| | | Shares Issued | | | Net Assets | |
| Class A | | | 1,058,074 | | | $ | 28,004,864 | |
| Class I | | | 3,174,754 | | | $ | 85,334,375 | |
The net unrealized appreciation of investments transferred was $3,090,238 as of the date of the acquisition.
On November 14, 2022, the Fund commenced public offerings of Class C shares.
The shares of each class of each Fund represent an interest in the same portfolio of investments of each particular Fund and have equal rights as to voting, redemptions, dividends and liquidation, subject to the approval of the Trustees. Income, expenses (other than expenses attributable to a specific class) and realized and unrealized gains and losses on investments are allocated to each class of shares in proportion to their relative net assets. Shareholders of a class that bears distribution and service expenses under the terms of a distribution plan have exclusive voting rights to that distribution plan.
Each Fund is an investment company and accordingly follows the investment company accounting and reporting guidance of the Financial Accounting Standards Board (“FASB”) Accounting Standard Codification Topic 946 “Financial Services—Investment Companies.”
Note 2 – Accounting Policies
The following is a summary of the significant accounting policies consistently followed by the Funds in the preparation of their financial statements. The preparation of financial statements in conformity with generally accepted accounting principles in the United States of America (“GAAP”) requires management to make estimates and assumptions that affect the reported amounts and disclosures in the financial statements. Actual results could differ from these estimates.
First Trust Capital Management Funds
NOTES TO FINANCIAL STATEMENTS - Continued
September 30, 2023
(a) Valuation of Investments
The Funds value equity securities at the last reported sale price on the principal exchange or in the principal over the counter (“OTC”) market in which such securities are traded, as of the close of regular trading on the NYSE on the day the securities are being valued or, if the last-quoted sales price is not readily available, the securities will be valued at the last bid or the mean between the last available bid and ask price. Securities traded on the NASDAQ are valued at the NASDAQ Official Closing Price (“NOCP”). Investments in open-end investment companies are valued at the daily closing net asset value of the respective investment company. Options are valued at the mean between the last available bid and ask prices used. Debt securities are valued by utilizing a price supplied by independent pricing service providers. The independent pricing service providers may use various valuation methodologies including matrix pricing and other analytical pricing models as well as market transactions and dealer quotations. These models generally consider such factors as yields or prices of bonds of comparable quality, type of issue, coupon, maturity, ratings and general market conditions. If a price is not readily available for a portfolio security, the security will be valued at fair value (the amount which the Funds might reasonably expect to receive for the securities were upon its current sale). The Board of Trustees has designated the Advisor as the Funds’ valuation designee (the “Valuation Designee”) to make all fair value determinations with respect to the Funds’ portfolio investments, subject to the Board’s oversight. As the Valuation Designee, the Advisor has adopted and implemented policies and procedures to be followed when the Funds must utilize fair value pricing. Prior to September 8, 2022, securities were valued at fair value as determined in good faith by the Funds’ advisor, subject to review and approval by the Valuation Committee, pursuant to procedures adopted by the Board of Trustees. The actions of the Valuation Committee were subsequently reviewed by the Board at its next regularly scheduled board meeting. The Valuation Committee met as needed. The Valuation Committee was comprised of all the Trustees, but action may have been taken by any one of the Trustees.
(b) Foreign Currency Translation
The Funds’ records are maintained in U.S. dollars. The value of securities, currencies and other assets and liabilities denominated in currencies other than U.S. dollars are translated into U.S. dollars based upon foreign exchange rates prevailing at the end of the reporting period. The currencies are translated into U.S. dollars by using the exchange rates quoted as of 4:00 PM Eastern Standard Time. Purchases and sales of investment securities, income and expenses are translated on the respective dates of such transactions.
The Funds do not isolate that portion of their net realized and unrealized gains and losses on investments resulting from changes in foreign exchange rates from the impact arising from changes in market prices. Such fluctuations are included with net realized and unrealized gain or loss from investments and foreign currency.
Net realized foreign currency transaction gains and losses arise from sales of foreign currencies, currency gains or losses realized between the trade and settlement dates on securities transactions, and the differences between the amounts of dividends, interest, and foreign withholding taxes recorded on the Funds’ books and the U.S. dollar equivalent of the amounts actually received or paid. Net unrealized foreign currency translation gains and losses arise from changes in the value of assets and liabilities, other than investments in securities, resulting from changes in the exchange rates.
(c) Short Sales
Short sales are transactions in which the Funds sell a security they do not own in anticipation of a decline in the value of that security. To complete such a transaction, the Funds must borrow the security to make delivery to the buyer. The Funds then are obligated to replace the security borrowed by purchasing the security at market price at the time of replacement. The price at such time may be more or less than the price at which the security was sold by the Funds. When a security is sold short, a decrease in the value of the security will be recognized as a gain and an increase in the value of the security will be recognized as a loss, which is potentially limitless. Until the security is replaced, the Funds are required to pay the lender amounts equal to dividend or interest that accrue during the period of the loan which is recorded as an expense. To borrow the security, the Funds also may be required to pay a premium or an interest fee, which are recorded as interest expense. Cash or securities are segregated for the broker to meet the necessary margin requirements. The Funds are subject to the risk that they may not always be able to close out a short position at a particular time or at an acceptable price.
First Trust Capital Management Funds
NOTES TO FINANCIAL STATEMENTS - Continued
September 30, 2023
(d) Options
The Funds may write or purchase options contracts primarily to enhance the Funds’ returns or reduce volatility. In addition, the Funds may utilize options in an attempt to generate gains from option premiums or to reduce overall portfolio risk. When a Fund writes or purchases an option, an amount equal to the premium received or paid by a Fund is recorded as a liability or an asset and is subsequently adjusted to the current market value of the option written or purchased. Premiums received or paid from writing or purchasing options which expire unexercised are treated by a Fund on the expiration date as realized gains or losses. The difference between the premium and the amount paid or received on effecting a closing purchase or sale transaction, including brokerage commissions, is also treated as a realized gain or loss. If an option is exercised, the premium paid or received is added to the cost of the purchase or proceeds from the sale in determining whether a Fund has realized a gain or a loss on investment transactions. A Fund, as a writer of an option, may have no control over whether the underlying securities may be sold (call) or purchased (put) and as a result bears the market risk of an unfavorable change in the price of the security underlying the written option.
(e) Rights
The Funds may invest in rights (including those acquired in units or attached to other securities) that entitle (but do not obligate) the holder to buy equity securities at a specific price for a specific period of time but will do so only if such equity securities are deemed appropriate by the Advisor. Rights have a shorter duration and are issued by a company to existing stockholders to provide those holders the right to purchase additional shares of stock at a later date. Rights do not have voting rights, do not earn dividends, and do not entitle the holder to any rights with respect to the assets of the company that has issued them. Rights do not represent ownership of the underlying companies but only the right to purchase shares of those companies at a specified price on or before a specified exercise date. Rights tend to be more volatile than the underlying stock, and if at a right’s expiration date the stock is trading at a price below the price set in the rights, the right will expire worthless. Conversely, if at the expiration date the stock is trading at a price higher than the price set in the right, a Fund can acquire the stock at a price below its market value. The prices of rights do not necessarily parallel the prices of the underlying securities. An investment in rights may be considered speculative.
(f) Investment Transactions, Investment Income and Expenses
Investment transactions are accounted for on the trade date. Realized gains and losses on investments are determined on the identified cost basis. Dividend income is recorded net of applicable withholding taxes on the ex-dividend date and interest income is recorded on an accrual basis. Withholding taxes on foreign dividends, if applicable, are paid (a portion of which may be reclaimable) or provided for in accordance with the applicable country’s tax rules and rates and are disclosed on the Statements of Operations. Withholding tax reclaims are filed in certain countries to recover a portion of the amounts previously withheld. The Fund records a reclaim receivable based on a number of factors, including a jurisdiction’s legal obligation to pay reclaims as well as payment history and market convention. Discounts or premiums on debt securities are accreted or amortized to interest income over the lives of the respective securities using the effective interest method. Income and expenses of the Funds are allocated on a pro rata basis to each class of shares’ relative net assets, except for distribution and service fees which are unique to each class of shares. Expenses incurred by the Trust with respect to more than one Fund are allocated in proportion to the net assets of each Fund except where allocation of direct expenses to each Fund or an alternative allocation method can be more appropriately made.
First Trust Capital Management Funds
NOTES TO FINANCIAL STATEMENTS - Continued
September 30, 2023
(g) Federal Income Taxes
Each Fund intends to comply with the requirements of Subchapter M of the Internal Revenue Code applicable to regulated investment companies and to distribute substantially all of its net investment income and any net realized gains to its shareholders. Therefore, no provision is made for federal income or excise taxes. Due to the timing of dividend distributions and the differences in accounting for income and realized gains and losses for financial statement and federal income tax purposes, the fiscal year in which amounts are distributed may differ from the year in which the income and realized gains and losses are recorded by the Funds.
Accounting for Uncertainty in Income Taxes (the “Income Tax Statement”) requires an evaluation of tax positions taken (or expected to be taken) in the course of preparing a Fund’s tax returns to determine whether these positions meet a “more-likely-than-not” standard that, based on the technical merits, have a more than fifty percent likelihood of being sustained by a taxing authority upon examination. A tax position that meets the “more-likely-than-not” recognition threshold is measured to determine the amount of benefit to recognize in the financial statements. The Funds recognize interest and penalties, if any, related to unrecognized tax benefits as income tax expense on the Statements of Operations.
The Income Tax Statement requires management of the Funds to analyze tax positions taken in the prior three open tax years, if any, and tax positions expected to be taken in the Funds’ current tax year, as defined by the IRS statute of limitations for all major jurisdictions, including federal tax authorities and certain state tax authorities. As of September 30, 2023, and during the prior three open tax years, the Funds did not have a liability for any unrecognized tax benefits. The Funds have no examination in progress and are not aware of any tax positions for which it is reasonably possible that the total amounts of unrecognized tax benefits will significantly change in the next twelve months.
(h) Distributions to Shareholders
The Funds will make distributions of net investment income per the table below and net capital gains, if any, at least annually. The Multi-Strategy Fund seeks to make distributions monthly based on a pre-determined rate. A portion of the distributions made by the Multi-Strategy Fund may be treated as return of capital for tax purposes. Shareholders who receive a payment of a distribution consisting of a return of capital may be under the impression that they are receiving net profits when, in fact, they are not. Shareholders should not assume that the source of a distribution from the Multi-Strategy Fund is net profit. The Multi-Strategy Fund may make additional payments of dividends or distributions if it deems it desirable at any other time during the year. Distributions to shareholders are recorded on the ex-dividend date. The amount and timing of distributions are determined in accordance with federal income tax regulations, which may differ from GAAP.
| | Distribution Frequency of
Net Investment Income |
| Merger Arbitrage Fund | Annually |
| Multi-Strategy Fund | Monthly |
First Trust Capital Management Funds
NOTES TO FINANCIAL STATEMENTS - Continued
September 30, 2023
The character of distributions made during the year from net investment income or net realized gains may differ from the characterization for federal income tax purposes due to differences in the recognition of income, expense and gain (loss) items for financial statement and tax purposes.
(i) Illiquid Securities
Pursuant to Rule 22e-4 under the 1940 Act, the Funds have adopted a Liquidity Risk Management Program (“LRMP”) that requires, among other things, that the Funds limit their illiquid investments that are assets to no more than 15% of net assets. An illiquid investment is any security which may not reasonably be expected to be sold or disposed of in current market conditions in seven calendar days or less without the sale or disposition significantly changing the market value of the investment. If the Advisor, at any time, determines that the value of illiquid securities held by a Fund exceeds 15% of its net asset value, the Advisor will take such steps as it considers appropriate to reduce them as soon as reasonably practicable in accordance with the Funds’ written LRMP.
Note 3 – Investment Advisory and Other Agreements
The Trust, on behalf of the Funds, entered into an Investment Advisory Agreement (the “Agreement”) with First Trust Capital Management L.P. (the “Advisor”). Under the terms of the Agreement, the Funds pay a monthly investment advisory fee to the Advisor at the following annual rates based on the average daily net assets of the Funds:
| Merger Arbitrage Fund | 1.25% |
| Multi-Strategy Fund | 1.20% |
The Advisor has engaged Glenmede Investment Management, LP and Palmer Square Capital Management, LLC, (each, a "Sub-Advisor" and together, the “Sub-Advisors”) to manage certain assets of the Multi-Strategy Fund and pays the Sub-Advisors from its advisory fees. Prior to July 24, 2023, Angel Oak Capital Advisors, LLC served as a Sub-Advisor to the Multi-Strategy Fund.
The Advisor has contractually agreed to waive its fee and/or pay for expenses of the Funds to ensure that the annual Funds’ operating expenses (excluding any taxes, leverage interest, acquired fund fees and expenses (as determined in accordance with Form N-1A), dividend and interest expense on short sales, brokerage commissions, expenses incurred in connection with any merger or reorganization and extraordinary expenses such as litigation expenses) do not exceed the following levels:
| | Annual Expense Limit | Annual Expense Limit | Annual Expense Limit |
| | Class A Shares† | Class C Shares† | Class I Shares† |
| Merger Arbitrage Fund | 1.85% | - | 1.55% |
| Multi-Strategy Fund | 1.85% | 2.60% | 1.55% |
| † | The limit on annual operating expenses is calculated based on each Fund’s average daily net assets. |
This agreement is in effect until January 31, 2024 for each Fund. These agreements may be terminated before that date only by the Trust’s Board of Trustees.
The Advisor is permitted to seek reimbursement from the Funds, subject to certain limitations, of fees waived or payments made to the Funds for a period ending three full fiscal years after the date of the waiver or payment. This reimbursement may be requested from the Funds if the reimbursement will not cause the Funds’ annual expense ratio to exceed the lesser of (a) the expense limitation amount in effect at the time such fees were waived or payments made, or (b) the expense limitation amount in effect at the time of the reimbursement.
First Trust Capital Management Funds
NOTES TO FINANCIAL STATEMENTS - Continued
September 30, 2023
UMB Fund Services, Inc. (“UMBFS”) serves as the Funds’ fund accountant, transfer agent and co-administrator; and Mutual Fund Administration, LLC (“MFAC”) serves as the Funds’ other co-administrator. UMB Bank, n.a., an affiliate of UMBFS, serves as the Funds’ custodian. The Funds’ allocated fees incurred for fund accounting, fund administration, transfer agency and custody services for the year ended September 30, 2023, are reported as “Fund services fees” on the Statements of Operations. UMBFS, UMB Bank, n.a., and MFAC have voluntarily waived their fees that they would otherwise be paid, and/or to assume expenses in the amount of $95,810 for the Multi-Strategy Fund for the year ended September 30, 2023. This amount is shown as a reduction of expenses, “Fees paid indirectly”, on the Statements of Operations.
First Trust Portfolios L.P. serves as the Funds’ distributor (the “Distributor”) and is an affiliate of the Adviser. The Distributor does not receive compensation from the Funds for its distribution services; the Advisor pays the Distributor a fee for its distribution-related services.
The Funds have a fee arrangement with their custodian, UMB Bank, n.a., which provides for custody fees to be reduced by earning credits based on cash balances left on deposit with the custodian. For the year ended September 30, 2023, there were no fees reduced by earning credits.
Certain trustees and officers of the Trust are employees of UMBFS or MFAC. The Funds do not compensate trustees and officers affiliated with the Funds’ co-administrators. For the year ended September 30, 2023, the Funds’ allocated fees incurred to Trustees who are not affiliated with the Funds’ co-administrators are reported on the Statements of Operations.
The Funds’ Board of Trustees has adopted a Deferred Compensation Plan (the “Plan”) for the Independent Trustees that enables Trustees to elect to receive payment in cash or the option to select various fund(s) in the Trust in which their deferred accounts shall be deemed to be invested. If a trustee elects to defer payment, the Plan provides for the creation of a deferred payment account. The Funds’ liability for these amounts is adjusted for market value changes in the invested fund(s) and remains a liability of the Funds until distributed in accordance with the Plan. The Trustees Deferred compensation liability under the Plan constitutes a general unsecured obligation of each Fund and is disclosed on the Statements of Assets and Liabilities. Contributions made under the plan and the change in unrealized appreciation/depreciation and income are included in the Trustees’ fees and expenses on the Statements of Operations.
Dziura Compliance Consulting, LLC provides Chief Compliance Officer (“CCO”) services to the Trust. The Funds’ allocated fees incurred for CCO services for the year ended September 30, 2023, are reported on the Statements of Operations.
The Funds are permitted to purchase or sell securities from or to certain affiliated funds under specified conditions outlined in procedures adopted by the Board. The procedures have been designed to ensure that any purchase or sale of securities by a Fund from or to another fund or portfolio that is or could be considered an affiliate by virtue of having a common investment adviser (or affiliated investment advisers), common trustees and/or common officers complies with Rule 17a-7 of the 1940 Act. Further, as defined under these procedures, each transaction is affected at the current market price to minimize trading costs, where permissible. For the year ended September 30, 2023, the Funds did not engage in purchases and sales of securities pursuant to Rule 17a-7 of the 1940 Act.
First Trust Capital Management Funds
NOTES TO FINANCIAL STATEMENTS - Continued
September 30, 2023
Note 4 – Federal Income Taxes
At September 30, 2023, the cost of investments on a tax basis and gross unrealized appreciation (depreciation) on investments for federal income tax purposes were as follows:
| | | Merger Arbitrage Fund | | | Multi-Strategy Fund | |
| Cost of investments | | $ | 1,853,588,324 | | | $ | 106,116,660 | |
| | | | | | | | | |
| Gross unrealized appreciation | | $ | 20,508,961 | | | $ | 5,198,137 | |
| Gross unrealized depreciation | | | (9,529,650 | ) | | | (5,386,591 | ) |
| Net unrealized appreciation (depreciation) on investments | | $ | 10,979,311 | | | $ | (188,454 | ) |
The difference between cost amounts for financial statement and federal income tax purposes is due primarily to timing differences in recognizing certain gains and losses in security transactions.
GAAP requires that certain components of net assets be reclassified between financial and tax reporting. These reclassifications have no effect on net assets or net asset value per share. For the year ended September 30, 2023, permanent differences in book and tax accounting have been reclassified to paid-in capital and total distributable earnings (accumulated deficit) as follows:
| | | Increase (Decrease) | |
| Fund | | Paid-in Capital | | | Total Distributable Earnings
(Accumulated Deficit) | |
| Merger Arbitrage Fund | | $ | 688 | | | $ | (688 | ) |
| Multi-Strategy Fund | | | (33,532 | ) | | | 33,532 | |
As of September 30, 2023, the components of accumulated earnings (deficit) on a tax basis were as follows:
| | | Merger Arbitrage Fund | | | Multi-Strategy Fund | |
| Undistributed ordinary income | | $ | 57,720,867 | | | $ | - | |
| Undistributed long-term capital gains | | | - | | | | - | |
| Accumulated earnings | | | 57,720,867 | | | | - | |
| | | | | | | | | |
| Accumulated capital and other losses | | | - | | | | (740,290 | ) |
| Unrealized appreciation (depreciation) on investments | | | 10,979,311 | | | | (188,454 | ) |
| Unrealized deferred compensation | | | (55,621 | ) | | | (10,463 | ) |
| Total accumulated earnings (accumulated deficit) | | $ | 68,644,557 | | | $ | (939,207 | ) |
First Trust Capital Management Funds
NOTES TO FINANCIAL STATEMENTS - Continued
September 30, 2023
The tax character of distributions paid during the years ended September 30, 2023 and 2022 was as follows:
| | | Merger Arbitrage Fund | | | Multi-Strategy Fund | |
| Distribution paid from: | | 2023 | | | 2022 | | | 2023 | | | 2022 | |
| Ordinary income | | $ | 19,702,459 | | | $ | 48,501,516 | | | $ | 995,222 | | | $ | 376,275 | |
| Net long-term capital gains | | | 1,077,295 | | | | 5,940,117 | | | | - | | | | - | |
| Return of Capital | | | - | | | | - | | | | 1,536,904 | | | | 1,069,656 | |
| Total taxable distributions | | $ | 20,779,754 | | | $ | 54,441,633 | | | $ | 2,532,126 | | | $ | 1,445,931 | |
As of September 30, 2023, the Multi-Strategy Fund had net capital loss carryovers as follows:
| Not subject to expiration: | | Short-term | | | Long-term | | | Total | |
| Multi-Strategy Fund | | $ | - | | | $ | 740,290 | | | $ | 740,290 | |
During the year ended September 30, 2023, the Fund utilized $0 of capital loss carryovers.
As of September 30, 2023, the Multi-Strategy had qualified post October losses of $0.
Note 5 – Redemption Fee
The Merger Arbitrage Fund may impose a redemption fee of 1.00% of the total redemption amount on all shares redeemed within 30 days of purchase. For the years ended September 30, 2023 and 2022, the Fund received $114,796 and $70,840, respectively, in redemption fees.
Note 6 – Investment Transactions
For the year ended September 30, 2023, purchases and sales of investments, excluding short-term investments, were as follows:
| | | Purchases | | | Sales | | | Proceeds from Securities Sold Short | | | Cover Short Securities | |
| Merger Arbitrage Fund | | $ | 7,295,819,101 | | | $ | 7,752,895,489 | | | $ | 691,349,550 | | | $ | 586,055,938 | |
| Multi-Strategy Fund | | | 105,609,209 | | | | 53,637,292 | | | | 7,745,064 | | | | 4,606,116 | |
Note 7 – Distribution Plan
The Trust, on behalf of the Funds, has adopted a Distribution Plan (the “Plan”) pursuant to Rule 12b-1 under the 1940 Act that allows the Funds to pay distribution fees for the sale and distribution of their shares. With respect to Class A and Class C, the Plan provides for the payment of distribution fees at the annual rate of up to 0.25% and 1.00%, respectively, of average daily net assets. Class I does not pay any distribution fees.
For the year ended September 30, 2023, distribution fees incurred are disclosed on the Statements of Operations.
Note 8 – Shareholder Servicing Plan
The Trust, on behalf of the Merger Arbitrage Fund and Multi-Strategy Fund, has adopted a Shareholder Servicing Plan to pay a fee at an annual rate of up to 0.15% of average daily net assets of Class A and Class C shares and 0.10% of average daily net assets of Class I shares serviced by shareholder servicing agents who provide administrative and support services to their customers.
First Trust Capital Management Funds
NOTES TO FINANCIAL STATEMENTS - Continued
September 30, 2023
For the year ended September 30, 2023, shareholder servicing fees incurred are disclosed on the Statements of Operations.
Note 9 – Indemnifications
In the normal course of business, the Funds enter into contracts that contain a variety of representations which provide general indemnifications. The Funds’ maximum exposure under these arrangements is unknown, as this would involve future claims that may be made against the Funds that have not yet occurred. However, the Funds expect the risk of loss to be remote from any such claims.
Note 10 – Fair Value Measurements and Disclosure
Fair Value Measurements and Disclosures defines fair value, establishes a framework for measuring fair value in accordance with GAAP, and expands disclosure about fair value measurements. It also provides guidance on determining when there has been a significant decrease in the volume and level of activity for an asset or a liability, when a transaction is not orderly, and how that information must be incorporated into a fair value measurement.
Under Fair Value Measurements and Disclosures, various inputs are used in determining the value of the Funds’ investments. These inputs are summarized into three broad Levels as described below:
| · | Level 1 – Unadjusted quoted prices in active markets for identical assets or liabilities that the Funds have the ability to access. |
| · | Level 2 – Observable inputs other than quoted prices included in Level 1 that are observable for the asset or liability, either directly or indirectly. These inputs may include quoted prices for the identical instrument on an inactive market, prices for similar instruments, interest rates, prepayment speeds, credit risk, yield curves, default rates and similar data. |
| · | Level 3 – Unobservable inputs for the asset or liability, to the extent relevant observable inputs are not available, representing the Funds’ own assumptions about the assumptions a market participant would use in valuing the asset or liability, and would be based on the best information available. |
The availability of observable inputs can vary from security to security and is affected by a wide variety of factors, including for example, the type of security, whether the security is new and not yet established in the marketplace, the liquidity of markets, and other characteristics particular to the security. To the extent that valuation is based on models or inputs that are less observable or unobservable in the market, the determination of fair value requires more judgment. Accordingly, the degree of judgment exercised in determining fair value is greatest for instruments categorized in Level 3.
The inputs to measure fair value may fall into different Levels of the fair value hierarchy. In such cases, for disclosure purposes, the Level in the fair value hierarchy within which the fair value measurement falls in its entirety is determined based on the lowest Level input that is significant to the fair value measurement in its entirety.
The inputs or methodology used for valuing securities are not an indication of the risk associated with investing in those securities. The following is a summary of the inputs used, as of September 30, 2023, in valuing the Funds’ assets and liabilities carried at fair value:
First Trust Capital Management Funds
NOTES TO FINANCIAL STATEMENTS - Continued
September 30, 2023
| Merger Arbitrage | | Level 1 | | | Level 2 | | | Level 3 | | | Total | |
| Assets | | | | | | | | | | | | | | | | |
| Investments | | | | | | | | | | | | | | | | |
| Common Stocks* | | $ | 1,651,539,265 | | | $ | - | | | $ | - | | | $ | 1,651,539,265 | |
| Master Limited Partnerships | | | 47,690,804 | | | | - | | | | - | | | | 47,690,804 | |
| Preferred Stocks* | | | 17,464,061 | | | | - | | | | - | | | | 17,464,061 | |
| Rights | | | - | | | | - | | | | 293,496 | | | | 293,496 | |
| Units | | | 15,795,007 | | | | - | | | | - | | | | 15,795,007 | |
| Short-Term Investments | | | 332,962,672 | | | | - | | | | - | | | | 332,962,672 | |
| Warrants | | | 215,287 | | | | - | | | | - | | | | 215,287 | |
| Total Investments | | | 2,065,667,096 | | | | - | | | | 293,496 | | | | 2,065,960,592 | |
| Purchased Options Contracts | | | 544,669 | | | | - | | | | - | | | | 544,669 | |
| Total Investments and Options | | $ | 2,066,211,765 | | | $ | - | | | $ | 293,496 | | | $ | 2,066,505,261 | |
| | | | | | | | | | | | | | | | | |
| Liabilities | | | | | | | | | | | | | | | | |
| Securities Sold Short | | | | | | | | | | | | | | | | |
| Common Stocks* | | $ | 201,787,723 | | | $ | - | | | $ | - | | | $ | 201,787,723 | |
| Total Securities Sold Short | | | 201,787,723 | | | | - | | | | - | | | | 201,787,723 | |
| Written Options Contracts | | | 149,903 | | | | - | | | | - | | | | 149,903 | |
| Total Securities Sold Short and Options | | $ | 201,937,626 | | | $ | - | | | $ | - | | | $ | 201,937,626 | |
| Multi-Strategy Fund | | Level 1 | | | Level 2 | | | Level 3 | | | Total | |
| Assets | | | | | | | | | | | | | | | | |
| Investments | | | | | | | | | | | | | | | | |
| Asset-Backed Securities | | $ | - | | | $ | 82,966 | | | $ | - | | | $ | 82,966 | |
| Collateralized Loan Obligations | | | - | | | | 35,270,986 | | | | - | | | | 35,270,986 | |
| Collateralized Mortgage Obligations | | | - | | | | 80,343 | | | | - | | | | 80,343 | |
| Common Stocks* | | | 26,367,007 | | | | - | | | | - | | | | 26,367,007 | |
| Master Limited Partnerships | | | 761,432 | | | | - | | | | - | | | | 761,432 | |
| Preferred Stocks* | | | 219,456 | | | | - | | | | - | | | | 219,456 | |
| Rights | | | - | | | | - | | | | 1,034 | | | | 1,034 | |
| Units | | | 245,567 | | | | - | | | | - | | | | 245,567 | |
| Short-Term Investments | | | 19,492,855 | | | | - | | | | - | | | | 19,492,855 | |
| Warrants | | | 4,236 | | | | - | | | | - | | | | 4,236 | |
| Total Investments | | | 47,090,553 | | | | 35,434,295 | | | | 1,034 | | | | 82,525,882 | |
| Purchased Options Contracts | | | 32,750,637 | | | | - | | | | - | | | | 32,750,637 | |
| Total Investments and Options | | $ | 79,841,190 | | | $ | 35,434,295 | | | $ | 1,034 | | | $ | 115,276,519 | |
| Liabilities | | | | | | | | | | | | | | | | |
| Securities Sold Short | | | | | | | | | | | | | | | | |
| Common Stocks* | | $ | 3,476,394 | | | $ | - | | | $ | - | | | $ | 3,476,394 | |
| Total Securities Sold Short | | | 3,476,394 | | | | - | | | | - | | | | 3,476,394 | |
| Written Options Contracts | | | 5,871,953 | | | | 35 | | | | - | | | | 5,871,988 | |
| Total Securities Sold Short and Options | | $ | 9,348,347 | | | $ | 35 | | | $ | - | | | $ | 9,348,382 | |
| * | All common stocks and preferred stocks held in the Funds are Level 1. For a detailed break-out of common stocks and preferred stocks by major industry classification, please refer to the Schedule of Investments. |
First Trust Capital Management Funds
NOTES TO FINANCIAL STATEMENTS - Continued
September 30, 2023
The following is a reconciliation of assets in which significant unobservable inputs (Level 3) were used in determining value:
| Merger Arbitrage Fund |
| | | Rights | |
| Balance as of September 30, 2022 | | $ | - | |
| Transfers into Level 3 during the period | | | - | |
| Transfers out of Level 3 during the period | | | - | |
| Total gains or losses for the period | | | | |
| Included in earnings (or changes in net assets) | | | - | |
| Included in other comprehensive income | | | - | |
| Purchases, sales, and principal paydowns | | | | |
| Net purchases | | | 293,496 | |
| Net sales | | | - | |
| Principal paydown | | | - | |
| Balance as of September 30, 2023 | | $ | 293,496 | |
| Change in unrealized gains or losses for the period included in earnings (or changes in net assets) for assets held at the end of the reporting period | | $ | - | |
| Multi-Strategy Fund |
| | | Rights | |
| Balance as of September 30, 2022 | | $ | - | |
| Transfers into Level 3 during the period | | | - | |
| Transfers out of Level 3 during the period | | | - | |
| Total gains or losses for the period | | | | |
| Included in earnings (or changes in net assets) | | | - | |
| Included in other comprehensive income | | | - | |
| Purchases, sales, and principal paydowns | | | | |
| Net purchases | | | 1,034 | |
| Net sales | | | - | |
| Principal paydown | | | - | |
| Balance as of September 30, 2023 | | | 1,034 | |
| Change in unrealized gains or losses for the period included in earnings (or changes in net assets) for assets held at the end of the reporting period | | $ | - | |
First Trust Capital Management Funds
NOTES TO FINANCIAL STATEMENTS - Continued
September 30, 2023
The following table presents additional quantitative information about valuation methodologies and inputs used for investments that are measured at fair value and categorized within Level 3 as of September 30, 2023:
| Fund | | Asset Class | | Fair Value at September 30, 2023 | | | Valuation Technique(s) | | Unobservable Input | | Range of Input | | | Weighted Average of Input | | Impact to Valuation from an Increase in Input (1) |
| Merger Arbitrage Fund | | Rights | | $ | 293,496 | | | Asset Approach | | Expected Remaining Distributions | | $ | 1.02 | | | N/A | | Increase |
| Multi-Strategy Fund | | Rights | | $ | 1,034 | | | Asset Approach | | Expected Remaining Distributions | | $ | 1.02 | | | N/A | | Increase |
| (1) | This column represents the directional change in the fair value of the Level 3 investments that would result from an increase to the corresponding unobservable input. A decrease to the unobservable input would have the opposite effect. |
Note 11 – Derivative and Hedging Disclosure
Derivatives and Hedging requires enhanced disclosures about the Funds’ derivative and hedging activities, including how such activities are accounted for and their effects on the Funds’ financial position, performance and cash flows. The Funds invested in options contracts during the year ended September 30, 2023.
The effects of these derivative instruments on the Funds’ financial position and financial performance as reflected on the Statements of Assets and Liabilities and Statements of Operations are presented in the tables below. The fair values of derivative instruments as of September 30, 2023, by risk category are as follows:
| | | Merger Arbitrage Fund |
| | | Asset Derivatives | | Liability Derivatives |
| Derivatives not designated as hedging instruments | | Statement of Asset
and Liabilities
Location | | Value | | | Statement of Asset
and Liabilities
Location | | Value | |
| Equity contracts | | Purchased options
contracts, at value | | $ | 544,669 | | | Written options
contracts, at value | | $ | 149,903 | |
| | | Multi-Strategy Fund |
| | | Asset Derivatives | | Liability Derivatives |
| Derivatives not designated as hedging instruments | | Statement of Asset
and Liabilities
Location | | Value | | | Statement of Asset
and Liabilities
Location | | Value | |
| Equity contracts | | Purchased options
contracts, at value | | $ | 32,750,637 | | | Written options
contracts, at value | | $ | 5,871,988 | |
The effects of derivative instruments on the Statements of Operations for the year ended September 30, 2023, are as follows:
First Trust Capital Management Funds
NOTES TO FINANCIAL STATEMENTS - Continued
September 30, 2023
| Merger Arbitrage Fund |
| Amount of Realized Gain or (Loss) on Derivatives Recognized in Income |
| Derivatives not designated as hedging instruments | | Purchased Options Contracts | | | Written Options Contracts | |
| Equity contracts | | $ | (2,381,629 | ) | | $ | 964,162 | |
| Multi-Strategy Fund |
| Amount of Realized Gain or (Loss) on Derivatives Recognized in Income |
| Derivatives not designated as hedging instruments | | Purchased Options Contracts | | | Written Options Contracts | |
| Equity contracts | | $ | 8,277,537 | | | $ | (6,469,364 | ) |
| Merger Arbitrage Fund |
| | | Change in Unrealized Appreciation/Depreciation on Derivatives Recognized in Income | |
| Derivatives not designated as hedging instruments | | Purchased Options Contracts | | | Written Options Contracts | |
| Equity contracts | | $ | 95,295 | | | $ | (260,061 | ) |
| Multi-Strategy Fund |
| | | Change in Unrealized Appreciation/Depreciation on Derivatives Recognized in Income | |
| Derivatives not designated as hedging instruments | | Purchased Options Contracts | | | Written Options Contracts | |
| Equity contracts | | $ | 1,091,563 | | | $ | (1,585,463 | ) |
The number of contracts is included on the Schedule of Investments. The quarterly average volumes of derivative instruments as of September 30, 2023, are as follows:
| Merger Arbitrage Fund |
| Derivative | | Quarterly Average | | Amount | |
| Options Contracts - Purchased | | Average Notional Value | | $ | 21,964,100 | |
| Options Contracts - Written | | Average Notional Value | | | (55,107,700 | ) |
| Multi-Strategy Fund |
| Derivative | | Quarterly Average | | Amount | |
| Options Contracts - Purchased | | Average Notional Value | | $ | 72,619,100 | |
| Options Contracts - Written | | Average Notional Value | | | (85,664,250 | ) |
First Trust Capital Management Funds
NOTES TO FINANCIAL STATEMENTS - Continued
September 30, 2023
Note 12 – Borrowing
The Funds have entered into a borrowing agreement with BNP Paribas (acting through its New York Branch). The Funds may borrow amounts up to one-third of the value of its assets. The Funds are charged interest of Overnight Bank Funding Rate (“OBFR”) plus 1.20% for borrowing under this agreement. The Funds did not borrow under the line of credit agreement during the year ended September 30, 2023.
Note 13 – Investments in Affiliated Issuers
An affiliated issuer is an entity in which the Fund has ownership of a least 5% of the voting securities or any securities issued by Sub-Advisor. Issuers that are affiliates of the Funds at the beginning of the fiscal year are noted in the Funds’ Schedule of Investments. Additional security purchases and the reduction of certain securities shares outstanding of existing portfolio holdings that were not considered affiliated in prior years may result in the Fund owning in excess of 5% of the outstanding shares at period-end. The table below reflects transactions during the period with entities that are affiliates as of September 30, 2023 and may include acquisitions of new investments, prior year holdings that became affiliated during the period and prior period affiliated holdings that are no longer affiliated as of period-end:
First Trust Merger Arbitrage Fund
| Security Description | | Value Beginning
of Period | | | Purchases | | | Sales Proceeds | | | Net Realized
Gain (Loss) | | | Transfer Prior Year
Unrealized
Appreciation
(Depreciation) | | | Unrealized
Appreciation
(Depreciation) | | | Value End of
Period | | | Dividend
Income* | |
| Aesther Healthcare Acquisition Corp. - Class A⁽²⁾ | | | 5,671,489 | | | | - | | | | (5,888,418 | ) | | | 267,021 | | | | (50,092 | ) | | | - | | | | - | | | | - | |
| Aetherium Acquisition Corp. - Class A⁽²⁾ | | | 6,475,910 | | | | - | | | | (6,764,662 | ) | | | 302,215 | | | | (13,463 | ) | | | - | | | | - | | | | - | |
| Alpha Partners Technology Merger Corp.⁽¹⁾ | | | 322,165 | | | | 14,501,600 | | | | - | | | | - | | | | (1,036 | ) | | | 692,891 | | | | 15,515,620 | | | | - | |
| AlphaVest Acquisition Corp.⁽¹⁾ | | | - | | | | 5,549,383 | | | | - | | | | - | | | | - | | | | (1,750 | ) | | | 5,547,633 | | | | - | |
| Andretti Acquisition Corp. - Class A⁽¹⁾ | | | 1,004 | | | | 19,159,402 | | | | (9,027,873 | ) | | | 111,841 | | | | - | | | | 290,626 | | | | 10,535,000 | | | | - | |
| AP Acquisition Corp. - Class A⁽¹⁾ | | | - | | | | 17,319,438 | | | | (5,807,310 | ) | | | 23,724 | | | | - | | | | 360,594 | | | | 11,896,446 | | | | - | |
| Apollo Strategic Growth Capital II - Class A⁽¹⁾ | | | 2,526,996 | | | | 51,083,922 | | | | (41,452,163 | ) | | | 476,951 | | | | (20,366 | ) | | | 383,407 | | | | 12,998,747 | | | | - | |
| Ares Acquisition Corp. - Class A⁽¹⁾ | | | 129,785 | | | | 70,523,052 | | | | (40,040,142 | ) | | | 461,498 | | | | (1,761 | ) | | | 952,900 | | | | 32,025,332 | | | | - | |
| Battery Future Acquisition Corp. - Class A⁽¹⁾ | | | 3,723,235 | | | | 22,812,215 | | | | (16,167,765 | ) | | | 322,396 | | | | (35,499 | ) | | | 77,091 | | | | 10,731,673 | | | | - | |
| Better World Acquisition Corp.⁽²⁾ | | | 10,760,828 | | | | 4,426,245 | | | | (15,644,958 | ) | | | 500,073 | | | | (42,188 | ) | | | - | | | | - | | | | - | |
| BioPlus Acquisition Corp. - Class A⁽¹⁾ | | | 1,402,800 | | | | 9,529,961 | | | | - | | | | - | | | | (8,200 | ) | | | 516,013 | | | | 11,440,574 | | | | - | |
| Bukit Jalil Global Acquisition 1 Ltd.⁽¹⁾ | | | - | | | | 4,784,600 | | | | - | | | | - | | | | - | | | | 47,000 | | | | 4,831,600 | | | | - | |
| BurTech Acquisition Corp. - Class A⁽¹⁾ | | | 432,590 | | | | 5,532,858 | | | | (489,847 | ) | | | 15,125 | | | | (925 | ) | | | 68,359 | | | | 5,558,160 | �� | | | - | |
| CF Acquisition Corp. VII - Class A⁽¹⁾ | | | 5,177,540 | | | | 6,645,588 | | | | - | | | | - | | | | (36,243 | ) | | | 542,778 | | | | 12,329,663 | | | | - | |
| Chenghe Acquisition Co. - Class A⁽¹⁾ | | | 289,513 | | | | 10,085,329 | | | | (3,105,645 | ) | | | 31,645 | | | | 288 | | | | 289,010 | | | | 7,590,140 | | | | - | |
| Churchill Capital Corp. V - Class A⁽¹⁾ | | | 5,954,464 | | | | 5,405,546 | | | | - | | | | - | | | | 36,909 | | | | 386,312 | | | | 11,783,231 | | | | - | |
| Compass Digital Acquisition Corp. - Class A⁽¹⁾ | | | 301,893 | | | | 12,931,422 | | | | - | | | | - | | | | 525 | | | | 419,975 | | | | 13,653,815 | | | | - | |
| Concord Acquisition Corp. II - Class A⁽¹⁾ | | | 814,774 | | | | 27,368,106 | | | | (13,376,327 | ) | | | 291,976 | | | | (2,022 | ) | | | 220,693 | | | | 15,317,200 | | | | - | |
| Concord Acquisition Corp. III - Class A⁽¹⁾ | | | 7,067,278 | | | | 14,947,598 | | | | (18,375,436 | ) | | | 359,396 | | | | (68,160 | ) | | | (7,191 | ) | | | 3,923,485 | | | | - | |
| Constellation Acquisition Corp. I - Class A⁽¹⁾ | | | 9,293,656 | | | | 3,996,440 | | | | (9,916,967 | ) | | | 168,827 | | | | (62,058 | ) | | | 339,848 | | | | 3,819,746 | | | | - | |
| Denali Capital Acquisition Corp. - Class A⁽¹⁾ | | | 1,122,805 | | | | 6,698,814 | | | | - | | | | - | | | | (1,440 | ) | | | 160,266 | | | | 7,980,445 | | | | - | |
| DUET Acquisition Corp. - Class A⁽¹⁾ | | | - | | | | 4,912,646 | | | | - | | | | - | | | | - | | | | (13,721 | ) | | | 4,898,925 | | | | - | |
| Enphys Acquisition Corp. - Class A⁽¹⁾ | | | - | | | | 30,464,147 | | | | - | | | | - | | | | - | | | | 611,453 | | | | 31,075,600 | | | | - | |
| Everest Consolidator Acquisition Corp. - Class A⁽¹⁾ | | | 234,818 | | | | 13,107,376 | | | | - | | | | - | | | | (1,636 | ) | | | 70,670 | | | | 13,411,228 | | | | - | |
| Feutune Light Acquisition Corp. - Class A⁽¹⁾ | | | 1,542,847 | | | | 4,350,004 | | | | (1,625,355 | ) | | | 77,857 | | | | 4,650 | | | | 1,125 | | | | 4,351,128 | | | | - | |
| Fintech Ecosystem Development Corp. - Class A | | | 10,050,010 | | | | - | | | | (2,639,979 | ) | | | 122,493 | | | | 19,933 | | | | 427,554 | | | | 7,980,011 | | | | - | |
| First Light Acquisition Group, Inc. - Class A⁽²⁾ | | | 3,792,250 | | | | - | | | | (3,910,834 | ) | | | 95,484 | | | | 23,100 | | | | - | | | | - | | | | - | |
| Forbion European Acquisition Corp. - Class A⁽¹⁾ | | | - | | | | 9,726,472 | | | | - | | | | - | | | | - | | | | 192,016 | | | | 9,918,488 | | | | - | |
| FTAC Emerald Acquisition Corp. - Class A⁽¹⁾ | | | - | | | | 32,031,219 | | | | (12,742,291 | ) | | | 70,247 | | | | - | | | | 58,622 | | | | 19,417,797 | | | | - | |
| Global Partner Acquisition Corp. II - Class A⁽¹⁾ | | | 1,450,176 | | | | 549,207 | | | | - | | | | - | | | | (7,084 | ) | | | 173,766 | | | | 2,166,065 | | | | - | |
| Goldenstone Acquisition Ltd.⁽¹⁾ | | | - | | | | 4,431,842 | | | | - | | | | - | | | | - | | | | 32,172 | | | | 4,464,014 | | | | - | |
| Haymaker Acquisition Corp. IV⁽¹⁾ | | | - | | | | 12,103,969 | | | | - | | | | - | | | | - | | | | 101,923 | | | | 12,205,892 | | | | - | |
| Haymaker Acquisition Corp. IV⁽¹⁾ | | | - | | | | - | | | | (155,853 | ) | | | 155,853 | | | | - | | | | 137 | | | | 137 | | | | - | |
| Haymaker Acquisition Corp. IV⁽¹⁾ | | | - | | | | 12,103,969 | | | | (12,103,969 | ) | | | - | | | | - | | | | 10 | | | | 10 | | | | - | |
| Investcorp Europe Acquisition Corp. I - Class A⁽¹⁾ | | | 830,669 | | | | 9,217,644 | | | | - | | | | - | | | | (14,746 | ) | | | 396,763 | | | | 10,430,330 | | | | - | |
| Israel Acquisitions Corp.⁽¹⁾ | | | - | | | | 9,408,861 | | | | - | | | | - | | | | - | | | | 224,386 | | | | 9,633,247 | | | | - | |
| Keen Vision Acquisition Corp.⁽¹⁾ | | | - | | | | 12,285,565 | | | | - | | | | - | | | | - | | | | 152,223 | | | | 12,437,788 | | | | - | |
| Kernel Group Holdings, Inc. - Class A⁽¹⁾ | | | 289,956 | | | | 9,893,425 | | | | (4,741,222 | ) | | | 54,965 | | | | (3,022 | ) | | | 38,388 | | | | 5,532,490 | | | | - | |
First Trust Capital Management Funds
NOTES TO FINANCIAL STATEMENTS - Continued
September 30, 2023
First Trust Merger Arbitrage Fund
Security Description | | Value Beginning
of Period | | | Purchases | | | Sales Proceeds | | | Net Realized
Gain (Loss) | | | Transfer Prior Year
Unrealized
Appreciation
(Depreciation) | | | Unrealized
Appreciation
(Depreciation) | | | Value End of
Period | | | Dividend
Income* | |
| Lakeshore Acquisition II Corp.⁽²⁾ | | | 6,656,638 | | | | 3,319,134 | | | | (10,251,498 | ) | | | 298,647 | | | | (22,921 | ) | | | - | | | | - | | | | - | |
| Legato Merger Corp. II⁽²⁾ | | | 21,091,082 | | | | - | | | | (21,878,841 | ) | | | 707,922 | | | | 79,837 | | | | - | | | | - | | | | - | |
| Malacca Straits Acquisition Co., Ltd. - Class A⁽²⁾ | | | 6,156,000 | | | | - | | | | (6,194,207 | ) | | | 74,207 | | | | (36,000 | ) | | | - | | | | - | | | | - | |
| Mountain & Co. I Acquisition Corp. - Class A⁽¹⁾ | | | 312,320 | | | | 7,439,125 | | | | (319,705 | ) | | | 10,740 | | | | (3,355 | ) | | | 156,547 | | | | 7,595,672 | | | | - | |
| Oak Woods Acquisition Corp. - Class A⁽¹⁾ | | | - | | | | 4,757,837 | | | | - | | | | - | | | | - | | | | 83,817 | | | | 4,841,654 | | | | - | |
| OmniLit Acquisition Corp. - Class A⁽²⁾ | | | 7,843,258 | | | | 6,502,468 | | | | (14,541,122 | ) | | | 247,887 | | | | (52,491 | ) | | | - | | | | - | | | | - | |
| Patria Latin American Opportunity Acquisition Corp. - Class A⁽¹⁾ | | | 3,919,300 | | | | 12,848,062 | | | | - | | | | - | | | | (46,200 | ) | | | 644,423 | | | | 17,365,585 | | | | - | |
| Pearl Holdings Acquisition Corp. - Class A⁽¹⁾ | | | 279,788 | | | | 21,510,986 | | | | - | | | | - | | | | (1,585 | ) | | | 535,500 | | | | 22,324,689 | | | | - | |
| Project Energy Reimagined Acquisition Corp. - Class A⁽¹⁾ | | | - | | | | 15,049,998 | | | | (5,190,150 | ) | | | 123,225 | | | | - | | | | 81,846 | | | | 10,064,919 | | | | - | |
| PROOF Acquisition Corp. I - Class A⁽¹⁾ | | | 886,333 | | | | 5,599,466 | | | | (928,611 | ) | | | 45,862 | | | | (3,584 | ) | | | 10,090 | | | | 5,609,556 | | | | - | |
| RF Acquisition Corp. - Class A | | | 6,297,544 | | | | 4,571,267 | | | | (7,021,984 | ) | | | 101,542 | | | | 3,631 | | | | 308,000 | | | | 4,260,000 | | | | - | |
| Rigel Resource Acquisition Corp. - Class A⁽¹⁾ | | | 315,313 | | | | 29,174,583 | | | | (5,278,023 | ) | | | 92,661 | | | | (5,313 | ) | | | 770,648 | | | | 25,069,869 | | | | - | |
| Screaming Eagle Acquisition Corp. - Class A⁽¹⁾ | | | - | | | | 70,780,413 | | | | - | | | | - | | | | - | | | | 2,258,399 | | | | 73,038,812 | | | | - | |
| SDCL EDGE Acquisition Corp. - Class A⁽¹⁾ | | | 2,271,941 | | | | 8,144,242 | | | | - | | | | - | | | | 2,050 | | | | 348,590 | | | | 10,766,823 | | | | - | |
| Seaport Global Acquisition II Corp. - Class A⁽²⁾ | | | 8,741,770 | | | | 3,151,199 | | | | (8,977,592 | ) | | | 291,434 | | | | (3,206,811 | ) | | | - | | | | - | | | | - | |
| Slam Corp. - Class A⁽¹⁾ | | | 5,267,284 | | | | 34,589,793 | | | | (2,278,522 | ) | | | 150,000 | | | | (40,760 | ) | | | 2,636,498 | | | | 40,324,293 | | | | - | |
| Spring Valley Acquisition Corp. II - Class A⁽¹⁾ | | | - | | | | 21,494,272 | | | | - | | | | - | | | | - | | | | 724,160 | | | | 22,218,432 | | | | - | |
| TortoiseEcofin Acquisition Corp. III - Class A⁽¹⁾ | | | - | | | | 30,570,239 | | | | - | | | | - | | | | - | | | | 258,347 | | | | 30,828,586 | | | | - | |
| Trajectory Alpha Acquisition Corp. - Class A⁽¹⁾ | | | 1,952,270 | | | | 4,597,704 | | | | (2,491,076 | ) | | | 123,542 | | | | (25,610 | ) | | | 42,165 | | | | 4,198,995 | | | | - | |
| Valuence Merger Corp. I - Class A⁽¹⁾ | | | - | | | | 19,111,639 | | | | (13,696,403 | ) | | | 131,391 | | | | - | | | | 170,879 | | | | 5,717,506 | | | | - | |
| Total | | $ | 151,650,292 | | | $ | 781,100,292 | | | $ | (323,024,750 | ) | | $ | 6,308,647 | | | | (3,643,648 | ) | | $ | 17,236,218 | | | $ | 629,627,051 | | | $ | - | |
| * | Net of foreign withholding taxes. |
| ⁽¹⁾ | Not an affiliate at the beginning of the period. |
| ⁽²⁾ | Not an affiliate at the end of the period. |
First Trust Merger Arbitrage Fund
| Security Description | | Shares Beginning of Period | | | Purchases | | | Sales | | | Stock Split | | | Shares End of Period | |
| Aesther Healthcare Acquisition Corp. - Class A⁽²⁾ | | | 556,574 | | | | - | | | | (556,574 | ) | | | - | | | | - | |
| Aetherium Acquisition Corp. - Class A⁽²⁾ | | | 651,500 | | | | - | | | | (651,500 | ) | | | - | | | | - | |
| Alpha Partners Technology Merger Corp.⁽¹⁾ | | | 32,807 | | | | 1,433,005 | | | | - | | | | - | | | | 1,465,812 | |
| AlphaVest Acquisition Corp.⁽¹⁾ | | | - | | | | 524,847 | | | | - | | | | - | | | | 524,847 | |
| Andretti Acquisition Corp. - Class A⁽¹⁾ | | | 100 | | | | 1,826,619 | | | | (846,719 | ) | | | - | | | | 980,000 | |
| AP Acquisition Corp. - Class A⁽¹⁾ | | | - | | | | 1,616,250 | | | | (532,785 | ) | | | - | | | | 1,083,465 | |
| Apollo Strategic Growth Capital II - Class A⁽¹⁾ | | | 256,028 | | | | 5,012,595 | | | | (4,031,825 | ) | | | - | | | | 1,236,798 | |
| Ares Acquisition Corp. - Class A⁽¹⁾ | | | 13,070 | | | | 6,900,744 | | | | (3,937,482 | ) | | | - | | | | 2,976,332 | |
| Battery Future Acquisition Corp. - Class A⁽¹⁾ | | | 369,050 | | | | 2,150,101 | | | | (1,532,784 | ) | | | - | | | | 986,367 | |
| Better World Acquisition Corp.⁽²⁾ | | | 1,038,690 | | | | 428,635 | | | | (1,467,325 | ) | | | - | | | | - | |
| BioPlus Acquisition Corp. - Class A⁽¹⁾ | | | 140,000 | | | | 916,378 | | | | - | | | | - | | | | 1,056,378 | |
| Bukit Jalil Global Acquisition 1 Ltd.⁽¹⁾ | | | - | | | | 470,000 | | | | - | | | | - | | | | 470,000 | |
| BurTech Acquisition Corp. - Class A⁽¹⁾ | | | 43,259 | | | | 530,153 | | | | (47,569 | ) | | | - | | | | 525,843 | |
| CF Acquisition Corp. VII - Class A⁽¹⁾ | | | 517,754 | | | | 634,551 | | | | - | | | | - | | | | 1,152,305 | |
| Chenghe Acquisition Co. - Class A⁽¹⁾ | | | 28,750 | | | | 961,802 | | | | (289,708 | ) | | | - | | | | 700,844 | |
| Churchill Capital Corp. V - Class A⁽¹⁾ | | | 601,461 | | | | 531,542 | | | | - | | | | - | | | | 1,133,003 | |
| Compass Digital Acquisition Corp. - Class A⁽¹⁾ | | | 30,900 | | | | 1,270,703 | | | | - | | | | - | | | | 1,301,603 | |
| Concord Acquisition Corp. II - Class A⁽¹⁾ | | | 84,084 | | | | 2,698,729 | | | | (1,292,813 | ) | | | - | | | | 1,490,000 | |
| Concord Acquisition Corp. III - Class A⁽¹⁾ | | | 704,614 | | | | 1,428,343 | | | | (1,763,514 | ) | | | - | | | | 369,443 | |
| Constellation Acquisition Corp. I - Class A⁽¹⁾ | | | 935,917 | | | | 405,238 | | | | (987,147 | ) | | | - | | | | 354,008 | |
| Denali Capital Acquisition Corp. - Class A⁽¹⁾ | | | 111,500 | | | | 619,310 | | | | - | | | | - | | | | 730,810 | |
| DUET Acquisition Corp. - Class A⁽¹⁾ | | | - | | | | 457,416 | | | | - | | | | - | | | | 457,416 | |
| Enphys Acquisition Corp. - Class A⁽¹⁾ | | | - | | | | 2,959,581 | | | | - | | | | - | | | | 2,959,581 | |
| Everest Consolidator Acquisition Corp. - Class A⁽¹⁾ | | | 23,365 | | | | 1,216,120 | | | | - | | | | - | | | | 1,239,485 | |
| Feutune Light Acquisition Corp. - Class A⁽¹⁾ | | | 155,060 | | | | 407,409 | | | | (155,060 | ) | | | - | | | | 407,409 | |
| Fintech Ecosystem Development Corp. - Class A | | | 1,000,001 | | | | - | | | | (250,000 | ) | | | - | | | | 750,001 | |
| First Light Acquisition Group, Inc. - Class A⁽²⁾ | | | 385,000 | | | | - | | | | (385,000 | ) | | | - | | | | - | |
| Forbion European Acquisition Corp. - Class A⁽¹⁾ | | | - | | | | 905,798 | | | | - | | | | - | | | | 905,798 | |
| FTAC Emerald Acquisition Corp. - Class A⁽¹⁾ | | | - | | | | 3,074,588 | | | | (1,218,202 | ) | | | - | | | | 1,856,386 | |
First Trust Capital Management Funds
NOTES TO FINANCIAL STATEMENTS - Continued
September 30, 2023
First Trust Merger Arbitrage Fund
| Security Description | | Shares Beginning of Period | | | Purchases | | | Sales | | | Stock Split | | | Shares End of Period | |
| Global Partner Acquisition Corp. II - Class A⁽¹⁾ | | | 145,600 | | | | 54,406 | | | | - | | | | - | | | | 200,006 | |
| Goldenstone Acquisition Ltd.⁽¹⁾ | | | - | | | | 416,808 | | | | - | | | | - | | | | 416,808 | |
| Haymaker Acquisition Corp. IV⁽¹⁾ | | | - | | | | 1,200,186 | | | | - | | | | - | | | | 1,200,186 | |
| Haymaker Acquisition Corp. IV⁽¹⁾ | | | - | | | | 600,093 | | | | (599,440 | ) | | | - | | | | 653 | |
| Haymaker Acquisition Corp. IV⁽¹⁾ | | | - | | | | 1,200,187 | | | | (1,200,186 | ) | | | - | | | | 1 | |
| Investcorp Europe Acquisition Corp. I - Class A⁽¹⁾ | | | 81,920 | | | | 876,750 | | | | - | | | | - | | | | 958,670 | |
| Israel Acquisitions Corp.⁽¹⁾ | | | - | | | | 913,104 | | | | - | | | | - | | | | 913,104 | |
| Keen Vision Acquisition Corp.⁽¹⁾ | | | - | | | | 1,215,815 | | | | - | | | | - | | | | 1,215,815 | |
| Kernel Group Holdings, Inc. - Class A⁽¹⁾ | | | 29,200 | | | | 958,574 | | | | (465,841 | ) | | | - | | | | 521,933 | |
| Lakeshore Acquisition II Corp.⁽²⁾ | | | 662,352 | | | | 331,176 | | | | (993,528 | ) | | | - | | | | - | |
| Legato Merger Corp. II⁽²⁾ | | | 2,123,976 | | | | - | | | | (2,123,976 | ) | | | - | | | | - | |
| Malacca Straits Acquisition Co., Ltd. - Class A⁽²⁾ | | | 600,000 | | | | - | | | | (600,000 | ) | | | - | | | | - | |
| Mountain & Co. I Acquisition Corp. - Class A⁽¹⁾ | | | 30,500 | | | | 678,185 | | | | (30,500 | ) | | | - | | | | 678,185 | |
| Oak Woods Acquisition Corp. - Class A⁽¹⁾ | | | - | | | | 463,760 | | | | - | | | | - | | | | 463,760 | |
| OmniLit Acquisition Corp. - Class A⁽²⁾ | | | 778,101 | | | | 636,405 | | | | (1,414,506 | ) | | | - | | | | - | |
| Patria Latin American Opportunity Acquisition Corp. - Class A⁽¹⁾ | | | 385,000 | | | | 1,195,126 | | | | - | | | | - | | | | 1,580,126 | |
| Pearl Holdings Acquisition Corp. - Class A⁽¹⁾ | | | 28,063 | | | | 2,054,464 | | | | - | | | | - | | | | 2,082,527 | |
| Project Energy Reimagined Acquisition Corp. - Class A⁽¹⁾ | | | - | | | | 1,458,492 | | | | (498,099 | ) | | | - | | | | 960,393 | |
| PROOF Acquisition Corp. I - Class A⁽¹⁾ | | | 88,900 | | | | 522,305 | | | | (88,900 | ) | | | - | | | | 522,305 | |
| RF Acquisition Corp. - Class A | | | 638,049 | | | | 454,311 | | | | (692,360 | ) | | | - | | | | 400,000 | |
| Rigel Resource Acquisition Corp. - Class A⁽¹⁾ | | | 31,250 | | | | 2,762,290 | | | | (491,440 | ) | | | - | | | | 2,302,100 | |
| Screaming Eagle Acquisition Corp. - Class A⁽¹⁾ | | | - | | | | 6,982,678 | | | | - | | | | - | | | | 6,982,678 | |
| SDCL EDGE Acquisition Corp. - Class A⁽¹⁾ | | | 229,721 | | | | 786,017 | | | | - | | | | - | | | | 1,015,738 | |
| Seaport Global Acquisition II Corp. - Class A⁽²⁾ | | | 874,177 | | | | 295,242 | | | | (874,177 | ) | | | - | | | | 295,242 | |
| Slam Corp. - Class A⁽¹⁾ | | | 531,512 | | | | 3,426,564 | | | | (217,418 | ) | | | - | | | | 3,740,658 | |
| Spring Valley Acquisition Corp. II - Class A⁽¹⁾ | | | - | | | | 2,076,489 | | | | - | | | | - | | | | 2,076,489 | |
| TortoiseEcofin Acquisition Corp. III - Class A⁽¹⁾ | | | - | | | | 2,941,659 | | | | - | | | | - | | | | 2,941,659 | |
| Trajectory Alpha Acquisition Corp. - Class A⁽¹⁾ | | | 197,000 | | | | 442,156 | | | | (240,012 | ) | | | - | | | | 399,144 | |
| Valuence Merger Corp. I - Class A⁽¹⁾ | | | - | | | | 1,803,975 | | | | (1,289,348 | ) | | | - | | | | 514,627 | |
| Total | | | 15,134,805 | | | | 76,127,674 | | | | (31,765,738 | ) | | | - | | | | 59,496,741 | |
| ⁽¹⁾ | Not an affiliate at the beginning of the period. |
| ⁽²⁾ | Not an affiliate at the end of the period. |
First Trust Multi Strategy Fund
| Security Description | | Value Beginning of Period | | | Purchases | | | Sales Proceeds | | | Net Realized
Gain (Loss) | | | Transfer Prior Year
Unrealized
Appreciation
(Depreciation) | | | Unrealized
Appreciation
(Depreciation) | | | Value End of
Period | | | Dividend
Income* | |
| Palmer Square Loan Funding Ltd.⁽¹⁾ | | | 342,498 | | | | - | | | | (308,247 | ) | | | - | | | | 157,502 | | | | (113,003 | ) | | | 78,750 | | | | - | |
| Total | | $ | 342,498 | | | $ | - | | | $ | (308,247 | ) | | $ | - | | | $ | 157,502 | | | $ | (113,003 | ) | | $ | 78,750 | | | $ | - | |
| * | Net of foreign withholding taxes. |
| ⁽¹⁾ | Not an affiliate at the beginning of the period. |
First Trust Multi Strategy Fund
| Security Description | | Shares
Beginning of
Period | | | Purchases | | | Sales | | | Stock Split | | | Shares End of Period | |
| Palmer Square Loan Funding Ltd.⁽¹⁾ | | | 500,000 | | | | - | | | | - | | | | - | | | | 500,000 | |
| Total | | | 500,000 | | | | - | | | | - | | | | - | | | | 500,000 | |
| ⁽¹⁾ | Not an affiliate at the beginning of the period. |
First Trust Capital Management Funds
NOTES TO FINANCIAL STATEMENTS - Continued
September 30, 2023
Note 14 – Market Disruption and Geopolitical Risks
Certain local, regional or global events such as war, acts of terrorism, the spread of infectious illnesses and/or other public health issues, or other events may have a significant impact on a security or instrument. These types of events and other like them are collectively referred to as “Market Disruptions and Geopolitical Risks” and they may have adverse impacts on the worldwide economy, as well as the economies of individual countries, the financial health of individual companies and the market in general in significant and unforeseen ways. Some of the impacts noted in recent times include but are not limited to embargos, political actions, supply chain disruptions, restrictions to investment and/or monetary movement including the forced selling of securities or the inability to participate impacted markets. The duration of these events could adversely affect the Fund’s performance, the performance of the securities in which the Fund invests and may lead to losses on your investment. The ultimate impact of “Market Disruptions and Geopolitical Risks” on the financial performance of the Fund’s investments is not reasonably estimable at this time. Management is actively monitoring these events.
Note 15 - Investments by Other Registered Investment Companies
For purposes of the 1940 Act, each Fund is treated as a registered investment company. Section 12(d)(1) of the 1940 Act restricts investments by investment companies in the securities of other investment companies, including shares of the Fund. Rule 12d1-4 of the 1940 Act permits other investment companies to invest in the Funds beyond the limits in Section 12(d)(1), subject to certain terms and conditions, including that such investment companies enter into an agreement with the Fund.
Note 16 – New Accounting Pronouncements and Regulatory Updates
Effective January 24, 2023, the SEC adopted rule and form amendments to require mutual funds and ETFs to transmit concise and visually engaging streamlined annual and semiannual reports to shareholders that highlight key information deemed important for retail investors to assess and monitor their fund investments. Other information, including financial statements, will no longer appear in the funds’ streamlined shareholder reports but must be available online, delivered free of charge upon request, and filed on a semiannual basis on Form N-CSR. The rule and form amendments have a compliance date of July 24, 2024. At this time, management is evaluating the impact of these rule and form amendment changes on the content of the current shareholder report and the newly created annual and semiannual streamlined shareholder reports.
In October 2020, the SEC adopted new regulations governing the use of derivatives by registered investment companies (“Rule 18f-4”). Rule 18f-4 imposes limits on the amount of derivatives a Fund can enter into, eliminates the asset segregation framework currently used by funds to comply with Section 18 of the 1940 Act, and requires funds whose use of derivatives is greater than a limited specified amount to establish and maintain a comprehensive derivatives risk management program and appoint a derivatives risk manager. The Funds have adopted procedures in accordance with Rule 18f-4.
In December 2020, the SEC adopted a new rule providing a framework for fund valuation practices (“Rule 2a-5”). Rule 2a-5 establishes requirements for determining fair value in good faith for purposes of the 1940 Act. Rule 2a-5 will permit fund boards to designate certain parties to perform fair value determinations, subject to board oversight and certain other conditions. Rule 2a-5 also defines when market quotations are “readily available” for purposes of the 1940 Act and the threshold for determining whether a fund must fair value a security. In connection with Rule 2a-5, the SEC also adopted related recordkeeping requirements and is rescinding previously issued guidance, including with respect to the role of a board in determining fair value and the accounting and auditing of fund investments. The Funds have adopted procedures in accordance with Rule 2a-5.
In March 2020, the FASB issued Accounting Standards Update (ASU) No. 2020-04, Reference Rate Reform (Topic 848) – Facilitation of the Effects of Reference Rate Reform on Financial Reporting. The amendments in the ASU provide optional temporary financial reporting relief from the effect of certain types of contract modifications due to the planned discontinuation of the London Interbank Offered Rate and other interbank-offered based reference rates as of the end of 2021. The ASU is effective for certain reference rate-related contract modifications that occur during the period March 12, 2020 through December 31, 2022. In December 2022, the FASB issued ASU No. 2022-06, Reference Rate Reform (Topic 848) - Deferral of the Sunset Date of Topic 848, which extends the period through December 31, 2024. Management has reviewed the requirements and believes the adoption of these ASUs will not have a material impact on the financial statements.
First Trust Capital Management Funds
NOTES TO FINANCIAL STATEMENTS - Continued
September 30, 2023
Note 17 – Events Subsequent to the Fiscal Period End
The Funds have adopted financial reporting rules regarding subsequent events which require an entity to recognize in the financial statements the effects of all subsequent events that provide additional evidence about conditions that existed at the date of the balance sheet. Management has evaluated the Funds’ related events and transactions that occurred through the date of issuance of the Funds’ financial statements. There were no events or transactions that occurred during this period that materially impacted the amounts or disclosures in the Funds’ financial statements.
REPORT OF INDEPENDENT REGISTERED PUBLIC ACCOUNTING FIRM
To the Board of Trustees of Investment Managers Series Trust II and
Shareholders of First Trust Capital Management Funds
Opinion on the Financial Statements
We have audited the accompanying statements of assets and liabilities of First Trust Merger Arbitrage Fund and First Trust Multi-Strategy Fund (the “Funds”), each a series of Investment Managers Series Trust II (the “Trust”), including the schedules of investments, as of September 30, 2023, the related statements of operations and cash flows for the year then ended, the statements of changes in net assets for each of the two years in the period then ended and the financial highlights for the periods indicated thereon, and the related notes (collectively referred to as the “financial statements”). In our opinion, the financial statements present fairly, in all material respects, the financial position of the Funds as of September 30, 2023, the results of their operations and their cash flows for the year then ended, the changes in their net assets for each of the two years in the period then ended and their financial highlights for the periods indicated thereon, in conformity with accounting principles generally accepted in the United States of America.
Basis for Opinion
These financial statements are the responsibility of the Funds’ management. Our responsibility is to express an opinion on the Funds’ financial statements based on our audits. We are a public accounting firm registered with the Public Company Accounting Oversight Board (United States) (“PCAOB”) and are required to be independent with respect to the Funds in accordance with the U.S. federal securities laws and the applicable rules and regulations of the Securities and Exchange Commission and the PCAOB. We have served as the auditor of one or more of the funds in the Trust since 2013.
We conducted our audits in accordance with the standards of the PCAOB. Those standards require that we plan and perform the audits to obtain reasonable assurance about whether the financial statements are free of material misstatement, whether due to error or fraud. The Funds are not required to have, nor were we engaged to perform, an audit of the Funds’ internal control over financial reporting. As part of our audits we are required to obtain an understanding of internal control over financial reporting, but not for the purpose of expressing an opinion on the effectiveness of the Funds’ internal control over financial reporting. Accordingly, we express no such opinion.
Our audits included performing procedures to assess the risks of material misstatement of the financial statements, whether due to error or fraud, and performing procedures that respond to those risks. Such procedures included examining, on a test basis, evidence regarding the amounts and disclosures in the financial statements. Our audits also included evaluating the accounting principles used and significant estimates made by management, as well as evaluating the overall presentation of the financial statements. Our procedures included confirmation of securities owned as of September 30, 2023 by correspondence with the custodian and brokers or by other appropriate auditing procedures where replies were not received. We believe that our audits provide a reasonable basis for our opinion.
| |  |
| | TAIT, WELLER & BAKER LLP |
Philadelphia, Pennsylvania
November 29, 2023
First Trust Capital Management Funds
SUPPLEMENTAL INFORMATION (Unaudited)
Qualified Dividend Income
For the year ended September 30, 2023, 7.61% and 4.25% of dividends to be paid from net investment income, including short-term capital gains (if any) from the Merger Arbitrage Fund and Multi-Strategy Fund, respectively, are designated as qualified dividend income.
Corporate Dividends Received Deduction
For the year ended September 30, 2023, 9.27% and 5.72% of the dividends to be paid from net investment income, including short-term capital gains (if any) from the Merger Arbitrage Fund and Multi-Strategy Fund, respectively, are designated as dividends received deduction available to corporate shareholders.
Capital Gain Designation
For Federal income tax purposes, the Merger Arbitrage Fund designates long-term capital gain dividends of $1,077,295 for the year ended September 30, 2023.
Trustees and Officers Information
Additional information about the Trustees is included in the Funds’ Statement of Additional Information which is available, without charge, upon request by calling (877) 779-1999. The Trustees and officers of the Funds and their principal occupations during the past five years are as follows:
| Name, Address, Year of Birth and Position(s) held with Trust | Term of Officec and Length of Time Served | Principal Occupation During the Past Five Years and Other Affiliations | Number of Portfolios in the Fund Complex Overseen by Trusteed | Other Directorships Held by Trustee During the Past Five Yearse |
| Independent Trustees: | | |
Thomas Knipper, CPA a (Born 1957) Trustee | Since September 2013 | Retired (April 2022 – present); Independent Consulting, financial services organizations (March 2021 – March 2022); Vice President and Chief Compliance Officer, Ameritas Investment Partners, a registered investment advisor (1995 – March 2021). | 2 | Monachil Credit Income Fund, a closed-end investment company. |
Kathleen K. Shkuda a (born 1951) Trustee | Since September 2013 | Zigzag Consulting, a financial services consulting firm (2008 – present). Director, Managed Accounts, Merrill Lynch (2007-2008). | 2 | None. |
Larry D. Tashjian a (born 1953) Trustee and Chairman of the Board | Since September 2013 | Principal, CAM Capital Advisors, a family office (2001 – present). | 2 | General Finance Corporation. |
First Trust Capital Management Funds
SUPPLEMENTAL INFORMATION (Unaudited) – Continued
John P. Zader a (born 1961) Trustee | Since September 2013 | Retired (June 2014 – present); CEO, UMB Fund Services, Inc., a mutual fund and hedge fund service provider, and the transfer agent, fund accountant, and co-administrator for the Fund (December 2006 – June 2014); President, Investment Managers Series Trust (December 2007 - June 2014). | 2 | FPA Funds Trust, a registered investment company (includes 6 portfolios), Source Capital, Inc., a closed-end investment company. |
| Interested Trustees: | | |
Terrance P. Gallagher a* (born 1958) Trustee and President | Since July 2019 | President, Investment Managers Series Trust II (September 2013 – present); Executive Vice President, UMB Fund Services, Inc. (2007 – present). Director of Compliance, Unified Fund Services Inc. (now Huntington Fund Services), a mutual fund service provider (2004 – 2007). | 2 | Agility Multi-Asset Income Fund, Aspiriant Risk-Managed Real Asset Fund, Aspiriant Risk-Managed Capital Appreciation Fund, AFA Multi-Manager Credit Fund, The Optima Dynamic Alternatives Fund, Infinity Core Alternative Fund, Keystone Private Income Fund, First Trust Alternative Opportunities Fund, Variant Alternative Income Fund, Variant Impact Fund, First Trust Private Assets Fund, First Trust Private Credit Fund, First Trust Real Assets Fund, Destiny Alternative Fund LLC, Destiny Alternative Fund (TEI) LLC, and Pender Real Estate Credit Fund, each a closed-end investment company. |
First Trust Capital Management Funds
SUPPLEMENTAL INFORMATION (Unaudited) – Continued
Joy Ausili b† (born 1966) Trustee, Vice President and Assistant Secretary | Since January 2023 | Co-Chief Executive Officer (2016 – present), and Vice President (2006 – 2015), Mutual Fund Administration, LLC; Vice President and Assistant Secretary (January 2016 – present), Investment Managers Series Trust II; Vice President and Secretary, Investment Managers Series Trust (March 2016 – present); Co-President, Foothill Capital Management, LLC, a registered investment advisor (2018 – 2022). | 2 | None. |
| Officers of the Trust: | | | | |
Rita Dam b (born 1966) Treasurer and Assistant Secretary | Since September 2013 | Co-Chief Executive Officer (2016 – present), and Vice President (2006 – 2015), Mutual Fund Administration, LLC; Co-President, Foothill Capital Management, LLC, a registered investment advisor (2018 – 2022). | N/A | N/A |
Diane Drake b (born 1967) Secretary | Since January 2016 | Senior Counsel, Mutual Fund Administration, LLC (October 2015 – present); Chief Compliance Officer, Foothill Capital Management, LLC, a registered investment advisor (2018 – 2019). | N/A | N/A |
Martin Dziura b (born 1959) Chief Compliance Officer | Since September 2013 | Principal, Dziura Compliance Consulting, LLC (October 2014 - present). Managing Director, Cipperman Compliance Services (2010 – September 2014). Chief Compliance Officer, Hanlon Investment Management (2009 - 2010). Vice President − Compliance, Morgan Stanley Investment Management (2000 − 2009). | N/A | N/A |
| a | Address for certain Trustees and certain officers: 235 West Galena Street, Milwaukee, Wisconsin 53212. |
| b | Address for Ms. Ausili, Ms. Dam and Ms. Drake: 2220 E. Route 66, Suite 226, Glendora, California 91740. Address for Mr. Dziura: 309 Woodridge Lane, Media, Pennsylvania 19063. |
| c | Trustees and officers serve until their successors have been duly elected. |
| d | The Trust is comprised of 48 series managed by unaffiliated investment advisors. Each Trustee serves as Trustee of each series of the Trust. The term “Fund Complex” applies only to the Funds managed by the same investment advisor. The Funds do not hold themselves out as related to any other series within the Trust, for purposes of investment and investor services, nor do they share the same investment advisor with any other series. |
| e | “Other Directorships Held” includes only directorship of companies required to register or file reports with the SEC under the Securities Exchange Act of 1934, as amended (that is, “public companies”) or other investment companies registered under the 1940 Act. |
| † | Ms. Ausili is an “interested person” of the Trust by virtue of his position with Mutual Fund Administration, LLC. |
| * | Mr. Gallagher is an “interested person” of the Trust by virtue of his position with UMB Fund Services, Inc. |
First Trust Capital Management Funds
SUPPLEMENTAL INFORMATION (Unaudited) – Continued
Board Consideration of Investment Advisory and Sub-Advisory Agreements
At an in-person meeting held on April 19, 2023, the Board of Trustees (the “Board”) of Investment Managers Series Trust II (the “Trust”), including the trustees who are not “interested persons” of the Trust (the “Independent Trustees”) as defined in the Investment Company Act of 1940, as amended (the “1940 Act”), reviewed and unanimously approved the renewal of the investment advisory agreement (the “Advisory Agreement”) between the Trust and First Trust Capital Management L.P. (the “Investment Advisor”) for an additional one-year term from when it otherwise would expire, with respect to the following series of the Trust (each a “Fund” and together, the “Funds”):
| • | First Trust Merger Arbitrage Fund (the “Merger Arbitrage Fund”), and |
| • | First Trust Multi-Strategy Fund (the “Multi-Strategy Fund”). |
At the same meeting, the Board and the Independent Trustees also reviewed and unanimously approved the renewal of the following sub-advisory agreements (together, the “Sub-Advisory Agreements”), each for additional one-year terms from when they otherwise would expire:
| • | the sub-advisory agreement between the Investment Advisor and Angel Oak Capital Advisors, LLC (“Angel Oak”) with respect to the Multi-Strategy Fund (the “Angel Oak Sub-Advisory Agreement”), and |
| • | the sub-advisory agreement between the Investment Advisor and Glenmede Investment Management LP (“Glenmede” and together with Angel Oak, the “Sub-Advisors”) with respect to the Multi-Strategy Fund (the “Glenmede Sub-Advisory Agreement”). |
The Advisory Agreement and the Sub-Advisory Agreements are collectively referred to below as the “Fund Advisory Agreements.”
In addition, at an in-person meeting held on July 19, 2023, the Board, including the Independent Trustees, unanimously approved a new sub-advisory agreement (the “New Palmer Square Sub-Advisory Agreement”) between the Investment Advisor and Palmer Square Capital Management, LLC (“Palmer Square”) with respect to the Multi-Strategy Fund for an initial two-year term.
In approving renewal of each Fund Advisory Agreement and approving the New Palmer Square Sub-Advisory Agreement, the Board, including the Independent Trustees, determined that such renewal and approval, as applicable, was in the best interests of each Fund and its shareholders.
Fund Advisory Agreements
Background
In advance of the April meeting, the Board received information about the Funds and the Fund Advisory Agreements from the Investment Advisor, the Sub-Advisors, and Mutual Fund Administration, LLC and UMB Fund Services, Inc., the Trust’s co-administrators, certain portions of which are discussed below. The materials, among other things, included information about the organization and financial condition of the Investment Advisor and the Sub-Advisors; information regarding the background, experience, and compensation structure of relevant personnel providing services to the Funds; information about the Investment Advisor’s and the Sub-Advisors’ compliance policies and procedures, disaster recovery and contingency planning, and policies with respect to portfolio execution and trading; information regarding the profitability of the Investment Advisor’s overall relationship with each Fund; reports comparing the performance of each Fund with returns of its benchmark index and a group of comparable funds (each, a “Peer Group”) selected by Broadridge Financial Solutions, Inc. (“Broadridge”) from Morningstar, Inc.’s relevant fund universe (each, a “Fund Universe”) for various periods ended January 31, 2023; reports comparing the investment advisory fee and total expenses of each Fund with those of its Peer Group and Fund Universe; and the advisory and sub-advisory fees paid pursuant to the Advisory Agreement and Sub-Advisory Agreements, respectively. The Board also received a memorandum from legal counsel to the Trust and the Independent Trustees discussing the legal standards under the 1940 Act and other applicable law for their consideration of the proposed renewal of the Fund Advisory Agreements. In addition, the Board considered information reviewed by the Board during the year at other Board and Board committee meetings. No representatives of the Investment Advisor or the Sub-Advisors were present during the Board’s consideration of the Fund Advisory Agreements, and the Independent Trustees were represented by their legal counsel with respect to the matters considered.
First Trust Capital Management Funds
SUPPLEMENTAL INFORMATION (Unaudited) - Continued
In renewing each Fund Advisory Agreement, the Board and the Independent Trustees considered a variety of factors, including those discussed below. In their deliberations, the Board and the Independent Trustees did not identify any particular factor that was controlling, and each Trustee may have attributed different weights to the various factors.
First Trust Capital Management L.P.
Nature, Extent, and Quality of Services
With respect to the performance results of each Fund, the meeting materials indicated the following:
| • | The Merger Arbitrage Fund’s total return for the one-year period was above the Peer Group and Event Driven Fund Universe median returns, the Bloomberg U.S. Aggregate Bond Index return, and the S&P 500 Index return. The Fund’s annualized total returns for the three- and five-year periods were above the Peer Group and Fund Universe median returns and the Bloomberg Index returns, but below the S&P 500 Index returns by 5.82% and 5.48%, respectively, for those periods. The Trustees observed that the Fund’s volatility of returns, as measured by its standard deviation; its risk-adjusted returns, as measured by its Sharpe ratio; and its downside volatility, as measured by its Morningstar risk score, ranked it in the first quartile of the funds (which is the most favorable) in the Peer Group and Fund Universe for the one-, three-, and five-year periods. |
| • | The Multi-Strategy Fund’s annualized total return for the five-year period was above the Peer Group and Multi-strategy Fund Universe median returns and the ICE BofA 3-Month U.S. Treasury Bill Index return. For the ten-year period, the Fund’s annualized total return was above the Fund Universe median return and the ICE BofA Index return, and was the same as the Peer Group median return. The Fund’s annualized total return for the three-year period was above the Fund Universe median return and the ICE BofA Index return, but below the Peer Group median return by 0.46%. The Fund’s total return for the one-year period was below the Fund Universe median return by 3.97%, the ICE BofA Index return by 4.90%, and the Peer Group median return by 5.83%. The Trustees observed that for the five- and ten-year periods, the Fund’s performance ranked it in the first or second quartile of the funds (which are the most favorable) in the Peer Group and Fund Universe. The Trustees also considered the Investment Advisor’s assertion that the Fund’s underperformance relative to the Peer Group and Fund Universe over the one-year period was due primarily to mark-to-market pressures in the Fund's structured credit strategy, as fixed income spreads continued to widen due to the ongoing interest rate increases, and the increased levels of volatility in the options market, which impacted the Fund’s options writing strategy during the period. |
The Board considered the overall quality of services provided by the Investment Advisor to the Funds. In doing so, the Board considered the Investment Advisor’s specific responsibilities in day-to-day management and oversight of the Funds, as well as the qualifications, experience, and responsibilities of the personnel involved in the activities of the Funds. The Board also considered the overall quality of the organization and operations of the Investment Advisor, as well as its compliance structure. In addition, the Board considered the respective roles of the Investment Advisor and the Sub-Advisors with respect to the Multi-Strategy Fund, noting that the Investment Advisor provides overall supervision of the general investment management and investment operations of the Fund and oversees each Sub-Advisor with respect to the Fund’s operations, including monitoring the investment and trading activities of each Sub-Advisor, monitoring the Fund’s compliance with its investment policies, and providing general administrative services related to the Investment Advisor’s overall supervision of the Fund; and that each Sub-Advisor’s responsibilities include day-to-day management of a portion of the Fund’s assets utilizing its designated strategy. The Board and the Independent Trustees concluded that based on the various factors they had reviewed, the nature, overall quality, and extent of the management and oversight services provided by the Investment Advisor to each Fund were satisfactory.
First Trust Capital Management Funds
SUPPLEMENTAL INFORMATION (Unaudited) - Continued
Advisory Fees and Expense Ratios
With respect to the advisory fees and expenses paid by the Funds, the meeting materials indicated the following:
| • | The Merger Arbitrage Fund’s annual investment advisory fee (gross of fee waivers) was above the Peer Group and Event Driven Fund Universe medians by 0.085% and 0.1175%, respectively. The Board considered that the Investment Advisor manages assets for (i) a private fund, (ii) a sub-advised account in an ETF, (iii) the arbitrage sleeve within the Multi-Strategy Fund, and (iv) a separately managed account in a closed-end multi-strategy fund, each with similar objectives and policies as the Merger Arbitrage Fund. The Board noted that each of those accounts has different restrictions than the Merger Arbitrage Fund with respect to position sizing, restricted securities/sectors and leverage, and as a result, those accounts have differing fee structures. The Board observed that the Fund’s advisory fee was higher than each of those other accounts, but considered that (i) the private fund pays only a performance-based fee and therefore could pay higher overall fees than the Fund, depending on the private fund’s performance; (ii) the ETF charges a unitary management fee and the Investment Advisor is paid 50% of that fee minus the ETF’s expenses for sub-advisory services; (iii) the Investment Advisor’s management fee for managing the arbitrage sleeve within the Multi-Strategy Fund is effectively the Investment Advisor’s advisory fee after paying the Sub-Advisors; and (iv) the Investment Advisor’s management fee for the closed-end multi-strategy fund is effectively the Investment Advisor’s advisory fee after paying the fund’s sub-advisors. The Board also observed that management of mutual fund assets requires compliance with certain requirements under the 1940 Act that do not apply to the private fund that the Investment Advisor manages. The Board also noted that the Fund’s advisory fee was within the range of the advisory fee paid by the other series of the Trust managed by the Investment Advisor. |
The annual total expenses paid by the Merger Arbitrage Fund (net of fee waivers) for the Fund’s most recent fiscal year were higher than the Fund Universe and Peer Group medians by 0.02% and 0.05%, respectively. The Trustees considered that the Fund’s total expenses were not in the highest quartile of those funds in the Peer Group or the Fund Universe.
| • | The Multi-Strategy Fund’s annual investment advisory fee (gross of fee waivers) was the same as the Peer Group median, but slightly higher than the Multistrategy Fund Universe median by 0.01%. The Board observed that the Investment Advisor charges a lower advisory fee to one other registered fund with a multialternative strategy that has similar objectives and policies as the Fund, and noted the Investment Advisor’s assertion that the lower advisory fee is appropriate for that fund due to its fund-of-funds structure. The Board also considered that the Fund’s advisory fee was lower than the advisory fee paid by the other series of the Trust managed by the Investment Advisor. |
The annual total expenses paid by the Multi-Strategy Fund (net of fee waivers) for the Fund’s most recent fiscal year were higher than the Peer Group and Fund Universe medians by 0.04% and 0.15%, respectively. The Trustees noted, however, that the average net assets of the Fund’s class considered by Broadridge were significantly lower than the average net assets of corresponding classes of funds in the Peer Group and Fund Universe, and that certain of those other funds also had significant assets in other classes.
First Trust Capital Management Funds
SUPPLEMENTAL INFORMATION (Unaudited) - Continued
The Board and the Independent Trustees concluded that based on the factors they had reviewed, the compensation payable to the Investment Advisor by each Fund under the Advisory Agreement was fair and reasonable in light of the nature and quality of the services the Investment Advisor provides to the Fund.
Profitability, Benefits to the Investment Advisor, and Economies of Scale
The Board next considered information prepared by the Investment Advisor relating to its costs and profits with respect to each Fund for the year ended January 31, 2023, noting that the Investment Advisor had agreed to maintain an expense limitation arrangement for each Fund through January 31, 2024. Recognizing the difficulty in evaluating an investment advisor’s profitability with respect to the funds it manages in the context of an advisor with multiple lines of business, and noting that other profitability methodologies might also be reasonable, the Board and the Independent Trustees concluded that the profits of the Investment Advisor from its relationships with each Fund were reasonable.
The Board also considered the benefits received by the Investment Advisor as a result of its relationship with the Funds, other than the receipt of its investment advisory fees, including any research received from broker-dealers providing execution services to the Merger Arbitrage Fund, the beneficial effects from the review by the Trust’s Chief Compliance Officer of the Investment Advisor’s compliance program, and the intangible benefits of the Investment Advisor’s association with the Funds generally and any favorable publicity arising in connection with the Funds’ performance. With respect to the Merger Arbitrage Fund, the Trustees noted that although there were no advisory fee breakpoints, the Fund’s capacity is likely to be constrained and therefore, the Investment Advisor does not expect to realize economies of scale with respect to the Fund. With respect to the Multi-Strategy Fund, the Trustees noted that the asset level of the Fund was not currently likely to lead to significant economies of scale, and that any such economies would be considered in the future as the assets of the Fund grow.
Angel Oak Capital Advisors, LLC
Nature, Extent and Quality of Services
The Board considered the overall quality of services provided by Angel Oak to the Multi-Strategy Fund. In doing so, the Board considered Angel Oak’s specific responsibilities in day-to-day management of a portion of the Fund’s assets utilizing an asset-backed fixed income market strategy, as well as the qualifications, experience, and responsibilities of the personnel involved in the activities of the Fund. The Board also considered the overall quality of the organization and operations of Angel Oak, as well as its compliance structure. The meeting materials indicated that Angel Oak’s portion of the Fund returned -6.52% for the one-year period ended January 31, 2023. The Trustees considered the Investment Advisor’s assertion that this negative performance was attributable to short-term pricing pressure during the rising interest rate environment, and that Angel Oak has continued to perform in line with expectations. The Trustees also considered that the Investment Advisor recommended renewing the Angel Oak Sub-Advisory Agreement. The Board and the Independent Trustees concluded that based on the various factors they had reviewed, the nature, overall quality, and extent of the management services provided by Angel Oak to the Multi-Strategy Fund were satisfactory.
Sub-Advisory Fee
The Board reviewed information regarding the sub-advisory fee charged by Angel Oak with respect to the Multi-Strategy Fund, and noted that Angel Oak serves as advisor to a registered fund and a UCITS fund, each of which has the same investment objective and investment strategies as Angel Oak’s portion of the Multi-Strategy Fund. The Trustees also noted that the sub-advisory fee that Angel Oak charges to manage its portion of the Fund is lower than the advisory fee that Angel Oak receives from the registered fund, and that Angel Oak provides more services as advisor to the registered fund than it does as sub-advisor to the Multi-Strategy Fund. The Trustees also observed that the Investment Advisor pays Angel Oak’s sub-advisory fee out of the Investment Advisor’s advisory fee.
First Trust Capital Management Funds
SUPPLEMENTAL INFORMATION (Unaudited) - Continued
The Board and the Independent Trustees concluded that based on the factors they had reviewed, the compensation payable to Angel Oak under the Angel Oak Sub-Advisory Agreement was fair and reasonable in light of the nature and quality of the services Angel Oak provides to the Multi-Strategy Fund.
Benefits to Angel Oak
The Board also considered the benefits received by Angel Oak as a result of its relationship with the Multi-Strategy Fund, other than the receipt of its sub-advisory fee, including any research received from broker-dealers providing execution services to the Fund, the beneficial effects from the review by the Trust’s Chief Compliance Officer of Angel Oak’s compliance program, the intangible benefits of Angel Oak’s association with the Fund generally, and any favorable publicity arising in connection with the Fund’s performance.
Glenmede Investment Management LP
Nature, Extent and Quality of Services
The Board considered the overall quality of services provided by Glenmede to the Multi-Strategy Fund. In doing so, the Board considered Glenmede’s specific responsibilities in day-to-day management of a portion of the Fund���s assets utilizing a secured options writing strategy, as well as the qualifications, experience, and responsibilities of the personnel involved in the activities of the Fund. The Board also considered the overall quality of the organization and operations of Glenmede, as well as its compliance structure. The meeting materials indicated that Glenmede’s portion of the Fund returned -4.56% for the period since Glenmede’s addition as a sub-advisor to the Multi-Strategy Fund’s portfolio in April 2022, through January 31, 2023. The Trustees noted the Investment Advisor’s observation that this negative performance was in line with expectations in providing an equity downside cushion for the Fund’s portfolio. The Trustees also noted that the Investment Advisor recommended renewing the Glenmede Sub-Advisory Agreement. The Board and the Independent Trustees concluded that based on the various factors they had reviewed, the nature, overall quality, and extent of the management services provided by Glenmede to the Multi-Strategy Fund were satisfactory.
Sub-Advisory Fee
The Board reviewed information regarding the sub-advisory fee charged by Glenmede with respect to the Multi-Strategy Fund, and noted that it was lower than the fee that Glenmede charges to manage institutional separate accounts using the same strategy up to the $50 million level, and greater than Glenmede’s fee for those clients above that level. The Board observed, however, that management of mutual fund assets requires compliance with certain requirements under the 1940 Act that do not apply to separately managed accounts. The Trustees also observed that the Investment Advisor pays Glenmede’s sub-advisory fee out of the Investment Advisor’s advisory fee.
The Board and the Independent Trustees concluded that based on the factors they had reviewed, the compensation payable to Glenmede under the Glenmede Sub-Advisory Agreement was fair and reasonable in light of the nature and quality of the services Glenmede provides to the Multi-Strategy Fund.
Benefits to Glenmede
The Board also considered the benefits received by Glenmede as a result of its relationship with the Multi-Strategy Fund, other than the receipt of its sub-advisory fee, including any research received from broker-dealers providing execution services to the Fund, the beneficial effects from the review by the Trust’s Chief Compliance Officer of Glenmede’s compliance program, the intangible benefits of Glenmede’s association with the Fund generally, and any favorable publicity arising in connection with the Fund’s performance.
First Trust Capital Management Funds
SUPPLEMENTAL INFORMATION (Unaudited) - Continued
Conclusion
Based on these and other factors, the Board and the Independent Trustees concluded that renewal of each Fund Advisory Agreement was in the best interests of each Fund and its shareholders and, accordingly, renewed each Fund Advisory Agreement with respect to the Funds, as applicable.
New Palmer Square Sub-Advisory Agreement
Background
In advance of the July meeting, the Board received information about the Multi-Strategy Fund and the New Palmer Square Sub-Advisory Agreement from the Investment Advisor, Palmer Square, and Mutual Fund Administration, LLC and UMB Fund Services, Inc., the Trust’s co-administrators, certain portions of which are discussed below. The materials, among other things, included information about the organization and financial condition of Palmer Square; information regarding the background, experience, and compensation structure of relevant personnel who would be providing services to the Fund; information about Palmer Square’s compliance policies and procedures, disaster recovery and contingency planning, and policies with respect to portfolio execution and trading; information regarding the performance of a registered investment company managed by Palmer Square with a similar investment objective and strategies as the portion of the Multi-Strategy Fund that would be sub-advised by Palmer Square (the “Registered Fund”) for the one-, three-, and five-year and since inception (August 2014) periods ended March 31, 2023; and information regarding the proposed sub-advisory fee under the New Palmer Square Sub-Advisory Agreement. The Board also received a memorandum from legal counsel to the Trust discussing the legal standards under the 1940 Act and other applicable law for their consideration of the proposed approval of the New Palmer Square Sub-Advisory Agreement. In addition, the Board considered information reviewed by the Board during the year at other Board and Board committee meetings. No representatives of the Investment Advisor or Palmer Square were present during the Board’s consideration of the New Palmer Square Sub-Advisory Agreement, and the Independent Trustees were represented by their legal counsel with respect to the matters considered.
In approving the New Palmer Square Sub-Advisory Agreement, the Board and the Independent Trustees considered a variety of factors, including those discussed below. In their deliberations, the Board and the Independent Trustees did not identify any particular factor that was controlling, and each Trustee may have attributed different weights to the various factors.
Nature, Extent and Quality of Services
With respect to the relevant performance information, the meeting materials indicated that the Registered Fund outperformed its benchmark, the Bloomberg U.S. Aggregate Bond Index, for the one-, three-, and five-year and since inception periods.
The Board considered the respective roles of the Investment Advisor and Palmer Square, noting that the Investment Advisor would provide overall supervision of the general investment management and investment operations of the Multi-Strategy Fund and oversee Palmer Square with respect to the Fund’s operations, including monitoring the investment and trading activities of Palmer Square, monitoring the Fund’s compliance with its investment policies, and providing general administrative services related to the Investment Advisor’s overall supervision of the Fund; and that the Palmer Square’s responsibilities would include day-to-day portfolio management of its portion of the Fund.
First Trust Capital Management Funds
SUPPLEMENTAL INFORMATION (Unaudited) - Continued
The Board and the Independent Trustees concluded that based on the various factors they had reviewed, Palmer Square would have the capabilities, resources, and personnel necessary to manage its portion of the Multi-Strategy Fund.
Sub-Advisory Fee
The Board reviewed information regarding the sub-advisory fee proposed to be charged by Palmer Square with respect to its portion of the Multi-Strategy Fund. The Trustees noted that the proposed sub-advisory fee was lower than Palmer Square’s advisory fee to manage the Registered Fund, and the same as the sub-advisory fee that the Investment Advisor pays to Palmer Square to sub-advise an interval fund. The Trustees also observed that Palmer Square’s proposed sub-advisory fee was within the range of advisory fees that Palmer Square charges to manage separate accounts for institutional and high net worth clients with similar objectives and policies as Palmer Square’s portion of the Fund. The Board further observed that management of mutual fund assets requires compliance with certain requirements under the 1940 Act that do not apply to Palmer Square’s other clients, and that Palmer Square will provide more services to its portion of the Fund than it does to the separately managed accounts that it manages. The Board also noted that the Investment Advisor recommended the approval of the New Palmer Square Sub-Advisory Agreement, and that the Investment Advisor would pay Palmer Square’s sub-advisory fee out of the Investment Advisor’s advisory fee.
The Board and the Independent Trustees concluded that the proposed compensation payable to Palmer Square under the New Palmer Square Sub-Advisory Agreement would be fair and reasonable in light of the nature and quality of the services proposed to be provided by Palmer Square to the Fund.
Benefits to Palmer Square
The Board also considered that the potential benefits to be received by Palmer Square as a result of its relationship with the Fund, other than the receipt of its sub-advisory fee, would include the usual types of “fall out” benefits received by sub-advisors to the Trust, including any research received from broker-dealers providing execution services to the Fund, the beneficial effects from the review by the Trust’s Chief Compliance Officer of Palmer Square’s compliance program, the intangible benefits of Palmer Square’s association with the Fund generally, and any favorable publicity arising in connection with the Fund’s performance.
Conclusion
Based on these and other factors, the Board and the Independent Trustees concluded that approval of the New Palmer Square Sub-Advisory Agreement was in the best interests of the Multi-Strategy Fund and its shareholders and, accordingly, approved the New Palmer Square Sub-Advisory Agreement.
First Trust Capital Management Funds
SUPPLEMENTAL INFORMATION (Unaudited) - Continued
Statement Regarding Liquidity Risk Management Program
The Securities and Exchange Commission adopted Rule 22e-4 under the Investment Company Act of 1940, as amended (the “Liquidity Rule”), to promote effective liquidity risk management throughout the open-end investment company industry, thereby reducing the risk that funds will be unable to meet their redemption obligations and mitigating dilution of the interests of fund shareholders.
The Board of Trustees (the “Board”) of Investment Managers Series Trust II (the “Trust”) met on April 19, 2023 (the “Meeting”), to review the liquidity risk management program (the “Fund Program”) applicable to the following series of the Trust (each, a “Fund” and together, the “Funds”) pursuant to the Liquidity Rule:
First Trust Merger Arbitrage Fund
First Trust Multi-Strategy Fund
The Board has appointed First Trust Capital Management, L.P., the investment adviser to the Funds, as the program administrator (“Program Administrator”) for the Fund Program. Under the Trust’s liquidity risk management program (the “Trust Program”), the Board has delegated oversight of the Trust Program to the Liquidity Oversight Committee (the “Oversight Committee”). At the Meeting, the Oversight Committee, on behalf of Program Administrator and the Funds, provided the Board with a written report (the “Report”) that addressed the operation, adequacy, and effectiveness of implementation of the Fund Program, and any material changes to it for the period from February 1, 2022 through January 31, 2023 (the “Program Reporting Period”).
In assessing the adequacy and effectiveness of implementation of the Fund Program, the Report discussed the following, among other things:
• The Fund Program’s liquidity classification methodology for categorizing each Fund’s investments (including derivative transactions);
• An overview of market liquidity for each Fund during the Program Reporting Period;
• Each Fund’s ability to meet redemption requests;
• Each Fund’s cash management;
• Each Fund’s borrowing activity, if any, in order to meet redemption requests;
• Each Fund’s compliance with the 15% limit of illiquid investments; and
• Each Fund’s status as a primarily highly liquid fund (“PHLF”), the effectiveness of the implementation of the PHLF standard, and whether it would be appropriate for each Fund to adopt a highly liquid investment minimum (“HLIM”).
The Report stated that the Funds primarily hold assets that are defined under the Liquidity Rule as "highly liquid investments," and therefore each Fund is not required to establish an HLIM. Highly liquid investments are defined as cash and any investment reasonably expected to be convertible to cash in current market conditions in three business days or less without the conversion to cash significantly changing the market value of the investment. The Report also stated that there were no material changes made to the Fund Program during the Program Reporting Period.
In the Report, the Program Administrator concluded that (i) the Fund Program, as adopted and implemented, remains reasonably designed to assess and manage each Fund’s liquidity risk; (ii) each Fund continues to qualify as a PHLF and therefore is not required to adopt an HLIM; (iii) during the Program Reporting Period, each Fund was able to meet redemption requests without significant dilution of remaining investors’ interests; and (iv) there were no weaknesses in the design or implementation of the Fund Program during the Program Reporting Period.
There can be no assurance that the Fund Program will achieve its objectives in the future. Please refer to the Funds’ prospectus for more information regarding each Fund’s exposure to liquidity risk and other principal risks to which an investment in the Funds may be subject.
First Trust Capital Management Funds
EXPENSE EXAMPLES
For the Six Months Ended September 30, 2023 (Unaudited)
Expense Examples
As a shareholder of the Funds, you incur two types of costs: (1) transaction costs including sales charges (loads) on purchases within certain classes; and (2) ongoing costs, including management fees, distribution and/or service (12b-1) fees (Class A and Class C only) and other Fund expenses. The examples below are intended to help you understand your ongoing costs (in dollars) of investing in the Funds and to compare these costs with the ongoing costs of investing in other mutual funds.
The Funds’ examples are based on an investment of $1,000 invested at the beginning of the period and held for the entire period from April 1, 2023 to September 30, 2023.
Actual Expenses
The information in the row titled “Actual Performance” of the table below provides actual account values and actual expenses. You may use the information in these columns, together with the amount you invested, to estimate the expenses that you paid over the period. Simply divide your account value by $1,000 (for example, an $8,600 account value divided by $1,000 = 8.6), then multiply the result by the number in the appropriate row under the column titled “Expenses Paid During Period” to estimate the expenses you paid on your account during this period.
Hypothetical Example for Comparison Purposes
The information in the row titled “Hypothetical (5% annual return before expenses)” of the table below provides hypothetical account values and hypothetical expenses based on the Fund’s actual expense ratios and an assumed rate of return of 5% per year before expenses, which is not the Fund’s actual return. The hypothetical account values and expenses may not be used to estimate the actual ending account balance or expenses you paid for the period. You may use this information to compare the ongoing costs of investing in the Funds and other funds. To do so, compare these 5% hypothetical examples with the 5% hypothetical examples that appear in the shareholder reports of the other funds.
Please note that the expenses shown in the table are meant to highlight your ongoing costs only and do not reflect any transaction costs, such as sales charges (load) or contingent deferred sales charges. Therefore, the information in the row titled “Hypothetical (5% annual return before expenses)” is useful in comparing ongoing costs only, and will not help you determine the relative total costs of owning different funds. In addition, if these transactional costs were included, your costs would have been higher.
| Merger Arbitrage Fund | Beginning Account Value | Ending Account Value | Expenses Paid During Period* |
| 4/1/23 | 9/30/23 | 4/1/23 – 9/30/23 |
| Class A | Actual Performance | $ | 1,000.00 | $ | 1,012.30 | $ | 11.03 |
| | Hypothetical (5% annual return before expenses) | | 1,000.00 | | 1,014.10 | | 11.04 |
| Class I | Actual Performance | | 1,000.00 | | 1,013.90 | | 9.32 |
| | Hypothetical (5% annual return before expenses) | | 1,000.00 | | 1,015.81 | | 9.33 |
| * | Expenses are equal to the Fund’s annualized expense ratios of 2.19% and 1.85% for the Class A and Class I shares, respectively, multiplied by the average account values over the period, multiplied by 183/365 (to reflect the six-month period) for Class A shares and Class I shares. Assumes all dividends and distributions were reinvested. |
First Trust Capital Management Funds
EXPENSE EXAMPLES - Continued
For the Six Months Ended September 30, 2023 (Unaudited)
| Multi-Strategy Fund | Beginning Account Value | Ending Account Value | Expenses Paid During Period* |
| 4/1/23 | 9/30/23 | 4/1/23 – 9/30/23 |
| Class A | Actual Performance | $ | 1,000.00 | $ | 1,029.60 | $ | 10.03 |
| | Hypothetical (5% annual return before expenses) | | 1,000.00 | | 1,015.19 | | 9.95 |
| Class C | Actual Performance | $ | 1,000.00 | | 1,026.50 | | 13.83 |
| | Hypothetical (5% annual return before expenses) | | 1,000.00 | | 1,011.42 | | 13.73 |
| Class I | Actual Performance | | 1,000.00 | | 1,031.80 | | 8.59 |
| | Hypothetical (5% annual return before expenses) | | 1,000.00 | | 1,016.61 | | 8.53 |
| * | Expenses are equal to the Fund’s annualized expense ratios of 1.97%, 2.72% and 1.69% for Class A, Class C and Class I shares, respectively, multiplied by the average account values over the period, multiplied by 183/365 (to reflect the six-month period) for Class A, Class C and Class I shares. Assumes all dividends and distributions were reinvested. |
This page is intentionally left blank
The First Trust Capital Management Funds
Each a series of Investment Managers Series Trust II
Investment Advisor
First Trust Capital Management L.P.
225 West Wacker Drive, 21st Floor
Chicago, Illinois 60606
Sub-Advisor
Glenmede Investment Management, LP
1650 Market Street, Suite 1200
Philadelphia, Pennsylvania 19103
Sub-Advisor
Palmer Square Capital Management, LLC
1900 Shawnee Mission Parkway, Suite 315
Mission Woods, Kansas 99205
Independent Registered Public Accounting Firm
Tait, Weller & Baker LLP
Two Liberty Place
50 South 16th Street, Suite 2900
Philadelphia, Pennsylvania 19102
Custodian
UMB Bank, n.a.
928 Grand Boulevard, 5th Floor
Kansas City, Missouri 64106
Fund Co-Administrator
Mutual Fund Administration, LLC
2220 East Route 66, Suite 226
Glendora, California 91740
Fund Co-Administrator, Transfer Agent and Fund Accountant
UMB Fund Services, Inc.
235 West Galena Street
Milwaukee, Wisconsin 53212
Distributor
First Trust Portfolios L.P.
120 E. Liberty Drive, Suite 400
Wheaton, Illinois 60187
FUND INFORMATION
| | TICKER | CUSIP |
| First Trust Arbitrage Fund – Class A | VARAX | 46141T 877 |
| First Trust Arbitrage Fund – Class I | VARBX | 46141T 869 |
| First Trust Multi-Strategy Fund – Class A | FTMAX | 46141T 687 |
| First Trust Multi-Strategy Fund – Class C | FTMCX | 46144X 511 |
| First Trust Multi-Strategy Fund – Class I | FTMIX | 46141T 679 |
Privacy Principles of the First Trust Capital Management Funds for Shareholders
The Funds are committed to maintaining the privacy of their shareholders and to safeguarding their non-public personal information. The following information is provided to help you understand what personal information the Funds collect, how we protect that information and why, in certain cases, we may share information with select other parties.
Generally, the Funds do not receive any non-public personal information relating to their shareholders, although certain non-public personal information of their shareholders may become available to the Funds. The Funds do not disclose any non-public personal information about their shareholders or former shareholders to anyone, except as permitted by law or as is necessary in order to service shareholder accounts (for example, to a transfer agent or third party administrator).
This report is sent to shareholders of the First Trust Capital Management Funds for their information. It is not a Prospectus, circular or representation intended for use in the purchase or sale of shares of the Funds or of any securities mentioned in this report.
Proxy Voting
The Funds’ proxy voting policies and procedures, as well as information regarding how the Funds voted proxies for portfolio securities, if applicable, during the most recent 12-month period ended June 30, are available, without charge and upon request by calling (877) 779-1999 or on the SEC’s website at www.sec.gov.
Fund Portfolio Holdings
The Funds file a complete schedule of their portfolio holdings with the SEC for the first and third quarters of each fiscal year on Form N-PORT within 60 days of the end of such fiscal quarter. Shareholders may obtain the Funds’ Form N-PORT on the SEC’s website at www.sec.gov.
Prior to the use of Form N-PORT, the Funds filed their complete schedule of portfolio holdings with the SEC on Form N-Q, which is available online at www.sec.gov.
Householding
The Funds will mail only one copy of shareholder documents, including prospectuses, notice of annual and semi-annual reports availability and proxy statements, to shareholders with multiple accounts at the same address. This practice is commonly called “householding” and is intended to reduce expenses and eliminate duplicate mailings of shareholder documents. Mailings of your shareholder documents may be householded indefinitely unless you instruct us otherwise. If you do not want the mailing of these documents to be combined with those for other members of your household, please call the Funds at (877) 779-1999.
First Trust Capital Management Funds
P.O. Box 2175
Milwaukee, WI 53201
Toll Free: (877) 779-1999
Item 1. Report to Stockholders (Continued).
(b) Not applicable.
Item 2. Code of Ethics.
The registrant has adopted a code of ethics that applies to the registrant's principal executive officer and principal financial officer. The registrant has not made any amendments to its code of ethics during the period covered by this report. The registrant has not granted any waivers from any provisions of the code of ethics during the period covered by this report.
The registrant undertakes to provide to any person without charge, upon request, a copy of its code of ethics by mail when they call the registrant at 1-877-779-1999.
Item 3. Audit Committee Financial Expert.
The Board of Trustees of the Registrant has determined that the Registrant has the following “audit committee financial experts” as defined in Item 3(b) of Form N-CSR serving on its Audit Committee: Messrs. Thomas Knipper and John P. Zader. The audit committee financial experts are “independent” as that term is defined in Item 3(a)(2) of Form N-CSR.
Item 4. Principal Accountant Fees and Services.
The registrant has engaged its principal accountant to perform audit services, audit-related services, tax services and other services during the past two fiscal years. "Audit services" refer to performing an audit of the registrant's annual financial statements or services that are normally provided by the accountant in connection with statutory and regulatory filings or engagements for those fiscal years. "Audit-related services" refer to the assurance and related services by the principal accountant that are reasonably related to the performance of the audit. "Tax services" refer to professional services rendered by the principal accountant for tax compliance, tax advice, and tax planning. There were no "other services" provided by the principal accountant. The following table details the aggregate fees billed or expected to be billed for each of the last two fiscal years for audit fees, audit-related fees, tax fees and other fees by the principal accountant.
| First Trust Merger Arbitrage Fund | FYE 9/30/2023 | FYE 9/31/2022 |
| Audit Fees | $13,500 | $12,500 |
| Audit-Related Fees | N/A | N/A |
| Tax Fees | $2,500 | $2,500 |
| All Other Fees | N/A | N/A |
| First Trust Multi-Strategy Fund | FYE 9/30/2023 | FYE 9/30/2022 |
| Audit Fees | $13,500 | $12,500 |
| Audit-Related Fees | N/A | N/A |
| Tax Fees | $2,500 | $2,500 |
| All Other Fees | N/A | N/A |
The audit committee has adopted pre-approval policies and procedures that require the audit committee to pre-approve all audit and non-audit services of the registrant, including services provided to any entity affiliated with the registrant.
The percentage of fees billed by Tait, Weller, & Weller LLP applicable to non-audit services pursuant to waiver of pre-approval requirement were as follows:
| First Trust Merger Arbitrage Fund | FYE 9/30/2023 | FYE 9/30/2022 |
| Audit-Related Fees | 0% | 0% |
| Tax Fees | 0% | 0% |
| All Other Fees | 0% | 0% |
| First Trust Multi-Strategy Fund | FYE 9/30/2023 | FYE 9/30/2022 |
| Audit-Related Fees | 0% | 0% |
| Tax Fees | 0% | 0% |
| All Other Fees | 0% | 0% |
All of the principal accountant's hours spent on auditing the registrant's financial statements were attributed to work performed by full-time permanent employees of the principal accountant.
The following table indicates the non-audit fees billed or expected to be billed by the registrant's accountant for services to the registrant and to the registrant's investment advisor (and any other controlling entity, etc.—not sub-advisor) for the last two years. The audit committee of the Board of Trustees has considered whether the provision of non-audit services that were rendered to the registrant's investment advisor is compatible with maintaining the principal accountant's independence and has concluded that the provision of such non-audit services by the accountant has not compromised the accountant's independence.
| First Trust Merger Arbitrage Fund | | |
| Non-Audit Related Fees | FYE 9/30/2023 | FYE 9/30/2022 |
| Registrant | N/A | N/A |
| Registrant’s Investment Advisor | N/A | N/A |
| First Trust Multi-Strategy Fund | | |
| Non-Audit Related Fees | FYE 9/30/2023 | FYE 9/30/2022 |
| Registrant | N/A | N/A |
| Registrant’s Investment Advisor | N/A | N/A |
Item 5. Audit Committee of Listed Registrants.
| (a) | Not applicable to registrants who are not listed issuers (as defined in Rule 10A-3 under the Securities Exchange Act of 1934). |
Item 6. Schedule of Investments.
| (a) | Schedule of Investments is included as part of the report to shareholders filed under Item 1 of this Form. |
Item 7. Disclosure of Proxy Voting Policies and Procedures for Closed-End Management Investment Companies.
Not applicable to open-end investment companies.
Item 8. Portfolio Managers of Closed-End Management Investment Companies.
Not applicable to open-end investment companies.
Item 9. Purchases of Equity Securities by Closed-End Management Investment Company and Affiliated Purchasers.
Not applicable.
Item 10. Submission of Matters to a Vote of Security Holders.
The registrant has not made any material changes to the procedures by which shareholders may recommend nominees to the registrant’s Board of Trustees.
Item 11. Controls and Procedures.
| (a) | The Registrant’s President/Chief Executive Officer and Treasurer/Chief Financial Officer have reviewed the Registrant's disclosure controls and procedures (as defined in Rule 30a-3(c) under the Investment Company Act of 1940 (the “Act”)) as of a date within 90 days of the filing of this report, as required by Rule 30a-3(b) under the Act and Rules 13a-15(b) or 15d-15(b) under the Securities Exchange Act of 1934. Based on their review, such officers have concluded that the disclosure controls and procedures are effective in ensuring that information required to be disclosed in this report is appropriately recorded, processed, summarized and reported and made known to them by others within the Registrant and by the Registrant’s service provider. |
| (b) | There were no changes in the Registrant's internal control over financial reporting (as defined in Rule 30a-3(d) under the Act) that occurred during the period covered by this report that has materially affected, or is reasonably likely to materially affect, the Registrant's internal control over financial reporting. |
Item 12. Disclosure of Securities Lending Activities for Closed-End Management Investment Companies.
Not applicable to open-end investment companies.
Item 13. Exhibits.
(2) Certifications pursuant to Section 302 of the Sarbanes-Oxley Act of 2002. Filed herewith.
(3) Any written solicitation to purchase securities under Rule 23c-1 under the Act sent or given during the period covered by the report by or on behalf of the registrant to 10 or more persons. Not applicable to open-end investment companies.
(4) Change in the registrant’s independent public accountant. There was no change in the registrant’s independent public accountant for the period covered by this report.
SIGNATURES
Pursuant to the requirements of the Securities Exchange Act of 1934 and the Investment Company Act of 1940, the registrant has duly caused this report to be signed on its behalf by the undersigned, thereunto duly authorized.
| (Registrant) | Investment Managers Series Trust II | |
| | | |
| By (Signature and Title) | /s/ Terrance Gallagher | |
| | Terrance Gallagher, President/Chief Executive Officer | |
| | | |
| Date | 12/8/2023 | |
Pursuant to the requirements of the Securities Exchange Act of 1934 and the Investment Company Act of 1940, this report has been signed below by the following persons on behalf of the registrant and in the capacities and on the dates indicated.
| By (Signature and Title) | /s/ Terrance Gallagher | |
| | Terrance Gallagher, President/Chief Executive Officer | |
| | | |
| Date | 12/8/2023 | |
| | | |
| By (Signature and Title) | /s/ Rita Dam | |
| | Rita Dam, Treasurer/Chief Financial Officer | |
| | | |
| Date | 12/8/2023 | |

