UNITED STATES
SECURITIES AND EXCHANGE COMMISSION
Washington, D.C. 20549
FORM N-CSR
CERTIFIED SHAREHOLDER REPORT OF REGISTERED
MANAGEMENT INVESTMENT COMPANIES
Investment Company Act file number 811-22894
INVESTMENT MANAGERS SERIES TRUST II
(Exact name of registrant as specified in charter)
235 W. Galena Street
Milwaukee, WI 53212
(Address of principal executive offices) (Zip code)
Diane J. Drake
Mutual Fund Administration, LLC
2220 E. Route 66, Suite 226
Glendora, CA 91740
(Name and address of agent for service)
(626) 385-5777
Registrant's telephone number, including area code
Date of fiscal year end: September 30
Date of reporting period: September 30, 2023
Item 1. Report to Stockholders.
The registrant’s annual report transmitted to shareholders pursuant to Rule 30e-1 under the Investment Company Act of 1940, as amended (the “Investment Company Act”), is as follows:

| AXS Multi-Strategy Alternatives Fund | AXS Adaptive Plus Fund |
| (Investor Class: KCMTX) | (Class I: AXSPX) |
| (Class I: KCMIX) | |
| | AXS Income Opportunities Fund |
| AXS Sustainable Income Fund | (Class A: OIOAX) |
| (Class I: AXSKX) | (Class D: OIODX) |
| | (Class I: OIOIX) |
| AXS Thomson Reuters Venture Capital Return Tracker Fund | |
| (Class A: LDVAX) | AXS Dynamic Opportunity Fund |
| (Class C: LDVCX) | (Class A: ADOAX) |
| (Class I: LDVIX) | (Class I: ADOIX) |
| | |
| AXS Merger Fund | AXS Tactical Income Fund |
| (Investor Class: GAKAX) | (Class A: TINAX) |
| (Class I: GAKIX) | (Class I: TINIX) |
| | |
| AXS Alternative Value Fund | AXS Chesapeake Strategy Fund |
| (Investor Class: COGLX) | (Class A: ECHAX) |
| (Class I: COGVX) | (Class C: ECHCX) |
| | (Class I: EQCHX) |
| AXS Market Neutral Fund | |
| (Investor Class: COGMX) | |
| (Class I: COGIX) | |
ANNUAL REPORT
SEPTEMBER 30, 2023
AXS Funds
Each a series of Investment Managers Series Trust II
Table of Contents
| Shareholder Letters | 1 |
| Fund Performances | 26 |
| Schedule of Investments | 48 |
| Consolidated Schedule of Investments | 103 |
| Statements of Assets and Liabilities | 106 |
| Consolidated Statements of Assets and Liabilities | 112 |
| Statements of Operations | 113 |
| Consolidated Statements of Operations | 117 |
| Statements of Changes in Net Assets | 118 |
| Consolidated Statements of Changes in Net Assets | 128 |
| Statement of Cash Flows | 129 |
| Financial Highlights | 132 |
| Consolidated Financial Highlights | 152 |
| Notes to Financial Statements | 155 |
| Notes to Consolidated Financial Statements | 190 |
| Report of Independent Registered Public Accounting Firm | 204 |
| Supplemental Information | 208 |
| Expense Examples | 212 |
This report and the financial statements contained herein are provided for the general information of the shareholders of the AXS Funds. This report is not authorized for distribution to prospective investors in the Fund unless preceded or accompanied by an effective prospectus.
www.axsinvestments.com

Dear Fellow Shareholders,
We write this annual shareholder letter for the AXS Multi-Strategy Alternatives Fund (“the Fund”) as of fiscal year end on September 30, 2023.
OVERVIEW
The fiscal year saw a choppy equity rebound beginning in October through late June only to experience a subsequent pullback in the months that followed. To expand on the market recovery, there were seven mega-cap stocks that led the market during this period while the rest of the market lagged far behind the “Magnificent 7”. Federal Reserve tightening from 3.25% to 5.50% kept inflation at bay. The overall U.S. bond market was relatively flat for the period due to tightening conditions, leading investors to seek returns in equities or refuge in short term treasury bills. Commodities were mixed during the period, with oil relatively flat and gold/silver up.
INVESTMENT STRATEGY
The AXS Multi-Strategy Alternatives Fund is a liquid, equity-focused macro fund with the flexibility to invest globally and tactically, including long/short, across all asset classes. The Fund's flexible mandate gives it the ability to invest globally in a wide variety of asset classes, company sizes, industries and equity styles (e.g., growth vs. value). It can also employ leverage to accentuate market moves and hedge in an effort to control risk and manage volatility. Quantitative, top-down hedging and bottoms-up stock picking tools are used, which help reduce emotion and behavioral biases in investment decision-making.
INVESTMENT PHILOSOPHY
The AXS Multi-Strategy Alternatives Fund employs a risk-averse investment strategy predicated on the belief that strong long-term investment results are best achieved through the compounding of reasonable gains and the avoidance of major losses. The Fund strives to be nimble and responsive to significant market cycle changes by moving out of “harm’s way” during recessions and capitalizing on opportunistic equity strategies during stronger markets. Said another way, the Fund strives to both “manage and participate” by “de-risking” the portfolio in dangerous markets and “re-risking” or “re-engaging” the portfolio to return generating assets when markets are stronger.
INVESTMENT PROCESS
| 1. | Long-term growth of capital |
The Fund’s mandate gives it the flexibility to invest globally in any asset class, long or short. The Fund is equity-focused, as historically owning common stocks and certain ETFs have offered the greatest opportunity to grow capital over time. The Fund determines whether to be invested in stocks via equity exposure rules. The Fund uses a "Risk On/Risk Off" hedging process. If Risk is On, the Fund employs several quantitative equity strategies (algorithms) to make buy/sell decisions. These algorithms are based on a variety of inputs and are designed to exploit opportunities in the marketplace. Each strategy may focus on fundamental factors (such as earnings, debt, free cash flow1, dividends and industry leadership) and technical factors (including price, momentum, volume, volatility and breadth). Each algorithm has its own ranking system and buy/sell rules. Most of the strategies set sector-based exposure ceilings, with individual stocks limited to about 3% of AUM at the Fund level. This diversification helps reduce sector and stock-specific risk. International allocations are made in the same manner and held in American Depositary Receipts (ADRs).
| 1 | Free cash flow is the cash a company generates after taking into consideration cash outflows that support its operations and maintain its capital assets. In other words, free cash flow is the cash left over after a company pays for its operating expenses and capital expenditures. |
| 2. | Preservation of capital |
If Risk is Off, the Fund will hedge using three approaches: (a) buying index ETFs that act inversely to the stock market to create a market neutral or net short posture, (b) shorting index ETFs via total return swap trades, and (3) by investing in noncorrelated asset classes such as bonds, precious metals or currencies through the use of ETFs. The Fund can also use cash as a defensive position.
PERFORMANCE
Class I shares2 of the Fund (KCMIX) returned 11.60% for the period, outpacing the benchmark Wilshire Liquid Alternative Global Macro Total Return Index3 which declined -3.79%. “Magnificent 7” holdings Apple, Amazon, Microsoft, Nvidia and Tesla contributed to fund returns, while Centene, Synchrony Financial, CorVel, Universal Insurance Holdings and Expedia detracted from fund returns.
OUTLOOK
Going forward, fiscal 2024 should prove interesting as the nation faces a presidential election amid multiple geopolitical conflicts and pesky inflationary pressures. Whatever the stock market does, the Fund will attempt to adjust to the conditions.
Investors cannot directly invest in an index and unmanaged index returns do not reflect any fees, expenses or sales charges. The views in this letter were as of September 30, 2023 and may not necessarily reflect the same views on the date this letter is first published or any time thereafter. These views are intended to help shareholders in understanding the Fund’s investment methodology and do not constitute investment advice.
Faithfully yours,
Parker B. Binion
Head of Investments, AXS Investments LLC
Fund holdings and/or sector allocations are subject to change. Please see the Schedule of Investments for information on current holdings.
Past performance does not guarantee future results.
| 2 | Investor class shares (KCMTX) returned 11.47% for the fiscal year. |
| 3 | The Wilshire Liquid Alternative Global Macro Index℠ measures the performance of the global macro strategy component of the Wilshire Liquid Alternative Index. Global macro strategies predominantly invest in situations driven by the macro-economic environment across the capital structure as well as currencies and commodities. Created in 2014, with a time series of data beginning on June 30, 2006, the Wilshire Liquid Alternative Global Macro Index (WLIQAGM) is designed to provide a broad measure of the liquid alternative global macro market. |
Mutual funds involve risk including possible loss of principal. There is no assurance that the Fund will achieve its investment objective. The Fund may invest in small, less well-known companies, which may be subject to more erratic market movements than large cap stocks; foreign securities, which are subject to currency fluctuations and political uncertainty; and derivative securities, which may carry market, credit and liquidity risks. The Fund may also engage in short selling activities, which are more risky than long positions because the potential loss on a short sale is unlimited. The Fund may use leveraging and/or hedging techniques that could fail if changes in the value of the derivative do not correlate with the securities being hedged. These risks may result in greater share price volatility. Risks of futures contracts may arise from an imperfect correlation between movements in the price of the instruments and the price of the underlying securities. The Fund’s use of futures contracts exposes the Fund to leverage risk because of small margin requirements relative to futures contract value. Swap transactions may alter the Fund’s exposure to long-term or short-term interest rates, foreign currency values, corporate borrowing rates, or other factors such as security prices or inflation rates and also may alter the Fund’s volatility. Selling covered calls limits the upside potential of the underlying security. Selling put options may require the Fund to purchase the underlying securities during periods of declining prices. Premiums paid to purchase options lose value over time and may be lost entirely, if the option expires before it is feasible to be exercised. The protection from selling puts is limited to the strike price minus the premium paid. Investing in REITs involves risks similar to those associated with investing in small capitalization companies. Generally, fixed income securities decrease in value if interest rates rise and increase in value if interest rates fall. Exposure to the commodities markets (including financial futures markets) may subject the Fund to greater volatility.
 | Uniplan Investment Counsel, Inc.
839 North Jefferson Street
Milwaukee, WI 53202-3759
www.Uniplanic.com 262-534-3000 |
For the fiscal year ending September 30, 2023, the AXS Sustainable Income Fund’s Class I share has returned 3.49% vs the ICE BofA 1-3 Year US Corporate & Government Index return of 2.89%. Relative to the Index, the Fund was primarily impacted from a tightening of credit spreads particularly in the investment grade segment of the credit markets while the non-investment grade segment remained relatively flat, where greater than 50% of the portfolio holdings are represented.
Fixed income markets were under pressure throughout much of the fiscal year, with corporate credit holding up more favorably than municipal and government debt. High yield corporate debt which constitutes most of the portfolio holdings, has outperformed investment grade during the period. As the Fed embarked on its hiking cycle throughout the fiscal year, bond prices largely fell in lockstep. As we move towards the end of calendar year 2023, it appears the Fed is approaching an end to the current hiking cycle, with a pause in rate adjustment likely to extend into 2024.
On a sector basis, our returns were most negatively impacted by energy, specifically our renewable energy exposure which as an industry have come under pressure due to higher costs of capital and a more saturated competitive environment suppressing pricing power. We were most benefited by Information Technology, where tailwinds from AI-related spend and a focus on high quality issuers has more than offset the sector’s general sensitivity to higher costs of capital to fuel growth.
Top contributors during FY23 included Zscaler, a cloud security company; Harrow Health, an eyecare pharmaceutical company; and Hannon Armstrong Sustainable Infrastructure Capital, a provider of capital to sustainable infrastructure markets. The biggest detractors from performance were Enphase Energy, a manufacturer of solar energy equipment; Venator Materials, a manufacturer of chemical products; and Sunnova Energy, a provider of renewable energy solutions.
“Higher for Longer” rhetoric has been the consistent theme in FY23. The Fed has maintained its stance on the need for higher interest rates to curb inflation and hiked rates throughout the year. Correspondingly, this led to bond yields rising throughout the period, with pockets of volatility such as the Silicon Valley Bank collapse in March. This brief interruption brought forth fears of financial contagion, and with it a perception that the Fed may need to pause or cut rates sooner rather than later to ensure the banking system remained fully functional. Thankfully, these concerns have largely subsided, which has led to a resumption in the upward trend in treasury yields.
As of 9/30/23, most of the Yield Curve was at or near YTD highs, and multi-year highs not seen since the Great Financial Crisis. The widely watched inversion on 2-10Y Treasuries peaked above 100 basis points before ending the period at an inverted 48 basis points. The 10-Year yield has outpaced a rising 2-Year yield in recent months to partially unwind the extent of backwardness in the yield curve. The fixed income landscape as of 9/30/23 includes the inverted yield curve, a common harbinger of economic recession, and markets becoming more receptive to the Fed’s “Higher for Longer” messaging that suggests rates may remain elevated for the intermediate future until inflation is explicitly retreating towards the Fed’s long-term target of 2%.
The elevated volatility within fixed income did provide some opportunities for divestment of non-thematic holdings, as well as initiation of some new positions within the portfolio. Throughout FY23, we exited many smaller positions in favor of more concentrated holdings in companies who more clearly fit the fund’s Next Economy objectives. Several companies in which we allocated greater capital include, Equinix, Digital Realty, and Darling Ingredients. Equinix and Digital Realty are data center REITs, with the former offering a green bond with an attractive spread relative to the market. Darling Ingredients collects and recycles animal processing by-products and used restaurant cooking oil to offer sustainable ingredients.
As we continue to reshape the portfolio toward our sustainable income objectives, we remain selective and patient, being opportunistic as market volatility continues through the end of the calendar year. Our focus remains sharply on duration risk as well as credit quality, as higher rates and a potential recession, continue to put pressure on the lower end of the credit spectrum.
Finally, given the higher cash levels seen recently in the portfolio, we have continued to ladder in some short-term treasuries, which currently provide an attractive yield yet also provide ample liquidity for portfolio changes as market opportunities arise amidst continued volatility.
Disclosures:
Duration is the measure of the price sensitivity of a bond to changes in interest rates.
The Consumer Price Index (CPI), as calculated by the Bureau of Labor Statistics, measures the monthly change in prices paid by U.S. consumers for a basket of goods and services representative of aggregate U.S. consumer spending.
The ICE U.S. Dollar Index is an index of the value of the U.S. dollar relative to a basket of foreign currencies.
The ICE BofA Merrill Lynch 1-3 Year US Corporate & Government Index is the performance of U.S. dollar denominated investment grade debt publicly issued in the U.S. domestic market, including U.S. Treasury, U.S. agency, foreign government, supranational and corporate securities. The index does not reflect expenses, fees or sales charge, which would lower performance. The index is unmanaged and is not available for investment. Investors cannot directly invest in an index.
Fund holdings and/or sector allocations are subject to change. Please see the Schedule of Investments for information on current holdings.
Mutual funds involve risk including possible loss of principal. There is no assurance that the Fund will achieve its investment objective. The market price of a security may decline due to general market conditions that are not specifically related to a particular company, changes in the general outlook for corporate earnings, changes in interest or currency rates, or adverse investor sentiment. The prices of fixed income securities respond to economic developments as well as to changes in an issuer’s credit rating or market perceptions about the creditworthiness of an issuer. High yield bonds are debt securities rated below investment grade and are speculative, involve greater risks of default, downgrade, or price declines and are more volatile and tend to be less liquid than investment-grade securities. If an issuer of a debt security held by the Fund defaults or is downgraded, or if the value of the assets underlying a security declines, the value of the Fund’s portfolio will typically decline. Generally fixed income securities decrease in value if interest rates rise and increase in value if interest rates fall, with longer-term securities being more sensitive than shorter-term securities. While the Sub-Adviser believes that the integration of ESG analysis as part of the investment process contributes to its risk management approach, the Fund’s consideration of ESG criteria in making its investment decisions may affect the Fund’s exposure to risks associated with certain issuers, industries and sectors, which may impact the Fund’s investment performance.
The views in this letter were as of September 30, 2023 and may not necessarily reflect the same views on the date this letter is first published or any time thereafter. These views are intended to help shareholders in understanding the fund’s investment methodology and do not constitute investment advice.
Dear Shareholders,
Thank you for your continued investment and interest in the AXS Thomson Reuters Venture Capital Return Tracker Fund (the “Fund”). This letter addresses the fiscal year ending September 30, 2023.
OVERVIEW
Fund performance occurred with the backdrop of a choppy equity rebound beginning in October 2022 and lasting through late June before faltering a bit in the third quarter of 2023. Inflation was held in check for much of the period due to the Federal Reserve tightening cycle. The bond market was relatively flat for the period due to tightening conditions, leading investors to seek returns in equities.
As an indexed-based strategy, the Fund is designed to track the performance of its underlying index which seeks to replicate the aggregate risk and performance profile of the Venture Capital space.
PERFORMANCE
The AXS Thomson Reuters Venture Capital Return Tracker Fund is available in class A, I, and C shares. For the fiscal year ended September 30, 2023, performance for the A share was 32.56% (24.96% with load), the I share returned 32.80%, and the C share returned 31.55%. Fund performance was in line with the Thomson Reuters Venture Capital Index1 gross performance of 33.87%. The Fund’s prospectus benchmark NASDAQ Composite Total Return Index returned 26.11%
INVESTMENT STRATEGY
The Fund replicates the exposures of its underlying index using U.S. listed equities and total return swaps to create economic leverage and to implement a relative-value overlay. U.S. listed equities provide exposures to the economic sectors represented by the universe of venture capital backed private companies.
The index is constructed using the Thomson Reuters Business Classification (TRBC) to classify and measure the direct economic exposures of the universe of venture capital backed companies. In certain instances, the economic sectors are more specific, as is the case for Software and Technology Equipment, rather than that more general Technology. During the period, Software, Heath Care Services, Industrials, Technology Equipment, and Non-Cyclical Consumer Goods & Services consistently ranked as the top 5 sectors of the underlying index to represent the primary exposures of the index. The aggregate sector weights are determined by the index and implemented by the fund.
The index selects U.S. listed large cap equities among the respective sectors and weights the membership according to their market value subject to a 4.5% (ex-cash) weight constraint. Each sector is diversified in the number of securities within each sector and through use of the weight constraint. In this manner, the intent is to reduce idiosyncratic risks and to isolate the systemic risks of each sector. The Fund implements the index membership in both the security and relative target weights.
| 1 | The Thomson Reuters Venture Capital Index utilizes a prosperity model designed by DSC Quantitative Group, LLC (“DSC”). The index: 1) identifies a set of publicly listed assets weighted in an attempt replicate the returns of the Venture Capital universe, 2) utilizes economic factors and market indicators to calculate optimal asset weights and 3) modifies the portfolio over time to reflect changes in the venture capital universe. |
OUTLOOK
As index-based strategies, the Funds are designed to track their underlying indexes and are passively managed. The indexes replicate the average returns of the venture capital and private equity space. Direct investment in these strategies have required large capital commitments and long lock-up periods in private LP structures resulting in the need for long-term investment horizons. Replication strategies using an open-end mutual fund structure address these hurdles by allowing lower investment minimums and offering daily liquidity.
Institutions have utilized these strategies as long-term strategic investments and we suggest the outlook for these strategies should undertake a similar approach. These strategies serve as tools to achieve a strategic allocation to the venture capital and private equity space. The passive, rules-based investment process is consistently applied throughout various market environments.
We thank you for your continued support and confidence in our implementation of these strategies.
Investors cannot directly invest in an index and unmanaged index returns do not reflect any fees, expenses or sales charges. The views in this letter were as of September 30, 2023 and may not necessarily reflect the same views on the date this letter is first published or any time thereafter. These views are intended to help shareholders in understanding the Fund’s investment methodology and do not constitute investment advice.
Faithfully yours,
Parker B. Binion
Head of Investments, AXS Investments LLC
Past performance does not guarantee future results.
Mutual funds involve risk including possible loss of principal. There is no assurance that the Funds will achieve their investment objective. Investments in equity securities are subject to overall market risks. To the extent that the Funds’ investments are concentrated in or significantly exposed to a particular sector, the Funds will be susceptible to loss due to adverse occurrences affecting that sector. Loss may result from the Funds’ investments in derivatives. These instruments may be illiquid, difficult to value and leveraged so that small changes may produce disproportionate losses to the Fund. Over the counter derivatives, such as swaps, are also subject to counterparty risk, which is the risk that the other party in the transaction will not fulfill its contractual obligation. In certain circumstances, it may be difficult for the Funds to purchase and sell particular derivative investments within a reasonable time at a fair price.
AXS Thomson Reuters Venture Capital Return Tracker Fund
Venture capital investments involve a greater degree of risk; as a result, the Fund’s returns may experience greater volatility than the overall market. The Fund does not invest in venture capital funds nor does it invest directly in the company funded by venture capital funds. The Fund seeks to generate returns that mimic the aggregate returns of U.S. venture capital backed companies as measured by the Thomson Reuters Venture Capital Index (TRVCI). There is a risk that Funds’ return many not match or achieve a higher degree of correlation with the return of the TRVCI. Additionally, the TRVCI’s return may not match or achieve a high degree of correlation with the return of the U.S. venture capital-based companies.

September 30, 2023
Dear Fellow Shareholders:
The AXS Merger Fund (the “Fund”) returned +6.98% and +7.23% for the Investor Class and Class I, respectively, for fiscal year ended September 30, 2023.
Portfolio Review
In 2023, the Fund invested in approximately 124 different merger situations, up 4.2% over last year despite a marked decrease in activity. The portfolio was heavily concentrated in North America. Strategic deals made up around 90% of the Fund’s holdings, on average, up slightly from its average over the last several years.
Deal volume was $616 billion in the quarter ending September 30th, down 4% from the same quarter a year ago. Continued regulatory scrutiny caused deals worth more than $10 billion to drop an unsurprising 42%. The U.S. saw a 35% jump from the third quarter of last year to $356.5 billion, while Europe saw a 31% drop. Healthcare once again buoyed the buyout market with a 25% jump in volumes with large pharmaceutical companies filling holes in their pipelines, led by Biogen’s $6.3 billion deal for Reata Pharmaceuticals. Notable deals in the quarter included Cisco System’s $26.3 billion transaction with Splunk, Smurfit Kappa Group’s $11.4 billion deal with Westrock, and Tapestry’s $6.7 billion merger with Capri Holdings. The largest deals for the year included Pfizer’s $42.8 acquisition of Seagen, Amgen’s $26.4 billion takeover of Horizon Therapeutics, and Johnson & Johnson’s $17.2 billion deal with Abiomed.
Through September, private equity volumes slumped 41% to $393 billion. The financing environment remains challenging for these buyers with the Fed maintaining higher interest rates for longer. Francisco Partner’s $6.1 billion buyout of New Relic was the largest buyout announced during the quarter. Others included Clayton Dubilier and Rice’s $2.3 billion takeover of Veritiv and Thoma Bravo’s $1.6 billion deal for NextGen Healthcare. Private credit has continued to help bridge the gap for buyout firms that still want to do deals. We also continue to see larger equity checks being written, some even with guarantees of full equity contributions if financing is not available.
Performance
As is typical for our strategy, there were many deals that contributed positively to the Fund’s performance. The biggest gain for the year came from our position in the $67.8 billion deal between Microsoft Corp. and Activision Blizzard Inc. In July, Microsoft scored a big win against the Federal Trade Commission (FTC) in its attempt to block the merger. In December 2022, the FTC sued to block the deal on shaky antitrust logic and a hearing took place in June of this year. The judge ruled in favor of the companies, leaving the UK as the only impediment to the deal. The UK, which initially ruled against the deal in April, took the unprecedented step of reopening the investigation after global backlash against the UK regulatory environment. Microsoft offered to appease the regulators with a simple divestiture of their streaming business in the UK. The remedy was approved in early October and the deal closed shortly thereafter.
Another positive contributor was the closing of the $37.6 billion buyout of Twitter Inc by Elon Musk at the original price. The deal was announced in April of 2022, and shortly thereafter Musk said he was putting the deal “on hold.” He then announced in July that he was walking away from the transaction, causing the stock to trade down substantially below the $54.20 per share he agreed to pay in April. Prior to his deposition for the upcoming court battle over the deal, Musk said he would honor his original commitment to buy the company at the agreed price, despite an obvious decline in Twitter’s business and volatility in the credit markets. While there was uncertainty in the deal right up until the close, we continued to believe Twitter had a very strong contract as a result of Musk waving due diligence. The Fund increased its position throughout the saga believing Twitter would prevail in court or reach a settlement near the original price. There were also rumors that the U.S. government would open an investigation into some of the foreign financing sources being used by Musk, possibly delaying the close. This caused volatility in the stock throughout October, but the deal ultimately closed at the end of that month.
P.O. Box 1627 | New York, NY 10150 | 212 350-0200 | www.kellnercap.com
Also driving performance was the narrowing of the spread in the $70 billion transaction between Broadcom and VMware. The spread had blown out in the second quarter due to trading anomalies. There was nothing specific to the deal that happened, but Broadcom, which provides high speed switches that power artificial intelligence systems, saw its stock skyrocket from just over $600 in May to about $900 in June. With arbitrageurs unable to control it, the spread blew out. We saw a similar situation at the end of 2021 into 2022 with Xilinx and Advanced Micro Devices (AMD) when AMD got caught in the meme frenzy causing volatility in the spread. That deal ultimately closed and was a profitable position for the fund. We believe Broadcom’s deal with VMware will have a similar outcome. While this volatility creates difficult marks, it also provides opportunity. The companies received approval from the UK and the U.S. regulatory process expired without the agencies taking action. This leaves only approval from China, which we expect in the fourth quarter.
The Fund suffered a loss when in early May, Toronto Dominion Bank (TD) and First Horizon mutually agreed to terminate its $13.4 billion merger after they were unable to get clarity on an approval timeline from banking authorities over concerns of TD’s anti-money laundering practices. The companies, with the deal being over 400 days since announcement and the termination date approaching, decided to go their separate ways. This came as a surprise to the market as deals of similar size had recently been allowed to proceed. Senator Elizabeth Warren had been an opponent of the deal (among others), objecting to further consolidation in the banking industry and the elimination of another regional bank. This despite the government allowing JP Morgan to get bigger by snatching up a distressed bank soon thereafter. This opposition, along with an open-ended timeframe and the regional bank crisis proved too much for both companies and they decided to move on, resulting in a loss for the Fund.
Outlook
Even with high interest rates, increased antitrust scrutiny and a recession looming, there are signs that merger activity is picking up. Historically, after a boom year like 2021 when volumes topped $5 trillion, it takes about two years for the M&A market to bottom out and we are seeing that now. Financing markets are opening for big deals with three of the largest deals of the year being announced in September. Buyers and sellers are becoming more realistic about pricing which is conducive to more activity as well. The hesitancy to do deals in this regulatory environment has been tempered somewhat by Microsoft’s win in court for its Activision deal and a settlement in the Horizon/Amgen deal. These victories solidify our belief in the decades of case law that govern our business and provide protection from government overreach.
While deals are taking longer to bring to fruition, the extra due diligence done before announcement ensures that companies are steadfast in their belief in both the merits and the legality of their transactions. Private equity is still in the position where the money they raised needs to be spent or returned to investors. Deal sizes will likely be smaller and equity checks larger, which is consistent with what we are seeing. With banks still working off the loans from the last few years, private equity will continue to lean on the $1.5 trillion private credit market to help finance deals. The general tone in the M&A market is positive with increased deal rumors and more announcements. The spread environment continues to be favorable with regulatory angst eased, but still at the forefront of everyone’s mind. The duration of the portfolio remains short with more than 80% of our deals set to close in three to six months. This leaves the Fund in a solid position as we head into the new fiscal year.
We are grateful for your continued trust and support.
Sincerely,
The Investment Team at Kellner Management, LP
P.O. Box 1627 | New York, NY 10150 | 212 350-0200 | www.kellnercap.com
The views in this letter were as of September 30, 2023 and may not necessarily reflect the same views on the date this letter is first published or any time thereafter. These views are intended to help shareholders in understanding the fund’s investment methodology and do not constitute investment advice.
P.O. Box 1627 | New York, NY 10150 | 212 350-0200 | www.kellnercap.com

Dear Shareholder,
This Annual Report covers the AXS Alternative Value Fund (“the Value Fund”) and the AXS Market Neutral Fund (“the Market Neutral Fund”) for the fiscal year ending September 30, 2023. We appreciate this opportunity to offer insight into the funds’ investment strategies and to offer commentary on performance and evolving global market conditions.
Market Commentary
The equity market rebounded during trailing twelve months ended September 30, 2023 as the S&P 500 gained 21.62% on a total return basis during the period. A rebound in corporate earnings, a slowing rate of inflation and market participants’ increase in risk appetite are largely credited for the rise. Value stocks underperformed growth stocks during the trailing twelve months as the Morningstar US LM Value Index gained 17.51% on a total return basis while the Morningstar US LM Growth Index gained 22.39% on a total return basis. Underlying data from investment factor analysis from S&P CapitalIQ, show that large stocks generally outperformed small stocks and stocks that exhibit increased price volatility performed better than low price volatility stocks, both by wide margins. Factor data also indicate that stocks with good valuation metrics underperformed those with less attractive metrics. This is notable because performance of the valuation factor has historically been a significant driver of performance for the Value Fund and Market Neutral Fund.
As the equity market currently stands, the valuation of the overall market looks very stretched. The Cyclically Adjusted Price-to-Earnings (“CAPE”) multiple is an interesting very long-term valuation indicator for the S&P 500 that we follow. The current CAPE multiple of 30.8x is in the top 11% of all the monthly CAPE multiple measurements dating back to March 31, 1936. Historically, when this multiple is high, the ten-year annualized average return for the S&P 500 for the next ten years is below the average ten-year annualized return for the S&P 500. This is important because of the rise in interest rates over the past year. Yields on U.S. ten-year Treasury bonds, generally considered a low-risk, safe security, are nearing 5%. If yields continue to rise without an equity market correction, fixed income securities will become an increasingly attractive investment alternative to equities in our view.
The Value Fund
The macroeconomic view upon which our value strategies are based is what we consider to be a straightforward model of market behavior over time. This model is based on the belief that corporate profits, market multiples, and interest rates drive stock price returns over very long periods of time.
Performance Commentary
The Value Fund invests in high quality companies that trade at attractive valuations relative to the broader market. We utilize our proprietary ROTA/ROME® investment selection and portfolio construction methodology to execute this strategy. ROTA/ROME® focuses on a company’s Return on Total Assets (“ROTA”) and Return on Market Value of Equity (“ROME”) in order to identify companies whose per share intrinsic value has diverged significantly from the current market price of its stock. We believe that companies that exhibit sustainable long-term high ROTA are higher quality companies that most likely have a competitive advantage within the marketplace. ROME is a measure of profit yield, and like a yield on a bond, the higher the ROME, the more likely that shares in the company can be purchased at a better valuation compared to a company with a lower ROME.
| | Return 1-Yr |
| AXS Alternative Value Fund - CL I | 8.98% |
| AXS Alternative Value Fund - Investor Class | 8.79% |
| S&P 500 | 21.62% |
3965 West 83rd Street • #348 • Prairie Village, KS 66208
913.214.5001
www.cognios.com
During the fiscal year ended September 30, 2023, the total return for the Class I Shares (COGVX) was 8.98% and the total return for the Investor Class Shares (COGLX) was 8.79%%, which trailed the S&P 500 index due to the soft performance of the valuation factor. The strong performance of the volatility factor negatively impacted the Value Fund to a lesser extent as the investment model typically selects stocks with lower share price volatility.
AXS Market Neutral Fund
The AXS Market Neutral Large Cap Fund employs a Beta -adjusted market neutral investment strategy that seeks to provide investors with returns that are non-correlated to, or independent of, the returns of the global equity and fixed income markets. By attempting to hedge out all of the market Beta, the Fund’s returns over time should be essentially “pure Alpha” (i.e., Alpha is the excess return of a portfolio after considering its Beta exposure). Additionally, by hedging out the general market movements in this Beta-adjusted market neutral fashion, we believe that the total returns of the Fund will be independent of those broad “systemic” risk factors and macro events that move the entire stock market either positively or negatively over time.
Performance Commentary
The Market Neutral Fund invests long in high quality companies that trade at attractive valuations relative to the broader market. We utilize our proprietary ROTA/ROME® investment selection and portfolio construction methodology, very similar to the Value Fund. Conversely, The Market Neutral Fund sells short shares in companies that demonstrate poor qualities based on our proprietary ROTA/ROME® investment selection and portfolio construction methodology.
| | Return 1-Yr |
| AXS Market Neutral Fund - CL I | 4.86% |
| AXS Market Neutral Fund - Investor Class | 4.54% |
| S&P 500 | 21.62% |
For the twelve months ended September 30, 2023, the total return for the Class I Shares (COGIX) was 4.86% and the total return for the Investor Class Shares (COGMX) was 4.54%. The strong performance of the volatility factor negatively impacted the Market Neutral Fund to a lesser extent as the investment model typically selects stocks with lower share price volatility for the long portfolio and higher volatility stocks for the short portfolio.
We look forward to future opportunities to connect with our shareholders. We strive to continuously add value to your investment experience by providing access to fund information, portfolio updates and straightforward commentary.
The views in this letter were as of September 30, 2023 and may not necessarily reflect the same views on the date this letter is first published or any time thereafter. These views are intended to help shareholders in understanding the fund’s investment methodology and do not constitute investment advice.
We thank you for investing with us and for the trust you have placed in us.
Sincerely,
 |  | |
| Jonathan Angrist | Brian Machtley | |
Portfolio Managers
Cognios Capital
Disclosures
The information provided herein represents the opinion of the Funds’ manager, is subject to change at any time, is not guaranteed and should not be considered investment advice.
Performance data quoted represents past performance; past performance does not guarantee future results.
The Funds’ holdings and sector allocations are subject to change at any time and should not be considered recommendations to buy and sell any security. Please refer to the Schedule of Investments in this report for a complete list of Fund holdings.
Mutual funds involve risk including possible loss of principal. There is no assurance that the Fund will achieve its investment objective.
The value of the Fund’s assets will fluctuate as the equity market fluctuates, although the beta-adjusted market neutral focus of the Fund should reduce the effect of general market fluctuations on the valuation of the Fund as a whole. Utilization of leverage, such as borrowings and shorting positions, involves certain risks to the Fund’s shareholders, including potential for higher volatility of the net asset value (“NAV”) of the Fund’s shares and the relatively greater effect of portfolio holdings on the NAV of the shares. The Fund may not always be able to close out a short position on favorable terms. Short sales involve the risk that the Fund will incur a loss by subsequently buying a security at a higher price than the price at which it sold the security short. Value investing is subject to the risk that the market will not recognize a security’s inherent value for a long time or at all, or that a stock judged to be undervalued may actually be appropriately priced or overvalued. The prices of foreign securities may be more volatile than the prices of securities of U.S. issuers because of economic and social conditions abroad, political developments and changes in the regulatory environments of foreign countries.
The Russell 1000® Value Total Return Index measures the performance of those Russell 1000 companies with lower price-to-book ratios and lower forecasted growth values. Please note that indices do not take into account any fees and expenses of investing in the individual securities that they track, and individuals cannot invest directly in any index.
The Russell 1000® Growth Total Return Index measures the performance of those Russell 1000 companies with higher price-to-book ratios and higher forecasted growth values. Please note that indices do not take into account any fees and expenses of investing in the individual securities that they track, and individuals cannot invest directly in any index.
Price-to-earnings ratio is a valuation metric of a company’s current share price compared to its earnings per share.
You cannot invest directly in an index.
Index performance is not indicative of a fund’s performance.
Must be preceded or accompanied by a prospectus.
Distributed by IMST Distributors, LLC, which is not affiliated with AXS.
Dear Shareholders,
We write this annual shareholder letter for the AXS Adaptive Plus Fund (“the Fund”) as of fiscal year end on September 30, 2023.
OVERVIEW
Fund performance occurred with the backdrop of a choppy equity rebound beginning in October 2022 and lasting through late June before faltering a bit in the third quarter of 2023. Inflation was held in check for much of the period due to the Federal Reserve tightening cycle. The bond market was relatively flat for the period due to tightening conditions, leading investors to seek returns in equities.
As an indexed-based strategy, the Fund is designed to track the performance of its underlying index which seeks capital preservation and growth as described below.
PERFORMANCE
Class I shares of the Fund (AXSPX) returned -3.51% for fiscal year ended September 30, 2023. Fund performance was in line with the ProfitScore Regime Adaptive Equity Index1 gross performance of -1.45%. The Fund’s prospectus benchmark S&P 500 Total Return Index returned 21.62%.2
INVESTMENT STRATEGY
The AXS Adaptive Plus Fund seeks capital appreciation in rising and falling U.S. equity markets. Under normal market conditions, the Fund seeks to achieve its investment objective by investing in equity-linked call options or swaps that provide exposure to the ProfitScore Capital Management, Inc. (“ProfitScore”) Regime Adaptive trading program (the “Trading Program”) that is designed to produce the returns of the ProfitScore Regime-Adaptive Equity Index (the “Index”). The Index reflects the returns of a highly liquid, systematic trading program that is calculated based on trades (long and short) of S&P 500 Index or Nasdaq 100 securities and cash equivalents.
The options and swaps in which the Fund invests are designed to produce returns similar to the Index. The Fund does not invest more than 25% of its net assets with any one option counterparty or swap contract counterparty. To generate additional income, Fund’s assets not invested in options or swaps or used as collateral for such investments may be allocated to money market funds and/or U.S. Government securities, such as bills, notes and bonds issued by the U.S. Treasury, and/or other investment grade fixed income securities or fixed income ETFs.
INVESTMENT PHILOSOPHY
The AXS Adaptive Plus Fund seeks exposure to the Trading Program’s investment strategy based on the concept that equity market efficiency is negatively correlated with volatility. When volatility increases, market efficiency declines, and vice versa. The volatility state of the market determines alpha/beta opportunities. Low volatility periods are commonly known as bull markets when longer term uptrends and the bulk of market gains occur. The Trading Program’s U.S. equity exposure will attempt to systematically capture beta, which is the return generated from a portfolio that can be attributable to the overall market returns, during low volatility regimes. When volatility is elevated, the Trading Program will adjust its U.S. equity exposure in an attempt to generate alpha, which is a measure of the amount that an investment has returned in comparison to the market or benchmark. The overall goal of the Trading Program is to minimize the effect of U.S. equity volatility on the Trading Program while generating gains in bull or bear markets
| 1 | The ProfitScore Regime-Adaptive Equity Index (the "Index") offers a dynamic (time-varying) exposure across a defined range of assets within (the "Opportunity Set") representing U.S. equity and cash equivalent assets: (U.S. Equity Equivalents), (Cash Equivalents). Allocations to each asset within the Opportunity Set are generated by a proprietary systematic methodology developed by ProfitScore Capital Management, Inc., the Index Sponsor. New allocations are generated as market conditions change. |
| 2 | The S&P 500 Index measures the performance of large cap U.S. equities. It is weighted by market cap and comprised of 500 of the largest domestically listed companies which represent approximately 80% of domestically available market capitalization. |
INVESTMENT PROCESS
The Fund’s seeks to meet or exceed the returns of Index via exposure to the Trading Program combined with cash management. The Trading Program and therefore the Fund seeks capital appreciation in both rising and falling US equity markets. The Trading Program determines its equity exposure long, neutral or short based on various rules including rules designed to measure the volatility state of the market. With the 75% or more of assets not allocated to swaps or option exposure of the Trading Program, the Fund seeks to grow assets with interest in the products mentioned above.
OUTLOOK
Going forward, the beleaguered market seeks to regain its footing as the nation faces a presidential election with inflationary pressures and two geopolitical battles going on in Gaza and Ukraine. Whatever the stock market does, the Index will attempt to adjust to the conditions and the Fund will track the Index.
Investors cannot directly invest in an index and unmanaged index returns do not reflect any fees, expenses and sales charges. The views in this letter were as of September 30, 2023 and may not necessarily reflect the same views on the date this letter is first published or any time thereafter. These views are intended to help shareholders in understanding the Fund’s investment methodology and do not constitute investment advice.
Faithfully yours,
Parker B. Binion
Head of Investments, AXS Investments LLC
There are risks involved with investing including the possible loss of principal. The Fund can invest in derivatives, which include instruments and contracts that are based on and valued in relation to one or more underlying securities, financial benchmarks, indices or other reference obligations or measures of value. The Fund may enter into swap transactions. A swap contract is a commitment between two parties to make or receive payments based on agreed upon terms, and whose value and payments are derived by changes in the value of an underlying financial instrument. Certain Fund transactions, such as entering into futures contracts, options, and short sales, may give rise to a form of leverage. For additional information on risks of investing in the fund, please see the prospectus.
Past performance does not guarantee future results.

AXS Investments
181 Westchester Ave., Ste. 402
Port Chester, NY 10573

axsinvestments.com

833.AXS.ALTS
(297.2587)
Dear Fellow Shareholders,
As a result of the AXS Income Opportunities Fund (“the Fund”) having a new fiscal year-end, September 30, 2023, this annual shareholder letter primarily addresses the one month intervening period from the prior fiscal year-end, August 31, 2023.
OVERVIEW
Despite the more challenging equity and fixed income market environment which rapidly developed in September, the Fund held up well during the twelve-month period ended September 30, 2023. As has been the case for several quarters, capital markets participants across all sectors continued to be highly focused on incoming economic data that might suggest the elevated inflation backdrop was subsiding. Manageable debt maturities and heightened balance sheet liquidity remained issues of utmost priority for commercial real estate owners and investors.
Investment Objectives & Strategy
The AXS Income Opportunities Fund seeks to maximize current income with the potential for modest growth of capital. The Fund focuses its investment primarily in preferred stocks issued by listed companies in the U.S. real estate investment trust (REIT) sector—diversifying across property types (e.g., lodging, retail, office, apartments, etc.) and mortgage subsectors. The Fund also maintains exposure to REIT common stocks when there appears to be opportunity for both attractive yield and capital appreciation.
returns
For the above referenced one month period between the prior and new fiscal year-ends (now 9/30/23), the Class I (OIOIX) shares returned -3.23% as compared to -2.54% for the Bloomberg Barclays U.S. Aggregate Bond Index. For the 12-months ending September, the Fund returned 12.21% as compared to 0.64% for the Index.
The Fund’s 3-year total return was 5.52% annualized compared to -5.21% for the Index through September 30th.
The performance data quoted represents past performance and is no guarantee of future results. Investment return and principal value of an investment will fluctuate so that an investor's shares, when redeemed, may be worth more or less than their original cost. Current performance may be lower or higher than the performance data quoted. For the most recent month-end performance, please call (833) 297-2587 or visit the Fund’s website at www.axsinvestments.com.
DISTRIBUTION RATE
We are pleased the Fund’s Class I share distribution rate1 amounted to 7.45% at the end of September. For some of the portfolio companies, as earnings growth continues there may be an ability to increase dividends in future periods, helping to support Fund dividends. The subsidized and unsubsidized SEC 30-day yields as of September 30th were 7.23% and 7.71%, respectively.
Market SUMMARY
As heightened capital market volatility and financing stresses induced by the multiple regional bank failures in late March of 2023 continued to fade, the relative calming that occurred in the second and early third quarter was a welcomed change. Companies in the REIT sector generally had solid earnings results coming out of the second quarter, many appear positioned to perform well versus other assets classes—especially considering the sector’s relatively attractive stock valuations.
Particularly in times of banking sector stress as we saw in March and typically for some time thereafter, facets of financing commercial real estate businesses such as balance sheet liquidity, cash availability, and ready access to longstanding lines of credit matter foremost. The ability of real estate owners to maintain control over their assets, not relinquishing them through foreclosure, is paramount. Fortunately, most publicly traded real estate companies manage these facets of the business very well.
Especially if the Fed’s current “higher for longer” rate scenario plays out, there will be some highly leveraged real estate owners continuing to make headlines as the cash flow from their real estate fails to cover debt service, and/or the diminished value of the assets make refinancing difficult or impossible. Ideally at least some REITs in the portfolio would potentially profit from the attractively priced buying opportunities that might result.
Portfolio Allocation
At the fiscal year-end, the Fund was comprised of 92% preferred stocks and 17% REIT common equities. With their competitive yield profile and consistent history of dividend payments, preferred stocks remain the primary focus of the portfolio.
Portfolio by Security Type
| | Preferreds | Equities |
| Number of Positions | 52 | 15 |
| Number of Issuers | 31 | 15 |
| Net Invested | 92% | 17% |
| 1 | Distribution Rate is the most recent Class I share dividend amount annualized ($1.0745) divided by the NAV as of 9/30/23 ($14.43), which equates to 7.45%. |
Fund Positioning
Given the recovery in stock prices witnessed into fiscal year-end was only partial, not complete, many REIT stocks remain available for investment with large price to net asset value (NAV) discounts. These sizeable discounts make it sensible to include a meaningful allocation in the portfolio to common stocks in the sector. Solid balance sheets, dividends well covered by cash flow, and attractive valuation, continue to drive stock selection.
TOP 5 NET Sector Composition
| SECTOR | Preferreds | SECTOR | Equities |
| Hotels | 34% | Office | 4% |
| Mortgage | 31% | Retail | 4% |
| Diversified | 7% | Diversified | 3% |
| RE Operating Co’s | 6% | Mortgage | 3% |
| Single Family Residential | 3% | Health Care | 2% |
Current and future holdings are subject to change and risk. The views in this letter were as of 9/30/23 and may not necessarily reflect the same views on the date this letter is first published or any time thereafter. These views are intended to help shareholders in understanding the fund’s investment methodology and do not constitute investment advice.
Mutual Fund Investing involves risk; principal loss is possible.
Dear Fellow Shareholders,
We write this annual shareholder letter for the AXS Dynamic Opportunity Fund (“the Fund”) as of fiscal year end on September 30, 2023.
OVERVIEW
Our fiscal year commenced with a pivotal moment as the stock market reached its low point in October 2022, and then rallied into late July 2023, only to experience a subsequent pullback in the months that followed. To expand on the market recovery, there were seven mega-cap stocks that led the market during this period while the rest of the market lagged far behind the “Magnificent 7”. During the fiscal year, we witnessed a significant change in the Federal Funds rate, which increased from 3.25% to 5.50%. This shift had notable repercussions, including the unfortunate failure of several regional banks. Many investors took a "risk-off" approach in the broader stock market as investors fled to safer short-term treasury bills and money market funds, which offered attractive yields relative to the perceived risk in the equity market. Inflation has been a recurring concern throughout the fiscal year. Reports show that inflation has shown signs of slowing down since its peak. These developments continue to be closely monitored, and we remain vigilant in our efforts to adapt to this evolving economic environment.
INVESTMENT STRATEGY
The Fund is an equity long/short fund with a strategy designed to capture market upside when market conditions are favorable, while preserving capital when the market conditions are unfavorable. We use a proprietary dynamic hedge model that is updated daily to determine the overall market health and adjust our market exposure accordingly. For example, for most of July 2023 our model indicated 100% exposure (no hedges), but by the end of the fiscal year (September) the model had moved to just 20% market exposure (with significant hedges).
For our long stock portfolio, we screen for stocks experiencing high-volume breakouts, and then scrutinize those companies for the ones with the strongest underlying fundamentals. On the short side we use a similar screening method to identify short ETF candidates that are weak and in downtrends or have broken support levels. Over recent years we’ve seen how shorting individual equity names can come with immense risks of violent short squeezes, and we pride ourselves on using ETF shorts as our shorting strategy against our portfolio to eliminate single stock risk.
INVESTMENT PHILOSOPHY
The Fund is designed as a core investment for investors seeking long term capital appreciation with a short-term focus on capital preservation. The fund employs a dynamic hedging strategy, which aims to actively participate during a rising market environment and protect investors when markets experience downturns.
INVESTMENT PROCESS
| 1. | Long-term growth of capital |
Our Fund screens stocks daily to seeks out new investment opportunities to enhance our portfolio. This diligent approach involves monitoring a diverse range of indicators, with a focus on selecting the most promising investment opportunities from a bottom up basis. For instance, when evaluating a company in its early stages of growth, we prioritize criteria such as high-volume breakouts and substantial revenue growth, recognizing these as key drivers of future success. Our preference is to hold our positions for the long-term, focusing on earnings stability, free cash flow growth, and high profit margins.
| 2. | Preservation of capital |
During periods of elevated volatility, particularly during events like earnings releases, we take proactive measures to protect our positions by implementing option strategies as a hedge to protect downside risk. In addition to the option strategies available for hedging individual stocks, our fund incorporates a strategy of identifying and shorting weak ETFs as a hedge to our overall portfolio. When our risk model indicates that market exposure should be decreased, we proactively respond by raising cash and adding to hedges. This is achieved through a de-risking strategy, which involves strategically repositioning our portfolio to minimize our overall exposure. We believe that by employing these dynamic strategies, we can better navigate the fluctuations of the market and minimize drawdowns.
PERFORMANCE
Class I shares1 of the Fund (ADOIX) returned -0.46% for the period, outpacing the benchmark Wilshire Liquid Alternative Global Macro Total Return Index2 which declined -3.79%.
The stock market during the fiscal year was highlighted by a very narrow group of stocks leading the way, while a much larger band of stocks experienced negative performance. The choppiness of the broader market made it difficult to find new leading stocks, and many breakouts that we did participate in proved short lived. Hedging activity was elevated over the last 12 months, as was portfolio turnover. This is not typically characteristic of a new bull market. When a new bull market does emerge, we would expect to see waves of stocks showing up on our screens and offering attractive opportunities for new leadership in the market.
OUTLOOK
Our outlook is one of optimism and strategic preparedness. The year ahead is an election year, and Fed Funds futures are beginning to factor in the possibility of rate cuts, which traditionally have a positive impact on the broader stock market. Innovations like AI have been a big talking point this fiscal year and have the potential to further fuel the stock market's growth. Despite our optimism, we remain mindful of the geopolitical environment's potential impact on financial markets. We are also mindful of a potential economic slowdown following the Fed’s historic rate hike campaign. We are ready to take proactive steps that allow us to hedge against potential risks if the situation occurs.
Investors cannot directly invest in an index and unmanaged index returns do not reflect any fees, expenses or sales charges. The views in this letter were as of September 30, 2023 and may not necessarily reflect the same views on the date this letter is first published or any time thereafter. These views are intended to help shareholders in understanding the Fund’s investment methodology and do not constitute investment advice.
Faithfully yours,
Jordan Kahn
Portfolio Manager, AXS Investments LLC
| 1 | Investor class shares (ADOIX) returned -0.71% (-6.44% with load) for the fiscal year. |
| 2 | The Wilshire Liquid Alternative Global Macro Index℠ measures the performance of the global macro strategy component of the Wilshire Liquid Alternative Index. Global macro strategies predominantly invest in situations driven by the macro-economic environment across the capital structure as well as currencies and commodities. Created in 2014, with a time series of data beginning on June 30, 2006, the Wilshire Liquid Alternative Global Macro Index (WLIQAGM) is designed to provide a broad measure of the liquid alternative global macro market. |
Fund holdings and/or sector allocations are subject to change. Please see the Schedule of Investments for information on current holdings.
Past performance does not guarantee future results.
Mutual funds involve risk including possible loss of principal. There is no assurance that the Fund will achieve its investment objective. The Fund may invest in small, less well-known companies, which may be subject to more erratic market movements than large cap stocks; foreign securities, which are subject to currency fluctuations and political uncertainty; and derivative securities, which may carry market, credit and liquidity risks. The Fund may also engage in short selling activities, which are more risky than long positions because the potential loss on a short sale is unlimited. The Fund may use leveraging and/or hedging techniques that could fail if changes in the value of the derivative do not correlate with the securities being hedged. These risks may result in greater share price volatility. Risks of futures contracts may arise from an imperfect correlation between movements in the price of the instruments and the price of the underlying securities. The Fund’s use of futures contracts exposes the Fund to leverage risk because of small margin requirements relative to futures contract value. Swap transactions may alter the Fund’s exposure to long-term or short-term interest rates, foreign currency values, corporate borrowing rates, or other factors such as security prices or inflation rates and also may alter the Fund’s volatility. Selling covered calls limits the upside potential of the underlying security. Selling put options may require the Fund to purchase the underlying securities during periods of declining prices. Premiums paid to purchase options lose value over time and may be lost entirely, if the option expires before it is feasible to be exercised. The protection from selling puts is limited to the strike price minus the premium paid. Investing in REITs involves risks similar to those associated with investing in small capitalization companies. Generally, fixed income securities decrease in value if interest rates rise and increase in value if interest rates fall. Exposure to the commodities markets (including financial futures markets) may subject the Fund to greater volatility.
Dear Fellow Shareholders,
We write this annual shareholder letter for the AXS Tactical Income Fund (“the Fund”) as of fiscal year end on September 30, 2023.
OVERVIEW
During the fiscal year, we witnessed a significant change in the Federal Funds rate, which increased from 3.25% to 5.50%. Over that time period the 10-year US Treasury yield rallied up to around 4.75% which is nearly 100 basis points higher than levels seen at the start of the fiscal year. The rise in bond yields made it difficult for the broader fixed income markets as rising rates acted as a stiff headwind for fixed income markets. The US Aggregate Bond Index (AGG) is down -1.03% year-to-date in 2023.
INVESTMENT STRATEGY
The Fund is a tactical income fund that takes a systematic trading approach in the portfolio. Our goal is to actively participate in up-trending, income-oriented sectors while avoiding down-trending sectors. We conduct daily technical assessments of fixed income ETFs across various sectors to monitor their performance and overall health. Based on these assessments and positioning within our models, we exercise discretion in adjusting the allocation of investments to the various fixed income ETFs, with a focus on optimizing yield and performance.
INVESTMENT PHILOSOPHY
The Fund is designed as a core investment for investors seeking income generation, while also focusing on capital preservation. The fund employs a tactical strategy which is geared towards seizing promising income-generating opportunities and minimizing potential losses during market downturns. Our primary goal is to enable our investors to benefit from financial market gains while managing risk on the downside.
INVESTMENT PROCESS
The Fund conducts daily screenings across the entire fixed income market spectrum to identify ETFs that align with our portfolio objectives. Our focus is on identifying ETFs that not only offer appealing yields but also exhibit upward trends, enabling us to benefit from both yield and performance. During market volatility, we adopt a risk-off approach and allocate our capital into safer havens, such as short-term treasury ETFs and cash.
PERFORMANCE
Class I shares1 of the Fund (TINIX) returned -0.40% for the period, underperforming the benchmark Bloomberg Aggregate Bond Index2 which returned 0.64%.
The choppy environment in fixed income, characterized by Fed rate hikes and rising bond yields, made it difficult to see much price appreciation in many of the higher yielding sectors of fixed income. For the first time in nearly a decade, there are areas of the income markets that offer the prospect of double-digit yields. But those areas have been volatile, leading the Fund to get stopped out of positions frequently. As the Fed rate hike cycle looks to be nearing its end, bond market volatility should decrease and allow for greater price appreciation going forward.
| 1 | Class A Shares (TINAX) returned -0.76% (with load -6.45%) for the fiscal year. |
| 2 | The Bloomberg USAgg Index is a broad-based flagship benchmark that measures the investment grade, US dollar-denominated, fixed-rate taxable bond market. The index includes Treasuries, government-related and corporate securities, MBS (agency fixed-rate pass-throughs), ABS and CMBS (agency and non-agency). The Index was originally known as the Barclays Aggregate Bond Index until Bloomberg took it over. |
OUTLOOK
Our investment approach remains tactical, giving the Fund flexibility to respond to the evolving market environment. Currently, the Federal Reserve appears to have largely completed its cycle of rate hikes, with the economy requiring a period to absorb the effects of these hikes. We foresee a limited likelihood of the Fed reversing course and cutting rates within 2023. It is our observation that the Fed intends to adopt a more observant role, allowing the impact of the rapid interest rate hikes to unfold throughout the remainder of this year. If circumstances warrant, they may consider the possibility of initiating a rate reduction in 2024, but they will want to see inflation measures continue to move lower, and possibly await some easing in the labor market.
Faithfully yours,
Jordan Kahn
Portfolio Manager, AXS Investments LLC
Fund holdings and/or sector allocations are subject to change. Please see the Schedule of Investments for information on current holdings.
Past performance does not guarantee future results.
Investors cannot directly invest in an index and unmanaged index returns do not reflect any fees, expenses or sales charges. The views in this letter were as of September 30, 2023 and may not necessarily reflect the same views on the date this letter is first published or any time thereafter. These views are intended to help shareholders in understanding the Fund’s investment methodology and do not constitute investment advice.
Mutual funds involve risk including possible loss of principal. There is no assurance that the Fund will achieve its investment objective. The Fund may invest in small, less well-known companies, which may be subject to more erratic market movements than large cap stocks; foreign securities, which are subject to currency fluctuations and political uncertainty; and derivative securities, which may carry market, credit and liquidity risks. The Fund may also engage in short selling activities, which are more risky than long positions because the potential loss on a short sale is unlimited. The Fund may use leveraging and/or hedging techniques that could fail if changes in the value of the derivative do not correlate with the securities being hedged. These risks may result in greater share price volatility. Risks of futures contracts may arise from an imperfect correlation between movements in the price of the instruments and the price of the underlying securities. The Fund’s use of futures contracts exposes the Fund to leverage risk because of small margin requirements relative to futures contract value. Swap transactions may alter the Fund’s exposure to long-term or short-term interest rates, foreign currency values, corporate borrowing rates, or other factors such as security prices or inflation rates and also may alter the Fund’s volatility. Selling covered calls limits the upside potential of the underlying security. Selling put options may require the Fund to purchase the underlying securities during periods of declining prices. Premiums paid to purchase options lose value over time and may be lost entirely, if the option expires before it is feasible to be exercised. The protection from selling puts is limited to the strike price minus the premium paid. Investing in REITs involves risks similar to those associated with investing in small capitalization companies. Generally, fixed income securities decrease in value if interest rates rise and increase in value if interest rates fall. Exposure to the commodities markets (including financial futures markets) may subject the Fund to greater volatility.
 | Annual Commentary 2023 |
AXS Chesapeake Strategy Fund
At Chesapeake Capital, we have steadfastly applied a systematic long-term trend following approach to help investors seek capital appreciation. Our model, now time-tested for over 30 years, is to identify long- term price trends in futures contracts diversified across about 100 global markets. We go long when trends are up and short when they are down, cutting losses and letting profits run along the way. Our approach is reactionary, not predictive, and driven by a highly disciplined algorithmic process that removes emotion from the equation. The AXS Chesapeake Strategy Fund allows investors to benefit from long-term trends. For the fiscal year ending September 30, 2023, the AXS Chesapeake Strategy Fund Class I, Class C and Class A shares were -2.35%, -3.27% and -2.50% (-8.11% with load), respectively, the SG Trend Index which was -4.97%.
2022 – Q4
The fund produced negative results for the quarter; gains in October and December were able to slightly reduce the impact of losses incurred in November. Three of the four major market sectors traded (Stocks, Fixed Income, Currency and Commodities) in the fund produced losses for the quarter. Currency markets produced the largest losses as the US dollar gave back some of its previous gains against global currencies during the quarter. The commodity markets also produced losses for the fund for the quarter led by losses in the metal and energy complex. The Fixed income sector was basically flat for the quarter, but led the portfolio in gains for the year, followed by yearly positive results in commodities and currencies. The equity sector produced small losses for the quarter.
2023 – Q1
In the fixed income arena, the fund produced negative returns on short positions in US and global interest rates. The trend of global rising rates paused as regional bank failures weighed on the Federal Reserve’s potential for aggressive rate hikes to combat inflation. The currency sector recorded slight losses for the quarter on the weakening dollar, particularly against the Euro and the Japanese Yen as both currencies rebounded sharply after trading at decade lows versus the US dollar. The fund enters the second quarter with a minimal change in exposure in the currency complex. The equity sector contributed losses for the quarter as net short positions in the complex produced losses. By quarter end, the fund had increased long positions in the European indices. The commodity complex contributed net gains on mixed results in the subsectors. Gains were produced in the agricultural sector, particularly on long sugar and short coffee positions. Gains were also recorded in the meat complex. Losses for the complex were posted in the energy and metals markets.
2023 – Q2
The equity sector was the largest contributor to gains for the quarter with the fund posting gains in US and global stock indices. In the fixed income arena, the fund produced positive results on short US and global interest rate positions. The trend of global rising rates continued, particularly towards the latter half of the quarter’s end. The currency sector recorded slight gains for the quarter on a stronger US dollar vs. Japanese Yen and Swedish Kroner as gains on long dollar positions offset losses incurred on recently establish short dollar positions vs. the Euro, British Pound and Swiss Franc. The commodity complex contributed to net gains on mixed results in the subsectors. Gains were also recorded in the meat complex and were also produced in the soft commodity sector, particularly on long sugar and cocoa positions and short coffee positions. Losses in commodities were posted in the energy and metals markets. Gains were also recorded in the meat complex.
2023 – Q3
The fund produced positive results on short US and global interest rate positions in the fixed income arena. The trend of global rising rates continued, particularly towards the latter half of the quarter’s end. The equity sector was the largest contributor to negative performance for the quarter with the fund posting losses in US and global stock indices long positions. The currency sector recorded net losses for the quarter as the stronger US dollar produced losses on the funds short dollar positions vs. the Euro, British Pound and Swiss Franc. The long dollar positions in Japanese Yen and Swedish Kroner produced gains. The commodity complex contributed net losses on mixed results in the subsectors. Losses in commodities were posted in the energy and metals markets. Losses were also recorded in the grain complex. Gains were recorded in the meat complex and soft commodity sector, particularly on long sugar positions. AXS Chesapeake Strategy Fund is well positioned to take advantage of price trends as that continue to emerge in 2023/4. The impact of geopolitical activity on the world markets continues to affect prices and trends. Chesapeake continues to maintain a well-diversified portfolio to try to dampen market volatility and benefit from price trends that develop.
The views in this letter were as of September 30, 2023 and may not necessarily reflect the same views on the date this letter is first published or any time thereafter. These views are intended to help shareholders in understanding the fund’s investment methodology and do not constitute investment advice.
Past performance is not necessarily indicative of future results. Futures trading is speculative and involves substantial risk of loss. This report is for use by current clients, authorized selling agents and prospective clients who have received a current Chesapeake disclosure document.
Actual Performance for Individual Capital Accounts may vary from the rate of return for the Company overall depending on the timing of the initial investment and subsequent additions and/or withdrawals.
100 South Ashely Drive, Suite 1140 Tampa, Florida 33602
Tel: 804.836.1617 Fax: 804.836.1610 E-mail: clientservices@chesapeakecapital.com
AXS Multi-Strategy Alternatives Fund
FUND PERFORMANCE at September 30, 2023 (Unaudited)

This graph compares a hypothetical $10,000 investment in the Fund’s Investor Class shares with a similar investment in the Wilshire Liquid Alternative Global Macro Index TR during the periods shown. The performance graph above is shown for the Fund’s Investor Class shares. Class I shares performance may vary. Results include the reinvestment of all dividends and capital gains.
The Wilshire Liquid Alternative Global Macro Index TR measures the performance of the global macro strategy component of the Wilshire Liquid Alternative Index TR. The index does not reflect expenses, fees or sales charge, which would lower performance. The index is unmanaged and is not available for investment.
| Average Annual Total Returns as of September 30, 2023 | 1 Year | 5 Years | 10 Years | Since Inception | Inception Date |
| Investor Class* | 11.47% | 2.44% | 5.38% | N/A | N/A |
| Class I | 11.60% | 2.63% | N/A | 5.11% | 03/20/17 |
| Wilshire Liquid Alternative Global Macro Index TR | -3.79% | 3.53% | 2.28% | N/A | N/A |
*Formerly R-1 Class.
The performance data quoted here represents past performance and past performance is not a guarantee of future results. Investment return and principal value will fluctuate so that an investor’s shares, when redeemed, may be worth more or less than their original cost. Current performance may be lower or higher than the performance information quoted. The most recent month end performance may be obtained by calling (833) 297-2587.
The Fund acquired the assets and liabilities of the KCM Macro Trends Fund, a series of Northern Lights Fund Trust (the “Predecessor Fund”) on October 18, 2019. As a result of the reorganization, the Fund is the accounting successor of the Predecessor Fund. Performance results shown in the graph and the performance table above for the period prior to October 19, 2019, reflect the performance of the Predecessor Fund.
Gross and Net expense ratios for Investor Class were 2.31% and 1.84%, respectively, and for Class I shares were 2.06% and 1.67%, respectively, which were the amounts stated in the current prospectus dated February 1, 2023, and supplemented on April 21, 2023 and July 3, 2023. For the Fund’s current one year expense ratios, please refer to the Financial Highlights section of this report. The Fund’s Advisor has contractually agreed to waive its fees and/or pay for operating expenses of the Fund to ensure that total annual fund operating expenses (excluding, as applicable, taxes, leverage interest, brokerage commissions, dividend and interest expenses on short sales, acquired fund fees and expenses as determined in accordance with Form N-1A, expenses incurred in connection with any merger or reorganization, or extraordinary expenses such as litigation expenses) do not exceed 1.68% and 1.51% of the average daily net assets of the Fund’s Investor Class shares and Class I shares, respectively. This agreement is in effect until January 31, 2024, and it may be terminated before that date only by the Trust’s Board of Trustees. In the absence of such waivers, the Fund’s returns would be lower.
AXS Multi-Strategy Alternatives Fund
FUND PERFORMANCE at September 30, 2023 (Unaudited) – Continued
Returns reflect the reinvestment of distributions made by the Fund, if any. The graph and the performance table shown do not reflect the deduction of taxes that a shareholder would pay on Fund distributions or the redemption of Fund shares.
AXS Sustainable Income Fund
FUND PERFORMANCE at September 30, 2023 (Unaudited)
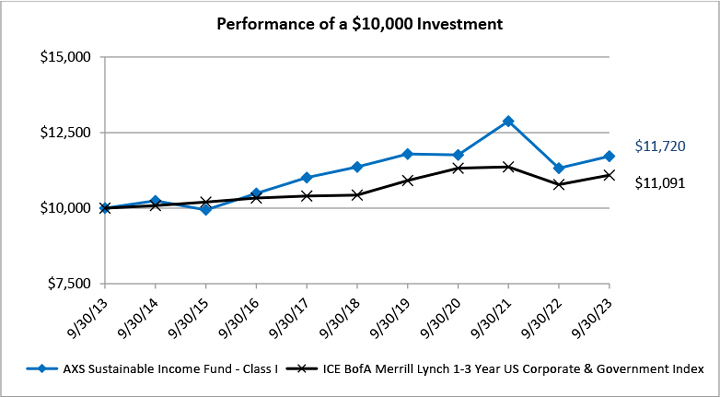
This graph compares a hypothetical $10,000 investment in the Fund’s Class I shares during the periods shown with a similar investment in the ICE BofA Merrill Lynch 1-3 Year US Corporate & Government Index. The performance graph above is shown for the Fund Class I shares. Results include the reinvestment of all dividends and capital gains.
The ICE BofA Merrill Lynch 1-3 Year US Corporate & Government Index is the performance of U.S. dollar denominated investment grade debt publicly issued in the U.S. domestic market, including U.S. Treasury, U.S. agency, foreign government, supranational and corporate securities. The index does not reflect expenses, fees or sales charge, which would lower performance. The index is unmanaged and is not available for investment.
| Average Annual Total Returns as of September 30, 2023 | 1 Year | 5 Years | 10 Years |
| Class I | 3.49% | 0.62% | 1.60% |
| ICE BofA Merrill Lynch 1-3 Year US Corporate & Government Index | 2.89% | 1.23% | 1.04% |
The performance data quoted here represents past performance and past performance is not a guarantee of future results. Investment return and principal value will fluctuate so that an investor’s shares, when redeemed, may be worth more or less than their original cost. Current performance may be lower or higher than the performance information quoted. The most recent month end performance may be obtained by calling (833) 297-2587.
The Fund acquired the assets and liabilities of the Sky Harbor Short Duration High Yield Partners, LP, a Delaware limited partnership which commenced operations on February 1, 2013 (the “Predecessor Fund”) on October 16, 2020. As a result of the reorganization, the Fund is the accounting successor of the Predecessor Fund. The Predecessor Fund was not registered under the Investment Company Act of 1940, as amended (the "1940 Act") and therefore was not subject to certain restrictions imposed by the 1940 Act on registered investment companies and by the Internal Revenue Code of 1986 on regulated investment companies. If the Predecessor Fund had been registered under the 1940 Act, the Predecessor Fund's performance may have been adversely affected. Performance results shown in the graph and the performance table above for the period prior to October 17, 2020, reflect the performance of the Predecessor Fund. The return was 8.42% for the period October 17, 2020 (commencement of operations) through September 30, 2021.
AXS Sustainable Income Fund
FUND PERFORMANCE at September 30, 2023 (Unaudited) – Continued
Gross and net expense ratios for the Class I shares were 1.81% and 0.99%, respectively, which were stated in the current prospectus dated February 1, 2023. For the Fund’s current one year expense ratios, please refer to the Financial Highlights section of this report. The Fund’s Advisor has contractually agreed to waive its fees and/or pay for operating expenses of the Fund to ensure that total annual fund operating expenses (excluding, as applicable, taxes, leverage interest, brokerage commissions, dividend and interest expenses on short sales, acquired fund fees and expenses as determined in accordance with Form N-1A, expenses incurred in connection with any merger or reorganization, or extraordinary expenses such as litigation expenses) do not exceed 0.99% of the average daily net assets of the Fund’s Class I shares. This agreement is in effect until January 31, 2024, and it may be terminated before that date only by the Trust’s Board of Trustees. In the absence of such waivers, the Fund’s returns would be lower.
Returns reflect the reinvestment of distributions made by the Fund, if any. The graph and the performance table above do not reflect the deduction of taxes that a shareholder would pay on Fund distributions or the redemption of the Fund shares. Shares redeemed within 30 days of purchase will be charged 1.00% redemption fee.
AXS Thomson Reuters Venture Capital Return Tracker Fund
FUND PERFORMANCE at September 30, 2023 (Unaudited)

This graph compares a hypothetical $10,000 investment in the Fund’s Class I shares, made at its inception, with a similar investment in the NASDAQ OTC Composite Index. The performance graph above is shown for the Fund Class I shares. Class A shares and Class C shares performance may vary. Results include the reinvestment of all dividends and capital gains.
The NASDAQ OTC Composite Index is the market capitalization-weighted index of over 2,500 common equities listed on the Nasdaq stock exchange. The index does not reflect expenses, fees or sales charge, which would lower performance. The index is unmanaged and is not available for investment.
| Average Annual Total Returns as of September 30, 2023 | 1 Year | 5 Years | Since Inception | Inception Date |
| Before deducting maximum sales charge | | | | |
| Class A1 | 32.56% | 4.59% | 13.80% | 10/02/14 |
| Class C2 | 31.55% | 3.81% | 13.22% | 09/23/15 |
| Class I3 | 32.80% | 4.83% | 14.02% | 10/02/14 |
| After deducting maximum sales charge | | | | |
| Class A1 | 24.96% | 3.36% | 13.13% | 10/02/14 |
| Class C2 | 30.55% | 3.81% | 13.22% | 09/23/15 |
| NASDAQ OTC Composite Index | 26.11% | 11.41% | 14.05% | 10/02/14 |
| 1 | Maximum sales charge for Class A shares is 5.75%. No initial sales charge applies to purchase of $1 million or more. |
| 2 | Class C Shares are subject to a contingent deferred sales charge (“CDSC”) of 1.00% on any shares sold within 12 months of the date of purchase. |
| 3 | Class I shares do not have any initial or contingent deferred sales charge. |
The performance data quoted here represents past performance and past performance is not a guarantee of future results. Investment return and principal value will fluctuate so that an investor’s shares, when redeemed, may be worth more or less than their original cost. Current performance may be lower or higher than the performance information quoted. The most recent month end performance may be obtained by calling (833) 297-2587.
The Fund acquired the assets and liabilities of the Leland Thomson Reuters Venture Capital Index Fund, a series of the Northern Lights Fund Trust III (the “Predecessor Fund”) on November 20, 2020. As a result of the reorganization, the Fund is the accounting successor of the Predecessor Fund. Performance results shown in the graph and the performance table above for the period prior to November 21, 2020, reflect the performance of the Predecessor Fund.
AXS Thomson Reuters Venture Capital Return Tracker Fund
FUND PERFORMANCE at September 30, 2023 (Unaudited) – Continued
Gross and net expense ratios for the Class A shares were 2.07% and 1.75%, respectively, the Class C shares were 2.82% and 2.50%, respectively, and the Class I shares were 1.82% and 1.50%, respectively, which were stated in the current prospectus dated February 1, 2023. For the Fund’s current one year expense ratios, please refer to the Financial Highlights section of this report. The Fund’s Advisor has contractually agreed to waive its fees and/or pay for operating expenses of the Fund to ensure that total annual fund operating expenses (excluding, as applicable, taxes, leverage interest, brokerage commissions, dividend and interest expenses on short sales, acquired fund fees and expenses as determined in accordance with Form N-1A, expenses incurred in connection with any merger or reorganization, or extraordinary expenses such as litigation expenses) do not exceed 1.75%, 2.50%, and 1.50% of the average daily net assets of the Fund’s Class A, Class C, and Class I shares, respectively. This agreement is in effect until January 31, 2024, and it may be terminated before that date only by the Trust’s Board of Trustees. In the absence of such waivers, the Fund’s returns would be lower.
Returns reflect the reinvestment of distributions made by the Fund, if any. The graph and the performance table above do not reflect the deduction of taxes that a shareholder would pay on Fund distributions or the redemption of the Fund shares. Shares redeemed within 30 days of purchase will be charged 1.00% redemption fee.
AXS Merger Fund
FUND PERFORMANCE at September 30, 2023 (Unaudited)
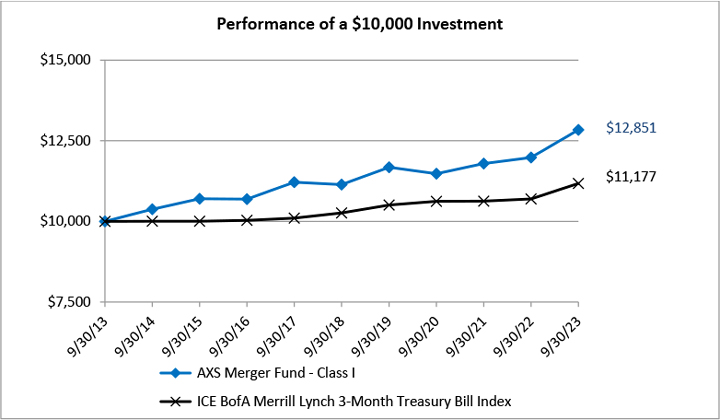
This graph compares a hypothetical $10,000 investment in the Fund’s Class I shares with a similar investment in the ICE BofA Merrill Lynch 3-Month Treasury Bill Index during the periods shown. The performance graph above is shown for the Fund’s Class I shares. Investor Class shares performance may vary. Results include the reinvestment of all dividends and capital gains.
The ICE BofA Merrill Lynch 3-Month Treasury Bill Index is an unmanaged index that measures returns of three-month Treasury Bills. The indexes do not reflect expenses, fees or sales charge, which would lower performance. The indexes are unmanaged and are not available for investment.
| Average Annual Total Returns as of September 30, 2023 | 1 Year | 5 Years | 10 Years |
| Class I | 7.23% | 2.89% | 2.54% |
| Investor Class | 6.98% | 2.65% | 2.23% |
| ICE BofA Merrill Lynch 3-Month Treasury Bill Index | 4.50% | 1.72% | 1.12% |
The performance data quoted here represents past performance and past performance is not a guarantee of future results. Investment return and principal value will fluctuate so that an investor’s shares, when redeemed, may be worth more or less than their original cost. Current performance may be lower or higher than the performance information quoted. The most recent month end performance may be obtained by calling (833) 297-2587.
The Fund acquired the assets and liabilities of the Kellner Merger Fund, a series of the Advisors Series Trust (the “Predecessor Fund”) on January 22, 2021. As a result of the reorganization, the Fund is the accounting successor of the Predecessor Fund. Performance results shown in the graph and the performance table above for the periods prior to January 23, 2021, reflect the performance of the Predecessor Fund.
Gross and net expense ratios for the Investor Class shares were 2.63% and 2.33%, respectively, and the Class I shares were 2.38% and 2.08%, respectively, which were stated in the current prospectus dated February 1, 2023, and supplemented on April 21, 2023 and June 26, 2023. For the Fund’s current one year expense ratios, please refer to the Financial Highlights section of this report. The Fund’s Advisor has contractually agreed to waive its fees and/or pay for operating expenses of the Fund to ensure that total annual fund operating expenses (excluding any taxes, leverage interest, brokerage commissions, dividend and interest expenses on short sales, acquired fund fees and expenses as determined in accordance with Form N-1A, expenses incurred in connection with any merger or reorganization, or extraordinary expenses such as litigation expenses) do not exceed 1.75% and 1.50% of the average daily net assets of the Fund’s Investor Class and Class I shares, respectively. This agreement is in effect until January 31, 2024, and it may be terminated before that date only by the Trust’s Board of Trustees. In the absence of such waivers, the Fund’s returns would be lower.
AXS Merger Fund
FUND PERFORMANCE at September 30, 2023 (Unaudited) – Continued
Returns reflect the reinvestment of distributions made by the Fund, if any. The graph and the performance table above do not reflect the deduction of taxes that a shareholder would pay on Fund distributions or the redemption of the Fund shares. Shares redeemed within 30 days of purchase will be charged 1.00% redemption fee.
AXS Alternative Value Fund
FUND PERFORMANCE at September 30, 2023 (Unaudited)
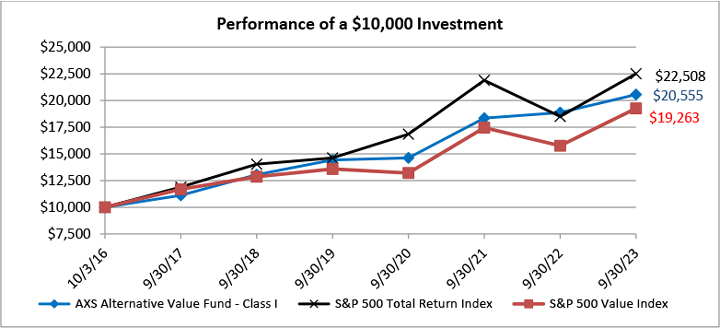
This graph compares a hypothetical $10,000 investment in the Fund’s Class I shares, made at its inception, with a similar investment in the S&P 500 Total Return Index and the S&P 500 Value Index. The performance graph above is shown for the Fund’s Class I shares. Investor Class shares performance may vary. Results include the reinvestment of all dividends and capital gains.
The S&P 500 Total Return Index is a broad unmanaged index of 500 stocks, which is widely recognized as representative of the equity market in general. The S&P 500 Value Index represents the value companies of the S&P 500 Index, a widely recognized benchmark of U.S. stock market performance that is dominated by the stocks of large U.S. companies. These indices do not reflect expenses, fees or sales charge, which would lower performance. These indices are unmanaged and are not available for investment.
| Average Annual Total Returns as of September 30, 2023 | 1 Year | 5 Years | Since Inception | Inception Date |
| Class I | 8.98% | 9.51% | 10.86% | 10/03/16 |
| Investor Class | 8.79% | 9.37% | 10.67% | 10/03/16 |
| S&P 500 Total Return Index | 21.62% | 9.92% | 12.30% | 10/03/16 |
| S&P 500 Value Index | 19.65% | 5.84% | 7.19% | 10/03/16 |
The performance data quoted here represents past performance and past performance is not a guarantee of future results. Investment return and principal value will fluctuate so that an investor’s shares, when redeemed, may be worth more or less than their original cost. Current performance may be lower or higher than the performance information quoted. The most recent month end performance may be obtained by calling (833) 297-2587.
The Fund acquired the assets and liabilities of the AXS Alternative Value Fund (formerly, Cognios Large Cap Value Fund), a series of the M3Sixty Funds Trust (the “Predecessor Fund”) on March 5, 2021. As a result of the reorganization, the Fund is the accounting successor of the Predecessor Fund. Performance results shown in the graph and the performance table above for the periods prior to March 6, 2021, reflect the performance of the Predecessor Fund.
Gross and net expense ratios for the Investor Class shares were 2.42% and 1.78%, respectively, and the Class I shares were 2.17% and 1.53%, respectively, which were stated in the current prospectus dated February 1, 2023, and supplemented on April 21, 2023. For the Fund’s current one year expense ratios, please refer to the Financial Highlights section of this report. The Fund’s Advisor has contractually agreed to waive its fees and/or pay for operating expenses of the Fund to ensure that total annual fund operating expenses (excluding any taxes, leverage interest, brokerage commissions, dividend and interest expenses on short sales, acquired fund fees and expenses as determined in accordance with Form N-1A, expenses incurred in connection with any merger or reorganization, or extraordinary expenses such as litigation expenses) do not exceed 1.10% and 0.85% of the average daily net assets of the Fund’s Investor Class and Class I shares, respectively. This agreement is in effect until January 31, 2024, and it may be terminated before that date only by the Trust’s Board of Trustees. In the absence of such waivers, the Fund’s returns would be lower.
AXS Alternative Value Fund
FUND PERFORMANCE at September 30, 2023 (Unaudited) – Continued
Returns reflect the reinvestment of distributions made by the Fund, if any. The graph and the performance table above do not reflect the deduction of taxes that a shareholder would pay on Fund distributions or the redemption of the Fund shares. Shares redeemed within 30 days of purchase will be charged 1.00% redemption fee.
AXS Market Neutral Fund
FUND PERFORMANCE at September 30, 2023 (Unaudited)

This graph compares a hypothetical $10,000 investment in the Fund’s Class I shares, made at with a similar investment in the S&P 500 Total Return Index and Bloomberg Aggregate Bond Index for the periods shown above. The performance graph above is shown for the Fund’s Class I shares. Investor Class shares performance may vary. Results include the reinvestment of all dividends and capital gains.
The S&P 500 Total Return Index is a broad unmanaged index of 500 stocks, which is widely recognized as representative of the equity market in general. The Bloomberg Aggregate Bond Index is comprised of investment grade, fixed rate bond market securities, including government, government agency, corporate and mortgage-backed securities between one and ten years. These indices do not reflect expenses, fees or sales charge, which would lower performance. These indices are unmanaged and are not available for investment.
| Average Annual Total Returns as of September 30, 2023 | 1 Year | 5 Years | 10 Years |
| Class I | 4.86% | 2.56% | 4.25% |
| Investor Class | 4.54% | 2.32% | 4.00% |
| S&P 500 Total Return Index | 21.62% | 9.92% | 11.91% |
| Bloomberg Aggregate Bond Index | 0.64% | 0.10% | 1.13% |
The performance data quoted here represents past performance and past performance is not a guarantee of future results. Investment return and principal value will fluctuate so that an investor’s shares, when redeemed, may be worth more or less than their original cost. Current performance may be lower or higher than the performance information quoted. The most recent month end performance may be obtained by calling (833) 297-2587.
The Fund acquired the assets and liabilities of the AXS Market Neutral Fund (formerly, Cognios Market Neutral Large Cap Fund), a series of the M3Sixty Funds Trust (the “Predecessor Fund”) on March 5, 2021. As a result of the reorganization, the Fund is the accounting successor of the Predecessor Fund. Performance results shown in the graph and the performance table above for the periods prior to March 6, 2021, reflect the performance of the Predecessor Fund.
Gross and net expense ratios for the Investor Class shares were 4.65% and 3.88%, respectively, and the Class I shares were 4.40% and 3.63%, respectively, which were stated in the current prospectus dated February 1, 2023 and supplemented on April 21, 2023. For the Fund’s current one year expense ratios, please refer to the Financial Highlights section of this report. The Fund’s Advisor has contractually agreed to waive its fees and/or pay for operating expenses of the Fund to ensure that total annual fund operating expenses (excluding any taxes, leverage interest, brokerage commissions, dividend and interest expenses on short sales, acquired fund fees and expenses as determined in accordance with Form N-1A, expenses incurred in connection with any merger or reorganization, or extraordinary expenses such as litigation expenses) do not exceed 1.70% and 1.45% of the average daily net assets of the Fund’s Investor Class and Class I shares, respectively. This agreement is in effect until January 31, 2024, and it may be terminated before that date only by the Trust’s Board of Trustees. In the absence of such waivers, the Fund’s returns would be lower.
AXS Market Neutral Fund
FUND PERFORMANCE at September 30, 2023 (Unaudited) – Continued
Returns reflect the reinvestment of distributions made by the Fund, if any. The graph and the performance table above do not reflect the deduction of taxes that a shareholder would pay on Fund distributions or the redemption of the Fund shares. Shares redeemed within 30 days of purchase will be charged 1.00% redemption fee.
AXS Adaptive Plus Fund
FUND PERFORMANCE at September 30, 2023 (Unaudited)

This graph compares a hypothetical $10,000 investment in the Fund’s Class I shares, made at its inception, with a similar investment in the S&P 500 Total Return Index. The performance graph above is shown for the Fund’s Class I shares. Results include the reinvestment of all dividends and capital gains.
The S&P 500 Index measures the performance of large cap U.S. equities. It is weighted by market cap and comprised of 500 of the largest domestically listed companies which represent approximately 80% of domestically available market capitalization. The index is unmanaged and is not available for investment.
| Average Annual Total Returns as of September 30, 2023 | 1 Year | Since Inception | Inception Date |
| Class I | -3.51% | -0.50% | 9/15/22 |
| S&P 500 Index | 21.62% | 11.34% | 9/15/22 |
The performance data quoted here represents past performance and past performance is not a guarantee of future results. Investment return and principal value will fluctuate so that an investor's shares, when redeemed, may be worth more or less than their original cost. Current performance may be lower or higher than the performance information quoted. The most recent month end performance may be obtained by calling (833) 297-2587.
Gross and net expense ratios for the Fund’s Class I shares were 2.47% and 2.10%, respectively, which were the amounts stated in the current prospectus dated February 1, 2023, and supplemented on September 8, 2023. For the Fund’s current period expense ratios, please refer to the Financial Highlights section of this report. The Fund’s Advisor has contractually agreed to waive fees and/or pay for operating expenses of the Fund to ensure that total annual fund operating expenses (excluding any taxes, leverage interest, brokerage commissions, dividend and interest expenses on short sales, acquired fund fees and expenses as determined in accordance with Form N-1A, expenses incurred in connection with any merger or reorganization, or extraordinary expenses such as litigation expenses) do not exceed 1.99% of the average daily net assets of Class I shares of the Fund. This agreement is in effect until January 31, 2024 and may be terminated before that date only by the Trust’s Board of Trustees. In the absence of such waivers, the Fund’s returns would be lower.
AXS Adaptive Plus Fund
FUND PERFORMANCE at September 30, 2023 (Unaudited) - Continued
Returns reflect the reinvestment of distributions made by the Fund, if any. The graph and the performance table shown do not reflect the deduction of taxes that a shareholder would pay on Fund distributions or the redemption of Fund shares.
AXS Income Opportunities Fund
FUND PERFORMANCE at September 30, 2023 (Unaudited)
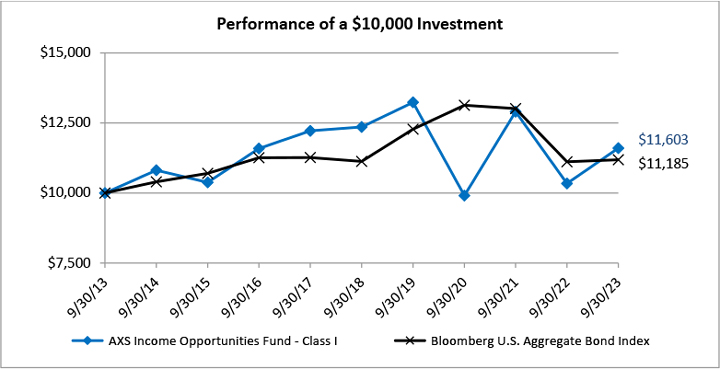
This graph compares a hypothetical $10,000 investment in the Fund’s Class I shares with a similar investment in the Bloomberg U.S. Aggregate Bond Index during the periods shown. The performance graph above is shown for the Fund’s Class I shares. Class A and Class D shares performance may vary. Results include the reinvestment of all dividends and capital gains.
The Bloomberg U.S. Aggregate Bond Index is a broad-based fixed-income index used by bond traders and the managers of mutual funds and exchange-traded funds (ETFs) as a benchmark to measure their relative performance. The index does not reflect expenses, fees or sales charge, which would lower performance. The index is unmanaged and is not available for investment.
| Average Annual Total Returns as of September 30, 2023 | 1 Year | 5 Years | 10 Years |
| Before deducting maximum sales charge | | | |
| Class A1,2 | 11.96% | -1.53% | 1.21% |
| Class D3 | 11.08% | -2.24% | 0.50% |
| Class I2 | 12.21% | -1.25% | 1.50% |
| After deducting maximum sales charge | | | |
| Class A1,2 | 5.50% | -2.53% | 0.69% |
| Bloomberg U.S. Aggregate Bond Index | 0.64% | 0.10% | 1.13% |
| 1 | Maximum sales charge for Class A shares is 5.75%. No initial sales charge applies to purchases of $1 million or more. |
| 2 | The Class I and Class A Shares commenced operations on June 28, 2013. |
| 3 | The Class D Shares commenced operations on September 27, 2013. |
The performance data quoted here represents past performance and past performance is not a guarantee of future results. Investment return and principal value will fluctuate so that an investor’s shares, when redeemed, may be worth more or less than their original cost. Current performance may be lower or higher than the performance information quoted. The most recent month end performance may be obtained by calling (833) 297-2587.
AXS Income Opportunities Fund
FUND PERFORMANCE at September 30, 2023 (Unaudited) – Continued
The Fund acquired the assets and liabilities of the AXS Income Opportunities Fund (formerly, Orinda Income Opportunities Fund), a series of the RBB Fund, Inc. (the “Predecessor Fund”) at the close of business on May 13, 2022. As a result of the reorganization, the Fund is the accounting successor of the Predecessor Fund. Performance results shown in the graph and the performance table above for the periods prior to May 14, 2022, reflect the performance of the Predecessor Fund.
Expense ratios for the Class A, Class D and Class I shares were 1.69%, 2.44% and 1.44%, respectively, which were stated in the current prospectus dated January 1, 2023. For the Fund’s current period expense ratios, please refer to the Financial Highlights section of this report. The Fund’s Advisor has contractually agreed to waive its fees and/or pay for operating expenses of the Fund to ensure that total annual fund operating expenses (excluding any taxes, leverage interest, brokerage commissions, dividend and interest expenses on short sales, acquired fund fees and expenses as determined in accordance with Form N-1A, expenses incurred in connection with any merger or reorganization, or extraordinary expenses such as litigation expenses) do not exceed 1.65%, 2.40% and 1.40% of the average daily net assets of the Fund’s Class A, Class D and Class I shares, respectively. This agreement is in effect until May 13, 2024, and it may be terminated before that date only by the Trust’s Board of Trustees. In the absence of such waivers, the Fund’s returns would be lower.
Returns reflect the reinvestment of distributions made by the Fund, if any. The graph and the performance table above do not reflect the deduction of taxes that a shareholder would pay on Fund distributions or the redemption of the Fund shares.
AXS Dynamic Opportunity Fund
FUND PERFORMANCE at September 30, 2023 (Unaudited)
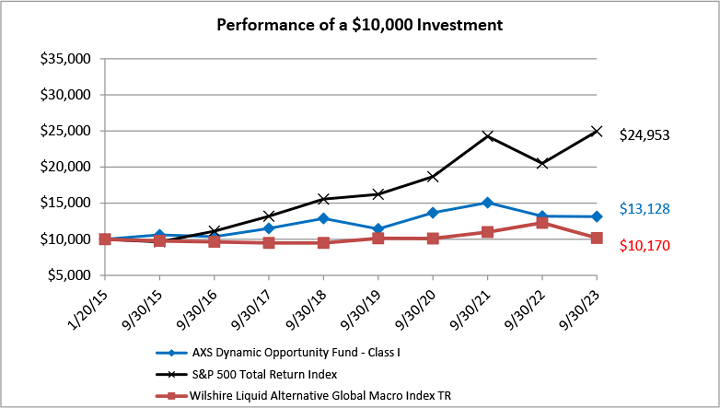
This graph compares a hypothetical $10,000 investment in the Fund’s Class I shares, made at its inception, with similar investments in the S&P 500 Total Return Index and the Wilshire Liquid Alternative Global Macro Index TR. The performance graph above is shown for the Fund’s Class I shares. Class A shares performance may vary. Results include the reinvestment of all dividends and capital gains.
The S&P 500 Total Return Index is widely regarded as the best single gauge of the U.S. equities market. This world-renowned Index includes 500 leading companies in leading industries of the U.S. economy. The Wilshire Liquid Alternative Global Macro Index TR measures the performance of the global macro strategy component of the Wilshire Liquid Alternative Index TR. These indices do not reflect expenses, fees or sales charge, which would lower performance. These indices are unmanaged and are not available for investment.
| Average Annual Total Returns as of September 30, 2023 | 1 Year | 5 Years | Since Inception | Inception Date |
| Before deducting maximum sales charge | | | | |
| Class A1 | -0.71% | 0.18% | 2.97% | 01/20/15 |
| Class I | -0.46% | 0.38% | 3.18% | 01/20/15 |
| After deducting maximum sales charge | | | | |
| Class A1 | -6.44% | -1.00% | 2.26% | 01/20/15 |
| S&P 500 Total Return Index | 21.62% | 9.92% | 11.09% | 01/20/15 |
| Wilshire Liquid Alternative Global Macro Index TR | -3.79% | 3.53% | 1.40% | 01/20/15 |
| 1 | Maximum sales charge for Class A shares is 5.75%. No initial sales charge applies to purchases of $1 million or more. |
The performance data quoted here represents past performance and past performance is not a guarantee of future results. Investment return and principal value will fluctuate so that an investor’s shares, when redeemed, may be worth more or less than their original cost. Current performance may be lower or higher than the performance information quoted. The most recent month end performance may be obtained by calling (833) 297-2587.
AXS Dynamic Opportunity Fund
FUND PERFORMANCE at September 30, 2023 (Unaudited) – Continued
The Fund acquired the assets and liabilities of the AXS Dynamic Opportunity Fund, a series of Northern Lights Fund Trust III (the “Predecessor Fund”) which occurred on May 12, 2023. As a result of the reorganization, the Fund is the accounting successor of the Predecessor Fund. Performance results shown in the graph and the performance table above for the periods prior to May 12, 2023, reflect the performance of the Predecessor Fund.
Expense ratio for the Fund’s Class A shares were 1.93% and for the Fund’s Class I shares were 1.68% which were the amounts stated in the current prospectus dated February 23, 2023. For the Fund’s current period expense ratios, please refer to the Financial Highlights section of this report. The Fund’s Advisor has contractually agreed to waive fees and/or pay for operating expenses of the Fund to ensure that total annual fund operating expenses (excluding any taxes, leverage interest, brokerage commissions, dividend and interest expenses on short sales, acquired fund fees and expenses as determined in accordance with Form N-1A, expenses incurred in connection with any merger or reorganization, or extraordinary expenses such as litigation expenses) do not exceed 2.40% and 2.15% of the average daily net assets of Class A and Class I shares of the Fund. This agreement is in effect for a period of two years from the date of the reorganization of the ACM Dynamic Opportunity Fund, a series of Northern Lights Fund Trust III, which occurred on May 12, 2023, and may be terminated before that date only by the Trust’s Board of Trustees. In the absence of such waivers, the Fund’s returns would be lower.
Returns reflect the reinvestment of distributions made by the Fund, if any. The graph and the performance table above do not reflect the deduction of taxes that a shareholder would pay on Fund distributions or the redemption of the Fund shares. Shares redeemed within 30 days of purchase will be charged 1.00% redemption fee.
AXS Tactical Income Fund
FUND PERFORMANCE at September 30, 2023 (Unaudited)

This graph compares a hypothetical $10,000 investment in the Fund’s Class I shares, made at its inception, with a similar investment in the Bloomberg U.S Aggregate Bond Index. Results include the reinvestment of all dividends and capital gains.
The Bloomberg U.S Aggregate Bond Index is comprised of U.S investment grade, fixed rate bond market securities, including government, government agency, corporate and mortgage-backed securities between one and ten years. The index is unmanaged and it is not available for investment.
| Average Annual Total Returns as of September 30, 2023 | 1 Year | 3 Years | Since Inception | Inception Date |
| Before deducting maximum sales charge | | | | |
| Class A1 | -0.76% | -1.95% | 0.49% | 12/31/18 |
| Class I | -0.40% | -1.71% | 0.75% | 12/31/18 |
| After deducting maximum sales charge | | | | |
| Class A1 | -6.45% | -3.88% | -0.76% | 12/31/18 |
| Bloomberg U.S Aggregate Bond Index | 0.64% | -5.21% | -0.23% | 12/31/18 |
| 1 | Maximum sales charge for Class A shares is 5.75%. No initial sales charge applies to purchases of $1 million or more. |
The performance data quoted here represents past performance and past performance is not a guarantee of future results. Investment return and principal value will fluctuate so that an investor's shares, when redeemed, may be worth more or less than their original cost. Current performance may be lower or higher than the performance information quoted. The most recent month end performance may be obtained by calling (833) 297-2587.
The Fund acquired the assets and liabilities of the AXS Tactical Income Fund, a series of Northern Lights Fund Trust III (the “Predecessor Fund”) which occurred on May 12, 2023. As a result of the reorganization, the Fund is the accounting successor of the Predecessor Fund. Performance results shown in the graph and the performance table above for the periods prior to May 12, 2023, reflect the performance of the Predecessor Fund.
Expense ratio for the Fund’s Class A shares were 2.95% and for the Fund’s Class I shares were 2.70% which were the amounts stated in the current prospectus dated February 27, 2023. For the Fund’s current period expense ratios, please refer to the Financial Highlights section of this report. The Fund’s Advisor has contractually agreed to waive fees and/or pay for operating expenses of the Fund to ensure that total annual fund operating expenses (excluding any taxes, leverage interest, brokerage commissions, dividend and interest expenses on short sales, acquired fund fees and expenses as determined in accordance with Form N-1A, expenses incurred in connection with any merger or reorganization, or extraordinary expenses such as litigation expenses) do not exceed 2.25% and 2.00% of the average daily net assets of Class A and Class I shares of the Fund. This agreement is in effect for a period of two years from the date of the reorganization of the ACM Tactical Income Fund, a series of Northern Lights Fund Trust III, which occurred on May 12, 2023, and may be terminated before that date only by the Trust’s Board of Trustees. In the absence of such waivers, the Fund’s returns would be lower.
AXS Tactical Income Fund
FUND PERFORMANCE at September 30, 2023 (Unaudited) - Continued
Returns reflect the reinvestment of distributions made by the Fund, if any. The graph and the performance table above do not reflect the deduction of taxes that a shareholder would pay on Fund distributions or the redemption of Fund shares. Shares redeemed within 30 days of purchase will be charged a redemption fee of 1.00%.
AXS Chesapeake Strategy Fund
FUND PERFORMANCE at September 30, 2023 (Unaudited)
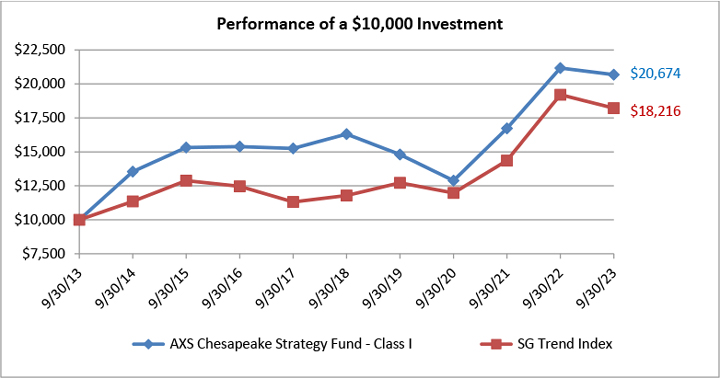
This graph compares a hypothetical $10,000 investment in the Fund’s Class I shares with a similar investment in the SG Trend Index during the periods shown. The performance graph above is shown for the Fund’s Class I shares. Class A shares and Class C shares performance may vary. Results include the reinvestment of all dividends and capital gains.
The SG Trend Index is designed to track the 10 largest (by AUM) trend following CTAs and be representative of the trend followers in the managed futures space. The SG Trend index is equally weighted, and rebalanced and reconstituted annually. The index does not reflect expenses, fees or sales charge, which would lower performance. The index is unmanaged and is not available for investment.
| Average Annual Total Returns as of September 30, 2023 | 1 Year | 5 Years | 10 Years | Since Inception | Inception Date |
| Before deducting maximum sales charge | | | | | |
| Class A1 | -2.50% | 4.61% | N/A | 3.01% | 08/21/15 |
| Class C2 | -3.27% | 3.82% | N/A | 2.25% | 08/21/15 |
| Class I3 | -2.35% | 4.86% | 7.53% | N/A | N/A |
| After deducting maximum sales charge | | | | | |
| Class A1 | -8.11% | 3.37% | N/A | 2.26% | 08/21/15 |
| Class C2 | -4.23% | 3.82% | N/A | 2.25% | 08/21/15 |
| SG Trend Index | -4.97% | 9.14% | 6.21% | N/A | N/A |
| 1 | Maximum sales charge for Class A shares is 5.75%. No initial sales charge applies to purchase of $1 million or more. |
| 2 | Class C Shares are subject to a contingent deferred sales charge (“CDSC”) of 1.00% on any shares sold within 12 months of the date of purchase. |
| 3 | Class I shares do not have any initial or contingent deferred sales charge. |
The performance data quoted here represents past performance and past performance is not a guarantee of future results. Investment return and principal value will fluctuate so that an investor’s shares, when redeemed, may be worth more or less than their original cost. Current performance may be lower or higher than the performance information quoted. The most recent month end performance may be obtained by calling (833) 297-2587.
The Fund acquired the assets and liabilities of the Equinox Chesapeake Strategy Fund, a series of the Equinox Funds Trust (the “Predecessor Fund”) on November 8, 2019. As a result of the reorganization, the Fund is the accounting successor of the Predecessor Fund. Performance results shown in the graph and the performance table above for the period prior to November 9, 2019, reflect the performance of the Predecessor Fund.
AXS Chesapeake Strategy Fund
FUND PERFORMANCE at September 30, 2023 (Unaudited) – Continued
Gross and net expense ratios for the Class A were 2.69% and 2.19%, respectively, for the Class C shares were 3.44% and 2.94%, respectively, and for the Class I shares were 2.44% and 1.94%, respectively, which were stated in the current prospectus dated February 1, 2023. For the Fund’s current one year expense ratios, please refer to the Consolidated Financial Highlights section of this report. The Fund’s Advisor has contractually agreed to waive its fees and/or pay for operating expenses of the Fund to ensure that total annual fund operating expenses (excluding, as applicable, taxes, leverage interest, brokerage commissions, dividend and interest expenses on short sales, acquired fund fees and expenses as determined in accordance with Form N-1A, expenses incurred in connection with any merger or reorganization, or extraordinary expenses such as litigation expenses) do not exceed 2.10%, 2.85%, and 1.85% of the average daily net assets of the Fund’s Class A, Class C, and Class I shares, respectively. This agreement is in effect until July 22, 2024, and it may be terminated before that date only by the Trust’s Board of Trustees. In the absence of such waivers, the Fund’s returns would be lower.
Returns reflect the reinvestment of distributions made by the Fund, if any. The graph and the performance table above do not reflect the deduction of taxes that a shareholder would pay on Fund distributions or the redemption of the Fund shares.
AXS Multi-Strategy Alternatives Fund
SCHEDULE OF INVESTMENTS
As of September 30, 2023
| Number of Shares | | | | | Value | |
| | | | | COMMON STOCKS — 56.2% | | | | |
| | | | | AEROSPACE/DEFENSE — 2.0% | | | | |
| | 260 | | | Curtiss-Wright Corp. | | $ | 50,864 | |
| | 1,590 | | | Howmet Aerospace, Inc. | | | 73,537 | |
| | 180 | | | Lockheed Martin Corp. | | | 73,613 | |
| | 145 | | | TransDigm Group, Inc.* | | | 122,254 | |
| | | | | | | | 320,268 | |
| | | | | AGRICULTURE — 0.5% | | | | |
| | 1,840 | | | Altria Group, Inc. | | | 77,372 | |
| | | | | | | | | |
| | | | | APPAREL — 1.0% | | | | |
| | 305 | | | Deckers Outdoor Corp.* | | | 156,798 | |
| | | | | | | | | |
| | | | | AUTO MANUFACTURERS — 4.1% | | | | |
| | 580 | | | Cummins, Inc. | | | 132,507 | |
| | 1,280 | | | Tesla, Inc.* | | | 320,281 | |
| | 9,075 | | | Wabash National Corp. | | | 191,664 | |
| | | | | | | | 644,452 | |
| | | | | BANKS — 2.2% | | | | |
| | 9,845 | | | Customers Bancorp, Inc.* | | | 339,160 | |
| | | | | | | | | |
| | | | | BIOTECHNOLOGY — 2.6% | | | | |
| | 2,345 | | | Gilead Sciences, Inc. | | | 175,734 | |
| | 4,015 | | | Incyte Corp.* | | | 231,947 | |
| | | | | | | | 407,681 | |
| | | | | BUILDING MATERIALS — 2.0% | | | | |
| | 2,135 | | | American Woodmark Corp.* | | | 161,427 | |
| | 3,300 | | | Apogee Enterprises, Inc. | | | 155,364 | |
| | | | | | | | 316,791 | |
| | | | | COMMERCIAL SERVICES — 2.0% | | | | |
| | 4,760 | | | Adtalem Global Education, Inc.* | | | 203,966 | |
| | 440 | | | Automatic Data Processing, Inc. | | | 105,855 | |
| | | | | | | | 309,821 | |
| | | | | COMPUTERS — 5.0% | | | | |
| | 1,765 | | | Apple, Inc. | | | 302,186 | |
| | 630 | | | Leidos Holdings, Inc. | | | 58,061 | |
| | 1,015 | | | Qualys, Inc.* | | | 154,838 | |
| | 6,010 | | | Western Digital Corp.* | | | 274,236 | |
| | | | | | | | 789,321 | |
| | | | | ELECTRICAL COMPONENTS & EQUIPMENT — 0.9% | | | | |
| | 780 | | | Encore Wire Corp. | | | 142,319 | |
AXS Multi-Strategy Alternatives Fund
SCHEDULE OF INVESTMENTS - Continued
As of September 30, 2023
| Number of Shares | | | | | Value | |
| | | | | COMMON STOCKS (Continued) | | | | |
| | | | | ELECTRONICS — 2.8% | | | | |
| | 2,805 | | | Brady Corp. - Class A | | $ | 154,050 | |
| | 1,465 | | | Garmin Ltd.1 | | | 154,118 | |
| | 10,960 | | | TTM Technologies, Inc.* | | | 141,165 | |
| | | | | | | | 449,333 | |
| | | | | ENGINEERING & CONSTRUCTION — 1.0% | | | | |
| | 740 | | | EMCOR Group, Inc. | | | 155,689 | |
| | | | | | | | | |
| | | | | HEALTHCARE-PRODUCTS — 2.6% | | | | |
| | 970 | | | Edwards Lifesciences Corp.* | | | 67,202 | |
| | 1,070 | | | Globus Medical, Inc. - Class A* | | | 53,126 | |
| | 885 | | | Haemonetics Corp.* | | | 79,278 | |
| | 315 | | | Intuitive Surgical, Inc.* | | | 92,071 | |
| | 690 | | | Lantheus Holdings, Inc.* | | | 47,941 | |
| | 365 | | | Teleflex, Inc. | | | 71,690 | |
| | | | | | | | 411,308 | |
| | | | | HOME BUILDERS — 2.4% | | | | |
| | 2,015 | | | Century Communities, Inc. | | | 134,562 | |
| | 1,420 | | | M/I Homes, Inc.* | | | 119,337 | |
| | 1,080 | | | Meritage Homes Corp. | | | 132,181 | |
| | | | | | | | 386,080 | |
| | | | | INSURANCE — 5.9% | | | | |
| | 460 | | | American Financial Group, Inc. | | | 51,368 | |
| | 1,210 | | | Arch Capital Group Ltd.*,1 | | | 96,449 | |
| | 300 | | | Erie Indemnity Co. - Class A | | | 88,137 | |
| | 1,680 | | | Essent Group Ltd.1 | | | 79,447 | |
| | 215 | | | Kinsale Capital Group, Inc. | | | 89,038 | |
| | 5,295 | | | MGIC Investment Corp. | | | 88,374 | |
| | 2,505 | | | Old Republic International Corp. | | | 67,485 | |
| | 1,230 | | | Primerica, Inc. | | | 238,632 | |
| | 490 | | | RLI Corp. | | | 66,586 | |
| | 1,100 | | | W R Berkley Corp. | | | 69,839 | |
| | | | | | | | 935,355 | |
| | | | | INTERNET — 4.3% | | | | |
| | 725 | | | Amazon.com, Inc.* | | | 92,162 | |
| | 1,595 | | | Expedia Group, Inc.* | | | 164,397 | |
| | 1,395 | | | JD.com, Inc. - ADR1 | | | 40,636 | |
| | 125 | | | MercadoLibre, Inc.* | | | 158,485 | |
| | 470 | | | Meta Platforms, Inc. - Class A* | | | 141,099 | |
| | 235 | | | Netflix, Inc.* | | | 88,736 | |
| | | | | | | | 685,515 | |
AXS Multi-Strategy Alternatives Fund
SCHEDULE OF INVESTMENTS - Continued
As of September 30, 2023
| Number of Shares | | | | | Value | |
| | | | | COMMON STOCKS (Continued) | | | | |
| | | | | MISCELLANEOUS MANUFACTURING — 0.7% | | | | |
| | 1,185 | | | 3M Co. | | $ | 110,940 | |
| | | | | | | | | |
| | | | | OIL & GAS — 0.1% | | | | |
| | 40 | | | Valero Energy Corp. | | | 5,668 | |
| | 368 | | | Vitesse Energy, Inc. | | | 8,424 | |
| | | | | | | | 14,092 | |
| | | | | PACKAGING & CONTAINERS — 0.8% | | | | |
| | 7,310 | | | O-I Glass, Inc.* | | | 122,296 | |
| | | | | | | | | |
| | | | | RETAIL — 2.5% | | | | |
| | 470 | | | AutoNation, Inc.* | | | 71,158 | |
| | 175 | | | Costco Wholesale Corp. | | | 98,868 | |
| | 175 | | | Lithia Motors, Inc. | | | 51,683 | |
| | 240 | | | Murphy USA, Inc. | | | 82,015 | |
| | 220 | | | Ulta Beauty, Inc.* | | | 87,879 | |
| | | | | | | | 391,603 | |
| | | | | SEMICONDUCTORS — 2.8% | | | | |
| | 235 | | | ASML Holding N.V.1 | | | 138,335 | |
| | 695 | | | NVIDIA Corp. | | | 302,318 | |
| | | | | | | | 440,653 | |
| | | | | SOFTWARE — 5.5% | | | | |
| | 190 | | | Adobe, Inc.* | | | 96,881 | |
| | 1,275 | | | Electronic Arts, Inc. | | | 153,510 | |
| | 310 | | | Intuit, Inc. | | | 158,391 | |
| | 930 | | | Microsoft Corp. | | | 293,647 | |
| | 350 | | | Synopsys, Inc.* | | | 160,640 | |
| | | | | | | | 863,069 | |
| | | | | TELECOMMUNICATIONS — 1.7% | | | | |
| | 9,640 | | | Juniper Networks, Inc. | | | 267,896 | |
| | | | | | | | | |
| | | | | TRANSPORTATION — 0.8% | | | | |
| | 1,510 | | | Matson, Inc. | | | 133,967 | |
| | | | | | | | | |
| | | | | TOTAL COMMON STOCKS | | | | |
| | | | | (Cost $8,494,920) | | | 8,871,779 | |
| | | | | EXCHANGE-TRADED FUNDS — 33.6% | | | | |
| | 41,575 | | | AGF U.S. Market Neutral Anti-Beta Fund - Class B - ETF | | | 825,679 | |
| | 38,000 | | | Direxion Daily S&P 500 Bear 3X Shares - Class USD INC - ETF | | | 599,640 | |
| | 2,835 | | | Energy Select Sector SPDR Fund - Class USD INC - ETF | | | 256,256 | |
| | 10,565 | | | Global X Uranium ETF - ETF | | | 285,677 | |
| | 8,520 | | | iShares 7-10 Year Treasury Bond ETF - ETF | | | 780,347 | |
| | 5,690 | | | iShares MSCI India ETF - Class USD INC - ETF | | | 251,612 | |
AXS Multi-Strategy Alternatives Fund
SCHEDULE OF INVESTMENTS - Continued
As of September 30, 2023
| Number of Shares | | | | | Value | |
| | | | | EXCHANGE-TRADED FUNDS (Continued) | | | | |
| | 4,000 | | | iShares MSCI India Small-Cap ETF - ETF | | $ | 252,480 | |
| | 4,131 | | | iShares MSCI Japan ETF - ETF | | | 249,058 | |
| | 3,620 | | | iShares MSCI Japan Small-Cap ETF - ETF | | | 245,997 | |
| | 50,000 | | | ProShares UltraPro Short S&P 500 - Class USD INC - ETF | | | 597,500 | |
| | 9,545 | | | Simplify Health Care ETF - ETF | | | 239,675 | |
| | 6,560 | | | SPDR Gold MiniShares Trust - ETF* | | | 240,490 | |
| | 2,935 | | | SPDR S&P Health Care Equipment ETF - ETF | | | 229,135 | |
| | 16,665 | | | Sprott Physical Gold Trust*,1 | | | 238,643 | |
| | | | | TOTAL EXCHANGE-TRADED FUNDS | | | | |
| | | | | (Cost $5,312,663) | | | 5,292,189 | |
| | | | | | | | | |
| | | | | SHORT-TERM INVESTMENTS — 12.3% | | | | |
| | 1,938,289 | | | Fidelity Investments Money Market Government Portfolio - Class I, 5.16%2,3 | | | 1,938,289 | |
| | | | | TOTAL SHORT-TERM INVESTMENTS | | | | |
| | | | | (Cost $1,938,289) | | | 1,938,289 | |
| | | | | | | | | |
| | | | | TOTAL INVESTMENTS — 102.1% | | | | |
| | | | | (Cost $15,745,872) | | | 16,102,257 | |
| | | | | | | | | |
| | | | | Liabilities in Excess of Other Assets — (2.1)% | | | (331,054 | ) |
| | | | | TOTAL NET ASSETS — 100.0% | | $ | 15,771,203 | |
ADR – American Depository Receipt
ETF – Exchange-Traded Fund
| * | Non-income producing security. |
| 1 | Foreign security denominated in U.S. Dollars. |
| 2 | All or a portion of this security is segregated as collateral for swap agreement. As of September 30, 2023, the aggregate value of those securities was $1,339,400, representing 8.5% of net assets. |
| 3 | The rate is the annualized seven-day yield at period end. |
See accompanying Notes to Financial Statements.
AXS Multi-Strategy Alternatives Fund
SCHEDULE OF INVESTMENTS - Continued
As of September 30, 2023
SWAP CONTRACTS
EQUITY SWAP CONTRACTS
| Counterparty | | Reference Entity | | Pay/Receive Equity on Reference Entity | | Financing Rate | | Pay/Receive
Frequency | | Termination
Date | | Notional Amount | | | Premium Paid (Received) | | | Unrealized Appreciation (Depreciation) | |
| | | | | | | | | | | | | | | | | | | | |
| Cowen | | Cowen Financial Product - AXS Multi-Strat Short | | Pay | | 2.82% (OBRF01* - Spread) | | Monthly | | 8/30/2024 | | | (2,600,069 | ) | | | - | | | $ | 131,547 | |
| TOTAL EQUITY SWAP CONTRACTS | | | | | | | | | | | | | | $ | 131,547 | |
| * | OBFR01 - Overnight Bank Funding Rate, 5.32% as of September 30, 2023. |
Equity Swap Top 50 Holdings^
| Cowen Financial Product - AXS Multi-Strat Short | | EQUITIES | | | | |
| | | | | | | | | | |
| Number of | | | | | Notional | | | Percentage of Equity | |
| Shares | | | Description | | Value | | | Swap's Notional Amount | |
| | (1,675 | ) | | Invesco QQQ Trust Series 1 ETF | | $ | (600,102 | ) | | | 23.08 | % |
| | (2,760 | ) | | iShares S&P 100 ETF | | | (553,766 | ) | | | 21.30 | % |
| | (3,525 | ) | | Invesco S&P 500 Equal Weight ETF | | | (499,457 | ) | | | 19.21 | % |
| | (5,655 | ) | | First Trust US Equity Opportunities ETF | | | (474,896 | ) | | | 18.26 | % |
| | (15,650 | ) | | Invesco S&P 500 Pure Growth ETF | | | (471,848 | ) | | | 18.15 | % |
| ^ | These investments are not direct holdings of the Fund. The holdings were determined based on the absolute notional values of the positions within the underlying swap basket. This basket contains only 5 investments. |
See accompanying Notes to Financial Statements.
AXS Multi-Strategy Alternatives Fund
SUMMARY OF INVESTMENTS
As of September 30, 2023
| Security Type/Industry | | Percent of Total Net Assets | |
| Common Stocks | | | | |
| Insurance | | | 5.9 | % |
| Software | | | 5.5 | % |
| Computers | | | 5.0 | % |
| Internet | | | 4.3 | % |
| Auto Manufacturers | | | 4.1 | % |
| Electronics | | | 2.8 | % |
| Semiconductors | | | 2.8 | % |
| Healthcare-Products | | | 2.6 | % |
| Biotechnology | | | 2.6 | % |
| Retail | | | 2.5 | % |
| Home Builders | | | 2.4 | % |
| Banks | | | 2.2 | % |
| Aerospace/Defense | | | 2.0 | % |
| Building Materials | | | 2.0 | % |
| Commercial Services | | | 2.0 | % |
| Telecommunications | | | 1.7 | % |
| Engineering & Construction | | | 1.0 | % |
| Apparel | | | 1.0 | % |
| Electrical Components & Equipment | | | 0.9 | % |
| Transportation | | | 0.8 | % |
| Packaging & Containers | | | 0.8 | % |
| Miscellaneous Manufacturing | | | 0.7 | % |
| Agriculture | | | 0.5 | % |
| Oil & Gas | | | 0.1 | % |
| Total Common Stocks | | | 56.2 | % |
| Exchange-Traded Funds | | | 33.6 | % |
| Short-Term Investments | | | 12.3 | % |
| Total Investments | | | 102.1 | % |
| Liabilities in Excess of Other Assets | | | (2.1 | )% |
| Total Net Assets | | | 100.0 | % |
See accompanying Notes to Financial Statements.
AXS Sustainable Income Fund
SCHEDULE OF INVESTMENTS
As of September 30, 2023
| Principal Amount | | | | | Value | |
| | | | | CORPORATE BONDS — 93.9% | | | | |
| | | | | AEROSPACE/DEFENSE — 3.1% | | | | |
| | | | | Hexcel Corp. | | | | |
| $ | 105,000 | | | 4.200%, 2/15/20271 | | $ | 97,238 | |
| | | | | | | | | |
| | | | | AGRICULTURE — 3.1% | | | | |
| | | | | Darling Ingredients, Inc. | | | | |
| | 104,000 | | | 5.250%, 4/15/20271,2 | | | 99,103 | |
| | | | | | | | | |
| | | | | AUTO PARTS & EQUIPMENT — 2.5% | | | | |
| | | | | Dana, Inc. | | | | |
| | 100,000 | | | 4.250%, 9/1/20301 | | | 80,260 | |
| | | | | | | | | |
| | | | | BIOTECHNOLOGY — 1.5% | | | | |
| | | | | BioMarin Pharmaceutical, Inc. | | | | |
| | 50,000 | | | 1.250%, 5/15/20273 | | | 49,530 | |
| | | | | | | | | |
| | | | | BUILDING MATERIALS — 3.1% | | | | |
| | | | | Owens Corning | | | | |
| | 107,000 | | | 3.950%, 8/15/20291 | | | 97,227 | |
| | | | | | | | | |
| | | | | COMMERCIAL SERVICES — 3.5% | | | | |
| | | | | AMN Healthcare, Inc. | | | | |
| | 106,000 | | | 4.625%, 10/1/20271,2 | | | 95,797 | |
| | | | | WASH Multifamily Acquisition, Inc. | | | | |
| | 5,000 | | | 5.750%, 4/15/20261,2 | | | 4,669 | |
| | | | | Williams Scotsman International, Inc. | | | | |
| | 10,000 | | | 6.125%, 6/15/20251,2 | | | 9,900 | |
| | | | | | | | 110,366 | |
| | | | | COMPUTERS — 8.6% | | | | |
| | | | | Apple, Inc. | | | | |
| | 100,000 | | | 1.125%, 5/11/20251 | | | 93,538 | |
| | | | | International Business Machines Corp. | | | | |
| | 100,000 | | | 3.300%, 5/15/2026 | | | 94,883 | |
| | | | | Unisys Corp. | | | | |
| | 12,000 | | | 6.875%, 11/1/20271,2 | | | 8,985 | |
| | | | | Virtusa Corp. | | | | |
| | 19,000 | | | 7.125%, 12/15/20281,2 | | | 15,342 | |
| | | | | Zscaler, Inc. | | | | |
| | 50,000 | | | 0.125%, 7/1/20253 | | | 60,050 | |
| | | | | | | | 272,798 | |
| | | | | ELECTRIC — 2.5% | | | | |
| | | | | Clearway Energy Operating LLC | | | | |
| | 100,000 | | | 3.750%, 2/15/20311,2 | | | 78,953 | |
AXS Sustainable Income Fund
SCHEDULE OF INVESTMENTS - Continued
As of September 30, 2023
| Principal Amount | | | | | Value | |
| | | | CORPORATE BONDS (Continued) | | | |
| | | | | ELECTRICAL COMPONENTS & EQUIPMENT — 3.0% | | | | |
| | | | | EnerSys | | | | |
| $ | 106,000 | | | 4.375%, 12/15/20271,2 | | $ | 96,327 | |
| | | | | | | | | |
| | | | | ELECTRONICS — 3.3% | | | | |
| | | | | Honeywell International, Inc. | | | | |
| | 35,000 | | | 1.350%, 6/1/20251 | | | 32,760 | |
| | | | | Trimble, Inc. | | | | |
| | 75,000 | | | 6.100%, 3/15/20331 | | | 73,494 | |
| | | | | | | | 106,254 | |
| | | | | ENERGY-ALTERNATE SOURCES — 3.8% | | | | |
| | | | | Enphase Energy, Inc. | | | | |
| | 100,000 | | | 0.000%, 3/1/20263 | | | 87,750 | |
| | | | | Sunnova Energy International, Inc. | | | | |
| | 50,000 | | | 0.250%, 12/1/20263 | | | 32,225 | |
| | | | | | | | 119,975 | |
| | | | | ENTERTAINMENT — 3.8% | | | | |
| | | | | Six Flags Entertainment Corp. | | | | |
| | 10,000 | | | 4.875%, 7/31/20241,2 | | | 9,895 | |
| | | | | Vail Resorts, Inc. | | | | |
| | 70,000 | | | 6.250%, 5/15/20251,2 | | | 69,623 | |
| | 49,000 | | | 0.000%, 1/1/20263 | | | 43,120 | |
| | | | | | | | 122,638 | |
| | | | | FOOD — 0.1% | | | | |
| | | | | H-Food Holdings LLC / Hearthside Finance Co., Inc. | | | | |
| | 9,000 | | | 8.500%, 6/1/20261,2 | | | 2,250 | |
| | | | | | | | | |
| | | | | HEALTHCARE-PRODUCTS — 3.0% | | | | |
| | | | | Hologic, Inc. | | | | |
| | 103,000 | | | 4.625%, 2/1/20281,2 | | | 94,766 | |
| | | | | | | | | |
| | | | | HEALTHCARE-SERVICES — 2.3% | | | | |
| | | | | CHS/Community Health Systems, Inc. | | | | |
| | 20,000 | | | 8.000%, 3/15/20261,2 | | | 19,057 | |
| | | | | ModivCare, Inc. | | | | |
| | 16,000 | | | 5.875%, 11/15/20251,2 | | | 15,209 | |
| | | | | Select Medical Corp. | | | | |
| | 15,000 | | | 6.250%, 8/15/20261,2 | | | 14,655 | |
| | | | | Tenet Healthcare Corp. | | | | |
| | 10,000 | | | 6.250%, 2/1/20271 | | | 9,676 | |
| | | | | U.S. Acute Care Solutions LLC | | | | |
| | 16,000 | | | 6.375%, 3/1/20261,2 | | | 13,760 | |
| | | | | | | | 72,357 | |
AXS Sustainable Income Fund
SCHEDULE OF INVESTMENTS - Continued
As of September 30, 2023
| Principal Amount | | | | | Value | |
| | | | CORPORATE BONDS (Continued) | | | |
| | | | | INTERNET — 0.9% | | | | |
| | | | | TripAdvisor, Inc. | | | | |
| $ | 10,000 | | | 7.000%, 7/15/20251,2 | | $ | 9,981 | |
| | | | | Uber Technologies, Inc. | | | | |
| | 18,000 | | | 8.000%, 11/1/20261,2 | | | 18,212 | |
| | | | | | | | 28,193 | |
| | | | | LODGING — 0.3% | | | | |
| | | | | Hilton Domestic Operating Co., Inc. | | | | |
| | 10,000 | | | 5.375%, 5/1/20251,2 | | | 9,825 | |
| | | | | | | | | |
| | | | | MACHINERY-DIVERSIFIED — 0.3% | | | | |
| | | | | Titan Acquisition Ltd. / Titan Co.-Borrower LLC | | | | |
| | 11,000 | | | 7.750%, 4/15/20261,2,4 | | | 10,780 | |
| | | | | | | | | |
| | | | | MEDIA — 3.5% | | | | |
| | | | | CCO Holdings LLC / CCO Holdings Capital Corp. | | | | |
| | 20,000 | | | 5.500%, 5/1/20261,2 | | | 19,319 | |
| | | | | Cengage Learning, Inc. | | | | |
| | 2,000 | | | 9.500%, 6/15/20241,2 | | | 2,002 | |
| | | | | Directv Financing LLC / Directv Financing Co.-Obligor, Inc. | | | | |
| | 13,000 | | | 5.875%, 8/15/20271,2 | | | 11,514 | |
| | | | | Gannett Holdings LLC | | | | |
| | 21,000 | | | 6.000%, 11/1/20261,2 | | | 18,037 | |
| | | | | iHeartCommunications, Inc. | | | | |
| | 18,000 | | | 8.375%, 5/1/20271 | | | 12,958 | |
| | | | | McGraw-Hill Education, Inc. | | | | |
| | 5,000 | | | 5.750%, 8/1/20281,2 | | | 4,320 | |
| | | | | Townsquare Media, Inc. | | | | |
| | 40,000 | | | 6.875%, 2/1/20261,2 | | | 37,776 | |
| | | | | Videotron Ltd. | | | | |
| | 5,000 | | | 5.375%, 6/15/20241,2,4 | | | 4,956 | |
| | | | | | | | 110,882 | |
| | | | | METAL FABRICATE/HARDWARE — 3.1% | | | | |
| | | | | Advanced Drainage Systems, Inc. | | | | |
| | 105,000 | | | 5.000%, 9/30/20271,2 | | | 98,398 | |
| | | | | | | | | |
| | | | | PACKAGING & CONTAINERS — 0.3% | | | | |
| | | | | LABL, Inc. | | | | |
| | 10,000 | | | 6.750%, 7/15/20261,2 | | | 9,690 | |
| | | | | | | | | |
| | | | | PHARMACEUTICALS — 0.3% | | | | |
| | | | | AdaptHealth LLC | | | | |
| | 12,000 | | | 6.125%, 8/1/20281,2 | | | 10,355 | |
AXS Sustainable Income Fund
SCHEDULE OF INVESTMENTS - Continued
As of September 30, 2023
| Principal Amount | | | | | Value | |
| | | | CORPORATE BONDS (Continued) | | | |
| | | | | REITS — 22.9% | | | | |
| | | | | Alexandria Real Estate Equities, Inc. | | | | |
| $ | 105,000 | | | 3.800%, 4/15/20261 | | $ | 100,154 | |
| | | | | American Tower Corp. | | | | |
| | 109,000 | | | 1.600%, 4/15/20261 | | | 97,885 | |
| | | | | Apollo Commercial Real Estate Finance, Inc. | | | | |
| | 10,000 | | | 5.375%, 10/15/20233 | | | 9,950 | |
| | | | | Digital Realty Trust LP | | | | |
| | 109,000 | | | 3.700%, 8/15/20271 | | | 100,676 | |
| | | | | Equinix, Inc. | | | | |
| | 113,000 | | | 1.000%, 9/15/20251 | | | 102,667 | |
| | | | | HAT Holdings I LLC / HAT Holdings II LLC | | | | |
| | 104,000 | | | 6.000%, 4/15/20251,2 | | | 101,197 | |
| | | | | Hudson Pacific Properties LP | | | | |
| | 26,000 | | | 5.950%, 2/15/20281 | | | 21,705 | |
| | | | | Iron Mountain, Inc. | | | | |
| | 100,000 | | | 4.875%, 9/15/20271,2 | | | 92,236 | |
| | | | | Park Intermediate Holdings LLC / PK Domestic Property LLC / PK Finance Co.-Issuer | | | | |
| | 5,000 | | | 7.500%, 6/1/20251,2 | | | 4,992 | |
| | | | | Prologis LP | | | | |
| | 128,000 | | | 1.250%, 10/15/20301 | | | 95,550 | |
| | | | | | | | 727,012 | |
| | | | | RETAIL — 2.8% | | | | |
| | | | | Home Depot, Inc. | | | | |
| | 93,000 | | | 3.350%, 9/15/20251 | | | 89,464 | |
| | | | | | | | | |
| | | | | SEMICONDUCTORS — 8.6% | | | | |
| | | | | Amkor Technology, Inc. | | | | |
| | 10,000 | | | 6.625%, 9/15/20271,2 | | | 9,863 | |
| | | | | Broadcom, Inc. | | | | |
| | 100,000 | | | 3.150%, 11/15/20251 | | | 94,531 | |
| | | | | Microchip Technology, Inc. | | | | |
| | 75,000 | | | 0.983%, 9/1/2024 | | | 71,594 | |
| | | | | Micron Technology, Inc. | | | | |
| | 100,000 | | | 5.375%, 4/15/20281 | | | 96,643 | |
| | | | | | | | 272,631 | |
| | | | | SOFTWARE — 0.5% | | | | |
| | | | | Rocket Software, Inc. | | | | |
| | 5,000 | | | 6.500%, 2/15/20291,2 | | | 4,125 | |
| | | | | SS&C Technologies, Inc. | | | | |
| | 7,000 | | | 5.500%, 9/30/20271,2 | | | 6,604 | |
AXS Sustainable Income Fund
SCHEDULE OF INVESTMENTS - Continued
As of September 30, 2023
| Principal Amount | | | | | Value | |
| | | | | CORPORATE BONDS (Continued) | | | | |
| | | | | SOFTWARE (Continued) | | | | |
| | | | | Veritas US, Inc. / Veritas Bermuda Ltd. | | | | |
| $ | 5,000 | | | 7.500%, 9/1/20251,2 | | $ | 4,177 | |
| | | | | | | | 14,906 | |
| | | | | TELECOMMUNICATIONS — 0.8% | | | | |
| | | | | CommScope Technologies LLC | | | | |
| | 18,000 | | | 6.000%, 6/15/20251,2 | | | 16,813 | |
| | | | | Viasat, Inc. | | | | |
| | 9,000 | | | 5.625%, 4/15/20271,2 | | | 7,797 | |
| | | | | | | | 24,610 | |
| | | | | WATER — 2.4% | | | | |
| | | | | American Water Capital Corp. | | | | |
| | 80,000 | | | 3.400%, 3/1/20251 | | | 77,361 | |
| | | | | TOTAL CORPORATE BONDS | | | | |
| | | | | (Cost $3,117,014) | | | 2,984,149 | |
Number
of Shares | | | | | | |
| | | | MEDIUM TERM NOTES — 1.5% | | | |
| | | | | COMMERCIAL SERVICES — 1.5% | | | | |
| | 25,000 | | | Capital Impact Partners | | | 24,047 | |
| | 25,000 | | | Capital Impact Partners1 | | | 23,421 | |
| | | | | | | | 47,468 | |
| | | | | TOTAL MEDIUM TERM NOTES | | | | |
| | | | | (Cost $49,423) | | | 47,468 | |
| | | | | PREFERRED STOCKS — 1.2% | | | | |
| | | | | PHARMACEUTICALS — 1.2% | | | | |
| | | | | Harrow, Inc., | | | | |
| | 1,500 | | | 11.875%1 | | | 38,475 | |
| | | | | TOTAL PREFERRED STOCKS | | | | |
| | | | | (Cost $37,500) | | | 38,475 | |
| Principal Amount | | | | | | |
| | | | U.S. TREASURY NOTES — 3.3% | | | |
| | | | | United States Treasury Note | | | | |
| $ | 36,000 | | | 0.125%, 10/15/2023 | | | 35,933 | |
| | 35,000 | | | 0.750%, 12/31/2023 | | | 34,601 | |
| | 35,000 | | | 2.500%, 4/30/2024 | | | 34,405 | |
| | | | | TOTAL U.S. TREASURY NOTES | | | | |
| | | | | (Cost $105,173) | | | 104,939 | |
AXS Sustainable Income Fund
SCHEDULE OF INVESTMENTS - Continued
As of September 30, 2023
| Principal Amount | | | | | Value | |
| | | | | SHORT-TERM INVESTMENTS — 0.6% | | | | |
| $ | 17,855 | | | UMB Bank Demand Deposit, 0.01%5 | | $ | 17,855 | |
| | | | | TOTAL SHORT-TERM INVESTMENTS | | | | |
| | | | | (Cost $17,855) | | | 17,855 | |
| | | | | | | | | |
| | | | | TOTAL INVESTMENTS — 100.5% | | | | |
| | | | | (Cost $3,326,965) | | | 3,192,886 | |
| | | | | Liabilities in Excess of Other Assets — (0.5)% | | | (14,650 | ) |
| | | | | TOTAL NET ASSETS — 100.0% | | $ | 3,178,236 | |
LLC – Limited Liability Company
LP – Limited Partnership
| 2 | Security exempt from registration under Rule 144A of the Securities Act of 1933. These securities are restricted and may be resold in transactions exempt from registration normally to qualified institutional buyers. The total value of these securities is $1,161,260, which represents 36.5% of total net assets of the Fund. |
| 4 | Foreign security denominated in U.S. Dollars. |
| 5 | The rate is the annualized seven-day yield at period end. |
See accompanying Notes to Financial Statements.
AXS Sustainable Income Fund
SUMMARY OF INVESTMENTS
As of September 30, 2023
| Security Type/Industry | | Percent of Total
Net Assets | |
| Corporate Bonds | | | | |
| REITS | | | 22.9 | % |
| Computers | | | 8.6 | % |
| Semiconductors | | | 8.6 | % |
| Entertainment | | | 3.8 | % |
| Energy-Alternate Sources | | | 3.8 | % |
| Media | | | 3.5 | % |
| Commercial Services | | | 3.5 | % |
| Electronics | | | 3.3 | % |
| Agriculture | | | 3.1 | % |
| Building Materials | | | 3.1 | % |
| Metal Fabricate/Hardware | | | 3.1 | % |
| Aerospace/Defense | | | 3.1 | % |
| Electrical Components & Equipment | | | 3.0 | % |
| Healthcare-Products | | | 3.0 | % |
| Retail | | | 2.8 | % |
| Auto Parts & Equipment | | | 2.5 | % |
| Electric | | | 2.5 | % |
| Water | | | 2.4 | % |
| Healthcare-Services | | | 2.3 | % |
| Biotechnology | | | 1.5 | % |
| Internet | | | 0.9 | % |
| Telecommunications | | | 0.8 | % |
| Software | | | 0.5 | % |
| Packaging & Containers | | | 0.3 | % |
| Pharmaceuticals | | | 0.3 | % |
| Lodging | | | 0.3 | % |
| Machinery-Diversified | | | 0.3 | % |
| Food | | | 0.1 | % |
| Total Corporate Bonds | | | 93.9 | % |
| Medium Term Notes | | | | |
| Commercial Services | | | 1.5 | % |
| Total Medium Term Notes | | | 1.5 | % |
| Preferred Stocks | | | | |
| Pharmaceuticals | | | 1.2 | % |
| Total Preferred Stocks | | | 1.2 | % |
| U.S. Treasury Notes | | | 3.3 | % |
| Short-Term Investments | | | 0.6 | % |
| Total Investments | | | 100.5 | % |
| Liabilities in Excess of Other Assets | | | (0.5 | )% |
| Total Net Assets | | | 100.0 | % |
See accompanying Notes to Financial Statements.
AXS Thomson Reuters Venture Capital Return Tracker Fund
SCHEDULE OF INVESTMENTS
As of September 30, 2023
| Number of Shares | | | | | Value | |
| | | | | COMMON STOCKS — 103.5% | | | | |
| | | | | ADVERTISING — 0.7% | | | | |
| | 8,906 | | | Trade Desk, Inc. - Class A* | | $ | 696,004 | |
| | | | | | | | | |
| | | | | AEROSPACE/DEFENSE — 1.0% | | | | |
| | 2,998 | | | Boeing Co.* | | | 574,657 | |
| | 6,516 | | | RTX Corp. | | | 468,956 | |
| | | | | | | | 1,043,613 | |
| | | | | AGRICULTURE — 0.3% | | | | |
| | 3,114 | | | Altria Group, Inc. | | | 130,943 | |
| | 2,479 | | | Philip Morris International, Inc. | | | 229,506 | |
| | | | | | | | 360,449 | |
| | | | | AUTO MANUFACTURERS — 0.1% | | | | |
| | 519 | | | Tesla, Inc.* | | | 129,864 | |
| | | | | | | | | |
| | | | | BANKS — 1.7% | | | | |
| | 12,224 | | | Bank of America Corp. | | | 334,693 | |
| | 586 | | | Goldman Sachs Group, Inc. | | | 189,612 | |
| | 5,170 | | | JPMorgan Chase & Co. | | | 749,753 | |
| | 2,304 | | | Morgan Stanley | | | 188,168 | |
| | 6,634 | | | Wells Fargo & Co. | | | 271,065 | |
| | | | | | | | 1,733,291 | |
| | | | | BEVERAGES — 0.9% | | | | |
| | 7,228 | | | Coca-Cola Co. | | | 404,623 | |
| | 339 | | | Constellation Brands, Inc. - Class A | | | 85,201 | |
| | 1,381 | | | Monster Beverage Corp.* | | | 73,124 | |
| | 2,402 | | | PepsiCo, Inc. | | | 406,995 | |
| | | | | | | | 969,943 | |
| | | | | BIOTECHNOLOGY — 0.1% | | | | |
| | 1,292 | | | Corteva, Inc. | | | 66,099 | |
| | | | | | | | | |
| | | | | CHEMICALS — 0.8% | | | | |
| | 399 | | | Air Products and Chemicals, Inc. | | | 113,076 | |
| | 1,352 | | | Dow, Inc. | | | 69,709 | |
| | 831 | | | DuPont de Nemours, Inc. | | | 61,984 | |
| | 484 | | | Ecolab, Inc. | | | 81,990 | |
| | 940 | | | Linde PLC1 | | | 350,009 | |
| | 453 | | | Sherwin-Williams Co. | | | 115,538 | |
| | | | | | | | 792,306 | |
| | | | | COMMERCIAL SERVICES — 5.9% | | | | |
| | 8,822 | | | Automatic Data Processing, Inc.2 | | | 2,122,397 | |
| | 8,661 | | | CoStar Group, Inc.* | | | 665,944 | |
AXS Thomson Reuters Venture Capital Return Tracker Fund
SCHEDULE OF INVESTMENTS - Continued
As of September 30, 2023
| Number of Shares | | | | | Value | |
| | | | | COMMON STOCKS (Continued) | | | | |
| | | | | COMMERCIAL SERVICES (Continued) | | | | |
| | 1,683 | | | Gartner, Inc.* | | $ | 578,296 | |
| | 25,356 | | | PayPal Holdings, Inc.*,2 | | | 1,482,312 | |
| | 1,641 | | | S&P Global, Inc. | | | 599,638 | |
| | 3,294 | | | Verisk Analytics, Inc. | | | 778,174 | |
| | | | | | | | 6,226,761 | |
| | | | | COMPUTERS — 10.8% | | | | |
| | 14,850 | | | Accenture PLC - Class A1 | | | 4,560,584 | |
| | 9,657 | | | Apple, Inc.2 | | | 1,653,375 | |
| | 10,843 | | | Cognizant Technology Solutions Corp. - Class A2 | | | 734,505 | |
| | 4,996 | | | Crowdstrike Holdings, Inc. - Class A*,2 | | | 836,230 | |
| | 14,233 | | | Fortinet, Inc.*,2 | | | 835,192 | |
| | 19,110 | | | International Business Machines Corp.2 | | | 2,681,133 | |
| | | | | | | | 11,301,019 | |
| | | | | COSMETICS/PERSONAL CARE — 0.7% | | | | |
| | 1,451 | | | Colgate-Palmolive Co. | | | 103,180 | |
| | 4,331 | | | Procter & Gamble Co. | | | 631,720 | |
| | | | | | | | 734,900 | |
| | | | | DISTRIBUTION/WHOLESALE — 0.8% | | | | |
| | 20,081 | | | Copart, Inc.* | | | 865,290 | |
| | | | | | | | | |
| | | | | DIVERSIFIED FINANCIAL SERVICES — 9.4% | | | | |
| | 264 | | | BlackRock, Inc. | | | 170,674 | |
| | 12,452 | | | Mastercard, Inc. - Class A2 | | | 4,929,871 | |
| | 20,914 | | | Visa, Inc. - Class A2 | | | 4,810,429 | |
| | | | | | | | 9,910,974 | |
| | | | | ELECTRIC — 0.0% | | | | |
| | 88 | | | Duke Energy Corp. | | | 7,767 | |
| | 240 | | | NextEra Energy, Inc. | | | 13,750 | |
| | 117 | | | Southern Co. | | | 7,572 | |
| | | | | | | | 29,089 | |
| | | | | ELECTRONICS — 0.7% | | | | |
| | 955 | | | Agilent Technologies, Inc. | | | 106,788 | |
| | 3,343 | | | Honeywell International, Inc. | | | 617,586 | |
| | | | | | | | 724,374 | |
| | | | | FOOD — 0.2% | | | | |
| | 2,503 | | | Mondelez International, Inc. - Class A | | | 173,708 | |
| | | | | | | | | |
| | | | | HEALTHCARE-PRODUCTS — 3.5% | | | | |
| | 5,675 | | | Abbott Laboratories | | | 549,624 | |
AXS Thomson Reuters Venture Capital Return Tracker Fund
SCHEDULE OF INVESTMENTS - Continued
As of September 30, 2023
| Number of Shares | | | | | Value | |
| | | | | COMMON STOCKS (Continued) | | | | |
| | | | | HEALTHCARE-PRODUCTS (Continued) | | | | |
| | 248 | | | Align Technology, Inc.* | | $ | 75,719 | |
| | 4,644 | | | Boston Scientific Corp.* | | | 245,203 | |
| | 2,356 | | | Danaher Corp. | | | 584,524 | |
| | 1,979 | | | Edwards Lifesciences Corp.* | | | 137,105 | |
| | 1,248 | | | GE HealthCare Technologies, Inc. | | | 84,914 | |
| | 268 | | | IDEXX Laboratories, Inc.* | | | 117,188 | |
| | 1,132 | | | Intuitive Surgical, Inc.* | | | 330,872 | |
| | 4,344 | | | Medtronic PLC1 | | | 340,396 | |
| | 475 | | | ResMed, Inc. | | | 70,238 | |
| | 1,238 | | | Stryker Corp. | | | 338,308 | |
| | 1,325 | | | Thermo Fisher Scientific, Inc. | | | 670,675 | |
| | 240 | | | West Pharmaceutical Services, Inc. | | | 90,051 | |
| | 643 | | | Zimmer Biomet Holdings, Inc. | | | 72,158 | |
| | | | | | | | 3,706,975 | |
| | | | | HEALTHCARE-SERVICES — 2.3% | | | | |
| | 1,722 | | | Centene Corp.* | | | 118,611 | |
| | 775 | | | Elevance Health, Inc. | | | 337,451 | |
| | 715 | | | HCA Healthcare, Inc. | | | 175,876 | |
| | 383 | | | Humana, Inc. | | | 186,337 | |
| | 3,206 | | | UnitedHealth Group, Inc.2 | | | 1,616,433 | |
| | | | | | | | 2,434,708 | |
| | | | | INSURANCE — 2.9% | | | | |
| | 8,616 | | | Berkshire Hathaway, Inc. - Class B*,2 | | | 3,018,185 | |
| | | | | | | | | |
| | | | | INTERNET — 18.8% | | | | |
| | 8,706 | | | Airbnb, Inc. - Class A* | | | 1,194,550 | |
| | 37,734 | | | Alphabet, Inc. - Class A*,2 | | | 4,937,871 | |
| | 1,739 | | | Amazon.com, Inc.* | | | 221,062 | |
| | 27 | | | Cogent Communications Holdings, Inc. | | | 1,671 | |
| | 845 | | | MercadoLibre, Inc.* | | | 1,071,359 | |
| | 17,365 | | | Meta Platforms, Inc. - Class A*,2 | | | 5,213,147 | |
| | 9,482 | | | Netflix, Inc.*,2 | | | 3,580,403 | |
| | 6,782 | | | Palo Alto Networks, Inc.*,2 | | | 1,589,972 | |
| | 42,426 | | | Uber Technologies, Inc.*,2 | | | 1,951,172 | |
| | | | | | | | 19,761,207 | |
| | | | | IRON/STEEL — 0.1% | | | | |
| | 404 | | | Nucor Corp. | | | 63,165 | |
| | | | | | | | | |
| | | | | MACHINERY-CONSTRUCTION & MINING — 0.6% | | | | |
| | 2,429 | | | Caterpillar, Inc. | | | 663,117 | |
AXS Thomson Reuters Venture Capital Return Tracker Fund
SCHEDULE OF INVESTMENTS - Continued
As of September 30, 2023
| Number of Shares | | | | | Value | |
| | | | COMMON STOCKS (Continued) | | | |
| | | | | MACHINERY-DIVERSIFIED — 0.5% | | | | |
| | 1,379 | | | Deere & Co. | | $ | 520,407 | |
| | | | | | | | | |
| | | | | MEDIA — 0.2% | | | | |
| | 3 | | | Cable One, Inc. | | | 1,847 | |
| | 86 | | | Charter Communications, Inc. - Class A* | | | 37,824 | |
| | 2,965 | | | Comcast Corp. - Class A | | | 131,468 | |
| | 316 | | | Liberty Global PLC - Class A*,1 | | | 5,410 | |
| | | | | | | | 176,549 | |
| | | | | MINING — 0.1% | | | | |
| | 2,403 | | | Freeport-McMoRan, Inc. | | | 89,608 | |
| | 1,426 | | | Newmont Corp. | | | 52,691 | |
| | | | | | | | 142,299 | |
| | | | | MISCELLANEOUS MANUFACTURING — 0.5% | | | | |
| | 4,965 | | | General Electric Co. | | | 548,881 | |
| | | | | | | | | |
| | | | | OIL & GAS — 0.7% | | | | |
| | 960 | | | Chevron Corp. | | | 161,875 | |
| | 678 | | | ConocoPhillips | | | 81,224 | |
| | 327 | | | EOG Resources, Inc. | | | 41,451 | |
| | 2,264 | | | Exxon Mobil Corp. | | | 266,201 | |
| | 240 | | | Marathon Petroleum Corp. | | | 36,322 | |
| | 400 | | | Occidental Petroleum Corp. | | | 25,952 | |
| | 255 | | | Phillips 66 | | | 30,638 | |
| | 118 | | | Pioneer Natural Resources Co. | | | 27,087 | |
| | 200 | | | Valero Energy Corp. | | | 28,342 | |
| | | | | | | | 699,092 | |
| | | | | OIL & GAS SERVICES — 0.0% | | | | |
| | 831 | | | Schlumberger N.V.1 | | | 48,447 | |
| | | | | | | | | |
| | | | | PHARMACEUTICALS — 1.6% | | | | |
| | 746 | | | AbbVie, Inc. | | | 111,199 | |
| | 857 | | | Becton Dickinson & Co. | | | 221,560 | |
| | 577 | | | Cencora, Inc. | | | 103,843 | |
| | 970 | | | Cigna Group | | | 277,488 | |
| | 4,414 | | | CVS Health Corp. | | | 308,186 | |
| | 1,248 | | | Dexcom, Inc.* | | | 116,438 | |
| | 356 | | | Eli Lilly & Co. | | | 191,218 | |
| | 1,156 | | | Johnson & Johnson | | | 180,047 | |
| | 1,073 | | | Merck & Co., Inc. | | | 110,465 | |
| | 2,386 | | | Pfizer, Inc. | | | 79,144 | |
| | | | | | | | 1,699,588 | |
AXS Thomson Reuters Venture Capital Return Tracker Fund
SCHEDULE OF INVESTMENTS - Continued
As of September 30, 2023
| Number of Shares | | | | | Value | |
| | | | COMMON STOCKS (Continued) | | | |
| | | | | REITS — 0.2% | | | | |
| | 1,525 | | | Prologis, Inc. - REIT | | $ | 171,120 | |
| | | | | | | | | |
| | | | | RETAIL — 0.5% | | | | |
| | 84 | | | Costco Wholesale Corp. | | | 47,457 | |
| | 191 | | | Home Depot, Inc. | | | 57,713 | |
| | 2,623 | | | Walmart, Inc. | | | 419,496 | |
| | | | | | | | 524,666 | |
| | | | | SEMICONDUCTORS — 1.3% | | | | |
| | 1,046 | | | Advanced Micro Devices, Inc.* | | | 107,550 | |
| | 328 | | | Analog Devices, Inc. | | | 57,429 | |
| | 521 | | | Applied Materials, Inc. | | | 72,132 | |
| | 217 | | | Broadcom, Inc. | | | 180,236 | |
| | 2,552 | | | Intel Corp. | | | 90,724 | |
| | 1,524 | | | NVIDIA Corp. | | | 662,925 | |
| | 688 | | | QUALCOMM, Inc. | | | 76,409 | |
| | 554 | | | Texas Instruments, Inc. | | | 88,092 | |
| | | | | | | | 1,335,497 | |
| | | | | SOFTWARE — 34.1% | | | | |
| | 16,346 | | | Activision Blizzard, Inc.2 | | | 1,530,476 | |
| | 9,186 | | | Adobe, Inc.*,2 | | | 4,683,941 | |
| | 1,829 | | | ANSYS, Inc.* | | | 544,219 | |
| | 4,814 | | | Autodesk, Inc.*,2 | | | 996,065 | |
| | 5,756 | | | Cadence Design Systems, Inc.*,2 | | | 1,348,631 | |
| | 6,590 | | | Datadog, Inc.* | | | 600,283 | |
| | 5,408 | | | Electronic Arts, Inc. | | | 651,123 | |
| | 13,266 | | | Fidelity National Information Services, Inc.2 | | | 733,212 | |
| | 5,910 | | | Intuit, Inc.2 | | | 3,019,655 | |
| | 15,677 | | | Microsoft Corp.2 | | | 4,950,013 | |
| | 35,094 | | | Oracle Corp.2 | | | 3,717,156 | |
| | 41,638 | | | Palantir Technologies, Inc. - Class A* | | | 666,208 | |
| | 2,072 | | | Roper Technologies, Inc.2 | | | 1,003,428 | |
| | 22,411 | | | Salesforce, Inc.*,2 | | | 4,544,503 | |
| | 4,210 | | | ServiceNow, Inc.*,2 | | | 2,353,222 | |
| | 7,284 | | | Snowflake, Inc. - Class A*,2 | | | 1,112,777 | |
| | 3,243 | | | Synopsys, Inc.*,2 | | | 1,488,440 | |
| | 5,186 | | | VMware, Inc. - Class A* | | | 863,365 | |
| | 4,572 | | | Workday, Inc. - Class A*,2 | | | 982,294 | |
| | | | | | | | 35,789,011 | |
| | | | | TELECOMMUNICATIONS — 0.4% | | | | |
| | 5,024 | | | AT&T, Inc. | | | 75,460 | |
| | 2,526 | | | Cisco Systems, Inc. | | | 135,798 | |
| | 154 | | | Frontier Communications Parent, Inc.* | | | 2,410 | |
AXS Thomson Reuters Venture Capital Return Tracker Fund
SCHEDULE OF INVESTMENTS - Continued
As of September 30, 2023
| Number of Shares | | | | | Value | |
| | | | COMMON STOCKS (Continued) | | | |
| | | | | TELECOMMUNICATIONS (Continued) | | | | |
| | 69 | | | Iridium Communications, Inc. | | $ | 3,139 | |
| | 430 | | | T-Mobile US, Inc.* | | | 60,222 | |
| | 2,812 | | | Verizon Communications, Inc. | | | 91,137 | |
| | | | | | | | 368,166 | |
| | | | | TRANSPORTATION — 1.1% | | | | |
| | 3,062 | | | Union Pacific Corp. | | | 623,515 | |
| | 3,438 | | | United Parcel Service, Inc. - Class B | | | 535,881 | |
| | | | | | | | 1,159,396 | |
| | | | | TOTAL COMMON STOCKS | | | | |
| | | | | (Cost $99,218,768) | | | 108,588,160 | |
| Principal Amount | | | | | | |
| | | | | SHORT-TERM INVESTMENTS — 0.1% | | | | |
| $ | 118,546 | | | UMB Bank Demand Deposit, 0.01%3 | | | 118,546 | |
| | | | | TOTAL SHORT-TERM INVESTMENTS | | | | |
| | | | | (Cost $118,546) | | | 118,546 | |
| | | | | | | | | |
| | | | | TOTAL INVESTMENTS — 103.6% | | | | |
| | | | | (Cost $99,337,314) | | | 108,706,706 | |
| | | | | | | | | |
| | | | | Liabilities in Excess of Other Assets — (3.6)% | | | (3,779,030 | ) |
| | | | | TOTAL NET ASSETS — 100.0% | | $ | 104,927,676 | |
PLC – Public Limited Company
REIT – Real Estate Investment Trusts
| * | Non-income producing security. |
| 1 | Foreign security denominated in U.S. Dollars. |
| 2 | All or a portion of this security is segregated as collateral for swap agreement. As of September 30, 2023, the aggregate value of those securities was $53,187,662, representing 50.7% of net assets. |
| 3 | The rate is the annualized seven-day yield at period end. |
See accompanying Notes to Financial Statements.
AXS Thomson Reuters Venture Capital Return Tracker Fund
SCHEDULE OF INVESTMENTS - Continued
As of September 30, 2023
SWAP CONTRACTS
EQUITY SWAP CONTRACTS
| Counterparty | | Reference Entity | | Fund Pays | | Fund Receives | | Pay/Receive Frequency | | Termination
Date | | Notional Amount | | | Premium Paid (Received) | | | Unrealized Appreciation (Depreciation) | |
| BNP Paribas | | BNP Paribas Index Swap1 | | 0.50% | | Index Return | | Monthly | | 10/2/23 | | $ | 115,269,535 | | | $ | 20,764 | | | $ | (263,125 | ) |
| BNP Paribas | | BNP Paribas Equity Basket Swap2 | | 1-Month Federal Funds + 0.57% | | Basket Return | | Monthly | | 10/2/23 | | | 56,007,774 | | | | 20,711 | | | | (3,430,595 | ) |
| TOTAL EQUITY SWAP CONTRACTS | | | | | | | | | | | | | | $ | (3,693,720 | ) |
| 1 | The BNP Paribas Index Swap is made up of the NASDAQ 100 Total Return Index and the S&P 500 Total Return Index and exposure to each index was 257.30% and (257.30)%, respectively. |
| 2 | BNP Paribas Equity Basket Swap Top 50 Holdings^ |
| Number of | | | | | | | | Percentage of Equity | |
| Shares | | | Description | | Value | | | Swap's Notional Amount | |
| | 8,994 | | | Meta Platforms, Inc. - Class A | | $ | 2,700,089 | | | | 4.82 | % |
| | 8,120 | | | Microsoft Corp. | | | 2,563,890 | | | | 4.58 | % |
| | 19,544 | | | Alphabet, Inc. - Class A | | | 2,557,528 | | | | 4.57 | % |
| | 6,450 | | | Mastercard, Inc. - Class A | | | 2,553,620 | | | | 4.56 | % |
| | 10,833 | | | Visa, Inc. - Class A | | | 2,491,698 | | | | 4.45 | % |
| | 4,758 | | | Adobe, Inc. | | | 2,426,104 | | | | 4.33 | % |
| | 7,691 | | | Accenture PLC - Class A | | | 2,361,983 | | | | 4.22 | % |
| | 11,608 | | | Salesforce, Inc. | | | 2,353,870 | | | | 4.20 | % |
| | 18,177 | | | Oracle Corp. | | | 1,925,308 | | | | 3.44 | % |
| | 4,911 | | | Netflix, Inc. | | | 1,854,394 | | | | 3.31 | % |
| | 3,061 | | | Intuit, Inc. | | | 1,563,987 | | | | 2.79 | % |
| | 4,463 | | | Berkshire Hathaway, Inc. - Class B | | | 1,563,389 | | | | 2.79 | % |
| | 9,898 | | | International Business Machines Corp. | | | 1,388,689 | | | | 2.48 | % |
| | 2,181 | | | ServiceNow, Inc. | | | 1,219,092 | | | | 2.18 | % |
| | 4,569 | | | Automatic Data Processing, Inc. | | | 1,099,210 | | | | 1.96 | % |
| | 21,974 | | | Uber Technologies, Inc. | | | 1,010,584 | | | | 1.80 | % |
| | 5,002 | | | Apple, Inc. | | | 856,392 | | | | 1.53 | % |
| | 1,661 | | | UnitedHealth Group, Inc. | | | 837,460 | | | | 1.50 | % |
| | 3,513 | | | Palo Alto Networks, Inc. | | | 823,588 | | | | 1.47 | % |
| | 8,467 | | | Activision Blizzard, Inc. | | | 792,765 | | | | 1.42 | % |
| | 1,680 | | | Synopsys, Inc. | | | 771,070 | | | | 1.38 | % |
| | 13,133 | | | PayPal Holdings, Inc. | | | 767,755 | | | | 1.37 | % |
| | 2,981 | | | Cadence Design Systems, Inc. | | | 698,448 | | | | 1.25 | % |
| | 4,509 | | | Airbnb, Inc. - Class A | | | 618,680 | | | | 1.10 | % |
| | 3,773 | | | Snowflake, Inc. - Class A | | | 576,401 | | | | 1.03 | % |
| | 438 | | | MercadoLibre, Inc. | | | 555,331 | | | | 0.99 | % |
| | 1,073 | | | Roper Technologies, Inc. | | | 519,632 | | | | 0.93 | % |
| | 2,493 | | | Autodesk, Inc. | | | 515,827 | | | | 0.92 | % |
| | 2,368 | | | Workday, Inc. - Class A | | | 508,765 | | | | 0.91 | % |
| | 10,401 | | | Copart, Inc. | | | 448,179 | | | | 0.80 | % |
| | 2,686 | | | VMware, Inc. - Class A | | | 447,165 | | | | 0.80 | % |
| | 2,588 | | | Crowdstrike Holdings, Inc. - Class A | | | 433,179 | | | | 0.77 | % |
| | 7,372 | | | Fortinet, Inc. | | | 432,589 | | | | 0.77 | % |
| | 1,706 | | | Verisk Analytics, Inc. | | | 403,025 | | | | 0.72 | % |
| | 2,678 | | | JPMorgan Chase & Co. | | | 388,364 | | | | 0.69 | % |
| | 5,616 | | | Cognizant Technology Solutions Corp. - Class A | | | 380,428 | | | | 0.68 | % |
| | 6,871 | | | Fidelity National Information Services, Inc. | | | 379,760 | | | | 0.68 | % |
| | 4,613 | | | Trade Desk, Inc. - Class A | | | 360,506 | | | | 0.64 | % |
| | 686 | | | Thermo Fisher Scientific, Inc. | | | 347,233 | | | | 0.62 | % |
| | 21,566 | | | Palantir Technologies, Inc. - Class A | | | 345,056 | | | | 0.62 | % |
| | 4,486 | | | CoStar Group, Inc. | | | 344,929 | | | | 0.62 | % |
| | 1,258 | | | Caterpillar, Inc. | | | 343,434 | | | | 0.61 | % |
| | 789 | | | NVIDIA Corp. | | | 343,207 | | | | 0.61 | % |
| | 2,801 | | | Electronic Arts, Inc. | | | 337,240 | | | | 0.60 | % |
| | 2,243 | | | Procter & Gamble Co. | | | 327,164 | | | | 0.58 | % |
| | 1,586 | | | Union Pacific Corp. | | | 322,957 | | | | 0.58 | % |
| | 1,732 | | | Honeywell International, Inc. | | | 319,970 | | | | 0.57 | % |
| | 3,413 | | | Datadog, Inc. | | | 310,890 | | | | 0.56 | % |
| | 850 | | | S&P Global, Inc. | | | 310,599 | | | | 0.55 | % |
| | 1,220 | | | Danaher Corp. | | | 302,682 | | | | 0.54 | % |
| ^ | These investments are not direct holdings of the Fund. The holdings were determined based on the absolute notional values of the positions within the underlying swap basket. |
See accompanying Notes to Financial Statements.
AXS Thomson Reuters Venture Capital Return Tracker Fund
SUMMARY OF INVESTMENTS
As of September 30, 2023
| Security Type/Industry | | Percent of Total
Net Assets | |
| Common Stocks | | | | |
| Software | | | 34.1 | % |
| Internet | | | 18.8 | % |
| Computers | | | 10.8 | % |
| Diversified Financial Services | | | 9.4 | % |
| Commercial Services | | | 5.9 | % |
| Healthcare-Products | | | 3.5 | % |
| Insurance | | | 2.9 | % |
| Healthcare-Services | | | 2.3 | % |
| Banks | | | 1.7 | % |
| Pharmaceuticals | | | 1.6 | % |
| Semiconductors | | | 1.3 | % |
| Transportation | | | 1.1 | % |
| Aerospace/Defense | | | 1.0 | % |
| Beverages | | | 0.9 | % |
| Chemicals | | | 0.8 | % |
| Distribution/Wholesale | | | 0.8 | % |
| Cosmetics/Personal Care | | | 0.7 | % |
| Oil & Gas | | | 0.7 | % |
| Electronics | | | 0.7 | % |
| Advertising | | | 0.7 | % |
| Machinery-Construction & Mining | | | 0.6 | % |
| Retail | | | 0.5 | % |
| Machinery-Diversified | | | 0.5 | % |
| Miscellaneous Manufacturing | | | 0.5 | % |
| Telecommunications | | | 0.4 | % |
| Agriculture | | | 0.3 | % |
| Media | | | 0.2 | % |
| REITS | | | 0.2 | % |
| Food | | | 0.2 | % |
| Iron/Steel | | | 0.1 | % |
| Mining | | | 0.1 | % |
| Auto Manufacturers | | | 0.1 | % |
| Biotechnology | | | 0.1 | % |
| Electric | | | 0.0 | % |
| Oil & Gas Services | | | 0.0 | % |
| Total Common Stocks | | | 103.5 | % |
| Short-Term Investments | | | 0.1 | % |
| Total Investments | | | 103.6 | % |
| Liabilities in Excess of Other Assets | | | (3.6 | )% |
| Total Net Assets | | | 100.0 | % |
See accompanying Notes to Financial Statements.
AXS Merger Fund
SCHEDULE OF INVESTMENTS
As of September 30, 2023
| Number of Shares | | | | | Value | |
| | | | COMMON STOCKS — 51.0% | | | |
| | | | | AIRLINES — 0.2% | | | | |
| | 3,100 | | | Spirit Airlines, Inc. | | $ | 51,150 | |
| | | | | | | | | |
| | | | | APPAREL — 2.1% | | | | |
| | 13,600 | | | Capri Holdings Ltd.* | | | 715,496 | |
| | | | | | | | | |
| | | | | BANKS — 0.6% | | | | |
| | 1 | | | Columbia Banking System, Inc. | | | 20 | |
| | 18,900 | | | First Horizon Corp. | | | 208,278 | |
| | | | | | | | 208,298 | |
| | | | | BIOTECHNOLOGY — 9.5% | | | | |
| | 13,700 | | | Abcam PLC - ADR* | | | 310,031 | |
| | 17,300 | | | Horizon Therapeutics Plc* | | | 2,001,437 | |
| | 4,200 | | | Seagen, Inc.* | | | 891,030 | |
| | | | | | | | 3,202,498 | |
| | | | | DIVERSIFIED FINANCIAL SERVICES — 1.3% | | | | |
| | 6,100 | | | Avantax, Inc.* | | | 156,038 | |
| | 7,300 | | | Canaccord Genuity Group, Inc. | | | 43,317 | |
| | 15,300 | | | Greenhill & Co., Inc. | | | 226,440 | |
| | | | | | | | 425,795 | |
| | | | | ELECTRONICS — 5.2% | | | | |
| | 29,500 | | | National Instruments Corp. | | | 1,758,790 | |
| | | | | | | | | |
| | | | | ENTERTAINMENT — 0.2% | | | | |
| | 10,100 | | | Cineplex, Inc.* | | | 70,417 | |
| | | | | | | | | |
| | | | | FOOD SERVICE — 0.0% | | | | |
| | 600 | | | Sovos Brands, Inc.* | | | 13,530 | |
| | | | | | | | | |
| | | | | GAS — 0.1% | | | | |
| | 1,208 | | | Brookfield Infrastructure Corp. - Class A | | | 42,671 | |
| | | | | | | | | |
| | | | | INSURANCE — 0.5% | | | | |
| | 6,100 | | | Argo Group International Holdings Ltd. | | | 182,024 | |
| | | | | | | | | |
| | | | | MACHINERY-DIVERSIFIED — 1.5% | | | | |
| | 8,800 | | | CIRCOR International, Inc.* | | | 490,600 | |
| | | | | | | | | |
| | | | | OIL & GAS — 6.2% | | | | |
| | 21,200 | | | Denbury, Inc.* | | | 2,077,812 | |
| | | | | | | | | |
| | | | | PIPELINES — 2.7% | | | | |
| | 14,407 | | | ONEOK, Inc. | | | 913,849 | |
AXS Merger Fund
SCHEDULE OF INVESTMENTS - Continued
As of September 30, 2023
| Number of Shares | | | | | Value | |
| | | | COMMON STOCKS (Continued) | | | |
| | | | | REITS — 1.3% | | | | |
| | 1,700 | | | Healthcare Realty Trust, Inc. - REIT | | $ | 25,959 | |
| | 26,300 | | | Hersha Hospitality Trust - Class A - REIT | | | 259,318 | |
| | 15,200 | | | RPT Realty - REIT | | | 160,512 | |
| | | | | | | | 445,789 | |
| | | | | SEMICONDUCTORS — 0.6% | | | | |
| | 2,100 | | | Silicon Motion Technology Corp. - ADR | | | 107,625 | |
| | 4,400 | | | Tower Semiconductor Ltd.* | | | 108,064 | |
| | | | | | | | 215,689 | |
| | | | | SOFTWARE — 19.0% | | | | |
| | 28,800 | | | Activision Blizzard, Inc. | | | 2,696,544 | |
| | 11,200 | | | Avid Technology, Inc.* | | | 300,944 | |
| | 16,000 | | | New Relic, Inc.* | | | 1,369,920 | |
| | 5,500 | | | NextGen Healthcare, Inc.* | | | 130,515 | |
| | 1,500 | | | Sciplay Corp. - Class A* | | | 34,155 | |
| | 1 | | | Unity Software, Inc.* | | | 25 | |
| | 11,200 | | | VMware, Inc. - Class A* | | | 1,864,576 | |
| | | | | | | | 6,396,679 | |
| | | | | TOTAL COMMON STOCKS | | | | |
| | | | | (Cost $16,509,669) | | | 17,211,087 | |
| | | | | | | | | |
| | | | | SHORT-TERM INVESTMENTS — 42.2% | | | | |
| | | | | | | | | |
| | 14,231,480 | | | Fidelity Investments Money Market Funds - Treasury Portfolio, Class I, 5.15%1 | | | 14,231,480 | |
| | | | | TOTAL SHORT-TERM INVESTMENTS | | | | |
| | | | | (Cost $14,231,480) | | | 14,231,480 | |
| | | | | | | | | |
| | | | | TOTAL INVESTMENTS — 93.2% | | | | |
| | | | | (Cost $30,741,149) | | | 31,442,567 | |
| | | | | | | | | |
| | | | | Other Assets in Excess of Liabilities — 6.8% | | | 2,294,041 | |
| | | | | TOTAL NET ASSETS — 100.0% | | $ | 33,736,608 | |
| | | | | | | | | |
| | | | | SECURITIES SOLD SHORT — (13.1)% | | | | |
| | | | | COMMON STOCKS — (13.1)% | | | | |
| | | | | DIVERSIFIED FINANCIAL SERVICES — (0.0)% | | | | |
| | (1 | ) | | Intercontinental Exchange, Inc. | | | (110 | ) |
| | | | | | | | | |
| | | | | GAS — (0.1)% | | | | |
| | (1,233 | ) | | Brookfield Infrastructure Corp. - Class A | | | (43,574 | ) |
| | | | | | | | | |
| | | | | OIL & GAS — (6.2)% | | | | |
| | (17,808 | ) | | Exxon Mobil Corp. | | | (2,093,865 | ) |
AXS Merger Fund
SCHEDULE OF INVESTMENTS - Continued
As of September 30, 2023
| Number of Shares | | | | | Value | |
| | | | SECURITIES SOLD SHORT (Continued) | | | |
| | | | COMMON STOCKS (Continued) | | | |
| | | | | PIPELINES — (2.7)% | | | | |
| | (14,407 | ) | | ONEOK, Inc. | | $ | (913,836 | ) |
| | | | | | | | | |
| | | | | REITS — (0.5)% | | | | |
| | (9,194 | ) | | Kimco Realty Corp. - REIT | | | (161,722 | ) |
| | | | | | | | | |
| | | | | SEMICONDUCTORS — (3.6)% | | | | |
| | (1,423 | ) | | Broadcom, Inc. | | | (1,181,915 | ) |
| | (815 | ) | | MaxLinear, Inc.* | | | (18,134 | ) |
| | | | | | | | (1,200,049 | ) |
| | | | | TOTAL COMMON STOCKS | | | | |
| | | | | (Proceeds $4,092,240) | | | (4,413,156 | ) |
| | | | | | | | | |
| | | | | TOTAL SECURITIES SOLD SHORT | | | | |
| | | | | (Proceeds $4,092,240) | | $ | (4,413,156 | ) |
ADR – American Depository Receipt
PLC – Public Limited Company
REIT – Real Estate Investment Trusts
| * | Non-income producing security. |
| 1 | The rate is the annualized seven-day yield at period end. |
See accompanying Notes to Financial Statements.
AXS Merger Fund
SUMMARY OF INVESTMENTS
As of September 30, 2023
| Security Type/Industry | | Percent of Total Net Assets | |
| Common Stocks | | | | |
| Software | | | 19.0 | % |
| Biotechnology | | | 9.5 | % |
| Oil & Gas | | | 6.2 | % |
| Electronics | | | 5.2 | % |
| Pipelines | | | 2.7 | % |
| Apparel | | | 2.1 | % |
| Machinery-Diversified | | | 1.5 | % |
| REITS | | | 1.3 | % |
| Diversified Financial Services | | | 1.3 | % |
| Banks | | | 0.6 | % |
| Semiconductors | | | 0.6 | % |
| Insurance | | | 0.5 | % |
| Airlines | | | 0.2 | % |
| Entertainment | | | 0.2 | % |
| Gas | | | 0.1 | % |
| Food Service | | | 0.0 | % |
| Total Common Stocks | | | 51.0 | % |
| Short-Term Investments | | | 42.2 | % |
| Total Investments | | | 93.2 | % |
| Other Assets in Excess of Liabilities | | | 6.8 | % |
| Total Net Assets | | | 100.0 | % |
See accompanying Notes to Financial Statements.
AXS Alternative Value Fund
SCHEDULE OF INVESTMENTS
As of September 30, 2023
Number
of Shares | | | | | Value | |
| | | | COMMON STOCKS — 117.6% | | | |
| | | | | ADVERTISING — 0.4% | | | | |
| | 641 | | | Omnicom Group, Inc.1 | | $ | 47,742 | |
| | | | | | | | | |
| | | | | AEROSPACE/DEFENSE — 4.7% | | | | |
| | 808 | | | General Dynamics Corp.1 | | | 178,544 | |
| | 1,068 | | | L3Harris Technologies, Inc.1 | | | 185,960 | |
| | 478 | | | Lockheed Martin Corp.1 | | | 195,483 | |
| | 180 | | | Northrop Grumman Corp.1 | | | 79,234 | |
| | | | | | | | 639,221 | |
| | | | | AGRICULTURE — 3.1% | | | | |
| | 4,797 | | | Altria Group, Inc.1 | | | 201,714 | |
| | 2,296 | | | Philip Morris International, Inc.1 | | | 212,564 | |
| | | | | | | | 414,278 | |
| | | | | BANKS — 0.9% | | | | |
| | 1,011 | | | M&T Bank Corp.1 | | | 127,841 | |
| | | | | | | | | |
| | | | | BEVERAGES — 4.8% | | | | |
| | 1,822 | | | Brown-Forman Corp. - Class B1 | | | 105,111 | |
| | 3,581 | | | Coca-Cola Co.1 | | | 200,464 | |
| | 1,621 | | | Molson Coors Beverage Co. - Class B1 | | | 103,079 | |
| | 702 | | | Monster Beverage Corp.*,1 | | | 37,171 | |
| | 1,215 | | | PepsiCo, Inc.1 | | | 205,870 | |
| | | | | | | | 651,695 | |
| | | | | BIOTECHNOLOGY — 9.7% | | | | |
| | 898 | | | Amgen, Inc.1 | | | 241,347 | |
| | 831 | | | Biogen, Inc.*,1 | | | 213,575 | |
| | 2,856 | | | Gilead Sciences, Inc.1 | | | 214,029 | |
| | 2,522 | | | Incyte Corp.*,1 | | | 145,696 | |
| | 295 | | | Regeneron Pharmaceuticals, Inc.*,1 | | | 242,773 | |
| | 700 | | | Vertex Pharmaceuticals, Inc.*,1 | | | 243,418 | |
| | | | | | | | 1,300,838 | |
| | | | | COMMERCIAL SERVICES — 3.3% | | | | |
| | 694 | | | MarketAxess Holdings, Inc.1 | | | 148,266 | |
| | 1,148 | | | Rollins, Inc.1 | | | 42,855 | |
| | 1,099 | | | Verisk Analytics, Inc.1 | | | 259,628 | |
| | | | | | | | 450,749 | |
| | | | | COMPUTERS — 3.3% | | | | |
| | 1,633 | | | International Business Machines Corp.1 | | | 229,110 | |
| | 2,338 | | | Leidos Holdings, Inc.1 | | | 215,470 | |
| | | | | | | | 444,580 | |
AXS Alternative Value Fund
SCHEDULE OF INVESTMENTS - Continued
As of September 30, 2023
Number
of Shares | | | | | Value | |
| | | | COMMON STOCKS (Continued) | | | |
| | | | | COSMETICS/PERSONAL CARE — 3.2% | | | | |
| | 2,882 | | | Colgate-Palmolive Co.1 | | $ | 204,939 | |
| | 1,523 | | | Procter & Gamble Co.1 | | | 222,145 | |
| | | | | | | | 427,084 | |
| | | | | DIVERSIFIED FINANCIAL SERVICES — 2.0% | | | | |
| | 273 | | | Cboe Global Markets, Inc.1 | | | 42,645 | |
| | 1,157 | | | CME Group, Inc.1 | | | 231,655 | |
| | | | | | | | 274,300 | |
| | | | | ELECTRIC — 0.5% | | | | |
| | 1,916 | | | NRG Energy, Inc.1 | | | 73,804 | |
| | | | | | | | | |
| | | | | ENVIRONMENTAL CONTROL — 3.2% | | | | |
| | 1,558 | | | Republic Services, Inc.1 | | | 222,030 | |
| | 1,347 | | | Waste Management, Inc.1 | | | 205,337 | |
| | | | | | | | 427,367 | |
| | | | | FOOD — 11.0% | | | | |
| | 4,385 | | | Campbell Soup Co.1 | | | 180,136 | |
| | 6,284 | | | Conagra Brands, Inc.1 | | | 172,307 | |
| | 2,765 | | | General Mills, Inc.1 | | | 176,932 | |
| | 917 | | | Hershey Co.1 | | | 183,473 | |
| | 5,154 | | | Hormel Foods Corp.1 | | | 196,007 | |
| | 3,214 | | | Kellogg Co.1 | | | 191,265 | |
| | 1,025 | | | Kraft Heinz Co.1 | | | 34,481 | |
| | 889 | | | Lamb Weston Holdings, Inc.1 | | | 82,197 | |
| | 2,681 | | | McCormick & Co., Inc.1 | | | 202,791 | |
| | 1,160 | | | Tyson Foods, Inc. - Class A1 | | | 58,569 | |
| | | | | | | | 1,478,158 | |
| | | | | HEALTHCARE-PRODUCTS — 3.5% | | | | |
| | 923 | | | Abbott Laboratories1 | | | 89,393 | |
| | 711 | | | Danaher Corp.1 | | | 176,399 | |
| | 230 | | | Thermo Fisher Scientific, Inc.1 | | | 116,419 | |
| | 339 | | | Waters Corp.*,1 | | | 92,957 | |
| | | | | | | | 475,168 | |
| | | | | HEALTHCARE-SERVICES — 7.1% | | | | |
| | 3,003 | | | Centene Corp.*,1 | | | 206,847 | |
| | 294 | | | Elevance Health, Inc.1 | | | 128,013 | |
| | 342 | | | Humana, Inc.1 | | | 166,390 | |
| | 714 | | | Molina Healthcare, Inc.*,1 | | | 234,113 | |
| | 429 | | | UnitedHealth Group, Inc.1 | | | 216,298 | |
| | | | | | | | 951,661 | |
AXS Alternative Value Fund
SCHEDULE OF INVESTMENTS - Continued
As of September 30, 2023
Number
of Shares | | | | | Value | |
| | | | COMMON STOCKS (Continued) | | | |
| | | | | HOUSEHOLD PRODUCTS/WARES — 4.7% | | | | |
| | 2,556 | | | Church & Dwight Co., Inc.1 | | $ | 234,206 | |
| | 1,434 | | | Clorox Co.1 | | | 187,940 | |
| | 1,703 | | | Kimberly-Clark Corp.1 | | | 205,808 | |
| | | | | | | | 627,954 | |
| | | | | INSURANCE — 11.9% | | | | |
| | 142 | | | Aon PLC - Class A1,2 | | | 46,039 | |
| | 918 | | | Arthur J. Gallagher & Co.1 | | | 209,240 | |
| | 588 | | | Assurant, Inc.1 | | | 84,425 | |
| | 3,491 | | | Brown & Brown, Inc.1 | | | 243,811 | |
| | 224 | | | Chubb Ltd.1,2 | | | 46,632 | |
| | 438 | | | Cincinnati Financial Corp.1 | | | 44,803 | |
| | 850 | | | Globe Life, Inc.1 | | | 92,421 | |
| | 1,319 | | | Hartford Financial Services Group, Inc.1 | | | 93,530 | |
| | 3,709 | | | Loews Corp.1 | | | 234,817 | |
| | 704 | | | Travelers Cos., Inc.1 | | | 114,970 | |
| | 2,838 | | | W R Berkley Corp.1 | | | 180,185 | |
| | 986 | | | Willis Towers Watson PLC1,2 | | | 206,035 | |
| | | | | | | | 1,596,908 | |
| | | | | MEDIA — 2.7% | | | | |
| | 521 | | | FactSet Research Systems, Inc.1 | | | 227,812 | |
| | 4,170 | | | Fox Corp. - Class A1 | | | 130,104 | |
| | | | | | | | 357,916 | |
| | | | | OIL & GAS — 1.6% | | | | |
| | 8,108 | | | Coterra Energy, Inc.1 | | | 219,321 | |
| | | | | | | | | |
| | | | | PACKAGING & CONTAINERS — 0.7% | | | | |
| | 625 | | | Packaging Corp. of America1 | | | 95,969 | |
| | | | | | | | | |
| | | | | PHARMACEUTICALS — 13.9% | | | | |
| | 1,509 | | | AbbVie, Inc.1 | | | 224,931 | |
| | 631 | | | Bristol-Myers Squibb Co.1 | | | 36,623 | |
| | 2,127 | | | Cardinal Health, Inc.1 | | | 184,666 | |
| | 772 | | | Cigna Group1 | | | 220,846 | |
| | 2,658 | | | CVS Health Corp.1 | | | 185,582 | |
| | 1,341 | | | Johnson & Johnson1 | | | 208,861 | |
| | 466 | | | McKesson Corp.1 | | | 202,640 | |
| | 2,132 | | | Merck & Co., Inc.1 | | | 219,489 | |
| | 9,263 | | | Organon & Co.1 | | | 160,806 | |
| | 5,317 | | | Pfizer, Inc.1 | | | 176,365 | |
| | 295 | | | Zoetis, Inc.1 | | | 51,324 | |
| | | | | | | | 1,872,133 | |
AXS Alternative Value Fund
SCHEDULE OF INVESTMENTS - Continued
As of September 30, 2023
Number
of Shares | | | | | Value | |
| | | | COMMON STOCKS (Continued) | | | |
| | | | | REITS — 1.4% | | | | |
| | 726 | | | Public Storage - REIT1 | | $ | 191,316 | |
| | | | | | | | | |
| | | | | RETAIL — 9.3% | | | | |
| | 91 | | | AutoZone, Inc.*,1 | | | 231,139 | |
| | 423 | | | Costco Wholesale Corp.1 | | | 238,978 | |
| | 1,021 | | | Dollar General Corp.1 | | | 108,022 | |
| | 635 | | | Domino's Pizza, Inc.1 | | | 240,532 | |
| | 789 | | | McDonald's Corp.1 | | | 207,854 | |
| | 43 | | | O'Reilly Automotive, Inc.*,1 | | | 39,081 | |
| | 425 | | | Starbucks Corp.1 | | | 38,790 | |
| | 602 | | | Tractor Supply Co.1 | | | 122,236 | |
| | 1,218 | | | Walgreens Boots Alliance, Inc.1 | | | 27,088 | |
| | | | | | | | 1,253,720 | |
| | | | | SEMICONDUCTORS — 0.8% | | | | |
| | 2,966 | | | Intel Corp.1 | | | 105,441 | |
| | | | | | | | | |
| | | | | SOFTWARE — 5.8% | | | | |
| | 2,454 | | | Akamai Technologies, Inc.*,1 | | | 261,449 | |
| | 1,335 | | | Electronic Arts, Inc.1 | | | 160,734 | |
| | 474 | | | Fiserv, Inc.*,1 | | | 53,543 | |
| | 1,271 | | | Jack Henry & Associates, Inc.1 | | | 192,099 | |
| | 584 | | | Oracle Corp.1 | | | 61,857 | |
| | 135 | | | Tyler Technologies, Inc.*,1 | | | 52,129 | |
| | | | | | | | 781,811 | |
| | | | | TELECOMMUNICATIONS — 2.9% | | | | |
| | 13,082 | | | AT&T, Inc.1 | | | 196,491 | |
| | 5,926 | | | Verizon Communications, Inc.1 | | | 192,062 | |
| | | | | | | | 388,553 | |
| | | | | TRANSPORTATION — 1.2% | | | | |
| | 1,345 | | | C.H. Robinson Worldwide, Inc.1 | | | 115,845 | |
AXS Alternative Value Fund
SCHEDULE OF INVESTMENTS - Continued
As of September 30, 2023
Number
of Shares | | | | | Value | |
| | | | COMMON STOCKS (Continued) | | | |
| | | | | TRANSPORTATION (Continued) | | | | |
| | 428 | | | Expeditors International of Washington, Inc.1 | | $ | 49,061 | |
| | | | | | | | 164,906 | |
| | | | | TOTAL COMMON STOCKS | | | | |
| | | | | (Cost $16,176,329) | | | 15,840,434 | |
| | | | | | | | | |
| | | | | TOTAL INVESTMENTS — 117.6% | | | | |
| | | | | (Cost $16,176,329) | | | 15,840,434 | |
| | | | | | | | | |
| | | | | Liabilities in Excess of Other Assets — (17.6)% | | | (2,376,152 | ) |
| | | | | TOTAL NET ASSETS — 100.0% | | $ | 13,464,282 | |
PLC – Public Limited Company
REIT – Real Estate Investment Trusts
| * | Non-income producing security. |
| 1 | All or a portion of the security is segregated as collateral for line of credit borrowings. As of September 30, 2023, the aggregate value of those securities was $15,840,434, representing 117.6% of net assets. |
| 2 | Foreign security denominated in U.S. Dollars. |
See accompanying Notes to Financial Statements.
AXS Alternative Value Fund
SUMMARY OF INVESTMENTS
As of September 30, 2023
| Security Type/Industry | | Percent of Total
Net Assets | |
| Common Stocks | | | | |
| Pharmaceuticals | | | 13.9 | % |
| Insurance | | | 11.9 | % |
| Food | | | 11.0 | % |
| Biotechnology | | | 9.7 | % |
| Retail | | | 9.3 | % |
| Healthcare-Services | | | 7.1 | % |
| Software | | | 5.8 | % |
| Beverages | | | 4.8 | % |
| Household Products/Wares | | | 4.7 | % |
| Aerospace/Defense | | | 4.7 | % |
| Healthcare-Products | | | 3.5 | % |
| Commercial Services | | | 3.3 | % |
| Computers | | | 3.3 | % |
| Cosmetics/Personal Care | | | 3.2 | % |
| Environmental Control | | | 3.2 | % |
| Agriculture | | | 3.1 | % |
| Telecommunications | | | 2.9 | % |
| Media | | | 2.7 | % |
| Diversified Financial Services | | | 2.0 | % |
| Oil & Gas | | | 1.6 | % |
| REITS | | | 1.4 | % |
| Transportation | | | 1.2 | % |
| Banks | | | 0.9 | % |
| Semiconductors | | | 0.8 | % |
| Packaging & Containers | | | 0.7 | % |
| Electric | | | 0.5 | % |
| Advertising | | | 0.4 | % |
| Total Common Stocks | | | 117.6 | % |
| Total Investments | | | 117.6 | % |
| Liabilities in Excess of Other Assets | | | (17.6 | )% |
| Total Net Assets | | | 100.0 | % |
See accompanying Notes to Financial Statements.
AXS Market Neutral Fund
SCHEDULE OF INVESTMENTS
As of September 30, 2023
| Number of Shares | | | | | Value | |
| | | | COMMON STOCKS — 121.5% | | | |
| | | | | AEROSPACE/DEFENSE — 6.6% | | | | |
| | 1,405 | | | General Dynamics Corp.1 | | $ | 310,463 | |
| | 1,776 | | | L3Harris Technologies, Inc.1 | | | 309,237 | |
| | 743 | | | Lockheed Martin Corp.1 | | | 303,857 | |
| | 721 | | | Northrop Grumman Corp.1 | | | 317,377 | |
| | | | | | | | 1,240,934 | |
| | | | | AGRICULTURE — 3.2% | | | | |
| | 7,245 | | | Altria Group, Inc.1 | | | 304,652 | |
| | 3,255 | | | Philip Morris International, Inc.1 | | | 301,348 | |
| | | | | | | | 606,000 | |
| | | | | BANKS — 1.7% | | | | |
| | 2,468 | | | M&T Bank Corp.1 | | | 312,079 | |
| | | | | | | | | |
| | | | | BEVERAGES — 4.8% | | | | |
| | 5,336 | | | Coca-Cola Co.1 | | | 298,709 | |
| | 4,840 | | | Molson Coors Beverage Co. - Class B1 | | | 307,776 | |
| | 1,756 | | | PepsiCo, Inc.1 | | | 297,537 | |
| | | | | | | | 904,022 | |
| | | | | BIOTECHNOLOGY — 8.2% | | | | |
| | 1,148 | | | Amgen, Inc.1 | | | 308,536 | |
| | 4,092 | | | Gilead Sciences, Inc.1 | | | 306,654 | |
| | 5,262 | | | Incyte Corp.*,1 | | | 303,986 | |
| | 372 | | | Regeneron Pharmaceuticals, Inc.*,1 | | | 306,141 | |
| | 871 | | | Vertex Pharmaceuticals, Inc.*,1 | | | 302,882 | |
| | | | | | | | 1,528,199 | |
| | | | | COMMERCIAL SERVICES — 3.2% | | | | |
| | 1,420 | | | MarketAxess Holdings, Inc.1 | | | 303,369 | |
| | 1,265 | | | Verisk Analytics, Inc.1 | | | 298,843 | |
| | | | | | | | 602,212 | |
| | | | | COMPUTERS — 1.7% | | | | |
| | 3,363 | | | Leidos Holdings, Inc.1 | | | 309,934 | |
| | | | | | | | | |
| | | | | COSMETICS/PERSONAL CARE — 3.2% | | | | |
| | 4,228 | | | Colgate-Palmolive Co.1 | | | 300,653 | |
| | 2,022 | | | Procter & Gamble Co.1 | | | 294,929 | |
| | | | | | | | 595,582 | |
| | | | | DIVERSIFIED FINANCIAL SERVICES — 3.3% | | | | |
| | 1,965 | | | Cboe Global Markets, Inc.1 | | | 306,953 | |
| | 1,518 | | | CME Group, Inc.1 | | | 303,934 | |
| | | | | | | | 610,887 | |
AXS Market Neutral Fund
SCHEDULE OF INVESTMENTS - Continued
As of September 30, 2023
| Number of Shares | | | | | Value | |
| | | | COMMON STOCKS (Continued) | | | |
| | | | | ENVIRONMENTAL CONTROL — 3.2% | | | | |
| | 2,096 | | | Republic Services, Inc.1 | | $ | 298,701 | |
| | 1,959 | | | Waste Management, Inc.1 | | | 298,630 | |
| | | | | | | | 597,331 | |
| | | | | FOOD — 12.8% | | | | |
| | 7,205 | | | Campbell Soup Co.1 | | | 295,981 | |
| | 10,670 | | | Conagra Brands, Inc.1 | | | 292,571 | |
| | 4,733 | | | General Mills, Inc.1 | | | 302,865 | |
| | 1,475 | | | Hershey Co.1 | | | 295,118 | |
| | 7,859 | | | Hormel Foods Corp.1 | | | 298,878 | |
| | 5,092 | | | Kellogg Co.1 | | | 303,025 | |
| | 3,254 | | | Lamb Weston Holdings, Inc.1 | | | 300,865 | |
| | 4,003 | | | McCormick & Co., Inc.1 | | | 302,787 | |
| | | | | | | | 2,392,090 | |
| | | | | HEALTHCARE-PRODUCTS — 5.1% | | | | |
| | 1,227 | | | Danaher Corp.1 | | | 304,419 | |
| | 2,237 | | | ResMed, Inc.1 | | | 330,785 | |
| | 1,141 | | | Waters Corp.*,1 | | | 312,873 | |
| | | | | | | | 948,077 | |
| | | | | HEALTHCARE-SERVICES — 8.1% | | | | |
| | 4,469 | | | Centene Corp.*,1 | | | 307,825 | |
| | 687 | | | Elevance Health, Inc.1 | | | 299,134 | |
| | 620 | | | Humana, Inc.1 | | | 301,642 | |
| | 920 | | | Molina Healthcare, Inc.*,1 | | | 301,659 | |
| | 608 | | | UnitedHealth Group, Inc.1 | | | 306,547 | |
| | | | | | | | 1,516,807 | |
| | | | | HOUSEHOLD PRODUCTS/WARES — 4.8% | | | | |
| | 3,239 | | | Church & Dwight Co., Inc.1 | | | 296,790 | |
| | 2,304 | | | Clorox Co.1 | | | 301,962 | |
| | 2,473 | | | Kimberly-Clark Corp.1 | | | 298,862 | |
| | | | | | | | 897,614 | |
| | | | | INSURANCE — 9.6% | | | | |
| | 913 | | | Aon PLC - Class A1 | | | 296,013 | |
| | 4,248 | | | Brown & Brown, Inc.1 | | | 296,680 | |
| | 4,222 | | | Hartford Financial Services Group, Inc.1 | | | 299,382 | |
| | 4,789 | | | Loews Corp.1 | | | 303,192 | |
| | 4,753 | | | W R Berkley Corp.1 | | | 301,768 | |
| | 1,446 | | | Willis Towers Watson PLC1 | | | 302,156 | |
| | | | | | | | 1,799,191 | |
AXS Market Neutral Fund
SCHEDULE OF INVESTMENTS - Continued
As of September 30, 2023
Number
of Shares | | | | | Value | |
| | | | COMMON STOCKS (Continued) | | | |
| | | | | MEDIA — 3.3% | | | | |
| | 710 | | | FactSet Research Systems, Inc.1 | | $ | 310,455 | |
| | 9,735 | | | Fox Corp. - Class A1 | | | 303,732 | |
| | | | | | | | 614,187 | |
| | | | | OIL & GAS — 1.7% | | | | |
| | 11,767 | | | Coterra Energy, Inc.1 | | | 318,297 | |
| | | | | | | | | |
| | | | | PHARMACEUTICALS — 14.4% | | | | |
| | 2,007 | | | AbbVie, Inc.1 | | | 299,163 | |
| | 3,446 | | | Cardinal Health, Inc.1 | | | 299,182 | |
| | 1,060 | | | Cigna Group1 | | | 303,234 | |
| | 4,308 | | | CVS Health Corp.1 | | | 300,785 | |
| | 1,914 | | | Johnson & Johnson1 | | | 298,105 | |
| | 702 | | | McKesson Corp.1 | | | 305,265 | |
| | 2,890 | | | Merck & Co., Inc.1 | | | 297,526 | |
| | 16,662 | | | Organon & Co.1 | | | 289,252 | |
| | 9,429 | | | Pfizer, Inc.1 | | | 312,760 | |
| | | | | | | | 2,705,272 | |
| | | | | REITS — 1.6% | | | | |
| | 1,155 | | | Public Storage - REIT1 | | | 304,366 | |
| | | | | | | | | |
| | | | | RETAIL — 11.3% | | | | |
| | 120 | | | AutoZone, Inc.*,1 | | | 304,799 | |
| | 548 | | | Costco Wholesale Corp.1 | | | 309,598 | |
| | 2,839 | | | Dollar General Corp.1 | | | 300,366 | |
| | 808 | | | Domino's Pizza, Inc.1 | | | 306,062 | |
| | 1,129 | | | McDonald's Corp.1 | | | 297,424 | |
| | 329 | | | O'Reilly Automotive, Inc.*,1 | | | 299,015 | |
| | 1,504 | | | Tractor Supply Co.1 | | | 305,387 | |
| | | | | | | | 2,122,651 | |
| | | | | SOFTWARE — 4.9% | | | | |
| | 2,857 | | | Akamai Technologies, Inc.*,1 | | | 304,385 | |
| | 2,647 | | | Fiserv, Inc.*,1 | | | 299,005 | |
| | 2,079 | | | Jack Henry & Associates, Inc.1 | | | 314,220 | |
| | | | | | | | 917,610 | |
| | | | | TELECOMMUNICATIONS — 3.2% | | | | |
| | 20,425 | | | AT&T, Inc.1 | | | 306,784 | |
| | 9,262 | | | Verizon Communications, Inc.1 | | | 300,181 | |
| | | | | | | | 606,965 | |
AXS Market Neutral Fund
SCHEDULE OF INVESTMENTS - Continued
As of September 30, 2023
| Number of Shares | | | | | Value | |
| | | | COMMON STOCKS (Continued) | | | |
| | | | | TRANSPORTATION — 1.6% | | | | |
| | 3,563 | | | C.H. Robinson Worldwide, Inc.1 | | $ | 306,881 | |
| | | | | TOTAL COMMON STOCKS | | | | |
| | | | | (Cost $24,103,096) | | | 22,757,188 | |
Principal
Amount | | | | | | |
| | | | | SHORT-TERM INVESTMENTS — 0.7% | | | | |
| $ | 133,014 | | | UMB Bank Demand Deposit, 0.01%2 | | | 133,014 | |
| | | | | TOTAL SHORT-TERM INVESTMENTS | | | | |
| | | | | (Cost $133,014) | | | 133,014 | |
| | | | | | | | | |
| | | | | TOTAL INVESTMENTS — 122.2% | | | | |
| | | | | (Cost $24,236,110) | | | 22,890,202 | |
| | | | | Liabilities in Excess of Other Assets — (22.2)% | | | (4,164,919 | ) |
| | | | | TOTAL NET ASSETS — 100.0% | | $ | 18,725,283 | |
| Number of Shares | | | | | | |
| | | | | SECURITIES SOLD SHORT — (85.6)% | | | | |
| | | | | COMMON STOCKS — (85.6)% | | | | |
| | | | | ADVERTISING — (1.2)% | | | | |
| | (3,755 | ) | | Interpublic Group of Cos., Inc. | | | (107,618 | ) |
| | (1,473 | ) | | Omnicom Group, Inc. | | | (109,709 | ) |
| | | | | | | | (217,327 | ) |
| | | | | AEROSPACE/DEFENSE — (1.2)% | | | | |
| | (2,388 | ) | | Howmet Aerospace, Inc. | | | (110,445 | ) |
| | (1,520 | ) | | RTX Corp. | | | (109,394 | ) |
| | | | | | | | (219,839 | ) |
| | | | | AGRICULTURE — (0.6)% | | | | |
| | (986 | ) | | Bunge Ltd. | | | (106,735 | ) |
| | | | | | | | | |
| | | | | AUTO MANUFACTURERS — (0.6)% | | | | |
| | (475 | ) | | Cummins, Inc. | | | (108,519 | ) |
| | | | | | | | | |
| | | | | BANKS — (0.6)% | | | | |
| | (1,301 | ) | | Morgan Stanley | | | (106,253 | ) |
| | | | | | | | | |
| | | | | BEVERAGES — (1.1)% | | | | |
| | (1,789 | ) | | Brown-Forman Corp. - Class B | | | (103,207 | ) |
| | (3,279 | ) | | Keurig Dr Pepper, Inc. | | | (103,518 | ) |
| | | | | | | | (206,725 | ) |
AXS Market Neutral Fund
SCHEDULE OF INVESTMENTS - Continued
As of September 30, 2023
| Number of Shares | | | | | Value | |
| | | | SECURITIES SOLD SHORT (Continued) | | | |
| | | | | COMMON STOCKS (Continued) | | | | |
| | | | | BIOTECHNOLOGY — (1.8)% | | | | |
| | (306 | ) | | Bio-Rad Laboratories, Inc. - Class A* | | $ | (109,686 | ) |
| | (2,123 | ) | | Corteva, Inc. | | | (108,613 | ) |
| | (819 | ) | | Illumina, Inc.* | | | (112,432 | ) |
| | | | | | | | (330,731 | ) |
| | | | | BUILDING MATERIALS — (2.3)% | | | | |
| | (1,975 | ) | | Johnson Controls International PLC | | | (105,090 | ) |
| | (270 | ) | | Martin Marietta Materials, Inc. | | | (110,829 | ) |
| | (1,252 | ) | | Mohawk Industries, Inc.* | | | (107,434 | ) |
| | (545 | ) | | Vulcan Materials Co. | | | (110,101 | ) |
| | | | | | | | (433,454 | ) |
| | | | | CHEMICALS — (4.0)% | | | | |
| | (380 | ) | | Air Products and Chemicals, Inc. | | | (107,692 | ) |
| | (1,496 | ) | | DuPont de Nemours, Inc. | | | (111,587 | ) |
| | (631 | ) | | Ecolab, Inc. | | | (106,892 | ) |
| | (1,589 | ) | | FMC Corp. | | | (106,415 | ) |
| | (1,602 | ) | | International Flavors & Fragrances, Inc. | | | (109,208 | ) |
| | (292 | ) | | Linde PLC | | | (108,726 | ) |
| | (839 | ) | | PPG Industries, Inc. | | | (108,902 | ) |
| | | | | | | | (759,422 | ) |
| | | | | COMMERCIAL SERVICES — (2.3)% | | | | |
| | (455 | ) | | Automatic Data Processing, Inc. | | | (109,464 | ) |
| | (1,391 | ) | | CoStar Group, Inc.* | | | (106,954 | ) |
| | (917 | ) | | Global Payments, Inc. | | | (105,813 | ) |
| | (580 | ) | | Quanta Services, Inc. | | | (108,500 | ) |
| | | | | | | | (430,731 | ) |
| | | | | COSMETICS/PERSONAL CARE — (0.6)% | | | | |
| | (741 | ) | | Estee Lauder Cos., Inc. - Class A | | | (107,112 | ) |
| | | | | | | | | |
| | | | | DIVERSIFIED FINANCIAL SERVICES — (1.1)% | | | | |
| | (710 | ) | | American Express Co. | | | (105,925 | ) |
| | (1,973 | ) | | Charles Schwab Corp. | | | (108,318 | ) |
| | | | | | | | (214,243 | ) |
| | | | | ELECTRIC — (12.6)% | | | | |
| | (2,125 | ) | | Alliant Energy Corp. | | | (102,956 | ) |
| | (1,357 | ) | | Ameren Corp. | | | (101,544 | ) |
| | (1,372 | ) | | American Electric Power Co., Inc. | | | (103,202 | ) |
| | (1,930 | ) | | CMS Energy Corp. | | | (102,502 | ) |
| | (1,200 | ) | | Consolidated Edison, Inc. | | | (102,636 | ) |
AXS Market Neutral Fund
SCHEDULE OF INVESTMENTS - Continued
As of September 30, 2023
Number
of Shares | | | | | Value | |
| | | | SECURITIES SOLD SHORT (Continued) | | | |
| | | | COMMON STOCKS (Continued) | | | |
| | | | | ELECTRIC (Continued) | | | | |
| | (992 | ) | | Constellation Energy Corp. | | $ | (108,207 | ) |
| | (2,303 | ) | | Dominion Energy, Inc. | | | (102,875 | ) |
| | (1,031 | ) | | DTE Energy Co. | | | (102,358 | ) |
| | (1,171 | ) | | Duke Energy Corp. | | | (103,352 | ) |
| | (1,596 | ) | | Edison International | | | (101,011 | ) |
| | (2,033 | ) | | Evergy, Inc. | | | (103,073 | ) |
| | (1,737 | ) | | Eversource Energy | | | (101,007 | ) |
| | (2,704 | ) | | Exelon Corp. | | | (102,184 | ) |
| | (3,020 | ) | | FirstEnergy Corp. | | | (103,224 | ) |
| | (1,602 | ) | | NextEra Energy, Inc. | | | (91,779 | ) |
| | (2,835 | ) | | NRG Energy, Inc. | | | (109,204 | ) |
| | (6,360 | ) | | PG&E Corp.* | | | (102,587 | ) |
| | (1,394 | ) | | Pinnacle West Capital Corp. | | | (102,710 | ) |
| | (4,309 | ) | | PPL Corp. | | | (101,520 | ) |
| | (1,512 | ) | | Sempra | | | (102,861 | ) |
| | (1,565 | ) | | Southern Co. | | | (101,287 | ) |
| | (1,269 | ) | | WEC Energy Group, Inc. | | | (102,218 | ) |
| | (1,819 | ) | | Xcel Energy, Inc. | | | (104,083 | ) |
| | | | | | | | (2,358,380 | ) |
| | | | | ELECTRICAL COMPONENTS & EQUIPMENT — (1.2)% | | | | |
| | (1,125 | ) | | Emerson Electric Co. | | | (108,641 | ) |
| | (1,022 | ) | | Generac Holdings, Inc.* | | | (111,357 | ) |
| | | | | | | | (219,998 | ) |
| | | | | ELECTRONICS — (0.6)% | | | | |
| | (573 | ) | | Honeywell International, Inc. | | | (105,856 | ) |
| | | | | | | | | |
| | | | | ENGINEERING & CONSTRUCTION — (0.6)% | | | | |
| | (820 | ) | | Jacobs Solutions, Inc. | | | (111,930 | ) |
| | | | | | | | | |
| | | | | FOOD — (1.7)% | | | | |
| | (3,174 | ) | | Kraft Heinz Co. | | | (106,773 | ) |
| | (1,542 | ) | | Mondelez International, Inc. - Class A | | | (107,015 | ) |
| | (2,138 | ) | | Tyson Foods, Inc. - Class A | | | (107,948 | ) |
| | | | | | | | (321,736 | ) |
| | | | | HAND/MACHINE TOOLS — (0.6)% | | | | |
| | (1,302 | ) | | Stanley Black & Decker, Inc. | | | (108,821 | ) |
| | | | | | | | | |
| | | | | HEALTHCARE-PRODUCTS — (8.6)% | | | | |
| | (2,902 | ) | | Baxter International, Inc. | | | (109,521 | ) |
| | (1,566 | ) | | Bio-Techne Corp. | | | (106,598 | ) |
AXS Market Neutral Fund
SCHEDULE OF INVESTMENTS - Continued
As of September 30, 2023
Number
of Shares | | | | | Value | |
| | | | | SECURITIES SOLD SHORT (Continued) | | | | |
| | | | | COMMON STOCKS (Continued) | | | | |
| | | | | HEALTHCARE-PRODUCTS (Continued) | | | | |
| | (2,027 | ) | | Boston Scientific Corp.* | | $ | (107,026 | ) |
| | (332 | ) | | Cooper Cos., Inc. | | | (105,579 | ) |
| | (3,206 | ) | | DENTSPLY SIRONA, Inc. | | | (109,517 | ) |
| | (1,689 | ) | | GE HealthCare Technologies, Inc. | | | (114,919 | ) |
| | (685 | ) | | Insulet Corp.* | | | (109,251 | ) |
| | (375 | ) | | Intuitive Surgical, Inc.* | | | (109,609 | ) |
| | (1,356 | ) | | Medtronic PLC | | | (106,256 | ) |
| | (997 | ) | | Revvity, Inc. | | | (110,368 | ) |
| | (484 | ) | | STERIS PLC | | | (106,199 | ) |
| | (381 | ) | | Stryker Corp. | | | (104,116 | ) |
| | (536 | ) | | Teleflex, Inc. | | | (105,276 | ) |
| | (291 | ) | | West Pharmaceutical Services, Inc. | | | (109,186 | ) |
| | (931 | ) | | Zimmer Biomet Holdings, Inc. | | | (104,477 | ) |
| | | | | | | | (1,617,898 | ) |
| | | | | HEALTHCARE-SERVICES — (0.6)% | | | | |
| | (2,378 | ) | | Catalent, Inc.* | | | (108,270 | ) |
| | | | | | | | | |
| | | | | INSURANCE — (2.8)% | | | | |
| | (957 | ) | | Allstate Corp. | | | (106,619 | ) |
| | (511 | ) | | Chubb Ltd. | | | (106,380 | ) |
| | (277 | ) | | Everest Group Ltd. | | | (102,953 | ) |
| | (1,685 | ) | | MetLife, Inc. | | | (106,003 | ) |
| | (763 | ) | | Progressive Corp. | | | (106,286 | ) |
| | | | | | | | (528,241 | ) |
| | | | | INTERNET — (1.1)% | | | | |
| | (834 | ) | | Amazon.com, Inc.* | | | (106,018 | ) |
| | (286 | ) | | Netflix, Inc.* | | | (107,994 | ) |
| | | | | | | | (214,012 | ) |
| | | | | LODGING — (0.6)% | | | | |
| | (2,397 | ) | | Las Vegas Sands Corp. | | | (109,879 | ) |
| | | | | | | | | |
| | | | | MACHINERY-CONSTRUCTION & MINING — (0.6)% | | | | |
| | (401 | ) | | Caterpillar, Inc. | | | (109,473 | ) |
| | | | | | | | | |
| | | | | MACHINERY-DIVERSIFIED — (1.2)% | | | | |
| | (287 | ) | | Deere & Co. | | | (108,308 | ) |
| | (1,202 | ) | | Xylem, Inc. | | | (109,418 | ) |
| | | | | | | | (217,726 | ) |
AXS Market Neutral Fund
SCHEDULE OF INVESTMENTS - Continued
As of September 30, 2023
| Number of Shares | | | | | Value | |
| | | | | SECURITIES SOLD SHORT (Continued) | | | | |
| | | | | COMMON STOCKS (Continued) | | | | |
| | | | | MEDIA — (1.7)% | | | | |
| | (2,394 | ) | | Comcast Corp. - Class A | | $ | (106,150 | ) |
| | (5,555 | ) | | News Corp. | | | (111,433 | ) |
| | (1,331 | ) | | Walt Disney Co.* | | | (107,878 | ) |
| | | | | | | | (325,461 | ) |
| | | | | MINING — (0.5)% | | | | |
| | (2,664 | ) | | Newmont Corp. | | | (98,435 | ) |
| | | | | | | | | |
| | | | | MISCELLANEOUS MANUFACTURING — (1.2)% | | | | |
| | (555 | ) | | Axon Enterprise, Inc.* | | | (110,439 | ) |
| | (970 | ) | | General Electric Co. | | | (107,234 | ) |
| | | | | | | | (217,673 | ) |
| | | | | PACKAGING & CONTAINERS — (1.7)% | | | | |
| | (12,030 | ) | | Amcor PLC | | | (110,195 | ) |
| | (2,180 | ) | | Ball Corp. | | | (108,520 | ) |
| | (3,091 | ) | | Westrock Co. | | | (110,658 | ) |
| | | | | | | | (329,373 | ) |
| | | | | PHARMACEUTICALS — (4.1)% | | | | |
| | (411 | ) | | Becton Dickinson & Co. | | | (106,256 | ) |
| | (1,853 | ) | | Bristol-Myers Squibb Co. | | | (107,548 | ) |
| | (587 | ) | | Cencora, Inc. | | | (105,642 | ) |
| | (1,235 | ) | | Dexcom, Inc.* | | | (115,225 | ) |
| | (197 | ) | | Eli Lilly & Co. | | | (105,815 | ) |
| | (1,490 | ) | | Henry Schein, Inc.* | | | (110,633 | ) |
| | (11,349 | ) | | Viatris, Inc. | | | (111,901 | ) |
| | | | | | | | (763,020 | ) |
| | | | | REAL ESTATE — (0.6)% | | | | |
| | (1,442 | ) | | CBRE Group, Inc. - Class A* | | | (106,506 | ) |
| | | | | | | | | |
| | | | | REITS — (13.6)% | | | | |
| | (1,069 | ) | | Alexandria Real Estate Equities, Inc. - REIT | | | (107,007 | ) |
| | (651 | ) | | American Tower Corp. - REIT | | | (107,057 | ) |
| | (610 | ) | | AvalonBay Communities, Inc. - REIT | | | (104,761 | ) |
| | (1,797 | ) | | Boston Properties, Inc. - REIT | | | (106,886 | ) |
| | (1,103 | ) | | Camden Property Trust - REIT | | | (104,322 | ) |
| | (1,187 | ) | | Crown Castle, Inc. - REIT | | | (109,240 | ) |
| | (872 | ) | | Digital Realty Trust, Inc. - REIT | | | (105,529 | ) |
| | (148 | ) | | Equinix, Inc. - REIT | | | (107,487 | ) |
| | (1,800 | ) | | Equity Residential - REIT | | | (105,678 | ) |
| | (500 | ) | | Essex Property Trust, Inc. - REIT | | | (106,045 | ) |
AXS Market Neutral Fund
SCHEDULE OF INVESTMENTS - Continued
As of September 30, 2023
| Number of Shares | | | | | Value | |
| | | | | SECURITIES SOLD SHORT (Continued) | | | | |
| | | | | COMMON STOCKS (Continued) | | | | |
| | | | | REITS (Continued) | | | | |
| | (876 | ) | | Extra Space Storage, Inc. - REIT | | $ | (106,504 | ) |
| | (1,153 | ) | | Federal Realty Investment Trust - REIT | | | (104,496 | ) |
| | (5,704 | ) | | Healthpeak Properties, Inc. - REIT | | | (104,725 | ) |
| | (3,299 | ) | | Invitation Homes, Inc. - REIT | | | (104,545 | ) |
| | (1,747 | ) | | Iron Mountain, Inc. - REIT | | | (103,859 | ) |
| | (830 | ) | | Mid-America Apartment Communities, Inc. - REIT | | | (106,780 | ) |
| | (944 | ) | | Prologis, Inc. - REIT | | | (105,926 | ) |
| | (2,095 | ) | | Realty Income Corp. - REIT | | | (104,624 | ) |
| | (1,771 | ) | | Regency Centers Corp. - REIT | | | (105,268 | ) |
| | (538 | ) | | SBA Communications Corp. - REIT | | | (107,691 | ) |
| | (2,980 | ) | | UDR, Inc. - REIT | | | (106,297 | ) |
| | (2,531 | ) | | Ventas, Inc. - REIT | | | (106,631 | ) |
| | (3,639 | ) | | VICI Properties, Inc. - REIT | | | (105,895 | ) |
| | (1,304 | ) | | Welltower, Inc. - REIT | | | (106,824 | ) |
| | | | | | | | (2,544,077 | ) |
| | | | | RETAIL — (2.3)% | | | | |
| | (1,041 | ) | | Dollar Tree, Inc.* | | | (110,814 | ) |
| | (744 | ) | | Genuine Parts Co. | | | (107,419 | ) |
| | (5,150 | ) | | Walgreens Boots Alliance, Inc. | | | (114,536 | ) |
| | (671 | ) | | Walmart, Inc. | | | (107,313 | ) |
| | | | | | | | (440,082 | ) |
| | | | | SEMICONDUCTORS — (1.2)% | | | | |
| | (3,162 | ) | | Intel Corp. | | | (112,409 | ) |
| | (1,576 | ) | | Micron Technology, Inc. | | | (107,215 | ) |
| | | | | | | | (219,624 | ) |
| | | | | SHIPBUILDING — (0.6)% | | | | |
| | (541 | ) | | Huntington Ingalls Industries, Inc. | | | (110,678 | ) |
| | | | | | | | | |
| | | | | SOFTWARE — (3.4)% | | | | |
| | (590 | ) | | Broadridge Financial Solutions, Inc. | | | (105,639 | ) |
| | (1,939 | ) | | Fidelity National Information Services, Inc. | | | (107,168 | ) |
| | (220 | ) | | Roper Technologies, Inc. | | | (106,542 | ) |
| | (524 | ) | | Salesforce, Inc.* | | | (106,257 | ) |
| | (789 | ) | | Take-Two Interactive Software, Inc.* | | | (110,768 | ) |
| | (280 | ) | | Tyler Technologies, Inc.* | | | (108,119 | ) |
| | | | | | | | (644,493 | ) |
| | | | | TELECOMMUNICATIONS — (2.3)% | | | | |
| | (603 | ) | | Arista Networks, Inc.* | | | (110,910 | ) |
| | (3,490 | ) | | Corning, Inc. | | | (106,340 | ) |
AXS Market Neutral Fund
SCHEDULE OF INVESTMENTS - Continued
As of September 30, 2023
| Number of Shares | | | | | Value | |
| | | | | SECURITIES SOLD SHORT (Continued) | | | | |
| | | | | COMMON STOCKS (Continued) | | | | |
| | | | | TELECOMMUNICATIONS (Continued) | | | | |
| | (3,903 | ) | | Juniper Networks, Inc. | | $ | (108,465 | ) |
| | (780 | ) | | T-Mobile US, Inc.* | | | (109,239 | ) |
| | | | | | | | (434,954 | ) |
| | | | | TOYS/GAMES/HOBBIES — (0.6)% | | | | |
| | (1,657 | ) | | Hasbro, Inc. | | | (109,594 | ) |
| | | | | | | | | |
| | | | | TRANSPORTATION — (1.1)% | | | | |
| | (3,486 | ) | | CSX Corp. | | | (107,195 | ) |
| | (538 | ) | | Norfolk Southern Corp. | | | (105,948 | ) |
| | | | | | | | (213,143 | ) |
| | | | | WATER — (0.5)% | | | | |
| | (821 | ) | | American Water Works Co., Inc. | | | (101,664 | ) |
| | | | | TOTAL COMMON STOCKS | | | | |
| | | | | (Proceeds $17,825,946) | | | (16,032,088 | ) |
| | | | | | | | | |
| | | | | TOTAL SECURITIES SOLD SHORT | | | | |
| | | | | (Proceeds $17,825,946) | | $ | (16,032,088 | ) |
PLC – Public Limited Company
REIT – Real Estate Investment Trusts
| * | Non-income producing security. |
| 1 | All or a portion of the security is segregated as collateral for securities sold short. As of September 30, 2023, the aggregate value of those securities was $22,757,188, representing 121.5% of net assets. |
| 2 | The rate is the annualized seven-day yield at period end. |
See accompanying Notes to Financial Statements.
AXS Market Neutral Fund
SUMMARY OF INVESTMENTS
As of September 30, 2023
| Security Type/Industry | | Percent of Total
Net Assets | |
| Common Stocks | | | | |
| Pharmaceuticals | | | 14.4 | % |
| Food | | | 12.8 | % |
| Retail | | | 11.3 | % |
| Insurance | | | 9.6 | % |
| Biotechnology | | | 8.2 | % |
| Healthcare-Services | | | 8.1 | % |
| Aerospace/Defense | | | 6.6 | % |
| Healthcare-Products | | | 5.1 | % |
| Software | | | 4.9 | % |
| Household Products/Wares | | | 4.8 | % |
| Beverages | | | 4.8 | % |
| Diversified Financial Services | | | 3.3 | % |
| Media | | | 3.3 | % |
| Cosmetics/Personal Care | | | 3.2 | % |
| Telecommunications | | | 3.2 | % |
| Environmental Control | | | 3.2 | % |
| Agriculture | | | 3.2 | % |
| Commercial Services | | | 3.2 | % |
| Banks | | | 1.7 | % |
| Computers | | | 1.7 | % |
| Oil & Gas | | | 1.7 | % |
| Transportation | | | 1.6 | % |
| REITS | | | 1.6 | % |
| Total Common Stocks | | | 121.5 | % |
| Short-Term Investments | | | 0.7 | % |
| Total Investments | | | 122.2 | % |
| Liabilities in Excess of Other Assets | | | (22.2 | )% |
| Total Net Assets | | | 100.0 | % |
See accompanying Notes to Financial Statements.
AXS Adaptive Plus Fund
SCHEDULE OF INVESTMENTS
As of September 30, 2023
| Principal Amount | | | | | Value | |
| | | | U.S. TREASURY BILLS — 50.5% | | | |
| | | | | United States Treasury Bill | | | | |
| $ | 5,000,000 | | | 0.000%, 10/5/2023 | | $ | 4,997,805 | |
| | 5,000,000 | | | 0.000%, 12/7/2023 | | | 4,951,300 | |
| | 6,000,000 | | | 0.000%, 2/8/2024 | | | 5,886,132 | |
| | | | | TOTAL U.S. TREASURY BILLS | | | | |
| | | | | (Cost $15,837,342) | | | 15,835,237 | |
| Number of Contracts | | | | | | |
| | | | PURCHASED OPTIONS CONTRACTS — 23.3% | | | |
| | | | | CALL OPTIONS — 23.3% | | | | |
| | 9,498 | | | Nomura Galaxy Option -ProfitScore Regime-Adaptive Equity Index Counterparty: Nomura Securities, Current Price: $770.21, Exercise Price: $0.0001, Notional Amount: $95, Expiration Date: September 15, 20241 | | | 7,315,926 | |
| | | | | TOTAL CALL OPTIONS | | | | |
| | | | | (Cost $7,872,922) | | | 7,315,926 | |
| | | | | | | | | |
| | | | | TOTAL PURCHASED OPTIONS CONTRACTS | | | | |
| | | | | (Cost $7,872,922) | | | 7,315,926 | |
| Number of Shares | | | | | | |
| | | | | SHORT-TERM INVESTMENTS — 27.8% | | | | |
| | 8,719,679 | | | Fidelity Investments Money Market Funds - Treasury Portfolio, Class I, 5.15%2 | | | 8,719,679 | |
| | | | | TOTAL SHORT-TERM INVESTMENTS | | | | |
| | | | | (Cost $8,719,679) | | | 8,719,679 | |
| | | | | | | | | |
| | | | | TOTAL INVESTMENTS — 101.6% | | | | |
| | | | | (Cost $32,429,943) | | | 31,870,842 | |
| | | | | Liabilities in Excess of Other Assets — (1.6)% | | | (487,720 | ) |
| | | | | TOTAL NET ASSETS — 100.0% | | $ | 31,383,122 | |
| 1 | The Nomura Call Option is issued by Nomura Securities Ltd. and provides AXS Adaptive Plus Fund exposure to the ProfitScore Trading Program that is designed to produce the returns of Adaptive Equity Index. |
| 2 | The rate is the annualized seven-day yield at period end. |
See accompanying Notes to Financial Statements.
AXS Adaptive Plus Fund
SUMMARY OF INVESTMENTS
As of September 30, 2023
| Security Type | | Percent of Total
Net Assets | |
| U.S. Treasury Bills | | | 50.5 | % |
| Purchased Options Contracts | | | 23.3 | % |
| Short-Term Investments | | | 27.8 | % |
| Total Investments | | | 101.6 | % |
| Liabilities in Excess of Other Assets | | | (1.6 | )% |
| Total Net Assets | | | 100.0 | % |
See accompanying Notes to Financial Statements.
AXS Income Opportunities Fund
SCHEDULE OF INVESTMENTS
As of September 30, 2023
| Number of Shares | | | | | Value | |
| | | | COMMON STOCKS — 17.1% | | | |
| | | | | REITS — 16.6% | | | | |
| | 10,000 | | | Alexandria Real Estate Equities, Inc. - REIT | | $ | 1,001,000 | |
| | 36,000 | | | American Assets Trust, Inc. - REIT | | | 700,200 | |
| | 70,000 | | | Annaly Capital Management, Inc. - REIT | | | 1,316,700 | |
| | 12,000 | | | Blackstone Mortgage Trust, Inc. - Class A - REIT | | | 261,000 | |
| | 9,887 | | | Boston Properties, Inc. - REIT | | | 588,079 | |
| | 31,218 | | | CTO Realty Growth, Inc. - REIT | | | 506,044 | |
| | 85,319 | | | Global Medical REIT, Inc. - REIT | | | 765,312 | |
| | 26,617 | | | KKR Real Estate Finance Trust, Inc. - REIT | | | 315,944 | |
| | 170,581 | | | Macerich Co. - REIT1 | | | 1,861,039 | |
| | 86,243 | | | Medical Properties Trust, Inc. - REIT | | | 470,024 | |
| | 13,668 | | | National Storage Affiliates Trust - REIT | | | 433,822 | |
| | 8,780 | | | Simon Property Group, Inc. - REIT | | | 948,503 | |
| | 55,530 | | | Vornado Realty Trust - REIT1 | | | 1,259,420 | |
| | 14,771 | | | WP Carey, Inc. - REIT | | | 798,816 | |
| | | | | | | | 11,225,903 | |
| | | | | VENTURE CAPITAL — 0.5% | | | | |
| | 25,520 | | | Newlake Capital Partners, Inc. - REIT | | | 347,582 | |
| | | | | TOTAL COMMON STOCKS | | | | |
| | | | | (Cost $14,349,503) | | | 11,573,485 | |
| | | | | PREFERRED STOCKS — 92.0% | | | | |
| | | | | COMMERCIAL SERVICES — 2.1% | | | | |
| | 36,380 | | | Triton International Ltd. - Series C, 7.375%2,3,4 | | | 826,554 | |
| | 26,464 | | | Triton International Ltd. - Series D, 6.875%2,3,4 | | | 612,906 | |
| | | | | | | | 1,439,460 | |
| | | | | REAL ESTATE — 1.1% | | | | |
| | 32,452 | | | Seritage Growth Properties - Series A, 7.000%1,2,4 | | | 749,641 | |
| | | | | REITS — 81.0% | | | | |
| | 116,199 | | | AGNC Investment Corp. - Series C, 10.681% (3-Month USD Libor + 511.1 basis points)1,2,4,5 | | | 2,980,504 | |
| | 26,077 | | | AGNC Investment Corp. - Series D, 6.875% (3-Month USD Libor + 433.2 basis points)1,2,4,5 | | | 625,848 | |
| | 21,468 | | | AGNC Investment Corp. - Series F, 6.125% (3-Month USD Libor + 469.7 basis points)1,2,4,5 | | | 464,353 | |
| | 66,316 | | | American Homes 4 Rent - Series G, 5.875%1,2,4 | | | 1,442,373 | |
| | 74,673 | | | Annaly Capital Management, Inc. - Series F, 10.649% (3-Month USD Libor + 499.3 basis points)1,2,4,5 | | | 1,891,467 | |
| | 25,547 | | | Annaly Capital Management, Inc. - Series G, 9.828% (3-Month USD Libor + 417.2 basis points)2,4,5 | | | 633,310 | |
| | 32,290 | | | Annaly Capital Management, Inc. - Series I, 6.750% (3-Month USD Libor + 498.9 basis points)1,2,4,5 | | | 766,887 | |
| | 46,925 | | | Arbor Realty Trust, Inc. - Series D, 6.375%1,2,4 | | | 834,796 | |
AXS Income Opportunities Fund
SCHEDULE OF INVESTMENTS - Continued
As of September 30, 2023
| Number of Shares | | | | | Value | |
| | | | | PREFERRED STOCKS (Continued) | | | | |
| | | | | REITS (Continued) | | | | |
| | 72,856 | | | Arbor Realty Trust, Inc. - Series E, 6.250%1,2,4 | | $ | 1,256,037 | |
| | 70,186 | | | Arbor Realty Trust, Inc. - Series F, 6.250% (3-Month Term SOFR + 544 basis points)1,2,4,5 | | | 1,294,932 | |
| | 99,948 | | | Armada Hoffler Properties, Inc. - Series A, 6.750%1,2,4 | | | 2,108,903 | |
| | 17,046 | | | Centerspace - Series C, 6.625%1,2,4 | | | 416,349 | |
| | 67,175 | | | Chatham Lodging Trust - Series A, 6.625%1,2,4 | | | 1,371,713 | |
| | 34,183 | | | Chimera Investment Corp. - Series A, 8.000%1,2,4 | | | 674,089 | |
| | 60,224 | | | Chimera Investment Corp. - Series C, 7.750% (3-Month USD Libor + 474.3 basis points)1,2,4,5 | | | 1,086,441 | |
| | 67,022 | | | Chimera Investment Corp. - Series D, 8.000% (3-Month USD Libor + 537.9 basis points)1,2,4,5 | | | 1,398,749 | |
| | 65,305 | | | CorEnergy Infrastructure Trust, Inc., 7.375%2,4 | | | 333,056 | |
| | 38,292 | | | CTO Realty Growth, Inc. - Series A, 6.375%1,2,4 | | | 700,361 | |
| | 64,379 | | | DiamondRock Hospitality Co. - Series A, 8.250%1,2,4 | | | 1,641,021 | |
| | 81,990 | | | EPR Properties - Series G, 5.750%1,2,4 | | | 1,522,554 | |
| | 33,861 | | | Franklin BSP Realty Trust, Inc. - Series E, 7.500%1,2,4 | | | 670,109 | |
| | 33,784 | | | Hersha Hospitality Trust - Series C, 6.875%1,2,4 | | | 833,789 | |
| | 88,295 | | | Hersha Hospitality Trust - Series D, 6.500%1,2,4 | | | 2,185,301 | |
| | 100,369 | | | Hersha Hospitality Trust - Series E, 6.500%1,2,4 | | | 2,483,129 | |
| | 121,659 | | | KKR Real Estate Finance Trust, Inc. - Series A, 6.500%1,2,4 | | | 1,983,042 | |
| | 49,537 | | | National Storage Affiliates Trust - Series A, 6.000%1,2,4 | | | 1,112,106 | |
| | 54,092 | | | Pebblebrook Hotel Trust - Series E, 6.375%1,2,4 | | | 1,081,299 | |
| | 73,415 | | | Pebblebrook Hotel Trust - Series F, 6.300%1,2,4 | | | 1,462,427 | |
| | 73,142 | | | Pebblebrook Hotel Trust - Series G, 6.375%1,2,4 | | | 1,440,166 | |
| | 80,845 | | | Pebblebrook Hotel Trust - Series H, 5.700%1,2,4 | | | 1,489,165 | |
| | 16,659 | | | PennyMac Mortgage Investment Trust - Series B, 8.000% (3-Month USD Libor + 0.00 basis points)1,2,4,5 | | | 352,338 | |
| | 67,000 | | | PennyMac Mortgage Investment Trust - Series C, 6.750%2,4 | | | 1,173,840 | |
| | 31,002 | | | Rithm Capital Corp. - Series B, 7.125% (3-Month USD Libor + 564 basis points)1,2,4,5 | | | 704,365 | |
| | 73,071 | | | Rithm Capital Corp. - Series C, 6.375% (3-Month USD Libor + 496.9 basis points)1,2,4,5 | | | 1,443,152 | |
| | 143,432 | | | RLJ Lodging Trust - Series A, 1.950%1,4,6 | | | 3,449,540 | |
| | 11,056 | | | RPT Realty - Series D, 7.250%1,4,6 | | | 562,308 | |
| | 34,765 | | | SL Green Realty Corp. - Series I, 6.500%1,2,4 | | | 657,059 | |
| | 52,665 | | | Summit Hotel Properties, Inc. - Series E, 6.250%1,2,4 | | | 1,032,761 | |
| | 108,347 | | | Summit Hotel Properties, Inc. - Series F, 5.875%1,2,4 | | | 1,996,835 | |
| | 66,121 | | | Sunstone Hotel Investors, Inc. - Series H, 6.125%1,2,4 | | | 1,405,732 | |
| | 70,000 | | | Sunstone Hotel Investors, Inc. - Series I, 5.700%1,2,4 | | | 1,442,000 | |
| | 53,019 | | | TPG RE Finance Trust, Inc. - Series C, 6.250%1,2,4 | | | 846,713 | |
| | 34,000 | | | UMH Properties, Inc. - Series D, 6.375%1,2,4 | | | 714,680 | |
| | 68,215 | | | Vornado Realty Trust - Series O, 4.450%1,2,4 | | | 852,005 | |
| | | | | | | | 54,817,604 | |
AXS Income Opportunities Fund
SCHEDULE OF INVESTMENTS - Continued
As of September 30, 2023
| Number of Shares | | | | | Value | |
| | | | PREFERRED STOCKS (Continued) | | | |
| | | | | TELECOMMUNICATIONS — 5.1% | | | | |
| | 31,663 | | | DigitalBridge Group, Inc. - Series H, 7.125%1,2,4 | | $ | 693,420 | |
| | 51,221 | | | DigitalBridge Group, Inc. - Series I, 7.150%1,2,4 | | | 1,091,007 | |
| | 75,999 | | | DigitalBridge Group, Inc. - Series J, 7.125%1,2,4 | | | 1,641,579 | |
| | | | | | | | 3,426,006 | |
| | | | | VENTURE CAPITAL — 2.7% | | | | |
| | 51,512 | | | Global Net Lease, Inc. - Series A, 7.250%1,2,4 | | | 967,395 | |
| | 49,338 | | | Global Net Lease, Inc. - Series B, 6.875%2,4 | | | 861,442 | |
| | | | | | | | 1,828,837 | |
| | | | | TOTAL PREFERRED STOCKS | | | | |
| | | | | (Cost $69,549,331) | | | 62,261,548 | |
| | | | | SHORT-TERM INVESTMENTS — 2.1% | | | | |
| | 1,414,731 | | | Goldman Sachs Financial Square Government Fund - Institutional Shares, 5.16%1,7 | | | 1,414,731 | |
| | | | | TOTAL SHORT-TERM INVESTMENTS | | | | |
| | | | | (Cost $1,414,731) | | | 1,414,731 | |
| | | | | | | | | |
| | | | | TOTAL INVESTMENTS — 111.2% | | | | |
| | | | | (Cost $85,313,565) | | | 75,249,764 | |
| | | | | | | | | |
| | | | | Liabilities in Excess of Other Assets — (11.2)% | | | (7,604,786 | ) |
| | | | | TOTAL NET ASSETS — 100.0% | | $ | 67,644,978 | |
REIT – Real Estate Investment Trusts
| 1 | All or a portion of the security is segregated as collateral for line of credit borrowings. As of September 30, 2023, the aggregate value of those securities was $43,369,641, representing 64.1% of net assets. |
| 3 | Foreign security denominated in U.S. Dollars. |
| 4 | Perpetual security. Maturity date is not applicable. |
| 7 | The rate is the annualized seven-day yield at period end. |
See accompanying Notes to Financial Statements.
AXS Income Opportunities Fund
SUMMARY OF INVESTMENTS
As of September 30, 2023
| Security Type/Industry | | Percent of Total
Net Assets | |
| Common Stocks | | | | |
| REITS | | | 16.6 | % |
| Venture Capital | | | 0.5 | % |
| Total Common Stocks | | | 17.1 | % |
| Preferred Stocks | | | | |
| REITS | | | 81.0 | % |
| Telecommunications | | | 5.1 | % |
| Venture Capital | | | 2.7 | % |
| Commercial Services | | | 2.1 | % |
| Real Estate | | | 1.1 | % |
| Total Preferred Stocks | | | 92.0 | % |
| Short-Term Investments | | | 2.1 | % |
| Total Investments | | | 111.2 | % |
| Liabilities in Excess of Other Assets | | | (11.2 | )% |
| Total Net Assets | | | 100.0 | % |
See accompanying Notes to Financial Statements.
AXS Dynamic Opportunity Fund
SCHEDULE OF INVESTMENTS
As of September 30, 2023
| Number of Shares | | | | | Value | |
| | | | COMMON STOCKS — 43.2% | | | |
| | | | | ADVERTISING — 1.4% | | | | |
| | 10,000 | | | Trade Desk, Inc. - Class A* | | $ | 781,500 | |
| | | | | | | | | |
| | | | | AUTO PARTS & EQUIPMENT — 1.3% | | | | |
| | 12,000 | | | Allison Transmission Holdings, Inc. | | | 708,720 | |
| | | | | | | | | |
| | | | | COMMERCIAL SERVICES — 1.4% | | | | |
| | 2,500 | | | Quanta Services, Inc. | | | 467,675 | |
| | 650 | | | United Rentals, Inc. | | | 288,970 | |
| | | | | | | | 756,645 | |
| | | | | COMPUTERS — 1.6% | | | | |
| | 5,000 | | | Apple, Inc. | | | 856,050 | |
| | | | | | | | | |
| | | | | DIVERSIFIED FINANCIAL SERVICES — 1.3% | | | | |
| | 15,500 | | | FTAI Aviation Ltd. | | | 551,025 | |
| | 700 | | | Visa, Inc. - Class A | | | 161,007 | |
| | | | | | | | 712,032 | |
| | | | | ENGINEERING & CONSTRUCTION — 0.7% | | | | |
| | 1,500 | | | Comfort Systems USA, Inc. | | | 255,615 | |
| | 500 | | | EMCOR Group, Inc. | | | 105,195 | |
| | | | | | | | 360,810 | |
| | | | | ENTERTAINMENT — 1.1% | | | | |
| | 20,000 | | | DraftKings, Inc. - Class A* | | | 588,800 | |
| | | | | | | | | |
| | | | | INTERNET — 9.1% | | | | |
| | 12,000 | | | Alphabet, Inc. - Class A* | | | 1,570,320 | |
| | 12,000 | | | Amazon.com, Inc.* | | | 1,525,440 | |
| | 3,700 | | | Meta Platforms, Inc. - Class A* | | | 1,110,777 | |
| | 16,000 | | | Uber Technologies, Inc.* | | | 735,840 | |
| | | | | | | | 4,942,377 | |
| | | | | MACHINERY-CONSTRUCTION & MINING — 3.0% | | | | |
| | 4,000 | | | Caterpillar, Inc. | | | 1,092,000 | |
| | 14,700 | | | Vertiv Holdings Co. | | | 546,840 | |
| | | | | | | | 1,638,840 | |
| | | | | OIL & GAS — 4.1% | | | | |
| | 24,500 | | | Helmerich & Payne, Inc. | | | 1,032,920 | |
| | 3,500 | | | Pioneer Natural Resources Co. | | | 803,425 | |
| | 8,000 | | | Sunoco LP | | | 391,600 | |
| | | | | | | | 2,227,945 | |
AXS Dynamic Opportunity Fund
SCHEDULE OF INVESTMENTS - Continued
As of September 30, 2023
| Number of Shares | | | | | Value | |
| | | | COMMON STOCKS (Continued) | | | |
| | | | | OIL & GAS SERVICES — 4.6% | | | | |
| | 32,000 | | | Atlas Energy Solutions, Inc. - Class A | | $ | 711,360 | |
| | 30,000 | | | Oceaneering International, Inc.* | | | 771,600 | |
| | 14,000 | | | Tidewater, Inc.* | | | 994,980 | |
| | | | | | | | 2,477,940 | |
| | | | | RETAIL — 1.6% | | | | |
| | 2,000 | | | AutoNation, Inc.* | | | 302,800 | |
| | 1,500 | | | Lululemon Athletica, Inc.* | | | 578,415 | |
| | | | | | | | 881,215 | |
| | | | | SEMICONDUCTORS — 3.9% | | | | |
| | 7,800 | | | Advanced Micro Devices, Inc.* | | | 801,996 | |
| | 3,000 | | | NVIDIA Corp. | | | 1,304,970 | |
| | | | | | | | 2,106,966 | |
| | | | | SOFTWARE — 5.1% | | | | |
| | 1,000 | | | Fair Isaac Corp.* | | | 868,530 | |
| | 1,700 | | | Microsoft Corp. | | | 536,775 | |
| | 7,500 | | | Oracle Corp. | | | 794,400 | |
| | 1,000 | | | ServiceNow, Inc.* | | | 558,960 | |
| | | | | | | | 2,758,665 | |
| | | | | TELECOMMUNICATIONS — 1.5% | | | | |
| | 4,500 | | | Arista Networks, Inc.* | | | 827,685 | |
| | | | | | | | | |
| | | | | VENTURE CAPITAL — 1.5% | | | | |
| | 7,500 | | | Blackstone, Inc. | | | 803,550 | |
| | | | | TOTAL COMMON STOCKS | | | | |
| | | | | (Cost $18,260,274) | | | 23,429,740 | |
| Principal Amount | | | | | | |
| | | | | U.S. TREASURY BILLS — 5.4% | | | | |
| $ | 3,000,000 | | | United States Treasury Bill 0.000%, 3/14/2024 | | | 2,927,532 | |
| | | | | TOTAL U.S. TREASURY BILLS | | | | |
| | | | | (Cost $2,927,675) | | | 2,927,532 | |
AXS Dynamic Opportunity Fund
SCHEDULE OF INVESTMENTS - Continued
As of September 30, 2023
Number
of Contracts | | | | | Value | |
| | | | PURCHASED OPTIONS CONTRACTS — 0.7% | | | |
| | | | | CALL OPTIONS — 0.5% | | | | |
| | 350 | | | SPDR S&P 500 ETF Trust Exercise Price: $435, Notional Amount: $15,225,000, Expiration Date: November 17, 2023* | | $ | 257,950 | |
| | | | | TOTAL CALL OPTIONS | | | | |
| | | | | (Cost $319,815) | | | 257,950 | |
| | | | | PUT OPTIONS — 0.2% | | | | |
| | 150 | | | Amazon.com, Inc. Exercise Price: $125, Notional Amount: $1,875,000, Expiration Date: November 17, 2023* | | | 84,750 | |
| | 300 | | | DraftKings, Inc. Exercise Price: $28, Notional Amount: $840,000, Expiration Date: October 20, 2023* | | | 19,800 | |
| | | | | TOTAL PUT OPTIONS | | | | |
| | | | | (Cost $143,730) | | | 104,550 | |
| | | | | | | | | |
| | | | | TOTAL PURCHASED OPTIONS CONTRACTS | | | | |
| | | | | (Cost $463,545) | | | 362,500 | |
| Number of Shares | | | | | | |
| | | | | SHORT-TERM INVESTMENTS — 50.9% | | | | |
| | 25,692,116 | | | Fidelity Investments Money Market Government Portfolio - Class I, 5.16%1 | | | 25,692,116 | |
| | 1,912,013 | | | Goldman Sachs Financial Square Government Fund, 4.91%1 | | | 1,912,013 | |
| | | | | TOTAL SHORT-TERM INVESTMENTS | | | | |
| | | | | (Cost $27,604,129) | | | 27,604,129 | |
| | | | | | | | | |
| | | | | TOTAL INVESTMENTS — 100.2% | | | | |
| | | | | (Cost $49,255,623) | | | 54,323,901 | |
| | | | | | | | | |
| | | | | Liabilities in Excess of Other Assets — (0.2)% | | | (134,474 | ) |
| | | | | TOTAL NET ASSETS — 100.0% | | $ | 54,189,427 | |
LP – Limited Partnership
ETF – Exchange-Traded Fund
| * | Non-income producing security. |
| 1 | The rate is the annualized seven-day yield at period end. |
See accompanying Notes to Financial Statements.
AXS Dynamic Opportunity Fund
SUMMARY OF INVESTMENTS
As of September 30, 2023
| Security Type/Industry | | Percent of Total
Net Assets | |
| Common Stocks | | | | |
| Internet | | | 9.1 | % |
| Software | | | 5.1 | % |
| Oil & Gas Services | | | 4.6 | % |
| Oil & Gas | | | 4.1 | % |
| Semiconductors | | | 3.9 | % |
| Machinery-Construction & Mining | | | 3.0 | % |
| Computers | | | 1.6 | % |
| Retail | | | 1.6 | % |
| Venture Capital | | | 1.5 | % |
| Telecommunications | | | 1.5 | % |
| Commercial Services | | | 1.4 | % |
| Advertising | | | 1.4 | % |
| Auto Parts & Equipment | | | 1.3 | % |
| Diversified Financial Services | | | 1.3 | % |
| Entertainment | | | 1.1 | % |
| Engineering & Construction | | | 0.7 | % |
| Total Common Stocks | | | 43.2 | % |
| U.S. Treasury Bills | | | 5.4 | % |
| Purchased Options Contracts | | | 0.7 | % |
| Short-Term Investments | | | 50.9 | % |
| Total Investments | | | 100.2 | % |
| Liabilities in Excess of Other Assets | | | (0.2 | )% |
| Total Net Assets | | | 100.0 | % |
See accompanying Notes to Financial Statements.
AXS Tactical Income Fund
SCHEDULE OF INVESTMENTS
As of September 30, 2023
| Number of Shares | | | | | Value | |
| | | | COMMON STOCKS — 2.2% | | | |
| | | | | INVESTMENT COMPANIES — 1.5% | | | | |
| | 8,000 | | | Ares Capital Corp. | | $ | 155,760 | |
| | 10,000 | | | FS KKR Capital Corp. | | | 196,900 | |
| | 2,000 | | | Main Street Capital Corp. | | | 81,260 | |
| | 6,000 | | | Oaktree Specialty Lending Corp. | | | 120,720 | |
| | | | | | | | 554,640 | |
| | | | | REITS — 0.7% | | | | |
| | 15,000 | | | AGNC Investment Corp. - REIT | | | 141,600 | |
| | 5,000 | | | Starwood Property Trust, Inc. - REIT | | | 96,750 | |
| | | | | | | | 238,350 | |
| | | | | TOTAL COMMON STOCKS | | | | |
| | | | | (Cost $807,411) | | | 792,990 | |
| | | | | EXCHANGE-TRADED FUNDS — 88.2% | | | | |
| | 9,000 | | | Alerian MLP ETF | | | 379,800 | |
| | 69,000 | | | First Trust Preferred Securities and Income ETF | | | 1,101,930 | |
| | 30,000 | | | Invesco CEF Income Composite ETF | | | 513,000 | |
| | 70,000 | | | Invesco Senior Loan ETF | | | 1,469,300 | |
| | 14,000 | | | Invesco Taxable Municipal Bond ETF | | | 354,060 | |
| | 23,000 | | | iShares 1-3 Year Treasury Bond ETF | | | 1,862,310 | |
| | 13,000 | | | iShares 20+ Year Treasury Bond ETF | | | 1,152,970 | |
| | 72,000 | | | iShares Floating Rate Bond ETF | | | 3,664,080 | |
| | 5,500 | | | iShares iBoxx $ Investment Grade Corporate Bond ETF | | | 561,110 | |
| | 10,500 | | | iShares National Muni Bond ETF | | | 1,076,670 | |
| | 55,000 | | | iShares Preferred & Income Securities ETF | | | 1,658,250 | |
| | 72,000 | | | iShares Treasury Floating Rate Bond ETF | | | 3,653,280 | |
| | 35,000 | | | JPMorgan Alerian MLP Index ETN | | | 864,500 | |
| | 30,000 | | | ProShares Short 20+ Year Treasury | | | 754,500 | |
| | 87,000 | | | SPDR Blackstone Senior Loan ETF | | | 3,647,910 | |
| | 56,000 | | | SPDR Bloomberg 1-3 Month T-Bill ETF | | | 5,141,920 | |
| | 16,000 | | | SPDR Bloomberg Convertible Securities ETF | | | 1,084,800 | |
| | 7,500 | | | SPDR Bloomberg High Yield Bond ETF | | | 678,000 | |
| | 80,000 | | | VanEck BDC Income ETF | | | 1,282,400 | |
| | 38,000 | | | VanEck Emerging Markets High Yield Bond ETF | | | 677,160 | |
| | 11,000 | | | Vanguard Total International Bond ETF | | | 526,130 | |
| | 5,000 | | | Virtus InfraCap U.S. Preferred Stock ETF | | | 96,700 | |
| | | | | TOTAL EXCHANGE-TRADED FUNDS | | | | |
| | | | | (Cost $32,168,984) | | | 32,200,780 | |
| | | | | CLOSED-END FUNDS — 0.5% | | | | |
| | 13,495 | | | PIMCO Corporate & Income Opportunity Fund | | | 176,380 | |
| | | | | TOTAL CLOSED-END FUNDS | | | | |
| | | | | (Cost $186,125) | | | 176,380 | |
AXS Tactical Income Fund
SCHEDULE OF INVESTMENTS - Continued
As of September 30, 2023
| Number of Shares | | | | | Value | |
| | | | | SHORT-TERM INVESTMENTS — 29.0% | | | | |
| | 8,976,949 | | | Fidelity Investments Money Market Government Portfolio - Class I, 5.16%1 | | $ | 8,976,949 | |
| | 1,609,206 | | | Goldman Sachs Financial Square Government Fund, 4.91%1 | | | 1,609,206 | |
| | | | | TOTAL SHORT-TERM INVESTMENTS | | | | |
| | | | | (Cost $10,586,155) | | | 10,586,155 | |
| | | | | | | | | |
| | | | | TOTAL INVESTMENTS — 119.9% | | | | |
| | | | | (Cost $43,748,675) | | | 43,756,305 | |
| | | | | | | | | |
| | | | | Liabilities in Excess of Other Assets — (19.9)% | | | (7,254,586 | ) |
| | | | | TOTAL NET ASSETS — 100.0% | | $ | 36,501,719 | |
REIT – Real Estate Investment Trusts
ETF – Exchange-Traded Fund
ETN – Exchange Traded Note
BDC – Business Development Company
| 1 | The rate is the annualized seven-day yield at period end. |
See accompanying Notes to Financial Statements.
AXS Tactical Income Fund
SUMMARY OF INVESTMENTS
As of September 30, 2023
| Security Type/Industry | | Percent of Total
Net Assets | |
| Closed-End Funds | | | | |
| Unknown Bloomberg Industry Group | | | 0.5 | % |
| Total Closed-End Funds | | | 0.5 | % |
| Common Stocks | | | | |
| Investment Companies | | | 1.5 | % |
| REITS | | | 0.7 | % |
| Total Common Stocks | | | 2.2 | % |
| Exchange-Traded Funds | | | 88.2 | % |
| Short-Term Investments | | | 29.0 | % |
| Total Investments | | | 119.9 | % |
| Liabilities in Excess of Other Assets | | | (19.9 | )% |
| Total Net Assets | | | 100.0 | % |
See accompanying Notes to Financial Statements.
AXS Chesapeake Strategy Fund
CONSOLIDATED SCHEDULE OF INVESTMENTS
As of September 30, 2023
| Number of Shares | | | | | Value | |
| | | | | SHORT-TERM INVESTMENTS — 90.4% | | | | |
| | 37,145,900 | | | Fidelity Investments Money Market Government Portfolio - Class I, 5.16%1 | | $ | 37,145,900 | |
| Principal | | | | | | |
| Amount | | | | | | |
| $ | 11,818,393 | | | UMB Bank Demand Deposit, 0.01%1, 2 | | | 11,818,393 | |
| | | | | TOTAL SHORT-TERM INVESTMENTS | | | | |
| | | | | (Cost $48,964,293) | | | 48,964,293 | |
| | | | | | | | | |
| | | | | TOTAL INVESTMENTS — 90.4% | | | | |
| | | | | (Cost $48,964,293) | | | 48,964,293 | |
| | | | | Other Assets in Excess of Liabilities — 9.6% | | | 5,177,334 | |
| | | | | TOTAL NET ASSETS — 100.0% | | $ | 54,141,627 | |
| 1 | The rate is the annualized seven-day yield at period end. |
| 2 | All or a portion of this investment is a holding of AXS Chesapeake Strategy Fund Limited. |
See accompanying Notes to Consolidated Financial Statements.
AXS Chesapeake Strategy Fund
CONSOLIDATED SCHEDULE OF INVESTMENTS - Continued
As of September 30, 2023
FUTURES CONTRACTS
| | | | | | | | | | | Value/Unrealized | |
| | | Expiration | | Number of | | | Notional | | | Appreciation | |
| Long Contracts | | Date | | Contracts | | | Value* | | | (Depreciation) | |
| Commodity Futures | | | | | | | | | | | | | | |
| CBOT Oats1 | | December 2023 | | | 12 | | | | 296,994 | | | $ | (37,494 | ) |
| CBOT Rough Rice1 | | November 2023 | | | 11 | | | | 369,679 | | | | (19,659 | ) |
| CBOT Soybean1 | | November 2023 | | | 8 | | | | 558,775 | | | | (48,775 | ) |
| CME Live Cattle1 | | December 2023 | | | 41 | | | | 3,079,920 | | | | 2,050 | |
| CMX Silver1 | | December 2023 | | | 3 | | | | 354,450 | | | | (17,700 | ) |
| ICE Canola1 | | November 2023 | | | 30 | | | | 500,638 | | | | (56,275 | ) |
| LME Lead1 | | December 2023 | | | 17 | | | | 953,963 | | | | (31,288 | ) |
| LME Tin1 | | December 2023 | | | 4 | | | | 516,700 | | | | (38,320 | ) |
| MDE Crude Palm Oil1 | | November 2023 | | | 6 | | | | 576,000 | | | | (3,450 | ) |
| NYBOT Cocoa1 | | December 2023 | | | 4 | | | | 139,440 | | | | (2,720 | ) |
| NYBOT Cotton #21 | | December 2023 | | | 14 | | | | 615,963 | | | | (5,913 | ) |
| NYBOT Sugar #111 | | March 2024 | | | 101 | | | | 3,038,403 | | | | (42,985 | ) |
| NYMEX NY Harbor ULSD1 | | November 2023 | | | 10 | | | | 1,389,360 | | | | (3,108 | ) |
| NYMEX RBOB Gasoline1 | | November 2023 | | | 9 | | | | 1,001,236 | | | | (94,225 | ) |
| NYMEX WTI Crude Oil1 | | November 2023 | | | 27 | | | | 2,438,382 | | | | 12,948 | |
| SGX Iron Ore CFR China 62% FE Fines1 | | October 2023 | | | 65 | | | | 775,004 | | | | 2,460 | |
| | | | | | | | | | | | | | | |
| Currency Futures | | | | | | | | | | | | | | |
| Brazil Real | | November 2023 | | | 91 | | | | 1,843,269 | | | | (39,649 | ) |
| CME British Pound | | December 2023 | | | 36 | | | | 2,818,800 | | | | (71,550 | ) |
| CME Mexican Peso | | December 2023 | | | 67 | | | | 1,877,340 | | | | 22,780 | |
| Swedish Krona | | December 2023 | | | 20 | | | | 22,160,900 | | | | (39,256 | ) |
| | | | | | | | | | | | | | | |
| Index Futures | | | | | | | | | | | | | | |
| CAC 40 10 Euro | | October 2023 | | | 18 | | | | 1,312,740 | | | | (26,927 | ) |
| CBOT DJIA Index E-Mini | | December 2023 | | | 5 | | | | 873,500 | | | | (30,375 | ) |
| CME E-mini S&P 500 | | December 2023 | | | 11 | | | | 2,481,298 | | | | (102,273 | ) |
| CME E-mini S&P MidCap 400 | | December 2023 | | | 4 | | | | 1,040,770 | | | | (32,610 | ) |
| CME NASDAQ 100 E-Mini | | December 2023 | | | 8 | | | | 2,479,296 | | | | (100,656 | ) |
| EUX DAX Index | | December 2023 | | | 5 | | | | 1,995,563 | | | | (57,947 | ) |
| EUX Euro STOXX 50 | | December 2023 | | | 29 | | | | 1,241,635 | | | | (23,760 | ) |
| FTSE Taiwan | | October 2023 | | | 44 | | | | 2,472,800 | | | | 35,200 | |
| IBEX 35 | | October 2023 | | | 17 | | | | 1,606,840 | | | | (2,157 | ) |
| ICF FTSE 100 Index | | December 2023 | | | 11 | | | | 830,060 | | | | 16,776 | |
| MIL FTSE/MIB Index | | December 2023 | | | 14 | | | | 1,996,050 | | | | (17,169 | ) |
| MSCI EAFE E-Mini | | December 2023 | | | 10 | | | | 1,053,900 | | | | (33,150 | ) |
| SFE SPI 200 Index | | December 2023 | | | 11 | | | | 1,994,575 | | | | (29,528 | ) |
| SGX Nikkei 225 | | December 2023 | | | 24 | | | | 389,519,999 | | | | (36,536 | ) |
| Total Long Contracts | | | | | | | | | 456,204,242 | | | | (953,241 | ) |
| | | | | | | | | | | | | | | |
| Short Contracts | | | | | | | | | | | | | | |
| Commodity Futures | | | | | | | | | | | | | | |
| CBOT Corn1 | | December 2023 | | | (5 | ) | | | (119,500 | ) | | | 312 | |
| CBOT Wheat1 | | December 2023 | | | (21 | ) | | | (663,600 | ) | | | 95,025 | |
| CME Lean Hogs1 | | December 2023 | | | (16 | ) | | | (485,120 | ) | | | 25,760 | |
| Euronext Rapeseed1 | | November 2023 | | | (28 | ) | | | (616,350 | ) | | | (3,330 | ) |
| LME Primary Aluminum1 | | December 2023 | | | (12 | ) | | | (661,575 | ) | | | (44,175 | ) |
| LME Primary Nickel1 | | December 2023 | | | (4 | ) | | | (450,120 | ) | | | 2,256 | |
| LME Zinc1 | | December 2023 | | | (9 | ) | | | (563,681 | ) | | | (33,188 | ) |
| NYBOT Coffee 'C'1 | | December 2023 | | | (15 | ) | | | (889,875 | ) | | | 67,781 | |
| NYMEX Palladium1 | | December 2023 | | | (1 | ) | | | (126,350 | ) | | | 750 | |
| NYMEX Platinum1 | | January 2024 | | | (5 | ) | | | (233,425 | ) | | | 4,450 | |
| SAFEX Sunflower Seed1 | | December 2023 | | | (33 | ) | | | (14,556,160 | ) | | | (18,221 | ) |
| | | | | | | | | | | | | | | |
| Currency Futures | | | | | | | | | | | | | | |
| Canadian Dollar | | December 2023 | | | (40 | ) | | | (2,949,399 | ) | | | (4,000 | ) |
| CME Japanese Yen | | December 2023 | | | (46 | ) | | | (3,989,638 | ) | | | 92,575 | |
| New Zealand Dollar | | December 2023 | | | (25 | ) | | | (1,470,375 | ) | | | (30,000 | ) |
| | | | | | | | | | | | | | | |
| Index Futures | | | | | | | | | | | | | | |
| FTSE China A50 | | October 2023 | | | (95 | ) | | | (1,179,144 | ) | | | (17,666 | ) |
| | | | | | | | | | | | | | | |
| Interest Rate Futures | | | | | | | | | | | | | | |
| CBOT 2-Year U.S. Treasury Note | | December 2023 | | | (46 | ) | | | (9,360,641 | ) | | | 35,938 | |
| CBOT 5-Year U.S. Treasury Note | | December 2023 | | | (91 | ) | | | (9,672,305 | ) | | | 84,602 | |
| CBOT 10-Year U.S. Treasury Note | | December 2023 | | | (73 | ) | | | (8,016,313 | ) | | | 127,750 | |
| CBOT U.S. Long Bond | | December 2023 | | | (25 | ) | | | (2,963,476 | ) | | | 118,945 | |
| CBOT Ultra Long-Term U.S. Treasury Bond | | December 2023 | | | (13 | ) | | | (1,622,055 | ) | | | 79,117 | |
| EUX Euro-BTP Italian Government Bond | | December 2023 | | | (24 | ) | | | (2,636,880 | ) | | | 3,552 | |
| EUX Euro-Bund | | December 2023 | | | (41 | ) | | | (5,395,190 | ) | | | 127,868 | |
| EUX Euro-Buxl 30-Year Bond | | December 2023 | | | (8 | ) | | | (1,051,680 | ) | | | 76,964 | |
| ICF Long Gilt | | December 2023 | | | (34 | ) | | | (3,126,300 | ) | | | (91,679 | ) |
| MSE Canadian 10 Year Bond | | December 2023 | | | (34 | ) | | | (4,010,980 | ) | | | 71,089 | |
| SFE Australian 10 Year Bond | | December 2023 | | | (93 | ) | | | (10,680,899 | ) | | | 171,948 | |
| Total Short Contracts | | | | | | | | | (87,491,031 | ) | | | 944,423 | |
| | | | | | | | | | | | | | | |
| TOTAL FUTURES CONTRACTS | | | | | | | | | 368,713,211 | | | $ | (8,818 | ) |
| 1 | This investment is a holding of AXS Chesapeake Strategy Fund Limited. |
See accompanying Notes to Consolidated Financial Statements.
AXS Chesapeake Strategy Fund
CONSOLIDATED SUMMARY OF INVESTMENTS
As of September 30, 2023
| Security Type | | Percent of Total Net Assets | |
| Short-Term Investments | | | 90.4 | % |
| Total Investments | | | 90.4 | % |
| Other Assets in Excess of Liabilities | | | 9.6 | % |
| Total Net Assets | | | 100.0 | % |
See accompanying Notes to Consolidated Financial Statements.
AXS Funds
STATEMENTS OF ASSETS AND LIABILITIES
As of September 30, 2023
| | | | | | | | | Thomson Reuters | | | | |
| | | Multi-Strategy | | | Sustainable | | | Venture Capital Return | | | | |
| | | Alternatives Fund | | | Income Fund | | | Tracker Fund | | | Merger Fund | |
| Assets: | | | | | | | | | | | | | | | | |
| Investments, at value (cost $15,745,872, $3,326,965, $99,337,314, $30,741,149, respectively) | | $ | 16,102,257 | | | $ | 3,192,886 | | | $ | 108,706,706 | | | $ | 31,442,567 | |
| Foreign currency, at value (cost $0, $0, $0 and $21, respectively) | | | - | | | | - | | | | - | | | | 20 | |
| Purchased options contracts, at value (cost $0, $0, $0 and $0, respectively) | | | - | | | | - | | | | - | | | | - | |
| Cash | | | - | | | | - | | | | 144,824 | | | | 41,303 | |
| Cash deposited with brokers | | | - | | | | - | | | | - | | | | - | |
| Cash deposited with brokers for securities sold short | | | - | | | | - | | | | - | | | | 6,501,295 | |
| Unrealized appreciation on open swap contracts | | | 131,547 | | | | - | | | | - | | | | - | |
| Receivables: | | | | | | | | | | | | | | | | |
| Investment securities sold | | | 777,422 | | | | - | | | | - | | | | 430,188 | |
| Fund shares sold | | | 11,959 | | | | - | | | | 38,052 | | | | 255 | |
| Due from Advisor | | | - | | | | 2,370 | | | | - | | | | - | |
| Dividends and interest | | | 11,918 | | | | 35,162 | | | | 31,470 | | | | 65,306 | |
| Reclaims receivable | | | - | | | | - | | | | - | | | | - | |
| Prepaid expenses and other assets | | | 14,105 | | | | 8,974 | | | | 1,644 | | | | 21,211 | |
| Total assets | | | 17,049,208 | | | | 3,239,392 | | | | 108,922,696 | | | | 38,502,145 | |
| | | | | | | | | | | | | | | | | |
| Liabilities: | | | | | | | | | | | | | | | | |
| Foreign currency due to custodian, at value (proceeds $0, $0, $0 and $129,891, respectively) | | | - | | | | - | | | | - | | | | 127,556 | |
| Securities sold short, at value (proceeds $0, $0, $0 and $4,092,240, respectively) | | | - | | | | - | | | | - | | | | 4,413,156 | |
| Unrealized depreciation on open swap contracts | | | - | | | | - | | | | 3,693,720 | | | | - | |
| Payables: | | | | | | | | | | | | | | | | |
| Investment securities purchased | | | 1,197,844 | | | | - | | | | 44,560 | | | | 88,505 | |
| Fund shares redeemed | | | 16,221 | | | | - | | | | - | | | | - | |
| Due to Broker | | | - | | | | - | | | | - | | | | - | |
| Advisory fees | | | 965 | | | | - | | | | 62,852 | | | | 11,793 | |
| Distribution fees - Class A & Class D (Note 8) | | | - | | | | - | | | | - | | | | - | |
| Distribution fees - Class A & Class C (Note 8) | | | - | | | | - | | | | 10,844 | | | | - | |
| Distribution fees - Investor Class (Note 8) | | | 2,822 | | | | - | | | | - | | | | 180 | |
| Shareholder servicing fees (Note 7) | | | - | | | | - | | | | - | | | | - | |
| Dividends on securities sold short | | | - | | | | - | | | | - | | | | - | |
| Auditing fees | | | 18,974 | | | | 17,559 | | | | 22,502 | | | | 14,995 | |
| Fund accounting and administration fees | | | 8,688 | | | | 5,581 | | | | 33,115 | | | | 24,717 | |
| Sub-transfer agent fees and expenses | | | 8,644 | | | | 2,771 | | | | 22,847 | | | | 15,317 | |
| Trustees’ deferred compensation (Note 3) | | | 8,137 | | | | 4,815 | | | | 38,115 | | | | 10,137 | |
| Legal fees | | | 4,764 | | | | 4,120 | | | | 15,939 | | | | 11,416 | |
| Custody fees | | | 2,740 | | | | 4,833 | | | | 11,201 | | | | 12,644 | |
| Transfer agent fees and expenses | | | 2,671 | | | | 6,581 | | | | 16,172 | | | | 6,545 | |
| Trustees’ fees and expenses | | | 2,471 | | | | 3,776 | | | | 4,204 | | | | 8,959 | |
| Chief Compliance Officer fees | | | 934 | | | | 8,838 | | | | 3,265 | | | | 9,378 | |
| Shareholder reporting fees | | | 779 | | | | 1,098 | | | | 11,571 | | | | 6,244 | |
| Loan payable | | | - | | | | - | | | | - | | | | - | |
| Interest Expense | | | - | | | | - | | | | - | | | | - | |
| Registration fees | | | - | | | | - | | | | - | | | | - | |
| Accrued other expenses | | | 1,351 | | | | 1,184 | | | | 4,113 | | | | 3,995 | |
| Total liabilities | | | 1,278,005 | | | | 61,156 | | | | 3,995,020 | | | | 4,765,537 | |
| Commitments and contingencies (Note 3) | | | | | | | | | | | | | | | | |
| Net Assets | | $ | 15,771,203 | | | $ | 3,178,236 | | | $ | 104,927,676 | | | $ | 33,736,608 | |
See accompanying Notes to Financial Statements.
AXS Funds
STATEMENTS OF ASSETS AND LIABILITIES - Continued
As of September 30, 2023
| | | | | | | | | Thomson Reuters | | | | |
| | | Multi-Strategy | | | Sustainable | | | Venture Capital Return | | | | |
| | | Alternatives Fund | | | Income Fund | | | Tracker Fund | | | Merger Fund | |
| Components of Net Assets: | | | | | | | | | | | | | | | | |
| Paid-in capital (par value of $0.01 per share with an unlimited number of shares authorized) | | $ | 16,771,449 | | | $ | 3,899,357 | | | $ | 227,343,038 | | | $ | 31,825,132 | |
| Total distributable earnings (accumulated deficit) | | | (1,000,246 | ) | | | (721,121 | ) | | | (122,415,362 | ) | | | 1,911,476 | |
| Net Assets | | $ | 15,771,203 | | | $ | 3,178,236 | | | $ | 104,927,676 | | | $ | 33,736,608 | |
| | | | | | | | | | | | | | | | | |
| Maximum Offering Price per Share: | | | | | | | | | | | | | | | | |
| Class A Shares: | | | | | | | | | | | | | | | | |
| Net assets applicable to shares outstanding | | | | | | $ | - | | | $ | 32,896,832 | | | | | |
| Shares of beneficial interest issued and outstanding | | | | | | | - | | | | 2,086,680 | | | | | |
| Redemption price per share1 | | | | | | $ | - | | | $ | 15.77 | | | | | |
| Maximum sales charge (5.75% of offering price)2 | | | | | | | - | | | | 0.96 | | | | | |
| Maximum offering price to public | | | | | | $ | - | | | $ | 16.73 | | | | | |
| | | | | | | | | | | | | | | | | |
| Class C Shares: | | | | | | | | | | | | | | | | |
| Net assets applicable to shares outstanding | | | | | | | | | | $ | 4,114,689 | | | | | |
| Shares of beneficial interest issued and outstanding | | | | | | | | | | | 278,855 | | | | | |
| Redemption price per share1,3 | | | | | | | | | | $ | 14.76 | | | | | |
| | | | | | | | | | | | | | | | | |
| Investor Class Shares4: | | | | | | | | | | | | | | | | |
| Net assets applicable to shares outstanding | | $ | 10,880,899 | | | | | | | | | | | $ | 883,988 | |
| Shares of beneficial interest issued and outstanding | | | 1,086,715 | | | | | | | | | | | | 80,545 | |
| Redemption price per share1 | | $ | 10.01 | | | | | | | | | | | $ | 10.98 | |
| | | | | | | | | | | | | | | | | |
| Class I Shares: | | | | | | | | | | | | | | | | |
| Net assets applicable to shares outstanding | | $ | 4,890,304 | | | $ | 3,178,236 | | | $ | 67,916,155 | | | $ | 32,852,620 | |
| Shares of beneficial interest issued and outstanding | | | 484,175 | | | | 427,741 | | | | 4,238,229 | | | | 2,890,046 | |
| Redemption price per share1 | | $ | 10.10 | | | $ | 7.43 | | | $ | 16.02 | | | $ | 11.37 | |
| 1 | Redemptions made within 30 days of purchase may be assessed a redemption fee of 1.00%. The Multi-Strategy Alternatives Fund does not have redemption fees. |
| 2 | No sales charge applies on investments of $1 million or more. |
| 3 | A contingent deferred sales charge (“CDSC”) of 1.00% may be charged on purchases that are redeemed within 12 months of purchase. |
| 4 | Previously R-1 Class Shares for the Multi-Strategy Alternatives Fund. |
See accompanying Notes to Financial Statements.
AXS Funds
STATEMENTS OF ASSETS AND LIABILITIES – Continued
As of September 30, 2023
| | | Alternative | | | Market | | | Adaptive | | | Income Opportunities | |
| | | Value Fund | | | Neutral Fund | | | Plus Fund | | | Fund6 | |
| Assets: | | | | | | | | | | | | | | | | |
| Investments, at value (cost $16,176,329, $24,236,110, $24,557,021, $85,313,565, respectively) | | $ | 15,840,434 | | | $ | 22,890,202 | | | $ | 24,554,916 | | | $ | 75,249,764 | |
| Foreign currency, at value (cost $0, $0, $0 and $0, respectively) | | | - | | | | - | | | | - | | | | - | |
| Purchased options contracts, at value (cost $0, $0, $7,872,922 and $0, respectively) | | | - | | | | - | | | | 7,315,926 | | | | - | |
| Cash | | | 116,594 | | | | 169,085 | | | | - | | | | 150,000 | |
| Cash deposited with brokers | | | - | | | | - | | | | - | | | | - | |
| Cash deposited with brokers for securities sold short | | | - | | | | 11,682,370 | | | | - | | | | - | |
| Unrealized appreciation on open swap contracts | | | - | | | | - | | | | - | | | | - | |
| Receivables: | | | | | | | | | | | | | | | | |
| Investment securities sold | | | - | | | | - | | | | - | | | | 401,484 | |
| Fund shares sold | | | - | | | | 44,292 | | | | 30,168 | | | | - | |
| Due from Advisor | | | 2,847 | | | | - | | | | - | | | | - | |
| Dividends and interest | | | 20,471 | | | | 60,063 | | | | 37,742 | | | | 754,543 | |
| Reclaims receivable | | | - | | | | - | | | | - | | | | 177 | |
| Prepaid expenses and other assets | | | 3,568 | | | | 11,970 | | | | 18,691 | | | | 40,780 | |
| Total assets | | | 15,983,914 | | | | 34,857,982 | | | | 31,957,443 | | | | 76,596,748 | |
| | | | | | | | | | | | | | | | | |
| Liabilities: | | | | | | | | | | | | | | | | |
| Foreign currency due to custodian, at value (proceeds $0, $0, $0 and $0, respectively) | | | - | | | | - | | | | - | | | | - | |
| Securities sold short, at value (proceeds $0, $17,825,946, $0 and $0, respectively) | | | - | | | | 16,032,088 | | | | - | | | | - | |
| Unrealized depreciation on open swap contracts | | | - | | | | - | | | | - | | | | - | |
| Payables: | | | | | | | | | | | | | | | | |
| Investment securities purchased | | | - | | | | - | | | | - | | | | - | |
| Fund shares redeemed | | | 250 | | | | - | | | | 491,933 | | | | 36,938 | |
| Due to Broker | | | - | | | | 8,730 | | | | - | | | | 841,841 | |
| Advisory fees | | | - | | | | 3,770 | | | | 31,297 | | | | 13,942 | |
| Distribution fees - Class A & Class D (Note 8) | | | - | | | | - | | | | - | | | | 8,361 | |
| Distribution fees - Class A & Class C (Note 8) | | | - | | | | - | | | | - | | | | - | |
| Distribution fees - Investor Class (Note 8) | | | 397 | | | | 222 | | | | - | | | | - | |
| Shareholder servicing fees (Note 7) | | | - | | | | - | | | | - | | | | - | |
| Dividends on securities sold short | | | - | | | | 35,006 | | | | - | | | | - | |
| Auditing fees | | | 14,992 | | | | 14,992 | | | | 16,947 | | | | 26,700 | |
| Fund accounting and administration fees | | | 8,489 | | | | 7,877 | | | | 7,780 | | | | 28,304 | |
| Sub-transfer agent fees and expenses | | | 1,691 | | | | 5,132 | | | | 1,409 | | | | 2,638 | |
| Trustees’ deferred compensation (Note 3) | | | 2,937 | | | | 3,473 | | | | 2,165 | | | | 8,982 | |
| Legal fees | | | 1,556 | | | | 4,198 | | | | 4,540 | | | | 16,203 | |
| Custody fees | | | 1,748 | | | | 6,082 | | | | 3,236 | | | | 2,959 | |
| Transfer agent fees and expenses | | | 1,283 | | | | 1,823 | | | | 2,941 | | | | 12,268 | |
| Trustees’ fees and expenses | | | 320 | | | | 2,141 | | | | 1,256 | | | | 2,827 | |
| Chief Compliance Officer fees | | | 1,282 | | | | 2,296 | | | | 2,086 | | | | 2,974 | |
| Shareholder reporting fees | | | 384 | | | | 1,738 | | | | 1,301 | | | | 9,369 | |
| Loan payable | | | 2,470,948 | | | | - | | | | - | | | | 7,889,372 | |
| Interest Expense | | | 12,151 | | | | - | | | | - | | | | 40,608 | |
| Registration fees | | | - | | | | - | | | | - | | | | - | |
| Accrued other expenses | | | 1,204 | | | | 3,131 | | | | 7,430 | | | | 7,484 | |
| Total liabilities | | | 2,519,632 | | | | 16,132,699 | | | | 574,321 | | | | 8,951,770 | |
| Commitments and contingencies (Note 3) | | | | | | | | | | | | | | | | |
| Net Assets | | $ | 13,464,282 | | | $ | 18,725,283 | | | $ | 31,383,122 | | | $ | 67,644,978 | |
See accompanying Notes to Financial Statements.
AXS Funds
STATEMENTS OF ASSETS AND LIABILITIES - Continued
As of September 30, 2023
| | | Alternative | | | Market | | �� | Adaptive | | | Income Opportunities | |
| | | Value Fund | | | Neutral Fund | | | Plus Fund | | | Fund6 | |
| Components of Net Assets: | | | | | | | | | | | | | | | | |
| Paid-in capital (par value of $0.01 per share with an unlimited number of shares authorized) | | $ | 14,163,445 | | | $ | 22,252,841 | | | $ | 32,541,277 | | | $ | 126,805,182 | |
| Total distributable earnings (accumulated deficit) | | | (699,163 | ) | | | (3,527,558 | ) | | | (1,158,155 | ) | | | (59,160,204 | ) |
| Net Assets | | $ | 13,464,282 | | | $ | 18,725,283 | | | $ | 31,383,122 | | | $ | 67,644,978 | |
| | | | | | | | | | | | | | | | | |
| Maximum Offering Price per Share: | | | | | | | | | | | | | | | | |
| Investor Class Shares: | | | | | | | | | | | | | | | | |
| Net assets applicable to shares outstanding | | $ | 1,821,806 | | | $ | 1,070,140 | | | | | | | | | |
| Shares of beneficial interest issued and outstanding | | | 165,689 | | | | 89,346 | | | | | | | | | |
| Redemption price per share7 | | $ | 11.00 | | | $ | 11.98 | | | | | | | | | |
| | | | | | | | | | | | | | | | | |
| Class A Shares: | | | | | | | | | | | | | | | | |
| Net assets applicable to shares outstanding | | | | | | | | | | | | | | $ | 2,333,596 | |
| Shares of beneficial interest issued and outstanding | | | | | | | | | | | | | | | 162,297 | |
| Redemption price per share | | | | | | | | | | | | | | $ | 14.38 | |
| Maximum sales charge (5.75% of offering price) | | | | | | | | | | | | | | | 0.88 | |
| Maximum offering price to public | | | | | | | | | | | | | | $ | 15.26 | |
| | | | | | | | | | | | | | | | | |
| Class D Shares: | | | | | | | | | | | | | | | | |
| Net assets applicable to shares outstanding | | | | | | | | | | | | | | $ | 5,672,964 | |
| Shares of beneficial interest issued and outstanding | | | | | | | | | | | | | | | 403,442 | |
| Redemption price per share | | | | | | | | | | | | | | $ | 14.06 | |
| | | | | | | | | | | | | | | | | |
| Class I Shares: | | | | | | | | | | | | | | | | |
| Net assets applicable to shares outstanding | | $ | 11,642,476 | | | $ | 17,655,143 | | | $ | 31,383,122 | | | $ | 59,638,418 | |
| Shares of beneficial interest issued and outstanding | | | 1,059,339 | | | | 1,434,967 | | | | 3,164,359 | | | | 4,134,047 | |
| Redemption price per share7 | | $ | 10.99 | | | $ | 12.30 | | | $ | 9.92 | | | $ | 14.43 | |
| 6 | Fiscal year end changed to September 30, effective September 1, 2023. |
| 7 | Redemptions made within 30 days of purchase may be assessed a redemption fee of 1.00%. The Adaptive Plus Fund and Income Opportunities Fund do not have redemption fees. |
See accompanying Notes to Financial Statements.
AXS Funds
STATEMENTS OF ASSETS AND LIABILITIES - Continued
As of September 30, 2023
| | | Dynamic Opportunity | | | Tactical Income | |
| | | Fund8 | | | Fund8 | |
| Assets: | | | | | | | | |
| Investments, at value (cost $48,792,078 and $43,748,675, respectively) | | $ | 53,961,401 | | | $ | 43,756,305 | |
| Foreign currency, at value (cost $0 and $0, respectively) | | | - | | | | - | |
| Purchased options contracts, at value (cost $463,545 and $0, respectively) | | | 362,500 | | | | - | |
| Cash | | | 3,230 | | | | 16,831 | |
| Cash deposited with brokers | | | 799,644 | | | | 25,097 | |
| Cash deposited with brokers for securities sold short | | | - | | | | - | |
| Unrealized appreciation on open swap contracts | | | - | | | | - | |
| Receivables: | | | | | | | | |
| Investment securities sold | | | 724,420 | | | | 204,881 | |
| Fund shares sold | | | - | | | | - | |
| Due from Advisor | | | - | | | | - | |
| Dividends and interest | | | 95,105 | | | | 64,164 | |
| Reclaims receivable | | | - | | | | - | |
| Prepaid expenses | | | 40,266 | | | | 19,417 | |
| Total assets | | | 55,986,566 | | | | 44,086,695 | |
| | | | | | | | | |
| Liabilities: | | | | | | | | |
| Foreign currency due to custodian, at value (proceeds $0 and $0, respectively) | | | - | | | | - | |
| Securities sold short, at value (proceeds $0 and $0, respectively) | | | - | | | | - | |
| Unrealized depreciation on open swap contracts | | | - | | | | - | |
| Payables: | | | | | | | | |
| Investment securities purchased | | | 1,706,638 | | | | 7,497,860 | |
| Fund shares redeemed | | | 10,000 | | | | 14,046 | |
| Due to Broker | | | - | | | | - | |
| Advisory fees | | | 27,543 | | | | 17,335 | |
| Distribution fees - Class A & Class D (Note 8) | | | - | | | | - | |
| Distribution fees - Class A & Class C (Note 8) | | | 919 | | | | 1,091 | |
| Distribution fees - Investor Class (Note 8) | | | - | | | | - | |
| Shareholder servicing fees (Note 7) | | | 15,844 | | | | 8,657 | |
| Dividends on securities sold short | | | - | | | | - | |
| Auditing fees | | | 17,218 | | | | 17,219 | |
| Fund accounting and administration fees | | | 866 | | | | 804 | |
| Sub-transfer agent fees and expenses | | | 317 | | | | 151 | |
| Trustees’ deferred compensation (Note 3) | | | 1,248 | | | | 861 | |
| Legal fees | | | 2,923 | | | | 4,116 | |
| Custody fees | | | 3,171 | | | | 3,071 | |
| Transfer agent fees and expenses | | | 6,050 | | | | 7,185 | |
| Trustees’ fees and expenses | | | 2,150 | | | | 2,468 | |
| Chief Compliance Officer fees | | | 275 | | | | 1,468 | |
| Shareholder reporting fees | | | 10 | | | | 4,122 | |
| Loan payable | | | - | | | | - | |
| Interest Expense | | | - | | | | - | |
| Registration fees | | | - | | | | 1,940 | |
| Accrued other expenses | | | 1,967 | | | | 2,582 | |
| Total liabilities | | | 1,797,139 | | | | 7,584,976 | |
| Commitments and contingencies (Note 3) | | | | | | | | |
| Net Assets | | $ | 54,189,427 | | | $ | 36,501,719 | |
See accompanying Notes to Financial Statements.
AXS Funds
STATEMENTS OF ASSETS AND LIABILITIES - Continued
As of September 30, 2023
| | | Dynamic Opportunity | | | Tactical Income | |
| | | Fund8 | | | Fund8 | |
| Components of Net Assets: | | | | | | | | |
| Paid-in capital (par value of $0.01 per share with an unlimited number of shares authorized) | | $ | 50,675,675 | | | $ | 45,630,663 | |
| Total distributable earnings (accumulated deficit) | | | 3,513,752 | | | | (9,128,944 | ) |
| Net Assets | | $ | 54,189,427 | | | $ | 36,501,719 | |
| | | | | | | | | |
| Maximum Offering Price per Share: | | | | | | | | |
| Class A Shares: | | | | | | | | |
| Net assets applicable to shares outstanding | | $ | 1,787,659 | | | $ | 1,653,473 | |
| Shares of beneficial interest issued and outstanding | | | 106,866 | | | | 189,946 | |
| Redemption price per share9 | | $ | 16.73 | | | $ | 8.70 | |
| Maximum sales charge (5.75% of offering price)10 | | | 1.02 | | | | 0.53 | |
| Maximum offering price to public | | $ | 17.75 | | | $ | 9.23 | |
| | | | | | | | | |
| Class I Shares: | | | | | | | | |
| Net assets applicable to shares outstanding | | $ | 52,401,768 | | | $ | 34,848,246 | |
| Shares of beneficial interest issued and outstanding | | | 3,070,296 | | | | 4,003,317 | |
| Redemption price per share9 | | $ | 17.07 | | | $ | 8.70 | |
| 8 | Fiscal year end changed to September 30, effective July 1, 2023. |
| 9 | Redemptions made within 30 days of purchase may be assessed a redemption fee of 1.00%. |
| 10 | There are no sales charges on investments of $1 million or more. On sales of $25,000 or more, the sales charge will be reduced. |
See accompanying Notes to Financial Statements.
AXS Chesapeake Strategy Fund
CONSOLIDATED STATEMENT OF ASSETS AND LIABILITIES
As of September 30, 2023
| Assets: | | | | |
| Investments, at value (cost $48,964,293) | �� | $ | 48,964,293 | |
| Cash | | | 20,043 | |
| Cash deposited with brokers for open futures contracts | | | 5,193,671 | |
| Receivables: | | | | |
| Dividends and interest | | | 161,408 | |
| Fund shares sold | | | 201 | |
| Prepaid expenses and other assets | | | 8,931 | |
| Total assets | | | 54,348,547 | |
| | | | | |
| Liabilities: | | | | |
| Variation margin on futures contracts | | | 8,818 | |
| Payables: | | | | |
| Advisory fees | | | 52,421 | |
| Fund administration and accounting fees | | | 34,967 | |
| Trustees’ deferred compensation (Note 3) | | | 24,554 | |
| Auditing fees | | | 22,439 | |
| Legal fees | | | 13,505 | |
| Sub-transfer agent fees and expenses | | | 8,089 | |
| Transfer agent fees and expenses | | | 7,562 | |
| Shareholder reporting fees | | | 7,123 | |
| Distribution fees - Class A & Class C (Note 8) | | | 5,607 | |
| Custody fees | | | 4,742 | |
| Fund shares redeemed | | | 4,657 | |
| Chief Compliance Officer fees | | | 4,078 | |
| Trustees’ fees and expenses | | | 1,199 | |
| Accrued other expenses | | | 7,159 | |
| Total liabilities | | | 206,920 | |
| Commitments and contingencies (Note 3) | | | | |
| Net Assets | | $ | 54,141,627 | |
| | | | | |
| Components of Net Assets: | | | | |
| Paid-in capital (par value of $0.01 per share with an unlimited number of shares authorized) | | $ | 73,597,972 | |
| Total distributable earnings (accumulated deficit) | | | (19,456,345 | ) |
| Net Assets | | $ | 54,141,627 | |
| | | | | |
| Maximum Offering Price per Share: | | | | |
| Class A Shares: | | | | |
| Net assets applicable to shares outstanding | | $ | 7,962,741 | |
| Shares of beneficial interest issued and outstanding | | | 648,108 | |
| Redemption price per share1 | | $ | 12.29 | |
| Maximum sales charge (5.75% of offering price)2 | | | 0.75 | |
| Maximum offering price to public | | $ | 13.04 | |
| | | | | |
| Class C Shares: | | | | |
| Net assets applicable to shares outstanding | | $ | 4,496,140 | |
| Shares of beneficial interest issued and outstanding | | | 347,786 | |
| Redemption price per share1,3 | | $ | 12.93 | |
| | | | | |
| Class I Shares: | | | | |
| Net assets applicable to shares outstanding | | $ | 41,682,746 | |
| Shares of beneficial interest issued and outstanding | | | 3,346,722 | |
| Redemption price per share1 | | $ | 12.45 | |
| 1 | Redemptions made within 30 days of purchase may be assessed a redemption fee of 1.00%. |
| 2 | No sales charge applies on investments of $1 million or more. |
| 3 | A contingent deferred sales charge (“CDSC”) of 1.00% may be charged on purchases that are redeemed within 12 months of purchase. |
See accompanying Notes to Consolidated Financial Statements.
AXS Funds
STATEMENTS OF OPERATIONS
For the Periods Ended September 30, 2023
| | | | | | | | | Thomson Reuters | | | | |
| | | Multi-Strategy | | | Sustainable | | | Venture Capital Return | | | | |
| | | Alternatives Fund | | | Income Fund | | | Tracker Fund | | | Merger Fund | |
| Investment Income: | | | | | | | | | | | | | | | | |
| Dividends (net of foreign withholding taxes of $1,245, $0, $0 and $328, respectively) | | $ | 298,547 | | | $ | 2,733 | | | $ | 1,040,156 | | | $ | 288,637 | |
| Interest | | | 130,143 | | | | 121,896 | | | | 224 | | | | 865,837 | |
| Total investment income | | | 428,690 | | | | 124,629 | | | | 1,040,380 | | | | 1,154,474 | |
| | | | | | | | | | | | | | | | | |
| Expenses: | | | | | | | | | | | | | | | | |
| Advisory fees | | | 181,699 | | | | 15,918 | | | | 1,377,006 | | | | 491,526 | |
| Fund accounting and administration fees | | | 63,340 | | | | 14,424 | | | | 164,636 | | | | 97,972 | |
| Registration fees | | | 33,184 | | | | 23,064 | | | | 94,574 | | | | 35,970 | |
| Distribution fees - Investor Class (Note 8) | | | 31,192 | | | | - | | | | - | | | | 2,543 | |
| Sub-transfer agent fees and expenses | | | 23,765 | | | | - | | | | 49,551 | | | | 34,677 | |
| Transfer agent fees and expenses | | | 21,177 | | | | 1,829 | | | | 64,695 | | | | 25,256 | |
| Auditing fees | | | 19,911 | | | | 18,498 | | | | 24,689 | | | | 15,493 | |
| Custody fees | | | 16,253 | | | | 7,294 | | | | 26,194 | | | | 13,491 | |
| Shareholder reporting fees | | | 11,803 | | | | 3,258 | | | | 19,093 | | | | 10,952 | |
| Legal fees | | | 11,460 | | | | 2,771 | | | | 38,830 | | | | 23,266 | |
| Trustees’ fees and expenses | | | 7,001 | | | | 4,568 | | | | 16,274 | | | | 15,088 | |
| Miscellaneous | | | 4,530 | | | | 1,529 | | | | 732 | | | | 4,038 | |
| Chief Compliance Officer fees | | | 1,754 | | | | 12,968 | | | | 8,199 | | | | 20,057 | |
| Insurance fees | | | 1,309 | | | | 1,326 | | | | 11,107 | | | | 4,792 | |
| Shareholder servicing fees (Note 7) | | | - | | | | - | | | | - | | | | - | |
| Interest expense | | | - | | | | - | | | | - | | | | 24,027 | |
| Dividends on securities sold short | | | - | | | | - | | | | - | | | | 100,364 | |
| Distribution fees - Class A (Note 8) | | | - | | | | - | | | | 87,763 | | | | - | |
| Distribution fees - Class C (Note 8) | | | - | | | | - | | | | 43,076 | | | | - | |
| Distribution fees - Class D (Note 8) | | | - | | | | - | | | | - | | | | - | |
| Total expenses | | | 428,378 | | | | 107,447 | | | | 2,026,419 | | | | 919,512 | |
| Advisory fees waived | | | (132,804 | ) | | | (15,918 | ) | | | (243,172 | ) | | | (202,747 | ) |
| Other expenses absorbed | | | - | | | | (69,021 | ) | | | - | | | | - | |
| Fees paid indirectly (Note 3) | | | - | | | | - | | | | - | | | | - | |
| Net expenses | | | 295,574 | | | | 22,508 | | | | 1,783,247 | | | | 716,765 | |
| Net investment income (loss) | | | 133,116 | | | | 102,121 | | | | (742,867 | ) | | | 437,709 | |
| | | | | | | | | | | | | | | | | |
| Realized and Unrealized Gain (Loss): | | | | | | | | | | | | | | | | |
| Net realized gain (loss) on: | | | | | | | | | | | | | | | | |
| Investments | | | 203,909 | | | | (113,775 | ) | | | (14,572,523 | ) | | | 877,803 | |
| Purchased options contracts | | | - | | | | - | | | | - | | | | (2,640 | ) |
| Foreign currency transactions | | | - | | | | - | | | | - | | | | 67,432 | |
| Securities sold short | | | - | | | | - | | | | - | | | | 910,452 | |
| Written options contracts | | | - | | | | - | | | | - | | | | 986 | |
| Swap contracts | | | (247,756 | ) | | | - | | | | 925,787 | | | | - | |
| Net realized gain (loss) | | | (43,847 | ) | | | (113,775 | ) | | | (13,646,736 | ) | | | 1,854,033 | |
| Capital gain distribution from portfolio funds | | | - | | | | - | | | | - | | | | - | |
| Net change in unrealized appreciation (depreciation) on: | | | | | | | | | | | | | | | | |
| Investments | | | 2,147,686 | | | | 44,780 | | | | 43,506,634 | | | | 1,954,213 | |
| Purchased options contracts | | | - | | | | - | | | | - | | | | - | |
| Foreign currency transactions | | | - | | | | - | | | | - | | | | (78,337 | ) |
| Securities sold short | | | - | | | | - | | | | - | | | | (1,441,077 | ) |
| Written options contracts | | | - | | | | - | | | | - | | | | - | |
| Swap contracts | | | (83,645 | ) | | | - | | | | 1,855,070 | | | | - | |
| Net change in unrealized appreciation (depreciation) | | | 2,064,041 | | | | 44,780 | | | | 45,361,704 | | | | 434,799 | |
| Net increase from payment by affiliates (Note 3) | | | - | | | | - | | | | - | | | | - | |
| Net realized and unrealized gain (loss) | | | 2,020,194 | | | | (68,995 | ) | | | 31,714,968 | | | | 2,288,832 | |
| Net Increase (Decrease) in Net Assets from Operations | | $ | 2,153,310 | | | $ | 33,126 | | | $ | 30,972,101 | | | $ | 2,726,541 | |
See accompanying Notes to Financial Statements.
AXS Funds
STATEMENTS OF OPERATIONS - Continued
For the Periods Ended September 30, 2023
| | | Alternative | | | Market | | | Adaptive | |
| | | Value Fund | | | Neutral Fund | | | Plus Fund | |
| Investment Income: | | | | | | | | | | | | |
| Dividends (net of foreign withholding taxes of $0, $0 and $0, respectively) | | $ | 597,689 | | | $ | 673,462 | | | $ | - | |
| Interest | | | 40 | | | | 413,982 | | | | 773,127 | |
| Total investment income | | | 597,729 | | | | 1,087,444 | | | | 773,127 | |
| | | | | | | | | | | | | |
| Expenses: | | | | | | | | | | | | |
| Advisory fees | | | 142,151 | | | | 326,747 | | | | 321,916 | |
| Fund accounting and administration fees | | | 63,679 | | | | 67,114 | | | | 43,691 | |
| Registration fees | | | 29,153 | | | | 38,785 | | | | 36,499 | |
| Distribution fees - Investor Class (Note 8) | | | 7,076 | | | | 4,868 | | | | - | |
| Sub-transfer agent fees and expenses | | | 23,194 | | | | 28,804 | | | | 19,843 | |
| Transfer agent fees and expenses | | | 11,623 | | | | 13,717 | | | | 9,038 | |
| Auditing fees | | | 15,492 | | | | 15,492 | | | | 14,447 | |
| Custody fees | | | 6,754 | | | | 5,955 | | | | 6,500 | |
| Shareholder reporting fees | | | 5,933 | | | | 6,077 | | | | 9,114 | |
| Legal fees | | | 7,838 | | | | 5,938 | | | | 9,932 | |
| Trustees’ fees and expenses | | | 4,749 | | | | 6,502 | | | | 7,209 | |
| Miscellaneous | | | 1,820 | | | | 1,922 | | | | 12,465 | |
| Chief Compliance Officer fees | | | 11,617 | | | | 7,106 | | | | 4,062 | |
| Insurance fees | | | 1,903 | | | | 3,055 | | | | 780 | |
| Shareholder servicing fees (Note 7) | | | - | | | | - | | | | - | |
| Interest expense | | | 345,689 | | | | - | | | | - | |
| Dividends on securities sold short | | | - | | | | 524,986 | | | | - | |
| Distribution fees - Class A (Note 8) | | | - | | | | - | | | | - | |
| Distribution fees - Class C (Note 8) | | | - | | | | - | | | | - | |
| Distribution fees - Class D (Note 8) | | | - | | | | - | | | | - | |
| Total expenses | | | 678,671 | | | | 1,057,068 | | | | 495,496 | |
| Advisory fees waived | | | (139,882 | ) | | | (188,797 | ) | | | (68,537 | ) |
| Other expenses absorbed | | | - | | | | - | | | | - | |
| Fees paid indirectly (Note 3) | | | - | | | | - | | | | - | |
| Net expenses | | | 538,789 | | | | 868,271 | | | | 426,959 | |
| Net investment income (loss) | | | 58,940 | | | | 219,173 | | | | 346,168 | |
| | | | | | | | | | | | | |
| Realized and Unrealized Gain (Loss): | | | | | | | | | | | | |
| Net realized gain (loss) on: | | | | | | | | | | | | |
| Investments | | | (194,694 | ) | | | 2,316,451 | | | | - | |
| Purchased options contracts | | | - | | | | - | | | | (891,614 | ) |
| Foreign currency transactions | | | - | | | | - | | | | - | |
| Securities sold short | | | - | | | | (1,221,815 | ) | | | - | |
| Written options contracts | | | - | | | | - | | | | - | |
| Swap contracts | | | - | | | | - | | | | - | |
| Net realized gain (loss) | | | (194,694 | ) | | | 1,094,636 | | | | (891,614 | ) |
| Capital gain distribution from portfolio funds | | | - | | | | - | | | | - | |
| Net change in unrealized appreciation (depreciation) on: | | | | | | | | | | | | |
| Investments | | | 1,659,525 | | | | (783,776 | ) | | | (2,105 | ) |
| Purchased options contracts | | | - | | | | - | | | | (705,708 | ) |
| Foreign currency transactions | | | - | | | | - | | | | - | |
| Securities sold short | | | - | | | | (154,315 | ) | | | - | |
| Written options contracts | | | - | | | | - | | | | - | |
| Swap contracts | | | - | | | | - | | | | - | |
| Net change in unrealized appreciation (depreciation) | | | 1,659,525 | | | | (938,091 | ) | | | (707,813 | ) |
| Net increase from payment by affiliates (Note 3) | | | - | | | | - | | | | 389 | |
| Net realized and unrealized gain (loss) | | | 1,464,831 | | | | 156,545 | | | | (1,599,038 | ) |
| Net Increase (Decrease) in Net Assets from Operations | | $ | 1,523,771 | | | $ | 375,718 | | | $ | (1,252,870 | ) |
See accompanying Notes to Financial Statements.
AXS Funds
STATEMENTS OF OPERATIONS - Continued
For the Periods Ended September 30, 2023
| | | Income Opportunities Fund | | | Dynamic Opportunity Fund | |
| | | For the | | | | | | For the | | | | |
| | | Period Ended | | | For the Year Ended | | | Period Ended | | | For the Year Ended | |
| | | September 30, 20231 | | | August 31, 2023 | | | September 30, 20232 | | | December 31, 2022 | |
| Investment Income: | | | | | | | | | | | | | | | | |
| Dividends (net of foreign withholding taxes of $0, $0, $0 and $59,630, respectively) | | $ | 746,272 | | | $ | 5,312,456 | | | $ | 143,614 | | | $ | 429,044 | |
| Interest | | | 9,540 | | | | 94,935 | | | | 1,175,753 | | | | 770,392 | |
| Total investment income | | | 755,812 | | | | 5,407,391 | | | | 1,319,367 | | | | 1,199,436 | |
| | | | | | | | | | | | | | | | | |
| Expenses: | | | | | | | | | | | | | | | | |
| Advisory fees | | | 57,085 | | | | 964,350 | | | | 614,998 | | | | 1,089,572 | |
| Fund accounting and administration fees | | | 12,837 | | | | 195,569 | | | | 87,465 | | | | 146,453 | |
| Registration fees | | | 4,836 | | | | 55,009 | | | | 24,845 | | | | 43,050 | |
| Distribution fees - Investor Class (Note 8) | | | - | | | | - | | | | - | | | | - | |
| Sub-transfer agent fees and expenses | | | 8,556 | | | | 103,347 | | | | 25,642 | | | | - | |
| Transfer agent fees and expenses | | | 5,000 | | | | 24,992 | | | | 24,444 | | | | 39,250 | |
| Auditing fees | | | 11,200 | | | | 16,000 | | | | 18,968 | | | | 16,501 | |
| Custody fees | | | 1,737 | | | | 15,912 | | | | 4,509 | | | | 9,485 | |
| Shareholder reporting fees | | | 1,475 | | | | 11,068 | | | | 6,404 | | | | 12,622 | |
| Legal fees | | | 2,828 | | | | 39,167 | | | | 12,159 | | | | 15,249 | |
| Trustees’ fees and expenses | | | 951 | | | | 16,119 | | | | 13,064 | | | | 14,752 | |
| Miscellaneous | | | 413 | | | | 5,921 | | | | 5,847 | | | | 6,515 | |
| Chief Compliance Officer fees | | | 664 | | | | 13,388 | | | | 7,939 | | | | 14,858 | |
| Insurance fees | | | 646 | | | | 6,849 | | | | 1,904 | | | | 3,915 | |
| Shareholder servicing fees (Note 7) | | | - | | | | - | | | | 27,558 | | | | 79,116 | |
| Interest expense | | | 45,901 | | | | 555,216 | | | | - | | | | 7,487 | |
| Dividends on securities sold short | | | - | | | | - | | | | 34,822 | | | | 70,316 | |
| Distribution fees - Class A (Note 8) | | | 491 | | | | 6,758 | | | | 3,684 | | | | 6,662 | |
| Distribution fees - Class C (Note 8) | | | - | | | | - | | | | - | | | | - | |
| Distribution fees - Class D (Note 8) | | | 4,771 | | | | 59,684 | | | | - | | | | - | |
| Total expenses | | | 159,391 | | | | 2,089,349 | | | | 914,252 | | | | 1,575,803 | |
| Advisory fees waived | | | (28,256 | ) | | | (117,609 | ) | | | - | | | | - | |
| Other expenses absorbed | | | - | | | | - | | | | - | | | | - | |
| Fees paid indirectly (Note 3) | | | - | | | | - | | | | - | | | | - | |
| Net expenses | | | 131,135 | | | | 1,971,740 | | | | 914,252 | | | | 1,575,803 | |
| Net investment income (loss) | | | 624,677 | | | | 3,435,651 | | | | 405,115 | | | | (376,367 | ) |
| | | | | | | | | | | | | | | | | |
| Realized and Unrealized Gain (Loss): | | | | | | | | | | | | | | | | |
| Net realized gain (loss) on: | | | | | | | | | | | | | | | | |
| Investments | | | (321,108 | ) | | | (9,811,144 | ) | | | 3,316,621 | | | | 5,215,566 | |
| Purchased options contracts | | | - | | | | - | | | | (2,641,220 | ) | | | - | |
| Foreign currency transactions | | | - | | | | - | | | | - | | | | - | |
| Securities sold short | | | - | | | | - | | | | (813,756 | ) | | | 261,967 | |
| Written options contracts | | | - | | | | - | | | | (415,276 | ) | | | (17,067 | ) |
| Swap contracts | | | - | | | | - | | | | - | | | | - | |
| Net realized gain (loss) | | | (321,108 | ) | | | (9,811,144 | ) | | | (553,631 | ) | | | 5,460,466 | |
| Capital gain distribution from portfolio funds | | | - | | | | - | | | | - | | | | - | |
| Net change in unrealized appreciation (depreciation) on: | | | | | | | | | | | | | | | | |
| Investments | | | (2,616,237 | ) | | | 4,395,505 | | | | 111,818 | | | | (17,219,102 | ) |
| Purchased options contracts | | | - | | | | - | | | | 381,095 | | | | - | |
| Foreign currency transactions | | | - | | | | - | | | | - | | | | - | |
| Securities sold short | | | - | | | | - | | | | 135,929 | | | | (135,929 | ) |
| Written options contracts | | | - | | | | - | | | | - | | | | 23,616 | |
| Swap contracts | | | - | | | | - | | | | - | | | | - | |
| Net change in unrealized appreciation (depreciation) | | | (2,616,237 | ) | | | 4,395,505 | | | | 628,842 | | | | (17,331,415 | ) |
| Net increase from payment by affiliates (Note 3) | | | - | | | | - | | | | - | | | | - | |
| Net realized and unrealized gain (loss) | | | (2,937,345 | ) | | | (5,415,639 | ) | | | 75,211 | | | | (11,870,949 | ) |
| Net Increase (Decrease) in Net Assets from Operations | | $ | (2,312,668 | ) | | $ | (1,979,988 | ) | | $ | 480,326 | | | $ | (12,247,316 | ) |
| 1 | Fiscal year end changed to September 30, effective September 1, 2023. |
| 2 | Fiscal year end changed to September 30, effective July 1, 2023. |
See accompanying Notes to Financial Statements.
AXS Funds
STATEMENTS OF OPERATIONS - Continued
For the Periods Ended September 30, 2023
| | | Tactical Income Fund | |
| | | For the | | | | |
| | | Period Ended | | | For the Year Ended | |
| | | September 30, 20233 | | | December 31, 2022 | |
| Investment Income: | | | | | | | | |
| Dividends (net of foreign withholding taxes of $0 and $0, respectively) | | $ | 1,842,415 | | | $ | 1,731,743 | |
| Interest | | | 388,530 | | | | 398,251 | |
| Total investment income | | | 2,230,945 | | | | 2,129,994 | |
| | | | | | | | | |
| Expenses: | | | | | | | | |
| Advisory fees | | | 310,809 | | | | 533,934 | |
| Fund accounting and administration fees | | | 55,296 | | | | 103,668 | |
| Registration fees | | | 27,525 | | | | 38,340 | |
| Distribution fees - Investor Class (Note 8) | | | - | | | | - | |
| Sub-transfer agent fees and expenses | | | 15,663 | | | | - | |
| Transfer agent fees and expenses | | | 22,309 | | | | 37,422 | |
| Auditing fees | | | 18,968 | | | | 17,499 | |
| Custody fees | | | 6,205 | | | | 7,548 | |
| Shareholder reporting fees | | | 6,521 | | | | 10,804 | |
| Legal fees | | | 12,594 | | | | 14,905 | |
| Trustees’ fees and expenses | | | 12,312 | | | | 14,610 | |
| Miscellaneous | | | 8,091 | | | | 6,396 | |
| Chief Compliance Officer fees | | | 7,298 | | | | 12,711 | |
| Insurance fees | | | 1,783 | | | | 3,090 | |
| Shareholder servicing fees (Note 7) | | | 15,370 | | | | 39,637 | |
| Interest expense | | | - | | | | - | |
| Dividends on securities sold short | | | - | | | | - | |
| Distribution fees - Class A (Note 8) | | | 3,657 | | | | 8,316 | |
| Distribution fees - Class C (Note 8) | | | - | | | | - | |
| Distribution fees - Class D (Note 8) | | | - | | | | - | |
| Total expenses | | | 524,401 | | | | 848,880 | |
| Advisory fees waived | | | - | | | | - | |
| Other expenses absorbed | | | - | | | | - | |
| Fees paid indirectly (Note 3) | | | - | | | | - | |
| Net expenses | | | 524,401 | | | | 848,880 | |
| Net investment income (loss) | | | 1,706,544 | | | | 1,281,114 | |
| | | | | | | | | |
| Realized and Unrealized Gain (Loss): | | | | | | | | |
| Net realized gain (loss) on: | | | | | | | | |
| Investments | | | (2,054,456 | ) | | | (4,418,319 | ) |
| Purchased options contracts | | | (13,609 | ) | | | - | |
| Foreign currency transactions | | | - | | | | - | |
| Securities sold short | | | (1,312 | ) | | | (4,302 | ) |
| Written options contracts | | | 43,072 | | | | 131,473 | |
| Swap contracts | | | - | | | | - | |
| Net realized gain (loss) | | | (2,026,305 | ) | | | (4,291,148 | ) |
| Capital gain distribution from portfolio funds | | | - | | | | - | |
| Net change in unrealized appreciation (depreciation) on: | | | | | | | | |
| Investments | | | 202,020 | | | | (1,534,346 | ) |
| Purchased options contracts | | | - | | | | - | |
| Foreign currency transactions | | | - | | | | - | |
| Securities sold short | | | - | | | | - | |
| Written options contracts | | | - | | | | - | |
| Swap contracts | | | - | | | | - | |
| Net change in unrealized appreciation (depreciation) | | | 202,020 | | | | (1,534,346 | ) |
| Net increase from payment by affiliates (Note 3) | | | - | | | | - | |
| Net realized and unrealized gain (loss) | | | (1,824,285 | ) | | | (5,825,494 | ) |
| Net Increase (Decrease) in Net Assets from Operations | | $ | (117,741 | ) | | $ | (4,544,380 | ) |
| 3 | Fiscal year end changed to September 30, effective July 1, 2023. |
See accompanying Notes to Financial Statements.
AXS Chesapeake Strategy Fund
CONSOLIDATED STATEMENT OF OPERATIONS
For the Year Ended September 30, 2023
| Investment Income: | | | | |
| Interest | | $ | 1,793,587 | |
| Total investment income | | | 1,793,587 | |
| | | | | |
| Expenses: | | | | |
| Advisory fees | | | 826,793 | |
| Fund administration and accounting fees | | | 164,427 | |
| Sub-transfer agent fees and expenses | | | 62,744 | |
| Registration fees | | | 58,499 | |
| Transfer agent fees and expenses | | | 41,087 | |
| Legal fees | | | 39,479 | |
| Auditing fees | | | 28,287 | |
| Shareholder reporting fees | | | 26,594 | |
| Chief Compliance Officer fees | | | 18,064 | |
| Miscellaneous | | | 15,289 | |
| Custody fees | | | 14,286 | |
| Insurance fees | | | 3,863 | |
| Trustees’ fees and expenses | | | 8,172 | |
| Distribution fees - Class A (Note 8) | | | 20,710 | |
| Distribution fees - Class C (Note 8) | | | 51,721 | |
| Total expenses | | | 1,380,015 | |
| Advisory fees waived | | | (252,712 | ) |
| Net expenses | | | 1,127,303 | |
| Net investment income (loss) | | | 666,284 | |
| | | | | |
| Realized and Unrealized Gain (Loss): | | | | |
| Net realized gain (loss) on: | | | | |
| Futures contracts | | | 513,715 | |
| Foreign currency transactions | | | 9,795 | |
| Net realized gain (loss) | | | 523,510 | |
| Net change in unrealized appreciation (depreciation) on: | | | | |
| Futures contracts | | | (2,923,722 | ) |
| Foreign currency translations | | | (8,798 | ) |
| Net change in unrealized appreciation (depreciation) | | | (2,932,520 | ) |
| Net realized and unrealized gain (loss) | | | (2,409,010 | ) |
| | | | | |
| Net Increase (Decrease) in Net Assets from Operations | | $ | (1,742,726 | ) |
See accompanying Notes to Consolidated Financial Statements.
AXS Multi-Strategy Alternatives Fund
STATEMENTS OF CHANGES IN NET ASSETS
| | | For the | | | For the | |
| | | Year Ended | | | Year Ended | |
| | | September 30, 2023 | | | September 30, 2022 | |
| Increase (Decrease) in Net Assets from: | | | | | | | | |
| Operations: | | | | | | | | |
| Net investment income (loss) | | $ | 133,116 | | | $ | (8,620 | ) |
| Net realized gain (loss) on investments and swap contracts | | | (43,847 | ) | | | (1,241,245 | ) |
| Net change in unrealized appreciation/depreciation on investments and swap contracts | | | 2,064,041 | | | | (4,037,850 | ) |
| Net increase (decrease) in net assets resulting from operations | | | 2,153,310 | | | | (5,287,715 | ) |
| | | | | | | | | |
| Distributions to Shareholders: | | | | | | | | |
| Distributions: | | | | | | | | |
| Investor Class | | | - | | | | (1,996,507 | ) |
| Class I | | | - | | | | (2,049,477 | ) |
| Total distributions to shareholders | | | - | | | | (4,045,984 | ) |
| | | | | | | | | |
| Capital Transactions: | | | | | | | | |
| Net proceeds from shares sold: | | | | | | | | |
| Investor Class | | | 810,059 | | | | 4,249,291 | |
| Class I | | | 367,896 | | | | 2,804,191 | |
| Reinvestment of distributions: | | | | | | | | |
| Investor Class | | | - | | | | 1,875,222 | |
| Class I | | | - | | | | 1,793,047 | |
| Cost of shares redeemed: | | | | | | | | |
| Investor Class | | | (3,961,781 | ) | | | (8,524,558 | ) |
| Class I | | | (3,601,381 | ) | | | (7,103,457 | ) |
| Capital contribution from Plan of Reorganization (Note 1): | | | | | | | | |
| Investor Class | | | - | | | | 9,738,840 | |
| Class I | | | - | | | | 4,467,783 | |
| Net increase (decrease) in net assets from capital transactions | | | (6,385,207 | ) | | | 9,300,359 | |
| | | | | | | | | |
| Total increase (decrease) in net assets | | | (4,231,897 | ) | | | (33,340 | ) |
| | | | | | | | | |
| Net Assets: | | | | | | | | |
| Beginning of period | | | 20,003,100 | | | | 20,036,440 | |
| End of period | | $ | 15,771,203 | | | $ | 20,003,100 | |
| | | | | | | | | |
| Capital Share Transactions: | | | | | | | | |
| Shares sold: | | | | | | | | |
| Investor Class | | | 81,379 | | | | 339,118 | |
| Class I | | | 36,996 | | | | 232,169 | |
| Shares reinvested: | | | | | | | | |
| Investor Class | | | - | | | | 156,138 | |
| Class I | | | - | | | | 148,431 | |
| Shares redeemed: | | | | | | | | |
| Investor Class | | | (398,522 | ) | | | (726,759 | ) |
| Class I | | | (369,766 | ) | | | (632,425 | ) |
| Capital contribution from Plan of Reorganization (Note 1): | | | | | | | | |
| Investor Class | | | - | | | | 901,427 | |
| Class I | | | - | | | | 410,906 | |
| Net increase (decrease) in capital share transactions | | | (649,913 | ) | | | 829,005 | |
See accompanying Notes to Financial Statements.
AXS Sustainable Income Fund
STATEMENTS OF CHANGES IN NET ASSETS
| | | For the | | | For the | |
| | | Year Ended | | | Year Ended | |
| | | September 30, 2023 | | | September 30, 2022 | |
| Increase (decrease) in Net Assets from: | | | | | | | | |
| Operations: | | | | | | | | |
| Net investment income (loss) | | $ | 102,122 | | | $ | 862,346 | |
| Net realized gain (loss) on investments | | | (113,775 | ) | | | (443,262 | ) |
| Net change in unrealized appreciation/depreciation on investments | | | 44,780 | | | | (1,043,251 | ) |
| Net increase (decrease) in net assets resulting from operations | | | 33,127 | | | | (624,167 | ) |
| | | | | | | | | |
| Distributions to Shareholders: | | | | | | | | |
| Distributions: | | | | | | | | |
| Class I | | | (103,017 | ) | | | (1,840,610 | ) |
| Total distributions to shareholders | | | (103,017 | ) | | | (1,840,610 | ) |
| | | | | | | | | |
| Capital Transactions: | | | | | | | | |
| Net proceeds from shares sold: | | | | | | | | |
| Class I | | | 1,922,412 | | | | 823,480 | |
| Reinvestment of distributions: | | | | | | | | |
| Class I | | | 81,196 | | | | 222,630 | |
| Cost of shares redeemed: | | | | | | | | |
| Class I | | | (116,063 | ) | | | (50,061,015 | ) |
| Net increase (decrease) in net assets from capital transactions | | | 1,887,545 | | | | (49,014,905 | ) |
| | | | | | | | | |
| Total increase (decrease) in net assets | | | 1,817,655 | | | | (51,479,682 | ) |
| | | | | | | | | |
| Net Assets: | | | | | | | | |
| Beginning of period | | | 1,360,581 | | | | 52,840,263 | |
| End of period | | $ | 3,178,236 | | | $ | 1,360,581 | |
| | | | | | | | | |
| Capital Share Transactions: | | | | | | | | |
| Shares sold: | | | | | | | | |
| Class I | | | 250,906 | | | | 90,430 | |
| Shares reinvested: | | | | | | | | |
| Class I | | | 10,767 | | | | 25,652 | |
| Shares redeemed: | | | | | | | | |
| Class I | | | (15,120 | ) | | | (5,029,703 | ) |
| Net increase (decrease) in capital share transactions | | | 246,553 | | | | (4,913,621 | ) |
See accompanying Notes to Financial Statements.
AXS Thomson Reuters Venture Capital Return Tracker Fund
STATEMENTS OF CHANGES IN NET ASSETS
| | | For the | | | For the | |
| | | Year Ended | | | Year Ended | |
| | | September 30, 2023 | | | September 30, 2022 | |
| Increase (Decrease) in Net Assets from: | | | | | | | | |
| Operations: | | | | | | | | |
| Net investment income (loss) | | $ | (742,867 | ) | | $ | (1,966,315 | ) |
| Net realized gain (loss) on investments and swap contracts | | | (13,646,736 | ) | | | (111,425,479 | ) |
| Net change in unrealized appreciation/depreciation on investments and swap contracts | | | 45,361,704 | | | | (79,082,032 | ) |
| Net increase from payment by affiliates (Note 3) | | | - | | | | 8,347 | |
| Net increase (decrease) in net assets resulting from operations | | | 30,972,101 | | | | (192,465,479 | ) |
| | | | | | | | | |
| Distributions to Shareholders: | | | | | | | | |
| Distributions: | | | | | | | | |
| Class A | | | (276,204 | ) | | | (20,127,174 | ) |
| Class C | | | - | | | | (2,991,249 | ) |
| Class I | | | (769,115 | ) | | | (48,306,816 | ) |
| Total distributions to shareholders | | | (1,045,319 | ) | | | (71,425,239 | ) |
| | | | | | | | | |
| Capital Transactions: | | | | | | | | |
| Net proceeds from shares sold: | | | | | | | | |
| Class A | | | 2,728,955 | | | | 17,586,330 | |
| Class C | | | 443,317 | | | | 2,499,264 | |
| Class I | | | 12,427,108 | | | | 92,488,359 | |
| Reinvestment of distributions: | | | | | | | | |
| Class A | | | 272,094 | | | | 19,793,050 | |
| Class C | | | - | | | | 2,888,966 | |
| Class I | | | 755,975 | | | | 46,839,363 | |
| Cost of shares redeemed: | | | | | | | | |
| Class A1 | | | (14,470,874 | ) | | | (30,417,448 | ) |
| Class C2 | | | (1,715,125 | ) | | | (6,108,419 | ) |
| Class I3 | | | (33,235,967 | ) | | | (149,058,854 | ) |
| Net increase (decrease) in net assets from capital transactions | | | (32,794,517 | ) | | | (3,489,389 | ) |
| | | | | | | | | |
| Total increase (decrease) in net assets | | | (2,867,735 | ) | | | (267,380,107 | ) |
| | | | | | | | | |
| Net Assets: | | | | | | | | |
| Beginning of period | | | 107,795,411 | | | | 375,175,518 | |
| End of period | | $ | 104,927,676 | | | $ | 107,795,411 | |
| | | | | | | | | |
| Capital Share Transactions: | | | | | | | | |
| Shares sold: | | | | | | | | |
| Class A | | | 193,683 | | | | 714,887 | |
| Class C | | | 33,066 | | | | 108,445 | |
| Class I | | | 864,908 | | | | 3,861,384 | |
| Shares reinvested: | | | | | | | | |
| Class A | | | 21,526 | | | | 713,778 | |
| Class C | | | - | | | | 110,646 | |
| Class I | | | 58,968 | | | | 1,663,330 | |
| Shares redeemed: | | | | | | | | |
| Class A | | | (1,032,573 | ) | | | (1,462,829 | ) |
| Class C | | | (129,361 | ) | | | (287,326 | ) |
| Class I | | | (2,320,290 | ) | | | (7,107,072 | ) |
| Net increase (decrease) in capital share transactions | | | (2,310,073 | ) | | | (1,684,757 | ) |
| 1 | Net of redemption fee proceeds of $8,484 and $6,718, respectively. |
| 2 | Net of redemption fee proceeds of $111 and $1,400, respectively. |
| 3 | Net of redemption fee proceeds of $1,131 and $42,702, respectively. |
See accompanying Notes to Financial Statements.
AXS Merger Fund
STATEMENTS OF CHANGES IN NET ASSETS
| | | For the | | | For the | |
| | | Year Ended | | | Year Ended | |
| | | September 30, 2023 | | | September 30, 2022 | |
| Increase (Decrease) in Net Assets from: | | | | | | | | |
| Operations: | | | | | | | | |
| Net investment income (loss) | | $ | 437,709 | | | $ | (580,780 | ) |
| Net realized gain (loss) on investments,purchased options contracts, securities sold short, written options contracts and foreign currency transactions | | | 1,854,033 | | | | 1,708,947 | |
| Net change in unrealized appreciation/depreciation on investments, securities sold shorts and foreign currency translations | | | 434,799 | | | | 30,080 | |
| Net increase (decrease) in net assets resulting from operations | | | 2,726,541 | | | | 1,158,247 | |
| | | | | | | | | |
| Distributions to Shareholders: | | | | | | | | |
| Distributions: | | | | | | | | |
| Investor Class | | | (6,140 | ) | | | (15,978 | ) |
| Class I | | | (226,530 | ) | | | (727,558 | ) |
| Total distributions to shareholders | | | (232,670 | ) | | | (743,536 | ) |
| | | | | | | | | |
| Capital Transactions: | | | | | | | | |
| Net proceeds from shares sold: | | | | | | | | |
| Investor Class | | | 10,198 | | | | 64,896 | |
| Class I | | | 864,507 | | | | 13,814,359 | |
| Reinvestment of distributions: | | | | | | | | |
| Investor Class | | | 5,863 | | | | 13,905 | |
| Class I | | | 225,877 | | | | 724,168 | |
| Cost of shares redeemed: | | | | | | | | |
| Investor Class | | | (334,113 | ) | | | (471,900 | ) |
| Class I1 | | | (26,866,379 | ) | | | (34,170,375 | ) |
| Net increase (decrease) in net assets from capital transactions | | | (26,094,047 | ) | | | (20,024,947 | ) |
| | | | | | | | | |
| Total increase (decrease) in net assets | | | (23,600,176 | ) | | | (19,610,236 | ) |
| | | | | | | | | |
| Net Assets: | | | | | | | | |
| Beginning of period | | | 57,336,784 | | | | 76,947,020 | |
| End of period | | $ | 33,736,608 | | | $ | 57,336,784 | |
| | | | | | | | | |
| Capital Share Transactions: | | | | | | | | |
| Shares sold: | | | | | | | | |
| Investor Class | | | 966 | | | | 6,260 | |
| Class I | | | 80,102 | | | | 1,306,739 | |
| Shares reinvested: | | | | | | | | |
| Investor Class | | | 560 | | | | 1,373 | |
| Class I | | | 20,895 | | | | 69,298 | |
| Shares redeemed: | | | | | | | | |
| Investor Class | | | (31,670 | ) | | | (45,905 | ) |
| Class I | | | (2,482,636 | ) | | | (3,222,242 | ) |
| Net increase (decrease) in capital share transactions | | | (2,411,783 | ) | | | (1,884,477 | ) |
| 1 | Net of redemption fee proceeds of $0 and $14,612, respectively. |
See accompanying Notes to Financial Statements.
AXS Alternative Value Fund
STATEMENTS OF CHANGES IN NET ASSETS
| | | For the | | | For the | |
| | | Year Ended | | | Year Ended | |
| | | September 30, 2023 | | | September 30, 2022 | |
| Increase (Decrease) in Net Assets From: | | | | | | | | |
| Operations: | | | | | | | | |
| Net investment income (loss) | | $ | 58,940 | | | $ | 135,877 | |
| Net realized gain (loss) on investments | | | (194,694 | ) | | | 50,474 | |
| Net change in unrealized appreciation/depreciation on investments | | | 1,659,525 | | | | (2,162,759 | ) |
| Net increase (decrease) in net assets resulting from operations | | | 1,523,771 | | | | (1,976,408 | ) |
| | | | | | | | | |
| Distributions to shareholders: | | | | | | | | |
| Distributions: | | | | | | | | |
| Investor Class | | | (37,138 | ) | | | (24,234 | ) |
| Class I | | | (329,455 | ) | | | (32,671 | ) |
| Total distributions to shareholders | | | (366,593 | ) | | | (56,905 | ) |
| | | | | | | | | |
| Capital Transactions: | | | | | | | | |
| Net proceeds from shares sold: | | | | | | | | |
| Investor Class | | | 2,176,791 | | | | 2,047,597 | |
| Class I | | | 12,525,925 | | | | 21,256,340 | |
| Reinvestment of distributions: | | | | | | | | |
| Investor Class | | | 37,138 | | | | 24,234 | |
| Class I | | | 247,369 | | | | 28,440 | |
| Cost of shares redeemed: | | | | | | | | |
| Investor Class1 | | | (2,540,889 | ) | | | (512,317 | ) |
| Class I2 | | | (18,990,409 | ) | | | (3,359,852 | ) |
| Net increase (decrease) in net assets from capital transactions | | | (6,544,075 | ) | | | 19,484,442 | |
| | | | | | | | | |
| Total increase (decrease) in net assets | | | (5,386,897 | ) | | | 17,451,129 | |
| | | | | | | | | |
| Net Assets: | | | | | | | | |
| Beginning of year | | | 18,851,179 | | | | 1,400,050 | |
| End of year | | $ | 13,464,282 | | | $ | 18,851,179 | |
| | | | | | | | | |
| Capital Share Transactions: | | | | | | | | |
| Shares sold: | | | | | | | | |
| Investor Class | | | 187,713 | | | | 179,941 | |
| Class I | | | 1,088,672 | | | | 1,880,489 | |
| Shares reinvested: | | | | | | | | |
| Investor Class | | | 3,204 | | | | 2,115 | |
| Class I | | | 21,399 | | | | 2,490 | |
| Shares redeemed: | | | | | | | | |
| Investor Class | | | (221,699 | ) | | | (46,503 | ) |
| Class I | | | (1,699,261 | ) | | | (309,066 | ) |
| Net increase (decrease) in capital share transactions | | | (619,972 | ) | | | 1,709,466 | |
| 1 | Net of redemption fees of $380 and $623, respectively. |
| 2 | Net of redemption fees of $595 and $736, respectively. |
See accompanying Notes to Financial Statements.
AXS Market Neutral Fund
STATEMENTS OF CHANGES IN NET ASSETS
| | | For the | | | For the | |
| | | Year Ended | | | Year Ended | |
| | | September 30, 2023 | | | September 30, 2022 | |
| Increase (Decrease) in Net Assets From: | | | | | | | | |
| Operations: | | | | | | | | |
| Net investment income (loss) | | $ | 219,173 | | | $ | (72,800 | ) |
| Net realized gain (loss) | | | 1,094,636 | | | | 987,275 | |
| Net change in unrealized appreciation/depreciation on investments and securities sold short | | | (938,091 | ) | | | 578,647 | |
| Net increase (decrease) in net assets resulting from operations | | | 375,718 | | | | 1,493,122 | |
| | | | | | | | | |
| Capital Transactions: | | | | | | | | |
| Net proceeds from shares sold: | | | | | | | | |
| Investor Class | | | 1,233,088 | | | | 1,174,780 | |
| Class I | | | 20,453,324 | | | | 13,045,609 | |
| Cost of shares redeemed: | | | | | | | | |
| Investor Class1 | | | (2,257,446 | ) | | | (1,410,515 | ) |
| Class I2 | | | (22,131,511 | ) | | | (2,786,148 | ) |
| Net increase (decrease) in net assets from capital transactions | | | (2,702,545 | ) | | | 10,023,726 | |
| | | | | | | | | |
| Total increase (decrease) in net assets | | | (2,326,827 | ) | | | 11,516,848 | |
| | | | | | | | | |
| Net Assets: | | | | | | | | |
| Beginning of period | | | 21,052,110 | | | | 9,535,262 | |
| End of period | | $ | 18,725,283 | | | $ | 21,052,110 | |
| | | | | | | | | |
| Capital Share Transactions: | | | | | | | | |
| Shares sold: | | | | | | | | |
| Investor Class | | | 103,347 | | | | 102,741 | |
| Class I | | | 1,675,795 | | | | 1,123,975 | |
| Shares redeemed: | | | | | | | | |
| Investor Class | | | (191,297 | ) | | | (130,942 | ) |
| Class I | | | (1,861,709 | ) | | | (241,025 | ) |
| Net increase (decrease) in capital share transactions | | | (273,864 | ) | | | 854,749 | |
| 1 | Net of redemption fees of $89 and $626, respectively. |
| 2 | Net of redemption fees of $8,306 and $2,591, respectively. |
See accompanying Notes to Financial Statements.
AXS Adaptive Plus Fund
STATEMENTS OF CHANGES IN NET ASSETS
| | | | | | For the Period | |
| | | For the | | | September 15, 2022* | |
| | | Year Ended | | | through | |
| | | September 30, 2023 | | | September 30, 2022 | |
| Increase (Decrease) in Net Assets From: | | | | | | | | |
| Operations: | | | | | | | | |
| Net investment income (loss) | | $ | 346,168 | | | $ | (78 | ) |
| Net realized gain (loss) on investments and purchase option contracts | | | (891,614 | ) | | | - | |
| Net change in unrealized appreciation/depreciation on investments and purchase options contracts | | | (707,813 | ) | | | 148,712 | |
| Net increase from payments by affiliates (Note 3) | | | 389 | | | | - | |
| Net increase (decrease) in net assets resulting from operations | | | (1,252,870 | ) | | | 148,634 | |
| | | | | | | | | |
| Distributions to Shareholders: | | | | | | | | |
| Distributions: | | | | | | | | |
| Class I | | | (54,338 | ) | | | - | |
| Total distributions to shareholders | | | (54,338 | ) | | | - | |
| | | | | | | | | |
| Capital Transactions: | | | | | | | | |
| Net proceeds from shares sold: | | | | | | | | |
| Class I | | | 38,328,442 | | | | 12,060,438 | |
| Reinvestment of distributions: | | | | | | | | |
| Class I | | | 54,338 | | | | - | |
| Cost of shares redeemed: | | | | | | | | |
| Class I | | | (17,685,246 | ) | | | (216,276 | ) |
| Net increase (decrease) in net assets from capital transactions | | | 20,697,534 | | | | 11,844,162 | |
| | | | | | | | | |
| Total increase (decrease) in net assets | | | 19,390,326 | | | | 11,992,796 | |
| | | | | | | | | |
| Net Assets: | | | | | | | | |
| Beginning of period | | | 11,992,796 | | | | - | |
| End of period | | $ | 31,383,122 | | | $ | 11,992,796 | |
| | | | | | | | | |
| Capital Share Transactions: | | | | | | | | |
| Shares sold: | | | | | | | | |
| Class I | | | 3,795,237 | | | | 1,184,198 | |
| Shares reinvested: | | | | | | | | |
| Class I | | | 5,812 | | | | - | |
| Shares redeemed: | | | | | | | | |
| Class I | | | (1,799,601 | ) | | | (21,287 | ) |
| Net increase (decrease) in capital share transactions | | | 2,001,448 | | | | 1,162,911 | |
| * | Commencement of operations. |
See accompanying Notes to Financial Statements.
AXS Income Opportunities Fund
STATEMENTS OF CHANGES IN NET ASSETS
| | | For the | | | For the | | | For the | |
| | | Period Ended | | | Year Ended | | | Year Ended | |
| | | September 30, 20231 | | | August 31, 2023 | | | August 31, 20222 | |
| Increase (Decrease) in Net Assets from: | | | | | | | | | | | | |
| Operations: | | | | | | | | | | | | |
| Net investment income (loss) | | $ | 624,677 | | | $ | 3,435,651 | | | $ | 3,995,005 | |
| Net realized gain (loss) on investments and securities sold short | | | (321,108 | ) | | | (9,811,144 | ) | | | 10,902,967 | |
| Net change in unrealized appreciation/depreciation on investments and securities sold short | | | (2,616,237 | ) | | | 4,395,505 | | | | (33,092,755 | ) |
| Net increase (decrease) in net assets resulting from operations | | | (2,312,668 | ) | | | (1,979,988 | ) | | | (18,194,783 | ) |
| | | | | | | | | | | | | |
| Distributions to Shareholders: | | | | | | | | | | | | |
| Distributions: | | | | | | | | | | | | |
| Class A | | | (21,112 | ) | | | (128,477 | ) | | | (156,368 | ) |
| Class D | | | (47,480 | ) | | | (252,213 | ) | | | (212,105 | ) |
| Class I | | | (556,085 | ) | | | (4,427,259 | ) | | | (3,742,435 | ) |
| Return of Capital: | | | | | | | | | | | | |
| Class A | | | (20,717 | ) | | | (73,636 | ) | | | (196,309 | ) |
| Class D | | | (46,592 | ) | | | (160,748 | ) | | | (296,442 | ) |
| Class I | | | (545,680 | ) | | | (2,318,288 | ) | | | (5,366,433 | ) |
| Total distributions to shareholders | | | (1,237,666 | ) | | | (7,360,621 | ) | | | (9,970,092 | ) |
| | | | | | | | | | | | | |
| Capital Transactions: | | | | | | | | | | | | |
| Net proceeds from shares sold: | | | | | | | | | | | | |
| Class A | | | - | | | | 80,393 | | | | 291,331 | |
| Class D | | | 1,205 | | | | 263,028 | | | | 594,900 | |
| Class I | | | 97,189 | | | | 7,469,884 | | | | 22,985,337 | |
| Reinvestment of distributions: | | | | | | | | | | | | |
| Class A | | | 34,580 | | | | 160,281 | | | | 186,050 | |
| Class D | | | 79,427 | | | | 361,759 | | | | 366,618 | |
| Class I | | | 1,012,287 | | | | 6,209,793 | | | | 7,057,529 | |
| Cost of shares redeemed: | | | | | | | | | | | | |
| Class A | | | (24,149 | ) | | | (1,102,051 | ) | | | (3,480,672 | ) |
| Class D | | | (51,886 | ) | | | (1,654,694 | ) | | | (2,408,902 | ) |
| Class I | | | (1,121,722 | ) | | | (62,245,818 | ) | | | (65,659,943 | ) |
| Net increase (decrease) in net assets from capital transactions | | | 26,931 | | | | (50,457,425 | ) | | | (40,067,752 | ) |
| | | | | | | | | | | | | |
| Total increase (decrease) in net assets | | | (3,523,403 | ) | | | (59,798,034 | ) | | | (68,232,627 | ) |
| | | | | | | | | | | | | |
| Net Assets: | | | | | | | | | | | | |
| Beginning of period | | | 71,168,381 | | | | 130,966,415 | | | | 199,199,042 | |
| End of period | | $ | 67,644,978 | | | $ | 71,168,381 | | | $ | 130,966,415 | |
| | | | | | | | | | | | | |
| Capital Share Transactions: | | | | | | | | | | | | |
| Shares sold: | | | | | | | | | | | | |
| Class A | | | - | | | | 5,379 | | | | 15,607 | |
| Class D | | | 83 | | | | 18,602 | | | | 34,286 | |
| Class I | | | 6,513 | | | | 510,055 | | | | 1,282,212 | |
| Shares reinvested: | | | | | | | | | | | | |
| Class A | | | 2,410 | | | | 11,638 | | | | 10,508 | |
| Class D | | | 5,657 | | | | 26,816 | | | | 21,186 | |
| Class I | | | 70,298 | | | | 450,343 | | | | 399,437 | |
| Shares redeemed: | | | | | | | | | | | | |
| Class A | | | (1,666 | ) | | | (76,074 | ) | | | (195,952 | ) |
| Class D | | | (3,665 | ) | | | (117,204 | ) | | | (140,638 | ) |
| Class I | | | (76,656 | ) | | | (4,349,615 | ) | | | (3,662,593 | ) |
| Net increase (decrease) in capital share transactions | | | 2,974 | | | | (3,520,060 | ) | | | (2,235,947 | ) |
| 1 | Fiscal year end changed to September 30, effective September 1, 2023. |
| 2 | With the Plan of Reorganization with respect to the Orinda Income Opportunities Fund, Class A, Class D and Class I shareholders received Class A, Class D and Class I shares of the AXS Income Opporunities Fund, respectively, effective as of the close of business on May 13, 2022. See Note 1 in the accompanying Notes to Financial Statements. |
See accompanying Notes to Financial Statements.
AXS Dynamic Opportunities Fund^
STATEMENTS OF CHANGES IN NET ASSETS
| | | For the | | | For the | | | For the | |
| | | Period Ended | | | Year Ended | | | Year Ended | |
| | | September 30, 2023 * | | | December 31, 2022 | | | December 31, 2021 | |
| Increase (Decrease) in Net Assets from: | | | | | | | | | | | | |
| Operations: | | | | | | | | | | | | |
| Net investment income (loss) | | $ | 405,115 | | | $ | (376,367 | ) | | $ | (973,029 | ) |
| Net realized gain (loss) on investments, purchased options contracts, securities sold short and written options contracts | | | (553,631 | ) | | | 5,460,466 | | | | 2,084,012 | |
| Net change in unrealized appreciation/depreciation on investments, purchased options contracts, securities sold short and written options contracts | | | 628,842 | | | | (17,331,415 | ) | | | (860,436 | ) |
| Net increase (decrease) in net assets resulting from operations | | | 480,326 | | | | (12,247,316 | ) | | | 250,547 | |
| | | | | | | | | | | | | |
| Distributions to Shareholders: | | | | | | | | | | | | |
| Distributions: | | | | | | | | | | | | |
| Class A | | | - | | | | (138,328 | ) | | | (77,251 | ) |
| Class I | | | - | | | | (4,759,902 | ) | | | (2,386,723 | ) |
| Return of capital: | | | | | | | | | | | | |
| Class A | | | - | | | | - | | | | (486 | ) |
| Class I | | | - | | | | - | | | | (15,024 | ) |
| Total distributions to shareholders | | | - | | | | (4,898,230 | ) | | | (2,479,484 | ) |
| | | | | | | | | | | | | |
| Capital Transactions: | | | | | | | | | | | | |
| Net proceeds from shares sold: | | | | | | | | | | | | |
| Class A | | | 11,260 | | | | 203,034 | | | | 1,329,614 | |
| Class I | | | 8,067,331 | | | | 10,295,894 | | | | 29,792,109 | |
| Reinvestment of distributions: | | | | | | | | | | | | |
| Class A | | | - | | | | 126,158 | | | | 72,312 | |
| Class I | | | - | | | | 4,708,168 | | | | 2,368,692 | |
| Cost of shares redeemed: | | | | | | | | | | | | |
| Class A 1 | | | (407,974 | ) | | | (846,109 | ) | | | (728,049 | ) |
| Class I 2 | | | (32,642,117 | ) | | | (23,838,317 | ) | | | (11,910,742 | ) |
| Net increase (decrease) in net assets from capital transactions | | | (24,971,500 | ) | | | (9,351,172 | ) | | | 20,923,936 | |
| | | | | | | | | | | | | |
| Total increase (decrease) in net assets | | | (24,491,174 | ) | | | (26,496,718 | ) | | | 18,694,999 | |
| | | | | | | | | | | | | |
| Net Assets: | | | | | | | | | | | | |
| Beginning of period | | | 78,680,601 | | | | 105,177,319 | | | | 86,482,320 | |
| End of period | | $ | 54,189,427 | | | $ | 78,680,601 | | | $ | 105,177,319 | |
| | | | | | | | | | | | | |
| Capital Share Transactions: | | | | | | | | | | | | |
| Shares sold: | | | | | | | | | | | | |
| Class A | | | 696 | | | | 10,849 | | | | 61,433 | |
| Class I | | | 475,820 | | | | 539,109 | | | | 1,365,909 | |
| Shares reinvested: | | | | | | | | | | | | |
| Class A | | | - | | | | 7,572 | | | | 3,566 | |
| Class I | | | - | | | | 277,604 | | | | 115,152 | |
| Shares redeemed: | | | | | | | | | | | | |
| Class A | | | (24,536 | ) | | | (45,175 | ) | | | (33,728 | ) |
| Class I | | | (1,937,971 | ) | | | (1,229,705 | ) | | | (545,839 | ) |
| Net increase (decrease) in capital share transactions | | | (1,485,991 | ) | | | (439,746 | ) | | | 966,493 | |
| ^ | With the Plan of Reorganization with respect to the AXS Dynamic Opportunity Fund (formerly, ACM Dynamic Opportunity Fund), Class A and Class I shareholders received Class A and Class I shares of the AXS Dynamic Opportunity Fund effective as of the close of business on May 12, 2023. See Note 1 in the accompanying Notes to Financial Statements. |
| * | Fiscal year end changed to September 30, effective July 1, 2023. |
| 1 | Net of redemption fee proceeds of $19, $113, and $68, respectively. |
| 2 | Net of redemption fee proceeds of $4,422, $178, and $2,246, respectively. |
See accompanying Notes to Financial Statements.
AXS Tactical Income Fund ^
STATEMENTS OF CHANGES IN NET ASSETS
| | | For the | | | For the | | | For the | |
| | | Period Ended | | | Year Ended | | | Year Ended | |
| | | September 30, 2023 * | | | December 31, 2022 | | | December 31, 2021 | |
| Increase (Decrease) in Net Assets from: | | | | | | | | | | | | |
| Operations: | | | | | | | | | | | | |
| Net investment income (loss) | | $ | 1,706,544 | | | $ | 1,281,114 | | | $ | 2,365,959 | |
| Net realized gain (loss) on investments, purchased options contracts, securities sold short and written options contracts | | | (2,026,305 | ) | | | (4,291,148 | ) | | | (1,969,452 | ) |
| Distributions of realized gains by underlying investment companies | | | - | | | | - | | | | 3,224 | |
| Net change in unrealized appreciation/depreciation on investments | | | 202,020 | | | | (1,534,346 | ) | | | (950,771 | ) |
| Net increase (decrease) in net assets resulting from operations | | | (117,741 | ) | | | (4,544,380 | ) | | | (551,040 | ) |
| | | | | | | | | | | | | |
| Distributions to Shareholders: | | | | | | | | | | | | |
| Distributions: | | | | | | | | | | | | |
| Class A | | | (75,329 | ) | | | (68,106 | ) | | | (138,097 | ) |
| Class I | | | (1,644,968 | ) | | | (1,207,069 | ) | | | (2,078,162 | ) |
| Return of capital: | | | | | | | | | | | | |
| Class A | | | - | | | | - | | | | (895 | ) |
| Class I | | | - | | | | - | | | | (14,013 | ) |
| Total distributions to shareholders | | | (1,720,297 | ) | | | (1,275,175 | ) | | | (2,231,167 | ) |
| | | | | | | | | | | | | |
| Capital Transactions: | | | | | | | | | | | | |
| Net proceeds from shares sold: | | | | | | | | | | | | |
| Class A | | | 127,251 | | | | 802,502 | | | | 1,680,712 | |
| Class I | | | 3,154,800 | | | | 8,916,241 | | | | 31,617,017 | |
| Reinvestment of distributions: | | | | | | | | | | | | |
| Class A | | | 66,097 | | | | 51,235 | | | | 76,597 | |
| Class I | | | 1,615,166 | | | | 1,173,708 | | | | 2,032,469 | |
| Cost of shares redeemed: | | | | | | | | | | | | |
| Class A 1 | | | (596,184 | ) | | | (2,317,268 | ) | | | (1,517,688 | ) |
| Class I 2 | | | (9,695,476 | ) | | | (25,242,685 | ) | | | (12,309,577 | ) |
| Net increase (decrease) in net assets from capital transactions | | | (5,328,346 | ) | | | (16,616,267 | ) | | | 21,579,530 | |
| | | | | | | | | | | | | |
| Total increase (decrease) in net assets | | | (7,166,384 | ) | | | (22,435,822 | ) | | | 18,797,323 | |
| | | | | | | | | | | | | |
| Net Assets: | | | | | | | | | | | | |
| Beginning of period | | | 43,668,103 | | | | 66,103,925 | | | | 47,306,602 | |
| End of period | | $ | 36,501,719 | | | $ | 43,668,103 | | | $ | 66,103,925 | |
| | | | | | | | | | | | | |
| Capital Share Transactions: | | | | | | | | | | | | |
| Shares sold: | | | | | | | | | | | | |
| Class A | | | 14,154 | | | | 83,216 | | | | 159,245 | |
| Class I | | | 347,072 | | | | 926,776 | | | | 2,997,985 | |
| Shares reinvested: | | | | | | | | | | | | |
| Class A | | | 7,415 | | | | 5,472 | | | | 7,334 | |
| Class I | | | 181,003 | | | | 124,902 | | | | 194,569 | |
| Shares redeemed: | | | | | | | | | | | | |
| Class A | | | (66,915 | ) | | | (244,479 | ) | | | (144,457 | ) |
| Class I | | | (1,083,492 | ) | | | (2,630,855 | ) | | | (1,175,222 | ) |
| Net increase (decrease) in capital share transactions | | | (600,763 | ) | | | (1,734,968 | ) | | | 2,039,454 | |
| ^ | With the Plan of Reorganization with respect to the AXS Tactical Income Fund (formerly, ACM Tactical income Fund), Class A and Class I shareholders received Class A and Class I shares of the AXS Tactical Income Fund effective as of the close of business on May 12, 2023. See Note 1 in the accompanying Notes to Financial Statements. |
| * | Fiscal year end changed to September 30, effective July 1, 2023. |
| 1 | Net of redemption fee proceeds of $1,887, $6, and $148, respectively. |
| 2 | Net of redemption fee proceeds of $1,309, $99, and $2,290, respectively. |
See accompanying Notes to Financial Statements.
AXS Chesapeake Strategy Fund
CONSOLIDATED STATEMENTS OF CHANGES IN NET ASSETS
| | | For the | | | For the | |
| | | Year Ended | | | Year Ended | |
| | | September 30, 2023 | | | September 30, 20221,2 | |
| Increase (Decrease) in Net Assets from: | | | | | | | | |
| Operations: | | | | | | | | |
| Net investment income (loss) | | $ | 666,284 | | | $ | (465,441 | ) |
| Net realized gain (loss) on investments, futures contracts and foreign currency transactions | | | 523,510 | | | | 6,155,491 | |
| Net change in unrealized appreciation/depreciation on futures contracts and foreign currency transactions | | | (2,932,520 | ) | | | 2,280,932 | |
| Net increase (decrease) in net assets resulting from operations | | | (1,742,726 | ) | | | 7,970,982 | |
| | | | | | | | | |
| Distributions to Shareholders: | | | | | | | | |
| Distributions: | | | | | | | | |
| Class A | | | (111,507 | ) | | | (651,094 | ) |
| Class C | | | (41,049 | ) | | | (15,388 | ) |
| Class I | | | (687,139 | ) | | | (2,485,912 | ) |
| Total distributions to shareholders | | | (839,695 | ) | | | (3,152,394 | ) |
| | | | | | | | | |
| Capital Transactions: | | | | | | | | |
| Net proceeds from shares sold: | | | | | | | | |
| Class A | | | 1,267,163 | | | | 632,501 | |
| Class C | | | 130,217 | | | | 129,589 | |
| Class I | | | 22,367,173 | | | | 29,326,728 | |
| Reinvestment of distributions: | | | | | | | | |
| Class A | | | 105,628 | | | | 628,759 | |
| Class C | | | 38,016 | | | | 14,657 | |
| Class I | | | 616,683 | | | | 2,321,839 | |
| Cost of shares redeemed: | | | | | | | | |
| Class A | | | (1,930,347 | ) | | | (1,339,769 | ) |
| Class C | | | (1,831,272 | ) | | | (779,138 | ) |
| Class I | | | (24,965,925 | ) | | | (12,430,192 | ) |
| Capital Contribution from Plan of Reorganization (Note 1): | | | | | | | | |
| Class A | | | - | | | | 4,397,705 | |
| Class C | | | - | | | | 6,023,468 | |
| Class I | | | - | | | | 8,389,210 | |
| Net increase (decrease) in net assets from capital transactions | | | (4,202,664 | ) | | | 37,315,357 | |
| | | | | | | | | |
| Total increase (decrease) in net assets | | | (6,785,085 | ) | | | 42,133,945 | |
| | | | | | | | | |
| Net Assets: | | | | | | | | |
| Beginning of period | | | 60,926,712 | | | | 18,792,767 | |
| End of period | | $ | 54,141,627 | | | $ | 60,926,712 | |
| | | | | | | | | |
| Capital Share Transactions: | | | | | | | | |
| Shares sold: | | | | | | | | |
| Class A | | | 105,815 | | | | 53,255 | |
| Class C | | | 10,206 | | | | 10,098 | |
| Class I | | | 1,821,802 | | | | 2,410,007 | |
| Shares reinvested: | | | | | | | | |
| Class A | | | 8,967 | | | | 62,439 | |
| Class C | | | 3,049 | | | | 1,372 | |
| Class I | | | 51,735 | | | | 228,078 | |
| Shares redeemed: | | | | | | | | |
| Class A | | | (159,650 | ) | | | (112,625 | ) |
| Class C | | | (141,462 | ) | | | (61,450 | ) |
| Class I | | | (2,052,111 | ) | | | (1,042,674 | ) |
| Capital Contribution from Plan of Reorganization (Note 1): | | | | | | | | |
| Class A | | | - | | | | 378,798 | |
| Class C | | | - | | | | 503,116 | |
| Class I | | | - | | | | 737,113 | |
| Net increase (decrease) in capital share transactions | | | (351,649 | ) | | | 3,167,527 | |
| 1 | With the Plan of Reorganization with respect to the AXS Aspect Core Diversified Strategy Fund, Class A, Class C and Class I shareholders received Class A, Class C and Class I shares of the AXS Chesapeake Strategy Fund, respectively, effective as of the close of business on December 17, 2021. See Note 1 in the accompanying Notes to Consolidated Financial Statements. |
| 2 | With the Plan of Reorganization with respect to the AXS Managed Futures Strategy Fund, Class A, Class C and Class I shareholders received Class A, Class C and Class I shares of the AXS Chesapeake Strategy Fund, respectively, effective as of the close of business on July 22, 2022. See Note 1 in the accompanying Notes to Consolidated Financial Statements. |
See accompanying Notes to Consolidated Financial Statements.
AXS Merger Fund
STATEMENT OF CASH FLOWS
For the Year Ended September 30, 2023
| Increase (Decrease) in Cash: | | | | |
| Cash flows provided by (used for) operating activities: | | | | |
| Net increase (decrease) in net assets resulting from operations | | $ | 2,726,541 | |
| Adjustments to reconcile net increase (decrease) in net assets from operations to Net cash provided by (used for) operating activities: | | | | |
| Purchases of long-term investments | | | (69,529,629 | ) |
| Sales of long-term investments | | | 97,909,840 | |
| Return of capital dividends received | | | 98,294 | |
| Purchased options contracts | | | (2,640 | ) |
| Sale of options contracts | | | - | |
| Proceeds from securities sold short | | | 10,578,139 | |
| Cover short securities | | | (13,771,182 | ) |
| Proceeds from written options contracts | | | 24,875 | |
| Closed written options contracts | | | 986 | |
| Purchase/Sale of short-term investments, net | | | (3,155,702 | ) |
| (Increase) Decrease in Assets: | | | | |
| Investment securities sold receivable | | | (430,188 | ) |
| Dividends and interest receivables | | | 221,414 | |
| Other assets | | | 7,815 | |
| Increase (Decrease) in Liabilities: | | | | |
| Foreign currency payable | | | (870,325 | ) |
| Deposits at broker | | | - | |
| Payables for securities purchased | | | (1,385,295 | ) |
| Advisory fees payable | | | (8,589 | ) |
| Payables for dividends and interest on securities sold short | | | (7,526 | ) |
| Accrued expenses | | | 44,542 | |
| Net realized (gain)/loss | | | (1,637,680 | ) |
| Net change in unrealized appreciation/depreciation | | | (513,136 | ) |
| Net cash provided by (used for) operating activities | | | 20,300,554 | |
| | | | | |
| Cash flows provided by (used for) financing activities: | | | | |
| Proceeds from shares sold | | | 875,045 | |
| Cost of shares redeemed | | | (27,227,395 | ) |
| Dividends paid to shareholders, net of reinvestments | | | (930 | ) |
| Net cash provided by (used for) financing activities | | | (26,353,280 | ) |
| | | | | |
| Net increase (decrease) in cash | | | (6,052,726 | ) |
| | | | | |
| Cash and cash equivalents | | | | |
| Beginning cash balance | | | 7,058,383 | |
| Beginning cash held at broker | | | 5,536,941 | |
| Total beginning cash and cash equivalents | | | 12,595,324 | |
| | | | | |
| Ending cash balance | | | 41,303 | |
| Ending cash held at broker broker | | | 6,501,295 | |
| Total ending cash and cash equivalents | | $ | 6,542,598 | |
| Supplemental disclosure of interest expense paid | | $ | 27,838 | |
| Supplemental disclosure of reinvested distributions | | $ | 231,740 | |
See accompanying Notes to Financial Statements.
AXS Market Neutral Fund
STATEMENT OF CASH FLOWS
For the Year Ended September 30, 2023 (Unaudited)
| Increase (Decrease) in Cash: | | | | |
| Cash flows provided by (used for) operating activities: | | | | |
| Net increase (decrease) in net assets resulting from operations | | $ | 375,718 | |
| Adjustments to reconcile net increase (decrease) in net assets from operations to Net cash provided by (used for) operating activities: | | | | |
| Purchases of long-term investments | | | (36,825,028 | ) |
| Sales of long-term investments | | | 40,997,835 | |
| Return of capital dividends received | | | 12,361 | |
| Proceeds from securities sold short | | | 29,740,568 | |
| Cover short securities | | | (31,928,956 | ) |
| Purchase/Sale of short-term investments, net | | | 576,665 | |
| (Increase) Decrease in Assets: | | | | |
| Dividends and interest receivables | | | (12,143 | ) |
| Prepaid expenses and other assets | | | 4,160 | |
| Increase (Decrease) in Liabilities: | | | | |
| Payables for dividends on securities sold short | | | 2,991 | |
| Advisory fees payable | | | (2,123 | ) |
| Accrued expenses | | | (7,707 | ) |
| Net realized (gain)/loss | | | (1,079,129 | ) |
| Net change in unrealized appreciation/depreciation | | | 938,091 | |
| Net cash provided by (used for) operating activities | | | 2,793,303 | |
| | | | | |
| Cash flows provided by (used for) financing activities: | | | | |
| Borrowings from Broker | | | (5,311,903 | ) |
| Proceeds from shares sold | | | 21,660,820 | |
| Cost of shares redeemed | | | (24,435,114 | ) |
| Net cash provided (used for) by financing activities | | | (8,086,197 | ) |
| | | | | |
| Net increase (decrease) in cash | | | (5,292,894 | ) |
| | | | | |
| Cash and cash equivalents | | | | |
| Beginning cash held at broker | | | 165,874 | |
| Beginning segregated cash held by custodian | | | 16,978,475 | |
| Total beginning cash and cash equivalents | | | 17,144,349 | |
| | | | | |
| Ending cash balance | | | 169,085 | |
| Ending cash held at broker | | | 11,682,370 | |
| Total ending cash and cash equivalents | | $ | 11,851,455 | |
See accompanying Notes to Financial Statements.
AXS Income Opportunities Fund
STATEMENT OF CASH FLOWS
| | | For the | | | For the | |
| | | Period Ended | | | Year Ended | |
| | | September 30, 20231 | | | August 31, 2023 | |
| Increase (Decrease) in Cash: | | | | | | | | |
| Cash flows provided by (used for) operating activities: | | | | | | | | |
| Net increase (decrease) in net assets resulting from operations | | $ | (2,312,668 | ) | | $ | (1,979,988 | ) |
| Adjustments to reconcile net increase (decrease) in net assets from operations to net cash provided by (used for) operating activities: | | | | | | | | |
| Purchases of long-term investments | | | (4,090,969 | ) | | | (47,859,640 | ) |
| Sales of long-term investments | | | 4,821,737 | | | | 102,787,909 | |
| Return of capital dividends received | | | 219,418 | | | | 3,456,632 | |
| Purchase/Sale of short-term investments, net | | | 6,952 | | | | 1,106,404 | |
| (Increase) Decrease in Assets: | | | | | | | | |
| Investment securities sold receivable | | | 252,129 | | | | (141,020 | ) |
| Dividends and interest receivables | | | (437,797 | ) | | | 281,697 | |
| Prepaid expenses and other assets | | | (9,288 | ) | | | 4,752 | |
| Increase (Decrease) in Liabilities: | | | | | | | | |
| Investment securities purchased payable | | | (226,611 | ) | | | (103,489 | ) |
| Due to Custodian | | | - | | | | (781,773 | ) |
| Cash Due to Broker | | | 841,841 | | | | - | |
| Interest expense | | | (3,380 | ) | | | 8,284 | |
| Advisory fees payable | | | (2,582 | ) | | | (56,846 | ) |
| Accrued expenses | | | 17,730 | | | | (55,895 | ) |
| Net realized (gain)/loss | | | 321,108 | | | | 9,811,144 | |
| Net change in unrealized appreciation/depreciation | | | 2,616,237 | | | | (4,395,505 | ) |
| Net cash provided by (used for) operating activities | | | 2,013,857 | | | | 62,082,666 | |
| | | | | | | | | |
| Cash flows provided by (used for) financing activities: | | | | | | | | |
| Proceeds from shares sold | | | 100,826 | | | | 7,810,873 | |
| Cost of shares redeemed | | | (1,186,022 | ) | | | (65,184,313 | ) |
| Dividends paid to shareholders, net of reinvestments | | | (111,372 | ) | | | (628,788 | ) |
| Loan payable | | | (792,289 | ) | | | (3,955,438 | ) |
| Net cash provided by (used for) financing activities | | | (1,988,857 | ) | | | (61,957,666 | ) |
| | | | | | | | | |
| Net Increase (Decrease) in cash | | | 25,000 | | | | 125,000 | |
| | | | | | | | | |
| Cash and cash equivalents | | | | | | | | |
| Beginning cash balance | | | 125,000 | | | | - | |
| Beginning cash held at broker | | | - | | | | - | |
| Total beginning cash and cash equivalents | | | 125,000 | | | | - | |
| | | | | | | | | |
| Ending cash balance | | | 150,000 | | | | 125,000 | |
| Ending cash held at broker | | | - | | | | - | |
| Total ending cash and cash equivalents | | $ | 150,000 | | | $ | 125,000 | |
| Supplemental disclosure of interest expense paid | | $ | 49,281 | | | $ | 546,932 | |
Non cash financing activities not included herein consist of $1,126,294 and $6,731,833, respectively, of reinvested dividends.
| 1 | Fiscal year end changed to September 30, effective September 1, 2023. |
See accompanying Notes to Financial Statements.
AXS Multi-Strategy Alternatives Fund
FINANCIAL HIGHLIGHTS
Investor Class*
Per share operating performance.
For a capital share outstanding throughout each period.
| | | For the Year Ended September 30, | | | For the Period
May 1, 2020 through | | | For the Year Ended April 30, | |
| | | 2023 | | | 2022 | | | 2021 | | | September 30, 2020** | | | 2020 | | | 2019 | |
| Net asset value, beginning of period | | $ | 8.98 | | | $ | 14.37 | | | $ | 11.12 | | | $ | 9.95 | | | $ | 11.49 | | | $ | 13.28 | |
| Income from Investment Operations: | | | | | | | | | | | | | | | | | | | | | | | | |
| Net investment income (loss)1 | | | 0.07 | | | | (0.01 | ) | | | (0.11 | ) | | | (0.03 | ) | | | (0.03 | ) | | | - | 2 |
| Net realized and unrealized gain (loss) | | | 0.96 | | | | (2.31 | ) | | | 3.36 | | | | 1.20 | | | | (1.41 | ) | | | 0.61 | |
| Total from investment operations | | | 1.03 | | | | (2.32 | ) | | | 3.25 | | | | 1.17 | | | | (1.44 | ) | | | 0.61 | |
| | | | | | | | | | | | | | | | | | | | | | | | | |
| Less Distributions: | | | | | | | | | | | | | | | | | | | | | | | | |
| From net investment income | | | - | | | | - | | | | - | | | | - | | | | - | | | | - | |
| From net realized gain | | | - | | | | (3.07 | ) | | | - | | | | - | | | | (0.10 | ) | | | (2.40 | ) |
| Total distributions | | | - | | | | (3.07 | ) | | | - | | | | - | | | | (0.10 | ) | | | (2.40 | ) |
| | | | | | | | | | | | | | | | | | | | | | | | | |
| Net asset value, end of period | | $ | 10.01 | | | $ | 8.98 | | | $ | 14.37 | | | $ | 11.12 | | | $ | 9.95 | | | $ | 11.49 | |
| | | | | | | | | | | | | | | | | | | | | | | | | |
| Total return3 | | | 11.47 | % | | | (21.53 | )% | | | 29.23 | % | | | 11.76 | % 5 | | | (12.66 | )% 4 | | | 5.34 | % |
| | | | | | | | | | | | | | | | | | | | | | | | | |
| Ratios and Supplemental Data: | | | | | | | | | | | | | | | | | | | | | | | | |
| Net assets, end of period (in thousands) | | $ | 10,881 | | | $ | 12,612 | | | $ | 10,546 | | | $ | 12,941 | | | $ | 14,586 | | | $ | 97,281 | |
| | | | | | | | | | | | | | | | | | | | | | | | | |
| Ratio of expenses to average net assets: | | | | | | | | | | | | | | | | | | | | | | | | |
| Before fees waived and expenses absorbed/recovered | | | 2.44 | % | | | 2.15 | % | | | 2.14 | % | | | 1.66 | % 6 | | | 1.58 | % | | | 1.68 | % |
| After fees waived and expenses absorbed/recovered | | | 1.68 | % | | | 1.68 | % | | | 1.68 | % | | | 1.66 | % 6 | | | 1.58 | % | | | 1.68 | % |
| Ratio of net investment income (loss) to average net assets: | | | | | | | | | | | | | | | | | | | | | | | | |
| Before fees waived and expenses absorbed/recovered | | | (0.08 | )% | | | (0.59 | )% | | | (1.34 | )% | | | (0.75 | )% 6 | | | (0.30 | )% | | | (0.02 | )% |
| After fees waived and expenses absorbed/recovered | | | 0.68 | % | | | (0.12 | )% | | | (0.88 | )% | | | (0.75 | )% 6 | | | (0.30 | )% | | | (0.02 | )% |
| | | | | | | | | | | | | | | | | | | | | | | | | |
| Portfolio turnover rate | | | 410 | % | | | 456 | % | | | 419 | % | | | 193 | % 5 | | | 727 | % | | | 838 | % |
| * | Financial information from April 30, 2019 through October 18, 2019 is for the KCM Macro Trends Fund, which was reorganized into the AXS Multi-Strategy Alternatives Fund as of the close of business on October 18, 2019. On February 1, 2022, Class R-1 shares were re-designated into Investor Class shares. See Note 1 in the accompanying Notes to Consolidated Financial Statements. |
| ** | Fiscal year end changed to September 30, effective May 1, 2020. |
| 1 | Based on average daily shares outstanding for the period. |
| 2 | Amount represents less than $0.005 per share. |
| 3 | Total returns would have been higher/lower had expenses not been recovered/waived and absorbed by the Advisor. Returns shown do not reflect the deduction of taxes that a shareholder would pay on Fund distributions or the redemption of Fund shares. |
| 4 | A predecessor affiliate reimbursed the Fund $43,948 for losses on pricing error. The payment had a positive 0.09% impact to the total return. |
See accompanying Notes to Financial Statements.
AXS Multi-Strategy Alternatives Fund
FINANCIAL HIGHLIGHTS
Class I*
Per share operating performance.
For a capital share outstanding throughout each period.
| | | For the Year Ended September 30, | | | For the Period
May 1, 2020 through | | | For the Year Ended April 30, | |
| | | 2023 | | | 2022 | | | 2021 | | | September 30, 2020** | | | 2020 | | | 2019 | |
| Net asset value, beginning of period | | $ | 9.05 | | | $ | 14.43 | | | $ | 11.16 | | | $ | 9.97 | | | $ | 11.53 | | | $ | 13.28 | |
| Income from Investment Operations: | | | | | | | | | | | | | | | | | | | | | | | | |
| Net investment income (loss)1 | | | 0.08 | | | | 0.01 | | | | (0.09 | ) | | | (0.02 | ) | | | - | 2 | | | 0.02 | |
| Net realized and unrealized gain (loss) | | | 0.97 | | | | (2.32 | ) | | | 3.36 | | | | 1.21 | | | | (1.41 | ) | | | 0.63 | |
| Total from investment operations | | | 1.05 | | | | (2.31 | ) | | | 3.27 | | | | 1.19 | | | | (1.41 | ) | | | 0.65 | |
| | | | | | | | | | | | | | | | | | | | | | | | | |
| Less Distributions: | | | | | | | | | | | | | | | | | | | | | | | | |
| From net investment income | | | - | | | | - | | | | - | | | | - | | | | (0.05 | ) | | | - | |
| From net realized gain | | | - | | | | (3.07 | ) | | | - | | | | - | | | | (0.10 | ) | | | (2.40 | ) |
| Total distributions | | | - | | | | (3.07 | ) | | | - | | | | - | | | | (0.15 | ) | | | (2.40 | ) |
| | | | | | | | | | | | | | | | | | | | | | | | | |
| Redemption fee proceeds1 | | | - | | | | - | | | | - | | | | - | | | | - | | | | - | |
| | | | | | | | | | | | | | | | | | | | | | | | | |
| Net asset value, end of period | | $ | 10.10 | | | $ | 9.05 | | | $ | 14.43 | | | $ | 11.16 | | | $ | 9.97 | | | $ | 11.53 | |
| | | | | | | | | | | | | | | | | | | | | | | | | |
| Total return3 | | | 11.60 | % | | | (21.34 | )% | | | 29.30 | % | | | 11.94 | % 5 | | | (12.43 | )% 4 | | | 5.65 | % |
| | | | | | | | | | | | | | | | | | | | | | | | | |
| Ratios and Supplemental Data: | | | | | | | | | | | | | | | | | | | | | | | | |
| Net assets, end of period (in thousands) | | $ | 4,890 | | | $ | 7,391 | | | $ | 9,490 | | | $ | 49,925 | | | $ | 43,877 | | | $ | 467 | |
| | | | | | | | | | | | | | | | | | | | | | | | | |
| Ratio of expenses to average net assets: | | | | | | | | | | | | | | | | | | | | | | | | |
| Before fees waived and expenses absorbed/recovered | | | 2.19 | % | | | 1.90 | % | | | 1.89 | % | | | 1.41 | % 6 | | | 1.31 | % | | | 1.51 | % |
| After fees waived and expenses absorbed/recovered | | | 1.51 | % | | | 1.51 | % | | | 1.51 | % | | | 1.41 | % 6 | | | 1.31 | % | | | 1.51 | % |
| Ratio of net investment income (loss) to average net assets: | | | | | | | | | | | | | | | | | | | | | | | | |
| Before fees waived and expenses absorbed/recovered | | | 0.17 | % | | | (0.34 | )% | | | (1.09 | )% | | | (0.50 | )% 6 | | | (0.03 | )% | | | 0.18 | % |
| After fees waived and expenses absorbed/recovered | | | 0.85 | % | | | 0.05 | % | | | (0.71 | )% | | | (0.50 | )% 6 | | | (0.03 | )% | | | 0.18 | % |
| | | | | | | | | | | | | | | | | | | | | | | | | |
| Portfolio turnover rate | | | 410 | % | | | 456 | % | | | 419 | % | | | 193 | % 5 | | | 727 | % | | | 838 | % |
| * | Financial information from April 30, 2019 through October 18, 2019 is for the KCM Macro Trends Fund, which was reorganized into the AXS Multi-Strategy Alternatives Fund as of the close of business on October 18, 2019. On October 21, 2019, Institutional Class shares were re-designated into Class I Shares. See Note 1 in the accompanying Notes to Consolidated Financial Statements. |
| ** | Fiscal year end changed to September 30, effective May 1, 2020. |
| 1 | Based on average daily shares outstanding for the period. |
| 2 | Amount represents less than $0.005 per share. |
| 3 | Total returns would have been higher/lower had expenses not been recovered/waived and absorbed by the Advisor. Returns shown do not reflect the deduction of taxes that a shareholder would pay on Fund distributions or the redemption of Fund shares. |
| 4 | Payment by a predecessor affiliate had no impact to the total return. |
See accompanying Notes to Financial Statements.
AXS Sustainable Income Fund
FINANCIAL HIGHLIGHTS
Class I
Per share operating performance.
For a capital share outstanding throughout each period.
| | | | | | | | | For the Period | |
| | | For the Year Ended September 30, | | | October 17, 2020*
through | |
| | | 2023 | | | 2022 | | | September 30, 2021 | |
| Net asset value, beginning of period | | $ | 7.51 | | | $ | 10.37 | | | $ | 10.00 | |
| Income from Investment Operations: | | | | | | | | | | | | |
| Net investment income (loss)1 | | | 0.34 | | | | 0.47 | | | | 0.47 | |
| Net realized and unrealized gain (loss) | | | (0.08 | ) | | | (1.55 | ) | | | 0.36 | |
| Total from investment operations | | | 0.26 | | | | (1.08 | ) | | | 0.83 | |
| | | | | | | | | | | | | |
| Less Distributions: | | | | | | | | | | | | |
| From net investment income | | | (0.34 | ) | | | (1.59 | ) | | | (0.46 | ) |
| From net realized gain | | | - | | | | (0.19 | ) | | | - | |
| Total distributions | | | (0.34 | ) | | | (1.78 | ) | | | (0.46 | ) |
| | | | | | | | | | | | | |
| Net asset value, end of period | | $ | 7.43 | | | $ | 7.51 | | | $ | 10.37 | |
| | | | | | | | | | | | | |
| Total return 2 | | | 3.49 | % | | | (12.06 | %) | | | 8.42 | % 3 |
| | | | | | | | | | | | | |
| Ratios and Supplemental Data: | | | | | | | | | | | | |
| Net assets, end of period (in thousands) | | $ | 3,178 | | | $ | 1,361 | | | $ | 52,840 | |
| | | | | | | | | | | | | |
| Ratio of expenses to average net assets: | | | | | | | | | | | | |
| Before fees waived and expenses absorbed/recovered | | | 4.73 | % | | | 1.81 | % | | | 1.11 | % 4 |
| After fees waived and expenses absorbed/recovered | | | 0.99 | % | | | 0.99 | % | | | 0.99 | % 4 |
| Ratio of net investment income to average net assets: | | | | | | | | | | | | |
| Before fees waived and expenses absorbed/recovered | | | 0.76 | % | | | 3.83 | % | | | 4.62 | % 4 |
| After fees waived and expenses absorbed/recovered | | | 4.50 | % | | | 4.65 | % | | | 4.74 | % 4 |
| | | | | | | | | | | | | |
| Portfolio turnover rate | | | 38 | % | | | 35 | % | | | 114 | % 3 |
| * | Commencement of operations. |
| 1 | Based on average shares outstanding for the period. |
| 2 | Total returns would have been lower had expenses not been waived and absorbed by the Advisor. Returns shown do not reflect the deduction of taxes that a shareholder would pay on Fund distributions or the redemption of Fund shares. |
See accompanying Notes to Financial Statements.
AXS Thomson Reuters Venture Capital Return Tracker Fund
FINANCIAL HIGHLIGHTS
Class A*
Per share operating performance.
For a capital share outstanding throughout each period.
| | | For the Year Ended September 30, | |
| | | 2023 | | | 2022 | | | 2021 | | | 2020 | | | 2019 | |
| Net asset value, beginning of period | | $ | 11.99 | | | $ | 35.13 | | | $ | 31.14 | | | $ | 18.26 | | | $ | 19.88 | |
| Income from Investment Operations: | | | | | | | | | | | | | | | | | | | | |
| Net investment income (loss)1 | | | (0.12 | ) | | | (0.21 | ) | | | (0.34 | ) | | | (0.18 | ) | | | (0.09 | ) |
| Net realized and unrealized gain (loss) | | | 4.00 | | | | (16.26 | ) | | | 9.73 | | | | 13.04 | | | | (0.45 | ) |
| Net increase from payment by affiliates (Note 3) | | | - | | | | - | 2 | | | - | 2 | | | - | | | | - | |
| Total from investment operations | | | 3.88 | | | | (16.47 | ) | | | 9.39 | | | | 12.86 | | | | (0.54 | ) |
| | | | | | | | | | | | | | | | | | | | | |
| Less Distributions: | | | | | | | | | | | | | | | | | | | | |
| From net investment income | | | (0.10 | ) | | | (2.56 | ) | | | - | | | | - | | | | - | |
| From net realized gain | | | - | | | | (4.11 | ) | | | (5.41 | ) | | | - | | | | (1.08 | ) |
| Total distributions | | | (0.10 | ) | | | (6.67 | ) | | | (5.41 | ) | | | - | | | | (1.08 | ) |
| | | | | | | | | | | | | | | | | | | | | |
| Redemption fee proceeds1 | | | - | 2 | | | - | 2 | | | 0.01 | | | | 0.02 | | | | - | 2 |
| | | | | | | | | | | | | | | | | | | | | |
| Net asset value, end of period | | $ | 15.77 | | | $ | 11.99 | | | $ | 35.13 | | | $ | 31.14 | | | $ | 18.26 | |
| | | | | | | | | | | | | | | | | | | | | |
| Total return3 | | | 32.56 | % | | | (57.66 | )% | | | 33.23 | % | | | 70.54 | % | | | (1.84 | )% |
| | | | | | | | | | | | | | | | | | | | | |
| Ratios and Supplemental Data: | | | | | | | | | | | | | | | | | | | | |
| Net assets, end of period (in thousands) | | $ | 32,897 | | | $ | 34,824 | | | $ | 103,229 | | | $ | 82,691 | | | $ | 37,779 | |
| | | | | | | | | | | | | | | | | | | | | |
| Ratio of expenses to average net assets: | | | | | | | | | | | | | | | | | | | | |
| Before fees waived and expenses absorbed | | | 1.97 | % | | | 2.07 | % | | | 1.85 | % | | | 1.89 | % | | | 2.06 | % |
| After fees waived and expenses absorbed | | | 1.75 | % | | | 1.75 | % | | | 1.76 | % | | | 1.75 | % | | | 1.75 | % |
| Ratio of net investment loss to average net assets: | | | | | | | | | | | | | | | | | | | | |
| Before fees waived and expenses absorbed | | | (1.03 | )% | | | (1.29 | )% | | | (1.11 | )% | | | (0.90 | )% | | | (0.83 | )% |
| After fees waived and expenses absorbed | | | (0.81 | )% | | | (0.97 | )% | | | (1.02 | )% | | | (0.76 | )% | | | (0.52 | )% |
| | | | | | | | | | | | | | | | | | | | | |
| Portfolio turnover rate | | | 24 | % | | | 72 | % | | | 100 | % | | | 115 | % | | | 115 | % |
| * | Financial information from October 1, 2018 through November 20, 2020 is for the Leland Thomson Reuters Venture Capital Index Fund, which was reorganized into the AXS Thomson Reuters Venture Capital Return Tracker Fund as of the close of business on November 20, 2020. See Note 1 in the accompanying Notes to Consolidated Financial Statements. |
| 1 | Based on average daily shares outstanding for the period. |
| 2 | Amount represents less than $0.005 per share. |
| 3 | Total returns would have been lower had expenses not been waived and absorbed by the Advisor. Returns shown include Rule 12b-1 fees of up to 0.25% and do not reflect the deduction of taxes that a shareholder would pay on Fund distributions or the redemption of Fund shares. Returns shown do not include payment of sales load of 5.75% of offering price which will not apply on sales of $1 million or more. If the sales charge was included total returns would be lower. |
See accompanying Notes to Financial Statements.
AXS Thomson Reuters Venture Capital Return Tracker Fund
FINANCIAL HIGHLIGHTS
Class C*
Per share operating performance.
For a capital share outstanding throughout each period.
| | | For the Year Ended September 30, | |
| | | 2023 | | | 2022 | | | 2021 | | | 2020 | | | 2019 | |
| Net asset value, beginning of period | | $ | 11.22 | | | $ | 33.33 | | | $ | 29.98 | | | $ | 17.71 | | | $ | 19.46 | |
| Income from Investment Operations: | | | | | | | | | | | | | | | | | | | | |
| Net investment income (loss)1 | | | (0.21 | ) | | | (0.36 | ) | | | (0.57 | ) | | | (0.34 | ) | | | (0.22 | ) |
| Net realized and unrealized gain (loss) | | | 3.75 | | | | (15.28 | ) | | | 9.32 | | | | 12.60 | | | | (0.45 | ) |
| Net increase from payment by affiliates (Note 3) | | | - | | | | - | 2 | | | - | 2 | | | - | | | | - | |
| Total from investment operations | | | 3.54 | | | | (15.64 | ) | | | 8.75 | | | | 12.26 | | | | (0.67 | ) |
| | | | | | | | | | | | | | | | | | | | | |
| Less Distributions: | | | | | | | | | | | | | | | | | | | | |
| From net investment income | | | - | | | | (2.36 | ) | | | - | | | | - | | | | - | |
| From net realized gain | | | - | | | | (4.11 | ) | | | (5.41 | ) | | | - | | | | (1.08 | ) |
| Total distributions | | | - | | | | (6.47 | ) | | | (5.41 | ) | | | - | | | | (1.08 | ) |
| | | | | | | | | | | | | | | | | | | | | |
| Redemption fee proceeds1 | | | - | 2 | | | - | 2 | | | 0.01 | | | | 0.01 | | | | - | 2 |
| | | | | | | | | | | | | | | | | | | | | |
| Net asset value, end of period | | $ | 14.76 | | | $ | 11.22 | | | $ | 33.33 | | | $ | 29.98 | | | $ | 17.71 | |
| | | | | | | | | | | | | | | | | | | | | |
| Total return3 | | | 31.55 | % | | | (57.99 | )% | | | 32.26 | % | | | 69.28 | % | | | (2.59 | )% |
| | | | | | | | | | | | | | | | | | | | | |
| Ratios and Supplemental Data: | | | | | | | | | | | | | | | | | | | | |
| Net assets, end of period (in thousands) | | $ | 4,115 | | | $ | 4,210 | | | $ | 14,776 | | | $ | 11,205 | | | $ | 5,315 | |
| | | | | | | | | | | | | | | | | | | | | |
| Ratio of expenses to average net assets: | | | | | | | | | | | | | | | | | | | | |
| Before fees waived and expenses absorbed | | | 2.72 | % | | | 2.82 | % | | | 2.60 | % | | | 2.64 | % | | | 2.81 | % |
| After fees waived and expenses absorbed | | | 2.50 | % | | | 2.50 | % | | | 2.51 | % | | | 2.50 | % | | | 2.50 | % |
| Ratio of net investment loss to average net assets: | | | | | | | | | | | | | | | | | | | | |
| Before fees waived and expenses absorbed | | | (1.78 | )% | | | (2.04 | )% | | | (1.86 | )% | | | (1.64 | )% | | | (1.58 | )% |
| After fees waived and expenses absorbed | | | (1.56 | )% | | | (1.72 | )% | | | (1.77 | )% | | | (1.50 | )% | | | (1.27 | )% |
| | | | | | | | | | | | | | | | | | | | | |
| Portfolio turnover rate | | | 24 | % | | | 72 | % | | | 100 | % | | | 115 | % | | | 115 | % |
| * | Financial information from October 1, 2018 through November 20, 2020 is for the Leland Thomson Reuters Venture Capital Index Fund, which was reorganized into the AXS Thomson Reuters Venture Capital Return Tracker Fund as of the close of business on November 20, 2020. See Note 1 in the accompanying Notes to Consolidated Financial Statements. |
| 1 | Based on average daily shares outstanding for the period. |
| 2 | Amount represents less than $0.005 per share. |
| 3 | Total returns would have been lower had expenses not been waived and absorbed by the Advisor. Returns shown include Rule 12b-1 fees of up to 1.00% and do not reflect the deduction of taxes that a shareholder would pay on Fund distributions or the redemption of Fund shares. Returns do not include payment of Contingent Deferred Sales Charge (“CDSC”) of 1.00% on certain redemptions of Class C shares made within 12 months of purchase. If the sales charge was included, total returns would be lower. |
See accompanying Notes to Financial Statements.
AXS Thomson Reuters Venture Capital Return Tracker Fund
FINANCIAL HIGHLIGHTS
Class I*
Per share operating performance.
For a capital share outstanding throughout each period.
| | | For the Year Ended September 30, | |
| | | 2023 | | | 2022 | | | 2021 | | | 2020 | | | 2019 | |
| Net asset value, beginning of period | | $ | 12.20 | | | $ | 35.63 | | | $ | 31.45 | | | $ | 18.40 | | | $ | 19.97 | |
| Income from Investment Operations: | | | | | | | | | | | | | | | | | | | | |
| Net investment income (loss)1 | | | (0.08 | ) | | | (0.16 | ) | | | (0.26 | ) | | | (0.12 | ) | | | (0.05 | ) |
| Net realized and unrealized gain (loss) | | | 4.05 | | | | (16.53 | ) | | | 9.84 | | | | 13.16 | | | | (0.44 | ) |
| Net increase from payment by affiliates (Note 3) | | | - | | | | - | 2 | | | - | 2 | | | - | | | | - | |
| Total from investment operations | | | 3.97 | | | | (16.69 | ) | | | 9.58 | | | | 13.04 | | | | (0.49 | ) |
| | | | | | | | | | | | | | | | | | | | | |
| Less Distributions: | | | | | | | | | | | | | | | | | | | | |
| From net investment income | | | (0.15 | ) | | | (2.64 | ) | | | - | | | | - | | | | - | |
| From net realized gain | | | - | | | | (4.11 | ) | | | (5.41 | ) | | | - | | | | (1.08 | ) |
| Total distributions | | | (0.15 | ) | | | (6.75 | ) | | | (5.41 | ) | | | - | | | | (1.08 | ) |
| | | | | | | | | | | | | | | | | | | | | |
| Redemption fee proceeds1 | | | - | 2 | | | 0.01 | | | | 0.01 | | | | 0.01 | | | | - | 2 |
| | | | | | | | | | | | | | | | | | | | | |
| Net asset value, end of period | | $ | 16.02 | | | $ | 12.20 | | | $ | 35.63 | | | $ | 31.45 | | | $ | 18.40 | |
| | | | | | | | | | | | | | | | | | | | | |
| Total return3 | | | 32.80 | % | | | (57.56 | )% | | | 33.54 | % | | | 70.92 | % | | | (1.57 | )% |
| | | | | | | | | | | | | | | | | | | | | |
| Ratios and Supplemental Data: | | | | | | | | | | | | | | | | | | | | |
| Net assets, end of period (in thousands) | | $ | 67,916 | | | $ | 68,761 | | | $ | 257,170 | | | $ | 148,199 | | | $ | 59,881 | |
| | | | | | | | | | | | | | | | | | | | | |
| Ratio of expenses to average net assets: | | | | | | | | | | | | | | | | | | | | |
| Before fees waived and expenses absorbed | | | 1.72 | % | | | 1.82 | % | | | 1.60 | % | | | 1.64 | % | | | 1.81 | % |
| After fees waived and expenses absorbed | | | 1.50 | % | | | 1.50 | % | | | 1.51 | % | | | 1.50 | % | | | 1.50 | % |
| Ratio of net investment loss to average net assets: | | | | | | | | | | | | | | | | | | | | |
| Before fees waived and expenses absorbed | | | (0.78 | )% | | | (1.04 | )% | | | (0.86 | )% | | | (0.66 | )% | | | (0.59 | )% |
| After fees waived and expenses absorbed | | | (0.56 | )% | | | (0.72 | )% | | | (0.77 | )% | | | (0.52 | )% | | | (0.28 | )% |
| | | | | | | | | | | | | | | | | | | | | |
| Portfolio turnover rate | | | 24 | % | | | 72 | % | | | 100 | % | | | 115 | % | | | 115 | % |
| * | Financial information from October 1, 2018 through November 20, 2020 is for the Leland Thomson Reuters Venture Capital Index Fund, which was reorganized into the AXS Thomson Reuters Venture Capital Return Tracker Fund as of the close of business on November 20, 2020. See Note 1 in the accompanying Notes to Consolidated Financial Statements. |
| 1 | Based on average daily shares outstanding for the period. |
| 2 | Amount represents less than $0.005 per share. |
| 3 | Total returns would have been lower had expenses not been waived and absorbed by the Advisor. Returns shown do not reflect the deduction of taxes that a shareholder would pay on Fund distributions or the redemption of Fund shares. |
See accompanying Notes to Financial Statements.
AXS Merger Fund
FINANCIAL HIGHLIGHTS
Class I*
Per share operating performance.
For a capital share outstanding throughout each period.
| | | | | | | | | For the Period | | | | | | | | | | |
| | | For the Year Ended September 30, | | | January 1, 2021
through | | | For the Year Ended December 31, | |
| | | 2023 | | | 2022 | | | September 30, 2021** | | | 2020 | | | 2019 | | | 2018 | |
| Net asset value, beginning of period | | $ | 10.66 | | | $ | 10.60 | | | $ | 10.62 | | | $ | 10.79 | | | $ | 10.78 | | | $ | 10.74 | |
| Income from Investment Operations: | | | | | | | | | | | | | | | | | | | | | | | | |
| Net investment loss1 | | | 0.12 | | | | (0.09 | ) | | | (0.10 | ) | | | (0.11 | ) | | | (0.05 | ) | | | (0.07 | ) |
| Net realized and unrealized gain | | | 0.65 | | | | 0.26 | | | | 0.08 | | | | 0.15 | | | | 0.55 | | | | 0.19 | |
| Total from investment operations | | | 0.77 | | | | 0.17 | | | | (0.02 | ) | | | 0.04 | | | | 0.50 | | | | 0.12 | |
| | | | | | | | | | | | | | | | | | | | | | | | | |
| Less Distributions: | | | | | | | | | | | | | | | | | | | | | | | | |
| From net investment income | | | - | | | | - | | | | - | | | | (0.01 | ) | | | - | | | | - | |
| From net realized gain | | | (0.06 | ) | | | (0.11 | ) | | | - | | | | (0.20 | ) | | | (0.49 | ) | | | (0.08 | ) |
| Total distributions | | | (0.06 | ) | | | (0.11 | ) | | | - | | | | (0.21 | ) | | | (0.49 | ) | | | (0.08 | ) |
| | | | | | | | | | | | | | | | | | | | | | | | | |
| Redemption fee proceeds1 | | | - | | | | - | 2 | | | - | 2 | | | - | | | | - | | | | - | |
| | | | | | | | | | | | | | | | | | | | | | | | | |
| Net asset value, end of period | | $ | 11.37 | | | $ | 10.66 | | | $ | 10.60 | | | $ | 10.62 | | | $ | 10.79 | | | $ | 10.78 | |
| | | | | | | | | | | | | | | | | | | | | | | | | |
| Total return3 | | | 7.23 | % | | | 1.61 | % | | | (0.19 | )% 4 | | | 0.37 | % | | | 4.66 | % | | | 1.15 | % |
| | | | | | | | | | | | | | | | | | | | | | | | | |
| Ratios and Supplemental Data: | | | | | | | | | | | | | | | | | | | | | | | | |
| Net assets, end of period (in thousands) | | $ | 32,853 | | | $ | 56,195 | | | $ | 75,415 | | | $ | 96,768 | | | $ | 164,058 | | | $ | 177,923 | |
| | | | | | | | | | | | | | | | | | | | | | | | | |
| Ratio of expenses to average net assets (including dividends on securities sold short and interest expense): | | | | | | | | | | | | | | | | | | | | | | | | |
| Before fees waived and expenses absorbed/recovered6 | | | 2.33 | % | | | 2.30 | % | | | 2.56 | % 5 | | | 2.06 | % 7 | | | 2.28 | % | | | 2.06 | % |
| After fees waived and expenses absorbed/recovered6 | | | 1.82 | % | | | 2.00 | % | | | 2.36 | % 5 | | | 2.01 | %7 | | | 2.28 | % | | | 2.09 | % |
| Ratio of net investment loss to average net assets (including dividends on securities sold short and interest expense): | | | | | | | | | | | | | | | | | | | | | | | | |
| Before fees waived and expenses absorbed/recovered | | | 0.60 | % | | | (1.18 | )% | | | (1.43 | )% 5 | | | (1.11 | )% | | | (0.45 | )% | | | (0.64 | )% |
| After fees waived and expenses absorbed/recovered | | | 1.11 | % | | | (0.88 | )% | | | (1.23 | )% 5 | | | (1.06 | )% | | | (0.45 | )% | | | (0.67 | )% |
| | | | | | | | | | | | | | | | | | | | | | | | | |
| Portfolio turnover rate | | | 303 | % | | | 218 | % | | | 184 | % 4 | | | 256 | % | | | 298 | % | | | 285 | % |
| * | Financial information from January 1, 2018 through December 31, 2020 is for the Kellner Merger Fund, which was reorganized into the AXS Merger Fund as of the close of business on January 22, 2021. See Note 1 in the accompanying Notes to Financial Statements. |
| ** | Fiscal year end changed to September 30, effective January 1, 2021. |
| 1 | Based on average shares outstanding for the period. |
| 2 | Amount represents less than $0.01 per share. |
| 3 | Total returns would have been higher/lower had expenses not been recovered/waived and absorbed by the Advisor. Returns shown do not reflect the deduction of taxes that a shareholder would pay on Fund distributions or the redemption of Fund shares. |
| 6 | If dividends on securities sold short, interest expense and extraordinary expenses had been excluded, the expense ratios would have been lowered by 0.32% and 0.50% for the years ended September 30, 2023 and 2022 and 0.86% for the period January 1, 2021 through September 30, 2021. For the years ended December 31, 2020, 2019 and 2018, the ratios would have been lowered by 0.51%, 0.78% and 0.59%, respectively. |
| 7 | Includes extraordinary expenses of 0.02% that occurred during the Fund’s fiscal year ended December 31, 2020. |
See accompanying Notes to Financial Statements.
AXS Merger Fund
FINANCIAL HIGHLIGHTS
Investor Class*
Per share operating performance.
For a capital share outstanding throughout each period.
| | | | | | | | | For the Period | | | | | | | | | | |
| | | For the Year Ended September 30, | | | January 1, 2021
through | | | For the Year Ended December 31, | |
| | | 2023 | | | 2022 | | | September 30, 2021** | | | 2020 | | | 2019 | | | 2018 | |
| Net asset value, beginning of period | | $ | 10.32 | | | $ | 10.29 | | | $ | 10.33 | | | $ | 10.52 | | | $ | 10.54 | | | $ | 10.53 | |
| Income from Investment Operations: | | | | | | | | | | | | | | | | | | | | | | | | |
| Net investment loss1 | | | 0.09 | | | | (0.12 | ) | | | (0.12 | ) | | | (0.14 | ) | | | (0.08 | ) | | | (0.10 | ) |
| Net realized and unrealized gain | | | 0.63 | | | | 0.26 | | | | 0.08 | | | | 0.15 | | | | 0.55 | | | | 0.19 | |
| Total from investment operations | | | 0.72 | | | | 0.14 | | | | (0.04 | ) | | | 0.01 | | | | 0.47 | | | | 0.09 | |
| | | | | | | | | | | | | | | | | | | | | | | | | |
| Less Distributions: | | | | | | | | | | | | | | | | | | | | | | | | |
| From net realized gain | | | (0.06 | ) | | | (0.11 | ) | | | - | | | | (0.20 | ) | | | (0.49 | ) | | | (0.08 | ) |
| Total distributions | | | (0.06 | ) | | | (0.11 | ) | | | - | | | | (0.20 | ) | | | (0.49 | ) | | | (0.08 | ) |
| | | | | | | | | | | | | | | | | | | | | | | | | |
| Redemption fee proceeds1 | | | - | | | | - | | | | - | 2 | | | - | | | | - | | | | - | |
| | | | | | | | | | | | | | | | | | | | | | | | | |
| Net asset value, end of period | | $ | 10.98 | | | $ | 10.32 | | | $ | 10.29 | | | $ | 10.33 | | | $ | 10.52 | | | $ | 10.54 | |
| | | | | | | | | | | | | | | | | | | | | | | | | |
| Total return3 | | | 6.98 | % | | | 1.37 | % | | | (0.39 | )% 4 | | | 0.08 | % | | | 4.48 | % | | | 0.88 | % |
| | | | | | | | | | | | | | | | | | | | | | | | | |
| Ratios and Supplemental Data: | | | | | | | | | | | | | | | | | | | | | | | | |
| Net assets, end of period (in thousands) | | $ | 884 | | | $ | 1,142 | | | $ | 1,532 | | | $ | 1,634 | | | $ | 1,990 | | | $ | 1,954 | |
| | | | | | | | | | | | | | | | | | | | | | | | | |
| Ratio of expenses to average net assets (including dividends | | | | | | | | | | | | | | | | | | | | | | | | |
| on securities sold short and interest expense): | | | | | | | | | | | | | | | | | | | | | | | | |
| Before fees waived and expenses absorbed/recovered6 | | | 2.58 | % | | | 2.55 | % | | | 2.81 | % 5 | | | 2.31 | % 7 | | | 2.53 | % | | | 2.28 | % |
| After fees waived and expenses absorbed/recovered6 | | | 2.07 | % | | | 2.25 | % | | | 2.61 | % 5 | | | 2.26 | % 7 | | | 2.53 | % | | | 2.31 | % |
| Ratio of net investment loss to average net assets (including dividends | | | | | | | | | | | | | | | | | | | | | | | | |
| on securities sold short and interest expense): | | | | | | | | | | | | | | | | | | | | | | | | |
| Before fees waived and expenses absorbed/recovered | | | 0.35 | % | | | (1.43 | )% | | | (1.68 | )% 5 | | | (1.39 | )% | | | (0.71 | )% | | | (0.88 | )% |
| After fees waived and expenses absorbed/recovered | | | 0.86 | % | | | (1.13 | )% | | | (1.48 | )% 5 | | | (1.34 | )% | | | (0.71 | )% | | | (0.91 | )% |
| | | | | | | | | | | | | | | | | | | | | | | | | |
| Portfolio turnover rate | | | 303 | % | | | 218 | % | | | 184 | % 4 | | | 256 | % | | | 298 | % | | | 285 | % |
| * | Financial information from January 1, 2018 through December 31, 2020 is for the Kellner Merger Fund, which was reorganized into the AXS Merger Fund as of the close of business on January 22, 2021. See Note 1 in the accompanying Notes to Financial Statements. |
| ** | Fiscal year end changed to September 30, effective January 1, 2021. |
| 1 | Based on average shares outstanding for the period. |
| 2 | Amount represents less than $0.01 per share. |
| 3 | Total returns would have been higher/lower had expenses not been recovered/waived and absorbed by the Advisor. Returns shown do not reflect the deduction of taxes that a shareholder would pay on Fund distributions or the redemption of Fund shares. |
| 6 | If dividends on securities sold short, interest expense and extraordinary expenses had been excluded, the expense ratios would have been lowered by 0.32% and 0.50% for the years ended September 30, 2023 and 2022 and 0.86% for the period January 1, 2021 through September 30, 2021. For the years ended December 31, 2020, 2019 and 2018, the ratios would have been lowered by 0.51%, 0.78% and 0.56%, respectively. |
| 7 | Includes extraordinary expenses of 0.02% that occurred during the Fund’s fiscal year ended December 31, 2020. |
See accompanying Notes to Financial Statements.
AXS Alternative Value Fund
FINANCIAL HIGHLIGHTS
Investor Class*
Per share operating performance.
For a capital share outstanding throughout each period.
| | | | | | | | | For the Period | | | | | | | | | | |
| | | For the Year Ended September 30, | | | July 1, 2021
through | | | For the Year Ended June 30, | |
| | | 2023 | | | 2022 | | | September 30, 2021** | | | 2021 | | | 2020 | | | 2019 | |
| Net asset value, beginning of period | | $ | 10.23 | | | $ | 10.33 | | | $ | 10.58 | | | $ | 8.16 | | | $ | 9.44 | | | $ | 10.23 | |
| Income from Investment Operations: | | | | | | | | | | | | | | | | | | | | | | | | |
| Net investment income (loss)1 | | | 0.01 | | | | 0.11 | | | | 0.03 | | | | 0.07 | | | | 0.10 | | | | 0.11 | |
| Net realized and unrealized gain (loss) | | | 0.90 | | | | 0.19 | | | | (0.30 | ) | | | 3.39 | | | | (0.65 | ) | | | 0.92 | |
| Total from investment operations | | | 0.91 | | | | 0.30 | | | | (0.27 | ) | | | 3.46 | | | | (0.55 | ) | | | 1.03 | |
| | | | | | | | | | | | | | | | | | | | | | | | | |
| Less Distributions: | | | | | | | | | | | | | | | | | | | | | | | | |
| From net investment income | | | (0.06 | ) | | | (0.15 | ) | | | - | | | | (1.04 | ) | | | (0.08 | ) | | | (0.19 | ) |
| From net realized gain | | | (0.08 | ) | | | (0.26 | ) | | | - | | | | - | | | | (0.65 | ) | | | (1.63 | ) |
| Total distributions | | | (0.14 | ) | | | (0.41 | ) | | | - | | | | (1.04 | ) | | | (0.73 | ) | | | (1.82 | ) |
| | | | | | | | | | | | | | | | | | | | | | | | | |
| Redemption fee proceeds1 | | | - | 2 | | | 0.01 | | | | 0.02 | | | | - | | | | - | | | | - | |
| | | | | | | | | | | | | | | | | | | | | | | | | |
| Net asset value, end of period | | $ | 11.00 | | | $ | 10.23 | | | $ | 10.33 | | | $ | 10.58 | | | $ | 8.16 | | | $ | 9.44 | |
| | | | | | | | | | | | | | | | | | | | | | | | | |
| Total return3 | | | 8.79 | % | | | 2.57 | % | | | (2.36 | )% 4 | | | 44.75 | % | | | (6.89 | )% | | | 12.90 | % |
| | | | | | | | | | | | | | | | | | | | | | | | | |
| Ratios and Supplemental Data: | | | | | | | | | | | | | | | | | | | | | | | | |
| Net assets, end of period (in thousands) | | $ | 1,822 | | | $ | 2,010 | | | $ | 629 | | | $ | 584 | | | $ | 540 | | | $ | 545 | |
| | | | | | | | | | | | | | | | | | | | | | | | | |
| Ratio of expenses to average net assets (including interest expense): | | | | | | | | | | | | | | | | | | | | | | | | |
| Before fees waived and expenses absorbed/recovered5 | | | 3.32 | % | | | 2.42 | % | | | 8.13 | % 6 | | | 13.41 | % | | | 2.87 | % | | | 2.96 | % |
| After fees waived and expenses absorbed/recovered5 | | | 2.68 | % | | | 1.78 | % | | | 1.57 | % 6 | | | 1.65 | % | | | 2.02 | % | | | 2.07 | % |
| Ratio of net investment income (loss) to average net assets (including interest expense): | | | | | | | | | | | | | | | | | | | | | | | | |
| Before fees waived and expenses absorbed/recovered | | | (0.59 | )% | | | 0.33 | % | | | (5.55 | )% 6 | | | (11.06 | )% | | | 2.01 | % | | | 2.28 | % |
| After fees waived and expenses absorbed/recovered | | | 0.05 | % | | | 0.97 | % | | | 1.01 | % 6 | | | 0.70 | % | | | 1.16 | % | | | 1.39 | % |
| | | | | | | | | | | | | | | | | | | | | | | | | |
| Portfolio turnover rate | | | 33 | % | | | 26 | % | | | 6 | % 4 | | | 50 | % | | | 74 | % | | | 64 | % |
| * | Financial information from June 30, 2019 through March 5, 2021 is for the AXS Alternative Value Fund (formerly, Cognios Large Cap Value Fund), which was reorganized into the AXS Alternative Value Fund as of the close of business on March 5, 2021. See Note 1 in the accompanying Notes to Financial Statements. |
| ** | Fiscal year end changed to September 30, effective July 1, 2021. |
| 1 | Based on average shares outstanding for the period. |
| 2 | Amount represents less than $0.01 per share. |
| 3 | Total returns would have been lower had expenses not been waived/recovered or absorbed by the Advisor. Returns shown include 12b-1 fees of up to 0.25% and do not reflect the deduction of taxes that a shareholder would pay on Fund distributions or the redemption of Fund shares. |
| 5 | If interest expense had been excluded, the expense ratios would have been lowered by 1.58% for the year ended September 30, 2023. For the periods ended September 30, 2022 and 2021 and June 30, 2021, 2020 and 2019, the ratios would have been lowered by 0.68% 0.47%, 0.55%, 0.92% and 0.97%, respectively. |
See accompanying Notes to Financial Statements.
AXS Alternative Value Fund
FINANCIAL HIGHLIGHTS
Class I*
Per share operating performance.
For a capital share outstanding throughout each period.
| | | | | | | | | For the Period | | | | | | | | | | |
| | | For the Year Ended September 30, | | | July 1, 2021 through | | | For the Year Ended June 30, | |
| | | 2023 | | | 2022 | | | September 30, 2021** | | | 2021 | | | 2020 | | | 2019 | |
| Net asset value, beginning of period | | $ | 10.22 | | | $ | 10.33 | | | $ | 10.58 | | | $ | 8.16 | | | $ | 9.43 | | | $ | 10.25 | |
| Income from Investment Operations: | | | | | | | | | | | | | | | | | | | | | | | | |
| Net investment income (loss)1 | | | 0.03 | | | | 0.14 | | | | 0.03 | | | | 0.08 | | | | 0.13 | | | | 0.18 | |
| Net realized and unrealized gain (loss) | | | 0.90 | | | | 0.19 | | | | (0.28 | ) | | | 3.42 | | | | (0.66 | ) | | | 0.82 | |
| Total from investment operations | | | 0.93 | | | | 0.33 | | | | (0.25 | ) | | | 3.50 | | | | (0.53 | ) | | | 1.00 | |
| | | | | | | | | | | | | | | | | | | | | | | | | |
| Less Distributions: | | | | | | | | | | | | | | | | | | | | | | | | |
| From net investment income | | | (0.08 | ) | | | (0.18 | ) | | | - | | | | (1.08 | ) | | | (0.09 | ) | | | (0.19 | ) |
| From net realized gain | | | (0.08 | ) | | | (0.26 | ) | | | - | | | | - | | | | (0.65 | ) | | | (1.63 | ) |
| Total distributions | | | (0.16 | ) | | | (0.44 | ) | | | - | | | | (1.08 | ) | | | (0.74 | ) | | | (1.82 | ) |
| | | | | | | | | | | | | | | | | | | | | | | | | |
| Redemption fee proceeds1 | | | - | 2 | | | - | 2 | | | - | 2 | | | - | 2 | | | - | | | | - | |
| | | | | | | | | | | | | | | | | | | | | | | | | |
| Net asset value, end of period | | $ | 10.99 | | | $ | 10.22 | | | $ | 10.33 | | | $ | 10.58 | | | $ | 8.16 | | | $ | 9.43 | |
| | | | | | | | | | | | | | | | | | | | | | | | | |
| Total return3 | | | 8.98 | % | | | 2.78 | % | | | (2.36 | )% 4 | | | 45.36 | % | | | (6.67 | )% | | | 12.56 | % |
| | | | | | | | | | | | | | | | | | | | | | | | | |
| Ratios and Supplemental Data: | | | | | | | | | | | | | | | | | | | | | | | | |
| Net assets, end of period (in thousands) | | $ | 11,642 | | | $ | 16,841 | | | $ | 771 | | | $ | 684 | | | $ | 10,766 | | | $ | 19,947 | |
| | | | | | | | | | | | | | | | | | | | | | | | | |
| Ratio of expenses to average net assets (including interest expense): | | | | | | | | | | | | | | | | | | | | | | | | |
| Before fees waived and expenses absorbed/recovered5 | | | 3.07 | % | | | 2.17 | % | | | 7.88 | % 6 | | | 13.16 | % | | | 2.62 | % | | | 2.71 | % |
| After fees waived and expenses absorbed/recovered5 | | | 2.43 | % | | | 1.53 | % | | | 1.32 | % 6 | | | 1.40 | % | | | 1.77 | % | | | 1.82 | % |
| Ratio of net investment income (loss) to average net assets (including interest expense): | | | | | | | | | | | | | | | | | | | | | | | | |
| Before fees waived and expenses absorbed/recovered | | | (0.34 | )% | | | 0.58 | % | | | (5.30 | )% 6 | | | (10.81 | )% | | | 2.26 | % | | | 2.53 | % |
| After fees waived and expenses absorbed/recovered | | | 0.30 | % | | | 1.22 | % | | | 1.26 | % 6 | | | 0.95 | % | | | 1.41 | % | | | 1.64 | % |
| | | | | | | | | | | | | | | | | | | | | | | | | |
| Portfolio turnover rate | | | 33 | % | | | 26 | % | | | 6 | % 4 | | | 50 | % | | | 74 | % | | | 64 | % |
| * | Financial information from June 30, 2019 through March 5, 2021 is for the AXS Alternative Value Fund (formerly, Cognios Large Cap Value Fund), which was reorganized into the AXS Alternative Value Fund as of the close of business on March 5, 2021. See Note 1 in the accompanying Notes to Financial Statements. |
| ** | Fiscal year end changed to September 30, effective July 1, 2021. |
| 1 | Based on average shares outstanding for the period. |
| 2 | Amount represents less than $0.01 per share. |
| 3 | Total returns would have been lower had fees not been waived/recovered or absorbed by the Advisor. These returns do not reflect the deduction of taxes that a shareholder would pay on the Fund distributions or redemption of Fund shares. |
| 5 | If interest expense had been excluded, the expense ratios would have been lowered by 1.58% for the year ended September 30, 2023. For the periods ended September 30, 2022 and 2021 and June 30, 2021, 2020 and 2019, the ratios would have been lowered by 0.68%, 0.47%, 0.55%, 0.92% and 0.97%, respectively. |
See accompanying Notes to Financial Statements.
AXS Market Neutral Fund
FINANCIAL HIGHLIGHTS
Investor Class*
Per share operating performance.
For a capital share outstanding throughout each period.
| | | | | | | | | For the Period | | | | | | | | | | |
| | | For the Year Ended September 30, | | | July 1, 2021 through | | | For the Year Ended June 30, | |
| | | 2023 | | | 2022 | | | September 30, 2021** | | | 2021 | | | 2020 | | | 2019 | |
| Net asset value, beginning of period | | $ | 11.46 | | | $ | 9.94 | | | $ | 10.06 | | | $ | 10.15 | | | $ | 10.00 | | | $ | 10.31 | |
| Income from Investment Operations: | | | | | | | | | | | | | | | | | | | | | | | | |
| Net investment income (loss)1 | | | 0.08 | | | | (0.08 | ) | | | (0.04 | ) | | | (0.15 | ) | | | (0.11 | ) | | | (0.05 | ) |
| Net realized and unrealized gain (loss) | | | 0.44 | | | | 1.60 | | | | (0.08 | ) | | | 0.06 | | | | 0.26 | | | | (0.26 | ) |
| Total from investment operations | | | 0.52 | | | | 1.52 | | | | (0.12 | ) | | | (0.09 | ) | | | 0.15 | | | | (0.31 | ) |
| | | | | | | | | | | | | | | | | | | | | | | | | |
| Redemption fee proceeds1 | | | - | 2 | | | - | 2 | | | - | | | | - | 2 | | | - | | | | - | |
| | | | | | | | | | | | | | | | | | | | | | | | | |
| Net asset value, end of period | | $ | 11.98 | | | $ | 11.46 | | | $ | 9.94 | | | $ | 10.06 | | | $ | 10.15 | | | $ | 10.00 | |
| | | | | | | | | | | | | | | | | | | | | | | | | |
| Total return3 | | | 4.54 | % | | | 15.29 | % | | | (1.19 | )% 4 | | | (0.89 | )% | | | 1.50 | % | | | (3.01 | )% |
| | | | | | | | | | | | | | | | | | | | | | | | | |
| Ratios and Supplemental Data: | | | | | | | | | | | | | | | | | | | | | | | | |
| Net assets, end of period (in thousands) | | $ | 1,070 | | | $ | 2,031 | | | $ | 2,042 | | | $ | 2,188 | | | $ | 7,155 | | | $ | 17,931 | |
| | | | | | | | | | | | | | | | | | | | | | | | | |
| Ratio of expenses to average net assets (including dividends on securities sold short and interest expense): | | | | | | | | | | | | | | | | | | | | | | | | |
| Before fees waived and expenses absorbed/recovered5 | | | 4.76 | % | | | 4.65 | % | | | 5.36 | % 6 | | | 5.97 | % | | | 4.86 | % | | | 4.27 | % |
| After fees waived and expenses absorbed/recovered5 | | | 3.95 | % | | | 3.88 | % | | | 4.36 | % 6 | | | 4.22 | % | | | 4.34 | % | | | 3.88 | % |
| Ratio of net investment income (loss) to average net assets (including dividends on securities sold short and interest expense): | | | | | | | | | | | | | | | | | | | | | | | | |
| Before fees waived and expenses absorbed/recovered | | | (0.10 | )% | | | (1.51 | )% | | | (2.67 | )% 6 | | | (3.21 | )% | | | (1.61 | )% | | | (0.65 | )% |
| After fees waived and expenses absorbed/recovered | | | 0.71 | % | | | (0.74 | )% | | | (1.67 | )% 6 | | | (1.46 | )% | | | (1.09 | )% | | | (0.26 | )% |
| | | | | | | | | | | | | | | | | | | | | | | | | |
| Portfolio turnover rate | | | 127 | % | | | 42 | % | | | 15 | % 4 | | | 91 | % | | | 137 | % | | | 159 | % |
| * | Financial information for the year ended June 30, 2019 through March 5, 2021 is for the AXS Market Neutral Fund (formerly, Cognios Market Neutral Large Cap Fund), which was reorganized into the AXS Market Neutral Fund as of the close of business on March 5, 2021. See Note 1 in the accompanying Notes to Financial Statements. |
| ** | Fiscal year end changed to September 30, effective July 1, 2021. |
| 1 | Based on average shares outstanding for the period. |
| 2 | Amount represents less than $0.01 per share. |
| 3 | Total returns would have been lower had expenses not been waived or absorbed by the Advisor. Returns shown include 12b-1 fees of up to 0.25% and do not reflect the deduction of taxes that a shareholder would pay on Fund distributions or the redemption of Fund shares. |
| 5 | If interest expense and dividends on securities sold short had been excluded, the expense ratios would have been lowered by 2.25% for the year ended September 30, 2023. For the periods ended September 30, 2022 and 2021, the periods ended June 30, 2021, 2020 and 2019, the ratios would have been lowered by 2.18%, 2.66%, 2.52%, 2.64% and 2.19%, respectively. |
See accompanying Notes to Financial Statements.
AXS Market Neutral Fund
FINANCIAL HIGHLIGHTS
Class I*
Per share operating performance.
For a capital share outstanding throughout each period.
| | | | | | | | | For the Period | | | | | | | | | | |
| | | For the Year Ended September 30, | | | July 1, 2021 through | | | For the Year Ended June 30, | |
| | | 2023 | | | 2022 | | | September 30, 2021** | | | 2021 | | | 2020 | | | 2019 | |
| Net asset value, beginning of period | | $ | 11.73 | | | $ | 10.15 | | | $ | 10.28 | | | $ | 10.35 | | | $ | 10.17 | | | $ | 10.46 | |
| Income from Investment Operations: | | | | | | | | | | | | | | | | | | | | | | | | |
| Net investment income (loss)1 | | | 0.12 | | | | (0.06 | ) | | | (0.04 | ) | | | (0.12 | ) | | | (0.08 | ) | | | 0.01 | |
| Net realized and unrealized gain (loss) | | | 0.45 | | | | 1.64 | | | | (0.09 | ) | | | 0.05 | | | | 0.26 | | | | (0.30 | ) |
| Total from investment operations | | | 0.57 | | | | 1.58 | | | | (0.13 | ) | | | (0.07 | ) | | | 0.18 | | | | (0.29 | ) |
| | | | | | | | | | | | | | | | | | | | | | | | | |
| Redemption fee proceeds1 | | | - | 2 | | | - | 2 | | | - | | | | - | 2 | | | - | | | | - | |
| | | | | | | | | | | | | | | | | | | | | | | | | |
| Net asset value, end of period | | $ | 12.30 | | | $ | 11.73 | | | $ | 10.15 | | | $ | 10.28 | | | $ | 10.35 | | | $ | 10.17 | |
| | | | | | | | | | | | | | | | | | | | | | | | | |
| Total return3 | | | 4.86 | % | | | 15.57 | % | | | (1.26 | )% 4 | | | (0.68 | )% | | | 1.77 | % | | | (2.77 | )% |
| | | | | | | | | | | | | | | | | | | | | | | | | |
| Ratios and Supplemental Data: | | | | | | | | | | | | | | | | | | | | | | | | |
| Net assets, end of period (in thousands) | | $ | 17,655 | | | $ | 19,021 | | | $ | 7,493 | | | $ | 9,537 | | | $ | 31,433 | | | $ | 74,525 | |
| | | | | | | | | | | | | | | | | | | | | | | | | |
| Ratio of expenses to average net assets (including dividends on securities sold short and interest expense): | | | | | | | | | | | | | | | | | | | | | | | | |
| Before fees waived and expenses absorbed/recovered5 | | | 4.51 | % | | | 4.40 | % | | | 5.11 | % 6 | | | 5.72 | % | | | 4.61 | % | | | 4.02 | % |
| After fees waived and expenses absorbed/recovered5 | | | 3.70 | % | | | 3.63 | % | | | 4.11 | % 6 | | | 3.97 | % | | | 4.09 | % | | | 3.63 | % |
| Ratio of net investment income (loss) to average net assets (including dividends on securities sold short and interest expense): | | | | | | | | | | | | | | | | | | | | | | | | |
| Before fees waived and expenses absorbed/recovered | | | 0.15 | % | | | (1.26 | )% | | | (2.42 | )% 6 | | | (2.96 | )% | | | (1.36 | )% | | | (0.40 | )% |
| After fees waived and expenses absorbed/recovered | | | 0.96 | % | | | (0.49 | )% | | | (1.42 | )% 6 | | | (1.21 | )% | | | (0.84 | )% | | | (0.01 | )% |
| | | | | | | | | | | | | | | | | | | | | | | | | |
| Portfolio turnover rate | | | 127 | % | | | 42 | % | | | 15 | % 4 | | | 91 | % | | | 137 | % | | | 159 | % |
| * | Financial information for the year ended June 30, 2019 through March 5, 2021 is for the AXS Market Neutral Fund (formerly, Cognios Market Neutral Large Cap Fund), which was reorganized into the AXS Market Neutral Fund as of the close of business on March 5, 2021. See Note 1 in the accompanying Notes to Financial Statements. |
| ** | Fiscal year end changed to September 30, effective July 1, 2021. |
| 1 | Based on average shares outstanding for the period. |
| 2 | Amount represents less than $0.01 per share. |
| 3 | Total returns would have been lower had fees not been waived or absorbed by the Advisor. These returns do not reflect the deduction of taxes that a shareholder would pay on the Fund distributions or redemption of Fund shares. |
| 5 | If interest expense and dividends on securities sold short had been excluded, the expense ratios would have been lowered by 2.25% for the year ended September 30, 2023. For the period ended September 30, 2022 and 2021, the periods ended June 30, 2021, 2020 and 2019, the ratios would have been lowered by 2.18%, 2.66%, 2.52%, 2.64% and 2.19%, respectively. |
See accompanying Notes to Financial Statements.
AXS Adaptive Plus Fund
FINANCIAL HIGHLIGHTS
Class I
Per share operating performance.
For a capital share outstanding throughout each period.
| | | | | | For the Period | |
| | | For the | | | September 15, 2022* | |
| | | Year Ended | | | through | |
| | | September 30, 2023 | | | September 30, 2022 | |
| Net asset value, beginning of period | | $ | 10.31 | | | $ | 10.00 | |
| Income from Investment Operations: | | | | | | | | |
| Net investment income (loss)1 | | | 0.16 | | | | - | 2 |
| Net realized and unrealized gain (loss) on investments and purchased options contracts | | | (0.52 | ) | | | 0.31 | |
| Net increase from payment by affiliates (Note 3) | | | - | 2 | | | - | |
| Total from investment operations | | | (0.36 | ) | | | 0.31 | |
| | | | | | | | | |
| Less Distributions: | | | | | | | | |
| From net investment income | | | (0.03 | ) | | | - | |
| Total distributions | | | (0.03 | ) | | | - | |
| | | | | | | | | |
| Net asset value, end of period | | $ | 9.92 | | | $ | 10.31 | |
| | | | | | | | | |
| Total return3 | | | (3.51 | )% | | | 3.10 | % 4 |
| | | | | | | | | |
| Ratios and Supplemental Data: | | | | | | | | |
| Net assets, end of period (in thousands) | | $ | 31,383 | | | $ | 11,993 | |
| | | | | | | | | |
| Ratio of expenses to average net assets: | | | | | | | | |
| Before fees waived and expenses absorbed/recovered | | | 2.31 | % | | | 19.43 | % 5 |
| After fees waived and expenses absorbed/recovered | | | 1.99 | % | | | 1.99 | % 5 |
| Ratio of net investment income (loss) to average net assets: | | | | | | | | |
| Before fees waived and expenses absorbed/recovered | | | 1.29 | % | | | (17.50 | )% 5 |
| After fees waived and expenses absorbed/recovered | | | 1.61 | % | | | (0.06 | )% 5 |
| | | | | | | | | |
| Portfolio turnover rate | | | - | % | | | - | % 4 |
| * | Commencement of operations. |
| 1 | Based on average shares outstanding for the period. |
| 2 | Amount represents less than $0.01 per share. |
| 3 | Total returns would have been higher/lower had expenses not been recovered/waived and absorbed by the Advisor. Returns shown do not reflect the deduction of taxes that a shareholder would pay on Fund distributions or the redemption of Fund shares. |
See accompanying Notes to Financial Statements.
AXS Income Opportunities Fund*
FINANCIAL HIGHLIGHTS
Class A*
Per share operating performance.
For a capital share outstanding throughout each period.
| | | For the Period Ended | | | For the Year Ended August 31, | |
| | | September 30, 20231 | | | 2023 | | | 2022 | | | 2021 | | | 2020 | | | 2019 | |
| Net asset value, beginning of period | | $ | 15.13 | | | $ | 15.91 | | | $ | 19.02 | | | $ | 15.74 | | | $ | 21.77 | | | $ | 22.46 | |
| Income from Investment Operations: | | | | | | | | | | | | | | | | | | | | | | | | |
| Net investment income (loss)2 | | | 0.13 | | | | 0.49 | | | | 0.41 | | | | 0.30 | | | | 0.68 | | | | 0.85 | |
| Net realized and unrealized gain (loss) | | | (0.62 | ) | | | (0.19 | ) | | | (2.45 | ) | | | 4.06 | | | | (5.48 | ) | | | (0.10 | ) |
| Total from investment operations | | | (0.49 | ) | | | 0.30 | | | | (2.04 | ) | | | 4.36 | | | | (4.80 | ) | | | 0.75 | |
| | | | | | | | | | | | | | | | | | | | | | | | | |
| Less Distributions: | | | | | | | | | | | | | | | | | | | | | | | | |
| From net investment income | | | (0.13 | ) | | | (0.64 | ) | | | (0.42 | ) | | | (0.57 | ) | | | (0.90 | ) | | | (1.08 | ) |
| From return of capital | | | (0.13 | ) | | | (0.44 | ) | | | (0.65 | ) | | | (0.51 | ) | | | (0.33 | ) | | | (0.36 | ) |
| Total distributions | | | (0.26 | ) | | | (1.08 | ) | | | (1.07 | ) | | | (1.08 | ) | | | (1.23 | ) | | | (1.44 | ) |
| | | | | | | | | | | | | | | | | | | | | | | | | |
| Net asset value, end of period | | $ | 14.38 | | | $ | 15.13 | | | $ | 15.91 | | | $ | 19.02 | | | $ | 15.74 | | | $ | 21.77 | |
| | | | | | | | | | | | | | | | | | | | | | | | | |
| Total return3 | | | (3.23 | )% 4 | | | 2.81 | % | | | (11.15 | )% | | | 28.78 | % | | | (22.43 | )% | | | 3.82 | % |
| | | | | | | | | | | | | | | | | | | | | | | | | |
| Ratios and Supplemental Data: | | | | | | | | | | | | | | | | | | | | | | | | |
| Net assets, end of period (in thousands) | | $ | 2,334 | | | $ | 2,445 | | | $ | 3,509 | | | $ | 7,427 | | | $ | 14,444 | | | $ | 62,963 | |
| | | | | | | | | | | | | | | | | | | | | | | | | |
| Ratio of expenses to average net assets (including dividends on securities sold short and interest expense): | | | | | | | | | | | | | | | | | | | | | | | | |
| Before fees waived and expenses absorbed/recovered5 | | | 2.95 | % 6 | | | 2.35 | % | | | 1.81 | % | | | 1.65 | % | | | 1.82 | % | | | 2.04 | % |
| After fees waived and expenses absorbed/recovered5 | | | 2.45 | % 6 | | | 2.23 | % | | | 1.76 | % | | | 1.69 | % | | | 1.80 | % | | | 2.04 | % |
| Ratio of net investment income (loss) to average net assets (including dividends on securities sold short and interest expense): | | | | | | | | | | | | | | | | | | | | | | | | |
| Before fees waived and expenses absorbed/recovered | | | 10.28 | % 6 | | | 3.26 | % | | | 2.24 | % | | | 1.80 | % | | | 3.34 | % | | | 3.96 | % |
| After fees waived and expenses absorbed/recovered | | | 10.78 | % 6 | | | 3.38 | % | | | 2.29 | % | | | 1.76 | % | | | 3.36 | % | | | 3.96 | % |
| | | | | | | | | | | | | | | | | | | | | | | | | |
| Portfolio turnover rate | | | 5 | % 4 | | | 46 | % | | | 93 | % | | | 149 | % | | | 153 | % | | | 131 | % |
| * | Financial information from August 31, 2019 through May 13, 2022 is for the Orinda Income Opportunities Fund, which was reorganized into the AXS Income Opportunities Fund as of the close of business on May 13, 2022. See Note 1 in the accompanying Notes to Financial Statements. |
| 1 | Fiscal year end changed to September 30, effective September 1, 2023. |
| 2 | Based on average shares outstanding for the period. |
| 3 | Total returns would have been higher/lower had expenses not been recovered/waived and absorbed by the Advisor. Returns shown include Rule 12b-1 fees of up to 0.25% and do not reflect the deduction of taxes that a shareholder would pay on Fund distributions or the redemption of Fund shares. Returns shown do not include payment of sales load of 5.75% of offering price which will not apply on sales of $1 million or more. If the sales charge was included total returns would be lower. |
| 5 | If dividends on securities sold short and interest expense had been excluded, the expense ratios would have been lower by 0.80% for the period ended September 30, 2023. For years ended August 31, 2023, 2022, 2021, 2020, and 2019, the expense ratios would have been lower by 0.58%, 0.17%, 0.08%, 0.25%, and 0.46%, respectively. |
See accompanying Notes to Financial Statements.
AXS Income Opportunities Fund*
FINANCIAL HIGHLIGHTS
Class D*
Per share operating performance.
For a capital share outstanding throughout each period.
| | | For the Period Ended | | | For the Year Ended August 31, | |
| | | September 30, 20231 | | | 2023 | | | 2022 | | | 2021 | | | 2020 | | | 2019 | |
| Net asset value, beginning of period | | $ | 14.79 | | | $ | 15.56 | | | $ | 18.66 | | | $ | 15.49 | | | $ | 21.52 | | | $ | 22.23 | |
| Income from Investment Operations: | | | | | | | | | | | | | | | | | | | | | | | | |
| Net investment income (loss)2 | | | 0.12 | | | | 0.37 | | | | 0.27 | | | | 0.15 | | | | 0.49 | | | | 0.73 | |
| Net realized and unrealized gain (loss) | | | (0.61 | ) | | | (0.16 | ) | | | (2.40 | ) | | | 4.00 | | | | (5.36 | ) | | | (0.13 | ) |
| Total from investment operations | | | (0.49 | ) | | | 0.21 | | | | (2.13 | ) | | | 4.15 | | | | (4.87 | ) | | | 0.60 | |
| | | | | | | | | | | | | | | | | | | | | | | | | |
| Less Distributions: | | | | | | | | | | | | | | | | | | | | | | | | |
| From net investment income | | | (0.12 | ) | | | (0.58 | ) | | | (0.32 | ) | | | (0.47 | ) | | | (0.83 | ) | | | (0.95 | ) |
| From return of capital | | | (0.12 | ) | | | (0.40 | ) | | | (0.65 | ) | | | (0.51 | ) | | | (0.33 | ) | | | (0.36 | ) |
| Total distributions | | | (0.24 | ) | | | (0.98 | ) | | | (0.97 | ) | | | (0.98 | ) | | | (1.16 | ) | | | (1.31 | ) |
| | | | | | | | | | | | | | | | | | | | | | | | | |
| Net asset value, end of period | | $ | 14.06 | | | $ | 14.79 | | | $ | 15.56 | | | $ | 18.66 | | | $ | 15.49 | | | $ | 21.52 | |
| | | | | | | | | | | | | | | | | | | | | | | | | |
| Total return3 | | | (3.34 | )% 4 | | | 2.12 | % | | | (11.90 | )% | | | 27.80 | % | | | (22.99 | )% | | | 3.12 | % |
| | | | | | | | | | | | | | | | | | | | | | | | | |
| Ratios and Supplemental Data: | | | | | | | | | | | | | | | | | | | | | | | | |
| Net assets, end of period (in thousands) | | $ | 5,673 | | | $ | 5,936 | | | $ | 7,364 | | | $ | 10,420 | | | $ | 9,626 | | | $ | 17,939 | |
| | | | | | | | | | | | | | | | | | | | | | | | | |
| Ratio of expenses to average net assets (including dividends on securities sold short and interest expense): | | | | | | | | | | | | | | | | | | | | | | | | |
| Before fees waived and expenses absorbed/recovered5 | | | 3.70 | % 6 | | | 3.10 | % | | | 2.56 | % | | | 2.40 | % | | | 2.70 | % | | | 2.80 | % |
| After fees waived and expenses absorbed/recovered5 | | | 3.20 | % 6 | | | 2.98 | % | | | 2.51 | % | | | 2.43 | % | | | 2.68 | % | | | 2.80 | % |
| Ratio of net investment income (loss) to average net assets (including dividends on securities sold short and interest expense): | | | | | | | | | | | | | | | | | | | | | | | | |
| Before fees waived and expenses absorbed/recovered | | | 9.53 | % 6 | | | 2.51 | % | | | 1.49 | % | | | 0.90 | % | | | 2.65 | % | | | 3.43 | % |
| After fees waived and expenses absorbed/recovered | | | 10.03 | % 6 | | | 2.63 | % | | | 1.54 | % | | | 0.88 | % | | | 2.67 | % | | | 3.43 | % |
| | | | | | | | | | | | | | | | | | | | | | | | | |
| Portfolio turnover rate | | | 5 | % 4 | | | 46 | % | | | 93 | % | | | 149 | % | | | 153 | % | | | 131 | % |
| * | Financial information from August 31, 2019 through May 13, 2022 is for the Orinda Income Opportunities Fund, which was reorganized into the AXS Income Opportunities Fund as of the close of business on May 13, 2022. See Note 1 in the accompanying Notes to Financial Statements. |
| 1 | Fiscal year end changed to September 30, effective September 1, 2023. |
| 2 | Based on average shares outstanding for the period. |
| 3 | Total returns would have been higher/lower had expenses not been recovered/waived and absorbed by the Advisor. Returns shown include Rule 12b-1 fees of up to 1.00% and do not reflect the deduction of taxes that a shareholder would pay on Fund distributions or the redemption of Fund shares. |
| 5 | If dividends on securities sold short and interest expense had been excluded, the expense ratios would have been lower by 0.80% for the period ended September 30, 2023. For years ended August 31, 2023, 2022, 2021, 2020, and 2019, the expense ratios would have been lower by 0.58%, 0.17%, 0.09%, 0.34%, and 0.52%, respectively. |
See accompanying Notes to Financial Statements.
AXS Income Opportunities Fund*
FINANCIAL HIGHLIGHTS
Class I*
Per share operating performance.
For a capital share outstanding throughout each period.
| | | For the Period Ended | | | For the Year Ended August 31, | |
| | | September 30, 20231 | | | 2023 | | | 2022 | | | 2021 | | | 2020 | | | 2019 | |
| Net asset value, beginning of period | | $ | 15.19 | | | $ | 15.96 | | | $ | 19.08 | | | $ | 15.78 | | | $ | 21.83 | | | $ | 22.50 | |
| Income from Investment Operations: | | | | | | | | | | | | | | | | | | | | | | | | |
| Net investment income (loss)2 | | | 0.13 | | | | 0.53 | | | | 0.45 | | | | 0.32 | | | | 0.67 | | | | 0.95 | |
| Net realized and unrealized gain (loss) | | | (0.62 | ) | | | (0.18 | ) | | | (2.46 | ) | | | 4.10 | | | | (5.44 | ) | | | (0.12 | ) |
| Total from investment operations | | | (0.49 | ) | | | 0.35 | | | | (2.01 | ) | | | 4.42 | | | | (4.77 | ) | | | 0.83 | |
| | | | | | | | | | | | | | | | | | | | | | | | | |
| Less Distributions: | | | | | | | | | | | | | | | | | | | | | | | | |
| From net investment income | | | (0.14 | ) | | | (0.67 | ) | | | (0.46 | ) | | | (0.61 | ) | | | (0.95 | ) | | | (1.14 | ) |
| From return of capital | | | (0.13 | ) | | | (0.45 | ) | | | (0.65 | ) | | | (0.51 | ) | | | (0.33 | ) | | | (0.36 | ) |
| Total distributions | | | (0.27 | ) | | | (1.12 | ) | | | (1.11 | ) | | | (1.12 | ) | | | (1.28 | ) | | | (1.50 | ) |
| | | | | | | | | | | | | | | | | | | | | | | | | |
| Net asset value, end of period | | $ | 14.43 | | | $ | 15.19 | | | $ | 15.96 | | | $ | 19.08 | | | $ | 15.78 | | | $ | 21.83 | |
| | | | | | | | | | | | | | | | | | | | | | | | | |
| Total return3 | | | (3.23 | )% 4 | | | 3.16 | % | | | (10.97 | )% | | | 29.12 | % | | | (22.22 | )% | | | 4.17 | % |
| | | | | | | | | | | | | | | | | | | | | | | | | |
| Ratios and Supplemental Data: | | | | | | | | | | | | | | | | | | | | | | | | |
| Net assets, end of period (in thousands) | | $ | 59,638 | | | $ | 62,787 | | | $ | 120,093 | | | $ | 181,351 | | | $ | 150,062 | | | $ | 206,355 | |
| | | | | | | | | | | | | | | | | | | | | | | | | |
| Ratio of expenses to average net assets (including dividends on securities sold short and interest expense): | | | | | | | | | | | | | | | | | | | | | | | | |
| Before fees waived and expenses absorbed/recovered5 | | | 2.70 | % 6 | | | 2.10 | % | | | 1.56 | % | | | 1.40 | % | | | 1.71 | % | | | 1.79 | % |
| After fees waived and expenses absorbed/recovered5 | | | 2.20 | % 6 | | | 1.98 | % | | | 1.51 | % | | | 1.43 | % | | | 1.69 | % | | | 1.79 | % |
| Ratio of net investment income (loss) to average net assets (including dividends on securities sold short and interest expense): | | | | | | | | | | | | | | | | | | | | | | | | |
| Before fees waived and expenses absorbed/recovered | | | 10.53 | % 6 | | | 3.51 | % | | | 2.49 | % | | | 1.88 | % | | | 3.65 | % | | | 4.43 | % |
| After fees waived and expenses absorbed/recovered | | | 11.03 | % 6 | | | 3.63 | % | | | 2.53 | % | | | 1.85 | % | | | 3.67 | % | | | 4.43 | % |
| | | | | | | | | | | | | | | | | | | | | | | | | |
| Portfolio turnover rate | | | 5 | % 4 | | | 46 | % | | | 93 | % | | | 149 | % | | | 153 | % | | | 131 | % |
| * | Financial information from August 31, 2019 through May 13, 2022 is for the Orinda Income Opportunities Fund, which was reorganized into the AXS Income Opportunities Fund as of the close of business on May 13, 2022. See Note 1 in the accompanying Notes to Financial Statements. |
| 1 | Fiscal year end changed to September 30, effective September 1, 2023. |
| 2 | Based on average shares outstanding for the period. |
| 3 | Total returns would have been higher/lower had expenses not been recovered/waived and absorbed by the Advisor. Returns shown do not reflect the deduction of taxes that a shareholder would pay on Fund distributions or the redemption of Fund shares. |
| 5 | If dividends on securities sold short and interest expense had been excluded, the expense ratios would have been lower by 0.80% for the period ended September 30, 2023. For years ended August 31, 2023, 2022, 2021, 2020, and 2019, the expense ratios would have been lower by 0.58%, 0.17%, 0.09%, 0.35%, and 0.50%, respectively. |
See accompanying Notes to Financial Statements.
AXS Dynamic Opportunities Fund^
FINANCIAL HIGHLIGHTS
Class A*
Per share operating performance.
For a capital share outstanding throughout each period.
| | | For the | | | | | | | | | | | | | | | | |
| | | Period Ended | | | For the Year Ended December 31, | |
| | | September 30, 2023 ** | | | 2022 | | | 2021 | | | 2020 | | | 2019 | | | 2018 | |
| Net asset value, beginning of period | | $ | 16.58 | | | $ | 20.32 | | | $ | 20.67 | | | $ | 17.63 | | | $ | 17.33 | | | $ | 17.71 | |
| Income from Investment Operations: | | | | | | | | | | | | | | | | | | | | | | | | |
| Net investment income (loss) 1 | | | 0.07 | | | | (0.13 | ) | | | (0.25 | ) | | | (0.30 | ) | | | (0.20 | ) | | | (0.25 | ) |
| Net realized and unrealized gain (loss) | | | 0.08 | | | | (2.50 | ) | | | 0.39 | | | | 4.25 | | | | 0.56 | | | | 0.04 | 2 |
| Total from investment operations | | | 0.15 | | | | (2.63 | ) | | | 0.14 | | | | 3.95 | | | | 0.36 | | | | (0.21 | ) |
| | | | | | | | | | | | | | | | | | | | | | | | | |
| Less Distributions: | | | | | | | | | | | | | | | | | | | | | | | | |
| From net investment income | | | - | | | | (1.11 | ) | | | (0.49 | ) | | | (0.89 | ) | | | (0.06 | ) | | | (0.17 | ) |
| From return of capital | | | - | | | | - | | | | - | 3 | | | (0.02 | ) | | | - | | | | - | |
| Total distributions | | | - | | | | (1.11 | ) | | | (0.49 | ) | | | (0.91 | ) | | | (0.06 | ) | | | (0.17 | ) |
| | | | | | | | | | | | | | | | | | | | | | | | | |
| Redemption fee proceeds 1 | | | - | 3 | | | - | 3 | | | - | 3 | | | - | 3 | | | - | | | | - | 3 |
| Net asset value, end of period | | $ | 16.73 | | | $ | 16.58 | | | $ | 20.32 | | | $ | 20.67 | | | $ | 17.63 | | | $ | 17.33 | |
| | | | | | | | | | | | | | | | | | | | | | | | | |
| Total return 4 | | | 0.90 | % 5 | | | (12.98 | )% | | | 0.70 | % | | | 22.37 | % | | | 2.09 | % | | | (1.15 | )% |
| | | | | | | | | | | | | | | | | | | | | | | | | |
| Ratios and Supplemental Data: | | | | | | | | | | | | | | | | | | | | | | | | |
| Net assets, end of period (in thousands) | | $ | 1,787 | | | $ | 2,167 | | | $ | 3,200 | | | $ | 2,609 | | | $ | 3,686 | | | $ | 8,961 | |
| | | | | | | | | | | | | | | | | | | | | | | | | |
| Ratio of expenses to average net assets (including dividends on securities sold short and interest expense)6: | | | 2.10 | % 7 | | | 2.05 | % | | | 1.94 | % | | | 2.07 | % | | | 1.95 | % | | | 2.04 | % |
| Ratio of net investment income (loss) to average net assets (including dividends on securities sold short and interest expense): | | | 0.58 | % 7 | | | (0.70 | )% | | | (1.18 | )% | | | (1.61 | )% | | | (1.10 | )% | | | (1.37 | )% |
| | | | | | | | | | | | | | | | | | | | | | | | | |
| Portfolio turnover rate | | | 649 | % 5 | | | 742 | % | | | 330 | % | | | 437 | % | | | 325 | % | | | 271 | % |
| ^ | With the Plan of Reorganization with respect to the AXS Dynamic Opportunity Fund (formerly, ACM Dynamic Opportunity Fund), Class A shareholders received Class A shares of the AXS Dynamic Opportunity Fund effective as of the close of business on May 12, 2023. See Note 1 in the accompanying Notes to Financial Statements. |
| * | Financial information from January 1, 2018 through May 12, 2023 is for the ACM Dynamic Opportunity Fund, which was reorganized into the AXS Dynamic Opportunity Fund as of the close of business on May 12, 2023. See Note 1 in the accompanying Notes to Financial Statements. |
| ** | Fiscal year end changed to September 30, effective July 1, 2023. |
| 1 | Based on average shares outstanding during the period. |
| 2 | Net realized and unrealized gain on investments does not accord with the net amount reported in the Statements of Operations for the year ended December 31, 2018 due to timing of shareholder subscriptions and redemptions relative to fluctuating market values during the year. |
| 3 | Amount represents less than $0.01 per share. |
| 4 | Total returns would have been lower/higher had certain expenses not been waived or absorbed/recovered by the Advisor. These returns include Rule 12b-1 fees of up to 0.25% and do not reflect the deduction of taxes that a shareholder would pay on Fund distributions or the redemption of Fund shares. |
| 6 | If dividends on securities sold short and interest expense had been excluded, the expense ratios would have been lowered by 0.07% for the period ended September 30, 2023. For the years ended December 31, 2022, 2021, 2020, 2019, and 2018, the ratios would have been lowered by 0.08%, 0.06%, 0.10%, 0.02%, and 0.12.%, respectively. |
See accompanying Notes to Financial Statements.
AXS Dynamic Opportunities Fund^
FINANCIAL HIGHLIGHTS
Class I*
Per share operating performance.
For a capital share outstanding throughout each period.
| | | For the | | | | | | | | | | | | | | | | |
| | | Period Ended | | | For the Year Ended December 31, | |
| | | September 30, 2023 ** | | | 2022 | | | 2021 | | | 2020 | | | 2019 | | | 2018 | |
| Net asset value, beginning of period | | $ | 16.88 | | | $ | 20.62 | | | $ | 20.92 | | | $ | 17.82 | | | $ | 17.48 | | | $ | 17.82 | |
| Income from Investment Operations: | | | | | | | | | | | | | | | | | | | | | | | | |
| Net investment income (loss) 1 | | | 0.11 | | | | (0.08 | ) | | | (0.20 | ) | | | (0.26 | ) | | | (0.15 | ) | | | (0.20 | ) |
| Net realized and unrealized gain (loss) | | | 0.08 | | | | (2.55 | ) | | | 0.39 | | | | 4.27 | | | | 0.55 | | | | 0.03 | 2 |
| Total from investment operations | | | 0.19 | | | | (2.63 | ) | | | 0.19 | | | | 4.01 | | | | 0.40 | | | | (0.17 | ) |
| | | | | | | | | | | | | | | | | | | | | | | | | |
| Less Distributions: | | | | | | | | | | | | | | | | | | | | | | | | |
| From net investment income | | | - | | | | (1.11 | ) | | | (0.49 | ) | | | (0.89 | ) | | | (0.06 | ) | | | (0.17 | ) |
| From return of capital | | | - | | | | - | | | | - | 3 | | | (0.02 | ) | | | - | | | | - | |
| Total distributions | | | - | | | | (1.11 | ) | | | (0.49 | ) | | | (0.91 | ) | | | (0.06 | ) | | | (0.17 | ) |
| | | | | | | | | | | | | | | | | | | | | | | | | |
| Redemption fee proceeds 1 | | | - | 3 | | | - | 3 | | | - | 3 | | | - | 3 | | | - | 3 | | | - | 3 |
| Net asset value, end of period | | $ | 17.07 | | | $ | 16.88 | | | $ | 20.62 | | | $ | 20.92 | | | $ | 17.82 | | | $ | 17.48 | |
| | | | | | | | | | | | | | | | | | | | | | | | | |
| Total return 4 | | | 1.13 | % 5 | | | (12.79 | )% | | | 0.93 | % | | | 22.47 | % | | | 2.30 | % | | | (0.92 | )% |
| | | | | | | | | | | | | | | | | | | | | | | | | |
| Ratios and Supplemental Data: | | | | | | | | | | | | | | | | | | | | | | | | |
| Net assets, end of period (in thousands) | | $ | 52,402 | | | $ | 76,514 | | | $ | 101,977 | | | $ | 83,874 | | | $ | 70,270 | | | $ | 77,999 | |
| | | | | | | | | | | | | | | | | | | | | | | | | |
| Ratio of expenses to average net assets (including dividends on securities sold short and interest expense)6: | | | 1.85 | % 7 | | | 1.80 | % | | | 1.69 | % | | | 1.82 | % | | | 1.70 | % | | | 1.79 | % |
| Ratio of net investment income (loss) to average net assets (including dividends on securities sold short and interest expense): | | | 0.83 | % 7 | | | (0.42 | )% | | | (0.93 | )% | | | (1.36 | )% | | | (0.85 | )% | | | (1.12 | )% |
| | | | | | | | | | | | | | | | | | | | | | | | | |
| Portfolio turnover rate | | | 649 | % 5 | | | 742 | % | | | 330 | % | | | 437 | % | | | 325 | % | | | 271 | % |
| ^ | With the Plan of Reorganization with respect to the AXS Dynamic Opportunity Fund (formerly, ACM Dynamic Opportunity Fund), Class I shareholders received Class I shares of the AXS Dynamic Opportunity Fund effective as of the close of business on May 12, 2023. See Note 1 in the accompanying Notes to Financial Statements. |
| * | Financial information from January 1, 2018 through May 12, 2023 is for the ACM Dynamic Opportunity Fund, which was reorganized into the AXS Dynamic Opportunity Fund as of the close of business on May 12, 2023. See Note 1 in the accompanying Notes to Financial Statements. |
| ** | Fiscal year end changed to September 30, effective July 1, 2023. |
| 1 | Based on average shares outstanding during the period. |
| 2 | Net realized and unrealized gain on investments does not accord with the net amount reported in the Statements of Operations for the year ended December 31, 2018 due to timing of shareholder subscriptions and redemptions relative to fluctuating market values during the year. |
| 3 | Amount represents less than $0.01 per share. |
| 4 | Total returns would have been lower/higher had certain expenses not been waived or absorbed/recovered by the Advisor. Returns shown do not reflect the deduction of taxes that a shareholder would pay on Fund distributions or the redemption of Fund shares. |
| 6 | If dividends on securities sold short and interest expense had been excluded, the expense ratios would have been lowered by 0.07% for the period ended September 30, 2023. For the years ended December 31, 2022, 2021, 2020, 2019, and 2018, the ratios would have been lowered by 0.08%, 0.06%, 0.10%, 0.02%, and 0.12%, respectively. |
See accompanying Notes to Financial Statements.
AXS Tactical Income Fund^
FINANCIAL HIGHLIGHTS
Class A*
Per share operating performance.
For a capital share outstanding throughout each period.
| | | For the | | | | | | | | | | | | | |
| | | Period Ended | | | For the Year Ended December 31, | |
| | | September 30, 2023 ** | | | 2022 | | | 2021 | | | 2020 | | | 2019*** | |
| Net asset value, beginning of period | | $ | 9.11 | | | $ | 10.12 | | | $ | 10.54 | | | $ | 10.13 | | | $ | 10.00 | |
| Income from Investment Operations: | | | | | | | | | | | | | | | | | | | | |
| Net investment income (loss) 1 | | | 0.36 | | | | 0.21 | | | | 0.38 | | | | 0.34 | | | | 0.48 | |
| Net realized and unrealized gain (loss) | | | (0.43 | ) | | | (1.00 | ) | | | (0.44 | ) | | | 0.34 | | | | 0.03 | 2 |
| Total from investment operations | | | (0.07 | ) | | | (0.79 | ) | | | (0.06 | ) | | | 0.68 | | | | 0.51 | |
| | | | | | | | | | | | | | | | | | | | | |
| Less Distributions: | | | | | | | | | | | | | | | | | | | | |
| From net investment income | | | (0.35 | ) | | | (0.22 | ) | | | (0.36 | ) | | | (0.28 | ) | | | (0.37 | ) |
| Return of capital | | | - | | | | - | | | | - | 3 | | | (0.01 | ) | | | (0.01 | ) |
| Total distributions | | | (0.35 | ) | | | (0.22 | ) | | | (0.36 | ) | | | (0.29 | ) | | | (0.38 | ) |
| | | | | | | | | | | | | | | | | | | | | |
| Redemption fee proceeds 1 | | | 0.01 | | | | - | 3 | | | - | 3 | | | 0.02 | | | | - | 3 |
| Net asset value, end of period | | $ | 8.70 | | | $ | 9.11 | | | $ | 10.12 | | | $ | 10.54 | | | $ | 10.13 | |
| | | | | | | | | | | | | | | | | | | | | |
| Total return 4 | | | (0.64 | )% 5 | | | (7.89 | )% | | | (0.61 | )% | | | 7.01 | % | | | 5.13 | % 5 |
| | | | | | | | | | | | | | | | | | | | | |
| Ratios and Supplemental Data: | | | | | | | | | | | | | | | | | | | | |
| Net assets, end of period (in thousands) | | $ | 1,654 | | | $ | 2,142 | | | $ | 3,958 | | | $ | 3,887 | | | $ | 1,272 | |
| | | | | | | | | | | | | | | | | | | | | |
| Ratio of expenses to average net assets: | | | | | | | | | | | | | | | | | | | | |
| Before fees waived and expenses absorbed/recovered | | | 1.93 | % 6 | | | 1.83 | % | | | 1.76 | % | | | 1.82 | % | | | 2.35 | % 6,7 |
| After fees waived and expenses absorbed/recovered | | | 1.93 | % 6 | | | 1.83 | % | | | 1.76 | % | | | 1.86 | % 8 | | | 2.25 | % 6,7 |
| Ratio of net investment income (loss) to average net assets: | | | | | | | | | | | | | | | | | | | | |
| Before fees waived and expenses absorbed/recovered | | | 5.25 | % 6 | | | 2.11 | % | | | 3.65 | % | | | 3.35 | % | | | 4.98 | % 6 |
| After fees waived and expenses absorbed/recovered | | | 5.25 | % 6 | | | 2.11 | % | | | 3.65 | % | | | 3.31 | % | | | 5.08 | % 6 |
| | | | | | | | | | | | | | | | | | | | | |
| Portfolio turnover rate | | | 612 | % 5 | | | 894 | % | | | 555 | % | | | 478 | % | | | 645 | % 5 |
| ^ | With the Plan of Reorganization with respect to the AXS Tactical Income Fund (formerly, ACM Tactical Income Fund), Class A shareholders received Class A shares of the AXS Tactical Income Fund effective as of the close of business on May 12, 2023. See Note 1 in the accompanying Notes to Financial Statements. |
| * | Financial information from January 2, 2019 through May 12, 2023 is for the ACM Tactical Income Fund, which was reorganized into the AXS Tactical Income Fund as of the close of business on May 12, 2023. See Note 1 in the accompanying Notes to Financial Statements. |
| ** | Fiscal year end changed to September 30, effective July 1, 2023. |
| *** | The Fund commenced operations on January 2, 2019. |
| 1 | Based on average shares outstanding during the period. |
| 2 | The amount of net realized and unrealized gain on investment per share for the period ended December 31, 2019 does not accord with the amounts in the Statement of Operations due to the timing of purchases and sales of Fund shares in relation to fluctuating market values. |
| 3 | Amount represents less than $0.01 per share. |
| 4 | Total returns would have been lower/higher had certain expenses not been waived or absorbed/recovered by the Advisor. These returns include Rule 12b-1 fees of up to 0.25% and do not reflect the deduction of taxes that a shareholder would pay on Fund distributions or the redemption of Fund shares. |
| 7 | Includes less than 0.01% of interest expense. |
| 8 | Includes recapture of 0.04% during the year. |
See accompanying Notes to Financial Statements.
AXS Tactical Income Fund^
FINANCIAL HIGHLIGHTS
Class I*
Per share operating performance.
For a capital share outstanding throughout each period.
| | | For the | | | | | | | | | | | | | |
| | | Period Ended | | | For the Year Ended December 31, | |
| | | September 30, 2023 ** | | | 2022 | | | 2021 | | | 2020 | | | 2019*** | |
| Net asset value, beginning of period | | $ | 9.11 | | | $ | 10.12 | | | $ | 10.54 | | | $ | 10.13 | | | $ | 10.00 | |
| Income from Investment Operations: | | | | | | | | | | | | | | | | | | | | |
| Net investment income (loss) 1 | | | 0.37 | | | | 0.23 | | | | 0.42 | | | | 0.37 | | | | 0.48 | |
| Net realized and unrealized gain (loss) | | | (0.40 | ) | | | (1.00 | ) | | | (0.45 | ) | | | 0.33 | | | | 0.05 | 2 |
| Total from investment operations | | | (0.03 | ) | | | (0.77 | ) | | | (0.03 | ) | | | 0.70 | | | | 0.53 | |
| | | | | | | | | | | | | | | | | | | | | |
| Less Distributions: | | | | | | | | | | | | | | | | | | | | |
| From net investment income | | | (0.38 | ) | | | (0.24 | ) | | | (0.39 | ) | | | (0.30 | ) | | | (0.39 | ) |
| Return of capital | | | - | | | | - | | | | - | 3 | | | (0.01 | ) | | | (0.01 | ) |
| Total distributions | | | (0.38 | ) | | | (0.24 | ) | | | (0.39 | ) | | | (0.31 | ) | | | (0.40 | ) |
| | | | | | | | | | | | | | | | | | | | | |
| Redemption fee proceeds 1 | | | - | 3 | | | - | 3 | | | - | 3 | | | 0.02 | | | | - | 3 |
| Net asset value, end of period | | $ | 8.70 | | | $ | 9.11 | | | $ | 10.12 | | | $ | 10.54 | | | $ | 10.13 | |
| | | | | | | | | | | | | | | | | | | | | |
| Total return 4 | | | (0.35 | )% 5 | | | (7.66 | )% | | | (0.36 | )% | | | 7.26 | % | | | 5.35 | % 5 |
| | | | | | | | | | | | | | | | | | | | | |
| Ratios and Supplemental Data: | | | | | | | | | | | | | | | | | | | | |
| Net assets, end of period (in thousands) | | $ | 34,848 | | | $ | 41,526 | | | $ | 62,146 | | | $ | 43,420 | | | $ | 19,215 | |
| | | | | | | | | | | | | | | | | | | | | |
| Ratio of expenses to average net assets: | | | | | | | | | | | | | | | | | | | | |
| Before fees waived and expenses absorbed/recovered | | | 1.68 | % 6 | | | 1.58 | % | | | 1.51 | % | | | 1.57 | % | | | 2.10 | % 6,7 |
| After fees waived and expenses absorbed/recovered | | | 1.68 | % 6 | | | 1.58 | % | | | 1.51 | % | | | 1.61 | % 8 | | | 2.00 | % 6,7 |
| Ratio of net investment income (loss) to average net assets: | | | | | | | | | | | | | | | | | | | | |
| Before fees waived and expenses absorbed/recovered | | | 5.50 | % 6 | | | 2.42 | % | | | 4.04 | % | | | 3.60 | % | | | 4.73 | % 6 |
| After fees waived and expenses absorbed/recovered | | | 5.50 | % 6 | | | 2.42 | % | | | 4.04 | % | | | 3.56 | % | | | 4.83 | % 6 |
| | | | | | | | | | | | | | | | | | | | | |
| Portfolio turnover rate | | | 612 | % 5 | | | 894 | % | | | 555 | % | | | 478 | % | | | 645 | % 5 |
| ^ | With the Plan of Reorganization with respect to the AXS Tactical Income Fund (formerly, ACM Tactical Income Fund), Class I shareholders received Class I shares of the AXS Tactical Income Fund effective as of the close of business on May 12, 2023. See Note 1 in the accompanying Notes to Financial Statements. |
| * | Financial information from January 2, 2019 through May 12, 2023 is for the ACM Tactical Income Fund, which was reorganized into the AXS Tactical Income Fund as of the close of business on May 12, 2023. See Note 1 in the accompanying Notes to Financial Statements. |
| ** | Fiscal year end changed to September 30, effective July 1, 2023. |
| *** | The Fund commenced operations on January 2, 2019. |
| 1 | Based on average shares outstanding during the period. |
| 2 | The amount of net realized and unrealized gain on investment per share for the period ended December 31, 2019 does not accord with the amounts in the Statement of Operations due to the timing of purchases and sales of Fund shares in relation to fluctuating market values. |
| 3 | Amount represents less than $0.01 per share. |
| 4 | Total returns would have been lower/higher had expenses not been waived and absorbed/recovered by the Advisor. Returns shown do not reflect the deduction of taxes that a shareholder would pay on Fund distributions or the redemption of Fund shares. |
| 7 | Includes less than 0.01% of interest expense. |
| 8 | Includes recapture of 0.04% during the year. |
See accompanying Notes to Financial Statements.
AXS Chesapeake Strategy Fund
CONSOLIDATED FINANCIAL HIGHLIGHTS
Class A*
Per share operating performance.
For a capital share outstanding throughout each period.
| | | For the Year Ended September 30, | |
| | | 2023 | | | 2022 | | | 2021 | | | 2020 | | | 2019 | |
| Net asset value, beginning of period | | $ | 12.78 | | | $ | 12.21 | | | $ | 9.42 | | | $ | 11.26 | | | $ | 12.54 | |
| Income from Investment Operations: | | | | | | | | | | | | | | | | | | | | |
| Net investment income (loss)1 | | | 0.13 | | | | (0.18 | ) | | | (0.20 | ) | | | (0.02 | ) | | | 0.03 | |
| Net realized and unrealized gain (loss) | | | (0.46 | ) | | | 2.82 | | | | 2.99 | | | | (1.45 | ) | | | (1.21 | ) |
| Total from investment operations | | | (0.33 | ) | | | 2.64 | | | | 2.79 | | | | (1.47 | ) | | | (1.18 | ) |
| | | | | | | | | | | | | | | | | | | | | |
| Less Distributions: | | | | | | | | | | | | | | | | | | | | |
| From net investment income | | | (0.16 | ) | | | (2.07 | ) | | | - | | | | (0.37 | ) | | | (0.05 | ) |
| From net realized gain | | | - | | | | - | | | | - | | | | - | | | | (0.05 | ) |
| Total distributions | | | (0.16 | ) | | | (2.07 | ) | | | - | | | | (0.37 | ) | | | (0.10 | ) |
| | | | | | | | | | | | | | | | | | | | | |
| Net increase from payment by affiliates | | | - | | | | - | | | | - | | | | 0.00 | 2,3 | | | - | |
| | | | | | | | | | | | | | | | | | | | | |
| Net asset value, end of period | | $ | 12.29 | | | $ | 12.78 | | | $ | 12.21 | | | $ | 9.42 | | | $ | 11.26 | |
| | | | | | | | | | | | | | | | | | | | | |
| Total return4 | | | (2.50 | )% | | | 26.21 | % | | | 29.62 | % | | | (13.31 | )% | | | (9.40 | )% |
| | | | | | | | | | | | | | | | | | | | | |
| Ratios and Supplemental Data: | | | | | | | | | | | | | | | | | | | | |
| Net assets, end of period (in thousands) | | $ | 7,963 | | | $ | 8,859 | | | $ | 3,799 | | | $ | 3,376 | | | $ | 5,048 | |
| | | | | | | | | | | | | | | | | | | | | |
| Ratio of expenses to average net assets: | | | | | | | | | | | | | | | | | | | | |
| Before fees waived and expenses absorbed5 | | | 2.54 | % | | | 2.60 | % | | | 3.36 | % | | | 2.35 | % | | | 2.24 | % |
| After fees waived and expenses absorbed5 | | | 2.10 | % | | | 2.10 | % | | | 2.10 | % | | | 2.12 | % | | | 2.10 | % |
| Ratio of net investment income (loss) to average net assets: | | | | | | | | | | | | | | | | | | | | |
| Before fees waived and expenses absorbed | | | 0.61 | % | | | (1.97 | )% | | | (2.96 | )% | | | (0.44 | )% | | | 0.11 | % |
| After fees waived and expenses absorbed | | | 1.05 | % | | | (1.47 | )% | | | (1.70 | )% | | | (0.21 | )% | | | 0.25 | % |
| | | | | | | | | | | | | | | | | | | | | |
| Portfolio turnover rate | | | 0 | % | | | 0 | % | | | 0 | % | | | 0 | % | | | 36 | % |
| * | Financial information from November 8, 2019 and prior is for the Equinox Chesapeake Strategy Fund, which was reorganized into the AXS Chesapeake Strategy Fund as of the close of business on November 8, 2019. See Note 1 in the accompanying Notes to Consolidated Financial Statements. |
| 1 | Based on average shares outstanding for the period. |
| 2 | Amount represents less than $0.005 per share. |
| 3 | The Advisor reimbursed the Fund $457 for losses from a trade error. The payment had no impact to the total return. |
| 4 | Total returns would have been higher/lower had expenses not been recovered/waived and absorbed by the Advisor. Returns shown include Rule 12b-1 fees of up to 0.25% and do not reflect the deduction of taxes that a shareholder would pay on Fund distributions or the redemption of Fund shares. Returns shown do not include payment of sales load of 5.75% of offering price which will not apply on sales of $1 million or more. If the sales charge was included total returns would be lower. |
| 5 | If reorganizational costs and interest expense had been excluded, the expense ratios would have been lower by 0%, 0%, 0%, 0.02% and 0% for years ended September 30, 2023, 2022, 2021, 2020 and 2019, respectively. |
See accompanying Notes to Consolidated Financial Statements.
AXS Chesapeake Strategy Fund
CONSOLIDATED FINANCIAL HIGHLIGHTS
Class I*
Per share operating performance.
For a capital share outstanding throughout each period.
| | | For the Year Ended September 30, | |
| | | 2023 | | | 2022 | | | 2021 | | | 2020 | | | 2019 | |
| Net asset value, beginning of period | | $ | 12.95 | | | $ | 12.34 | | | $ | 9.50 | | | $ | 11.35 | | | $ | 12.65 | |
| Income from Investment Operations: | | | | | | | | | | | | | | | | | | | | |
| Net investment income (loss)1 | | | 0.16 | | | | (0.15 | ) | | | (0.17 | ) | | | - | 2 | | | 0.05 | |
| Net realized and unrealized gain (loss) | | | (0.47 | ) | | | 2.86 | | | | 3.01 | | | | (1.45 | ) | | | (1.22 | ) |
| Total from investment operations | | | (0.31 | ) | | | 2.71 | | | | 2.84 | | | | (1.45 | ) | | | (1.17 | ) |
| | | | | | | | | | | | | | | | | | | | | |
| Less Distributions: | | | | | | | | | | | | | | | | | | | | |
| From net investment income | | | (0.19 | ) | | | (2.10 | ) | | | - | | | | (0.40 | ) | | | (0.08 | ) |
| From net realized gain | | | - | | | | - | | | | - | | | | - | | | | (0.05 | ) |
| Total distributions | | | (0.19 | ) | | | (2.10 | ) | | | - | | | | (0.40 | ) | | | (0.13 | ) |
| | | | | | | | | | | | | | | | | | | | | |
| Net increase from payment by affiliates | | | - | | | | - | | | | - | | | | 0.00 | 2,3 | | | - | |
| | | | | | | | | | | | | | | | | | | | | |
| Net asset value, end of period | | $ | 12.45 | | | $ | 12.95 | | | $ | 12.34 | | | $ | 9.50 | | | $ | 11.35 | |
| | | | | | | | | | | | | | | | | | | | | |
| Total return4 | | | (2.35 | )% | | | 26.58 | % | | | 29.89 | % | | | (13.07 | )% | | | (9.23 | )% |
| | | | | | | | | | | | | | | | | | | | | |
| Ratios and Supplemental Data: | | | | | | | | | | | | | | | | | | | | |
| Net assets, end of period (in thousands) | | $ | 41,683 | | | $ | 45,656 | | | $ | 14,723 | | | $ | 11,955 | | | $ | 90,105 | |
| | | | | | | | | | | | | | | | | | | | | |
| Ratio of expenses to average net assets: | | | | | | | | | | | | | | | | | | | | |
| Before fees waived and expenses absorbed5 | | | 2.29 | % | | | 2.35 | % | | | 3.11 | % | | | 2.10 | % | | | 1.98 | % |
| After fees waived and expenses absorbed5 | | | 1.85 | % | | | 1.85 | % | | | 1.85 | % | | | 1.87 | % | | | 1.85 | % |
| Ratio of net investment income (loss) to average net assets: | | | | | | | | | | | | | | | | | | | | |
| Before fees waived and expenses absorbed | | | 0.86 | % | | | (1.72 | )% | | | (2.71 | )% | | | (0.19 | )% | | | 0.36 | % |
| After fees waived and expenses absorbed | | | 1.30 | % | | | (1.22 | )% | | | (1.45 | )% | | | 0.04 | % | | | 0.49 | % |
| | | | | | | | | | | | | | | | | | | | | |
| Portfolio turnover rate | | | 0 | % | | | 0 | % | | | 0 | % | | | 0 | % | | | 36 | % |
| * | Financial information from November 8, 2019 and prior is for the Equinox Chesapeake Strategy Fund, which was reorganized into the AXS Chesapeake Strategy Fund as of the close of business on November 8, 2019. See Note 1 in the accompanying Notes to Consolidated Financial Statements. |
| 1 | Based on average shares outstanding for the period. |
| 2 | Amount represents less than $0.005 per share. |
| 3 | The Advisor reimbursed the Fund $457 for losses from a trade error. The payment had no impact to the total return. |
| 4 | Total returns would have been higher/lower had expenses not been recovered/waived and absorbed by the Advisor. Returns shown do not reflect the deduction of taxes that a shareholder would pay on Fund distributions or the redemption of Fund shares. |
| 5 | If reorganizational costs and interest expense had been excluded, the expense ratios would have been lower by 0%, 0%, 0%, 0.02% and 0% for years ended September 30, 2023, 2022, 2021, 2020 and 2019, respectively. |
See accompanying Notes to Consolidated Financial Statements.
AXS Chesapeake Strategy Fund
CONSOLIDATED FINANCIAL HIGHLIGHTS
Class C*
Per share operating performance.
For a capital share outstanding throughout each period.
| | | For the Year Ended September 30, | |
| | | 2023 | | | 2022 | | | 2021 | | | 2020 | | | 2019 | |
| Net asset value, beginning of period | | $ | 13.47 | | | $ | 11.85 | | | $ | 9.21 | | | $ | 10.98 | | | $ | 12.26 | |
| Income from Investment Operations: | | | | | | | | | | | | | | | | | | | | |
| Net investment income (loss)1 | | | 0.04 | | | | (0.28 | ) | | | (0.27 | ) | | | (0.10 | ) | | | (0.05 | ) |
| Net realized and unrealized gain (loss) | | | (0.48 | ) | | | 2.99 | | | | 2.91 | | | | (1.41 | ) | | | (1.18 | ) |
| Total from investment operations | | | (0.44 | ) | | | 2.71 | | | | 2.64 | | | | (1.51 | ) | | | (1.23 | ) |
| | | | | | | | | | | | | | | | | | | | | |
| Less Distributions: | | | | | | | | | | | | | | | | | | | | |
| From net investment income | | | (0.10 | ) | | | (1.09 | ) | | | - | | | | (0.26 | ) | | | - | |
| From net realized gain | | | - | | | | - | | | | - | | | | - | | | | (0.05 | ) |
| Total distributions | | | (0.10 | ) | | | (1.09 | ) | | | - | | | | (0.26 | ) | | | (0.05 | ) |
| | | | | | | | | | | | | | | | | | | | | |
| Net increase from payment by affiliates | | | - | | | | - | | | | - | | | | 0.00 | 2,3 | | | - | |
| | | | | | | | | | | | | | | | | | | | | |
| Net asset value, end of period | | $ | 12.93 | | | $ | 13.47 | | | $ | 11.85 | | | $ | 9.21 | | | $ | 10.98 | |
| | | | | | | | | | | | | | | | | | | | | |
| Total return4 | | | (3.27 | )% | | | 25.24 | % | | | 28.66 | % | | | (13.96 | )% | | | (10.04 | )% |
| | | | | | | | | | | | | | | | | | | | | |
| Ratios and Supplemental Data: | | | | | | | | | | | | | | | | | | | | |
| Net assets, end of period (in thousands) | | $ | 4,496 | | | $ | 6,412 | | | $ | 271 | | | $ | 309 | | | $ | 592 | |
| | | | | | | | | | | | | | | | | | | | | |
| Ratio of expenses to average net assets: | | | | | | | | | | | | | | | | | | | | |
| Before fees waived and expenses absorbed5 | | | 3.29 | % | | | 3.35 | % | | | 4.11 | % | | | 3.10 | % | | | 2.99 | % |
| After fees waived and expenses absorbed5 | | | 2.85 | % | | | 2.85 | % | | | 2.85 | % | | | 2.87 | % | | | 2.85 | % |
| Ratio of net investment income (loss) to average net assets: | | | | | | | | | | | | | | | | | | | | |
| Before fees waived and expenses absorbed | | | (0.14 | )% | | | (2.72 | )% | | | (3.71 | )% | | | (1.19 | )% | | | (0.63 | )% |
| After fees waived and expenses absorbed | | | 0.30 | % | | | (2.22 | )% | | | (2.45 | )% | | | (0.96 | )% | | | (0.49 | )% |
| | | | | | | | | | | | | | | | | | | | | |
| Portfolio turnover rate | | | 0 | % | | | 0 | % | | | 0 | % | | | 0 | % | | | 36 | % |
| * | Financial information from November 8, 2019 and prior is for the Equinox Chesapeake Strategy Fund, which was reorganized into the AXS Chesapeake Strategy Fund as of the close of business on November 8, 2019. See Note 1 in the accompanying Notes to Consolidated Financial Statements. |
| 1 | Based on average shares outstanding for the period. |
| 2 | Amount represents less than $0.005 per share. |
| 3 | The Advisor reimbursed the Fund $457 for losses from a trade error. The payment had no impact to the total return. |
| 4 | Total returns would have been higher/lower had expenses not been recovered/waived and absorbed by the Advisor. Returns shown do not reflect the deduction of taxes that a shareholder would pay on Fund distributions or the redemption of Fund shares. |
| 5 | If reorganizational costs and interest expense had been excluded, the expense ratios would have been lower by 0%, 0%, 0%, 0.02% and 0% for years ended September 30, 2023, 2022, 2021, 2020 and 2019, respectively. |
See accompanying Notes to Consolidated Financial Statements.
AXS Funds
NOTES TO FINANCIAL STATEMENTS
September 30, 2023
Note 1 – Organization
AXS Multi-Strategy Alternatives Fund (the “Multi-Strategy Alternatives Fund”), AXS Sustainable Income Fund (the “Sustainable Income Fund”), AXS Thomson Reuters Venture Capital Return Tracker Fund (the “Thomson Reuters Venture Capital Return Tracker Fund”), AXS Merger Fund (the “Merger Fund”), AXS Alternative Value Fund (the “Alternative Value Fund”), AXS Market Neutral Fund (the “Market Neutral Fund”), AXS Adaptive Plus Fund (the “Adaptive Plus Fund”), AXS Income Opportunities Fund (the “Income Opportunities Fund”), AXS Dynamic Opportunity Fund (the “Dynamic Opportunity Fund”) and AXS Tactical Income Fund (the “Tactical Income Fund”) (each a “Fund” and collectively the “Funds”) are organized as a series of Investment Managers Series Trust II, a Delaware statutory trust (the “Trust”) which is registered as an open-end management investment company under the Investment Company Act of 1940, as amended (the “1940 Act”). Each Fund, other than the Merger Fund and the Adaptive Plus Fund, are diversified funds. The Merger Fund and the Adaptive Plus Fund are non-diversified funds.
The Multi-Strategy Alternatives Fund’s investment objective is long-term growth of capital. As a secondary goal, the Fund seeks to manage volatility and market risk. Effective May 1, 2020, the Multi-Strategy Alternatives Fund changed fiscal year end from April 30 to September 30.
The Multi-Strategy Alternatives Fund commenced investment operations on October 21, 2019 with Investor Class (previously R-1 Class Shares) and Class I shares. Prior to that date, the Multi-Strategy Alternatives Fund acquired the assets and assumed the liabilities of the KCM Macro Trends Fund (the “Multi-Strategy Alternatives Predecessor Fund”), a series of Northern Lights Fund Trust, which offered two classes of shares, Investor Class (previously R-1 Class Shares) and Institutional Class, in a tax-free reorganization as set out in the Agreement and Plan of Reorganization. The proposed Plan of Reorganization was approved by the Trusts Board on June 14, 2019, by the Board of Northern Lights Fund Trust on June 17, 2019, and by beneficial owners of the Multi-Strategy Alternatives Predecessor Fund on October 17, 2019. The tax-free reorganization was accomplished on October 18, 2019. Upon closing of the Plan of Reorganization, Institutional Class shares were designated to Class I shares. As a result of the reorganization, the Multi-Strategy Alternatives Fund assumed the performance and accounting history of the Multi-Strategy Alternatives Predecessor Fund. Financial information included for the dates prior to the reorganization is that of the Multi-Strategy Alternatives Predecessor Fund.
The reorganization was accomplished by the following tax-free exchange in which each shareholder of the Multi-Strategy Alternatives Predecessor Fund received the same aggregate share net asset value in the corresponding classes as noted below:
| | | Shares Issued | | | Net Assets | |
| Investor Class* | | | 7,643,433 | | | $ | 84,119,077 | |
| Class I | | | 67,002 | | | | 740,865 | |
*Previously R-1 Class Shares.
The net unrealized appreciation of investments transferred was $2,594,449 as of the date of the acquisition.
The Multi-Strategy Alternatives Fund acquired the assets and assumed the liabilities of the Good Harbor Tactical Select Fund (the “Multi-Strategy Alternatives Predecessor Fund”), a series of Northern Lights Fund Trust III, which offered three classes of shares, Class A, Class C and Class I, in a tax-free reorganization as set out in the Agreement and Plan of Reorganization. The proposed Plan of Reorganization was approved by the Trusts Board on January 20, 2022, by the Board of Northern Lights Fund Trust on August 26, 2021, and by beneficial owners of the Multi-Strategy Alternatives Predecessor Fund on May 18, 2022. The tax-free reorganization was accomplished on June 3, 2022. Upon closing of the Plan of Reorganization, Class A and C shares were designated to Investor shares.
AXS Funds
NOTES TO FINANCIAL STATEMENTS - Continued
September 30, 2023
The reorganization was accomplished by the following tax-free exchange in which each shareholder of the Multi-Strategy Alternatives Predecessor Fund received the same aggregate share net asset value in the corresponding classes as noted below:
| | | Shares Issued | | | Net Assets | |
| Investor Class* | | | 901,427 | | | $ | 9,738,840 | |
| Class I | | | 410,906 | | | | 4,467,783 | |
*Previously R-1 Class Shares.
The net unrealized appreciation of investments transferred was $194,738 as of the date of the acquisition.
The Sustainable Income Fund’s investment objective is to seek to generate current income.
The Sustainable Income Fund commenced investment operations on October 19, 2020 with Class I shares. Prior to that date, its only activity was a transfer of 101,960 newly issued shares of the Fund’s Class I in exchange for the net assets of the SKY Harbor Short Duration High Yield Partners, LP, a Delaware limited liability company (the “Company”) valued at $1,019,596. This exchange was nontaxable. The primary assets received by the Fund were cash, interest receivable and securities of the Company with a fair value of $946,696 (identified cost of investments transferred were $951,387), totaling $1,019,596. For financial reporting purposes, assets received and shares issued by the Fund were recorded at fair value; however, the cost basis of the investments received from the Company was carried forward to align ongoing reporting of the Fund’s realized and unrealized gains and losses with amounts distributable to shareholders for tax purposes.
The Thomson Reuters Venture Capital Return Tracker Fund’s investment objective is to provide investment results that, before fees and expenses, correspond generally to the price performance of a specific benchmark designed to track the aggregate performance of U.S. venture capital-backed companies. The Fund’s current benchmark is the Thomson Reuters Venture Capital Index.
The Thomson Reuters Venture Capital Return Tracker Fund commenced investment operations on November 23, 2020 with Class A shares, Class C shares, and Class I shares. Prior to that date, the Thomson Reuters Venture Capital Return Tracker Fund acquired the assets and assumed the liabilities of the Leland Thomson Reuters Venture Capital Index Fund (the ” Thomson Reuters Venture Capital Return Tracker Predecessor Fund”), a series of Northern Lights Fund Trust III, which offered three classes of shares, Class A shares, Class C shares, and Class I shares, in a tax-free reorganization as set out in the Agreement and Plan of Reorganization. The proposed Plan of Reorganization was approved by the Trust’s Board on August 6, 2020, by the Board of Northern Lights Fund Trust III on August 5, 2020, and by beneficial owners of the Thomson Reuters Venture Capital Return Tracker Predecessor Fund on November 18, 2020. The tax-free reorganization was accomplished on November 20, 2020. As a result of the reorganization, the Thomson Reuters Venture Capital Return Tracker Fund assumed the performance and accounting history of the Thomson Reuters Venture Capital Return Tracker Predecessor Fund. Financial information included for the dates prior to the reorganization is that of the Thomson Reuters Venture Capital Return Tracker Predecessor Fund.
AXS Funds
NOTES TO FINANCIAL STATEMENTS - Continued
September 30, 2023
The reorganization was accomplished by the following tax-free exchange in which each shareholder of the Thomson Reuters Venture Capital Return Tracker Predecessor Fund received the same aggregate share net asset value in the corresponding classes as noted below:
| | | Shares Issued | | | Net Assets | |
| Class A | | | 2,543,961 | | | $ | 81,237,729 | |
| Class C | | | 382,538 | | | | 11,745,929 | |
| Class I | | | 4,326,594 | | | | 139,556,985 | |
The net unrealized appreciation of investments transferred was $64,795,988 as of the date of the acquisition.
The Merger Fund’s investment objective seeks to achieve positive risk-adjusted returns with less volatility than in the equity markets. Effective January 1, 2021, the Merger Fund changed fiscal year end from December 31 to September 30.
The Merger Fund commenced investment operations on January 25, 2021 with Investor Class shares and Class I shares. Prior to that date, the Merger Fund acquired the assets and assumed the liabilities of the Kellner Merger Fund (the “Merger Predecessor Fund”), a series of Advisors Series Trust, which offered two classes of shares, Investor Class shares and Institutional Class shares, in a tax-free reorganization as set out in the Agreement and Plan of Reorganization. The proposed Plan of Reorganization was approved by the Trust’s Board on October 20, 2020, by the Board of Advisors Series Trust on October 23, 2020, and by beneficial owners of the Merger Predecessor Fund on January 15, 2021. The tax-free reorganization was accomplished on January 22, 2021. As a result of the reorganization, the Merger Fund assumed the performance and accounting history of the Merger Predecessor Fund. Financial information included for the dates prior to the reorganization is that of the Merger Predecessor Fund.
The reorganization was accomplished by the following tax-free exchange in which each shareholder of the Merger Predecessor Fund received the same aggregate share net asset value in the corresponding classes as noted below:
| | | Shares Issued | | | Net Assets | |
| Investor Class | | | 158,344 | | | $ | 1,639,685 | |
| Class I | | | 9,122,919 | | | $ | 97,119,730 | |
The net unrealized appreciation of investments transferred was $372,944 as of the date of the acquisition.
The Alternative Value Fund’s investment objective is to seek long-term growth of capital. Effective July 1, 2021, the Alternative Value Fund changed fiscal year end from June 30 to September 30.
The Alternative Value Fund commenced investment operations on March 8, 2021 with Class I shares and Investor Class shares. Prior to that date, the Alternative Value Fund acquired the assets and assumed the liabilities of the AXS Alternative Value Fund (formerly, Cognios Large Cap Value Fund) (the “Alternative Value Predecessor Fund”), a series of M3Sixty Funds Trust, which offered two classes of shares, Investor Class shares and Institutional Class shares, in a tax-free reorganization as set out in the Agreement and Plan of Reorganization. The proposed Plan of Reorganization was approved by the Trust’s Board on October 20, 2020, by the Board of M3Sixty Funds Trust on October 20, 2020, and by beneficial owners of the Alternative Value Predecessor Fund on February 26, 2021. The tax-free reorganization was accomplished on March 5, 2021. As a result of the reorganization, the Alternative Value Fund assumed the performance and accounting history of the Alternative Value Predecessor Fund. Financial information included for the dates prior to the reorganization is that of the Alternative Value Predecessor Fund.
AXS Funds
NOTES TO FINANCIAL STATEMENTS - Continued
September 30, 2023
The reorganization was accomplished by the following tax-free exchange in which each shareholder of the Alternative Value Predecessor Fund received the same aggregate share net asset value in the corresponding classes as noted below:
| | | Shares Issued | | | Net Assets | |
| Investor Class | | | 53,742 | | | $ | 497,821 | |
| Institutional Class | | | 65,608 | | | $ | 606,912 | |
The net unrealized appreciation of investments transferred was $143,049 as of the date of the acquisition.
The Market Neutral Fund’s investment objective is to seek long-term growth of capital independent of stock market direction. Effective July 1, 2021, the Market Neutral Fund changed fiscal year end from June 30 to September 30.
The Market Neutral Fund commenced investment operations on March 8, 2021 with Class I shares and Investor Class shares. Prior to that date, the Market Neutral Fund acquired the assets and assumed the liabilities of the AXS Market Neutral Fund (formerly, Cognios Market Neutral Large Cap Fund) (the “Market Neutral Predecessor Fund”), a series of M3Sixty Funds Trust, which offered two class of shares, Investor Class shares and Institutional Class shares in a tax-free reorganization as set out in the Agreement and Plan of Reorganization. The proposed Plan of Reorganization was approved by the Trust’s Board on October 20, 2020, by the Board of M3Sixty Funds Trust on October 20, 2020, and by beneficial owners of the Market Neutral Predecessor Fund on March 3, 2021. The tax-free reorganization was accomplished on March 5, 2021. As a result of the reorganization, the Market Neutral Fund assumed the performance and accounting history of the Market Neutral Predecessor Fund. Financial information included for the dates prior to the reorganization is that of the Market Neutral Predecessor Fund.
The reorganization was accomplished by the following tax-free exchange in which each shareholder of the Market Neutral Predecessor Fund received the same aggregate share net asset value in the corresponding classes as noted below:
| | | Shares Issued | | | Net Assets | |
| Investor Class | | | 246,342 | | | $ | 2,334,398 | |
| Institutional Class | | | 1,189,884 | | | $ | 11,511,835 | |
The net unrealized appreciation of investments transferred was $735,813 as of the date of the acquisition.
The Adaptive Plus Fund’s investment objective is to seek capital appreciation in rising and falling U.S. equity markets. The Adaptive Plus Fund currently offers one class of shares, Class I. Investor Class Shares are not currently available. The Fund’s Class I shares commenced operations on September 15, 2022.
The Income Opportunities Fund’s investment objective is to seek to maximize current income with potential for modest growth capital. Effective September 1, 2023, the Income Opportunities Fund changed fiscal year end from August 31 to September 30.
The Income Opportunities Fund commenced investment operations on May 16, 2022 with Class A shares, Class D Shares and Class I shares. Prior to that date, the Income Opportunities Fund acquired the assets and assumed the liabilities of the Orinda Income Opportunities Fund (the “Income Opportunities Predecessor Fund”), a series of the RBB Fund, Inc., which offered three class of shares, Class A, Class D, and Class I shares. On May 6, 2022, beneficial owners of the Income Opportunities Predecessor Fund approved a proposed Agreement and Plan of Reorganization that provided for the reorganization into the Income Opportunities Fund. The Plan of Reorganization was approved by the Trust’s Board on January 20, 2022 and by the RBB Fund, Inc. Board on January 20, 2022. The tax-free reorganization was accomplished on May 13, 2022. As a result of the reorganization, the Income Opportunities Fund assumed the performance and accounting history of the Income Opportunities Predecessor Fund. Financial information included for the dates prior to the reorganization is that of the Income Opportunities Predecessor Fund.
AXS Funds
NOTES TO FINANCIAL STATEMENTS - Continued
September 30, 2023
The reorganization was accomplished by the following tax-free exchange in which each shareholder of the Income Opportunities Fund received the same aggregate share net asset value in the corresponding classes as noted below:
| | | Shares Issued | | | Net Assets | |
| Class A | | | 288,994 | | | $ | 4,713,613 | |
| Class D | | | 500,841 | | | | 7,997,228 | |
| Class I | | | 7,682,748 | | | | 125,743,540 | |
The net unrealized depreciation of investments transferred was $14,736,986 as of the date of the acquisition.
The Dynamic Opportunity Fund’s investment objective is to seek long-term capital appreciation with a short-term focus on capital preservation. Effective July 1, 2023, the Dynamic Opportunity Fund changed fiscal year and tax year ends from December 31 to September 30.
The Dynamic Opportunity Fund commenced investment operations on May 15, 2023 with Class A and Class I shares. Prior to that date, the Dynamic Opportunity Fund acquired the assets and assumed the liabilities of the ACM Dynamic Opportunity Fund (the “AXS Dynamic Opportunity Predecessor Fund”), a series of Northern Lights Fund Trust III, which offered two classes of shares, Class A and Class I shares, in a tax-free reorganization as set out in the Agreement and Plan of Reorganization. The proposed Plan of Reorganization was approved by the Trust’s Board on February 2, 2023, by the Board of Northern Lights Fund Trust III on January 23, 2023, and by beneficial owners of the AXS Dynamic Opportunity Predecessor Fund on May 10, 2023. The tax-free reorganization was accomplished on May 12, 2023. As a result of the reorganization, the Dynamic Opportunity Fund assumed the performance and accounting history of the AXS Dynamic Opportunity Predecessor Fund. Financial information included for the dates prior to the reorganization is that of the AXS Dynamic Opportunity Predecessor Fund.
The reorganization was accomplished by the following tax-free exchange in which each shareholder of the AXS Dynamic Opportunity Predecessor Fund received the same aggregate share net asset value in the corresponding classes as noted below:
| | | Shares Issued | | | Net Assets | |
| Class A | | | 116,630 | | | $ | 1,881,167 | |
| Class I | | | 3,939,339 | | | | 64,761,951 | |
The net unrealized appreciation of investments transferred was $7,284,210 as of the date of the acquisition.
The Tactical Income Fund’s investment objective is to seek to generate income, with capital preservation as a secondary objective. Effective July 1, 2023, the Tactical Income Fund changed fiscal and tax year ends from December 31 to September 30.
The Tactical Income Fund commenced investment operations on May 15, 2023 with Class A and Class I shares. Prior to that date, the Tactical Income Fund acquired the assets and assumed the liabilities of the ACM Tactical Income Fund (the “AXS Tactical Income Predecessor Fund”), a series of Northern Lights Fund Trust III, which offered two classes of shares, Class A and Class I shares, in a tax-free reorganization as set out in the Agreement and Plan of Reorganization. The proposed Plan of Reorganization was approved by the Trust’s Board on February 2, 2023, by the Board of Northern Lights Fund Trust III on January 23, 2023, and by beneficial owners of the AXS Tactical Income Predecessor Fund on May 5, 2023. The tax-free reorganization was accomplished on May 12, 2023. As a result of the reorganization, the Tactical Income Fund assumed the performance and accounting history of the AXS Tactical Income Predecessor Fund. Financial information included for the dates prior to the reorganization is that of the AXS Tactical Income Predecessor Fund.
AXS Funds
NOTES TO FINANCIAL STATEMENTS - Continued
September 30, 2023
The reorganization was accomplished by the following tax-free exchange in which each shareholder of the AXS Tactical Income Predecessor Fund received the same aggregate share net asset value in the corresponding classes as noted below:
| | | Shares Issued | | | Net Assets | |
| Class A | | | 236,949 | | | $ | 2,120,926 | |
| Class I | | | 4,507,040 | | | | 40,364,152 | |
The net unrealized appreciation of investments transferred was $133,691 as of the date of the acquisition.
The shares of each class of each Fund (other than the Sustainable Income Fund which currently only offers one class of shares) represent an interest in the same portfolio of investments of each particular Fund and have equal rights as to voting, redemptions, dividends and liquidation, subject to the approval of the Trustees. Income, expenses (other than expenses attributable to a specific class) and realized and unrealized gains and losses on investments are allocated to each class of shares in proportion to their relative net assets. Shareholders of a class that bears distribution and service expenses under the terms of a distribution plan have exclusive voting rights to that distribution plan.
Each Fund is an investment company and accordingly follows the investment company accounting and reporting guidance of the Financial Accounting Standards Board (FASB) Accounting Standard Codification Topic 946 “Financial Services—Investment Companies.”
Note 2 – Accounting Policies
The following is a summary of the significant accounting policies consistently followed by the Funds in the preparation of their financial statements. The preparation of financial statements in conformity with accounting principles generally accepted in the United States of America (“GAAP”) requires management to make estimates and assumptions that affect the reported amounts and disclosures in the financial statements. Actual results could differ from these estimates.
(a) Valuation of Investments
The Funds value equity securities at the last reported sale price on the principal exchange or in the principal over the counter (“OTC”) market in which such securities are traded, as of the close of regular trading on the NYSE on the day the securities are being valued or, if the last-quoted sales price is not readily available, the securities will be valued at the last bid or the mean between the last available bid and ask price. Securities traded on the NASDAQ are valued at the NASDAQ Official Closing Price (“NOCP”). Investments in open-end investment companies are valued at the daily closing net asset value of the respective investment company. Debt securities are valued by utilizing a price supplied by independent pricing service providers. The independent pricing service providers may use various valuation methodologies including matrix pricing and other analytical pricing models as well as market transactions and dealer quotations. These models generally consider such factors as yields or prices of bonds of comparable quality, type of issue, coupon, maturity, ratings and general market conditions. If a price is not readily available for a portfolio security, the security will be valued at fair value (the amount which the Funds might reasonably expect to receive for the security upon its current sale). The Board of Trustees has designated the Advisor as the Funds’ valuation designee (the “Valuation Designee”) to make all fair value determinations with respect to the Funds’ portfolio investments, subject to the Board’s oversight. As the Valuation Designee, the Advisor has adopted and implemented policies and procedures to be followed when the Funds must utilize fair value pricing. Prior to September 8, 2022, securities were valued at fair value as determined in good faith by the Fund’s advisor, subject to review and approval by the Valuation Committee, pursuant to procedures adopted by the Board of Trustees. The actions of the Valuation Committee were subsequently reviewed by the Board at its next regularly scheduled board meeting. The Valuation Committee met as needed. The Valuation Committee was comprised of all the Trustees, but action may had been taken by any one of the Trustees.
AXS Funds
NOTES TO FINANCIAL STATEMENTS - Continued
September 30, 2023
(b) Foreign Currency Translation
The Funds’ records are maintained in U.S. dollars. The value of securities, currencies and other assets and liabilities denominated in currencies other than U.S. dollars are translated into U.S. dollars based upon foreign exchange rates prevailing at the end of the reporting period. The currencies are translated into U.S. dollars by using the exchange rates quoted as of 4:00 PM Eastern Standard Time. Purchases and sales of investment securities, income and expenses are translated on the respective dates of such transactions.
The Funds do not isolate that portion of their net realized and unrealized gains and losses on investments resulting from changes in foreign exchange rates from the impact arising from changes in market prices. Such fluctuations are included with net realized and unrealized gain or loss from investments and foreign currency.
Net realized foreign currency transaction gains and losses arise from sales of foreign currencies, currency gains or losses realized between the trade and settlement dates on securities transactions, and the differences between the amounts of dividends, interest, and foreign withholding taxes recorded on the Funds’ books and the U.S. dollar equivalent of the amounts actually received or paid. Net unrealized foreign currency translation gains and losses arise from changes in the value of assets and liabilities, other than investments in securities, resulting from changes in the exchange rates.
(c) Exchange-Traded Funds (“ETFs”)
ETFs typically trade on securities exchanges and their shares may, at times, trade at a premium or discount to their net asset values. In addition, an ETF may not replicate exactly the performance of the benchmark index it seeks to track for a number of reasons, including transaction costs incurred by the ETF, the temporary unavailability of certain index securities in the secondary market or discrepancies between the ETF and the index with respect to the weighting of securities or the number of securities held. Investing in ETFs, which are investment companies, may involve duplication of advisory fees and certain other expenses. As a result, Fund shareholders indirectly bear their proportionate share of these incurred expenses. Therefore, the cost of investing in the Funds will be higher than the cost of investing directly in ETFs and may be higher than other mutual funds that invest directly in securities.
Each ETF in which the Funds invest is subject to specific risks, depending on the nature of the ETF. Each ETF is subject to the risks associated with direct ownership of the securities comprising the index on which the ETF is based. These risks could include liquidity risk, sector risk, and risks associated with fixed-income securities.
(d) Equity Swaps (Total Return Swaps)
The Multi-Strategy Alternatives Fund and Thomson Reuters Venture Capital Return Tracker Fund may enter into equity swap contracts for hedging or investment purposes. Equity swap contracts may be structured in different ways. The counterparty may agree to pay the Funds the amount, if any, by which the notional amount of the equity swap contract would have increased in value had it been invested in particular stocks (or an index of stocks), plus the dividends that would have been received on those stocks. In these cases, the Funds may agree to pay to the counterparty a floating-rate of interest on the notional amount of the equity swap contract plus the amount, if any, by which that notional amount would have decreased in value had it been invested in such stocks. In these cases, the return to the Funds on any equity swap contract should be the gain or loss on the notional amount plus dividends on the stocks less the interest paid by the Funds on the notional amount. In other cases, the counterparty and the Fund may agree to pay the other the difference between the relative investment performance that would have been achieved if the notional amount of the equity swap contract had been invested in different stocks (or indices of stocks).
AXS Funds
NOTES TO FINANCIAL STATEMENTS - Continued
September 30, 2023
Total return swap contracts are agreements between counterparties to exchange cash flow, one based on a market-linked return of an individual asset or group of assets (such as an index), and the other on a fixed or floating rate. As a total return swap, an equity swap may be structured in different ways. When the Funds enter into a “long” equity swap, the counterparty may agree to pay the Funds the amount, if any, by which the notional amount of the equity swap would have increased in value had it been invested in a particular referenced security or securities, plus the dividends that would have been received on those securities. In return, the Funds will generally agree to pay the counterparty interest on the notional amount of the equity swap plus the amount, if any, by which that notional amount would have decreased in value had it been invested in such referenced security or securities, plus, in certain instances, commissions or trading spreads on the notional amounts. Therefore, the Funds’ return on the equity swap generally should equal the gain or loss on the notional amount, plus dividends on the referenced security or securities less the interest paid by the Funds on the notional amount. Alternatively, when the Funds enter into a “short” equity swap, the counterparty will generally agree to pay the Funds the amount, if any, by which the notional amount of the equity swap would have decreased in value had the Funds sold a particular referenced security or securities short, less the dividend expense that the Funds would have incurred on the referenced security or securities, as adjusted for interest payments or other economic factors. In this situation, the Funds will generally be obligated to pay the amount, if any, by which the notional amount of the swap would have increased in value had they been invested directly in the referenced security or securities.
Equity swaps generally do not involve the delivery of securities or other referenced assets. Accordingly, the risk of loss with respect to equity swaps is normally limited to the net amount of payments that the Funds are contractually obligated to make. If the other party to an equity swap defaults, the Funds’ risk of loss consists of the net amount of payments that the Funds are contractually entitled to receive, if any. The Funds will segregate cash or liquid assets, enter into offsetting transactions or use other measures permitted by applicable law to “cover” the Funds’ current obligations.
Equity swaps are derivatives and their value can be very volatile. The Funds may engage in total return swaps to gain exposure to securities, along with offsetting long total return swap positions to maintain appropriate currency balances and risk exposures across all swap positions. To the extent that the Advisor does not accurately analyze and predict future market trends, the values or assets or economic factors, the Funds may suffer a loss, which may be substantial. As of September 30, 2023, open swap agreements are shown in the Schedules of Investments.
(e) Real Estate Investment Trusts (“REITs”)
The Income Opportunities Fund has made certain investments in REITS which pay dividends to their shareholders based upon available funds from operations. It is quite common for these dividends to exceed the REITs’ taxable earnings and profits resulting in the excess portion being designated as a return of capital. The Fund intends to include the gross dividends from such REITs in its annual distributions to shareholders and, accordingly, a portion of the Fund’s distributions may also be designated as a return of capital.
AXS Funds
NOTES TO FINANCIAL STATEMENTS - Continued
September 30, 2023
(f) Short Sales
Short sales are transactions in which the Funds sell a security they do not own in anticipation of a decline in the value of that security. To complete such a transaction, the Funds must borrow the security to make delivery to the buyer. The Funds then are obligated to replace the security borrowed by purchasing the security at market price at the time of replacement. The price at such time may be more or less than the price at which the security was sold by the Funds. When a security is sold short, a decrease in the value of the security will be recognized as a gain and an increase in the value of the security will be recognized as a loss, which is potentially limitless. Until the security is replaced, the Funds are required to pay the lender amounts equal to dividend or interest that accrue during the period of the loan which is recorded as an expense. To borrow the security, the Funds also may be required to pay a premium or an interest fee, which are recorded as interest expense. Cash or securities are segregated for the broker to meet the necessary margin requirements. The Funds are subject to the risk that they may not always be able to close out a short position at a particular time or at an acceptable price.
(g) Options
The Funds may write or purchase options contracts primarily to generate gains from option premiums or to reduce overall portfolio risk. When the Fund writes or purchases an option, an amount equal to the premium received or paid by the Fund is recorded as a liability or an asset and is subsequently adjusted to the current market value of the option written or purchased. Premiums received or paid from writing or purchasing options which expire unexercised are treated by the Fund on the expiration date as realized gains or losses. The difference between the premium and the amount paid or received on effecting a closing purchase or sale transaction, including brokerage commissions, is also treated as a realized gain or loss. If an option is exercised, the premium paid or received is added to the cost of the purchase or proceeds from the sale in determining whether the Fund has realized a gain or a loss on investment transactions. The Fund, as a writer of an option, may have no control over whether the underlying securities may be sold (call) or purchased (put) and as a result bears the market risk of an unfavorable change in the price of the security underlying the written option.
(h) Investment Transactions, Investment Income and Expenses
Investment transactions are accounted for on the trade date. Realized gains and losses on investments are determined on the identified cost basis. Dividend income is recorded net of applicable withholding taxes on the ex-dividend date and interest income is recorded on an accrual basis. Withholding taxes on foreign dividends, if applicable, are paid (a portion of which may be reclaimable) or provided for in accordance with the applicable country’s tax rules and rates and are disclosed in the Statements of Operations. Withholding tax reclaims are filed in certain countries to recover a portion of the amounts previously withheld. The Funds record a reclaim receivable based on a number of factors, including a jurisdiction’s legal obligation to pay reclaims as well as payment history and market convention. Income and expenses of the Funds are allocated on a pro rata basis to each class of shares relative net assets, except for distribution and service fees which are unique to each class of shares. Expenses incurred by the Trust with respect to more than one fund are allocated in proportion to the net assets of each fund except where allocation of direct expenses to each fund or an alternative allocation method can be more appropriately made.
(i) Federal Income Tax
The Funds intend to comply with the requirements of Subchapter M of the Internal Revenue Code applicable to regulated investment companies and to distribute substantially all of their net investment income and any net realized gains to their shareholders. Therefore, no provision is made for federal income or excise taxes. Due to the timing of dividend distributions and the differences in accounting for income and realized gains and losses for financial statement and federal income tax purposes, the fiscal year in which amounts are distributed may differ from the year in which the income and realized gains and losses are recorded by the Funds.
AXS Funds
NOTES TO FINANCIAL STATEMENTS - Continued
September 30, 2023
Accounting for Uncertainty in Income Taxes (the “Income Tax Statement”) requires an evaluation of tax positions taken (or expected to be taken) in the course of preparing a Fund’s tax returns to determine whether these positions meet a “more-likely-than-not” standard that, based on the technical merits, have a more than fifty percent likelihood of being sustained by a taxing authority upon examination. A tax position that meets the “more-likely-than-not” recognition threshold is measured to determine the amount of benefit to recognize in the financial statements. The Funds recognize interest and penalties, if any, related to unrecognized tax benefits as income tax expense in the Statements of Operations.
The Income Tax Statement requires management of the Funds to analyze tax positions taken in the prior three open tax years, if any, and tax positions expected to be taken in the Funds’ current tax year, as defined by the IRS statute of limitations for all major jurisdictions, including federal tax authorities and certain state tax authorities. As of September 30, 2023, and during the prior three open tax years, the Funds did not have a liability for any unrecognized tax benefits. The Funds have no examinations in progress and are not aware of any tax positions for which it is reasonably possible that the total amounts of unrecognized tax benefits will significantly change in the next twelve months.
(j) Distributions to Shareholders
Dividends from net investment income, if any, are declared and paid at least annually, except for the Sustainable Income Fund and the Income Opportunities Fund, which will distribute net investment income, if any, quarterly and the Tactical Income Fund, which will distribute net investment income, if any, monthly. Distributable net realized capital gains, if any, are declared and distributed annually. Distributions to shareholders are recorded on the ex-dividend date. The amount and timing of distributions are determined in accordance with federal income tax regulations, which may differ from GAAP.
The character of distributions made during the year from net investment income or net realized gains may differ from the characterization for federal income tax purposes due to differences in the recognition of income, expense and gain (loss) items for financial statement and tax purposes.
(k) Illiquid Securities
Pursuant to Rule 22e-4 under the 1940 Act, the Funds have adopted a Liquidity Risk Management Program (“LRMP”) that requires, among other things, that the Funds limit their illiquid investments that are assets to no more than 15% of net assets. An illiquid investment is any security which may not reasonably be expected to be sold or disposed of in current market conditions in seven calendar days or less without the sale or disposition significantly changing the market value of the investment. If the Advisor, at any time, determines that the value of illiquid securities held by the Funds exceed 15% of its net asset value, the Advisor will take such steps as it considers appropriate to reduce them as soon as reasonably practicable in accordance with the Funds’ written LRMP.
AXS Funds
NOTES TO FINANCIAL STATEMENTS - Continued
September 30, 2023
Note 3 – Investment Advisory and Other Agreements
The Trust, on behalf of the Funds, entered into an Investment Advisory Agreement (the “Agreement”) with AXS Investments LLC (the “Advisor”). Under the terms of the Agreement, the Funds pay twice a month investment advisory fee to the Advisor at the following annual rates based on the average daily net assets of the Funds:
| Fund | | Investment
Advisory
Fees | | | Investment
Advisory
Fees
Tier 2 | | | Investment
Advisory
Fees
Tier 3 | |
| Multi-Strategy Alternatives Fund | | | 1.00 | % | | | - | | | | - | |
| Sustainable Income Fund | | | 0.70 | % | | | - | | | | - | |
| Thomson Reuters Venture Capital Return Tracker Fund | | | 1.25 | % | | | - | | | | - | |
| Merger Fund | | | 1.25 | %* | | | 1.125 | %** | | | 1.00 | %*** |
| Alternative Value Fund | | | 0.65 | % | | | - | | | | - | |
| Market Neutral Fund | | | 1.40 | % | | | - | | | | - | |
| Adaptive Plus Fund | | | 1.50 | % | | | - | | | | - | |
| Income Opportunities Fund | | | 1.00 | % | | | - | | | | - | |
| Dynamic Opportunity Fund | | | 1.25 | % | | | - | | | | - | |
| Tactical Income Fund | | | 1.00 | % | | | - | | | | - | |
*Fund’s average daily net assets up to $2 billion.
**Fund’s average daily net assets between $2 billion and $4 billion.
***Fund’s average daily net assets in excess of $4 billion.
The Advisor has contractually agreed to waive its fee and, if necessary, to absorb other operating expenses of the Funds to ensure that total annual operating expenses (excluding any taxes, leverage interest, brokerage commissions, dividend and interest expenses on short sales, acquired fund fees and expenses (as determined in accordance with Form N-1A), professional fees related to services for the collection of foreign tax reclaims, expenses incurred in connection with any merger or reorganization, and extraordinary expenses such as litigation expenses) in order to limit total annual operating expenses of each fund.
AXS Funds
NOTES TO FINANCIAL STATEMENTS - Continued
September 30, 2023
These agreements are in effect until January 31, 2024 for the Multi-Strategy Alternatives Fund, the Sustainable Income Fund, the Thomson Reuters Venture Capital Return Tracker Fund, the Merger Fund, the Alternative Value Fund, the Market Neutral Fund and the Adaptive Plus Fund, May 13, 2024 for the Income Opportunities Fund and May 12, 2025 for the Dynamic Opportunity Fund and the Tactical Income Fund and they may be terminated before that date only by the Trust’s Board of Trustees. The table below contains the expense cap by Fund and by Class:
| | | Total Limit on Annual | |
| | | Operating Expenses | |
| | | Class A Shares | | | Class C Shares | | | Class D Shares | | | Class I Shares | | | Investor Class Shares | |
| Multi-Strategy Alternatives Fund | | | - | | | | - | | | | - | | | | 1.51 | % | | | 1.68 | % |
| Sustainable Income Fund | | | - | | | | - | | | | - | | | | 0.99 | % | | | - | |
| Thomson Reuters Venture Capital Return Tracker Fund | | | 1.75 | % | | | 2.50 | % | | | - | | | | 1.50 | % | | | - | |
| Merger Fund | | | - | | | | - | | | | - | | | | 1.50 | % | | | 1.75 | % |
| Alternative Value Fund | | | - | | | | - | | | | - | | | | 0.85 | % | | | 1.10 | % |
| Market Neutral Fund | | | - | | | | - | | | | - | | | | 1.45 | % | | | 1.70 | % |
| Adaptive Plus Fund | | | - | | | | - | | | | - | | | | 1.99 | % | | | - | |
| Income Opportunities Fund | | | 1.65 | % | | | - | | | | 2.40 | % | | | 1.40 | % | | | - | |
| Dynamic Opportunity Fund | | | 2.40 | % | | | - | | | | - | | | | 2.15 | % | | | - | |
| Tactical Income Fund | | | 2.25 | % | | | - | | | | - | | | | 2.00 | % | | | - | |
The Advisor has engaged Green Alpha Advisors, LLC (“Green Alpha”) and Uniplan Investment Counsel, Inc. (“Uniplan”) as Sub-Advisors, to manage the Sustainable Income Fund’s overall investment program, and pays Green Alpha and Uniplan from its advisory fees.
The Advisor has engaged Kellner Management, L.P. (“Kellner”) to manage the Merger Fund’s overall investment program and pays Kellner from its advisory fees. The Advisor has engaged Quantitative Value Technologies, LLC d/b/a Cognios Capital (the “Cognios”) to manage the Alternative Value Fund and the Market Neutral Fund and pays Cognios from its advisory fees.
Prior to the close of business on October 18, 2019, investment advisory services were provided to the Multi-Strategy Alternatives Predecessor Fund by Kerns Capital Management, Inc., which received investment management fees for its services pursuant to the terms of the investment advisory agreements for the Multi-Strategy Alternatives Predecessor Fund. The investment advisory fees, which were computed and accrued daily and paid monthly, at an annual rate of 1.00% of the Fund’s average daily net assets.
Prior to the close of business on November 20, 2020, investment advisory services were provided to the Thomson Reuters Venture Capital Return Tracker Predecessor Fund by Good Harbor Financial, LLC (“Good Harbor”) which received investment management fees for its services pursuant to the terms of the investment advisory agreements for the Thomson Reuters Venture Capital Return Tracker Predecessor Fund. The investment advisory fees were computed and accrued daily and paid monthly at an annual rate of 1.25% of the Thomson Reuters Venture Capital Return Tracker Predecessor Fund’s average daily net assets. Good Harbor had contractually agreed to waive its fee and, if necessary, to absorb other operating expenses to ensure that total annual operating expenses (excluding any taxes, leverage interest, brokerage commissions, dividend and interest expenses on short sales, acquired fund fees and expenses as determined in accordance with Form N-1A, expenses incurred in connection with any merger or reorganization, and extraordinary expenses such as litigation expenses) do not exceed 1.75%, 2.50%, and 1.50% of the average daily net assets of Class A, Class C, and Class I shares, respectively, of the Thomson Reuters Venture Capital Return Tracker Predecessor Fund.
AXS Funds
NOTES TO FINANCIAL STATEMENTS - Continued
September 30, 2023
Prior to the close of business on May 12, 2023, investment advisory services were provided to the AXS Dynamic Opportunity Predecessor Fund and AXS Tactical Income Predecessor Fund by Ascendant Capital Management, LLC (“Ascendant”) for the period January 1, 2023 through May 12, 2023, which received investment management fees for their services pursuant to the terms of the investment advisory agreements for the AXS Dynamic Opportunity Predecessor Fund and the AXS Tactical Income Predecessor Fund. The investment advisory fees were computed and accrued daily and paid monthly at an annual rate of 1.25% of the AXS Dynamic Opportunity Predecessor Fund’s average daily net assets and 1.00% of the AXS Tactical Income Predecessor Fund’s average daily net assets. Ascendant had contractually agreed to waive its fee and, if necessary, to absorb other operating expenses to ensure that total annual operating expenses (excluding any taxes, leverage interest, brokerage commissions, dividend and interest expenses on short sales, acquired fund fees and expenses as determined in accordance with Form N-1A, expenses incurred in connection with any merger or reorganization, and extraordinary expenses such as litigation expenses) do not exceed 2.40% and 2.15% of the average daily net assets of Class A shares and Class I shares, respectively, of the AXS Dynamic Opportunity Predecessor Fund and do not exceed 2.25% and 2.00% of the average daily net assets of Class A shares and Class I shares, respectively, of the AXS Tactical Income Predecessor Fund.
The Advisor may recover from each Fund’s fees and/or expenses previously waived and/or absorbed if each Fund’s expense ratio, including the recovered expenses, falls below the expense limit at which it was waived. The Advisor is permitted to seek reimbursement from each Fund, subject to certain limitations, of fees waived or payments made to each Fund for a period ending three full years after the date of the waiver or payment. This reimbursement may be requested from each Fund if the reimbursement will not cause each Fund’s annual expense ratio to exceed the lesser of (a) the expense limitation amount in effect at the time such fees were waived or payments made, or (b) the expense limitation amount in effect at the time of the reimbursement. The potential recoverable amount is noted as “Commitments and contingencies” as reported on the Statements of Assets and Liabilities. The Advisor may recapture all or a portion of this amount no later than the dates stated below:
| | | Multi-Strategy Alternatives Fund | | | Sustainable Income
Fund | | | Thomson Reuters Venture Capital Return Tracker Fund | |
| September 30, 2024 | | $ | 105,332 | | | $ | 53,753 | | | $ | 148,438 | |
| September 30, 2025 | | | 84,473 | | | | 150,675 | | | | 746,554 | |
| September 30, 2026 | | | 132,804 | | | | 84,939 | | | | 243,172 | |
| Total | | $ | 322,609 | | | $ | 289,367 | | | $ | 1,138,164 | |
| | | Merger Fund | | | Alternative Value Fund | | | Market Neutral Fund | |
| June 30, 2024 | | $ | - | | | $ | 204,502 | | | $ | 255,480 | |
| September 30, 2024 | | | 91,243 | | | | 22,808 | | | | 27,485 | |
| September 30, 2025 | | | 194,688 | | | | 72,072 | | | | 106,381 | |
| September 30, 2026 | | | 202,747 | | | | 139,882 | | | | 188,797 | |
| Total | | $ | 488,678 | | | $ | 439,264 | | | $ | 578,143 | |
AXS Funds
NOTES TO FINANCIAL STATEMENTS - Continued
September 30, 2023
| | | Adaptive Plus Fund | | | Income Opportunities Fund | |
| August 31, 2025 | | $ | - | | | $ | 89,686 | |
| August 31, 2026 | | | - | | | | 117,609 | |
| September 30, 2025 | | | 23,459 | | | | - | |
| September 30, 2026 | | | 68,537 | | | | 28,256 | |
| Total | | $ | 91,996 | | | $ | 235,551 | |
Good Harbor is permitted to seek reimbursement, subject to certain limitations, of fees waived or payments made by Good Harbor to the Thomson Reuters Venture Capital Return Tracker Predecessor Fund prior to reorganization on November 20, 2020, for a period ending three years after the date of the waiver of payment. This reimbursement may be requested from the Thomson Reuters Venture Capital Return Tracker Fund if the reimbursement will not cause the Thomson Reuters Venture Capital Return Tracker Fund’s annual expense ratio to exceed the lesser of (a) the expense limitation amount in effect at the time such fees were waived or payments made, or (b) the expense limitation amount in effect at the time of the reimbursement. Reimbursements of fees waived, or payments made will be made on a “first in, first out” basis so that the oldest fees waived, or payments are satisfied first. Any reimbursement of fees waived, or payments made by Good Harbor to the Thomson Reuters Venture Capital Return Tracker Predecessor Fund prior to the reorganization must be approved by the Trust’s Board of Trustees. Good Harbor may recapture all or a portion of this amount no later than September 30 of the years stated below for the Thomson Reuters Venture Capital Return Tracker Fund:
| | | Thomson Reuters Venture Capital Return Tracker Fund | |
| 2024 | | $ | 98,415 | |
| Total | | $ | 98,415 | |
During the period ended September 30, 2022, a service provider reimbursed the Thomson Reuters Venture Capital Return Tracker Fund $8,347 for losses from a pricing error. This amount is reported on the Thomson Reuters Venture Capital Return Tracker Fund’s Statements of Operations and Statements of Changes under the caption “Net increase from payment by affiliates.” This reimbursement had no impact to the total return.
During the year ended September 30, 2023, a service provider reimbursed the Adaptive Plus Fund $389 for losses from a shareholder trade. This amount is reported on the Adaptive Plus Fund’s Statement of Operations and Statements of Changes under the caption “Net increase from payment by affiliates.” This reimbursement had no impact to the total return.
Prior to the close of business on January 22, 2021, investment advisory services were provided to the Merger Predecessor Fund by Kellner, which received investment management fees for its services pursuant to the terms of the investment advisory agreements for the Merger Predecessor Fund. The investment advisory fees were computed and accrued daily and paid monthly at an annual rate of 1.25% of the Merger Fund’s average daily net assets up to $2 billion in assets, 1.125% on assets between $2 billion to $4 billion, and 1.00% on assets in excess of $4 billion. The Merger Predecessor’s advisor had contractually agreed to waive its fees and/or pay for operating expenses of the Merger Predecessor Fund to ensure that total annual fund operating expenses (excluding any taxes, leverage interest, brokerage commissions, dividend and interest expenses on short sales, Rule 12b-1 fees, acquired fund fees and expenses (as determined in accordance with SEC Form N-1A), expenses incurred in connection with any merger or reorganization, and extraordinary expenses such as litigation expenses) do not exceed 1.50% of the average daily net assets of the Predecessor Fund.
AXS Funds
NOTES TO FINANCIAL STATEMENTS - Continued
September 30, 2023
Kellner is permitted to seek reimbursement, subject to certain limitations, of fees waived or payments made by Kellner to the Merger Predecessor Fund prior to the Merger Predecessor Fund’s reorganization on January 22, 2021, for a period ending three years after the date of the waiver of payment. This reimbursement may be requested from the Merger Fund if the reimbursement will not cause the Merger Fund’s annual expense ratio to exceed the lesser of (a) the expense limitation amount in effect at the time such fees were waived or payments made, or (b) the expense limitation amount in effect at the time of the reimbursement. Reimbursements of fees waived, or payments made will be made on a “first in, first out” basis so that the oldest fees waived, or payments are satisfied first. Any reimbursement of fees waived, or payments made by Kellner to the predecessor fund prior to the reorganization must be approved by the Trust’s Board of Trustees. Kellner may recapture all or a portion of this amount no later than the dates stated below:
| December 31, 2023 | | $ | 53,286 | |
| January 31, 2024 | | | 24,404 | |
| Total | | $ | 77,690 | |
Prior to the close of business on March 5, 2021, investment advisory services were provided to the Alternative Value Predecessor Fund and Market Neutral Predecessor Fund by Cognios for the period July 1, 2020 through November 30, 2020, and by AXS Investments LLC for the period December 1, 2020 through March 5, 2021, which received investment management fees for their services pursuant to the terms of the investment advisory agreements for the Alternative Value Predecessor Fund and the Market Neutral Predecessor Fund. The investment advisory fees were computed and accrued daily and paid monthly at an annual rate of 0.65% of the Alternative Value Predecessor Fund’s average daily net assets and 1.40% of the Market Neutral Predecessor Fund’s average daily net assets. Cognios and AXS Investments LLC had contractually agreed to waive its fee and, if necessary, to absorb other operating expenses to ensure that total annual operating expenses (excluding any taxes, leverage interest, brokerage commissions, dividend and interest expenses on short sales, acquired fund fees and expenses as determined in accordance with Form N-1A, expenses incurred in connection with any merger or reorganization, and extraordinary expenses such as litigation expenses) do not exceed 1.10% and 0.85% of the average daily net assets of Investor Class and Institutional Class shares, respectively, of the Alternative Value Predecessor Fund and do not exceed 1.70% and 1.45% of the average daily net assets of Investor Class and Institutional Class shares, respectively, of the Market Neutral Predecessor Fund.
Cognios is permitted to seek reimbursement, subject to certain limitations, of fees waived or payments made by Cognios to the Alternative Value Predecessor Fund and the Market Neutral Predecessor Fund prior to the reorganization on March 5, 2021, for a period ending three years after the date of the waiver of payment Such reimbursement may be requested from each Fund if the reimbursement will not cause the Fund’s annual expense ratios to exceed the lesser of (a) the expense limitation amount in effect at the time such fees were waived or payments made, or (b) the expense limitation amount in effect at the time of the reimbursements. Reimbursements of fees waived, or payments made will be made on a “first in, first out” basis so that the oldest fees waived, or payments are satisfied first. Any reimbursements of fees waived, or payments made by Cognios to the Alternative Value Predecessor Fund and Market Neutral Predecessor Fund prior to the reorganization must be approved by the Trust’s Board of Trustees. Cognios may recapture all or a portion of this amount no later than June 30 of the years stated below:
AXS Funds
NOTES TO FINANCIAL STATEMENTS - Continued
September 30, 2023
| | | Alternative Value Fund | | | Market Neutral Fund | |
| 2024 | | $ | 85,816 | | | $ | 130,522 | |
| Total | | $ | 85,816 | | | $ | 130,522 | |
UMB Fund Services, Inc. (“UMBFS”) serves as the Funds’ fund accountant, transfer agent and co-administrator; and Mutual Fund Administration, LLC (“MFAC”) serves as the Funds’ other co-administrator. UMB Bank, N.A., an affiliate of UMBFS, serves as the Funds’ custodian. The Funds’ allocated fees incurred for fund accounting, fund administration, transfer agency and custody services for the periods ended September 30, 2023, are reported on the Statements of Operations. For the period May 13, 2023 to September 30, 2023, the Dynamic Opportunity Fund and Tactical Income Fund paid UMBFS $46,310 and $29,917 and UMB Bank, N.A. $711 and $2,993, respectively.
Prior to the close of business on May 12, 2023, Ultimus Fund Solutions, LLC (“UFS”) served as the administrator, fund accountant, and transfer agent to the AXS Dynamic Opportunity Predecessor Fund and AXS Tactical Income Predecessor Fund and US Bancorp Investments, Inc. served as the Custodian to the AXS Dynamic Opportunity Predecessor Fund and AXS Tactical Income Predecessor Fund. For the period January 1, 2023 to May 12, 2023, the AXS Dynamic Opportunity Predecessor Fund and AXS Tactical Income Predecessor Fund paid UFS $65,599 and $47,688 and US Bancorp Investments, Inc. $3,798 and $3,212, respectively.
ALPS Distributors, Inc. serves as the Funds’ Distributor (the “Distributor”). Prior to January 1, 2023, IMST Distributors, LLC served as the Funds’ Distributor. The Distributor does not receive compensation from the Funds for its distribution services; the Advisor pays the Distributor a fee for its distribution related services. Prior to the close of business on May 12, 2023, Northern Lights Distributors, LLC served as distributor to the AXS Dynamic Opportunity Predecessor Fund and AXS Tactical Income Predecessor Fund.
For the period May 13, 2023 to September 30, 2023, the Dynamic Opportunity Fund and Tactical Income Fund paid their Trustees who are not affiliated with the Funds $7,820 and $7,077 respectively. For the period January 1, 2023 to May 12, 2023, the AXS Dynamic Opportunity Predecessor Fund and AXS Tactical Income Predecessor Fund paid its Trustees who are not affiliated with the Funds $5,244 and $5,235, respectively.
Certain trustees and officers of the Trust are employees of UMBFS or MFAC. The Funds do not compensate trustees and officers affiliated with the Funds’ co-administrators. For the periods ended September 30, 2023, the Funds’ allocated fees incurred to Trustees who are not affiliated with the Funds’ co-administrators are reported on the Statements of Operations. The amount shown as “Fees paid indirectly” on the Statements of Operations is a portion of the Trustees fees paid by the Trust’s Co-Administrators.
The Funds’ Board of Trustees has adopted a Deferred Compensation Plan (the “Plan”) for the Independent Trustees that enables Trustees to elect to receive payment in cash or the option to select various fund(s) in the Trust in which their deferred accounts shall be deemed to be invested. If a trustee elects to defer payment, the Plan provides for the creation of a deferred payment account. The Funds’ liability for these amounts is adjusted for market value changes in the invested fund and remains a liability to the Funds until distributed in accordance with the Plan. The Trustees’ Deferred compensation liability under the Plan constitutes a general unsecured obligation of the Funds and is disclosed in the Statements of Assets and Liabilities. Contributions made under the plan and the change in unrealized appreciation (depreciation) and income are included in the Trustees’ fees and expenses in the Statements of Operations.
AXS Funds
NOTES TO FINANCIAL STATEMENTS - Continued
September 30, 2023
Dziura Compliance Consulting, LLC provides Chief Compliance Officer (“CCO”) services to the Trust. For the period May 13, 2023 to September 30, 2023, the Dynamic Opportunity Fund and Tactical Income Fund paid the CCO $1,615 and $2,318, respectively. Prior to the close of business on May 12, 2023, Northern Lights Compliance Services, LLC (“NLCS”) served as the CCO to the AXS Dynamic Opportunity Predecessor Fund and AXS Tactical Income Predecessor Fund. For the period January 1, 2023 to May 12, 2022, the AXS Dynamic Opportunity Predecessor Fund and AXS Tactical Income Predecessor Fund paid the CCO $6,324 and $4,980, respectively. The Funds’ allocated fees incurred for CCO services for the periods ended September 30, 2023, are reported on the Statements of Operations.
Note 4 – Federal Income Taxes
At September 30, 2023, gross unrealized appreciation (depreciation) of investments based on cost for federal income tax purposes were as follows:
| | | Multi-Strategy Alternatives Fund | | | Sustainable Income Fund | | | Thomson Reuters Venture Capital Return Tracker Fund | |
| Cost of investments | | $ | 15,881,186 | | | $ | 3,326,965 | | | $ | 105,524,842 | |
| | | | | | | | | | | | | |
| Gross unrealized appreciation | | $ | 788,396 | | | $ | 12,519 | | | $ | 15,226,956 | |
| Gross unrealized depreciation | | | (567,325 | ) | | | (146,598 | ) | | | (12,045,092 | ) |
| Net unrealized appreciation (depreciation) on investments | | $ | 221,071 | | | $ | (134,079 | ) | | $ | 3,181,864 | |
| | | Merger Fund | | | Alternative Value Fund | | | Market Neutral Fund | |
| Cost of investments | | $ | 26,648,909 | | | $ | 16,263,738 | | | $ | 6,410,164 | |
| | | | | | | | | | | | | |
| Gross unrealized appreciation | | $ | 1,262,885 | | | $ | 931,543 | | | $ | 3,258,088 | |
| Gross unrealized depreciation | | | (882,383 | ) | | | (1,354,847 | ) | | | (2,810,138 | ) |
| Net unrealized appreciation (depreciation) on investments | | $ | 380,502 | | | $ | (423,304 | ) | | $ | 447,950 | |
| | | Adaptive Plus Fund | | | Income Opportunities Fund | | | Dynamic Opportunity Fund | |
| Cost of investments | | $ | 33,156,428 | | | $ | 86,279,323 | | | $ | 50,174,937 | |
| | | | | | | | | | | | | |
| Gross unrealized appreciation | | $ | 19,665 | | | $ | 4,945,595 | | | $ | 5,456,106 | |
| Gross unrealized depreciation | | | (1,305,251 | ) | | | (15,975,154 | ) | | | (1,307,142 | ) |
| Net unrealized appreciation (depreciation) on investments | | $ | (1,285,586 | ) | | $ | (11,029,559 | ) | | $ | 4,148,964 | |
AXS Funds
NOTES TO FINANCIAL STATEMENTS - Continued
September 30, 2023
| | | Tactical Income Fund | |
| Cost of investments | | $ | 44,696,374 | |
| | | | | |
| Gross unrealized appreciation | | $ | 190,976 | |
| Gross unrealized depreciation | | | (1,131,045 | ) |
| Net unrealized appreciation (depreciation) on investments | | $ | (940,069 | ) |
The difference between cost amounts for financial statement and federal income tax purposes is due primarily to timing differences in recognizing certain gains and losses in security transactions.
GAAP requires that certain components of net assets be reclassified between financial and tax reporting. These reclassifications have no effect on net assets or net asset value per share. For the year ended September 30, 2023, permanent differences in book and tax accounting have been reclassified to paid-in capital and total distributable earnings (accumulated deficit) as follows:
| | | Increase (Decrease) | |
| | | Paid-in Capital | | | Total Distributable Earnings (Accumulated Deficit) | |
| Multi-Strategy Alternatives Fund | | $ | 983 | | | $ | (983 | ) |
| Sustainable Income Fund | | | (43 | ) | | | 43 | |
| Thomson Reuters Venture Capital Return Tracker Fund | | | (648,225 | ) | | | 648,225 | |
| Merger Fund | | | 9,677 | | | | (9,677 | ) |
| Alternative Value Fund | | | 18,177 | | | | (18,177 | ) |
| Market Neutral Fund | | | (10,832 | ) | | | 10,832 | |
| Adaptive Plus Fund | | | (167 | ) | | | 167 | |
| Income Opportunities Fund | | | - | | | | - | |
| Dynamic Opportunity Fund | | | - | | | | - | |
| Tactical Income Fund | | | (12,894 | ) | | | 12,894 | |
AXS Funds
NOTES TO FINANCIAL STATEMENTS - Continued
September 30, 2023
The tax basis of the components of distributable net earnings (accumulated deficit) at September 30, 2023 were as follows:
| | | Multi-Strategy Alternatives Fund | | | Sustainable Income Fund | | | Thomson Reuters Venture Capital Return Tracker Fund | |
| Undistributed ordinary income | | $ | 65,512 | | | $ | - | | | $ | - | |
| Undistributed long-term capital gains | | | - | | | | - | | | | - | |
| Tax accumulated earnings | | | 65,512 | | | | - | | | | - | |
| | | | | | | | | | | | | |
| Accumulated capital and other losses | | | (1,278,691 | ) | | | (582,227 | ) | | | (121,865,391 | ) |
| Unrealized appreciation (depreciation) on investments | | | 221,071 | | | | (134,079 | ) | | | 3,181,864 | |
| Unrealized appreciation (depreciation) on swap contracts | | | - | | | | - | | | | (3,693,720 | ) |
| Unrealized appreciation (depreciation) on foreign currency translations | | | - | | | | - | | | | - | |
| Unrealized Trustees’ deferred compensation | | | (8,138 | ) | | | (4,815 | ) | | | (38,115 | ) |
| Total accumulated earnings (deficit) | | $ | (1,000,246 | ) | | $ | (721,121 | ) | | $ | (122,415,362 | ) |
| | | Merger Fund | | | Alternative Value Fund | | | Market Neutral Fund | |
| Undistributed ordinary income | | $ | 1,612,679 | | | $ | 4,449 | | | $ | 241,254 | |
| Undistributed long-term capital gains | | | - | | | | - | | | | - | |
| Tax accumulated earnings | | | 1,612,679 | | | | 4,449 | | | | 241,254 | |
| | | | | | | | | | | | | |
| Accumulated capital and other losses | | | (73,865 | ) | | | (277,371 | ) | | | (4,213,289 | ) |
| Unrealized appreciation (depreciation) on investments | | | 380,502 | | | | (423,304 | ) | | | 447,950 | |
| Unrealized appreciation (depreciation) on foreign currency translations | | | 2,297 | | | | - | | | | - | |
| Unrealized Trustees’ deferred compensation | | | (10,137 | ) | | | (2,937 | ) | | | (3,473 | ) |
| Total accumulated earnings (deficit) | | $ | 1,911,476 | | | $ | (699,163 | ) | | $ | (3,527,558 | ) |
AXS Funds
NOTES TO FINANCIAL STATEMENTS - Continued
September 30, 2023
| | | Adaptive Plus Fund | | | Income Opportunities Fund | | | Dynamic Opportunity Fund | |
| Undistributed ordinary income | | $ | 294,336 | | | $ | - | | | $ | 441,185 | |
| Undistributed long-term capital gains | | | - | | | | - | | | | - | |
| Tax accumulated earnings | | | 294,336 | | | | - | | | | 441,185 | |
| | | | | | | | | | | | | |
| Accumulated capital and other losses | | | (164,740 | ) | | | (48,130,645 | ) | | | (1,075,149 | ) |
| Unrealized appreciation (depreciation) on investments | | | (1,285,586 | ) | | | (11,029,559 | ) | | | 4,148,964 | |
| Unrealized appreciation (depreciation) on foreign currency translations | | | - | | | | - | | | | - | |
| Unrealized Trustees’ deferred compensation | | | (2,165 | ) | | | - | | | | (1,248 | ) |
| Total accumulated earnings (deficit) | | $ | (1,158,155 | ) | | $ | (59,160,204 | ) | | $ | 3,513,752 | |
| | | Tactical Income Fund | |
| Undistributed ordinary income | | $ | - | |
| Undistributed long-term capital gains | | | - | |
| Tax accumulated earnings | | | - | |
| | | | | |
| Accumulated capital and other losses | | | (8,188,014 | ) |
| Unrealized appreciation (depreciation) on investments | | | (940,069 | ) |
| Unrealized appreciation (depreciation) on foreign currency translations | | | - | |
| Unrealized Trustees’ deferred compensation | | | (861 | ) |
| Total accumulated earnings (deficit) | | $ | (9,128,944 | ) |
AXS Funds
NOTES TO FINANCIAL STATEMENTS - Continued
September 30, 2023
The tax character of the distributions paid during the periods ended September 30, 2023, September 30, 2022, August 31, 2023, August 31, 2022, December 31, 2022, December 31, 2021 and June 30, 2022 were as follows:
| | | Multi-Strategy Alternatives Fund | |
| | | September 30, 2023 | | | September 30, 2022 | |
| Distributions paid from: | | | | | | | | |
| Ordinary income | | $ | - | | | $ | 3,646,539 | |
| Net long-term capital gains | | | - | | | | 399,445 | |
| Total distributions paid | | $ | - | | | $ | 4,045,984 | |
| | | Sustainable Income Fund | |
| | | September 30, 2023 | | | September 30, 2022 | |
| Distributions paid from: | | | | | | | | |
| Ordinary income | | $ | 103,017 | | | $ | 1,827,684 | |
| Net long-term capital gains | | | - | | | | 12,926 | |
| Total distributions paid | | $ | 103,017 | | | $ | 1,840,610 | |
| | | Thomson Reuters Venture Capital Return Tracker Fund | |
| | | September 30, 2023 | | | September 30, 2022 | |
| Distributions paid from: | | | | | | | | |
| Ordinary income | | $ | 1,045,319 | | | $ | 27,678,206 | |
| Net long-term capital gains | | | - | | | | 43,747,033 | |
| Total distributions paid | | $ | 1,045,319 | | | $ | 71,425,239 | |
| | | Merger Fund | |
| | | September 30, 2023 | | | September 30, 2022 | |
| Distributions paid from: | | | | | | | | |
| Ordinary income | | $ | 213,383 | | | $ | 550,151 | |
| Net long-term capital gains | | | 19,287 | | | | 193,385 | |
| Total distributions paid | | $ | 232,670 | | | $ | 743,536 | |
| | | Alternative Value Fund | |
| | | September 30, 2023 | | | September 30, 2022 | |
| Distributions paid from: | | | | | | | | |
| Ordinary income | | $ | 175,220 | | | $ | 22,193 | |
| Net long-term capital gains | | | 191,373 | | | | 34,712 | |
| Total distributions paid | | $ | 366,593 | | | $ | 56,905 | |
| | | Market Neutral Fund | |
| | | September 30, 2023 | | | September 30, 2022 | | | June 30, 2022 | |
| Distributions paid from: | | | | | | | | | | | | |
| Ordinary income | | $ | - | | | $ | - | | | $ | - | |
| Net long-term capital gains | | | - | | | | - | | | | - | |
| Total distributions paid | | $ | - | | | $ | - | | | $ | - | |
AXS Funds
NOTES TO FINANCIAL STATEMENTS - Continued
September 30, 2023
| | | Adaptive Plus Fund | |
| | | September 30, 2023 | | | September 30, 2022 | |
| Distributions paid from: | | | | | | | | |
| Ordinary income | | $ | 54,338 | | | $ | - | |
| Net long-term capital gains | | | - | | | | - | |
| Total distributions paid | | $ | 54,338 | | | $ | - | |
| | | Income Opportunities Fund* | |
| | | September 30, 2023 | | | August 31, 2023 | | | August 31, 2022 | |
| Distributions paid from: | | | | | | | | | | | | |
| Ordinary income | | $ | 624,677 | | | $ | 4,807,949 | | | $ | 4,110,908 | |
| Net long-term capital gains | | | - | | | | - | | | | - | |
| Return of capital | | | 612,989 | | | | 2,552,672 | | | | 5,859,184 | |
| Total distributions paid | | $ | 1,237,666 | | | $ | 7,360,621 | | | $ | 9,970,092 | |
| | | Dynamic Opportunity Fund* | |
| | | September 30, 2023 | | | December 31, 2022 | | | December 31, 2021 | |
| Distributions paid from: | | | | | | | | | | | | |
| Ordinary income | | $ | - | | | $ | - | | | $ | - | |
| Net long-term capital gains | | | - | | | | 4,898,230 | | | | 2,463,974 | |
| Return of capital | | | - | | | | - | | | | 15,510 | |
| Total distributions paid | | $ | - | | | $ | 4,898,230 | | | $ | 2,479,484 | |
| | | Tactical Income Fund* | |
| | | September 30, 2023 | | | December 31, 2022 | | | December 31, 2021 | |
| Distributions paid from: | | | | | | | | | | | | |
| Ordinary income | | $ | 1,720,297 | | | $ | 1,275,175 | | | $ | 2,043,660 | |
| Net long-term capital gains | | | - | | | | - | | | | - | |
| Tax exempt income | | | - | | | | - | | | | 172,599 | |
| Return of capital | | | - | | | | - | | | | 14,908 | |
| Total distributions paid | | $ | 1,720,297 | | | $ | 1,275,175 | | | $ | 2,231,167 | |
*The Fund’s new tax year is September 30, 2023.
As of September 30, 2023, the Funds had qualified late-year ordinary losses, which are deferred until fiscal year 2024 for tax purposes. Net late-year ordinary losses incurred after December 31, and within the taxable year, are deemed to arise on the first day of each Fund’s next taxable year.
| | | Late-Year Ordinary Losses | |
| Thomson Reuters Venture Capital Return Tracker Fund | | $ | 2,953,740 | |
AXS Funds
NOTES TO FINANCIAL STATEMENTS - Continued
September 30, 2023
As of September 30, 2023, the Funds had post-October capital losses, which are deferred until fiscal year 2024 for tax purposes. Capital losses incurred after October 31, and within the year are deemed to arise on the first day of the Fund’s next taxable year.
| | | Post-October Capital Losses | |
| Multi-Strategy Alternatives Fund | | $ | 138,995 | |
| Sustainable Income Fund | | | 106,111 | |
| Thomson Reuters Venture Capital Return Tracker Fund | | | 9,599,646 | |
| Merger Fund | | | 73,865 | |
As of September 30, 2023, the Funds had net capital loss carryovers as follows:
| Not subject to expiration: | | Short-term | | | Long-term | | | Total | |
| Multi-Strategy Alternatives Fund | | $ | 1,139,696 | | | $ | - | | | $ | 1,139,696 | |
| Sustainable Income Fund | | | 476,116 | | | | - | | | | 476,116 | |
| Thomson Reuters Venture Capital Return Tracker Fund | | | 106,747,583 | | | | 2,564,422 | | | | 109,312,005 | |
| Alternative Value Fund | | | 195,810 | | | | 81,561 | | | | 277,371 | |
| Market Neutral Fund | | | 4,213,289 | | | | - | | | | 4,213,289 | |
| Adaptive Plus Fund | | | 164,740 | | | | - | | | | 164,740 | |
| Income Opportunities Fund | | | 31,150,701 | | | | 16,979,944 | | | | 48,130,645 | |
| Dynamic Opportunity Fund | | | 1,075,149 | | | | - | | | | 1,075,149 | |
| Tactical Income Fund | | | 7,981,701 | | | | 206,313 | | | | 8,188,014 | |
The Multi-Strategy Alternatives Fund, Sustainable Income Fund, Thomson Reuters Venture Capital Return Tracker Fund, Alternative Value Fund, Market Neutral Fund, Adaptive Plus Fund, Income Opportunities Fund, Dynamic Opportunity Fund and Tactical Income Fund had utilized non-expiring capital loss carry overs totaling $0, $0, $0, $0, $154,912, $0, $0, $0 and $0, respectively.
Note 5 – Redemption Fee
The Sustainable Income Fund, Thomson Reuters Venture Capital Return Tracker Fund, Merger Fund, Alternative Value Fund, Market Neutral Fund, Dynamic Opportunity Fund and Tactical Income Fund may impose a redemption fee of 1.00% of the total redemption amount on all shares redeemed within 30 days of purchase. These Funds received redemption fees as follows:
| | | Periods Ended
September 30, 2023 | | | Year Ended September 30, 2022 | | | Year Ended December 31, 2022 | |
| Sustainable Income Fund | | $ | - | | | $ | - | | | $ | - | |
| Thomson Reuters Venture Capital Return Tracker Fund | | | 9,276 | | | | 50,820 | | | | - | |
| Merger Fund | | | - | | | | 14,612 | | | | - | |
| Alternative Value Fund | | | 975 | | | | 1,359 | | | | - | |
| Market Neutral Fund | | | 8,395 | | | | 3,217 | | | | - | |
| Dynamic Opportunity Fund | | | 4,441 | | | | - | | | | 291 | |
| Tactical Income Fund | | | 3,196 | | | | - | | | | 105 | |
AXS Funds
NOTES TO FINANCIAL STATEMENTS - Continued
September 30, 2023
Note 6 – Investment Transactions
For the periods ended September 30, 2023, cost of purchases and proceeds from sales of portfolio securities, other than short-term investments, option transactions and short-term U.S. Government securities were as follows:
| | | Purchases | | | Sales | | | Proceeds from Securities Sold Short | | | Cover Short Securities | |
| Multi-Strategy Alternatives Fund | | $ | 63,389,148 | | | $ | 67,080,557 | | | $ | - | | | $ | - | |
| Sustainable Income Fund | | | 2,834,340 | | | | 789,567 | | | | - | | | | - | |
| Thomson Reuters Venture Capital Return Tracker Fund | | | 26,055,244 | | | | 59,558,374 | | | | - | | | | - | |
| Merger Fund | | | 69,529,629 | | | | 97,909,840 | | | | 10,578,139 | | | | 13,771,182 | |
| Alternative Value Fund | | | 8,787,623 | | | | 20,632,309 | | | | - | | | | - | |
| Market Neutral Fund | | | 36,825,028 | | | | 40,997,835 | | | | 29,740,568 | | | | 31,928,956 | |
| Adaptive Plus Fund | | | - | | | | - | | | | - | | | | - | |
| Income Opportunities Fund | | | 4,090,969 | | | | 4,821,737 | | | | - | | | | - | |
| Dynamic Opportunity Fund | | | 179,368,536 | | | | 186,873,514 | | | | 39,046,299 | | | | 53,195,605 | |
| Tactical Income Fund | | | 227,869,938 | | | | 213,990,373 | | | | 674,229 | | | | 675,541 | |
Note 7 – Shareholder Servicing Plan
For the period January 1, 2023 through May 12, 2023, the AXS Dynamic Opportunity Predecessor Fund and AXS Tactical Income Predecessor Fund had a Shareholder Servicing Plan for the Funds’ Class A shares to pay for shareholder services. The Plan provided a monthly service fee at an annual rate of 0.25% of the average daily net assets and paid to the Distributor for shareholder servicing activities.
For the period January 1, 2023 through May 12, 2023, shareholder servicing fees incurred are disclosed on the Statements of Operations.
Note 8 – Distribution Plan
The Trust, on behalf of each Fund, has adopted a Distribution Plan (the “Plan”) pursuant to Rule 12b-1 under the 1940 Act that allows each Fund to pay distribution fees for the sale and distribution of its shares. With respect to Investor Class shares, Class A shares, Class C shares and Class D shares, the Plan provides for the payment of distribution fees at the annual rate of up to 0.25%, 0.25%, 1.00% and 1.00%, respectively, of average daily net assets. Class I Shares are not subject to any distribution or service fees under the Plan.
For the periods ended September 30, 2023, distribution fees incurred are disclosed on the Statements of Operations.
Note 9 – Indemnifications
In the normal course of business, the Funds enter into contracts that contain a variety of representations, which provide general indemnifications. The Funds’ maximum exposure under these arrangements is unknown, as this would involve future claims that may be made against the Funds that have not yet occurred. However, the Funds expect the risk of loss to be remote.
AXS Funds
NOTES TO FINANCIAL STATEMENTS - Continued
September 30, 2023
Note 10 – Fair Value Measurements and Disclosure
Fair Value Measurements and Disclosures defines fair value, establishes a framework for measuring fair value in accordance with GAAP, and expands disclosure about fair value measurements. It also provides guidance on determining when there has been a significant decrease in the volume and level of activity for an asset or a liability, when a transaction is not orderly, and how that information must be incorporated into a fair value measurement.
Under Fair Value Measurements and Disclosures, various inputs are used in determining the value of the Funds’ investments. These inputs are summarized into three broad Levels as described below:
| · | Level 1 – Unadjusted quoted prices in active markets for identical assets or liabilities that the Funds have the ability to access. |
| · | Level 2 – Observable inputs other than quoted prices included in level 1 that are observable for the asset or liability, either directly or indirectly. These inputs may include quoted prices for the identical instrument on an inactive market, prices for similar instruments, interest rates, prepayment speeds, credit risk, yield curves, default rates and similar data. |
| · | Level 3 – Unobservable inputs for the asset or liability, to the extent relevant observable inputs are not available; representing the Funds’ own assumptions about the assumptions a market participant would use in valuing the asset or liability and would be based on the best information available. |
The availability of observable inputs can vary from security to security and is affected by a wide variety of factors, including, for example, the type of security, whether the security is new and not yet established in the marketplace, the liquidity of markets, and other characteristics particular to the security. To the extent that valuation is based on models or inputs that are less observable or unobservable in the market, the determination of fair value requires more judgment. Accordingly, the degree of judgment exercised in determining fair value is greatest for instruments categorized in Level 3.
Fund-linked options are stated at fair value based on the fair value of the ProfitScore Capital Management, Inc. Regime Adaptive Equity trading program, taking into account any fees and expenses associated with the fund-linked option. Fund-linked options are generally categorized in Level 2.
The inputs used to measure fair value may fall into different Levels of the fair value hierarchy. In such cases, for disclosure purposes, the Level in the fair value hierarchy within which the fair value measurement falls in its entirety, is determined based on the lowest Level input that is significant to the fair value measurement in its entirety.
The inputs or methodology used for valuing securities are not an indication of the risk associated with investing in those securities. The following is a summary of the inputs used, as of September 30, 2023, in valuing the Funds’ assets and liabilities carried at fair value:
AXS Funds
NOTES TO FINANCIAL STATEMENTS - Continued
September 30, 2023
| Multi-Strategy Alternatives Fund | | Level 1 | | | Level 2 | | | Level 3** | | | Total | |
| Assets | | | | | | | | | | | | | | | | |
| Investments | | | | | | | | | | | | | | | | |
| Common Stocks1 | | $ | 8,871,779 | | | $ | - | | | $ | - | | | $ | 8,871,779 | |
| Exchange-Traded Funds | | | 5,292,189 | | | | - | | | | - | | | | 5,292,189 | |
| Short-Term Investments | | | 1,938,289 | | | | - | | | | - | | | | 1,938,289 | |
| Other Financial Instruments*** | | | | | | | | | | | | | | | | |
| Swap Contracts | | | - | | | | 131,547 | | | | - | | | | 131,547 | |
| Total Assets | | $ | 16,102,257 | | | $ | 131,547 | | | $ | - | | | $ | 16,233,804 | |
| Sustainable Income Fund | | Level 1 | | | Level 2 | | | Level 3** | | | Total | |
| Investments | | | | | | | | | | | | | | | | |
| Corporate Bonds1 | | $ | - | | | $ | 2,984,149 | | | $ | - | | | $ | 2,984,149 | |
| Medium Term Notes | | | - | | | | 47,468 | | | | - | | | | 47,468 | |
| Preferred Stocks1 | | | 38,475 | | | | - | | | | - | | | | 38,475 | |
| U.S. Treasury Notes | | | - | | | | 104,939 | | | | - | | | | 104,939 | |
| Short-Term Investments | | | 17,855 | | | | - | | | | - | | | | 17,855 | |
| Total Investments | | $ | 56,330 | | | $ | 3,136,556 | | | $ | - | | | $ | 3,192,886 | |
| Thomson Reuters Venture Capital Return Tracker Fund | | Level 1 | | | Level 2 | | | Level 3** | | | Total | |
| Assets | | | | | | | | | | | | | | | | |
| Investments | | | | | | | | | | | | | | | | |
| Common Stocks1 | | $ | 108,588,160 | | | $ | - | | | $ | - | | | $ | 108,588,160 | |
| Short-Term Investments | | | 118,546 | | | | - | | | | - | | | | 118,546 | |
| Total Investments | | | 108,706,706 | | | | - | | | | - | | | | 108,706,706 | |
| | | | | | | | | | | | | | | | | |
| Liabilities | | | | | | | | | | | | | | | | |
| Other Financial Instruments*** | | | | | | | | | | | | | | | | |
| Swap Contracts | | $ | - | | | $ | 3,693,720 | | | $ | - | | | $ | 3,693,720 | |
| Total Liabilities | | $ | - | | | $ | 3,693,720 | | | $ | - | | | $ | 3,693,720 | |
AXS Funds
NOTES TO FINANCIAL STATEMENTS - Continued
September 30, 2023
| Merger Fund | | Level 1 | | | Level 2* | | | Level 3* | | | Total | |
| Assets | | | | | | | | | | | | | | | | |
| Investments | | | | | | | | | | | | | | | | |
| Common Stocks1 | | $ | 17,211,087 | | | $ | - | | | $ | - | | | $ | 17,211,087 | |
| Short-Term Investments | | | 14,231,480 | | | | - | | | | - | | | | 14,231,480 | |
| Total Assets | | $ | 31,442,567 | | | $ | - | | | $ | - | | | $ | 31,442,567 | |
| | | | | | | | | | | | | | | | | |
| Liabilities | | | | | | | | | | | | | | | | |
| Securities Sold Short | | | | | | | | | | | | | | | | |
| Common Stocks1 | | $ | 4,413,156 | | | $ | - | | | $ | - | | | $ | 4,413,156 | |
| Total Liabilities | | $ | 4,413,156 | | | $ | - | | | $ | - | | | $ | 4,413,156 | |
| Alternative Value Fund | | Level 1 | | | Level 2* | | | Level 3* | | | Total | |
| Investments | | | | | | | | | | | | | | | | |
| Common Stocks1 | | $ | 15,840,434 | | | $ | - | | | $ | - | | | $ | 15,840,434 | |
| Total Investments | | $ | 15,840,434 | | | $ | - | | | $ | - | | | $ | 15,840,434 | |
| Market Neutral Fund | | Level 1 | | | Level 2* | | | Level 3* | | | Total | |
| Assets | | | | | | | | | | | | | | | | |
| Investments | | | | | | | | | | | | | | | | |
| Common Stocks1 | | $ | 22,757,188 | | | $ | - | | | $ | - | | | $ | 22,757,188 | |
| Short-Term Investments | | | 133,014 | | | | - | | | | - | | | | 133,014 | |
| Total Assets | | $ | 22,890,202 | | | $ | - | | | $ | - | | | $ | 22,890,202 | |
| | | | | | | | | | | | | | | | | |
| Liabilities | | | | | | | | | | | | | | | | |
| Securities Sold Short | | | | | | | | | | | | | | | | |
| Common Stocks1 | | $ | 16,032,088 | | | $ | - | | | $ | - | | | $ | 16,032,088 | |
| Total Liabilities | | $ | 16,032,088 | | | $ | - | | | $ | - | | | $ | 16,032,088 | |
| Adaptive Plus Fund | | Level 1 | | | Level 2 | | | Level 3** | | | Total | |
| Investments | | | | | | | | | | | | | | | | |
| U.S. Treasury Bills | | $ | - | | | $ | 15,835,237 | | | $ | - | | | $ | 15,835,237 | |
| Short-Term Investments | | | 8,719,679 | | | | - | | | | - | | | | 8,719,679 | |
| Total Investments | | | 8,719,679 | | | | 15,835,237 | | | | - | | | | 24,554,916 | |
| Purchased Options Contracts | | | - | | | | 7,315,926 | | | | - | | | | 7,315,926 | |
| Total Investments and Purchased Options Contracts | | $ | 8,719,679 | | | $ | 23,151,163 | | | $ | - | | | $ | 31,870,842 | |
| Income Opportunities Fund | | Level 1 | | | Level 2* | | | Level 3* | | | Total | |
| Investments | | | | | | | | | | | | | | | | |
| Common Stocks1 | | $ | 11,573,485 | | | $ | - | | | $ | - | | | $ | 11,573,485 | |
| Preferred Stocks1 | | | 62,261,548 | | | | - | | | | - | | | | 62,261,548 | |
| Short-Term Investments | | | 1,414,731 | | | | - | | | | - | | | | 1,414,731 | |
| Total Investments | | $ | 75,249,764 | | | $ | - | | | $ | - | | | $ | 75,249,764 | |
AXS Funds
NOTES TO FINANCIAL STATEMENTS - Continued
September 30, 2023
| Dynamic Opportunity Fund | | Level 1 | | | Level 2 | | | Level 3** | | | Total | |
| Assets | | | | | | | | | | | | | | | | |
| Investments | | | | | | | | | | | | | | | | |
| Common Stocks1 | | $ | 23,429,740 | | | $ | - | | | $ | - | | | $ | 23,429,740 | |
| U.S. Treasury Bills | | | - | | | | 2,927,532 | | | | - | | | | 2,927,532 | |
| Short-Term Investments | | | 27,604,129 | | | | - | | | | - | | | | 27,604,129 | |
| Total Investments | | | 51,033,869 | | | | 2,927,532 | | | | - | | | | 53,961,401 | |
| Purchased Options Contracts | | | 362,500 | | | | - | | | | - | | | | 362,500 | |
| Total Investments and Purchased Options Contracts | | $ | 51,396,369 | | | $ | 2,927,532 | | | $ | - | | | $ | 54,323,901 | |
| Tactical Income Fund | | Level 1 | | | Level 2* | | | Level 3* | | | Total | |
| Investments | | | | | | | | | | | | | | | | |
| Common Stocks1 | | $ | 792,990 | | | $ | - | | | $ | - | | | $ | 792,990 | |
| Exchange-Traded Funds | | | 32,200,780 | | | | - | | | | - | | | | 32,200,780 | |
| Closed-End Funds | | | 176,380 | | | | - | | | | - | | | | 176,380 | |
| Short-Term Investments | | | 10,586,155 | | | | - | | | | - | | | | 10,586,155 | |
| Total Investments | | $ | 43,756,305 | | | $ | - | | | $ | - | | | $ | 43,756,305 | |
| 1 | For a detailed break-out by major industry classification, please refer to the Schedules of Investments. |
| * | The Funds did not hold any Level 2 or 3 securities at period end. |
| ** | The Funds did not hold any Level 3 securities at period end. |
| *** | Other financial instruments are derivative instruments such as swap contracts. Swap contracts are valued at the unrealized appreciation (depreciation) on the instrument. |
Note 11 – Derivatives and Hedging Disclosures
Derivatives and Hedging requires enhanced disclosures about the Funds’ derivative and hedging activities, including how such activities are accounted for and their effects on the Funds’ financial position and performance. The Funds invested in swap contracts and options contracts during the periods ended September 30, 2023.
The effects of these derivative instruments on the Funds’ financial position and financial performance as reflected in the Statements of Assets and Liabilities and Statements of Operations are presented in the tables below. The fair values of derivative instruments, as of September 30, 2023, by risk category are as follows:
| Multi-Strategy Alternatives Fund |
| | | Asset Derivatives |
| Derivatives not designated as hedging instruments | | Statements of Assets and Liabilities | | Value | |
| Equity contracts | | Unrealized appreciation on open swap contracts | | $ | 131,547 | |
AXS Funds
NOTES TO FINANCIAL STATEMENTS - Continued
September 30, 2023
| Thomson Reuters Venture Capital Return Tracker Fund |
| | | Liability Derivatives |
| Derivatives not designated as hedging instruments | | Statements of Assets and Liabilities | | Value | |
| Equity contracts | | Unrealized depreciation on open swap contracts | | $ | 3,693,720 | |
| Adaptive Plus Fund |
| | | Asset Derivatives |
| Derivatives not designated as hedging instruments | | Statements of Assets and Liabilities | | Value | |
| Equity contracts | | Purchased options contracts, at value | | $ | 7,315,926 | |
| Dynamic Opportunity Fund |
| | | Asset Derivatives |
| Derivatives not designated as hedging instruments | | Statements of Assets and Liabilities | | Value | |
| Equity contracts | | Purchased options contracts, at value | | $ | 362,500 | |
The effects of derivative instruments on the Statements of Operations for the periods ended September 30, 2023, are as follows:
| Multi-Strategy Alternatives Fund |
| Amount of Realized Gain or (Loss) on Derivatives Recognized in the Statements of Operations |
| Derivatives not designated as hedging instruments | | Open Swap Contracts | |
| Equity contracts | | $ | (247,756 | ) |
| Thomson Reuters Venture Capital Return Tracker Fund |
| Amount of Realized Gain or (Loss) on Derivatives Recognized in the Statements of Operations |
| Derivatives not designated as hedging instruments | | Open Swap Contracts | |
| Equity contracts | | $ | 925,787 | |
AXS Funds
NOTES TO FINANCIAL STATEMENTS - Continued
September 30, 2023
| Merger Fund |
| Amount of Realized Gain or (Loss) on Derivatives Recognized in the Statements of Operations |
| Derivatives not designated as hedging instruments | | Purchased Options Contracts | | | Written Options Contracts | |
| Equity contracts | | $ | (2,640 | ) | | $ | 986 | |
| Adaptive Plus Fund |
| Amount of Realized Gain or (Loss) on Derivatives Recognized in the Statements of Operations |
| Derivatives not designated as hedging instruments | | Purchased Options Contracts | |
| Equity contracts | | $ | (891,614 | ) |
| Dynamic Opportunity Fund |
| Amount of Realized Gain or (Loss) on Derivatives Recognized in the Statements of Operations |
| Derivatives not designated as hedging instruments | | Purchased Options Contracts | | | Written Options Contracts | |
| Equity contracts | | $ | (2,641,220 | ) | | $ | (415,276 | ) |
| Tactical Income Fund |
| Amount of Realized Gain or (Loss) on Derivatives Recognized in the Statements of Operations |
| Derivatives not designated as hedging instruments | | Purchased Options Contracts | | | Written Options Contracts | |
| Equity contracts | | $ | (13,609 | ) | | $ | 43,072 | |
| Multi-Strategy Alternatives Fund |
| Change in Unrealized Appreciation/Depreciation on Derivatives Recognized in the Statements of Operations |
| Derivatives not designated as hedging instruments | | Open Swap Contracts | |
| Equity contracts | | $ | (83,645 | ) |
| Thomson Reuters Venture Capital Return Tracker Fund |
| Change in Unrealized Appreciation/Depreciation on Derivatives Recognized in the Statements of Operations |
| Derivatives not designated as hedging instruments | | Open Swap Contracts | |
| Equity contracts | | $ | 1,855,070 | |
| Adaptive Plus Fund |
| Change in Unrealized Appreciation/Depreciation on Derivatives Recognized in the Statements of Operations |
| Derivatives not designated as hedging instruments | | Purchased Options Contracts | |
| Equity contracts | | $ | (705,708 | ) |
AXS Funds
NOTES TO FINANCIAL STATEMENTS - Continued
September 30, 2023
| Dynamic Opportunity Fund |
| Change in Unrealized Appreciation/Depreciation on Derivatives Recognized in the Statements of Operations |
| Derivatives not designated as hedging instruments | | Purchased Options Contracts | |
| Equity contracts | | $ | 381,095 | |
The average quarterly volume of derivative instruments held by the Funds during the periods ended September 30, 2023, are as follows:
| Multi-Strategy Alternatives Fund |
| | | | | Open Swap Contracts - Short | |
| Equity contracts | | Notional Value | | $ | 2,367,213 | |
| Thomson Reuters Venture Capital Return Tracker Fund |
| | | | | Open Swap Contracts – Long | |
| Equity contracts | | Notional Value | | $ | 164,316,417 | |
| Adaptive Plus Fund |
| | | | | Purchased Options Contracts | |
| Equity contracts | | Notional Value | | $ | 54 | |
| Dynamic Opportunity Fund |
| | | | | Purchased Options Contracts | | | Written Options Contracts | |
| Equity contracts | | Notional Value | | $ | 41,232,013 | | | $ | (1,689,924 | ) |
Note 12 - Disclosures about Offsetting Assets and Liabilities
Disclosures about Offsetting Assets and Liabilities requires an entity to disclose information about offsetting and related arrangements to enable users of its financial statements to understand the effect of those arrangements on its financial position. The guidance requires retrospective application for all comparative periods presented.
A Fund mitigates credit risk with respect to OTC derivative counterparties through credit support annexes included with International Swaps and Derivative Association (“ISDA”) Master Agreements or other Master Netting Agreements which are the standard contracts governing most derivative transactions between the Funds and each of its counterparties. These agreements allow the Funds and each counterparty to offset certain derivative financial instruments’ payables and/or receivables against each other and/or with collateral, which is generally held by the Funds’ custodian. The amount of collateral moved to/from applicable counterparties is based upon minimum transfer amounts specified in the agreement. To the extent amounts due to the Funds from its counterparties are not fully collateralized contractually or otherwise, the Funds bear the risk of loss from counterparty non-performance.
AXS Funds
NOTES TO FINANCIAL STATEMENTS - Continued
September 30, 2023
It is the Funds’ policy to recognize a net asset or liability equal to the unrealized appreciation (depreciation) of open swap contracts. As of September 30, 2023, the Funds are subject to a master netting arrangement for the open swap contracts. The following table shows additional information regarding the offsetting of assets and liabilities, as of September 30, 2023:
| Multi-Strategy Alternatives Fund |
| | | | | | | | Amounts Not Offset in Statements of Assets and Liabilities | | | | |
| Description | | Counterparty | | Gross Amounts Recognized in the Statements of Assets and Liabilities | | | Financial Instruments* | | | Cash Collateral* | | | Net Amount | |
| Unrealized appreciation on open swap contracts | | Cowen | | $ | 131,547 | | | $ | - | | | $ | - | | | $ | 131,547 | |
| Thomson Reuters Venture Capital Return Tracker Fund |
| | | | | | | | Amounts Not Offset in Statements of Assets and Liabilities | | | | |
| Description | | Counterparty | | Gross Amounts Recognized in the Statements of Assets and Liabilities | | | Financial Instruments* | | | Cash Collateral* | | | Net Amount | |
| Unrealized depreciation on open swap contracts | | BNP Paribas | | $ | (3,693,720 | ) | | $ | 3,693,720 | | | $ | - | | | $ | - | |
| * | Amounts relate to master netting agreements and collateral agreements which have been determined by the Advisor to be legally enforceable in the event of default but where certain other criteria are not met in accordance with applicable offsetting accounting guidance. The collateral amounts may exceed the related net amounts of financial assets and liabilities presented in the Statements of Assets and Liabilities. Where this is the case, the total amount reported is limited to the net amounts of financial assets and liabilities with that counterparty. |
AXS Funds
NOTES TO FINANCIAL STATEMENTS - Continued
September 30, 2023
Note 13 – Borrowing
The Alternative Value Fund, Market Neutral Fund and Income Opportunities Fund have entered into a borrowing agreement with BNP Paribas (acting through its New York Branch). The Funds may borrow amounts up to one-third of the value of its assets. The Alternative Value Fund, Market Neutral Fund and Income Opportunities Fund are charged interest of the bank’s prime rate plus 1.25%, 1.00% and 1.30%, respectively, for borrowing under this agreement. Interest expense for the year ended September 30, 2023, is disclosed on the Statements of Operations, if applicable. The Market Neutral Fund did not borrow under the line of credit agreement during the year ended September 30, 2023. Credit facility activity for the period ended September 30, 2023, was as follows:
| | | Alternative Value Fund | | | Income Opportunities Fund | |
| Maximum available credit as of September 30, 2023 | | $ | 5,327,971 | | | $ | 25,532,249 | |
| Largest amount outstanding on an individual day | | | 11,455,923 | | | | 7,889,372 | |
| Average daily loan outstanding | | | 5,978,146 | | | | 7,889,372 | |
| Credit facility outstanding as of September 30, 2023 | | | 2,470,948 | | | | 7,889,372 | |
| Average interest rate when in use | | | 5.84 | % | | | 6.62 | % |
| Interest | | $ | 345,689 | | | $ | 40,608 | |
Note 14 – Market Disruption and Geopolitical Risks
Certain local, regional, or global events such as war, acts of terrorism, the spread of infectious illness and/or other public health issues, financial institution instability or other events may have a significant impact on a security or instrument. These types of events and other like them are collectively referred to as “Market Disruptions and Geopolitical Risks” and they may have adverse impacts on the worldwide economy, as well as the economies of individual countries, the financial health of individual companies and the market in general in significant and unforeseen ways. Some of the impacts noted in recent times include but are not limited to embargos, political actions, supply chain disruptions, bank failures, restrictions to investment and/or monetary movement including the forced selling of securities or the inability to participate impacted markets. The duration of these events could adversely affect the Funds’ performance, the performance of the securities in which the Funds invest and may lead to losses on your investment. The ultimate impact of “Market Disruptions and Geopolitical Risks” on the financial performance of the Funds’ investments is not reasonably estimable at this time. Management is actively monitoring these events.
AXS Funds
NOTES TO FINANCIAL STATEMENTS - Continued
September 30, 2023
Note 15– Control Ownership
The beneficial ownership, either directly or indirectly, of more than 25% of the voting securities of a Fund creates presumption of control of the Fund, under Section 2(a) 9 of the Act. As of September 30, 2023, beneficial ownership in excess of 25% is as follows:
| Fund | Beneficial Owner | % of Outstanding Shares |
| Multi-Strategy Alternatives Fund | National Financial Services, LLC | 27.6% |
| Sustainable Income Fund | SEI Private Trust Company | 44.7% |
| Sustainable Income Fund | National Financial Services, LLC | 36.3% |
| Thomson Reuters Venture Capital Return Tracker Fund | Interactive Brokers, LLC | 46.9% |
| Merger Fund | LPL Financial, LLC | 29.5% |
| Alternative Value Fund | SEI Private Trust Company | 34.6% |
| Alternative Value Fund | National Financial Services, LLC | 28.6% |
| Market Neutral Fund | Charles Schwab & Co. | 42.6% |
| Market Neutral Fund | LPL Financial, LLC | 25.6% |
| Adaptive Plus Fund | Charles Schwab & Co. | 97.2% |
| Income Opportunities Fund | Pershing LLC | 39.5% |
| Income Opportunities Fund | National Financial Services, LLC | 27.0% |
| Dynamic Opportunity Fund | Charles Schwab & Co. | 89.4% |
| Tactical Income Fund | Charles Schwab & Co. | 84.2% |
The Trust has no knowledge as to whether all or any portion of the shares owned of record are also owned beneficially.
Note 16 – New Accounting Pronouncements and Regulatory Updates
Effective January 24, 2023, the SEC adopted rule and form amendments to require mutual funds and ETFs to transmit concise and visually engaging streamlined annual and semiannual reports to shareholders that highlight key information deemed important for retail investors to assess and monitor their fund investments. Other information, including financial statements, will no longer appear in the funds’ streamlined shareholder reports but must be available online, delivered free of charge upon request, and filed on a semiannual basis on Form N-CSR. The rule and form amendments have a compliance date of July 24, 2024. At this time, management is evaluating the impact of these rule and form amendment changes on the content of the current shareholder report and the newly created annual and semiannual streamlined shareholder reports.
In October 2020, the SEC adopted new regulations governing the use of derivatives by registered investment companies (“Rule 18f-4”). Rule 18f-4 will impose limits on the amount of derivatives a Fund can enter into, eliminate the asset segregation framework currently used by funds to comply with Section 18 of the 1940 Act, and require funds whose use of derivatives is greater than a limited specified amount to establish and maintain a comprehensive derivatives risk management program and appoint a derivatives risk manager. The Funds have adopted procedures in accordance with Rule 18f-4.
In December 2020, the SEC adopted a new rule providing a framework for fund valuation practices (“Rule 2a-5”). Rule 2a-5 establishes requirements for determining fair value in good faith for purposes of the 1940 Act. Rule 2a-5 will permit fund boards to designate certain parties to perform fair value determinations, subject to board oversight and certain other conditions. Rule 2a-5 also defines when market quotations are “readily available” for purposes of the 1940 Act and the threshold for determining whether a fund must fair value a security. In connection with Rule 2a-5, the SEC also adopted related recordkeeping requirements and is rescinding previously issued guidance, including with respect to the role of a board in determining fair value and the accounting and auditing of fund investments. The Funds have adopted procedures in accordance with Rule 2a-5.
AXS Funds
NOTES TO FINANCIAL STATEMENTS - Continued
September 30, 2023
In March 2020, the Financial Accounting Standards Board (FASB) issued Accounting Standards Update (ASU) No. 2020-04, Reference Rate Reform (Topic 848) – Facilitation of the Effects of Reference Rate Reform on Financial Reporting. The amendments in the ASU provide optional temporary financial reporting relief from the effect of certain types of contract modifications due to the planned discontinuation of the London Interbank Offered Rate and other interbank-offered based reference rates as of the end of 2021. The ASU is effective for certain reference rate-related contract modifications that occur during the period March 12, 2020 through December 31, 2022. In December 2022, the FASB issued ASU No. 2022-06, Reference Rate Reform (Topic 848) - Deferral of the Sunset Date of Topic 848, which extends the period through December 31, 2024. Management has reviewed the requirements and believes the adoption of these ASUs will not have a material impact on the financial statements.
Note 17 - Change in Independent Public Accountant
On January 19, 2023, the Audit Committee of the Board of Trustees of Investment Managers Series Trust II (the “Trust”) appointed Tait, Weller & Baker LLP (“Tait”) as the AXS Dynamic Opportunity Fund and the AXS Tactical Income Fund (each a “Fund” collectively the “Funds”) independent registered public accounting firm upon the reorganization of the ACM Dynamic Opportunity Fund and the ACM Tactical Income Fund (the “Predecessor Funds”) for the fiscal period ended September 30, 2023. Previously, BBD, LLP (“BBD”) served as the independent registered public accounting firm to the Predecessor Funds.
BBD’s report on the financial statements for the Predecessor Funds for fiscal years ended December 31, 2022 and December 31, 2021 contained no adverse opinion or disclaimer of opinion, nor was it qualified or modified as to uncertainty, audit scope, or accounting principles. During the Funds’ fiscal years ended December 2021, December 31, 2022 and through January 19, 2023 there were no (i) disagreements with BBD on any matter of accounting principles or practices, financial statement disclosure, or auditing scope or procedure, which disagreements, if not resolved to the satisfaction of BBD, would have caused it to make reference to the subject matter of the disagreements in connection with its report on the Predecessor Funds financial statements for such period, nor (ii) “reportable events” of the kinds described in Item 304(a)(1)(v) of Regulation S-K under the Securities Exchange Act of 1934, as amended.
During the period prior to December 31, 2022 and through January 19, 2023, neither the Funds nor anyone on behalf of the Funds had consulted Tait on items that concerned (a) the application of accounting principles to a specified transaction, either completed or proposed, or the type of audit opinion that might be rendered on the Funds’ financial statements, or (b) the subject of a disagreement (as defined in paragraph (a)(1)(iv) of Item 304 of Regulation S-K and related instructions) or reportable events (as described in paragraph (a)(1)(v) of Item 304 of Regulation S-K). The selection of Tait does not reflect any disagreements with BBD or dissatisfaction by the Funds, the Board, or the Audit Committee with the performance of BBD.
Note 18 – Events Subsequent to the Fiscal Period End
The Funds have adopted financial reporting rules regarding subsequent events which require an entity to recognize in the financial statements the effects of all subsequent events that provide additional evidence about conditions that existed at the date of the balance sheet. Management has evaluated the Funds’ related events and transactions that occurred through the date of issuance of the Funds’ financial statements. There were no events or transactions that occurred during this period that materially impacted the amounts or disclosures in the Funds’ financial statements.
AXS Chesapeake Strategy Fund
NOTES TO CONSOLIDATED FINANCIAL STATEMENTS
September 30, 2023
Note 1 – Organization
AXS Chesapeake Strategy Fund (the “Fund”) is organized as a diversified series of Investment Managers Series Trust II, a Delaware statutory trust (the “Trust”) which is registered as an open-end management investment company under the Investment Company Act of 1940, as amended (the “1940 Act”). The Fund’s investment objective is long-term capital appreciation.
The Fund commenced investment operations on November 11, 2019 with Class A shares, Class C Shares and Class I shares. Prior to that date, the Fund acquired the assets and assumed the liabilities of the Equinox Chesapeake Strategy Fund (the “Chesapeake Strategy Predecessor Fund”), a series of Equinox Funds Trust, which offered three class of shares, Class A, Class C, and Class I shares. On November 6, 2019, beneficial owners of the Chesapeake Strategy Predecessor Fund approved a proposed Agreement and Plan of Reorganization that provided for the reorganization into the Fund. The Plan of Reorganization was approved by the Trust’s Board on June 14, 2019 and by the Equinox Funds Trust Board on July 1, 2019. The tax-free reorganization was accomplished on November 8, 2019. As a result of the reorganization, the Fund assumed the performance and accounting history of the Chesapeake Strategy Predecessor Fund. Financial information included for the dates prior to the reorganization is that of the Chesapeake Strategy Predecessor Fund.
The reorganization was accomplished by the following tax-free exchange in which each shareholder of the Chesapeake Strategy Predecessor Fund received the same aggregate share net asset value in the corresponding classes as noted below:
| | | Shares Issued | | | Net Assets | |
| Class A | | | 455,380 | | | $ | 4,835,786 | |
| Class C | | | 52,298 | | | | 541,044 | |
| Class I | | | 7,369,196 | | | | 78,929,398 | |
The net unrealized depreciation of investments transferred was $2,540,824 as of the date of the acquisition.
On November 3, 2021, based on the recommendation of the Advisor, the Trust’s Board approved the reorganization of the AXS Aspect Core Diversified Strategy Fund (the “Aspect Core Fund”) into the Fund. The Board called and held a meeting of shareholders of Aspect Core Fund on December 15, 2021, where shareholders approved the reorganization. The purpose of the reorganization was to combine two funds within the Trust with similar investment objectives and strategies. The reorganization provided for the transfer of assets of the Aspect Core Fund (the “Target Fund”) to the Fund and the assumption of the liabilities of the Aspect Core Fund by the Fund. Following the reorganization, the Fund held the assets of the Aspect Core Fund. The reorganization was effective as of the close of business on December 17, 2021. The reorganization was accomplished by the following tax-free exchange in which each shareholder of the Aspect Core Fund received the same aggregate share net asset value in the corresponding classes as noted below:
| | | Shares Issued | | | Net Assets | |
| Class A | | | 83,620 | | | $ | 839,543 | |
| Class C | | | 180,850 | | | | 1,924,244 | |
| Class I | | | 295,670 | | | | 3,001,051 | |
AXS Chesapeake Strategy Fund
NOTES TO CONSOLIDATED FINANCIAL STATEMENTS - Continued
September 30, 2023
The Fund is an investment company and accordingly follows the investment company accounting and reporting guidance of the Financial Accounting Standards Board (FASB) Accounting Standard Codification Topic 946 “Financial Services — Investment Companies”.
(a) Consolidation of Subsidiary
The Fund may invest up to 25% of its total assets in its subsidiary, AXS Chesapeake Strategy Fund Limited (the “Fund’s subsidiary” or “subsidiary”), a wholly-owned and controlled subsidiary formed under the laws of the Cayman Islands. The Consolidated Schedule of Investments, Consolidated Statement of Assets and Liabilities, Consolidated Statement of Operations, Consolidated Statements of Changes in Net Assets and Consolidated Financial Highlights of the Fund include the accounts of the Fund’s subsidiary. All inter-company accounts and transactions have been eliminated in the consolidation for the Fund. The Fund’s subsidiary is advised by Chesapeake Investment Management LLC (“Chesapeake” or the “Sub-Advisor”) and acts as an investment vehicle in order to effect certain investments consistent with the Fund’s investment objective and policies specified in the Fund’s prospectus and statement of additional information. The Fund’s subsidiary will generally invest in derivatives, including commodity futures, and other investments intended to serve as margin or collateral for derivative positions. The inception date of the Fund’s subsidiary was April 19, 2012. As of September 30, 2023, total assets of the Chesapeake Strategy Fund were $54,348,547 of which $1,904,126, or approximately 3.50%, represented the Fund’s ownership of the shares of the Fund’s subsidiary.
For tax purposes, the Fund’s subsidiary is an exempted Cayman investment company. The Fund’s subsidiary has received an undertaking from the Government of the Cayman Islands exempting it from all local income, profits and capital gains taxes. No such taxes are levied in the Cayman Islands at the present time. For U.S. income tax purposes, each subsidiary is a Controlled Foreign Corporation (“CFC”) and as such is not subject to U.S. income tax. However, as a wholly-owned CFC, the subsidiary’s net income and capital gains, to the extent of its earnings and profits, will be included each year in the Fund’s investment company taxable income.
Note 2 – Accounting Policies
The following is a summary of the significant accounting policies consistently followed by the Fund in the preparation of its financial statements. The preparation of financial statements in conformity with accounting principles generally accepted in the United States of America (“GAAP”) requires management to make estimates and assumptions that affect the reported amounts and disclosures in the financial statements. Actual results could differ from these estimates.
(a) Valuation of Investments
The Fund values equity securities at the last reported sale price on the principal exchange or in the principal over the counter (“OTC”) market in which such securities are traded, as of the close of regular trading on the NYSE on the day the securities are being valued or, if the last-quoted sales price is not readily available, the securities will be valued at the last bid or the mean between the last available bid and ask price. Securities traded on the NASDAQ are valued at the NASDAQ Official Closing Price (“NOCP”). Investments in open-end investment companies are valued at the daily closing net asset value of the respective investment company. Debt securities are valued by utilizing a price supplied by independent pricing service providers. The independent pricing service providers may use various valuation methodologies including matrix pricing and other analytical pricing models as well as market transactions and dealer quotations. These models generally consider such factors as yields or prices of bonds of comparable quality, type of issue, coupon, maturity, ratings and general market conditions. If a price is not readily available for a portfolio security, the security will be valued at fair value (the amount which the Fund might reasonably expect to receive for the security upon its current sale). The Board of Trustees has designated the Advisor as the Fund’s valuation designee (the “Valuation Designee”) to make all fair value determinations with respect to the Fund’s portfolio investments, subject to the Board’s oversight. As the Valuation Designee, the Advisor has adopted and implemented policies and procedures to be followed when the Fund must utilize fair value pricing. Prior to September 8, 2022, securities were valued at fair value as determined in good faith by the Fund’s advisor, subject to review and approval by the Valuation Committee, pursuant to procedures adopted by the Board of Trustees. The actions of the Valuation Committee were subsequently reviewed by the Board at its next regularly scheduled board meeting. The Valuation Committee met as needed. The Valuation Committee was comprised of all the Trustees, but action may have been taken by any one of the Trustees.
AXS Chesapeake Strategy Fund
NOTES TO CONSOLIDATED FINANCIAL STATEMENTS - Continued
September 30, 2023
(b) Foreign Currency Translation
The Fund’s records are maintained in U.S. dollars. The value of securities, currencies and other assets and liabilities denominated in currencies other than U.S. dollars are translated into U.S. dollars based upon foreign exchange rates prevailing at the end of the reporting period. The currencies are translated into U.S. dollars by using the exchange rates quoted as of 4:00 PM Eastern Standard Time. Purchases and sales of investment securities, income and expenses are translated on the respective dates of such transactions.
The Fund does not isolate that portion of its net realized and unrealized gains and losses on investments resulting from changes in foreign exchange rates from the impact arising from changes in market prices. Such fluctuations are included with net realized and unrealized gain or loss from investments and foreign currency.
Net realized foreign currency transaction gains and losses arise from sales of foreign currencies, currency gains or losses realized between the trade and settlement dates on securities transactions, and the differences between the amounts of dividends, interest, and foreign withholding taxes recorded on the Fund’s books and the U.S. dollar equivalent of the amounts actually received or paid. Net unrealized foreign currency translation gains and losses arise from changes in the value of assets and liabilities, other than investments in securities, resulting from changes in the exchange rates.
(c) Futures Contracts
The Fund purchases and sells futures contracts to pursue its investment objective and to gain exposure to, or hedge against, change in the value of equities, interest rates, foreign currency, or commodities. Initial margin deposits required upon entering into futures contracts are satisfied by the segregation of specific securities or cash as collateral for the account of the broker (the Portfolio’s agent in acquiring the futures position). During the period the futures contracts are open, changes in the value of the contracts are recognized as unrealized gains or losses by “marking to market” on a daily basis to reflect the market value of the contracts at the end of each day’s trading. Variation margin payments are received or made depending upon whether unrealized gains or losses are incurred. When the contracts are closed, the Fund recognizes a realized gain or loss equal to the difference between the proceeds from, or cost of, the closing transaction and the Fund’s basis in the contract. If the Fund was unable to liquidate a futures contract and/or enter into an offsetting closing transaction, the Fund would continue to be subject to market risk with respect to the value of the contracts and continue to be required to maintain the margin deposits on the futures contracts. The Fund segregates liquid securities having a value at least equal to the amount of the current obligation under any open futures contract. Risks may exceed amounts recognized in the Consolidated Statement of Assets and Liabilities. With futures, there is minimal counterparty credit risk to a Fund since futures are exchange traded and the exchange’s clearinghouse, as counterparty to all exchange traded futures, guarantees the futures against default.
(d) Forward Foreign Currency Contracts
The Fund may enter into forward currency exchange contracts in order to hedge against foreign currency exchange rate risks. A forward involves an obligation to purchase or sell a specific currency at a future date, which may be any fixed number of days from the date of the contract agreed upon by the parties, at a price set at the time of the contract. The market value of the contract fluctuates with changes in currency exchange rates. The contract is marked-to-market daily and the change in market value is recorded by the Fund as an unrealized gain or loss. As foreign securities are sold, a portion of the contract is generally closed and the Fund records a realized gain or loss equal to the difference between the value of the contract at the time it was opened and the value at the time it was closed. Realized gains and losses from contract transactions are included as a component of net realized gains/(losses) from forward foreign currency contracts in the Consolidated Statement of Operations.
AXS Chesapeake Strategy Fund
NOTES TO CONSOLIDATED FINANCIAL STATEMENTS - Continued
September 30, 2023
(e) Short-Term Investments
The Fund may invest a significant amount (68.6% of its net assets as of September 30, 2023) in the Fidelity Investments Money Market Government Portfolio – Class I (“FIGXX”). FIGXX Invests in U.S. Government securities and/or repurchase agreements that are collateralized fully, U.S. Government securities issued by entities that are chartered by Congress but whose securities are neither issued nor guaranteed by the U.S. Treasury and investing in compliance with industry-standard regulatory requirements for money market funds for the quality, maturity, liquidity and diversification of investments. FIGXX may invest at least 80% of its assets in U.S. Treasury securities and repurchase agreements for those securities.
FIGXX file complete Semi-Annual and Annual Reports with the U.S. Securities and Exchange Commission for semi-annual and annual periods of each fiscal year on Form N-CSR. The Forms N-CSR are available on the website of the U.S. Securities and Exchange Commission at www.sec.gov, and may also be viewed and copied at the Commission’s Public Reference Room in Washington, DC. Information on the operation of the Public Reference Room may be obtained by calling 1-800-SEC-0330. The net expense ratio per the March 31, 2023, Annual report of the FIGXX was 0.18%, respectively.
(f) Short Sales
Short sales are transactions in which the Fund sells a security it does not own in anticipation of a decline in the value of that security. To complete such a transaction, the Fund must borrow the security to make delivery to the buyer. The Fund then is obligated to replace the security borrowed by purchasing the security at market price at the time of replacement. The price at such time may be more or less than the price at which the security was sold by the Fund. When a security is sold short, a decrease in the value of the security will be recognized as a gain and an increase in the value of the security will be recognized as a loss, which is potentially limitless. Until the security is replaced, the Fund is required to pay the lender amounts equal to dividend or interest that accrue during the period of the loan which is recorded as an expense. To borrow the security, the Fund also may be required to pay a premium or an interest fee, which are recorded as interest expense. Cash or securities are segregated for the broker to meet the necessary margin requirements. The Fund is subject to the risk that it may not always be able to close out a short position at a particular time or at an acceptable price.
(g) Options
The Fund may write or purchase options contracts primarily to generate gains from option premiums or to reduce overall portfolio risk. When the Fund writes or purchases an option, an amount equal to the premium received or paid by the Fund is recorded as a liability or an asset and is subsequently adjusted to the current market value of the option written or purchased. Premiums received or paid from writing or purchasing options which expire unexercised are treated by the Fund on the expiration date as realized gains or losses. The difference between the premium and the amount paid or received on effecting a closing purchase or sale transaction, including brokerage commissions, is also treated as a realized gain or loss. If an option is exercised, the premium paid or received is added to the cost of the purchase or proceeds from the sale in determining whether the Fund has realized a gain or a loss on investment transactions. The Fund, as a writer of an option, may have no control over whether the underlying securities may be sold (call) or purchased (put) and as a result bears the market risk of an unfavorable change in the price of the security underlying the written option.
AXS Chesapeake Strategy Fund
NOTES TO CONSOLIDATED FINANCIAL STATEMENTS - Continued
September 30, 2023
(h) Investment Transactions, Investment Income and Expenses
Investment transactions are accounted for on the trade date. Realized gains and losses on investments are determined on the identified cost basis. Dividend income is recorded net of applicable withholding taxes on the ex-dividend date and interest income is recorded on an accrual basis. Withholding taxes on foreign dividends, if applicable, are paid (a portion of which may be reclaimable) or provided for in accordance with the applicable country’s tax rules and rates and are disclosed in the Consolidated Statement of Operations. Withholding tax reclaims are filed in certain countries to recover a portion of the amounts previously withheld. The Fund records a reclaim receivable based on a number of factors, including a jurisdiction’s legal obligation to pay reclaims as well as payment history and market convention. Income and expenses of the Fund are allocated on a pro rata basis to each class of shares in proportion to their relative net assets, except for distribution and service fees which are unique to each class of shares. Expenses incurred by the Trust with respect to more than one fund are allocated in proportion to the net assets of each fund except where allocation of direct expenses to each fund or an alternative allocation method can be more appropriately made.
(i) Federal Income Taxes
The Fund intends to comply with the requirements of Subchapter M of the Internal Revenue Code applicable to regulated investment companies and to distribute substantially all of their net investment income and any net realized gains to their shareholders. Therefore, no provision is made for federal income or excise taxes. Due to the timing of dividend distributions and the differences in accounting for income and realized gains and losses for financial statement and federal income tax purposes, the fiscal year in which amounts are distributed may differ from the year in which the income and realized gains and losses are recorded by the Fund.
Accounting for Uncertainty in Income Taxes (the “Income Tax Statement”) requires an evaluation of tax positions taken (or expected to be taken) in the course of preparing a Fund’s tax returns to determine whether these positions meet a “more-likely-than-not” standard that, based on the technical merits, have a more than fifty percent likelihood of being sustained by a taxing authority upon examination. A tax position that meets the “more-likely-than-not” recognition threshold is measured to determine the amount of benefit to recognize in the financial statements. The Fund recognizes interest and penalties, if any, related to unrecognized tax benefits as income tax expense in the Consolidated Statement of Operations.
The Income Tax Statement requires management of the Fund to analyze tax positions taken in the prior three open tax years, if any, and tax positions expected to be taken in the Fund’s current tax year, as defined by the IRS statute of limitations for all major jurisdictions, including federal tax authorities and certain state tax authorities. As of September 30, 2023, and during the prior three open tax years the Fund did not have a liability for any unrecognized tax benefits. The Fund has no examination in progress and is not aware of any tax positions for which it is reasonably possible that the total amounts of unrecognized tax benefits will significantly change in the next twelve months.
(j) Distributions to Shareholders
Dividends from net investment income, if any, are declared and paid at least annually. Distributable net realized capital gains, if any, are declared and distributed annually. Distributions to shareholders are recorded on the ex-dividend date. The amount and timing of distributions are determined in accordance with federal income tax regulations, which may differ from GAAP.
AXS Chesapeake Strategy Fund
NOTES TO CONSOLIDATED FINANCIAL STATEMENTS - Continued
September 30, 2023
The character of distributions made during the year from net investment income or net realized gains may differ from the characterization for federal income tax purposes due to differences in the recognition of income, expense and gain (loss) items for financial statement and tax purposes.
(k) Illiquid Securities
Pursuant to Rule 22e-4 under the 1940 Act, the Fund has adopted a Liquidity Risk Management Program (“LRMP”) that requires, among other things, that the Fund limits its illiquid investments that are assets to no more than 15% of net assets. An illiquid investment is any security which may not reasonably be expected to be sold or disposed of in current market conditions in seven calendar days or less without the sale or disposition significantly changing the market value of the investment. If the Advisor, at any time determines that the value of illiquid securities held by the Fund exceeds 15% of its net asset value, the Advisor will take such steps as it considers appropriate to reduce them as soon as reasonably practicable in accordance with the Fund’s written LRMP.
Note 3 – Investment Advisory and Other Agreements
The Trust, on behalf of the Fund, entered into an Investment Advisory Agreement (the “Agreement”) with AXS Investments LLC (the “Advisor”). Under the terms of the Agreement, the Fund pays twice a month investment advisory fee to the Advisor at the annual rate of 1.45% of the Fund’s average daily net assets. The Advisor has engaged Chesapeake Capital Corporation (“Chesapeake”), a Sub-Advisor, to manage the Chesapeake Strategy Fund’s overall investment program, and pays Chesapeake from its advisory fees.
The Advisor has contractually agreed to waive its fee and, if necessary, to absorb other operating expenses of the Fund to ensure that total annual operating expenses (excluding any taxes, leverage interest, brokerage commissions, dividend and interest expenses on short sales, acquired fund fees and expenses (as determined in accordance with Form N-1A), professional fees related to services for the collection of foreign tax reclaims, expenses incurred in connection with any merger or reorganization, and extraordinary expenses such as litigation expenses) do not exceed 2.10%, 2.85% and 1.85% of the average daily net assets of the Fund’s Class A shares, Class C shares and Class I shares, respectively, until July 22, 2024, and the agreement may be terminated before that date only by the Trust’s Board of Trustees.
The investment management fees include a management fee paid to the advisor by the Fund’s subsidiary at the annual rate of 1.45% of the subsidiary’s average daily net assets. The advisor has contractually agreed, for so long as the Fund invests in the subsidiary, to waive a portion of the management fee it receives from the Fund in an amount equal to the management fee paid to the advisor by the subsidiary, with no right to recoupment. This undertaking may not be terminated by the advisor as long as the investment advisory agreement between the subsidiary and the Advisor is in place unless the Advisor obtains the prior approval of the Trust’s Board of Trustees.
For the year ended September 30, 2023, the Advisor waived a portion of its advisory fees totaling $252,712. The Advisor is permitted to seek reimbursement from the Fund, subject to certain limitations, of fees waived or payments made to the Fund for a period ending three full fiscal years after the date of the waiver or payment. This reimbursement may be requested from the Fund if the reimbursement will not cause the Fund’s annual expense ratio to exceed the lesser of (a) the expense limitation in effect at the time such fees were waived or payments made, or (b) the expense limitation in effect at the time of the reimbursement. At September 30, 2023, the amount of these potentially recoverable expenses was $641,963. The potential recoverable amount is noted as "Commitments and contingencies" as reported on the Consolidated Statement of Assets and Liabilities. The Advisor may recapture all or a portion of this amount no later than September 30, of the year stated below:
AXS Chesapeake Strategy Fund
NOTES TO CONSOLIDATED FINANCIAL STATEMENTS - Continued
September 30, 2023
| 2024 | | $ | 217,024 | |
| 2025 | | | 172,227 | |
| 2026 | | | 252,712 | |
| Total | | $ | 641,963 | |
UMB Fund Services, Inc. (“UMBFS”) serves as the Fund’s fund accountant, transfer agent and co-administrator; and Mutual Fund Administration, LLC (“MFAC”) serves as the Fund’s other co-administrator. UMB Bank, n.a., an affiliate of UMBFS, serves as the Fund’s custodian.
The Fund’s allocated fees incurred for fund accounting, fund administration, transfer agency and custody services for the year ended September 30, 2023, are reported on the Consolidated Statement of Operations.
ALPS Distributors, Inc. serves as the Fund’s Distributor (the “Distributor”). Prior to January 1, 2023, IMST Distributors, LLC, a wholly owned subsidiary of Foreside Financial Group, LLC (d/b/a ACA Group), served as the Fund’s Distributor. The Distributor does not receive compensation from the Fund for its distribution services; the Advisor pays the Distributor a fee for its distribution-related services.
Certain trustees and officers of the Trust are employees of UMBFS or MFAC. The Fund does not compensate trustees and officers affiliated with the Fund’s co-administrators. For the year ended September 30, 2023, the Fund’s allocated fees incurred to Trustees who are not affiliated with the Fund’s co-administrators are reported on the Consolidated Statement of Operations.
The Fund’s Board of Trustees has adopted a Deferred Compensation Plan (the “Plan”) for the Independent Trustees that enables Trustees to elect to receive payment in cash or the option to select various fund(s) in the Trust in which their deferred accounts shall be deemed to be invested. If a trustee elects to defer payment, the Plan provides for the creation of a deferred payment account. The Fund’s liability for these amounts is adjusted for market value changes in the invested fund(s) and remains a liability to the Fund until distributed in accordance with the Plan. The Trustees Deferred compensation liability under the Plan constitutes a general unsecured obligation of the Fund and is disclosed in the Consolidated Statement of Assets and Liabilities. Contributions made under the plan and the change in unrealized appreciation/depreciation and income are included in the Trustees’ fees and expenses in the Consolidated Statement of Operations.
Dziura Compliance Consulting, LLC provides Chief Compliance Officer (“CCO”) services to the Trust. The Fund’s allocated fees incurred for CCO services for the year ended September 30, 2023, are reported on the Consolidated Statement of Operations.
Note 4 – Federal Income Taxes
At September 30, 2023, the cost of securities on a tax basis and gross unrealized appreciation and (depreciation) on investments for federal income tax purposes were as follows:
| Cost of investments | | $ | 48,964,293 | |
| | | | | |
| Gross unrealized appreciation | | $ | - | |
| Gross unrealized depreciation | | | - | |
| | | | | |
| Net unrealized appreciation/(depreciation) | | $ | - | |
AXS Chesapeake Strategy Fund
NOTES TO CONSOLIDATED FINANCIAL STATEMENTS - Continued
September 30, 2023
The difference between cost amounts for financial statement and federal income tax purposes is due primarily to timing differences in recognizing certain gains and losses in security transactions.
U.S. GAAP requires that certain components of net assets be reclassified between financial and tax reporting. These reclassifications have no effect on net assets or net asset value per share. For the year ended September 30, 2023, permanent differences in book and tax accounting have been reclassified to paid-in capital and total distributable earnings/(deficit) as follows:
| Increase (Decrease) | |
| Paid in Capital | | | Total Distributable Earnings | |
| $ | - | | | $ | - | |
As of September 30, 2023, the components of accumulated earnings/(deficit) on a tax basis were as follows:
| Undistributed ordinary income | | $ | 610,571 | |
| Undistributed long-term capital gains | | | - | |
| Tax accumulated earnings | | | 610,571 | |
| | | | | |
| Accumulated capital and other losses | | | (19,903,687 | ) |
| Unrealized Appreciation/(Depreciation) | | | - | |
| Unrealized Appreciation/(Depreciation) - futures contracts | | | (138,779 | ) |
| Unrealized Appreciation/(Depreciation) - forward foreign currency exchange contracts | | | - | |
| Unrealized Appreciation/(Depreciation) - foreign currency translations | | | 104 | |
| Unrealized deferred compensation | | | (24,554 | ) |
| Total accumulated earnings/(deficit) | | $ | (19,456,345 | ) |
The tax character of the distributions paid during the fiscal years ended September 30, 2023 and September 30, 2022, were as follows:
| Distributions paid from: | | 2023 | | | 2022 | |
| Ordinary income | | $ | 839,695 | | | $ | 3,152,394 | |
| Net long-term capital gains | | | - | | | | - | |
| Total distributions paid | | $ | 839,695 | | | $ | 3,152,394 | |
At September 30, 2023, the Fund had an accumulated net capital loss carry forward as follows:
| Short-term | | $ | 10,513,437 | |
| Long-term | | | 1,081,599 | |
| Total | | $ | 11,595,036 | |
AXS Chesapeake Strategy Fund
NOTES TO CONSOLIDATED FINANCIAL STATEMENTS - Continued
September 30, 2023
During the fiscal year ended September 30, 2023, the Chesapeake Strategy Fund utilized non-expiring capital loss carry overs totaling $0 respectively.
Note 5 – Investment Transactions
For the year ended September 30, 2023, the Fund’s purchases and sales of investments, excluding short-term investments and futures contracts, were $0 and $0, respectively.
Note 6 – Distribution Plan
The Trust on behalf the Fund, has adopted a Distribution Plan (the “Plan”) pursuant to Rule 12b-1 under the 1940 Act that allows the Fund to pay distribution fees for the sale and distribution of its shares. With respect to, Class A shares and Class C shares, the Plan provides for the payment of distribution fees at the annual rate of up to 0.25% and 1.00%, respectively, of average daily net assets. Class I Shares are not subject to any distribution or service fees under the Plan.
For the year ended September 30, 2023, distribution fees incurred are disclosed on the Consolidated Statement of Operations.
Note 7 – Indemnifications
In the normal course of business, the Fund enters into contracts that contain a variety of representations, which provide general indemnifications. The Fund’s maximum exposure under these arrangements is unknown, as this would involve future claims that may be made against the Fund that have not yet occurred. However, the Fund expects the risk of loss to be remote.
Note 8 – Fair Value Measurements and Disclosure
Fair Value Measurements and Disclosures defines fair value, establishes a framework for measuring fair value in accordance with GAAP, and expands disclosure about fair value measurements. It also provides guidance on determining when there has been a significant decrease in the volume and level of activity for an asset or a liability, when a transaction is not orderly, and how that information must be incorporated into a fair value measurement.
Under Fair Value Measurements and Disclosures, various inputs are used in determining the value of the Fund’s investments. These inputs are summarized into three broad Levels as described below:
| · | Level 1 – Unadjusted quoted prices in active markets for identical assets or liabilities that the Fund has the ability to access. |
| · | Level 2 – Observable inputs other than quoted prices included in level 1 that are observable for the asset or liability, either directly or indirectly. These inputs may include quoted prices for the identical instrument on an inactive market, prices for similar instruments, interest rates, prepayment speeds, credit risk, yield curves, default rates and similar data. |
| · | Level 3 – Unobservable inputs for the asset or liability, to the extent relevant observable inputs are not available; representing the Fund’s own assumptions about the assumptions a market participant would use in valuing the asset or liability, and would be based on the best information available. |
The availability of observable inputs can vary from security to security and is affected by a wide variety of factors, including, for example, the type of security, whether the security is new and not yet established in the marketplace, the liquidity of markets, and other characteristics particular to the security. To the extent that valuation is based on models or inputs that are less observable or unobservable in the market, the determination of fair value requires more judgment. Accordingly, the degree of judgment exercised in determining fair value is greatest for instruments categorized in Level 3.
AXS Chesapeake Strategy Fund
NOTES TO CONSOLIDATED FINANCIAL STATEMENTS - Continued
September 30, 2023
The inputs used to measure fair value may fall into different Levels of the fair value hierarchy. In such cases, for disclosure purposes, the Level in the fair value hierarchy within which the fair value measurement falls in its entirety, is determined based on the lowest Level input that is significant to the fair value measurement in its entirety.
The inputs or methodology used for valuing securities are not an indication of the risk associated with investing in those securities. The following is a summary of the inputs used, as of September 30, 2023, in valuing the Fund’s assets and liabilities carried at fair value:
| Chesapeake Strategy Fund | | Level 1 | | | Level 2* | | | Level 3* | | | Total | |
| Assets | | | | | | | | | | | | | | | | |
| Investments | | | | | | | | | | | | | | | | |
| Short-Term Investments | | $ | 48,964,293 | | | $ | - | | | $ | - | | | $ | 48,964,293 | |
| Total Assets | | $ | 48,964,293 | | | $ | - | | | $ | - | | | $ | 48,964,293 | |
| | | | | | | | | | | | | |
| Liabilities | | | | | | | | | | | | |
| Other Financial Instruments** | | | | | | | | | | | | | | | | |
| Futures Contracts | | $ | 8,818 | | | $ | - | | | $ | - | | | $ | 8,818 | |
| Total Liabilities | | $ | 8,818 | | | $ | - | | | $ | - | | | $ | 8,818 | |
| * | The Fund did not hold any Level 2 or 3 securities at period end. |
| ** | Other financial instruments are derivative instruments such as futures contracts and forward foreign currency contracts. Futures contracts, forward foreign currency contracts are valued at the unrealized appreciation/(depreciation) on the instrument. |
Note 9 – Derivatives and Hedging Disclosures
Derivatives and Hedging requires enhanced disclosures about the Fund’s derivative and hedging activities, including how such activities are accounted for and their effects on the Fund’s financial position and performance. The Fund invested in futures contracts during the year ended September 30, 2023.
AXS Chesapeake Strategy Fund
NOTES TO CONSOLIDATED FINANCIAL STATEMENTS - Continued
September 30, 2023
The effects of these derivative instruments on the Fund’s financial position and financial performance as reflected in the Consolidated Statement of Assets and Liabilities and Consolidated Statement of Operations are presented in the tables below. The fair values of derivative instruments, as of September 30, 2023, by risk category are as follows:
| Chesapeake Strategy Fund |
| | | Asset Derivatives | | Liability Derivatives |
| Derivatives not designated as hedging instruments | | Consolidated Statement of Assets
and Liabilities | | Value | | | Consolidated Statement of Assets
and Liabilities | | Value | |
| Commodity contracts | | Unrealized appreciation
on open futures contracts* | | $ | 213,792 | | | Unrealized depreciation on open futures contracts* | | $ | (500,826 | ) |
| Currency contracts | | Unrealized appreciation
on open futures contracts* | | | 115,355 | | | Unrealized depreciation on open futures contracts* | | | (184,455 | ) |
| Index contracts | | Unrealized appreciation
on open futures contracts* | | | 51,976 | | | Unrealized depreciation on open futures contracts* | | | (510,754 | ) |
| Interest rate contracts | | Unrealized appreciation
on open futures contracts* | | | 897,773 | | | Unrealized depreciation on open futures contracts* | | | (91,679 | ) |
| | | Total unrealized appreciation on open futures contracts* | | | 1,278,896 | | | Total unrealized depreciation on open futures contracts* | | | (1,287,714 | ) |
| Net unrealized appreciation/(depreciation) on open futures contracts** | | | | | $ | (8,818 | ) |
| * | Includes cumulative appreciation/(depreciation) on futures contracts as reported on the Consolidated Schedule of Investments. |
| ** | Net unrealized appreciation/(depreciation) on open futures contracts is shown as variation margin on futures contracts on the Consolidated Statement of Assets and Liabilities. |
The effects of derivative instruments on the Consolidated Statement of Operations for the year ended September 30, 2023, are as follows:
| Chesapeake Strategy Fund |
| Amount of Realized Gain or (Loss) on Derivatives Recognized in the Consolidated Statement of Operations |
| Derivatives not designated as hedging instruments | | Futures Contracts | |
| Commodity contracts | | $ | (514,601 | ) |
| Currency contracts | | | (1,035,512 | ) |
| Index contracts | | | (170,597 | ) |
| Interest rate contracts | | | 2,234,425 | |
| Total | | $ | 513,715 | |
AXS Chesapeake Strategy Fund
NOTES TO CONSOLIDATED FINANCIAL STATEMENTS - Continued
September 30, 2023
| Chesapeake Strategy Fund |
| Change in Unrealized Appreciation/Depreciation on Derivatives Recognized in the Consolidated Statement of Operations |
| Derivatives not designated as hedging instruments | | Futures Contracts | |
| Commodity contracts | | $ | (361,062 | ) |
| Currency contracts | | | (990,530 | ) |
| Index contracts | | | (659,119 | ) |
| Interest rate contracts | | | (913,011 | ) |
| Total | | $ | (2,923,722 | ) |
The average quarterly volume of derivative instruments held by the Fund during the year ended September 30, 2023, are as follows:
| Chesapeake Strategy Fund |
| | | | | Long Futures Contracts* | | | Short Futures Contracts* | |
| Commodity contracts | | Notional Value | | $ | 7,791,257 | | | $ | 15,972,708 | |
| Currency contracts | | Notional Value | | | 28,208,804 | | | | 17,767,268 | |
| Index contracts | | Notional Value | | | 178,225,817 | | | | 2,438,427 | |
| Interest rate contracts | | Notional Value | | | - | | | | 45,762,915 | |
Note 10 - Disclosures about Offsetting Assets and Liabilities
Disclosures about Offsetting Assets and Liabilities requires an entity to disclose information about offsetting and related arrangements to enable users of its financial statements to understand the effect of those arrangements on its financial position. The guidance requires retrospective application for all comparative periods presented.
A Fund mitigates credit risk with respect to OTC derivative counterparties through credit support annexes included with International Swaps and Derivative Association (“ISDA”) Master Agreements or other Master Netting Agreements which are the standard contracts governing most derivative transactions between the Fund and each of its counterparties. These agreements allow the Fund and each counterparty to offset certain derivative financial instruments’ payables and/or receivables against each other and/or with collateral, which is generally held by the Fund’s custodian. The amount of collateral moved to/from applicable counterparties is based upon minimum transfer amounts specified in the agreement. To the extent amounts due to the Fund from its counterparties are not fully collateralized contractually or otherwise, the Fund bears the risk of loss from counterparty non-performance.
It is the Fund’s policy to recognize a net asset or liability equal to the unrealized appreciation (depreciation) of futures, forward foreign currency exchange and swap contracts. As of September 30, 2023, the Fund is subject to a master netting arrangement for the futures. The following table shows additional information regarding the offsetting of assets and liabilities, as of September 30, 2023:
AXS Chesapeake Strategy Fund
NOTES TO CONSOLIDATED FINANCIAL STATEMENTS - Continued
September 30, 2023
| Chesapeake Strategy Fund |
| | | | | | | | Amounts Not Offset in Consolidated Statement of Assets and Liabilities | | | | |
| Description | | Counterparty | | Gross Amounts Recognized in the Consolidated Statement of Assets and Liabilities | | | Financial Instruments** | | | Cash Collateral** | | | Net Amount | |
| Unrealized appreciation/(depreciation) on open futures contracts* | | StoneX | | $ | (8,818 | ) | | $ | - | | | $ | 8,818 | | | $ | - | |
| * | Includes cumulative appreciation/depreciation on futures contracts as reported on the Schedule of Investments. Net unrealized appreciation/depreciation is shown as variation margin on futures contracts on the Consolidated Statement of Assets and Liabilities. |
| ** | Amounts relate to master netting agreements and collateral agreements which have been determined by the advisor to be legally enforceable in the event of default but where certain other criteria are not met in accordance with applicable offsetting accounting guidance. The collateral amounts may exceed the related net amounts of financial assets and liabilities presented in the Consolidated Statements of Assets and Liabilities. Where this is the case, the total amount reported is limited to the net amounts of financial assets and liabilities with that counterparty. |
Note 11 – Market Disruption and Geopolitical Risks
Certain local, regional or global events such as war, acts of terrorism, the spread of infectious illnesses and/or other public health issues, financial institution instability or other events may have a significant impact on a security or instrument. These types of events and other like them are collectively referred to as “Market Disruptions and Geopolitical Risks” and they may have adverse impacts on the worldwide economy, as well as the economies of individual countries, the financial health of individual companies and the market in general in significant and unforeseen ways. Some of the impacts noted in recent times include but are not limited to embargos, political actions, supply chain disruptions, bank failures, restrictions to investment and/or monetary movement including the forced selling of securities or the inability to participate impacted markets. The duration of these events could adversely affect the Fund’s performance, the performance of the securities in which the Fund invests and may lead to losses on your investment. The ultimate impact of “Market Disruptions and Geopolitical Risks” on the financial performance of the Fund’s investments is not reasonably estimable at this time. Management is actively monitoring these events.
Note 12 – New Accounting Pronouncements and Regulatory Updates
Effective January 24, 2023, the SEC adopted rule and form amendments to require mutual funds and exchange traded funds (ETFs) to transmit concise and visually engaging streamlined annual and semiannual reports to shareholders that highlight key information deemed important for retail investors to assess and monitor their fund investments. Other information, including financial statements, will no longer appear in the Fund’s streamlined shareholder reports but must be available online, delivered free of charge upon request, and filed on a semiannual basis on Form N-CSR. The rule and form amendments have a compliance date of July 24, 2024. At this time, management is evaluating the impact of these rule and form amendment changes on the content of the current shareholder report and the newly created annual and semiannual streamlined shareholder reports.
AXS Chesapeake Strategy Fund
NOTES TO CONSOLIDATED FINANCIAL STATEMENTS - Continued
September 30, 2023
In October 2020, the SEC adopted new regulations governing the use of derivatives by registered investment companies (“Rule 18f-4”). Rule 18f-4 will impose limits on the amount of derivatives a Fund can enter into, eliminate the asset segregation framework currently used by funds to comply with Section 18 of the 1940 Act, and require funds whose use of derivatives is greater than a limited specified amount to establish and maintain a comprehensive derivatives risk management program and appoint a derivatives risk manager. The Fund has adopted procedures in accordance with Rule 18f-4.
In December 2020, the SEC adopted a new rule providing a framework for fund valuation practices (“Rule 2a-5”). Rule 2a-5 establishes requirements for determining fair value in good faith for purposes of the 1940 Act. Rule 2a-5 will permit fund boards to designate certain parties to perform fair value determinations, subject to board oversight and certain other conditions. Rule 2a-5 also defines when market quotations are “readily available” for purposes of the 1940 Act and the threshold for determining whether a fund must fair value a security. In connection with Rule 2a-5, the SEC also adopted related recordkeeping requirements and is rescinding previously issued guidance, including with respect to the role of a board in determining fair value and the accounting and auditing of fund investments. The Fund has adopted procedures in accordance with Rule 2a-5.
In March 2020, the FASB issued Accounting Standards Update (ASU) No. 2020-04, Reference Rate Reform (Topic 848) – Facilitation of the Effects of Reference Rate Reform on Financial Reporting. The amendments in the ASU provide optional temporary financial reporting relief from the effect of certain types of contract modifications due to the planned discontinuation of the London Interbank Offered Rate and other interbank-offered based reference rates as of the end of 2021. The ASU is effective for certain reference rate-related contract modifications that occur during the period March 12, 2020 through December 31, 2022. In December 2022, the FASB issued ASU No. 2022-06, Reference Rate Reform (Topic 848) - Deferral of the Sunset Date of Topic 848, which extends the period through December 31, 2024. Management has reviewed the requirements and believes the adoption of these ASUs will not have a material impact on the financial statements.
Note 13 – Events Subsequent to the Fiscal Period End
The Fund has adopted financial reporting rules regarding subsequent events which require an entity to recognize in the financial statements the effects of all subsequent events that provide additional evidence about conditions that existed at the date of the balance sheet. Management has evaluated the Fund’s related events and transactions that occurred through the date of issuance of the Fund’s financial statements.
There were no events or transactions that occurred during this period that materially impacted the amounts or disclosures in the Fund’s financial statements.
REPORT OF INDEPENDENT REGISTERED PUBLIC ACCOUNTING FIRM
To the Board of Trustees of Investment Managers Series Trust II and
Shareholders of AXS Funds
Opinion on the Financial Statements
We have audited the accompanying statements of assets and liabilities of AXS Multi-Strategy Alternatives Fund, AXS Sustainable Income Fund, AXS Thomson Reuters Venture Capital Return Tracker Fund, AXS Merger Fund, AXS Alternative Value Fund, AXS Market Neutral Fund, AXS Adaptive Plus Fund, AXS Dynamic Opportunity Fund, AXS Tactical Income Fund, (collectively along with the AXS Chesapeake Strategy Fund, referred to as the “Funds”), each a series of Investment Managers Series Trust II (the “Trust”), including the schedules of investments, as of September 30, 2023, the related statements of operations, the statements of cash flows, the statements of changes in net assets and the financial highlights for each of the periods indicated in the table below, and the related notes (collectively referred to as the “financial statements”).
We have also audited the accompanying consolidated statement of assets and liabilities of the AXS Chesapeake Strategy Fund, a series of Investment Managers Series Trust II, including the consolidated schedule of investments, as of September 30, 2023, the related consolidated statement of operations, the consolidated statements of changes in net assets, and the consolidated financial highlights for each of the periods indicated in the table below, and the related consolidated notes (collectively referred to as the “consolidated financial statements”).
In our opinion, the financial statements and consolidated financial statements present fairly, in all material respects, the financial position of the Funds as of September 30, 2023, the results of their operations, their cash flows, the changes in their net assets, and their financial highlights for each of the periods indicated in the table below, in conformity with accounting principles generally accepted in the United States of America.
| Fund | Statement of Operations | Statement of Cash Flows | Statements of Changes in Net Assets | Financial Highlights |
| AXS Multi-Strategy Alternatives Fund, AXS Sustainable Income Fund, AXS Thomson Reuters Venture Capital Return Tracker Fund | For the year ended September 30, 2023 | N/A | For each of the two years in the period ended September 30, 2023 | For each of the two years in the period ended September 30, 2023 |
| AXS Merger Fund | For the year ended September 30, 2023 | For the year ended September 30, 2023 | For each of the two years in the period ended September 30, 2023 | For each of the two years in the period ended September 30, 2023, for the period January 1, 2021 through September 30, 2021 and for each of the three years in the period ended December 31, 2020 |
| AXS Alternative Value Fund | For the year ended September 30, 2023 | N/A | For each of the two years in the period ended September 30, 2023 | For each of the two years in the period ended September 30, 2023, for the period July 1, 2021 through September 30, 2021, and for the year ended June 30, 2021 |
| AXS Market Neutral Fund | For the year ended September 30, 2023 | For the year ended September 30, 2023 | For each of the two years in the period ended September 30, 2023 | For each of the two years in the period ended September 30, 2023, for the period July 1, 2021 through September 30, 2021 and for the year ended June 30, 2021 |
| AXS Adaptive Plus Fund | For the year ended September 30, 2023 | N/A | For the year ended September 30, 2023 and for the period September 15, 2022 (commencement of operations) through September 30, 2022 | For the year ended September 30, 2023 and for the period September 15, 2022 (commencement of operations) through September 30, 2022 |
| Fund | Statement of Operations | Statement of Cash Flows | Statements of Changes in Net Assets | Financial Highlights |
| AXS Dynamic Opportunities Fund and AXS Tactical Income Fund | For the nine-month period ended September 30, 2023 | N/A | For the nine-month period ended September 30, 2023 | For the nine-month period ended September 30, 2023 |
| Fund | Consolidated Statement of Operations | Statement of Cash Flows | Consolidated Statements of Changes in Net Assets | Consolidated Financial Highlights |
| AXS Chesapeake Strategy Fund | For the year ended September 30, 2023 | N/A | For each of the two years in the period ended September 30, 2023 | For each of the two years in the period ended September 30, 2023 |
The Funds’ financial statements and consolidated financial statements, financial highlights and consolidated financial highlights for each of the periods indicated in the table below were audited by other auditors, whose reports dated as indicated in the table below expressed unqualified opinions on those financial statements and consolidated financial statements, financial highlights and consolidated financial highlights.
| Fund | Other Auditors Report Date | Statement of Operations | Statements of Changes in Net Assets | Financial Highlights |
| AXS Multi-Strategy Alternatives Fund | November 29, 2021 | N/A | N/A | For the year ended September 30, 2021, for the period May 1, 2020 through September 30, 2020, and for the two years in the period ended April 30, 2020 |
| AXS Sustainable Income Fund | November 29, 2021 | N/A | N/A | For the period October 17, 2020 (commencement of operations) through September 31, 2021 |
| AXS Thomson Reuters Venture Capital Return Tracker Fund | November 29, 2021 | N/A | N/A | For each of the three years in the period ended September 30, 2021 |
| AXS Alternative Value Fund | August 31, 2020 | N/A | N/A | For each of the two years in the period ended June 30, 2020 |
| AXS Market Neutral Fund | August 31, 2020 | N/A | N/A | For each of the two years in the period ended June 30, 2020 |
| AXS Dynamic Opportunities Fund | March 1, 2023 | For the year ended December 31, 2022 | For each of the two years in the period ended December 31, 2022 | For each of the five years in the period ended December 31, 2022 |
| AXS Tactical Income Fund | March 1, 2023 | For the year ended December 31, 2022 | For each of the two years in the period ended December 31, 2022 | For each of the three years in the period ended December 31, 2022 and for the period January 2, 2019 (commencement of operations) through December 31, 2019 |
| Fund | Other Auditors Report Date | Consolidated Statements of Changes in Net Assets | Consolidated Financial Highlights |
| AXS Chesapeake Strategy Fund | November 29, 2021 | N/A | For each of the three years in the period ended September 30, 2020 |
Basis for Opinion
These financial statements and consolidated financial statements are the responsibility of the Funds’ management. Our responsibility is to express an opinion on the Funds’ financial statements and consolidated financial statements based on our audits. We are a public accounting firm registered with the Public Company Accounting Oversight Board (United States) (“PCAOB”) and are required to be independent with respect to the Funds in accordance with the U.S. federal securities laws and the applicable rules and regulations of the Securities and Exchange Commission and the PCAOB. We have served as the auditor of one or more of the funds in the Trust since 2013.
We conducted our audits in accordance with the standards of the PCAOB. Those standards require that we plan and perform the audits to obtain reasonable assurance about whether the financial statements and consolidated financial statements are free of material misstatement, whether due to error or fraud. The Funds are not required to have, nor were we engaged to perform, an audit of the Funds’ internal control over financial reporting. As part of our audits we are required to obtain an understanding of internal control over financial reporting, but not for the purpose of expressing an opinion on the effectiveness of the Funds’ internal control over financial reporting. Accordingly, we express no such opinion.
Our audits included performing procedures to assess the risks of material misstatement of the financial statements and consolidated financial statements, whether due to error or fraud, and performing procedures that respond to those risks. Such procedures included examining, on a test basis, evidence regarding the amounts and disclosures in the financial statements and consolidated financial statements. Our audits also included evaluating the accounting principles used and significant estimates made by management, as well as evaluating the overall presentation of the financial statements and consolidated financial statements. Our procedures included confirmation of securities owned as of September 30, 2023 by correspondence with the custodian and brokers; when replies were not received from brokers, we performed other auditing procedures. We believe that our audits provide a reasonable basis for our opinion.
| |  |
| | |
| | TAIT, WELLER & BAKER LLP |
Philadelphia, Pennsylvania
November 29, 2023
REPORT OF INDEPENDENT REGISTERED PUBLIC ACCOUNTING FIRM
To the Board of Trustees of
Investment Managers Series Trust II
and the Shareholders of AXS Income Opportunities Fund
Opinion on the Financial Statements
We have audited the accompanying statement of assets and liabilities of AXS Income Opportunities Fund (the “Fund”), a series of Investment Managers Series Trust II, including the schedule of investments, as of September 30, 2023, the related statements of operations and cash flows for the one-month period ended September 30, 2023 and for the year ended August 31, 2023, the statements of changes in net assets for the one-month period ended September 30, 2023 and for each of the two years in the period ended August 31, 2023, financial highlights for the one-month period ended September 30, 2023 and for each of the five years in the period ended August 31, 2023, and the related notes (collectively referred to as the “financial statements”). In our opinion, the financial statements present fairly, in all material respects, the financial position of the Fund as of September 30, 2023, the results of its operations and its cash flows, the changes in its net assets, and the financial highlights for the periods indicated above, in conformity with accounting principles generally accepted in the United States of America.
Basis for Opinion
These financial statements are the responsibility of the Fund’s management. Our responsibility is to express an opinion on the Fund’s financial statements based on our audits. We are a public accounting firm registered with the Public Company Accounting Oversight Board (United States) (“PCAOB”) and are required to be independent with respect to the Fund in accordance with the U.S. federal securities laws and the applicable rules and regulations of the Securities and Exchange Commission and the PCAOB. We have served as the auditor of one or more of the funds in the Trust since 2013.
We conducted our audits in accordance with the standards of the PCAOB. Those standards require that we plan and perform the audit to obtain reasonable assurance about whether the financial statements are free of material misstatement, whether due to error or fraud. The Fund is not required to have, nor were we engaged to perform, an audit of its internal control over financial reporting. As part of our audits we are required to obtain an understanding of internal control over financial reporting, but not for the purpose of expressing an opinion on the effectiveness of the Fund’s internal control over financial reporting. Accordingly, we express no such opinion.
Our audits included performing procedures to assess the risks of material misstatement of the financial statements, whether due to error or fraud, and performing procedures that respond to those risks. Such procedures included examining, on a test basis, evidence regarding the amounts and disclosures in the financial statements. Our audits also included evaluating the accounting principles used and significant estimates made by management, as well as evaluating the overall presentation of the financial statements. Our procedures included confirmation of securities owned as of September 30, 2023 by correspondence with the custodian. We believe that our audits provide a reasonable basis for our opinion.
| |  |
| | |
| | TAIT, WELLER & BAKER LLP |
Philadelphia, Pennsylvania
November 29, 2023
AXS Funds
SUPPLEMENTAL INFORMATION (Unaudited)
Long-Term Capital Gain Designation
For the year ended September 30, 2023, the Alternative Value Fund designates $191,373 as a 20% rate gain distribution for purposes of the dividends paid deduction.
Corporate Dividends Received Deduction
For the year ended September 30, 2023, the Alternative Value Fund, Sustainable Income Fund, and Tactical Income Fund had 100%, 2.66% and 6.90%, respectively, of the dividends to be paid from net investment income, including short-term capital gains from the Fund (if any), are designated as dividends received deduction available to corporate shareholders.
Qualified Dividend Income
For the year ended September 30, 2023, the Alternative Value Fund, Income Opportunities Fund, Sustainable Income Fund and Tactical Income Fund had 100%, 7.45%, 2.66% and 8.09%, respectively, of dividends paid from net investment income, including short-term capital gains from the Fund (if any), designated as qualified dividend income.
Trustees and Officers Information
Additional information about the Trustees is included in the Funds’ Statement of Additional Information which is available, without charge, upon request by calling (833) 297-2587. The Trustees and officers of the Funds and their principal occupations during the past five years are as follows:
| Name, Address, Year of Birth and Position(s) held with Trust | Term of Officec and Length of Time Served | Principal Occupation During the Past Five Years and Other Affiliations | Number of Portfolios in the Fund Complex Overseen by Trusteed | Other Directorships Held by Trusteee |
| Independent Trustees: | | |
Thomas Knipper, CPA a (Born 1957) Trustee | Since September 2013 | Retired (April 2022 – present); Independent Consulting, financial services organizations (March 2021 – March 2022); Vice President and Chief Compliance Officer, Ameritas Investment Partners, a registered investment advisor (1995 – March 2021). | 11 | Monachil Credit Income Fund, a closed-end investment company. |
Kathleen K. Shkuda a
(born 1951) Trustee | Since September 2013 | Zigzag Consulting, a financial services consulting firm (2008 – present); Director, Managed Accounts, Merrill Lynch (2007 – 2008). | 11 | None. |
AXS Funds
SUPPLEMENTAL INFORMATION (Unaudited) – Continued
| Name, Address, Year of Birth and Position(s) held with Trust | Term of Officec and Length of Time Served | Principal Occupation During the Past Five Years and Other Affiliations | Number of Portfolios in the Fund Complex Overseen by Trusteed | Other Directorships Held by Trusteee |
| “Independent” Trustees: |
Larry D. Tashjian a (born 1953) Trustee and Chairman of the Board | Since September 2013 | Principal, CAM Capital Advisors, a family office (2001 – present). | 11 | General Finance Corporation. |
John P. Zader a (born 1961) Trustee | Since September 2013 | Retired (June 2014 – present); CEO, UMB Fund Services, Inc., a mutual fund and hedge fund service provider, and the transfer agent, fund accountant, and coadministrator for the Fund(s) (December 2006 – June 2014); President, Investment Managers Series Trust (December 2007 – June 2014). | 11 | FPA Funds Trust (includes 2 portfolios), Bragg Capital Trust (includes 2 portfolios), FPA New Income, Inc. and FPA U.S. Core Equity Fund, Inc., each a registered investment company; Source Capital, Inc., a closed-end investment company. |
| Interested Trustee: | | |
Terrance P. Gallagher a* (born 1958) Trustee and President | Since July 2019 | President, Investment Managers Series Trust II (September 2013 – present); Executive Vice President, UMB Fund Services, Inc. (2007 – present); Director of Compliance, Unified Fund Services Inc. (now Huntington Fund Services), a mutual fund service provider (2004 – 2007). | 11 | Agility Multi- Asset Income Fund, Aspiriant Risk- Managed Real Asset Fund, Aspiriant Risk- Managed Capital Appreciation Fund, AFA Multi- Manager Credit Fund, The Optima Dynamic Alternatives Fund, Infinity Core Alternative Fund, Keystone Private Income Fund, First Trust Alternative Opportunities Fund, Variant Alternative Income Fund, Variant Impact Fund, First Trust Private Assets Fund, First Trust Private Credit Fund, First Trust Real Assets Fund, Destiny Alternative Fund LLC, Destiny Alternative Fund (TEI) LLC, and Pender Real Estate Credit Fund, each a closed-end investment company. |
AXS Funds
SUPPLEMENTAL INFORMATION (Unaudited) – Continued
| Name, Address, Year of Birth and Position(s) held with Trust | Term of Officec and Length of Time Served | Principal Occupation During the Past Five Years and Other Affiliations | Number of Portfolios in the Fund Complex Overseen by Trusteed | Other Directorships Held by Trusteee |
| Interested Trustee: | | | | |
Joy Ausili b† (born 1966) Trustee, Vice President and Assistant Secretary | Since January 2023 | Co-Chief Executive Officer (2016 – present), and Vice President (2006 – 2015), Mutual Fund Administration, LLC; Vice President and Assistant Secretary (January 2016 – present), Investment Managers Series Trust II; Vice President and Secretary, Investment Managers Series Trust (March 2016 – present); Co-President, Foothill Capital Management, LLC, a registered investment advisor (2018 – 2022). | 11 | None. |
| Officers of the Trust: | | | | |
Rita Dam b
(born 1966)
Treasurer and Assistant Secretary | Since September 2013 | Co-Chief Executive Officer (2016 – present), and Vice President (2006 – 2015), Mutual Fund Administration, LLC; Co-President, Foothill Capital Management, LLC, a registered investment advisor (2018 – 2022). | N/A | N/A |
Diane Drake b
(born 1967) Secretary | Since January 2016 | Senior Counsel, Mutual Fund Administration, LLC (October 2015 – present); Chief Compliance Officer, Foothill Capital Management, LLC, a registered investment advisor (2018 – 2019). | N/A | N/A |
Martin Dziura b
(born 1959) Chief Compliance Officer | Since September 2013 | Principal, Dziura Compliance Consulting, LLC (October 2014 – present); Managing Director, Cipperman Compliance Services (2010 – September 2014); Chief Compliance Officer, Hanlon Investment Management (2009 – 2010); Vice President − Compliance, Morgan Stanley Investment Management (2000 − 2009). | N/A | N/A |
| a | Address for certain Trustees and certain officers: 235 West Galena Street, Milwaukee, Wisconsin 53212. |
| b | Address for Ms. Ausili, Ms. Dam and Ms. Drake: 2220 E. Route 66, Suite 226, Glendora, California 91740. Address for Mr. Dziura: 309 Woodridge Lane, Media, Pennsylvania 19063. |
| c | Trustees and officers serve until their successors have been duly elected. |
| d | The Trust is comprised of 48 series managed by unaffiliated investment advisors. The term “Fund Complex” applies only to the Funds managed by the same investment advisor. The Fund’s investment advisor also serves as the investment advisor to the AXS 1.25X NVDA Bear Daily ETF, AXS 2X Innovation ETF, AXS Astoria Inflation Sensitive ETF, AXS Brendan Wood TopGun Index ETF, AXS Cannabis ETF, AXS Change Finance ESG ETF, AXS Esoterica NextG Economy ETF, AXS First Priority CLO Bond ETF, AXS TSLA Bear Daily ETF, AXS Real Estate Income ETF, AXS Short Innovation Daily ETF and AXS Green Alpha ETF, which are offered in separate prospectus. The Funds do not hold themselves out as related to any other series within the Trust, for purposes of investment and investor services. |
AXS Funds
SUPPLEMENTAL INFORMATION (Unaudited) – Continued
| e | “Other Directorships Held” includes only directorship of companies required to register or file reports with the SEC under the Securities Exchange Act of 1934, as amended (that is, “public companies”) or other investment companies registered under the 1940 Act. |
| † | Ms. Ausili is an “interested person” of the Trust by virtue of her position with Mutual Fund Administration, LLC. |
| * | Mr. Gallagher is an “interested person” of the Trust by virtue of his position with UMB Fund Services, Inc. |
AXS Funds
EXPENSE EXAMPLES
For the Periods Ended September 30, 2023 (Unaudited)
Expense Examples
As a shareholder of the Funds, you incur two types of costs: (1) transaction costs; and (2) ongoing costs, including management fees; distribution and/or 12b-1 fees (Class A, Class C, Class D and Investor Class shares only) and other Fund expenses. The examples below are intended to help you understand your ongoing costs (in dollars) of investing in the Funds and to compare these costs with the ongoing costs of investing in other mutual funds.
The Multi-Strategy Alternatives Fund, Sustainable Income Fund, Thomson Reuters Venture Capital Return Tracker Fund, Merger Fund, Alternative Value Fund, Market Neutral Fund, Adaptive Plus Fund, Dynamic Opportunity Fund and Tactical Income Fund examples are based on an investment of $1,000 invested at the beginning of the period and held for the entire period from April 1, 2023 to September 30, 2023.
The Income Opportunities Fund’s Actual Performance example is based on an investment of $1,000 invested at the beginning of the period and held for the entire period from September 1, 2023 to September 30, 2023.The Income Opportunities Fund’s Hypothetical Performance is based on an investment of $1,000 invested at the beginning of the period and held for the entire period from April 1, 2023 to September 30, 2023.
Actual Expenses
The information in the row titled “Actual Performance” of the table below provides actual account values and actual expenses. You may use the information in these columns, together with the amount you invested, to estimate the expenses that you paid over the period. Simply divide your account value by $1,000 (for example, an $8,600 account value divided by $1,000 = 8.6), then multiply the result by the number in the appropriate row for your share class, under the column titled “Expenses Paid During Period” to estimate the expenses you paid on your account during this period.
Hypothetical Example for Comparison Purposes
The information in the row titled “Hypothetical (5% annual return before expenses)” of the table below provides hypothetical account values and hypothetical expenses based on the Fund’s actual expense ratios and an assumed rate of return of 5% per year before expenses, which is not the Fund’s actual return. The hypothetical account values and expenses may not be used to estimate the actual ending account balance or expenses you paid for the period. You may use this information to compare the ongoing costs of investing in the Fund and other funds. To do so, compare these 5% hypothetical examples with the 5% hypothetical examples that appear in the shareholder reports of the other funds.
Please note that the expenses shown in the table are meant to highlight your ongoing costs only and do not reflect any transaction costs, such as sales charges (load) or contingent deferred sales charges. Therefore, the information in the row titled “Hypothetical (5% annual return before expenses)” is useful in comparing ongoing costs only and will not help you determine the relative total costs of owning different funds. In addition, if these transactional costs were included, your costs would have been higher.
AXS Funds
EXPENSE EXAMPLES - Continued
For the Periods Ended September 30, 2023 (Unaudited)
| Multi-Strategy Alternatives Fund | Beginning Account Value | Ending Account Value | Expenses Paid During Period* |
| | | 4/1/23 | 9/30/23 | 4/1/23 – 9/30/23 |
| Investor Class | Actual Performance | $1,000.00 | $1,003.00 | $8.44 |
| | Hypothetical (5% annual return before expenses) | 1,000.00 | 1,016.64 | 8.50 |
| Class I | Actual Performance | 1,000.00 | 1,004.00 | 7.59 |
| | Hypothetical (5% annual return before expenses) | 1,000.00 | 1,017.49 | 7.64 |
* Expenses are equal to the Fund’s annualized expense ratios of 1.68% and 1.51% for Investor Class shares and Class I shares, respectively, multiplied by the average account values over the period, multiplied by 183/365 (to reflect the six-month period). The expense ratios reflect an expense waiver. Assumes all dividends and distributions were reinvested.
| Sustainable Income Fund | Beginning Account Value | Ending Account Value | Expenses Paid During Period* |
| | | 4/1/23 | 9/30/23 | 4/1/23 – 9/30/23 |
| Class I | Actual Performance | $1,000.00 | $992.50 | $4.94 |
| | Hypothetical (5% annual return before expenses) | 1,000.00 | 1,020.10 | 5.01 |
* Expenses are equal to the Fund’s annualized expense ratio of 0.99% for Class I shares, multiplied by the average account values over the period, multiplied by 183/365 (to reflect the six-month period). The expense ratios reflect an expense waiver. Assumes all dividends and distributions were reinvested.
| Thomson Reuters Venture Capital Return Tracker Fund | Beginning Account Value | Ending Account Value | Expenses Paid During Period* |
| | | 4/1/23 | 9/30/23 | 4/1/23 – 9/30/23 |
| Class A | Actual Performance | $1,000.00 | $1,120.00 | $9.30 |
| | Hypothetical (5% annual return before expenses) | 1,000.00 | 1,016.30 | 8.84 |
| Class C | Actual Performance | 1,000.00 | 1,115.60 | 13.26 |
| | Hypothetical (5% annual return before expenses) | 1,000.00 | 1,012.54 | 12.61 |
| Class I | Actual Performance | 1,000.00 | 1,120.00 | 7.97 |
| | Hypothetical (5% annual return before expenses) | 1,000.00 | 1,017.55 | 7.59 |
* Expenses are equal to the Fund’s annualized expense ratios of 1.75%, 2.50% and 1.50% for Class A shares, Class C shares and Class I shares, respectively, multiplied by the average account values over the period, multiplied by 183/365 (to reflect the six-month period). The expense ratio reflects an expense waiver. Assumes all dividends and distributions were reinvested.
AXS Funds
EXPENSE EXAMPLES - Continued
For the Periods Ended September 30, 2023 (Unaudited)
Merger Fund | Beginning Account Value | Ending Account Value | Expenses Paid During Period* |
| | | 4/1/23 | 9/30/23 | 4/1/23 – 9/30/23 |
| Investor Class | Actual Performance | $1,000.00 | $1,035.80 | $10.33 |
| | Hypothetical (5% annual return before expenses) | 1,000.00 | 1,014.92 | 10.22 |
| Class I | Actual Performance | 1,000.00 | 1,036.50 | 9.05 |
| | Hypothetical (5% annual return before expenses) | 1,000.00 | 1,016.18 | 8.96 |
* Expenses are equal to the Fund’s annualized expense ratios of 2.02% and 1.77% for Investor Class shares and Class I shares, respectively, multiplied by the average account values over the period, multiplied by 183/365 (to reflect the six-month period). The expense ratios reflect an expense waiver. Assumes all dividends and distributions were reinvested.
| Alternative Value Fund | Beginning Account Value | Ending Account Value | Expenses Paid During Period* |
| | | 4/1/23 | 9/30/23 | 4/1/23 – 9/30/23 |
| Investor Class | Actual Performance | $1,000.00 | $965.80 | $14.10 |
| | Hypothetical (5% annual return before expenses) | 1,000.00 | 1,010.72 | 14.43 |
| Class I | Actual Performance | 1,000.00 | 965.70 | 13.10 |
| | Hypothetical (5% annual return before expenses) | 1,000.00 | 1,011.74 | 13.41 |
* Expenses are equal to the Fund’s annualized expense ratio of 2.86% and 2.66% for Investor Class shares and Class I shares, respectively, multiplied by the average account value over the period, multiplied by 183/365 (to reflect the six-month period). The expense ratios reflect an expense waiver. Assumes all dividends and distributions were reinvested.
| Market Neutral Fund | Beginning Account Value | Ending Account Value | Expenses Paid During Period* |
| | | 4/1/23 | 9/30/23 | 4/1/23 – 9/30/23 |
| Investor Class | Actual Performance | $1,000.00 | $1,031.90 | $20.44 |
| | Hypothetical (5% annual return before expenses) | 1,000.00 | 1,004.95 | 20.17 |
| Class I | Actual Performance | 1,000.00 | 1,032.70 | 19.15 |
| | Hypothetical (5% annual return before expenses) | 1,000.00 | 1,006.02 | 18.90 |
* Expenses are equal to the Fund’s annualized expense ratio of 4.01% and 3.76% for Investor Class shares and Class I shares, respectively, multiplied by the average account value over the period, multiplied by 183/365 (to reflect the six-month period). The expense ratios reflect an expense waiver. Assumes all dividends and distributions were reinvested.
AXS Funds
EXPENSE EXAMPLES - Continued
For the Periods Ended September 30, 2023 (Unaudited)
| Adaptive Plus Fund | Beginning Account Value | Ending Account Value | Expenses Paid During Period* |
| | | 4/1/23 | 9/30/23 | 4/1/23 – 9/30/23 |
| Class I | Actual Performance | $1,000.00 | $991.00 | $9.94 |
| | Hypothetical (5% annual return before expenses) | 1,000.00 | 1,015.09 | 10.06 |
* Expenses are equal to the Fund’s annualized expense ratio of 1.99%, multiplied by the average account values over the period, multiplied by 183/365 (to reflect the six month period). The expense ratio reflects an expense waiver. Assumes all dividends and distributions were reinvested.
| Income Opportunities Fund | Beginning Account Value | Ending Account Value | Expenses Paid During Period |
| | | 9/1/23 | 9/30/23 | 9/1/23 – 9/30/23 |
| Class A | Actual Performance* | $1,000.00 | $967.70 | $1.98 |
| Class D | Actual Performance* | 1,000.00 | 966.60 | 2.59 |
| Class I | Actual Performance* | 1,000.00 | 967.70 | 1.78 |
| | | 4/1/23 | 9/30/23 | 4/1/23 – 9/30/23 |
| Class A | Hypothetical (5% annual return before expenses)** | 1,000.00 | 1,012.77 | 12.38 |
| Class D | Hypothetical (5% annual return before expenses)** | 1,000.00 | 1,009.01 | 16.13 |
| Class I | Hypothetical (5% annual return before expenses)** | 1,000.00 | 1,014.02 | 11.13 |
* Expenses are equal to the Fund’s annualized expense ratios of 2.45%, 3.20% and 2.20% for Class A shares, Class D shares and Class I shares, respectively, multiplied by the average account value over the period, multiplied by 30/365. Assumes all dividends and distributions were reinvested. The expense ratios reflect an expense waiver. Assumes all dividends and distributions were reinvested.
** Expenses are equal to the Fund’s annualized expense ratio of 2.45%, 3.20% and 2.20% for Class A shares, Class D shares and Class I shares, respectively, multiplied by the average account value over the period, multiplied by 183/365 (to reflect the six-month period). Assumes all dividends and distributions were reinvested.
Dynamic Opportunity Fund | Beginning Account Value | Ending Account Value | Expenses Paid During Period* |
| | | 4/1/23 | 9/30/23 | 4/1/23 – 9/30/23 |
| Class A | Actual Performance | $1,000.00 | $1,026.40 | $10.57 |
| | Hypothetical (5% annual return before expenses) | 1,000.00 | 1,014.64 | 10.51 |
| Class I | Actual Performance | 1,000.00 | 1,027.70 | 9.31 |
| | Hypothetical (5% annual return before expenses) | 1,000.00 | 1,015.89 | 9.26 |
* Expenses are equal to the Fund’s annualized expense ratios of 2.08% and 1.83% for Class A shares and Class I shares, respectively, multiplied by the average account values over the period, multiplied by 183/365 (to reflect the six-month period). Assumes all dividends and distributions were reinvested.
AXS Funds
EXPENSE EXAMPLES - Continued
For the Periods Ended September 30, 2023 (Unaudited)
| Tactical Income Fund | Beginning Account Value | Ending Account Value | Expenses Paid During Period* |
| | | 4/1/23 | 9/30/23 | 4/1/23 – 9/30/23 |
| Class A | Actual Performance | $1,000.00 | $992.00 | $9.61 |
| | Hypothetical (5% annual return before expenses) | 1,000.00 | 1,015.42 | 9.73 |
| Class I | Actual Performance | 1,000.00 | 993.30 | 8.37 |
| | Hypothetical (5% annual return before expenses) | 1,000.00 | 1,016.67 | 8.47 |
* Expenses are equal to the Fund’s annualized expense ratio of 1.93% and 1.68% for Class A shares and Class I shares, respectively, multiplied by the average account value over the period, multiplied by 183/365 (to reflect the six-month period). Assumes all dividends and distributions were reinvested.
AXS Chesapeake Strategy Fund
EXPENSE EXAMPLE
For the Six Months Ended September 30, 2023 (Unaudited)
Expense Examples
As a shareholder of the Fund, you incur two types of costs: (1) transaction costs, including sales charges (loads) on purchase of Class A shares; and (2) ongoing costs, including management fees; distribution and 12b-1 fees (Class A and Class C shares only) and other Fund expenses. The examples below are intended to help you understand your ongoing costs (in dollars) of investing in the Fund and to compare these costs with the ongoing costs of investing in other mutual funds.
These examples are based on an investment of $1,000 invested at the beginning of the period and held for the entire period from April 1, 2023 to September 30, 2023.
Actual Expenses
The information in the row titled “Actual Performance” of the table below provides actual account values and actual expenses. You may use the information in these columns, together with the amount you invested, to estimate the expenses that you paid over the period. Simply divide your account value by $1,000 (for example, an $8,600 account value divided by $1,000 = 8.6), then multiply the result by the number in the appropriate row for your share class, under the column titled “Expenses Paid During Period” to estimate the expenses you paid on your account during this period.
Hypothetical Example for Comparison Purposes
The information in the row titled “Hypothetical (5% annual return before expenses)” of the table below provides hypothetical account values and hypothetical expenses based on the Fund’s actual expense ratios and an assumed rate of return of 5% per year before expenses, which is not the Fund’s actual return. The hypothetical account values and expenses may not be used to estimate the actual ending account balance or expenses you paid for the period. You may use this information to compare the ongoing costs of investing in the Fund and other funds. To do so, compare these 5% hypothetical examples with the 5% hypothetical examples that appear in the shareholder reports of the other funds.
Please note that the expenses shown in the table are meant to highlight your ongoing costs only and do not reflect any transaction costs, such as sales charges (load) or contingent deferred sales charges. Therefore, the information in the row titled “Hypothetical (5% annual return before expenses)” is useful in comparing ongoing costs only, and will not help you determine the relative total costs of owning different funds. In addition, if these transactional costs were included, your costs would have been higher.
| | Beginning Account Value | Ending Account Value | Expenses Paid During Period* |
| | | 4/1/23 | 9/30/23 | 4/1/23 – 9/30/23 |
| Class A | Actual Performance | $ 1,000.00 | $ 1,049.50 | $ 10.79 |
| | Hypothetical (5% annual return before expenses) | 1,000.00 | 1,014.54 | 10.61 |
| Class C | Actual Performance | 1,000.00 | 1,045.30 | 14.62 |
| | Hypothetical (5% annual return before expenses) | 1,000.00 | 1,010.77 | 14.37 |
| Class I | Actual Performance | 1,000.00 | 1,049.70 | 9.51 |
| | Hypothetical (5% annual return before expenses) | 1,000.00 | 1,015.79 | 9.35 |
* Expenses are equal to the Fund’s annualized expense ratios of 2.10%, 2.85% and 1.85% for Class A shares, Class C shares and Class I shares, respectively, multiplied by the average account values over the period, multiplied by 183/365 (to reflect the six-month period). The expense ratios reflect an expense waiver. Assumes all dividends and distributions were reinvested.
This page is intentionally left blank
AXS Funds
Each a series of Investment Managers Series Trust II
Investment Advisor
AXS Investments LLC
181 Westchester Avenue, Unit 402
Port Chester, New York 10573
Sub-Advisor
Quantitative Value Technologies, LLC dba Cognios Capital
3965 West 83rd Street, Suite 348
Prairie Village, Kansas 66208
Sub-Advisor
Kellner Management, L.P.
900 Third Avenue, Suite 1401
New York, New York 10022
Sub-Advisor
Green Alpha Advisors, LLC
287 Century Circle, Suite 201
Louisville, Colorado 80027
Sub-Advisor
Chesapeake Capital Corporation
100 South Ashley Drive, Suite 1140
Tampa, Florida 33602
Sub-Advisor
Uniplan Investment Counsel, Inc
839 North Jefferson Street, Suite 502
Milwaukee, Wisconsin 53202
Independent Registered Public Accounting Firm
Tait, Weller & Baker LLP
Two Liberty Place
50 South 16th Street, Suite 2900
Philadelphia, Pennsylvania 19102
Custodian
UMB Bank, n.a.
928 Grand Boulevard, 5th Floor
Kansas City, Missouri 64106
Fund Co-Administrator
Mutual Fund Administration, LLC
2220 East Route 66, Suite 226
Glendora, California 91740
Fund Co-Administrator, Transfer Agent and Fund Accountant
UMB Fund Services, Inc.
235 West Galena Street
Milwaukee, Wisconsin 53212
Distributor
ALPS Distributors, Inc.
1290 Broadway, Suite 1000
Denver, Colorado 80203
www.alpsfunds.com
FUND INFORMATION
| | TICKER | CUSIP |
| AXS Multi-Strategy Alternatives Fund – Class I | KCMIX | 46141T 455 |
| AXS Multi-Strategy Alternatives Fund – Investor Class | KCMTX | 46141T 448 |
| AXS Sustainable Income Fund – Class I | AXSKX | 46141T 349 |
| AXS Thomson Reuters Venture Capital Return Tracker Fund – Class A | LDVAX | 46141T 281 |
| AXS Thomson Reuters Venture Capital Return Tracker Fund – Class C | LDVCX | 46141T 273 |
| AXS Thomson Reuters Venture Capital Return Tracker Fund – Class I | LDVIX | 46141T 265 |
| AXS Merger Fund – Investor Class | GAKAX | 46141T 216 |
| AXS Merger Fund – Class I | GAKIX | 46141T 190 |
| AXS Alternative Value Fund – Investor Class | COGLX | 46141T 240 |
| AXS Alternative Value Fund – Class I | COGVX | 46141T 257 |
| AXS Market Neutral Fund – Investor Class | COGMX | 46141T 224 |
| AXS Market Neutral Fund – Class I | COGIX | 46141T 232 |
| AXS Adaptive Plus Fund – Class I | AXSPX | 46144X552 |
| AXS Income Opportunities Fund – Class A | OIOAX | 46144X 602 |
| AXS Income Opportunities Fund – Class D | OIODX | 46144X 701 |
| AXS Income Opportunities Fund – Class I | OIOIX | 46144X 800 |
| AXS Dynamic Opportunity Fund – Class A | ADOAX | 46144X 479 |
| AXS Dynamic Opportunity Fund – Class I | ADOIX | 46144X 461 |
| AXS Tactical Income Fund – Class A | TINAX | 46144X 453 |
| AXS Tactical Income Fund – Class I | TINIX | 46144X 446 |
| AXS Chesapeake Strategy Fund – Class A | ECHAX | 46141T 471 |
| AXS Chesapeake Strategy Fund – Class C | ECHCX | 46141T 463 |
| AXS Chesapeake Strategy Fund – Class I | EQCHX | 46141T 372 |
Privacy Principles of the AXS Funds for Shareholders
The Funds are committed to maintaining the privacy of their shareholders and to safeguarding their non-public personal information. The following information is provided to help you understand what personal information the Funds collect, how we protect that information and why, in certain cases, we may share information with select other parties.
Generally, the Funds do not receive any non-public personal information relating to their shareholders, although certain non-public personal information of their shareholders may become available to the Funds. The Funds do not disclose any non-public personal information about their shareholders or former shareholders to anyone, except as permitted by law or as is necessary in order to service shareholder accounts (for example, to a transfer agent or third party administrator).
This report is sent to shareholders of the AXS Funds for their information. It is not a Prospectus, circular or representation intended for use in the purchase or sale of shares of the Funds or of any securities mentioned in this report.
Proxy Voting
The Funds’ proxy voting policies and procedures, as well as information regarding how the Funds voted proxies for portfolio securities, if applicable, during the most recent 12-month period ended June 30, are available, without charge and upon request by calling (833) 297-2587 or on the SEC’s website at www.sec.gov.
Fund Portfolio Holdings
The Funds file a complete schedule of their portfolio holdings with the SEC for the first and third quarters of each fiscal year on Form N-PORT within 60 days of the end of such fiscal quarter. Shareholders may obtain the Funds’ Form N-PORT on the SEC’s website at www.sec.gov.
Prior to the use of Form N-PORT, the Funds filed their complete schedule of portfolio holdings with the SEC on Form N-Q, which is available online at www.sec.gov.
Householding
The Funds will mail only one copy of shareholder documents, including prospectuses notice of annual and semi-annual reports availability and proxy statements, to shareholders with multiple accounts at the same address. This practice is commonly called “householding” and is intended to reduce expenses and eliminate duplicate mailings of shareholder documents. Mailings of your shareholder documents may be householded indefinitely unless you instruct us otherwise. If you do not want the mailing of these documents to be combined with those for other members of your household, please call the Funds at (833) 297-2587.
AXS Funds
P.O. Box 2175
Milwaukee, WI 53201
Toll Free: (833) 297-2587
Item 1. Report to Stockholders (Continued).
(b) Not applicable.
Item 2. Code of Ethics.
The registrant has adopted a code of ethics that applies to the registrant's principal executive officer and principal financial officer. The registrant has not made any amendments to its code of ethics during the period covered by this report. The registrant has not granted any waivers from any provisions of the code of ethics during the period covered by this report.
The registrant undertakes to provide to any person without charge, upon request, a copy of its code of ethics by mail when they call the registrant at 1-833-297-2587.
Item 3. Audit Committee Financial Expert.
The Board of Trustees of the Registrant has determined that the Registrant has the following “audit committee financial experts” as defined in Item 3(b) of Form N-CSR serving on its Audit Committee: Messrs. Thomas Knipper and John P. Zader. The audit committee financial experts are “independent” as that term is defined in Item 3(a)(2) of Form N-CSR.
Item 4. Principal Accountant Fees and Services.
The registrant has engaged its principal accountant to perform audit services, audit-related services, tax services and other services during the past two fiscal years. "Audit services" refer to performing an audit of the registrant's annual financial statements or services that are normally provided by the accountant in connection with statutory and regulatory filings or engagements for those fiscal years. "Audit-related services" refer to the assurance and related services by the principal accountant that are reasonably related to the performance of the audit. "Tax services" refer to professional services rendered by the principal accountant for tax compliance, tax advice, and tax planning. There were no "other services" provided by the principal accountant. The following table details the aggregate fees billed or expected to be billed for each of the last two fiscal years for audit fees, audit-related fees, tax fees and other fees by the principal accountant.
| AXS Funds | FYE 9/30/2023 | FYE 9/30/2022 |
| Audit Fees | $123,000 | $173,500 |
| Audit-Related Fees | N/A | N/A |
| Tax Fees | $20,000 | $27,500 |
| All Other Fees | N/A | N/A |
| AXS Income Opportunities Fund | FYE 9/30/2023 | FYE 8/31/2023 |
| Audit Fees | $9,500 | $13,500 |
| Audit-Related Fees | N/A | N/A |
| Tax Fees | $2,500 | $2,500 |
| All Other Fees | N/A | N/A |
AXS Dynamic Opportunity Fund AXS Tactical Income Fund | FYE 9/30/2023 | FYE 12/31/2022 |
| Audited Fees | $23,000 | $28,000 |
| Audit-Related Fees | N/A | N/A |
| Tax Fees | $5,000 | $6,000 |
| All Other Fees | N/A | N/A |
The audit committee has adopted pre-approval policies and procedures that require the audit committee to pre-approve all audit and non-audit services of the registrant, including services provided to any entity affiliated with the registrant.
The percentage of fees billed by Tait, Weller, & Weller LLP applicable to non-audit services pursuant to waiver of pre-approval requirement were as follows:
AXS Funds | FYE 9/30/2023 | FYE 9/30/2022 |
| Audit-Related Fees | 0% | 0% |
| Tax Fees | 0% | 0% |
| All Other Fees | 0% | 0% |
AXS Income Opportunities Fund | FYE 9/30/2023 | FYE 8/31/2023 |
| Audit-Related Fees | 0% | 0% |
| Tax Fees | 0% | 0% |
| All Other Fees | 0% | 0% |
AXS Dynamic Opportunity Fund AXS Tactical Income Fund | FYE 9/30/2023 | FYE 12/31/2022* |
| Audit-Related Fees | 0% | 0% |
| Tax Fees | 0% | 0% |
| All Other Fees | 0% | 0% |
| * | The percentage of fees billed by BBD, LLP applicable to non-audit services pursuant to waiver of pre-approval requirement |
All of the principal accountant's hours spent on auditing the registrant's financial statements were attributed to work performed by full-time permanent employees of the principal accountant.
The following table indicates the non-audit fees billed or expected to be billed by the registrant's accountant for services to the registrant and to the registrant's investment advisor (and any other controlling entity, etc.—not sub-advisor) for the last two years. The audit committee of the Board of Trustees has considered whether the provision of non-audit services that were rendered to the registrant's investment advisor is compatible with maintaining the principal accountant's independence and has concluded that the provision of such non-audit services by the accountant has not compromised the accountant's independence.
| AXS Funds | FYE 9/30/2023 | FYE 9/30/2022 |
| Non-Audit Related Fees | N/A | N/A |
| Registrant | N/A | N/A |
| Registrant’s Investment Advisor | N/A | N/A |
| AXS Income Opportunities Fund | FYE 9/30/2023 | FYE 8/31/2023 |
| Non-Audit Related Fees | N/A | N/A |
| Registrant | N/A | N/A |
| Registrant’s Investment Advisor | N/A | N/A |
AXS Dynamic Opportunity Fund AXS Tactical Income Fund | FYE 9/30/2023 | FYE 12/31/2022 |
| Non-Audit Related Fees | N/A | $6,000 |
| Registrant | N/A | N/A |
| Registrant’s Investment Advisor | N/A | N/A |
Item 5. Audit Committee of Listed Registrants.
| (a) | Not applicable to registrants who are not listed issuers (as defined in Rule 10A-3 under the Securities Exchange Act of 1934). |
Item 6. Schedule of Investments.
| (a) | Schedule of Investments is included as part of the report to shareholders filed under Item 1 of this Form. |
(b) Not Applicable.
Item 7. Disclosure of Proxy Voting Policies and Procedures for Closed-End Management Investment Companies.
Not applicable to open-end investment companies.
Item 8. Portfolio Managers of Closed-End Management Investment Companies.
Not applicable to open-end investment companies.
Item 9. Purchases of Equity Securities by Closed-End Management Investment Company and Affiliated Purchasers.
Not applicable.
Item 10. Submission of Matters to a Vote of Security Holders.
The registrant has not made any material changes to the procedures by which shareholders may recommend nominees to the registrant’s Board of Trustees.
Item 11. Controls and Procedures.
| (a) | The Registrant’s President/Chief Executive Officer and Treasurer/Chief Financial Officer have reviewed the Registrant's disclosure controls and procedures (as defined in Rule 30a-3(c) under the Investment Company Act of 1940 (the “Act”)) as of a date within 90 days of the filing of this report, as required by Rule 30a-3(b) under the Act and Rules 13a-15(b) or 15d-15(b) under the Securities Exchange Act of 1934. Based on their review, such officers have concluded that the disclosure controls and procedures are effective in ensuring that information required to be disclosed in this report is appropriately recorded, processed, summarized and reported and made known to them by others within the Registrant and by the Registrant’s service provider. |
| (b) | There were no changes in the Registrant's internal control over financial reporting (as defined in Rule 30a-3(d) under the Act) that occurred during the period covered by this report that has materially affected, or is reasonably likely to materially affect, the Registrant's internal control over financial reporting. |
Item 12. Disclosure of Securities Lending Activities for Closed-End Management Investment Companies.
Not applicable to open-end investment companies.
Item 13. Exhibits.
(2) Certifications pursuant to Section 302 of the Sarbanes-Oxley Act of 2002. Filed herewith.
(3) Any written solicitation to purchase securities under Rule 23c-1 under the Act sent or given during the period covered by the report by or on behalf of the registrant to 10 or more persons. Not applicable to open-end investment companies.
(4) Change in the registrant’s independent public accountant. Filed herewith.
SIGNATURES
Pursuant to the requirements of the Securities Exchange Act of 1934 and the Investment Company Act of 1940, the registrant has duly caused this report to be signed on its behalf by the undersigned, thereunto duly authorized.
| (Registrant) | Investment Managers Series Trust II | |
| | | |
| By (Signature and Title) | /s/ Terrance Gallagher | |
| | Terrance Gallagher, President/Chief Executive Officer | |
| | | |
| Date | 12/8/2023 | |
Pursuant to the requirements of the Securities Exchange Act of 1934 and the Investment Company Act of 1940, this report has been signed below by the following persons on behalf of the registrant and in the capacities and on the dates indicated.
| By (Signature and Title) | /s/ Terrance Gallagher | |
| | Terrance Gallagher, President/Chief Executive Officer | |
| | | |
| Date | 12/8/2023 | |
| | | |
| By (Signature and Title) | /s/ Rita Dam | |
| | Rita Dam, Treasurer/Chief Financial Officer | |
| | | |
| Date | 12/8/2023 | |