UNITED STATES
SECURITIES AND EXCHANGE COMMISSION
Washington, D.C. 20549
FORM N-CSR
CERTIFIED SHAREHOLDER REPORT OF REGISTERED MANAGEMENT INVESTMENT COMPANIES
Investment Company Act file number
INVESTMENT MANAGERS SERIES TRUST II
(Exact name of registrant as specified in charter)
235 W. Galena Street, Milwaukee, WI 53212
(Address of principal executive offices) (Zip code)
Diane J. Drake
2220 E. Route 66, Suite 226
Glendora, CA 91740
(Name and address of agent for service)
Registrant's telephone number, including area code:
Date of reporting period:
Item 1. Report to Stockholders.
(a) The registrant’s annual report transmitted to shareholders pursuant to Rule 30e-1 under the Investment Company Act of 1940, as amended (the “Investment Act”), is as follows:
ACR Opportunity Fund
Class I/ACROX
ANNUAL SHAREHOLDER REPORT | November 30, 2024
This annual shareholder report contains important information about the ACR Opportunity Fund (“Fund”) for the period of December 1, 2023 to November 30, 2024. You can find additional information about the Fund at https://opportunity.acr-investfunds.com/. You can also request this information by contacting us at (855) 955-9552.
This report describes changes to the Fund that occurred during the reporting period.
Fund Expenses
(Based on a hypothetical $10,000 investment)
| Fund (Class) | Costs of a $10,000 investment | Costs paid as a percentage
of a $10,000 investment |
ACR Opportunity Fund
(Class I/ACROX) | $143 | 1.26% |
Management’s Discussion of Fund Performance
The net performance of the Fund’s I Class shares for fiscal year 2024, from November 30, 2023, to November 30, 2024, was 27.72% versus 26.68% for the Fund’s benchmark, the MSCI All Country World (Gross)Index. ACR believes that the Fund’s net return of 27.72% was a satisfactory step towards the Fund’s objective of generating attractive long-term investment returns. Below, we present the fiscal 2024 portfolio activity and highlight the top contributors and detractors.
Fiscal 2024 Portfolio Activity
Fiscal 2024 was an active year with five sales and nine new purchases. We sold four successful long-term investments that had reached our estimate of value: Aercap (an aircraft lease finance business), Burford Capital (a Guernsey-based litigation finance company), Greencore (a UK-based producer and distributor of convenience food), and Sulzer (a Swiss industrial company. We also sold Nerdy (an online education business) at a loss in order to harvest tax losses to offset gains in the period and due to the company’s fundamental underperformance since purchase.
We made new investments in B&M European Value Retail (a UK-based discount retailer), Budweiser Brewing Company APAC (a Chinese and South Korean beer business), Core Scientific (a data center operator), Dollar General (a discount US retailer), JD Sports PLC (a UK based sports apparel retailer), MGM Resorts (a hotel operator), Premium Brands (a Canadian specialty foods business), Talen Energy (owner of a Nuclear power plant), and Winpak Ltd (a packaging business).
TOP Three Contributors
- Jefferies Financial Group
-The company’s share price increased as investment banking activity recovered throughout the period.
- Barclays Plc, a UK-based bank
- Barclay’s share price increased as earnings for the year came in higher than expected, and investors became more comfortable with the sustainability of earnings at current levels.
-Fairfax Financial, a multi-line insurer
- Fairfax’s price increased as insurance premium pricing was stable and Fairfax’s investments performed well
TOP Three Detractors
- Medmix AG, a Swiss industrial company
- Medmix’s end markets did not rebound in fiscal 2024 and the company had to reduce earnings expectations for the year. The company replaced its CEO, and ACR expects higher profitability and better execution over the medium term.
- B&M European Value Retail, a UK-based discount retailer
- The challenging environment of high inflation and strained consumer budgets created an opportunity to invest in B&M, whose long-term prospects remain strong, even as its share price continued to decline after our purchase due to poor market sentiment.
- Budweiser Brewing Company APAC, a Chinese and South Korean beer business
- Despite near-term challenges in China due to a recessionary consumer environment, ACR remains confident that Budweiser APAC is well-positioned to benefit from the growing demand for premium beer as consumer purchasing power increases, driving long-term growth and share price appreciation for the company.
Conclusions
Fiscal 2024 was a successful year with an attractive 27.72% return. We capitalized on market opportunities by divesting four investments that had approached our estimate of value and deploying capital into nine promising undervalued companies.
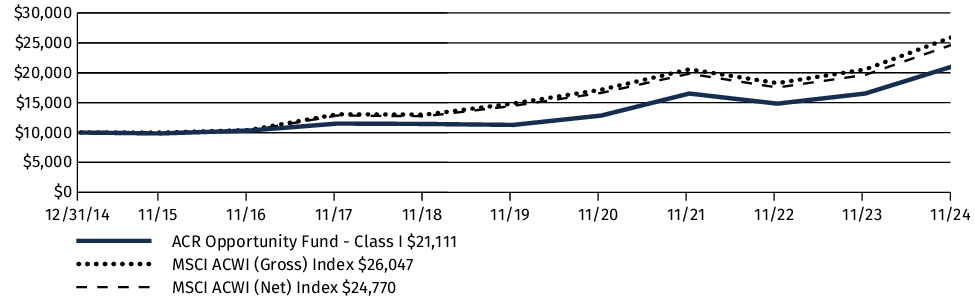
Fund Performance
The following graph and chart compare the initial and subsequent account values at the end of each of the most recently completed 10 fiscal years of the Fund, or for the life of the Fund, if shorter. It assumes a $10,000 initial investment at the beginning of the first fiscal year in an appropriate, broad-based securities market index for the same period.
GROWTH OF $10,000
| AVERAGE ANNUAL TOTAL RETURN | 1 Year | 5 Years | Since
Inception1 |
| ACR Opportunity Fund (Class I/ACROX) | 27.72% | 13.37% | 7.83% |
| MSCI ACWI (Gross) Index | 26.68% | 11.88% | 10.14% |
| MSCI ACWI (Net) Index | 26.12% | 11.36% | 9.58% |
1 | Class I commenced operations on December 31, 2014. |
Keep in mind that the Fund’s past performance is not a good predictor of how the Fund will perform in the future.
The graph and table do not reflect the deduction of taxes that a shareholder would pay on Fund distributions or redemption of Fund shares.
Key Fund Statistics
The following table outlines key fund statistics that you should pay attention to.
| Fund net assets | $77,821,017 |
| Total number of portfolio holdings | 38 |
| Total advisory fees paid (net) | $523,826 |
| Portfolio turnover rate as of the end of the reporting period | 40% |
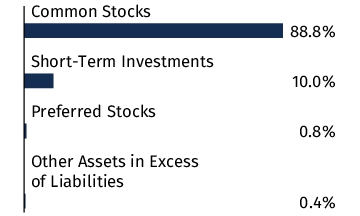
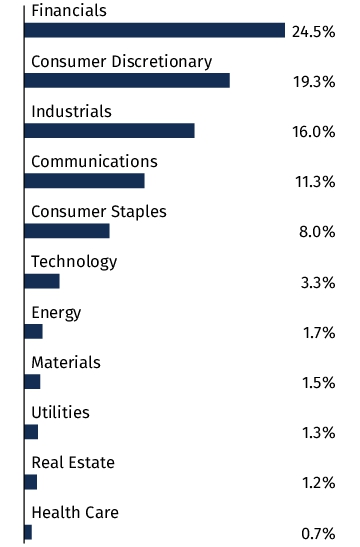
Graphical Representation of Holdings
The tables below show the investment makeup of the Fund, representing percentage of the total net asset of the Fund. The Top Ten Holdings and Sector Allocation exclude short-term holdings, if any. The Sector Allocation chart represents Common Stocks of the Fund.
| Barclays PLC - ADR | 5.9% |
| General Motors Co. | 5.5% |
| Citigroup, Inc. | 4.8% |
| Vodafone Group PLC - ADR | 4.7% |
| Fairfax Financial Holdings Ltd. | 4.5% |
| FedEx Corp. | 3.9% |
| Magna International, Inc. | 3.4% |
| DCC PLC | 3.4% |
| Liberty Global Ltd. - Class A | 3.4% |
| Dell Technologies, Inc. - Class C | 3.3% |
Material Fund Changes
Effective March 31, 2024, the Fund changed its name from ACR Multi-Strategy Quality Return (MQR) Fund to ACR Opportunity Fund.
This is a summary of certain changes since December 1, 2023. For more complete information, you may review the Fund’s prospectus, which is dated March 31, 2024, at https://opportunity.acr-investfunds.com/ or upon request at (855) 955-9552
Changes in and Disagreements with Accountants
There were no changes in or disagreements with accountants during the reporting period.
Availability of Additional Information
You can find additional information about the Fund such as the prospectus, financial information, fund holdings and proxy voting information at https://opportunity.acr-investfunds.com/. You can also request this information by contacting us at (855) 955-9552.
Householding
In order to reduce expenses, we will deliver a single copy of prospectuses, proxies, financial reports and other communication to shareholders with the same residential address, provided they have the same last name, or we reasonably believe them to be members of the same family. Unless we are notified otherwise, we will continue to send recipients only one copy of these materials for as long as they remain a shareholder of the Fund. If you would like to receive individual mailings, please call (855) 955-9552 and we will begin sending you separate copies of these materials within 30 days after receiving your request.
ACR Equity International Fund
Class I/ACREX
ANNUAL SHAREHOLDER REPORT | November 30, 2024
This annual shareholder report contains important information about the ACR Equity International Fund (“Fund”) for the period of December 1, 2023 to November 30, 2024. You can find additional information about the Fund at https://international.acr-investfunds.com/. You can also request this information by contacting us at (855) 955-9552.
This report describes changes to the Fund that occurred during the reporting period.
Fund Expenses
(Based on a hypothetical $10,000 investment)
| Fund (Class) | Costs of a $10,000 investment | Costs paid as a percentage
of a $10,000 investment |
ACR Equity International Fund
(Class I/ACREX) | $119 | 1.11% |
Management’s Discussion of Fund Performance
The net performance of the Fund’s I Class shares for fiscal year 2024, from November 30, 2023, to November 30, 2024, was 13.59% versus 13.03% for the Fund’s benchmark, the MSCI All Country World Ex-U.S. Index. We believe that the Fund’s net return of 13.59% was a satisfactory step towards the Fund’s objective of generating attractive long-term investment returns. Below, we present the fiscal 2024 portfolio activity and highlight the top contributors and detractors.
Fiscal 2024 Portfolio Activity
Fiscal 2024 was an active year with five sales and three new purchases. We sold three very successful long-term investments that had reached our estimate of value: Sulzer (a Swiss industrial company), Protector (a Norwegian insurance company), and Greencore (a UK-based producer and distributor of convenience food). Further, we sold the Fund’s profitable investments in Burford Capital (a Guernsey-based litigation finance company) and Kits Eyecare (a Canadian direct-to-consumer eyecare company) as we revalued their quality lower and decided that the Fund’s capital would be better deployed elsewhere.
We made new investments in Premium Brands (a Canadian specialty food company), Budweiser Brewing Company APAC (a Chinese and South Korean beer business), and B&M European Value Retail (a UK-based discount retailer). The three new purchases are high-quality companies with favorable competitive positions whose share prices reflect near-term headwinds that we expect to be transitory. Due to the five sales and three new investments, the Fund’s cash balance increased from 5.8% at the start of the fiscal year to 12.6% at the end of the year.
Top Three Contributors
- Greencore Plc, a UK-based producer and distributor of convenience food
- The company’s share price increased after it raised its profit guidance for the year.
- Barclays Plc, a UK-based bank
- Barclay’s share price increased as earnings for the year came in higher than expected, and investors became more comfortable with the sustainability of earnings at current levels.
- Eurocell Plc, UK-based manufacturer, recycler, and retailer of plastic window frames
- Eurocell’s share price increased after the company announced a credible plan to significantly increase profits over the medium term.
Top Three Detractors
- Medmix AG, a Swiss industrial company
- Medmix’s end markets did not rebound in fiscal 2024 and the company had to reduce earnings expectations for the year. The company replaced its CEO, and we expect higher profitability and better execution over the medium term.
- OPMobility SE, a French auto parts supplier
- The company’s profit was negatively impacted by lower-than-expected global auto production and a slower-than-expected uptake of battery electric vehicles in Europe and the U.S. The company gained market share, and we expect higher future profits.
- Victoria Plc, a UK-based flooring manufacturer and distributor
- Victoria’s profits were reduced due to the combination of lower demand and higher costs. We believe that higher interest rates are the reason for the near-term lower demand but expect a more normalized demand environment over the next years as flooring requires replacement.
Conclusion
Fiscal 2024 was a successful year with an attractive 13.59% return. We capitalized on market opportunities by divesting five investments that had approached our estimate of value and deploying capital into three promising undervalued companies.
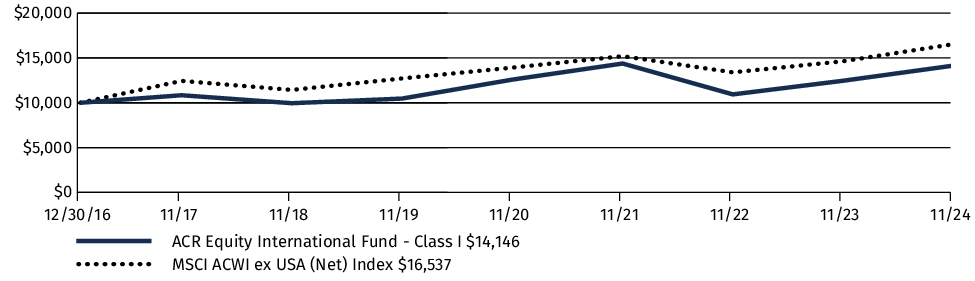
Fund Performance
The following graph and chart compare the initial and subsequent account values at the end of each of the most recently completed 10 fiscal years of the Fund, or for the life of the Fund, if shorter. It assumes a $10,000 initial investment at the beginning of the first fiscal year in an appropriate, broad-based securities market index for the same period.
GROWTH OF $10,000
| AVERAGE ANNUAL TOTAL RETURN | 1 Year | 5 Years | Since
Inception1 |
| ACR Equity International Fund (Class I/ACREX) | 13.59% | 6.21% | 4.48% |
| MSCI ACWI ex USA (Net) Index | 13.03% | 5.40% | 6.56% |
1 | Class I commenced operations on December 30, 2016. |
Keep in mind that the Fund’s past performance is not a good predictor of how the Fund will perform in the future.
The graph and table do not reflect the deduction of taxes that a shareholder would pay on Fund distributions or redemption of Fund shares.
Key Fund Statistics
The following table outlines key fund statistics that you should pay attention to.
| Fund net assets | $99,932,901 |
| Total number of portfolio holdings | 25 |
| Total advisory fees paid (net) | $559,789 |
| Portfolio turnover rate as of the end of the reporting period | 48% |
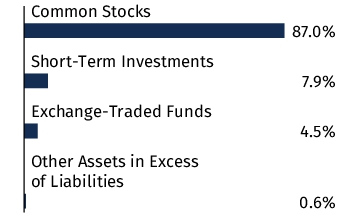
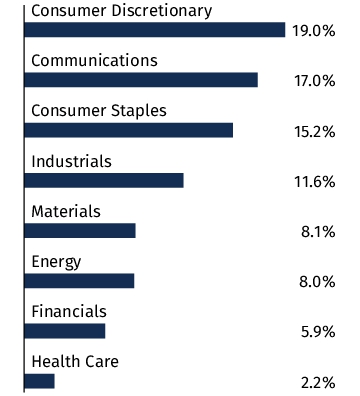
Graphical Representation of Holdings
The tables below show the investment makeup of the Fund, representing percentage of the total net asset of the Fund. The Top Ten Holdings and Sector Allocation exclude short-term holdings, if any. The Sector Allocation chart represents Common Stocks of the Fund.
| Eurocell PLC | 8.1% |
| DCC PLC | 8.0% |
| Vistry Group PLC | 6.0% |
| Vodafone Group PLC - ADR | 6.0% |
| ISS A/S | 5.9% |
| Opmobility | 5.6% |
| JD Sports Fashion PLC | 4.8% |
| Liberty Global Ltd. - Class A | 4.7% |
| Goldman Sachs Access Treasury 0-1 Year ETF | 4.5% |
| B&M European Value Retail S.A. | 4.5% |
Material Fund Changes
Effective March 31, 2024, the Fund changed its name from ACR International Quality Return (IQR) Fund to ACR Equity International Fund. The Fund also changed its principal investment strategy to invest at least 80% of its net assets (including amounts borrowed for investment purposes) in equity securities.
This is a summary of certain changes since December 1, 2023. For more complete information, you may review the Fund’s prospectus, which is dated March 31, 2024, at https://international.acr-investfunds.com/. or upon request at (855)-955-9552
Changes in and Disagreements with Accountants
There were no changes in or disagreements with accountants during the reporting period.
Availability of Additional Information
You can find additional information about the Fund such as the prospectus, financial information, fund holdings and proxy voting information at https://international.acr-investfunds.com/. You can also request this information by contacting us at (855) 955-9552.
Householding
In order to reduce expenses, we will deliver a single copy of prospectuses, proxies, financial reports and other communication to shareholders with the same residential address, provided they have the same last name, or we reasonably believe them to be members of the same family. Unless we are notified otherwise, we will continue to send recipients only one copy of these materials for as long as they remain a shareholder of the Fund. If you would like to receive individual mailings, please call (855) 955-9552 and we will begin sending you separate copies of these materials within 30 days after receiving your request.
(b) Not applicable.
Item 2. Code of Ethics.
The registrant has adopted a code of ethics that applies to the registrant's principal executive officer and principal financial officer. The registrant has not made any amendments to its code of ethics during the period covered by this report. The registrant has not granted any waivers from any provisions of the code of ethics during the period covered by this report.
The registrant undertakes to provide to any person without charge, upon request, a copy of its code of ethics by mail when they call the registrant at 1-855-955-9552
Item 3. Audit Committee Financial Expert.
The Board of Trustees of the Registrant has determined that the Registrant has the following “audit committee financial experts” as defined in Item 3(b) of Form N-CSR serving on its Audit Committee: Messrs. Thomas Knipper and John P. Zader. The audit committee financial experts are “independent” as that term is defined in Item 3(a)(2) of Form N-CSR.
Item 4. Principal Accountant Fees and Services.
The registrant has engaged its principal accountant to perform audit services, audit-related services, tax services and other services during the past two fiscal years. "Audit services" refer to performing an audit of the registrant's annual financial statements or services that are normally provided by the accountant in connection with statutory and regulatory filings or engagements for those fiscal years. "Audit-related services" refer to the assurance and related services by the principal accountant that are reasonably related to the performance of the audit. "Tax services" refer to professional services rendered by the principal accountant for tax compliance, tax advice, and tax planning. There were no "other services" provided by the principal accountant. The following table details the aggregate fees billed or expected to be billed for each of the last two fiscal years for audit fees, audit-related fees, tax fees and other fees by the principal accountant.
| | ACR Opportunity Fund ACR Equity International Fund | FYE 11/30/2024 | FYE 11/30/2023 |
| (a) | Audit Fees | $29,000 | $27,000 |
| (b) | Audit-Related Fees | N/A | N/A |
| (c) | Tax Fees | $,5000 | $5,000 |
| (d) | All Other Fees | N/A | N/A |
(e)(1) The audit committee has adopted pre-approval policies and procedures that require the audit committee to pre-approve all audit and non-audit services of the registrant, including services provided to any entity affiliated with the registrant.
(e)(2) The percentage of fees billed by Tait, Weller, & Weller LLP applicable to non-audit services pursuant to waiver of pre-approval requirement were as follows:
ACR Opportunity Fund ACR Equity International Fund | FYE 11/30/2024 | FYE 11/30/2023 |
| Audit-Related Fees | 0% | 0% |
| Tax Fees | 0% | 0% |
| All Other Fees | 0% | 0% |
| (f) | All of the principal accountant's hours spent on auditing the registrant's financial statements were attributed to work performed by full-time permanent employees of the principal accountant. |
The following table indicates the non-audit fees billed or expected to be billed by the registrant's accountant for services to the registrant and to the registrant's investment advisor (and any other controlling entity, etc.—not sub-advisor) for the last two years. The audit committee of the Board of Trustees has considered whether the provision of non-audit services that were rendered to the registrant's investment advisor is compatible with maintaining the principal accountant's independence and has concluded that the provision of such non-audit services by the accountant has not compromised the accountant's independence.
| | ACR Opportunity Fund ACR Equity International Fund | FYE 11/30/2024 | FYE 11/30/2023 |
| (g) | Registrant Non-Audit Related Fees | N/A | N/A |
| (h) | Registrant’s Investment Advisor | N/A | N/A |
Item 5. Audit Committee of Listed Registrants.
| (a) | Not applicable to registrants who are not listed issuers (as defined in Rule 10A-3 under the Securities Exchange Act of 1934). |
Item 6. Investments.
| (a) | Schedule of Investments is included as part of the report to shareholders filed under Item 7 of this Form. |
Item 7. Financial Statements and Financial Highlights for Open-End Management Investment Companies.

ACR Opportunity Fund
Class I Shares
(Ticker Symbol: ACROX)
ACR Equity International Fund
Class I Shares
(Ticker Symbol: ACREX)
ANNUAL FINANCIALS AND OTHER INFORMATION
NOVEMBER 30, 2024
ACR Opportunity Fund
ACR Equity International Fund
Each a series of Investment Managers Series Trust II
Table of Contents
| Item 7. Financial Statements and Financial Highlights | |
| Schedule of Investments | |
| ACR Opportunity Fund | 1 |
| ACR Equity International Fund | 4 |
| Statements of Assets and Liabilities | 6 |
| Statements of Operations | 7 |
| Statements of Changes in Net Assets | 8 |
| Financial Highlights | 10 |
| Notes to Financial Statements | 12 |
| Report of Independent Registered Public Accounting Firm | 22 |
| Supplemental Information | 23 |
| Item 8. Changes in and Disagreements with Accountants | 24 |
| Item 9. Proxy Disclosures | 24 |
| Item 10. Remuneration Paid to Directors, Officers, and Others | 24 |
| Item 11. Statement Regarding Basis for Approval of Investment Advisory Contact | 24 |
This report and the financial statements contained herein are provided for the general information of the shareholders of the ACR Funds. This report is not authorized for distribution to prospective investors in the Funds unless preceded or accompanied by an effective shareholder report and prospectus.
www.acr-investfunds.com
ACR Opportunity Fund
SCHEDULE OF INVESTMENTS
As of November 30, 2024
Number
of Shares | | | | | Value | |
| | | | | COMMON STOCKS — 88.8% | | | | |
| | | | | COMMUNICATIONS — 11.3% | | | | |
| | 12,000 | | | IAC, Inc.* | | $ | 567,960 | |
| | 184,500 | | | Liberty Global Ltd. - Class A*1 | | | 2,606,985 | |
| | 17,839 | | | Liberty Latin America Ltd. - Class C*1 | | | 123,267 | |
| | 36,900 | | | Sunrise Communications A.G. - Class A - ADR* | | | 1,790,019 | |
| | 411,000 | | | Vodafone Group PLC - ADR2 | | | 3,686,670 | |
| | | | | | | | 8,774,901 | |
| | | | | CONSUMER DISCRETIONARY — 19.3% | | | | |
| | 77,800 | | | General Motors Co.2 | | | 4,324,902 | |
| | 1,000,000 | | | JD Sports Fashion PLC | | | 1,298,384 | |
| | 13,000 | | | Lennar Corp. | | | 2,142,790 | |
| | 58,500 | | | Magna International, Inc.1 | | | 2,640,690 | |
| | 40,000 | | | MGM Resorts International* | | | 1,533,600 | |
| | 116,000 | | | Opmobility | | | 1,069,742 | |
| | 114,110 | | | Victoria PLC* | | | 62,507 | |
| | 230,000 | | | Vistry Group PLC* | | | 1,921,535 | |
| | | | | | | | 14,994,150 | |
| | | | | CONSUMER STAPLES — 8.0% | | | | |
| | 400,000 | | | B&M European Value Retail S.A. | | | 1,766,688 | |
| | 1,600,000 | | | Budweiser Brewing Co. APAC Ltd.3 | | | 1,532,483 | |
| | 20,000 | | | Dollar General Corp. | | | 1,545,400 | |
| | 25,000 | | | Premium Brands Holdings Corp. | | | 1,402,936 | |
| | | | | | | | 6,247,507 | |
| | | | | ENERGY — 1.7% | | | | |
| | 8,000 | | | Chevron Corp. | | | 1,295,440 | |
| | | | | FINANCIALS — 24.5% | | | | |
| | 339,000 | | | Barclays PLC - ADR2 | | | 4,569,720 | |
| | 52,500 | | | Citigroup, Inc.2 | | | 3,720,675 | |
| | 53,000 | | | Core Scientific, Inc.* | | | 947,640 | |
| | 2,500 | | | Fairfax Financial Holdings Ltd.1,2 | | | 3,533,075 | |
| | 30,000 | | | Jefferies Financial Group, Inc.2 | | | 2,374,200 | |
| | 70,000 | | | Power Corp. of Canada | | | 2,357,832 | |
| | 59,952 | | | Protector Forsikring A.S.A. | | | 1,569,253 | |
| | | | | | | | 19,072,395 | |
| | | | | HEALTH CARE — 0.7% | | | | |
| | 53,000 | | | Medmix A.G.3 | | | 517,366 | |
| | | | | INDUSTRIALS — 16.0% | | | | |
| | 29,400 | | | Ashtead Group PLC | | | 2,356,246 | |
| | 36,000 | | | DCC PLC | | | 2,625,320 | |
| | 960,000 | | | Eurocell PLC | | | 2,186,538 | |
ACR Opportunity Fund
SCHEDULE OF INVESTMENTS - Continued
As of November 30, 2024
Number
of Shares | | | | | Value | |
| | | | | COMMON STOCKS (Continued) | | | | |
| | | | | INDUSTRIALS (Continued) | | | | |
| | 10,000 | | | FedEx Corp. | | $ | 3,026,700 | |
| | 125,000 | | | ISS A/S | | | 2,274,179 | |
| | | | | | | | 12,468,983 | |
| | | | | MATERIALS — 1.5% | | | | |
| | 33,000 | | | Winpak Ltd. | | | 1,143,604 | |
| | | | | REAL ESTATE — 1.2% | | | | |
| | 133,898 | | | Five Point Holdings LLC - Class A* | | | 543,626 | |
| | 5,000 | | | Howard Hughes Holdings, Inc.* | | | 433,700 | |
| | | | | | | | 977,326 | |
| | | | | TECHNOLOGY — 3.3% | | | | |
| | 20,000 | | | Dell Technologies, Inc. - Class C | | | 2,551,800 | |
| | | | | UTILITIES — 1.3% | | | | |
| | 4,826 | | | Talen Energy Corp.* | | | 1,034,743 | |
| | | | | TOTAL COMMON STOCKS | | | | |
| | | | | (Cost $54,537,485) | | | 69,078,215 | |
| | | | | PREFERRED STOCKS — 0.8% | | | | |
| | | | | ENERGY — 0.8% | | | | |
| | 3,201 | | | EPI Preferred Holdings, Inc.*4,5,6 | | | 598,555 | |
| | | | | TOTAL PREFERRED STOCKS | | | | |
| | | | | (Cost $185,363) | | | 598,555 | |
Principal
Amount | | | | | | |
| | | | | SHORT-TERM INVESTMENTS — 10.0% | | | | |
| $ | 7,794,548 | | | UMB Bank, Institutional Banking Money Market II Deposit Investment, 4.04%7 | | | 7,794,548 | |
| | | | | TOTAL SHORT-TERM INVESTMENTS | | | | |
| | | | | (Cost $7,794,548) | | | 7,794,548 | |
| | | | | | | | | |
| | | | | TOTAL INVESTMENTS — 99.6% | | | | |
| | | | | (Cost $62,517,396) | | | 77,471,318 | |
| | | | | Other Assets in Excess of Liabilities — 0.4% | | | 349,699 | |
| | | | | TOTAL NET ASSETS — 100.0% | | $ | 77,821,017 | |
ADR – American Depository Receipt
LLC – Limited Liability Company
PLC – Public Limited Company
| * | Non-income producing security. |
| 1 | Foreign security denominated in U.S. Dollars. |
| 2 | All or a portion of this security is segregated as collateral for securities sold short. The market value of the securities pledged as collateral was $11,433,805, which represents 14.7% of total net assets of the Fund. |
ACR Opportunity Fund
SCHEDULE OF INVESTMENTS - Continued
As of November 30, 2024
| 3 | Security exempt from registration under Rule 144A of the Securities Act of 1933. These securities are restricted and may be resold in transactions exempt from registration normally to qualified institutional buyers. The total value of these securities is $2,049,849 which represents 2.6% of total net assets of the Fund. |
| 4 | The value of these securities was determined using significant unobservable inputs. These are reported as Level 3 securities in the Fair Value Hierarchy. |
| 5 | Post-reorganization assets. |
| 6 | Security in a privately owned company. |
| 7 | The rate is the annualized seven-day yield at period end. |
See accompanying Notes to Financial Statements.
ACR Equity International Fund
SCHEDULE OF INVESTMENTS
As of November 30, 2024
Number
of Shares | | | | | Value | |
| | | | | COMMON STOCKS — 87.0% | | | | |
| | | | | BERMUDA — 7.8% | | | | |
| | 329,000 | | | Liberty Global Ltd. - Class A*1 | | $ | 4,648,770 | |
| | 57,000 | | | Liberty Global Ltd. - Class C*1 | | | 833,340 | |
| | 334,994 | | | Liberty Latin America Ltd. - Class C*1 | | | 2,314,809 | |
| | | | | | | | 7,796,919 | |
| | | | | CANADA — 6.5% | | | | |
| | 1,516 | | | Fairfax Financial Holdings Ltd. | | | 2,150,725 | |
| | 77,574 | | | Premium Brands Holdings Corp. | | | 4,353,253 | |
| | | | | | | | 6,503,978 | |
| | | | | DENMARK — 5.9% | | | | |
| | 323,578 | | | ISS A/S | | | 5,886,994 | |
| | | | | FRANCE — 8.6% | | | | |
| | 34,729 | | | Accor S.A. | | | 1,604,166 | |
| | 20,210 | | | Danone S.A. | | | 1,382,355 | |
| | 602,241 | | | Opmobility | | | 5,553,816 | |
| | | | | | | | 8,540,337 | |
| | | | | HONG KONG — 3.0% | | | | |
| | 3,140,844 | | | Budweiser Brewing Co. APAC Ltd.2 | | | 3,008,307 | |
| | | | | IRELAND — 8.0% | | | | |
| | 109,754 | | | DCC PLC | | | 8,003,872 | |
| | | | | NORWAY — 1.8% | | | | |
| | 103,891 | | | Multiconsult A.S.A.2 | | | 1,825,456 | |
| | | | | SWITZERLAND — 5.4% | | | | |
| | 221,045 | | | Medmix A.G.2 | | | 2,157,761 | |
| | 67,000 | | | Sunrise Communications A.G. - Class A - ADR* | | | 3,250,170 | |
| | | | | | | | 5,407,931 | |
| | | | | UNITED KINGDOM — 40.0% | | | | |
| | 48,300 | | | Ashtead Group PLC | | | 3,870,975 | |
| | 1,004,000 | | | B&M European Value Retail S.A. | | | 4,434,387 | |
| | 284,426 | | | Barclays PLC - ADR | | | 3,834,062 | |
| | 3,540,660 | | | Eurocell PLC | | | 8,064,361 | |
| | 3,664,131 | | | JD Sports Fashion PLC | | | 4,757,449 | |
| | 2,945,386 | | | Naked Wines PLC* | | | 1,900,128 | |
| | 1,841,926 | | | Victoria PLC* | | | 1,008,970 | |
| | 721,735 | | | Vistry Group PLC* | | | 6,029,734 | |
ACR Equity International Fund
SCHEDULE OF INVESTMENTS - Continued
As of November 30, 2024
Number
of Shares | | | | | Value | |
| | | | | COMMON STOCKS (Continued) | | | | |
| | | | | UNITED KINGDOM (Continued) | | | | |
| | 669,724 | | | Vodafone Group PLC - ADR | | $ | 6,007,424 | |
| | | | | | | | 39,907,490 | |
| | | | | TOTAL COMMON STOCKS | | | | |
| | | | | (Cost $94,479,414) | | | 86,881,284 | |
| | | | | EXCHANGE-TRADED FUNDS — 4.5% | | | | |
| | | | | UNITED STATES — 4.5% | | | | |
| | 45,258 | | | Goldman Sachs Access Treasury 0-1 Year ETF | | | 4,534,399 | |
| | | | | TOTAL EXCHANGE-TRADED FUNDS | | | | |
| | | | | (Cost $4,519,626) | | | 4,534,399 | |
Principal
Amount | | | | | | |
| | | | | SHORT-TERM INVESTMENTS — 7.9% | | | | |
| $ | 7,922,494 | | | UMB Bank, Institutional Banking Money Market II Deposit Investment, 4.04%3 | | | 7,922,494 | |
| | | | | TOTAL SHORT-TERM INVESTMENTS | | | | |
| | | | | (Cost $7,922,494) | | | 7,922,494 | |
| | | | | | | | | |
| | | | | TOTAL INVESTMENTS — 99.4% | | | | |
| | | | | (Cost $106,921,534) | | | 99,338,177 | |
| | | | | Other Assets in Excess of Liabilities — 0.6% | | | 594,724 | |
| | | | | TOTAL NET ASSETS — 100.0% | | $ | 99,932,901 | |
ADR – American Depository Receipt
ETF – Exchange-Traded Fund
PLC – Public Limited Company
| * | Non-income producing security. |
| 1 | Foreign security denominated in U.S. Dollars. |
| 2 | Security exempt from registration under Rule 144A of the Securities Act of 1933. These securities are restricted and may be resold in transactions exempt from registration normally to qualified institutional buyers. The total value of these securities is $6,991,524 which represents 7.0% of total net assets of the Fund. |
| 3 | The rate is the annualized seven-day yield at period end. |
See accompanying Notes to Financial Statements.
STATEMENTS OF ASSETS AND LIABILITIES
As of November 30, 2024
| | | ACR Opportunity Fund | | | ACR Equity International Fund | |
| Assets: | | | | | | | | |
| Investments, at value (cost $62,517,396 and $106,921,534, respectively) | | $ | 77,471,318 | | | $ | 99,338,177 | |
| Cash | | | 21 | | | | 23,719 | |
| Cash deposited with broker for securities sold short | | | 94,837 | | | | - | |
| Receivables: | | | | | | | | |
| Fund shares sold | | | 11,600 | | | | 628 | |
| Dividends and interest | | | 369,565 | | | | 698,975 | |
| Prepaid expenses | | | 16,321 | | | | 17,170 | |
| Total assets | | | 77,963,662 | | | | 100,078,669 | |
| | | | | | | | | |
| Liabilities: | | | | | | | | |
| Payables: | | | | | | | | |
| Fund shares redeemed | | | - | | | | 1,224 | |
| Advisory fees | | | 50,245 | | | | 47,212 | |
| Shareholder servicing fees (Note 7) | | | 9,419 | | | | 9,797 | |
| Fund administration and accounting fees | | | 9,642 | | | | 13,028 | |
| Transfer agent fees and expenses | | | 4,471 | | | | 4,845 | |
| Custody fees | | | 6,198 | | | | 5,229 | |
| Trustees' deferred compensation (Note 3) | | | 34,221 | | | | 33,263 | |
| Auditing fees | | | 17,000 | | | | 16,918 | |
| Legal fees | | | 2,942 | | | | 4,812 | |
| Chief Compliance Officer fees | | | 2,439 | | | | 2,239 | |
| Trustees' fees and expenses | | | 988 | | | | 785 | |
| Accrued other expenses | | | 5,080 | | | | 6,416 | |
| Total Liabilities | | | 142,645 | | | | 145,768 | |
| Commitments and contingencies (Note 3) | | | | | | | | |
| Net Assets | | $ | 77,821,017 | | | $ | 99,932,901 | |
| | | | | | | | | |
| Components of Net Assets: | | | | | | | | |
| Paid-in capital (par value of $0.01 per share with an unlimited number of shares authorized) | | $ | 60,342,932 | | | $ | 101,854,571 | |
| Total distributable earnings (accumulated deficit) | | | 17,478,085 | | | | (1,921,670 | ) |
| Net Assets | | $ | 77,821,017 | | | $ | 99,932,901 | |
| | | | | | | | | |
| Maximum Offering Price per Share: | | | | | | | | |
| Class I Shares: | | | | | | | | |
| Net assets applicable to shares outstanding | | $ | 77,821,017 | | | $ | 99,932,901 | |
| Shares of beneficial interest issued and outstanding | | | 4,496,370 | | | | 8,078,326 | |
| Redemption price per share | | $ | 17.31 | | | $ | 12.37 | |
See accompanying Notes to Financial Statements.
STATEMENTS OF OPERATIONS
For the Year Ended November 30, 2024
| | | ACR Opportunity Fund | | | ACR Equity International Fund | |
| Investment income: | | | | | | | | |
| Dividends (net of foreign withholdings taxes of $103,110 and $148,890, respectively) | | $ | 1,575,281 | | | $ | 2,100,338 | |
| Interest | | | 244,991 | | | | 191,758 | |
| Total investment income | | | 1,820,272 | | | | 2,292,096 | |
| | | | | | | | | |
| Expenses: | | | | | | | | |
| Advisory fees | | | 661,250 | | | | 859,959 | |
| Shareholder servicing fees (Note 7) | | | 46,208 | | | | 77,318 | |
| Fund administration and accounting fees | | | 101,018 | | | | 128,110 | |
| Trustees' fees and expenses | | | 13,779 | | | | 16,541 | |
| Transfer agent fees and expenses | | | 34,776 | | | | 33,989 | |
| Custody fees | | | 25,401 | | | | 39,745 | |
| Registration fees | | | 21,923 | | | | 23,003 | |
| Auditing fees | | | 17,116 | | | | 17,502 | |
| Shareholder reporting fees | | | 11,519 | | | | 17,184 | |
| Chief Compliance Officer fees | | | 10,709 | | | | 10,733 | |
| Legal fees | | | 8,513 | | | | 11,767 | |
| Miscellaneous | | | 7,756 | | | | 5,741 | |
| Tax reclaim service fees | | | 4,800 | | | | 9,567 | |
| Dividends on securities sold short | | | 4,546 | | | | - | |
| Insurance fees | | | 4,029 | | | | 5,001 | |
| Interest expense | | | 6 | | | | - | |
| Total expenses | | | 973,349 | | | | 1,256,160 | |
| Advisory fees waived | | | (137,424 | ) | | | (300,170 | ) |
| Net expenses | | | 835,925 | | | | 955,990 | |
| Net investment income | | | 984,347 | | | | 1,336,106 | |
| | | | | | | | | |
| Realized and Unrealized Gain (Loss): | | | | | | | | |
| Net realized gain (loss) on: | | | | | | | | |
| Investments | | | 1,878,166 | | | | 6,429,324 | |
| Securities sold short | | | (164,615 | ) | | | - | |
| Foreign currency transactions | | | (3,909 | ) | | | (4,499 | ) |
| Net realized gain (loss) | | | 1,709,642 | | | | 6,424,825 | |
| Net change in unrealized appreciation/depreciation on: | | | | | | | | |
| Investments | | | 12,450,795 | | | | 921,314 | |
| Securities sold short | | | 66,279 | | | | - | |
| Foreign currency translations | | | (3,181 | ) | | | (2,549 | ) |
| Net change in unrealized appreciation/depreciation | | | 12,513,893 | | | | 918,765 | |
| Net realized and unrealized gain (loss) | | | 14,223,535 | | | | 7,343,590 | |
| | | | | | | | | |
| Net Increase (Decrease) in Net Assets from Operations | | $ | 15,207,882 | | | $ | 8,679,696 | |
See accompanying Notes to Financial Statements.
ACR Opportunity Fund
STATEMENTS OF CHANGES IN NET ASSETS
| | | For the
Year Ended
November 30, 2024 | | | For the
Year Ended
November 30, 2023 | |
| Increase (Decrease) in Net Assets from: | | | | | | | | |
| Operations: | | | | | | | | |
| Net investment income (loss) | | $ | 984,347 | | | $ | 1,053,746 | |
| Net realized gain (loss) | | | 1,709,642 | | | | 535,131 | |
| Net change in unrealized appreciation/depreciation on investments, securities sold short and foreign currency translations | | | 12,513,893 | | | | 3,538,895 | |
| Net increase (decrease) in net assets resulting from operations | | | 15,207,882 | | | | 5,127,772 | |
| | | | | | | | | |
| Distributions to Shareholders: | | | | | | | | |
| Distributions: | | | | | | | | |
| Class I | | | (1,595,187 | ) | | | (1,389,029 | ) |
| Total distributions to shareholders | | | (1,595,187 | ) | | | (1,389,029 | ) |
| | | | | | | | | |
| Capital Transactions: | | | | | | | | |
| Net proceeds from shares sold: | | | | | | | | |
| Class I | | | 18,634,095 | | | | 10,437,979 | |
| Reinvestment of distributions: | | | | | | | | |
| Class I | | | 1,522,049 | | | | 1,337,682 | |
| Cost of shares redeemed: | | | | | | | | |
| Class I1 | | | (7,732,164 | ) | | | (8,621,038 | ) |
| Net increase in net assets from capital transactions | | | 12,423,980 | | | | 3,154,623 | |
| | | | | | | | | |
| Total increase (decrease) in net assets | | | 26,036,675 | | | | 6,893,366 | |
| | | | | | | | | |
| Net Assets: | | | | | | | | |
| Beginning of period | | | 51,784,342 | | | | 44,890,976 | |
| End of period | | $ | 77,821,017 | | | $ | 51,784,342 | |
| Capital Share Transactions: | | | | | | | | |
| Shares sold: | | | | | | | | |
| Class I | | | 1,168,586 | | | | 783,874 | |
| Shares reinvested: | | | | | | | | |
| Class I | | | 106,512 | | | | 110,370 | |
| Shares redeemed: | | | | | | | | |
| Class I | | | (488,825 | ) | | | (651,793 | ) |
| Net increase (decrease) in capital share transactions | | | 786,273 | | | | 242,451 | |
| 1 | Net redemption fee proceeds of $312 and $293, respectively. |
See accompanying Notes to Financial Statements.
ACR Equity International Fund
STATEMENTS OF CHANGES IN NET ASSETS
| | | For the
Year Ended
November 30, 2024 | | | For the
Year Ended
November 30, 2023 | |
| Increase (Decrease) in Net Assets from: | | | | | | | | |
| Operations: | | | | | | | | |
| Net investment income (loss) | | $ | 1,336,106 | | | $ | 1,076,339 | |
| Net realized gain (loss) | | | 6,424,825 | | | | 613,216 | |
| Net change in unrealized appreciation/depreciation on investments and foreign currency translations | | | 918,765 | | | | 6,020,925 | |
| Net increase (decrease) in net assets resulting from operations | | | 8,679,696 | | | | 7,710,480 | |
| | | | | | | | | |
| Distributions to Shareholders: | | | | | | | | |
| Distributions: | | | | | | | | |
| Class I | | | (2,510,247 | ) | | | (892,292 | ) |
| Total distributions to shareholders | | | (2,510,247 | ) | | | (892,292 | ) |
| | | | | | | | | |
| Capital Transactions: | | | | | | | | |
| Net proceeds from shares sold: | | | | | | | | |
| Class I | | | 23,311,585 | | | | 17,270,608 | |
| Reinvestment of distributions: | | | | | | | | |
| Class I | | | 2,501,022 | | | | 888,259 | |
| Cost of shares redeemed: | | | | | | | | |
| Class I1 | | | (5,796,062 | ) | | | (6,492,640 | ) |
| Net increase in net assets from capital transactions | | | 20,016,545 | | | | 11,666,227 | |
| | | | | | | | | |
| Total increase (decrease) in net assets | | | 26,185,994 | | | | 18,484,415 | |
| | | | | | | | | |
| Net Assets: | | | | | | | | |
| Beginning of period | | | 73,746,907 | | | | 55,262,492 | |
| End of period | | $ | 99,932,901 | | | $ | 73,746,907 | |
| Capital Share Transactions: | | | | | | | | |
| Shares sold: | | | | | | | | |
| Class I | | | 1,793,137 | | | | 1,572,454 | |
| Shares reinvested: | | | | | | | | |
| Class I | | | 216,351 | | | | 91,762 | |
| Shares redeemed: | | | | | | | | |
| Class I | | | (482,971 | ) | | | (610,969 | ) |
| Net increase (decrease) in capital share transactions | | | 1,526,517 | | | | 1,053,247 | |
| 1 | Net redemption fee proceeds of $0 and $162, respectively. |
See accompanying Notes to Financial Statements.
ACR Opportunity Fund
FINANCIAL HIGHLIGHTS
Class I
Per share operating performance.
For a capital share outstanding throughout each period.
| | | For the Year Ended November 30, | |
| | | 2024 | | | 2023 | | | 2022 | | | 2021 | | | 2020 | |
| Net asset value, beginning of period | | $ | 13.96 | | | $ | 12.95 | | | $ | 14.54 | | | $ | 11.38 | | | $ | 10.27 | |
| Income from Investment Operations: | | | | | | | | | | | | | | | | | | | | |
| Net investment income (loss) 1 | | | 0.24 | | | | 0.29 | | | | 0.24 | | | | 0.15 | | | | 0.04 | |
| Net realized and unrealized gain (loss) | | | 3.54 | | | | 1.12 | | | | (1.71 | ) | | | 3.09 | | | | 1.36 | |
| Total from investment operations | | | 3.78 | | | | 1.41 | | | | (1.47 | ) | | | 3.24 | | | | 1.40 | |
| | | | | | | | | | | | | | | | | | | | | |
| Less Distributions: | | | | | | | | | | | | | | | | | | | | |
| From net investment income | | | (0.29 | ) | | | (0.24 | ) | | | (0.12 | ) | | | (0.08 | ) | | | (0.22 | ) |
| From net realized gain | | | (0.14 | ) | | | (0.16 | ) | | | - | | | | - | | | | (0.07 | ) |
| Total distributions | | | (0.43 | ) | | | (0.40 | ) | | | (0.12 | ) | | | (0.08 | ) | | | (0.29 | ) |
| | | | | | | | | | | | | | | | | | | | | |
| Redemption fee proceeds1 | | | - | 2 | | | - | 2 | | | - | 2 | | | - | 2 | | | - | 2 |
| Net asset value, end of period | | $ | 17.31 | | | $ | 13.96 | | | $ | 12.95 | | | $ | 14.54 | | | $ | 11.38 | |
| | | | | | | | | | | | | | | | | | | | | |
| Total return3 | | | 27.72 | % | | | 11.43 | % | | | (10.22 | )% | | | 28.65 | % | | | 13.91 | % |
| | | | | | | | | | | | | | | | | | | | | |
| Ratios and Supplemental Data: | | | | | | | | | | | | | | | | | | | | |
| Net assets, end of period (in thousands) | | $ | 77,821 | | | $ | 51,784 | | | $ | 44,891 | | | $ | 49,165 | | | $ | 28,715 | |
| | | | | | | | | | | | | | | | | | | | | |
| Ratios of expenses to average net assets (including dividends on securities sold short, interest expense, and tax reclaim service fees): | | | | | | | | | | | | | | | | | | | | |
| Before fees waived, expenses absorbed and fees paid indirectly | | | 1.47 | %4 | | | 1.56 | %4 | | | 1.61 | %4 | | | 1.65 | %4 | | | 2.03 | %4 |
| After fees waived, expenses absorbed and fees paid indirectly | | | 1.26 | %4 | | | 1.27 | %4 | | | 1.27 | %4 | | | 1.24 | %4 | | | 1.31 | %4 |
| Ratio of net investment income (loss) to average net assets (including dividends on securities sold short, interest expense, and tax reclaim service fees): | | | | | | | | | | | | | | | | | | | | |
| Before fees waived, expenses absorbed and fees paid indirectly | | | 1.28 | % | | | 1.87 | % | | | 1.45 | % | | | 0.61 | % | | | (0.26 | )% |
| After fees waived, expenses absorbed and fees paid indirectly | | | 1.49 | % | | | 2.16 | % | | | 1.79 | % | | | 1.02 | % | | | 0.46 | % |
| | | | | | | | | | | | | | | | | | | | | |
| Portfolio turnover rate | | | 40 | % | | | 20 | % | | | 19 | % | | | 17 | % | | | 33 | % |
| 1 | Based on average daily shares outstanding for the period. |
| 2 | Amount represents less than $0.01 per share. |
| 3 | Total returns would have been lower had expenses not been waived or absorbed by the Advisor. Returns shown do not reflect the deduction of taxes that a shareholder would pay on Fund distributions or the redemption of Fund shares. |
| 4 | If interest expense, dividends on securities sold short, and tax reclaim expense had been excluded, the expense ratios would have been lowered by 0.01% for the year ended November 30, 2024. For the years ended November 30, 2023, 2022, 2021, 2020, the ratios would have been lowered by 0.02%, 0.02%, 0.03%, and 0.14%, respectively. |
See accompanying Notes to Financial Statements.
ACR Equity International Fund
FINANCIAL HIGHLIGHTS
Class I
Per share operating performance.
For a capital share outstanding throughout each period.
| | | For the Year Ended November 30, | |
| | | 2024 | | | 2023 | | | 2022 | | | 2021 | | | 2020 | |
| Net asset value, beginning of period | | $ | 11.26 | | | $ | 10.05 | | | $ | 13.81 | | | $ | 12.14 | | | $ | 10.19 | |
| Income from Investment Operations: | | | | | | | | | | | | | | | | | | | | |
| Net investment income (loss) 1 | | | 0.20 | | | | 0.18 | | | | 0.12 | | | | 0.11 | | | | (0.02 | ) |
| Net realized and unrealized gain (loss) | | | 1.30 | | | | 1.19 | | | | (3.28 | ) | | | 1.61 | | | | 2.07 | |
| Net increase from reimbursement by affiliates | | | - | | | | - | | | | - | | | | - | | | | - | 2,3 |
| Total from investment operations | | | 1.50 | | | | 1.37 | | | | (3.16 | ) | | | 1.72 | | | | 2.05 | |
| | | | | | | | | | | | | | | | | | | | | |
| Less Distributions: | | | | | | | | | | | | | | | | | | | | |
| From net investment income | | | (0.39 | ) | | | (0.16 | ) | | | (0.08 | ) | | | - | | | | (0.10 | ) |
| From net realized gain | | | - | | | | - | | | | (0.52 | ) | | | (0.05 | ) | | | - | |
| Total distributions | | | (0.39 | ) | | | (0.16 | ) | | | (0.60 | ) | | | (0.05 | ) | | | (0.10 | ) |
| | | | | | | | | | | | | | | | | | | | | |
| Redemption fee proceeds1 | | | - | | | | - | 2 | | | - | 2 | | | - | 2 | | | - | 2 |
| Net asset value, end of period | | $ | 12.37 | | | $ | 11.26 | | | $ | 10.05 | | | $ | 13.81 | | | $ | 12.14 | |
| | | | | | | | | | | | | | | | | | | | | |
| Total return4 | | | 13.59 | % | | | 13.91 | % | | | (23.95 | )% | | | 14.24 | % | | | 20.23 | % |
| | | | | | | | | | | | | | | | | | | | | |
| Ratios and Supplemental Data: | | | | | | | | | | | | | | | | | | | | |
| Net assets, end of period (in thousands) | | $ | 99,933 | | | $ | 73,747 | | | $ | 55,262 | | | $ | 70,573 | | | $ | 30,329 | |
| | | | | | | | | | | | | | | | | | | | | |
| Ratio of expenses to average net assets (including tax reclaim service fees): | | | | | | | | | | | | | | | | | | | | |
| Before fees waived, expenses absorbed and fees paid indirectly | | | 1.46 | %5 | | | 1.47 | %5 | | | 1.56 | % | | | 1.54 | % | | | 2.20 | % |
| After fees waived, expenses absorbed and fees paid indirectly | | | 1.11 | %5 | | | 1.10 | %5 | | | 1.10 | % | | | 1.13 | %6 | | | 1.19 | % |
| Ratio of net investment income (loss) to average net assets (including tax reclaim service fees): | | | | | | | | | | | | | | | | | | | | |
| Before fees waived, expenses absorbed and fees paid indirectly | | | 1.20 | % | | | 1.22 | % | | | 0.63 | % | | | 0.37 | % | | | (1.20 | )% |
| After fees waived, expenses absorbed and fees paid indirectly | | | 1.55 | % | | | 1.59 | % | | | 1.09 | % | | | 0.78 | % | | | (0.19 | )% |
| | | | | | | | | | | | | | | | | | | | | |
| Portfolio turnover rate | | | 48 | % | | | 22 | % | | | 36 | % | | | 14 | % | | | 44 | % |
| 1 | Based on average daily shares outstanding for the period. |
| 2 | Amount represents less than $0.01 per share. |
| 3 | During the year ended November 30, 2020, an affiliate reimbursed the Fund $4,202 for FX loss. The reimbursement had no impact to the Fund's performance. |
| 4 | Total returns would have been lower had expenses not been waived or absorbed by the Advisor. Returns shown do not reflect the deduction of taxes that a shareholder would pay on Fund distributions or the redemption of Fund shares. |
| 5 | If tax reclaim expense had been excluded, the expense ratios would of been lowered by 0.01% for the year ended November 30, 2024. For the year ended November 30, 2023, the ratios would have been lowered 0.00%. |
| 6 | Effective as of the close of business on June 11, 2021, the Advisor has contractually agreed to limit the annual fund operating expenses to 1.10%. Prior to the close of business on June 11, 2021, the annual fund operating expense limitation was 1.25%. |
See accompanying Notes to Financial Statements.
ACR Funds
NOTES TO FINANCIAL STATEMENTS
November 30, 2024
Note 1 – Organization
ACR Opportunity Fund (formerly the ACR Multi-Strategy Quality Return (MQR) Fund) and ACR Equity International Fund (formerly ACR International Quality Return (IQR) Fund) (each a “Fund” and collectively the ‘‘Funds’’) are organized as a non-diversified series of Investment Managers Series Trust II, a Delaware statutory trust (the “Trust”) which is registered as an open-end management investment company under the Investment Company Act of 1940, as amended (the “1940 Act”).
The ACR Opportunity Fund seeks to preserve capital during periods of economic decline, and to provide above average absolute and relative returns in the long run. The Fund commenced investment operations on December 31, 2014, with two classes of shares, Class A and Class I. Effective as of the close of business on June 11, 2021, Class A shares were converted into Class I shares. Class A shares were subsequently terminated.
The ACR Equity International Fund seeks to protect capital from permanent impairment while providing a return above both the Fund’s cost of capital and above the Fund’s benchmark over a full market cycle. The Fund commenced investment operations on December 30, 2016, with two classes of shares, Class A and Class I. Effective as of the close of business on June 11, 2021, Class A shares were converted into Class I shares. Class A shares were subsequently terminated.
The shares of each class represent an interest in the same portfolio of investments of the Funds and have equal rights as to voting, redemptions, dividends and liquidation, subject to the approval of the Trustees. Income, expenses (other than expenses attributable to a specific class) and realized and unrealized gains and losses on investments are allocated to each class of shares in proportion to their relative net assets. Shareholders of a class that bears distribution and service expenses under the terms of a distribution plan have exclusive voting rights to that distribution plan.
Each Fund is an investment company and accordingly follows the investment company accounting and reporting guidance of the Financial Accounting Standards Board (FASB) Accounting Standard Codification Topic 946 “Financial Services—Investment Companies.”
Note 2 – Accounting Policies
The following is a summary of the significant accounting policies consistently followed by the Funds in the preparation of their financial statements. The preparation of financial statements in conformity with accounting principles generally accepted in the United States of America (“GAAP”) requires management to make estimates and assumptions that affect the reported amounts and disclosures in the financial statements. Actual results could differ from these estimates.
(a) Valuation of Investments
The Funds value equity securities at the last reported sale price on the principal exchange or in the principal over the counter (“OTC”) market in which such securities are traded, as of the close of regular trading on the NYSE on the day the securities are being valued or, if the last-quoted sales price is not readily available, the securities will be valued at the last bid or the mean between the last available bid and ask price. Securities traded on the NASDAQ are valued at the NASDAQ Official Closing Price (“NOCP”). Investments in open-end investment companies are valued at the daily closing net asset value of the respective investment company. Options are valued at the mean between the last available bid and asked prices used. Debt securities are valued by utilizing a price supplied by independent pricing service providers. The independent pricing service providers may use various valuation methodologies including matrix pricing and other analytical pricing models as well as market transactions and dealer quotations. These models generally consider such factors as yields or prices of bonds of comparable quality, type of issue, coupon, maturity, ratings and general market conditions. If a price is not readily available for a portfolio security, the security will be valued at fair value (the amount which the Funds might reasonably expect to receive for the security upon its current sale). The Board of Trustees has designated the Advisor as the Fund’s valuation designee (the “Valuation Designee”) to make all fair value determinations with respect to the Fund’s portfolio investments, subject to the Board’s oversight. As the Valuation Designee, the Advisor has adopted and implemented policies and procedures to be followed when the Fund must utilize fair value pricing.
ACR Funds
NOTES TO FINANCIAL STATEMENTS - Continued
November 30, 2024
(b) Short Sales
Short sales are transactions under which the Funds sell a security it does not own in anticipation of a decline in the value of that security. To complete such a transaction, the Funds must borrow the security to make delivery to the buyer. The Funds then are obligated to replace the security borrowed by purchasing the security at market price at the time of replacement. The price at such time may be more or less than the price at which the security was sold by the Funds. When a security is sold short a decrease in the value of the security will be recognized as a gain and an increase in the value of the security will be recognized as a loss, which is potentially limitless. Until the security is replaced, the Funds are required to pay the lender amounts equal to dividend or interest that accrue during the period of the loan which is recorded as an expense. To borrow the security, the Funds also may be required to pay a premium or an interest fee, which are recorded as interest expense. Cash or securities are segregated for the broker to meet the necessary margin requirements. The Funds are subject to the risk that it may not always be able to close out a short position at a particular time or at an acceptable price.
(c) Exchange Traded Funds (“ETFs”)
ETFs typically trade on securities exchanges and their shares may, at times, trade at a premium or discount to their net asset values. In addition, an ETF may not replicate exactly the performance of the benchmark index it seeks to track for a number of reasons, including transaction costs incurred by the ETF, the temporary unavailability of certain index securities in the secondary market or discrepancies between the ETF and the index with respect to the weighting of securities or the number of securities held. Investing in ETFs, which are investment companies, may involve duplication of advisory fees and certain other expenses. As a result, Fund shareholders indirectly bear their proportionate share of these acquired expenses. Therefore, the cost of investing in the Fund will be higher than the cost of investing directly in ETFs and may be higher than other mutual funds that invest directly in securities.
Each ETF in which the Fund invests is subject to specific risks, depending on the nature of the ETF. Each ETF is subject to the risks associated with direct ownership of the securities comprising the index on which the ETF is based. These risks could include liquidity risk, sector risk as well as risks associated with fixed-income securities.
(d) Preferred Stocks
Preferred stocks are a class of stock having a preference over common stock as to the payment of dividends and the recovery of investment in the event a company is liquidated, although preferred stock is usually subordinate to the debt securities of the issuer. Preferred stock typically does not possess voting rights and its market value may change based on changes in interest rates. If interest rates rise, the fixed dividend on preferred stocks may be less attractive, causing the price of preferred stocks to decline. Preferred stock may have mandatory sinking fund provisions, as well as call/redemption provisions prior to maturity, a negative feature when interest rates decline.
(e) Options
The Funds may write or purchase options contracts primarily to enhance the Funds’ returns or reduce volatility. In addition, the Funds may utilize options in an attempt to generate gains from option premiums or to reduce overall portfolio risk. When a Fund writes or purchases an option, an amount equal to the premium received or paid by a Fund is recorded as a liability or an asset and is subsequently adjusted to the current market value of the option written or purchased. Premiums received or paid from writing or purchasing options which expire unexercised are treated by a Fund on the expiration date as realized gains or losses. The difference between the premium and the amount paid or received on effecting a closing purchase or sale transaction, including brokerage commissions, is also treated as a realized gain or loss. If an option is exercised, the premium paid or received is added to the cost of the purchase or proceeds from the sale in determining whether a Fund has realized a gain or a loss on investment transactions. A Fund, as a writer of an option, may have no control over whether the underlying securities may be sold (call) or purchased (put) and as a result bears the market risk of an unfavorable change in the price of the security underlying the written option.
ACR Funds
NOTES TO FINANCIAL STATEMENTS - Continued
November 30, 2024
(f) Investment Transactions, Investment Income and Expenses
Investment transactions are accounted for on the trade date. Realized gains and losses on investments are determined on the identified cost basis. Dividend income is recorded net of applicable withholding taxes on the ex-dividend date and interest income is recorded on an accrual basis. Withholding taxes on foreign dividends, if applicable, are paid (a portion of which may be reclaimable) or provided for in accordance with the applicable country’s tax rules and rates and are disclosed in the Statements of Operations. Withholding tax reclaims are filed in certain countries to recover a portion of the amounts previously withheld. The Funds record a reclaim receivable based on a number of factors, including a jurisdiction’s legal obligation to pay reclaims as well as payment history and market convention. Discounts or premiums on debt securities are accreted or amortized to interest income over the lives of the respective securities using the effective interest method. Income and expenses of the Funds are allocated on a pro rata basis to each class of shares relative net assets, except for distribution and service fees which are unique to each class of shares. Expenses incurred by the Trust with respect to more than one Fund are allocated in proportion to the net assets of each Fund except where allocation of direct expenses to each Fund or an alternative allocation method can be more appropriately made.
(g) Federal Income Taxes
Each Fund intends to comply with the requirements of Subchapter M of the Internal Revenue Code applicable to regulated investment companies and to distribute substantially all of its net investment income and any net realized gains to its shareholders. Therefore, no provision is made for federal income or excise taxes. Due to the timing of dividend distributions and the differences in accounting for income and realized gains and losses for financial statement and federal income tax purposes, the fiscal year in which amounts are distributed may differ from the year in which the income and realized gains and losses are recorded by the Funds.
Accounting for Uncertainty in Income Taxes (the “Income Tax Statement”) requires an evaluation of tax positions taken (or expected to be taken) in the course of preparing a Fund’s tax returns to determine whether these positions meet a “more-likely-than-not” standard that, based on the technical merits, have a more than fifty percent likelihood of being sustained by a taxing authority upon examination. A tax position that meets the “more-likely-than-not” recognition threshold is measured to determine the amount of benefit to recognize in the financial statements. The Funds recognize interest and penalties, if any, related to unrecognized tax benefits as income tax expense in the Statements of Operations.
The Income Tax Statement requires management of the Funds to analyze tax positions taken in the prior three open tax years, if any, and tax positions expected to be taken in the Funds’ current tax year, as defined by the IRS statute of limitations for all major jurisdictions, including federal tax authorities and certain state tax authorities. As of November 30, 2024 and during the prior three tax years, the Funds did not have a liability for any unrecognized tax benefits. The Funds have no examination in progress and are not aware of any tax positions for which it is reasonably possible that the total amounts of unrecognized tax benefits will significantly change in the next twelve months.
ACR Funds
NOTES TO FINANCIAL STATEMENTS - Continued
November 30, 2024
(h) Distributions to Shareholders
The Funds will make distributions of net investment income and net capital gains, if any, at least annually. Distributions to shareholders are recorded on the ex-dividend date. The amount and timing of distributions are determined in accordance with federal income tax regulations, which may differ from GAAP.
The character of distributions made during the year from net investment income or net realized gains may differ from the characterization for federal income tax purposes due to differences in the recognition of income expense and gain (loss) items for financial statement and tax purposes.
(i) Illiquid Securities
Pursuant to Rule 22e-4 under the 1940 Act, the Funds have adopted a Liquidity Risk Management Program (“LRMP”) that requires, among other things, that the Funds limit their illiquid investments that are assets to no more than 15% of net assets. An illiquid investment is any security which may not reasonably be expected to be sold or disposed of in current market conditions in seven calendar days or less without the sale or disposition significantly changing the market value of the investment. If the Advisor, at any time, determines that the value of illiquid securities held by a Fund exceeds 15% of its net asset value, the Advisor will take such steps as it considers appropriate to reduce them as soon as reasonably practicable in accordance with the Funds’ written LRMP.
(j) Use of Estimates
The presentation of financial statements in conformity with GAAP requires management to make estimates and assumptions that affect the reported amounts of assets and liabilities at the date of the financial statements and the reported amounts of income and expenses during the reporting period. Actual results could differ from those estimates.
Note 3 – Investment Advisory and Other Agreements
The Trust, on behalf of the Funds, entered into an Investment Advisory Agreement (the “Agreement”) with ACR Alpine Capital Research, LLC (the “Advisor”). Under the terms of the Agreement, the Funds pay a monthly investment advisory fee to the Advisor based on each Fund’s average daily net assets. The annual rates are listed by Fund in the table below. The Advisor has contractually agreed to waive its fee and/or pay for operating expenses (excluding any taxes, leverage interest, acquired fund fees and expenses (as determined in accordance with Form N-1A), professional fees related to services for the collection of foreign tax reclaims, dividend and interest expense on short sales, brokerage commissions, professional fees related to services for the collection of foreign tax reclaims, expenses incurred in connection with any merger or reorganization, and extraordinary expenses such as litigation expenses) in order to limit total annual operating expenses of each fund. This agreement is in effect until March 31, 2025 for the Funds, and it may be terminated before that date only by the Trust’s Board of Trustees. The table below contains the annual investment advisory fees and expense cap by Fund.
| | Investment
Advisory Fees | Total Limit on Annual
Operating Expenses † |
| ACR Opportunity Fund | 1.00% | 1.25% |
| ACR Equity International Fund | 1.00% | 1.10% |
| † | The total limit on annual operating expenses is calculated based on each Fund’s average daily net assets. |
ACR Funds
NOTES TO FINANCIAL STATEMENTS - Continued
November 30, 2024
For the year ended November 30, 2024, the Advisor waived a portion of its advisory fees totaling $137,424 for the ACR Opportunity Fund and $300,170 for the ACR Equity International Fund. The Advisor is permitted to seek reimbursement from the Funds, subject to certain limitations, of fees waived or payments made to the Funds for a period ending three full fiscal years after the date of the waiver or payment. This reimbursement may be requested from the Funds if the reimbursement will not cause the Funds’ annual expense ratio to exceed the lesser of (a) the expense limitation amount in effect at the time such fees were waived or payments made, or (b) the expense limitation amount in effect at the time of the reimbursement. At November 30, 2024 the amount of these potentially recoverable expenses was $439,024 and $838,797 for the ACR Opportunity Fund and the ACR Equity International Fund, respectively. The potential recoverable amount is noted as “Commitments and contingencies” as reported on the Statement of Assets and Liabilities. The Advisor may recapture all or a portion of this amount no later than November 30 of the years stated below:
| | | ACR Opportunity Fund | | | ACR Equity International Fund | |
| 2025 | | $ | 159,090 | | | $ | 289,290 | |
| 2026 | | | 142,510 | | | | 249,337 | |
| 2027 | | | 137,424 | | | | 300,170 | |
| Total | | $ | 439,024 | | | $ | 838,797 | |
UMB Fund Services, Inc. (“UMBFS”) serves as the Funds’ fund accountant, transfer agent and co-administrator; and Mutual Fund Administration, LLC (“MFAC”) serves as the Funds’ other co-administrator. UMB Bank, n.a., an affiliate of UMBFS, serves as the Funds’ custodian. The Funds’ allocated fees incurred for fund accounting, fund administration, transfer agency and custody services for the year ended November 30, 2024, are reported on the Statements of Operations.
IMST Distributors, LLC, a wholly owned subsidiary of Foreside Financial Group, LLC (d/b/a ACA Group), serves as the Funds’ distributor (the “Distributor”). The Distributor does not receive compensation from the Funds for its distribution services; the Advisor pays the Distributor a fee for its distribution-related services.
Certain trustees and officers of the Trust are employees of UMBFS or MFAC. The Funds do not compensate trustees and officers affiliated with the Funds’ co-administrators. For the year ended November 30, 2024, the Funds’ allocated fees incurred to Trustees who are not affiliated with the Funds’ co-administrators are reported on the Statements of Operations.
The Funds’ Board of Trustees has adopted a Deferred Compensation Plan (the “Plan”) for the Independent Trustees that enables Trustees to elect to receive payment in cash or the option to select various fund(s) in the Trust in which their deferred accounts shall be deemed to be invested. If a trustee elects to defer payment, the Plan provides for the creation of a deferred payment account. The Funds’ liability for these amounts is adjusted for market value changes in the invested fund(s) and remains a liability to the Funds until distributed in accordance with the Plan. The Trustees Deferred compensation liability under the Plan constitutes a general unsecured obligation of each Fund and is disclosed in the Statements of Assets and Liabilities. Contributions made under the plan and the change in unrealized appreciation/depreciation and income are included in the Trustees’ fees and expenses in the Statements of Operations.
ACR Funds
NOTES TO FINANCIAL STATEMENTS - Continued
November 30, 2024
Dziura Compliance Consulting, LLC provides Chief Compliance Officer (“CCO”) services to the Trust. The Funds’ allocated fees incurred for CCO services for the year ended November 30, 2024, are reported on the Statements of Operations.
Note 4 – Federal Income Taxes
At November 30, 2024, gross unrealized appreciation and (depreciation) on investments owned by the Funds, based on cost for federal income tax purposes were as follows:
| | | ACR Opportunity Fund | | | ACR Equity International Fund* | |
| Cost of investments | | $ | 62,650,411 | | | $ | 107,095,585 | |
| | | | | | | | | |
| Gross unrealized appreciation | | $ | 18,926,876 | | | $ | 11,527,112 | |
| Gross unrealized depreciation | | | (4,105,969 | ) | | | (19,284,520 | ) |
| | | | | | | | | |
| Net unrealized appreciation (depreciation) on investments | | $ | 14,820,907 | | | $ | (7,757,408 | ) |
| * | The Fund did not hold any securities sold short during the year ended November 30, 2024. |
The difference between cost amounts for financial statement and federal income tax purposes is due primarily to timing differences in recognizing certain gains and losses in security transactions.
GAAP requires that certain components of net assets be reclassified between financial and tax reporting. These reclassifications have no effect on net assets or net asset value per share. For the year ended November 30, 2024, permanent differences in book and tax accounting have been reclassified to paid-in capital and distributable earnings (deficit) as follows:
| | | Increase (Decrease) | |
| Fund | | Paid-in Capital | | | Total Distributable
Earnings
(Accumulated Deficit) | |
| ACR Opportunity Fund | | $ | 701 | | | $ | (701 | ) |
| ACR Equity International Fund | | | 542 | | | | (542 | ) |
ACR Funds
NOTES TO FINANCIAL STATEMENTS - Continued
November 30, 2024
As of November 30, 2024, the components of accumulated earnings (deficit) on a tax basis were as follows:
| | | ACR Opportunity Fund | | | ACR Equity International Fund | |
| Undistributed ordinary income | | $ | 1,006,794 | | | $ | 1,455,827 | |
| Undistributed long-term capital gains | | | 1,690,703 | | | | 4,425,554 | |
| Accumulated earnings | | | 2,697,497 | | | | 5,881,381 | |
| | | | | | | | | |
| Accumulated capital and other losses | | | - | | | | - | |
| Unrealized appreciation (depreciation) on investments and securities sold short | | | 14,820,907 | | | | (7,757,408 | ) |
| Unrealized appreciation (depreciation) on foreign currency translations | | | (6,098 | ) | | | (12,380 | ) |
| Unrealized deferred compensation | | | (34,221 | ) | | | (33,263 | ) |
| Total accumulated earnings (deficit) | | $ | 17,478,085 | | | $ | (1,921,670 | ) |
During the period ended November 30, 2024, the Equity International Fund utilized $883,142 of non-expiring capital loss carryforwards.
The tax character of distributions paid during the years ended November 30, 2024 and November 30, 2023 were as follows:
| | | ACR Opportunity Fund | | | ACR Equity International Fund | |
| Distribution paid from: | | 2024 | | | 2023 | | | 2024 | | | 2023 | |
| Ordinary income | | $ | 1,153,695 | | | $ | 829,679 | | | $ | 2,510,247 | | | $ | 892,292 | |
| Net long-term capital gains | | | 441,492 | | | | 559,350 | | | | - | | | | - | |
| Total taxable distributions | | $ | 1,595,187 | | | $ | 1,389,029 | | | $ | 2,510,247 | | | $ | 892,292 | |
Note 5 – Redemption Fee
The Funds may impose a redemption fee of 2.00% of the total redemption amount on all shares redeemed within 90 days of purchase. For the year ended November 30, 2024 and the year ended November 30, 2023, respectively, the ACR Opportunity Fund received $312 and $293 in redemption fees, and the ACR Equity International Fund received $0 and $162 in redemption fees.
Note 6 – Investment Transactions
For the year ended November 30, 2024, purchases and sales of investments, excluding short-term investments, were as follows:
| | | Purchases | | | Sales | | | Proceeds from
Securities Sold
Short | | | Cover Short
Securities | |
| ACR Opportunity Fund | | $ | 30,339,840 | | | $ | 23,909,651 | | | $ | - | | | $ | 547,486 | |
| ACR Equity International Fund | | | 50,714,734 | | | | 39,145,653 | | | | - | | | | - | |
Note 7 – Shareholder Servicing Plan
The Trust, on behalf of the Funds, has adopted a Shareholder Servicing Plan to pay a fee at an annual rate of up to 0.15% of average daily net assets of Class I shares serviced by shareholder servicing agents who provide administrative and support services to their customers.
ACR Funds
NOTES TO FINANCIAL STATEMENTS - Continued
November 30, 2024
For the year ended November 30, 2024, shareholder servicing fees incurred are disclosed on the Statements of Operations.
Note 8 – Indemnifications
In the normal course of business, the Funds enter into contracts that contain a variety of representations which provide general indemnifications. The Funds’ maximum exposure under these arrangements is unknown, as this would involve future claims that may be made against the Funds that have not yet occurred. However, the Funds expect the risk of loss to be remote.
Note 9 – Fair Value Measurements and Disclosure
Fair Value Measurements and Disclosures defines fair value, establishes a framework for measuring fair value in accordance with GAAP, and expands disclosure about fair value measurements. It also provides guidance on determining when there has been a significant decrease in the volume and level of activity for an asset or a liability, when a transaction is not orderly, and how that information must be incorporated into a fair value measurement.
Under Fair Value Measurements and Disclosures, various inputs are used in determining the value of the Funds’ investments. These inputs are summarized into three broad Levels as described below:
| ● | Level 1 – Unadjusted quoted prices in active markets for identical assets or liabilities that the Funds have the ability to access. |
| ● | Level 2 – Observable inputs other than quoted prices included in Level 1 that are observable for the asset or liability, either directly or indirectly. These inputs may include quoted prices for the identical instrument on an inactive market, prices for similar instruments, interest rates, prepayment speeds, credit risk, yield curves, default rates and similar data. |
| ● | Level 3 – Unobservable inputs for the asset or liability, to the extent relevant observable inputs are not available, representing the Funds’ own assumptions about the assumptions a market participant would use in valuing the asset or liability, and would be based on the best information available. |
The availability of observable inputs can vary from security to security and is affected by a wide variety of factors, including for example, the type of security, whether the security is new and not yet established in the marketplace, the liquidity of markets, and other characteristics particular to the security. To the extent that valuation is based on models or inputs that are less observable or unobservable in the market, the determination of fair value requires more judgment. Accordingly, the degree of judgment exercised in determining fair value is greatest for instruments categorized in Level 3.
The inputs to measure fair value may fall into different Levels of the fair value hierarchy. In such cases, for disclosure purposes, the Level in the fair value hierarchy within which the fair value measurement falls in its entirety, is determined based on the lowest Level input that is significant to the fair value measurement in its entirety.
ACR Funds
NOTES TO FINANCIAL STATEMENTS - Continued
November 30, 2024
The inputs or methodology used for valuing securities are not an indication of the risk associated with investing in those securities. The following is a summary of the inputs used, as of November 30, 2024, in valuing the Funds’ assets carried at fair value:
| ACR Opportunity Fund | | Level 1 | | | Level 2 | | | Level 3 | | | Total | |
| Assets | | | | | | | | | | | | | | | | |
| Common Stock | | | | | | | | | | | | | | | | |
| Communications | | $ | 8,774,901 | | | $ | - | | | $ | - | | | $ | 8,774,901 | |
| Consumer Discretionary | | | 10,704,489 | | | | 4,289,661 | | | | - | | | | 14,994,150 | |
| Consumer Staples | | | 2,948,336 | | | | 3,299,171 | | | | - | | | | 6,247,507 | |
| Energy | | | 1,295,440 | | | | - | | | | - | | | | 1,295,440 | |
| Financials | | | 19,072,395 | | | | - | | | | - | | | | 19,072,395 | |
| Health Care | | | 517,366 | | | | - | | | | - | | | | 517,366 | |
| Industrials | | | 5,213,238 | | | | 7,255,745 | | | | - | | | | 12,468,983 | |
| Materials | | | 1,143,604 | | | | - | | | | | | | | 1,143,604 | |
| Real Estate | | | 977,326 | | | | - | | | | - | | | | 977,326 | |
| Technology | | | 2,551,800 | | | | - | | | | - | | | | 2,551,800 | |
| Utilities | | | 1,034,743 | | | | - | | | | | | | | 1,034,743 | |
| Preferred Stocks | | | - | | | | - | | | | 598,555 | | | | 598,555 | |
| Short-Term Investments | | | 7,794,548 | | | | - | | | | - | | | | 7,794,548 | |
| Total Assets | | $ | 62,028,186 | | | $ | 14,844,577 | | | $ | 598,555 | | | $ | 77,471,318 | |
| ACR Equity International Fund | | Level 1 | | | Level 2 | | | Level 3* | | | Total | |
| Assets | | | | | | | | | | | | | | | | |
| Common Stock | | | | | | | | | | | | | | | | |
| Bermuda | | $ | 7,796,919 | | | $ | - | | | $ | - | | | $ | 7,796,919 | |
| Canada | | | 6,503,978 | | | | - | | | | - | | | | 6,503,978 | |
| Denmark | | | - | | | | 5,886,994 | | | | - | | | | 5,886,994 | |
| France | | | - | | | | 8,540,337 | | | | - | | | | 8,540,337 | |
| Hong Kong | | | - | | | | 3,008,307 | | | | - | | | | 3,008,307 | |
| Ireland | | | - | | | | 8,003,872 | | | | - | | | | 8,003,872 | |
| Norway | | | 1,825,456 | | | | - | | | | - | | | | 1,825,456 | |
| Switzerland | | | 5,407,931 | | | | - | | | | - | | | | 5,407,931 | |
| United Kingdom | | | 20,814,945 | | | | 19,092,545 | | | | - | | | | 39,907,490 | |
| Exchange-Traded Funds | | | 4,534,399 | | | | - | | | | - | | | | 4,534,399 | |
| Short-Term Investments | | | 7,922,494 | | | | - | | | | - | | | | 7,922,494 | |
| Total Assets | | $ | 54,806,122 | | | $ | 44,532,055 | | | $ | - | | | $ | 99,338,177 | |
| * | The Fund did not hold any Level 3 securities at period end. |
ACR Funds
NOTES TO FINANCIAL STATEMENTS - Continued
November 30, 2024
The following is a reconciliation of assets in which significant unobservable inputs (Level 3) were used in determining value:
| | | ACR Opportunity Fund | |
| Beginning balance November 30, 2023 | | $ | 829,710 | |
| Transfers into Level 3 during the period | | | - | |
| Transfers out of Level 3 during the period | | | - | |
| Total realized gain/(loss) | | | - | |
| Change in unrealized appreciation/(depreciation) | | | (255,155 | ) |
| Net purchases | | | 24,000 | |
| Return of Capital | | | - | |
| Net sales | | | - | |
| Balance as of November 30, 2024 | | $ | 598,555 | |
The following table presents additional quantitative information about valuation methodologies and inputs used for investments that are measured at fair value and categorized within Level 3 as of November 30, 2024:
| ACR Opportunity Fund |
| Asset Class | | Fair Value at
11/30/2024 | | | Valuation
Technique(s) | | Unobservable
Input | | Range of Input | | | Weighted
Average of
Input | | | Impact to
Valuation
from an
Increase in
Input(1) |
| Preferred Stocks | | $ | 598,555 | | | Asset Approach | | Estimated Recovery Proceeds | | $ | 186.97 | | | | N/A | | | Increase |
| (1) | This column represents the directional change in the fair value of the Level 3 investments that would result from an increase to the corresponding unobservable input. A decrease to the unobservable input would have the opposite effect. |
Note 10 – Market Disruption and Geopolitical Risks
Certain local, regional or global events such as war, acts of terrorism, the spread of infectious illnesses and/or other public health issues, financial institution instability or other events may have a significant impact on a security or instrument. These types of events and other like them are collectively referred to as “Market Disruptions and Geopolitical Risks” and they may have adverse impacts on the worldwide economy, as well as the economies of individual countries, the financial health of individual companies and the market in general in significant and unforeseen ways. Some of the impacts noted in recent times include but are not limited to embargos, political actions, supply chain disruptions, bank failures, restrictions to investment and/or monetary movement including the forced selling of securities or the inability to participate impacted markets. The duration of these events could adversely affect the Fund’s performance, the performance of the securities in which the Fund invests and may lead to losses on your investment. The ultimate impact of “Market Disruptions and Geopolitical Risks” on the financial performance of the Fund’s investments is not reasonably estimable at this time. Management is actively monitoring these events.
ACR Funds
NOTES TO FINANCIAL STATEMENTS - Continued
November 30, 2024
Note 11 – New Accounting Pronouncements and Regulatory Updates
In March 2020, the Financial Accounting Standards Board (FASB) issued Accounting Standards Update (ASU) No. 2020-04, Reference Rate Reform (Topic 848) – Facilitation of the Effects of Reference Rate Reform on Financial Reporting. The amendments in the ASU provide optional temporary financial reporting relief from the effect of certain types of contract modifications due to the planned discontinuation of the London Interbank Offered Rate and other interbank-offered based reference rates as of the end of 2021. The ASU is effective for certain reference rate-related contract modifications that occur during the period March 12, 2020 through December 31, 2022. In December 2022, the FASB issued ASU No. 2022-06, Reference Rate Reform (Topic 848) – Deferral of the Sunset Date of Topic 848, which extends the period through December 31, 2024. Management has reviewed the requirements and believes the adoption of these ASUs will not have a material impact on the financial statements.
Note 12 – Events Subsequent to the Fiscal Period End
The Funds have adopted financial reporting rules regarding subsequent events which require an entity to recognize in the financial statements the effects of all subsequent events that provide additional evidence about conditions that existed at the date of the balance sheet. Management has evaluated the Funds’ related events and transactions that occurred through the date of issuance of the Funds’ financial statements.
The Funds each declared the payment of distributions to be paid, on December 13, 2024, to shareholders of record on December 12, 2024 as follows:
| | | | | Short Term
Capital Gain | | | Long Term
Capital Gain | | | Income | |
| ACR Opportunity Fund | | Class I Shares | | $ | 0.00505 | | | $ | 0.37409 | | | $ | 0.22562 | |
| ACR Equity International Fund | | Class I Shares | | | None | | | $ | 0.54747 | | | $ | 0.18060 | |
There were no other events or transactions that occurred during this period that materially impacted the amounts or disclosures in the Funds’ financial statements.
REPORT OF INDEPENDENT REGISTERED PUBLIC ACCOUNTING FIRM
To the Shareholders of the ACR Funds and
the Board of Trustees of
Investment Managers Series Trust II
Opinion on the Financial Statements
We have audited the accompanying statements of assets and liabilities of ACR Opportunity Fund (formerly, ACR Multi-Strategy Quality Return (MQR) Fund) and ACR Equity International Fund (formerly, ACR International Quality Return (IQR) Fund) (the “Funds”), each a series of Investment Managers Series Trust II, including the schedules of investments, as of November 30, 2024, the related statements of operations for the year then ended, the statements of changes in net assets for each of the two years in the period then ended, the financial highlights for each of the five years in the period then ended, and the related notes (collectively referred to as the “financial statements”). In our opinion, the financial statements present fairly, in all material respects, the financial position of the Funds as of November 30, 2024, the results of their operations for the year then ended, the changes in their net assets for each of the two years in the period then ended and their financial highlights for each of the five years in the period then ended, in conformity with accounting principles generally accepted in the United States of America.
Basis for Opinion
These financial statements are the responsibility of the Funds’ management. Our responsibility is to express an opinion on the Funds financial statements based on our audits. We are a public accounting firm registered with the Public Company Accounting Oversight Board (United States) (“PCAOB”) and are required to be independent with respect to the Funds in accordance with the U.S. federal securities laws and the applicable rules and regulations of the Securities and Exchange Commission and the PCAOB. We have served as the auditor of one or more of the funds in the Trust since 2013.
We conducted our audits in accordance with the standards of the PCAOB. Those standards require that we plan and perform the audits to obtain reasonable assurance about whether the financial statements are free of material misstatement, whether due to error or fraud. The Funds are not required to have, nor were we engaged to perform, an audit of their internal control over financial reporting. As part of our audits we are required to obtain an understanding of internal control over financial reporting, but not for the purpose of expressing an opinion on the effectiveness of the Funds internal control over financial reporting. Accordingly, we express no such opinion.
Our audits included performing procedures to assess the risks of material misstatement of the financial statements, whether due to error or fraud, and performing procedures that respond to those risks. Such procedures included examining, on a test basis, evidence regarding the amounts and disclosures in the financial statements. Our audits also included evaluating the accounting principles used and significant estimates made by management, as well as evaluating the overall presentation of the financial statements. Our procedures included confirmation of securities owned as of November 30, 2024 by correspondence with the custodian, counter party, and brokers. We believe that our audits provide a reasonable basis for our opinion.
| |  |
| | TAIT, WELLER & BAKER LLP |
Philadelphia, Pennsylvania
January 28, 2025
ACR Funds
SUPPLEMENTAL INFORMATION (Unaudited)
Tax Information
Long- Term Capital Gain Designation
For the year ended November 30,2024, the ACR Opportunity Fund designates $441,492 as a 20% rate gain distribution for purposes of the dividends paid deduction.
Corporate Dividends Received Deduction
For the year ended November 30, 2024, 38.62% of the dividends to be paid from net investment income, including short term- capital gains (if any), for the ACR Opportunity Fund is designated as dividends received deduction available to corporate shareholders.
Qualified Dividend Income
For the year ended November 30, 2024, 100% and 100%, respectively, of dividends to be paid from net investment income, including short- term capital gains from the Fund (if any), for the ACR Opportunity and ACR Equity International Funds are designated as qualified dividend income.
Item 8. Changes in and Disagreements with Accountants for Open-End Management Investment Companies.
Not Applicable.
Item 9. Proxy Disclosures for Open-End Management Investment Companies.
Not Applicable.
Item 10. Remuneration Paid to Directors, Officers, and Others of Open-End Management Investment Companies.
This information is included in Item 7, as part of the financial statements.
Item 11. Statement Regarding Basis for Approval of Investment Advisory Contract.
Board Consideration of Investment Advisory Agreements
At an in-person meeting held on October 31, 2024, the Board of Trustees (the “Board”) of Investment Managers Series Trust II (the “Trust”), including the trustees who are not “interested persons” of the Trust (the “Independent Trustees”) as defined in the Investment Company Act of 1940, as amended (the “1940 Act”), reviewed and unanimously approved the renewal of the investment advisory agreement (the “Advisory Agreement”) between the Trust and ACR Alpine Capital Research, LLC (the “Advisor”) with respect to the ACR Opportunity Fund (the “Opportunity Fund”) and the ACR Equity International Fund (the “Equity International Fund” and together with the Opportunity Fund, the “Funds”) series of the Trust for an additional one-year term from when it otherwise would expire. In approving renewal of the Advisory Agreement, the Board, including the Independent Trustees, determined that such renewal was in the best interests of each Fund and its shareholders.
Background
In advance of the meeting, the Board received information about the Funds and the Advisory Agreement from the Advisor and from Mutual Fund Administration, LLC and UMB Fund Services, Inc., the Trust’s co-administrators, certain portions of which are discussed below. The materials, among other things, included information about the Advisor’s organization and financial condition; information regarding the background, experience, and compensation structure of relevant personnel providing services to the Funds; information about the Advisor’s compliance policies and procedures, disaster recovery and contingency planning, and policies with respect to portfolio execution and trading; information regarding the profitability of the Advisor’s overall relationship with the Funds; reports comparing the performance of each Fund with returns of its benchmark index and a group of comparable funds (each a “Peer Group”) selected by Broadridge Financial Solutions, Inc. (“Broadridge”) from Morningstar, Inc.’s relevant fund universe (each a “Fund Universe”) for various periods ended July 31, 2024; and reports comparing the investment advisory fee and total expenses of each Fund with those of its Peer Group and Fund Universe. The Board also received a memorandum from legal counsel to the Trust and the Independent Trustees discussing the legal standards under the 1940 Act and other applicable law for their consideration of the proposed renewal of the Advisory Agreement. In addition, the Board considered information reviewed by the Board during the year at other Board and Board committee meetings. No representatives of the Advisor were present during the Board’s consideration of the Advisory Agreement, and the Independent Trustees were represented by their legal counsel with respect to the matters considered.
In renewing the Advisory Agreement, the Board and the Independent Trustees considered a variety of factors, including those discussed below. In their deliberations, the Board and the Independent Trustees did not identify any particular factor that was controlling, and each Trustee may have attributed different weights to the various factors.
Nature, Extent, and Quality of Services
The Board considered information included in the meeting materials regarding the performance of each Fund. The materials they reviewed indicated the following:
| ● | The Opportunity Fund’s annualized total returns for the one-, three-, and five-year periods were above the Peer Group and Tactical Allocation Fund Universe median returns, and the MSCI All Country World Index returns. |
| ● | The Equity International Fund’s annualized total returns for the one- and five-year periods were above the Peer Group and Foreign Small/Mid Blend Fund Universe median returns and the MSCI All Country World ex USA Index returns. The Fund’s annualized total return for the three-year period was below the Fund Universe and Peer Group median returns and the MSCI Index return by 0.02%, 1.74%, and 3.10%, respectively. The Trustees considered the Advisor’s observation that the Fund’s underperformance relative to the MSCI Index was due to a timing issue, as the three-year period excludes the Fund’s outperformance of the MSCI Index for the one-year period ended July 31, 2021, but it includes the partial unwinding of that outperformance that occurred during the one-year period ended July 31, 2022. The Trustees also observed that the Fund’s risk-adjusted returns, as measured by its Sharpe ratio, and its risk-adjusted returns relative to the benchmark, as measured by its information ratio, ranked it in the first quartile of the funds (which is the most favorable) in the Peer Group and Fund Universe for the five-year period. |
The Board also considered the overall quality of services provided by the Advisor to the Funds. In doing so, the Board considered the Advisor’s specific responsibilities in day-to-day management and oversight of the Funds, as well as the qualifications, experience, and responsibilities of the personnel involved in the activities of the Funds. The Board also considered the overall quality of the organization and operations of the Advisor, as well as its compliance structure. The Board and the Independent Trustees concluded that based on the various factors they had reviewed, the nature, overall quality, and extent of the management and oversight services provided by the Advisor to each Fund were satisfactory.
Advisory Fees and Expense Ratios
With respect to the advisory fees and expenses paid by the Funds, the meeting materials indicated the following:
| ● | The Opportunity Fund’s annual investment advisory fee (gross of fee waivers) was higher than the Tactical Allocation Fund Universe and Peer Group medians by 0.055% and 0.20%, respectively. The Trustees noted, however, that the Fund’s advisory fee was not in the top quartile of funds in the Peer Group or the Fund Universe. The Trustees considered that the Advisor charges only a performance fee, and no asset-based fee, to the private ACR opportunity fund, which is managed in a similar fashion to the Fund. The Trustees also noted that the Fund’s advisory fee was the same as that of the other series of the Trust managed by the Advisor. |
The annual total expenses paid by the Fund (net of fee waivers) for the Fund’s most recent fiscal year were higher than the Fund Universe and Peer Group medians by 0.16% and 0.24%, respectively. The Trustees noted, however, that the average net assets of the Fund were significantly lower than the average net assets of corresponding classes of funds in the Peer Group and the Fund Universe, and that certain of those other funds also had significant assets in other classes.
| ● | The Equity International Fund’s annual investment advisory fee (gross of fee waivers) was higher than the Foreign Small/Mid Blend Fund Universe and Peer Group medians by 0.05% and 0.20%, respectively. The Trustees noted the Advisor’s belief that the Fund’s advisory fee does not undermine the Fund’s longer-term value proposition given its concentrated strategy, and that the Advisor intends to limit the capacity of the Fund in an effort to maintain the integrity of the strategy. The Trustees also noted that the Advisor had waived a significant portion of its advisory fee for the Fund. The Trustees considered that the Advisor does not manage any other client accounts with the same objectives and policies as the Fund, and therefore they did not have a good basis for comparing the Fund’s advisory fee with those of other similar accounts of the Advisor. The Trustees also noted that the Fund’s advisory fee was the same as that of the other series of the Trust managed by the Advisor. |
The annual total expenses paid by the Fund (net of fee waivers) for the Fund’s most recent fiscal year were slightly higher than the Fund Universe median by 0.01%, and higher than the Peer Group median by 0.13%. The Trustees noted, however, that the average net assets of the Fund were lower than the average net assets of corresponding classes of funds in the Peer Group, and significantly lower than the average net assets of corresponding classes of funds in the Fund Universe, and that certain of those other funds also had significant assets in other classes. The Board also considered the Advisor’s assertion that the net expenses for the Fund are set at a level at which the Advisor can maintain the viability of the Fund.
The Board and the Independent Trustees concluded that based on the factors they had reviewed, the compensation payable to the Advisor under the Advisory Agreement was fair and reasonable in light of the nature and quality of the services the Advisor provides to the Funds.
Profitability and Economies of Scale
The Board next considered information prepared by the Advisor relating to its costs and profits with respect to each Fund for the year ended July 31, 2024, noting that the Advisor had waived a significant portion of its advisory fee for the Equity International Fund, and had waived a portion of its advisory fee for the Opportunity Fund. Recognizing the difficulty in evaluating an investment advisor’s profitability with respect to the funds it manages in the context of an advisor with multiple lines of business, and noting that other profitability methodologies might also be reasonable, the Board and the Independent Trustees concluded that the profits of the Advisor from its relationships with the Opportunity Fund and the Equity International Fund were reasonable.
The Board also considered the benefits received by the Advisor as a result of the Advisor’s relationship with the Funds, other than the receipt of its investment advisory fees, including any research received from broker-dealers providing execution services to the Funds, the beneficial effects from the review by the Trust’s Chief Compliance Officer of the Advisor’s compliance program, the intangible benefits of the Advisor’s association with the Funds generally, and any favorable publicity arising in connection with the Funds’ performance. The Board noted that although there were no advisory fee breakpoints, the asset levels of the Funds were not currently likely to lead to significant economies of scale, and that any such economies would be considered in the future as the Funds’ assets grow.
Conclusion
Based on these and other factors, the Board and the Independent Trustees concluded that renewal of the Advisory Agreement was in the best interests of each Fund and its shareholders and, accordingly, approved the renewal of the Advisory Agreement with respect to each Fund.
Item 12. Disclosure of Proxy Voting Policies and Procedures for Closed-End Management Investment Companies.
Not applicable to open-end investment companies.
Item 13. Portfolio Managers of Closed-End Management Investment Companies.
Not applicable to open-end investment companies.
Item 14. Purchases of Equity Securities by Closed-End Management Investment Company and Affiliated Purchasers.
Not applicable to open-end investment companies.
Item 15. Submission of Matters to a Vote of Security Holders.
The registrant has not made any material changes to the procedures by which shareholders may recommend nominees to the registrant’s Board of Trustees.
Item 16. Controls and Procedures.
| (a) | The Registrant’s Principal Executive Officer and Principal Financial Officer have reviewed the Registrant's disclosure controls and procedures (as defined in Rule 30a-3(c) under the Investment Company Act of 1940 (the “Act”)) as of a date within 90 days of the filing of this report, as required by Rule 30a-3(b) under the Act and Rules 13a-15(b) or 15d-15(b) under the Securities Exchange Act of 1934. Based on their review, such officers have concluded that the disclosure controls and procedures are effective in ensuring that information required to be disclosed in this report is appropriately recorded, processed, summarized and reported and made known to them by others within the Registrant and by the Registrant’s service provider. |
| (b) | There were no changes in the Registrant's internal control over financial reporting (as defined in Rule 30a-3(d) under the Act) that occurred during the period covered by this report that has materially affected, or is reasonably likely to materially affect, the Registrant's internal control over financial reporting. |
Item 17. Disclosure of Securities Lending Activities for Closed-End Management Investment Companies.
Not applicable to open-end investment companies.
Item 18. Recovery of Erroneously Awarded Compensation.
(a) Not Applicable.
(b) Not Applicable.
Item 19. Exhibits.
(a) (2) Any policy required by the listing standards adopted pursuant to Rule 10D-1 under the Exchange Act (17 CFR 240.10D-1) by the registered national securities exchange or registered national securities association upon which the registrant’s securities are listed. Instruction to paragraph (a)(2). Not Applicable.
(a) (3) A separate certification for each principal executive and principal financial officer of the registrant as required by Rule 30a-2(a) under the Act (17 CFR 270.30a-2(a)). Filed herewith.
(a) (4) Not Applicable.
(a) (5) Not Applicable.
SIGNATURES
Pursuant to the requirements of the Securities Exchange Act of 1934 and the Investment Company Act of 1940, the registrant has duly caused this report to be signed on its behalf by the undersigned, thereunto duly authorized.
| (Registrant) | Investment Managers Series Trust II | |
| | | |
| By (Signature and Title) | /s/ Terrance Gallagher | |
| | Terrance Gallagher, President and Principal Executive Officer | |
| | | |
| Date | 2/7/2025 | |
Pursuant to the requirements of the Securities Exchange Act of 1934 and the Investment Company Act of 1940, this report has been signed below by the following persons on behalf of the registrant and in the capacities and on the dates indicated.
| By (Signature and Title) | /s/ Terrance Gallagher | |
| | Terrance Gallagher, President and Principal Executive Officer | |
| | | |
| Date | 2/7/2025 | |
| | | |
| By (Signature and Title) | /s/ Rita Dam | |
| | Rita Dam, Treasurer and Principal Financial Officer | |
| | | |
| Date | 2/7/2025 | |