UNITED STATES
SECURITIES AND EXCHANGE COMMISSION
Washington, D.C. 20549
FORM N-CSR
CERTIFIED SHAREHOLDER REPORT OF REGISTERED MANAGEMENT
INVESTMENT COMPANIES
Investment Company Act file number 811-22906
Virtus Alternative Solutions Trust
(Exact name of registrant as specified in charter)
101 Munson Street
Greenfield, MA 01301
(Address of principal executive offices) (Zip code)
Jennifer Fromm, Esq.
Vice President, Chief Legal Officer, Counsel and Secretary for Registrant
One Financial Plaza
Hartford, CT 06103-4506
(Name and address of agent for service)
Registrant’s telephone number, including area code: (800)-243-1574
Date of fiscal year end: October 31
Date of reporting period: October 31, 2020
Form N-CSR is to be used by management investment companies to file reports with the Commission not later than 10 days after the transmission to stockholders of any report that is required to be transmitted to stockholders under Rule 30e-1 under the Investment Company Act of 1940 (17 CFR 270.30e-1). The Commission may use the information provided on Form N-CSR in its regulatory, disclosure review, inspection, and policymaking roles.
A registrant is required to disclose the information specified by Form N-CSR, and the Commission will make this information public. A registrant is not required to respond to the collection of information contained in Form N-CSR unless the Form displays a currently valid Office of Management and Budget (“OMB”) control number. Please direct comments concerning the accuracy of the information collection burden estimate and any suggestions for reducing the burden to Secretary, Securities and Exchange Commission, 450 Fifth Street, NW, Washington, DC 20549-0609. The OMB has reviewed this collection of information under the clearance requirements of 44 U.S.C. § 3507.
Item 1. Reports to Stockholders.
The Report to Shareholders is attached herewith.

| Virtus Aviva Multi-Strategy Target Return Fund* |
| Virtus Duff & Phelps Select MLP and Energy Fund* |
| Virtus KAR Long/Short Equity Fund* |
| 1 | ||
| 2 | ||
| 4 | ||
| Fund | Fund Summary | Schedule of Investments |
| 6 | 15 | |
| 9 | 25 | |
| 12 | 27 | |
| 29 | ||
| 31 | ||
| 33 | ||
| 35 | ||
| 37 | ||
| 54 | ||
| 55 | ||
| 56 | ||
| 57 | ||


President, Virtus Funds
| Beginning Account Value May 1, 2020 | Ending Account Value October 31, 2020 | Annualized Expense Ratio* | Expenses Paid During Period** | |||||
Aviva Multi-Strategy Target Return Fund | ||||||||
| Class A | $ 1,000.00 | $ 995.80 | 1.69 % | $ 8.48 | ||||
| Class C | 1,000.00 | 991.50 | 2.44 | 12.21 | ||||
| Class I | 1,000.00 | 995.90 | 1.44 | 7.22 | ||||
| Class R6 | 1,000.00 | 996.90 | 1.38 | 6.93 | ||||
Duff & Phelps Select MLP and Energy Fund | ||||||||
| Class A | 1,000.00 | 948.50 | 1.40 | 6.86 | ||||
| Class C | 1,000.00 | 944.20 | 2.15 | 10.51 | ||||
| Class I | 1,000.00 | 949.40 | 1.15 | 5.64 | ||||
KAR Long/Short Equity Fund | ||||||||
| Class A | 1,000.00 | 1,239.80 | 2.29 | 12.87 | ||||
| Class C | 1,000.00 | 1,235.50 | 3.02 | 16.96 | ||||
| Class I | 1,000.00 | 1,241.90 | 2.04 | 11.49 | ||||
| Class R6 | 1,000.00 | 1,241.70 | 2.05 | 11.53 |
| * | Annualized expense ratios include dividend and interest expense on securities sold short. |
| ** | Expenses are equal to the relevant Fund’s annualized expense ratio, which is net of waived fees and reimbursed expenses, if applicable, multiplied by the average account value over the period, multiplied by the number of days (184) expenses were accrued in the most recent fiscal half-year, then divided by 366 to reflect the one-half year period. |
| Beginning Account Value May 1, 2020 | Ending Account Value October 31, 2020 | Annualized Expense Ratio* | Expenses Paid During Period** | |||||
Aviva Multi-Strategy Target Return Fund | ||||||||
| Class A | $ 1,000.00 | $ 1,016.64 | 1.69 % | $ 8.57 | ||||
| Class C | 1,000.00 | 1,012.87 | 2.44 | 12.34 | ||||
| Class I | 1,000.00 | 1,017.90 | 1.44 | 7.30 | ||||
| Class R6 | 1,000.00 | 1,018.20 | 1.38 | 7.00 | ||||
Duff & Phelps Select MLP and Energy Fund | ||||||||
| Class A | 1,000.00 | 1,018.10 | 1.40 | 7.10 | ||||
| Class C | 1,000.00 | 1,014.33 | 2.15 | 10.89 | ||||
| Class I | 1,000.00 | 1,019.35 | 1.15 | 5.84 | ||||
KAR Long/Short Equity Fund | ||||||||
| Class A | 1,000.00 | 1,013.64 | 2.29 | 11.57 | ||||
| Class C | 1,000.00 | 1,009.96 | 3.02 | 15.25 | ||||
| Class I | 1,000.00 | 1,014.89 | 2.04 | 10.32 | ||||
| Class R6 | 1,000.00 | 1,014.85 | 2.05 | 10.37 |
| * | Annualized expense ratios include dividend and interest expense on securities sold short. |
| ** | Expenses are equal to the relevant Fund’s annualized expense ratio, which is net of waived fees and reimbursed expenses, if applicable, multiplied by the average account value over the period, multiplied by the number of days (184) expenses were accrued in the most recent fiscal half-year, then divided by 366 to reflect the one-half year period. |
October 31, 2020
| Ticker Symbols: | |
| Class A: VMSAX | |
| Class C: VCMSX | |
| Class I: VMSIX | |
| Class R6: VMSRX |
Aviva Investors Americas LLC
| ■ | The Fund is diversified and has an investment objective of long-term total return. There is no guarantee that the Fund will meet its objective. |
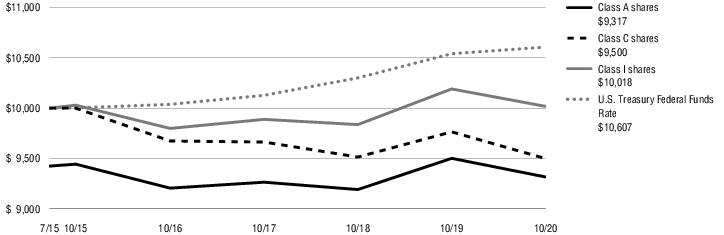
| ■ | For the fiscal year ended October 31, 2020, the Fund’s Class A shares at NAV returned -1.95%, Class C shares at NAV returned -2.71%, Class I shares at NAV returned -1.70% and Class R6 shares at NAV returned -1.65%. For the same period, the U.S. Treasury Federal Funds Rate, which serves as both the Fund’s broad-based and style-specific benchmark appropriate for comparison, returned 0.63%. |
| ■ | Financial markets ended 2019 on a positive note, as improving investor sentiment regarding global economic growth contributed to increased demand for riskier assets. Bonds underperformed, however, as the yields on safe-haven assets, such as U.S. government bonds, rose to levels that were not seen again over the course of the first 10 months of 2020. |
| ■ | The beginning of 2020 saw a continuation of market leadership by risk assets before the first signs of the COVID-19 outbreak triggered volatility in the equity markets. While Chinese stocks were the first to react to the news in January, most other global equity markets, including that of the U.S., were more resilient. This changed abruptly at the end of February, however, as the markets went into panic mode in anticipation of a severe global economic recession due to expected coronavirus lockdowns in a large number of countries. This led to investors selling both riskier and more defensive assets, which in turn created a liquidity |
| ■ | This trend continued throughout the second quarter of 2020 as markets welcomed the flurry of stimulus measures, which helped combat the dramatic slowdown of economic activity in the U.S. and other countries. Some clear winners emerged from the global lockdowns, as some of the largest household names in the technology and consumer discretionary sectors saw an opportunity to grow profits in the “work-from-home” environment. Investors were quick to reward financially stable companies, particularly those on track to grow their market share in the highly uncertain environment. While some sectors saw a relatively smooth recovery over the following months, cyclically sensitive parts of the equity market remained in deeply negative territory for the year. |
| ■ | In July and August, market sentiment continued to improve, with some countries, such as Australia, New Zealand, Canada, and Germany showing relative success in containing the spread of COVID-19 and supporting their economies. However, September and October saw volatility pick up due to investor concerns regarding delays to additional fiscal stimulus, rising political uncertainty around the U.S. presidential election, and increasing COVID-19 cases. |
| ■ | While equities in most developed and emerging markets declined during the fiscal year, bonds rose significantly on the back of the enormous monetary packages deployed by the major central banks. The U.S. dollar ended the year weaker against most peers, having seen a period of sharp appreciation during the market stress in March. Gold saw significant gains due to investor expectations around the real value of money being diluted by the trillions thrown into the system by global governments and central banks. |
| ■ | Credit assets benefitted from lower risk-free rates |
| across the board, however credit spreads rose in both the investment grade and high yield sectors across both developed and emerging markets. This reflected a deterioration in corporate fundamentals due to the challenging environment. Finally, volatility rose throughout the fiscal year as market stress reached extreme highs in March and subsided somewhat over the following months. |
| ■ | The Fund delivered negative performance for the fiscal year ended October 31, 2020. Performance was driven by gains in the Opportunistic Return strategies (a portion of the portfolio that consists of positions broadly uncorrelated to traditional asset classes) and Risk-Reducing Return strategies (a defensive part of the portfolio). The Fund’s Market Return strategies generated losses, as they consisted of riskier positions that were impacted by the deterioration in investor appetite for risk over the fiscal year. |
| ■ | The Fund’s performance benefitted from its bond exposure the most while being hurt by currencies and credit. |
| ■ | Within top contributors, the Fund’s exposure to U.S. government bonds proved to be particularly profitable due to two positions – an outright long position, and a relative value strategy in which U.S. government bonds were paired against German government bonds. U.S. interest rates collapsed following the decisive rate cut by the Fed, while German bond yields had been already very low for a number of years. This allowed the spread between the two types of bonds to shrink significantly during the year’s volatile market conditions. |
| ■ | The Fund’s position in U.S. equities added to returns. The Fund’s strategy favored companies with strong balance sheets in the Russell 2000® Index over the broader market. This approach contributed positively to performance, as investors showed a preference for companies with stable finances during the peak of the crisis. An outright long exposure to U.S. equities also contributed to performance. |
| ■ | Finally, a strategy that was designed to benefit from lower real yields in the U.S. (that is, the difference between nominal interest rates and |
| inflation) also delivered strong gains on the back of a sharp decline in nominal yields. | |
| ■ | The five biggest detractors from performance included a mixed bag of strategies, two of which are no longer held in the Fund. A position in the Japanese yen detracted the most. The strategy was implemented for risk reduction purposes, but proved to be less effective after March as investor appetite for risk recovered. Most of the riskier global currencies saw sharp gains in the second and third quarters of 2020. |
| ■ | The Fund’s position in U.S. inflation-linked assets also detracted as inflation expectations collapsed in March. Most investors anticipated a sharp fall in economic activity across the globe, which in turn led to speculation that inflationary pressures would decline. |
| ■ | Three equity strategies delivered negative returns, as well. The Fund’s exposure to Japanese and European stocks resulted in negative performance as both markets suffered extreme volatility at the beginning of the year, and prices were slow to recover. Finally, the Fund’s emphasis on value stocks over global consumer staples names also generated negative performance. Investors saw more stability and potential in consumer staples stocks, which typically do well in recessionary economic conditions. |
| ■ | The Fund’s usage of derivatives did not materially impact returns, since derivatives are used for risk management and efficient portfolio management purposes, as opposed to return enhancement. |
| Common Stocks | 49% |
| Short-Term Investment | 47 |
| Exchange-Traded Fund | 5 |
| Purchased Options | 2 |
| Written Options | (3) |
| Total | 100% |
| 1 Year | 5 Years | Since inception | Inception date | |||||||
| Class A shares at NAV2 | -1.95 % | -0.27 % | -0.22 % | 7/20/15 | ||||||
| Class A shares at POP3,4 | -7.59 | -1.44 | -1.33 | 7/20/15 | ||||||
| Class C shares at NAV and with CDSC2,4 | -2.71 | -1.02 | -0.97 | 7/20/15 | ||||||
| Class I shares at NAV | -1.70 | -0.02 | 0.03 | 7/20/15 | ||||||
| Class R6 shares at NAV | -1.65 | — | 0.84 | 11/3/16 | ||||||
| U.S. Treasury Federal Funds Rate | 0.63 | 1.18 | — 5 | — | ||||||
| Fund Expense Ratios6: A Shares: Gross 2.24%, Net 1.78%; C Shares: Gross 2.97%, Net 2.53%; I Shares: Gross 1.97%, Net 1.53%, R6 Shares: Gross 1.93%, Net 1.47%. | ||||||||||
| All returns represent past performance which is no guarantee of future results. Current performance may be higher or lower than the performance shown. The investment return and principal value of an investment will fluctuate so that an investor’s shares, when redeemed, may be worth more or less than their original cost. The above table and graph below do not reflect the deduction of taxes that a shareholder would pay on fund distributions or the redemption of shares. Please visit Virtus.com for performance data current to the most recent month-end. |
| 1 | Total returns are historical and include changes in share price and the reinvestment of both dividends and capital gain distributions. |
| 2 | “NAV” (Net Asset Value) total returns do not include the effect of any sales charge. |
| 3 | “POP” (Public Offering Price) total returns include the effect of the maximum front-end 5.75% sales charge. |
| 4 | “CDSC” (contingent deferred sales charge) is applied to redemptions of certain classes of shares that do not have a sales charge applied at the time of purchase. CDSC for certain redemptions of Class A shares made within 18 months of a finder’s fee being paid and all Class C shares are 1% within the first year and 0% thereafter. |
| 5 | The since inception index returned 1.42% for Class R6 and 1.13% for Class A, C and I shares of the respective share classes. |
| 6 | The expense ratios of the Fund are set forth according to the prospectus for the Fund effective February 28, 2020, as supplemented and revised, and may differ from the expense ratios disclosed in the Financial Highlights tables in this report. See the Financial Highlights for more current expense ratios. Net Expense: Expenses reduced by the contractual fee waiver and expense limitation in effect through February 28, 2021. Gross Expense: Does not reflect the effect of the fee waiver or expense limitation. Expense ratios reflect fees and expenses associated with any underlying funds. |
| Ticker Symbols: | |
| Class A: VLPAX | |
| Class C: VLPCX | |
| Class I: VLPIX |
Duff & Phelps Investment Management Co.
| ■ | The Fund is non-diversified and has an investment objective of total return with a secondary objective of income. There is no guarantee that the Fund will meet its objective. |
| ■ | For the fiscal year ended October 31, 2020, the Fund’s Class A shares at NAV returned -32.15%, Class C shares at NAV returned -32.76%, and Class I shares at NAV returned -32.03%. For the same period, the Alerian MLP Index, which serves as both the Fund’s broad-based and style-specific benchmark appropriate for comparison, returned -42.52%. |
| ■ | Stable energy markets depend on the forces of supply and demand finding relative balance, but two seismic developments made the fiscal year ended October 31, 2020, one of the most difficult periods on record for the energy sector. During the period, midstream energy stocks fell 42.5%, as measured by the Alerian MLP Index, and massively underperformed the broader S&P 500® Index. The first quarter of the fiscal year was characterized by the volatility that has become commonplace for the midstream sector. With the sector badly lagging the S&P 500® Index and a number of stocks in the red on a calendar year basis in 2019, November brought a round of tax-loss selling, followed by a sharp rebound starting in December and carrying through much of January 2020. The rally began to fade around mid-month as the market began to worry about the impact of COVID-19 on Chinese energy |
| ■ | In February, the global reach of COVID-19 was becoming clearer, and by March, governments across the world were orchestrating coordinated shutdowns of their economies in order to control the spread of the virus. As estimated by some observers, this ultimately drove a sharp decline of over 26 million barrels per day in oil demand at the trough, amounting to roughly 25% of global petroleum consumption. This represented the greatest demand shock in modern times. |
| ■ | Around the same time, OPEC and allied countries (OPEC+) met in early March to address severe oversupply in crude oil markets, but members were unable to find consensus on a strategy. With key participants Saudi Arabia and Russia advocating for diametrically opposite actions, these two countries effectively launched a price war for market share that pushed the U.S. West Texas Intermediate (WTI) crude oil benchmark down 45% over the following two weeks. |
| ■ | This period was disastrous for midstream energy stock performance, and there was nowhere to hide. The Alerian MLP Index fell nearly 60% from the start of March to its bottom around mid-month. Selling pressure was relentless and indiscriminate, exacerbated by the unwinding of many master limited partnership (MLP) closed-end funds, most of which had taken on leverage to amplify their buying power. |
| ■ | With demand in apparent free fall and Saudi Arabia flooding the markets with additional crude that could not be absorbed, every nook and cranny of global storage started to rapidly fill. Production needed to decline, deeply and immediately, and the world was waiting on U.S. shale producers to blink. With storage approaching tank tops, the WTI crude index briefly went into negative territory, closing below -$37 per barrel in late April, before returning to positive territory. It closed the month at just under $19 per barrel. |
| ■ | Surprisingly, midstream stocks rose sharply beginning in late March, as closed-end fund liquidations ended and savvy investors stepped up, understanding that the stocks had been oversold. The Alerian MLP Index rallied more than |
| 90% from the bottom in March through the end of April, but this still left the index down 33% for the fiscal year to date. | |
| ■ | With crude oil prices far below the cash cost to operate wells, shale producers took the first step toward rebalancing the market. They not only halted all new drilling, but even curtailed wells that were already online and flowing, which pushed U.S. production into decline. Then Saudi Arabia and Russia came back together to broker the largest production cut in OPEC history, removing roughly 9% of global supply. With the necessary supply response in place and demand losses bottoming out, crude oil prices rebounded to positive $40 per barrel by the end of July. And with oil prices back above the cash cost, producers brought shut-in volumes back online, improving the near-term outlook for midstream companies. However, as the market came to realize that the pandemic would go on far longer than most had envisioned, the stocks failed to sustain any positive momentum, falling another 12% over the last six months of the fiscal year. WTI ended the fiscal year just under $36 per barrel, down 34%. |
| ■ | Despite the broad-based carnage in the sector, there were still relative winners and losers, with trading activity becoming more discriminate as the pandemic wore on. First, the market showed a clear preference for the strongest balance sheets. All companies slashed their capital expenditure (capex) budgets and reduced operating and overhead expenses, accelerating a pivot to free cash flow generation that had been forming prior to the pandemic. But companies with too much debt were forced to go a step further, slashing their dividends and distributions. Those companies earliest to take action saw their stock prices rebound more quickly. |
| ■ | Asset mix also led to select opportunities for well-positioned companies. Natural gas and natural gas liquids (NGL) prices actually rose during the year, benefitting companies with assets in the Marcellus/Utica regions and those with NGL export facilities. A significant quantity of these commodities are produced alongside crude oil in key shale basins, so the sharp decline in crude oil production also resulted in lower volumes and higher prices for natural gas and NGLs. Owners of crude oil storage also benefitted, as the short-term oversupply condition created a window for |
| operators to fully contract those facilities with substantial tariff increases. Generally, the stocks that were more challenged during the fiscal year represented gathering and processing companies, those with volumetric exposure to crude oil and refined product pipelines, and companies whose balance sheets remained stretched even after dividend/distribution cuts. | |
| ■ | While pandemic-related impacts largely drove sector performance, there were other contributing factors. Investor adoption of environmental, social & governance (ESG) principles and focus on the transition to cleaner energy accelerated during the fiscal year. Traditional energy companies are thought to be long-term losers to solar, wind, and other green technologies. The good news is the sector started to take these issues more seriously, with several companies publishing their first sustainability reports and committing to specific operating practices that reduce emissions. Midstream energy scores particularly poorly on governance given the particulars of the MLP structure and a recent history of egregious outcomes for limited partner investors. A number of MLPs have converted to traditional C-corporations where governance protections are greater, but several large midstream companies continue to back the MLP structure. Uncertainty around the U.S. presidential election was also a factor, as investors worried about an acceleration of the transition to cleaner sources of energy should the Democrats win control of the White House and Congress. To that end, Canadian midstream companies generally outperformed their U.S. counterparts in the fiscal year. |
| ■ | The Fund outperformed the Alerian MLP Index for the 12 months ended October 31, 2020. The Fund benefitted on a relative basis from finding value outside of the large MLPs that dominate the benchmark. This was particularly true with investments in midstream C-corporations oriented toward natural gas and liquefied natural gas (LNG). The Fund was significantly underweight the large MLPs, which we believe need to attract a broader investor base with governance reforms and major index inclusion through eventual conversions to C-corporations. The Fund outperformed the benchmark over the second, |
| third, and fourth quarters of the fiscal year, and was roughly in-line for the first quarter. Outperformance was most pronounced in the second and third quarters of the fiscal year, when the effects of the pandemic ravaged the market most severely. | |
| ■ | The five largest individual contributors to Fund performance on an absolute basis were Antero Midstream, Williams, Hess Midstream LP, MPLX LP, and NextEra Energy Partners LP. Antero Midstream traded higher on the improvement in natural gas prices, along with significant progress by its parent, Antero Resources, in reducing near-term debt maturities and the market’s perception of elevated counterparty risk. Williams performed well on the relative stability of its natural gas-heavy business mix. Hess Midstream demonstrated base business resilience from its unique contract structure with its parent, Hess Corporation. MPLX responded to a strategic re-commitment from its parent, Marathon Petroleum, as well as an improved production outlook in the gassy Marcellus/Utica shales of the Appalachia Basin. NextEra Energy Partners, a leading operator of renewable power generation assets in the U.S., benefited from a strong rally in clean energy stocks. |
| ■ | The five largest individual detractors from Fund performance on an absolute basis were Plains GP Holdings LP, ONEOK, Energy Transfer LP, Targa Resources, and Enterprise Products Partners. Plains, Energy Transfer, and Targa were three companies with elevated leverage and heavily dependent on production from the Permian Basin, where drilling activity fell to levels insufficient to offset natural declines on existing wells. ONEOK also suffered from high leverage and concerns about the sustainability of its dividend, especially given sharp production curtailments on its core Williston Basin footprint. Enterprise, while certainly not unscathed by the pandemic, held up relatively well on a fundamental basis, but the market failed to reward the resiliency of its vertically integrated asset base, likely reflecting the MLP structure being out of favor. |
| Diversified | 28% | |
| Gathering/Processing | 19 | |
| Downstream/Other | 17 | |
| Petroleum Transportation & Storage | 15 | |
| Natural Gas Pipelines | 11 | |
| Electric, LDC & Power | 9 | |
| Upstream | 1 | |
| Total | 100% |
| 1 Year | 5 Years | Since inception | Inception date | |||||||
| Class A shares at NAV2 | -32.15 % | -8.72 % | -8.86 % | 9/9/15 | ||||||
| Class A shares at POP3,4 | -36.05 | -9.79 | -9.90 | 9/9/15 | ||||||
| Class C shares at NAV and with CDSC2,4 | -32.76 | -9.44 | -9.58 | 9/9/15 | ||||||
| Class I shares at NAV | -32.03 | -8.52 | -8.66 | 9/9/15 | ||||||
| Alerian MLP Index | -42.52 | -12.46 | -12.75 5 | — | ||||||
| Fund Expense Ratios6: A Shares: Gross 2.62%, Net 1.43%; C Shares: Gross 3.38%, Net 2.18%; I Shares: Gross 2.33%, Net 1.18%. | ||||||||||
| All returns represent past performance which is no guarantee of future results. Current performance may be higher or lower than the performance shown. The investment return and principal value of an investment will fluctuate so that an investor’s shares, when redeemed, may be worth more or less than their original cost. The above table and graph below do not reflect the deduction of taxes that a shareholder would pay on fund distributions or the redemption of shares. Please visit Virtus.com for performance data current to the most recent month-end. |

| 1 | Total returns are historical and include changes in share price and the reinvestment of both dividends and capital gain distributions. |
| 2 | “NAV” (Net Asset Value) total returns do not include the effect of any sales charge. |
| 3 | “POP” (Public Offering Price) total returns include the effect of the maximum front-end 5.75% sales charge. |
| 4 | “CDSC” (contingent deferred sales charge) is applied to redemptions of certain classes of shares that do not have a sales charge applied at the time of purchase. CDSC for certain redemptions of Class A shares made within 18 months of a finder’s fee being paid and all Class C shares are 1% within the first year and 0% thereafter. |
| 5 | The since inception index return is from the Fund’s inception date. |
| 6 | The expense ratios of the Fund are set forth according to the prospectus for the Fund effective February 28, 2020, as supplemented and revised, and may differ from the expense ratios disclosed in the Financial Highlights tables in this report. See the Financial Highlights for more current expense ratios. Net Expense: Expenses reduced by the contractual expense limitation in effect through February 28, 2021. Gross Expense: Does not reflect the effect of the expense limitation. Expense ratios reflect fees and expenses associated with any underlying funds. |
| Ticker Symbols: | |
| Class A : VLSAX | |
| Class C: VLSCX | |
| Class I: VLSIX | |
| Class R6: VLSRX |
Kayne Anderson Rudnick Investment Management, LLC
| ■ | The Fund is non-diversified and has an investment objective of seeking long-term capital appreciation. There is no guarantee that the Fund will meet its objective. |
| ■ | Stock market returns were mostly positive during the fiscal year. For the 12 months ended October 31, 2020, the S&P 500® Index advanced 9.71%, while small-capitalization stocks, as represented by the Russell 2000® Index, declined 0.14%. The Russell 3000® Index increased 10.15% during the period. International developed markets, as measured by the MSCI EAFE® Index (net), declined 6.86% while the MSCI Emerging Markets Index (net) gained 8.25%. |
| ■ | Equity investors enjoyed solid returns in the fourth quarter of 2019 and then went for a roller coaster ride in the first quarter of 2020, as markets around the world declined due to the COVID-19 pandemic, which necessitated an almost complete shutdown of economic activity. After a nosedive first quarter of 2020, the S&P 500® Index recovered in the following three months to have its best quarter in over 20 years, erasing most of the first-quarter loss. With aggressive stimulus from governments around the world flowing into the markets as a |
| ■ | The Fund meaningfully outperformed its benchmark, the Russell 3000® Index, on an absolute basis for the 12 months ended October 31, 2020. The long portfolio outpaced the return of the Russell 3000® Index, while the short portfolio, which profits when its holdings decline in value, also made a positive contribution to performance. |
| ■ | In the long portfolio, strong stock selection in industrials and information technology contributed meaningfully to performance. Poor stock selection and an underweight in consumer discretionary, as well as poor stock selection in real estate, detracted from performance. |
| ■ | In the short portfolio, strong stock selection in real estate and consumer discretionary contributed positively to performance. Poor stock selection in information technology and consumer staples detracted from performance. |
| ■ | The Trade Desk outperformed as growth returned to programmatic advertising in the most recent quarter, after the ad spending slowdown that followed the first COVID-19 wave. At about 25% of revenue, Connected Television (CTV) is The Trade Desk’s most important strategic focus at the moment, and one that could thrive under stay-at-home restrictions. The global TV ad market is at least $250 billion and CTV is estimated to be just 3% penetrated, with The Trade Desk named as the preferred provider by Disney and getting premium inventory from Amazon, Comcast, and Roku. |
| ■ | DocuSign had strong momentum in signing new |
| users for its contract management solutions. With COVID-19, the need to move to digital document management accelerated further. DocuSign also experienced accelerating growth for its e-signature solutions. | |
| ■ | Other top contributors included CoreLogic (long), Avalara (long), and POOLCORP (long). |
| ■ | Thor Industries manufactures and sells recreational vehicles (RVs). While Thor successfully weathered past recessions due to its variable cost structure, it entered the current recession with debt on its balance sheet. We decided to exit the position in the first quarter of 2020, and missed the subsequent rally in the stock as demand for RVs skyrocketed in the spring and summer travel seasons. The need for social distancing during the COVID-19 pandemic increased the appeal of traveling in an RV, driving Thor’s shares higher. |
| ■ | Endurance International specializes in web hosting and email marketing. The company’s stock price declined in the first quarter of 2020 as investors assessed the negative impact COVID-19 and shelter-in-place orders would have on the company. However, the stock rallied in the second quarter and remained on an upswing through the end of the fiscal year. COVID-19 has forced many businesses to invest more in digital advertising and communication to stay top-of-mind with consumers. As a result, Endurance reported positive customer count growth in 2020, after several years of declines. |
| ■ | Other top detractors included Lamar Advertising (long), Focus Financial Partners (short), and Century Communities (short). |
| Common Stocks | 110% | |
| Information Technology | 27% | |
| Industrials | 17 | |
| Communication Services | 15 | |
| Financials | 14 | |
| Consumer Staples | 11 | |
| Consumer Discretionary | 10 | |
| Health Care | 8 | |
| All other Common Stocks | 8 | |
| Short-Term Investment | 9 | |
| Securities Sold Short | (19) | |
| Industrials | (6) | |
| Real Estate | (2) | |
| Consumer Discretionary | (4) | |
| Information Technology | (2) | |
| Consumer Staples | (1) | |
| Financials | (4) | |
| Total | 100% |
| 1 Year | Since inception | Inception date | ||||||
| Class A shares at NAV2 | 30.01 % | 30.13 % | 12/6/18 | |||||
| Class A shares at POP3,4 | 22.54 | 26.13 | 12/6/18 | |||||
| Class C shares at NAV2 | 29.01 | 29.17 | 12/6/18 | |||||
| Class C shares at NAV and with CDSC4 | 29.01 | 29.17 | 12/6/18 | |||||
| Class I shares at NAV | 30.41 | 30.50 | 12/6/18 | |||||
| Class R6 shares at NAV | 30.39 | 30.54 | 12/6/18 | |||||
| Russell 3000® Index | 10.15 | 12.69 5 | — | |||||
| Fund Expense Ratios6: A Shares: Gross 4.20%, Net 2.34%; C Shares: Gross 4.95%, Net 3.09%; I Shares: Gross 4.04%, Net 2.09%, R6 Shares: Gross 3.94%, Net 2.02%. | ||||||||
| All returns represent past performance which is no guarantee of future results. Current performance may be higher or lower than the performance shown. The investment return and principal value of an investment will fluctuate so that an investor’s shares, when redeemed, may be worth more or less than their original cost. The above table and graph below do not reflect the deduction of taxes that a shareholder would pay on fund distributions or the redemption of shares. Please visit Virtus.com for performance data current to the most recent month-end. |

| 1 | Total returns are historical and include changes in share price and the reinvestment of both dividends and capital gain distributions. |
| 2 | “NAV” (Net Asset Value) total returns do not include the effect of any sales charge. |
| 3 | “POP” (Public Offering Price) total returns include the effect of the maximum front-end 5.75% sales charge. |
| 4 | “CDSC” (contingent deferred sales charge) is applied to redemptions of certain classes of shares that do not have a sales charge applied at the time of purchase. CDSC for certain redemptions of Class A shares made within 18 months of a finder’s fee being paid and all Class C shares are 1% within the first year and 0% thereafter. |
| 5 | The since inception index return is from the Fund’s inception date. |
| 6 | The expense ratios of the Fund are set forth according to the prospectus for the Fund effective February 28, 2020, as supplemented and revised, and may differ from the expense ratios disclosed in the Financial Highlights tables in this report. See the Financial Highlights for more current expense ratios. Net Expense: Expenses reduced by the contractual expense limitation in effect through February 28, 2021. Gross Expense: Does not reflect the effect of the expense limitation. Expense ratios reflect fees and expenses associated with any underlying funds. |
October 31, 2020
| Shares | Value | ||
| Common Stocks—36.8% | |||
| Communication Services—3.4% | |||
| Altice USA, Inc. Class A(1) | 3,177 | $ 86 | |
| Anterix, Inc.(1) | 284 | 9 | |
| Bandwidth, Inc. Class A(1) | 61 | 10 | |
| Cable One, Inc. | 6 | 10 | |
| Cargurus, Inc.(1) | 437 | 9 | |
| Charter Communications, Inc. Class A(1) | 566 | 342 | |
| Comcast Corp. Class A | 7,775 | 328 | |
| Elisa OYJ | 987 | 48 | |
| Infrastrutture Wireless Italiane SpA 144A(2) | 5,527 | 60 | |
| Liberty Broadband Corp. Class A(1) | 72 | 10 | |
| Liberty Broadband Corp. Class C(1) | 71 | 10 | |
| NetEase, Inc. ADR | 520 | 45 | |
| New York Times Co. (The) Class A | 242 | 9 | |
| Nintendo Co. Ltd. | 100 | 54 | |
| Scout24 AG 144A(2) | 677 | 55 | |
| Spotify Technology SA(1) | 42 | 10 | |
| Take-Two Interactive Software, Inc.(1) | 62 | 10 | |
| TechTarget, Inc.(1) | 250 | 11 | |
| Vodafone Group PLC | 89,096 | 119 | |
| Zynga, Inc. Class A(1) | 1,187 | 11 | |
| 1,246 | |||
| Consumer Discretionary—4.5% | |||
| Accor SA(1) | 106 | 3 | |
| Aptiv PLC | 900 | 87 | |
| Aramark | 122 | 3 | |
| Aristocrat Leisure Ltd. | 317 | 6 | |
| Burlington Stores, Inc.(1) | 328 | 63 | |
| Carnival Corp. | 277 | 4 | |
| Carnival PLC | 9,817 | 108 | |
| Chegg, Inc.(1) | 151 | 11 | |
| Chipotle Mexican Grill, Inc.(1) | 22 | 26 | |
| Cie Generale des Etablissements Michelin SCA | 704 | 76 | |
| Columbia Sportswear Co. | 116 | 9 | |
| Compass Group PLC | 1,072 | 15 | |
| Crown Resorts Ltd. | 242 | 1 | |
| Darden Restaurants, Inc. | 68 | 6 | |
| Deckers Outdoor Corp.(1) | 48 | 12 | |
| Delivery Hero SE 144A(1)(2) | 537 | 62 | |
| Domino’s Pizza, Inc. | 24 | 9 | |
| Dorman Products, Inc.(1) | 124 | 11 | |
| EssilorLuxottica SA(1) | 474 | 59 | |
| Evolution Gaming Group AB 144A(2) | 59 | 4 | |
| Ferrari NV | 323 | 58 | |
| Flutter Entertainment PLC | 481 | 84 | |
| Galaxy Entertainment Group Ltd. Class L | 1,340 | 9 | |
| Garmin Ltd. | 109 | 11 | |
| Gentex Corp. | 408 | 11 | |
| Shares | Value | ||
| Consumer Discretionary—continued | |||
| Genting Singapore Ltd. | 3,600 | $ 2 | |
| Grand Canyon Education, Inc.(1) | 123 | 10 | |
| GVC Holdings PLC(1) | 290 | 4 | |
| Hilton Worldwide Holdings, Inc. | 156 | 14 | |
| InterContinental Hotels Group PLC(1) | 92 | 5 | |
| Just Eat Takeaway.com NV 144A(1)(2) | 531 | 59 | |
| Kering SA | 89 | 54 | |
| La Francaise des Jeux SAEM 144A(2) | 47 | 2 | |
| Las Vegas Sands Corp. | 203 | 10 | |
| Lululemon Athletica, Inc.(1) | 33 | 10 | |
| LVMH Moet Hennessy Louis Vuitton SE | 129 | 60 | |
| Marriott International, Inc. Class A | 158 | 15 | |
| McDonald’s Corp. | 413 | 88 | |
| McDonald’s Holdings Co. Japan Ltd. | 100 | 5 | |
| Melco Resorts & Entertainment Ltd. | 136 | 2 | |
| MGM Resorts International | 271 | 6 | |
| Oriental Land Co. Ltd | 100 | 14 | |
| Peugeot SA(1) | 10,074 | 181 | |
| Pool Corp. | 34 | 12 | |
| Prosus NV | 650 | 65 | |
| Restaurant Brands International, Inc. | 163 | 8 | |
| Royal Caribbean Cruises Ltd. | 104 | 6 | |
| Sands China Ltd. | 1,609 | 6 | |
| SJM Holdings Ltd. | 1,417 | 1 | |
| Sodexo SA | 52 | 3 | |
| Starbucks Corp. | 648 | 56 | |
| Tabcorp Holdings Ltd. | 1,251 | 3 | |
| Tiffany & Co. | 89 | 12 | |
| Toyota Motor Corp. | 1,200 | 79 | |
| Tractor Supply Co. | 73 | 10 | |
| Vail Resorts, Inc. | 22 | 5 | |
| Volkswagen AG | 509 | 74 | |
| Wingstop, Inc. | 72 | 8 | |
| Winmark Corp. | 66 | 11 | |
| Wynn Macau Ltd.(1) | 1,051 | 1 | |
| Wynn Resorts Ltd. | 57 | 4 | |
| Yum China Holdings, Inc. | 202 | 11 | |
| Yum! Brands, Inc. | 161 | 15 | |
| 1,679 | |||
| Consumer Staples—2.4% | |||
| Beiersdorf AG | 535 | 56 | |
| BellRing Brands, Inc. Class A(1) | 539 | 10 | |
| Boston Beer Co., Inc. (The) Class A(1) | 11 | 11 | |
| Brown-Forman Corp. Class A | 151 | 10 | |
| Brown-Forman Corp. Class B | 136 | 10 | |
| Shares | Value | ||
| Consumer Staples—continued | |||
| Calavo Growers, Inc. | 154 | $ 10 | |
| Cal-Maine Foods, Inc.(1) | 267 | 10 | |
| Carrefour SA | 7,531 | 117 | |
| Church & Dwight Co., Inc. | 113 | 10 | |
| Clorox Co. (The) | 49 | 10 | |
| Constellation Brands, Inc. Class A | 354 | 59 | |
| Danone SA | 916 | 51 | |
| Flowers Foods, Inc. | 439 | 10 | |
| Freshpet, Inc.(1) | 96 | 11 | |
| Heineken NV | 665 | 59 | |
| Henkel AG & Co. KGaA | 574 | 56 | |
| Hershey Co. (The) | 75 | 10 | |
| Hormel Foods Corp. | 212 | 10 | |
| J&J Snack Foods Corp. | 82 | 11 | |
| John B Sanfilippo & Son, Inc. | 139 | 10 | |
| Kerry Group PLC Class A | 450 | 54 | |
| Lancaster Colony Corp. | 58 | 10 | |
| L’Oreal SA | 184 | 60 | |
| McCormick & Co., Inc. | 54 | 10 | |
| National Beverage Corp.(1) | 142 | 11 | |
| Pernod Ricard SA | 372 | 60 | |
| Remy Cointreau SA | 334 | 56 | |
| Sanderson Farms, Inc. | 88 | 11 | |
| Tootsie Roll Industries, Inc. | 348 | 10 | |
| Unilever NV | 996 | 56 | |
| WD-40 Co. | 53 | 13 | |
| 892 | |||
| Energy—0.9% | |||
| BP PLC | 38,975 | 99 | |
| Koninklijke Vopak NV | 1,012 | 53 | |
| Reliance Industries Ltd. | 2,193 | 61 | |
| TOTAL SE | 3,372 | 101 | |
| 314 | |||
| Financials—2.7% | |||
| Aon PLC Class A | 430 | 79 | |
| Arch Capital Group Ltd.(1) | 2,130 | 64 | |
| AXA SA | 1,722 | 28 | |
| Banco Santander SA(1) | 84,064 | 168 | |
| Brown & Brown, Inc. | 645 | 28 | |
| Credicorp Ltd. | 364 | 42 | |
| Gallagher (Arthur J.) & Co. | 852 | 88 | |
| Marsh & McLennan Cos., Inc. | 765 | 79 | |
| Societe Generale SA(1) | 11,461 | 155 | |
| Standard Chartered PLC(1) | 6,603 | 30 | |
| UniCredit SpA(1) | 18,834 | 141 | |
| Willis Towers Watson PLC | 422 | 77 | |
| 979 | |||
| Health Care—4.8% | |||
| 10X Genomics, Inc. Class A(1) | 84 | 11 | |
| ABIOMED, Inc.(1) | 38 | 10 | |
| ACADIA Pharmaceuticals, Inc.(1) | 252 | 12 | |
| Acceleron Pharma, Inc. (1) | 94 | 10 | |
| Shares | Value | ||
| Health Care—continued | |||
| Agilent Technologies, Inc. | 105 | $ 11 | |
| Agios Pharmaceuticals, Inc.(1) | 282 | 11 | |
| Alexion Pharmaceuticals, Inc.(1) | 90 | 10 | |
| Allakos, Inc.(1) | 130 | 12 | |
| Allogene Therapeutics, Inc.(1) | 287 | 10 | |
| Alnylam Pharmaceuticals, Inc.(1) | 77 | 9 | |
| Amedisys, Inc.(1) | 44 | 11 | |
| Arena Pharmaceuticals, Inc.(1) | 140 | 12 | |
| Argenx SE(1) | 244 | 61 | |
| AtriCure, Inc.(1) | 265 | 9 | |
| Atrion Corp. | 16 | 10 | |
| Axonics Modulation Technologies, Inc.(1) | 235 | 11 | |
| BioMerieux | 392 | 58 | |
| Bio-Rad Laboratories, Inc. Class A(1) | 20 | 12 | |
| Bio-Techne Corp. | 42 | 11 | |
| Cardiovascular Systems, Inc.(1) | 293 | 10 | |
| Carl Zeiss Meditec AG | 502 | 65 | |
| Cerner Corp. | 150 | 10 | |
| Chemed Corp. | 21 | 10 | |
| ChemoCentryx, Inc.(1) | 195 | 9 | |
| Codexis, Inc.(1) | 862 | 11 | |
| Cooper Cos., Inc. (The) | 30 | 10 | |
| Corcept Therapeutics, Inc.(1) | 579 | 10 | |
| CryoPort, Inc.(1) | 226 | 9 | |
| Deciphera Pharmaceuticals, Inc.(1) | 198 | 11 | |
| DiaSorin SpA | 298 | 65 | |
| Eagle Pharmaceuticals Inc.(1) | 259 | 12 | |
| Eidos Therapeutics, Inc.(1) | 228 | 16 | |
| Enanta Pharmaceuticals, Inc.(1) | 232 | 10 | |
| Exelixis, Inc.(1) | 403 | 8 | |
| Global Blood Therapeutics, Inc.(1) | 193 | 10 | |
| Globus Medical, Inc. Class A(1) | 205 | 11 | |
| Guardant Health, Inc.(1) | 96 | 10 | |
| Haemonetics Corp.(1) | 122 | 12 | |
| Halozyme Therapeutics, Inc.(1) | 388 | 11 | |
| HMS Holdings Corp.(1) | 428 | 11 | |
| ICU Medical, Inc.(1) | 55 | 10 | |
| IDEXX Laboratories, Inc.(1) | 28 | 12 | |
| Immunovant, Inc.(1) | 289 | 13 | |
| Incyte Corp.(1) | 119 | 10 | |
| Inspire Medical Systems, Inc.(1) | 81 | 10 | |
| Insulet Corp.(1) | 45 | 10 | |
| Ionis Pharmaceuticals, Inc.(1) | 203 | 10 | |
| iRhythm Technologies, Inc.(1) | 46 | 10 | |
| Karuna Therapeutics, Inc.(1) | 130 | 11 | |
| Shares | Value | ||
| Health Care—continued | |||
| Kodiak Sciences, Inc.(1) | 197 | $ 18 | |
| Koninklijke Philips NV(1) | 1,310 | 61 | |
| Krystal Biotech, Inc.(1) | 238 | 10 | |
| Kura Oncology, Inc.(1) | 354 | 11 | |
| LeMaitre Vascular, Inc. | 318 | 10 | |
| LHC Group, Inc.(1) | 51 | 11 | |
| Livongo Health, Inc.(1) | 75 | 10 | |
| Luminex Corp. | 418 | 9 | |
| Madrigal Pharmaceuticals, Inc.(1) | 83 | 11 | |
| Masimo Corp.(1) | 47 | 11 | |
| Merck & Co., Inc. | 796 | 60 | |
| Mesa Laboratories, Inc. | 44 | 11 | |
| Mettler-Toledo International, Inc.(1) | 10 | 10 | |
| Mirati Therapeutics, Inc.(1) | 63 | 14 | |
| MyoKardia, Inc.(1) | 78 | 17 | |
| Neogen Corp.(1) | 131 | 9 | |
| Neurocrine Biosciences, Inc.(1) | 103 | 10 | |
| Nevro Corp.(1) | 71 | 11 | |
| Novocure Ltd.(1) | 99 | 12 | |
| Orion Oyj Class B | 1,289 | 55 | |
| OrthoPediatrics Corp.(1) | 242 | 11 | |
| Penumbra, Inc.(1) | 51 | 13 | |
| PerkinElmer, Inc. | 86 | 11 | |
| QIAGEN NV(1) | 1,178 | 56 | |
| QIAGEN NV(1) | 205 | 10 | |
| Relmada Therapeutics, Inc.(1) | 275 | 8 | |
| Repligen Corp.(1) | 72 | 12 | |
| ResMed, Inc. | 60 | 12 | |
| Rhythm Pharmaceuticals, Inc.(1) | 395 | 8 | |
| Sanofi | 594 | 54 | |
| Sarepta Therapeutics, Inc.(1) | 70 | 10 | |
| Sartorius AG | 148 | 63 | |
| Sartorius Stedim Biotech | 176 | 67 | |
| Seagen, Inc.(1) | 57 | 9 | |
| Shockwave Medical, Inc.(1) | 147 | 10 | |
| Silk Road Medical, Inc.(1) | 149 | 9 | |
| Simulations Plus, Inc. | 160 | 10 | |
| STAAR Surgical Co.(1) | 187 | 14 | |
| STERIS PLC | 61 | 11 | |
| Stoke Therapeutics, Inc.(1) | 301 | 12 | |
| Tactile Systems Technology, Inc.(1) | 316 | 12 | |
| Tandem Diabetes Care, Inc.(1) | 95 | 10 | |
| Teladoc Health, Inc.(1) | 48 | 9 | |
| Teleflex, Inc. | 31 | 10 | |
| Thermo Fisher Scientific, Inc. | 166 | 79 | |
| Turning Point Therapeutics, Inc.(1) | 122 | 11 | |
| UCB SA | 526 | 52 | |
| United Therapeutics Corp.(1) | 101 | 14 | |
| Varian Medical Systems, Inc.(1) | 60 | 10 | |
| Veeva Systems, Inc. Class A(1) | 38 | 10 | |
| Shares | Value | ||
| Health Care—continued | |||
| Veracyte, Inc.(1) | 327 | $ 11 | |
| Viking Therapeutics, Inc.(1) | 1,548 | 9 | |
| Waters Corp.(1) | 53 | 12 | |
| West Pharmaceutical Services, Inc. | 37 | 10 | |
| Wright Medical Group NV(1) | 362 | 11 | |
| Y-mAbs Therapeutics, Inc.(1) | 270 | 12 | |
| 1,791 | |||
| Industrials—7.9% | |||
| A.O. Smith Corp. | 196 | 10 | |
| AAON, Inc. | 181 | 11 | |
| Acuity Brands Inc. | 152 | 14 | |
| AeroVironment, Inc.(1) | 164 | 13 | |
| Air China Ltd. Class H | 11,612 | 8 | |
| Allegion PLC | 1,412 | 139 | |
| AMETEK, Inc. | 106 | 10 | |
| ANA Holdings, Inc.(1) | 1,700 | 37 | |
| Assa Abloy AB Class B | 5,936 | 127 | |
| Bouygues SA | 3,183 | 104 | |
| Brady Corp. Class A | 263 | 10 | |
| C.H. Robinson Worldwide, Inc. | 101 | 9 | |
| Carrier Global Corp. | 1,229 | 41 | |
| China Southern Airlines Co. Ltd. Class H(1) | 14,000 | 7 | |
| Cie de Saint-Gobain(1) | 1,129 | 44 | |
| Cintas Corp. | 32 | 10 | |
| Copart, Inc.(1) | 754 | 83 | |
| CoStar Group, Inc.(1) | 12 | 10 | |
| CSW Industrials, Inc. | 138 | 12 | |
| Daikin Industries Ltd. | 500 | 94 | |
| Delta Air Lines, Inc. | 3,506 | 107 | |
| Deutsche Lufthansa AG(1) | 2,385 | 20 | |
| Donaldson Co., Inc. | 221 | 11 | |
| easyJet PLC | 1,716 | 11 | |
| Encore Wire Corp. | 225 | 10 | |
| Equifax, Inc. | 747 | 102 | |
| Experian PLC | 3,319 | 121 | |
| Exponent, Inc. | 140 | 10 | |
| Fastenal Co. | 230 | 10 | |
| Graco, Inc. | 171 | 11 | |
| Heartland Express, Inc. | 559 | 10 | |
| HEICO Corp. | 96 | 10 | |
| HEICO Corp. Class A | 115 | 11 | |
| Hubbell, Inc. | 335 | 49 | |
| IDEX Corp. | 57 | 10 | |
| IHS Markit Ltd. | 131 | 11 | |
| Japan Airlines Co. Ltd.(1) | 2,700 | 47 | |
| JetBlue Airways Corp.(1) | 1,257 | 15 | |
| Johnson Controls International PLC | 892 | 38 | |
| Kingspan Group PLC(1) | 190 | 17 | |
| Kingspan Group PLC(1) | 693 | 60 | |
| Knorr-Bremse AG | 509 | 59 | |
| Kone OYJ Class B | 1,753 | 140 | |
| Landstar System, Inc. | 81 | 10 | |
| Legrand SA | 765 | 57 | |
| Lennox International, Inc. | 171 | 46 | |
| Lincoln Electric Holdings, Inc. | 116 | 12 | |
| Shares | Value | ||
| Industrials—continued | |||
| Mercury Systems, Inc.(1) | 134 | $ 9 | |
| MSC Industrial Direct Co., Inc. Class A | 166 | 12 | |
| National Presto Industries, Inc. | 124 | 10 | |
| Nordson Corp. | 55 | 11 | |
| Old Dominion Freight Line, Inc. | 57 | 11 | |
| Otis Worldwide Corp. | 2,015 | 123 | |
| Proto Labs, Inc.(1) | 77 | 9 | |
| Raven Industries, Inc. | 472 | 10 | |
| Republic Services, Inc. | 109 | 10 | |
| Robert Half International, Inc. | 196 | 10 | |
| Rollins, Inc. | 195 | 11 | |
| Ryanair Holdings PLC(1) | 2,635 | 36 | |
| Safran SA(1)(3)(4) | 246 | 26 | |
| Schindler Holding AG | 343 | 88 | |
| Schneider Electric SE | 898 | 109 | |
| Schneider National, Inc. Class B | 412 | 9 | |
| Signify NV 144A(1)(2) | 884 | 31 | |
| Simpson Manufacturing Co., Inc. | 109 | 10 | |
| Singapore Airlines Ltd. | 3,000 | 7 | |
| Southwest Airlines Co. | 1,829 | 72 | |
| Teledyne Technologies, Inc.(1) | 33 | 10 | |
| Teleperformance | 200 | 60 | |
| Toro Co. (The) | 124 | 10 | |
| Trane Technologies PLC | 921 | 122 | |
| TransUnion | 1,345 | 107 | |
| Trex Co., Inc.(1) | 151 | 11 | |
| UniFirst Corp. | 56 | 9 | |
| Union Pacific Corp. | 355 | 63 | |
| Verisk Analytics, Inc. | 57 | 10 | |
| Vicor Corp.(1) | 133 | 10 | |
| Watsco, Inc. | 200 | 45 | |
| Wolters Kluwer NV | 702 | 57 | |
| 2,936 | |||
| Information Technology—6.7% | |||
| Acacia Communications, Inc.(1) | 153 | 10 | |
| Adyen NV 144A(1)(2) | 32 | 54 | |
| Akamai Technologies, Inc.(1) | 92 | 9 | |
| Alarm.com Holdings, Inc.(1) | 186 | 11 | |
| Ambarella, Inc.(1) | 204 | 11 | |
| Amdocs Ltd. | 178 | 10 | |
| Amphenol Corp. Class A | 99 | 11 | |
| ANSYS, Inc.(1) | 32 | 10 | |
| Appfolio, Inc. Class A(1) | 72 | 10 | |
| Arista Networks, Inc.(1) | 52 | 11 | |
| ASML Holding NV | 164 | 60 | |
| Aspen Technology, Inc.(1) | 79 | 9 | |
| Avalara, Inc.(1) | 83 | 12 | |
| Badger Meter, Inc. | 161 | 12 | |
| Black Knight, Inc.(1) | 120 | 11 | |
| Blackline, Inc.(1) | 119 | 12 | |
| Shares | Value | ||
| Information Technology—continued | |||
| Booz Allen Hamilton Holding Corp. | 118 | $ 9 | |
| Broadcom, Inc. | 320 | 112 | |
| Broadridge Financial Solutions, Inc. | 78 | 11 | |
| Cadence Design Systems, Inc.(1) | 100 | 11 | |
| Capgemini SE | 270 | 31 | |
| Citrix Systems, Inc. | 75 | 9 | |
| Cloudflare, Inc. Class A(1) | 259 | 13 | |
| Cognex Corp. | 166 | 11 | |
| Crowdstrike Holdings, Inc. Class A(1) | 72 | 9 | |
| Dassault Systemes SE | 319 | 54 | |
| Datadog, Inc. Class A(1) | 111 | 10 | |
| DocuSign, Inc.(1) | 49 | 10 | |
| Dolby Laboratories, Inc. Class A | 156 | 12 | |
| DSP Group, Inc.(1) | 797 | 11 | |
| EPAM Systems, Inc.(1) | 32 | 10 | |
| F5 Networks, Inc.(1) | 86 | 11 | |
| Fair Isaac Corp.(1) | 24 | 9 | |
| Fastly, Inc. Class A(1) | 109 | 7 | |
| Fitbit, Inc. Class A(1) | 1,608 | 11 | |
| Five9, Inc.(1) | 82 | 12 | |
| Guidewire Software, Inc.(1) | 97 | 9 | |
| Infineon Technologies AG | 4,504 | 125 | |
| Jack Henry & Associates, Inc. | 63 | 9 | |
| LiveRamp Holdings, Inc.(1) | 198 | 13 | |
| Lumentum Holdings, Inc.(1) | 1,129 | 93 | |
| Manhattan Associates, Inc.(1) | 107 | 9 | |
| Maxim Integrated Products, Inc. | 157 | 11 | |
| MAXIMUS, Inc. | 150 | 10 | |
| Micron Technology, Inc.(1) | 3,612 | 182 | |
| Mitek Systems, Inc.(1) | 824 | 10 | |
| Monolithic Power Systems, Inc. | 40 | 13 | |
| Murata Manufacturing Co. Ltd. | 2,400 | 168 | |
| National Instruments Corp. | 296 | 9 | |
| Nemetschek SE | 799 | 58 | |
| NIC, Inc. | 509 | 11 | |
| Okta, Inc.(1) | 49 | 10 | |
| Pegasystems, Inc. | 85 | 10 | |
| Power Integrations, Inc. | 196 | 12 | |
| PTC, Inc.(1) | 120 | 10 | |
| Qorvo, Inc.(1) | 797 | 102 | |
| QUALCOMM, Inc. | 923 | 114 | |
| Qualys, Inc.(1) | 106 | 9 | |
| RingCentral, Inc. Class A(1) | 38 | 10 | |
| Samsung Electronics Co. Ltd. | 3,618 | 182 | |
| SAP SE | 380 | 41 | |
| SK Hynix, Inc. | 2,586 | 183 | |
| Skyworks Solutions, Inc. | 792 | 112 | |
| Smartsheet, Inc. Class A(1) | 214 | 11 | |
| SPS Commerce, Inc.(1) | 139 | 12 | |
| Synopsys, Inc.(1) | 50 | 11 | |
| Shares | Value | ||
| Information Technology—continued | |||
| Teradyne, Inc. | 135 | $ 12 | |
| Twilio Inc. Class A(1) | 43 | 12 | |
| Tyler Technologies, Inc.(1) | 30 | 12 | |
| Universal Display Corp. | 60 | 12 | |
| Varonis Systems, Inc.(1) | 89 | 10 | |
| VeriSign, Inc.(1) | 50 | 10 | |
| VirnetX Holding Corp. | 2,016 | 11 | |
| Visa, Inc. Class A | 346 | 63 | |
| Win Semiconductors Corp. | 10,000 | 109 | |
| Xilinx, Inc. | 103 | 12 | |
| Zscaler, Inc.(1) | 75 | 10 | |
| 2,468 | |||
| Materials—3.2% | |||
| Air Liquide SA | 370 | 54 | |
| Akzo Nobel NV | 599 | 58 | |
| Albemarle Corp. | 921 | 86 | |
| Anglo American PLC | 5,958 | 140 | |
| AptarGroup, Inc. | 90 | 10 | |
| ArcelorMittal SA(1) | 10,045 | 136 | |
| Balchem Corp. | 108 | 11 | |
| BHP Group PLC | 5,297 | 102 | |
| Fuchs Petrolub SE | 1,246 | 64 | |
| Glencore PLC(1) | 34,837 | 70 | |
| Johnson Matthey PLC | 4,086 | 114 | |
| Koninklijke DSM NV | 372 | 60 | |
| LG Chem Ltd. | 129 | 70 | |
| NewMarket Corp. | 29 | 10 | |
| Novagold Resources, Inc.(1) | 910 | 9 | |
| Royal Gold, Inc. | 84 | 10 | |
| Symrise AG | 429 | 53 | |
| Umicore SA | 1,710 | 66 | |
| UPM-Kymmene OYJ | 1,929 | 55 | |
| 1,178 | |||
| Real Estate—0.3% | |||
| Alexandria Real Estate Equities, Inc. | 402 | 61 | |
| Rexford Industrial Realty, Inc. | 1,435 | 66 | |
| 127 | |||
| Total Common Stocks (Identified Cost $12,740) | 13,610 | ||
| Exchange-Traded Fund—4.1% | |||
| Invesco DB Gold Fund | 27,646 | 1,518 | |
| Total Exchange-Traded Fund (Identified Cost $1,532) | 1,518 | ||
| Shares | Value | ||
| Purchased Options—1.5% | |||
| (See open purchased options schedule) | |||
| Total Purchased Options (Premiums paid $952) | $ 560 | ||
| Total Long-Term Investments—42.4% (Identified Cost $15,224) | 15,688 | ||
| Short-Term Investment—35.4% | |||
| Money Market Mutual Fund—35.4% | |||
| Dreyfus Government Cash Management Fund - Institutional Shares (seven-day effective yield 0.021%)(5) | 13,102,582 | 13,103 | |
| Total Short-Term Investment (Identified Cost $13,103) | 13,103 | ||
| TOTAL INVESTMENTS, BEFORE WRITTEN OPTIONS—77.8% (Identified Cost $28,327) | 28,791 | ||
| Written Options—(2.0)% | |||
| (See open written options schedule) | |||
| Total Written Options (Premiums received $809) | (750) | ||
| TOTAL INVESTMENTS, NET OF WRITTEN OPTIONS—75.8% (Identified Cost $27,518) | $28,041 | ||
| Other assets and liabilities, net—24.2% | 8,931 | ||
| NET ASSETS—100.0% | $36,972 | ||
| Abbreviations: | |
| ADR | American Depositary Receipt |
| LIBOR | London Interbank Offered Rate |
| PLC | Public Limited Company |
| QTR | Quarterly |
| TERM | Payment Frequency at Termination |
| Footnote Legend: | |
| (1) | Non-income producing. |
| (2) | Security exempt from registration under Rule 144A of the Securities Act of 1933. These securities may be resold in transactions exempt from registration, normally to qualified institutional buyers. At October 31, 2020, these securities amounted to a value of $327 or 0.9% of net assets. |
| (3) | Security valued at fair value as determined in good faith by or under the direction of the Trustees. |
| (4) | Restricted security. |
| (5) | Shares of this fund are publicly offered, and its prospectus and annual report are publicly available. |
| Counterparties: | |
| BNP | BNP Paribas |
| CITI | Citibank |
| GS | Goldman Sachs & Co. |
| JPM | JPMorgan Chase Bank N.A. |
| ML | Merrill Lynch |
| Soc Gen | Societe Generale |
| Foreign Currencies: | |
| AUD | Australian Dollar |
| CHF | Swiss Franc |
| CNY | Chinese Yuan |
| EUR | Euro |
| GBP | United Kingdom Pound Sterling |
| INR | Indian Rupee |
| JPY | Japanese Yen |
| KRW | South Korean Won |
| MXN | Mexican Peso |
| SEK | Swedish Krona |
| SGD | Singapore Dollar |
| TWD | Taiwan Dollar |
| USD | United States Dollar |
| Country Weightings (Unaudited)† | |
| United States | 72% |
| France | 6 |
| Germany | 3 |
| Netherlands | 3 |
| United Kingdom | 3 |
| Ireland | 3 |
| Japan | 2 |
| Other | 8 |
| Total | 100% |
| † % of total investments, net of written options, as of October 31, 2020. | |
| Open purchased option contracts as of October 31, 2020 were as follows: | ||||||
| Description of Options | Counterparty | Number of Contracts | Contract Notional Amount | Strike Price(1) | Expiration Date | Value |
| Call Options | ||||||
| Euro Stoxx 50® Index | JPM | 12 | $ 390 | $ 3,250.00 | 12/18/20 | $ 3 |
| FTSE 100 Index | JPM | 60 | 3,720 | 6,200.00 | 12/18/20 | 14 |
| Euro Stoxx Banks | JPM | 926 | 2,778 | 60.00 | 12/18/20 | 70 |
| Swiss Market Index | JPM | 10 | 1,040 | 10,400.00 | 12/18/20 | 4 |
| Swiss Market Index | JPM | 3 | 315 | 10,500.00 | 12/18/20 | 1 |
| Russell 2000® Index | JPM | 16 | 2,720 | 1,700.00 | 01/15/21 | 43 |
| Russell 2000® Index | JPM | 4 | 620 | 1,550.00 | 11/20/20 | 19 |
| FTSE 100 Index | JPM | 12 | 750 | 6,250.00 | 11/20/20 | 1 |
| Euro Stoxx Banks | JPM | 686 | 2,315 | 67.50 | 12/18/20 | 14 |
| Euro Stoxx 50® Index | JPM | 28 | 959 | 3,425.00 | 11/20/20 | — (2) |
| Euro Stoxx 50® Index | JPM | 12 | 390 | 3,250.00 | 01/15/21 | 4 |
| Euro Stoxx Banks | JPM | 926 | 2,778 | 60.00 | 11/20/20 | 32 |
| Euro Stoxx Banks | JPM | 116 | 435 | 75.00 | 11/20/20 | — (2) |
| Swiss Market Index | JPM | 4 | 412 | 10,300.00 | 11/20/20 | 1 |
| Euro Stoxx Banks | JPM | 116 | 450 | 77.50 | 12/18/20 | — (2) |
| Euro Stoxx Banks | JPM | 33 | 89 | 54.00 | 12/18/20 | 7 |
| Swiss Market Index | JPM | 3 | 312 | 10,400.00 | 01/15/21 | 2 |
| Put Options | ||||||
| Euro Stoxx 50® Index | JPM | 50 | 1,500 | 3,000.00 | 12/18/20 | 86 |
| S&P 500® Index | JPM | 3 | 1,005 | 3,350.00 | 12/18/20 | 57 |
| S&P 500® Index | JPM | 3 | 1,020 | 3,400.00 | 11/20/20 | 51 |
| MSCI Emerging Markets Index | JPM | 3 | 324 | 1,080.00 | 12/18/20 | 10 |
| Euro Stoxx 50® Index | JPM | 38 | 988 | 2,600.00 | 11/20/20 | 7 |
| Euro Stoxx 50® Index | JPM | 39 | 985 | 2,525.00 | 12/18/20 | 14 |
| S&P 500® Index | JPM | 3 | 1,038 | 3,460.00 | 01/15/21 | 81 |
| MSCI Emerging Markets Index | JPM | 3 | 324 | 1,080.00 | 11/20/20 | 7 |
| S&P 500® Index | JPM | 4 | 1,070 | 2,675.00 | 11/13/20 | 3 |
| S&P 500® Index | JPM | 4 | 1,110 | 2,775.00 | 11/27/20 | 9 |
| MSCI Emerging Markets Index | JPM | 3 | 339 | 1,130.00 | 01/15/21 | 20 |
| Total | $ 560 | |||||
| Footnote Legend: | |
| (1) | Strike price not reported in thousands. |
| (2) | Amount is less than $500. |
| Open written option contracts as of October 31, 2020 were as follows: | ||||||
| Description of Options | Counterparty | Number of Contracts | Contract Notional Amount | Strike Price(1) | Expiration Date | Value |
| Call Options | ||||||
| Euro Stoxx 50® Index | JPM | 12 | $ 420 | $ 3,500.00 | 01/15/21 | $ (1) |
| Euro Stoxx 50® Index | JPM | 12 | 420 | 3,500.00 | 12/18/20 | (—) (2) |
| FTSE 100 Index | JPM | 60 | 3,780 | 6,300.00 | 12/18/20 | (8) |
| Swiss Market Index | JPM | 3 | 330 | 11,000.00 | 12/18/20 | (—) (2) |
| DJ Euro Stoxx Banks | JPM | 686 | 2,401 | 70.00 | 12/18/20 | (10) |
| MSCI Emerging Markets Index | JPM | 3 | 354 | 1,180.00 | 12/18/20 | (4) |
| Russell 2000® Index | JPM | 16 | 2,800 | 1,750.00 | 01/15/21 | (23) |
| Russell 2000® Index | JPM | 4 | 660 | 1,650.00 | 11/20/20 | (6) |
| DJ Euro Stoxx Banks | JPM | 845 | 2,640 | 62.50 | 12/18/20 | (44) |
| S&P 500® Index | JPM | 4 | 1,428 | 3,570.00 | 11/20/20 | (2) |
| MSCI Emerging Markets Index | JPM | 3 | 351 | 1,170.00 | 11/20/20 | (2) |
| DJ Euro Stoxx Banks | JPM | 926 | 2,894 | 62.50 | 11/20/20 | (19) |
| Swiss Market Index | JPM | 4 | 428 | 10,700.00 | 11/20/20 | (—) (2) |
| S&P 500® Index | JPM | 4 | 1,480 | 3,700.00 | 11/13/20 | (—) (2) |
| MSCI Emerging Markets Index | JPM | 3 | 366 | 1,220.00 | 01/15/21 | (3) |
| Swiss Market Index | JPM | 3 | 324 | 10,800.00 | 01/15/21 | (1) |
| Put Options | ||||||
| Euro Stoxx 50® Index | JPM | 62 | 1,736 | 2,800.00 | 12/18/20 | (56) |
| FTSE 100 Index | JPM | 5 | 298 | 5,950.00 | 12/18/20 | (29) |
| Swiss Market Index | JPM | 10 | 1,040 | 10,400.00 | 12/18/20 | (98) |
| S&P 500® Index | JPM | 3 | 945 | 3,150.00 | 12/18/20 | (32) |
| Swiss Market Index | JPM | 2 | 194 | 9,700.00 | 12/18/20 | (9) |
| S&P 500® Index | JPM | 3 | 960 | 3,200.00 | 11/20/20 | (25) |
| Russell 2000® Index | JPM | 4 | 608 | 1,520.00 | 01/15/21 | (38) |
| Russell 2000® Index | JPM | 2 | 310 | 1,550.00 | 11/20/20 | (13) |
| DJ Euro Stoxx Banks | JPM | 116 | 319 | 55.00 | 12/18/20 | (30) |
| FTSE 100 Index | JPM | 6 | 339 | 5,650.00 | 11/20/20 | (15) |
| Euro Stoxx 50® Index | JPM | 14 | 441 | 3,150.00 | 11/20/20 | (34) |
| MSCI Emerging Markets Index | JPM | 3 | 294 | 980.00 | 12/18/20 | (4) |
| DJ Euro Stoxx Banks | JPM | 179 | 559 | 62.50 | 12/18/20 | (104) |
| S&P 500® Index | JPM | 3 | 978 | 3,260.00 | 01/15/21 | (55) |
| Euro Stoxx 50® Index | JPM | 12 | 360 | 3,000.00 | 01/15/21 | (24) |
| MSCI Emerging Markets Index | JPM | 3 | 297 | 990.00 | 11/20/20 | (2) |
| DJ Euro Stoxx Banks | JPM | 116 | 319 | 55.00 | 11/20/20 | (23) |
| Swiss Market Index | JPM | 2 | 192 | 9,600.00 | 11/20/20 | (6) |
| DJ Euro Stoxx Banks | JPM | 33 | 89 | 54.00 | 12/18/20 | (7) |
| MSCI Emerging Markets Index | JPM | 3 | 324 | 1,080.00 | 01/15/21 | (13) |
| Swiss Market Index | JPM | 2 | 194 | 9,700.00 | 01/15/21 | (10) |
| Total | $(750) | |||||
| Footnote Legend: | |
| (1) | Strike price not reported in thousands. |
| (2) | Amount is less than $500. |
| Futures contracts as of October 31, 2020 were as follows: | ||||
| Issue | Expiration | Contracts Purchased/(Sold) | Notional Value | Value/Unrealized Appreciation (Depreciation) |
| TOPIX Index Future | December 2020 | (7) | $ (1,052) | $ 15 |
| Euro Stoxx 50® Future | December 2020 | (28) | (965) | 96 |
| MSCI All Country World Index Future | December 2020 | (39) | (1,091) | 33 |
| MSCI Emerging Markets Index Future | December 2020 | 19 | 1,047 | 14 |
| MSCI World Index Future | December 2020 | (31) | (2,116) | 91 |
| MSCI World Industrials Future | December 2020 | 5 | 381 | (25) |
| MSCI World Industrials Future | December 2020 | (10) | (367) | 13 |
| Russell 2000® Future | December 2020 | (34) | (2,612) | (83) |
| S&P 500® Index E-Mini Future | December 2020 | 13 | 2,122 | (42) |
| Stoxx ® Europe Mid 600 Index Future | December 2020 | (87) | (1,731) | 139 |
| 10 Year U.S. Treasury Note Future | December 2020 | 131 | 18,107 | (121) |
| S&P 500® Annual Dividend Index Future | December 2021 | 15 | 195 | 10 |
| S&P 500® Annual Dividend Index Future | December 2022 | 15 | 190 | 1 |
| Total | $ 141 | |||
| Forward foreign currency exchange contracts as of October 31, 2020 were as follows: | ||||||||
| Currency Purchased | Value (1) | Currency Sold | Value (1) | Counterparty | Settlement Date | Unrealized Appreciation | Unrealized (Depreciation) | |
| AUD (2) | 722 | USD | 529 | CITI | 11/12/20 | $ — | $(21) | |
| AUD (2) | 479 | USD | 345 | JPM | 11/12/20 | — | (8) | |
| AUD (2) | 83 | USD | 60 | ML | 11/12/20 | — | (2) | |
| EUR (2) | 371 | USD | 439 | BNP | 11/12/20 | — | (7) | |
| EUR (2) | 505 | USD | 600 | CITI | 11/12/20 | — | (11) | |
| EUR (2) | 1,956 | USD | 2,309 | JPM | 11/12/20 | — | (30) | |
| EUR (2) | 422 | USD | 501 | Soc Gen | 11/12/20 | — | (8) | |
| GBP (2) | 92 | USD | 122 | Soc Gen | 11/12/20 | — | (3) | |
| JPY (2) | 407,567 | USD | 3,859 | JPM | 11/12/20 | 35 | — | |
| KRW (2) | 543,094 | USD | 461 | CITI | 11/12/20 | 17 | — | |
| MXN (2) | 33,490 | USD | 1,544 | ML | 01/14/21 | 22 | — | |
| SGD (2) | 627 | USD | 461 | CITI | 11/12/20 | — | (2) | |
| SGD (2) | 312 | USD | 228 | JPM | 11/12/20 | — (3) | — | |
| SGD (2) | 158 | USD | 115 | ML | 11/12/20 | 1 | — | |
| SGD (2) | 154 | USD | 113 | Soc Gen | 11/12/20 | — | (—) (3) | |
| TWD (2) | 13,470 | USD | 468 | GS | 12/11/20 | 3 | — | |
| USD (2) | 922 | AUD | 1,285 | ML | 11/12/20 | 19 | — | |
| USD (2) | 90 | CHF | 82 | JPM | 11/12/20 | — (3) | — | |
| USD (2) | 327 | EUR | 276 | BNP | 11/12/20 | 5 | — | |
| USD (2) | 125 | EUR | 106 | GS | 11/12/20 | 2 | — | |
| USD (2) | 1,692 | EUR | 1,434 | JPM | 11/12/20 | 21 | — | |
| USD (2) | 169 | EUR | 143 | ML | 11/12/20 | 3 | — | |
| USD (2) | 41 | GBP | 31 | BNP | 11/12/20 | — (3) | — | |
| USD (2) | 1,112 | GBP | 850 | JPM | 11/12/20 | 11 | — | |
| USD (2) | 48 | INR | 3,639 | BNP | 11/12/20 | — | (1) | |
| USD (2) | 100 | JPY | 10,461 | CITI | 11/12/20 | — | (—) (3) | |
| USD (2) | 375 | JPY | 39,603 | JPM | 11/12/20 | — | (4) | |
| USD (2) | 211 | KRW | 242,697 | CITI | 11/12/20 | — | (3) | |
| USD (2) | 636 | KRW | 756,094 | ML | 11/12/20 | — | (31) | |
| USD (2) | 64 | KRW | 76,075 | Soc Gen | 11/12/20 | — | (3) | |
| USD (2) | 90 | SEK | 784 | JPM | 11/12/20 | 2 | — | |
| USD (2) | 910 | SGD | 1,250 | JPM | 11/12/20 | — | (5) | |
| USD (2) | 105 | TWD | 3,064 | BNP | 11/12/20 | — | (2) | |
| USD (2) | 463 | TWD | 13,470 | BNP | 12/11/20 | — | (8) | |
| USD (2) | 3,148 | EUR | 2,664 | CITI | 01/20/21 | 39 | — | |
| Total | $180 | $(149) | ||||||
| Footnote Legend: | |
| (1) | Reported in thousands. |
| (2) | Non deliverable forward. See Note 3b. |
| (3) | Amount is less than $500. |
| Centrally Cleared credit default swaps - sell protection(1) outstanding as of October 31, 2020 was as follows: | |||||||||||||
| Reference Entity | Payment Frequency | Counterparty | Fixed Rate | Expiration Date | Notional Amount(2) | Value | Premiums Paid (Received) | Unrealized Appreciation | Unrealized (Depreciation) | ||||
| iTraxx Europe | QTR | JPM | 5.000% | 12/20/25 | 4,304 | EUR | $332 | $405 | $— | $(73) | |||
| CDX North American High Yield Index | QTR | JPM | 5.000% | 12/20/25 | 5,469 | USD | 222 | 241 | — | (19) | |||
| Total | $554 | $646 | $— | $(92) | |||||||||
| Footnote Legend: | |
| (1) | If the Fund is a seller of protection and a credit event occurs, as defined under the terms of that particular swap agreement, the Fund will either (i) pay to the buyer of protection an amount equal to the notional amount of the swap and take delivery of the referenced obligation or underlying investments comprising the referenced index or (ii) pay a net settlement amount in the form of cash or investments equal to the notional amount of the swap less the recovery value of the referenced obligation or underlying investments comprising the referenced index. |
| (2) | The maximum potential amount the Fund could be required to pay as a seller of credit protection or receive as a buyer of credit protection if a credit event occurs as defined under the terms of that particular swap agreement. |
| Centrally cleared inflation swaps outstanding as of October 31, 2020 were as follows: | |||||||||||||
| Fixed Rate | Floating Rate | Payment Frequency | Counterparty | Expiration Date | Notional Amount | Value | Premiums Paid (Received) | Unrealized Appreciation | Unrealized Depreciation | ||||
| 1.807% (1) | 1-Month-USCPI | TERM | JPM | 07/28/50 | 145 | USD | $17 | $— | $17 | $— | |||
| 1.828% (1) | 1-Month-USCPI | TERM | JPM | 07/28/50 | 144 | USD | 16 | — | 16 | — | |||
| 1.810% (1) | 1-Month-USCPI | TERM | JPM | 07/29/50 | 144 | USD | 16 | — | 16 | — | |||
| 2.087% (1) | 1-Month-USCPI | TERM | JPM | 10/26/50 | 525 | USD | (2) | — | — | (2) | |||
| Total | $47 | $— | $49 | $ (2) | |||||||||
| Footnote Legend: | |
| (1) | Fund pays the fixed rate and receives the floating rate. |
| Centrally cleared interest rate swaps outstanding as of October 31, 2020 were as follows: | |||||||||||||
| Fixed Rate | Floating Rate | Payment Frequency | Counterparty | Expiration Date | Notional Amount | Value | Premiums Paid (Received) | Unrealized Appreciation | Unrealized Depreciation | ||||
| 2.880% (1) | China Fixing Repo Rates 7 Days | TERM | JPM | 12/16/25 | 13,044 | CNY | $25 | $— | $25 | $— | |||
| 2.883% (1) | China Fixing Repo Rates 7 Days | TERM | JPM | 12/16/25 | 15,361 | CNY | 29 | — | 29 | — | |||
| 2.875% (1) | China Fixing Repo Rates 7 Days | TERM | JPM | 12/16/25 | 9,492 | CNY | 18 | — | 18 | — | |||
| 2.825% (1) | China Fixing Repo Rates 7 Days | TERM | JPM | 12/16/25 | 15,576 | CNY | 24 | — | 24 | — | |||
| Total | $96 | $— | $96 | $— | |||||||||
| Footnote Legend: | |
| (1) | Fund pays the floating rate and receives the fixed rate. |
| Over-the-counter variance swaps outstanding as of October 31, 2020 were as follows: | |||||||||||||
| Referenced Entity | Strike Price | Payment Frequency | Counterparty | Expiration Date | Notional Amount | Value | Premiums Paid (Received) | Unrealized Appreciation | Unrealized Depreciation | ||||
| S&P 500® Composite Stock Price Index(1) | $29.70 | TERM | GS | 06/18/21 | 41 | USD | $(150) | $— | $— | $(150) | |||
| S&P 500® Composite Stock Price Index(2) | 29.70 | TERM | GS | 01/15/21 | 16 | USD | 78 | — | 78 | — | |||
| Total | $ (72) | $— | $78 | $(150) | |||||||||
| Footnote Legend: | |
| (1) | Fund pays the fixed strike price and receives the variance payment. |
| (2) | Fund pays the variance payment and receives the fixed strike price. |
| Over-the-counter total return swaps outstanding as of October 31, 2020 were as follows: | |||||||||||||
| Referenced Entity | Floating Rate(1) | Payment Frequency | Counterparty | Expiration Date | Notional Amount | Value | Premiums Paid (Received) | Unrealized Appreciation | Unrealized Depreciation | ||||
| CenturyLink, Inc. | 1-Month LIBOR | Monthly | Soc Gen | 01/13/21 | 33 | USD | $ 13 | $— | $ 13 | $ — | |||
| Walt Disney Co. | 1-Month LIBOR | Monthly | Soc Gen | 01/13/21 | 38 | USD | 6 | — | 6 | — | |||
| Fox Corp. | 1-Month LIBOR | Monthly | Soc Gen | 01/13/21 | 36 | USD | 11 | — | 11 | — | |||
| Netflix, Inc. | 1-Month LIBOR | Monthly | Soc Gen | 01/13/21 | 39 | USD | (16) | — | — | (16) | |||
| AT&T, Inc. | 1-Month LIBOR | Monthly | Soc Gen | 01/13/21 | 73 | USD | 21 | — | 21 | — | |||
| Verizon Communications, Inc. | 1-Month LIBOR | Monthly | Soc Gen | 01/13/21 | 76 | USD | 2 | — | 2 | — | |||
| ViacomCBS, Inc. | 1-Month LIBOR | Monthly | Soc Gen | 01/13/21 | 37 | USD | 11 | — | 11 | — | |||
| Discovery, Inc. | 1-Month LIBOR | Monthly | Soc Gen | 01/13/21 | 36 | USD | 14 | — | 14 | — | |||
| MSCI EMU Net Total Return EUR Index | 1-Month LIBOR | Monthly | ML | 07/13/21 | 1,234 | EUR | 116 | — | 116 | — | |||
| MSCI EMU Net Total Return EUR Index | 1-Month LIBOR | Monthly | ML | 07/13/21 | 226 | EUR | 21 | — | 21 | — | |||
| MSCI World Industrials Net Total Return USD Index | 1-Month LIBOR | Monthly | Soc Gen | 09/10/21 | 749 | USD | 44 | — | 44 | — | |||
| MSCI EMU Net Total Return EUR Index | 1-Month LIBOR | Monthly | ML | 07/13/21 | 413 | EUR | 39 | — | 39 | — | |||
| CenturyLink, Inc. | 1-Month LIBOR | Monthly | ML | 01/13/21 | 39 | USD | 5 | — | 5 | — | |||
| AT&T, Inc. | 1-Month LIBOR | Monthly | ML | 01/13/21 | 97 | USD | 3 | — | 3 | — | |||
| Discovery, Inc. | 1-Month LIBOR | Monthly | ML | 01/13/21 | 50 | USD | 2 | — | 2 | — | |||
| Fox Corp. | 1-Month LIBOR | Monthly | ML | 01/13/21 | 48 | USD | 1 | — | 1 | — | |||
| ViacomCBS, Inc. | 1-Month LIBOR | Monthly | ML | 01/13/21 | 49 | USD | 1 | — | 1 | — | |||
| Verizon Communications, Inc. | 1-Month LIBOR | Monthly | ML | 01/13/21 | 75 | USD | 1 | — | 1 | — | |||
| Discovery, Inc. | 1-Month LIBOR | Monthly | ML | 01/13/21 | 42 | USD | 2 | — | 2 | — | |||
| Netflix, Inc. | 1-Month LIBOR | Monthly | ML | 01/13/21 | 14 | USD | — (2) | — | — (2) | — | |||
| Total | $ 297 | $— | $ 313 | $(16) | |||||||||
| Footnote Legend: | |
| (1) | The Fund pays the floating rate (+/- a spread) and receives the total return of the reference entity. |
| (2) | Amount is less than $500. |
| Total Value at October 31, 2020 | Level 1 Quoted Prices | Level 2 Significant Observable Inputs | |||
| Assets: | |||||
| Equity Securities: | |||||
| Common Stocks | $13,610 | $12,420 | $1,190 | ||
| Exchange-Traded Fund | 1,518 | 1,518 | — | ||
| Money Market Mutual Fund | 13,103 | 13,103 | — | ||
| Other Financial Instruments: | |||||
| Purchased Options | 560 | 399 | 161 | ||
| Futures Contracts | 412 | 412 | — | ||
| Forward Foreign Currency Exchange Contracts | 180 | — | 180 | ||
| Centrally Cleared Inflation Swaps | 49 | — | 49 | ||
| Centrally Cleared Interest Rate Swaps | 96 | — | 96 | ||
| Over-the-Counter Total Return Swaps | 313 | — | 313 | ||
| Over-the-Counter Variance swaps | 78 | — | 78 | ||
| Centrally Cleared Credit Default Swap | 554 | — | 554 | ||
| Total Assets | 30,473 | 27,852 | 2,621 | ||
| Liabilities: | |||||
| Other Financial Instruments: | |||||
| Written Options | (750) | (723) | (27) | ||
| Futures Contracts | (271) | (271) | — | ||
| Forward Foreign Currency Exchange Contracts | (149) | — | (149) | ||
| Centrally Cleared Inflation Swaps | (2) | — | (2) | ||
| Over-the-Counter Variance swaps | (150) | — | (150) | ||
| Over-the-Counter Total Return Swaps | (16) | — | (16) | ||
| Total Liabilities | (1,338) | (994) | (344) | ||
| Total Investments | $29,135 | $26,858 | $2,277 |
October 31, 2020
| Shares | Value | ||
| Common Stocks & MLP Interests—99.2% | |||
| Diversified—27.9% | |||
| Energy Transfer LP | 34,219 | $ 176 | |
| Enterprise Products Partners LP | 17,285 | 286 | |
| Keyera Corp. | 9,120 | 129 | |
| Kinder Morgan, Inc. | 20,640 | 246 | |
| MPLX LP | 10,321 | 178 | |
| ONEOK, Inc. | 6,085 | 177 | |
| Pembina Pipeline Corp. | 6,440 | 135 | |
| 1,327 | |||
| Downstream/Other—16.5% | |||
| Cheniere Energy, Inc.(1) | 8,217 | 393 | |
| Enviva Partners LP | 1,500 | 64 | |
| GasLog Ltd. | 15,840 | 38 | |
| Golar LNG Ltd.(1) | 10,340 | 78 | |
| Marathon Petroleum Corp. | 3,750 | 111 | |
| Phillips 66 | 2,150 | 100 | |
| 784 | |||
| Electric, LDC & Power—9.1% | |||
| CenterPoint Energy, Inc. | 6,000 | 127 | |
| NextEra Energy Partners LP | 2,510 | 158 | |
| Sempra Energy | 1,200 | 150 | |
| 435 | |||
| Gathering/Processing—18.8% | |||
| DCP Midstream LP | 5,600 | 72 | |
| Enable Midstream Partners LP | 11,500 | 51 | |
| Equitrans Midstream Corp. | 19,000 | 138 | |
| Hess Midstream LP Class A | 11,590 | 198 | |
| Rattler Midstream LP | 19,870 | 117 | |
| Shares | Value | ||
| Gathering/Processing—continued | |||
| Targa Resources Corp. | 19,900 | $ 319 | |
| 895 | |||
| Natural Gas Pipelines—11.2% | |||
| TC Energy Corp. | 4,850 | 191 | |
| Williams Cos., Inc. (The) | 17,970 | 345 | |
| 536 | |||
| Petroleum Transportation & Storage—14.4% | |||
| Enbridge, Inc. | 5,500 | 152 | |
| Genesis Energy LP | 13,565 | 57 | |
| Magellan Midstream Partners LP | 5,770 | 205 | |
| Phillips 66 Partners LP | 2,000 | 47 | |
| Plains GP Holdings LP Class A | 35,434 | 226 | |
| 687 | |||
| Upstream—1.3% | |||
| EQT Corp. | 4,000 | 60 | |
| Total Common Stocks & MLP Interests (Identified Cost $6,487) | 4,724 | ||
| Total Long-Term Investments—99.2% (Identified Cost $6,487) | 4,724 | ||
| TOTAL INVESTMENTS—99.2% (Identified Cost $6,487) | $4,724 | ||
| Other assets and liabilities, net—0.8% | 36 | ||
| NET ASSETS—100.0% | $4,760 | ||
| Abbreviations: | |
| LP | Limited Partnership |
| MLP | Master Limited Partnership |
| Footnote Legend: | |
| (1) | Non-income producing. |
| Country Weightings (Unaudited)† | |
| United States | 84% |
| Canada | 13 |
| Bermuda | 3 |
| Total | 100% |
| † % of total investments as of October 31, 2020. | |
| Ownership Structure (Unaudited)†,†† | |
| Major Midstream Companies | 32% |
| Embedded General Partner | 23 |
| Midstream MLP | 23 |
| MLP Affiliates & Other | 22 |
| Total | 100% |
| † % of total investments as of October 31, 2020. | |
| Total Value at October 31, 2020 | Level 1 Quoted Prices | ||
| Assets: | |||
| Equity Securities: | |||
| Common Stocks & MLP Interests | $4,724 | $4,724 | |
| Total Investments | $4,724 | $4,724 |
October 31, 2020
| Shares | Value | ||
| Common Stocks—90.9% | |||
| Communication Services—12.7% | |||
| Alphabet, Inc. Class C(1)(2) | 2,746 | $ 4,452 | |
| Auto Trader Group plc | 366,248 | 2,747 | |
| MediaAlpha, Inc. Class A(1) | 205,819 | 6,963 | |
| 14,162 | |||
| Consumer Discretionary—8.2% | |||
| Home Depot, Inc. (The) | 12,551 | 3,348 | |
| Pool Corp. | 10,711 | 3,747 | |
| Trip.com Group Ltd. ADR(1) | 70,102 | 2,016 | |
| 9,111 | |||
| Consumer Staples—9.5% | |||
| Grocery Outlet Holding Corp.(1) | 72,177 | 3,177 | |
| Lamb Weston Holdings, Inc. | 81,123 | 5,147 | |
| Monster Beverage Corp.(1) | 29,383 | 2,250 | |
| 10,574 | |||
| Financials—11.7% | |||
| Berkley (W.R.) Corp. | 49,100 | 2,952 | |
| Moelis & Co. Class A | 64,359 | 2,394 | |
| Moody’s Corp. | 10,326 | 2,714 | |
| Primerica, Inc.(2) | 45,816 | 5,051 | |
| 13,111 | |||
| Health Care—6.3% | |||
| Mettler-Toledo International, Inc.(1) | 2,355 | 2,350 | |
| Silk Road Medical, Inc.(1) | 26,956 | 1,634 | |
| Zoetis, Inc. | 19,363 | 3,070 | |
| 7,054 | |||
| Industrials—13.8% | |||
| CoreLogic, Inc. | 46,891 | 3,607 | |
| Lennox International, Inc. | 13,026 | 3,539 | |
| Old Dominion Freight Line, Inc. | 13,409 | 2,553 | |
| TransUnion | 35,257 | 2,808 | |
| Verisk Analytics, Inc.(2) | 16,356 | 2,911 | |
| 15,418 | |||
| Information Technology—22.2% | |||
| Avalara, Inc.(1) | 16,633 | 2,479 | |
| CDW Corp.(2) | 26,919 | 3,301 | |
| DocuSign, Inc.(1) | 13,593 | 2,749 | |
| Duck Creek Technologies, Inc.(1) | 49,114 | 2,130 | |
| Intuit, Inc.(2) | 9,413 | 2,962 | |
| Jack Henry & Associates, Inc.(2) | 14,983 | 2,221 | |
| nCino, Inc.(1) | 26,801 | 1,890 | |
| Shares | Value | ||
| Information Technology—continued | |||
| Trade Desk, Inc. (The) Class A(1) | 6,298 | $ 3,568 | |
| Visa, Inc. Class A | 19,202 | 3,489 | |
| 24,789 | |||
| Materials—2.9% | |||
| Scotts Miracle-Gro Co. (The) | 21,878 | 3,283 | |
| Real Estate—3.6% | |||
| Lamar Advertising Co. Class A | 64,335 | 3,986 | |
| Total Common Stocks (Identified Cost $80,659) | 101,488 | ||
| Total Long-Term Investments—90.9% (Identified Cost $80,659) | 101,488 | ||
| Short-Term Investment—7.3% | |||
| Money Market Mutual Fund—7.3% | |||
| Dreyfus Government Cash Management Fund - Institutional Shares (seven-day effective yield 0.021%)(3) | 8,127,540 | 8,127 | |
| Total Short-Term Investment (Identified Cost $8,127) | 8,127 | ||
| TOTAL INVESTMENTS, BEFORE SECURITIES SOLD SHORT—98.2% (Identified Cost $88,786) | 109,615 | ||
| Securities Sold Short(4)—(15.9)% | |||
| Consumer Discretionary—(3.7)% | |||
| Beazer Homes USA, Inc.(5) | (29,289) | (357) | |
| Century Communities, Inc.(5) | (41,175) | (1,599) | |
| H&R Block, Inc. | (78,664) | (1,358) | |
| ODP Corp. (The) | (43,849) | (855) | |
| (4,169) | |||
| Consumer Staples—(0.7)% | |||
| Flowers Foods, Inc. | (34,281) | (808) | |
| Financials—(3.3)% | |||
| Focus Financial Partners, Inc. Class A(5) | (37,248) | (1,360) | |
| LendingClub Corp.(5) | (85,838) | (401) | |
| Third Point Reinsurance, Ltd.(5) | (117,482) | (914) | |
| Shares | Value | ||
| Financials—continued | |||
| Waddell & Reed Financial, Inc. Class A | (63,408) | $ (973) | |
| (3,648) | |||
| Industrials—(5.1)% | |||
| ACCO Brands Corp. | (150,008) | (791) | |
| Allison Transmission Holdings, Inc. | (29,911) | (1,081) | |
| ArcBest Corp. | (15,355) | (469) | |
| Deluxe Corp. | (22,327) | (479) | |
| Herc Holdings, Inc.(5) | (29,989) | (1,330) | |
| Textainer Group Holdings Ltd.(5) | (88,235) | (1,276) | |
| Werner Enterprises, Inc. | (6,747) | (256) | |
| (5,682) | |||
| Information Technology—(1.7)% | |||
| Endurance International Group Holdings, Inc.(5) | (322,003) | (1,871) | |
| Real Estate—(1.4)% | |||
| Paramount Group, Inc. | (109,810) | (635) | |
| Regency Centers Corp. | (15,894) | (565) | |
| Retail Opportunity Investments Corp. | (32,481) | (316) | |
| (1,516) | |||
| Total Securities Sold Short (Proceeds $(16,770)) | (17,694) | ||
| TOTAL INVESTMENTS, NET OF SECURITIES SOLD SHORT—82.3% (Identified Cost $72,016) | $ 91,921 | ||
| Other assets and liabilities, net—17.7% | 19,744 | ||
| NET ASSETS—100.0% | $111,665 | ||
| Abbreviation: | |
| ADR | American Depositary Receipt |
| Footnote Legend: | |
| (1) | Non-income producing. |
| (2) | All or portion segregated as collateral for securities sold short. |
| (3) | Shares of this fund are publicly offered, and its prospectus and annual report are publicly available. |
| (4) | The Fund is contractually responsible to the lender for any dividends payable and interest accrued on securities while those securities are in a short position. These dividends and interest are recorded as an expense of the Fund. |
| (5) | No dividend expense on security sold short. |
| Total Value at October 31, 2020 | Level 1 Quoted Prices | ||
| Assets: | |||
| Equity Securities: | |||
| Common Stocks | $101,488 | $101,488 | |
| Money Market Mutual Fund | 8,127 | 8,127 | |
| Total Assets | 109,615 | 109,615 | |
| Liabilities: | |||
| Equity Securities: | |||
| Common Stocks | (17,694) | (17,694) | |
| Total Liabilities | (17,694) | (17,694) | |
| Total Investments | $ 91,921 | $ 91,921 |
October 31, 2020
| Aviva Multi-Strategy Target Return Fund | Duff & Phelps Select MLP and Energy Fund | KAR Long/Short Equity Fund | |||
| Assets | |||||
Investment in securities at value(1) | $28,791 | $ 4,724 | $109,615 | ||
Foreign currency at value(2) | — | — | — | ||
Cash | 2,727 | 11 | — (a) | ||
Cash pledged as collateral for futures | 918 | — | — | ||
Deposits with prime broker | 4,420 | — | 16,481 | ||
Margin due from counterparty on cleared swaps | 595 | — | — | ||
Variation margin receivable on futures contracts | 9 | — | — | ||
Swaps at value(3) | 1,090 | — | — | ||
Unrealized appreciation on forward foreign currency exchange contracts | 180 | — | — | ||
| Receivables | |||||
Investment securities sold | 2 | — | 2,091 | ||
Fund shares sold | — (a) | 1 | 1,338 | ||
Receivable from adviser | — | 5 | — | ||
Dividends and interest | 3 | 35 | 4 | ||
Tax reclaims | 8 | — | — | ||
Securities lending income | — | — | 1 | ||
Prepaid Trustees’ retainer | 1 | — (a) | 1 | ||
Prepaid expenses | 21 | 18 | 39 | ||
Other assets | 3 | — (a) | 9 | ||
Total assets | 38,768 | 4,794 | 129,579 | ||
| Liabilities | |||||
Foreign currency, at value | 35 | — | — (a) | ||
Written options at value(4) | 750 | — | — | ||
Securities sold short(5) | — | — | 17,694 | ||
Swaps at value(3) | 168 | — | — | ||
Unrealized depreciation on forward foreign currency exchange contracts | 149 | — | — | ||
| Payables | |||||
Fund shares repurchased | 571 | — | 7 | ||
Investment securities purchased | — | — | 12 | ||
Dividend distributions | — | — | 16 | ||
Investment advisory fees | 20 | — | 100 | ||
Distribution and service fees | 1 | — (a) | 1 | ||
Administration and accounting fees | 4 | 1 | 10 | ||
Transfer agent and sub-transfer agent fees and expenses | 4 | — (a) | 20 | ||
Professional fees | 66 | 32 | 29 | ||
Trustee deferred compensation plan | 3 | — (a) | 9 | ||
Interest expense and/or commitment fees | — (a) | — (a) | — | ||
Other accrued expenses | 25 | 1 | 16 | ||
Total liabilities | 1,796 | 34 | 17,914 | ||
Net Assets | $36,972 | $ 4,760 | $111,665 | ||
| Net Assets Consist of: | |||||
Capital paid in on shares of beneficial interest | $38,847 | $ 8,299 | $ 90,755 | ||
Accumulated earnings (loss) | (1,875) | (3,539) | 20,910 | ||
Net Assets | $36,972 | $ 4,760 | $111,665 | ||
| Aviva Multi-Strategy Target Return Fund | Duff & Phelps Select MLP and Energy Fund | KAR Long/Short Equity Fund | |||
| Net Assets: | |||||
Class A | $ 1,755 | $ 317 | $ 1,210 | ||
Class C | $ 626 | $ 79 | $ 504 | ||
Class I | $ 34,482 | $ 4,364 | $ 109,819 | ||
Class R6 | $ 109 | $ — | $ 132 | ||
| Shares Outstanding (unlimited number of shares authorized, no par value): | |||||
Class A | 183,568 | 61,212 | 73,593 | ||
Class C | 67,126 | 15,319 | 31,069 | ||
Class I | 3,586,497 | 855,486 | 6,644,945 | ||
Class R6 | 11,333 | — | 7,962 | ||
| Net Asset Value and Redemption Price Per Share:(b) | |||||
Class A | $ 9.56 | $ 5.19 | $ 16.44 | ||
Class C | $ 9.33 | $ 5.12 | $ 16.21 | ||
Class I | $ 9.61 | $ 5.10 | $ 16.53 | ||
Class R6 | $ 9.63 | $ — | $ 16.54 | ||
| Maximum Offering Price per Share (NAV/(1-Maximum Sales Charge)): | |||||
Class A | $ 10.14 | $ 5.51 | $ 17.44 | ||
Maximum Sales Charge - Class A | 5.75% | 5.75% | 5.75% | ||
(1) Investment in securities at cost | $ 28,327 | $ 6,487 | $ 88,786 | ||
(2) Foreign currency at cost | $ (35) | $ — | $ —(a) | ||
(3) Includes premiums paid (received) on centrally cleared credit default swaps | $ 646 | $ — | $ — | ||
(4) Written options premiums received | $ 809 | $ — | $ — | ||
(5) Securities sold short proceeds | $ — | $ — | $ 16,770 |
| (b) | Net asset values are calculated using unrounded net assets. |
| (a) | Amount is less than $500. |
YEAR ENDED October 31, 2020
| Aviva Multi-Strategy Target Return Fund | Duff & Phelps Select MLP and Energy Fund | KAR Long/Short Equity Fund | |||
| Investment Income | |||||
Dividends | $ 314 | $ 373 | $ 672 | ||
Less: return of capital distributions | — | (241) | — | ||
Interest | 36 | 1 | — | ||
Securities lending, net of fees | — | — | 1 | ||
Foreign taxes withheld | (13) | (6) | — | ||
Total investment income | 337 | 127 | 673 | ||
| Expenses | |||||
Investment advisory fees | 481 | 47 | 817 | ||
Distribution and service fees, Class A | 4 | 1 | 1 | ||
Distribution and service fees, Class C | 8 | 1 | 3 | ||
Administration and accounting fees | 46 | 13 | 76 | ||
Transfer agent fees and expenses | 17 | 3 | 28 | ||
Sub-transfer agent fees and expenses, Class A | 1 | — (1) | — (1) | ||
Sub-transfer agent fees and expenses, Class C | — (1) | — (1) | — (1) | ||
Sub-transfer agent fees and expenses, Class I | 13 | — (1) | 84 | ||
Custodian fees | 9 | 1 | — (1) | ||
Printing fees and expenses | 19 | 3 | 35 | ||
Professional fees | 84 | 33 | 29 | ||
Interest expense and/or commitment fees | — (1) | — (1) | — | ||
Registration fees | 60 | 44 | 79 | ||
Trustees’ fees and expenses | 3 | — (1) | 4 | ||
Miscellaneous expenses | 7 | 2 | 5 | ||
Total expenses | 752 | 148 | 1,161 | ||
Dividend expense and interest expense on securities sold short | — | — | 343 | ||
Total expenses, including dividend and interest expense on securities sold short | 752 | 148 | 1,504 | ||
Less net expenses reimbursed and/or waived by investment adviser(2) | (207) | (86) | (145) | ||
Net expenses | 545 | 62 | 1,359 | ||
Net investment income (loss) | (208) | 65 | (686) | ||
| Aviva Multi-Strategy Target Return Fund | Duff & Phelps Select MLP and Energy Fund | KAR Long/Short Equity Fund | |||
| Net Realized and Unrealized Gain (Loss) on Investments | |||||
| Net realized gain (loss) from: | |||||
Investments | $(156) | $(1,153) | $ 1,697 | ||
Foreign currency transactions | (47) | — (1) | (2) | ||
Forward foreign currency transactions | (853) | — | — | ||
Written options | (313) | — | — | ||
Futures | 728 | — | — | ||
Swaps | (966) | — | — | ||
Net increase from payment by affiliate | 17 (3) | — | — | ||
| Net change in unrealized appreciation (depreciation) on: | |||||
Investments | 276 | (1,316) | 19,449 | ||
Securities sold short | — | — | (1,017) | ||
Foreign currency transactions | — (1) | — (1) | — | ||
Forward foreign currency transactions | 169 | — | — | ||
Written options | 70 | — | — | ||
Futures | 23 | — | — | ||
Swaps | 495 | — | — | ||
Net realized and unrealized gain (loss) on investments | (557) | (2,469) | 20,127 | ||
Net increase (decrease) in net assets resulting from operations | $(765) | $(2,404) | $19,441 |
| (1) | Amount is less than $500. |
| (2) | See Note 4D in the Notes to Financial Statements. |
| (3) | See Note 4G in the Notes to Financial Statements. |
| Aviva Multi-Strategy Target Return Fund | Duff & Phelps Select MLP and Energy Fund | ||||||
| Year Ended October 31, 2020 | Year Ended October 31, 2019 | Year Ended October 31, 2020 | Year Ended October 31, 2019 | ||||
| Increase (Decrease) in Net Assets Resulting from Operations | |||||||
Net investment income (loss) | $ (208) | $ 495 | $ 65 | $ 67 | |||
Net realized gain (loss) | (1,607) | (1,481) | (1,153) | (425) | |||
Net increase from payment by affiliate | 17 (1) | — | — | — | |||
Net change in unrealized appreciation (depreciation) | 1,033 | 1,657 | (1,316) | (328) | |||
Increase (decrease) in net assets resulting from operations | (765) | 671 | (2,404) | (686) | |||
| Dividends and Distributions to Shareholders | |||||||
| Net Investment Income and Net Realized Gains: | |||||||
Class A | — | (50) | — | (24) | |||
Class C | — | (19) | — | (3) | |||
Class I | (52) | (1,589) | — | (139) | |||
Class R6 | (—) (2) | (3) | — | — | |||
| Return of Capital: | |||||||
Class A | — | — | (17) | (32) | |||
Class C | — | — | (4) | (5) | |||
Class I | — | — | (288) | (188) | |||
Total Dividends and Distributions to Shareholders | (52) | (1,661) | (309) | (391) | |||
| Change in Net Assets from Capital Transactions (See Note 6): | |||||||
Class A | 247 | (1,004) | 195 | 474 | |||
Class C | (324) | (630) | (3) | 3 | |||
Class I | 963 | (39,524) | 2,453 | (25) | |||
Class R6 | 7 | — (2) | — | — | |||
Increase (decrease) in net assets from capital transactions | 893 | (41,158) | 2,645 | 452 | |||
Net increase (decrease) in net assets | 76 | (42,148) | (68) | (625) | |||
| Net Assets | |||||||
Beginning of period | 36,896 | 79,044 | 4,828 | 5,453 | |||
End of Period | $ 36,972 | $ 36,896 | $ 4,760 | $ 4,828 | |||
| (1) | See Note 4G in the Notes to Financial Statements. |
| (2) | Amount is less than $500. |
| KAR Long/Short Equity Fund | |||
| Year Ended October 31, 2020 | From Inception December 06, 2018 to October 31, 2019 | ||
| Increase (Decrease) in Net Assets Resulting from Operations | |||
Net investment income (loss) | $ (686) | $ (72) | |
Net realized gain (loss) | 1,695 | 197 | |
Net change in unrealized appreciation (depreciation) | 18,432 | 1,474 | |
Increase (decrease) in net assets resulting from operations | 19,441 | 1,599 | |
| Dividends and Distributions to Shareholders | |||
| Net Investment Income and Net Realized Gains: | |||
Class A | (1) | — | |
Class C | (1) | — | |
Class I | (115) | — | |
Class R6 | (13) | — | |
Total Dividends and Distributions to Shareholders | (130) | — | |
| Change in Net Assets from Capital Transactions (See Note 6): | |||
Class A | 974 | 107 | |
Class C | 311 | 109 | |
Class I | 73,555 | 17,007 | |
Class R6 | (4,008) | 2,700 | |
Increase (decrease) in net assets from capital transactions | 70,832 | 19,923 | |
Net increase (decrease) in net assets | 90,143 | 21,522 | |
| Net Assets | |||
Beginning of period | 21,522 | — | |
End of Period | $ 111,665 | $ 21,522 | |
THROUGHOUT EACH PERIOD
| Net Asset Value, Beginning of Period | Net Investment Income (Loss)(1) | Net Realized and Unrealized Gain (Loss) | Total from Investment Operations | Dividends from Net Investment Income | Return of Capital | Distributions from Net Realized Gains | Total Distributions | Change in Net Asset Value | Net Asset Value, End of Period | Total Return (2)(3) | Net Assets, End of Period (in thousands) | Ratio of Net Expenses to Average Net Assets (including dividend and interest expense on securities sold short)(4) | Ratio of Gross Expenses to Average Net Assets(4) | Ratio of Net Investment Income (Loss) to Average Net Assets(4) | Portfolio Turnover Rate(2) | ||
| Aviva Multi-Strategy Target Return Fund | |||||||||||||||||
| Class A | |||||||||||||||||
| 11/1/19 to 10/31/20 | $ 9.75 | (0.08) | (0.11) | (0.19) | — | — | — | — | (0.19) | $ 9.56 | (1.95) % (5) | $ 1,755 | 1.69 % | 2.26 % | (0.83) % | 213 % | |
| 11/1/18 to 10/31/19 | 9.65 | 0.08 | 0.23 | 0.31 | (0.13) | — | (0.08) | (0.21) | 0.10 | 9.75 | 3.38 | 1,558 | 1.69 | 2.15 | 0.81 | 185 | |
| 11/1/17 to 10/31/18 | 9.74 | 0.04 | (0.12) | (0.08) | (0.01) | — | — | (0.01) | (0.09) | 9.65 | (0.79) | 2,580 | 1.69 | 2.01 | 0.41 | 113 | |
| 11/1/16 to 10/31/17 | 9.71 | (0.01) | 0.07 | 0.06 | (0.01) | — | (0.02) | (0.03) | 0.03 | 9.74 | 0.63 | 2,873 | 1.69 | 2.14 | (0.09) | 106 | |
| 11/1/15 to 10/31/16 | 10.02 | (0.06) | (0.19) | (0.25) | (0.02) | — | (0.04) | (0.06) | (0.31) | 9.71 | (2.51) | 4,847 | 1.72 (6)(7) | 2.31 | (0.65) | 129 | |
| Class C | |||||||||||||||||
| 11/1/19 to 10/31/20 | $ 9.58 | (0.14) | (0.11) | (0.25) | — | — | — | — | (0.25) | $ 9.33 | (2.61) % (5) | $ 626 | 2.44 % | 3.01 % | (1.46) % | 213 % | |
| 11/1/18 to 10/31/19 | 9.46 | 0.01 | 0.23 | 0.24 | (0.04) | — | (0.08) | (0.12) | 0.12 | 9.58 | 2.63 | 966 | 2.44 | 2.88 | 0.08 | 185 | |
| 11/1/17 to 10/31/18 | 9.61 | (0.03) | (0.12) | (0.15) | — (8) | — | — | — (8) | (0.15) | 9.46 | (1.54) | 1,597 | 2.44 | 2.72 | (0.34) | 113 | |
| 11/1/16 to 10/31/17 | 9.62 | (0.08) | 0.07 | (0.01) | — | — | — | — | (0.01) | 9.61 | (0.10) | 2,637 | 2.44 | 2.89 | (0.85) | 106 | |
| 11/1/15 to 10/31/16 | 10.00 | (0.13) | (0.20) | (0.33) | (0.01) | — | (0.04) | (0.05) | (0.38) | 9.62 | (3.26) | 4,655 | 2.46 (6)(7) | 3.09 | (1.40) | 129 | |
| Class I | |||||||||||||||||
| 11/1/19 to 10/31/20 | $ 9.79 | (0.05) | (0.12) | (0.17) | (0.01) | — | — | (0.01) | (0.18) | $ 9.61 | (1.70) % (5) | $ 34,482 | 1.44 % | 2.00 % | (0.53) % | 213 % | |
| 11/1/18 to 10/31/19 | 9.70 | 0.10 | 0.23 | 0.33 | (0.16) | — | (0.08) | (0.24) | 0.09 | 9.79 | 3.59 | 34,268 | 1.44 | 1.89 | 1.07 | 185 | |
| 11/1/17 to 10/31/18 | 9.77 | 0.06 | (0.11) | (0.05) | (0.02) | — | — | (0.02) | (0.07) | 9.70 | (0.52) | 74,764 | 1.44 | 1.74 | 0.66 | 113 | |
| 11/1/16 to 10/31/17 | 9.74 | 0.02 | 0.07 | 0.09 | (0.04) | — | (0.02) | (0.06) | 0.03 | 9.77 | 0.92 | 102,802 | 1.44 | 1.88 | 0.16 | 106 | |
| 11/1/15 to 10/31/16 | 10.03 | (0.04) | (0.19) | (0.23) | (0.02) | — | (0.04) | (0.06) | (0.29) | 9.74 | (2.30) | 113,343 | 1.47 (6)(7) | 2.08 | (0.41) | 129 | |
| Class R6 | |||||||||||||||||
| 11/1/19 to 10/31/20 | $ 9.80 | (0.05) | (0.10) | (0.15) | (0.02) | — | — | (0.02) | (0.17) | $ 9.63 | (1.55) % (5) | $ 109 | 1.38 % | 1.98 % | (0.50) % | 213 % | |
| 11/1/18 to 10/31/19 | 9.71 | 0.11 | 0.22 | 0.33 | (0.16) | — | (0.08) | (0.24) | 0.09 | 9.80 | 3.64 | 104 | 1.38 | 1.84 | 1.15 | 185 | |
| 11/1/17 to 10/31/18 | 9.77 | 0.07 | (0.11) | (0.04) | (0.02) | — | — | (0.02) | (0.06) | 9.71 | (0.41) | 103 | 1.38 | 1.70 | 0.72 | 113 | |
| 11/3/16 (9) to 10/31/17 | 9.65 | 0.02 | 0.16 | 0.18 | (0.04) | — | (0.02) | (0.06) | 0.12 | 9.77 | 1.87 | 102 | 1.39 | 1.84 | 0.21 | 106 | |
| Duff & Phelps Select MLP and Energy Fund | |||||||||||||||||
| Class A | |||||||||||||||||
| 11/1/19 to 10/31/20 | $ 8.09 | 0.06 | (2.65) | (2.59) | — | (0.31) | — | (0.31) | (2.90) | $ 5.19 | (32.15) % | $ 317 | 1.40 % (10) | 3.11 % | 0.95 % | 41 % | |
| 11/1/18 to 10/31/19 | 9.26 | 0.14 | (0.82) | (0.68) | (0.12) | (0.37) | — | (0.49) | (1.17) | 8.09 | (7.22) | 447 | 1.40 (10) | 2.59 | 1.56 | 82 | |
| 11/1/17 to 10/31/18 | 9.39 | 0.02 | 0.07 | 0.09 | (0.17) | (0.05) | — | (0.22) | (0.13) | 9.26 | 0.79 | 321 | 1.45 (6) | 2.87 | 0.21 | 29 | |
| 11/1/16 to 10/31/17 | 9.57 | — (8) | 0.02 | 0.02 | (0.10) | (0.10) | — | (0.20) | (0.18) | 9.39 | 0.06 | 333 | 1.55 | 4.75 | 0.01 | 32 | |
| 11/1/15 to 10/31/16 | 9.79 | 0.06 | (0.10) | (0.04) | (0.08) | (0.10) | — | (0.18) | (0.22) | 9.57 | (0.17) | 226 | 1.56 (7) | 6.20 | 0.69 | 33 | |
| Class C | |||||||||||||||||
| 11/1/19 to 10/31/20 | $ 8.01 | 0.02 | (2.64) | (2.62) | — | (0.27) | — | (0.27) | (2.89) | $ 5.12 | (32.76) % | $ 79 | 2.15 % (10) | 3.85 % | 0.28 % | 41 % | |
| 11/1/18 to 10/31/19 | 9.20 | (0.03) | (0.70) | (0.73) | (0.09) | (0.37) | — | (0.46) | (1.19) | 8.01 | (7.84) | 126 | 2.16 (10) | 3.36 | (0.32) | 82 | |
| 11/1/17 to 10/31/18 | 9.36 | (0.05) | 0.05 | — | (0.11) | (0.05) | — | (0.16) | (0.16) | 9.20 | (0.13) | 143 | 2.21 (6) | 3.61 | (0.55) | 29 | |
| 11/1/16 to 10/31/17 | 9.54 | (0.07) | 0.01 | (0.06) | (0.02) | (0.10) | — | (0.12) | (0.18) | 9.36 | (0.69) | 145 | 2.30 | 5.47 | (0.74) | 32 | |
| 11/1/15 to 10/31/16 | 9.78 | (0.01) | (0.09) | (0.10) | (0.04) | (0.10) | — | (0.14) | (0.24) | 9.54 | (0.93) | 128 | 2.31 (7) | 6.93 | (0.06) | 33 | |
| Class I | |||||||||||||||||
| 11/1/19 to 10/31/20 | $ 7.99 | 0.08 | (2.63) | (2.55) | — | (0.34) | — | (0.34) | (2.89) | $ 5.10 | (32.03) % | $ 4,364 | 1.15 % (10) | 2.79 % | 1.30 % | 41 % | |
| 11/1/18 to 10/31/19 | 9.25 | 0.05 | (0.70) | (0.65) | (0.24) | (0.37) | — | (0.61) | (1.26) | 7.99 | (6.98) | 4,255 | 1.16 (10) | 2.31 | 0.62 | 82 | |
| 11/1/17 to 10/31/18 | 9.40 | 0.04 | 0.07 | 0.11 | (0.21) | (0.05) | — | (0.26) | (0.15) | 9.25 | 0.99 | 4,989 | 1.21 (6) | 2.56 | 0.45 | 29 | |
| 11/1/16 to 10/31/17 | 9.58 | 0.03 | 0.01 | 0.04 | (0.12) | (0.10) | — | (0.22) | (0.18) | 9.40 | 0.27 | 5,056 | 1.30 | 4.46 | 0.26 | 32 | |
| 11/1/15 to 10/31/16 | 9.79 | 0.08 | (0.09) | (0.01) | (0.10) | (0.10) | — | (0.20) | (0.21) | 9.58 | 0.10 | 4,738 | 1.31 (7) | 5.95 | 0.94 | 33 |
| Net Asset Value, Beginning of Period | Net Investment Income (Loss)(1) | Net Realized and Unrealized Gain (Loss) | Total from Investment Operations | Dividends from Net Investment Income | Return of Capital | Distributions from Net Realized Gains | Total Distributions | Change in Net Asset Value | Net Asset Value, End of Period | Total Return (2)(3) | Net Assets, End of Period (in thousands) | Ratio of Net Expenses to Average Net Assets (including dividend and interest expense on securities sold short)(4) | Ratio of Gross Expenses to Average Net Assets(4) | Ratio of Net Investment Income (Loss) to Average Net Assets(4) | Portfolio Turnover Rate(2) | ||
| KAR Long/Short Equity Fund | |||||||||||||||||
| Class A | |||||||||||||||||
| 11/1/19 to 10/31/20 | $12.69 | (0.20) | 4.00 | 3.80 | — | — | (0.05) | (0.05) | 3.75 | $16.44 | 30.01 % | $ 1,210 | 2.32 % (11) | 2.51 % | (1.34) % | 33 % | |
| 12/6/18 (9) to 10/31/19 | 10.00 | (0.11) | 2.80 | 2.69 | — | — | — | — | 2.69 | 12.69 | 26.90 | 134 | 2.40 (11) | 4.26 | (1.03) | 56 | |
| Class C | |||||||||||||||||
| 11/1/19 to 10/31/20 | $12.61 | (0.28) | 3.93 | 3.65 | — | — | (0.05) | (0.05) | 3.60 | $16.21 | 29.01 % | $ 504 | 3.09 % (11) | 3.28 % | (2.02) % | 33 % | |
| 12/6/18 (9) to 10/31/19 | 10.00 | (0.18) | 2.79 | 2.61 | — | — | — | — | 2.61 | 12.61 | 26.10 | 138 | 3.15 (11) | 5.02 | (1.78) | 56 | |
| Class I | |||||||||||||||||
| 11/1/19 to 10/31/20 | $12.72 | (0.15) | 4.01 | 3.86 | — | — | (0.05) | (0.05) | 3.81 | $16.53 | 30.41 % | $109,819 | 2.07 % (11) | 2.30 % | (1.05) % | 33 % | |
| 12/6/18 (9) to 10/31/19 | 10.00 | (0.10) | 2.82 | 2.72 | — | — | — | — | 2.72 | 12.72 | 27.20 | 17,813 | 2.04 (11) | 3.99 | (0.94) | 56 | |
| Class R6 | |||||||||||||||||
| 11/1/19 to 10/31/20 | $12.73 | (0.13) | 3.99 | 3.86 | — | — | (0.05) | (0.05) | 3.81 | $16.54 | 30.39 % | $ 132 | 2.07 % (11) | 2.24 % | (0.95) % | 33 % | |
| 12/6/18 (9) to 10/31/19 | 10.00 | (0.07) | 2.80 | 2.73 | — | — | — | — | 2.73 | 12.73 | 27.30 | 3,437 | 2.08 (11) | 4.00 | (0.71) | 56 |
| Footnote Legend: | |
| (1) | Calculated using average shares outstanding. |
| (2) | Not annualized for periods less than one year. |
| (3) | Sales charges, where applicable, are not reflected in the total return calculation. |
| (4) | Annualized for periods less than one year. |
| (5) | Payment from affiliate had no impact on total return. |
| (6) | Due to a change in expense cap, the ratio shown is a blended expense ratio. |
| (7) | Net expense ratio includes extraordinary proxy expenses. |
| (8) | Amount is less than $0.005 per share. |
| (9) | Inception date. |
| (10) | The ratio of net expenses to average net assets excluding interest expense for the Duff & Phelps Select MLP and Energy Fund for Class A are 1.40% and 1.40%, Class C is 2.15% and 2.15% and for Class I is 1.15% and 1.15% for the years ended October 31, 2020 and October 31, 2019. |
| (11) | The ratio of net expenses to average net assets excluding dividend and interest expense on securities sold short for the KAR Long/Short Equity Fund for Class A are 1.80% and 1.80%, for Class C is 2.55% and 2.55%, for Class I is 1.55% and 1.55% and for Class R6 is 1.48% and 1.48% for the year ended October 31, 2020 and the period ended October 31, 2019. |
October 31, 2020
| A. | Security Valuation |
| Each Fund utilizes a fair value hierarchy which prioritizes the inputs to valuation techniques used to measure fair value into three broad levels. The Funds’ policy is to recognize transfers into or out of Level 3 at the end of the reporting period. | |
| • Level 1 – quoted prices in active markets for identical securities (security types generally include listed equities). |
| B. | Security Transactions and Investment Income |
| Security transactions are recorded on the trade date. Realized gains and losses from the sale of securities are determined on the identified cost basis. Dividend income is recognized on the ex-dividend date or, in the case of certain foreign securities, as soon as a Fund is notified. Interest income is recorded on the accrual basis. Each Fund amortizes premiums and accretes discounts using the effective interest method. Any distributions from underlying funds are recorded in accordance with the character of the distributions as designated by the underlying funds. | |
| Dividend income from REIT and MLP investments is recorded using management’s estimate of the percentage of income included in distributions received from such investments based on historical information and other industry sources. The return of capital portion of the estimate is a reduction to investment income and a reduction in the cost basis of each investment which increases net realized gain (loss) and net change in unrealized appreciation (depreciation). If the return of capital distributions exceed their cost basis, the distributions are treated as realized gains. The Duff & Phelps Select MLP and Energy Fund invests in MLPs that make distributions that are primarily attributable to return of capital. The actual amounts of income, return of capital, and capital gains are only determined by each REIT and MLP after its fiscal year-end, and may differ from the estimated amounts. | |
| C. | Income Taxes |
| Each Fund is treated as a separate taxable entity. It is the intention of each Fund to comply with the requirements of Subchapter M of the Internal Revenue Code and to distribute substantially all of its taxable income to its shareholders. Therefore, no provision for federal income taxes or excise taxes has been made. | |
| Certain Funds may be subject to foreign taxes on income, gains on investments or currency repatriation, a portion of which may be recoverable. Each Fund will accrue such taxes and recoveries as applicable based upon current interpretations of the tax rules and regulations that exist in the markets in which it invests. | |
| Management of the Funds has concluded that there are no significant uncertain tax positions that would require recognition in the financial statements. As of October 31, 2020, the tax years that remain subject to examination by the major tax jurisdictions under the statute of limitations are from the year 2017 forward (with limited exceptions). |
| D. | Distributions to Shareholders |
| Distributions are recorded by each Fund on the ex-dividend date. Income and capital gain distributions are determined in accordance with income tax regulations that may differ from U.S. GAAP. | |
| E. | Expenses |
| Expenses incurred together by a Fund and other affiliated mutual funds are allocated in proportion to the net assets of each such fund, except where allocation of direct expense to each Fund or an alternative allocation method can be more appropriately used. | |
| In addition to the net annual operating expenses that a Fund bears directly, the shareholders of a Fund indirectly bear the pro-rata expenses of any underlying mutual funds in which the Fund invests. | |
| F. | Foreign Currency Translations |
| Non-U.S. investment securities and other assets and liabilities denominated in foreign currencies are translated into U.S. dollar amounts at the foreign currency exchange rate effective at the end of the reporting period. Cost of investments is translated at the currency exchange rate effective at the trade date. The gain or loss resulting from a change in currency exchange rates between the trade and settlement date of a portfolio transaction is treated as a gain or loss on foreign currency. Likewise, the gain or loss resulting from a change in currency exchange rates between the date income is accrued and the date it is paid is treated as a gain or loss on foreign currency. The Funds do not isolate that portion of the results of operations arising from changes in foreign exchange rates on investments from the fluctuations arising from changes in the market prices of securities held. Such fluctuations are included with the net realized and unrealized gain or loss on investments. | |
| G. | Short Sales |
| Each Fund may sell securities short. A short sale is a transaction in which a Fund sells a security it does not own in anticipation of a decline in market price. To sell a security short, a Fund must borrow the security. The Fund’s obligation to replace the security borrowed and sold short will be fully collateralized at all times by the proceeds from the short sale retained by the broker and by cash and securities deposited in a segregated account with the Fund’s custodian. If the price of the security sold short increases between the time of the short sale and the time the Fund replaces the borrowed security, the Fund will realize a loss, and if the price declines during the period, the Fund will realize a gain. Any realized gain will be decreased, and any realized loss increased, by the amount of transaction costs. On ex-dividend date, dividends on short sales are recorded as an expense to the Fund. | |
| In addition, in accordance with the terms of its prime brokerage agreement, KAR Long/Short Equity Fund may receive rebate income or be charged a fee on borrowed securities. Such income or fee is calculated on a daily basis based upon the market value of each borrowed security and a variable rate that is dependent upon the availability of such security. The dividends on short sales and rebate income/fees are recorded under “Dividend expense and interest expense on securities sold short” on the Statement of Operations. | |
| H. | Securities Lending |
| The Funds may loan securities to qualified brokers through a securities lending agency agreement with The Bank of New York Mellon (“BNYM”). Under the securities lending policy, when lending securities a Fund is required to maintain collateral with a market value not less than 100% of the market value of loaned securities. Collateral is adjusted daily in connection with changes in the market value of securities on loan. Collateral may consist of cash and securities issued by the U.S. Government or its agencies. Cash collateral is invested in a short-term money market fund. Dividends earned on the collateral and premiums paid by the broker are recorded as income by the Fund net of fees and rebates charged/paid by BNYM for its services as securities lending agent and in connection with this securities lending program. Lending portfolio securities involves a risk of delay in the recovery of the loaned securities or in the declining value of the collateral. | |
| Securities lending transactions are entered into by each Fund under a Master Securities Lending Agreement (“MSLA”) which permit the Fund, under certain circumstances including an event of default (such as bankruptcy or insolvency), to offset amounts payable by the Fund to the same counterparty against amounts to be received and create one single net payment due to or from the Fund. | |
| At October 31, 2020, the Funds had no securities on loan. |
| A. | Futures Contracts |
| A futures contract is an agreement between two parties to purchase (long) or sell (short) a security at a set price for delivery on a future date. Upon entering into a futures contract, a Fund is required to pledge to the broker an amount of cash and/or securities equal to the “initial margin” requirements of the futures exchange on which the contract is traded. Pursuant to the contract, the Fund agrees to receive from or pay to the broker an amount of cash equal to the daily fluctuation in value of the contract. Such receipts or payments are known as variation margin and are recorded by a Fund for financial statement purposes on a daily basis as unrealized appreciation or depreciation. When the contract expires or is closed, gain or loss equal to the difference between the value of the contract at the time it was opened and the value at the time it was closed is realized. This is presented in the Statement of Operations as net realized gain (loss) from future contracts. |
| During the fiscal period, Aviva Multi-Strategy Target Return Fund utilized futures to optimize performance by gaining exposure to broad markets or to hedge the risk of securities within the portfolios. The potential risks of doing so are that 1) the use of futures may result in larger losses or smaller gains than the use of more traditional investments, 2) the prices of futures and the price movements of the securities that the future is intended to simulate may not correlate well, 3) the Fund’s success in using futures will be dependent upon the subadviser’s ability to correctly predict such price movements, 4) liquidity of futures can be adversely affected by market factors, and the prices of such securities may move in unexpected ways, and 5) if the Fund cannot close out a futures position, it may be compelled to continue to make daily cash payments to the broker to meet margin requirements, thus increasing transaction costs. Futures contracts outstanding at period end, if any, are listed after each Fund’s Schedule of Investments. | |
| B. | Forward Foreign Currency Exchange Contracts |
| A forward foreign currency exchange contract is an agreement between two parties to buy and sell a currency at a set exchange rate on a future date. Forward foreign currency exchange contracts, when used by a Fund, help to manage the overall exposure to the currencies in which some of the investments held by the Fund are denominated. The contract is marked-to-market daily, and the change in market value is recorded by the Fund as an unrealized appreciation or depreciation. When the contract is closed, the Fund records a realized gain or loss equal to the difference between the value at the time it was opened and the value at the time it was closed. The use of forward foreign currency exchange contracts involves the risk that the value of the contract changes unfavorably due to movements in the value of the referenced foreign currencies. Non-deliverable forward foreign currency exchange contracts are settled with the counterparty in U.S. dollars without the delivery of foreign currency. | |
| During the fiscal period, Aviva Multi-Strategy Target Return Fund entered into forward foreign currency exchange contracts as an economic hedge against either specific transactions or portfolio instruments or to obtain exposure to, or hedge exposure away from, foreign currencies (foreign currency exchange rate risk). Forward foreign currency contracts outstanding at period end, if any, are listed after each Fund’s Schedule of Investments. | |
| C. | Options Contracts |
| An options contract provides the purchaser with the right, but not the obligation, to buy (call option) or sell (put option) a financial instrument at an agreed upon price. Certain Funds may purchase or write both put and call options on portfolio securities. A Fund doing so is subject to equity price risk and/or foreign currency risk in the normal course of pursuing its investment objectives. | |
| When a Fund purchases an option, it pays a premium and an amount equal to that premium is recorded as an asset. When a Fund writes an option, it receives a premium and an amount equal to that premium is recorded as a liability. The asset or liability is adjusted daily to reflect the current market value of the option. Holdings of the Fund designated to cover outstanding written options are noted in the Schedules of Investments. Purchased options are reported as an asset within “Investment in securities at value” in the Statements of Assets and Liabilities. Written options are reported as a liability within “Written options at value.” Changes in value of the purchased option are included in “Net change in unrealized appreciation (depreciation) from investments” in the Statements of Operations. Changes in value of written options are included in “Net change in unrealized appreciation (depreciation) from written options” in the Statements of Operations. | |
| If an option expires unexercised, the Fund realizes a gain or loss to the extent of the premium received or paid. If an option is exercised, the premium received or paid is recorded as an adjustment to the proceeds from the sale or the cost basis of the purchase. The difference between the premium and the amount received or paid on effecting a closing purchase or sale transaction is also treated as a realized gain or loss. Gain or loss on purchased options is included in “Net realized gain (loss) on investments” in the Statements of Operations. Gain or loss on written options is presented separately as “Net realized gain (loss) from written options” in the Statements of Operations. | |
| The risk in writing call options is that the Fund gives up the opportunity for profit if the market price/foreign currency rate of the referenced security/currency increases and the option is exercised. The risk in writing put options is that the Fund may incur a loss if the market price/foreign currency rate of the referenced security/currency decreases and the option is exercised. The risk in buying options is that the Fund pays a premium whether or not the option is exercised. The use of such instruments may involve certain additional risks as a result of unanticipated movements in the market. Writers (sellers) of options are subject to unlimited risk of loss, as the seller will be obligated to deliver or take delivery of the security at a predetermined price which may, upon exercise of the option, be significantly different from the then-market value. | |
| During the fiscal period, Aviva Multi-Strategy Target Return Fund used options contracts to gain asymmetric exposure to, or hedge against, market and idiosyncratic risk or to reduce portfolio volatility. | |
| D. | Swaps |
| Certain Funds may enter into swap agreements, in which the Fund and a counterparty agree either to make periodic net payments on a specified notional amount or a net payment upon termination. Swap agreements are negotiated in the OTC market and may be entered into as a bilateral contract (“OTC swaps”) or centrally cleared (“centrally cleared swaps”). The value of the swap is reflected on the Statements of Assets and Liabilities as “Swaps at value”. Swaps are marked-to-market daily and changes in value are recorded as “Net change in unrealized appreciation (depreciation) on swaps” in the Statements of Operations. | |
| Any upfront premiums paid are recorded as assets and any upfront fees received are recorded as liabilities and are shown under “Swaps at value” in the Statements of Assets and Liabilities and are amortized over the term of the swap. When a swap is terminated, the Fund records a realized gain or loss equal to the difference between the proceeds from (or cost of) the closing transaction and the Fund’s basis in the contract, if any. Generally, the basis of the contracts is the unamortized premium received or paid. Cash settlements between the Fund and the counterparty are recognized as “Net realized gain (loss) on swaps” in the Statements of Operations. Swap contracts outstanding at period end, if any, are listed after each Fund’s Schedule of Investments. |
| In a centrally cleared swap, immediately following execution of the swap agreement, the swap agreement is submitted to a central counterparty (the “CCP”) and the Fund’s counterparty on the swap agreement becomes the CCP. The Fund is required to interface with the CCP through a clearing broker. Upon entering into a centrally cleared swap, a Fund is required to deposit initial margin with the clearing broker in the form of cash or securities in an amount that varies depending on the size and risk profile of the particular swap. | |
| Securities deposited as margin are designated on the Schedule of Investments and cash deposited is recorded on the Statements of Assets and Liabilities as “Deposits with prime broker”. | |
| Swap transactions involve, to varying degrees, elements of interest rate, credit and market risk in excess of the amounts recognized in the Statements of Assets and Liabilities. Such risks involve the possibility that there will be no liquid market for these agreements, that the counterparty to the agreements may default on its obligation to perform or disagree as to the meaning of the contractual terms in the agreements, and that there may be unfavorable changes in interest rates and/or market values associated with these transactions. | |
| Credit default swaps – A Fund may either buy or sell (write) credit default swaps on single-name issuers (corporate or sovereign), a combination or basket of single-name issuers or traded indexes. Credit default swaps on single-name issuers are agreements in which the buyer pays fixed periodic payments to the seller in consideration for a guarantee from the protection seller to make specific payment should a negative credit event take place with respect to the referenced entity (e.g., bankruptcy, failure to pay, obligation accelerators, repudiation, moratorium or restructuring). Credit default swaps on a combination or basket of single-name issuers are agreements in which the buyer pays fixed periodic payments to the seller in consideration for a guarantee from the protection seller to make specific payment should a negative credit event take place with respect to any of the referenced entities (e.g., bankruptcy, failure to pay, obligation accelerators, repudiation, moratorium or restructuring). Credit default swaps on traded indexes are agreements in which the buyer pays fixed periodic payments to the seller in consideration for a guarantee from the seller to make a specific payment should a write-down, principal or interest shortfall or default of all or individual underlying securities included in the index occurs. As a buyer, if an underlying credit event occurs, the Fund will either receive from the seller an amount equal to the notional amount of the swap and deliver the referenced security or underlying securities comprising the index or receive a net settlement of cash equal to the notional amount of the swap less the recovery value of the security or underlying securities comprising the index. As a seller (writer), if an underlying credit event occurs, the Fund will either pay the buyer an amount equal to the notional amount of the swap and take delivery of the referenced security or underlying securities comprising the index or pay a net settlement of cash equal to the notional amount of the swap less the recovery value of the security or underlying securities comprising the index. The Funds may enter into credit default swaps to manage their exposure to the market or certain sectors of the market, to reduce their risk exposure to defaults of corporate and/or sovereign issuers or to create exposure to corporate and/or sovereign issuers to which they are not otherwise exposed (credit risk). | |
| During the fiscal period, Aviva Multi-Strategy Target Return Fund utilized both single name credit default swaps and credit index swaps to gain long or short exposure to individual securities or to gain exposure to a credit or asset-backed index. | |
| Total return swaps – Total return swaps are agreements in which there is an exchange of cash flows whereby one party commits to make payments based on the total return (coupons plus capital gains/losses) of an underlying instrument in exchange for fixed or floating rate interest payments. To the extent the total return of the instrument or index underlying the transaction exceeds or falls short of the offsetting interest rate obligation, the Fund will receive a payment from or make a payment to the counterparty. Certain Funds may enter into total return swaps to obtain exposure to a security or market without owning such security or investing directly in that market or to transfer the risk/return of one market (e.g., fixed income) to another market (e.g., equity) (equity risk and/or interest rate risk). | |
| Certain Funds may enter into equity basket swaps to obtain exposure to a portfolio of long and short securities. Under the terms of the agreement, the swap is designed to function as a portfolio of direct investments in long and short equity or fixed income positions. This means that the Fund has the ability to trade in and out of long and short positions within the swap and will receive all of the economic benefits and risks equivalent to direct investments in these positions such as: capital appreciation (depreciation), corporate actions, and dividends and interest received and paid, all of which are reflected in the swap value. The swap value also includes interest charges and credits related to the notional values of the long and short positions and cash balances within the swap. These interest charges and credits are based on defined market rates plus or minus a specified spread and are referred to herein as “financing costs”. Positions within the swap are reset periodically, and financing costs are reset monthly. | |
| During a reset, any unrealized gains (losses) on positions and accrued financing costs become available for cash settlement between the Fund and the swap counterparty. Cash settlement in and out of the swap may occur at a reset date or any other date, at the discretion of the Fund and the counterparty, over the life of the agreement, and is generally determined based on limits and thresholds established as part of the ISDA Master Agreement (defined below in “Derivative Risks”) between the Fund and the counterparty. | |
| The value of the swap is derived from a combination of (i) the net value of the underlying positions, which are valued daily using the last sale or closing prices on the principal exchange on which the securities are traded; (ii) financing costs; (iii) the value of dividends or accrued interest; (iv) cash balances within the swap; and (v) other factors, as applicable. The swap involves additional risks than if the Fund has invested in the underlying positions directly, including: the risk that changes in the swap may not correlate perfectly with the underlying long and short securities; credit risk related to the counterparty’s failure to perform under contract terms; and liquidity risk related to the lack of a liquid market for the swap contract, which may limit the ability of the Fund to close out its position(s). | |
| During the fiscal period, Aviva Multi-Strategy Target Return Fund utilized total return swaps to gain exposure to broad markets or to hedge the risk of individual securities within the portfolios, obtain long or short exposure to the underlying reference instrument, obtain leverage and gain exposure to restricted markets in order to avoid the operational burden of ownership filing requirements. At October 31, 2020, the Aviva Multi-Strategy Target Return Fund did not hold Swap Baskets. |
| Interest rate swaps – Interest rate swaps are agreements in which one party pays a stream of interest payments, either fixed or floating, for another party’s stream of interest payments, either fixed or floating, on the same notional amount for a specified period of time. Certain Funds may enter into interest rate swaps to gain or reduce exposure to interest rates or to manage duration, the yield curve or interest rate risk by economically hedging the value of the fixed rate bonds which may decrease when interest rates rise (interest rate risk). | |
| During the fiscal period, Aviva Multi-Strategy Target Return Fund utilized interest rate swaps to gain exposure to interest rates or to hedge interest rate risk within its portfolio. | |
| Inflation swaps – Inflation swaps are contracts in which one party agrees to pay the cumulative percentage increase in a price index (e.g., the Consumer Price Index with respect to CPI swaps) over the term of the swap (with some lag on the inflation index), while the other pays a compounded fixed rate. One factor that may lead to changes in the values of inflation swaps is a change in real interest rates, which are tied to the relationship between nominal interest rates and the rate of inflation. If nominal interest rates increase at a faster rate than inflation, real interest rates may rise, which may lead to a decrease in value of an inflation swap. Certain Funds may enter into inflation swaps to hedge the inflation risk associated with non-inflation indexed investments, thereby creating “synthetic” inflation-indexed investments. | |
| During the fiscal period, Aviva Multi-Strategy Target Return Fund utilized inflation swaps to hedge inflation risk within its portfolio or to gain exposure to the impact of inflation. | |
| Variance swaps –Variance swaps are contracts in which two parties agree to exchange cash payments based on the difference between the stated level of variance and the actual variance realized on an underlying asset or index. Certain Funds may enter into variance swaps in an attempt to hedge equity market risk or adjust exposure to the equity markets. | |
| During the fiscal period, Aviva Multi-Strategy Target Return Fund utilized variance swaps to capitalize on volatility in the equity markets. | |
| The following is a summary of derivative instruments categorized by primary risk exposure as of October 31, 2020: |
| Fair Values of Derivative Financial Instruments as of October 31, 2020 | ||
| Derivative Assets | ||
| Aviva Multi-Strategy Target Return Fund | ||
| Primary Risk | Statement of Assets and Liabilities Location | Value |
| Interest rate contracts | Swaps at value | $ 145 |
| Foreign currency exchange contracts | Unrealized appreciation on forward foreign currency exchange contracts | 180 |
| Equity contracts | Unrealized appreciation on futures contracts(1); Investments in securities at value(2); Swaps at value | 1,363 |
| Credit contracts | Swaps at value | 554 |
| Total | $2,242 | |
| Fair Value of Derivative Financial Instruments as of October 31, 2020 | ||
| Derivative Liabilities | ||
| Aviva Multi-Strategy Target Return Fund | ||
| Primary Risk | Statement of Assets and Liabilities Location | Value |
| Interest rate contracts | Unrealized depreciation on futures contracts(1); Swaps at value | $ 123 |
| Foreign currency exchange contracts | Unrealized depreciation on forward foreign currency exchange contracts | 149 |
| Equity contracts | Written options at value; Unrealized depreciation on futures contracts(1); Swaps at value | 1,066 |
| Total | $1,338 | |
For futures contracts only current day’s variation margin is reported within the Statements of Assets and Liabilities.
| The Effect of Derivative Financial Instruments in the Statements of Operations for the Period Ended October 31, 2020 | |||
| Net Realized Gain (Loss) From | |||
| Aviva Multi-Strategy Target Return Fund | |||
| Interest rate contracts: | |||
| Futures contracts(1) | $ 1,431 | ||
| Swaps (2) | (666) | ||
| Foreign currency exchange contracts: | |||
| Forward foreign currency transactions(3) | (853) | ||
| Equity contracts: | |||
| Futures contracts(1) | (703) | ||
| Purchased options(4) | 35 | ||
| Written options(5) | (313) | ||
| Swaps (2) | 18 | ||
| Credit contracts: | |||
| Swaps (2) | (318) | ||
| Total | $(1,369) | ||
| (1) Included in net realized gain (loss) from futures within the Statements of Operations. |
| (2) Included in net realized gain (loss) from swaps within the Statements of Operations. |
| (3) Included in net realized gain (loss) from forward foreign currency transactions within the Statements of Operations. |
| (4) Included in net realized gain (loss) from investments within the Statement of Operations. |
| (5) Included in net realized gain (loss) from written options within the Statement of Operations. |
| The Effect of Derivative Financial Instruments in the Statements of Operations for the Period Ended October 31, 2020 | |||
| Net Change in Unrealized Appreciation/(Depreciation) on | |||
| Aviva Multi-Strategy Target Return Fund | |||
| Interest rate contracts: | |||
| Futures contracts(1) | $ (70) | ||
| Swaps (2) | 161 | ||
| Foreign currency exchange contracts: | |||
| Forward foreign currency transactions(3) | 169 | ||
| Equity contracts: | |||
| Futures contracts(1) | 93 | ||
| Purchased options(4) | (317) | ||
| Written options(5) | 70 | ||
| Swaps (2) | 448 | ||
| Credit contracts: | |||
| Swaps (2) | (114) | ||
| Total | $ 440 | ||
| (1) Included in net change in unrealized appreciation (depreciation) from futures within the Statements of Operations. |
| (2) Included in net change in unrealized appreciation (depreciation) from swaps within the Statement of Operations. |
| (3) Included in net change in unrealized appreciation (depreciation) from forward foreign currency transactions within the Statements of Operations. |
| (4) Included in net change in unrealized appreciation (depreciation) from investments within the Statement of Operations. |
| (5) Included in net change in unrealized appreciation (depreciation) from written options within the Statements of Operations. |
| Aviva Multi-Strategy Target Return Fund | |
Purchased Options(1) | $ 394 |
Written Options(2) | (318) |
Futures Contracts - Long Positions(3) | 202 |
Futures Contracts - Short Positions(3) | (136) |
Forward Foreign Currency Exchange Purchase Contracts(4) | 14,746 |
Forward Foreign Currency Exchange Sale Contracts(5) | (14,740) |
Interest Rate Swap Agreements(6) | 47,586 |
Credit Default Swap Agreements - Sell Protection(6) | 4,882 |
Total Return Swap Agreements(6) | 2,150 |
Inflation Swap Agreements(6) | 6,260 |
Variance Swap Agreements(6) | 300 |
| (1) Average premiums paid for the period. |
| (2) Average premiums received for the period. |
| (3) Average unrealized for the period. |
| (4) Average value at trade date payable. |
| (5) Average value at settlement date receivable. |
| (6) Notional amount. |
| E. | Derivative Risks |
| A derivative contract may suffer a mark-to-market loss if the value of the contract decreases due to an unfavorable change in the market rates or values of the underlying instrument. Losses can also occur if the counterparty does not perform under the contract. | |
| A Fund’s risk of loss from counterparty credit risk on OTC derivatives is generally limited to the aggregate unrealized gain netted against any collateral held by such Fund. For OTC purchased options, each Fund bears the risk of loss of the amount of the premiums paid plus the positive change in market values net of any collateral held by such Fund should the counterparty fail to perform under the contracts. Options written by a Fund do not typically give rise to counterparty credit risk, as options written generally obligate the Fund, and not the counterparty, to perform. | |
| With exchange traded purchased options and futures and centrally cleared swaps, generally speaking, there is less counterparty credit risk to the Fund since the exchange or clearinghouse, as counterparty to such instruments, guarantees against a possible default. The clearinghouse stands between the buyer and the seller of the contract; therefore, credit risk is limited to failure of the clearinghouse. While offset rights may exist under applicable law, a Fund does not have a contractual right of offset against a clearing broker or clearinghouse in the event of a default (including the bankruptcy or insolvency) of the clearing broker or clearinghouse. Additionally, credit risk exists in exchange traded futures and centrally cleared swaps with respect to initial and variation margin that is held in a clearing broker’s customer accounts. While clearing brokers are required to segregate customer margin from their own assets, in the event that a clearing broker becomes insolvent or goes into bankruptcy and at that time there is a shortfall in the aggregate amount of margin held by the clearing broker for all its clients, typically the shortfall would be allocated on a pro rata basis across all the clearing broker’s customers, potentially resulting in losses to the Fund. | |
| In order to better define its contractual rights and to secure rights that will help a Fund mitigate its counterparty risk, each Fund may enter into an International Swaps and Derivatives Association, Inc. Master Agreement (“ISDA Master Agreement”) or similar agreement with its derivative contract counterparties. An ISDA Master Agreement is a bilateral agreement between a Fund and a counterparty that governs certain OTC derivatives and typically contains, among other things, collateral posting terms and netting provisions in the event of a default and/or termination event. Under an ISDA Master Agreement, a Fund may, under certain circumstances, offset with the counterparty certain derivative financial instruments’ payables and/or receivables with collateral held and/or posted and create one single net payment. The provisions of the ISDA Master Agreement typically permit a single net payment in the event of default including the bankruptcy or insolvency of the counterparty. However, bankruptcy or insolvency laws of a particular jurisdiction may impose restrictions on or prohibitions against the right of offset in bankruptcy, insolvency or other events. In addition, certain ISDA Master Agreements allow counterparties to OTC derivatives to terminate derivative contracts prior to maturity in the event a Fund’s net assets decline by a stated percentage or the Fund fails to meet the terms of its ISDA Master Agreements, which would cause the Fund to accelerate payment of any net liability owed to the counterparty. |
| F. | Collateral Requirements and Master Netting Agreements (“MNA”) |
| For derivatives traded under an ISDA Master Agreement, the collateral requirements are typically calculated by netting the mark-to-market amount for each transaction under such agreement and comparing that amount to the value of any collateral currently pledged by the Funds and the counterparty. | |
| Cash collateral that has been pledged to cover obligations of a Fund and cash collateral received from the counterparty, if any, is reported separately on the Statements of Assets and Liabilities as cash pledged as collateral and cash received as collateral, respectively. Non-cash collateral pledged by a Fund, if any, is noted in the Schedules of Investments. Typically, the Funds and counterparties are not permitted to sell, re-pledge or use the collateral they receive. To the extent amounts due to a Fund from its counterparties are not fully collateralized, contractually or otherwise, the Fund bears the risk of loss from counterparty non-performance. The Funds attempt to mitigate counterparty risk by only entering into agreements with counterparties that they believe have the financial resources to honor their obligations and by monitoring the financial stability of those counterparties. | |
| The following tables present the Funds’ derivative assets and liabilities by counterparty net of amounts available for offset under a MNA and net of the related collateral received/pledged by the Funds as of October 31, 2020: |
| At October 31, 2020, the Funds’ derivative assets and liabilities (by type) are as follows: | |||||
| Aviva Multi-Strategy Target Return Fund | |||||
| Assets | Liabilities | ||||
| Derivative Financial Instruments: | |||||
| Futures contracts | $ 9 | $ — | |||
| Forward foreign currency exchange contracts | 180 | 149 | |||
| Swaps | 1,090 | 168 | |||
| Purchased options | 560 | — | |||
| Written options | — | 750 | |||
| Total derivative assets and liabilities in the Statements of Assets and Liabilities | $ 1,839 | $1,067 | |||
| Derivatives not subject to a MNA or similar agreement | (1,268) | (752) | |||
| Total assets and liabilities subject to a MNA | $ 571 | $ 315 | |||
| Aviva Multi-Strategy Target Return Fund | ||||||||||
| Counterparty | Derivative Assets Subject to a MNA by Counterparty | Derivatives Available for Offset | Non-Cash Collateral Received(1) | Cash Collateral Received(1) | Net Amount of Derivative Assets(2) | |||||
BNP Paribas | $ 5 | $ (5) | $— | $ — | $ — | |||||
Citibank | 56 | (37) | — | — | 19 | |||||
Goldman Sachs & Co | 83 | (83) | — | — | — | |||||
JPMorgan Chase Bank N.A. | 69 | (47) | — | (22) | — | |||||
Merrill Lynch | 236 | (33) | — | — | 203 | |||||
Societe Generale | 122 | (30) | — | — | 92 | |||||
Total | $571 | $(235) | $— | $(22) | $314 | |||||
| Counterparty | Derivatives Liabilities Subject to a MNA by Counterparty | Derivatives Available for Offset | Non-cash Collateral Pledged(3) | Cash Collateral Pledged(3) | Net Amount of Derivative Liabilities(4) | |||||
BNP Paribas | $ 18 | $ (5) | $— | $— | $13 | |||||
Citibank | 37 | (37) | — | — | — | |||||
Goldman Sachs & Co | 150 | (83) | — | — | 67 | |||||
| JPMorgan Chase Bank N.A. | 47 | (47) | — | — | — | |||||
| Merrill Lynch | 33 | (33) | — | — | — | |||||
| Societe Generale | 30 | (30) | — | — | — | |||||
Total | $315 | $(235) | $— | $— | $80 |
| A. | Investment Adviser |
| Virtus Alternative Investment Advisers, Inc. (“VAIA” or the “Adviser”), an indirect, wholly-owned subsidiary of Virtus Investment Partners, Inc. (“Virtus”), is the investment adviser to the Funds. The Adviser manages the Funds’ investment programs and general operations of the Funds, including oversight of the Funds’ subadvisers. | |
| As compensation for its services to the Funds, the Adviser is entitled to a fee, which is calculated daily and paid monthly based upon the following annual rates as a percentage of the average daily net assets of each Fund. |
| 1st $1 Billion | $1+ Billion | 1st $5 Billion | $5+ Billion | ||||
| Aviva Multi-Strategy Target Return Fund* | —% | —% | 1.30% | 1.25% | |||
| Duff & Phelps Select MLP and Energy Fund** | 0.90 | 0.85 | — | — | |||
| KAR Long/Short Equity Fund | 1.25 | 1.20 | — | — | |||
| *The Adviser has contractually agreed to waive a portion of the management fee so that such fee does not exceed 1.25% through February 28, 2021. | |||||||
| **Prior to February 28, 2020, the advisory fee for this Fund was 0.90% on all assets. | |||||||
| B. | Subadvisers |
| The subadvisers manage the investments of each Fund for which they are paid a fee by the Adviser. | |
| The subadvisers and the Funds they serve as of the end of the period are as follows: Aviva Investors Americas LLC (“Aviva”), for Aviva Multi-Strategy Target Return Fund; Duff & Phelps Investment Management Co. (“Duff & Phelps”), an indirect wholly-owned subsidiary of Virtus, for Duff & Phelps Select MLP and Energy Fund; and Kayne Anderson Rudnick Investment Management, LLC (“KAR”), an indirect wholly-owned subsidiary of Virtus, for KAR Long/Short Equity Fund. | |
| C. | Expense Limitations |
| The Adviser has contractually agreed to limit each Fund’s annual total operating expenses, subject to the exceptions listed below, so that such expenses do not exceed, on an annualized basis, the following respective percentages of average daily net assets through February 28, 2021. Following the contractual period, the Adviser may discontinue these expense reimbursement arrangements at any time. The waivers and reimbursements are accrued daily and received monthly. |
| Fund | Class A | Class C | Class I | Class R6 | ||||
Aviva Multi-Strategy Target Return Fund | 1.69 % | 2.44 % | 1.44 % | 1.38 % | ||||
Duff & Phelps Select MLP and Energy Fund | 1.40 | 2.15 | 1.15 | N/A | ||||
KAR Long/Short Equity Fund | 1.80 | 2.55 | 1.55 | 1.48 |
| D. | Expense Recapture |
| Under certain conditions, the Adviser may recapture operating expenses reimbursed or fees waived under these arrangements within three years after the date on which such amounts were incurred or waived. A Fund must pay its ordinary operating expenses before the Adviser is entitled to any reimbursement and must remain in compliance with any applicable expense limitations or, if none, the expense limitation in effect at the time of the waiver or reimbursement. All or a portion of the following Adviser reimbursed expenses may be recaptured by the fiscal year ending: |
| Expiration | ||||||||
| Fund | 2021 | 2022 | 2023 | Total | ||||
| Aviva Multi-Strategy Target Return Fund | ||||||||
Class A | $ 7 | $ 7 | $ 9 | $ 23 | ||||
Class C | 5 | 5 | 4 | 14 | ||||
Class I | 208 | 177 | 175 | 560 | ||||
Class R6 | — (1) | — (1) | 1 | 1 | ||||
| Duff & Phelps Select MLP and Energy Fund | ||||||||
Class A | 6 | 28 | 9 | 43 | ||||
Class C | 2 | 2 | 2 | 6 | ||||
Class I | 77 | 58 | 75 | 210 | ||||
| KAR Long/Short Equity Fund | ||||||||
Class A | — | 2 | 1 | 3 | ||||
Class C | — | 2 | 1 | 3 | ||||
Class I | — | 100 | 139 | 239 | ||||
Class R6 | — | 53 | 5 | 58 | ||||
| (1) | Amount is less than $500. |
| E. | Distributor |
| VP Distributors, LLC (“VP Distributors”), an indirect, wholly-owned subsidiary of Virtus, serves as the distributor of each Fund’s shares. VP Distributors has advised the Funds that for the fiscal year ended October 31, 2020, there were less than $500 in commissions for Class A shares and less than $500 in CDSC for Class A shares and Class C shares, respectively. | |
| In addition, each Fund pays VP Distributors 12b-1 fees under a 12b-1 Plan as a percentage of the average daily net assets of each respective class at the annual rates of 0.25% for Class A shares and 1.00% for Class C shares. Class I and Class R6 shares are not subject to a 12b-1 Plan. | |
| Under certain circumstances, shares of certain Virtus Mutual Funds may be exchanged for shares of the same class of certain other Virtus Mutual Funds on the basis of the relative NAV per share at the time of the exchange. On exchanges with share classes that carry a CDSC, the CDSC schedule of the original shares purchased continues to apply. | |
| F. | Administrator and Transfer Agent |
| Virtus Fund Services, LLC, an indirect, wholly-owned subsidiary of Virtus, serves as the administrator and transfer agent to the Funds. | |
| For the fiscal year ended October 31, 2020, the Funds incurred administration fees totaling $103 which are included in the Statements of Operations within the line item “Administration and accounting fees.” The fees are calculated daily and paid monthly. | |
| For the fiscal year ended October 31, 2020, the Funds incurred transfer agent fees totaling $48 which are included in the Statements of Operations within the line item “Transfer agent fees and expenses.” The fees are calculated daily and paid monthly. | |
| G. | Payments to Affiliate |
| During the period ended October 31, 2020, Aviva reimbursed Aviva Multi-Strategy Target Return Fund for losses. These amounts are included in “Net increase from payment by affiliates” in the Statements of Operations. There was no impact on the total return. | |
| H. | Affiliated Shareholders |
| At October 31, 2020, Virtus and its affiliates held shares of certain Funds, which may be redeemed at any time, that aggregated to the following: |
| Shares | Aggregate Net Asset Value | ||
| Aviva Multi-Strategy Target Return Fund | |||
Class A | 10,106 | $ 97 | |
Class C | 10,058 | 94 | |
Class I | 1,902,815 | 18,286 | |
Class R6 | 10,470 | 101 | |
| Duff & Phelps Select MLP and Energy Fund | |||
Class A | 10,601 | 55 | |
Class C | 10,431 | 53 | |
Class I | 850,174 | 4,336 | |
| KAR Long/Short Equity Fund | |||
Class R6 | 6,600 | 109 |
| I. | Trustee Compensation |
| The Trust provides a deferred compensation plan for its Trustees who receive compensation from the Trust. Under the deferred compensation plan, Trustees may elect to defer all or a portion of their compensation. Amounts deferred are retained by the Trust, and then, to the extent permitted by the 1940 Act, in turn, may be invested in the shares of affiliated or unaffiliated mutual funds selected by the participating Trustees. Investments in such instruments are included in “Other assets” in the Statements of Assets and Liabilities at October 31, 2020. |
| Purchases | Sales | ||
Aviva Multi-Strategy Target Return Fund | $28,222 | $21,648 | |
Duff & Phelps Select MLP And Energy Fund | 4,690 | 2,016 | |
KAR Long/Short Equity Fund | 72,347 | 23,338 |
| Purchases | Sales | ||
Aviva Multi-Strategy Target Return Fund | $735 | $2,411 |
| Aviva Multi-Strategy Target Return Fund | |||||||
| Year Ended October 31, 2020 | Year Ended October 31, 2019 | ||||||
| SHARES | AMOUNT | SHARES | AMOUNT | ||||
| Class A | |||||||
| Shares sold and cross class conversions | 120 | $ 1,167 | 14 | $ 132 | |||
| Reinvestment of distributions | — | — | 5 | 48 | |||
| Shares repurchased and cross class conversions | (96) | (920) | (127) | (1,184) | |||
| Net Increase / (Decrease) | 24 | $ 247 | (108) | $ (1,004) | |||
| Class C | |||||||
| Shares sold and cross class conversions | — (1) | $ 1 | 9 | $ 83 | |||
| Reinvestment of distributions | — | — | 2 | 17 | |||
| Shares repurchased and cross class conversions | (34) | (325) | (79) | (730) | |||
| Net Increase / (Decrease) | (34) | $ (324) | (68) | $ (630) | |||
| Aviva Multi-Strategy Target Return Fund | |||||||
| Year Ended October 31, 2020 | Year Ended October 31, 2019 | ||||||
| SHARES | AMOUNT | SHARES | AMOUNT | ||||
| Class I | |||||||
| Shares sold and cross class conversions | 896 | $ 8,800 | 487 | $ 4,626 | |||
| Reinvestment of distributions | 2 | 24 | 85 | 757 | |||
| Shares repurchased and cross class conversions | (810) | (7,861) | (4,783) | (44,907) | |||
| Net Increase / (Decrease) | 88 | $ 963 | (4,211) | $ (39,524) | |||
| Class R6 | |||||||
| Shares sold and cross class conversions | 1 | $ 8 | 1 | $ 6 | |||
| Reinvestment of distributions | — (1) | — (1) | — (1) | — (1) | |||
| Shares repurchased and cross class conversions | (—) (1) | (1) | (1) | (6) | |||
| Net Increase / (Decrease) | 1 | $ 7 | — (1) | $ —(1) | |||
| (1) | Amount is less than $500 or 500 shares. |
| Duff & Phelps Select MLP and Energy Fund | |||||||
| Year Ended October 31, 2020 | Year Ended October 31, 2019 | ||||||
| SHARES | AMOUNT | SHARES | AMOUNT | ||||
| Class A | |||||||
| Shares sold and cross class conversions | 112 | $ 801 | 402 | $ 3,627 | |||
| Reinvestment of distributions | 3 | 14 | 6 | 50 | |||
| Shares repurchased and cross class conversions | (109) | (620) | (387) | (3,203) | |||
| Net Increase / (Decrease) | 6 | $ 195 | 21 | $ 474 | |||
| Class C | |||||||
| Shares sold and cross class conversions | — (1) | $ 1 | 6 | $ 51 | |||
| Reinvestment of distributions | — (1) | 1 | — (1) | 3 | |||
| Shares repurchased and cross class conversions | (1) | (5) | (6) | (51) | |||
| Net Increase / (Decrease) | (1) | $ (3) | — (1) | $ 3 | |||
| Class I | |||||||
| Shares sold and cross class conversions | 405 | $ 2,859 | 72 | $ 631 | |||
| Reinvestment of distributions | 21 | 114 | 2 | 18 | |||
| Shares repurchased and cross class conversions | (104) | (520) | (81) | (674) | |||
| Net Increase / (Decrease) | 322 | $ 2,453 | (7) | $ (25) | |||
| (1) | Amount is less than $500 or 500 shares. |
| KAR Long/Short Equity Fund | |||||||
| Year Ended October 31, 2020 | From Inception December 06, 2018 to October 31, 2019 | ||||||
| SHARES | AMOUNT | SHARES | AMOUNT | ||||
| Class A | |||||||
| Shares sold and cross class conversions | 104 | $ 1,571 | 11 | $ 107 | |||
| Reinvestment of distributions | — (1) | — (1) | — | — | |||
| Shares repurchased and cross class conversions | (41) | (597) | — | — | |||
| Net Increase / (Decrease) | 63 | $ 974 | 11 | $ 107 | |||
| KAR Long/Short Equity Fund | |||||||
| Year Ended October 31, 2020 | From Inception December 06, 2018 to October 31, 2019 | ||||||
| SHARES | AMOUNT | SHARES | AMOUNT | ||||
| Class C | |||||||
| Shares sold and cross class conversions | 58 | $ 789 | 11 | $ 109 | |||
| Reinvestment of distributions | — (1) | — (1) | — | — | |||
| Shares repurchased and cross class conversions | (38) | (478) | (—) | (—) | |||
| Net Increase / (Decrease) | 20 | $ 311 | 11 | $ 109 | |||
| Class I | |||||||
| Shares sold and cross class conversions | 5,840 | $ 81,713 | 1,431 | $ 17,401 | |||
| Reinvestment of distributions | 9 | 115 | — | — | |||
| Shares repurchased and cross class conversions | (603) | (8,273) | (31) | (394) | |||
| Net Increase / (Decrease) | 5,246 | $ 73,555 | 1,400 | $ 17,007 | |||
| Class R6 | |||||||
| Shares sold and cross class conversions | 1 | $ 22 | 270 | $ 2,700 | |||
| Shares repurchased and cross class conversions | (263) | (4,030) | — | — | |||
| Net Increase / (Decrease) | (262) | $ (4,008) | 270 | $ 2,700 | |||
| (1) | Amount is less than $500 or 500 shares. |
| % of Shares Outstanding | Number of Accounts | ||
Aviva Multi-Strategy Target Return Fund | 62% | 2 * | |
Duff & Phelps Select MLP and Energy Fund | 93 | 2 * | |
KAR Long/Short Equity Fund | 83 | 1 * |
| * | Includes affiliated shareholder account(s). |
| Fund | Sector | Percentage of Total Investments | ||
Duff & Phelps Select MLP and Energy Fund | Diversified (MLP) | 28% | ||
KAR Long/Short Equity Fund | Information Technology | 27% |
| Fund | Investment | Date of Acquisition | Cost | Value | Percentage of Net Assets | |||||
Aviva Multi-Strategy Target Return Fund | Safran SA | 2/16/2018 | $27 | $26 | 0.1% |
| Fund | Interest Incurred on Borrowing | Average Dollar Amount of Borrowing | Weighted Average Interest Rate on Borrowing | Days Loan was Open | ||||
Duff & Phelps Select MLP and Energy Fund | $— (1) | $220 | 1.75% | 2 | ||||
KAR Long/Short Equity Fund | — (1) | 570 | 1.76 | 1 |
| (1) | Amount is less than $500. |
| Fund | Federal Tax Cost | Unrealized Appreciation | Unrealized (Depreciation) | Net Unrealized Appreciation (Depreciation) | ||||
Aviva Multi-Strategy Target Return Fund- securities and derivatives | $ 28,623 | $ 1,626 | $ (1,011) | $ 615 | ||||
| Aviva Multi-Strategy Target Return Fund - Written Options | (750) | — | — | — | ||||
Duff & Phelps Select MLP and Energy Fund | 6,986 | 213 | (2,475) | (2,262) | ||||
KAR Long/Short Equity Fund | 88,786 | 21,734 | (906) | 20,828 |
| Fund | Federal Tax Cost | Unrealized Appreciation | Unrealized (Depreciation) | Net Unrealized Appreciation (Depreciation) | ||||
| KAR Long/Short Equity Fund - Short Sales | (16,770) | 2,355 | (3,279) | (924) |
| Short-Term | Long-Term | ||
Aviva Multi-Strategy Target Return Fund | $2,050 | $343 | |
Duff & Phelps Select MLP and Energy Fund | 340 | 794 |
| Late Year Ordinary Losses Deferred | Late Year Ordinary Losses Recognized | ||
Aviva Multi-Strategy Target Return Fund | $ 94 | $ — | |
Duff & Phelps Select MLP and Energy Fund | 50 | (153) |
| Undistributed Ordinary Income | |
| KAR Long/Short Equity Fund | $1,009 |
| Ordinary Income | Long-Term Capital Gains | Return of Capital | Total | ||||
Aviva Multi-Strategy Target Return Fund | |||||||
10/31/20 | $ 52 | $— | $ — | $ 52 | |||
10/31/19 | 1,661 | — | — | 1,661 | |||
Duff & Phelps Select MLP and Energy Fund | |||||||
10/31/20 | — | — | 309 | 309 | |||
10/31/19 | 166 | — | 225 | 391 | |||
KAR Long/Short Equity Fund | |||||||
10/31/20 | 129 | — | — | 129 | |||
| 10/31/19 | — | — | — | — |
| Capital Paid in on Shares of Beneficial Interest | Total Distributable Earnings (Accumulated Losses) | ||
| Aviva Multi-Strategy Target Return Fund | $ (1,063) | $1,063 |
| Capital Paid in on Shares of Beneficial Interest | Total Distributable Earnings (Accumulated Losses) | ||
| Duff & Phelps Select MLP and Energy Fund | 31 | (31) |
| Virtus KAR Long/Short Equity Fund | Statement of operations for the year ended October 31, 2020, and statements of changes in net assets for the year ended October 31, 2020 and the period December 6, 2018 (inception) through October 31, 2019 |
| Virtus Aviva Multi-Strategy Target Return Fund Virtus Duff & Phelps Select MLP and Energy Fund | Statements of operations for the year ended October 31, 2020 and statements of changes in net assets for each of the two years in the period ended October 31, 2020 |
Philadelphia, Pennsylvania
December 22, 2020
| QDI | DRD | ||
KAR Long/Short Equity Fund | 54.94% | 54.44% |
| Name, Year of Birth, Length of Time Served and Number of Portfolios in Fund Complex Overseen by Trustee | Principal Occupation(s) During Past 5 Years | Other Directorships Held by Trustee During Past 5 Years |
| Brown, Thomas J. YOB: 1945 Served Since: 2016 68 Portfolios | Retired. | Honorary Board Member (since 2020), Duff & Phelps Select MLP and Midstream Energy Fund Inc., Virtus Total Return Fund Inc. and Virtus Global Multi-Sector Income Fund; Trustee (since 2016), Virtus Mutual Fund Family (54 portfolios) and Virtus Alternative Solutions Trust (3 portfolios); Trustee (since 2011), Virtus Variable Insurance Trust (8 portfolios); Director (since 2010), D’Youville Senior Care Center; and Director (since 2005), VALIC Company Funds (49 portfolios). |
| Burke, Donald C. YOB: 1960 Served Since: 2016 72 Portfolios | Retired. | Director (since 2020), Duff & Phelps Select MLP and Midstream Energy Fund Inc. and Virtus Total Return Fund Inc.; and Trustee (since 2020), Virtus Global Multi-Sector Income Fund; Trustee (since 2016), Virtus Mutual Fund Family (54 portfolios), Virtus Variable Insurance Trust (8 portfolios) and Virtus Alternative Solutions Trust (3 portfolios); Director (since 2014), closed-end funds managed by Duff & Phelps Investment Management Co. (4 funds); Director, Avista Corp. (energy company) (since 2011); Trustee, Goldman Sachs Fund Complex (2010 to 2014); and Director, BlackRock Luxembourg and Cayman Funds (2006 to 2010). |
| Harris, Sidney E. YOB: 1949 Served Since: 2017 68 Portfolios | Professor and Dean Emeritus (since April 2015), Professor (1997 to 2014), Dean (1997 to 2004), J. Mack Robinson College of Business, Georgia State University. | Director (since 2020), Duff & Phelps Select MLP and Midstream Energy Fund Inc. and Virtus Total Return Fund Inc.; Trustee (since 2020), Virtus Global Multi-Sector Income Fund; Trustee (since 2019), Mutual Fund Directors Forum; Trustee (since 2017), Virtus Mutual Fund Family (54 portfolios), Virtus Variable Insurance Trust (8 portfolios) and Virtus Alternative Solutions Trust (3 portfolios); Trustee (since 2013), KIPP Metro Atlanta; Director (1999 to 2019) Total System Services, Inc.; Trustee (2004 to 2017), RidgeWorth Funds; Trustee (since 2012), International University of the Grand Bassam Foundation; and Trustee (2011 to 2015), Genspring Family Offices, LLC. |
| Mallin, John R. YOB: 1950 Served Since: 2016 68 Portfolios | Partner/Attorney (since 2003), McCarter & English LLP (law firm), Real Property Practice Group; Member (since 2014), Counselors of Real Estate. | Director (since 2020), Duff & Phelps Select MLP and Midstream Energy Fund Inc. and Virtus Total Return Fund Inc.; Trustee (since 2020), Virtus Global Multi-Sector Income Fund; Trustee (since 2016), Virtus Mutual Fund Family (54 portfolios) and Virtus Alternative Solutions Trust (3 portfolios); Director (since 2013), Horizons, Inc. (non-profit); and Trustee (since 1999), Virtus Variable Insurance Trust (8 portfolios). |
| McClellan, Hassell H. YOB: 1945 Served Since: 2015 68 Portfolios | Retired. Professor (1984 to 2013), Wallace E. Carroll School of Management, Boston College. | Honorary Board Member (since 2020), Duff & Phelps Select MLP and Midstream Energy Fund Inc., Virtus Total Return Fund Inc. and Virtus Global Multi-Sector Income Fund; Chairperson of the Board (since 2017) and Trustee (since 2000), John Hancock Fund Complex (collectively, 227 portfolios); Trustee (since 2016), Virtus Alternative Solutions Trust (3 portfolios); Trustee since 2015), Virtus Mutual Fund Family (54 portfolios); Director (since 2010), Barnes Group, Inc. (diversified global components manufacturer and logistical services company); and Trustee (since 2008), Virtus Variable Insurance Trust (8 portfolios). |
| McDaniel, Connie D. YOB: 1958 Served Since: 2017 68 Portfolios | Retired (since 2013). Vice President, Chief of Internal Audit, Corporate Audit Department (2009 to 2013), Vice President Global Finance Transformation (2007 to 2009), Vice President and Controller (1999 to 2007), The Coca-Cola Company. | Director (since 2020), Duff & Phelps Select MLP and Midstream Energy Fund Inc. and Virtus Total Return Fund Inc.; Trustee (since 2020), Virtus Global Multi-Sector Income Fund; Director (since 2019), Global Payments Inc.; Trustee (since 2017), Virtus Mutual Fund Family (54 portfolios), Virtus Variable Insurance Trust (8 portfolios) and Virtus Alternative Solutions Trust (3 portfolios); Member (since 2011) and Chair (2014 to 2016), Georgia State University, Robinson College of Business Board of Advisors; Director (2014 to 2019), Total System Services, Inc.; and Trustee (2005 to 2017), RidgeWorth Funds. |
| Name, Year of Birth, Length of Time Served and Number of Portfolios in Fund Complex Overseen by Trustee | Principal Occupation(s) During Past 5 Years | Other Directorships Held by Trustee During Past 5 Years |
| McLoughlin, Philip YOB: 1946 Served Since: 2013 72 Portfolios | Retired. | Director and Chairman (since 2016), Virtus Total Return Fund Inc.; Director and Chairman (2016 to 2019), the former Virtus Total Return Fund Inc.; Director and Chairman (since 2014), Duff & Phelps Select MLP and Midstream Energy Fund Inc.; Trustee and Chairman (since 2013), Virtus Alternative Solutions Trust (3 portfolios); Trustee and Chairman (since 2011), Virtus Global Multi-Sector Income Fund; Chairman and Trustee (since 2003), Virtus Variable Insurance Trust (8 portfolios); Director (since 1995), closed-end funds managed by Duff & Phelps Investment Management Co. (4 funds); Director (1991 to 2019) and Chairman (2010 to 2019), Lazard World Trust Fund (closed-end investment firm in Luxembourg); and Trustee (since 1989) and Chairman (since 2002), Virtus Mutual Fund Family (54 portfolios). |
| McNamara, Geraldine M. YOB: 1951 Served Since: 2001 72 Portfolios | Retired. | Director (since 2020), Duff & Phelps Select MLP and Midstream Energy Fund Inc. and Virtus Total Return Fund Inc.; Trustee (since 2020), Virtus Global Multi-Sector Income Fund; Trustee (since 2016), Virtus Alternative Solutions Trust (3 portfolios); Trustee (since 2015), Virtus Variable Insurance Trust (8 portfolios); Director (since 2003), closed-end funds managed by Duff & Phelps Investment Management Co. (4 funds); and Trustee (since 2001), Virtus Mutual Fund Family (54 portfolios). |
| Oates, James M. YOB: 1946 Served Since: 2013 68 Portfolios | Managing Director (since 1994), Wydown Group (consulting firm). | Director (since 2016), Virtus Total Return Fund Inc.; Director (2016 to 2019), the former Virtus Total Return Fund Inc.; Trustee (since 2016), Virtus Variable Insurance Trust (8 portfolios); Director (since 2014), Duff & Phelps Select MLP and Midstream Energy Fund Inc.; Trustee (since 2013), Virtus Alternative Solutions Trust (3 portfolios); Trustee (since 2013), Virtus Global Multi-Sector Income Fund; Trustee (since 2005) and Chairman (2005 to 2017), John Hancock Fund Complex (227 portfolios); Director (2002 to 2014), New Hampshire Trust Company; Chairman (2000 to 2016), Emerson Investment Management, Inc.; Non-Executive Chairman (2000 to 2014), Hudson Castle Group, Inc. (formerly IBEX Capital Markets, Inc.) (financial services); Chairman and Director (1999 to 2014), Connecticut River Bank; Director (since 1996), Stifel Financial; and Trustee (since 1987), Virtus Mutual Fund Family (54 portfolios). |
| Segerson, Richard E. YOB: 1946 Served Since: 2016 68 Portfolios | Retired. Managing Director (1998 to 2013), Northway Management Company. | Honorary Board Member (since 2020), Duff & Phelps Select MLP and Midstream Energy Fund Inc., Virtus Total Return Fund Inc. and Virtus Global Multi-Sector Income Fund; Trustee (since 2016), Virtus Alternative Solutions Trust (3 portfolios) and Virtus Variable Insurance Trust (8 portfolios); and Trustee (since 1983), Virtus Mutual Fund Family (54 portfolios). |
| Walton, R. Keith YOB: 1964 Served Since: 2020 68 Portfolios | Venture and Operating Partner (since 2020), Plexo Capital, LLC; Venture Partner (since 2019) and Senior Adviser (2018 to 2019), Plexo, LLC; Senior Adviser (2018 to 2019), Vatic Labs, LLC; Executive Vice President, Strategy (2017 to 2019), Zero Mass Water, LLC; Vice President, Strategy (2013 to 2017), Arizona State University; Partner (since 2006), Global Infrastructure Partners. | Trustee (since 2020) Virtus Alternative Solutions Trust (3 portfolios), Virtus Variable Insurance Trust (8 portfolios) and Virtus Mutual Fund Family (54 portfolios); Director (since 2017), certain funds advised by Bessemer Investment Management LLC; Director (since 2016), Duff & Phelps Select MLP and Midstream Energy Fund Inc.; Trustee (since 2016), Virtus Global Multi-Sector Income Fund; Director (2006 to 2019), Systematica Investments Limited Funds; Director (2006 to 2017), BlueCrest Capital Management Funds; Trustee (2014 to 2017), AZ Service; Director (since 2004), Virtus Total Return Fund Inc.; and Director (2004 to 2019), the former Virtus Total Return Fund Inc. |
| Zino, Brian T. YOB: 1952 Served Since: 2020 68 Portfolios | Retired. Various roles (1982 to 2008), J. & W. Seligman & Co. Incorporated, including President (1994 to 2008). | Trustee (since 2020) Virtus Alternative Solutions Trust (3 portfolios), Virtus Variable Insurance Trust (8 portfolios) and Virtus Mutual Fund Family (54 portfolios); Director (since 2016), Duff & Phelps Select MLP and Midstream Energy Fund Inc.; Trustee (since 2016), Virtus Global Multi-Sector Income Fund; Director (since 2014), Virtus Total Return Fund Inc.; Director (2014 to 2019), the former Virtus Total Return Fund Inc.; Trustee (since 2011), Bentley University; Director (1986 to 2008) and President (1994 to 2008), J&W Seligman Co. Inc.; Director (1998 to 2009), Chairman (2002 to 2004) and Vice Chairman (2000 to 2002), ICI Mutual Insurance Company; Member, Board of Governors of ICI (1998 to 2008). |
| Name, Year of Birth, Length of Time Served and Number of Funds Overseen | Principal Occupation(s) During Past 5 Years | Principal Occupation(s) During Past 5 Years and Other Directorships Held by Trustee |
| Aylward, George R.* Trustee and President YOB: 1964 Served Since: 2006 71 Portfolios | Director, President and Chief Executive Officer (since 2008), Virtus Investment Partners, Inc. and/or certain of its subsidiaries, and various senior officer positions with Virtus affiliates (since 2005). | Chairman and Trustee (since 2015), Virtus ETF Trust II (3 portfolios); Director, President and Chief Executive Officer (since 2014), Duff & Phelps Select MLP and Midstream Energy Fund Inc.; Trustee and President (since 2013), Virtus Alternative Solutions Trust (3 portfolios); Director (since 2013), Virtus Global Funds, PLC (5 portfolios); Trustee (since 2012) and President (since 2010), Virtus Variable Insurance Trust (8 portfolios); Trustee, President and Chief Executive Officer (since 2011), Virtus Global Multi-Sector Income Fund; Trustee and President (since 2006) and Executive Vice President (2004 to 2006), Virtus Mutual Fund Family (54 portfolios); Director, President and Chief Executive Officer (since 2006), Virtus Total Return Fund Inc.; and Director, President and Chief Executive Officer (2006 to 2019), the former Virtus Total Return Fund Inc. |
| Name, Year of Birth, Length of Time Served, and Number of Portfolios in Fund Complex Overseen | Principal Occupation(s) During Past 5 Years | Other Directorships Held by Trustee During Past 5 Years |
| Moyer, William R. YOB: 1944 Served Since: 2020 68 Portfolios | Private investor (since 2004); Financial and Operations Principal (2006 to 2017), Newcastle Distributors LLC (broker dealer). | Advisory Board Member (since 2020), Virtus Variable Insurance Trust (8 portfolios) and Virtus Mutual Fund Family (54 portfolios); Advisory Board Member (since 2020) and Director (2016 to 2019), Virtus Total Return Fund Inc.; Director (2016 to 2019), the former Virtus Total Return Fund Inc.; Advisory Board Member (since 2020) and Director (2014 to 2019), Duff & Phelps Select MLP and Midstream Energy Fund Inc.; Advisory Board Member (since 2020) and Trustee (2011 to 2019), Virtus Global Multi-Sector Income Fund; Advisory Board Member (since 2020) and Trustee (2013 to 2016), Virtus Alternative Solutions Trust (3 portfolios). |
| Name, Address and Year of Birth | Position(s) Held with Trust and Length of Time Served | Principal Occupation(s) During Past 5 Years |
| Batchelar, Peter J. YOB: 1970 | Senior Vice President (since 2017), and Vice President (2013 to 2016). | Senior Vice President, Product Development (since 2017), Vice President, Product Development (2008 to 2016), and various officer positions (since 2008), Virtus Investment Partners, Inc. and/or certain of its subsidiaries; Senior Vice President (since 2017), Vice President (2008 to 2016), Virtus Mutual Fund Family; Senior Vice President (since 2017), Vice President (2010 to 2016), Virtus Variable Insurance Trust; Senior Vice President (since 2017), Vice President (2013 to 2016), Virtus Alternative Solutions Trust; Senior Vice President (since 2017) and Vice President (2016 to 2017), Duff & Phelps Select MLP and Midstream Energy Fund Inc., Virtus Total Return Fund Inc. and Virtus Global Multi-Sector Income Fund; and Senior Vice President (2017 to 2019) and Vice President (2016 to 2017), the former Virtus Total Return Fund Inc. |
| Name, Address and Year of Birth | Position(s) Held with Trust and Length of Time Served | Principal Occupation(s) During Past 5 Years |
| Bradley, W. Patrick YOB: 1972 | Executive Vice President (since 2016); Senior Vice President (2013 to 2016); Vice President (2011 to 2013); Chief Financial Officer and Treasurer (since 2013). | Executive Vice President, Fund Services (since 2016), Senior Vice President, Fund Services (2010 to 2016), and various officer positons (since 2006), Virtus Investment Partners, Inc. and/or certain of its subsidiaries; Director (since 2019), Virtus Global Funds ICAV; Executive Vice President (since 2016), Senior Vice President (2013 to 2016), Vice President (2011 to 2013), Chief Financial Officer and Treasurer (since 2004), Virtus Variable Insurance Trust; Executive Vice President (since 2016), Senior Vice President (2013 to 2016), Vice President (2011 to 2013), Chief Financial Officer and Treasurer (since 2006), Virtus Mutual Fund Family; Executive Vice President (since 2016), Senior Vice President (2013 to 2016), Vice President (2012 to 2013) and Treasurer and Chief Financial Officer (since 2010), Virtus Total Return Fund Inc.; Executive Vice President (2016 to 2019), Senior Vice President (2013 to 2016), Vice President (2012 to 2013), Treasurer and Chief Financial Officer (since 2010), the former Virtus Total Return Fund Inc.; Executive Vice President (since 2016), Senior Vice President (2013 to 2016), Vice President (2011 to 2013), Chief Financial Officer and Treasurer (since 2011), Virtus Global Multi-Sector Income Fund; Executive Vice President (since 2016), Senior Vice President (2014 to 2016), Chief Financial Officer and Treasurer (since 2014), Duff & Phelps Select MLP and Midstream Energy Fund Inc.; Vice President and Assistant Treasurer (since 2011), Duff & Phelps Utility and Infrastructure Fund Inc.; Director (since 2013), Virtus Global Funds, PLC; and Executive Vice President (since 2016), Senior Vice President (2013 to 2016), and Chief Financial Officer and Treasurer (since 2013), Virtus Alternative Solutions Trust. |
| Carr, Kevin J. YOB: 1954 | Senior Vice President (since 2017) and Assistant Secretary (since 2013). | Vice President and Senior Counsel (2017 to Present), Senior Vice President (2009 to 2017), Vice President, Counsel and Secretary (2008 to 2009), and various officer positions (since 2005), Virtus Investment Partners, Inc. and/or certain of its subsidiaries; Senior Vice President (since 2013), Vice President (2005 to 2013),Chief Legal Officer, Counsel and Secretary (since 2005), Virtus Mutual Fund Family; Senior Vice President (2013 to 2014), Vice President (2012 to 2013), Secretary and Chief Legal Officer (2005 to 2013), and Assistant Secretary (2013 to 2014 and since 2017), Virtus Total Return Fund Inc.; Senior Vice President (2013 to 2014), Vice President (2012 to 2013),Secretary and Chief Legal Officer (2005 to 2013) and Assistant Secretary (2013 to 2014 and 2017 to 2019), the former Virtus Total Return Fund Inc.; Senior Vice President (since 2017), Assistant Secretary (since 2013), Vice President, Chief Legal Officer, Counsel and Secretary (2010 to 2013), Virtus Variable Insurance Trust; Senior Vice President (2013 to 2014),Vice President (2011 to 2013), and Assistant Secretary (since 2011), Virtus Global Multi-Sector Income Fund; Assistant Secretary (since 2015), Duff & Phelps Select MLP and Midstream Energy Fund Inc.; Senior Vice President (since 2017) and Assistant Secretary (since 2013), Virtus Alternative Solutions Trust; Secretary (since 2015), ETFis Series Trust I; and Secretary (since 2015), Virtus ETF Trust II. |
| Engberg, Nancy J. YOB: 1956 | Senior Vice President (since 2017); Vice President (2013 to 2017); and Chief Compliance Officer (since 2013). | Senior Vice President (since 2017), Vice President (2008 to 2017) and Chief Compliance Officer (2008 to 2011 and since 2016), and various officer positions (since 2003), Virtus Investment Partners, Inc. and/or certain of its subsidiaries; Senior Vice President (since 2017), Vice President (2011 to 2017) and Chief Compliance Officer (since 2011), Virtus Mutual Fund Family; Senior Vice President (since 2017), Vice President (2010 to 2017) and Chief Compliance Officer (since 2011), Virtus Variable Insurance Trust; Senior Vice President (since 2017), Vice President (2011 to 2017) and Chief Compliance Officer (since 2011), Virtus Global Multi-Sector Income Fund; Senior Vice President (since 2017), Vice President (2012 to 2017) and Chief Compliance Officer (since 2012), Virtus Total Return Fund Inc.; Senior Vice President (2017 to 2019), Vice President (2012 to 2017) and Chief Compliance Officer (since 2012), the former Virtus Total Return Fund Inc.; Senior Vice President (since 2017), Vice President (2013 to 2016) and Chief Compliance Officer (since 2013), Virtus Alternative Solutions Trust; Senior Vice President (since 2017), Vice President (2014 to 2017) and Chief Compliance Officer (since 2014), Duff & Phelps Select MLP and Midstream Energy Fund Inc.; Chief Compliance Officer (since 2015), ETFis Series Trust I; and Chief Compliance Officer (since 2015), Virtus ETF Trust II. |
| Name, Address and Year of Birth | Position(s) Held with Trust and Length of Time Served | Principal Occupation(s) During Past 5 Years |
| Fromm, Jennifer YOB: 1973 | Vice President, Chief Legal Officer and Secretary (since 2013). | Vice President (since 2016) and Senior Counsel (since 2007), Virtus Investment Partners, Inc. and /or certain of its subsidiaries; Vice President and Secretary (since 2020), DNP Select Income Fund Inc., Duff & Phelps Utility and Infrastructure Fund Inc., and DTF Tax-Free Income Inc.; Assistant Secretary (since 2020), Duff & Phelps Utility and Corporate Bond Trust Inc.; Vice President, Chief Legal Officer and Secretary (since 2019), Duff & Phelps Select MLP and Midstream Energy Fund Inc., Virtus Total Return Fund Inc. and Virtus Global Multi-Sector Income Fund; Vice President (since 2017) and Assistant Secretary (since 2008), Virtus Mutual Funds Family; Vice President, Chief Legal Officer, and Secretary (since 2013), Virtus Variable Insurance Trust; and Vice President, Chief Legal Officer, and Secretary (since 2013), Virtus Alternative Solutions Trust. |
| Short, Julia R. YOB: 1972 | Senior Vice President (since 2017). | Senior Vice President, Product Development (since 2017), Virtus Investment Partners, Inc. and/or certain of its subsidiaries; Senior Vice President (since 2018), Duff & Phelps Select MLP and Midstream Energy Fund Inc., Virtus Total Return Fund Inc. and Virtus Global Multi-Sector Income Fund; Senior Vice President (2018 to 2019), the former Virtus Total Return Fund Inc.; Senior Vice President (since 2017), Virtus Mutual Fund Family; President and Chief Executive Officer, RidgeWorth Funds (2007 to 2017); and Managing Director, Product Manager, RidgeWorth Investments (2004 to 2017). |
| Waltman, Francis G. YOB: 1962 | Executive Vice President (since 2013). | Executive Vice President, Product Management (since 2009), and various senior officer positions (since 2006), Virtus Investment Partners, Inc. and/or certain of its subsidiaries; Director (since 2019), Virtus Global Funds ICAV; Executive Vice President (since 2017), Virtus Total Return Fund Inc.; Executive Vice President (2017 to 2019), the former Virtus Total Return Fund Inc.; Executive Vice President (since 2014), Duff & Phelps Select MLP and Midstream Energy Fund Inc.; Executive Vice President (since 2013), Senior Vice President (2008 to 2013), Virtus Mutual Fund Family; Executive Vice President (since 2013), Senior Vice President (2010 to 2013), Virtus Variable Insurance Trust; Executive Vice President (since 2013), Senior Vice President (2011 to 2013), Virtus Global Multi-Sector Income Fund; Director (since 2013), Virtus Global Funds PLC; Executive Vice President (since 2013), Virtus Alternative Solutions Trust; Executive Vice President (since 2017), Virtus Total Return Fund Inc. |
dated February 28, 2020, as supplemented
| Amount of Transaction at Offering Price | Sales Charge as a Percentage of Offering Price | Sales Charge as a Percentage of Amount Invested |
| Under $50,000 | 5.50% | 5.82% |
| $50,000 but under $100,000 | 4.50% | 4.71% |
| $100,000 but under $250,000 | 3.50% | 3.63% |
| $250,000 but under $500,000 | 2.50% | 2.56% |
| $500,000 but under $1,000,00 | 2.00% | 2.04% |
| $1,000,000 or more | None | None |
| Amount of Transaction at Offering Price | Sales Charge as a Percentage of Offering Price | Sales Charge as a Percentage of Amount Invested | Dealer Discount as a Percentage of Offering Price |
| Under $50,000 | 5.50% | 5.82% | 4.75% |
| $50,000 but under $100,000 | 4.50% | 4.71% | 4.00% |
| $100,000 but under $250,000 | 3.50% | 3.63% | 3.00% |
| $250,000 but under $500,000 | 2.50% | 2.56% | 2.00% |
| $500,000 but under $1,000,000 | 2.00% | 2.04% | 1.75% |
| $1,000,000 or more | None | None | None |
Accounting Firm
| Mutual Fund Services | 1-800-243-1574 |
| Adviser Consulting Group | 1-800-243-4361 |
| Website | Virtus.com |
The Securities and Exchange Commission has modified mailing regulations for semiannual and annual shareholder fund reports to allow mutual fund companies to send a single copy of these reports to shareholders who share the same mailing address. If you would like additional copies, please call Mutual Fund Services at 1-800-243-1574.

please contact us at 1-800-243-1574, or Virtus.com.
| 8555 | 12-20 |
Item 2. Code of Ethics.
| (a) | The registrant, as of the end of the period covered by this report, has adopted a code of ethics that applies to the registrant’s principal executive officer, principal financial officer, principal accounting officer or controller, or persons performing similar functions, regardless of whether these individuals are employed by the registrant or a third party. |
| (c) | There have been no amendments, during the period covered by this report, to a provision of the code of ethics that applies to the registrant’s principal executive officer, principal financial officer, principal accounting officer or controller, or persons performing similar functions, regardless of whether these individuals are employed by the registrant or a third party, and that relates to any element of the code of ethics described in Item 2(b) of the instructions for completion of Form N-CSR. |
| (d) | The registrant has not granted any waivers during the period covered by this report, including an implicit waiver, from a provision of the code of ethics that applies to the registrant’s principal executive officer, principal financial officer, principal accounting officer or controller, or persons performing similar functions, regardless of whether these individuals are employed by the registrant or a third party, that relates to one or more of the items set forth in paragraph (b) of this item’s instructions. |
Item 3. Audit Committee Financial Expert.
| (a)(1) | The Registrant’s Board of Trustees has determined that the Registrant has an “audit committee financial expert” serving on its Audit Committee. |
| (a)(2) | The Registrant’s Board of Trustees has determined that Donald C. Burke, Thomas J. Brown and Richard E. Segerson each possess the technical attributes identified in Instruction 2(b) of Item 3 to Form N-CSR to qualify as an “audit committee financial expert.” Each of Mr. Burke, Mr. Brown and Mr. Segerson is an “independent” trustee as defined in paragraph (a)(2) of Item 3 to Form N-CSR. |
| (a)(3) | Not applicable. |
Item 4. Principal Accountant Fees and Services.
Audit Fees
| (a) | The aggregate fees billed for each of the last two fiscal years for professional services rendered by the principal accountant for the audit of the registrant’s annual financial statements or services that are normally provided by the accountant in connection with statutory and regulatory filings or engagements for those fiscal years are $78,600 for 2020 and $74,700 for 2019. |
Audit-Related Fees
| (b) | The aggregate fees billed in each of the last two fiscal years for assurance and related services by the principal accountant that are reasonably related to the performance of the audit of the registrant’s financial statements and are not reported under paragraph (a) of this Item are $4,700 for 2020 and $12,837 for 2019. Such audit-related fees include out of pocket expenses and fees related to a new fund launch. |
Tax Fees
| (c) | The aggregate fees billed in each of the last two fiscal years for professional services rendered by the principal accountant for tax compliance, tax advice, and tax planning are $19,919 for 2020 and $22,747 for 2019. |
“Tax Fees” are primarily associated with review of the Trust’s tax provision and qualification as a regulated investment company (RIC) in connection with audits of the Trust’s financial statement, review of year-end distributions by the Fund to avoid excise tax for the Trust, periodic discussion with management on tax issues affecting the Trust, and reviewing and signing the Fund’s federal income tax returns.
All Other Fees
| (d) | The aggregate fees billed in each of the last two fiscal years for products and services provided by the principal accountant, other than the services reported in paragraphs (a) through (c) of this Item are $0 for 2020 and $0 for 2019. |
| (e)(1) | Disclose the audit committee’s pre-approval policies and procedures described in paragraph (c)(7) of Rule 2-01 of Regulation S-X. |
The Board of Trustees of Virtus Alternative Solutions Trust (the “Fund”) has adopted policies and procedures with regard to the pre-approval of services provided by its independent auditors. Audit, audit-related and tax compliance services provided to the Fund on an annual basis require specific pre-approval by the Audit Committee. The Audit Committee also must approve other non-audit services provided to the Fund and those non-audit services provided to the Fund’s Affiliated Service Providers that relate directly to the operations and financial reporting of the Fund. Certain of these non-audit services that the Audit Committee believes are a) consistent with the SEC’s auditor independence rules and b) routine and recurring services that will not impair the independence of the independent auditors may be approved by the Audit Committee without consideration on a specific case-by-case basis (“general pre-approval”).
The Audit Committee has determined that Thomas J. Brown, Chair of the Audit Committee, may provide pre-approval for such services that meet the above requirements in the event such approval is sought between regularly scheduled meetings. In any event, the Audit Committee is
informed of each service approved subject to general pre-approval at the next regularly scheduled in-person Audit Committee meeting.
| (e)(2) | The percentage of services described in each of paragraphs (b) through (d) of this Item that were approved by the audit committee pursuant to paragraph (c)(7)(i)(C) of Rule 2-01 of Regulation S-X are as follows: |
(b) 0%
(c) 0%
(d) N/A
| (f) | The percentage of hours expended on the principal accountant’s engagement to audit the registrant’s financial statements for the most recent fiscal year that were attributed to work performed by persons other than the principal accountant’s full-time, permanent employees was less than fifty percent. |
| (g) | The aggregate non-audit fees billed by the registrant’s accountant for services rendered to the registrant, and rendered to the registrant’s investment adviser (not including any sub-adviser whose role is primarily portfolio management and is subcontracted with or overseen by another investment adviser), and any entity controlling, controlled by, or under common control with the adviser that provides ongoing services to the registrant for each of the last two fiscal years of the registrant was $24,619 for 2020 and $35,584 for 2019. |
| (h) | The registrant’s audit committee of the board of trustees has considered whether the provision of non-audit services that were rendered to the registrant’s investment adviser (not including any sub-adviser whose role is primarily portfolio management and is subcontracted with or overseen by another investment adviser), and any entity controlling, controlled by, or under common control with the investment adviser that provides ongoing services to the registrant that were not pre-approved pursuant to paragraph (c)(7)(ii) of Rule 2-01 of Regulation S-X is compatible with maintaining the principal accountant’s independence. |
Item 5. Audit Committee of Listed Registrants.
Not applicable.
Item 6. Investments.
(a) Schedule of Investments in securities of unaffiliated issuers as of the close of the reporting period is included as part of the report to shareholders filed under Item 1 of this form.
(b) Not applicable.
| Item 7. | Disclosure of Proxy Voting Policies and Procedures for Closed-End Management Investment Companies. |
Not applicable.
Item 8. Portfolio Managers of Closed-End Management Investment Companies.
Not applicable.
| Item 9. | Purchases of Equity Securities by Closed-End Management Investment Company and Affiliated Purchasers. |
Not applicable.
Item 10. Submission of Matters to a Vote of Security Holders.
There have been no material changes to the procedures by which the shareholders may recommend nominees to the registrant’s board of trustees, where those changes were implemented after the registrant last provided disclosure in response to the requirements of Item 407(c)(2)(iv) of Regulation S-K (17 CFR 229.407) (as required by Item 22(b)(15) of Schedule 14A (17 CFR 240.14a-101)), or this Item.
Item 11. Controls and Procedures.
| (a) | The registrant’s principal executive and principal financial officers, or persons performing similar functions, have concluded that the registrant’s disclosure controls and procedures (as defined in Rule 30a-3(c) under the Investment Company Act of 1940, as amended (the “1940 Act”) (17 CFR 270.30a-3(c))) are effective, as of a date within 90 days of the filing date of the report that includes the disclosure required by this paragraph, based on their evaluation of these controls and procedures required by Rule 30a-3(b) under the 1940 Act (17 CFR 270.30a-3(b)) and Rules 13a-15(b) or 15d-15(b) under the Securities Exchange Act of 1934, as amended (17 CFR 240.13a-15(b) or 240.15d-15(b)). |
| (b) | There were no changes in the registrant’s internal control over financial reporting (as defined in Rule 30a-3(d) under the 1940 Act (17 CFR 270.30a-3(d))) that occurred during the registrant’s most recent fiscal period that has materially affected, or is reasonably likely to materially affect, the registrant’s internal control over financial reporting. |
Item 12. Disclosure of Securities Lending Activities for Closed-End Management Investment Companies.
Not applicable.
Item 13. Exhibits.
(a)(1) |
(a)(2) | ||
(a)(3) | Not applicable. | |
(a)(4) | Not applicable. | |
(b) | ||
SIGNATURES
Pursuant to the requirements of the Securities Exchange Act of 1934 and the Investment Company Act of 1940, the registrant has duly caused this report to be signed on its behalf by the undersigned, thereunto duly authorized.
(Registrant) | Virtus Alternative Solutions Trust |
By (Signature and Title)* | /s/ George R. Aylward | |||
George R. Aylward, President | ||||
(principal executive officer) |
Date | 01/06/2021 |
Pursuant to the requirements of the Securities Exchange Act of 1934 and the Investment Company Act of 1940, this report has been signed below by the following persons on behalf of the registrant and in the capacities and on the dates indicated.
By (Signature and Title)* | /s/ George R. Aylward | |||
George R. Aylward, President | ||||
(principal executive officer) |
Date | 01/06/2021 |
By (Signature and Title)* | /s/ W. Patrick Bradley | |||
W. Patrick Bradley, Executive Vice President, Chief Financial Officer and Treasurer | ||||
(principal financial and accounting officer) |
Date | 01/04/2021 |
* Print the name and title of each signing officer under his or her signature.