UNITED STATES
SECURITIES AND EXCHANGE COMMISSION
Washington, D.C. 20549
FORM N-CSR
CERTIFIED SHAREHOLDER REPORT OF REGISTERED MANAGEMENT
INVESTMENT COMPANIES
| Investment Company Act file number | 811-22912 |
| | |
| | BNY Mellon Investment Funds II, Inc. | |
| | (Exact name of Registrant as specified in charter) | |
| | | |
| | c/o BNY Mellon Investment Adviser, Inc. 240 Greenwich Street New York, New York 10286 | |
| | (Address of principal executive offices) (Zip code) | |
| | | |
| | Deirdre Cunnane, Esq. 240 Greenwich Street New York, New York 10286 | |
| | (Name and address of agent for service) | |
| |
| Registrant's telephone number, including area code: | (212) 922-6400 |
| | |
Date of fiscal year end: | 10/31 | |
| Date of reporting period: | 10/31/2023 | |
| | | | | | | |
FORM N-CSR
Item 1. Reports to Stockholders.
BNY Mellon Global Emerging Markets Fund
| |
ANNUAL REPORT October 31, 2023 |
| |
Save time. Save paper. View your next shareholder report online as soon as it’s available. Log into www.im.bnymellon.com and sign up for eCommunications. It’s simple and only takes a few minutes. |
| |
The views expressed in this report reflect those of the portfolio manager(s) only through the end of the period covered and do not necessarily represent the views of BNY Mellon Investment Adviser, Inc. or any other person in the BNY Mellon Investment Adviser, Inc. organization. Any such views are subject to change at any time based upon market or other conditions and BNY Mellon Investment Adviser, Inc. disclaims any responsibility to update such views. These views may not be relied on as investment advice and, because investment decisions for a fund in the BNY Mellon Family of Funds are based on numerous factors, may not be relied on as an indication of trading intent on behalf of any fund in the BNY Mellon Family of Funds. |
| |
Not FDIC-Insured • Not Bank-Guaranteed • May Lose Value |
Contents
T H E F U N D
F O R M O R E I N F O R M AT I O N
Back Cover
DISCUSSION OF FUND PERFORMANCE (Unaudited)
For the period from November 1, 2022, through October 31, 2023, as provided by Portfolio Managers, Alex Khosla and Liliana Castillo Dearth of Newton Investment Management Limited, sub-adviser.
Market and Fund Performance Overview
For the 12-month period ended October 31, 2023, the BNY Mellon Global Emerging Markets Fund (the “fund”) produced a total return of 5.95% for Class A shares, 5.13% for Class C shares, 6.22% for Class I and 6.31% for Class Y shares.1 In comparison, the fund’s benchmark, the MSCI Emerging Markets Index (the “Index”), produced a total return of 10.80% for the same period.2
Emerging-markets equities gained ground during the reporting period as global economic growth continued in the face of high inflation and rising interest rates; the Chinese economy reopened after the government rescinded its “zero-COVID-19” policy; and the U.S. dollar weakened relative to most international currencies. The fund underperformed the Index largely due to disappointing individual stock selections.
The Fund’s Investment Approach
The fund seeks long-term capital appreciation. To pursue its goal, the fund normally invests at least 80% of its net assets, plus any borrowings for investment purposes, in common stocks and other equity securities (or derivative or other strategic instruments with similar economic characteristics) of companies organized or with their principal place of business, or majority of assets or business, in emerging-markets countries. The sub-adviser employs a fundamental, bottom-up investment process that emphasizes quality, return on capital employed and governance. The process of identifying investment ideas begins by identifying a core list of investment themes. These themes are based primarily on observable, global economic, industrial or social trends that the sub-adviser believes will positively affect certain sectors or industries and cause stocks within these sectors or industries to outperform others. The sub-adviser then identifies specific companies, using investment themes to help focus on areas where thematic and strategic research indicate positive returns are likely to be achieved.
Emerging-Markets Equities Gain on Positive Macroeconomic Trends
In the wake of sharp declines during the prior year related to the pandemic, the war in Ukraine and rising inflation, emerging-markets equities rebounded during the reporting period. The period started on a positive note, as inflation eased, the U.S. dollar weakened, and the U.S. Federal Reserve (the “Fed”) signaled slower interest-rate increases to come. Stocks maintained their upward trajectory at year-end, as China eased its draconian COVID-19 policies, clearing the way for a widely anticipated economic reopening. The Chinese government also loosened its regulatory crackdown on wide swaths of its domestic technology, real estate and education industries, offering hopes for an even wider economic reawakening. Positive trends continued in early 2023, with risk-on sentiment predominating in January and February. However, in early March, signs of stress emerged in the U.S. banking sector. As the period continued, uncertainties mounted over the slow pace of China’s recovery, turmoil within the country’s property sector and a worsening in U.S.-China relations, with the threat of U.S. restrictions on investments in China, including artificial
2
intelligence (“AI”), quantum computing and semiconductor companies. Rising U.S. government bond yields added further pressure.
Emerging markets lost ground during the final three months of the period in the face of the developments mentioned above, as well as renewed oil price increases and technical dynamics, such as substantial government bond issuance meeting reduced interest from several major international buyers. Arguably more significant was the growing realization that U.S. interest rates would stay “higher for longer,” as the Fed had been suggesting for some time, given the continuing resilience of the U.S. economy. The outbreak of armed conflict in the Middle East in October 2023 also undermined sentiment. Chinese economic data continued to be mixed, with the weakness of the housing market of particular concern. However, some relief came from the release of more positive data relating to manufacturing activity, industrial production and retail sales later in the period. Investors were also encouraged by policy support, as Chinese authorities signaled the beginning of a normalized regulatory environment for large financial technology platforms. The Chinese politburo meeting in July 2023 was more dovish than expected, pledging to boost consumption and addressing market concerns about local government debt. In addition, the Chinese authorities lowered down-payment ratios and reduced home mortgage rates to give relief to first-time home buyers.
Stock Selections Detract from Relative Performance
Several individual stock selections detracted from the fund’s performance relative to the Index. Battery-makers Samsung SDI Co. Ltd. and Wuxi Lead Intelligent Equipment Co. Ltd., based in South Korea and China, respectively, underperformed as investors questioned the resilience of orders in a recessionary environment and demand challenges for electric vehicles (“EVs”). U.S.-based lithium miner Livent Corp. also detracted, as some investors pointed to potential overcapacity and short-term headwinds for EV sales as factors that could weigh on the lithium market. Shares in China-based Meituan, a food delivery and online services provider, fell on concerns regarding rising competition as a Chinese social media company expanded its food-delivery business. Meituan shares came under additional pressure as holding company Tencent Holdings Ltd. distributed the majority of its shares in Meituan through a dividend. Shares in China-based packaged foods company Foshan Haitian Flavouring & Food Co. Ltd. trended downward after the company posted weaker-than-expected net profits and sales due to increased competition. Shares in China-based solar power equipment manufacturer LONGi Green Energy Technology Co. Ltd. declined due to concerns regarding intensifying competition as solar photovoltaic wafer industry capacity continued to build out, and because of a mismatch between supply and demand for wafers and modules in the solar supply chain. Shares of Sungrow Power Supply Co. Ltd., China’s market-leading producer of inverters and energy-storage systems, lost ground as the market became concerned with inventory digestion and shorter-term demand trends. The fund’s position in Shenzhen Inovance Technology Co. Ltd. also detracted from relative returns, as the China-based industrial equipment maker’s increase in first-quarter 2023 profits failed to meet market expectations.
3
DISCUSSION OF FUND PERFORMANCE (Unaudited) (continued)
On the positive side, the top contributions to relative performance came from the financials sector, led by Brazil-based investment platform XP, Inc., which released expectations-beating revenue figures aided by a growth in client assets and active customers. The stock further benefited from the early drop in Brazilian interest rates. Indian online insurance marketplace PB Fintech Ltd. issued good results, with the path to profitability becoming much clearer. Chinese insurer Ping An Insurance Group Company of China Ltd. also performed relatively well on optimism that the economic reopening in China would boost economic growth. The fund’s zero weighting in Middle Eastern banks further bolstered relative returns. In the technology sector, ASML Holding NV was a notable contributor, as the Netherlands-based semiconductor manufacturer reported a record order backlog and earnings that exceeded market estimates, forecasting strong sales despite increasingly tough U.S.-led restrictions on exports to China. The stock, along with the fund’s other semiconductor-related holdings, such as Japan-based Advantest Corp., received a further boost as some investors predicted a bottom in the semiconductor cycle. Advantest Corp. also rode a wave of positive sentiment after U.S. chipmaker NVIDIA released guidance that vastly exceeded market expectations, driven by significant demand for chips used in generative AI systems. Among consumer cyclicals, shares in fast-food restaurant company Yum China Holdings, Inc. rose following the company’s positive investor day, at which management lifted its guidance for new store openings and expressed confidence in hitting its 2026 targets for growth in sales and operating profits, despite the challenging Chinese economic environment.
Remaining Focused on Long-Term Opportunities
Over the short term, we believe asset prices are likely to continue to be influenced by the inflationary forces we see in the United States, along with the Fed’s response. Other variables that will probably influence the trajectory of emerging-markets equities in the coming months include the conflict in Ukraine, commodity prices, the strength of the U.S. dollar, the evolution of the Chinese recovery and global macro-financial conditions. Emerging-markets equities currently trade at an unusually high discount to developed markets, providing a conducive backdrop if these shorter-term variables prove favorable for emerging markets.
That said, we are more comfortable highlighting the longer-term opportunities in emerging markets. These are based on relatively high levels of income growth, rapid increases in product penetration and scope for industry consolidation. We believe there are significant opportunities for emerging-markets companies that are well-exposed to reliable secular growth trends and that can exploit these opportunity more effectively than their peers through differentiated customer offering and execution. Accordingly, we believe that emerging-markets investors who can identify the right growth themes and companies should be rewarded over the long term.
As of October 31, 2023, on a country basis, the fund holds its largest overweight position relative to the Index in India, which we believe offers many of the best bottom-up investment opportunities in emerging markets for the next five years and beyond, viewed
4
against a favorable macroeconomic backdrop. The fund holds an underweight position in China/Hong Kong but has significant exposure to businesses poised to benefit, as China upgrades its economy to become self-sufficient or even assume leadership in certain strategic and value-add industries. On a sector basis, the fund holds its most overweight positions in the consumer staples and industrial sectors. We find several businesses with attractive attributes in these sectors, such as strong long-term growth opportunities and high returns on capital.
November 15, 2023
¹ Total return includes reinvestment of dividends and any capital gains paid and does not take into consideration the maximum initial sales charge in the case of Class A shares, or the applicable contingent deferred sales charges imposed on redemptions in the case of Class C shares. Had these charges been reflected, returns would have been lower. Past performance is no guarantee of future results. Share price, yield and investment return fluctuate such that upon redemption, fund shares may be worth more or less than their original cost. The fund’s return reflects the absorption of certain fund expenses by BNY Mellon Investment Adviser, Inc. pursuant to an agreement in effect through March 1, 2024, at which time it may be extended, modified or terminated. Had these expenses not been absorbed, returns would have been lower.
2 Source: Lipper Inc. — Reflects reinvestment of net dividends and, where applicable, capital gain distributions. The MSCI Emerging Markets Index is a free, float-adjusted, market capitalization-weighted index that is designed to measure equity market performance of emerging markets. Investors cannot invest directly in any index.
Please note: the position in any security highlighted with italicized typeface was sold during the reporting period.
Equities are subject generally to market, market sector, market liquidity, issuer and investment style risks, among other factors, to varying degrees, all of which are more fully described in the fund’s prospectus.
Emerging markets tend to be more volatile than the markets of more mature economies and generally have less diverse and less mature economic structures and less stable political systems than those of developed countries. The securities of companies located in emerging markets are often subject to rapid and large changes in price. An investment in this fund should be considered only as a supplement to a complete investment program for those investors willing to accept the greater risks associated with investing in emerging-markets countries.
Investing internationally involves special risks, including changes in currency exchange rates, political, economic and social instability, a lack of comprehensive company information, differing auditing and legal standards and less market liquidity. These risks generally are greater with emerging-markets countries than with more economically and politically established foreign countries.
The fund may, but is not required to, use derivative instruments. A small investment in derivatives could have a potentially large impact on the fund’s performance. The use of derivatives involves risks different from, or possibly greater than, the risks associated with investing directly in the underlying assets.
5
FUND PERFORMANCE (Unaudited)

Comparison of change in value of a $10,000 investment in Class A shares, Class C shares, and Class I shares of BNY Mellon Global Emerging Markets Fund with a hypothetical investment of $10,000 in the MSCI Emerging Markets Index (the “Index”).
† Source: Lipper Inc.
Past performance is not predictive of future performance.
The above graph compares a hypothetical $10,000 investment made in each of the Class A shares, Class C shares, and Class I shares of BNY Mellon Global Emerging Markets Fund on 2/3/14 (inception date) to a hypothetical investment of $10,000 made in the Index on that date. All dividends and capital gain distributions are reinvested.
The fund’s performance shown in the line graph above takes into account the maximum initial sales charge on Class A shares and all other applicable fees and expenses on all classes. The Index is a free float‐adjusted market capitalization-weighted index that is designed to measure equity market performance of emerging markets. Unlike a mutual fund, the Index is not subject to charges, fees and other expenses. Investors cannot invest directly in any index. Further information relating to fund performance, including expense reimbursements, if applicable, is contained in the Financial Highlights section of the prospectus and elsewhere in this report.
6
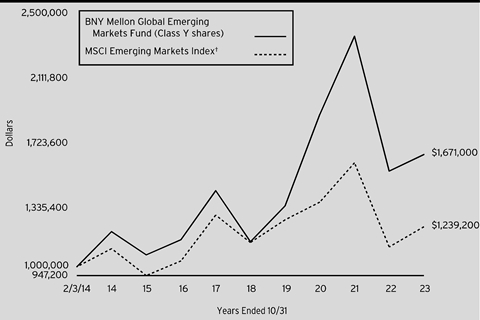
Comparison of change in value of a $1,000,000 investment in Class Y shares of BNY Mellon Global Emerging Markets Fund with a hypothetical investment of $1,000,000 in the MSCI Emerging Markets Index (the “Index”).
† Source: Lipper Inc.
Past performance is not predictive of future performance.
The above graph compares a hypothetical $1,000,000 investment made in Class Y shares of BNY Mellon Global Emerging Markets Fund on 2/3/14 (inception date) to a hypothetical investment of $1,000,000 made in the Index on that date. All dividends and capital gain distributions are reinvested.
The fund’s performance shown in the line graph above takes into account all applicable fees and expenses of the fund’s Class Y shares. The Index is a free float‐adjusted market capitalization-weighted index that is designed to measure equity market performance of emerging markets. Unlike a mutual fund, the Index is not subject to charges, fees and other expenses. Investors cannot invest directly in any index. Further information relating to fund performance, including expense reimbursements, if applicable, is contained in the Financial Highlights section of the prospectus and elsewhere in this report.
7
FUND PERFORMANCE (Unaudited) (continued)
| | | | | | | |
Average Annual Total Returns as of 10/31/203
|
| Inception
Date | 1 Year | 5 Year | | From
Inception |
Class A shares | | | | |
with maximum sales charge (5.75%) | 2/3/14 | -.17% | 6.15% | | 4.46% | |
without sales charge | 2/3/14 | 5.95% | 7.42% | | 5.09% | |
Class C shares | | | | |
with applicable redemption charge † | 2/3/14 | 4.13% | 6.60% | | 4.30% | |
without redemption | 2/3/14 | 5.13% | 6.60% | | 4.30% | |
Class I shares | 2/3/14 | 6.22% | 7.69% | | 5.33% | |
Class Y shares | 2/3/14 | 6.31% | 7.76% | | 5.41% | |
MSCI Emerging Markets Index | 1/31/14 | 10.80% | 1.59% | | 2.22% | †† |
† The maximum contingent deferred sales charge for Class C shares is 1% for shares redeemed within one year of the date of purchase.
†† For comparative purposes, the value of the Index as of 1/31/14 is used as the beginning value on 2/3/14.
The performance data quoted represents past performance, which is no guarantee of future results. Share price and investment return fluctuate and an investor’s shares may be worth more or less than original cost upon redemption. Current performance may be lower or higher than the performance quoted. Go to www.im.bnymellon.com for the fund’s most recent month-end returns.
The fund’s performance shown in the graphs and table does not reflect the deduction of taxes that a shareholder would pay on fund distributions or the redemption of fund shares. In addition to the performance of Class A shares shown with and without a maximum sales charge, the fund’s performance shown in the table takes into account all other applicable fees and expenses on all classes.
8
UNDERSTANDING YOUR FUND’S EXPENSES (Unaudited)
As a mutual fund investor, you pay ongoing expenses, such as management fees and other expenses. Using the information below, you can estimate how these expenses affect your investment and compare them with the expenses of other funds. You also may pay one-time transaction expenses, including sales charges (loads) and redemption fees, which are not shown in this section and would have resulted in higher total expenses. For more information, see your fund’s prospectus or talk to your financial adviser.
Review your fund’s expenses
The table below shows the expenses you would have paid on a $1,000 investment in BNY Mellon Global Emerging Markets Fund from May 1, 2023 to October 31, 2023. It also shows how much a $1,000 investment would be worth at the close of the period, assuming actual returns and expenses.
| | | | | | | |
Expenses and Value of a $1,000 Investment | |
Assume actual returns for the six months ended October 31, 2023 | |
| | | | | | |
| | Class A | Class C | Class I | Class Y | |
Expenses paid per $1,000† | $6.10 | $9.74 | $4.88 | $4.40 | |
Ending value (after expenses) | $935.50 | $932.00 | $936.60 | $937.40 | |
COMPARING YOUR FUND’S EXPENSES WITH THOSE OF OTHER FUNDS (Unaudited)
Using the SEC’s method to compare expenses
The Securities and Exchange Commission (“SEC”) has established guidelines to help investors assess fund expenses. Per these guidelines, the table below shows your fund’s expenses based on a $1,000 investment, assuming a hypothetical 5% annualized return. You can use this information to compare the ongoing expenses (but not transaction expenses or total cost) of investing in the fund with those of other funds. All mutual fund shareholder reports will provide this information to help you make this comparison. Please note that you cannot use this information to estimate your actual ending account balance and expenses paid during the period.
| | | | | | | |
Expenses and Value of a $1,000 Investment | |
Assuming a hypothetical 5% annualized return for the six months ended October 31, 2023 | |
| | | | | | |
| | Class A | Class C | Class I | Class Y | |
Expenses paid per $1,000† | $6.36 | $10.16 | $5.09 | $4.58 | |
Ending value (after expenses) | $1,018.90 | $1,015.12 | $1,020.16 | $1,020.67 | |
† | Expenses are equal to the fund’s annualized expense ratio of 1.25% for Class A, 2.00% for Class C, 1.00% for Class I and .90% for Class Y, multiplied by the average account value over the period, multiplied by 184/365 (to reflect the one-half year period). |
9
STATEMENT OF INVESTMENTS
October 31, 2023
| | | | | | | | |
| |
Description | | | | Shares | | Value ($) | |
Common Stocks - 99.0% | | | | | |
Brazil - 8.0% | | | | | |
B3 SA - Brasil Bolsa Balcao | | | | 3,688,660 | | 8,157,596 | |
Raia Drogasil SA | | | | 1,768,349 | | 9,052,628 | |
WEG SA | | | | 1,243,134 | | 8,119,483 | |
XP, Inc., Cl. A | | | | 535,885 | | 10,717,700 | |
| | | | | 36,047,407 | |
China - 22.9% | | | | | |
BY-HEALTH Co. Ltd., Cl. A | | | | 2,197,501 | | 5,504,023 | |
Foshan Haitian Flavouring & Food Co. Ltd., Cl. A | | | | 1,541,200 | | 7,938,583 | |
Kingdee International Software Group Co. Ltd. | | | | 2,877,000 | | 3,860,435 | |
Meituan, Cl. B | | | | 891,764 | a,b | 12,669,092 | |
NARI Technology Co. Ltd., Cl. A | | | | 2,934,746 | | 9,047,904 | |
NetEase, Inc. | | | | 349,000 | | 7,463,451 | |
Ping An Insurance Group Company of China Ltd., Cl. H | | | | 672,000 | | 3,396,985 | |
Proya Cosmetics Co. Ltd., Cl. A | | | | 329,900 | | 4,685,109 | |
Shenzhen Inovance Technology Co. Ltd., CI. A | | | | 1,136,006 | | 9,416,049 | |
Sungrow Power Supply Co. Ltd., CI. A | | | | 552,600 | | 6,395,022 | |
Tencent Holdings Ltd. | | | | 510,768 | | 18,921,318 | |
Yum China Holdings, Inc. | | | | 260,666 | | 13,700,605 | |
| | | | | 102,998,576 | |
Hong Kong - 5.1% | | | | | |
AIA Group Ltd. | | | | 2,091,200 | | 18,212,659 | |
Prudential PLC | | | | 468,782 | | 4,917,646 | |
| | | | | 23,130,305 | |
India - 29.8% | | | | | |
Godrej Consumer Products Ltd. | | | | 617,472 | | 7,355,410 | |
HDFC Bank Ltd. | | | | 1,246,285 | | 22,125,527 | |
HDFC Life Insurance Co. Ltd. | | | | 1,148,127 | a | 8,526,827 | |
Hindustan Unilever Ltd. | | | | 457,579 | | 13,660,620 | |
ICICI Bank Ltd. | | | | 738,272 | | 8,118,515 | |
Info Edge India Ltd. | | | | 260,907 | | 12,803,849 | |
MakeMyTrip Ltd. | | | | 71,386 | b | 2,764,780 | |
Marico Ltd. | | | | 1,553,203 | | 10,008,490 | |
PB Fintech Ltd. | | | | 390,332 | b | 3,286,522 | |
Pidilite Industries Ltd. | | | | 198,599 | | 5,867,767 | |
Sona Blw Precision Forgings Ltd. | | | | 982,258 | a | 6,388,315 | |
Tata Consultancy Services Ltd. | | | | 391,907 | | 15,900,005 | |
Titan Co. Ltd. | | | | 299,845 | | 11,495,933 | |
10
| | | | | | | | |
| |
Description | | | | Shares | | Value ($) | |
Common Stocks - 99.0% (continued) | | | | | |
India - 29.8% (continued) | | | | | |
Zomato Ltd. | | | | 4,466,318 | b | 5,670,689 | |
| | | | | 133,973,249 | |
Indonesia - 3.3% | | | | | |
Bank Mandiri Persero TBK Pt | | | | 27,715,100 | | 9,932,040 | |
Bank Rakyat Indonesia Persero TBK Pt | | | | 15,793,400 | | 4,936,976 | |
| | | | | 14,869,016 | |
Japan - 1.0% | | | | | |
Advantest Corp. | | | | 171,100 | | 4,421,670 | |
Mexico - 3.4% | | | | | |
Wal-Mart de Mexico SAB de CV | | | | 4,332,999 | | 15,525,638 | |
Netherlands - 3.4% | | | | | |
ASM International NV | | | | 12,582 | | 5,203,682 | |
ASML Holding NV | | | | 17,116 | | 10,296,290 | |
| | | | | 15,499,972 | |
Peru - 1.5% | | | | | |
Credicorp Ltd. | | | | 55,398 | | 6,922,534 | |
Philippines - .0% | | | | | |
GT Capital Holdings, Inc. | | | | 1 | | 10 | |
Poland - .9% | | | | | |
Dino Polska SA | | | | 40,416 | a,b | 3,831,913 | |
Singapore - .8% | | | | | |
Sea Ltd., ADR | | | | 86,637 | b | 3,612,763 | |
South Africa - 1.5% | | | | | |
Clicks Group Ltd. | | | | 453,805 | | 6,680,684 | |
South Korea - 4.2% | | | | | |
Samsung Electronics Co. Ltd. | | | | 259,083 | | 12,919,349 | |
Samsung SDI Co. Ltd. | | | | 18,426 | | 5,881,146 | |
| | | | | 18,800,495 | |
Taiwan - 7.6% | | | | | |
Delta Electronics, Inc. | | | | 397,000 | | 3,593,911 | |
Taiwan Semiconductor Manufacturing Co. Ltd. | | | | 1,580,000 | | 26,031,483 | |
Voltronic Power Technology Corp. | | | | 112,000 | | 4,494,429 | |
| | | | | 34,119,823 | |
United States - 2.2% | | | | | |
Lam Research Corp. | | | | 10,737 | | 6,315,718 | |
Livent Corp. | | | | 241,351 | b,c | 3,521,311 | |
| | | | | 9,837,029 | |
Uruguay - 3.4% | | | | | |
Globant SA | | | | 49,097 | b,c | 8,360,728 | |
MercadoLibre, Inc. | | | | 5,540 | b | 6,873,700 | |
| | | | | 15,234,428 | |
Total Common Stocks (cost $435,159,841) | | | | 445,505,512 | |
11
STATEMENT OF INVESTMENTS (continued)
| | | | | | | | |
| |
Description | | 1-Day
Yield (%) | | Shares | | Value ($) | |
Investment Companies - 1.0% | | | | | |
Registered Investment Companies - 1.0% | | | | | |
Dreyfus Institutional Preferred Government Plus Money Market Fund, Institutional Shares
(cost $4,443,104) | | 5.40 | | 4,443,104 | d | 4,443,104 | |
Total Investments (cost $439,602,945) | | 100.0% | | 449,948,616 | |
Cash and Receivables (Net) | | .0% | | 198,980 | |
Net Assets | | 100.0% | | 450,147,596 | |
ADR—American Depositary Receipt
a Security exempt from registration pursuant to Rule 144A under the Securities Act of 1933. These securities may be resold in transactions exempt from registration, normally to qualified institutional buyers. At October 31, 2023, these securities were valued at $31,416,147 or 6.98% of net assets.
b Non-income producing security.
c Security, or portion thereof, on loan. At October 31, 2023, the value of the fund’s securities on loan was $4,926,574 and the value of the collateral was $5,036,858, consisting of U.S. Government & Agency securities. In addition, the value of collateral may include pending sales that are also on loan.
d Investment in affiliated issuer. The investment objective of this investment company is publicly available and can be found within the investment company’s prospectus.
| | |
Portfolio Summary (Unaudited) † | Value (%) |
Semiconductors & Semiconductor Equipment | 11.6 |
Banks | 11.6 |
Media & Entertainment | 9.5 |
Insurance | 8.5 |
Capital Goods | 8.3 |
Consumer Staples Distribution | 7.8 |
Consumer Services | 7.7 |
Household & Personal Products | 6.9 |
Software & Services | 6.3 |
Technology Hardware & Equipment | 5.0 |
Financial Services | 4.2 |
Food, Beverage & Tobacco | 4.0 |
Consumer Durables & Apparel | 2.6 |
Materials | 2.1 |
Consumer Discretionary Distribution | 1.5 |
Automobiles & Components | 1.4 |
Investment Companies | 1.0 |
| | 100.0 |
† Based on net assets.
See notes to financial statements.
12
| | | | | | | |
Affiliated Issuers | | | |
Description | Value ($) 10/31/2022 | Purchases ($)† | Sales ($) | Value ($) 10/31/2023 | Dividends/
Distributions ($) | |
Registered Investment Companies - 1.0% | | |
Dreyfus Institutional Preferred Government Plus Money Market Fund, Institutional Shares - 1.0% | 12,292,718 | 229,575,317 | (237,424,931) | 4,443,104 | 853,964 | |
Investment of Cash Collateral for Securities Loaned - .0%†† | | |
Dreyfus Institutional Preferred Government Plus Money Market Fund, Institutional Shares - .0% | - | 3,946,501 | (3,946,501) | - | 10,797 | ††† |
Dreyfus Institutional Preferred Government Plus Money Market Fund, SL Shares - .0% | - | 8,849,041 | (8,849,041) | - | 5,426 | ††† |
Total - 1.0% | 12,292,718 | 242,370,859 | (250,220,473) | 4,443,104 | 870,187 | |
† Includes reinvested dividends/distributions.
†† Effective July 3, 2023, cash collateral for securities lending was transferred from Dreyfus Institutional Preferred Government Plus Money Market Fund, SL Shares to Dreyfus Institutional Preferred Government Plus Money Market Fund, Institutional Shares.
††† Represents securities lending income earned from the reinvestment of cash collateral from loaned securities, net of fees and collateral investment expenses, and other payments to and from borrowers of securities.
See notes to financial statements.
13
STATEMENT OF ASSETS AND LIABILITIES
October 31, 2023
| | | | | | | |
| | | | | | |
| | | Cost | | Value | |
Assets ($): | | | | |
Investments in securities—See Statement of Investments
(including securities on loan, valued at $4,926,574)—Note 1(c): | | | |
Unaffiliated issuers | 435,159,841 | | 445,505,512 | |
Affiliated issuers | | 4,443,104 | | 4,443,104 | |
Cash denominated in foreign currency | | | 877,298 | | 877,253 | |
Receivable for investment securities sold | | 6,082,492 | |
Receivable for shares of Common Stock subscribed | | 887,516 | |
Dividends and securities lending income receivable | | 204,119 | |
Tax reclaim receivable—Note 1(b) | | 21,073 | |
Prepaid expenses | | | | | 48,834 | |
| | | | | 458,069,903 | |
Liabilities ($): | | | | |
Due to BNY Mellon Investment Adviser, Inc. and affiliates—Note 3(c) | | 506,595 | |
Payable for investment securities purchased | | 4,870,386 | |
Payable for shares of Common Stock redeemed | | 1,578,420 | |
Foreign capital gains tax payable—Note 1(b) | | 757,561 | |
Directors’ fees and expenses payable | | 11,243 | |
Interest payable—Note 2 | | 4,150 | |
Other accrued expenses | | | | | 193,952 | |
| | | | | 7,922,307 | |
Net Assets ($) | | | 450,147,596 | |
Composition of Net Assets ($): | | | | |
Paid-in capital | | | | | 492,355,318 | |
Total distributable earnings (loss) | | | | | (42,207,722) | |
Net Assets ($) | | | 450,147,596 | |
| | | | | | |
Net Asset Value Per Share | Class A | Class C | Class I | Class Y | |
Net Assets ($) | 12,876,332 | 2,970,897 | 328,507,571 | 105,792,796 | |
Shares Outstanding | 716,154 | 174,709 | 18,084,437 | 5,789,867 | |
Net Asset Value Per Share ($) | 17.98 | 17.00 | 18.17 | 18.27 | |
| | | | | |
See notes to financial statements. | | | | | |
14
STATEMENT OF OPERATIONS
Year Ended October 31, 2023
| | | | | | | |
| | | | | | |
| | | | | | |
Investment Income ($): | | | | |
Income: | | | | |
Cash dividends (net of $729,957 foreign taxes withheld at source): | |
Unaffiliated issuers | | | 5,823,969 | |
Affiliated issuers | | | 853,964 | |
Income from securities lending—Note 1(c) | | | 16,223 | |
Total Income | | | 6,694,156 | |
Expenses: | | | | |
Management fee—Note 3(a) | | | 3,455,463 | |
Shareholder servicing costs—Note 3(c) | | | 450,340 | |
Custodian fees—Note 3(c) | | | 355,761 | |
Professional fees | | | 150,045 | |
Registration fees | | | 93,769 | |
Directors’ fees and expenses—Note 3(d) | | | 64,480 | |
Prospectus and shareholders’ reports | | | 53,218 | |
Distribution fees—Note 3(b) | | | 26,501 | |
Chief Compliance Officer fees—Note 3(c) | | | 20,417 | |
Loan commitment fees—Note 2 | | | 10,997 | |
Interest expense—Note 2 | | | 4,150 | |
Miscellaneous | | | 52,086 | |
Total Expenses | | | 4,737,227 | |
Less—reduction in expenses due to undertaking—Note 3(a) | | | (161,585) | |
Less—reduction in fees due to earnings credits—Note 3(c) | | | (3,888) | |
Net Expenses | | | 4,571,754 | |
Net Investment Income | | | 2,122,402 | |
Realized and Unrealized Gain (Loss) on Investments—Note 4 ($): | | |
Net realized gain (loss) on investments and foreign currency transactions | (30,081,091) | |
Net realized gain (loss) on foreign capital gains tax | 22,327 | |
Net Realized Gain (Loss) | | | (30,058,764) | |
Net change in unrealized appreciation (depreciation) on investments
and foreign currency transactions | 36,080,491 | |
Net change in unrealized appreciation (depreciation) on
foreign capital gains tax | (757,561) | |
Net Change in Unrealized Appreciation (Depreciation) | | | 35,322,930 | |
Net Realized and Unrealized Gain (Loss) on Investments | | | 5,264,166 | |
Net Increase in Net Assets Resulting from Operations | | 7,386,568 | |
| | | | | | |
See notes to financial statements. | | | | | |
15
STATEMENT OF CHANGES IN NET ASSETS
| | | | | | | | | | |
| | | | Year Ended October 31, |
| | | | 2023 | | 2022 | |
Operations ($): | | | | | | | | |
Net investment income | | | 2,122,402 | | | | 82,196 | |
Net realized gain (loss) on investments | | (30,058,764) | | | | (13,605,261) | |
Net change in unrealized appreciation
(depreciation) on investments | | 35,322,930 | | | | (181,680,779) | |
Net Increase (Decrease) in Net Assets
Resulting from Operations | 7,386,568 | | | | (195,203,844) | |
Distributions ($): | |
Distributions to shareholders: | | | | | | | | |
Class A | | | - | | | | (1,498,786) | |
Class C | | | - | | | | (405,878) | |
Class I | | | (531,253) | | | | (13,684,047) | |
Class Y | | | (474,449) | | | | (19,973,811) | |
Total Distributions | | | (1,005,702) | | | | (35,562,522) | |
Capital Stock Transactions ($): | |
Net proceeds from shares sold: | | | | | | | | |
Class A | | | 7,255,258 | | | | 5,831,510 | |
Class C | | | 247,676 | | | | 199,686 | |
Class I | | | 311,871,741 | | | | 162,542,259 | |
Class Y | | | 24,015,940 | | | | 53,220,152 | |
Distributions reinvested: | | | | | | | | |
Class A | | | - | | | | 1,494,089 | |
Class C | | | - | | | | 405,878 | |
Class I | | | 530,501 | | | | 13,644,996 | |
Class Y | | | 184,100 | | | | 10,515,588 | |
Cost of shares redeemed: | | | | | | | | |
Class A | | | (3,433,975) | | | | (15,327,688) | |
Class C | | | (886,755) | | | | (1,255,094) | |
Class I | | | (128,827,992) | | | | (159,403,641) | |
Class Y | | | (89,209,052) | | | | (153,738,581) | |
Increase (Decrease) in Net Assets
from Capital Stock Transactions | 121,747,442 | | | | (81,870,846) | |
Total Increase (Decrease) in Net Assets | 128,128,308 | | | | (312,637,212) | |
Net Assets ($): | |
Beginning of Period | | | 322,019,288 | | | | 634,656,500 | |
End of Period | | | 450,147,596 | | | | 322,019,288 | |
16
| | | | | | | | | | |
| | | | Year Ended October 31, |
| | | | 2023 | | 2022 | |
Capital Share Transactions (Shares): | |
Class A | | | | | | | | |
Shares sold | | | 374,170 | | | | 262,413 | |
Shares issued for distributions reinvested | | | - | | | | 61,970 | |
Shares redeemed | | | (177,183) | | | | (739,535) | |
Net Increase (Decrease) in Shares Outstanding | 196,987 | | | | (415,152) | |
Class C | | | | | | | | |
Shares sold | | | 13,664 | | | | 9,740 | |
Shares issued for distributions reinvested | | | - | | | | 17,556 | |
Shares redeemed | | | (48,441) | | | | (66,128) | |
Net Increase (Decrease) in Shares Outstanding | (34,777) | | | | (38,832) | |
Class Ia | | | | | | | | |
Shares sold | | | 15,965,493 | | | | 7,676,955 | |
Shares issued for distributions reinvested | | | 28,308 | | | | 561,291 | |
Shares redeemed | | | (6,747,746) | | | | (7,615,000) | |
Net Increase (Decrease) in Shares Outstanding | 9,246,055 | | | | 623,246 | |
Class Ya | | | | | | | | |
Shares sold | | | 1,230,711 | | | | 2,473,491 | |
Shares issued for distributions reinvested | | | 9,777 | | | | 430,437 | |
Shares redeemed | | | (4,630,948) | | | | (7,179,607) | |
Net Increase (Decrease) in Shares Outstanding | (3,390,460) | | | | (4,275,679) | |
| | | | | | | | | |
a | During the period ended October 31, 2023, 87,011 Class Y shares representing $1,703,335 were exchanged for 87,496 Class I shares and 1,890 Class A shares representing $33,277 were exchanged for 1,871 Class I shares. During the period ended October 31, 2022, 212,185 Class Y shares representing $4,481,375 were exchanged for 213,349 Class I shares. | |
See notes to financial statements. | | | | | | | | |
17
FINANCIAL HIGHLIGHTS
The following tables describe the performance for each share class for the fiscal periods indicated. All information (except portfolio turnover rate) reflects financial results for a single fund share. Net asset value total return is calculated assuming an initial investment made at the net asset value at the beginning of the period, reinvestment of all dividends and distributions at net asset value during the period, and redemption at net asset value on the last day of the period. Net asset value total return includes adjustments in accordance with accounting principles generally accepted in the United States of America and as such, the net asset value for financial reporting purposes and the returns based upon those net asset values may differ from the net asset value and returns for shareholder transactions. These figures have been derived from the fund’s financial statements.
| | | | | | | | | | | | |
| | | | | |
| | | | |
| | Year Ended October 31, |
Class A Shares | | 2023 | 2022 | 2021 | 2020 | 2019 |
Per Share Data ($): | | | | | | |
Net asset value, beginning of period | | 16.97 | 27.52 | 22.23 | 16.25 | 13.86 |
Investment Operations: | | | | | | |
Net investment income (loss)a | | .03 | (.06) | (.14) | (.10) | .03 |
Net realized and unrealized gain (loss)
on investments | | .98 | (8.84) | 5.48 | 6.43 | 2.48 |
Total from Investment Operations | | 1.01 | (8.90) | 5.34 | 6.33 | 2.51 |
Distributions: | | | | | | |
Dividends from net investment income | | - | - | (.05) | (.35) | (.12) |
Dividends from net realized gain
on Investments | | - | (1.65) | - | - | - |
Total Distributions | | - | (1.65) | (.05) | (.35) | (.12) |
Net asset value, end of period | | 17.98 | 16.97 | 27.52 | 22.23 | 16.25 |
Total Return (%)b | | 5.95 | (34.11) | 24.04 | 39.62 | 18.28 |
Ratios/Supplemental Data (%): | | | | | | |
Ratio of total expenses
to average net assets | | 1.29 | 1.30 | 1.26 | 1.29 | 1.32 |
Ratio of net expenses
to average net assets | | 1.25 | 1.25 | 1.25 | 1.25 | 1.25 |
Ratio of net investment income (loss)
to average net assets | | .18 | (.26) | (.51) | (.54) | .22 |
Portfolio Turnover Rate | | 44.72 | 47.66 | 66.55 | 51.54 | 48.73 |
Net Assets, end of period ($ x 1,000) | | 12,876 | 8,810 | 25,711 | 8,826 | 3,795 |
a Based on average shares outstanding.
b Exclusive of sales charge.
See notes to financial statements.
18
| | | | | | | | | |
| | | | |
| | | | |
| | Year Ended October 31, |
Class C Shares | | 2023 | 2022 | 2021 | 2020 | 2019 |
Per Share Data ($): | | | | | | |
Net asset value, beginning of period | | 16.17 | 26.49 | 21.52 | 15.73 | 13.42 |
Investment Operations: | | | | | | |
Net investment (loss)a | | (.09) | (.20) | (.35) | (.22) | (.08) |
Net realized and unrealized gain (loss)
on investments | | .92 | (8.47) | 5.32 | 6.23 | 2.41 |
Total from Investment Operations | | .83 | (8.67) | 4.97 | 6.01 | 2.33 |
Distributions: | | | | | | |
Dividends from net investment income | | - | - | - | (.22) | (.02) |
Dividends from net realized gain on Investments | | - | (1.65) | - | - | - |
Total Distributions | | - | (1.65) | - | (.22) | (.02) |
Net asset value, end of period | | 17.00 | 16.17 | 26.49 | 21.52 | 15.73 |
Total Return (%)b | | 5.13 | (34.60) | 23.09 | 38.61 | 17.35 |
Ratios/Supplemental Data (%): | | | | | | |
Ratio of total expenses
to average net assets | | 2.07 | 2.06 | 2.01 | 2.07 | 2.10 |
Ratio of net expenses
to average net assets | | 2.00 | 2.00 | 2.00 | 2.00 | 2.00 |
Ratio of net investment (loss)
to average net assets | | (.49) | (.99) | (1.33) | (1.26) | (.51) |
Portfolio Turnover Rate | | 44.72 | 47.66 | 66.55 | 51.54 | 48.73 |
Net Assets, end of period ($ x 1,000) | | 2,971 | 3,388 | 6,578 | 4,330 | 3,798 |
a Based on average shares outstanding.
b Exclusive of sales charge.
See notes to financial statements.
19
FINANCIAL HIGHLIGHTS (continued)
| | | | | | | | | | | | | | |
| | | | | |
| | | | | |
| | Year Ended October 31, |
Class I Shares | | 2023 | 2022 | 2021 | 2020 | 2019 |
Per Share Data ($): | | | | | | |
Net asset value, beginning of period | | 17.14 | 27.71 | 22.35 | 16.34 | 13.96 |
Investment Operations: | | | | | | |
Net investment income (loss)a | | .08 | (.01) | (.08) | (.05) | .07 |
Net realized and unrealized gain (loss)
on investments | | 1.00 | (8.91) | 5.52 | 6.46 | 2.50 |
Total from Investment Operations | | 1.08 | (8.92) | 5.44 | 6.41 | 2.57 |
Distributions: | | | | | | |
Dividends from net investment income | | (.05) | - | (.08) | (.40) | (.19) |
Dividends from net realized gain on Investments | | - | (1.65) | - | - | - |
Total Distributions | | (.05) | (1.65) | (.08) | (.40) | (.19) |
Net asset value, end of period | | 18.17 | 17.14 | 27.71 | 22.35 | 16.34 |
Total Return (%) | | 6.22 | (33.94) | 24.37 | 39.93 | 18.61 |
Ratios/Supplemental Data (%): | | | | | | |
Ratio of total expenses
to average net assets | | 1.05 | 1.05 | .99 | 1.02 | 1.00 |
Ratio of net expenses
to average net assets | | 1.00 | 1.00 | .99 | 1.00 | 1.00 |
Ratio of net investment income (loss)
to average net assets | | .43 | (.03) | (.28) | (.27) | .47 |
Portfolio Turnover Rate | | 44.72 | 47.66 | 66.55 | 51.54 | 48.73 |
Net Assets, end of period ($ x 1,000) | | 328,508 | 151,527 | 227,678 | 76,571 | 50,399 |
a Based on average shares outstanding.
See notes to financial statements.
20
| | | | | | | | |
| |
| | |
| | Year Ended October, 31 |
Class Y Shares | | 2023 | 2022 | 2021 | 2020 | 2019 |
Per Share Data ($): | | | | | | |
Net asset value, beginning of period | | 17.24 | 27.85 | 22.45 | 16.40 | 14.03 |
Investment Operations: | | | | | | |
Net investment income (loss)a | | .11 | (.02) | (.06) | (.03) | .07 |
Net realized and unrealized gain (loss)
on investments | | .98 | (8.98) | 5.55 | 6.48 | 2.51 |
Total from Investment Operations | | 1.09 | (8.96) | 5.49 | 6.45 | 2.58 |
Distributions: | | | | | | |
Dividends from
net investment income | | (.06) | - | (.09) | (.40) | (.21) |
Dividends from net realized gain on Investments | | - | (1.65) | - | - | - |
Total Distributions | | (.06) | (1.65) | (.09) | (.40) | (.21) |
Net asset value, end of period | | 18.27 | 17.24 | 27.85 | 22.45 | 16.40 |
Total Return (%) | | 6.31 | (33.91) | 24.48 | 40.07 | 18.61 |
Ratios/Supplemental Data (%): | | | | | | |
Ratio of total expenses
to average net assets | | .92 | .93 | .90 | .93 | .98 |
Ratio of net expenses
to average net assets | | .92 | .93 | .90 | .93 | .98 |
Ratio of net investment income (loss)
to average net assets | | .59 | .09 | (.22) | (.19) | .47 |
Portfolio Turnover Rate | | 44.72 | 47.66 | 66.55 | 51.54 | 48.73 |
Net Assets, end of period ($ x 1,000) | | 105,793 | 158,295 | 374,690 | 290,661 | 222,607 |
a Based on average shares outstanding.
See notes to financial statements.
21
NOTES TO FINANCIAL STATEMENTS
NOTE 1—Significant Accounting Policies:
BNY Mellon Global Emerging Markets Fund (the “fund”) is a separate non-diversified series of BNY Mellon Investment Funds II, Inc. (the “Company”), which is registered under the Investment Company Act of 1940, as amended (the “Act”), as an open-end management investment company and operates as a series company currently offering two series, including the fund. The fund’s investment objective is to seek long-term capital appreciation. BNY Mellon Investment Adviser, Inc. (the “Adviser”), a wholly-owned subsidiary of The Bank of New York Mellon Corporation (“BNY Mellon”), serves as the fund’s investment adviser. Newton Investment Management Limited (the “Sub-Adviser”), an indirect wholly-owned subsidiary of BNY Mellon and an affiliate of the Adviser, serves as the fund’s sub-adviser.
Effective March 31, 2023, the Sub-Adviser, entered into a sub-sub-investment advisory agreement with its affiliate, Newton Investment Management North America, LLC (“NIMNA”), to enable NIMNA to provide certain advisory services to the Sub-Adviser for the benefit of the fund, including, but not limited to, portfolio management services. NIMNA is subject to the supervision of the Sub-Adviser and the Adviser. NIMNA is also an affiliate of the Adviser. NIMNA’s principal office is located at BNY Mellon Center, 201 Washington Street, Boston, MA 02108. NIMNA is an indirect subsidiary of BNY Mellon.
BNY Mellon Securities Corporation (the “Distributor”), a wholly-owned subsidiary of the Adviser, is the distributor of the fund’s shares. The fund is authorized to issue 500 shares of $.001 par value Common Stock. The fund currently has authorized four classes of shares: Class A (100 million shares authorized), Class C (100 million shares authorized), Class I (100 million shares authorized) and Class Y (200 million shares authorized). Class A and Class C shares are sold primarily to retail investors through financial intermediaries and bear Distribution and/or Shareholder Services Plan fees. Class A shares generally are subject to a sales charge imposed at the time of purchase. Class A shares bought without an initial sales charge as part of an investment of $1 million or more may be charged a contingent deferred sales charge (“CDSC”) of 1.00% if redeemed within one year. Class C shares are subject to a CDSC imposed on Class C shares redeemed within one year of purchase. Class C shares automatically convert to Class A shares eight years after the date of purchase, without the imposition of a sales charge. Class I shares are sold primarily to bank trust departments and other financial service providers (including BNY
22
Mellon and its affiliates), acting on behalf of customers having a qualified trust or an investment account or relationship at such institution, and bear no Distribution or Shareholder Services Plan fees. Class Y shares are sold at net asset value per share generally to institutional investors, and bear no Distribution or Shareholder Services Plan fees. Class I and Class Y shares are offered without a front-end sales charge or CDSC. Other differences between the classes include the services offered to and the expenses borne by each class, the allocation of certain transfer agency costs and certain voting rights. Income, expenses (other than expenses attributable to a specific class), and realized and unrealized gains or losses on investments are allocated to each class of shares based on its relative net assets.
The Company accounts separately for the assets, liabilities and operations of each series. Expenses directly attributable to each series are charged to that series’ operations; expenses which are applicable to all series are allocated among them on a pro rata basis.
The Financial Accounting Standards Board (“FASB”) Accounting Standards Codification (“ASC”) is the exclusive reference of authoritative U.S. generally accepted accounting principles (“GAAP”) recognized by the FASB to be applied by nongovernmental entities. Rules and interpretive releases of the SEC under authority of federal laws are also sources of authoritative GAAP for SEC registrants. The fund is an investment company and applies the accounting and reporting guidance of the FASB ASC Topic 946 Financial Services-Investment Companies. The fund’s financial statements are prepared in accordance with GAAP, which may require the use of management estimates and assumptions. Actual results could differ from those estimates.
The Company enters into contracts that contain a variety of indemnifications. The fund’s maximum exposure under these arrangements is unknown. The fund does not anticipate recognizing any loss related to these arrangements.
(a) Portfolio valuation: The fair value of a financial instrument is the amount that would be received to sell an asset or paid to transfer a liability in an orderly transaction between market participants at the measurement date (i.e., the exit price). GAAP establishes a fair value hierarchy that prioritizes the inputs of valuation techniques used to measure fair value. This hierarchy gives the highest priority to unadjusted quoted prices in active markets for identical assets or liabilities (Level 1 measurements) and the lowest priority to unobservable inputs (Level 3 measurements).
Additionally, GAAP provides guidance on determining whether the volume and activity in a market has decreased significantly and whether
23
NOTES TO FINANCIAL STATEMENTS (continued)
such a decrease in activity results in transactions that are not orderly. GAAP requires enhanced disclosures around valuation inputs and techniques used during annual and interim periods.
Various inputs are used in determining the value of the fund’s investments relating to fair value measurements. These inputs are summarized in the three broad levels listed below:
Level 1—unadjusted quoted prices in active markets for identical investments.
Level 2—other significant observable inputs (including quoted prices for similar investments, interest rates, prepayment speeds, credit risk, etc.).
Level 3—significant unobservable inputs (including the fund’s own assumptions in determining the fair value of investments).
The inputs or methodology used for valuing securities are not necessarily an indication of the risk associated with investing in those securities.
Changes in valuation techniques may result in transfers in or out of an assigned level within the disclosure hierarchy. Valuation techniques used to value the fund’s investments are as follows:
The Company’s Board of Director (the “Board”) has designated the Adviser as the fund’s valuation designee to make all fair value determinations with respect to the fund’s portfolio investments, subject to the Board’s oversight and pursuant to Rule 2a-5 under the Act.
Investments in equity securities are valued at the last sales price on the securities exchange or national securities market on which such securities are primarily traded. Securities listed on the National Market System for which market quotations are available are valued at the official closing price or, if there is no official closing price that day, at the last sales price. For open short positions, asked prices are used for valuation purposes. Bid price is used when no asked price is available. Registered investment companies that are not traded on an exchange are valued at their net asset value. All of the preceding securities are generally categorized within Level 1 of the fair value hierarchy.
Securities not listed on an exchange or the national securities market, or securities for which there were no transactions, are valued at the average of the most recent bid and asked prices. These securities are generally categorized within Level 2 of the fair value hierarchy.
Fair valuing of securities may be determined with the assistance of a pricing service using calculations based on indices of domestic securities
24
and other appropriate indicators, such as prices of relevant ADRs and futures. Utilizing these techniques may result in transfers between Level 1 and Level 2 of the fair value hierarchy.
When market quotations or official closing prices are not readily available, or are determined not to accurately reflect fair value, such as when the value of a security has been significantly affected by events after the close of the exchange or market on which the security is principally traded (for example, a foreign exchange or market), but before the fund calculates its net asset value, the fund may value these investments at fair value as determined in accordance with the procedures approved by the Board. Certain factors may be considered when fair valuing investments such as: fundamental analytical data, the nature and duration of restrictions on disposition, an evaluation of the forces that influence the market in which the securities are purchased and sold, and public trading in similar securities of the issuer or comparable issuers. These securities are either categorized within Level 2 or 3 of the fair value hierarchy depending on the relevant inputs used.
For securities where observable inputs are limited, assumptions about market activity and risk are used and such securities are generally categorized within Level 3 of the fair value hierarchy.
Investments denominated in foreign currencies are translated to U.S. dollars at the prevailing rates of exchange.
The following is a summary of the inputs used as of October 31, 2023 in valuing the fund’s investments:
| | | | | | | |
| | Level 1-Unadjusted Quoted Prices | Level 2- Other Significant Observable Inputs | | Level 3-Significant Unobservable Inputs | Total | |
Assets ($) | | |
Investments in Securities:† | | |
Equity Securities - Common Stocks | 103,645,184 | 341,860,328 | †† | - | 445,505,512 | |
Investment Companies | 4,443,104 | - | | - | 4,443,104 | |
† See Statement of Investments for additional detailed categorizations, if any.
†† Securities classified within Level 2 at period end as the values were determined pursuant to the fund’s fair valuation procedures.
f
The following is a reconciliation of Level 3 assets for which significant unobservable inputs were used to determine fair value:
25
NOTES TO FINANCIAL STATEMENTS (continued)
| | | |
| | |
Equity Securities –
Common Stocks ($)
|
Balance as of 10/31/2022† | | 0 |
Purchases/Issuances | | - |
Sales/Dispositions | | (1,913,951) |
Net realized gain (loss) | | (2,500,377) |
Change in unrealized appreciation (depreciation) | | 4,414,328 |
Transfers into Level 3 | | - |
Transfers out of Level 3†† | | 0 |
Balance as of 10/31/2023 | | - |
The amount of total net gain (loss) for the period included in earnings attributable to the change in unrealized appreciation (depreciation) relating to investments still held at 10/31/2023 | | - |
† Securities deemed as Level 3 due to the lack of observable inputs by management assessment.
†† Transfers out of Level 3 represent the value at the date of transfer. The transfer out of Level 3 for the current period was due to additional observable inputs.
(b) Foreign currency transactions: The fund does not isolate that portion of the results of operations resulting from changes in foreign exchange rates on investments from the fluctuations arising from changes in the market prices of securities held. Such fluctuations are included with the net realized and unrealized gain or loss on investments.
Net realized foreign exchange gains or losses arise from sales of foreign currencies, currency gains or losses realized on securities transactions between trade and settlement date, and the difference between the amounts of dividends, interest and foreign withholding taxes recorded on the fund’s books and the U.S. dollar equivalent of the amounts actually received or paid. Net unrealized foreign exchange gains and losses arise from changes in the value of assets and liabilities other than investments resulting from changes in exchange rates. Foreign currency gains and losses on foreign currency transactions are also included with net realized and unrealized gain or loss on investments.
Foreign taxes: The fund may be subject to foreign taxes (a portion of which may be reclaimable) on income, stock dividends, realized and unrealized capital gains on investments or certain foreign currency transactions. Foreign taxes are recorded in accordance with the applicable foreign tax regulations and rates that exist in the foreign jurisdictions in which the fund invests. These foreign taxes, if any, are paid by the fund and are reflected in the Statement of Operations, if applicable. Foreign taxes payable or deferred or those subject to reclaims as of October 31, 2023, if any, are disclosed in the fund’s Statement of Assets and Liabilities.
26
(c) Securities transactions and investment income: Securities transactions are recorded on a trade date basis. Realized gains and losses from securities transactions are recorded on the identified cost basis. Dividend income is recognized on the ex-dividend date and interest income, including, where applicable, accretion of discount and amortization of premium on investments, is recognized on the accrual basis.
Pursuant to a securities lending agreement with BNY Mellon, the fund may lend securities to qualified institutions. It is the fund’s policy that, at origination, all loans are secured by collateral of at least 102% of the value of U.S. securities loaned and 105% of the value of foreign securities loaned. Collateral equivalent to at least 100% of the market value of securities on loan is maintained at all times. Collateral is either in the form of cash, which can be invested in certain money market mutual funds managed by the Adviser, or U.S. Government and Agency securities. Any non-cash collateral received cannot be sold or re-pledged by the fund, except in the event of borrower default. The securities on loan, if any, are also disclosed in the fund’s Statement of Investments. The fund is entitled to receive all dividends, interest and distributions on securities loaned, in addition to income earned as a result of the lending transaction. Should a borrower fail to return the securities in a timely manner, BNY Mellon is required to replace the securities for the benefit of the fund or credit the fund with the market value of the unreturned securities and is subrogated to the fund’s rights against the borrower and the collateral. Additionally, the contractual maturity of security lending transactions are on an overnight and continuous basis. During the period ended October 31, 2023, BNY Mellon earned $2,212 from the lending of the fund’s portfolio securities, pursuant to the securities lending agreement.
For financial reporting purposes, the fund elects not to offset assets and liabilities subject to a securities lending agreement, if any, in the Statement of Assets and Liabilities. Therefore, all qualifying transactions are presented on a gross basis in the Statement of Assets and Liabilities. As of October 31, 2023, the fund had securities on loan and the value of the related collateral received by the fund exceeded the value of the securities loaned by the fund. The value of the securities loaned by the fund, if any, are also disclosed in the Statement of Assets and Liabilities and in the Statement of Investments. The total amount of cash and non-cash securities lending collateral received is disclosed in the footnotes to the Statement of Investments.
(d) Affiliated issuers: Investments in other investment companies advised by the Adviser are considered “affiliated” under the Act.
27
NOTES TO FINANCIAL STATEMENTS (continued)
(e) Market Risk: The value of the securities in which the fund invests may be affected by political, regulatory, economic and social developments, and developments that impact specific economic sectors, industries or segments of the market. In addition, turbulence in financial markets and reduced liquidity in equity, credit and/or fixed-income markets may negatively affect many issuers, which could adversely affect the fund. Global economies and financial markets are becoming increasingly interconnected, and conditions and events in one country, region or financial market may adversely impact issuers in a different country, region or financial market. These risks may be magnified if certain events or developments adversely interrupt the global supply chain; in these and other circumstances, such risks might affect companies world-wide.
Foreign Investment Risk: To the extent the fund invests in foreign securities, the fund’s performance will be influenced by political, social and economic factors affecting investments in foreign issuers. Special risks associated with investments in foreign issuers include exposure to currency fluctuations, less liquidity, less developed or less efficient trading markets, lack of comprehensive company information, political and economic instability and differing auditing and legal standards.
Non-Diversification Risk: The fund is non-diversified, which means that the fund may invest a relatively high percentage of its assets in a limited number of issuers. Therefore, the fund’s performance may be more vulnerable to changes in the market value of a single issuer or group of issuers and more susceptible to risks associated with a single economic, political or regulatory occurrence than a diversified fund.
Emerging Market Risk.: The securities of issuers located or doing substantial business in emerging market countries tend to be more volatile and less liquid than the securities of issuers located in countries with more mature economies. Emerging markets generally have less diverse and less mature economic structures and less stable political systems than those of developed countries. Investments in these countries may be subject to political, economic, legal, market and currency risks. Special risks associated with investments in emerging market issuers may include the lack of publicly available information, the lack of uniform disclosure, accounting and financial reporting and recordkeeping standards, and limited investor protections applicable in developed economies. The risks also may include unpredictable political and economic policies, the imposition of capital controls and/or foreign investment limitations by a country, nationalization of businesses, and the imposition of sanctions or restrictions on certain investments by other countries, such as the United States.
28
(f) Dividends and distributions to shareholders: Dividends and distributions are recorded on the ex-dividend date. Dividends from net investment income and dividends from net realized capital gains, if any, are normally declared and paid annually, but the fund may make distributions on a more frequent basis to comply with the distribution requirements of the Internal Revenue Code of 1986, as amended (the “Code”). To the extent that net realized capital gains can be offset by capital loss carryovers, it is the policy of the fund not to distribute such gains. Income and capital gain distributions are determined in accordance with income tax regulations, which may differ from GAAP.
(g) Federal income taxes: It is the policy of the fund to continue to qualify as a regulated investment company, if such qualification is in the best interests of its shareholders, by complying with the applicable provisions of the Code, and to make distributions of taxable income and net realized capital gain sufficient to relieve it from substantially all federal income and excise taxes.
As of and during the period ended October 31, 2023, the fund did not have any liabilities for any uncertain tax positions. The fund recognizes interest and penalties, if any, related to uncertain tax positions as income tax expense in the Statement of Operations. During the period ended October 31, 2023, the fund did not incur any interest or penalties.
Each tax year in the four-year period ended October 31, 2023 remains subject to examination by the Internal Revenue Service and state taxing authorities.
At October 31, 2023, the components of accumulated earnings on a tax basis were as follows: undistributed ordinary income $3,611,334, accumulated capital losses $42,105,024 and unrealized depreciation $3,714,032.
The fund is permitted to carry forward capital losses for an unlimited period. Furthermore, capital loss carryovers retain their character as either short-term or long-term capital losses.
The fund has an accumulated capital loss carryover available for federal income tax purposes to be applied against future net realized capital gains, if any, realized subsequent to October 31, 2023. The fund has $23,029,380 of short-term capital losses and $19,075,644 of long-term capital losses which can be carried forward for an unlimited period.
The tax character of distributions paid to shareholders during the fiscal years ended October 31, 2023 and October 31, 2022 were as follows:
29
NOTES TO FINANCIAL STATEMENTS (continued)
undistributed ordinary income $1,005,702 and $2,762, and long-term capital gains $0 and $35,559,760, respectively.
NOTE 2—Bank Lines of Credit:
The fund participates with other long-term open-end funds managed by the Adviser in a $738 million unsecured credit facility led by Citibank, N.A. (the “Citibank Credit Facility”) and a $300 million unsecured credit facility provided by BNY Mellon (the “BNYM Credit Facility”), each to be utilized primarily for temporary or emergency purposes, including the financing of redemptions (each, a “Facility”). The Citibank Credit Facility is available in two tranches: (i) Tranche A is in an amount equal to $618 million and is available to all long-term open-ended funds, including the fund, and (ii) Tranche B is an amount equal to $120 million and is available only to BNY Mellon Floating Rate Income Fund, a series of BNY Mellon Investment Funds IV, Inc. Prior to September 27, 2023, the Citibank Credit Facility was $823.5 million with Tranche A available in an amount equal to $688.5 million and Tranche B available in an amount equal to $135 million. In connection therewith, the fund has agreed to pay its pro rata portion of commitment fees for Tranche A of the Citibank Credit Facility and the BNYM Credit Facility. Interest is charged to the fund based on rates determined pursuant to the terms of the respective Facility at the time of borrowing.
During the period ended October 31, 2023, the fund was charged $4,150 for interest expense. These fees are included in Interest expense in the Statement of Operations. The average amount of borrowings outstanding under the Facilities during the period ended October 31, 2023 was approximately $65,205 with a related weighted average annualized interest rate of 6.37%.
NOTE 3—Management Fee, Sub-Advisory Fee and Other Transactions with Affiliates:
(a) Pursuant to a management agreement with the Adviser, the management fee is computed at the annual rate of .75% of the value of the fund’s average daily net assets. The Adviser has contractually agreed, from November 1, 2022 through March 1, 2024, to waive receipt of its fees and/or assume the direct expenses of the fund so that the direct expenses of none of the fund’s share classes (excluding Rule 12b-1 Distribution Plan fees, Shareholder Services Plan fees, taxes, interest expense, brokerage commissions, commitment fees on borrowings and extraordinary expenses) exceed 1.00% of the value of the fund’s average daily net assets. On or after March 1, 2024, the Adviser may terminate this expense limitation at any time. The reduction in expenses, pursuant to the
30
undertaking amounted to $161,585 during the period ended October 31, 2023.
Pursuant to a sub-investment advisory agreement between the Adviser and the Sub-Adviser, the Sub-Adviser serves as the fund’s sub-adviser responsible for the day-to-day management of the fund’s portfolio. The Adviser pays the Sub-Adviser a monthly fee at an annual percentage of the value of the fund’s average daily net assets. The Adviser has obtained an exemptive order from the SEC (the “Order”), upon which the fund may rely, to use a manager of managers approach that permits the Adviser, subject to certain conditions and approval by the Board, to enter into and materially amend sub-investment advisory agreements with one or more sub-advisers who are either unaffiliated with the Adviser or are wholly-owned subsidiaries (as defined under the Act) of the Adviser’s ultimate parent company, BNY Mellon, without obtaining shareholder approval. The Order also allows the fund to disclose the sub-advisory fee paid by the Adviser to any unaffiliated sub-adviser in the aggregate with other unaffiliated sub-advisers in documents filed with the SEC and provided to shareholders. In addition, pursuant to the Order, it is not necessary to disclose the sub-advisory fee payable by the Adviser separately to a sub-adviser that is a wholly-owned subsidiary of BNY Mellon in documents filed with the SEC and provided to shareholders; such fees are to be aggregated with fees payable to the Adviser. The Adviser has ultimate responsibility (subject to oversight by the Board) to supervise any sub-adviser and recommend the hiring, termination, and replacement of any sub-adviser to the Board.
During the period ended October 31, 2023, the Distributor retained $4,896 from commissions earned on sales of the fund’s Class A shares and $85 from CDSC fees on redemptions of the fund’s Class C shares.
(b) Under the Distribution Plan adopted pursuant to Rule 12b-1 under the Act, Class C shares pay the Distributor for distributing its shares at an annual rate of .75% of the value of its average daily net assets. The Distributor may pay one or more Service Agents in respect of advertising, marketing and other distribution services, and determines the amounts, if any, to be paid to Service Agents and the basis on which such payments are made. During the period ended October 31, 2023, Class C shares were charged $26,501 pursuant to the Distribution Plan.
(c) Under the Shareholder Services Plan, Class A and Class C shares pay the Distributor at an annual rate of .25% of the value of their average daily net assets for the provision of certain services. The services provided may include personal services relating to shareholder accounts, such as answering shareholder inquiries regarding the fund, and services related to
31
NOTES TO FINANCIAL STATEMENTS (continued)
the maintenance of shareholder accounts. The Distributor may make payments to Service Agents (securities dealers, financial institutions or other industry professionals) with respect to these services. The Distributor determines the amounts to be paid to Service Agents. During the period ended October 31, 2023, Class A and Class C shares were charged $29,845 and $8,834, respectively, pursuant to the Shareholder Services Plan.
Under its terms, the Distribution Plan and Shareholder Services Plan shall remain in effect from year to year, provided such continuance is approved annually by a vote of a majority of those Directors who are not “interested persons” of the Company and who have no direct or indirect financial interest in the operation of or in any agreement related to the Distribution Plan and Shareholder Services Plan.
The fund has an arrangement with BNY Mellon Transfer, Inc., (the “Transfer Agent”), a subsidiary of BNY Mellon and an affiliate of the Adviser, whereby the fund may receive earnings credits when positive cash balances are maintained, which are used to offset Transfer Agent fees. For financial reporting purposes, the fund includes transfer agent net earnings credits, if any, as an expense offset in the Statement of Operations.
The fund has an arrangement with The Bank of New York Mellon (the “Custodian”), a subsidiary of BNY Mellon and an affiliate of the Adviser, whereby the fund will receive interest income or be charged overdraft fees when cash balances are maintained. For financial reporting purposes, the fund includes this interest income and overdraft fees, if any, as interest income in the Statement of Operations.
The fund compensates the Transfer Agent, under a transfer agency agreement, for providing transfer agency and cash management services for the fund. The majority of Transfer Agent fees are comprised of amounts paid on a per account basis, while cash management fees are related to fund subscriptions and redemptions. During the period ended October 31, 2023, the fund was charged $7,289 for transfer agency services. These fees are included in Shareholder servicing costs in the Statement of Operations. These fees were partially offset by earnings credits of $3,888.
The fund compensates the Custodian, under a custody agreement, for providing custodial services for the fund. These fees are determined based on net assets, geographic region and transaction activity. During the period ended October 31, 2023, the fund was charged $355,761 pursuant to the custody agreement.
32
During the period ended October 31, 2023, the fund was charged $20,417 for services performed by the fund’s Chief Compliance Officer and his staff. These fees are included in Chief Compliance Officer fees in the Statement of Operations.
The components of “Due to BNY Mellon Investment Adviser, Inc. and affiliates” in the Statement of Assets and Liabilities consist of: management fee of $309,008, Distribution Plan fees of $1,987, Shareholder Services Plan fees of $3,418, Custodian fees of $212,707 Chief Compliance Officer fees of $6,389 and Transfer Agent fees of $1,111, which are offset against an expense reimbursement currently in effect in the amount of $28,025.
(d) Each board member also serves as a board member of other funds in the BNY Mellon Family of Funds complex. Annual retainer fees and attendance fees are allocated to each fund based on net assets.
NOTE 4—Securities Transactions:
The aggregate amount of purchases and sales of investment securities, excluding short-term securities, during the period ended October 31, 2023, amounted to $327,483,595 and $195,943,110, respectively.
At October 31, 2023, the cost of investments for federal income tax purposes was $452,903,318 accordingly, accumulated net unrealized depreciation on investment was $2,954,702, consisting of $52,143,473 gross unrealized appreciation and $55,098,175 gross unrealized depreciation.
33
REPORT OF INDEPENDENT REGISTERED PUBLIC ACCOUNTING FIRM
To the Shareholders of BNY Mellon Global Emerging Markets Fund and Board of Directors of
BNY Mellon Investment Funds II, Inc.:
Opinion on the Financial Statements
We have audited the accompanying statement of assets and liabilities of BNY Mellon Global Emerging Markets Fund (the Fund), a series of BNY Mellon Investment Funds II, Inc., including the statement of investments, as of October 31, 2023, the related statement of operations for the year then ended, the statements of changes in net assets for each of the years in the two-year period then ended, and the related notes (collectively, the financial statements) and the financial highlights for each of the years in the five-year period then ended. In our opinion, the financial statements and financial highlights present fairly, in all material respects, the financial position of the Fund as of October 31, 2023, the results of its operations for the year then ended, the changes in its net assets for each of the years in the two-year period then ended, and the financial highlights for each of the years in the five-year period then ended, in conformity with U.S. generally accepted accounting principles.
Basis for Opinion
These financial statements and financial highlights are the responsibility of the Fund’s management. Our responsibility is to express an opinion on these financial statements and financial highlights based on our audits. We are a public accounting firm registered with the Public Company Accounting Oversight Board (United States) (PCAOB) and are required to be independent with respect to the Fund in accordance with the U.S. federal securities laws and the applicable rules and regulations of the Securities and Exchange Commission and the PCAOB.
We conducted our audits in accordance with the standards of the PCAOB. Those standards require that we plan and perform the audit to obtain reasonable assurance about whether the financial statements and financial highlights are free of material misstatement, whether due to error or fraud. Our audits included performing procedures to assess the risks of material misstatement of the financial statements and financial highlights, whether due to error or fraud, and performing procedures that respond to those risks. Such procedures included examining, on a test basis, evidence regarding the amounts and disclosures in the financial statements and financial highlights. Such procedures also included confirmation of securities owned as of October 31, 2023, by correspondence with custodian and brokers; when replies were not received from brokers, we performed other auditing procedures. Our audits also included evaluating the accounting principles used and significant estimates made by management, as well as evaluating the overall presentation of the financial statements and financial highlights. We believe that our audits provide a reasonable basis for our opinion.

We have served as the auditor of one or more BNY Mellon Investment Adviser, Inc. investment companies since 1994.
New York, New York
December 22, 2023
34
IMPORTANT TAX INFORMATION (Unaudited)
For federal tax purposes, the fund elects to provide each shareholder with their portion of the fund’s income sourced from foreign countries and taxes paid from foreign countries. The fund reports the maximum amount allowable but not less than $7,386,432 as income sourced from foreign countries for the fiscal year ended October 31, 2023 in accordance with Section 853(c)(2) of the Internal Revenue Code and also the fund reports the maximum amount allowable but not less than $707,628 as taxes paid from foreign countries for the fiscal year ended October 31, 2023 in accordance with Section 853(a) of the Internal Revenue Code. Where required by federal tax rules, shareholders will receive notification of their proportionate share of foreign sourced income and foreign taxes paid for the 2023 calendar year with Form 1099-DIV which will be mailed in early 2023. Also, the fund designates the maximum amount allowable, but not less than $1,652,061 as ordinary income dividends paid during the fiscal year ended October 31, 2023 as qualified dividend income in accordance with Section 854(b)(1)(B) of the Internal Revenue Code.
35
BOARD MEMBERS INFORMATION (Unaudited)
Independent Board Members
Joseph S. DiMartino (80)
Chairman of the Board (2013)
Principal Occupation During Past 5 Years:
· Director or Trustee of funds in the BNY Mellon Family of Funds and certain other entities (as described in the fund’s Statement of Additional Information) (1995-Present)
Other Public Company Board Memberships During Past 5 Years:
· CBIZ, Inc., a public company providing professional business services, products and solutions, Director (1997-May 2023)
No. of Portfolios for which Board Member Serves: 86
———————
Francine J. Bovich (72)
Board Member (2013)
Principal Occupation During Past 5 Years:
· The Bradley Trusts, private trust funds, Trustee (2011-Present)
Other Public Company Board Memberships During Past 5 Years:
· Annaly Capital Management, Inc., a real estate investment trust, Director (2014-Present)
No. of Portfolios for which Board Member Serves: 47
———————
Andrew J. Donohue (73)
Board Member (2019)
Principal Occupation During Past 5 Years:
· Attorney, Solo Law Practice (2019-Present)
· Shearman & Sterling LLP, a law firm, Of Counsel (2017-2019)
· Chief of Staff to the Chair of the SEC (2015-2017)
Other Public Company Board Memberships During Past 5 Years:
· Oppenheimer Funds (58 funds), Director (2017-2019)
No. of Portfolios for which Board Member Serves: 40
———————
36
Kenneth A. Himmel (77)
Board Member (2013)
Principal Occupation During Past 5 Years:
· Related Urban Development, a real estate development company, President and Chief Executive Officer (1996-Present)
· American Food Management, a restaurant company, Chief Executive Officer (1983-Present)
· Himmel & Company, a real estate development company, President and Chief Executive Officer (1980-Present)
· Gulf Related, an international real estate development company, Managing Partner (2010-December 2020)
No. of Portfolios for which Board Member Serves: 18
———————
Bradley Skapyak (64)
Board Member (2021)
Principal Occupation During Past 5 Years:
· Chief Operating Officer and Director of The Dreyfus Corporation (2009-2019)
· Chief Executive Officer and Director of the Distributor (2016-2019)
· Chairman and Director of The Dreyfus Transfer Agent, Inc. (2011-2019)
· Senior Vice President of The Bank of New York Mellon (2007-2019)
No. of Portfolios for which Board Member Serves: 18
———————
Roslyn M. Watson (74)
Board Member (2013)
Principal Occupation During Past 5 Years:
· Watson Ventures, Inc., a real estate investment company, Principal (1993-Present)
Other Public Company Board Memberships During Past 5 Years:
· American Express Bank, FSB, Director (1993-2018)
No. of Portfolios for which Board Member Serves: 40
———————
37
BOARD MEMBERS INFORMATION (Unaudited) (continued)
Benaree Pratt Wiley (77)
Board Member (2013)
Principal Occupation During Past 5 Years:
· The Wiley Group, a firm specializing in strategy and business development, Principal (2005-Present)
Other Public Company Board Memberships During Past 5 Years:
· CBIZ, Inc., a public company providing professional business services, products and solutions, Director (2008-Present)
· Blue Cross-Blue Shield of Massachusetts, Director (2004-2020)
No. of Portfolios for which Board Member Serves: 57
———————
The address of the Board Members and Officers is c/o BNY Mellon Investment Adviser, Inc., 240 Greenwich Street, New York, New York 10286. Additional information about each Board Member is available in the fund’s Statement of Additional Information which can be obtained from the Adviser free of charge by calling this toll free number: 1-800-373-9387.
38
OFFICERS OF THE FUND (Unaudited)
DAVID DIPETRILLO, President since January 2021.
Vice President and Director of the Adviser since February 2021; Head of North America Distribution, BNY Mellon Investment Management since February 2023; and Head of North America Product, BNY Mellon Investment Management from January 2018 to February 2023. He is an officer of 53 investment companies (comprised of 102 portfolios) managed by the Adviser or an affiliate of the Adviser. He is 45 years old and has been an employee of BNY Mellon since 2005.
JAMES WINDELS, Treasurer since November 2001.
Director of the Adviser since February 2023; Vice President of the Adviser since September 2020; and Director–BNY Mellon Fund Administration. He is an officer of 54 investment companies (comprised of 121 portfolios) managed by the Adviser or an affiliate of the Adviser. He is 65 years old and has been an employee of the Adviser since April 1985.
PETER M. SULLIVAN, Chief Legal Officer since July 2021 and Vice President and Assistant Secretary since March 2019.
Chief Legal Officer of the Adviser and Associate General Counsel of BNY Mellon since July 2021; Senior Managing Counsel of BNY Mellon from December 2020 to July 2021; and Managing Counsel of BNY Mellon from March 2009 to December 2020. He is an officer of 54 investment companies (comprised of 121 portfolios) managed by the Adviser or an affiliate of the Adviser. He is 55 years old and has been an employee of BNY Mellon since April 2004.
JAMES BITETTO, Vice President since August 2005 and Secretary since February 2018.
Senior Managing Counsel of BNY Mellon since December 2019; Managing Counsel of BNY Mellon from April 2014 to December 2019; and Secretary of the Adviser. He is an officer of 54 investment companies (comprised of 121 portfolios) managed by the Adviser or an affiliate of the Adviser. He is 57 years old and has been an employee of the Adviser since December 1996.
DEIRDRE CUNNANE, Vice President and Assistant Secretary since March 2019.
Managing Counsel of BNY Mellon since December 2021; and Counsel of BNY Mellon from August 2018 to December 2021. She is an officer of 54 investment companies (comprised of 121 portfolios) managed by the Adviser or an affiliate of the Adviser. She is 33 years old and has been an employee of BNY Mellon since August 2013.
SARAH S. KELLEHER, Vice President and Assistant Secretary since April 2014.
Vice President of BNY Mellon ETF Investment Adviser; LLC since February 2020; Senior Managing Counsel of BNY Mellon since September 2021; and Managing Counsel of BNY Mellon from December 2017 to September 2021. She is an officer of 54 investment companies (comprised of 121 portfolios) managed by the Adviser or an affiliate of the Adviser. She is 48 years old and has been an employee of BNY Mellon since March 2013.
JEFF PRUSNOFSKY, Vice President and Assistant Secretary since August 2005.
Senior Managing Counsel of BNY Mellon. He is an officer of 54 investment companies (comprised of 121 portfolios) managed by the Adviser or an affiliate of the Adviser. He is 58 years old and has been an employee of the Adviser since October 1990.
AMANDA QUINN, Vice President and Assistant Secretary since March 2020.
Counsel of BNY Mellon since June 2019; Regulatory Administration Manager at BNY Mellon Investment Management Services from September 2018 to May 2019. She is an officer of 54 investment companies (comprised of 121 portfolios) managed by the Adviser or an affiliate of the Adviser. She is 38 years old and has been an employee of BNY Mellon since June 2012.
JOANNE SKERRETT, Vice President and Assistant Secretary since March 2023.
Managing Counsel of BNY Mellon since June 2022; and Senior Counsel with the Mutual Fund Directors Forum, a leading funds industry organization, from 2016 to June 2022. She is an officer of 54 investment companies (comprised of 121 portfolios) managed by the Adviser or an affiliate of the Adviser. She is 51 years old and has been an employee of the Adviser since June 2022.
39
OFFICERS OF THE FUND (Unaudited) (continued)
NATALYA ZELENSKY, Vice President and Assistant Secretary since March 2017.
Chief Compliance Officer since August 2021 and Vice President since February 2020 of BNY Mellon ETF Investment Adviser, LLC; Chief Compliance Officer since August 2021 and Vice President and Assistant Secretary since February 2020 of BNY Mellon ETF Trust; Managing Counsel of BNY Mellon from December 2019 to August 2021; Counsel of BNY Mellon from May 2016 to December 2019; and Assistant Secretary of the Adviser from April 2018 to August 2021. She is an officer of 54 investment companies (comprised of 121 portfolios) managed by the Adviser or an affiliate of the Adviser. She is 38 years old and has been an employee of BNY Mellon since May 2016.
DANIEL GOLDSTEIN, Vice President since March 2022.
Head of Product Development of North America Distribution, BNY Mellon Investment Management since January 2018; Executive Vice President of North America Product, BNY Mellon Investment Management since April 2023; and Senior Vice President, Development & Oversight of North America Product, BNY Mellon Investment Management from 2010 to March 2023. He is an officer of 53 investment companies (comprised of 102 portfolios) managed by the Adviser or an affiliate of the Adviser. He is 54 years old and has been an employee of the Distributor since 1991.
JOSEPH MARTELLA, Vice President since March 2022.
Vice President of the Adviser since December 2022; Head of Product Management of North America Distribution, BNY Mellon Investment Management since January 2018; Executive Vice President of North America Product, BNY Mellon Investment Management since April 2023; and Senior Vice President of North America Product, BNY Mellon Investment Management from 2010 to March 2023. He is an officer of 53 investment companies (comprised of 102 portfolios) managed by the Adviser or an affiliate of the Adviser. He is 47 years old and has been an employee of the Distributor since 1999.
GAVIN C. REILLY, Assistant Treasurer since December 2005.
Tax Manager–BNY Mellon Fund Administration. He is an officer of 54 investment companies (comprised of 121 portfolios) managed by the Adviser or an affiliate of the Adviser. He is 55 years old and has been an employee of the Adviser since April 1991.
ROBERT SALVIOLO, Assistant Treasurer since July 2007.
Senior Accounting Manager–BNY Mellon Fund Administration. He is an officer of 54 investment companies (comprised of 121 portfolios) managed by the Adviser or an affiliate of the Adviser. He is 56 years old and has been an employee of the Adviser since June 1989.
ROBERT SVAGNA, Assistant Treasurer since December 2002.
Senior Accounting Manager–BNY Mellon Fund Administration. He is an officer of 54 investment companies (comprised of 121 portfolios) managed by the Adviser or an affiliate of the Adviser. He is 56 years old and has been an employee of the Adviser since November 1990.
JOSEPH W. CONNOLLY, Chief Compliance Officer since October 2004.
Chief Compliance Officer of the BNY Mellon Family of Funds and BNY Mellon Funds Trust since 2004; and Chief Compliance Officer of the Adviser from 2004 until June 2021. He is the Chief Compliance Officer of 53 investment companies (comprised of 105 portfolios) managed by the Adviser. He is 66 years old.
CARIDAD M. CAROSELLA, Anti-Money Laundering Compliance Officer since January 2016.
Anti-Money Laundering Compliance Officer of the BNY Mellon Family of Funds and BNY Mellon Funds Trust. She is an officer of 47 investment companies (comprised of 114 portfolios) managed by the Adviser or an affiliate of the Adviser. She is 55 years old and has been an employee of the Distributor since 1997.
40
This page intentionally left blank.
41
BNY Mellon Global Emerging Markets Fund
240 Greenwich Street
New York, NY 10286
Adviser
BNY Mellon Investment Adviser, Inc.
240 Greenwich Street
New York, NY 10286
Sub-Adviser
Newton Investment Management Limited
160 Queen Victoria Street
London, EC4V, 4LA, England
Custodian
The Bank of New York Mellon
240 Greenwich Street
New York, NY 10286
Transfer Agent &
Dividend Disbursing Agent
BNY Mellon Transfer, Inc.
240 Greenwich Street
New York, NY 10286
Distributor
BNY Mellon Securities Corporation
240 Greenwich Street
New York, NY 10286
| | |
Ticker Symbols: | Class A: DGEAX Class C: DGECX Class I: DGIEX Class Y: DGEYX |
Telephone Call your financial representative or 1-800-373-9387
Mail The BNY Mellon Family of Funds, 144 Glenn Curtiss Boulevard, Uniondale, NY 11556-0144
E-mail Send your request to info@bnymellon.com
Internet Information can be viewed online or downloaded at www.im.bnymellon.com
The fund files its complete schedule of portfolio holdings with the Securities and Exchange Commission (“SEC”) for the first and third quarters of each fiscal year on Form N-PORT. The fund’s Forms N-PORT are available on the SEC’s website at www.sec.gov.
A description of the policies and procedures that the fund uses to determine how to vote proxies relating to portfolio securities and information regarding how the fund voted these proxies for the most recent 12-month period ended June 30 is available at www.im.bnymellon.com and on the SEC’s website at www.sec.gov and without charge, upon request, by calling 1-800-373-9387.
| | |
© 2023 BNY Mellon Securities Corporation
6243AR1023 | 
|
BNY Mellon Yield Enhancement Strategy Fund
| |
ANNUAL REPORT October 31, 2023 |
| |
Save time. Save paper. View your next shareholder report online as soon as it’s available. Log into www.im.bnymellon.com and sign up for eCommunications. It’s simple and only takes a few minutes. |
| |
The views expressed in this report reflect those of the portfolio manager(s) only through the end of the period covered and do not necessarily represent the views of BNY Mellon Investment Adviser, Inc. or any other person in the BNY Mellon Investment Adviser, Inc. organization. Any such views are subject to change at any time based upon market or other conditions and BNY Mellon Investment Adviser, Inc. disclaims any responsibility to update such views. These views may not be relied on as investment advice and, because investment decisions for a fund in the BNY Mellon Family of Funds are based on numerous factors, may not be relied on as an indication of trading intent on behalf of any fund in the BNY Mellon Family of Funds. |
| |
Not FDIC-Insured • Not Bank-Guaranteed • May Lose Value |
Contents
T H E F U N D
F O R M O R E I N F O R M AT I O N
Back Cover
DISCUSSION OF FUND PERFORMANCE (Unaudited)
For the period from November 1, 2022, through October 31, 2023, as provided by Anthony Mastrocola and Lisa M. Sampson, Portfolio Managers
Market and Fund Performance Overview
For the 12-month period ended October 31, 2023, the BNY Mellon Yield Enhancement Strategy Fund (the “fund”) produced a total return of 5.32% for Class A shares, 4.67% for Class C shares, 5.84% for Class I shares and 5.90% for Class Y shares.1 In comparison, the Lipper Alternative Credit Focus Funds Index (the “Index”) produced a total return of 4.81% for the same period, and the Bloomberg US Aggregate Bond Index (the “Bloomberg Agg Index”) produced a total return of .36% for the same period.2
Bond prices rose during the reporting period as inflation eased, the U.S. Federal Reserve (the “Fed”) appeared to near the end of its current interest-rate hiking cycle, and global economic growth remained broadly positive. The fund produced mixed performance relative to the Index, with positive contributions from most strategies.
The Fund’s Investment Approach
The fund seeks high current income. To pursue its goal, it normally allocates its assets across fixed-income investment strategies. The fund is designed to complement and diversify traditional bond portfolios. The fund normally allocates its assets among other investment companies (underlying funds) that employ various fixed-income investment strategies, including those focusing on domestic and foreign corporate bonds, high yield securities (“junk” bonds), senior loans, emerging-markets debt, municipal securities and Treasury inflation-protected securities (TIPS).
BNY Mellon Investment Adviser, Inc. determines the fund’s asset allocation to the fixed-income investment strategies and sets the investment ranges using fundamental and quantitative analysis and its economic and financial markets outlook. Underlying funds are selected based on their investment objectives and management policies, investment strategies and portfolio holdings, risk/reward profiles, historical performance and other factors. As of October 31, 2023, the fund held investments in: BNY Mellon Corporate Bond Fund, BNY Mellon Municipal Opportunities Fund, BNY Mellon Floating Rate Income Fund, BNY Mellon High Yield Fund, BNY Mellon Global Dynamic Bond Income Fund and TCW Emerging Markets Income Fund.
Inflation Eases as Rates Increase
Interest-rate hikes implemented by central banks began to gain traction during the reporting period in the fight against rampant inflation. In October 2022, just prior to the start of the period, U.S. inflation stood at 7.7%, while inflation in the 20-member eurozone averaged 10.6%. The Fed and the European Central Bank both raised rates during the period, with the Fed on a more aggressive path. Inflation appeared to respond, declining to 3.7% in the United States and 2.9% in the eurozone by the end of the period. Economic growth rates proved erratic, increasing late in the period in the United States, while dipping into slightly negative territory in Europe. Similar trends
2
elsewhere in the world encouraged hopes that inflation might be tamed without prompting a major global recession.
Although central banks remained hawkish in the fight against inflation, this stance was largely priced into the global bond market at the start of the period, which almost coincided with a peak in U.S. 10-year Treasury yields. Later in the period, however, increasing U.S. wage pressures and unexpectedly robust U.S. economic growth prompted the Fed to warn that rates were likely to remain relatively high for longer than previously expected. Yields rose again, with the 10-year Treasury reaching a new 15-year high of nearly 5% in October 2023, and the two-year Treasury topping 5%, near historic highs. Bond prices retreated in the face of these developments, with the Bloomberg Agg Index ending the period nearly flat. However, floating-rate instruments benefited from the rising rate environment, delivering strongly positive returns.
Manager Selection Drove Fund Performance
The fund’s performance relative to the Index during the reporting period was primarily determined by allocation effects and the performance of underlying funds. The strongest contribution to the fund’s performance relative to the Index came from an overweight allocation to the floating-rate sector, which generated double-digit returns in a rising rate environment. The fund’s higher yield and lower duration also bolstered relative returns, as higher yields helped offset the negative impact of rising rates. The most significant detraction from relative performance came from the fund’s allocation to municipal bonds, through holdings of BNY Mellon Municipal Opportunities Fund. The fund’s opportunistic strategy, implemented through holdings of BNY Mellon Global Dynamic Bond Income Fund, also took a slight toll on relative returns. However, all sectors produced positive absolute returns.
Seeing Opportunities in Several Sectors
As of October 31, 2023, fixed-income investors face a host of challenges, with the Fed remaining hawkish, the yield curve still inverted after more than a year, default rates rising and economic and geopolitical risks impinging on financial markets from several sides. In light of the market’s uncertainties, we are maintaining the fund’s overall positioning. Nevertheless, we believe current yields present a buying opportunity and continue to see extending duration as a favorable risk/reward trade-off into 2024. Within the high yield sector, a post-recession bounce back and improving financial conditions to ease credit spreads point to higher expected returns. Emerging-markets USD debt offers reasonable
3
DISCUSSION OF FUND PERFORMANCE (Unaudited) (continued)
yields, but a combination of European and Chinese slowdown, tight spreads and frontier market distress lead us to remain cautious.
November 15, 2023
1 Total return includes reinvestment of dividends and any capital gains paid and does not take into consideration the maximum initial sales charge in the case of Class A shares, or the applicable contingent deferred sales charge imposed on redemptions in the case of Class C shares. Had these charges been reflected, returns would have been lower. Class I and Class Y shares are not subject to any initial or deferred sales charges. Share price, yield and investment return fluctuate such that upon redemption, fund shares may be worth more or less than their original cost. Past performance is no guarantee of future results.
2 Source: Lipper Inc. — The Bloomberg US Aggregate Bond Index is a broad-based, flagship benchmark that measures the investment grade, U.S. dollar-denominated, fixed-rate, taxable bond market. The Index includes Treasuries, government-related and corporate securities, MBS (agency fixed-rate and hybrid ARM pass-throughs), ABS and CMBS (agency and non-agency). The Lipper Alternative Credit Focus Funds Index consists of funds that, by prospectus language, invest in a wide range of credit-structured vehicles by using either fundamental credit research analysis or quantitative credit portfolio modeling trying to benefit from any changes in credit quality, credit spreads and market liquidity. Investors cannot invest directly in any index.
Bonds are subject generally to interest-rate, credit, liquidity and market risks, to varying degrees, all of which are more fully described in the fund’s prospectus. Generally, all other factors being equal, bond prices are inversely related to interest-rate changes, and rate increases can cause price declines.
Municipal income may be subject to state and local taxes. Capital gains, if any, are taxable.
Inflation-linked bonds (ILBs) issued by a government are fixed-income securities whose principal value is periodically adjusted according to the rate of inflation; ILBs decline in value when real interest rates rise. Treasury Inflation-Protected Securities (TIPS) are ILBs issued by the U.S. Government.
Mortgage-backed securities: Ginnie Maes and other securities backed by the full faith and credit of the United States Government are guaranteed only as to the timely payment of interest and principal when held to maturity. The market prices for such securities are not guaranteed and will fluctuate. Privately issued mortgage-related securities also are subject to credit risks associated with the underlying mortgage properties. These securities may be more volatile and less liquid than more traditional, government backed debt securities.
High yield bonds are subject to increased credit risk and are considered speculative in terms of the issuer’s perceived ability to continue making interest payments on a timely basis and to repay principal upon maturity.
Foreign bonds are subject to special risks, including exposure to currency fluctuations, changing political and economic conditions, and potentially less liquidity. These risks are generally greater with emerging-markets countries than with more economically and politically established foreign countries.
Investments in foreign currencies are subject to the risk that those currencies will decline in value relative to the U.S. dollar, or, in the case of hedged positions, that the U.S. dollar will decline relative to the currency being hedged. Currency rates in foreign countries may fluctuate significantly over short periods of time. A decline in the value of foreign currencies relative to the U.S. dollar will reduce the value of securities held by the fund and denominated in those currencies. The use of leverage may magnify the fund’s gains or losses. For derivatives with a leveraging component, adverse changes in the value or level of the underlying asset can result in a loss that is much greater than the original investment in the derivative.
The underlying funds’ underlying strategies may use derivative instruments. A small investment in derivatives could have a potentially large impact on the fund’s performance. The use of derivatives involves risks different from, or possibly greater than, the risks associated with investing directly in the underlying assets.
The ability of the fund to achieve its investment goal depends, in part, on the ability of BNY Mellon Investment Adviser, Inc. to effectively allocate the fund’s assets among the investment strategies and the underlying funds.
To the extent the fund invests in pooled investment vehicles, such as ETFs and other investment companies, the fund will be affected by the investment policies, practices and performance of such entities in direct proportion to the amount of assets the fund has invested therein. The risks of investing in other investment companies, including ETFs, typically reflect the risks associated with the types of instruments in which the investment companies invest. When the fund invests in an ETF or other investment company, shareholders of the fund will bear indirectly their proportionate share of the expenses of the ETF or other investment company (including management fees) in addition to the expenses of the fund. ETFs are exchange-traded investment companies that are, in many cases, designed to provide investment results corresponding to an index. The value of the underlying securities can fluctuate in response to activities of individual companies or in response to general market and/or economic conditions. Additional risks of investments in ETFs include: (i) the market price of an ETF’s shares may trade at a discount to its net asset value; (ii) an active trading market for an ETF’s shares may not develop or be maintained; or (iii) trading may be halted if the listing exchanges’ officials deem such action appropriate, the shares are delisted from the exchange, or the activation of market-wide “circuit breakers” (which are tied to large decreases in stock prices) halts trading generally. The fund will incur brokerage costs when purchasing and selling shares of ETFs.
4
FUND PERFORMANCE (Unaudited)
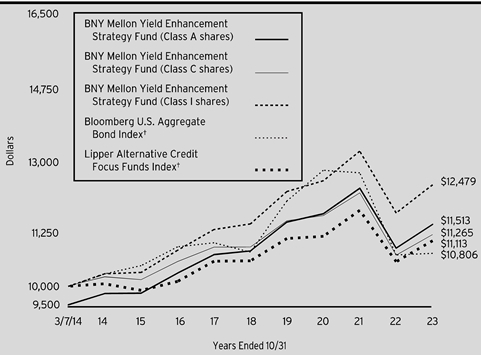
Comparison of change in value of a $10,000 investment in Class A shares, Class C shares and Class I shares of BNY Mellon Yield Enhancement Strategy Fund with a hypothetical investment of $10,000 in the Bloomberg U.S. Aggregate Bond Index and Lipper Alternative Credit Focus Funds Index.
† Source: Lipper Inc.
Past performance is not predictive of future performance.
The above graph compares a hypothetical $10,000 investment made in each of the Class A shares, Class C shares and Class I shares of BNY Mellon Yield Enhancement Strategy Fund on 3/7/14 (inception date) to a hypothetical investment of $10,000 made in the Bloomberg U.S. Aggregate Bond Index and Lipper Alternative Credit Focus Funds Index on that date. All dividends and capital gain distributions are reinvested.
The fund’s performance shown in the line graph above takes into account the maximum initial sales charge on Class A shares and all other applicable fees and expenses on Class A shares, Class C shares and Class I shares. The Bloomberg U.S. Aggregate Bond Index is a broad-based flagship benchmark that measures the investment-grade, U.S. dollar-denominated, fixed-rate taxable bond market. The Index includes Treasuries, government-related and corporate securities, MBS (agency fixed-rate and hybrid ARM pass-throughs), ABS and CMBS (agency and nonagency). The Lipper Alternative Credit Focus Funds Index consists of funds that, by prospectus language, invest in a wide range of credit-structured vehicles by using either fundamental credit research analysis or quantitative credit portfolio modeling trying to benefit from any changes in credit quality, credit spreads, and market liquidity. Unlike a mutual fund, the Indices are not subject to charges, fees and other expenses. Investors cannot invest directly in any index. Further information relating to fund performance, including expense reimbursements, if applicable, is contained in the Financial Highlights section of the prospectus and elsewhere in this report.
5
FUND PERFORMANCE (Unaudited) (continued)
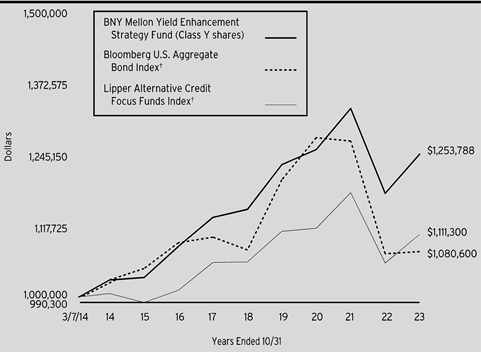
Comparison of change in value of a $1,000,000 investment in Class Y shares of BNY Mellon Yield Enhancement Strategy Fund with a hypothetical investment of $1,000,000 in the Bloomberg U.S. Aggregate Bond Index and Lipper Alternative Credit Focus Funds Index.
† Source: Lipper Inc.
Past performance is not predictive of future performance.
The above graph compares a hypothetical $1,000,000 investment made in Class Y shares of BNY Mellon Yield Enhancement Strategy Fund on 3/7/14 (inception date) to a hypothetical investment of $1,000,000 made in the Bloomberg U.S. Aggregate Bond Index and Lipper Alternative Credit Focus Funds Index on that date. All dividends and capital gain distributions are reinvested.
The fund’s performance shown in the line graph above takes into account all applicable fees and expenses of the fund’s Class Y shares. The Bloomberg U.S. Aggregate Bond Index is a broad-based flagship benchmark that measures the investment-grade, U.S. dollar-denominated, fixed-rate taxable bond market. The Index includes Treasuries, government-related and corporate securities, MBS (agency fixed-rate and hybrid ARM pass-throughs), ABS and CMBS (agency and nonagency). The Lipper Alternative Credit Focus Funds Index consists of funds that, by prospectus language, invest in a wide range of credit-structured vehicles by using either fundamental credit research analysis or quantitative credit portfolio modeling trying to benefit from any changes in credit quality, credit spreads, and market liquidity. Unlike a mutual fund, the Indices are not subject to charges, fees and other expenses. Investors cannot invest directly in any index. Further information relating to fund performance, including expense reimbursements, if applicable, is contained in the Financial Highlights section of the prospectus and elsewhere in this report.
6
| | | | | | | |
Average Annual Total Returns as of 10/31/2023 | | |
| Inception
Date | 1 Year | 5 Year | From
Inception |
Class A shares | | | | | |
with maximum sales charge (4.50%) | 3/7/14 | .55% | .23% | 1.47% | |
without sales charge | 3/7/14 | 5.32% | 1.17% | 1.96% | |
Class C shares | | | | | |
with applicable redemption charge † | 3/7/14 | 3.67% | .55% | 1.24% | |
without redemption | 3/7/14 | 4.67% | .55% | 1.24% | |
Class I shares | 3/7/14 | 5.84% | 1.61% | 2.32% | |
Class Y shares | 3/7/14 | 5.90% | 1.65% | 2.37% | |
Bloomberg U.S.
Aggregate Bond Index | 2/28/14 | .36% | -.06% | .81% | †† |
Lipper Alternative
Credit Focus Funds Index | 2/28/14 | 4.81% | .91% | 1.10% | †† |
† The maximum contingent deferred sales charge for Class C shares is 1% for shares redeemed within one year of the date of purchase.
†† For comparative purposes, the value of each index on 2/28/14 is used as the beginning value on 3/7/14.
The performance data quoted represents past performance, which is no guarantee of future results. Share price and investment return fluctuate and an investor’s shares may be worth more or less than original cost upon redemption. Current performance may be lower or higher than the performance quoted. Go to www.im.bnymellon.com for the fund’s most recent month-end returns.
The fund’s performance shown in the graphs and table does not reflect the deduction of taxes that a shareholder would pay on fund distributions or the redemption of fund shares. In addition to the performance of Class A shares shown with and without a maximum sales charge, the fund’s performance shown in the table takes into account all other applicable fees and expenses on all classes.
7
UNDERSTANDING YOUR FUND’S EXPENSES (Unaudited)
As a mutual fund investor, you pay ongoing expenses, such as management fees and other expenses. Using the information below, you can estimate how these expenses affect your investment and compare them with the expenses of other funds. You also may pay one-time transaction expenses, including sales charges (loads) and redemption fees, which are not shown in this section and would have resulted in higher total expenses. For more information, see your fund’s prospectus or talk to your financial adviser.
Review your fund’s expenses
The table below shows the expenses you would have paid on a $1,000 investment in BNY Mellon Yield Enhancement Strategy Fund from May 1, 2023 to October 31, 2023. It also shows how much a $1,000 investment would be worth at the close of the period, assuming actual returns and expenses.
| | | | | | | |
Expenses and Value of a $1,000 Investment | |
Assume actual returns for the six months ended October 31, 2023 | |
| | | | | | |
| | Class A | Class C | Class I | Class Y | |
Expenses paid per $1,000† | $3.26 | $6.35 | $.70 | $.45 | |
Ending value (after expenses) | $987.40 | $984.30 | $989.90 | $990.10 | |
COMPARING YOUR FUND’S EXPENSES WITH THOSE OF OTHER FUNDS (Unaudited)
Using the SEC’s method to compare expenses
The Securities and Exchange Commission (“SEC”) has established guidelines to help investors assess fund expenses. Per these guidelines, the table below shows your fund’s expenses based on a $1,000 investment, assuming a hypothetical 5% annualized return. You can use this information to compare the ongoing expenses (but not transaction expenses or total cost) of investing in the fund with those of other funds. All mutual fund shareholder reports will provide this information to help you make this comparison. Please note that you cannot use this information to estimate your actual ending account balance and expenses paid during the period.
| | | | | | | |
Expenses and Value of a $1,000 Investment | |
Assuming a hypothetical 5% annualized return for the six months ended October 31, 2023 | |
| | | | | | |
| | Class A | Class C | Class I | Class Y | |
Expenses paid per $1,000† | $3.31 | $6.46 | $.71 | $.46 | |
Ending value (after expenses) | $1,021.93 | $1,018.80 | $1,024.50 | $1,024.75 | |
† | Expenses are equal to the fund’s annualized expense ratio of .65% for Class A, 1.27% for Class C, .14% for Class I and .09% for Class Y, multiplied by the average account value over the period, multiplied by 184/365 (to reflect the one-half year period). |
8
STATEMENT OF INVESTMENTS
October 31, 2023
| | | | | | | | |
| |
Description | | | | Shares | | Value ($) | |
Investment Companies - 97.1% | | | | | |
Domestic Fixed Income - 45.3% | | | | | |
BNY Mellon Corporate Bond Fund, Cl. M | | | | 2,068,283 | a | 23,350,920 | |
BNY Mellon Floating Rate Income Fund, Cl. Y | | | | 5,830,224 | a | 63,724,344 | |
BNY Mellon High Yield Fund, Cl. I | | | | 6,764,808 | a | 34,094,634 | |
| | | | | 121,169,898 | |
Foreign Fixed Income - 22.3% | | | | | |
BNY Mellon Global Dynamic Bond Income Fund, Cl. Y | | | | 3,389,700 | a | 34,337,658 | |
TCW Emerging Markets
Income Fund, Cl. I | | | | 4,324,602 | | 25,255,675 | |
| | | | | 59,593,333 | |
Municipal Bond - 29.5% | | | | | |
BNY Mellon Municipal Opportunities Fund, Cl. M | | | | 6,920,828 | a | 79,105,062 | |
Total Investments (cost $285,275,674) | | 97.1% | | 259,868,293 | |
Cash and Receivables (Net) | | 2.9% | | 7,795,678 | |
Net Assets | | 100.0% | | 267,663,971 | |
a Investment in affiliated issuer. The investment objective of this investment company is publicly available and can be found within the investment company’s prospectus.
| | |
Portfolio Summary (Unaudited) † | Value (%) |
Investment Companies | 97.1 |
| | 97.1 |
† Based on net assets.
See notes to financial statements.
| | | | | | |
Affiliated Issuers | | |
Description | Value ($) 10/31/2022 | Purchases ($)† | Sales ($) | Net Realized
Gain (Loss) ($) | |
Domestic Fixed Income - 45.3% | | |
BNY Mellon Corporate Bond Fund, Cl. M - 8.7% | 25,772,137 | 6,799,990 | (9,587,187) | (250,183) | |
BNY Mellon Floating Rate Income Fund, Cl. Y - 23.8% | 66,166,735 | 20,105,825 | (23,967,966) | (1,118,323) | |
BNY Mellon High Yield Fund, Cl. I - 12.8% | 37,249,116 | 10,537,321 | (13,315,537) | (411,434) | |
9
STATEMENT OF INVESTMENTS (continued)
| | | | | | |
Description | Value ($) 10/31/2022 | Purchases ($)† | Sales ($) | Net Realized
Gain (Loss) ($) | |
Foreign Fixed Income - 12.8% | | |
BNY Mellon Global Dynamic Bond Income Fund, Cl. Y - 12.8% | 38,303,710 | 11,528,659 | (13,848,158) | (772,253) | |
Municipal Bond - 29.6% | | |
BNY Mellon Municipal Opportunities Fund, Cl. M - 29.6% | 89,397,702 | 24,879,069 | (34,087,774) | (1,232,301) | |
Total - 87.7% | 256,889,400 | 73,850,864 | (94,806,622) | (3,784,494) | |
| | | | | |
Description | Net Change in
Unrealized Appreciation (Depreciation) ($) | Value ($)
10/31/2023 | Dividends/
Distributions ($) | |
Domestic Fixed Income - 45.3% | | |
BNY Mellon Corporate Bond Fund, Cl. M - 8.7% | 616,163 | 23,350,920 | 993,678 | |
BNY Mellon Floating Rate Income Fund, Cl. Y - 23.8% | 2,538,073 | 63,724,344 | 5,590,044 | |
BNY Mellon High Yield Fund, Cl. I - 12.8% | 35,168 | 34,094,634 | 2,465,246 | |
Foreign Fixed Income - 12.8% | | |
BNY Mellon Global Dynamic Bond Income Fund, Cl. Y - 12.8% | (874,300) | 34,337,658 | 3,141,763 | |
Municipal Bond - 29.6% | | |
BNY Mellon Municipal Opportunities Fund, Cl. M - 29.6% | 148,366 | 79,105,062 | 4,227,674 | |
Total - 87.7% | 2,463,470 | 234,612,618 | 16,418,405 | |
† Includes reinvested dividends/distributions.
See notes to financial statements.
10
STATEMENT OF ASSETS AND LIABILITIES
October 31, 2023
| | | | | | | |
| | | | | | |
| | | Cost | | Value | |
Assets ($): | | | | |
Investments in securities—See Statement of Investments | | | |
Unaffiliated issuers | 29,296,063 | | 25,255,675 | |
Affiliated issuers | | 255,979,611 | | 234,612,618 | |
Cash | | | | | 3,457,155 | |
Receivable for shares of Common Stock subscribed | | 4,959,913 | |
Dividends receivable | | 667,276 | |
Prepaid expenses | | | | | 31,168 | |
| | | | | 268,983,805 | |
Liabilities ($): | | | | |
Due to BNY Mellon Investment Adviser, Inc. and affiliates—Note 3(c) | | 6,373 | |
Payable for shares of Common Stock redeemed | | 663,402 | |
Payable for investment securities purchased | | 586,711 | |
Directors’ fees and expenses payable | | 4,414 | |
Interest payable—Note 2 | | 226 | |
Other accrued expenses | | | | | 58,708 | |
| | | | | 1,319,834 | |
Net Assets ($) | | | 267,663,971 | |
Composition of Net Assets ($): | | | | |
Paid-in capital | | | | | 324,288,325 | |
Total distributable earnings (loss) | | | | | (56,624,354) | |
Net Assets ($) | | | 267,663,971 | |
| | | | | | |
Net Asset Value Per Share | Class A | Class C | Class I | Class Y | |
Net Assets ($) | 301,331 | 167,615 | 11,237,711 | 255,957,314 | |
Shares Outstanding | 28,599 | 15,920 | 1,063,509 | 24,244,008 | |
Net Asset Value Per Share ($) | 10.54 | 10.53 | 10.57 | 10.56 | |
| | | | | |
See notes to financial statements. | | | | | |
11
STATEMENT OF OPERATIONS
Year Ended October 31, 2023
| | | | | | | |
| | | | | | |
| | | | | | |
Investment Income ($): | | | | |
Income: | | | | |
Cash dividends: | |
Unaffiliated issuers | | | 1,511,871 | |
Affiliated issuers | | | 15,249,771 | |
Interest | | | 149,444 | |
Total Income | | | 16,911,086 | |
Expenses: | | | | |
Professional fees | | | 82,844 | |
Registration fees | | | 70,803 | |
Directors’ fees and expenses—Note 3(d) | | | 36,656 | |
Prospectus and shareholders’ reports | | | 24,010 | |
Chief Compliance Officer fees—Note 3(c) | | | 15,533 | |
Shareholder servicing costs—Note 3(c) | | | 7,386 | |
Loan commitment fees—Note 2 | | | 6,884 | |
Custodian fees—Note 3(c) | | | 2,113 | |
Distribution fees—Note 3(b) | | | 1,356 | |
Interest expense—Note 2 | | | 1,026 | |
Miscellaneous | | | 17,731 | |
Total Expenses | | | 266,342 | |
Less—reduction in fees due to earnings credits—Note 3(c) | | | (1,246) | |
Net Expenses | | | 265,096 | |
Net Investment Income | | | 16,645,990 | |
Realized and Unrealized Gain (Loss) on Investments—Note 4 ($): | | |
Net realized gain (loss) on investments: | | |
Unaffiliated issuers | | | | (586,816) | |
Affiliated issuers | | | | (3,784,494) | |
Capital gain distributions from affiliated issuers | 1,168,634 | |
Net Realized Gain (Loss) | | | (3,202,676) | |
Net change in unrealized appreciation (depreciation) on investments: | | |
Unaffiliated issuers | | | | 1,446,448 | |
Affiliated issuers | | | | 2,463,470 | |
Net Change in Unrealized Appreciation (Depreciation) | | | 3,909,918 | |
Net Realized and Unrealized Gain (Loss) on Investments | | | 707,242 | |
Net Increase in Net Assets Resulting from Operations | | 17,353,232 | |
| | | | | | |
See notes to financial statements. | | | | | |
12
STATEMENT OF CHANGES IN NET ASSETS
| | | | | | | | | | |
| | | | Year Ended October 31, |
| | | | 2023 | | 2022 | |
Operations ($): | | | | | | | | |
Net investment income | | | 16,645,990 | | | | 9,947,416 | |
Net realized gain (loss) on investments | | (3,202,676) | | | | (3,285,026) | |
Net change in unrealized appreciation
(depreciation) on investments | | 3,909,918 | | | | (40,005,497) | |
Net Increase (Decrease) in Net Assets
Resulting from Operations | 17,353,232 | | | | (33,343,107) | |
Distributions ($): | |
Distributions to shareholders: | | | | | | | | |
Class A | | | (17,719) | | | | (11,829) | |
Class C | | | (8,585) | | | | (3,874) | |
Class I | | | (540,137) | | | | (354,465) | |
Class Y | | | (16,696,989) | | | | (9,494,654) | |
Total Distributions | | | (17,263,430) | | | | (9,864,822) | |
Capital Stock Transactions ($): | |
Net proceeds from shares sold: | | | | | | | | |
Class A | | | 780 | | | | 239,055 | |
Class C | | | - | | | | 100,000 | |
Class I | | | 7,542,182 | | | | 5,740,551 | |
Class Y | | | 163,819,480 | | | | 184,096,578 | |
Distributions reinvested: | | | | | | | | |
Class A | | | 13,630 | | | | 9,357 | |
Class C | | | 7,558 | | | | 3,323 | |
Class I | | | 523,635 | | | | 331,888 | |
Class Y | | | 1,036,656 | | | | 587,119 | |
Cost of shares redeemed: | | | | | | | | |
Class A | | | (33,925) | | | | (288,900) | |
Class C | | | (18,724) | | | | - | |
Class I | | | (5,275,926) | | | | (7,004,799) | |
Class Y | | | (189,926,077) | | | | (131,432,044) | |
Increase (Decrease) in Net Assets
from Capital Stock Transactions | (22,310,731) | | | | 52,382,128 | |
Total Increase (Decrease) in Net Assets | (22,220,929) | | | | 9,174,199 | |
Net Assets ($): | |
Beginning of Period | | | 289,884,900 | | | | 280,710,701 | |
End of Period | | | 267,663,971 | | | | 289,884,900 | |
13
STATEMENT OF CHANGES IN NET ASSETS (continued)
| | | | | | | | | | |
| | | | Year Ended October 31, |
| | | | 2023 | | 2022 | |
Capital Share Transactions (Shares): | |
Class A | | | | | | | | |
Shares sold | | | 72 | | | | 21,057 | |
Shares issued for distributions reinvested | | | 1,266 | | | | 810 | |
Shares redeemed | | | (3,135) | | | | (25,244) | |
Net Increase (Decrease) in Shares Outstanding | (1,797) | | | | (3,377) | |
Class C | | | | | | | | |
Shares sold | | | - | | | | 8,137 | |
Shares issued for distributions reinvested | | | 703 | | | | 292 | |
Shares redeemed | | | (1,734) | | | | - | |
Net Increase (Decrease) in Shares Outstanding | (1,031) | | | | 8,429 | |
Class Ia | | | | | | | | |
Shares sold | | | 695,232 | | | | 488,838 | |
Shares issued for distributions reinvested | | | 48,501 | | | | 28,597 | |
Shares redeemed | | | (487,349) | | | | (606,876) | |
Net Increase (Decrease) in Shares Outstanding | 256,384 | | | | (89,441) | |
Class Ya | | | | | | | | |
Shares sold | | | 15,127,197 | | | | 16,515,155 | |
Shares issued for distributions reinvested | | | 96,125 | | | | 50,935 | |
Shares redeemed | | | (17,543,849) | | | | (11,765,055) | |
Net Increase (Decrease) in Shares Outstanding | (2,320,527) | | | | 4,801,035 | |
| | | | | | | | | |
a | During the period ended October 31, 2023, 340,063 Class Y shares representing $3,675,405 were exchanged for 339,790 Class I shares and during the period ended October 31, 2022, 371,780 Class Y shares representing $4,386,938 were exchanged for 371,455 Class I shares. | |
See notes to financial statements. | | | | | | | | |
14
FINANCIAL HIGHLIGHTS
The following tables describe the performance for each share class for the fiscal periods indicated. All information (except portfolio turnover rate) reflects financial results for a single fund share. Net asset value total return is calculated assuming an initial investment made at the net asset value at the beginning of the period, reinvestment of all dividends and distributions at net asset value during the period, and redemption at net asset value on the last day of the period. Net asset value total return includes adjustments in accordance with accounting principles generally accepted in the United States of America and as such, the net asset value for financial reporting purposes and the returns based upon those net asset values may differ from the net asset value and returns for shareholder transactions. These figures have been derived from the fund’s financial statements.
| | | | | | | | | | |
| | | | | | | | |
| | | | | | |
Class A Shares | | Year Ended October 31, |
| | 2023 | 2022 | 2021 | 2020 | 2019 | |
Per Share Data ($): | | | | | | | |
Net asset value, beginning of period | | 10.55 | 12.34 | 12.06 | 12.29 | 12.02 | |
Investment Operations: | | | | | | | |
Net investment incomea | | .56 | .35 | .36 | .42 | .49 | |
Net realized and unrealized
gain (loss) on investments | | .01 | (1.79) | .28 | (.21) | .27 | |
Total from Investment Operations | | .57 | (1.44) | .64 | .21 | .76 | |
Distributions: | | | | | | | |
Dividends from
net investment income | | (.58) | (.35) | (.36) | (.44) | (.49) | |
Net asset value, end of period | | 10.54 | 10.55 | 12.34 | 12.06 | 12.29 | |
Total Return (%)b | | 5.32 | (11.80) | 5.30 | 1.75 | 6.47 | |
Ratios/Supplemental Data (%): | | | | | | | |
Ratio of total expenses
to average net assetsc | | .64 | .60 | .53 | .49 | .47 | |
Ratio of net expenses
to average net assetsc | | .64 | .60 | .53 | .49 | .47 | |
Ratio of net investment income
to average net assetsc | | 5.18 | 3.03 | 2.88 | 3.47 | 4.19 | |
Portfolio Turnover Rate | | 28.91 | 34.02 | 10.58 | 8.41 | 21.45 | |
Net Assets, end of period ($ x 1,000) | | 301 | 321 | 417 | 564 | 585 | |
a Based on average shares outstanding.
b Exclusive of sales charge.
c Amount does not include the expenses of the underlying funds.
See notes to financial statements.
15
FINANCIAL HIGHLIGHTS (continued)
| | | | | | | | | | |
| | | | | | | | | |
| | | | | | |
Class C Shares | | Year Ended October 31, |
| | 2023 | 2022 | 2021 | 2020 | 2019 |
Per Share Data ($): | | | | | | | |
Net asset value, beginning of period | | | 10.54 | 12.05 | 12.29 | 12.02 | 12.40 |
Investment Operations: | | | | | | | |
Net investment incomea | | | .50 | .24 | .34 | .40 | .35 |
Net realized and unrealized
gain (loss) on investments | | | .00b | .33 | (.21) | .29 | (.35) |
Total from Investment Operations | | | .50 | .57 | .13 | .69 | - |
Distributions: | | | | | | | |
Dividends from
net investment income | | | (.51) | (.29) | (.37) | (.42) | (.38) |
Net asset value, end of period | | | 10.53 | 12.33 | 12.05 | 12.29 | 12.02 |
Total Return (%)c | | | 4.67 | 4.73 | 1.10 | 5.84 | .02 |
Ratios/Supplemental Data (%): | | | | | | | |
Ratio of total expenses
to average net assetsd | | | 1.25 | 1.23 | 1.11 | 1.12 | 1.26 |
Ratio of net expenses
to average net assetsd | | | 1.25 | 1.23 | 1.11 | 1.12 | 1.26 |
Ratio of net investment income
to average net assetsd | | | 4.57 | 2.02 | 2.88 | 3.32 | 2.84 |
Portfolio Turnover Rate | | | 28.91 | 10.58 | 8.41 | 21.45 | 22.78 |
Net Assets, end of period ($ x 1,000) | | | 168 | 105 | 24 | 25 | 24 |
a Based on average shares outstanding.
b Amount represents less than $.01 per share.
c Exclusive of sales charge.
d Amount does not include the expenses of the underlying funds.
See notes to financial statements.
16
| | | | | | | | | | | | | |
| | | | | | | |
| | | | | | |
Class I Shares | | Year Ended October 31, |
| | 2023 | 2022 | 2021 | 2020 | 2019 | |
Per Share Data ($): | | | | | | | |
Net asset value, beginning of period | | 10.58 | 12.37 | 12.09 | 12.32 | 12.05 | |
Investment Operations: | | | | | | | |
Net investment incomea | | .60 | .40 | .40 | .47 | .53 | |
Net realized and unrealized
gain (loss) on investments | | .03 | (1.78) | .29 | (.22) | .27 | |
Total from Investment Operations | | .63 | (1.38) | .69 | .25 | .80 | |
Distributions: | | | | | | | |
Dividends from
net investment income | | (.64) | (.41) | (.41) | (.48) | (.53) | |
Net asset value, end of period | | 10.57 | 10.58 | 12.37 | 12.09 | 12.32 | |
Total Return (%) | | 5.84 | (11.34) | 5.74 | 2.13 | 6.85 | |
Ratios/Supplemental Data (%): | | | | | | | |
Ratio of total expenses
to average net assetsb | | .14 | .12 | .11 | .11 | .09 | |
Ratio of net expenses
to average net assetsb | | .13 | .12 | .11 | .11 | .09 | |
Ratio of net investment income
to average net assetsb | | 5.56 | 3.50 | 3.23 | 3.85 | 4.34 | |
Portfolio Turnover Rate | | 28.91 | 34.02 | 10.58 | 8.41 | 21.45 | |
Net Assets, end of period ($ x 1,000) | | 11,238 | 8,540 | 11,095 | 9,877 | 9,804 | |
a Based on average shares outstanding.
b Amount does not include the expenses of the underlying funds.
See notes to financial statements.
17
FINANCIAL HIGHLIGHTS (continued)
| | | | | | | | | | | | | | |
| | | | | | | |
| | | | | | |
Class Y Shares | | Year Ended October 31, |
| | 2023 | 2022 | 2021 | 2020 | 2019 | |
Per Share Data ($): | | | | | | | |
Net asset value, beginning of period | | 10.57 | 12.36 | 12.08 | 12.31 | 12.04 | |
Investment Operations: | | | | | | | |
Net investment incomea | | .63 | .41 | .41 | .48 | .53 | |
Net realized and unrealized
gain (loss) on investments | | .00b | (1.79) | .28 | (.22) | .28 | |
Total from Investment Operations | | .63 | (1.38) | .69 | .26 | .81 | |
Distributions: | | | | | | | |
Dividends from
net investment income | | (.64) | (.41) | (.41) | (.49) | (.54) | |
Net asset value, end of period | | 10.56 | 10.57 | 12.36 | 12.08 | 12.31 | |
Total Return (%) | | 5.90 | (11.32) | 5.78 | 2.18 | 6.89 | |
Ratios/Supplemental Data (%): | | | | | | | |
Ratio of total expenses
to average net assetsc | | .09 | .09 | .08 | .06 | .06 | |
Ratio of net expenses
to average net assetsc | | .09 | .08 | .08 | .06 | .06 | |
Ratio of net investment income
to average net assetsc | | 5.78 | 3.56 | 3.33 | 3.96 | 4.39 | |
Portfolio Turnover Rate | | 28.91 | 34.02 | 10.58 | 8.41 | 21.45 | |
Net Assets,
end of period ($ x 1,000) | | 255,957 | 280,845 | 269,094 | 314,130 | 409,982 | |
a Based on average shares outstanding.
b Amount represents less than $.01 per share.
c Amount does not include the expenses of the underlying funds.
See notes to financial statements.
18
NOTES TO FINANCIAL STATEMENTS
NOTE 1—Significant Accounting Policies:
BNY Mellon Yield Enhancement Strategy Fund (the “fund”) is a separate diversified series of BNY Mellon Investment Funds II, Inc. (the “Company”), which is registered under the Investment Company Act of 1940, as amended (the “Act”), as an open-end management investment company and operates as a series company currently offering two series, including the fund. The fund’s investment objective is to seek high current income. BNY Mellon Investment Adviser, Inc. (the “Adviser”), a wholly-owned subsidiary of The Bank of New York Mellon Corporation (“BNY Mellon”), serves as the fund’s investment adviser.
BNY Mellon Securities Corporation (the “Distributor”), a wholly-owned subsidiary of the Adviser, is the distributor of the fund’s shares. The fund is authorized to issue 500 million shares of $.001 par value Common Stock. The fund currently has authorized four classes of shares: Class A (100 million shares authorized), Class C (100 million shares authorized), Class I (100 million shares authorized) and Class Y (200 million shares authorized). Class A and Class C shares are sold primarily to retail investors through financial intermediaries and bear Distribution and/or Shareholder Services Plan fees. Class A shares generally are subject to a sales charge imposed at the time of purchase. Class A shares bought without an initial sales charge as part of an investment of $1 million or more may be charged a contingent deferred sales charge (“CDSC”) of 1.00% if redeemed within one year. Class C shares are subject to a CDSC imposed on Class C shares redeemed within one year of purchase. Class C shares automatically convert to Class A shares eight years after the date of purchase, without the imposition of a sales charge. Class I shares are sold primarily to bank trust departments and other financial service providers (including BNY Mellon and its affiliates), acting on behalf of customers having a qualified trust or an investment account or relationship at such institution, and bear no Distribution or Shareholder Services Plan fees. Class Y shares are sold at net asset value per share generally to institutional investors, and bear no Distribution or Shareholder Services Plan fees. Class I and Class Y shares are offered without a front-end sales charge or CDSC. Other differences between the classes include the services offered to and the expenses borne by each class, the allocation of certain transfer agency costs and certain voting rights. Income, expenses (other than expenses attributable to a specific class), and realized and unrealized gains or losses on investments are allocated to each class of shares based on its relative net assets.
19
NOTES TO FINANCIAL STATEMENTS (continued)
As of October 31, 2023, MBC Investments Corporation, an indirect subsidiary of BNY Mellon, held 2,000 Class A shares and 2,000 Class C shares of the fund.
The Company accounts separately for the assets, liabilities and operations of each series. Expenses directly attributable to each series are charged to that series’ operations; expenses which are applicable to all series are allocated among them on a pro rata basis.
The Financial Accounting Standards Board (“FASB”) Accounting Standards Codification (“ASC”) is the exclusive reference of authoritative U.S. generally accepted accounting principles (“GAAP”) recognized by the FASB to be applied by nongovernmental entities. Rules and interpretive releases of the SEC under authority of federal laws are also sources of authoritative GAAP for SEC registrants. The fund is an investment company and applies the accounting and reporting guidance of the FASB ASC Topic 946 Financial Services-Investment Companies. The fund’s financial statements are prepared in accordance with GAAP, which may require the use of management estimates and assumptions. Actual results could differ from those estimates.
The Company enters into contracts that contain a variety of indemnifications. The fund’s maximum exposure under these arrangements is unknown. The fund does not anticipate recognizing any loss related to these arrangements.
(a) Portfolio valuation: The fair value of a financial instrument is the amount that would be received to sell an asset or paid to transfer a liability in an orderly transaction between market participants at the measurement date (i.e., the exit price). GAAP establishes a fair value hierarchy that prioritizes the inputs of valuation techniques used to measure fair value. This hierarchy gives the highest priority to unadjusted quoted prices in active markets for identical assets or liabilities (Level 1 measurements) and the lowest priority to unobservable inputs (Level 3 measurements).
Additionally, GAAP provides guidance on determining whether the volume and activity in a market has decreased significantly and whether such a decrease in activity results in transactions that are not orderly. GAAP requires enhanced disclosures around valuation inputs and techniques used during annual and interim periods.
Various inputs are used in determining the value of the fund’s investments relating to fair value measurements. These inputs are summarized in the three broad levels listed below:
20
Level 1—unadjusted quoted prices in active markets for identical investments.
Level 2—other significant observable inputs (including quoted prices for similar investments, interest rates, prepayment speeds, credit risk, etc.).
Level 3—significant unobservable inputs (including the fund’s own assumptions in determining the fair value of investments).
The inputs or methodology used for valuing securities are not necessarily an indication of the risk associated with investing in those securities.
The Company’s Board of Directors (the “Board”) has designated the Adviser as the fund’s valuation designee to make all fair value determinations with respect to the fund’s portfolio investments, subject to the Board’s oversight and pursuant to Rule 2a-5 under the Act.
Investments are valued at the net asset value of each underlying fund determined as of the close of the New York Stock Exchange (generally 4 p.m., Eastern time) on the valuation date and are generally categorized within Level 1 of the fair value hierarchy.
The following is a summary of the inputs used as of October 31, 2023 in valuing the fund’s investments:
| | | | | | | |
| | Level 1-Unadjusted Quoted Prices | Level 2- Other Significant Observable Inputs | | Level 3-Significant Unobservable Inputs | Total | |
Assets ($) | | |
Investments in Securities:† | | |
Investment Companies | 259,868,293 | - | | - | 259,868,293 | |
† See Statement of Investments for additional detailed categorizations, if any.
(b) Securities transactions and investment income: Securities transactions are recorded on a trade date basis. Realized gains and losses from securities transactions are recorded on the identified cost basis. Dividend income is recognized on the ex-dividend date and interest income, including, where applicable, accretion of discount and amortization of premium on investments, is recognized on the accrual basis.
(c) Affiliated issuers: Investments in other investment companies advised by the Adviser are considered “affiliated” under the Act.
(d) Market Risk: The value of the securities in which the fund invests may be affected by political, regulatory, economic and social developments,
21
NOTES TO FINANCIAL STATEMENTS (continued)
and developments that impact specific economic sectors, industries or segments of the market. In addition, turbulence in financial markets and reduced liquidity in equity, credit and/or fixed-income markets may negatively affect many issuers, which could adversely affect the fund. Global economies and financial markets are becoming increasingly interconnected, and conditions and events in one country, region or financial market may adversely impact issuers in a different country, region or financial market. These risks may be magnified if certain events or developments adversely interrupt the global supply chain; in these and other circumstances, such risks might affect companies world-wide.
Allocation Risk: The ability of the fund to achieve its investment goal depends, in part, on the ability of the Adviser to allocate effectively the fund's assets among the investment strategies and the underlying funds. There can be no assurance that the actual allocations will be effective in achieving the fund's investment goal.
Exchanged Traded Fund (“ETF”) and Other Investment Company Risk: To the extent the fund invests in pooled investment vehicles, such as ETF and other investment companies, the fund will be affected by the investment policies, practices and performance of such entities in direct proportion to the amount of assets the fund has invested therein. The risks of investing in other investment companies, including ETFs, typically reflect the risks associated with the types of instruments in which the investment companies invest. When the fund invests in an ETF or other investment companies, shareholders of the fund will bear indirectly their proportionate share of the expenses of the ETF or other investment companies (including management fees) in addition to the expenses of the fund.
(e) Dividends and distributions to shareholders: Dividends and distributions are recorded on the ex-dividend date. Dividends from net investment income are normally declared and paid on a monthly basis. Dividends from net realized capital gains, if any, are normally declared and paid annually, but the fund may make distributions on a more frequent basis to comply with the distribution requirements of the Internal Revenue Code of 1986, as amended (the “Code”). To the extent that net realized capital gains can be offset by capital loss carryovers, it is the policy of the fund not to distribute such gains. Income and capital gain distributions are determined in accordance with income tax regulations, which may differ from GAAP.
(f) Federal income taxes: It is the policy of the fund to continue to qualify as a regulated investment company, if such qualification is in the best interests of its shareholders, by complying with the applicable
22
provisions of the Code, and to make distributions of taxable income and net realized capital gain sufficient to relieve it from substantially all federal income and excise taxes.
As of and during the period ended October 31, 2023, the fund did not have any liabilities for any uncertain tax positions. The fund recognizes interest and penalties, if any, related to uncertain tax positions as income tax expense in the Statement of Operations. During the period ended October 31, 2023, the fund did not incur any interest or penalties.
Each tax year in the four-year period ended October 31, 2023 remains subject to examination by the Internal Revenue Service and state taxing authorities.
At October 31, 2023, the components of accumulated earnings on a tax basis were as follows: undistributed ordinary income $701,620, accumulated capital losses $22,498,561 and unrealized depreciation $34,827,413.
The fund is permitted to carry forward capital losses for an unlimited period. Furthermore, capital loss carryovers retain their character as either short-term or long-term capital losses.
The accumulated capital loss carryover is available for federal income tax purposes to be applied against future net realized capital gains, if any, realized subsequent to October 31, 2023. The fund has $3,294,635 of short-term capital losses and $19,203,926 of long-term capital losses which can be carried forward for an unlimited period.
The tax character of distributions paid to shareholders during the fiscal years ended October 31, 2023 and October 31, 2022 were as follows: ordinary income $14,240,790 and $7,149,563, and tax-exempt income $3,022,640 and $2,715,259, respectively.
NOTE 2—Bank Lines of Credit:
The fund participates with other long-term open-end funds managed by the Adviser in a $738 million unsecured credit facility led by Citibank, N.A. (the “Citibank Credit Facility”) and a $300 million unsecured credit facility provided by BNY Mellon (the “BNYM Credit Facility”), each to be utilized primarily for temporary or emergency purposes, including the financing of redemptions (each, a “Facility”). The Citibank Credit Facility is available in two tranches: (i) Tranche A is in an amount equal to $618 million and is available to all long-term open-ended funds, including the fund, and (ii) Tranche B is an amount equal to $120 million and is available only to BNY Mellon Floating Rate Income Fund, a series of BNY Mellon Investment Funds IV, Inc. Prior to September 27, 2023, the Citibank
23
NOTES TO FINANCIAL STATEMENTS (continued)
Credit Facility was $823.5 million with Tranche A available in an amount equal to $688.5 million and Tranche B available in an amount equal to $135 million. In connection therewith, the fund has agreed to pay its pro rata portion of commitment fees for Tranche A of the Citibank Credit Facility and the BNYM Credit Facility. Interest is charged to the fund based on rates determined pursuant to the terms of the respective Facility at the time of borrowing.
During the period ended October 31, 2023, the Fund was charged $1,026 for interest expense. These fees are included in Interest expense in the Statement of Operations. The average amount of borrowings outstanding under the Facilities during the period ended October 31, 2023 was approximately $16,986 with a related weighted average annualized interest rate of 6.04%.
NOTE 3—Management Fee and Other Transactions with Affiliates:
(a) Pursuant to a management agreement with the Adviser, there is no management fee paid to the Adviser. The fund may invest in other affiliated mutual funds advised by the Adviser and unaffiliated open-end funds, closed-end funds and exchange-traded funds. All fees and expenses of the underlying funds are reflected in the underlying fund’s net asset value.
(b) Under the Distribution Plan adopted pursuant to Rule 12b-1 under the Act, Class C shares pay the Distributor for distributing its shares at an annual rate of .75% of the value of its average daily net assets. The Distributor may pay one or more Service Agents in respect of advertising, marketing and other distribution services, and determines the amounts, if any, to be paid to Service Agents and the basis on which such payments are made. During the period ended October 31, 2023, Class C shares were charged $1,356 pursuant to the Distribution Plan.
(c) Under the Shareholder Services Plan, Class A and Class C shares pay the Distributor at an annual rate of .25% of the value of their average daily net assets for the provision of certain services. The services provided may include personal services relating to shareholder accounts, such as answering shareholder inquiries regarding the fund, and services related to the maintenance of shareholder accounts. The Distributor may make payments to Service Agents (securities dealers, financial institutions or other industry professionals) with respect to these services. The Distributor determines the amounts to be paid to Service Agents. During the period ended October 31, 2023, Class A and Class C shares were
24
charged $828 and $452, respectively, pursuant to the Shareholder Services Plan.
Under its terms, the Distribution Plan and Shareholder Services Plan shall remain in effect from year to year, provided such continuance is approved annually by a vote of a majority of those Directors who are not “interested persons” of the Company and who have no direct or indirect financial interest in the operation of or in any agreement related to the Distribution Plan or Shareholder Services Plan.
The fund has an arrangement with BNY Mellon Transfer, Inc., (the “Transfer Agent”), a subsidiary of BNY Mellon and an affiliate of the Adviser, whereby the fund may receive earnings credits when positive cash balances are maintained, which are used to offset Transfer Agent fees. For financial reporting purposes, the fund includes transfer agent net earnings credits, if any, as an expense offset in the Statement of Operations.
The fund has an arrangement with The Bank of New York Mellon (the “Custodian”), a subsidiary of BNY Mellon and an affiliate of the Adviser, whereby the fund will receive interest income or be charged overdraft fees when cash balances are maintained. For financial reporting purposes, the fund includes this interest income and overdraft fees, if any, as interest income in the Statement of Operations.
The fund compensates the Transfer Agent, under a transfer agency agreement, for providing transfer agency and cash management services for the fund. The majority of Transfer Agent fees are comprised of amounts paid on a per account basis, while cash management fees are related to fund subscriptions and redemptions. During the period ended October 31, 2023, the fund was charged $3,131 for transfer agency services. These fees are included in Shareholder servicing costs in the Statement of Operations. These fees were partially offset by earnings credits of $1,246.
The fund compensates the Custodian, under a custody agreement, for providing custodial services for the fund. These fees are determined based on net assets, geographic region and transaction activity. During the period ended October 31, 2023, the fund was charged $2,113 pursuant to the custody agreement.
During the period ended October 31, 2023, the fund was charged $15,533 for services performed by the fund’s Chief Compliance Officer and his staff. These fees are included in Chief Compliance Officer fees in the Statement of Operations.
25
NOTES TO FINANCIAL STATEMENTS (continued)
The components of “Due to BNY Mellon Investment Adviser, Inc. and affiliates” in the Statement of Assets and Liabilities consist of: Distribution Plan fees of $108, Shareholder Services Plan fees of $100, Custodian fees of $848, Chief Compliance Officer fees of $4,840 and Transfer Agent fees of $477.
(d) Each board member also serves as a board member of other funds in the BNY Mellon Family of Funds complex. Annual retainer fees and attendance fees are allocated to each fund based on net assets.
NOTE 4—Securities Transactions:
The aggregate amount of purchases and sales of investment securities, excluding short-term securities, during the period ended October 31, 2023, amounted to $81,892,592 and $105,540,921, respectively.
At October 31, 2023, the cost of investments for federal income tax purposes was $294,695,706; accordingly, accumulated net unrealized depreciation on investments was $34,827,413, consisting of gross unrealized depreciation.
26
REPORT OF INDEPENDENT REGISTERED PUBLIC ACCOUNTING FIRM
To the Shareholders of BNY Mellon Yield Enhancement Strategy Fund and Board of Directors of BNY Mellon Investment Funds II, Inc.:
Opinion on the Financial Statements
We have audited the accompanying statement of assets and liabilities of BNY Mellon Yield Enhancement Strategy Fund (the Fund), a series of BNY Mellon Investment Funds II, Inc., including the statement of investments, as of October 31, 2023, the related statement of operations for the year then ended, the statements of changes in net assets for each of the years in the two-year period then ended, and the related notes (collectively, the financial statements) and the financial highlights for each of the years in the five-year period then ended. In our opinion, the financial statements and financial highlights present fairly, in all material respects, the financial position of the Fund as of October 31, 2023, the results of its operations for the year then ended, the changes in its net assets for each of the years in the two-year period then ended, and the financial highlights for each of the years in the five-year period then ended, in conformity with U.S. generally accepted accounting principles.
Basis for Opinion
These financial statements and financial highlights are the responsibility of the Fund’s management. Our responsibility is to express an opinion on these financial statements and financial highlights based on our audits. We are a public accounting firm registered with the Public Company Accounting Oversight Board (United States) (PCAOB) and are required to be independent with respect to the Fund in accordance with the U.S. federal securities laws and the applicable rules and regulations of the Securities and Exchange Commission and the PCAOB.
We conducted our audits in accordance with the standards of the PCAOB. Those standards require that we plan and perform the audit to obtain reasonable assurance about whether the financial statements and financial highlights are free of material misstatement, whether due to error or fraud. Our audits included performing procedures to assess the risks of material misstatement of the financial statements and financial highlights, whether due to error or fraud, and performing procedures that respond to those risks. Such procedures included examining, on a test basis, evidence regarding the amounts and disclosures in the financial statements and financial highlights. Such procedures also included confirmation of securities owned as of October 31, 2023, by correspondence with transfer agent and custodian. Our audits also included evaluating the accounting principles used and significant estimates made by management, as well as evaluating the overall presentation of the financial statements and financial highlights. We believe that our audits provide a reasonable basis for our opinion.

We have served as the auditor of one or more BNY Mellon Investment Adviser, Inc. investment companies since 1994.
New York, New York
December 22, 2023
27
IMPORTANT TAX INFORMATION (Unaudited)
In accordance with federal tax law, the fund hereby reports $3,022,640 as “exempt-interest dividends paid” during its fiscal year ended October 31, 2023. Where required by federal tax law rules, shareholders will receive notification of their portion of the fund’s tax-exempt dividends paid for the 2023 calendar year on Form 1099-DIV, which will be mailed in early 2024. The fund reports the maximum amount allowable but not less than 55.73% as interest-related dividends in accordance with Sections 871(k)(1) and 881(c) of the Internal Revenue Code.
28
BOARD MEMBERS INFORMATION (Unaudited)
Independent Board Members
Joseph S. DiMartino (80)
Chairman of the Board (2013)
Principal Occupation During Past 5 Years:
· Director or Trustee of funds in the BNY Mellon Family of Funds and certain other entities (as described in the fund’s Statement of Additional Information) (1995-Present)
Other Public Company Board Memberships During Past 5 Years:
· CBIZ, Inc., a public company providing professional business services, products and solutions, Director (1997-May 2023)
No. of Portfolios for which Board Member Serves: 86
———————
Francine J. Bovich (72)
Board Member (2013)
Principal Occupation During Past 5 Years:
· The Bradley Trusts, private trust funds, Trustee (2011-Present)
Other Public Company Board Memberships During Past 5 Years:
· Annaly Capital Management, Inc., a real estate investment trust, Director (2014-Present)
No. of Portfolios for which Board Member Serves: 47
———————
Andrew J. Donohue (73)
Board Member (2019)
Principal Occupation During Past 5 Years:
· Attorney, Solo Law Practice (2019-Present)
· Shearman & Sterling LLP, a law firm, Of Counsel (2017-2019)
· Chief of Staff to the Chair of the SEC (2015-2017)
Other Public Company Board Memberships During Past 5 Years:
· Oppenheimer Funds (58 funds), Director (2017-2019)
No. of Portfolios for which Board Member Serves: 40
———————
29
BOARD MEMBERS INFORMATION (Unaudited) (continued)
Kenneth A. Himmel (77)
Board Member (2013)
Principal Occupation During Past 5 Years:
· Related Urban Development, a real estate development company, President and Chief Executive Officer (1996-Present)
· American Food Management, a restaurant company, Chief Executive Officer (1983-Present)
· Himmel & Company, a real estate development company, President and Chief Executive Officer (1980-Present)
· Gulf Related, an international real estate development company, Managing Partner (2010-December 2020)
No. of Portfolios for which Board Member Serves: 18
———————
Bradley Skapyak (64)
Board Member (2021)
Principal Occupation During Past 5 Years:
· Chief Operating Officer and Director of The Dreyfus Corporation (2009-2019)
· Chief Executive Officer and Director of the Distributor (2016-2019)
· Chairman and Director of The Dreyfus Transfer Agent, Inc. (2011-2019)
· Senior Vice President of The Bank of New York Mellon (2007-2019)
No. of Portfolios for which Board Member Serves: 18
———————
Roslyn M. Watson (74)
Board Member (2013)
Principal Occupation During Past 5 Years:
· Watson Ventures, Inc., a real estate investment company, Principal (1993-Present)
Other Public Company Board Memberships During Past 5 Years:
· American Express Bank, FSB, Director (1993-2018)
No. of Portfolios for which Board Member Serves: 40
———————
30
Benaree Pratt Wiley (77)
Board Member (2013)
Principal Occupation During Past 5 Years:
· The Wiley Group, a firm specializing in strategy and business development, Principal (2005-Present)
Other Public Company Board Memberships During Past 5 Years:
· CBIZ, Inc., a public company providing professional business services, products and solutions, Director (2008-Present)
· Blue Cross-Blue Shield of Massachusetts, Director (2004-2020)
No. of Portfolios for which Board Member Serves: 57
———————
The address of the Board Members and Officers is c/o BNY Mellon Investment Adviser, Inc., 240 Greenwich Street, New York, New York 10286. Additional information about each Board Member is available in the fund’s Statement of Additional Information which can be obtained from the Adviser free of charge by calling this toll free number: 1-800-373-9387.
31
OFFICERS OF THE FUND (Unaudited)
DAVID DIPETRILLO, President since January 2021.
Vice President and Director of the Adviser since February 2021; Head of North America Distribution, BNY Mellon Investment Management since February 2023; and Head of North America Product, BNY Mellon Investment Management from January 2018 to February 2023. He is an officer of 53 investment companies (comprised of 102 portfolios) managed by the Adviser or an affiliate of the Adviser. He is 45 years old and has been an employee of BNY Mellon since 2005.
JAMES WINDELS, Treasurer since November 2001.
Director of the Adviser since February 2023; Vice President of the Adviser since September 2020; and Director–BNY Mellon Fund Administration. He is an officer of 54 investment companies (comprised of 121 portfolios) managed by the Adviser or an affiliate of the Adviser. He is 65 years old and has been an employee of the Adviser since April 1985.
PETER M. SULLIVAN, Chief Legal Officer since July 2021 and Vice President and Assistant Secretary since March 2019.
Chief Legal Officer of the Adviser and Associate General Counsel of BNY Mellon since July 2021; Senior Managing Counsel of BNY Mellon from December 2020 to July 2021; and Managing Counsel of BNY Mellon from March 2009 to December 2020. He is an officer of 54 investment companies (comprised of 121 portfolios) managed by the Adviser or an affiliate of the Adviser. He is 55 years old and has been an employee of BNY Mellon since April 2004.
JAMES BITETTO, Vice President since August 2005 and Secretary since February 2018.
Senior Managing Counsel of BNY Mellon since December 2019; Managing Counsel of BNY Mellon from April 2014 to December 2019; and Secretary of the Adviser. He is an officer of 54 investment companies (comprised of 121 portfolios) managed by the Adviser or an affiliate of the Adviser. He is 57 years old and has been an employee of the Adviser since December 1996.
DEIRDRE CUNNANE, Vice President and Assistant Secretary since March 2019.
Managing Counsel of BNY Mellon since December 2021; and Counsel of BNY Mellon from August 2018 to December 2021. She is an officer of 54 investment companies (comprised of 121 portfolios) managed by the Adviser or an affiliate of the Adviser. She is 33 years old and has been an employee of BNY Mellon since August 2013.
SARAH S. KELLEHER, Vice President and Assistant Secretary since April 2014.
Vice President of BNY Mellon ETF Investment Adviser; LLC since February 2020; Senior Managing Counsel of BNY Mellon since September 2021; and Managing Counsel of BNY Mellon from December 2017 to September 2021. She is an officer of 54 investment companies (comprised of 121 portfolios) managed by the Adviser or an affiliate of the Adviser. She is 48 years old and has been an employee of BNY Mellon since March 2013.
JEFF PRUSNOFSKY, Vice President and Assistant Secretary since August 2005.
Senior Managing Counsel of BNY Mellon. He is an officer of 54 investment companies (comprised of 121 portfolios) managed by the Adviser or an affiliate of the Adviser. He is 58 years old and has been an employee of the Adviser since October 1990.
AMANDA QUINN, Vice President and Assistant Secretary since March 2020.
Counsel of BNY Mellon since June 2019; Regulatory Administration Manager at BNY Mellon Investment Management Services from September 2018 to May 2019. She is an officer of 54 investment companies (comprised of 121 portfolios) managed by the Adviser or an affiliate of the Adviser. She is 38 years old and has been an employee of BNY Mellon since June 2012.
JOANNE SKERRETT, Vice President and Assistant Secretary since March 2023.
Managing Counsel of BNY Mellon since June 2022; and Senior Counsel with the Mutual Fund Directors Forum, a leading funds industry organization, from 2016 to June 2022. She is an officer of 54 investment companies (comprised of 121 portfolios) managed by the Adviser or an affiliate of the Adviser. She is 51 years old and has been an employee of the Adviser since June 2022.
32
NATALYA ZELENSKY, Vice President and Assistant Secretary since March 2017.
Chief Compliance Officer since August 2021 and Vice President since February 2020 of BNY Mellon ETF Investment Adviser, LLC; Chief Compliance Officer since August 2021 and Vice President and Assistant Secretary since February 2020 of BNY Mellon ETF Trust; Managing Counsel of BNY Mellon from December 2019 to August 2021; Counsel of BNY Mellon from May 2016 to December 2019; and Assistant Secretary of the Adviser from April 2018 to August 2021. She is an officer of 54 investment companies (comprised of 121 portfolios) managed by the Adviser or an affiliate of the Adviser. She is 38 years old and has been an employee of BNY Mellon since May 2016.
DANIEL GOLDSTEIN, Vice President since March 2022.
Head of Product Development of North America Distribution, BNY Mellon Investment Management since January 2018; Executive Vice President of North America Product, BNY Mellon Investment Management since April 2023; and Senior Vice President, Development & Oversight of North America Product, BNY Mellon Investment Management from 2010 to March 2023. He is an officer of 53 investment companies (comprised of 102 portfolios) managed by the Adviser or an affiliate of the Adviser. He is 54 years old and has been an employee of the Distributor since 1991.
JOSEPH MARTELLA, Vice President since March 2022.
Vice President of the Adviser since December 2022; Head of Product Management of North America Distribution, BNY Mellon Investment Management since January 2018; Executive Vice President of North America Product, BNY Mellon Investment Management since April 2023; and Senior Vice President of North America Product, BNY Mellon Investment Management from 2010 to March 2023. He is an officer of 53 investment companies (comprised of 102 portfolios) managed by the Adviser or an affiliate of the Adviser. He is 47 years old and has been an employee of the Distributor since 1999.
GAVIN C. REILLY, Assistant Treasurer since December 2005.
Tax Manager–BNY Mellon Fund Administration. He is an officer of 54 investment companies (comprised of 121 portfolios) managed by the Adviser or an affiliate of the Adviser. He is 55 years old and has been an employee of the Adviser since April 1991.
ROBERT SALVIOLO, Assistant Treasurer since July 2007.
Senior Accounting Manager–BNY Mellon Fund Administration. He is an officer of 54 investment companies (comprised of 121 portfolios) managed by the Adviser or an affiliate of the Adviser. He is 56 years old and has been an employee of the Adviser since June 1989.
ROBERT SVAGNA, Assistant Treasurer since July 2007.
Senior Accounting Manager–BNY Mellon Fund Administration. He is an officer of 54 investment companies (comprised of 121 portfolios) managed by the Adviser or an affiliate of the Adviser. He is 56 years old and has been an employee of the Adviser since November 1990.
JOSEPH W. CONNOLLY, Chief Compliance Officer since October 2004.
Chief Compliance Officer of the BNY Mellon Family of Funds and BNY Mellon Funds Trust since 2004; and Chief Compliance Officer of the Adviser from 2004 until June 2021. He is the Chief Compliance Officer of 53 investment companies (comprised of 105 portfolios) managed by the Adviser. He is 66 years old.
CARIDAD M. CAROSELLA, Anti-Money Laundering Compliance Officer since January 2016.
Anti-Money Laundering Compliance Officer of the BNY Mellon Family of Funds and BNY Mellon Funds Trust. She is an officer of 47 investment companies (comprised of 114 portfolios) managed by the Adviser or an affiliate of the Adviser. She is 55 years old and has been an employee of the Distributor since 1997.
33
BNY Mellon Yield Enhancement Strategy Fund
240 Greenwich Street
New York, NY 10286
Adviser
BNY Mellon Investment Adviser, Inc.
240 Greenwich Street
New York, NY 10286
Custodian
The Bank of New York Mellon
240 Greenwich Street
New York, NY 10286
Transfer Agent &
Dividend Disbursing Agent
BNY Mellon Transfer, Inc.
240 Greenwich Street
New York, NY 10286
Distributor
BNY Mellon Securities Corporation
240 Greenwich Street
New York, NY 10286
| | |
Ticker Symbols: | Class A: DABMX Class C: DABLX Class I: DABKX Class Y: DABJX |
Telephone Call your financial representative or 1-800-373-9387
Mail The BNY Mellon Family of Funds, 144 Glenn Curtiss Boulevard, Uniondale, NY 11556-0144
E-mail Send your request to info@bnymellon.com
Internet Information can be viewed online or downloaded at www.im.bnymellon.com
The fund files its complete schedule of portfolio holdings with the Securities and Exchange Commission (“SEC”) for the first and third quarters of each fiscal year on Form N-PORT. The fund’s Forms N-PORT are available on the SEC’s website at www.sec.gov.
A description of the policies and procedures that the fund uses to determine how to vote proxies relating to portfolio securities and information regarding how the fund voted these proxies for the most recent 12-month period ended June 30 is available at www.im.bnymellon.com and on the SEC’s website at www.sec.gov and without charge, upon request, by calling 1-800-373-9387.
| | |
© 2023 BNY Mellon Securities Corporation
6327AR1023 | 
|
Item 2. Code of Ethics.
The Registrant has adopted a code of ethics that applies to the Registrant's principal executive officer, principal financial officer, principal accounting officer or controller, or persons performing similar functions. There have been no amendments to, or waivers in connection with, the Code of Ethics during the period covered by this Report.
Item 3. Audit Committee Financial Expert.
The Registrant's Board has determined that Bradley J. Skapyak, a member of the Audit Committee of the Board, is an audit committee financial expert as defined by the Securities and Exchange Commission (the "SEC"). Mr. Skapyak is "independent" as defined by the SEC for purposes of audit committee financial expert determinations.
Item 4. Principal Accountant Fees and Services.
(a) Audit Fees. The aggregate fees billed for each of the last two fiscal years (the "Reporting Periods") for professional services rendered by the Registrant's principal accountant (the "Auditor") for the audit of the Registrant's annual financial statements or services that are normally provided by the Auditor in connection with the statutory and regulatory filings or engagements for the Reporting Periods, were $95,720 in 2022 and $68,800 in 2023.
(b) Audit-Related Fees. The aggregate fees billed in the Reporting Periods for assurance and related services by the Auditor that are reasonably related to the performance of the audit of the Registrant's financial statements and are not reported under paragraph (a) of this Item 4 were $16,500 in 2022 and $11,400 in 2023. These services consisted of one or more of the following: (i) agreed upon procedures related to compliance with Internal Revenue Code section 817(h), (ii) security counts required by Rule 17f-2 under the Investment Company Act of 1940, as amended, (iii) advisory services as to the accounting or disclosure treatment of Registrant transactions or events and (iv) advisory services to the accounting or disclosure treatment of the actual or potential impact to the Registrant of final or proposed rules, standards or interpretations by the Securities and Exchange Commission, the Financial Accounting Standards Boards or other regulatory or standard-setting bodies.
The aggregate fees billed in the Reporting Periods for non-audit assurance and related services by the Auditor to the Registrant's investment adviser (not including any sub-investment adviser whose role is primarily portfolio management and is subcontracted with or overseen by another investment adviser), and any entity controlling, controlled by or under common control with the investment adviser that provides ongoing services to the Registrant ("Service Affiliates"), that were reasonably related to the performance of the annual audit of the Service Affiliate, which required pre-approval by the Audit Committee were $0 in 2022 and $0 in 2023.
(c) Tax Fees. The aggregate fees billed in the Reporting Periods for professional services rendered by the Auditor for tax compliance, tax advice, and tax planning ("Tax Services") were $0 in 2022 and $0 in 2023. These services consisted of: (i) review or preparation of U.S. federal, state, local and excise tax returns; (ii) U.S. federal, state and local tax planning, advice and assistance regarding statutory, regulatory or administrative developments; (iii) tax advice regarding tax qualification matters and/or treatment of various financial instruments held or proposed to be acquired or held, and (iv) determination of Passive Foreign Investment Companies. The aggregate fees billed in the Reporting Periods for Tax Services by the Auditor to Service Affiliates, which required pre-approval by the Audit Committee were $0 in 2022 and $0 in 2023.
(d) All Other Fees. The aggregate fees billed in the Reporting Periods for products and services provided by the Auditor, other than the services reported in paragraphs (a) through (c) of this Item, were $0 in 2022 and $0 in 2023.
The aggregate fees billed in the Reporting Periods for Non-Audit Services by the Auditor to Service Affiliates, other than the services reported in paragraphs (b) through (c) of this Item, which required pre-approval by the Audit Committee, were $0 in 2022 and $0 in 2023.
(e)(1) Audit Committee Pre-Approval Policies and Procedures. The Registrant's Audit Committee has established policies and procedures (the "Policy") for pre-approval (within specified fee limits) of the Auditor's engagements for non-audit services to the Registrant and Service Affiliates without specific case-by-case consideration. The pre-approved services in the Policy can include pre-approved audit services, pre-approved audit-related services, pre-approved tax services and pre-approved all other services. Pre-approval considerations include whether the proposed services are compatible with maintaining the Auditor's independence. Pre-approvals pursuant to the Policy are considered annually.
(e)(2) Note. None of the services described in paragraphs (b) through (d) of this Item 4 were approved by the Audit Committee pursuant to paragraph (c)(7)(i)(C) of Rule 2-01 of Regulation S-X.
(f) None of the hours expended on the principal accountant's engagement to audit the registrant's financial statements for the most recent fiscal year were attributed to work performed by persons other than the principal accountant's full-time, permanent employees.
Non-Audit Fees. The aggregate non-audit fees billed by the Auditor for services rendered to the Registrant, and rendered to Service Affiliates, for the Reporting Periods were $3,945,912 in 2022 and $4,074,591 in 2023.
Auditor Independence. The Registrant's Audit Committee has considered whether the provision of non-audit services that were rendered to Service Affiliates, which were not pre-approved (not requiring pre-approval), is compatible with maintaining the Auditor's independence.
(j) Not applicable.
Item 5. Audit Committee of Listed Registrants.
Not applicable.
Item 6. Investments.
(a) Not applicable.
| Item 7. | Disclosure of Proxy Voting Policies and Procedures for Closed-End Management Investment Companies. |
Not applicable.
Item 8. Portfolio Managers of Closed-End Management Investment Companies.
Not applicable.
| Item 9. | Purchases of Equity Securities by Closed-End Management Investment Companies and Affiliated Purchasers. |
Not applicable.
| Item 10. | Submission of Matters to a Vote of Security Holders. |
There have been no material changes to the procedures applicable to Item 10.
| Item 11. | Controls and Procedures. |
(a) The Registrant's principal executive and principal financial officers have concluded, based on their evaluation of the Registrant's disclosure controls and procedures as of a date within 90 days of the filing date of this report, that the Registrant's disclosure controls and procedures are reasonably designed to ensure that information required to be disclosed by the Registrant on Form N-CSR is recorded, processed, summarized and reported within the required time periods and that information required to be disclosed by the Registrant in the reports that it files or submits on Form N-CSR is accumulated and communicated to the Registrant's management, including its principal executive and principal financial officers, as appropriate to allow timely decisions regarding required disclosure.
(b) There were no changes to the Registrant's internal control over financial reporting that occurred during the period covered by this report that have materially affected, or are reasonably likely to materially affect, the Registrant's internal control over financial reporting.
| Item 12. | Disclosure of Securities Lending Activities for Closed-End Management Investment Companies. |
Not applicable.
(a)(1) Code of ethics referred to in Item 2.
(a)(2) Certifications of principal executive and principal financial officers as required by Rule 30a-2(a) under the Investment Company Act of 1940.
(a)(3) Not applicable.
(b) Certification of principal executive and principal financial officers as required by Rule 30a-2(b) under the Investment Company Act of 1940.
SIGNATURES
Pursuant to the requirements of the Securities Exchange Act of 1934 and the Investment Company Act of 1940, the Registrant has duly caused this Report to be signed on its behalf by the undersigned, thereunto duly authorized.
BNY Mellon Investment Funds II, Inc.
By: /s/ David J. DiPetrillo
David J. DiPetrillo
President (Principal Executive Officer)
Date: December 19, 2023
Pursuant to the requirements of the Securities Exchange Act of 1934 and the Investment Company Act of 1940, this Report has been signed below by the following persons on behalf of the Registrant and in the capacities and on the dates indicated.
By: /s/ David J. DiPetrillo
David J. DiPetrillo
President (Principal Executive Officer)
Date: December 19, 2023
By: /s/ James Windels
James Windels
Treasurer (Principal Financial Officer)
Date: December 19, 2023
EXHIBIT INDEX
(a)(1) Code of ethics referred to in Item 2.
(a)(2) Certifications of principal executive and principal financial officers as required by Rule 30a-2(a) under the Investment Company Act of 1940. (EX-99.CERT)
(b) Certification of principal executive and principal financial officers as required by Rule 30a-2(b) under the Investment Company Act of 1940. (EX-99.906CERT)