UNITED STATES
SECURITIES AND EXCHANGE COMMISSION
Washington, D.C. 20549
FORM N-CSR
CERTIFIED SHAREHOLDER REPORT OF REGISTERED MANAGEMENT
INVESTMENT COMPANIES
Investment Company Act file number | 811-22912 |
| |
| BNY Mellon Investment Funds II, Inc. | |
| (Exact name of Registrant as specified in charter) | |
| | |
| c/o BNY Mellon Investment Adviser, Inc. 240 Greenwich Street New York, New York 10286 | |
| (Address of principal executive offices) (Zip code) | |
| | |
| Bennett A. MacDougall, Esq. 240 Greenwich Street New York, New York 10286 | |
| (Name and address of agent for service) | |
|
Registrant's telephone number, including area code: | (212) 922-6400 |
| |
Date of fiscal year end: | 10/31 | |
Date of reporting period: | 10/31/2020 | |
| | | | | | | |
The following N-CSR relates only to the Registrant's series listed below and does not relate to any series of the Registrant with a different fiscal year end and, therefore, different N-CSR reporting requirements. A separate N-CSR will be filed for any series with a different fiscal year end, as appropriate.
BNY Mellon Alternative Diversifier Strategies Fund
BNY Mellon Global Emerging Markets Fund
BNY Mellon Yield Enhancement Strategy Fund
FORM N-CSR
Item 1. Reports to Stockholders.
BNY Mellon Alternative Diversifier Strategies Fund
| |
ANNUAL REPORT October 31, 2020 |
| |
Save time. Save paper. View your next shareholder report online as soon as it’s available. Log into www.bnymellonim.com/us and sign up for eCommunications. It’s simple and only takes a few minutes. |
| |
The views expressed in this report reflect those of the portfolio manager(s) only through the end of the period covered and do not necessarily represent the views of BNY Mellon Investment Adviser, Inc. or any other person in the BNY Mellon Investment Adviser, Inc. organization. Any such views are subject to change at any time based upon market or other conditions and BNY Mellon Investment Adviser, Inc. disclaims any responsibility to update such views. These views may not be relied on as investment advice and, because investment decisions for a fund in the BNY Mellon Family of Funds are based on numerous factors, may not be relied on as an indication of trading intent on behalf of any fund in the BNY Mellon Family of Funds. |
| |
Not FDIC-Insured • Not Bank-Guaranteed • May Lose Value |
Contents
THE FUND
FOR MORE INFORMATION
Back Cover
| | | | |
| |
BNY Mellon Alternative Diversifier Strategies Fund
| | The Fund |
A LETTER FROM THE PRESIDENT OF BNY MELLON INVESTMENT ADVISER, INC.
Dear Shareholder:
We are pleased to present this annual report for BNY Mellon Alternative Diversifier Strategies Fund, covering the 12-month period from November 1, 2019 through October 31, 2020. For information about how the fund performed during the reporting period, as well as general market perspectives, we provide a Discussion of Fund Performance on the pages that follow.
Accommodative rate policies from the U.S. Federal Reserve (the “Fed”) and progress towards a U.S./China trade deal stoked optimism about future economic growth prospects the final months of 2019, fueling an equity rally. As we entered 2020, optimism turned to concern as COVID-19 began to spread across portions of Asia and Europe. When the virus reached the U.S. in March 2020, stocks became volatile. U.S. equities posted historic losses during the month due to investor concern over the economic impact of a widespread quarantine. Global central banks and governments launched emergency stimulus measures to support their respective economies, and equity valuations began to rebound, trending upward until the fall. Volatility returned in September 2020 and continued through October, as concerns over rising COVID-19 infection rates, continued trade tensions, the U.S. Congress’ failure to pass additional financial assistance and anxiety over the upcoming U.S. election constrained equity valuations.
In fixed-income markets, interest rates were heavily influenced by changes in Fed policy and investor concern over COVID-19. In 2019, as stocks rallied in response to Fed rate cuts, risk-asset valuations also rose while Treasuries lagged. When COVID-19 began to emerge, a flight to quality ensued, and Treasury rates fell significantly. The Fed cut rates twice in March 2020, resulting in an overnight lending target rate of nearly zero, and the government launched a large stimulus package. Risk-asset prices began to rebound, and bond indices generally rose until September 2020, when investment-grade instrument prices stalled. Yields in the intermediate and long portions of the Treasury curve rose during October, further constraining bond prices.
We believe the near-term outlook for the U.S. will be challenging, as the country continues to battle COVID-19. As always, we will monitor relevant data for meaningful developments. We encourage you to discuss the risks and opportunities in today’s investment environment with your financial advisor.
Thank you for your continued confidence and support.
Sincerely,

Renee LaRoche-Morris
President
BNY Mellon Investment Adviser, Inc.
November 16, 2020
2
DISCUSSION OF FUND PERFORMANCE (Unaudited)
For the period from November 1, 2019 through October 31, 2020, as provided by Jeffrey M. Mortimer, CFA, and Caroline Lee-Tsao, Portfolio Managers
Market and Fund Performance Overview
For the 12-month period ended October 31, 2020, BNY Mellon Alternative Diversifier Strategies Fund’s Class A shares produced a total return of -2.75%, Class C shares returned -3.51%, Class I shares returned -2.47%, and Class Y shares returned -2.29%.1 In comparison, the S&P 500® Index (the “Index”) returned 9.71% for the same period, and the Lipper Alternative Multi-Strategy Funds Index (the “Lipper Index”) produced a total return of -2.00% for the period.2
Although stocks in the U.S. produced positive returns over the reporting period, other markets failed to fully recover from losses resulting from the COVID-19 virus and the efforts to stop its spread. The fund lagged the Index and the Lipper Index. Underperformance was due primarily to returns in the Boston Partners Long/Short Research Fund and the Gateway Fund.
The Fund’s Investment Approach
The fund seeks long-term capital appreciation. To pursue its goal, the fund normally allocates its assets across non-traditional or “alternative” asset classes and investment strategies. The fund is designed to complement and diversify traditional stock and bond portfolios. The fund normally allocates its assets among other investment companies (the underlying funds) that employ alternative investment strategies. The fund seeks to achieve its investment objective by allocating its assets among asset classes and investment strategies that typically have had a low correlation to each other and to traditional equity and fixed-income asset classes. The fund currently intends to allocate its assets among underlying funds that employ the following alternative investment strategies: long/short strategies, absolute return hedge strategies, real estate-related strategies, commodities strategies, global macro strategies and managed futures strategies.
As of October 31, 2020, the fund held positions in 11 underlying funds: AQR Managed Futures Strategy Fund, ASG Global Alternatives Fund, ASG Managed Futures Strategy Fund, DFA Commodity Strategy Portfolio, BNY Mellon Dynamic Total Return Fund, Boston Partners Long/Short Research Fund, BNY Mellon Global Real Estate Securities Fund, BNY Mellon Global Real Return Fund, the Gateway Fund, 361 Global Long/Short Equity Fund and Neuberger Berman Long/Short Fund.
Markets Begin to Recover, Led by Growth Stocks
The reporting period began with the market continuing to benefit from a shift in Federal Reserve (the “Fed”) policy, which had been prompted by concerns about economic growth and corporate earnings. Late in 2019, the Fed implemented three rate cuts, as trade tensions and other geopolitical concerns appeared to be weighing on economic growth. Other major central banks also enacted supportive policies. Stocks also benefited from the announcement of a “Phase One” trade deal between the U.S. and China, and from the approval of the new U.S.-Mexico-Canada Trade Agreement.
Early in 2020, developed markets experienced a correction, amid growing concerns about the COVID-19 virus. As a result, the Fed reduced the federal funds rate twice in March, bringing the target rate down to 0-0.25%. In addition, the Fed and other central banks initiated various programs to ease liquidity concerns in certain markets, and government authorities introduced
3
DISCUSSION OF FUND PERFORMANCE (Unaudited) (continued)
programs to keep small businesses afloat. Steps were also taken to provide relief to employees who had lost their jobs as a result of government-mandated business shutdowns.
In the second half of the reporting period, the economy began to show signs of recovery. Retail sales rebounded, and the outlook for manufacturing also improved. Job creation surged, beating economists’ expectations, and markets began to rebound as relief programs took effect, government shutdowns began to ease and hope for a COVID-19 vaccine or effective therapy took hold.
Late in the reporting period, markets benefited from the growing prospect that one or more vaccines would be available within a few months. Uncertainty surrounding the November 2020 election also eased, and investors began to factor the likelihood of additional stimulus and infrastructure spending into their calculations. With the belief that the end of the pandemic was in view and continued economic rebound was likely, investors began to shift away from growth-oriented stocks and into value-oriented stocks.
Underlying Strategies Produced Mixed Results
The fund’s performance compared to the Lipper Index was driven by relatively weak results from some of its underlying funds. The Boston Partners Long/Short Research Fund contributed negatively, as that underlying fund lagged its benchmark by more than 1,370 basis points, and its benchmark was also down somewhat. In addition, the ASG Global Alternatives Fund underperformed, lagging its benchmark by more than 850 basis points. The Gateway Fund detracted from returns as well, as it trailed its benchmark by more than 800 basis points.
On a more positive note, the fund’s performance was assisted by the Neuberger Berman Long/Short Fund, which outperformed its benchmark by 1,312 basis points. The BNY Mellon Global Real Estate Securities Fund was also a leading contributor to outperformance. Although returns to the global real estate market were down dramatically, this underlying fund beat its benchmark by more than 540 basis points. An overweight position in managed futures also contributed positively to returns, as the AQR Managed Futures Strategy Fund and the ASG Managed Futures Strategy Fund beat the benchmark by more than 190 basis points and more than 520 basis points, respectively. Allocations to the underlying funds also contributed positively to returns. The fund made no changes to its allocations among the underlying funds during the reporting period.
Positioned for a V-Shaped Recovery
We have positioned the fund for a mid-cycle bull market of modest equity returns, a pickup in volatility and lower-for-longer yields, given the accommodative policies of global central banks. But we constantly monitor markets for new information that may influence how we position investor portfolios moving forward. This may include developments around another wave of COVID-19, the pace of economic recovery and, of course, the U.S. November 2020 elections.
We believe that the global V-shaped recovery is intact, but we are watching areas of weakness. Labor, manufacturing and consumer data continue to exhibit a V-shaped rebound but at a slower rate. The global economy is expected to recover to pre-crisis levels in the second half of 2021. Meanwhile, equities remain resilient. Despite an expected period of choppiness, equities should push higher, as they digest bad news and see through to the likely continuation of the V-shaped recovery.
Accommodative policy, low rates, positive vaccine developments and an ongoing economic recovery should support equities over the next 12-18 months. The risks to this outlook include
4
another wave of COVID-19 that results in larger-than-expected lockdowns, a delay in an approved vaccine as well as geopolitical risks. Massive amounts of fiscal and monetary stimulus, which could result in inflationary pressures that arrive sooner than the market anticipates, also present a risk.
November 16, 2020
1 Total return includes reinvestment of dividends and any capital gains paid and does not take into consideration the maximum initial sales charge in the case of Class A shares, or the applicable contingent deferred sales charge imposed on redemptions in the case of Class C shares. Had these charges been reflected, returns would have been lower. Share price, yield and investment return fluctuate such that upon redemption, fund shares may be worth more or less than their original cost. Return figures provided reflect the absorption of certain fund expenses pursuant to an agreement by BNY Mellon Investment Adviser, Inc. in effect until February 28, 2021, at which time it may be extended, terminated, or modified. Had these expenses not been absorbed, the fund’s returns would have been lower. Past performance is no guarantee of future results.
² Source: Lipper Inc. — The S&P 500® Index is widely regarded as the best single gauge of large-cap U.S. equities. The index includes 500 leading companies and captures approximately 80% coverage of available market capitalization. The Lipper Alternative Multi-Strategy Funds Index consists of funds that, by prospectus language, seek total returns through the management of several different hedge-like strategies. These funds are typically quantitatively driven to measure the existing relationship between instruments and in some cases to identify positions in which the risk-adjusted spread between these instruments represents an opportunity for the investment manager. Investors cannot invest directly in any index.
Equities are subject generally to market, market sector, market liquidity, issuer and investment style risks, among other factors, to varying degrees, all of which are more fully described in the fund’s prospectus. Bonds are subject generally to interest-rate, credit, liquidity, call, sector and market risks, to varying degrees, all of which are more fully described in the fund’s prospectus.
Investing internationally involves special risks, including changes in currency exchange rates, political, economic, and social instability, a lack of comprehensive company information, differing auditing and legal standards and less market liquidity. These risks generally are greater with emerging-market countries than with more economically and politically established foreign countries.
Short sales involve selling a security the fund does not own in anticipation that the security’s price will decline. Short sales may involve substantial risk and leverage, and expose the fund to the risk that it will be required to buy the security, sold short, at a time when the security has appreciated in value, thus resulting in a loss to the fund. Short positions in stocks involve more risk than long positions in stocks because the maximum sustainable loss on a stock purchased is limited to the amount paid for the stock plus the transaction costs, whereas there is no maximum attainable price on the shorted stock. In theory, stocks sold short have unlimited risk. It is possible that the market value of securities the fund holds in long positions will decline at the same time that the market value of the securities the fund has sold short increases, thereby increasing the fund’s potential volatility. Leveraging occurs when the fund increases its assets available for investment using borrowing or similar transactions. Short sales effectively leverage the fund’s assets. The use of leverage may magnify the fund’s gains or losses.
Exposure to the commodities markets may subject the fund to greater volatility than investments in traditional securities. The values of commodities and commodity-linked investments are affected by events that might have less impact on the values of stocks and bonds. Investments linked to the prices of commodities are considered speculative. Prices of commodities and related contracts may fluctuate significantly over short periods due to a variety of factors.
The underlying funds’ underlying strategies may use derivative instruments. A small investment in derivatives could have a potentially large impact on the fund’s performance. The use of derivatives involves risks different from, or possibly greater than, the risks associated with investing directly in the underlying assets.
The ability of the fund to achieve its investment goal depends, in part, on the ability of BNY Mellon Investment Adviser, Inc. to allocate effectively the fund’s assets among the investment strategies and the underlying funds.
Recent market risks include pandemic risks related to COVID-19. The effects of COVID-19 have contributed to increased volatility in global markets and will likely affect certain countries, companies, industries and market sectors more dramatically than others. To the extent the fund may overweight its investments in certain countries, companies, industries or market sectors, such positions will increase the fund’s exposure to risk of loss from adverse developments affecting those countries, companies, industries or sectors.
5
FUND PERFORMANCE (Unaudited)
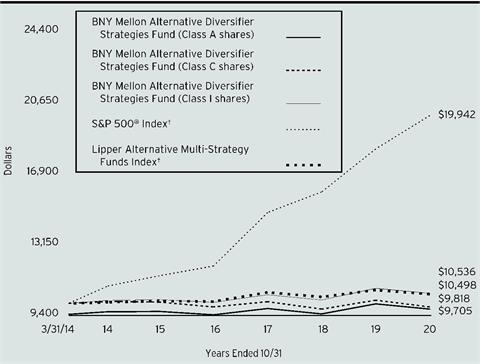
Comparison of change in value of a $10,000 investment in Class A shares, Class C shares and Class I shares of BNY Mellon Alternative Diversifier Strategies Fund with a hypothetical investment of $10,000 in the S&P 500® Index and Lipper Alternative Multi-Strategy Funds Index
† Source: Lipper Inc.
Past performance is not predictive of future performance.
The above graph compares a hypothetical $10,000 investment made in each of the Class A shares, Class C shares and Class I shares of BNY Mellon Alternative Diversifier Strategies Fund on 3/31/14 (inception date) to a hypothetical investment of $10,000 made in the S&P 500® Index and Lipper Alternative Multi-Strategy Funds Index on that date. All dividends and capital gain distributions are reinvested.
The fund’s performance shown in the line graph above takes into account the maximum initial sales charge on Class A shares and all other applicable fees and expenses on Class A shares, Class C shares and Class I shares. The S&P 500® Index is widely regarded as the best single gauge of large-cap U.S. equities. The Index includes 500 leading companies and captures approximately 80% coverage of available market capitalization. The Lipper Alternative Multi-Strategy Funds Index consists of funds that, by prospectus language, seek total returns through the management of several different hedge-like strategies. These funds are typically quantitatively driven to measure the existing relationship between instruments and in some cases to identify positions in which the risk-adjusted spread between these instruments represents an opportunity for the investment manager. Unlike a mutual fund, the indices are not subject to charges, fees and other expenses. Investors cannot invest directly in any index. These factors can contribute to the indices potentially outperforming the fund. Further information relating to fund performance, including expense reimbursements, if applicable, is contained in the Financial Highlights section of the prospectus and elsewhere in this report.
6
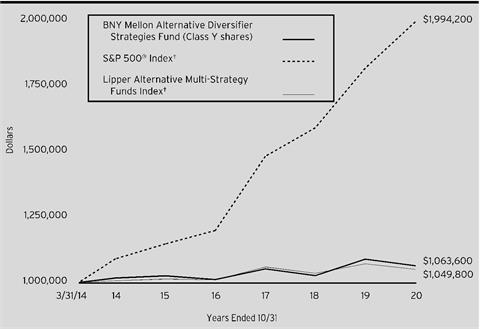
Comparison of change in value of a $1,000,000 investment in Class Y shares of BNY Mellon Alternative Diversifier Strategies Fund with a hypothetical investment of $1,000,000 in the S&P 500® Index and Lipper Alternative Multi-Strategy Funds Index
† Source: Lipper Inc.
Past performance is not predictive of future performance.
The above graph compares a hypothetical $1,000,000 investment made in Class Y shares of BNY Mellon Alternative Diversifier Strategies Fund on 3/31/14 (inception date) to a hypothetical investment of $1,000,000 made in the S&P 500® Index and Lipper Alternative Multi-Strategy Funds Index on that date. All dividends and capital gain distributions are reinvested.
The fund’s performance shown in the line graph above takes into account all applicable fees and expenses of the fund’s Class Y shares. The S&P 500® Index is widely regarded as the best single gauge of large-cap U.S. equities. The Index includes 500 leading companies and captures approximately 80% coverage of available market capitalization. The Lipper Alternative Multi-Strategy Funds Index consists of funds that, by prospectus language, seek total returns through the management of several different hedge-like strategies. These funds are typically quantitatively driven to measure the existing relationship between instruments and in some cases to identify positions in which the risk-adjusted spread between these instruments represents an opportunity for the investment manager. Unlike a mutual fund, the indices are not subject to charges, fees and other expenses. Investors cannot invest directly in any index. These factors can contribute to the indices potentially outperforming the fund. Further information relating to fund performance, including expense reimbursements, if applicable, is contained in the Financial Highlights section of the prospectus and elsewhere in this report.
7
FUND PERFORMANCE (Unaudited) (continued)
| | | | | |
Average Annual Total Returns as of 10/31/2020 |
| | Inception | | | From |
| Date | 1 Year | 5 Years | Inception |
Class A shares | | | | |
with maximum sales charge (5.75%) | 3/31/14 | -8.32% | -0.93% | -0.45% |
without sales charge | 3/31/14 | -2.75% | 0.25% | 0.44% |
Class C shares | | | | |
with applicable redemption charge† | 3/31/14 | -4.47% | -0.52% | -0.28% |
without redemption | 3/31/14 | -3.51% | -0.52% | -0.28% |
Class I shares | 3/31/14 | -2.47% | 0.64% | 0.80% |
Class Y shares | 3/31/14 | -2.29% | 0.74% | 0.94% |
S&P 500® Index | 3/31/14 | 9.71% | 11.70% | 11.05%†† |
Lipper Alternative
Multi-Strategy Funds Index | 3/31/14 | -2.00% | 0.72% | 0.74%†† |
† The maximum contingent deferred sales charge for Class C shares is 1% for shares redeemed within one year of the date of purchase.
†† Index date is based on the inception date of the fund.
The performance data quoted represents past performance, which is no guarantee of future results. Share price and investment return fluctuate and an investor’s shares may be worth more or less than original cost upon redemption. Current performance may be lower or higher than the performance quoted. Go to www.bnymellonim.com/us for the fund’s most recent month-end returns.
The fund’s performance shown in the graphs and table does not reflect the deduction of taxes that a shareholder would pay on fund distributions or the redemption of fund shares. In addition to the performance of Class A shares shown with and without a maximum sales charge, the fund’s performance shown in the table takes into account all other applicable fees and expenses on all classes.
8
UNDERSTANDING YOUR FUND’S EXPENSES (Unaudited)
As a mutual fund investor, you pay ongoing expenses, such as management fees and other expenses. Using the information below, you can estimate how these expenses affect your investment and compare them with the expenses of other funds. You also may pay one-time transaction expenses, including sales charges (loads) and redemption fees, which are not shown in this section and would have resulted in higher total expenses. For more information, see your fund’s prospectus or talk to your financial adviser.
Review your fund’s expenses
The table below shows the expenses you would have paid on a $1,000 investment in BNY Mellon Alternative Diversifier Strategies Fund from May 1, 2020 to October 31, 2020. It also shows how much a $1,000 investment would be worth at the close of the period, assuming actual returns and expenses.
| | | | | | | |
Expenses and Value of a $1,000 Investment | |
Assume actual returns for the six months ended October 31, 2020 | |
| | | | | | |
| | Class A | Class C | Class I | Class Y | |
Expense paid per $1,000† | $4.11 | $7.94 | $2.21 | $1.64 | |
Ending value (after expenses) | $1,041.70 | $1,038.00 | $1,043.50 | $1,044.20 | |
COMPARING YOUR FUND’S EXPENSES
WITH THOSE OF OTHER FUNDS (Unaudited)
Using the SEC’s method to compare expenses
The Securities and Exchange Commission (“SEC”) has established guidelines to help investors assess fund expenses. Per these guidelines, the table below shows your fund’s expenses based on a $1,000 investment, assuming a hypothetical 5% annualized return. You can use this information to compare the ongoing expenses (but not transaction expenses or total cost) of investing in the fund with those of other funds. All mutual fund shareholder reports will provide this information to help you make this comparison. Please note that you cannot use this information to estimate your actual ending account balance and expenses paid during the period.
| | | | | | | |
Expenses and Value of a $1,000 Investment | |
Assuming a hypothetical 5% annualized return for the six months ended October 31, 2020 | |
| | | | | | |
| | Class A | Class C | Class I | Class Y | |
Expense paid per $1,000† | $4.06 | $7.86 | $2.19 | $1.63 | |
Ending value (after expenses) | $1,021.11 | $1,017.34 | $1,022.97 | $1,023.53 | |
† Expenses are equal to the fund’s annualized expense ratio of .80% for Class A, 1.55% for Class C, .43% for Class I and .32% for Class Y, multiplied by the average account value over the period, multiplied by 184/366 (to reflect the one-half year period). |
9
STATEMENT OF INVESTMENTS
October 31, 2020
| | | | | | | | |
| |
Description | | | | Shares | | Value ($) | |
Investment Companies - 98.9% | | | | | |
Alternative Investments - 33.0% | | | | | |
AlphaSimplex Global Alternatives Fund, Cl. Y | | | | 3,161,384 | a | 33,479,053 | |
AlphaSimplex Managed Futures Strategy Fund, Cl. Y | | | | 1,360,503 | | 13,387,346 | |
AQR Managed Futures Strategy Fund, Cl. I | | | | 2,090,971 | | 17,334,150 | |
DFA Commodity Strategy Portfolio | | | | 1,611,223 | | 8,056,117 | |
Gateway Fund, CI. Y | | | | 906,854 | | 30,996,264 | |
| | | | | 103,252,930 | |
Domestic Equity - 29.7% | | | | | |
Boston Partners Long/Short Research Fund, Institutional Class | | | | 3,600,014 | a | 46,656,185 | |
Neuberger Berman Long Short Fund, Institutional Class | | | | 2,902,608 | b | 46,441,732 | |
| | | | | 93,097,917 | |
Foreign Balanced - 10.8% | | | | | |
BNY Mellon Global Real Return Fund, CI. Y | | | | 2,171,283 | c | 33,958,862 | |
Foreign Equity - 19.9% | | | | | |
361 Global Long/Short Equity Fund, CI. Y | | | | 2,737,497 | | 31,043,214 | |
BNY Mellon Global Real Estate Securities Fund, CI. Y | | | | 4,165,178 | c | 31,280,488 | |
| | | | | 62,323,702 | |
Foreign Fixed Income - 5.5% | | | | | |
BNY Mellon Dynamic Total Return Fund, CI. Y | | | | 1,059,100 | c | 17,189,193 | |
Total Investments (cost $316,285,922) | | 98.9% | | 309,822,604 | |
Cash and Receivables (Net) | | 1.1% | | 3,542,591 | |
Net Assets | | 100.0% | | 313,365,195 | |
aInvestment in non-controlled affiliates (cost $91,219,218).
bNon-income producing security.
cInvestment in affiliated issuer. The investment objective of this investment company is publicly available and can be found within the investment company’s prospectus.
| | |
Portfolio Summary (Unaudited) † | Value (%) |
Investment Companies | 98.9 |
| | 98.9 |
† Based on net assets.
See notes to financial statements.
10
STATEMENT OF INVESTMENTS IN AFFILIATED ISSUERS
| | | | | |
Investment Companies | Value
10/31/19 ($) | Purchases ($)† | Sales ($) | Net Realized Gains (Loss) ($) |
BNY Mellon Dynamic Total Return Fund, Cl.Y | 26,833,685 | 851,839 | (9,811,330) | 981,827 |
BNY Mellon Global Real Estate Securities Fund, Cl.Y | 45,426,922 | 6,186,288 | (8,799,784) | (418,384) |
BNY Mellon Global Real Return Fund, Cl.Y | 43,997,135 | 1,047,958 | (11,474,024) | 486,256 |
Total | 116,257,742 | 8,086,085 | (30,085,138) | 1,049,699 |
| | | | | |
Investment Companies | Net Change in Unrealized Appreciation (Depreciation) ($) | Value
10/31/20 ($) | Net
Assets (%) | Dividends/
Distributions ($) |
BNY Mellon Dynamic Total Return Fund, Cl.Y | (1,666,828) | 17,189,193 | 5.5 | 851,838 |
BNY Mellon Global Real Estate Securities Fund, Cl.Y | (11,114,554) | 31,280,488 | 10.0 | 4,558,199 |
BNY Mellon Global Real Return Fund, Cl.Y | (98,463) | 33,958,862 | 10.8 | 1,047,958 |
Total | (12,879,845) | 82,428,543 | 26.3 | 6,457,995 |
† Includes reinvested dividend/distributions.
See notes to financial statements.
In addition, an affiliated company is a company in which the fund has ownership of at least 5% of the voting securities at October 31, 2020. Investments in affiliated companies during the period ended October 31, 2020 were as follows:
| | | | | |
Investment
Companies | Value at ownership
date($)† | Purchases($) | Sales($) | Net Realized
Gain (Loss)($) |
AlphaSimplex Global Alternatives Fund, Cl. Y | 45,012,524 | 748,845 | (9,178,651) | (546,524) |
Boston Partners Long/Short Research Institutional Class | 49,407,638 | - | (2,631,644) | (590,083) |
Total | 94,420,162 | 748,845 | (11,810,295) | (1,136,607) |
11
STATEMENT OF INVESTMENTS IN AFFILIATED ISSUERS (continued)
| | | | | |
Investment
Companies | Change in Net Unrealized Appreciation
(Depreciation)($) | Value
10/31/20($) | Net
Assets(%) | Dividends/
Distributions($) |
AlphaSimplex Global Alternatives Fund, Cl. Y | (2,557,141) | 33,479,053 | 10.7 | - |
Boston Partners Long/Short Research Fund, Institutional Class | 470,274 | 46,656,185 | 14.9 | - |
Total | (2,086,867) | 80,135,238 | 25.6 | - |
† The table reflects the values from the date the security became an affiliated issuer through October 31, 2020. The dates AlphaSimplex Global Alternatives Fund Cl. Y and Boston Partners Long/Short Research Fund, Institutional Class are December 31, 2019 and September 30, 2020, respectively.
See notes to financial statements.
12
STATEMENT OF ASSETS AND LIABILITIES
October 31, 2020
| | | | | | | |
| | | | | | |
| | | Cost | | Value | |
Assets ($): | | | | |
Investments in securities—See Statement of Investments | | | |
Unaffiliated issuers | 144,379,639 | | 147,258,823 | |
Affiliated issuers | | 171,906,283 | | 162,563,781 | |
Cash | | | | | 3,309,982 | |
Receivable for investment securities sold | | 647,556 | |
Interest receivable | | 23,023 | |
Receivable for shares of Common Stock subscribed | | 1,419 | |
Prepaid expenses | | | | | 16,091 | |
| | | | | 313,820,675 | |
Liabilities ($): | | | | |
Due to BNY Mellon Investment Adviser, Inc. and affiliates—Note 3(c) | | 76,484 | |
Payable for shares of Common Stock redeemed | | 316,022 | |
Directors’ fees and expenses payable | | 5,538 | |
Interest payable—Note 2 | | 594 | |
Other accrued expenses | | | | | 56,842 | |
| | | | | 455,480 | |
Net Assets ($) | | | 313,365,195 | |
Composition of Net Assets ($): | | | | |
Paid-in capital | | | | | 325,469,238 | |
Total distributable earnings (loss) | | | | | (12,104,043) | |
Net Assets ($) | | | 313,365,195 | |
| | | | | | |
Net Asset Value Per Share | Class A | Class C | Class I | Class Y | |
Net Assets ($) | 40,368 | 26,297 | 1,115,872 | 312,182,658 | |
Shares Outstanding | 3,299 | 2,190 | 91,258 | 25,385,441 | |
Net Asset Value Per Share ($) | 12.24 | 12.01 | 12.23 | 12.30 | |
| | | | | |
See notes to financial statements. | | | | | |
13
STATEMENT OF OPERATIONS
Year Ended October 31, 2020
| | | | | | | |
| | | | | | |
| | | | | | |
Investment Income ($): | | | | |
Income: | | | | |
Cash dividends: | |
Unaffiliated issuers | | | 3,521,730 | |
Affiliated issuers | | | 3,182,152 | |
Interest | | | 19,365 | |
Total Income | | | 6,723,247 | |
Expenses: | | | | |
Management fee—Note 3(a) | | | 953,435 | |
Professional fees | | | 87,671 | |
Registration fees | | | 67,909 | |
Directors’ fees and expenses—Note 3(d) | | | 35,806 | |
Chief Compliance Officer fees—Note 3(c) | | | 14,076 | |
Loan commitment fees—Note 2 | | | 12,927 | |
Prospectus and shareholders’ reports | | | 8,982 | |
Custodian fees—Note 3(c) | | | 5,110 | |
Shareholder servicing costs—Note 3(c) | | | 2,142 | |
Interest expense—Note 2 | | | 1,202 | |
Distribution fees—Note 3(b) | | | 199 | |
Miscellaneous | | | 16,570 | |
Total Expenses | | | 1,206,029 | |
Less—reduction in expenses due to undertaking—Note 3(a) | | | (112) | |
Net Expenses | | | 1,205,917 | |
Investment Income—Net | | | 5,517,330 | |
Realized and Unrealized Gain (Loss) on Investments—Note 4 ($): | | |
Net realized gain (loss) on investments: | | |
Unaffiliated issuers | | | | (3,541,903) | |
Affiliated issuers | | | | (86,908) | |
Capital gain distributions on unaffiliated issuers | 2,182,109 | |
Capital gain distributions from affiliated issuers | 3,275,843 | |
Net Realized Gain (Loss) | | | 1,829,141 | |
Net change in unrealized appreciation (depreciation) on investments: | | |
Unaffiliated issuers | | | | (2,534,628) | |
Affiliated issuers | | | | (14,966,712) | |
Net Change in Unrealized Appreciation (Depreciation) | | | (17,501,340) | |
Net Realized and Unrealized Gain (Loss) on Investments | | | (15,672,199) | |
Net (Decrease) in Net Assets Resulting from Operations | | (10,154,869) | |
| | | | | | |
See notes to financial statements. | | | | | |
14
STATEMENT OF CHANGES IN NET ASSETS
| | | | | | | | | | |
| | | | Year Ended October 31, |
| | | | 2020 | | 2019 | |
Operations ($): | | | | | | | | |
Investment income—net | | | 5,517,330 | | | | 4,174,101 | |
Net realized gain (loss) on investments | | 1,829,141 | | | | 4,074,920 | |
Net change in unrealized appreciation
(depreciation) on investments | | (17,501,340) | | | | 16,102,571 | |
Net Increase (Decrease) in Net Assets
Resulting from Operations | (10,154,869) | | | | 24,351,592 | |
Distributions ($): | |
Distributions to shareholders: | | | | | | | | |
Class A | | | (849) | | | | (239) | |
Class C | | | (318) | | | | (242) | |
Class I | | | (34,551) | | | | (18,149) | |
Class Y | | | (10,408,051) | | | | (5,704,719) | |
Total Distributions | | | (10,443,769) | | | | (5,723,349) | |
Capital Stock Transactions ($): | |
Net proceeds from shares sold: | | | | | | | | |
Class A | | | 100 | | | | 1,002 | |
Class C | | | - | | | | 15,123 | |
Class I | | | 1,842,750 | | | | 1,566,135 | |
Class Y | | | 25,618,561 | | | | 75,145,013 | |
Distributions reinvested: | | | | | | | | |
Class A | | | 330 | | | | 89 | |
Class C | | | 27 | | | | 103 | |
Class I | | | 21,046 | | | | 13,626 | |
Class Y | | | 3,235,280 | | | | 1,620,010 | |
Cost of shares redeemed: | | | | | | | | |
Class A | | | - | | | | (20,128) | |
Class C | | | - | | | | (15,906) | |
Class I | | | (1,895,079) | | | | (1,863,423) | |
Class Y | | | (122,412,289) | | | | (115,590,391) | |
Increase (Decrease) in Net Assets
from Capital Stock Transactions | (93,589,274) | | | | (39,128,747) | |
Total Increase (Decrease) in Net Assets | (114,187,912) | | | | (20,500,504) | |
Net Assets ($): | |
Beginning of Period | | | 427,553,107 | | | | 448,053,611 | |
End of Period | | | 313,365,195 | | | | 427,553,107 | |
15
STATEMENT OF CHANGES IN NET ASSETS (continued)
| | | | | | | | | | |
| | | | Year Ended October 31, |
| | | | 2020 | | 2019 | |
Capital Share Transactions (Shares): | |
Class A | | | | | | | | |
Shares sold | | | 8 | | | | 80 | |
Shares issued for distributions reinvested | | | 25 | | | | 8 | |
Shares redeemed | | | - | | | | (1,668) | |
Net Increase (Decrease) in Shares Outstanding | 33 | | | | (1,580) | |
Class C | | | | | | | | |
Shares sold | | | - | | | | 1,298 | |
Shares issued for distributions reinvested | | | 2 | | | | 9 | |
Shares redeemed | | | - | | | | (1,306) | |
Net Increase (Decrease) in Shares Outstanding | 2 | | | | 1 | |
Class Ia | | | | | | | | |
Shares sold | | | 151,380 | | | | 125,472 | |
Shares issued for distributions reinvested | | | 1,650 | | | | 1,162 | |
Shares redeemed | | | (155,732) | | | | (150,507) | |
Net Increase (Decrease) in Shares Outstanding | (2,702) | | | | (23,873) | |
Class Ya | | | | | | | | |
Shares sold | | | 2,099,763 | | | | 6,110,495 | |
Shares issued for distributions reinvested | | | 252,362 | | | | 137,639 | |
Shares redeemed | | | (10,002,993) | | | | (9,434,107) | |
Net Increase (Decrease) in Shares Outstanding | (7,650,868) | | | | (3,185,973) | |
| | | | | | | | | |
a During the period ended October 31, 2020, 150,604 Class Y shares representing $1,842,750 were exchanged for 151,381 Class I shares and during the period ended October 31, 2019, 115,468 Class Y shares representing $1,452,491 were exchanged for 116,041 Class I shares. | |
See notes to financial statements. | | | | | | | | |
16
FINANCIAL HIGHLIGHTS
The following tables describe the performance for each share class for the fiscal periods indicated. All information (except portfolio turnover rate) reflects financial results for a single fund share. Total return shows how much your investment in the fund would have increased (or decreased) during each period, assuming you had reinvested all dividends and distributions. These figures have been derived from the fund’s financial statements.
| | | | | | | |
| | | |
| | | Year Ended October 31, |
Class A Shares | | 2020 | 2019 | 2018 | 2017 | 2016 |
Per Share Data ($): | | | | | | |
Net asset value, beginning of period | | 12.84 | 12.24 | 12.65 | 12.23 | 12.54 |
Investment Operations: | | | | | | |
Investment income (loss)—neta | | .10 | .08 | (.03) | .01 | .06 |
Net realized and unrealized
gain (loss) on investments | | (.44) | .60 | (.33) | .42 | (.30) |
Total from Investment Operations | | (.34) | .68 | (.36) | .43 | (.24) |
Distributions: | | | | | | |
Dividends from investment income—net | | (.14) | (.02) | (.05) | (.01) | (.07) |
Dividends from net realized
gain on investments | | (.12) | (.06) | – | – | – |
Total Distributions | | (.26) | (.08) | (.05) | (.01) | (.07) |
Net asset value, end of period | | 12.24 | 12.84 | 12.24 | 12.65 | 12.23 |
Total Return (%)b | | (2.75) | 5.57 | (2.89) | 3.52 | (1.88) |
Ratios/Supplemental Data (%): | | | | | | |
Ratio of total expenses
to average net assetsc | | .95 | .97 | .86 | .82 | .85 |
Ratio of net expenses
to average net assetsc | | .80 | .80 | .80 | .75 | .79 |
Ratio of net investment income (loss)
to average net assetsc | | .84 | .67 | (.24) | .07 | .48 |
Portfolio Turnover Rate | | 5.23 | 51.61 | 19.18 | 16.45 | 20.39 |
Net Assets, end of period ($ x 1,000) | | 40 | 42 | 59 | 61 | 61 |
a Based on average shares outstanding.
b Exclusive of sales charge.
c Amounts do not include the expenses of the underlying funds.
See notes to financial statements.
17
FINANCIAL HIGHLIGHTS (continued)
| | | | | | | |
| | | |
| | | Year Ended October 31, |
Class C Shares | | 2020 | 2019 | 2018 | 2017 | 2016 |
Per Share Data ($): | | | | | | |
Net asset value, beginning of period | | 12.59 | 12.08 | 12.57 | 12.22 | 12.54 |
Investment Operations: | | | | | | |
Investment income (loss)—neta | | .01 | (.03) | (.12) | (.08) | (.02) |
Net realized and unrealized
gain (loss) on investments | | (.45) | .61 | (.37) | .43 | (.30) |
Total from Investment Operations | | (.44) | .58 | (.49) | .35 | (.32) |
Distributions: | | | | | | |
Dividends from investment income—net | | (.02) | (.01) | – | – | – |
Dividends from net realized
gain on investments | | (.12) | (.06) | – | – | – |
Total Distributions | | (.14) | (.07) | – | – | – |
Net asset value, end of period | | 12.01 | 12.59 | 12.08 | 12.57 | 12.22 |
Total Return (%)b | | (3.51) | 4.85 | (3.90) | 2.86 | (2.55) |
Ratios/Supplemental Data (%): | | | | | | |
Ratio of total expenses
to average net assetsc | | 1.76 | 1.69 | 1.59 | 1.41 | 1.44 |
Ratio of net expenses
to average net assetsc | | 1.55 | 1.55 | 1.55 | 1.41 | 1.44 |
Ratio of net investment income (loss)
to average net assetsc | | .10 | (.21) | (.99) | (.63) | (.16) |
Portfolio Turnover Rate | | 5.23 | 51.61 | 19.18 | 16.45 | 20.39 |
Net Assets, end of period ($ x 1,000) | | 26 | 28 | 26 | 27 | 33 |
a Based on average shares outstanding.
b Exclusive of sales charge.
c Amounts do not include the expenses of the underlying funds.
See notes to financial statements.
18
| | | | | | | |
| | | |
| | | Year Ended October 31, |
Class I Shares | | 2020 | 2019 | 2018 | 2017 | 2016 |
Per Share Data ($): | | | | | | |
Net asset value, beginning of period | | 12.84 | 12.27 | 12.69 | 12.27 | 12.58 |
Investment Operations: | | | | | | |
Investment income—neta | | .17 | .14 | .01 | .05 | .10 |
Net realized and unrealized
gain (loss) on investments | | (.48) | .59 | (.34) | .43 | (.28) |
Total from Investment Operations | | (.31) | .73 | (.33) | .48 | (.18) |
Distributions: | | | | | | |
Dividends from investment income—net | | (.18) | (.10) | (.09) | (.06) | (.13) |
Dividends from net realized
gain on investments | | (.12) | (.06) | – | – | – |
Total Distributions | | (.30) | (.16) | (.09) | (.06) | (.13) |
Net asset value, end of period | | 12.23 | 12.84 | 12.27 | 12.69 | 12.27 |
Total Return (%) | | (2.47) | 6.05 | (2.60) | 3.97 | (1.44) |
Ratios/Supplemental Data (%): | | | | | | |
Ratio of total expenses
to average net assetsb | | .43 | .42 | .38 | .35 | .37 |
Ratio of net expenses
to average net assetsb | | .43 | .42 | .38 | .35 | .37 |
Ratio of net investment income
to average net assetsb | | 1.38 | 1.11 | .08 | .43 | .79 |
Portfolio Turnover Rate | | 5.23 | 51.61 | 19.18 | 16.45 | 20.39 |
Net Assets, end of period ($ x 1,000) | | 1,116 | 1,206 | 1,446 | 1,780 | 1,336 |
a Based on average shares outstanding.
b Amounts do not include the expenses of the underlying funds.
See notes to financial statements.
19
FINANCIAL HIGHLIGHTS (continued)
| | | | | | | |
| | |
| | Year Ended October 31, |
Class Y Shares | | 2020 | 2019 | 2018 | 2017 | 2016 |
Per Share Data ($): | | | | | | |
Net asset value, beginning of period | | 12.90 | 12.33 | 12.74 | 12.32 | 12.63 |
Investment Operations: | | | | | | |
Investment income—neta | | .18 | .12 | .03 | .06 | .11 |
Net realized and unrealized
gain (loss) on investments | | (.47) | .62 | (.34) | .43 | (.28) |
Total from Investment Operations | | (.29) | .74 | (.31) | .49 | (.17) |
Distributions: | | | | | | |
Dividends from
investment income—net | | (.19) | (.11) | (.10) | (.07) | (.14) |
Dividends from net realized
gain on investments | | (.12) | (.06) | – | – | – |
Total Distributions | | (.31) | (.17) | (.10) | (.07) | (.14) |
Net asset value, end of period | | 12.30 | 12.90 | 12.33 | 12.74 | 12.32 |
Total Return (%) | | (2.29) | 6.11 | (2.43) | 4.01 | (1.39) |
Ratios/Supplemental Data (%): | | | | | | |
Ratio of total expenses
to average net assetsb | | .32 | .30 | .30 | .29 | .30 |
Ratio of net expenses
to average net assetsb | | .32 | .30 | .30 | .29 | .30 |
Ratio of net investment income
to average net assetsb | | 1.45 | .98 | .27 | .52 | .92 |
Portfolio Turnover Rate | | 5.23 | 51.61 | 19.18 | 16.45 | 20.39 |
Net Assets, end of period ($ x 1,000) | | 312,183 | 426,278 | 446,522 | 475,659 | 509,333 |
a Based on average shares outstanding.
b Amounts do not include the expenses of the underlying funds.
See notes to financial statements.
20
NOTES TO FINANCIAL STATEMENTS
NOTE 1—Significant Accounting Policies:
BNY Mellon Alternative Diversifier Strategies Fund (the “fund”) is a separate diversified series of of BNY Mellon Investment Funds II, Inc. (the “Company”), which is registered under the Investment Company Act of 1940, as amended (the “Act”), as an open-end management investment company and operates as a series company currently offering three series, including the fund. The fund’s investment objective is to seek long-term capital appreciation. BNY Mellon Investment Adviser, Inc. (the “Adviser”), a wholly-owned subsidiary of The Bank of New York Mellon Corporation (“BNY Mellon”), serves as the fund’s investment adviser.
The Company’s Board of Directors (the “Board”) approved, effective December 31, 2019 (the “Effective Date”), the termination of the fund’s authorized Class T shares. Prior to the Effective Date, the fund did not offer such Class T shares for purchase. The authorized Class T shares were reallocated to authorized Class Y shares, increasing authorized Class Y shares from 100 million to 200 million.
BNY Mellon Securities Corporation (the “Distributor”), a wholly-owned subsidiary of the Adviser, is the distributor of the fund’s shares. The fund is authorized to issue 500 shares of $.001 par value Common Stock. The fund currently has authorized four classes of shares: Class A (100 million shares authorized), Class C (100 million shares authorized), Class I (100 million shares authorized) and Class Y (200 million shares authorized). Class A and Class C shares are sold primarily to retail investors through financial intermediaries and bear Distribution and/or Shareholder Services Plan fees. Class A shares generally are subject to a sales charge imposed at the time of purchase. Class A shares bought without an initial sales charge as part of an investment of $1 million or more may be charged a contingent deferred sales charge (“CDSC”) of 1.00% if redeemed within one year. Class C shares are subject to a CDSC imposed on Class C shares redeemed within one year of purchase. Class C shares automatically convert to Class A shares ten years after the date of purchase, without the imposition of a sales charge. Class I shares are sold primarily to bank trust departments and other financial service providers (including The Bank of New York Mellon, a subsidiary of BNY Mellon and an affiliate of the Adviser, and its affiliates), acting on behalf of customers having a qualified trust or an investment account or relationship at such institution, and bear no Distribution or Shareholder Services Plan fees. Class Y shares are sold at net asset value per share generally to institutional investors, and bear no Distribution or Shareholder Services Plan fees. Class I and Class Y shares
21
NOTES TO FINANCIAL STATEMENTS (continued)
are offered without a front-end sales charge or CDSC. Other differences between the classes include the services offered to and the expenses borne by each class, the allocation of certain transfer agency costs, and certain voting rights. Income, expenses (other than expenses attributable to a specific class), and realized and unrealized gains or losses on investments are allocated to each class of shares based on its relative net assets.
As of October 31, 2020, MBC Investments Corp., an indirect subsidiary of BNY Mellon, held 2,000 Class A and 2,000 Class C shares of the fund.
The Company accounts separately for the assets, liabilities and operations of each series. Expenses directly attributable to each series are charged to that series’ operations; expenses which are applicable to all series are allocated among them on a pro rata basis.
The Financial Accounting Standards Board (“FASB”) Accounting Standards Codification (“ASC”) is the exclusive reference of authoritative U.S. generally accepted accounting principles (“GAAP”) recognized by the FASB to be applied by nongovernmental entities. Rules and interpretive releases of the Securities and Exchange Commission (“SEC”) under authority of federal laws are also sources of authoritative GAAP for SEC registrants. The fund is an investment company and applies the accounting and reporting guidance of the FASB ASC Topic 946 Financial Services-Investment Companies. The fund’s financial statements are prepared in accordance with GAAP, which may require the use of management estimates and assumptions. Actual results could differ from those estimates.
The Company enters into contracts that contain a variety of indemnifications. The fund’s maximum exposure under these arrangements is unknown. The fund does not anticipate recognizing any loss related to these arrangements.
(a) Portfolio valuation: The fair value of a financial instrument is the amount that would be received to sell an asset or paid to transfer a liability in an orderly transaction between market participants at the measurement date (i.e., the exit price). GAAP establishes a fair value hierarchy that prioritizes the inputs of valuation techniques used to measure fair value. This hierarchy gives the highest priority to unadjusted quoted prices in active markets for identical assets or liabilities (Level 1 measurements) and the lowest priority to unobservable inputs (Level 3 measurements).
Additionally, GAAP provides guidance on determining whether the volume and activity in a market has decreased significantly and whether such a decrease in activity results in transactions that are not orderly.
22
GAAP requires enhanced disclosures around valuation inputs and techniques used during annual and interim periods.
Various inputs are used in determining the value of the fund’s investments relating to fair value measurements. These inputs are summarized in the three broad levels listed below:
Level 1—unadjusted quoted prices in active markets for identical investments.
Level 2—other significant observable inputs (including quoted prices for similar investments, interest rates, prepayment speeds, credit risk, etc.).
Level 3—significant unobservable inputs (including the fund’s own assumptions in determining the fair value of investments).
The inputs or methodology used for valuing securities are not necessarily an indication of the risk associated with investing in those securities.
Investments are valued at the net asset value of each underlying fund determined as of the close of the New York Stock Exchange (generally 4 p.m., Eastern time) on the valuation date and are generally categorized within Level 1 of the fair value hierarchy.
The following is a summary of the inputs used as of October 31, 2020 in valuing the fund’s investments:
| | | | | |
| | Level 1 - Unadjusted Quoted Prices | Level 2 - Other Significant Observable Inputs | Level 3 -Significant Unobservable Inputs | Total |
Assets ($) | | | |
Investments in Securities:† | | | |
Investment Companies | 309,822,604 | - | - | 309,822,604 |
† See Statement of Investments for additional detailed categorizations, if any.
(b) Securities transactions and investment income: Securities transactions are recorded on a trade date basis. Realized gains and losses from securities transactions are recorded on the identified cost basis. Dividend income is recognized on the ex-dividend date and interest income, including, where applicable, accretion of discount and amortization of premium on investments, is recognized on the accrual basis.
(c) Affiliated issuers: Investments in other investment companies advised by the Adviser are considered “affiliated” under the Act.
23
NOTES TO FINANCIAL STATEMENTS (continued)
(d) Risk: Certain events particular to the industries in which the fund’s investments conduct their operations, as well as general economic, political and public health conditions, may have a significant negative impact on the investee’s operations and profitability. In addition, turbulence in financial markets and reduced liquidity in equity, credit and/or fixed income markets may negatively affect many issuers, which could adversely affect the fund. Global economies and financial markets are becoming increasingly interconnected, and conditions and events in one country, region or financial market may adversely impact issuers in a different country, region or financial market. These risks may be magnified if certain events or developments adversely interrupt the global supply chain; in these and other circumstances, such risks might affect companies world-wide. Recent examples include pandemic risks related to COVID-19 and aggressive measures taken world-wide in response by governments, including closing borders, restricting international and domestic travel, and the imposition of prolonged quarantines of large populations, and by businesses, including changes to operations and reducing staff. To the extent the fund may overweight its investments in certain countries, companies, industries or market sectors, such positions will increase the fund’s exposure to risk of loss from adverse developments affecting those countries, companies, industries or sectors.
(e) Dividends and distributions to shareholders: Dividends and distributions are recorded on the ex-dividend date. Dividends from investment income-net and dividends from net realized capital gains, if any, are normally declared and paid annually, but the fund may make distributions on a more frequent basis to comply with the distribution requirements of the Internal Revenue Code of 1986, as amended (the “Code”). To the extent that net realized capital gains can be offset by capital loss carryovers, it is the policy of the fund not to distribute such gains. Income and capital gain distributions are determined in accordance with income tax regulations, which may differ from GAAP.
(f) Federal income taxes: It is the policy of the fund to continue to qualify as a regulated investment company, if such qualification is in the best interests of its shareholders, by complying with the applicable provisions of the Code, and to make distributions of taxable income and net realized capital gain sufficient to relieve it from substantially all federal income and excise taxes.
As of and during the period ended October 31, 2020, the fund did not have any liabilities for any uncertain tax positions. The fund recognizes interest and penalties, if any, related to uncertain tax positions as income
24
tax expense in the Statement of Operations. During the period ended October 31, 2020, the fund did not incur any interest or penalties.
Each tax year in the four-year period ended October 31, 2020 remains subject to examination by the Internal Revenue Service and state taxing authorities.
At October 31, 2020, the components of accumulated earnings on a tax basis were as follows: undistributed capital gains $1,587,919 and unrealized depreciation $13,105,420. In addition, the fund deferred for tax purposes late year ordinary losses of $586,542 to the first day of the following fiscal year.
The tax character of distributions paid to shareholders during the fiscal periods ended October 31, 2020 and October 31, 2019 were as follows: ordinary income $6,357,765 and $3,702,941, and long-term capital gains $4,086,004 and $2,020,408, respectively.
NOTE 2—Bank Lines of Credit:
The fund participates with other long-term open-end funds managed by the Adviser in a $823.5 million unsecured credit facility led by Citibank, N.A. (the “Citibank Credit Facility”) and a $300 million unsecured credit facility provided by The Bank of New York Mellon (the “BNYM Credit Facility”), each to be utilized primarily for temporary or emergency purposes, including the financing of redemptions (each, a “Facility”). The Citibank Credit Facility is available in two tranches: (i) Tranche A is in an amount equal to $688.5 million and is available to all long-term open-ended funds, including the fund, and (ii) Tranche B is an amount equal to $135 million and is available only to BNY Mellon Floating Rate Income Fund, a series of BNY Mellon Investment Funds IV, Inc. Prior to September 30, 2020, the Citibank Credit Facility was $927 million with Tranche A available in an amount equal to $747 million and Tranche B available in an amount equal to $180 million. Prior to March 11, 2020, the Citibank Credit Facility was $1.030 billion with Tranche A available in an amount equal to $830 million and Tranche B available in an amount equal to $200 million. In connection therewith, the fund has agreed to pay its pro rata portion of commitment fees for Tranche A of the Citibank Credit Facility and the BNYM Credit Facility. Interest is charged to the fund based on rates determined pursuant to the terms of the respective Facility at the time of borrowing.
The average amount of borrowings outstanding under the Facilities during the period ended October 31, 2020 was approximately $86,612 with a related weighted average annualized interest rate of 1.39%.
25
NOTES TO FINANCIAL STATEMENTS (continued)
NOTE 3—Management Fee and Other Transactions with Affiliates:
(a) Pursuant to a management agreement with the Adviser, the fund has agreed to pay a management fee at the annual rate of 1.35% applied to the portion of the fund’s average daily net assets allocated to direct investments in securities and .25% applied to that portion of the fund’s average daily net assets allocated to investments in other investment companies (underlying funds) and money market instruments (including cash and equivalents). The Adviser has contractually agreed, from November 1, 2019 through February 28, 2021, to waive receipt of its fees and/or assume the direct expenses of the fund, so that the direct expenses of none of the classes (excluding Rule 12b-1 Distribution Plan fees, Shareholder Services Plan fees, taxes, interest expense, brokerage commissions, commitment fees on borrowings and extraordinary expenses) exceed .55% of the value of the fund’s average daily net assets. On or after February 28, 2021, the Adviser may terminate this expense limitation at any time. Because “acquired fund fees and expenses” are incurred indirectly by the fund, such fees and expenses are not included in the expense limitations. The reduction in expenses, pursuant to the undertaking, amounted to $112 during the period ended October 31, 2020.
(b) Under the Distribution Plan adopted pursuant to Rule 12b-1 under the Act, Class C shares pay the Distributor for distributing its shares at an annual rate of .75% of the value of its average daily net assets. During the period ended October 31, 2020, Class C shares were charged $199 pursuant to the Distribution Plan.
(c) Under the Shareholder Services Plan, Class A and Class C shares pay the Distributor at an annual rate of .25% of the value of their average daily net assets for the provision of certain services. The services provided may include personal services relating to shareholder accounts, such as answering shareholder inquiries regarding the fund and providing reports and other information, and services related to the maintenance of shareholder accounts. The Distributor may make payments to Service Agents (securities dealers, financial institutions or other industry professionals) with respect to these services. The Distributor determines the amounts to be paid to Service Agents. During the period ended October 31, 2020, Class A and Class C shares were charged $101 and $66, respectively, pursuant to the Shareholder Services Plan.
Under its terms, the Distribution Plan and Shareholder Services Plan shall remain in effect from year to year, provided such continuance is approved annually by a vote of a majority of those Directors who are not “interested persons” of the Company and who have no direct or indirect financial
26
interest in the operation of or in any agreement related to the Distribution Plan or Shareholder Services Plan.
The fund has an arrangement with the transfer agent whereby the fund may receive earnings credits when positive cash balances are maintained, which are used to offset transfer agency fees. For financial reporting purposes, the fund includes net earnings credits, if any, as an expense offset in the Statement of Operations.
The fund has an arrangement with the custodian whereby the fund will receive interest income or be charged an overdraft fees when cash balances are maintained. For financial reporting purposes, the fund includes this interest income and overdraft fees, if any, as interest income in the Statement of Operations.
The fund compensates BNY Mellon Transfer, Inc., a wholly-owned subsidiary of the Adviser, under a transfer agency agreement for providing transfer agency and cash management services for the fund. The majority of transfer agency fees are comprised of amounts paid on a per account basis, while cash management fees are related to fund subscriptions and redemptions. During the period ended October 31, 2020, the fund was charged $1,573 for transfer agency services. These fees are included in Shareholder servicing costs in the Statement of Operations.
The fund compensates The Bank of New York Mellon under a custody agreement for providing custodial services for the fund. These fees are determined based on net assets, geographic region and transaction activity. During the period ended October 31, 2020, the fund was charged $5,110 pursuant to the custody agreement.
During the period ended October 31, 2020, the fund was charged $14,076 for services performed by the Chief Compliance Officer and his staff. These fees are included in Chief Compliance Officer fees in the Statement of Operations.
The components of “Due to BNY Mellon Investment Adviser, Inc. and affiliates” in the Statement of Assets and Liabilities consist of: management fees of $70,272, Distribution Plan fees of $17, Shareholder Services Plan fees of $14, custodian fees of $1,350, Chief Compliance Officer fees of $4,546 and transfer agency fees of $292, which are offset against an expense reimbursement currently in effect in the amount of $7.
(d) Each Board member also serves as a Board member of other funds in the BNY Mellon Family of Funds complex. Annual retainer fees and attendance fees are allocated to each fund based on net assets.
27
NOTES TO FINANCIAL STATEMENTS (continued)
NOTE 4—Securities Transactions:
The aggregate amount of purchases and sales of investment securities, excluding short-term securities, during the period ended October 31, 2020, amounted to $19,654,213 and $112,298,377, respectively.
At October 31, 2020, the cost of investments for federal income tax purposes was $322,928,024, accordingly, accumulated net unrealized depreciation on investments was $13,105,420, consisting of $9,938,945 gross unrealized appreciation and $23,044,365 gross unrealized depreciation.
28
REPORT OF INDEPENDENT REGISTERED PUBLIC ACCOUNTING FIRM
To the Shareholders of the Fund and Board of Directors of
BNY Mellon Investment Funds II, Inc.:
Opinion on the Financial Statements
We have audited the accompanying statement of assets and liabilities of BNY Mellon Alternative Diversifier Strategies Fund (the “Fund”), a series of BNY Mellon Investment Funds II, Inc., including the statement of investments, as of October 31, 2020, and the statement of investments in affiliated issuers as of and for the year then ended, the related statement of operations for the year then ended, the statements of changes in net assets for each of the years in the two-year period then ended, and the related notes (collectively, the financial statements), and the financial highlights for each of the years in the five-year period then ended. In our opinion, the financial statements and financial highlights present fairly, in all material respects, the financial position of the Fund as of October 31, 2020, the results of its operations for the year then ended, the changes in its net assets for each of the years in the two-year period then ended, and the financial highlights for each of the years in the five-year period then ended, in conformity with U.S. generally accepted accounting principles.
Basis for Opinion
These financial statements and financial highlights are the responsibility of the Fund’s management. Our responsibility is to express an opinion on these financial statements and financial highlights based on our audits. We are a public accounting firm registered with the Public Company Accounting Oversight Board (United States) (PCAOB) and are required to be independent with respect to the Fund in accordance with the U.S. federal securities laws and the applicable rules and regulations of the Securities and Exchange Commission and the PCAOB.
We conducted our audits in accordance with the standards of the PCAOB. Those standards require that we plan and perform the audit to obtain reasonable assurance about whether the financial statements and financial highlights are free of material misstatement, whether due to error or fraud. Our audits included performing procedures to assess the risks of material misstatement of the financial statements and financial highlights, whether due to error or fraud, and performing procedures that respond to those risks. Such procedures included examining, on a test basis, evidence regarding the amounts and disclosures in the financial statements and financial highlights. Such procedures also included confirmation of securities owned as of October 31, 2020, by correspondence with the transfer agent and custodian. Our audits also included evaluating the accounting principles used and significant estimates made by management, as well as evaluating the overall presentation of the financial statements and financial highlights. We believe that our audits provide a reasonable basis for our opinion.

We have served as the auditor of one or more BNY Mellon Investment Adviser, Inc. investment companies since 1994.
New York, New York
December 18, 2020
29
IMPORTANT TAX INFORMATION (Unaudited)
For federal tax purposes, the fund reports the maximum amount allowable, but not less than $6,357,765 as ordinary income dividends paid during the year ended October 31, 2020 as qualified dividend income in accordance with Section 854(b)(1)(B) of the Internal Revenue Code. Also, the fund reports the maximum amount allowable but not less than 100% of ordinary income dividends paid during the year ended October 31, 2020 as eligible for the corporate dividends received deduction provided under Section 243 of the Internal Revenue Code in accordance with Section 854(b)(1)(A) of the Internal Revenue Code. Shareholders will receive notification in early 2021 of the percentage applicable to the preparation of their 2020 income tax returns. The fund reports the maximum amount allowable but not less than $.1242 per share as a capital gain dividend in accordance with Section 852(b)(3)(C) of the Internal Revenue Code. Also, the fund reports the maximum amount allowable but not less than $.0003 as a short-term capital gain dividend paid on December 31, 2019 in accordance with Sections 871(k)(2) and 881(e) of the Internal Revenue Code.
30
BOARD MEMBERS INFORMATION (Unaudited)
INDEPENDENT BOARD MEMBERS
Joseph S. DiMartino (77)
Chairman of the Board (1999)
Principal Occupation During Past 5 Years:
· Director or Trustee of funds in the BNY Mellon Family of Funds and certain other entities (as described in the fund’s Statement of Additional Information) (1995-Present)
Other Public Company Board Memberships During Past 5 Years:
· CBIZ, Inc., a public company providing professional business services, products and solutions, Director (1997-Present)
No. of Portfolios for which Board Member Serves: 110
———————
Francine J. Bovich (69)
Board Member (2012)
Principal Occupation During Past 5 Years:
· Trustee, The Bradley Trusts, private trust funds (2011-Present)
Other Public Company Board Memberships During Past 5 Years:
· Annaly Capital Management, Inc., a real estate investment trust, Director (2014-Present)
No. of Portfolios for which Board Member Serves: 67
———————
Andrew J. Donohue (70)
Board Member (2019)
Principal Occupation During Past 5 Years:
· Of Counsel, Shearman & Sterling LLP (2017-2019)
· Chief of Staff to the Chair of the SEC (2015-2017)
· Managing Director and Investment Company General Counsel of Goldman Sachs (2012-2015)
Other Public Company Board Memberships During Past 5 Years:
· Oppenheimer Funds (58 funds), Director (2017-2019)
No. of Portfolios for which Board Member Serves: 53
———————
31
BOARD MEMBERS INFORMATION (Unaudited) (continued)
INDEPENDENT BOARD MEMBERS (continued)
Kenneth A. Himmel (74)
Board Member (1994)
Principal Occupation During Past 5 Years:
· Managing Partner, Gulf Related, an international real estate development company (2010-Present)
· President and CEO, Related Urban Development, a real estate development company (1996-Present)
· CEO, American Food Management, a restaurant company (1983-Present)
· President and CEO, Himmel & Company, a real estate development company (1980-Present)
No. of Portfolios for which Board Member Serves: 22
———————
Stephen J. Lockwood (73)
Board Member (1994)
Principal Occupation During Past 5 Years:
· Chairman of the Board, Stephen J. Lockwood and Company LLC, a real estate investment company (2000-Present)
No. of Portfolios for which Board Member Serves: 22
———————
Roslyn M. Watson (71)
Board Member (1994)
Principal Occupation During Past 5 Years:
· Principal, Watson Ventures, Inc., a real estate investment company (1993-Present)
Other Public Company Board Memberships During Past 5 Years:
· American Express Bank, FSB, Director (1993-2018)
No. of Portfolios for which Board Member Serves: 53
———————
32
Benaree Pratt Wiley (74)
Board Member (1998)
Principal Occupation During Past 5 Years:
· Principal, The Wiley Group, a firm specializing in strategy and business development (2005-Present)
Other Public Company Board Memberships During Past 5 Years:
· CBIZ, Inc., a public company providing professional business services, products and solutions, Director (2008-Present)
· Blue Cross-Blue Shield of Massachusetts, Director (2004-Present)
No. of Portfolios for which Board Member Serves: 71
———————
Once elected all Board Members serve for an indefinite term, but achieve Emeritus status upon reaching age 80. The address of the Board Members and Officers is c/o BNY Mellon Investment Adviser, Inc. 240 Greenwich Street, New York, New York 10286. Additional information about the Board Members is available in the fund’s Statement of Additional Information which can be obtained from the Adviser free of charge by calling this toll free number: 1-800-373-9387.
James M. Fitzgibbons, Emeritus Board Member
33
OFFICERS OF THE FUND (Unaudited)
RENEE LAROCHE-MORRIS, President since May 2019.
President and a director of BNY Mellon Investment Adviser, Inc. since January 2018. She is an officer of 61 investment companies (comprised of 110 portfolios) managed by the Adviser. She is 49 years old and has been an employee of BNY Mellon since 2003.
JAMES WINDELS, Treasurer since November 2001.
Director-BNY Mellon Fund Administration, and an officer of 63 investment companies (comprised of 141 portfolios) managed by the Adviser or an affiliate of the Adviser. He is 62 years old and has been an employee of the Adviser since April 1985.
BENNETT A. MACDOUGALL, Chief Legal Officer since October 2015.
Chief Legal Officer of the Adviser and Associate General Counsel and Managing Director of BNY Mellon since June 2015; Director and Associate General Counsel of Deutsche Bank–Asset & Wealth Management Division from June 2005 to June 2015, and as Chief Legal Officer of Deutsche Investment Management Americas Inc. from June 2012 to May 2015. He is an officer of 63 investment companies (comprised of 141 portfolios) managed by the Adviser or an affiliate of the Adviser. He is 49 years old and has been an employee of the Adviser since June 2015.
DAVID DIPETRILLO, Vice President since May 2019.
Head of North America Product, BNY Mellon Investment Management since January 2018, Director of Product Strategy, BNY Mellon Investment Management from January 2016 to December 2017; Head of US Retail Product and Channel Marketing, BNY Mellon Investment Management from January 2014 to December 2015. He is an officer of 62 investment companies (comprised of 118 portfolios) managed by the Adviser or an affiliate of the Adviser. He is 42 years old and has been an employee of BNY Mellon since 2005.
JAMES BITETTO, Vice President since August 2005 and Secretary since February 2018.
Senior Managing Counsel of BNY Mellon since December 2019; Managing Counsel of BNY Mellon from April 2014 to December 2019; Secretary of the Adviser, and an officer of 63 investment companies (comprised of 141 portfolios) managed by the Adviser or an affiliate of the Adviser. He is 54 years old and has been an employee of the Adviser since December 1996.
SONALEE CROSS, Vice President and Assistant Secretary since March 2018.
Counsel of BNY Mellon since October 2016; Associate at Proskauer Rose LLP from April 2016 to September 2016; Attorney at EnTrust Capital from August 2015 to February 2016; Associate at Sidley Austin LLP from September 2013 to August 2015. She is an officer of 63 investment companies (comprised of 141 portfolios) managed by the Adviser or an affiliate of the Adviser. She is 33 years old and has been an employee of the Adviser since October 2016.
DEIRDRE CUNNANE, Vice President and Assistant Secretary since March 2019.
Counsel of BNY Mellon since August 2018; Senior Regulatory Specialist at BNY Mellon Investment Management Services from February 2016 to August 2018; Trustee Associate at BNY Mellon Trust Company (Ireland) Limited from August 2013 to February 2016. She is an officer of 63 investment companies (comprised of 141 portfolios) managed by the Adviser or an affiliate of the Adviser. She is 30 years old and has been an employee of the Adviser since August 2018.
SARAH S. KELLEHER, Vice President and Assistant Secretary since April 2014.
Managing Counsel of BNY Mellon since December 2017, Senior Counsel of BNY Mellon from March 2013 to December 2017. She is an officer of 63 investment companies (comprised of 141 portfolios) managed by the Adviser or an affiliate of the Adviser. She is 45 years old and has been an employee of the Adviser since March 2013.
JEFF PRUSNOFSKY, Vice President and Assistant Secretary since August 2005.
Senior Managing Counsel of BNY Mellon, and an officer of 63 investment companies (comprised of 141 portfolios) managed by the Adviser or an affiliate of the Adviser. He is 55 years old and has been an employee of the Adviser since October 1990.
AMANDA QUINN, Vice President and Assistant Secretary since March 2020.
Counsel of BNY Mellon since June 2019; Regulatory Administration Manager at BNY Mellon Investment Management Services from September 2018 to May 2019; Senior Regulatory Specialist at BNY Mellon Investment Management Services from April 2015 to August 2018. She is an officer of 63 investment companies (comprised of 141 portfolios) managed by the Adviser or an affiliate of the Adviser. She is 35 years old and has been an employee of the Adviser since June 2019.
34
PETER M. SULLIVAN, Vice President and Assistant Secretary since March 2019.
Managing Counsel of BNY Mellon since March 2009, Senior Counsel of BNY Mellon from April 2004 to March 2009, and an officer of 63 investment companies (comprised of 141 portfolios) managed by the Adviser or an affiliate of the Adviser. He is 52 years old and has been an employee of the Adviser since January 2019.
NATALYA ZELENSKY, Vice President and Assistant Secretary since March 2017.
Managing Counsel of BNY Mellon since December 2019; Counsel of BNY Mellon from May 2016 to December 2019; Attorney at Wildermuth Endowment Strategy Fund/Wildermuth Advisory, LLC from November 2015 to May 2016 and Assistant General Counsel at RCS Advisory Services from July 2014 to November 2015. She is an officer of 63 investment companies (comprised of 141 portfolios) managed by the Adviser or an affiliate of the Adviser. She is 35 years old and has been an employee of the Adviser since May 2016.
GAVIN C. REILLY, Assistant Treasurer since December 2005.
Tax Manager-BNY Mellon Fund Administration, and an officer of 63 investment companies (comprised of 141 portfolios) managed by the Adviser or an affiliate of the Adviser. He is 52 years old and has been an employee of the Adviser since April 1991.
ROBERT S. ROBOL, Assistant Treasurer since December 2002.
Senior Accounting Manager-BNY Mellon Fund Administration, and an officer of 63 investment companies (comprised of 141 portfolios) managed by the Adviser or an affiliate of the Adviser. He is 56 years old and has been an employee of the Adviser since October 1988.
ROBERT SALVIOLO, Assistant Treasurer since July 2007.
Senior Accounting Manager–BNY Mellon Fund Administration, and an officer of 63 investment companies (comprised of 141 portfolios) managed by the Adviser or an affiliate of the Adviser. He is 53 years old and has been an employee of the Adviser since June 1989.
ROBERT SVAGNA, Assistant Treasurer since December 2002.
Senior Accounting Manager–BNY Mellon Fund Administration, and an officer of 63 investment companies (comprised of 141 portfolios) managed by the Adviser or an affiliate of the Adviser. He is 53 years old and has been an employee of the Adviser since November 1990.
JOSEPH W. CONNOLLY, Chief Compliance Officer since October 2004.
Chief Compliance Officer of the Adviser, the BNY Mellon Family of Funds and BNY Mellon Funds Trust (62 investment companies, comprised of 133 portfolios). He is 63 years old and has served in various capacities with the Adviser since 1980, including manager of the firm’s Fund Accounting Department from 1997 through October 2001.
CARIDAD M. CAROSELLA, Anti-Money Laundering Compliance Officer since January 2016.
Anti-Money Laundering Compliance Officer of the BNY Mellon Family of Funds and BNY Mellon Funds Trust since January 2016; from May 2015 to December 2015, Interim Anti-Money Laundering Compliance Officer of the BNY Mellon Family of Funds and BNY Mellon Funds Trust and the Distributor; from January 2012 to May 2015, AML Surveillance Officer of the Distributor. She is an officer of 56 investment companies (comprised of 134 portfolios) managed by the Adviser or an affiliate of the Adviser. She is 52 years old and has been an employee of the Distributor since 1997.
35
This page intentionally left blank.
36
This page intentionally left blank.
37
BNY Mellon Alternative Diversifier Strategies Fund
240 Greenwich Street
New York, NY 10286
Adviser
BNY Mellon Investment Adviser, Inc.
240 Greenwich Street
New York, NY 10286
Custodian
The Bank of New York Mellon
240 Greenwich Street
New York, NY 10286
Transfer Agent &
Dividend Disbursing Agent
BNY Mellon Transfer, Inc.
240 Greenwich Street
New York, NY 10286
Distributor
BNY Mellon Securities Corporation
240 Greenwich Street
New York, NY 10286
| | |
Ticker Symbols: | Class A: DRNAX Class C: DRNCX Class I: DRNIX Class Y: DRYNX |
Telephone Call your financial representative or 1-800-373-9387
Mail The BNY Mellon Family of Funds, 144 Glenn Curtiss Boulevard, Uniondale, NY 11556-0144
E-mail Send your request to info@bnymellon.com
Internet Information can be viewed online or downloaded at www.bnymellonim.com/us
The fund files its complete schedule of portfolio holdings with the Securities and Exchange Commission (“SEC”) for the first and third quarters of each fiscal year on Form N-PORT. The fund’s Forms N-PORT are available on the SEC’s website at www.sec.gov.
A description of the policies and procedures that the fund uses to determine how to vote proxies relating to portfolio securities and information regarding how the fund voted these proxies for the most recent 12-month period ended June 30 is available at www.bnymellonim.com/us and on the SEC’s website at www.sec.gov and without charge, upon request, by calling 1-800-373-9387.
| | |
© 2020 BNY Mellon Securities Corporation
6253AR1020 | 
|
BNY Mellon Global Emerging Markets Fund
| |
ANNUAL REPORT October 31, 2020 |
| |
Save time. Save paper. View your next shareholder report online as soon as it’s available. Log into www.bnymellonim.com/us and sign up for eCommunications. It’s simple and only takes a few minutes. |
| |
The views expressed in this report reflect those of the portfolio manager(s) only through the end of the period covered and do not necessarily represent the views of BNY Mellon Investment Adviser, Inc. or any other person in the BNY Mellon Investment Adviser, Inc. organization. Any such views are subject to change at any time based upon market or other conditions and BNY Mellon Investment Adviser, Inc. disclaims any responsibility to update such views. These views may not be relied on as investment advice and, because investment decisions for a fund in the BNY Mellon Family of Funds are based on numerous factors, may not be relied on as an indication of trading intent on behalf of any fund in the BNY Mellon Family of Funds. |
| |
Not FDIC-Insured • Not Bank-Guaranteed • May Lose Value |
Contents
THE FUND
FOR MORE INFORMATION
Back Cover
| | | | |
| |
BNY Mellon Global Emerging Markets Fund
| | The Fund |
A LETTER FROM THE PRESIDENT OF BNY MELLON INVESTMENT ADVISER, INC.
Dear Shareholder:
We are pleased to present this annual report for BNY Mellon Global Emerging Markets Fund, covering the 12-month period from November 1, 2019 through October 31, 2020. For information about how the fund performed during the reporting period, as well as general market perspectives, we provide a Discussion of Fund Performance on the pages that follow.
Accommodative rate policies from the U.S. Federal Reserve (the “Fed”) and progress towards a U.S./China trade deal stoked optimism about future economic growth prospects the final months of 2019, fueling an equity rally. As we entered 2020, optimism turned to concern as COVID-19 began to spread across portions of Asia and Europe. When the virus reached the U.S. in March 2020, stocks became volatile. U.S. equities posted historic losses during the month due to investor concern over the economic impact of a widespread quarantine. Global central banks and governments launched emergency stimulus measures to support their respective economies, and equity valuations began to rebound, trending upward until the fall. Volatility returned in September 2020 and continued through October, as concerns over rising COVID-19 infection rates, continued trade tensions, the U.S. Congress’ failure to pass additional financial assistance and anxiety over the upcoming U.S. election constrained equity valuations.
In fixed-income markets, interest rates were heavily influenced by changes in Fed policy and investor concern over COVID-19. In 2019, as stocks rallied in response to Fed rate cuts, risk-asset valuations also rose while Treasuries lagged. When COVID-19 began to emerge, a flight to quality ensued, and Treasury rates fell significantly. The Fed cut rates twice in March 2020, resulting in an overnight lending target rate of nearly zero, and the government launched a large stimulus package. Risk-asset prices began to rebound, and bond indices generally rose until September 2020, when investment-grade instrument prices stalled. Yields in the intermediate and long portions of the Treasury curve rose during October, further constraining bond prices.
We believe the near-term outlook for the U.S. will be challenging, as the country continues to battle COVID-19. As always, we will monitor relevant data for meaningful developments. We encourage you to discuss the risks and opportunities in today’s investment environment with your financial advisor.
Thank you for your continued confidence and support.
Sincerely,

Renee LaRoche-Morris
President
BNY Mellon Investment Adviser, Inc.
November 16, 2020
2
DISCUSSION OF FUND PERFORMANCE (Unaudited)
For the period from November 1, 2019 through October 31, 2020, as provided by portfolio manager Sophia Whitbread, CFA, of Newton Investment Management (North America) Limited, Sub-Investment Adviser
Market and Fund Performance Overview
For the 12-month period ended October 31, 2020, BNY Mellon Global Emerging Markets Fund’s Class A shares produced a total return of 39.62%, Class C shares returned 38.61%, Class I shares returned 39.93%, and Class Y shares returned 40.07%.1 In comparison, the fund’s benchmark, the MSCI Emerging Markets Index (the “Index”), produced a total return of 8.25% for the same period.2
Emerging markets encountered volatility during the reporting period, due in part to the COVID-19 outbreak and resulting economic uncertainty. The fund outperformed the Index, mainly due to stock selection within the information technology, consumer discretionary and financials sectors.
The Fund’s Investment Approach
The fund seeks long-term capital appreciation. To pursue its goal, the fund normally invests at least 80% of its net assets, plus any borrowings for investment purposes, in common stocks and other equity securities (or derivative or other strategic instruments with similar economic characteristics) of companies organized or with their principal place of business, or majority of assets or business, in emerging-markets countries. The portfolio manager employs a fundamental, bottom-up investment process that emphasizes quality, return on capital employed and governance. The process of identifying investment ideas begins by identifying a core list of investment themes. These themes are based primarily on observable global economic, industrial or social trends that the portfolio manager believes will positively affect certain sectors or industries and cause stocks within these sectors or industries to outperform others. The portfolio manager then identifies specific companies, using investment themes to help focus on areas where thematic and strategic research indicates positive returns are likely to be achieved.
Markets Impacted by COVID-19 and Central Bank Activity
Emerging markets rose very strongly at the end of 2019. The global economic environment remained sluggish, but sentiment improved as China and the U.S. reached a ‘Phase One’ trade agreement. The People’s Bank of China cut its bank-funding rate but did not aggressively stimulate, in stark contrast to the U.S., where the slowdown led to rapid loosening of policy and a consequent spike in money-supply growth. The positive sentiment carried over into the New Year; however, the strong emerging-market equity index gains that had accumulated by mid-January started to reverse, as optimism about the ‘Phase One’ U.S.-China trade agreement was replaced by growing fears over the potential impact of the outbreak of COVID-19 in China. By the end of March, emerging markets, along with all global markets, had suffered substantial declines, as the virus spread across the world, and many countries went into lockdown, stalling large parts of the global economy. China was very much “first in” and then “first out” when it came to the impact of COVID-19.
Emerging markets staged a strong recovery in the second half of the review period, as monetary authorities continued their exceptional support to markets with the U.S. Federal Reserve (the “Fed”) purchasing corporate debt directly, to support businesses affected by
3
DISCUSSION OF FUND PERFORMANCE (Unaudited) (continued)
COVID-19. The market was also driven in large part by improving data in China pointing to a strong economic recovery, and more belatedly by India, for which the market had over-discounted the short-term impact of the pandemic, hence the market subsequently rallied strongly in hard currency terms. In contrast, South Africa and most Latin American markets were very weak in hard currency terms, as these more fragile economies struggled with the impact of the virus.
Information Technology and Consumer Discretionary Stock Choices Drive Outperformance
At the sector level, the fund benefited most from stock selection within the information technology, consumer discretionary and financials sectors. At a country level, the largest contribution came from positioning in China, Hong Kong and South Korea. Top stock performers included Korean lithium-battery manufacturer Samsung SDI, which sustained its strong performance, supported by strong year-on-year sales growth of electric vehicles across Europe, in spite of the viral outbreak. The share price of Chinese solar energy manufacturer LONGi Green Energy Technology has more than doubled since the stock was purchased four and a half months ago, as investors started to recognize its global leadership position and quality advantage in a structurally attractive industry. The very real “greening of the recovery” dovetails with falling solar costs to make this the energy technology of choice for the next decade. The fund has around 25% of its capital in electric vehicle supply chain and solar power holdings. Elsewhere in the markets, other notable contributors included Meituan Dianping, China’s leading food and consumer service delivery platform, online tutoring provider GSX Techedu and Indian online food-delivery business Delivery Hero. These businesses have benefited from an acceleration in activity shifting online as a result of the pandemic.
Conversely, at a sector level, the only negative contributor was the low weighting in health care, due to the void in pharmaceutical stocks, which was detrimental as they performed relatively well in the sell-off, owing to their defensive nature. At a country level, India was the main detractor. As a country with a large population, significant population concentrations in large cities and lower GDP per capita, the impact from COVID-19 has meant that negative sentiment has weighed on the Indian market for a number of months, and some of the Fund’s Indian consumer names, such as cinema operator PVR, jeweler Titan and automobile manufacture Maruti Suzuki India, underperformed, although these stocks did recover some lost ground later in the review period. Similarly, in tougher-than-expected trading conditions, India’s Housing Development Finance trailed the broader market over the period. Brazilian travel company CVC Brasil Operadora e Agencia de Viagens was a large stock detractor, after its results were affected by unexpected further provisioning related to airline Avianca’s bankruptcy. The departure of the CFO (chief financial officer) did not help the market’s reaction to the results. Our reduced conviction in the stock led us to sell it during the period.
Seeking Growth Opportunities
We are bullish on emerging market equity opportunities, despite the recent rally in prices. The policy of the U.S. and other developed markets will likely be biased to loosening, which is supportive of a yield pick-up in emerging markets—so, good for currencies, but even better for lowering the discount rate for equities, particularly those with the best structural
4
growth opportunities. We are again seeing the U.S. dollar weakness that had started early in the year before interruption by the COVID-19 risk-aversion trade, and the stance of the Fed has been clarified with inflation targeting only likely to continue the recent dollar weakness and support inflationary winners such as emerging markets.
We believe China is best positioned for recovery over the next 12 months and India over the next five years. Commodities have struggled, not least given the OPEC+ breakdown, so the demand interruption from the virus is likely to have a more prolonged effect, unlike service industries, which can rebound more quickly and have better multi-year prospects. The ‘greening of the recovery’ in Europe in particular has been unsurprising to us and supports our ‘Earth matters’ theme. The Fund has around 25% in electric vehicle supply chain and solar power, but no oil companies.
November 16, 2020
1 Total return includes reinvestment of dividends and any capital gains paid and does not take into consideration the maximum initial sales charge in the case of Class A shares, or the applicable contingent deferred sales charges imposed on redemptions in the case of Class C shares. Had these charges been reflected, returns would have been lower. Past performance is no guarantee of future results. Share price, yield and investment return fluctuate such that upon redemption, fund shares may be worth more or less than their original cost. The fund’s return reflects the absorption of certain fund expenses by BNY Mellon Investment Adviser, Inc. pursuant to an agreement in effect through February 28, 2021, at which time it may be extended, modified or terminated. Had these expenses not been absorbed, returns would have been lower.
2 Source: Lipper Inc. — Reflects reinvestment of net dividends and, where applicable, capital gain distributions. The MSCI Emerging Markets Index is a free, float-adjusted, market capitalization-weighted index that is designed to measure equity market performance of emerging markets. Investors cannot invest directly in any index.
Please note: the position in any security highlighted with italicized typeface was sold during the reporting period.
The fund may, but is not required to, use derivative instruments. A small investment in derivatives could have a potentially large impact on the fund’s performance. The use of derivatives involves risks different from, or possibly greater than, the risks associated with investing directly in the underlying assets
Equities are subject generally to market, market sector, market liquidity, issuer and investment style risks, among other factors, to varying degrees, all of which are more fully described in the fund’s prospectus.
Recent market risks include pandemic risks related to COVID-19. The effects of COVID-19 have contributed to increased volatility in global markets and will likely affect certain countries, companies, industries and market sectors more dramatically than others. To the extent the fund may overweight its investments in certain countries, companies, industries or market sectors, such positions will increase the fund's exposure to risk of loss from adverse developments affecting those countries, companies, industries or sectors.
Emerging markets tend to be more volatile than the markets of more mature economies and generally have less diverse and less mature economic structures and less stable political systems than those of developed countries. The securities of companies located in emerging markets are often subject to rapid and large changes in price. An investment in this fund should be considered only as a supplement to a complete investment program for those investors willing to accept the greater risks associated with investing in emerging-market countries.
Investing internationally involves special risks, including changes in currency exchange rates, political, economic, and social instability, a lack of comprehensive company information, differing auditing and legal standards and less market liquidity. These risks generally are greater with emerging-market countries than with more economically and politically established foreign countries.
5
FUND PERFORMANCE (Unaudited)

Comparison of change in value of a $10,000 investment in Class A shares, Class C shares and Class I shares of BNY Mellon Global Emerging Markets Fund with a hypothetical investment of $10,000 in the MSCI Emerging Markets Index (the “Index”)
† Source: Lipper Inc.
Past performance is not predictive of future performance.
The above graph compares a hypothetical $10,000 investment made in each of the Class A shares, Class C shares, and Class I shares of BNY Mellon Global Emerging Markets Fund on 2/3/14 (inception date) to a hypothetical investment of $10,000 made in the Index on that date. All dividends and capital gain distributions are reinvested.
The fund’s performance shown in the line graph above takes into account the maximum initial sales charge on Class A shares and all other applicable fees and expenses on all classes. The Index is a free float-adjusted market capitalization-weighted index that is designed to measure equity market performance of emerging markets. Unlike a mutual fund, the Index is not subject to charges, fees and other expenses. Investors cannot invest directly in any index. Further information relating to fund performance, including expense reimbursements, if applicable, is contained in the Financial Highlights section of the prospectus and elsewhere in this report.
6

Comparison of change in value of a $1,000,000 investment in Class Y shares of BNY Mellon Global Emerging Markets Fund with a hypothetical investment of $1,000,000 in the MSCI Emerging Markets Index (the “Index”)
† Source: Lipper Inc.
Past performance is not predictive of future performance.
The above graph compares a hypothetical $1,000,000 investment made in Class Y shares of BNY Mellon Global Emerging Markets Fund on 2/3/14 (inception date) to a hypothetical investment of $1,000,000 made in the Index on that date. All dividends and capital gain distributions are reinvested.
The fund’s performance shown in the line graph above takes into account all applicable fees and expenses of the fund’s Class Y shares. The Index is a free float-adjusted market capitalization-weighted index that is designed to measure equity market performance of emerging markets. Unlike a mutual fund, the Index is not subject to charges, fees and other expenses. Investors cannot invest directly in any index. Further information relating to fund performance, including expense reimbursements, if applicable, is contained in the Financial Highlights section of the prospectus and elsewhere in this report.
7
FUND PERFORMANCE (Unaudited) (continued)
| | | | | | | |
Average Annual Total Returns as of 10/31/2020
|
| Inception
Date | 1 Year | 5 Year | | From
Inception |
Class A shares | | | | |
with maximum sales charge (5.75%) | 2/3/14 | 31.60% | 10.65% | | 8.80% | |
without sales charge | 2/3/14 | 39.62% | 11.96% | | 9.76% | |
Class C shares | | | | |
with applicable redemption charge † | 2/3/14 | 37.61% | 11.13% | | 8.94% | |
without redemption | 2/3/14 | 38.61% | 11.13% | | 8.94% | |
Class I shares | 2/3/14 | 39.93% | 12.24% | | 9.99% | |
Class Y shares | 2/3/14 | 40.07% | 12.27% | | 10.08% | |
MSCI Emerging Markets Index | 1/31/14 | 8.25% | 7.92% | | 4.96% | †† |
† The maximum contingent deferred sales charge for Class C shares is 1% for shares redeemed within one year of the date of purchase.
†† For comparative purposes, the value of the Index as of 1/31/14 is used as the beginning value on 2/3/14.
The performance data quoted represents past performance, which is no guarantee of future results. Share price and investment return fluctuate and an investor’s shares may be worth more or less than original cost upon redemption. Current performance may be lower or higher than the performance quoted. Go to www.bnymellonim.com/us for the fund’s most recent month-end returns.
The fund’s performance shown in the graphs and table does not reflect the deduction of taxes that a shareholder would pay on fund distributions or the redemption of fund shares. In addition to the performance of Class A shares shown with and without a maximum sales charge, the fund’s performance shown in the table takes into account all other applicable fees and expenses on all classes.
8
UNDERSTANDING YOUR FUND’S EXPENSES (Unaudited)
As a mutual fund investor, you pay ongoing expenses, such as management fees and other expenses. Using the information below, you can estimate how these expenses affect your investment and compare them with the expenses of other funds. You also may pay one-time transaction expenses, including sales charges (loads) and redemption fees, which are not shown in this section and would have resulted in higher total expenses. For more information, see your fund’s prospectus or talk to your financial adviser.
Review your fund’s expenses
The table below shows the expenses you would have paid on a $1,000 investment in BNY Mellon Global Emerging Markets Fund from May 1, 2020 to October 31, 2020. It also shows how much a $1,000 investment would be worth at the close of the period, assuming actual returns and expenses.
| | | | | | | |
Expenses and Value of a $1,000 Investment | |
Assume actual returns for the six months ended October 31, 2020 | |
| | | | | | |
| | Class A | Class C | Class I | Class Y | |
Expense paid per $1,000† | $7.63 | $12.18 | $6.11 | $5.68 | |
Ending value (after expenses) | $1,428.70 | $1,423.30 | $1,430.00 | $1,430.90 | |
COMPARING YOUR FUND’S EXPENSES
WITH THOSE OF OTHER FUNDS (Unaudited)
Using the SEC’s method to compare expenses
The Securities and Exchange Commission (“SEC”) has established guidelines to help investors assess fund expenses. Per these guidelines, the table below shows your fund’s expenses based on a $1,000 investment, assuming a hypothetical 5% annualized return. You can use this information to compare the ongoing expenses (but not transaction expenses or total cost) of investing in the fund with those of other funds. All mutual fund shareholder reports will provide this information to help you make this comparison. Please note that you cannot use this information to estimate your actual ending account balance and expenses paid during the period.
| | | | | | | |
Expenses and Value of a $1,000 Investment | |
Assuming a hypothetical 5% annualized return for the six months ended October 31, 2020 | |
| | | | | | |
| | Class A | Class C | Class I | Class Y | |
Expense paid per $1,000† | $6.34 | $10.13 | $5.08 | $4.72 | |
Ending value (after expenses) | $1,018.85 | $1,015.08 | $1,020.11 | $1,020.46 | |
† Expenses are equal to the fund’s annualized expense ratio of 1.25% for Class A, 2.00% for Class C, 1.00% for Class I and .93% for Class Y, multiplied by the average account value over the period, multiplied by 184/366 (to reflect the one-half year period). |
9
STATEMENT OF INVESTMENTS
October 31, 2020
| | | | | | | | |
| |
Description | | | | Shares | | Value ($) | |
Common Stocks - 96.7% | | | | | |
Argentina - 4.6% | | | | | |
Globant | | | | 59,716 | a | 10,785,307 | |
MercadoLibre | | | | 5,572 | a | 6,764,686 | |
| | | | | 17,549,993 | |
Australia - 1.3% | | | | | |
IDP Education | | | | 138,599 | | 1,888,349 | |
Orocobre | | | | 1,685,878 | a,b | 3,031,286 | |
| | | | | 4,919,635 | |
Brazil - .4% | | | | | |
Arco Platform, Cl. A | | | | 51,280 | a | 1,747,622 | |
Chile - 1.1% | | | | | |
Sociedad Quimica y Minera de Chile, ADR | | | | 111,080 | | 4,111,071 | |
China - 37.1% | | | | | |
Alibaba Group Holding, ADR | | | | 71,141 | a | 21,675,951 | |
Autohome, ADR | | | | 94,970 | | 9,074,383 | |
Bilibili, ADR | | | | 125,567 | a,b | 5,609,078 | |
China Harmony Auto Holding | | | | 2,922,500 | | 1,147,002 | |
China Yongda Automobiles Services Holdings | | | | 2,914,000 | | 4,139,100 | |
Flat Glass Group, Cl. H | | | | 2,715,000 | | 8,131,994 | |
LONGi Green Energy Technology, CI. A | | | | 1,862,110 | | 21,357,107 | |
Meituan, Cl. B | | | | 566,087 | a | 21,175,555 | |
New Oriental Education & Technology Group, ADR | | | | 120,774 | a | 19,369,734 | |
Ping An Insurance Group Company of China, Cl. H | | | | 621,000 | | 6,375,108 | |
Tencent Holdings | | | | 162,003 | | 12,426,671 | |
Tencent Music Entertainment Group, ADR | | | | 385,060 | a | 5,729,693 | |
Xinyi Solar Holdings | | | | 2,630,000 | | 4,816,490 | |
| | | | | 141,027,866 | |
Germany - 1.6% | | | | | |
Delivery Hero | | | | 53,046 | a,c | 6,127,267 | |
Hong Kong - 3.9% | | | | | |
AIA Group | | | | 1,561,000 | | 14,722,280 | |
India - 19.4% | | | | | |
Affle India | | | | 26,451 | a | 954,234 | |
Apollo Hospitals Enterprise | | | | 52,857 | | 1,513,723 | |
Asian Paints | | | | 358,131 | | 10,702,593 | |
Housing Development Finance | | | | 609,839 | | 15,818,173 | |
Info Edge India | | | | 255,076 | | 12,230,549 | |
Jubilant Foodworks | | | | 315,331 | | 9,247,938 | |
10
| | | | | | | | |
| |
Description | | | | Shares | | Value ($) | |
Common Stocks - 96.7% (continued) | | | | | |
India - 19.4% (continued) | | | | | |
Maruti Suzuki India | | | | 101,294 | | 9,546,969 | |
Nippon Life Asset Management | | | | 305,000 | c | 1,118,002 | |
PVR | | | | 247,596 | | 3,595,210 | |
Titan | | | | 572,623 | | 9,002,176 | |
| | | | | 73,729,567 | |
Indonesia - 1.1% | | | | | |
Vale Indonesia | | | | 15,419,424 | a | 4,238,704 | |
Netherlands - 4.3% | | | | | |
ASML Holding | | | | 13,259 | | 4,820,371 | |
Prosus | | | | 115,321 | | 11,526,994 | |
| | | | | 16,347,365 | |
Russia - .6% | | | | | |
HeadHunter Group, ADR | | | | 101,311 | | 2,324,074 | |
South Africa - 1.6% | | | | | |
Clicks Group | | | | 243,730 | | 3,536,986 | |
Discovery | | | | 379,110 | | 2,493,149 | |
| | | | | 6,030,135 | |
South Korea - 9.8% | | | | | |
Iljin Materials | | | | 274,629 | | 10,422,485 | |
LG Household & Health Care | | | | 3,322 | | 4,361,273 | |
Samsung SDI | | | | 57,189 | | 22,469,252 | |
| | | | | 37,253,010 | |
Taiwan - 6.0% | | | | | |
Elite Material | | | | 485,000 | | 2,550,311 | |
Taiwan Semiconductor Manufacturing | | | | 1,335,000 | | 20,147,829 | |
| | | | | 22,698,140 | |
United States - 3.9% | | | | | |
EPAM Systems | | | | 24,456 | a | 7,555,681 | |
Livent | | | | 695,725 | a,b | 7,479,044 | |
| | | | | 15,034,725 | |
Total Common Stocks (cost $226,931,195) | | | | 367,861,454 | |
| | | 1-Day
Yield (%) | | | | | |
Investment Companies - 2.9% | | | | | |
Registered Investment Companies - 2.9% | | | | | |
Dreyfus Institutional Preferred Government Plus Money Market Fund
(cost $11,025,756) | | 0.10 | | 11,025,756 | d | 11,025,756 | |
11
STATEMENT OF INVESTMENTS (continued)
| | | | | | | | |
| |
Description | | 1-Day
Yield (%) | | Shares | | Value ($) | |
Investment of Cash Collateral for Securities Loaned - .0% | | | | | |
Registered Investment Companies - .0% | | | | | |
Dreyfus Institutional Preferred Government Plus Money Market Fund
(cost $3,467) | | 0.10 | | 3,467 | d | 3,467 | |
Total Investments (cost $237,960,418) | | 99.6% | | 378,890,677 | |
Cash and Receivables (Net) | | .4% | | 1,497,030 | |
Net Assets | | 100.0% | | 380,387,707 | |
ADR—American Depository Receipt
aNon-income producing security.
bSecurity, or portion thereof, on loan. At October 31, 2020, the value of the fund’s securities on loan was $13,470,504 and the value of the collateral was $14,111,262, consisting of cash collateral of $3,467 and U.S. Government & Agency securities valued at $14,107,795.
cSecurity exempt from registration pursuant to Rule 144A under the Securities Act of 1933. These securities may be resold in transactions exempt from registration, normally to qualified institutional buyers. At October 31, 2020, these securities were valued at $7,245,269 or 1.9% of net assets.
dInvestment in affiliated issuer. The investment objective of this investment company is publicly available and can be found within the investment company’s prospectus.
| | |
Portfolio Summary (Unaudited) † | Value (%) |
Retailing | 19.1 |
Semiconductors & Semiconductor Equipment | 15.6 |
Media & Entertainment | 13.0 |
Technology Hardware & Equipment | 9.3 |
Consumer Services | 8.5 |
Materials | 7.8 |
Insurance | 6.2 |
Software & Services | 4.8 |
Banks | 4.2 |
Investment Companies | 2.9 |
Automobiles & Components | 2.5 |
Consumer Durables & Apparel | 2.4 |
Household & Personal Products | 1.1 |
Food & Staples Retailing | .9 |
Commercial & Professional Services | .6 |
Health Care Equipment & Services | .4 |
Diversified Financials | .3 |
| | 99.6 |
† Based on net assets.
See notes to financial statements.
12
STATEMENT OF INVESTMENTS IN AFFILIATED ISSUERS
| | | | | | | |
Investment Companies | Value
10/31/19 ($) | Purchases ($)† | Sales ($) | Value
10/31/20 ($) | Net
Assets (%) | Dividends/
Distributions ($) |
Registered
Investment Companies; | | | | |
Dreyfus Institutional Preferred Government Plus Money Market Fund | 4,912,165 | 102,484,658 | (96,371,067) | 11,025,756 | 2.9 | 31,436 |
Investment of Cash Collateral
for Securities Loaned; | | | | |
Dreyfus Institutional Preferred Government Plus Money Market Fund | 4,090,097 | 78,076,872 | (82,163,502) | 3,467 | .0 | - |
Total | 9,002,262 | 180,561,530 | (178,534,569) | 11,029,223 | 2.9 | 31,436 |
† Includes reinvested dividends/distributions.
See notes to financial statements.
13
STATEMENT OF ASSETS AND LIABILITIES
October 31, 2020
| | | | | | | |
| | | | | | |
| | | Cost | | Value | |
Assets ($): | | | | |
Investments in securities—See Statement of Investments
(including securities on loan, valued at $13,470,504)—Note 1(c): | | | |
Unaffiliated issuers | 226,931,195 | | 367,861,454 | |
Affiliated issuers | | 11,029,223 | | 11,029,223 | |
Cash denominated in foreign currency | | | 922,615 | | 930,821 | |
Receivable for shares of Common Stock subscribed | | 1,130,676 | |
Dividends and securities lending income receivable | | 58,510 | |
Receivable for investment securities sold | | 44,935 | |
Tax reclaim receivable | | 2,287 | |
Prepaid expenses | | | | | 17,556 | |
| | | | | 381,075,462 | |
Liabilities ($): | | | | |
Due to BNY Mellon Investment Adviser, Inc. and affiliates—Note 3(c) | | 329,968 | |
Payable for shares of Common Stock redeemed | | 243,767 | |
Directors’ fees and expenses payable | | 7,360 | |
Liability for securities on loan—Note 1(c) | | 3,467 | |
Interest payable—Note 2 | | 442 | |
Other accrued expenses | | | | | 102,751 | |
| | | | | 687,755 | |
Net Assets ($) | | | 380,387,707 | |
Composition of Net Assets ($): | | | | |
Paid-in capital | | | | | 286,798,163 | |
Total distributable earnings (loss) | | | | | 93,589,544 | |
Net Assets ($) | | | 380,387,707 | |
| | | | | | |
Net Asset Value Per Share | Class A | Class C | Class I | Class Y | |
Net Assets ($) | 8,826,013 | 4,329,870 | 76,570,788 | 290,661,036 | |
Shares Outstanding | 397,120 | 201,230 | 3,425,720 | 12,949,505 | |
Net Asset Value Per Share ($) | 22.23 | 21.52 | 22.35 | 22.45 | |
| | | | | |
See notes to financial statements. | | | | | |
14
STATEMENT OF OPERATIONS
Year Ended October 31, 2020
| | | | | | | |
| | | | | | |
| | | | | | |
Investment Income ($): | | | | |
Income: | | | | |
Cash dividends (net of $333,738 foreign taxes withheld at source): | |
Unaffiliated issuers | | | 2,048,033 | |
Affiliated issuers | | | 31,102 | |
Income from securities lending—Note 1(c) | | | 199,794 | |
Total Income | | | 2,278,929 | |
Expenses: | | | | |
Management fee—Note 3(a) | | | 2,299,335 | |
Custodian fees—Note 3(c) | | | 244,292 | |
Professional fees | | | 157,158 | |
Shareholder servicing costs—Note 3(c) | | | 84,519 | |
Registration fees | | | 67,141 | |
Distribution fees—Note 3(b) | | | 28,865 | |
Directors’ fees and expenses—Note 3(d) | | | 26,897 | |
Prospectus and shareholders’ reports | | | 14,409 | |
Chief Compliance Officer fees—Note 3(c) | | | 14,076 | |
Loan commitment fees—Note 2 | | | 11,627 | |
Interest expense—Note 2 | | | 527 | |
Miscellaneous | | | 25,503 | |
Total Expenses | | | 2,974,349 | |
Less—reduction in expenses due to undertaking—Note 3(a) | | | (14,997) | |
Net Expenses | | | 2,959,352 | |
Investment (Loss)—Net | | | (680,423) | |
Realized and Unrealized Gain (Loss) on Investments—Note 4 ($): | | |
Net realized gain (loss) on investments and foreign currency transactions | 19,630,714 | |
Net realized gain (loss) on forward foreign currency exchange contracts | (129,839) | |
Capital gain distributions from affiliated issuers | 334 | |
Net Realized Gain (Loss) | | | 19,501,209 | |
Net change in unrealized appreciation (depreciation) on investments
and foreign currency transactions | 90,524,239 | |
Net change in unrealized appreciation (depreciation) on
forward foreign currency exchange contracts | 2 | |
Net Change in Unrealized Appreciation (Depreciation) | | | 90,524,241 | |
Net Realized and Unrealized Gain (Loss) on Investments | | | 110,025,450 | |
Net Increase in Net Assets Resulting from Operations | | 109,345,027 | |
| | | | | | |
See notes to financial statements. | | | | | |
15
STATEMENT OF CHANGES IN NET ASSETS
| | | | | | | | | | |
| | | | Year Ended October 31, |
| | | | 2020 | | 2019 | |
Operations ($): | | | | | | | | |
Investment income (loss)—net | | | (680,423) | | | | 1,253,089 | |
Net realized gain (loss) on investments | | 19,501,209 | | | | (29,245,428) | |
Net change in unrealized appreciation
(depreciation) on investments | | 90,524,241 | | | | 75,516,983 | |
Net Increase (Decrease) in Net Assets
Resulting from Operations | 109,345,027 | | | | 47,524,644 | |
Distributions ($): | |
Distributions to shareholders: | | | | | | | | |
Class A | | | (85,052) | | | | (35,070) | |
Class C | | | (54,018) | | | | (5,385) | |
Class I | | | (1,143,845) | | | | (806,435) | |
Class Y | | | (5,341,890) | | | | (2,751,960) | |
Total Distributions | | | (6,624,805) | | | | (3,598,850) | |
Capital Stock Transactions ($): | |
Net proceeds from shares sold: | | | | | | | | |
Class A | | | 4,502,024 | | | | 996,504 | |
Class C | | | 392,214 | | | | 319,913 | |
Class I | | | 31,806,522 | | | | 15,921,975 | |
Class Y | | | 61,723,080 | | | | 35,012,923 | |
Distributions reinvested: | | | | | | | | |
Class A | | | 84,300 | | | | 34,189 | |
Class C | | | 53,578 | | | | 5,352 | |
Class I | | | 1,129,670 | | | | 781,819 | |
Class Y | | | 3,717,884 | | | | 1,980,059 | |
Cost of shares redeemed: | | | | | | | | |
Class A | | | (1,551,472) | | | | (2,972,769) | |
Class C | | | (1,082,460) | | | | (2,029,843) | |
Class I | | | (25,220,060) | | | | (53,972,963) | |
Class Y | | | (78,487,287) | | | | (48,615,555) | |
Increase (Decrease) in Net Assets
from Capital Stock Transactions | (2,932,007) | | | | (52,538,396) | |
Total Increase (Decrease) in Net Assets | 99,788,215 | | | | (8,612,602) | |
Net Assets ($): | |
Beginning of Period | | | 280,599,492 | | | | 289,212,094 | |
End of Period | | | 380,387,707 | | | | 280,599,492 | |
16
| | | | | | | | | | |
| | | | Year Ended October 31, |
| | | | 2020 | | 2019 | |
Capital Share Transactions (Shares): | |
Class A | | | | | | | | |
Shares sold | | | 241,464 | | | | 64,821 | |
Shares issued for distributions reinvested | | | 4,921 | | | | 2,440 | |
Shares redeemed | | | (82,890) | | | | (202,357) | |
Net Increase (Decrease) in Shares Outstanding | 163,495 | | | | (135,096) | |
Class C | | | | | | | | |
Shares sold | | | 22,291 | | | | 21,865 | |
Shares issued for distributions reinvested | | | 3,210 | | | | 392 | |
Shares redeemed | | | (65,721) | | | | (138,004) | |
Net Increase (Decrease) in Shares Outstanding | (40,220) | | | | (115,747) | |
Class Ia | | | | | | | | |
Shares sold | | | 1,794,852 | | | | 1,042,122 | |
Shares issued for distributions reinvested | | | 65,758 | | | | 55,817 | |
Shares redeemed | | | (1,520,042) | | | | (3,602,252) | |
Net Increase (Decrease) in Shares Outstanding | 340,568 | | | | (2,504,313) | |
Class Ya | | | | | | | | |
Shares sold | | | 3,484,598 | | | | 2,342,188 | |
Shares issued for distributions reinvested | | | 215,530 | | | | 140,430 | |
Shares redeemed | | | (4,327,375) | | | | (3,252,946) | |
Net Increase (Decrease) in Shares Outstanding | (627,247) | | | | (770,328) | |
| | | | | | | | | |
a During the period ended October 31, 2020, 77,972 Class Y shares representing $1,481,238 were exchanged for 78,284 Class I shares and during the period ended October 31, 2019, 46,253 Class Y shares representing $715,595 were exchanged for 46,433 Class I shares. | |
See notes to financial statements. | | | | | | | | |
17
FINANCIAL HIGHLIGHTS
The following tables describe the performance for each share class for the fiscal periods indicated. All information (except portfolio turnover rate) reflects financial results for a single fund share. Total return shows how much your investment in the fund would have increased (or decreased) during each period, assuming you had reinvested all dividends and distributions. These figures have been derived from the fund’s financial statements.
| | | | | | | | | | | | |
| | | | | |
| | | | |
| | Year Ended October 31, |
Class A Shares | | 2020 | 2019 | 2018 | 2017 | 2016 |
Per Share Data ($): | | | | | | |
Net asset value, beginning of period | | 16.25 | 13.86 | 17.79 | 14.24 | 13.15 |
Investment Operations: | | | | | | |
Investment income (loss)—neta | | (.10) | .03 | .03 | (.03) | (.02) |
Net realized and unrealized gain (loss)
on investments | | 6.43 | 2.48 | (3.75) | 3.58 | 1.11 |
Total from Investment Operations | | 6.33 | 2.51 | (3.72) | 3.55 | 1.09 |
Distributions: | | | | | | |
Dividends from investment income—net | | (.35) | (.12) | (.21) | - | - |
Net asset value, end of period | | 22.23 | 16.25 | 13.86 | 17.79 | 14.24 |
Total Return (%)b | | 39.62 | 18.28 | (21.19) | 25.02 | 8.13 |
Ratios/Supplemental Data (%): | | | | | | |
Ratio of total expenses
to average net assets | | 1.29 | 1.32 | 1.34 | 1.55 | 1.82 |
Ratio of net expenses
to average net assets | | 1.25 | 1.25 | 1.25 | 1.28 | 1.53 |
Ratio of net investment income (loss)
to average net assets | | (.54) | .22 | .16 | (.17) | (.18) |
Portfolio Turnover Rate | | 51.54 | 48.73 | 41.94 | 36.79 | 51.42 |
Net Assets, end of period ($ x 1,000) | | 8,826 | 3,795 | 5,109 | 4,117 | 297 |
a Based on average shares outstanding.
b Exclusive of sales charge.
See notes to financial statements.
18
| | | | | | | | | |
| | | | |
| | | | |
| | Year Ended October 31, |
Class C Shares | | 2020 | 2019 | 2018 | 2017 | 2016 |
Per Share Data ($): | | | | | | |
Net asset value, beginning of period | | 15.73 | 13.42 | 17.32 | 13.96 | 12.99 |
Investment Operations: | | | | | | |
Investment (loss)—neta | | (.22) | (.08) | (.10) | (.15) | (.13) |
Net realized and unrealized gain (loss)
on investments | | 6.23 | 2.41 | (3.63) | 3.51 | 1.10 |
Total from Investment Operations | | 6.01 | 2.33 | (3.73) | 3.36 | .97 |
Distributions: | | | | | | |
Dividends from investment income—net | | (.22) | (.02) | (.17) | - | - |
Net asset value, end of period | | 21.52 | 15.73 | 13.42 | 17.32 | 13.96 |
Total Return (%)b | | 38.61 | 17.35 | (21.80) | 24.07 | 7.39 |
Ratios/Supplemental Data (%): | | | | | | |
Ratio of total expenses
to average net assets | | 2.07 | 2.10 | 2.11 | 2.30 | 2.80 |
Ratio of net expenses
to average net assets | | 2.00 | 2.00 | 2.00 | 2.01 | 2.28 |
Ratio of net investment (loss)
to average net assets | | (1.26) | (.51) | (.60) | (.94) | (.97) |
Portfolio Turnover Rate | | 51.54 | 48.73 | 41.94 | 36.79 | 51.42 |
Net Assets, end of period ($ x 1,000) | | 4,330 | 3,798 | 4,793 | 3,335 | 54 |
a Based on average shares outstanding.
b Exclusive of sales charge.
See notes to financial statements.
19
FINANCIAL HIGHLIGHTS (continued)
| | | | | | | | | | | | | | |
| | | | | |
| | | | | |
| | Year Ended October 31, |
Class I Shares | | 2020 | 2019 | 2018 | 2017 | 2016 |
Per Share Data ($): | | | | | | |
Net asset value, beginning of period | | 16.34 | 13.96 | 17.89 | 14.29 | 13.16 |
Investment Operations: | | | | | | |
Investment income (loss)—neta | | (.05) | .07 | .07 | .01 | (.03) |
Net realized and unrealized gain (loss)
on investments | | 6.46 | 2.50 | (3.77) | 3.59 | 1.16 |
Total from Investment Operations | | 6.41 | 2.57 | (3.70) | 3.60 | 1.13 |
Distributions: | | | | | | |
Dividends from investment income—net | | (.40) | (.19) | (.23) | (.00)b | - |
Net asset value, end of period | | 22.35 | 16.34 | 13.96 | 17.89 | 14.29 |
Total Return (%) | | 39.93 | 18.61 | (21.01) | 25.24 | 8.50 |
Ratios/Supplemental Data (%): | | | | | | |
Ratio of total expenses
to average net assets | | 1.02 | 1.00 | 1.06 | 1.29 | 1.54 |
Ratio of net expenses
to average net assets | | 1.00 | 1.00 | 1.00 | 1.02 | 1.27 |
Ratio of net investment income (loss)
to average net assets | | (.27) | .47 | .38 | .07 | (.24) |
Portfolio Turnover Rate | | 51.54 | 48.73 | 41.94 | 36.79 | 51.42 |
Net Assets, end of period ($ x 1,000) | | 76,571 | 50,399 | 78,037 | 108,787 | 2,618 |
a Based on average shares outstanding.
b Amount represents less than $.01 per share.
See notes to financial statements.
20
| | | | | | | | |
| |
| | |
| | Year Ended October, 31 |
Class Y Shares | | 2020 | 2019 | 2018 | 2017 | 2016 |
Per Share Data ($): | | | | | | |
Net asset value, beginning of period | | 16.40 | 14.03 | 17.97 | 14.35 | 13.22 |
Investment Operations: | | | | | | |
Investment income (loss)—neta | | (.03) | .07 | .08 | .03 | .01 |
Net realized and unrealized gain (loss)
on investments | | 6.48 | 2.51 | (3.79) | 3.59 | 1.12 |
Total from Investment Operations | | 6.45 | 2.58 | (3.71) | 3.62 | 1.13 |
Distributions: | | | | | | |
Dividends from
investment income—net | | (.40) | (.21) | (.23) | (.00)b | - |
Net asset value, end of period | | 22.45 | 16.40 | 14.03 | 17.97 | 14.35 |
Total Return (%) | | 40.07 | 18.61 | (20.98) | 25.27 | 8.47 |
Ratios/Supplemental Data (%): | | | | | | |
Ratio of total expenses
to average net assets | | .93 | .98 | .94 | 1.18 | 1.42 |
Ratio of net expenses
to average net assets | | .93 | .98 | .94 | 1.11 | 1.26 |
Ratio of net investment income (loss)
to average net assets | | (.19) | .47 | .44 | .17 | .07 |
Portfolio Turnover Rate | | 51.54 | 48.73 | 41.94 | 36.79 | 51.42 |
Net Assets, end of period ($ x 1,000) | | 290,661 | 222,607 | 201,273 | 156,027 | 103,139 |
a Based on average shares outstanding.
b Amount represents less than $.01 per share.
See notes to financial statements.
21
NOTES TO FINANCIAL STATEMENTS
NOTE 1—Significant Accounting Policies:
BNY Mellon Global Emerging Markets Fund (the “fund”) is a separate non-diversified series of BNY Mellon Investment Funds II, Inc. (the “Company”), which is registered under the Investment Company Act of 1940, as amended (the “Act”), as an open-end management investment company and operates as a series company currently offering three series, including the fund. The fund’s investment objective is to seek long-term capital appreciation. BNY Mellon Investment Adviser, Inc. (the “Adviser”), a wholly-owned subsidiary of The Bank of New York Mellon Corporation (“BNY Mellon”), serves as the fund’s investment adviser. Effective December 31, 2019, Newton Investment Management (North America) Limited (“NIMNA”) reorganized into Newton Investment Management Limited (“NIM” or the “Sub-Adviser”), a wholly-owned subsidiary of BNY Mellon and an affiliate of the Adviser. Consequently, the sub-investment advisory agreement between the Adviser and NIMNA was terminated and NIM now serves as the fund’s sub-adviser pursuant to a sub-investment advisory agreement between the Adviser and NIM. There was no change to the fund’s investment objective, polices or strategies as a result of the reorganization of NIMNA into Sub-Adviser.
The Company’s Board of Director (the “Board”) approved, effective December 31, 2019 (the “Effective Date”), the termination of the fund’s authorized Class T shares. Prior to the Effective Date, the fund did not offer such Class T shares for purchase. The authorized Class T shares were reallocated to authorized Class Y shares, increasing authorized Class Y shares from 100 million to 200 million.
BNY Mellon Securities Corporation (the “Distributor”), a wholly-owned subsidiary of the Adviser, is the distributor of the fund’s shares. The fund is authorized to issue 500 shares of $.001 par value Common Stock. The fund currently has authorized four classes of shares: Class A (100 million shares authorized), Class C (100 million shares authorized), Class I (100 million shares authorized) and Class Y (200 million shares authorized). Class A and Class C shares are sold primarily to retail investors through financial intermediaries and bear Distribution and/or Shareholder Services Plan fees. Class A shares generally are subject to a sales charge imposed at the time of purchase. Class A shares bought without an initial sales charge as part of an investment of $1 million or more may be charged a contingent deferred sales charge (“CDSC”) of 1.00% if redeemed within one year. Class C shares are subject to a CDSC imposed on Class C shares redeemed within one year of purchase. Class C shares automatically
22
convert to Class A shares ten years after the date of purchase, without the imposition of a sales charge. Class I shares are sold primarily to bank trust departments and other financial service providers (including The Bank of New York Mellon, a subsidiary of BNY Mellon and an affiliate of the Adviser, and its affiliates), acting on behalf of customers having a qualified trust or an investment account or relationship at such institution, and bear no Distribution or Shareholder Services Plan fees. Class Y shares are sold at net asset value per share generally to institutional investors, and bear no Distribution or Shareholder Services Plan fees. Class I and Class Y shares are offered without a front-end sales charge or CDSC. Other differences between the classes include the services offered to and the expenses borne by each class, the allocation of certain transfer agency costs, and certain voting rights. Income, expenses (other than expenses attributable to a specific class), and realized and unrealized gains or losses on investments are allocated to each class of shares based on its relative net assets.
As of October 31, 2020, MBC Investments Corp., an indirect subsidiary of BNY Mellon, held 2,000 Class C shares of the fund.
The Company accounts separately for the assets, liabilities and operations of each series. Expenses directly attributable to each series are charged to that series’ operations; expenses which are applicable to all series are allocated among them on a pro rata basis.
The Financial Accounting Standards Board (“FASB”) Accounting Standards Codification (“ASC”) is the exclusive reference of authoritative U.S. generally accepted accounting principles (“GAAP”) recognized by the FASB to be applied by nongovernmental entities. Rules and interpretive releases of the Securities and Exchange Commission (“SEC”) under authority of federal laws are also sources of authoritative GAAP for SEC registrants. The fund is an investment company and applies the accounting and reporting guidance of the FASB ASC Topic 946 Financial Services-Investment Companies. The fund’s financial statements are prepared in accordance with GAAP, which may require the use of management estimates and assumptions. Actual results could differ from those estimates.
The Company enters into contracts that contain a variety of indemnifications. The fund’s maximum exposure under these arrangements is unknown. The fund does not anticipate recognizing any loss related to these arrangements.
(a) Portfolio valuation: The fair value of a financial instrument is the amount that would be received to sell an asset or paid to transfer a liability in an orderly transaction between market participants at the measurement
23
NOTES TO FINANCIAL STATEMENTS (continued)
date (i.e., the exit price). GAAP establishes a fair value hierarchy that prioritizes the inputs of valuation techniques used to measure fair value. This hierarchy gives the highest priority to unadjusted quoted prices in active markets for identical assets or liabilities (Level 1 measurements) and the lowest priority to unobservable inputs (Level 3 measurements).
Additionally, GAAP provides guidance on determining whether the volume and activity in a market has decreased significantly and whether such a decrease in activity results in transactions that are not orderly. GAAP requires enhanced disclosures around valuation inputs and techniques used during annual and interim periods.
Various inputs are used in determining the value of the fund’s investments relating to fair value measurements. These inputs are summarized in the three broad levels listed below:
Level 1—unadjusted quoted prices in active markets for identical investments.
Level 2—other significant observable inputs (including quoted prices for similar investments, interest rates, prepayment speeds, credit risk, etc.).
Level 3—significant unobservable inputs (including the fund’s own assumptions in determining the fair value of investments).
The inputs or methodology used for valuing securities are not necessarily an indication of the risk associated with investing in those securities.
Changes in valuation techniques may result in transfers in or out of an assigned level within the disclosure hierarchy. Valuation techniques used to value the fund’s investments are as follows:
Investments in equity securities are valued at the last sales price on the securities exchange or national securities market on which such securities are primarily traded. Securities listed on the National Market System for which market quotations are available are valued at the official closing price or, if there is no official closing price that day, at the last sales price. For open short positions, asked prices are used for valuation purposes. Bid price is used when no asked price is available. Registered investment companies that are not traded on an exchange are valued at their net asset value. All of the preceding securities are generally categorized within Level 1 of the fair value hierarchy.
Securities not listed on an exchange or the national securities market, or securities for which there were no transactions, are valued at the average of
24
the most recent bid and asked prices. These securities are generally categorized within Level 2 of the fair value hierarchy.
Fair valuing of securities may be determined with the assistance of a pricing service using calculations based on indices of domestic securities and other appropriate indicators, such as prices of relevant ADRs and futures. Utilizing these techniques may result in transfers between Level 1 and Level 2 of the fair value hierarchy.
When market quotations or official closing prices are not readily available, or are determined not to accurately reflect fair value, such as when the value of a security has been significantly affected by events after the close of the exchange or market on which the security is principally traded (for example, a foreign exchange or market), but before the fund calculates its net asset value, the fund may value these investments at fair value as determined in accordance with the procedures approved by the Board. Certain factors may be considered when fair valuing investments such as: fundamental analytical data, the nature and duration of restrictions on disposition, an evaluation of the forces that influence the market in which the securities are purchased and sold, and public trading in similar securities of the issuer or comparable issuers. These securities are either categorized within Level 2 or 3 of the fair value hierarchy depending on the relevant inputs used.
For securities where observable inputs are limited, assumptions about market activity and risk are used and such securities are generally categorized within Level 3 of the fair value hierarchy.
Investments denominated in foreign currencies are translated to U.S. dollars at the prevailing rates of exchange.
The following is a summary of the inputs used as of October 31, 2020 in valuing the fund’s investments:
25
NOTES TO FINANCIAL STATEMENTS (continued)
| | | | | | |
| | Level 1 - Unadjusted Quoted Prices | Level 2 - Other Significant Observable Inputs | | Level 3 - Significant Unobservable Inputs | Total |
Assets ($) | | | |
Investments in Securities:† | | | |
Equity Securities –
Common Stocks | 102,226,324 | 265,635,130 | †† | - | 367,861,454 |
Investment Companies | 11,029,223 | - | | - | 11,029,223 |
† See Statement of Investments for additional detailed categorizations, if any.
†† Securities classified within Level 2 at period end as the values were determined pursuant to the fund’s fair valuation procedures.
(b) Foreign currency transactions: The fund does not isolate that portion of the results of operations resulting from changes in foreign exchange rates on investments from the fluctuations arising from changes in the market prices of securities held. Such fluctuations are included with the net realized and unrealized gain or loss on investments.
Net realized foreign exchange gains or losses arise from sales of foreign currencies, currency gains or losses realized on securities transactions between trade and settlement date, and the difference between the amounts of dividends, interest and foreign withholding taxes recorded on the fund’s books and the U.S. dollar equivalent of the amounts actually received or paid. Net unrealized foreign exchange gains and losses arise from changes in the value of assets and liabilities other than investments resulting from changes in exchange rates. Foreign currency gains and losses on foreign currency transactions are also included with net realized and unrealized gain or loss on investments.
Foreign Taxes: The fund may be subject to foreign taxes (a portion of which may be reclaimable) on income, stock dividends, realized and unrealized capital gains on investments or certain foreign currency transactions. Foreign taxes are recorded in accordance with the fund’s understanding of the applicable foreign tax regulations and rates that exist in the foreign jurisdictions in which the fund invests. These foreign taxes, if any, are paid by the fund and are reflected in the Statement of Operations. Foreign taxes payable or deferred as of October 31, 2020, if any, are disclosed in the fund’s Statement of Assets and Liabilities.
(c) Securities transactions and investment income: Securities transactions are recorded on a trade date basis. Realized gains and losses from securities transactions are recorded on the identified cost basis. Dividend income is recognized on the ex-dividend date and interest income, including, where applicable, accretion of discount and
26
amortization of premium on investments, is recognized on the accrual basis.
Pursuant to a securities lending agreement with The Bank of New York Mellon, the fund may lend securities to qualified institutions. It is the fund’s policy that, at origination, all loans are secured by collateral of at least 102% of the value of U.S. securities loaned and 105% of the value of foreign securities loaned. Collateral equivalent to at least 100% of the market value of securities on loan is maintained at all times. Collateral is either in the form of cash, which can be invested in certain money market mutual funds managed by the Adviser, or U.S. Government and Agency securities. The fund is entitled to receive all dividends, interest and distributions on securities loaned, in addition to income earned as a result of the lending transaction. Should a borrower fail to return the securities in a timely manner, The Bank of New York Mellon is required to replace the securities for the benefit of the fund or credit the fund with the market value of the unreturned securities and is subrogated to the fund’s rights against the borrower and the collateral. Additionally, the contractual maturity of security lending transactions are on an overnight and continuous basis. During the period ended October 31, 2020, The Bank of New York Mellon earned $38,052 from the lending of the fund’s portfolio securities, pursuant to the securities lending agreement.
(d) Affiliated issuers: Investments in other investment companies advised by the Adviser are considered “affiliated” under the Act.
(e) Risk: Investing in foreign markets may involve special risks and considerations not typically associated with investing in the U.S. These risks include revaluation of currencies, high rates of inflation, repatriation restrictions on income and capital, and adverse political, economic developments and public health conditions. Moreover, securities issued in these markets may be less liquid, subject to government ownership controls and delayed settlements, and their prices may be more volatile than those of comparable securities in the U.S. In addition, turbulence in financial markets and reduced liquidity in equity, credit and/or fixed income markets may negatively affect many issuers, which could adversely affect the fund. Global economies and financial markets are becoming increasingly interconnected, and conditions and events in one country, region or financial market may adversely impact issuers in a different country, region or financial market. These risks may be magnified if certain events or developments adversely interrupt the global supply chain; in these and other circumstances, such risks might affect companies worldwide. Recent examples include pandemic risks related to COVID-19 and aggressive measures taken world-wide in response by governments,
27
NOTES TO FINANCIAL STATEMENTS (continued)
including closing borders, restricting international and domestic travel, and the imposition of prolonged quarantines of large populations, and by businesses, including changes to operations and reducing staff. To the extent the fund may overweight its investments in certain countries, companies, industries or market sectors, such positions will increase the fund’s exposure to risk of loss from adverse developments affecting those countries, companies, industries or sectors.
The fund follows an investment policy of investing primarily in emerging market countries. Because the fund’s investments are concentrated in emerging market countries, the fund’s performance is expected to be closely tied to social, political and economic conditions within such countries and to be more volatile than the performance of more geographically diversified funds.
(f) Dividends and distributions to shareholders: Dividends and distributions are recorded on the ex-dividend date. Dividends from investment income-net and dividends from net realized capital gains, if any, are normally declared and paid annually, but the fund may make distributions on a more frequent basis to comply with the distribution requirements of the Internal Revenue Code of 1986, as amended (the “Code”). To the extent that net realized capital gains can be offset by capital loss carryovers, it is the policy of the fund not to distribute such gains. Income and capital gain distributions are determined in accordance with income tax regulations, which may differ from GAAP.
(g) Federal income taxes: It is the policy of the fund to continue to qualify as a regulated investment company, if such qualification is in the best interests of its shareholders, by complying with the applicable provisions of the Code, and to make distributions of taxable income and net realized capital gain sufficient to relieve it from substantially all federal income and excise taxes.
As of and during the period ended October 31, 2020, the fund did not have any liabilities for any uncertain tax positions. The fund recognizes interest and penalties, if any, related to uncertain tax positions as income tax expense in the Statement of Operations. During the period ended October 31, 2020, the fund did not incur any interest or penalties.
Each tax year in the four-year period ended October 31, 2020 remains subject to examination by the Internal Revenue Service and state taxing authorities.
At October 31, 2020, the components of accumulated earnings on a tax basis were as follows: undistributed ordinary income $1,599,360,
28
accumulated capital losses $38,978,409 and unrealized appreciation $130,968,593.
The fund is permitted to carry forward capital losses for an unlimited period. Furthermore, capital loss carryovers retain their character as either short-term or long-term capital losses.
The accumulated capital loss carryover is available for federal income tax purposes to be applied against future net realized capital gains, if any, realized subsequent to October 31, 2020. The fund has $15,472,585 of short-term capital losses and $23,505,824 of long-term capital losses which can be carried forward for an unlimited period.
The tax character of distributions paid to shareholders during the fiscal periods ended October 31, 2020 and October 31, 2019 were as follows: undistributed ordinary income $6,624,805 and $3,598,850, respectively.
NOTE 2—Bank Lines of Credit:
The fund participates with other long-term open-end funds managed by the Adviser in a $823.5 million unsecured credit facility led by Citibank, N.A. (the “Citibank Credit Facility”) and a $300 million unsecured credit facility provided by The Bank of New York Mellon (the “BNYM Credit Facility”), each to be utilized primarily for temporary or emergency purposes, including the financing of redemptions (each, a “Facility”). The Citibank Credit Facility is available in two tranches: (i) Tranche A is in an amount equal to $688.5 million and is available to all long-term open-ended funds, including the fund, and (ii) Tranche B is an amount equal to $135 million and is available only to BNY Mellon Floating Rate Income Fund, a series of BNY Mellon Investment Funds IV, Inc. Prior to September 30, 2020, the Citibank Credit Facility was $927 million with Tranche A available in an amount equal to $747 million and Tranche B available in an amount equal to $180 million. Prior to March 11, 2020, the Citibank Credit Facility was $1.030 billion with Tranche A available in an amount equal to $830 million and Tranche B available in an amount equal to $200 million. In connection therewith, the fund has agreed to pay its pro rata portion of commitment fees for Tranche A of the Citibank Credit Facility and the BNYM Credit Facility. Interest is charged to the fund based on rates determined pursuant to the terms of the respective Facility at the time of borrowing.
The average amount of borrowings outstanding under the Facilities during the period ended October 31, 2020 was approximately $43,989 with a related weighted average annualized interest rate of 1.20%.
29
NOTES TO FINANCIAL STATEMENTS (continued)
NOTE 3—Management Fee, Sub-Investment Advisory Fee and Other Transactions with Affiliates:
(a) Pursuant to a management agreement with the Adviser, the management fee is computed at the annual rate of .75% of the value of the fund’s average daily net assets. The Adviser has contractually agreed, from November 1, 2019 through February 28, 2021, to waive receipt of its fees and/or assume the direct expenses of the fund, so that the direct expenses of none of the classes (excluding Rule 12b-1 Distribution Plan fees, Shareholder Services Plan fees, taxes, interest expense, brokerage commissions, commitment fees on borrowings and extraordinary expenses) exceed 1.00% of the value of the fund’s average daily net assets. On or after February 28, 2021, the Adviser may terminate this expense limitation at any time. The reduction in expenses, pursuant to the undertaking amounted to $14,997 during the period ended October 31, 2020.
Pursuant to a sub-investment advisory agreement between the Adviser and the Sub-Adviser, the Sub-Adviser serves as the fund’s sub-investment adviser responsible for the day-to-day management of the fund’s portfolio. The Adviser pays the Sub Adviser a monthly fee at an annual percentage of the value of the fund’s average daily net assets. The Adviser has obtained an exemptive order from the SEC (the “Order”), upon which the fund may rely, to use a manager of managers approach that permits the Adviser, subject to certain conditions and approval by the Board, to enter into and materially amend sub-investment advisory agreements with one or more sub-investment advisers who are either unaffiliated with the Adviser or are wholly-owned subsidiaries (as defined under the Act) of the Adviser’s ultimate parent company, BNY Mellon, without obtaining shareholder approval. The Order also allows the fund to disclose the sub-investment advisory fee paid by the Adviser to any unaffiliated sub-investment adviser in the aggregate with other unaffiliated sub-investment advisers in documents filed with the SEC and provided to shareholders. In addition, pursuant to the Order, it is not necessary to disclose the sub-investment advisory fee payable by the Adviser separately to a sub-investment adviser that is a wholly-owned subsidiary of BNY Mellon in documents filed with the SEC and provided to shareholders; such fees are to be aggregated with fees payable to the Adviser. The Adviser has ultimate responsibility (subject to oversight by the Board) to supervise any sub-investment adviser and recommend the hiring, termination, and replacement of any sub-investment adviser to the Board.
30
During the period ended October 31, 2020, the Distributor retained $2,110 commissions earned on sales of the fund’s Class A shares and $160 from CDSC fees on redemptions of the fund’s Class C shares.
(b) Under the Distribution Plan adopted pursuant to Rule 12b-1 under the Act, Class C shares pay the Distributor for distributing its shares at an annual rate of .75% of the value of its average daily net assets. During the period ended October 31, 2020, Class C shares were charged $28,865 pursuant to the Distribution Plan.
(c) Under the Shareholder Services Plan, Class A and Class C shares pay the Distributor at an annual rate of .25% of the value of their average daily net assets for the provision of certain services. The services provided may include personal services relating to shareholder accounts, such as answering shareholder inquiries regarding the fund and providing reports and other information, and services related to the maintenance of shareholder accounts. The Distributor may make payments to Service Agents (securities dealers, financial institutions or other industry professionals) with respect to these services. The Distributor determines the amounts to be paid to Service Agents. During the period ended October 31, 2020, Class A and Class C shares were charged $13,176 and $9,622, respectively, pursuant to the Shareholder Services Plan.
Under its terms, the Distribution Plan and Shareholder Services Plan shall remain in effect from year to year, provided such continuance is approved annually by a vote of a majority of those Directors who are not “interested persons” of the Company and who have no direct or indirect financial interest in the operation of or in any agreement related to the Distribution Plan and Shareholder Services Plan.
The fund has an arrangement with the transfer agent whereby the fund may receive earnings credits when positive cash balances are maintained, which are used to offset transfer agency fees. For financial reporting purposes, the fund includes net earnings credits, if any, as an expense offset in the Statement of Operations.
The fund has an arrangement with the custodian whereby the fund will receive interest income or be charged an overdraft fees when cash balances are maintained. For financial reporting purposes, the fund includes this interest income and overdraft fees, if any, as interest income in the Statement of Operations.
The fund compensates BNY Mellon Transfer, Inc., a wholly-owned subsidiary of the Adviser, under a transfer agency agreement for providing transfer agency and cash management services for the fund. The majority of transfer agency fees are comprised of amounts paid on a per account
31
NOTES TO FINANCIAL STATEMENTS (continued)
basis, while cash management fees are related to fund subscriptions and redemptions. During the period ended October 31, 2020, the fund was charged $4,951 for transfer agency services. These fees are included in Shareholder servicing costs in the Statement of Operations.
The fund compensates The Bank of New York Mellon under a custody agreement for providing custodial services for the fund. These fees are determined based on net assets, geographic region and transaction activity. During the period ended October 31, 2020, the fund was charged $244,292 pursuant to the custody agreement.
During the period ended October 31, 2020, the fund was charged $14,076 for services performed by the Chief Compliance Officer and his staff. These fees are included in Chief Compliance Officer fees in the Statement of Operations.
The components of “Due to BNY Mellon Investment Adviser, Inc. and affiliates” in the Statement of Assets and Liabilities consist of: management fees of $241,914, Distribution Plan fees of $2,788, Shareholder Services Plan fees of $2,830, custodian fees of $77,000, Chief Compliance Officer fees of $4,546 and transfer agency fees of $890.
(d) Each Board member also serves as a Board member of other funds in the BNY Mellon Family of Funds complex. Annual retainer fees and attendance fees are allocated to each fund based on net assets.
(e) A 2% redemption fee is charged and retained by the fund on certain shares redeemed within sixty days following the date of issuance subject to certain exceptions, including redemptions made through use of the fund’s exchange privilege. During the period ended October 31, 2020, redemption fees charged and retained by the fund amounted to $1,764.
NOTE 4—Securities Transactions:
The aggregate amount of purchases and sales of investment securities, excluding short-term securities and Forward foreign currency exchange contracts (“forward contracts”), during the period ended October 31, 2020, amounted to $153,763,221 and $170,514,882, respectively.
Derivatives: A derivative is a financial instrument whose performance is derived from the performance of another asset. The fund enters into International Swaps and Derivatives Association, Inc. Master Agreements or similar agreements (collectively, “Master Agreements”) with its over-the-counter (“OTC”) derivative contract counterparties in order to, among other things, reduce its credit risk to counterparties. Master Agreements include provisions for general obligations, representations, collateral and events of default or termination. Under a Master Agreement,
32
the fund may offset with the counterparty certain derivative financial instruments’ payables and/or receivables with collateral held and/or posted and create one single net payment in the event of default or termination.
Each type of derivative instrument that was held by the fund during the period ended October 31, 2020 is discussed below.
Forward Foreign Currency Exchange Contracts: The fund enters into forward contracts in order to hedge its exposure to changes in foreign currency exchange rates on its foreign portfolio holdings, to settle foreign currency transactions or as a part of its investment strategy. When executing forward contracts, the fund is obligated to buy or sell a foreign currency at a specified rate on a certain date in the future. With respect to sales of forward contracts, the fund incurs a loss if the value of the contract increases between the date the forward contract is opened and the date the forward contract is closed. The fund realizes a gain if the value of the contract decreases between those dates. With respect to purchases of forward contracts, the fund incurs a loss if the value of the contract decreases between the date the forward contract is opened and the date the forward contract is closed. The fund realizes a gain if the value of the contract increases between those dates. Any realized or unrealized gains or losses which occurred during the period are reflected in the Statement of Operations. The fund is exposed to foreign currency risk as a result of changes in value of underlying financial instruments. The fund is also exposed to credit risk associated with counterparty nonperformance on these forward contracts, which is generally limited to the unrealized gain on each open contract. This risk may be mitigated by Master Agreements, if any, between the fund and the counterparty and the posting of collateral, if any, by the counterparty to the fund to cover the fund’s exposure to the counterparty. At October 31, 2020, there were no forward contracts outstanding.
The following summarizes the average market value of derivatives outstanding during the period ended October 31, 2020:
| | | |
| | Average Market Value ($) |
Forward contracts | | 98,622 |
| | |
At October 31, 2020, the cost of investments for federal income tax purposes was $247,930,132; accordingly, accumulated net unrealized appreciation on investments was $130,960,545, consisting of $146,005,403 gross unrealized appreciation and $15,044,858 gross unrealized depreciation.
33
REPORT OF INDEPENDENT REGISTERED PUBLIC ACCOUNTING FIRM
To the Shareholders of the Fund and Board of Directors of
BNY Mellon Investment Funds II, Inc.:
Opinion on the Financial Statements
We have audited the accompanying statement of assets and liabilities of BNY Mellon Global Emerging Markets Fund (the “Fund”), a series of BNY Mellon Investment Funds II, Inc., including the statement of investments, as of October 31, 2020, and the statement of investments in affiliated issuers as of and for the year then ended, the related statement of operations for the year then ended, the statements of changes in net assets for each of the years in the two-year period then ended, and the related notes (collectively, the financial statements), and the financial highlights for each of the years in the five-year period then ended. In our opinion, the financial statements and financial highlights present fairly, in all material respects, the financial position of the Fund as of October 31, 2020, the results of its operations for the year then ended, the changes in its net assets for each of the years in the two-year period then ended, and the financial highlights for each of the years in the five-year period then ended, in conformity with U.S. generally accepted accounting principles.
Basis for Opinion
These financial statements and financial highlights are the responsibility of the Fund’s management. Our responsibility is to express an opinion on these financial statements and financial highlights based on our audits. We are a public accounting firm registered with the Public Company Accounting Oversight Board (United States) (PCAOB) and are required to be independent with respect to the Fund in accordance with the U.S. federal securities laws and the applicable rules and regulations of the Securities and Exchange Commission and the PCAOB.
We conducted our audits in accordance with the standards of the PCAOB. Those standards require that we plan and perform the audit to obtain reasonable assurance about whether the financial statements and financial highlights are free of material misstatement, whether due to error or fraud. Our audits included performing procedures to assess the risks of material misstatement of the financial statements and financial highlights, whether due to error or fraud, and performing procedures that respond to those risks. Such procedures included examining, on a test basis, evidence regarding the amounts and disclosures in the financial statements and financial highlights. Such procedures also included confirmation of securities owned as of October 31, 2020, by correspondence with the custodian and brokers or by other appropriate auditing procedures when replies from brokers were not received. Our audits also included evaluating the accounting principles used and significant estimates made by management, as well as evaluating the overall presentation of the financial statements and financial highlights. We believe that our audits provide a reasonable basis for our opinion.

We have served as the auditor of one or more BNY Mellon Investment Adviser, Inc. investment companies since 1994.
New York, New York
December 18, 2020
34
IMPORTANT TAX INFORMATION (Unaudited)
For federal tax purposes, the fund elects to provide each shareholder with their portion of the fund’s income sourced from foreign countries and taxes paid from foreign countries. The fund reports the maximum amount allowable but not less than $2,346,144 as income sourced from foreign countries for the fiscal year ended October 31, 2020 in accordance with Section 853(c)(2) of the Internal Revenue Code and also the fund reports the maximum amount allowable but not less than $174,944 as taxes paid from foreign countries for the fiscal year ended October 31, 2020 in accordance with Section 853(a) of the Internal Revenue Code. Where required by federal tax rules, shareholders will receive notification of their proportionate share of foreign sourced income and foreign taxes paid for the 2020 calendar year with Form 1099-DIV which will be mailed in early 2021. Also, the fund designates the maximum amount allowable, but not less than $6,739,948 as ordinary income dividends paid during the fiscal year ended October 31, 2020 as qualified dividend income in accordance with Section 854(b)(1)(B) of the Internal Revenue Code.
35
BOARD MEMBERS INFORMATION (Unaudited)
INDEPENDENT BOARD MEMBERS
Joseph S. DiMartino (77)
Chairman of the Board (1999)
Principal Occupation During Past 5 Years:
· Director or Trustee of funds in the BNY Mellon Family of Funds and certain other entities (as described in the fund’s Statement of Additional Information) (1995-Present)
Other Public Company Board Memberships During Past 5 Years:
· CBIZ, Inc., a public company providing professional business services, products and solutions, Director (1997-Present)
No. of Portfolios for which Board Member Serves: 110
———————
Francine J. Bovich (69)
Board Member (2012)
Principal Occupation During Past 5 Years:
· Trustee, The Bradley Trusts, private trust funds (2011-Present)
Other Public Company Board Memberships During Past 5 Years:
· Annaly Capital Management, Inc., a real estate investment trust, Director (2014-Present)
No. of Portfolios for which Board Member Serves: 67
———————
Andrew J. Donohue (70)
Board Member (2019)
Principal Occupation During Past 5 Years:
· Of Counsel, Shearman & Sterling LLP (2017-2019)
· Chief of Staff to the Chair of the SEC (2015-2017)
· Managing Director and Investment Company General Counsel of Goldman Sachs (2012-2015)
Other Public Company Board Memberships During Past 5 Years:
· Oppenheimer Funds (58 funds), Director (2017-2019)
No. of Portfolios for which Board Member Serves: 53
———————
36
Kenneth A. Himmel (74)
Board Member (1994)
Principal Occupation During Past 5 Years:
· Managing Partner, Gulf Related, an international real estate development company (2010-Present)
· President and CEO, Related Urban Development, a real estate development company (1996-Present)
· CEO, American Food Management, a restaurant company (1983-Present)
· President and CEO, Himmel & Company, a real estate development company (1980-Present)
No. of Portfolios for which Board Member Serves: 22
———————
Stephen J. Lockwood (73)
Board Member (1994)
Principal Occupation During Past 5 Years:
· Chairman of the Board, Stephen J. Lockwood and Company LLC, a real estate investment company (2000-Present)
No. of Portfolios for which Board Member Serves: 22
———————
Roslyn M. Watson (71)
Board Member (1994)
Principal Occupation During Past 5 Years:
· Principal, Watson Ventures, Inc., a real estate investment company (1993-Present)
Other Public Company Board Memberships During Past 5 Years:
· American Express Bank, FSB, Director (1993-2018)
No. of Portfolios for which Board Member Serves: 53
———————
37
BOARD MEMBERS INFORMATION (Unaudited) (continued)
INDEPENDENT BOARD MEMBERS (continued)
Benaree Pratt Wiley (74)
Board Member (1998)
Principal Occupation During Past 5 Years:
· Principal, The Wiley Group, a firm specializing in strategy and business development (2005-Present)
Other Public Company Board Memberships During Past 5 Years:
· CBIZ, Inc., a public company providing professional business services, products and solutions, Director (2008-Present)
· Blue Cross-Blue Shield of Massachusetts, Director (2004-Present)
No. of Portfolios for which Board Member Serves: 71
———————
Once elected all Board Members serve for an indefinite term, but achieve Emeritus status upon reaching age 80. The address of the Board Members and Officers is c/o BNY Mellon Investment Adviser, Inc. 240 Greenwich Street, New York, New York 10286. Additional information about the Board Members is available in the fund’s Statement of Additional Information which can be obtained from the Adviser free of charge by calling this toll free number: 1-800-373-9387.
James M. Fitzgibbons, Emeritus Board Member
38
OFFICERS OF THE FUND (Unaudited)
RENEE LAROCHE-MORRIS, President since May 2019.
President and a director of BNY Mellon Investment Adviser, Inc. since January 2018. She is an officer of 61 investment companies (comprised of 110 portfolios) managed by the Adviser. She is 49 years old and has been an employee of BNY Mellon since 2003.
JAMES WINDELS, Treasurer since November 2001.
Director-BNY Mellon Fund Administration, and an officer of 63 investment companies (comprised of 141 portfolios) managed by the Adviser or an affiliate of the Adviser. He is 62 years old and has been an employee of the Adviser since April 1985.
BENNETT A. MACDOUGALL, Chief Legal Officer since October 2015.
Chief Legal Officer of the Adviser and Associate General Counsel and Managing Director of BNY Mellon since June 2015; Director and Associate General Counsel of Deutsche Bank–Asset & Wealth Management Division from June 2005 to June 2015, and as Chief Legal Officer of Deutsche Investment Management Americas Inc. from June 2012 to May 2015. He is an officer of 63 investment companies (comprised of 141 portfolios) managed by the Adviser or an affiliate of the Adviser. He is 49 years old and has been an employee of the Adviser since June 2015.
DAVID DIPETRILLO, Vice President since May 2019.
Head of North America Product, BNY Mellon Investment Management since January 2018, Director of Product Strategy, BNY Mellon Investment Management from January 2016 to December 2017; Head of US Retail Product and Channel Marketing, BNY Mellon Investment Management from January 2014 to December 2015. He is an officer of 62 investment companies (comprised of 118 portfolios) managed by the Adviser or an affiliate of the Adviser. He is 42 years old and has been an employee of BNY Mellon since 2005.
JAMES BITETTO, Vice President since August 2005 and Secretary since February 2018.
Senior Managing Counsel of BNY Mellon since December 2019; Managing Counsel of BNY Mellon from April 2014 to December 2019; Secretary of the Adviser, and an officer of 63 investment companies (comprised of 141 portfolios) managed by the Adviser or an affiliate of the Adviser. He is 54 years old and has been an employee of the Adviser since December 1996.
SONALEE CROSS, Vice President and Assistant Secretary since March 2018.
Counsel of BNY Mellon since October 2016; Associate at Proskauer Rose LLP from April 2016 to September 2016; Attorney at EnTrust Capital from August 2015 to February 2016; Associate at Sidley Austin LLP from September 2013 to August 2015. She is an officer of 63 investment companies (comprised of 141 portfolios) managed by the Adviser or an affiliate of the Adviser. She is 33 years old and has been an employee of the Adviser since October 2016.
DEIRDRE CUNNANE, Vice President and Assistant Secretary since March 2019.
Counsel of BNY Mellon since August 2018; Senior Regulatory Specialist at BNY Mellon Investment Management Services from February 2016 to August 2018; Trustee Associate at BNY Mellon Trust Company (Ireland) Limited from August 2013 to February 2016. She is an officer of 63 investment companies (comprised of 141 portfolios) managed by the Adviser or an affiliate of the Adviser. She is 30 years old and has been an employee of the Adviser since August 2018.
SARAH S. KELLEHER, Vice President and Assistant Secretary since April 2014.
Managing Counsel of BNY Mellon since December 2017, Senior Counsel of BNY Mellon from March 2013 to December 2017. She is an officer of 63 investment companies (comprised of 141 portfolios) managed by the Adviser or an affiliate of the Adviser. She is 45 years old and has been an employee of the Adviser since March 2013.
JEFF PRUSNOFSKY, Vice President and Assistant Secretary since August 2005.
Senior Managing Counsel of BNY Mellon, and an officer of 63 investment companies (comprised of 141 portfolios) managed by the Adviser or an affiliate of the Adviser. He is 55 years old and has been an employee of the Adviser since October 1990.
AMANDA QUINN, Vice President and Assistant Secretary since March 2020.
Counsel of BNY Mellon since June 2019; Regulatory Administration Manager at BNY Mellon Investment Management Services from September 2018 to May 2019; Senior Regulatory Specialist at BNY Mellon Investment Management Services from April 2015 to August 2018. She is an officer of 63 investment companies (comprised of 141 portfolios) managed by the Adviser or an affiliate of the Adviser. She is 35 years old and has been an employee of the Adviser since June 2019.
39
OFFICERS OF THE FUND (Unaudited) (continued)
PETER M. SULLIVAN, Vice President and Assistant Secretary since March 2019.
Managing Counsel of BNY Mellon since March 2009, Senior Counsel of BNY Mellon from April 2004 to March 2009, and an officer of 63 investment companies (comprised of 141 portfolios) managed by the Adviser or an affiliate of the Adviser. He is 52 years old and has been an employee of the Adviser since January 2019.
NATALYA ZELENSKY, Vice President and Assistant Secretary since March 2017.
Managing Counsel of BNY Mellon since December 2019; Counsel of BNY Mellon from May 2016 to December 2019; Attorney at Wildermuth Endowment Strategy Fund/Wildermuth Advisory, LLC from November 2015 to May 2016 and Assistant General Counsel at RCS Advisory Services from July 2014 to November 2015. She is an officer of 63 investment companies (comprised of 141 portfolios) managed by the Adviser or an affiliate of the Adviser. She is 35 years old and has been an employee of the Adviser since May 2016.
GAVIN C. REILLY, Assistant Treasurer since December 2005.
Tax Manager-BNY Mellon Fund Administration, and an officer of 63 investment companies (comprised of 141 portfolios) managed by the Adviser or an affiliate of the Adviser. He is 52 years old and has been an employee of the Adviser since April 1991.
ROBERT S. ROBOL, Assistant Treasurer since December 2002.
Senior Accounting Manager-BNY Mellon Fund Administration, and an officer of 63 investment companies (comprised of 141 portfolios) managed by the Adviser or an affiliate of the Adviser. He is 56 years old and has been an employee of the Adviser since October 1988.
ROBERT SALVIOLO, Assistant Treasurer since July 2007.
Senior Accounting Manager–BNY Mellon Fund Administration, and an officer of 63 investment companies (comprised of 141 portfolios) managed by the Adviser or an affiliate of the Adviser. He is 53 years old and has been an employee of the Adviser since June 1989.
ROBERT SVAGNA, Assistant Treasurer since December 2002.
Senior Accounting Manager–BNY Mellon Fund Administration, and an officer of 63 investment companies (comprised of 141 portfolios) managed by the Adviser or an affiliate of the Adviser. He is 53 years old and has been an employee of the Adviser since November 1990.
JOSEPH W. CONNOLLY, Chief Compliance Officer since October 2004.
Chief Compliance Officer of the Adviser, the BNY Mellon Family of Funds and BNY Mellon Funds Trust (62 investment companies, comprised of 133 portfolios). He is 63 years old and has served in various capacities with the Adviser since 1980, including manager of the firm’s Fund Accounting Department from 1997 through October 2001.
CARIDAD M. CAROSELLA, Anti-Money Laundering Compliance Officer since January 2016.
Anti-Money Laundering Compliance Officer of the BNY Mellon Family of Funds and BNY Mellon Funds Trust since January 2016; from May 2015 to December 2015, Interim Anti-Money Laundering Compliance Officer of the BNY Mellon Family of Funds and BNY Mellon Funds Trust and the Distributor; from January 2012 to May 2015, AML Surveillance Officer of the Distributor. She is an officer of 56 investment companies (comprised of 134 portfolios) managed by the Adviser or an affiliate of the Adviser. She is 52 years old and has been an employee of the Distributor since 1997.
40
This page intentionally left blank.
41
BNY Mellon Global Emerging Markets Fund
240 Greenwich Street
New York, NY 10286
Adviser
BNY Mellon Investment Adviser, Inc.
240 Greenwich Street
New York, NY 10286
Sub-Adviser
Newton Investment Management Limited
160 Queen Victoria Street,
London, EC4V, 4LA, UK
Custodian
The Bank of New York Mellon
240 Greenwich Street
New York, NY 10286
Transfer Agent &
Dividend Disbursing Agent
BNY Mellon Transfer, Inc.
240 Greenwich Street
New York, NY 10286
Distributor
BNY Mellon Securities Corporation
240 Greenwich Street
New York, NY 10286
| | |
Ticker Symbols: | Class A: DGEAX Class C: DGECX Class I: DGIEX Class Y: DGEYX |
Telephone Call your financial representative or 1-800-373-9387
Mail The BNY Mellon Family of Funds, 144 Glenn Curtiss Boulevard, Uniondale, NY 11556-0144
E-mail Send your request to info@bnymellon.com
Internet Information can be viewed online or downloaded at www.bnymellonim.com/us
The fund files its complete schedule of portfolio holdings with the Securities and Exchange Commission (“SEC”) for the first and third quarters of each fiscal year on Form N-PORT. The fund’s Forms N-PORT are available on the SEC’s website at www.sec.gov.
A description of the policies and procedures that the fund uses to determine how to vote proxies relating to portfolio securities and information regarding how the fund voted these proxies for the most recent 12-month period ended June 30 is available at www.bnymellonim.com/us and on the SEC’s website at www.sec.gov and without charge, upon request, by calling 1-800-373-9387.
| | |
© 2020 BNY Mellon Securities Corporation
6243AR1020 | 
|
BNY Mellon Yield Enhancement Strategy Fund
| |
ANNUAL REPORT October 31, 2020 |
| |
Save time. Save paper. View your next shareholder report online as soon as it’s available. Log into www.bnymellonim.com/us and sign up for eCommunications. It’s simple and only takes a few minutes. |
| |
The views expressed in this report reflect those of the portfolio manager(s) only through the end of the period covered and do not necessarily represent the views of BNY Mellon Investment Adviser, Inc. or any other person in the BNY Mellon Investment Adviser, Inc. organization. Any such views are subject to change at any time based upon market or other conditions and BNY Mellon Investment Adviser, Inc. disclaims any responsibility to update such views. These views may not be relied on as investment advice and, because investment decisions for a fund in the BNY Mellon Family of Funds are based on numerous factors, may not be relied on as an indication of trading intent on behalf of any fund in the BNY Mellon Family of Funds. |
| |
Not FDIC-Insured • Not Bank-Guaranteed • May Lose Value |
Contents
THE FUND
FOR MORE INFORMATION
Back Cover
| | | | |
| |
BNY Mellon Yield Enhancement Strategy Fund
| | The Fund |
A LETTER FROM THE PRESIDENT OF BNY MELLON INVESTMENT ADVISER, INC.
Dear Shareholder:
We are pleased to present this annual report for BNY Mellon Yield Enhancement Strategy Fund, covering the 12-month period from November 1, 2019 through October 31, 2020. For information about how the fund performed during the reporting period, as well as general market perspectives, we provide a Discussion of Fund Performance on the pages that follow.
Accommodative rate policies from the U.S. Federal Reserve (the “Fed”) and progress towards a U.S./China trade deal stoked optimism about future economic growth prospects the final months of 2019, fueling an equity rally. As we entered 2020, optimism turned to concern as COVID-19 began to spread across portions of Asia and Europe. When the virus reached the U.S. in March 2020, stocks became volatile. U.S. equities posted historic losses during the month due to investor concern over the economic impact of a widespread quarantine. Global central banks and governments launched emergency stimulus measures to support their respective economies, and equity valuations began to rebound, trending upward until the fall. Volatility returned in September 2020 and continued through October, as concerns over rising COVID-19 infection rates, continued trade tensions, the U.S. Congress’ failure to pass additional financial assistance and anxiety over the upcoming U.S. election constrained equity valuations.
In fixed-income markets, interest rates were heavily influenced by changes in Fed policy and investor concern over COVID-19. In 2019, as stocks rallied in response to Fed rate cuts, risk-asset valuations also rose while Treasuries lagged. When COVID-19 began to emerge, a flight to quality ensued, and Treasury rates fell significantly. The Fed cut rates twice in March 2020, resulting in an overnight lending target rate of nearly zero, and the government launched a large stimulus package. Risk-asset prices began to rebound, and bond indices generally rose until September 2020, when investment-grade instrument prices stalled. Yields in the intermediate and long portions of the Treasury curve rose during October, further constraining bond prices.
We believe the near-term outlook for the U.S. will be challenging, as the country continues to battle COVID-19. As always, we will monitor relevant data for meaningful developments. We encourage you to discuss the risks and opportunities in today’s investment environment with your financial advisor.
Thank you for your continued confidence and support.
Sincerely,

Renee LaRoche-Morris
President
BNY Mellon Investment Adviser, Inc.
November 16, 2020
2
DISCUSSION OF FUND PERFORMANCE (Unaudited)
For the period from November 1, 2019 through October 31, 2020, as provided by Jeffrey M. Mortimer, CFA, and Caroline Lee-Tsao, Portfolio Managers
Market and Fund Performance Overview
For the 12-month period ended October 31, 2020, the BNY Mellon Yield Enhancement Strategy Fund Class A shares produced a total return of 1.75%, Class C shares returned 1.10%, Class I shares returned 2.13%, and Class Y shares returned 2.18%.1 In comparison, the Lipper Alternative Credit Focus Funds Index (the “Index”) produced a total return of 0.48% for the same period, and the Bloomberg Barclays U.S. Aggregate Bond Index (the “Barclays Agg Index”) produced a total return of 6.19% for the same period.2
Bonds generally produced positive results over the reporting period, due in part to falling rates and accommodative central bank policies. The fund outperformed the Index, due largely to manager allocation decisions, particularly allocations to corporate and municipal bonds.
The Fund’s Investment Approach
The fund seeks high current income. To pursue its goal, it normally allocates its assets across fixed-income investment strategies. The fund is designed to complement and diversify traditional bond portfolios. The fund normally allocates its assets among other investment companies (underlying funds) that employ various fixed-income investment strategies, including those focusing on domestic and foreign corporate bonds, high yield securities (“junk” bonds), senior loans, emerging-market debt, municipal securities and Treasury inflation-protected securities (TIPS).
BNY Mellon Investment Adviser, Inc. determines the fund’s asset allocation to the fixed-income investment strategies and sets the investment ranges using fundamental and quantitative analysis, and its economic and financial markets outlook. Underlying funds are selected based on their investment objectives and management policies, investment strategies and portfolio holdings, risk/reward profiles, historical performance and other factors. As of October 31, 2020, the fund held investments in: BNY Mellon Corporate Bond Fund, BNY Mellon Municipal Opportunities Fund, BNY Mellon Floating Rate Income Fund, BNY Mellon High Yield Fund, BNY Mellon Global Dynamic Bond Income Fund and TCW Emerging Markets Income Fund.
COVID-19 and Central Bank Activity Drives Markets
It was an eventful 12 months for fixed-income markets. The period started out with an optimistic tone, with clarity around Brexit and a possible resolution to the U.S./China trade disagreement on the horizon. Investors were looking forward to a new calendar year filled with higher economic growth rates and continued expansion. Emerging-market economies had begun to stabilize after being disrupted by trade disputes. Risk asset spreads were tight through the middle of February 2020. However, the tone changed as COVID-19 wreaked havoc globally, causing a dramatic decline in economic activity and consequent increase in corporate and emerging-market bond spreads.
3
DISCUSSION OF FUND PERFORMANCE (Unaudited) (continued)
Liquidity tightened in March 2020. Spreads widened, affecting even some high-quality positions. The adverse impact was compounded by an oil price collapse as a result of disagreement between OPEC member Saudi Arabia and Russia. There was a partial recovery in riskier bonds in April 2020, as massive monetary and fiscal responses were unleashed by governments and central banks. The European Central Bank expanded their bond buying program to provide more assistance to countries on the European periphery.
Risk assets rallied in response to central bank intervention. Investor sentiment also improved as COVID-19 infection rates fell during the summer, and lockdown measures eased, allowing economic activity to pick up in some parts of the world. Emerging-market sovereign debt and some high yield debt recovered some of the ground lost in March. Spreads generally continued to tighten through much of the period, and many fixed-income instruments posted gains through the end of the 12 months, despite pockets of volatility in September 2020. In October 2020, the U.S. Treasury yield curve steepened, dampening the momentum of rising bond valuations across many areas of the market.
Manager Allocation Decisions Buoy Fund Results
The fund’s performance compared to the Index was helped during the reporting period primarily by manager allocation decisions. Several asset classes, such as corporate and municipal bonds, outperformed the fund’s overall Index. Allocations to these asset classes helped total fund performance, even though the individual strategies themselves underperformed their respective benchmarks by a modest amount. The fund’s allocations to the BNY Mellon Corporate Bond Fund and the BNY Mellon Municipal Opportunities Fund were beneficial to overall fund performance for this very reason. The BNY Mellon Global Dynamic Bond Income Fund beat its individual benchmark as well as the fund’s overall Index, also aiding absolute and relative performance.
Conversely, manager selection decisions constrained the fund’s relative results. The TCW Emerging Markets Income Fund detracted from returns on an absolute and relative basis. The strategy not only trailed its respective benchmark, but also posted a mildly negative return for the period. The BNY Mellon Floating Rate Income Fund and BNY Mellon High Yield Fund posted positive absolute returns but trailed their respective benchmarks during the 12 months.
Anticipating Continued Accommodation
We believe the economic backdrop provided by accommodative central bank policies will continue to be supportive of yields and the asset classes within our fund. We think interest rates will remain low for the foreseeable future. It is our opinion that both corporate and high yield spreads continue to be historically tight. As such, we think there might not be much to gain in those spread sectors from a capital appreciation standpoint, but still believe they can provide benefit due to the higher coupons they offer.
4
We think this fund continues to offer exposure to a wide array of asset classes, and provides investors yield over a broad range of global bond indices. We believe we are well positioned for the current environment from an asset allocation standpoint.
November 16, 2020
1 Total return includes reinvestment of dividends and any capital gains paid and does not take into consideration the maximum initial sales charge in the case of Class A shares, or the applicable contingent deferred sales charge imposed on redemptions in the case of Class C shares. Had these charges been reflected, returns would have been lower. Class I and Class Y shares are not subject to any initial or deferred sales charges. Share price, yield and investment return fluctuate such that upon redemption, fund shares may be worth more or less than their original cost. Past performance is no guarantee of future results.
2 Source: Lipper Inc. — The Bloomberg Barclays U.S. Aggregate Bond Index is a broad-based, flagship benchmark that measures the investment-grade, U.S. dollar-denominated, fixed-rate, taxable bond market. The index includes Treasuries, government-related and corporate securities, MBS (agency fixed-rate and hybrid ARM pass-throughs), ABS and CMBS (agency and non-agency). The Lipper Alternative Credit Focus Funds Index consists of funds that, by prospectus language, invest in a wide range of credit-structured vehicles by using either fundamental credit research analysis or quantitative credit portfolio modeling trying to benefit from any changes in credit quality, credit spreads and market liquidity. Investors cannot invest directly in any index.
Bonds are subject generally to interest-rate, credit, liquidity and market risks, to varying degrees, all of which are more fully described in the fund’s prospectus. Generally, all other factors being equal, bond prices are inversely related to interest-rate changes, and rate increases can cause price declines. Municipal income may be subject to state and local taxes. Some income may be subject to the federal alternative minimum tax for certain investors. Capital gains, if any, are taxable. Inflation-linked bonds (ILBs) issued by a government are fixed-income securities whose principal value is periodically adjusted according to the rate of inflation; ILBs decline in value when real interest rates rise. Treasury Inflation-Protected Securities (TIPS) are ILBs issued by the U.S. Government.
Recent market risks include pandemic risks related to COVID-19. The effects of COVID-19 have contributed to increased volatility in global markets and will likely affect certain countries, companies, industries and market sectors more dramatically than others. To the extent the fund may overweight its investments in certain countries, companies, industries or market sectors, such positions will increase the fund’s exposure to risk of loss from adverse developments affecting those countries, companies, industries or sectors.
High yield bonds are subject to increased credit risk and are considered speculative in terms of the issuer’s perceived ability to continue making interest payments on a timely basis and to repay principal upon maturity.
Foreign bonds are subject to special risks, including exposure to currency fluctuations, changing political and economic conditions, and potentially less liquidity. These risks are generally greater with emerging-market countries than with more economically and politically established foreign countries.
Investments in foreign currencies are subject to the risk that those currencies will decline in value relative to the U.S. dollar, or, in the case of hedged positions, that the U.S. dollar will decline relative to the currency being hedged. Currency rates in foreign countries may fluctuate significantly over short periods of time. A decline in the value of foreign currencies relative to the U.S. dollar will reduce the value of securities held by the fund and denominated in those currencies. The use of leverage may magnify the fund’s gains or losses. For derivatives with a leveraging component, adverse changes in the value or level of the underlying asset can result in a loss that is much greater than the original investment in the derivative.
The underlying funds’ underlying strategies may use derivative instruments. A small investment in derivatives could have a potentially large impact on the fund’s performance. The use of derivatives involves risks different from, or possibly greater than, the risks associated with investing directly in the underlying assets.
The ability of the fund to achieve its investment goal depends, in part, on the ability of BNY Mellon Investment Adviser, Inc. to effectively allocate the fund’s assets among the investment strategies and the underlying funds.
5
FUND PERFORMANCE (Unaudited)
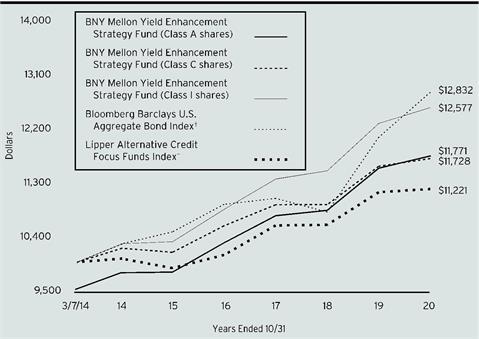
Comparison of change in value of a $10,000 investment in Class A shares, Class C shares and Class I shares of BNY Mellon Yield Enhancement Strategy Fund with a hypothetical investment of $10,000 in the Bloomberg Barclays U.S. Aggregate Bond Index and Lipper Alternative Credit Focus Funds Index
† Source: Lipper Inc.
Past performance is not predictive of future performance.
The above graph compares a hypothetical $10,000 investment made in each of the Class A shares, Class C shares and Class I shares of BNY Mellon Yield Enhancement Strategy Fund on 3/7/14 (inception date) to a hypothetical investment of $10,000 made in the Bloomberg Barclays U.S. Aggregate Bond Index and Lipper Alternative Credit Focus Funds Index on that date. All dividends and capital gain distributions are reinvested.
The fund’s performance shown in the line graph above takes into account the maximum initial sales charge on Class A shares and all other applicable fees and expenses on Class A shares, Class C shares and Class I shares. The Bloomberg Barclays U.S. Aggregate Bond Index is a broad-based flagship benchmark that measures the investment-grade, U.S. dollar-denominated, fixed-rate taxable bond market. The Index includes Treasuries, government-related and corporate securities, MBS (agency fixed-rate and hybrid ARM pass-throughs), ABS and CMBS (agency and nonagency). The Lipper Alternative Credit Focus Funds Index consists of funds that, by prospectus language, invest in a wide range of credit-structured vehicles by using either fundamental credit research analysis or quantitative credit portfolio modeling trying to benefit from any changes in credit quality, credit spreads, and market liquidity. Unlike a mutual fund, the indices are not subject to charges, fees and other expenses. Investors cannot invest directly in any index. Further information relating to fund performance, including expense reimbursements, if applicable, is contained in the Financial Highlights section of the prospectus and elsewhere in this report.
6

Comparison of change in value of a $1,000,000 investment in Class Y shares of BNY Mellon Yield Enhancement Strategy Fund with a hypothetical investment of $1,000,000 in the Bloomberg Barclays U.S. Aggregate Bond Index and Lipper Alternative Credit Focus Funds Index
† Source: Lipper Inc.
Past performance is not predictive of future performance.
The above graph compares a hypothetical $1,000,000 investment made in Class Y shares of BNY Mellon Yield Enhancement Strategy Fund on 3/7/14 (inception date) to a hypothetical investment of $1,000,000 made in the Bloomberg Barclays U.S. Aggregate Bond Index and Lipper Alternative Credit Focus Funds Index on that date. All dividends and capital gain distributions are reinvested.
The fund’s performance shown in the line graph above takes into account all applicable fees and expenses of the fund’s Class Y shares. The Bloomberg Barclays U.S. Aggregate Bond Index is a broad-based flagship benchmark that measures the investment-grade, U.S. dollar-denominated, fixed-rate taxable bond market. The Index includes Treasuries, government-related and corporate securities, MBS (agency fixed-rate and hybrid ARM pass-throughs), ABS and CMBS (agency and nonagency). The Lipper Alternative Credit Focus Funds Index consists of funds that, by prospectus language, invest in a wide range of credit-structured vehicles by using either fundamental credit research analysis or quantitative credit portfolio modeling trying to benefit from any changes in credit quality, credit spreads, and market liquidity. Unlike a mutual fund, the indices are not subject to charges, fees and other expenses. Investors cannot invest directly in any index. Further information relating to fund performance, including expense reimbursements, if applicable, is contained in the Financial Highlights section of the prospectus and elsewhere in this report.
7
FUND PERFORMANCE (Unaudited) (continued)
| | | | | | | |
Average Annual Total Returns as of 10/31/2020 | | |
| Inception
Date | 1 Year | 5 Year | From
Inception |
Class A shares | | | | | |
with maximum sales charge (4.50%) | 3/7/14 | -2.83% | 2.70% | 2.48% | |
without sales charge | 3/7/14 | 1.75% | 3.66% | 3.20% | |
Class C shares | | | | | |
with applicable redemption charge † | 3/7/14 | 0.12% | 2.90% | 2.43% | |
without redemption | 3/7/14 | 1.10% | 2.90% | 2.43% | |
Class I shares | 3/7/14 | 2.13% | 3.99% | 3.51% | |
Class Y shares | 3/7/14 | 2.18% | 4.06% | 3.56% | |
Bloomberg Barclays U.S.
Aggregate Bond Index | 2/28/14 | 6.19% | 4.08% | 3.81% | †† |
Lipper Alternative
Credit Focus Funds Index | 2/28/14 | 0.48% | 2.53% | 1.74% | †† |
† The maximum contingent deferred sales charge for Class C shares is 1% for shares redeemed within one year of the date of purchase.
†† For comparative purposes, the value of each index on 2/28/14 is used as the beginning value on 3/7/14.
The performance data quoted represents past performance, which is no guarantee of future results. Share price and investment return fluctuate and an investor’s shares may be worth more or less than original cost upon redemption. Current performance may be lower or higher than the performance quoted. Go to www.bnymellonim.com/us for the fund’s most recent month-end returns.
The fund’s performance shown in the graphs and table does not reflect the deduction of taxes that a shareholder would pay on fund distributions or the redemption of fund shares. In addition to the performance of Class A shares shown with and without a maximum sales charge, the fund’s performance shown in the table takes into account all other applicable fees and expenses on all classes.
8
UNDERSTANDING YOUR FUND’S EXPENSES (Unaudited)
As a mutual fund investor, you pay ongoing expenses, such as management fees and other expenses. Using the information below, you can estimate how these expenses affect your investment and compare them with the expenses of other funds. You also may pay one-time transaction expenses, including sales charges (loads) and redemption fees, which are not shown in this section and would have resulted in higher total expenses. For more information, see your fund’s prospectus or talk to your financial adviser.
Review your fund’s expenses
The table below shows the expenses you would have paid on a $1,000 investment in BNY Mellon Yield Enhancement Strategy Fund from May 1, 2020 to October 31, 2020. It also shows how much a $1,000 investment would be worth at the close of the period, assuming actual returns and expenses.
| | | | | | | |
Expenses and Value of a $1,000 Investment | |
Assume actual returns for the six months ended October 31, 2020 | |
| | | | | | |
| | Class A | Class C | Class I | Class Y | |
Expense paid per $1,000† | $2.62 | $5.90 | $.52 | $.42 | |
Ending value (after expenses) | $1,081.60 | $1,077.30 | $1,083.40 | $1,083.70 | |
COMPARING YOUR FUND’S EXPENSES
WITH THOSE OF OTHER FUNDS (Unaudited)
Using the SEC’s method to compare expenses
The Securities and Exchange Commission (“SEC”) has established guidelines to help investors assess fund expenses. Per these guidelines, the table below shows your fund’s expenses based on a $1,000 investment, assuming a hypothetical 5% annualized return. You can use this information to compare the ongoing expenses (but not transaction expenses or total cost) of investing in the fund with those of other funds. All mutual fund shareholder reports will provide this information to help you make this comparison. Please note that you cannot use this information to estimate your actual ending account balance and expenses paid during the period.
| | | | | | | |
Expenses and Value of a $1,000 Investment | |
Assuming a hypothetical 5% annualized return for the six months ended October 31, 2020 | |
| | | | | | |
| | Class A | Class C | Class I | Class Y | |
Expense paid per $1,000† | $2.54 | $5.74 | $.51 | $.41 | |
Ending value (after expenses) | $1,022.62 | $1,019.46 | $1,024.63 | $1,024.73 | |
† Expenses are equal to the fund’s annualized expense ratio of .50% for Class A, 1.13% for Class C, .10% for Class I and .08% for Class Y, multiplied by the average account value over the period, multiplied by 184/366 (to reflect the one-half year period). |
9
STATEMENT OF INVESTMENTS
October 31, 2020
| | | | | | | | |
| |
Description | | | | Shares | | Value ($) | |
Investment Companies - 99.6% | | | | | |
Domestic Fixed Income - 48.4% | | | | | |
BNY Mellon Corporate Bond Fund, Cl. M | | | | 2,679,213 | a | 36,490,879 | |
BNY Mellon Floating Rate Income Fund, Cl. Y | | | | 6,896,530 | a | 76,413,553 | |
BNY Mellon High Yield Fund, Cl. I | | | | 7,478,224 | a | 44,196,304 | |
| | | | | 157,100,736 | |
Foreign Fixed Income - 12.7% | | | | | |
BNY Mellon Global Dynamic Bond Income Fund, Cl. Y | | | | 2,446,167 | a | 30,356,927 | |
TCW Emerging Markets Income Fund, Cl. I | | | | 1,357,397 | | 10,764,162 | |
| | | | | 41,121,089 | |
Municipal Bond - 38.5% | | | | | |
BNY Mellon Municipal Opportunities Fund, Cl. M | | | | 9,319,716 | a | 124,977,388 | |
Total Investments (cost $320,533,984) | | 99.6% | | 323,199,213 | |
Cash and Receivables (Net) | | .4% | | 1,396,227 | |
Net Assets | | 100.0% | | 324,595,440 | |
a Investment in affiliated issuer. The investment objective of this investment company is publicly available and can be found within the investment company’s prospectus.
| | |
Portfolio Summary (Unaudited) † | Value (%) |
Investment Companies | 99.6 |
| | 99.6 |
† Based on net assets.
See notes to financial statements.
10
STATEMENT OF INVESTMENTS IN AFFILIATED ISSUERS
| | | | | |
Investment Companies | Value
10/31/19 ($) | Purchases ($)† | Sales ($) | Net Realized
Gain (Loss) ($) |
BNY Mellon Corporate Bond
Fund, Cl. M | 45,472,976 | 3,342,246 | (12,974,500) | 396,023 |
BNY Mellon Floating Rate
Income Fund, CI. Y | 100,350,312 | 8,711,082 | (28,308,000) | (3,536,748) |
BNY Mellon Global Dynamic
Bond Income Fund, CI. Y | 39,045,563 | 3,094,749 | (11,205,250) | (142,302) |
BNY Mellon High Yield Fund, CI. I | 56,854,448 | 4,811,719 | (15,154,000) | (1,059,896) |
BNY Mellon Municipal
Opportunities Fund, CI. M | 162,254,531 | 11,011,250 | (46,000,500) | 158,800 |
Total | 403,977,830 | 30,971,046 | (113,642,250) | (4,184,123) |
| | | | | | |
Investment Companies | Net Change in
Unrealized
Appreciation
(Depreciation) ($) | Value
10/31/20 ($) | Net
Assets (%) | Dividends/
Distributions ($) |
BNY Mellon Corporate Bond
Fund, Cl. M | 254,134 | 36,490,879 | 11.3 | 1,487,646 |
BNY Mellon Floating Rate
Income Fund, CI. Y | (803,093) | 76,413,553 | 23.5 | 4,664,681 |
BNY Mellon Global Dynamic
Bond Income Fund, CI. Y | (435,833) | 30,356,927 | 9.4 | 1,493,049 |
BNY Mellon High Yield Fund, CI. I | (1,255,967) | 44,196,304 | 13.6 | 2,793,498 |
BNY Mellon Municipal
Opportunities Fund, CI. M | (2,446,693) | 124,977,388 | 38.5 | 4,447,098 |
Total | | (4,687,452) | 312,435,051 | 96.3 | 14,885,972 |
† Includes reinvested dividends/distributions.
See notes to financial statements.
11
STATEMENT OF ASSETS AND LIABILITIES
October 31, 2020
| | | | | | | |
| | | | | | |
| | | Cost | | Value | |
Assets ($): | | | | |
Investments in securities—See Statement of Investments | | | |
Unaffiliated issuers | 11,368,902 | | 10,764,162 | |
Affiliated issuers | | 309,165,082 | | 312,435,051 | |
Cash | | | | | 1,482,928 | |
Dividends receivable | | 643,176 | |
Receivable for shares of Common Stock subscribed | | 118,154 | |
Receivable for investment securities sold | | 99,000 | |
Prepaid expenses | | | | | 14,020 | |
| | | | | 325,556,491 | |
Liabilities ($): | | | | |
Due to BNY Mellon Investment Adviser, Inc. and affiliates—Note 3(c) | | 5,402 | |
Payable for investment securities purchased | | 584,015 | |
Payable for shares of Common Stock redeemed | | 303,217 | |
Directors’ fees and expenses payable | | 6,271 | |
Other accrued expenses | | | | | 62,146 | |
| | | | | 961,051 | |
Net Assets ($) | | | 324,595,440 | |
Composition of Net Assets ($): | | | | |
Paid-in capital | | | | | 345,803,986 | |
Total distributable earnings (loss) | | | | | (21,208,546) | |
Net Assets ($) | | | 324,595,440 | |
| | | | | | |
Net Asset Value Per Share | Class A | Class C | Class I | Class Y | |
Net Assets ($) | 563,715 | 24,105 | 9,877,320 | 314,130,300 | |
Shares Outstanding | 46,753 | 2,000 | 817,155 | 26,010,190 | |
Net Asset Value Per Share ($) | 12.06 | 12.05 | 12.09 | 12.08 | |
| | | | | |
See notes to financial statements. | | | | | |
12
STATEMENT OF OPERATIONS
Year Ended October 31, 2020
| | | | | | | |
| | | | | | |
| | | | | | |
Investment Income ($): | | | | |
Income: | | | | |
Cash dividends: | |
Unaffiliated issuers | | | 542,163 | |
Affiliated issuers | | | 14,885,972 | |
Interest | | | 7,709 | |
Total Income | | | 15,435,844 | |
Expenses: | | | | |
Professional fees | | | 84,818 | |
Registration fees | | | 68,082 | |
Directors’ fees and expenses—Note 3(d) | | | 36,297 | |
Chief Compliance Officer fees—Note 3(c) | | | 14,076 | |
Loan commitment fees—Note 2 | | | 11,620 | |
Prospectus and shareholders’ reports | | | 9,633 | |
Shareholder servicing costs—Note 3(c) | | | 7,526 | |
Interest expense—Note 2 | | | 1,098 | |
Custodian fees—Note 3(c) | | | 933 | |
Distribution fees—Note 3(b) | | | 180 | |
Miscellaneous | | | 19,287 | |
Total Expenses | | | 253,550 | |
Investment Income—Net | | | 15,182,294 | |
Realized and Unrealized Gain (Loss) on Investments—Note 4 ($): | | |
Net realized gain (loss) on investments: | | |
Unaffiliated issuers | | | | (494,625) | |
Affiliated issuers | | | | (4,184,123) | |
Net Realized Gain (Loss) | | | (4,678,748) | |
Net change in unrealized appreciation (depreciation) on investments: | | |
Unaffiliated issuers | | | | (386,756) | |
Affiliated issuers | | | | (4,687,452) | |
Net Change in Unrealized Appreciation (Depreciation) | | | (5,074,208) | |
Net Realized and Unrealized Gain (Loss) on Investments | | | (9,752,956) | |
Net Increase in Net Assets Resulting from Operations | | 5,429,338 | |
| | | | | | |
See notes to financial statements. | | | | | |
13
��
STATEMENT OF CHANGES IN NET ASSETS
| | | | | | | | | | |
| | | | Year Ended October 31, |
| | | | 2020 | | 2019 | |
Operations ($): | | | | | | | | |
Investment income—net | | | 15,182,294 | | | | 18,310,058 | |
Net realized gain (loss) on investments | | (4,678,748) | | | | (6,080,697) | |
Net change in unrealized appreciation
(depreciation) on investments | | (5,074,208) | | | | 15,315,860 | |
Net Increase (Decrease) in Net Assets
Resulting from Operations | 5,429,338 | | | | 27,545,221 | |
Distributions ($): | |
Distributions to shareholders: | | | | | | | | |
Class A | | | (21,850) | | | | (29,749) | |
Class C | | | (737) | | | | (834) | |
Class I | | | (407,972) | | | | (404,073) | |
Class Y | | | (15,392,700) | | | | (17,994,111) | |
Total Distributions | | | (15,823,259) | | | | (18,428,767) | |
Capital Stock Transactions ($): | |
Net proceeds from shares sold: | | | | | | | | |
Class A | | | 98,716 | | | | 193,677 | |
Class I | | | 6,181,639 | | | | 6,741,942 | |
Class Y | | | 62,094,447 | | | | 106,540,860 | |
Distributions reinvested: | | | | | | | | |
Class A | | | 19,155 | | | | 23,400 | |
Class I | | | 389,329 | | | | 361,343 | |
Class Y | | | 1,183,341 | | | | 1,503,195 | |
Cost of shares redeemed: | | | | | | | | |
Class A | | | (127,655) | | | | (671,612) | |
Class I | | | (6,288,729) | | | | (6,754,330) | |
Class Y | | | (148,955,757) | | | | (127,240,462) | |
Increase (Decrease) in Net Assets
from Capital Stock Transactions | (85,405,514) | | | | (19,301,987) | |
Total Increase (Decrease) in Net Assets | (95,799,435) | | | | (10,185,533) | |
Net Assets ($): | |
Beginning of Period | | | 420,394,875 | | | | 430,580,408 | |
End of Period | | | 324,595,440 | | | | 420,394,875 | |
14
| | | | | | | | | | |
| | | | Year Ended October 31, |
| | | | 2020 | | 2019 | |
Capital Share Transactions (Shares): | |
Class A | | | | | | | | |
Shares sold | | | 8,180 | | | | 15,835 | |
Shares issued for distributions reinvested | | | 1,597 | | | | 1,952 | |
Shares redeemed | | | (10,582) | | | | (55,615) | |
Net Increase (Decrease) in Shares Outstanding | (805) | | | | (37,828) | |
Class Ia | | | | | | | | |
Shares sold | | | 519,456 | | | | 551,139 | |
Shares issued for distributions reinvested | | | 32,410 | | | | 29,905 | |
Shares redeemed | | | (530,534) | | | | (554,187) | |
Net Increase (Decrease) in Shares Outstanding | 21,332 | | | | 26,857 | |
Class Ya | | | | | | | | |
Shares sold | | | 5,140,885 | | | | 8,842,781 | |
Shares issued for distributions reinvested | | | 98,236 | | | | 124,634 | |
Shares redeemed | | | (12,536,121) | | | | (10,569,356) | |
Net Increase (Decrease) in Shares Outstanding | (7,297,000) | | | | (1,601,941) | |
| | | | | | | | | |
a During the period ended October 31, 2020, 394,600 Class Y shares representing $4,667,136 were exchanged for 394,271 Class I shares and during the period ended October 31, 2019, 309,744 Class Y shares representing $3,792,712 were exchanged for 309,491 Class I shares. | |
See notes to financial statements. | | | | | | | | |
15
FINANCIAL HIGHLIGHTS
The following tables describe the performance for each share class for the fiscal periods indicated. All information (except portfolio turnover rate) reflects financial results for a single fund share. Total return shows how much your investment in the fund would have increased (or decreased) during each period, assuming you had reinvested all dividends and distributions. These figures have been derived from the fund’s financial statements.
| | | | | | | | | | |
| | | | | | | | |
| | | | | | |
Class A Shares | | Year Ended October 31, |
| | 2020 | 2019 | 2018 | 2017 | 2016 | |
Per Share Data ($): | | | | | | | |
Net asset value, beginning of period | | 12.29 | 12.02 | 12.39 | 12.32 | 12.21 | |
Investment Operations: | | | | | | | |
Investment income—neta | | .42 | .49 | .45 | .45 | .50 | |
Net realized and unrealized
gain (loss) on investments | | (.21) | .27 | (.35) | .07 | .10 | |
Total from Investment Operations | | .21 | .76 | .10 | .52 | .60 | |
Distributions: | | | | | | | |
Dividends from
investment income—net | | (.44) | (.49) | (.47) | (.45) | (.49) | |
Net asset value, end of period | | 12.06 | 12.29 | 12.02 | 12.39 | 12.32 | |
Total Return (%)b | | 1.75 | 6.47 | .83 | 4.38 | 4.98 | |
Ratios/Supplemental Data (%): | | | | | | | |
Ratio of total expenses
to average net assetsc | | .49 | .47 | .38 | .41 | .31 | |
Ratio of net investment income
to average net assetsc | | 3.47 | 4.19 | 3.67 | 3.63 | 4.03 | |
Portfolio Turnover Rate | | 8.41 | 21.45 | 22.78 | 10.47 | 16.14 | |
Net Assets, end of period ($ x 1,000) | | 564 | 585 | 1,027 | 428 | 155 | |
a Based on average shares outstanding.
b Exclusive of sales charge.
c Amount does not include the expenses of the underlying funds.
See notes to financial statements.
16
| | | | | | | | | | |
| | | | | | | | | |
| | | | | | |
Class C Shares | | Year Ended October 31, |
| | 2020 | 2019 | 2018 | 2017 | 2016 |
Per Share Data ($): | | | | | | | |
Net asset value, beginning of period | | | 12.29 | 12.02 | 12.40 | 12.31 | 12.19 |
Investment Operations: | | | | | | | |
Investment income—neta | | | .34 | .40 | .35 | .35 | .38 |
Net realized and unrealized
gain (loss) on investments | | | (.21) | .29 | (.35) | .05 | .13 |
Total from Investment Operations | | | .13 | .69 | - | .40 | .51 |
Distributions: | | | | | | | |
Dividends from
investment income—net | | | (.37) | (.42) | (.38) | (.31) | (.39) |
Net asset value, end of period | | | 12.05 | 12.29 | 12.02 | 12.40 | 12.31 |
Total Return (%)b | | | 1.10 | 5.84 | .02 | 3.31 | 4.34 |
Ratios/Supplemental Data (%): | | | | | | | |
Ratio of total expenses
to average net assetsc | | | 1.11 | 1.12 | 1.26 | 1.37 | 1.12 |
Ratio of net investment income
to average net assetsc | | | 2.88 | 3.32 | 2.84 | 2.90 | 3.18 |
Portfolio Turnover Rate | | | 8.41 | 21.45 | 22.78 | 10.47 | 16.14 |
Net Assets, end of period ($ x 1,000) | | | 24 | 25 | 24 | 25 | 50 |
a Based on average shares outstanding.
b Exclusive of sales charge.
c Amount does not include the expenses of the underlying funds.
See notes to financial statements.
17
FINANCIAL HIGHLIGHTS (continued)
| | | | | | | | | | | | | |
| | | | | | | |
| | | | | | |
Class I Shares | | Year Ended October 31, |
| | 2020 | 2019 | 2018 | 2017 | 2016 | |
Per Share Data ($): | | | | | | | |
Net asset value, beginning of period | | 12.32 | 12.05 | 12.41 | 12.34 | 12.22 | |
Investment Operations: | | | | | | | |
Investment income—neta | | .47 | .53 | .48 | .47 | .48 | |
Net realized and unrealized
gain (loss) on investments | | (.22) | .27 | (.33) | .08 | .15 | |
Total from Investment Operations | | .25 | .80 | .15 | .55 | .63 | |
Distributions: | | | | | | | |
Dividends from
investment income—net | | (.48) | (.53) | (.51) | (.48) | (.51) | |
Net asset value, end of period | | 12.09 | 12.32 | 12.05 | 12.41 | 12.34 | |
Total Return (%) | | 2.13 | 6.85 | 1.20 | 4.66 | 5.22 | |
Ratios/Supplemental Data (%): | | | | | | | |
Ratio of total expenses
to average net assetsb | | .11 | .09 | .08 | .11 | .19 | |
Ratio of net investment income
to average net assetsb | | 3.85 | 4.34 | 3.99 | 3.85 | 4.16 | |
Portfolio Turnover Rate | | 8.41 | 21.45 | 22.78 | 10.47 | 16.14 | |
Net Assets, end of period ($ x 1,000) | | 9,877 | 9,804 | 9,264 | 5,742 | 538 | |
a Based on average shares outstanding.
b Amount does not include the expenses of the underlying funds.
See notes to financial statements.
18
| | | | | | | | | | | | | |
| | | | | | | |
| | | | | | |
Class Y Shares | | Year Ended October 31, |
| | 2020 | 2019 | 2018 | 2017 | 2016 | |
Per Share Data ($): | | | | | | | |
Net asset value, beginning of period | | 12.31 | 12.04 | 12.40 | 12.33 | 12.21 | |
Investment Operations: | | | | | | | |
Investment income—neta | | .48 | .53 | .50 | .50 | .52 | |
Net realized and unrealized
gain (loss) on investments | | (.22) | .28 | (.35) | .06 | .12 | |
Total from Investment Operations | | .26 | .81 | .15 | .56 | .64 | |
Distributions: | | | | | | | |
Dividends from
investment income—net | | (.49) | (.54) | (.51) | (.49) | (.52) | |
Net asset value, end of period | | 12.08 | 12.31 | 12.04 | 12.40 | 12.33 | |
Total Return (%) | | 2.18 | 6.89 | 1.23 | 4.72 | 5.37 | |
Ratios/Supplemental Data (%): | | | | | | | |
Ratio of total expenses
to average net assetsb | | .06 | .06 | .05 | .05 | .05 | |
Ratio of net investment income
to average net assetsb | | 3.96 | 4.39 | 4.06 | 4.11 | 4.28 | |
Portfolio Turnover Rate | | 8.41 | 21.45 | 22.78 | 10.47 | 16.14 | |
Net Assets, end of period ($ x 1,000) | | 314,130 | 409,982 | 420,265 | 456,703 | 422,405 | |
a Based on average shares outstanding.
b Amount does not include the expenses of the underlying funds.
See notes to financial statements.
19
NOTES TO FINANCIAL STATEMENTS
NOTE 1—Significant Accounting Policies:
BNY Mellon Yield Enhancement Strategy Fund (the “fund”) is a separate diversified series of BNY Mellon Investment Funds II, Inc. (the “Company”), which is registered under the Investment Company Act of 1940, as amended (the “Act”), as an open-end management investment company and operates as a series company currently offering three series, including the fund. The fund’s investment objective is to seek high current income. BNY Mellon Investment Adviser, Inc. (the “Adviser”), a wholly-owned subsidiary of The Bank of New York Mellon Corporation (“BNY Mellon”), serves as the fund’s investment adviser.
The Company’s Board of Directors (the “Board”) approved, effective December 31, 2019 (the “Effective Date”), the termination of the fund’s authorized Class T shares. Prior to the Effective Date, the fund did not offer such Class T shares for purchase. The authorized Class T shares were reallocated to authorized Class Y shares, increasing authorized Class Y shares from 100 million to 200 million.
BNY Mellon Securities Corporation (the “Distributor”), a wholly-owned subsidiary of the Adviser, is the distributor of the fund’s shares. The fund is authorized to issue 500 million shares of $.001 par value Common Stock. The fund currently has authorized four classes of shares: Class A (100 million shares authorized), Class C (100 million shares authorized), Class I (100 million shares authorized) and Class Y (200 million shares authorized). Class A and Class C shares are sold primarily to retail investors through financial intermediaries and bear Distribution and/or Shareholder Services Plan fees. Class A shares generally are subject to a sales charge imposed at the time of purchase. Class A shares bought without an initial sales charge as part of an investment of $1 million or more may be charged a contingent deferred sales charge (“CDSC”) of 1.00% if redeemed within one year. Class C shares are subject to a CDSC imposed on Class C shares redeemed within one year of purchase. Class C shares automatically convert to Class A shares ten years after the date of purchase, without the imposition of a sales charge. Class I shares are sold primarily to bank trust departments and other financial service providers (including The Bank of New York Mellon, a subsidiary of BNY Mellon and an affiliate of the Adviser, and its affiliates), acting on behalf of customers having a qualified trust or an investment account or relationship at such institution, and bear no Distribution or Shareholder Services Plan fees. Class Y shares are sold at net asset value per share generally to institutional investors, and bear no Distribution or Shareholder Services
20
Plan fees. Class I and Class Y shares are offered without a front-end sales charge or CDSC. Other differences between the classes include the services offered to and the expenses borne by each class, the allocation of certain transfer agency costs, and certain voting rights. Income, expenses (other than expenses attributable to a specific class), and realized and unrealized gains or losses on investments are allocated to each class of shares based on its relative net assets.
As of October 31, 2020, MBC Investments Corp., an indirect subsidiary of BNY Mellon, held all of the outstanding Class C shares of the fund.
The Company accounts separately for the assets, liabilities and operations of each series. Expenses directly attributable to each series are charged to that series’ operations; expenses which are applicable to all series are allocated among them on a pro rata basis.
The Financial Accounting Standards Board (“FASB”) Accounting Standards Codification (“ASC”) is the exclusive reference of authoritative U.S. generally accepted accounting principles (“GAAP”) recognized by the FASB to be applied by nongovernmental entities. Rules and interpretive releases of the Securities and Exchange Commission (“SEC”) under authority of federal laws are also sources of authoritative GAAP for SEC registrants. The fund is an investment company and applies the accounting and reporting guidance of the FASB ASC Topic 946 Financial Services-Investment Companies. The fund’s financial statements are prepared in accordance with GAAP, which may require the use of management estimates and assumptions. Actual results could differ from those estimates.
The Company enters into contracts that contain a variety of indemnifications. The fund’s maximum exposure under these arrangements is unknown. The fund does not anticipate recognizing any loss related to these arrangements.
(a) Portfolio valuation: The fair value of a financial instrument is the amount that would be received to sell an asset or paid to transfer a liability in an orderly transaction between market participants at the measurement date (i.e., the exit price). GAAP establishes a fair value hierarchy that prioritizes the inputs of valuation techniques used to measure fair value. This hierarchy gives the highest priority to unadjusted quoted prices in active markets for identical assets or liabilities (Level 1 measurements) and the lowest priority to unobservable inputs (Level 3 measurements).
Additionally, GAAP provides guidance on determining whether the volume and activity in a market has decreased significantly and whether such a decrease in activity results in transactions that are not orderly.
21
NOTES TO FINANCIAL STATEMENTS (continued)
GAAP requires enhanced disclosures around valuation inputs and techniques used during annual and interim periods.
Various inputs are used in determining the value of the fund’s investments relating to fair value measurements. These inputs are summarized in the three broad levels listed below:
Level 1—unadjusted quoted prices in active markets for identical investments.
Level 2—other significant observable inputs (including quoted prices for similar investments, interest rates, prepayment speeds, credit risk, etc.).
Level 3—significant unobservable inputs (including the fund’s own assumptions in determining the fair value of investments).
The inputs or methodology used for valuing securities are not necessarily an indication of the risk associated with investing in those securities.
Investments are valued at the net asset value of each underlying fund determined as of the close of the New York Stock Exchange (generally 4 p.m., Eastern time) on the valuation date and are generally categorized within Level 1 of the fair value hierarchy.
The following is a summary of the inputs used as of October 31, 2020 in valuing the fund’s investments:
| | | | | | |
Assets ($) | Level 1 - Unadjusted Quoted Prices | Level 2 - Other Significant Observable Inputs | Level 3 - Significant Unobservable Inputs | Total |
Investments in Securities: † | | | |
Investment
Companies | 323,199,213 | - | - | 323,199,213 |
† See Statement of Investments for additional detailed categorizations, if any.
(b) Securities transactions and investment income: Securities transactions are recorded on a trade date basis. Realized gains and losses from securities transactions are recorded on the identified cost basis. Dividend income is recognized on the ex-dividend date and interest income, including, where applicable, accretion of discount and amortization of premium on investments, is recognized on the accrual basis.
(c) Affiliated issuers: Investments in other investment companies advised by the Adviser are considered “affiliated” under the Act.
22
(d) Risk: Certain events particular to the industries in which the fund’s investments conduct their operations, as well as general economic, political and public health conditions, may have a significant negative impact on the investee’s operations and profitability. In addition, turbulence in financial markets and reduced liquidity in equity, credit and/or fixed income markets may negatively affect many issuers, which could adversely affect the fund. Global economies and financial markets are becoming increasingly interconnected, and conditions and events in one country, region or financial market may adversely impact issuers in a different country, region or financial market. These risks may be magnified if certain events or developments adversely interrupt the global supply chain; in these and other circumstances, such risks might affect companies world-wide. Recent examples include pandemic risks related to COVID-19 and aggressive measures taken world-wide in response by governments, including closing borders, restricting international and domestic travel, and the imposition of prolonged quarantines of large populations, and by businesses, including changes to operations and reducing staff. To the extent the fund may overweight its investments in certain countries, companies, industries or market sectors, such positions will increase the fund’s exposure to risk of loss from adverse developments affecting those countries, companies, industries or sectors.
(e) Dividends and distributions to shareholders: Dividends and distributions are recorded on the ex-dividend date. Dividends from investment income-net are normally declared and paid on a monthly basis. Dividends from net realized capital gains, if any, are normally declared and paid annually, but the fund may make distributions on a more frequent basis to comply with the distribution requirements of the Internal Revenue Code of 1986, as amended (the “Code”). To the extent that net realized capital gains can be offset by capital loss carryovers, it is the policy of the fund not to distribute such gains. Income and capital gain distributions are determined in accordance with income tax regulations, which may differ from GAAP.
(f) Federal income taxes: It is the policy of the fund to continue to qualify as a regulated investment company, if such qualification is in the best interests of its shareholders, by complying with the applicable provisions of the Code, and to make distributions of taxable income and net realized capital gain sufficient to relieve it from substantially all federal income and excise taxes.
As of and during the period ended October 31, 2020, the fund did not have any liabilities for any uncertain tax positions. The fund recognizes interest and penalties, if any, related to uncertain tax positions as income
23
NOTES TO FINANCIAL STATEMENTS (continued)
tax expense in the Statement of Operations. During the period ended October 31, 2020, the fund did not incur any interest or penalties.
Each tax year in the four-year period ended October 31, 2020 remains subject to examination by the Internal Revenue Service and state taxing authorities.
At October 31, 2020, the components of accumulated earnings on a tax basis were as follows: undistributed ordinary income $733,565, accumulated capital losses $19,743,873 and unrealized depreciation $2,198,238.
The fund is permitted to carry forward capital losses for an unlimited period. Furthermore, capital loss carryovers retain their character as either short-term or long-term capital losses.
The accumulated capital loss carryover is available for federal income tax purposes to be applied against future net realized capital gains, if any, realized subsequent to October 31, 2020. The fund has $2,873,329 of short-term capital losses and $16,870,544 of long-term capital losses which can be carried forward for an unlimited period.
The tax character of distributions paid to shareholders during the fiscal periods ended October 31, 2020 and October 31, 2019 were as follows: ordinary income $11,444,047 and $13,412,211, and tax-exempt income $4,379,212 and $5,016,556, respectively.
NOTE 2—Bank Lines of Credit:
The fund participates with other long-term open-end funds managed by the Adviser in a $823.5 million unsecured credit facility led by Citibank, N.A. (the “Citibank Credit Facility”) and a $300 million unsecured credit facility provided by The Bank of New York Mellon (the “BNYM Credit Facility”), each to be utilized primarily for temporary or emergency purposes, including the financing of redemptions (each, a “Facility”). The Citibank Credit Facility is available in two tranches: (i) Tranche A is in an amount equal to $688.5 million and is available to all long-term open-ended funds, including the fund, and (ii) Tranche B is an amount equal to $135 million and is available only to BNY Mellon Floating Rate Income Fund, a series of BNY Mellon Investment Funds IV, Inc. Prior to September 30, 2020, the Citibank Credit Facility was $927 million with Tranche A available in an amount equal to $747 million and Tranche B available in an amount equal to $180 million. Prior to March 11, 2020, the Citibank Credit Facility was $1.030 billion with Tranche A available in an amount equal to $830 million and Tranche B available in an amount equal to $200 million. In connection therewith, the fund has agreed to pay its pro
24
rata portion of commitment fees for Tranche A of the Citibank Credit Facility and the BNYM Credit Facility. Interest is charged to the fund based on rates determined pursuant to the terms of the respective Facility at the time of borrowing.
The average amount of borrowings outstanding under the Facilities during the period ended October 31, 2020 was approximately $68,033 with a related weighted average annualized interest rate of 1.61%.
NOTE 3—Management Fee and Other Transactions with Affiliates:
(a) Pursuant to a management agreement with the Adviser, there is no management fee paid to the Adviser. The fund may invest in other affiliated mutual funds advised by the Adviser and unaffiliated open-end funds, closed-end funds and exchange-traded funds. All fees and expenses of the underlying funds are reflected in the underlying fund’s net asset value.
(b) Under the Distribution Plan adopted pursuant to Rule 12b-1 under the Act, Class C shares pay the Distributor for distributing its shares at an annual rate of .75% of the value of its average daily net assets. During the period ended October 31, 2020, Class C shares were charged $180 pursuant to the Distribution Plan.
(c) Under the Shareholder Services Plan, Class A and Class C shares pay the Distributor at an annual rate of .25% of the value of their average daily net assets for the provision of certain services. The services provided may include personal services relating to shareholder accounts, such as answering shareholder inquiries regarding the fund and providing reports and other information, and services related to the maintenance of shareholder accounts. The Distributor may make payments to Service Agents (securities dealers, financial institutions or other industry professionals) with respect to these services. The Distributor determines the amounts to be paid to Service Agents. During the period ended October 31, 2020, Class A and Class C shares were charged $1,514 and $60, respectively, pursuant to the Shareholder Services Plan.
Under its terms, the Distribution Plan and Shareholder Services Plan shall remain in effect from year to year, provided such continuance is approved annually by a vote of a majority of those Directors who are not “interested persons” of the Company and who have no direct or indirect financial interest in the operation of or in any agreement related to the Distribution Plan or Shareholder Services Plan.
25
NOTES TO FINANCIAL STATEMENTS (continued)
The fund has an arrangement with the transfer agent whereby the fund may receive earnings credits when positive cash balances are maintained, which are used to offset transfer agency fees. For financial reporting purposes, the fund includes net earnings credits, if any, as an expense offset in the Statement of Operations.
The fund has an arrangement with the custodian whereby the fund will receive interest income or be charged an overdraft fees when cash balances are maintained. For financial reporting purposes, the fund includes this interest income and overdraft fees, if any, as interest income in the Statement of Operations.
The fund compensates BNY Mellon Transfer, Inc., a wholly-owned subsidiary of the Adviser, under a transfer agency agreement for providing transfer agency and cash management services for the fund. The majority of transfer agency fees are comprised of amounts paid on a per account basis, while cash management fees are related to fund subscriptions and redemptions. During the period ended October 31, 2020, the fund was charged $2,420 for transfer agency services. These fees are included in Shareholder servicing costs in the Statement of Operations.
The fund compensates The Bank of New York Mellon under a custody agreement for providing custodial services for the fund. These fees are determined based on net assets, geographic region and transaction activity. During the period ended October 31, 2020, the fund was charged $933 pursuant to the custody agreement.
During the period ended October 31, 2020, the fund was charged $14,076 for services performed by the Chief Compliance Officer and his staff. These fees are included in Chief Compliance Officer fees in the Statement of Operations.
The components of “Due to BNY Mellon Investment Adviser, Inc. and affiliates” in the Statement of Assets and Liabilities consist of: Distribution Plan fees of $15, Shareholder Services Plan fees of $135, custodian fees of $240, Chief Compliance Officer fees of $4,546 and transfer agency fees of $466.
(d) Each Board member also serves as a Board member of other funds in the BNY Mellon Family of Funds complex. Annual retainer fees and attendance fees are allocated to each fund based on net assets.
NOTE 4—Securities Transactions:
The aggregate amount of purchases and sales of investment securities, excluding short-term securities, during the period ended October 31, 2020, amounted to $32,126,021 and $117,700,500, respectively.
26
At October 31, 2020, the cost of investments for federal income tax purposes was $325,397,451; accordingly, accumulated net unrealized depreciation on investments was $2,198,238, consisting of $8,800,627 gross unrealized appreciation and $10,998,865 gross unrealized depreciation.
27
REPORT OF INDEPENDENT REGISTERED PUBLIC ACCOUNTING FIRM
To the Shareholders of the Fund and Board of Directors of
BNY Mellon Investment Funds II, Inc.:
Opinion on the Financial Statements
We have audited the accompanying statement of assets and liabilities of BNY Mellon Yield Enhancement Strategy Fund (the “Fund”), a series of BNY Mellon Investment Funds II, Inc., including the statement of investments, as of October 31, 2020, and the statement of investments in affiliated issuers as of and for the year then ended, the related statement of operations for the year then ended, the statements of changes in net assets for each of the years in the two-year period then ended, and the related notes (collectively, the financial statements), and the financial highlights for each of the years in the five-year period then ended. In our opinion, the financial statements and financial highlights present fairly, in all material respects, the financial position of the Fund as of October 31, 2020, the results of its operations for the year then ended, the changes in its net assets for each of the years in the two-year period then ended, and the financial highlights for each of the years in the five-year period then ended, in conformity with U.S. generally accepted accounting principles.
Basis for Opinion
These financial statements and financial highlights are the responsibility of the Fund’s management. Our responsibility is to express an opinion on these financial statements and financial highlights based on our audits. We are a public accounting firm registered with the Public Company Accounting Oversight Board (United States) (PCAOB) and are required to be independent with respect to the Fund in accordance with the U.S. federal securities laws and the applicable rules and regulations of the Securities and Exchange Commission and the PCAOB.
We conducted our audits in accordance with the standards of the PCAOB. Those standards require that we plan and perform the audit to obtain reasonable assurance about whether the financial statements and financial highlights are free of material misstatement, whether due to error or fraud. Our audits included performing procedures to assess the risks of material misstatement of the financial statements and financial highlights, whether due to error or fraud, and performing procedures that respond to those risks. Such procedures included examining, on a test basis, evidence regarding the amounts and disclosures in the financial statements and financial highlights. Such procedures also included confirmation of securities owned as of October 31, 2020, by correspondence with the transfer agent and custodian. Our audits also included evaluating the accounting principles used and significant estimates made by management, as well as evaluating the overall presentation of the financial statements and financial highlights. We believe that our audits provide a reasonable basis for our opinion.

We have served as the auditor of one or more BNY Mellon Investment Adviser, Inc. investment companies since 1994.
New York, New York
December 18, 2020
28
IMPORTANT TAX INFORMATION (Unaudited)
In accordance with federal tax law, the fund hereby reports $4,379,212 as “exempt-interest dividends paid” during its fiscal year ended October 31, 2020. Where required by federal tax law rules, shareholders will receive notification of their portion of the fund’s tax-exempt dividends paid for the 2020 calendar year on Form 1099-DIV, which will be mailed in early 2021.
29
BOARD MEMBERS INFORMATION (Unaudited)
INDEPENDENT BOARD MEMBERS
Joseph S. DiMartino (77)
Chairman of the Board (1999)
Principal Occupation During Past 5 Years:
· Director or Trustee of funds in the BNY Mellon Family of Funds and certain other entities (as described in the fund’s Statement of Additional Information) (1995-Present)
Other Public Company Board Memberships During Past 5 Years:
· CBIZ, Inc., a public company providing professional business services, products and solutions, Director (1997-Present)
No. of Portfolios for which Board Member Serves: 110
———————
Francine J. Bovich (69)
Board Member (2012)
Principal Occupation During Past 5 Years:
· Trustee, The Bradley Trusts, private trust funds (2011-Present)
Other Public Company Board Memberships During Past 5 Years:
· Annaly Capital Management, Inc., a real estate investment trust, Director (2014-Present)
No. of Portfolios for which Board Member Serves: 67
———————
Andrew J. Donohue (70)
Board Member (2019)
Principal Occupation During Past 5 Years:
· Of Counsel, Shearman & Sterling LLP (2017-2019)
· Chief of Staff to the Chair of the SEC (2015-2017)
· Managing Director and Investment Company General Counsel of Goldman Sachs (2012-2015)
Other Public Company Board Memberships During Past 5 Years:
· Oppenheimer Funds (58 funds), Director (2017-2019)
No. of Portfolios for which Board Member Serves: 53
———————
30
Kenneth A. Himmel (74)
Board Member (1994)
Principal Occupation During Past 5 Years:
· Managing Partner, Gulf Related, an international real estate development company (2010-Present)
· President and CEO, Related Urban Development, a real estate development company (1996-Present)
· CEO, American Food Management, a restaurant company (1983-Present)
· President and CEO, Himmel & Company, a real estate development company (1980-Present)
No. of Portfolios for which Board Member Serves: 22
———————
Stephen J. Lockwood (73)
Board Member (1994)
Principal Occupation During Past 5 Years:
· Chairman of the Board, Stephen J. Lockwood and Company LLC, a real estate investment company (2000-Present)
No. of Portfolios for which Board Member Serves: 22
———————
Roslyn M. Watson (71)
Board Member (1994)
Principal Occupation During Past 5 Years:
· Principal, Watson Ventures, Inc., a real estate investment company (1993-Present)
Other Public Company Board Memberships During Past 5 Years:
· American Express Bank, FSB, Director (1993-2018)
No. of Portfolios for which Board Member Serves: 53
———————
31
BOARD MEMBERS INFORMATION (Unaudited) (continued)
INDEPENDENT BOARD MEMBERS (continued)
Benaree Pratt Wiley (74)
Board Member (1998)
Principal Occupation During Past 5 Years:
· Principal, The Wiley Group, a firm specializing in strategy and business development (2005-Present)
Other Public Company Board Memberships During Past 5 Years:
· CBIZ, Inc., a public company providing professional business services, products and solutions, Director (2008-Present)
· Blue Cross-Blue Shield of Massachusetts, Director (2004-Present)
No. of Portfolios for which Board Member Serves: 71
———————
Once elected all Board Members serve for an indefinite term, but achieve Emeritus status upon reaching age 80. The address of the Board Members and Officers is c/o BNY Mellon Investment Adviser, Inc. 240 Greenwich Street, New York, New York 10286. Additional information about the Board Members is available in the fund’s Statement of Additional Information which can be obtained from the Adviser free of charge by calling this toll free number: 1-800-373-9387.
James M. Fitzgibbons, Emeritus Board Member
32
OFFICERS OF THE FUND (Unaudited)
RENEE LAROCHE-MORRIS, President since May 2019.
President and a director of BNY Mellon Investment Adviser, Inc. since January 2018. She is an officer of 61 investment companies (comprised of 110 portfolios) managed by the Adviser. She is 49 years old and has been an employee of BNY Mellon since 2003.
JAMES WINDELS, Treasurer since November 2001.
Director-BNY Mellon Fund Administration, and an officer of 63 investment companies (comprised of 141 portfolios) managed by the Adviser or an affiliate of the Adviser. He is 62 years old and has been an employee of the Adviser since April 1985.
BENNETT A. MACDOUGALL, Chief Legal Officer since October 2015.
Chief Legal Officer of the Adviser and Associate General Counsel and Managing Director of BNY Mellon since June 2015; Director and Associate General Counsel of Deutsche Bank–Asset & Wealth Management Division from June 2005 to June 2015, and as Chief Legal Officer of Deutsche Investment Management Americas Inc. from June 2012 to May 2015. He is an officer of 63 investment companies (comprised of 141 portfolios) managed by the Adviser or an affiliate of the Adviser. He is 49 years old and has been an employee of the Adviser since June 2015.
DAVID DIPETRILLO, Vice President since May 2019.
Head of North America Product, BNY Mellon Investment Management since January 2018, Director of Product Strategy, BNY Mellon Investment Management from January 2016 to December 2017; Head of US Retail Product and Channel Marketing, BNY Mellon Investment Management from January 2014 to December 2015. He is an officer of 62 investment companies (comprised of 118 portfolios) managed by the Adviser or an affiliate of the Adviser. He is 42 years old and has been an employee of BNY Mellon since 2005.
JAMES BITETTO, Vice President since August 2005 and Secretary since February 2018.
Senior Managing Counsel of BNY Mellon since December 2019; Managing Counsel of BNY Mellon from April 2014 to December 2019; Secretary of the Adviser, and an officer of 63 investment companies (comprised of 141 portfolios) managed by the Adviser or an affiliate of the Adviser. He is 54 years old and has been an employee of the Adviser since December 1996.
SONALEE CROSS, Vice President and Assistant Secretary since March 2018.
Counsel of BNY Mellon since October 2016; Associate at Proskauer Rose LLP from April 2016 to September 2016; Attorney at EnTrust Capital from August 2015 to February 2016; Associate at Sidley Austin LLP from September 2013 to August 2015. She is an officer of 63 investment companies (comprised of 141 portfolios) managed by the Adviser or an affiliate of the Adviser. She is 33 years old and has been an employee of the Adviser since October 2016.
DEIRDRE CUNNANE, Vice President and Assistant Secretary since March 2019.
Counsel of BNY Mellon since August 2018; Senior Regulatory Specialist at BNY Mellon Investment Management Services from February 2016 to August 2018; Trustee Associate at BNY Mellon Trust Company (Ireland) Limited from August 2013 to February 2016. She is an officer of 63 investment companies (comprised of 141 portfolios) managed by the Adviser or an affiliate of the Adviser. She is 30 years old and has been an employee of the Adviser since August 2018.
SARAH S. KELLEHER, Vice President and Assistant Secretary since April 2014.
Managing Counsel of BNY Mellon since December 2017, Senior Counsel of BNY Mellon from March 2013 to December 2017. She is an officer of 63 investment companies (comprised of 141 portfolios) managed by the Adviser or an affiliate of the Adviser. She is 45 years old and has been an employee of the Adviser since March 2013.
JEFF PRUSNOFSKY, Vice President and Assistant Secretary since August 2005.
Senior Managing Counsel of BNY Mellon, and an officer of 63 investment companies (comprised of 141 portfolios) managed by the Adviser or an affiliate of the Adviser. He is 55 years old and has been an employee of the Adviser since October 1990.
AMANDA QUINN, Vice President and Assistant Secretary since March 2020.
Counsel of BNY Mellon since June 2019; Regulatory Administration Manager at BNY Mellon Investment Management Services from September 2018 to May 2019; Senior Regulatory Specialist at BNY Mellon Investment Management Services from April 2015 to August 2018. She is an officer of 63 investment companies (comprised of 141 portfolios) managed by the Adviser or an affiliate of the Adviser. She is 35 years old and has been an employee of the Adviser since June 2019.
33
OFFICERS OF THE FUND (Unaudited) (continued)
PETER M. SULLIVAN, Vice President and Assistant Secretary since March 2019.
Managing Counsel of BNY Mellon since March 2009, Senior Counsel of BNY Mellon from April 2004 to March 2009, and an officer of 63 investment companies (comprised of 141 portfolios) managed by the Adviser or an affiliate of the Adviser. He is 52 years old and has been an employee of the Adviser since January 2019.
NATALYA ZELENSKY, Vice President and Assistant Secretary since March 2017.
Managing Counsel of BNY Mellon since December 2019; Counsel of BNY Mellon from May 2016 to December 2019; Attorney at Wildermuth Endowment Strategy Fund/Wildermuth Advisory, LLC from November 2015 to May 2016 and Assistant General Counsel at RCS Advisory Services from July 2014 to November 2015. She is an officer of 63 investment companies (comprised of 141 portfolios) managed by the Adviser or an affiliate of the Adviser. She is 35 years old and has been an employee of the Adviser since May 2016.
GAVIN C. REILLY, Assistant Treasurer since December 2005.
Tax Manager-BNY Mellon Fund Administration, and an officer of 63 investment companies (comprised of 141 portfolios) managed by the Adviser or an affiliate of the Adviser. He is 52 years old and has been an employee of the Adviser since April 1991.
ROBERT S. ROBOL, Assistant Treasurer since December 2002.
Senior Accounting Manager-BNY Mellon Fund Administration, and an officer of 63 investment companies (comprised of 141 portfolios) managed by the Adviser or an affiliate of the Adviser. He is 56 years old and has been an employee of the Adviser since October 1988.
ROBERT SALVIOLO, Assistant Treasurer since July 2007.
Senior Accounting Manager–BNY Mellon Fund Administration, and an officer of 63 investment companies (comprised of 141 portfolios) managed by the Adviser or an affiliate of the Adviser. He is 53 years old and has been an employee of the Adviser since June 1989.
ROBERT SVAGNA, Assistant Treasurer since July 2007.
Senior Accounting Manager–BNY Mellon Fund Administration, and an officer of 63 investment companies (comprised of 141 portfolios) managed by the Adviser or an affiliate of the Adviser. He is 53 years old and has been an employee of the Adviser since November 1990.
JOSEPH W. CONNOLLY, Chief Compliance Officer since October 2004.
Chief Compliance Officer of the Adviser, the BNY Mellon Family of Funds and BNY Mellon Funds Trust (62 investment companies, comprised of 133 portfolios). He is 63 years old and has served in various capacities with the Adviser since 1980, including manager of the firm’s Fund Accounting Department from 1997 through October 2001.
CARIDAD M. CAROSELLA, Anti-Money Laundering Compliance Officer since January 2016.
Anti-Money Laundering Compliance Officer of the BNY Mellon Family of Funds and BNY Mellon Funds Trust since January 2016; from May 2015 to December 2015, Interim Anti-Money Laundering Compliance Officer of the BNY Mellon Family of Funds and BNY Mellon Funds Trust and the Distributor; from January 2012 to May 2015, AML Surveillance Officer of the Distributor. She is an officer of 56 investment companies (comprised of 134 portfolios) managed by the Adviser or an affiliate of the Adviser. She is 52 years old and has been an employee of the Distributor since 1997.
34
This page intentionally left blank.
35
This page intentionally left blank.
36
This page intentionally left blank.
37
BNY Mellon Yield Enhancement Strategy Fund
240 Greenwich Street
New York, NY 10286
Adviser
BNY Mellon Investment Adviser, Inc.
240 Greenwich Street
New York, NY 10286
Custodian
The Bank of New York Mellon
240 Greenwich Street
New York, NY 10286
Transfer Agent &
Dividend Disbursing Agent
BNY Mellon Transfer, Inc.
240 Greenwich Street
New York, NY 10286
Distributor
BNY Mellon Securities Corporation
240 Greenwich Street
New York, NY 10286
| | |
Ticker Symbols: | Class A: DABMX Class C: DABLX Class I: DABKX Class Y: DABJX |
Telephone Call your financial representative or 1-800-373-9387
Mail The BNY Mellon Family of Funds, 144 Glenn Curtiss Boulevard, Uniondale, NY 11556-0144
E-mail Send your request to info@bnymellon.com
Internet Information can be viewed online or downloaded at www.bnymellonim.com/us
The fund files its complete schedule of portfolio holdings with the Securities and Exchange Commission (“SEC”) for the first and third quarters of each fiscal year on Form N-PORT. The fund’s Forms N-PORT are available on the SEC’s website at www.sec.gov.
A description of the policies and procedures that the fund uses to determine how to vote proxies relating to portfolio securities and information regarding how the fund voted these proxies for the most recent 12-month period ended June 30 is available at www.bnymellonim.com/us and on the SEC’s website at www.sec.gov and without charge, upon request, by calling 1-800-373-9387.
| | |
© 2020 BNY Mellon Securities Corporation
6327AR1020 | 
|
Item 2. Code of Ethics.
The Registrant has adopted a code of ethics that applies to the Registrant's principal executive officer, principal financial officer, principal accounting officer or controller, or persons performing similar functions. There have been no amendments to, or waivers in connection with, the Code of Ethics during the period covered by this Report.
Item 3. Audit Committee Financial Expert.
The Registrant's Board has determined that Joseph S. DiMartino, a member of the Audit Committee of the Board, is an audit committee financial expert as defined by the Securities and Exchange Commission (the "SEC"). Mr. DiMartino is "independent" as defined by the SEC for purposes of audit committee financial expert determinations.
Item 4. Principal Accountant Fees and Services.
(a) Audit Fees. The aggregate fees billed for each of the last two fiscal years (the "Reporting Periods") for professional services rendered by the Registrant's principal accountant (the "Auditor") for the audit of the Registrant's annual financial statements or services that are normally provided by the Auditor in connection with the statutory and regulatory filings or engagements for the Reporting Periods, were $99,840 in 2019 and $93,840 in 2020.
(b) Audit-Related Fees. The aggregate fees billed in the Reporting Periods for assurance and related services by the Auditor that are reasonably related to the performance of the audit of the Registrant's financial statements and are not reported under paragraph (a) of this Item 4 were $15,960 in 2019 and $15,960 in 2020. These services consisted of one or more of the following: (i) agreed upon procedures related to compliance with Internal Revenue Code section 817(h), (ii) security counts required by Rule 17f-2 under the Investment Company Act of 1940, as amended, (iii) advisory services as to the accounting or disclosure treatment of Registrant transactions or events and (iv) advisory services to the accounting or disclosure treatment of the actual or potential impact to the Registrant of final or proposed rules, standards or interpretations by the Securities and Exchange Commission, the Financial Accounting Standards Boards or other regulatory or standard-setting bodies.
The aggregate fees billed in the Reporting Periods for non-audit assurance and related services by the Auditor to the Registrant's investment adviser (not including any sub-investment adviser whose role is primarily portfolio management and is subcontracted with or overseen by another investment adviser), and any entity controlling, controlled by or under common control with the investment adviser that provides ongoing services to the Registrant ("Service Affiliates"), that were reasonably related to the performance of the annual audit of the Service Affiliate, which required pre-approval by the Audit Committee were $0 in 2019 and $0 in 2020.
(c) Tax Fees. The aggregate fees billed in the Reporting Periods for professional services rendered by the Auditor for tax compliance, tax advice, and tax planning ("Tax Services") were $9,930 in 2019 and $0 in 2020. These services consisted of: (i) review or preparation of U.S. federal, state, local and excise tax returns; (ii) tax advice regarding tax qualification matters and/or treatment of various financial instruments held or proposed to be acquired or held, and (iii) determination of Passive Foreign Investment. The aggregate fees billed in the Reporting Periods for Tax Services by the Auditor to Service Affiliates, which required pre-approval by the Audit Committee were $0 in 2019 and $0 in 2020.
(d) All Other Fees. The aggregate fees billed in the Reporting Periods for products and services provided by the Auditor, other than the services reported in paragraphs (a) through (c) of this Item, were $0 in 2019 and $0 in 2020.
The aggregate fees billed in the Reporting Periods for Non-Audit Services by the Auditor to Service Affiliates, other than the services reported in paragraphs (b) through (c) of this Item, which required pre-approval by the Audit Committee, were $0 in 2019 and $0 in 2020.
(e)(1) Audit Committee Pre-Approval Policies and Procedures. The Registrant's Audit Committee has established policies and procedures (the "Policy") for pre-approval (within specified fee limits) of the Auditor's engagements for non-audit services to the Registrant and Service Affiliates without specific case-by-case consideration. The pre-approved services in the Policy can include pre-approved audit services, pre-approved audit-related services, pre-approved tax services and pre-approved all other services. Pre-approval considerations include whether the proposed services are compatible with maintaining the Auditor's independence. Pre-approvals pursuant to the Policy are considered annually.
(e)(2) Note. None of the services described in paragraphs (b) through (d) of this Item 4 were approved by the Audit Committee pursuant to paragraph (c)(7)(i)(C) of Rule 2-01 of Regulation S-X.
(f) None of the hours expended on the principal accountant's engagement to audit the registrant's financial statements for the most recent fiscal year were attributed to work performed by persons other than the principal accountant's full-time, permanent employees.
Non-Audit Fees. The aggregate non-audit fees billed by the Auditor for services rendered to the Registrant, and rendered to Service Affiliates, for the Reporting Periods were $463,000 in 2019 and $472,000 in 2020.
Auditor Independence. The Registrant's Audit Committee has considered whether the provision of non-audit services that were rendered to Service Affiliates, which were not pre-approved (not requiring pre-approval), is compatible with maintaining the Auditor's independence.
Item 5. Audit Committee of Listed Registrants.
Not applicable.
Item 6. Investments.
(a) Not applicable.
Item 7. Disclosure of Proxy Voting Policies and Procedures for Closed-End Management Investment Companies.
Not applicable.
Item 8. Portfolio Managers of Closed-End Management Investment Companies.
Not applicable.
Item 9. Purchases of Equity Securities by Closed-End Management Investment Companies and Affiliated Purchasers.
Not applicable.
Item 10. Submission of Matters to a Vote of Security Holders.
There have been no material changes to the procedures applicable to Item 10.
Item 11. Controls and Procedures.
(a) The Registrant's principal executive and principal financial officers have concluded, based on their evaluation of the Registrant's disclosure controls and procedures as of a date within 90 days of the filing date of this report, that the Registrant's disclosure controls and procedures are reasonably designed to ensure that information required to be disclosed by the Registrant on Form N-CSR is recorded, processed, summarized and reported within the required time periods and that information required to be disclosed by the Registrant in the reports that it files or submits on Form N-CSR is accumulated and communicated to the Registrant's management, including its principal executive and principal financial officers, as appropriate to allow timely decisions regarding required disclosure.
(b) There were no changes to the Registrant's internal control over financial reporting that occurred during the second fiscal quarter of the period covered by this report that have materially affected, or are reasonably likely to materially affect, the Registrant's internal control over financial reporting.
Item 12. Disclosure of Securities Lending Activities for Closed-End Management Investment Companies.
Not applicable.
Item 13. Exhibits.
(a)(1) Code of ethics referred to in Item 2.
(a)(2) Certifications of principal executive and principal financial officers as required by Rule 30a-2(a) under the Investment Company Act of 1940.
(a)(3) Not applicable.
(b) Certification of principal executive and principal financial officers as required by Rule 30a-2(b) under the Investment Company Act of 1940.
SIGNATURES
Pursuant to the requirements of the Securities Exchange Act of 1934 and the Investment Company Act of 1940, the Registrant has duly caused this Report to be signed on its behalf by the undersigned, thereunto duly authorized.
BNY Mellon Investment Funds II, Inc.
By: /s/ Renee LaRoche-Morris
Renee LaRoche-Morris
President (Principal Executive Officer)
Date: December 22, 2020
Pursuant to the requirements of the Securities Exchange Act of 1934 and the Investment Company Act of 1940, this Report has been signed below by the following persons on behalf of the Registrant and in the capacities and on the dates indicated.
By: /s/ Renee LaRoche-Morris
Renee LaRoche-Morris
President (Principal Executive Officer)
Date: December 22, 2020
By: /s/ James Windels
James Windels
Treasurer (Principal Financial Officer)
Date: December 22, 2020
EXHIBIT INDEX
(a)(1) Code of ethics referred to in Item 2.
(a)(2) Certifications of principal executive and principal financial officers as required by Rule 30a-2(a) under the Investment Company Act of 1940. (EX-99.CERT)
(b) Certification of principal executive and principal financial officers as required by Rule 30a-2(b) under the Investment Company Act of 1940. (EX-99.906CERT)


