UNITED STATES
SECURITIES AND EXCHANGE COMMISSION
Washington, D.C. 20549
FORM N-CSR
CERTIFIED SHAREHOLDER REPORT OF REGISTERED MANAGEMENT
INVESTMENT COMPANIES
Investment Company Act file number | 811-22912 |
| |
| Dreyfus BNY Mellon Funds, Inc. | |
| (Exact name of Registrant as specified in charter) | |
| | |
| c/o The Dreyfus Corporation 200 Park Avenue New York, New York 10166 | |
| (Address of principal executive offices) (Zip code) | |
| | |
| Bennett A. MacDougall, Esq. 200 Park Avenue New York, New York 10166 | |
| (Name and address of agent for service) | |
|
Registrant's telephone number, including area code: | (212) 922-6400 |
| |
Date of fiscal year end: | 10/31 | |
Date of reporting period: | 10/31/18 | |
| | | | | | | |
FORM N-CSR
Item 1. Reports to Stockholders.
Dreyfus Alternative Diversifier Strategies Fund
| | | |

| | ANNUAL REPORT October 31, 2018 |
| |
Save time. Save paper. View your next shareholder report online as soon as it’s available. Log into www.dreyfus.com and sign up for Dreyfus eCommunications. It’s simple and only takes a few minutes. |
| |
The views expressed in this report reflect those of the portfolio manager(s) only through the end of the period covered and do not necessarily represent the views of Dreyfus or any other person in the Dreyfus organization. Any such views are subject to change at any time based upon market or other conditions and Dreyfus disclaims any responsibility to update such views. These views may not be relied on as investment advice and, because investment decisions for a Dreyfus fund are based on numerous factors, may not be relied on as an indication of trading intent on behalf of any Dreyfus fund. |
| |
Not FDIC-Insured • Not Bank-Guaranteed • May Lose Value |
Contents
THE FUND
FOR MORE INFORMATION
Back Cover
| | | | |
| |
Dreyfus Alternative Diversifier Strategies Fund
| | The Fund |
A LETTER FROM THE PRESIDENT OF DREYFUS
Dear Shareholder:
We are pleased to present this annual report for Dreyfus Alternative Diversifier Strategies Fund, covering the 12-month period from November 1, 2017 through October 31, 2018. For information about how the fund performed during the reporting period, as well as general market perspectives, we provide a Discussion of Fund Performance on the pages that follow.
Markets began the reporting period on solid footing as major global economies experienced above-trend growth across the board. In the United States, the Federal Reserve continued to move away from its accommodative monetary policy while other major central banks also began to consider monetary tightening. In the equity markets, both U.S. and non-U.S. markets enjoyed an upward trend, though investor concerns about volatility and inflation later began to weigh on returns. Interest rates rose across the curve, putting pressure on bond prices.
Later in the reporting period, global growth trends began to diverge. While a strong economic performance continued to bolster U.S. equity markets, slower growth and political concerns pressured markets in the Eurozone. Emerging markets also came under pressure as weakness in their currencies added to investors’ uneasiness. Fixed income markets continued to struggle as interest rates rose; the yield on the benchmark 10-year Treasury bond surged late in the reporting period, but growing investor concerns about global growth helped keep it from rising further.
Despite continuing doubts regarding trade, U.S. inflationary pressures, and global growth, we are optimistic that the U.S. economy will remain strong in the near term. However, we will stay attentive to signs that signal potential changes on the horizon. As always, we encourage you to discuss the risks and opportunities of today’s investment environment with your financial advisor.
Thank you for your continued confidence and support.
Sincerely,

Renee Laroche-Morris
President
The Dreyfus Corporation
November 15, 2018
2
DISCUSSION OF FUND PERFORMANCE (Unaudited)
For the period from November 1, 2017 through October 31, 2018, as provided by Jeffrey M. Mortimer, CFA, and Caroline Lee-Tsao, Portfolio Managers
Market and Fund Performance Overview
For the 12-month period ended October 31, 2018, Dreyfus Alternative Diversifier Strategies Fund’s Class A shares produced a total return of -2.89%, Class C shares returned -3.90%, Class I shares returned -2.60%, and Class Y shares returned -2.43%.1 In comparison, the S&P 500® Index (the “Index”) returned 7.35% for the same period, and the Lipper Alternative Multi-Strategy Funds Index (the “Lipper Index”) produced a total return of -2.29% for the period.2,3
Global financial markets generally posted mixed returns over the reporting period, in an environment of uneven global economic growth and rising interest rates. The fund lagged its benchmarks, mainly due to shortfalls in the ASG Managed Futures Strategy Fund, the BNY Mellon Absolute Insight Multi-Strategy Fund, and the DFA Commodity Strategy Portfolio.
The Fund’s Investment Approach
The fund seeks long-term capital appreciation. To pursue its goal, the fund normally allocates its assets across non-traditional or “alternative” asset classes and investment strategies. The fund is designed to complement and diversify traditional stock and bond portfolios. The fund normally allocates its assets among other investment companies (the underlying funds) that employ alternative investment strategies. The fund seeks to achieve its investment objective by allocating its assets among asset classes and investment strategies that typically have had a low correlation to each other and to traditional equity and fixed-income asset classes. The fund currently intends to allocate its assets among underlying funds that employ the following alternative investment strategies: long/short strategies, absolute return hedge strategies, real estate-related strategies, commodities strategies, global macro strategies, and managed futures strategies.
As of October 31, 2018, the fund held positions in 10 underlying funds: AQR Managed Futures Strategy Fund, ASG Global Alternatives Fund, ASG Managed Futures Strategy Fund, DFA Commodity Strategy Portfolio, Dynamic Total Return Fund, Dreyfus Select Managers Long/Short Fund, Dreyfus Global Real Estate Securities Fund, Dreyfus Global Real Return Fund, BNY Mellon Absolute Insight Multi-Strategy Fund, and Neuberger Berman Long/Short Fund.
Economic Growth Amid Rising Volatility
Global equity markets gained ground early in the reporting period, supported by improving economic conditions and rising corporate earnings. Asian equity markets led the advance, as Japanese equities responded positively to upward revisions of domestic growth forecasts. U.S. stocks posted gains when tax reform legislation reduced
3
DISCUSSION OF FUND PERFORMANCE (Unaudited) (continued)
corporate tax rates. Global growth trends enabled U.K. equities to climb, despite concerns regarding the country’s exit from the European Union, but Eurozone markets lagged global market averages, despite improving regional economic fundamentals.
Markets saw heightened volatility and declining stock prices early in the reporting period, sparked by perceived U.S. inflationary pressures and uncertainties surrounding the possibility of more protectionist U.S. trade policies. U.S. equities were also helped by the relative outperformance of the U.S. economy and stronger-than-expected U.S. earnings.
The economic backdrop for investors was challenging in the second half of the reporting period. While the trade dispute between the U.S. and a number of its important trading partners intensified, the combination of strong U.S. growth, higher U.S. rates, and an associated strong dollar made the quarter difficult for emerging-market currencies. The fundamentals for most of the emerging-market countries were little changed, but problems in countries such as Turkey led to confidence-related contagion effects across the investment space. As we approached the end of the period, political issues weighed on some markets, especially in Europe, related to Italy’s fiscal stand-off with the European Union and the U.K.’s Brexit negotiations.
Underlying Strategies Produced Mixed Results
The fund’s performance compared to the Index and the Lipper Index was constrained over the reporting period by relatively weak results from some of its underlying funds. ASG Managed Futures Strategy Fund hindered performance, as a result of its equity and fixed-income allocations. BNY Mellon Absolute Insight Multi-Strategy Fund underperformed and hindered overall returns due to its exposure to emerging-market debt, and the DFA Commodity Strategy Portfolio hurt performance, as a result of weakness in commodities markets.
The fund achieved better relative results from two underlying funds. ASG Global Alternatives Fund performed well on long positions in U.S. and Japanese equities, as well as short positions in fixed income. Dreyfus Global Real Estate Securities Fund contributed positively to performance via successful stock selections in the U.S., Europe, and Hong Kong.
In January 2018, to achieve greater diversification in the long/short category, we reduced the fund’s allocation to Dreyfus Select Managers Long/Short Fund and redeployed those assets to a new investment in Neuberger Berman Long/Short Fund.
Maintaining a Focus on Diversification
We expect financial markets to remain volatile over the remainder of 2018 and into 2019 in response to changing monetary policies, geopolitical tensions, and economic developments. In our judgment, the fund’s various diversification strategies can help reduce the impact of heightened market volatility on investors’ overall investment
4
portfolios, and we intend to continue to mitigate the risks of investing in stocks and bonds by diversifying across several alternative asset classes.
November 15, 2018
1 Total return includes reinvestment of dividends and any capital gains paid and does not take into consideration the maximum initial sales charge in the case of Class A shares, or the applicable contingent deferred sales charge imposed on redemptions in the case of Class C shares. Had these charges been reflected, returns would have been lower. Share price, yield, and investment return fluctuate such that upon redemption, fund shares may be worth more or less than their original cost. Return figures provided reflect the absorption of certain fund expenses pursuant to an agreement by The Dreyfus Corporation in effect until March 1, 2019, at which time it may be extended, terminated, or modified. Had these expenses not been absorbed, the fund’s returns would have been lower. Past performance is no guarantee of future results.
² Source: Lipper Inc. — The S&P 500® Index is widely regarded as the best single gauge of large-cap U.S. equities. The index includes 500 leading companies and captures approximately 80% coverage of available market capitalization.
3 Source: Factset. Lipper Alternative Multi-Strategy Funds Index consists of funds that, by prospectus language, seek total returns through the management of several different hedge-like strategies. These funds are typically quantitatively driven to measure the existing relationship between instruments and in some cases to identify positions in which the risk-adjusted spread between these instruments represents an opportunity for the investment manager. Investors cannot invest directly in any index.
Equities are subject generally to market, market sector, market liquidity, issuer, and investment style risks, among other factors, to varying degrees, all of which are more fully described in the fund’s prospectus. Bonds are subject generally to interest-rate, credit, liquidity, call, sector, and market risks, to varying degrees, all of which are more fully described in the fund’s prospectus.
Investing internationally involves special risks, including changes in currency exchange rates, political, economic, and social instability, a lack of comprehensive company information, differing auditing and legal standards, and less market liquidity. These risks generally are greater with emerging market countries than with more economically and politically established foreign countries.
Short sales involve selling a security the fund does not own in anticipation that the security’s price will decline. Short sales may involve substantial risk and leverage and expose the fund to the risk that it will be required to buy the security sold short at a time when the security has appreciated in value, thus resulting in a loss to the fund. Short positions in stocks involve more risk than long positions in stocks because the maximum sustainable loss on a stock purchased is limited to the amount paid for the stock plus the transaction costs, whereas there is no maximum attainable price on the shorted stock. In theory, stocks sold short have unlimited risk. It is possible that the market value of securities the fund holds in long positions will decline at the same time that the market value of the securities the fund has sold short increases, thereby increasing the fund’s potential volatility. Leveraging occurs when the fund increases its assets available for investment using borrowing or similar transactions. Short sales effectively leverage the fund’s assets. The use of leverage may magnify the fund’s gains or losses.
Exposure to the commodities markets may subject the fund to greater volatility than investments in traditional securities. The values of commodities and commodity-linked investments are affected by events that might have less impact on the values of stocks and bonds. Investments linked to the prices of commodities are considered speculative. Prices of commodities and related contracts may fluctuate significantly over short periods due to a variety of factors.
The underlying funds’ underlying strategies may use derivative instruments, such as options, futures, options on futures, forward contracts, swaps (including credit default swaps on corporate bonds and asset-backed securities), options on swaps, and other credit derivatives. A small investment in derivatives could have a potentially large impact on the fund’s performance. The use of derivatives involves risks different from, or possibly greater than, the risks associated with investing directly in the underlying assets.
The ability of the fund to achieve its investment goal depends, in part, on the ability of Dreyfus to allocate effectively the fund’s assets among the investment strategies and the underlying funds.
5
FUND PERFORMANCE (Unaudited)
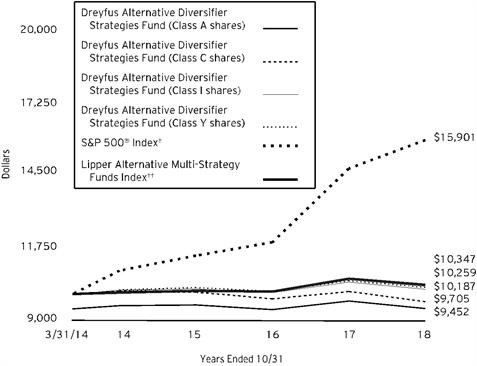
Comparison of change in value of $10,000 investment in Dreyfus Alternative Diversifier Strategies Fund Class A shares, Class C shares, Class I shares and Class Y shares and S&P 500® Index and Lipper Alternative Multi-Strategy Funds Index
† Source: Lipper Inc.
†† Source: FactSet.
Past performance is not predictive of future performance.
The above graph compares a $10,000 investment made in each of the Class A, Class C, Class I and Class Y shares of Dreyfus Alternative Diversifier Strategies Fund on 3/31/14 (inception date) to a $10,000 investment made in the S&P 500® Index and Lipper Alternative Multi-Strategy Funds Index on that date. All dividends and capital gain distributions are reinvested.
The fund’s performance shown in the line graph above takes into account the maximum initial sales charge on Class A shares and all other applicable fees and expenses on all classes. The S&P 500® Index is widely regarded as the best single gauge of large-cap U.S. equities. The Index includes 500 leading companies and captures approximately 80% coverage of available market capitalization. The Lipper Alternative Multi-Strategy Funds Index consists of funds that, by prospectus language, seek total returns through the management of several different hedge-like strategies. These funds are typically quantitatively driven to measure the existing relationship between instruments and in some cases to identify positions in which the risk-adjusted spread between these instruments represents an opportunity for the investment manager. Unlike a mutual fund, the Index is not subject to charges, fees and other expenses. Investors cannot invest directly in any index. These factors can contribute to the Index potentially outperforming the fund. Further information relating to fund performance, including expense reimbursements, if applicable, is contained in the Financial Highlights section of the prospectus and elsewhere in this report.
6
| | | | |
Average Annual Total Returns as of 10/31/18 |
| | Inception | | From |
| Date | 1 Year | Inception |
Class A shares | | | |
with maximum sales charge (5.75%) | 3/31/14 | -8.46% | -1.22% |
without sales charge | 3/31/14 | -2.89% | 0.06% |
Class C shares | | | |
with applicable redemption charge† | 3/31/14 | -4.86% | -0.65% |
without redemption | 3/31/14 | -3.90% | -0.65% |
Class I shares | 3/31/14 | -2.60% | 0.41% |
Class Y shares | 3/31/14 | -2.43% | 0.56% |
S&P 500® Index | 3/31/14 | 7.35% | 10.65%†† |
Lipper Alternative
Multi-Strategy Funds Index | 3/31/14 | -2.29% | 0.75%†† |
† The maximum contingent deferred sales charge for Class C shares is 1% for shares redeemed within one year of the date of purchase.
†† Index date is based on the inception date of the fund.
The performance data quoted represents past performance, which is no guarantee of future results. Share price and investment return fluctuate and an investor’s shares may be worth more or less than original cost upon redemption. Current performance may be lower or higher than the performance quoted. Go to Dreyfus.com for the fund’s most recent month-end returns.
The fund’s performance shown in the graph and table does not reflect the deduction of taxes that a shareholder would pay on fund distributions or the redemption of fund shares. In addition to the performance of Class A shares shown with and without a maximum sales charge, the fund’s performance shown in the table takes into account all other applicable fees and expenses on all classes.
7
UNDERSTANDING YOUR FUND’S EXPENSES (Unaudited)
As a mutual fund investor, you pay ongoing expenses, such as management fees and other expenses. Using the information below, you can estimate how these expenses affect your investment and compare them with the expenses of other funds. You also may pay one-time transaction expenses, including sales charges (loads) and redemption fees, which are not shown in this section and would have resulted in higher total expenses. For more information, see your fund’s prospectus or talk to your financial adviser.
Review your fund’s expenses
The table below shows the expenses you would have paid on a $1,000 investment in Dreyfus Alternative Diversifier Strategies Fund from May 1, 2018 to October 31, 2018. It also shows how much a $1,000 investment would be worth at the close of the period, assuming actual returns and expenses.
| | | | | | | | | | |
Expenses and Value of a $1,000 Investment |
assuming actual returns for the six months ended October 31, 2018 |
| | | Class A | | Class C | | Class I | | Class Y | |
Expenses paid per $1,000† | | $3.99 | | $7.72 | | $1.90 | | $1.50 | |
Ending value (after expenses) | | $979.20 | | $975.00 | | $981.60 | | $982.50 | |
COMPARING YOUR FUND’S EXPENSES
WITH THOSE OF OTHER FUNDS (Unaudited)
Using the SEC’s method to compare expenses
The Securities and Exchange Commission (“SEC”) has established guidelines to help investors assess fund expenses. Per these guidelines, the table below shows your fund’s expenses based on a $1,000 investment, assuming a hypothetical 5% annualized return. You can use this information to compare the ongoing expenses (but not transaction expenses or total cost) of investing in the fund with those of other funds. All mutual fund shareholder reports will provide this information to help you make this comparison. Please note that you cannot use this information to estimate your actual ending account balance and expenses paid during the period.
| | | | | | | | | | |
Expenses and Value of a $1,000 Investment |
assuming a hypothetical 5% annualized return for the six months ended October 31, 2018 |
| | | Class A | | Class C | | Class I | | Class Y | |
Expenses paid per $1,000† | | $4.08 | | $7.88 | | $1.94 | | $1.53 | |
Ending value (after expenses) | | $1,021.17 | | $1,017.39 | | $1,023.29 | | $1,023.69 | |
† Expenses are equal to the fund’s annualized expense ratio of .80% for Class A, 1.55% for Class C, .38% for Class I and .30% for Class Y, multiplied by the average account value over the period, multiplied by 184/365 (to reflect the one-half year period).
8
STATEMENT OF INVESTMENTS
October 31, 2018
| | | | | | | | |
| |
Description | | | | Shares | | Value ($) | |
Investment Companies - 99.2% | | | | | |
Alternative Investments - 20.3% | | | | | |
AQR Managed Futures Strategy Fund, Cl. I | | | | 3,119,826 | a | 27,204,882 | |
ASG Global Alternatives Fund, Cl. Y | | | | 2,708,529 | | 29,739,648 | |
ASG Managed Futures Strategy Fund, Cl. Y | | | | 2,897,179 | | 26,132,554 | |
DFA Commodity Strategy Portfolio | | | | 1,407,318 | | 8,035,784 | |
| | | | | 91,112,868 | |
Domestic Equity - 34.6% | | | | | |
Dreyfus Select Managers Long/Short Fund, Cl. Y | | | | 7,296,451 | b | 90,621,925 | |
Neuberger Berman Long Short Fund, Institutional Class | | | | 4,425,936 | a | 64,353,111 | |
| | | | | 154,975,036 | |
Domestic Fixed Income - 10.0% | | | | | |
BNY Mellon Absolute Insight Multi-Strategy Fund, Cl. Y | | | | 3,617,502 | b | 44,748,500 | |
Foreign Equity - 21.9% | | | | | |
Dreyfus Global Real Estate Securities Fund, Cl. Y | | | | 6,233,888 | b | 54,421,843 | |
Dreyfus Global Real Return Fund, Cl. Y | | | | 3,034,527 | b | 43,666,842 | |
| | | | | 98,088,685 | |
Foreign Fixed Income - 12.4% | | | | | |
Dreyfus Dynamic Total Return Fund, CI. Y | | | | 3,575,568 | b | 55,528,574 | |
Total Investments (cost $449,518,212) | | 99.2% | | 444,453,663 | |
Cash and Receivables (Net) | | .8% | | 3,599,948 | |
Net Assets | | 100.0% | | 448,053,611 | |
a Non-income producing security.
b Investment in affiliated issuer. The investment objective of this investment company is publicly available and can be found within the investment company’s prospectus.
| | |
Portfolio Summary (Unaudited) † | Value (%) |
Investment Companies | 99.2 |
| | 99.2 |
† Based on net assets.
See notes to financial statements.
9
STATEMENT OF INVESTMENTS IN AFFILIATED ISSUERS
| | | | | |
Registered Investment Companies | Value
10/31/17 ($) | Purchases ($)† | Sales ($) | Net Realized Gains (Loss) ($) |
BNY Mellon Absolute Insight Multi-Strategy Fund, Cl.Y | 47,189,731 | 2,356,465 | 3,852,198 | 14,782 |
Dreyfus Global Real Estate Securities Fund, Cl.Y | 55,560,046 | 4,565,946 | 3,852,198 | (84,370) |
Dreyfus Global Real Return Fund, Cl.Y | 45,387,852 | 2,448,079 | 3,852,198 | (127,014) |
Dreyfus Select Managers Long/Short Fund, Cl.Y | 164,809,381 | 2,973,171 | 74,445,744 | 1,584,286 |
Dynamic Total Return Fund, Cl.Y | 60,317,694 | 5,413,405 | 4,815,248 | (160,602) |
Total | 373,264,704 | 17,757,066 | 90,817,586 | 1,227,082 |
| | | | | |
Registered Investment Companies | Change in Net Unrealized Appreciation (Depreciation) ($) | Value
10/31/18 ($) | Net
Assets (%) | Dividends/
Distributions ($) |
BNY Mellon Absolute Insight Multi-Strategy Fund, Cl.Y | (960,280) | 44,748,500 | 10.0 | 326,351 |
Dreyfus Global Real Estate Securities Fund, Cl.Y | (1,767,581) | 54,421,843 | 12.2 | 2,535,830 |
Dreyfus Global Real Return Fund, Cl.Y | (189,877) | 43,666,842 | 9.7 | 417,963 |
Dreyfus Select Managers Long/Short Fund, Cl.Y | (4,299,169) | 90,621,925 | 20.2 | 1,523,778 |
Dynamic Total Return Fund, Cl.Y | (5,226,675) | 55,528,574 | 12.4 | 2,875,759 |
Total | (12,443,582) | 288,987,684 | 64.5 | 7,679,681 |
† Includes reinvested dividend/distributions.
See notes to financial statements.
10
STATEMENT OF ASSETS AND LIABILITIES
October 31, 2018
| | | | | | | |
| | | | | | |
| | | Cost | | Value | |
Assets ($): | | | | |
Investments in securities—See Statement of Investments: | | | |
Unaffiliated issuers | 165,308,692 | | 155,465,979 | |
Affiliated issuers | | 284,209,520 | | 288,987,684 | |
Cash | | | | | 4,887,529 | |
Receivable for shares of Common Stock subscribed | | 324,858 | |
Receivable for investment securities sold | | 112,471 | |
Interest receivable | | 25,903 | |
Prepaid expenses | | | | | 16,633 | |
| | | | | 449,821,057 | |
Liabilities ($): | | | | |
Due to The Dreyfus Corporation and affiliates—Note 3(c) | | | | 102,817 | |
Payable for shares of Common Stock redeemed | | 1,599,482 | |
Directors fees and expenses payable | | 3,539 | |
Accrued expenses | | | | | 61,608 | |
| | | | | 1,767,446 | |
Net Assets ($) | | | 448,053,611 | |
Composition of Net Assets ($): | | | | |
Paid-in capital | | | | | 458,187,259 | |
Total distributable earnings (loss) | | | | | (10,133,648) | |
Net Assets ($) | | | 448,053,611 | |
| | | | | | |
Net Asset Value Per Share | Class A | Class C | Class I | Class Y | |
Net Assets ($) | 59,304 | 26,415 | 1,446,087 | 446,521,805 | |
Shares Outstanding | 4,846 | 2,187 | 117,833 | 36,222,282 | |
Net Asset Value Per Share ($) | 12.24 | 12.08 | 12.27 | 12.33 | |
| | | | | | |
See notes to financial statements. | | | | | |
11
STATEMENT OF OPERATIONS
Year Ended October 31, 2018
| | | | | | | |
| | | | | | |
| | | | | | |
Investment Income ($): | | | | |
Income: | | | | |
Cash dividends: | |
Unaffiliated issuers | | | 493,116 | |
Affiliated issuers | | | 2,135,020 | |
Interest | | | 15,595 | |
Total Income | | | 2,643,731 | |
Expenses: | | | | |
Management fee—Note 3(a) | | | 1,169,914 | |
Professional fees | | | 93,502 | |
Registration fees | | | 59,504 | |
Directors’ fees and expenses—Note 3(d) | | | 33,690 | |
Loan commitment fees—Note 2 | | | 7,889 | |
Prospectus and shareholders’ reports | | | 6,375 | |
Custodian fees—Note 3(c) | | | 2,210 | |
Shareholder servicing costs—Note 3(c) | | | 1,743 | |
Distribution fees—Note 3(b) | | | 204 | |
Miscellaneous | | | 35,229 | |
Total Expenses | | | 1,410,260 | |
Less—reduction in expenses due to undertaking—Note 3(a) | | | (42) | |
Less—reduction in fees due to earnings credits—Note 3(c) | | | (2,210) | |
Net Expenses | | | 1,408,008 | |
Investment Income—Net | | | 1,235,723 | |
Realized and Unrealized Gain (Loss) on Investments—Note 4 ($): | | |
Net realized gain (loss) on investments: | | |
Unaffiliated issuers | | | | (1,307,067) | |
Affiliated issuers | | | | 1,227,082 | |
Capital gain distributions on unaffiliated issuers | 343,082 | |
Capital gain distributions from affiliated issuers | 5,544,661 | |
Net Realized Gain (Loss) | | | 5,807,758 | |
Net unrealized appreciation (depreciation) on investments: | | | | |
Unaffiliated issuers | | | | (5,967,990) | |
Affiliated issuers | | | | (12,443,582) | |
Net Unrealized Appreciation (Depreciation) | | | (18,411,572) | |
Net Realized and Unrealized Gain (Loss) on Investments | | | (12,603,814) | |
Net (Decrease) in Net Assets Resulting from Operations | | (11,368,091) | |
| | | | | | | |
See notes to financial statements. | | | | | |
12
STATEMENT OF CHANGES IN NET ASSETS
| | | | | | | | | | |
| | | | Year Ended October 31, |
| | | | 2018 | | 2017a | |
Operations ($): | | | | | | | | |
Investment income—net | | | 1,235,723 | | | | 2,512,616 | |
Net realized gain (loss) on investments | | 5,807,758 | | | | (2,898,637) | |
Net unrealized appreciation (depreciation)
on investments | | (18,411,572) | | | | 19,178,999 | |
Net Increase (Decrease) in Net Assets
Resulting from Operations | (11,368,091) | | | | 18,792,978 | |
Distributions ($): | |
Distributions to shareholders: | | | | | | | | |
Class A | | | (221) | | | | (50) | |
Class I | | | (7,692) | | | | (6,000) | |
Class Y | | | (3,843,329) | | | | (2,797,963) | |
Total Distributions | | | (3,851,242) | | | | (2,804,013) | |
Capital Stock Transactions ($): | |
Net proceeds from shares sold: | | | | | | | | |
Class A | | | - | | | | 9,425 | |
Class I | | | 2,431,791 | | | | 2,219,653 | |
Class Y | | | 45,731,957 | | | | 60,400,248 | |
Distributions reinvested: | | | | | | | | |
Class A | | | 130 | | | | 30 | |
Class I | | | 7,505 | | | | 5,167 | |
Class Y | | | 212,919 | | | | 183,395 | |
Cost of shares redeemed: | | | | | | | | |
Class A | | | (80) | | | | (11,685) | |
Class C | | | - | | | | (6,065) | |
Class I | | | (2,714,391) | | | | (1,821,945) | |
Class Y | | | (59,924,530) | | | | (110,203,081) | |
Increase (Decrease) in Net Assets
from Capital Stock Transactions | (14,254,699) | | | | (49,224,858) | |
Total Increase (Decrease) in Net Assets | (29,474,032) | | | | (33,235,893) | |
Net Assets ($): | |
Beginning of Period | | | 477,527,643 | | | | 510,763,536 | |
End of Period | | | 448,053,611 | | | | 477,527,643 | |
13
STATEMENT OF CHANGES IN NET ASSETS (continued)
| | | | | | | | | | |
| | | | Year Ended October 31, |
| | | | 2018 | | 2017a | |
Capital Share Transactions (Shares): | |
Class A | | | | | | | | |
Shares sold | | | - | | | | 766 | |
Shares issued for distributions reinvested | | | 11 | | | | 3 | |
Shares redeemed | | | - | | | | (950) | |
Net Increase (Decrease) in Shares Outstanding | 11 | | | | (181) | |
Class C | | | | | | | | |
Shares redeemed | | | - | | | | (497) | |
Net Increase (Decrease) in Shares Outstanding | - | | | | (497) | |
Class Ib | | | | | | | | |
Shares sold | | | 192,627 | | | | 178,678 | |
Shares issued for distributions reinvested | | | 591 | | | | 425 | |
Shares redeemed | | | (215,707) | | | | (147,707) | |
Net Increase (Decrease) in Shares Outstanding | (22,489) | | | | 31,396 | |
Class Yb | | | | | | | | |
Shares sold | | | 3,608,788 | | | | 4,875,013 | |
Shares issued for distributions reinvested | | | 16,726 | | | | 15,044 | |
Shares redeemed | | | (4,740,435) | | | | (8,909,527) | |
Net Increase (Decrease) in Shares Outstanding | (1,114,921) | | | | (4,019,470) | |
| | | | | | | | | | |
a Distributions to shareholders include only distributions from net investment income. Accumulated distribution in excess of investment income—net was $1,034,040 in 2017 and is no longer presented as a result of the adoption of SEC’s Disclosure Update and Simplification Rule. | |
b During the period ended October 31, 2018, 185,563 Class Y shares representing $2,352,291 were exchanged for 186,333 Class I shares and during the period ended October 31, 2017, 166,551 Class Y shares representing $2,077,653 were exchanged for 167,210 Class I shares. | |
See notes to financial statements.
| | | | | | | | |
14
FINANCIAL HIGHLIGHTS
The following tables describe the performance for each share class for the fiscal periods indicated. All information (except portfolio turnover rate) reflects financial results for a single fund share. Total return shows how much your investment in the fund would have increased (or decreased) during each period, assuming you had reinvested all dividends and distributions. These figures have been derived from the fund’s financial statements.
| | | | | | | |
| | | |
| | | Year Ended October 31, |
Class A Shares | | 2018 | 2017 | 2016 | 2015 | 2014a |
Per Share Data ($): | | | | | | |
Net asset value, beginning of period | | 12.65 | 12.23 | 12.54 | 12.67 | 12.50 |
Investment Operations: | | | | | | |
Investment income (loss)—netb | | (.03) | .01 | .06 | .07 | (.04) |
Net realized and unrealized
gain (loss) on investments | | (.33) | .42 | (.30) | (.04) | .21 |
Total from Investment Operations | | (.36) | .43 | (.24) | .03 | .17 |
Distributions: | | | | | | |
Dividends from investment income—net | | (.05) | (.01) | (.07) | (.16) | – |
Dividends from net realized
gain on investments | | – | – | – | (.00)c | – |
Total Distributions | | (.05) | (.01) | (.07) | (.16) | – |
Net asset value, end of period | | 12.24 | 12.65 | 12.23 | 12.54 | 12.67 |
Total Return (%)d | | (2.89) | 3.52 | (1.88) | .29 | 1.36e |
Ratios/Supplemental Data (%): | | | | | | |
Ratio of total expenses
to average net assetsf | | .86 | .82 | .85 | .86 | 1.02g |
Ratio of net expenses
to average net assetsf | | .80 | .75 | .79 | .80 | .54 g |
Ratio of net investment income (loss)
to average net assetsf | | (.24) | .07 | .48 | .58 | (.53)g |
Portfolio Turnover Rate | | 19.18 | 16.45 | 20.39 | 16.73 | .09e |
Net Assets, end of period ($ x 1,000) | | 59 | 61 | 61 | 62 | 57 |
a From March 31, 2014 (commencement of operations) to October 31, 2014.
b Based on average shares outstanding.
c Amount represents less than $.01 per share.
d Exclusive of sales charge.
e Not annualized.
f Amounts do not include the expenses of the underlying funds.
g Annualized.
See notes to financial statements.
15
FINANCIAL HIGHLIGHTS (continued)
| | | | | | | |
| | | |
| | | Year Ended October 31, |
Class C Shares | | 2018 | 2017 | 2016 | 2015 | 2014a |
Per Share Data ($): | | | | | | |
Net asset value, beginning of period | | 12.57 | 12.22 | 12.54 | 12.64 | 12.50 |
Investment Operations: | | | | | | |
Investment (loss)—netb | | (.12) | (.08) | (.02) | (.05) | (.10) |
Net realized and unrealized
gain (loss) on investments | | (.37) | .43 | (.30) | .00c | .24 |
Total from Investment Operations | | (.49) | .35 | (.32) | (.05) | .14 |
Distributions: | | | | | | |
Dividends from investment income—net | | – | – | – | (.05) | – |
Dividends from net realized
gain on investments | | – | – | – | (.00)c | – |
Total Distributions | | – | – | – | (.05) | – |
Net asset value, end of period | | 12.08 | 12.57 | 12.22 | 12.54 | 12.64 |
Total Return (%)d | | (3.90) | 2.86 | (2.55) | (.37) | 1.12e |
Ratios/Supplemental Data (%): | | | | | | |
Ratio of total expenses
to average net assetsf | | 1.59 | 1.41 | 1.44 | 1.59 | 2.16g |
Ratio of net expenses
to average net assetsf | | 1.55 | 1.41 | 1.44 | 1.50 | 1.34g |
Ratio of net investment (loss)
to average net assetsf | | (.99) | (.63) | (.16) | (.36) | (1.34)g |
Portfolio Turnover Rate | | 19.18 | 16.45 | 20.39 | 16.73 | .09e |
Net Assets, end of period ($ x 1,000) | | 26 | 27 | 33 | 34 | 39 |
a From March 31, 2014 (commencement of operations) to October 31, 2014.
b Based on average shares outstanding.
c Amount represents less than $.01 per share.
d Exclusive of sales charge.
e Not annualized.
f Amounts do not include the expenses of the underlying funds.
g Annualized.
See notes to financial statements.
16
| | | | | | | |
| | | |
| | | Year Ended October 31, |
Class I Shares | | 2018 | 2017 | 2016 | 2015 | 2014a |
Per Share Data ($): | | | | | | |
Net asset value, beginning of period | | 12.69 | 12.27 | 12.58 | 12.70 | 12.50 |
Investment Operations: | | | | | | |
Investment income (loss)—netb | | .01 | .05 | .10 | .03 | (.05) |
Net realized and unrealized
gain (loss) on investments | | (.34) | .43 | (.28) | .02 | .25 |
Total from Investment Operations | | (.33) | .48 | (.18) | .05 | .20 |
Distributions: | | | | | | |
Dividends from investment income—net | | (.09) | (.06) | (.13) | (.17) | – |
Dividends from net realized
gain on investments | | – | – | – | (.00)c | – |
Total Distributions | | (.09) | (.06) | (.13) | (.17) | – |
Net asset value, end of period | | 12.27 | 12.69 | 12.27 | 12.58 | 12.70 |
Total Return (%) | | (2.60) | 3.97 | (1.44) | .45 | 1.60d |
Ratios/Supplemental Data (%): | | | | | | |
Ratio of total expenses
to average net assetse | | .38 | .35 | .37 | .43 | 1.06f |
Ratio of net expenses
to average net assetse | | .38 | .35 | .37 | .41 | .52 f |
Ratio of net investment income (loss)
to average net assetse | | .08 | .43 | .79 | .23 | (.51) f |
Portfolio Turnover Rate | | 19.18 | 16.45 | 20.39 | 16.73 | .09d |
Net Assets, end of period ($ x 1,000) | | 1,446 | 1,780 | 1,336 | 633 | 119 |
a From March 31, 2014 (commencement of operations) to October 31, 2014.
b Based on average shares outstanding.
c Amount represents less than $.01 per share.
d Not annualized.
e Amounts do not include the expenses of the underlying funds.
f Annualized.
See notes to financial statements.
17
FINANCIAL HIGHLIGHTS (continued)
| | | | | | | |
| | | |
| | | Year Ended October 31, |
Class Y Shares | | 2018 | 2017 | 2016 | 2015 | 2014a |
Per Share Data ($): | | | | | | |
Net asset value, beginning of period | | 12.74 | 12.32 | 12.63 | 12.71 | 12.50 |
Investment Operations: | | | | | | |
Investment income (loss)—netb | | .03 | .06 | .11 | .13 | (.03) |
Net realized and unrealized
gain (loss) on investments | | (.34) | .43 | (.28) | (.03) | .24 |
Total from Investment Operations | | (.31) | .49 | (.17) | .10 | .21 |
Distributions: | | | | | | |
Dividends from investment income—net | | (.10) | (.07) | (.14) | (.18) | – |
Dividends from net realized
gain on investments | | – | – | – | (.00)c | – |
Total Distributions | | (.10) | (.07) | (.14) | (.18) | – |
Net asset value, end of period | | 12.33 | 12.74 | 12.32 | 12.63 | 12.71 |
Total Return (%) | | (2.43) | 4.01 | (1.39) | .82 | 1.68d |
Ratios/Supplemental Data (%): | | | | | | |
Ratio of total expenses
to average net assetse | | .30 | .29 | .30 | .31 | .36f |
Ratio of net expenses
to average net assetse | | .30 | .29 | .30 | .31 | .36f |
Ratio of net investment income (loss)
to average net assetse | | .27 | .52 | .92 | .99 | (.36)f |
Portfolio Turnover Rate | | 19.18 | 16.45 | 20.39 | 16.73 | .09d |
Net Assets, end of period ($ x 1,000) | | 446,522 | 475,659 | 509,333 | 477,866 | 373,341 |
a From March 31, 2014 (commencement of operations) to October 31, 2014.
b Based on average shares outstanding.
c Amount represents less than $.01 per share.
d Not annualized.
e Amounts do not include the expenses of the underlying funds.
f Annualized.
See notes to financial statements.
18
NOTES TO FINANCIAL STATEMENTS
NOTE 1—Significant Accounting Policies:
Dreyfus Alternative Diversifier Strategies Fund (the “fund”) is a separate diversified series of Dreyfus BNY Mellon Funds, Inc. (the “Company”), which is registered under the Investment Company Act of 1940, as amended (the “Act”), as an open-end management investment company and operates as a series company currently offering four series, including the fund. The fund’s investment objective is to seek long-term capital appreciation. The Dreyfus Corporation (the “Manager” or “Dreyfus”), a wholly-owned subsidiary of The Bank of New York Mellon Corporation (“BNY Mellon”), serves as the fund’s investment adviser.
MBSC Securities Corporation (the “Distributor”), a wholly-owned subsidiary of Dreyfus, is the distributor of the fund’s shares. The fund is authorized to issue 100 million shares of $.001 par value Common Stock in each of the following classes of shares: Class A, Class C, Class I, Class T and Class Y. Class A, Class C and Class T shares are sold primarily to retail investors through financial intermediaries and bear Distribution and/or Shareholder Services Plan fees. Class A and Class T shares generally are subject to a sales charge imposed at the time of purchase. Class C shares are subject to a contingent deferred sales charge (“CDSC”) imposed on Class C shares redeemed within one year of purchase. Class C shares automatically convert to Class A shares ten years after the date of purchase, without the imposition of a sales charge. Class I shares are sold primarily to bank trust departments and other financial service providers (including The Bank of New York Mellon, a subsidiary of BNY Mellon and an affiliate of Dreyfus, and its affiliates), acting on behalf of customers having a qualified trust or an investment account or relationship at such institution, and bear no Distribution or Shareholder Services Plan fees. Class Y shares are sold at net asset value per share generally to institutional investors, and bear no Distribution or Shareholder Services Plan fees. Class I and Class Y shares are offered without a front-end sales charge or CDSC. As of the date of this report, the fund did not offer Class T shares for purchase. Other differences between the classes include the services offered to and the expenses borne by each class, the allocation of certain transfer agency costs, and certain voting rights. Income, expenses (other than expenses attributable to a specific class), and realized and unrealized gains or losses on investments are allocated to each class of shares based on its relative net assets.
As of October 31, 2018, MBC Investments Corp., an indirect subsidiary of BNY Mellon, held 2,000 Class A and 2,000 Class C shares of the fund.
19
NOTES TO FINANCIAL STATEMENTS (continued)
The Company accounts separately for the assets, liabilities and operations of each series. Expenses directly attributable to each series are charged to that series’ operations; expenses which are applicable to all series are allocated among them on a pro rata basis.
The Financial Accounting Standards Board (“FASB”) Accounting Standards Codification is the exclusive reference of authoritative U.S. generally accepted accounting principles (“GAAP”) recognized by the FASB to be applied by nongovernmental entities. Rules and interpretive releases of the Securities and Exchange Commission (“SEC”) under authority of federal laws are also sources of authoritative GAAP for SEC registrants. The fund’s financial statements are prepared in accordance with GAAP, which may require the use of management estimates and assumptions. Actual results could differ from those estimates.
(a) Portfolio valuation: The fair value of a financial instrument is the amount that would be received to sell an asset or paid to transfer a liability in an orderly transaction between market participants at the measurement date (i.e., the exit price). GAAP establishes a fair value hierarchy that prioritizes the inputs of valuation techniques used to measure fair value. This hierarchy gives the highest priority to unadjusted quoted prices in active markets for identical assets or liabilities (Level 1 measurements) and the lowest priority to unobservable inputs (Level 3 measurements).
Additionally, GAAP provides guidance on determining whether the volume and activity in a market has decreased significantly and whether such a decrease in activity results in transactions that are not orderly. GAAP requires enhanced disclosures around valuation inputs and techniques used during annual and interim periods.
Various inputs are used in determining the value of the fund’s investments relating to fair value measurements. These inputs are summarized in the three broad levels listed below:
Level 1—unadjusted quoted prices in active markets for identical investments.
Level 2—other significant observable inputs (including quoted prices for similar investments, interest rates, prepayment speeds, credit risk, etc.).
Level 3—significant unobservable inputs (including the fund’s own assumptions in determining the fair value of investments).
The inputs or methodology used for valuing securities are not necessarily an indication of the risk associated with investing in those securities.
20
Investments are valued at the net asset value of each underlying fund determined as of the close of the New York Stock Exchange (generally 4 p.m., Eastern time) on the valuation date and are generally categorized within Level 1 of the fair value hierarchy.
The following is a summary of the inputs used as of October 31, 2018 in valuing the fund’s investments:
| | | | | |
| | Level 1 - Unadjusted Quoted Prices | Level 2 - Other Significant Observable Inputs | Level 3 -Significant Unobservable Inputs | Total |
Assets ($) | | | |
Investments in Securities: | | | |
Investment Companies | 444,453,663 | - | - | 444,453,663 |
At October 31, 2018, there were no transfers between levels of the fair value hierarchy. It is the fund’s policy to recognize transfers between levels at the end of the reporting period.
(b) Securities transactions and investment income: Securities transactions are recorded on a trade date basis. Realized gains and losses from securities transactions are recorded on the identified cost basis. Dividend income is recognized on the ex-dividend date and interest income, including, where applicable, accretion of discount and amortization of premium on investments, is recognized on the accrual basis.
(c) Affiliated issuers: Investments in other investment companies advised by Dreyfus are considered “affiliated” under the Act.
(d) Dividends and distributions to shareholders: Dividends and distributions are recorded on the ex-dividend date. Dividends from investment income-net and dividends from net realized capital gains, if any, are normally declared and paid annually, but the fund may make distributions on a more frequent basis to comply with the distribution requirements of the Internal Revenue Code of 1986, as amended (the “Code”). To the extent that net realized capital gains can be offset by capital loss carryovers, it is the policy of the fund not to distribute such gains. Income and capital gain distributions are determined in accordance with income tax regulations, which may differ from GAAP.
(e) Federal income taxes: It is the policy of the fund to continue to qualify as a regulated investment company, if such qualification is in the best interests of its shareholders, by complying with the applicable provisions of the Code, and to make distributions of taxable income and
21
NOTES TO FINANCIAL STATEMENTS (continued)
net realized capital gain sufficient to relieve it from substantially all federal income and excise taxes.
As of and during the period ended October 31, 2018, the fund did not have any liabilities for any uncertain tax positions. The fund recognizes interest and penalties, if any, related to uncertain tax positions as income tax expense in the Statement of Operations. During the period ended October 31, 2018, the fund did not incur any interest or penalties.
Each tax year in the four-year period ended October 31, 2018 remains subject to examination by the Internal Revenue Service and state taxing authorities.
At October 31, 2018, the components of accumulated earnings on a tax basis were as follows: undistributed capital gains $2,015,105 and unrealized depreciation $11,029,286. In addition, the fund deferred for tax purposes late year ordinary losses of $1,119,467 to the first day of the following fiscal year.
The tax character of distributions paid to shareholders during the fiscal periods ended October 31, 2018 and October 31, 2017 were as follows: ordinary income $3,851,242 and $2,804,013, respectively.
(f) New Accounting Pronouncements: In August 2018, the FASB issued Accounting Standards Update 2018-13, Fair Value Measurement (Topic 820): Disclosure Framework—Changes to the Disclosure Requirements for Fair Value Measurement (“ASU 2018-13”). The update provides guidance that eliminates, adds and modifies certain disclosure requirements for fair value measurements. ASU 2018-13 will be effective for annual periods beginning after December 15, 2019. Management is currently assessing the potential impact of these changes to future financial statements.
NOTE 2—Bank Lines of Credit:
The fund participates with other Dreyfus-managed funds in an $830 million unsecured credit facility led by Citibank, N.A. and a $300 million unsecured credit facility provided by The Bank of New York Mellon (each, a “Facility”), each to be utilized primarily for temporary or emergency purposes, including the financing of redemptions. In connection therewith, the fund has agreed to pay its pro rata portion of commitment fees for each Facility. Interest is charged to the fund based on rates determined pursuant to the terms of the respective Facility at the time of borrowing. During the period ended October 31, 2018, the fund did not borrow under the Facilities.
22
NOTE 3—Management Fee and Other Transactions with Affiliates:
(a) Pursuant to a management agreement with Dreyfus, the fund has agreed to pay a management fee at the annual rate of 1.35% applied to the portion of the fund’s average daily net assets allocated to direct investments in securities and .25% applied to that portion of the fund’s average daily net assets allocated to investments in other investment companies (underlying funds) and money market instruments (including cash and equivalents). Dreyfus has contractually agreed, from November 1, 2017 through March 1, 2019, to waive receipt of its fees and/or assume the direct expenses of the fund, so that the direct expenses of none of the classes (excluding Rule 12b-1 Distribution Plan fees, Shareholder Services Plan fees, acquired fund fees and expenses incurred by underlying funds, taxes, interest expense, brokerage commissions, commitment fees on borrowings and extraordinary expenses) exceed .55% of the value of the fund’s average daily net assets. On or after March 1, 2019, Dreyfus may terminate this expense limitation at any time. Because “acquired fund fees and expenses” are incurred indirectly by the fund, such fees and expenses are not included in the expense limitations. The reduction in expenses, pursuant to the undertaking, amounted to $42 during the period ended October 31, 2018.
(b) Under the Distribution Plan adopted pursuant to Rule 12b-1 under the Act, Class C shares pay the Distributor for distributing its shares at an annual rate of .75% of the value of its average daily net assets. During the period ended October 31, 2018, Class C shares were charged $204 pursuant to the Distribution Plan.
(c) Under the Shareholder Services Plan, Class A and Class C shares pay the Distributor at an annual rate of .25% of the value of their average daily net assets for the provision of certain services. The services provided may include personal services relating to shareholder accounts, such as answering shareholder inquiries regarding the fund and providing reports and other information, and services related to the maintenance of shareholder accounts. The Distributor may make payments to Service Agents (securities dealers, financial institutions or other industry professionals) with respect to these services. The Distributor determines the amounts to be paid to Service Agents. During the period ended October 31, 2018, Class A and Class C shares were charged $153 and $68, respectively, pursuant to the Shareholder Services Plan.
Under its terms, the Distribution Plan and Shareholder Services Plan shall remain in effect from year to year, provided such continuance is approved annually by a vote of a majority of those Directors who are not “interested
23
NOTES TO FINANCIAL STATEMENTS (continued)
persons” of the Company and who have no direct or indirect financial interest in the operation of or in any agreement related to the Distribution Plan or Shareholder Services Plan.
The fund has arrangements with the transfer agent and the custodian whereby the fund may receive earnings credits when positive cash balances are maintained, which are used to offset transfer agency and custody fees. For financial reporting purposes, the fund includes net earnings credits, if any, as an expense offset in the Statement of Operations.
The fund compensates Dreyfus Transfer, Inc., a wholly-owned subsidiary of Dreyfus, under a transfer agency agreement for providing transfer agency and cash management services for the fund. The majority of transfer agency fees are comprised of amounts paid on a per account basis, while cash management fees are related to fund subscriptions and redemptions. During the period ended October 31, 2018, the fund was charged $1,113 for transfer agency services. These fees are included in Shareholder servicing costs in the Statement of Operations.
The fund compensates The Bank of New York Mellon under a custody agreement for providing custodial services for the fund. These fees are determined based on net assets, geographic region and transaction activity. During the period ended October 31, 2018, the fund was charged $2,210 pursuant to the custody agreement. These fees were offset by earnings credits of $2,210.
During the period ended October 31, 2018, the fund was charged $12,797 for services performed by the Chief Compliance Officer and his staff. These fees are included in Miscellaneous in the Statement of Operations.
The components of “Due to The Dreyfus Corporation and affiliates” in the Statement of Assets and Liabilities consist of: management fees $96,633, Distribution Plan fees $17, Shareholder Services Plan fees $18, Custodian fees $1,800, Chief Compliance Officer fees $4,193 and transfer agency fees $161, which are offset against an expense reimbursement currently in effect in the amount of $5.
(d) Each Board member also serves as a Board member of other funds within the Dreyfus complex. Annual retainer fees and attendance fees are allocated to each fund based on net assets.
NOTE 4—Securities Transactions:
The aggregate amount of purchases and sales of investment securities, excluding short-term securities, during the period ended October 31, 2018, amounted to $88,800,046 and $98,521,713, respectively.
24
At October 31, 2018, the cost of investments for federal income tax purposes was $455,482,949; accordingly, accumulated net unrealized depreciation on investments was $11,029,286, consisting of $6,432,193 gross unrealized appreciation and $17,461,479 gross unrealized depreciation.
25
REPORT OF INDEPENDENT REGISTERED PUBLIC ACCOUNTING FIRM
To the Shareholders and Board of Directors
Dreyfus BNY Mellon Funds, Inc.
Opinion on the Financial Statements
We have audited the accompanying statement of assets and liabilities of Dreyfus Alternative Diversifier Strategies Fund (the “Fund”), a series of Dreyfus BNY Mellon Funds, Inc., including the statements of investments and investments in affiliated issuers, as of October 31, 2018, the related statement of operations for the year then ended, the statements of changes in net assets for each of the years in the two-year period then ended, and the related notes (collectively, the financial statements) and the financial highlights for each of the years or period in the five-year period then ended. In our opinion, the financial statements and financial highlights present fairly, in all material respects, the financial position of the Fund as of October 31, 2018, the results of its operations for the year then ended, the changes in its net assets for each of the years in the two-year period then ended, and the financial highlights for each of the years or period in the five-year period then ended, in conformity with U.S. generally accepted accounting principles.
Basis for Opinion
These financial statements and financial highlights are the responsibility of the Fund’s management. Our responsibility is to express an opinion on these financial statements and financial highlights based on our audits. We are a public accounting firm registered with the Public Company Accounting Oversight Board (United States) (PCAOB) and are required to be independent with respect to the Fund in accordance with the U.S. federal securities laws and the applicable rules and regulations of the Securities and Exchange Commission and the PCAOB.
We conducted our audits in accordance with the standards of the PCAOB. Those standards require that we plan and perform the audit to obtain reasonable assurance about whether the financial statements and financial highlights are free of material misstatement, whether due to error or fraud. Our audits included performing procedures to assess the risks of material misstatement of the financial statements and financial highlights, whether due to error or fraud, and performing procedures that respond to those risks. Such procedures included examining, on a test basis, evidence regarding the amounts and disclosures in the financial statements and financial highlights. Such procedures also included confirmation of securities owned as of October 31, 2018, by correspondence with the custodian and brokers or by other appropriate auditing procedures when replies from brokers were not received, and confirmation of fund of funds investments with transfer agents. Our audits also included evaluating the accounting principles used and significant estimates made by management, as well as evaluating the overall presentation of the financial statements and financial highlights. We believe that our audits provide a reasonable basis for our opinion.

We have served as the auditor of one or more Dreyfus Corporation investment companies since 1994.
New York, New York
December 28, 2018
26
IMPORTANT TAX INFORMATION (Unaudited)
For federal tax purposes, the fund reports the maximum amount allowable, but not less than $2,639,416 as ordinary income dividends paid during the year ended October 31, 2018 as qualified dividend income in accordance with Section 854(b)(1)(B) of the Internal Revenue Code. Also, the fund reports the maximum amount allowable but not less than 68.53% of ordinary income dividends paid during the year ended October 31, 2018 as eligible for the corporate dividends received deduction provided under Section 243 of the Internal Revenue Code in accordance with Section 854(b)(1)(A) of the Internal Revenue Code. Shareholders will receive notification in early 2019 of the percentage applicable to the preparation of their 2018 income tax returns.
27
BOARD MEMBERS INFORMATION (Unaudited)
INDEPENDENT BOARD MEMBERS
Joseph S. DiMartino (75)
Chairman of the Board (1999)
Principal Occupation During Past 5 Years:
· Corporate Director and Trustee (1995-present)
Other Public Company Board Memberships During Past 5 Years:
· CBIZ (formerly, Century Business Services, Inc.), a provider of outsourcing functions for small and medium size companies, Director (1997-present)
No. of Portfolios for which Board Member Serves: 124
———————
Francine J. Bovich (67)
Board Member (2012)
Principal Occupation During Past 5 Years:
· Trustee, The Bradley Trusts, private trust funds (2011-present)
Other Public Company Board Memberships During Past 5 Years:
· Annaly Capital Management, Inc., a real estate trust, Director (2014-present)
No. of Portfolios for which Board Member Serves: 72
———————
Kenneth A. Himmel (72)
Board Member (1994)
Principal Occupation During Past 5 Years:
· Managing Partner, Gulf Related, an international real estate development company (2010-present)
· President and CEO, Related Urban Development, a real estate development company (1996-present)
· President and CEO, Himmel & Company, a real estate development company (1980-present)
· CEO, American Food Management, a restaurant company (1983-present)
No. of Portfolios for which Board Member Serves: 25
———————
28
Stephen J. Lockwood (71)
Board Member (1994)
Principal Occupation During Past 5 Years:
· Chairman of the Board, Stephen J. Lockwood and Company LLC, a real estate investment company (2000-present)
No. of Portfolios for which Board Member Serves: 25
———————
Roslyn M. Watson (69)
Board Member (1994)
Principal Occupation During Past 5 Years:
· Principal, Watson Ventures, Inc., a real estate investment company (1993-present)
No. of Portfolios for which Board Member Serves: 58
———————
Benaree Pratt Wiley (72)
Board Member (1998)
Principal Occupation During Past 5 Years:
· Principal, The Wiley Group, a firm specializing in strategy and business development (2005-present)
Other Public Company Board Memberships During Past 5 Years:
· CBIZ (formerly, Century Business Services, Inc.), a provider of outsourcing functions for small and medium size companies, Director (2008-present)
No. of Portfolios for which Board Member Serves: 79
———————
Once elected all Board Members serve for an indefinite term, but achieve Emeritus status upon reaching age 80. The address of the Board Members and Officers is c/o The Dreyfus Corporation, 200 Park Avenue, New York, New York 10166. Additional information about the Board Members is available in the fund’s Statement of Additional Information which can be obtained from Dreyfus free of charge by calling this toll free number: 1-800-DREYFUS.
James M. Fitzgibbons, Emeritus Board Member
29
OFFICERS OF THE FUND (Unaudited)
BRADLEY J. SKAPYAK, President since January 2010.
Chief Operating Officer and a director of the Manager since June 2009, Chairman of Dreyfus Transfer, Inc., an affiliate of the Manager and the transfer agent of the funds, since May 2011 and Chief Executive Officer of MBSC Securities Corporation since August 2016. He is an officer of 62 investment companies (comprised of 124 portfolios) managed by the Manager. He is 59 years old and has been an employee of the Manager since February 1988.
BENNETT A. MACDOUGALL, Chief Legal Officer since October 2015.
Chief Legal Officer of the Manager and Associate General Counsel and Managing Director of BNY Mellon since June 2015; from June 2005 to June 2015, he served in various capacities with Deutsche Bank – Asset & Wealth Management Division, including as Director and Associate General Counsel, and Chief Legal Officer of Deutsche Investment Management Americas Inc. from June 2012 to May 2015. He is an officer of 63 investment companies (comprised of 149 portfolios) managed by the Manager. He is 47 years old and has been an employee of the Manager since June 2015.
JAMES BITETTO, Vice President since August 2005 and Secretary since February 2018.
Managing Counsel of BNY Mellon and Secretary of the Manager, and an officer of 63 investment companies (comprised of 149 portfolios) managed by the Manager. He is 52 years old and has been an employee of the Manager since December 1996.
JOSEPH M. CHIOFFI, Vice President and Assistant Secretary since August 2005.
Managing Counsel of BNY Mellon, and an officer of 63 investment companies (comprised of 149 portfolios) managed by the Manager. He is 56 years old and has been an employee of the Manager since June 2000.
SONALEE CROSS, Vice President and Assistant Secretary since March 2018.
Counsel of BNY Mellon since October 2016; Associate at Proskauer Rose LLP from April 2016 to September 2016; Attorney at EnTrust Capital from August 2015 to February 2016; Associate at Sidley Austin LLP from September 2013 until August 2015. She is an officer of 63 investment companies (comprised of 149 portfolios) managed by Dreyfus. She is 31 years old and has been an employee of the Manager since October 2016.
MAUREEN E. KANE, Vice President and Assistant Secretary since April 2015.
Managing Counsel of BNY Mellon since July 2014; from October 2004 until July 2014, General Counsel, and from May 2009 until July 2014, Chief Compliance Officer of Century Capital Management. She is an officer of 63 investment companies (comprised of 149 portfolios) managed by the Manager. She is 56 years old and has been an employee of the Manager since July 2014.
SARAH S. KELLEHER, Vice President and Assistant Secretary since April 2014.
Managing Counsel of BNY Mellon since December 2017, from March 2013 to December 2017, Senior Counsel of BNY Mellon. She is an officer of 63 investment companies (comprised of 149 portfolios) managed by the Manager. She is 43 years old and has been an employee of the Manager since March 2013.
JEFF PRUSNOFSKY, Vice President and Assistant Secretary since August 2005.
Senior Managing Counsel of BNY Mellon, and an officer of 63 investment companies (comprised of 149 portfolios) managed by the Manager. He is 53 years old and has been an employee of the Manager since October 1990.
NATALYA ZELENSKY, Vice President and Assistant Secretary since March 2017.
Counsel of BNY Mellon since May 2016; Attorney at Wildermuth Endowment Strategy Fund/Wildermuth Advisory, LLC from November 2015 until May 2016; Assistant General Counsel at RCS Advisory Services from July 2014 until November 2015; Associate at Sutherland, Asbill & Brennan from January 2013 until January 2014. She is an officer of 63 investment companies (comprised of 149 portfolios) managed by Dreyfus. She is 33 years old and has been an employee of the Manager since May 2016.
JAMES WINDELS, Treasurer since November 2001.
Director – Mutual Fund Accounting of the Manager, and an officer of 63 investment companies (comprised of 149 portfolios) managed by the Manager. He is 60 years old and has been an employee of the Manager since April 1985.
30
GAVIN C. REILLY, Assistant Treasurer since December 2005.
Tax Manager of the Investment Accounting and Support Department of the Manager, and an officer of 63 investment companies (comprised of 149 portfolios) managed by the Manager. He is 50 years old and has been an employee of the Manager since April 1991.
ROBERT S. ROBOL, Assistant Treasurer since December 2002.
Senior Accounting Manager – Dreyfus Financial Reporting of the Manager, and an officer of 63 investment companies (comprised of 149 portfolios) managed by the Manager. He is 54 years old and has been an employee of the Manager since October 1988.
ROBERT SALVIOLO, Assistant Treasurer since July 2007.
Senior Accounting Manager – Equity Funds of the Manager, and an officer of 63 investment companies (comprised of 149 portfolios) managed by the Manager. He is 51 years old and has been an employee of the Manager since June 1989.
ROBERT SVAGNA, Assistant Treasurer since December 2002.
Senior Accounting Manager – Fixed Income and Equity Funds of the Manager, and an officer of 63 investment companies (comprised of 149 portfolios) managed by the Manager. He is 51 years old and has been an employee of the Manager since November 1990.
JOSEPH W. CONNOLLY, Chief Compliance Officer since October 2004.
Chief Compliance Officer of the Manager, the Dreyfus Family of Funds and BNY Mellon Funds Trust (63 investment companies, comprised of 149 portfolios). He is 61 years old and has served in various capacities with the Manager since 1980, including manager of the firm’s Fund Accounting Department from 1997 through October 2001.
CARIDAD M. CAROSELLA, Anti-Money Laundering Compliance Officer since January 2016.
Anti-Money Laundering Compliance Officer of the Dreyfus Family of Funds and BNY Mellon Funds Trust since January 2016; from May 2015 to December 2015, Interim Anti-Money Laundering Compliance Officer of the Dreyfus Family of Funds and BNY Mellon Funds Trust and the Distributor; from January 2012 to May 2015, AML Surveillance Officer of the Distributor and from 2007 to December 2011, Financial Processing Manager of the Distributor. She is an officer of 57 investment companies (comprised of 143 portfolios) managed by the Manager. She is 50 years old and has been an employee of the Distributor since 1997.
31
NOTES
32
NOTES
33
Dreyfus Alternative Diversifier Strategies Fund
200 Park Avenue
New York, NY 10166
Manager
The Dreyfus Corporation
200 Park Avenue
New York, NY 10166
Custodian
The Bank of New York Mellon
240 Greenwich Street
New York, NY 10286
Transfer Agent &
Dividend Disbursing Agent
Dreyfus Transfer, Inc.
200 Park Avenue
New York, NY 10166
Distributor
MBSC Securities Corporation
200 Park Avenue
New York, NY 10166
| | |
Ticker Symbols: | Class A: DRNAX Class C: DRNCX Class I: DRNIX Class Y: DRYNX |
Telephone Call your financial representative or 1-800-DREYFUS
Mail The Dreyfus Family of Funds, 144 Glenn Curtiss Boulevard, Uniondale, NY 11556-0144
E-mail Send your request to info@dreyfus.com
Internet Information can be viewed online or downloaded at www.dreyfus.com
The fund files its complete schedule of portfolio holdings with the Securities and Exchange Commission (“SEC”) for the first and third quarters of each fiscal year on Form N-Q. The fund’s Forms N-Q are available on the SEC’s website at www.sec.gov.
A description of the policies and procedures that the fund uses to determine how to vote proxies relating to portfolio securities and information regarding how the fund voted these proxies for the most recent 12-month period ended June 30 is available at www.dreyfus.com and on the SEC’s website at www.sec.gov and without charge, upon request, by calling 1-800-DREYFUS.
| | |
© 2018 MBSC Securities Corporation
6253AR1018 | 
|
Dreyfus Global Emerging Markets Fund
| | | |

| | ANNUAL REPORT October 31, 2018 |
| |
Save time. Save paper. View your next shareholder report online as soon as it’s available. Log into www.dreyfus.com and sign up for Dreyfus eCommunications. It’s simple and only takes a few minutes. |
| |
The views expressed in this report reflect those of the portfolio manager(s) only through the end of the period covered and do not necessarily represent the views of Dreyfus or any other person in the Dreyfus organization. Any such views are subject to change at any time based upon market or other conditions and Dreyfus disclaims any responsibility to update such views. These views may not be relied on as investment advice and, because investment decisions for a Dreyfus fund are based on numerous factors, may not be relied on as an indication of trading intent on behalf of any Dreyfus fund. |
| |
Not FDIC-Insured • Not Bank-Guaranteed • May Lose Value |
Contents
THE FUND
FOR MORE INFORMATION
Back Cover
| | | | |
| |
Dreyfus Global Emerging Markets Fund
| | The Fund |
A LETTER FROM THE PRESIDENT OF DREYFUS
Dear Shareholder:
We are pleased to present this annual report for Dreyfus Global Emerging Markets Fund, covering the 12-month period from November 1, 2017 through October 31, 2018. For information about how the fund performed during the reporting period, as well as general market perspectives, we provide a Discussion of Fund Performance on the pages that follow.
Markets began the reporting period on solid footing as major global economies experienced above-trend growth across the board. In the United States, the Federal Reserve continued to move away from its accommodative monetary policy while other major central banks also began to consider monetary tightening. In the equity markets, both U.S. and non-U.S. markets enjoyed an upward trend, though investor concerns about volatility and inflation later began to weigh on returns. Interest rates rose across the curve, putting pressure on bond prices.
Later in the reporting period, global growth trends began to diverge. While a strong economic performance continued to bolster U.S. equity markets, slower growth and political concerns pressured markets in the Eurozone. Emerging markets also came under pressure as weakness in their currencies added to investors’ uneasiness. Fixed income markets continued to struggle as interest rates rose; the yield on the benchmark 10-year Treasury bond surged late in the reporting period, but growing investor concerns about global growth helped keep it from rising further.
Despite continuing doubts regarding trade, U.S. inflationary pressures, and global growth, we are optimistic that the U.S. economy will remain strong in the near term. However, we will stay attentive to signs that signal potential changes on the horizon. As always, we encourage you to discuss the risks and opportunities of today’s investment environment with your financial advisor.
Thank you for your continued confidence and support.
Sincerely,

Renee Laroche-Morris
President
The Dreyfus Corporation
November 15, 2018
2
DISCUSSION OF FUND PERFORMANCE (Unaudited)
For the period from November 1, 2017 through October 31, 2018, as provided by portfolio managers Robert Marshall-Lee, Sophia Whitbread, CFA and Naomi Waistell, CFA, of Newton Investment Management (North America) Limited, Sub-Investment Adviser
Market and Fund Performance Overview
For the 12-month period ended October 31, 2018, Dreyfus Global Emerging Markets Fund’s Class A shares produced a total return of -21.19%, Class C shares returned -21.80%, Class I shares returned -21.01%, and Class Y shares returned -20.98%.1 In comparison, the fund’s benchmark, the MSCI Emerging Markets Index (the “Index”), produced a total return of -12.52% for the same period.2
Emerging-market equities posted losses over the reporting period due to geopolitical issues, a strengthening dollar, and trade tensions. The fund underperformed the Index, mainly due to positioning in India and within the financials and materials sectors.
The Fund’s Investment Approach
The fund seeks long-term capital appreciation. To pursue its goal, the fund normally invests at least 80% of its net assets, plus any borrowings for investment purposes, in common stocks and other equity securities (or derivative or other strategic instruments with similar economic characteristics) of companies organized or with their principal place of business, or majority of assets or business, in emerging-market countries. The portfolio managers employ a fundamental, bottom-up investment process that emphasizes quality, return on capital employed, and governance. The process of identifying investment ideas begins by identifying a core list of investment themes. These themes are based primarily on observable global economic, industrial, or social trends that the portfolio managers believe will positively affect certain sectors or industries and cause stocks within these sectors or industries to outperform others. The portfolio managers then identify specific companies, using investment themes to help focus on areas where thematic and strategic research indicates positive returns are likely to be achieved.
Emerging Market Rebound, Then Reverse Course
Emerging-market equities benefited broadly from positive global economic trends during the first four months of the reporting period. Corporate earnings growth gained momentum across most industry groups and geographic regions. Strengthening global demand for commodities bolstered markets that export raw materials and energy, such as Russia and Brazil. Strong information technology and financials sector performance drove gains in China. South Korea benefited from easing regional political tensions.
Global equity markets, including most emerging markets, dipped sharply in February 2018, in response to concerns about renewed inflationary pressures in the United States. In March, the prospect of potential U.S. trade restrictions sparked additional market declines. Markets steadied after the initial sell-off, but as U.S. rates and yields resumed their upward trend in April, alongside a rising oil price, the heightened inflation expectations resulted in the U.S. dollar strengthening. This was a headwind for all emerging-market currencies to varying degrees, particularly Argentina and Turkey, whose currencies depreciated significantly.
3
DISCUSSION OF FUND PERFORMANCE (Unaudited) (continued)
Further weighing on sentiment has been the rising U.S.-China trade tensions, and political and economic difficulties in parts of South America.
Equity Returns Challenged by India Exposure
At a country level, India was by far the biggest detractor because of the increasing oil price, its predictable effect on the country’s current account balance, and a liquidity squeeze. A position in Indian software and retail service company Vakrangee detracted significantly. The stock has fallen sharply since January on the back of accusations of share-price manipulation. This pressure continued in April as the promised share buyback was delayed and the auditor resigned. While the year-to-date contribution has been substantially negative, it is also important to note that the stock was an extremely strong contributor in 2017 and that we had realized substantial profits, though in hindsight it would have been better to sell the position in full. More recent news on regulatory investigations have been encouraging, but the remaining holding is small.
At a sector level, positioning within financials and materials, and the void in energy stocks were the biggest detractors. The financials sector was an area of weakness, owing to the underweight to banks, as well as individual stock disappointments. Indian finance stocks underperformed on fears of the loss of liquidity in wholesale financing. Edelweiss Financial Services was hardest hit due to its reliance on wholesale financing, which may limit near-term growth. However, we believe this remains a robust business with great long-term growth potential. In the materials sector, weak sentiment towards the lithium price meant miners Orocobre and SQM performed poorly. The market is worried about oversupply of lithium, but we believe the difficulties of conversion into lithium hydroxide, which is needed for use in electric vehicle (EV) batteries, is broadly underestimated.
At the sector level, the fund benefited most from stock selection within the industrials and consumer staples sectors, and void positioning in real estate. At a country level, stock selection in South Korea was particularly strong, owing largely to the holdings in Samsung SDI and Samsung Electronics. Holding no Turkish stocks was also a positive. The top contributor to performance over the period was South Korean Samsung SDI, which reported a series of healthy results, driven by a strong performance from the battery division. The increasingly bright outlook for EV sales over the next three years should continue to drive demand for the company’s batteries. Hong Kong life insurer AIA Group was a top contributor to returns, as the company continues to execute extremely well on converting the huge demand for savings and protection products in the region into sales at attractive margins. It received a boost during the review period, as China announced that the country is to open up its financial sector to foreign companies. Chinese education company TAL Education was also a top performer, as it continued to show strong profit growth in a buoyant Chinese economy. The stock was sold from the portfolio in June.
Positive Trends Remain Intact Despite Volatility
We think there has been a decoupling of market sentiment and growth rates, though higher financing costs and energy prices are likely to present some headwind to profit growth. We think this has affected valuations, offering attractive buying opportunities to contrarian investors. U.S.-dollar strength has also seen a rotation into exporters with more dollar revenues, which may be a little surprising, given the anti-trade Trump rhetoric. The strategy, however, tends to be more domestically focused, since we find superior sustained growth
4
opportunities in these stocks, and in companies with a high return on invested capital (ROIC), capable of compounding their cash flows.
We continue to emphasize the importance of a highly active approach with regard to positioning, given increasingly varied conditions across emerging markets. We believe in diversification in terms of exposures and resilience towards headline risks, as well as dramatically different growth profiles. We are limiting our exposure to Turkey and Argentina, although we will be aware of opportunities presented, in light of recent pullbacks. While the high oil price and rising rates do make for a more challenging environment in the near term, which has been reflected in recent currency and share-price moves, we do not expect broad contagion, as most emerging markets are in far stronger current-account and fiscal health than during the 2013 “taper tantrum.” In our view the best multi-year growth opportunities tend to remain in Indian and Chinese domestically oriented companies.
November 15, 2018
1 Total return includes reinvestment of dividends and any capital gains paid and does not take into consideration the maximum initial sales charge in the case of Class A shares, or the applicable contingent deferred sales charges imposed on redemptions in the case of Class C shares. Had these charges been reflected, returns would have been lower. Past performance is no guarantee of future results. Share price, yield, and investment return fluctuate such that upon redemption, fund shares may be worth more or less than their original cost. Return figures provided reflect an undertaking for the absorption of certain fund expenses by The Dreyfus Corporation through March 1, 2019, at which time it may be extended, terminated, or modified. Had these expenses not been absorbed, the fund’s returns would have been lower. Past performance is no guarantee of future results.
2 Source: Lipper Inc. —it reflects reinvestment of net dividends and, where applicable, capital gain distributions. The MSCI Emerging Markets Index is a free, float-adjusted, market capitalization-weighted index that is designed to measure equity market performance of emerging markets. Investors cannot invest directly in any index.
Please note: the position in any security highlighted with italicized typeface was sold during the reporting period.
Equities are subject generally to market, market sector, market liquidity, issuer, and investment style risks, among other factors, to varying degrees, all of which are more fully described in the fund’s prospectus.
Emerging markets tend to be more volatile than the markets of more mature economies and generally have less diverse and less mature economic structures and less stable political systems than those of developed countries. The securities of companies located in emerging markets are often subject to rapid and large changes in price. An investment in this fund should be considered only as a supplement to a complete investment program for those investors willing to accept the greater risks associated with investing in emerging-market countries.
Investing internationally involves special risks, including changes in currency exchange rates, political, economic, and social instability, a lack of comprehensive company information, differing auditing and legal standards, and less market liquidity. These risks generally are greater with emerging-market countries than with more economically and politically established foreign countries.
5
FUND PERFORMANCE (Unaudited)
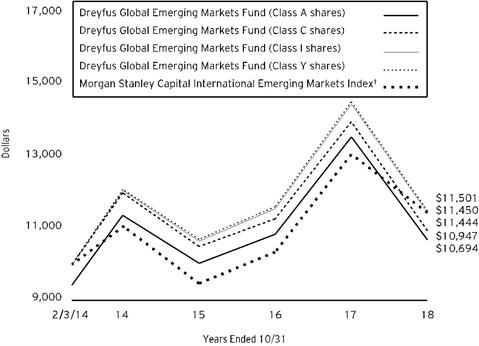
Comparison of change in value of $10,000 investment in Dreyfus Global Emerging Markets Fund Class A shares, Class C shares, Class I shares and Class Y shares, and the MSCI Emerging Markets Index (the “Index”)
† Source: Lipper Inc.
Past performance is not predictive of future performance.
The above graph compares a $10,000 investment made in each of the Class A, Class C, Class I and Class Y shares of Dreyfus Global Emerging Markets Fund on 2/3/14 (inception date) to a $10,000 investment made in the Index on that date. All dividends and capital gain distributions are reinvested.
The fund’s performance shown in the line graph above takes into account the maximum initial sales charge on Class A shares and all other applicable fees and expenses on all classes. The Index is a free float-adjusted market capitalization-weighted index that is designed to measure equity market performance of emerging markets. Unlike a mutual fund, the Index is not subject to charges, fees and other expenses. Investors cannot invest directly in any index. Further information relating to fund performance, including expense reimbursements, if applicable, is contained in the Financial Highlights section of the prospectus and elsewhere in this report.
6
| | | | | | | |
Average Annual Total Returns as of 10/31/18
|
| | Inception
Date | 1 Year | | From
Inception |
Class A shares | | | | |
with maximum sales charge (5.75%) | | 2/3/14 | -25.74% | | 1.43% | |
without sales charge | | 2/3/14 | -21.19% | | 2.70% | |
Class C shares | | | | |
with applicable redemption charge † | | 2/3/14 | -22.57% | | 1.93% | |
without redemption | | 2/3/14 | -21.80% | | 1.93% | |
Class I shares | | 2/3/14 | -21.01% | | 2.89% | |
Class Y shares | | 2/3/14 | -20.98% | | 2.99% | |
MSCI Emerging Markets Index | | 1/31/14 | -12.52% | | 2.89% | †† |
† The maximum contingent deferred sales charge for Class C shares is 1% for shares redeemed within one year of the date of purchase.
†† For comparative purposes, the value of the Index as of 1/31/14 is used as the beginning value on 2/3/14.
The performance data quoted represents past performance, which is no guarantee of future results. Share price and investment return fluctuate and an investor’s shares may be worth more or less than original cost upon redemption. Current performance may be lower or higher than the performance quoted. Go to Dreyfus.com for the fund’s most recent month-end returns.
The fund's performance shown in the graph and table does not reflect the deduction of taxes that a shareholder would pay on fund distributions or the redemption of fund shares. In addition to the performance of Class A shares shown with and without a maximum sales charge, the fund's performance shown in the table takes into account all other applicable fees and expenses on all classes.
7
UNDERSTANDING YOUR FUND’S EXPENSES (Unaudited)
As a mutual fund investor, you pay ongoing expenses, such as management fees and other expenses. Using the information below, you can estimate how these expenses affect your investment and compare them with the expenses of other funds. You also may pay one-time transaction expenses, including sales charges (loads) and redemption fees, which are not shown in this section and would have resulted in higher total expenses. For more information, see your fund’s prospectus or talk to your financial adviser.
Review your fund’s expenses
The table below shows the expenses you would have paid on a $1,000 investment in Dreyfus Global Emerging Markets Fund from May 1, 2018 to October 31, 2018. It also shows how much a $1,000 investment would be worth at the close of the period, assuming actual returns and expenses.
| | | | | | | | | | | | |
Expenses and Value of a $1,000 Investment | | |
assuming actual returns for the six months ended October 31, 2018 |
| | | | | | | | |
| | | | Class A | Class C | Class I | Class Y |
Expenses paid per $1,000† | | $5.66 | | $9.04 | | $4.53 | | $4.35 |
Ending value (after expenses) | | $796.50 | | $793.10 | | $797.30 | | $797.60 |
COMPARING YOUR FUND’S EXPENSES
WITH THOSE OF OTHER FUNDS (Unaudited)
Using the SEC’s method to compare expenses
The Securities and Exchange Commission (“SEC”) has established guidelines to help investors assess fund expenses. Per these guidelines, the table below shows your fund’s expenses based on a $1,000 investment, assuming a hypothetical 5% annualized return. You can use this information to compare the ongoing expenses (but not transaction expenses or total cost) of investing in the fund with those of other funds. All mutual fund shareholder reports will provide this information to help you make this comparison. Please note that you cannot use this information to estimate your actual ending account balance and expenses paid during the period.
| | | | | | | | | | | | |
Expenses and Value of a $1,000 Investment | | |
assuming a hypothetical 5% annualized return for the six months ended October 31, 2018 |
| | | | | | | | |
| | | | Class A | Class C | Class I | Class Y |
Expenses paid per $1,000† | | $6.36 | | $10.16 | | $5.09 | | $4.89 |
Ending value (after expenses) | | $1,018.90 | | $1,015.12 | | $1,020.16 | | $1,020.37 |
† Expenses are equal to the fund’s annualized expense ratio of 1.25% for Class A, 2.00% for Class C, 1.00% for Class I and .96% for Class Y, multiplied by the average account value over the period, multiplied by 184/365 (to reflect the one-half year period).
8
STATEMENT OF INVESTMENTS
October 31, 2018
| | | | | | | | |
| |
Description | | | | Shares | | Value ($) | |
Common Stocks - 100.1% | | | | | |
Argentina - .3% | | | | | |
Grupo Financiero Galicia, ADR | | | | 41,395 | | 954,569 | |
Australia - 1.8% | | | | | |
Orocobre | | | | 2,171,482 | a | 5,133,398 | |
Brazil - 1.8% | | | | | |
CVC Brasil Operadora e Agencia de Viagens | | | | 337,900 | | 5,131,831 | |
Chile - 3.7% | | | | | |
Sociedad Quimica y Minera Chile, ADR | | | | 241,955 | | 10,600,049 | |
China - 25.6% | | | | | |
3SBio | | | | 5,834,500 | b | 8,519,302 | |
51job, ADR | | | | 64,765 | a | 3,977,219 | |
Alibaba Group Holding, ADR | | | | 95,354 | a | 13,566,967 | |
Baidu, ADR | | | | 36,201 | a | 6,880,362 | |
China Biologic Products Holdings | | | | 44,430 | a | 2,951,929 | |
China Harmony New Energy Auto Holding | | | | 11,446,000 | | 4,534,119 | |
China Yongda Automobiles Services Holdings | | | | 6,342,500 | | 3,385,229 | |
Ctrip.com International, ADR | | | | 83,225 | a | 2,769,728 | |
Hollysys Automation Technologies | | | | 313,552 | | 6,026,469 | |
JD.com, ADR | | | | 133,714 | a | 3,144,953 | |
New Oriental Education & Technology Group, ADR | | | | 82,302 | a | 4,815,490 | |
Tencent Holdings | | | | 401,225 | | 13,599,542 | |
| | | | | 74,171,309 | |
Hong Kong - 5.7% | | | | | |
AIA Group | | | | 2,185,800 | | 16,625,241 | |
India - 25.7% | | | | | |
Amara Raja Batteries | | | | 164,448 | | 1,659,839 | |
Apollo Hospitals Enterprise | | | | 274,114 | | 4,237,988 | |
Edelweiss Financial Services | | | | 2,789,487 | | 6,136,369 | |
Godrej Consumer Products | | | | 633,579 | | 6,211,552 | |
Hindustan Unilever | | | | 303,117 | | 6,648,307 | |
Housing Development Finance | | | | 380,359 | | 9,119,169 | |
Indiabulls Housing Finance | | | | 183,959 | | 2,076,853 | |
ITC | | | | 2,769,766 | | 10,511,765 | |
Jubilant Foodworks | | | | 287,163 | | 4,220,642 | |
Maruti Suzuki India | | | | 119,225 | | 10,669,448 | |
PVR | | | | 270,954 | | 5,004,605 | |
Reliance Nippon Life Asset Management | | | | 763,289 | b | 1,731,964 | |
Titan | | | | 456,083 | | 5,241,976 | |
9
STATEMENT OF INVESTMENTS (continued)
| | | | | | | | |
| |
Description | | | | Shares | | Value ($) | |
Common Stocks - 100.1% (continued) | | | | | |
India - 25.7% (continued) | | | | | |
Vakrangee | | | | 2,230,177 | | 782,469 | |
| | | | | 74,252,946 | |
Indonesia - .6% | | | | | |
Surya Citra Media | | | | 16,603,400 | | 1,717,646 | |
Mexico - 3.0% | | | | | |
Fomento Economico Mexicano | | | | 492,329 | | 4,193,701 | |
Grupo Aeroportuario del Centro Norte | | | | 853,172 | | 4,468,461 | |
| | | | | 8,662,162 | |
Philippines - 1.2% | | | | | |
GT Capital Holdings | | | | 135,289 | | 1,923,337 | |
Security Bank | | | | 613,704 | | 1,657,424 | |
| | | | | 3,580,761 | |
South Africa - 6.4% | | | | | |
Clicks Group | | | | 266,932 | | 3,401,798 | |
Discovery | | | | 518,445 | | 5,539,217 | |
Naspers, Cl. N | | | | 54,567 | | 9,557,701 | |
| | | | | 18,498,716 | |
South Korea - 11.6% | | | | | |
LG Household & Health Care | | | | 4,157 | | 3,826,804 | |
Samsung Biologics | | | | 4,500 | a,b | 1,539,744 | |
Samsung Electronics | | | | 308,398 | | 11,533,969 | |
Samsung SDI | | | | 80,241 | | 16,510,596 | |
| | | | | 33,411,113 | |
Taiwan - 5.5% | | | | | |
Taiwan Semiconductor Manufacturing | | | | 2,132,000 | | 15,839,980 | |
United Kingdom - 4.8% | | | | | |
British American Tobacco | | | | 275,928 | | 12,065,421 | |
Unilever | | | | 34,179 | | 1,809,899 | |
| | | | | 13,875,320 | |
United States - 2.4% | | | | | |
Applied Materials | | | | 212,496 | | 6,986,869 | |
Total Common Stocks (cost $314,531,560) | | | | 289,441,910 | |
10
| | | | | | | | |
| |
Description | | 7-Day
Yield (%) | | Shares | | Value ($) | |
Investment Companies - .2% | | | | | |
Registered Investment Companies - .2% | | | | | |
Dreyfus Institutional Preferred Government Plus Money Market Fund
(cost $566,825) | | 2.21 | | 566,825 | c | 566,825 | |
Total Investments (cost $315,098,385) | | 100.3% | | 290,008,735 | |
Liabilities, Less Cash and Receivables | | (.3%) | | (796,641) | |
Net Assets | | 100.0% | | 289,212,094 | |
ADR—American Depository Receipt
a Non-income producing security.
b Security exempt from registration pursuant to Rule 144A under the Securities Act of 1933. These securities may be resold in transactions exempt from registration, normally to qualified institutional buyers. At October 31, 2018, these securities were valued at $11,791,010 or 4.08% of net assets.
c Investment in affiliated issuer. The investment objective of this investment company is publicly available and can be found within the investment company’s prospectus.
| | |
Portfolio Summary (Unaudited) † | Value (%) |
Media & Entertainment | 12.7 |
Technology Hardware & Equipment | 11.8 |
Retailing | 9.5 |
Food, Beverage & Tobacco | 9.2 |
Semiconductors & Semiconductor Equipment | 7.9 |
Insurance | 7.6 |
Household & Personal Products | 6.4 |
Materials | 5.4 |
Consumer Services | 4.9 |
Banks | 4.8 |
Pharmaceuticals Biotechnology & Life Sciences | 4.5 |
Automobiles & Components | 3.7 |
Diversified Financials | 3.4 |
Consumer Durables & Apparel | 1.8 |
Transportation | 1.5 |
Health Care Equipment & Services | 1.5 |
Commercial & Professional Services | 1.4 |
Food & Staples Retailing | 1.2 |
Capital Goods | .6 |
Software & Services | .3 |
Registered Investment Companies | .2 |
| | 100.3 |
† Based on net assets.
See notes to financial statements.
11
STATEMENT OF INVESTMENTS IN AFFILIATED ISSUERS
| | | | | | | |
Registered Investment Company | Value
10/31/17 ($) | Purchases ($) | Sales ($) | Value
10/31/18 ($) | Net
Assets (%) | Dividends/
Distributions ($) |
Dreyfus Institutional Preferred Government Plus Money Market Fund | 12,288,407 | 179,744,758 | 191,466,340 | 566,825 | .2 | 174,405 |
See notes to financial statements.
12
STATEMENT OF FORWARD FOREIGN CURRENCY EXCHANGE CONTRACTS October 31, 2018
| | | | | | |
Counterparty/ Purchased
Currency | Purchased Currency
Amounts | Currency
Sold | Sold
Currency
Amounts | Settlement Date | Unrealized Appreciation ($) |
Citigroup | | | |
United States Dollar | 24,231 | British Pound | 18,933 | 11/2/18 | 29 |
Gross Unrealized Appreciation | | | 29 |
See notes to financial statements.
13
STATEMENT OF ASSETS AND LIABILITIES
October 31, 2018
| | | | | | | |
| | | | | | |
| | | Cost | | Value | |
Assets ($): | | | | |
Investments in securities—See Statement of Investments: | | | |
Unaffiliated issuers | 314,531,560 | | 289,441,910 | |
Affiliated issuers | | 566,825 | | 566,825 | |
Cash | | | | | 230,533 | |
Cash denominated in foreign currency | | | 25,987 | | 25,988 | |
Receivable for investment securities sold | | 1,968,085 | |
Dividends receivable | | 394,322 | |
Receivable for shares of Common Stock subscribed | | 384,792 | |
Tax reclaim receivable | | 3,541 | |
Unrealized appreciation on forward foreign
currency exchange contracts—Note 4 | | 29 | |
Prepaid expenses | | | | | 11,424 | |
| | | | | 293,027,449 | |
Liabilities ($): | | | | |
Due to The Dreyfus Corporation and affiliates—Note 3(c) | | | | 315,272 | |
Payable for shares of Common Stock redeemed | | 2,453,499 | |
Payable for investment securities purchased | | 893,656 | |
Unrealized depreciation on foreign currency transactions | | 13,297 | |
Directors fees and expenses payable | | 4,863 | |
Interest payable—Note 2 | | 522 | |
Accrued expenses | | | | | 134,246 | |
| | | | | 3,815,355 | |
Net Assets ($) | | | 289,212,094 | |
Composition of Net Assets ($): | | | | |
Paid-in capital | | | | | 342,268,566 | |
Total distributable earnings (loss) | | | | | (53,056,472) | |
Net Assets ($) | | | 289,212,094 | |
| | | | | | |
Net Asset Value Per Share | Class A | Class C | Class I | Class Y | |
Net Assets ($) | 5,109,450 | 4,792,659 | 78,037,008 | 201,272,977 | |
Shares Outstanding | 368,721 | 357,197 | 5,589,465 | 14,347,080 | |
Net Asset Value Per Share ($) | 13.86 | 13.42 | 13.96 | 14.03 | |
| | | | | | |
See notes to financial statements. | | | | | |
14
STATEMENT OF OPERATIONS
Year Ended October 31, 2018
| | | | | | | |
| | | | | | |
| | | | | | |
Investment Income ($): | | | | |
Income: | | | | |
Cash dividends (net of $617,280 foreign taxes withheld at source): | |
Unaffiliated issuers | | | 4,789,046 | |
Affiliated issuers | | | 174,405 | |
Total Income | | | 4,963,451 | |
Expenses: | | | | |
Management fee—Note 3(a) | | | 2,690,130 | |
Custodian fees—Note 3(c) | | | 341,437 | |
Shareholder servicing costs—Note 3(c) | | | 233,771 | |
Professional fees | | | 134,928 | |
Registration fees | | | 93,215 | |
Distribution fees—Note 3(b) | | | 44,762 | |
Directors’ fees and expenses—Note 3(d) | | | 28,624 | |
Prospectus and shareholders’ reports | | | 19,083 | |
Loan commitment fees—Note 2 | | | 6,213 | |
Interest expense—Note 2 | | | 522 | |
Miscellaneous | | | 43,463 | |
Total Expenses | | | 3,636,148 | |
Less—reduction in expenses due to undertaking—Note 3(a) | | | (95,352) | |
Less—reduction in fees due to earnings credits—Note 3(c) | | | (697) | |
Net Expenses | | | 3,540,099 | |
Investment Income—Net | | | 1,423,352 | |
Realized and Unrealized Gain (Loss) on Investments—Note 4 ($): | | |
Net realized gain (loss) on investments and foreign currency transactions | (13,312,369) | |
Net realized gain (loss) on forward foreign currency exchange contracts | (140,546) | |
Net Realized Gain (Loss) | | | (13,452,915) | |
Net unrealized appreciation (depreciation) on investments
and foreign currency transactions | | | (76,629,926) | |
Net unrealized appreciation (depreciation) on
forward foreign currency exchange contracts | | | (1,351) | |
Net Unrealized Appreciation (Depreciation) | | | (76,631,277) | |
Net Realized and Unrealized Gain (Loss) on Investments | | | (90,084,192) | |
Net (Decrease) in Net Assets Resulting from Operations | | (88,660,840) | |
| | | | | | | |
See notes to financial statements. | | | | | |
15
STATEMENT OF CHANGES IN NET ASSETS
| | | | | | | | | | |
| | | | Year Ended October 31, |
| | | | 2018 | | 2017a | |
Operations ($): | | | | | | | | |
Investment income—net | | | 1,423,352 | | | | 212,660 | |
Net realized gain (loss) on investments | | (13,452,915) | | | | 742,734 | |
Net unrealized appreciation (depreciation)
on investments | | (76,631,277) | | | | 32,846,225 | |
Net Increase (Decrease) in Net Assets
Resulting from Operations | (88,660,840) | | | | 33,801,619 | |
Distributions ($): | |
Distributions to shareholders: | | | | | | | | |
Class A | | | (64,752) | | | | - | |
Class C | | | (39,963) | | | | - | |
Class I | | | (1,578,968) | | | | (764) | |
Class Y | | | (2,055,834) | | | | (34,547) | |
Total Distributions | | | (3,739,517) | | | | (35,311) | |
Capital Stock Transactions ($): | |
Net proceeds from shares sold: | | | | | | | | |
Class A | | | 8,786,724 | | | | 4,034,763 | |
Class C | | | 5,037,505 | | | | 3,159,256 | |
Class I | | | 125,517,169 | | | | 115,583,257 | |
Class Y | | | 123,713,498 | | | | 42,614,392 | |
Distributions reinvested: | | | | | | | | |
Class A | | | 63,574 | | | | - | |
Class C | | | 39,628 | | | | - | |
Class I | | | 1,533,173 | | | | 685 | |
Class Y | | | 1,533,173 | | | | 28,006 | |
Cost of shares redeemed: | | | | | | | | |
Class A | | | (5,782,678) | | | | (472,077) | |
Class C | | | (1,888,477) | | | | (33,069) | |
Class I | | | (125,928,486) | | | | (15,617,090) | |
Class Y | | | (23,279,177) | | | | (16,905,187) | |
Increase (Decrease) in Net Assets
from Capital Stock Transactions | 109,345,626 | | | | 132,392,936 | |
Total Increase (Decrease) in Net Assets | 16,945,269 | | | | 166,159,244 | |
Net Assets ($): | |
Beginning of Period | | | 272,266,825 | | | | 106,107,581 | |
End of Period | | | 289,212,094 | | | | 272,266,825 | |
16
| | | | | | | | | | |
| | | | Year Ended October 31, |
| | | | 2018 | | 2017a | |
Capital Share Transactions (Shares): | |
Class A | | | | | | | | |
Shares sold | | | 474,831 | | | | 240,788 | |
Shares issued for distributions reinvested | | | 3,429 | | | | - | |
Shares redeemed | | | (341,007) | | | | (30,189) | |
Net Increase (Decrease) in Shares Outstanding | 137,253 | | | | 210,599 | |
Class C | | | | | | | | |
Shares sold | | | 280,331 | | | | 190,777 | |
Shares issued for distributions reinvested | | | 2,193 | | | | - | |
Shares redeemed | | | (117,933) | | | | (2,016) | |
Net Increase (Decrease) in Shares Outstanding | 164,591 | | | | 188,761 | |
Class Ib | | | | | | | | |
Shares sold | | | 6,891,404 | | | | 6,853,168 | |
Shares issued for distributions reinvested | | | 82,252 | | | | 53 | |
Shares redeemed | | | (7,464,373) | | | | (956,273) | |
Net Increase (Decrease) in Shares Outstanding | (490,717) | | | | 5,896,948 | |
Class Yb | | | | | | | | |
Shares sold | | | 7,005,617 | | | | 2,640,673 | |
Shares issued for distributions reinvested | | | 77,954 | | | | 2,173 | |
Shares redeemed | | | (1,421,158) | | | | (1,145,170) | |
Net Increase (Decrease) in Shares Outstanding | 5,662,413 | | | | 1,497,676 | |
| | | | | | | | | | |
a Distributions to shareholders include only distributions from net investment income. Undistributed investment income—net was $66,902 in 2017 and is no longer presented as a result of the adoption of SEC’s Disclosure Update and Simplification Rule. | |
b During the period ended October 31, 2018, 5,878 Class Y shares representing $106,075 were exchanged for 5,905 Class I shares and during the period ended October 31, 2017, 7,251 Class Y shares representing $121,212 were exchanged for 7,281 Class I shares. | |
See notes to financial statements.
| | | | | | | | |
17
FINANCIAL HIGHLIGHTS
The following tables describe the performance for each share class for the fiscal periods indicated. All information (except portfolio turnover rate) reflects financial results for a single fund share. Total return shows how much your investment in the fund would have increased (or decreased) during each period, assuming you had reinvested all dividends and distributions. These figures have been derived from the fund’s financial statements.
| | | | | | | | | | | | | |
| | | | | |
| | | | |
| | Year Ended October 31, |
Class A Shares | | | 2018 | 2017 | 2016 | 2015 | 2014a |
Per Share Data ($): | | | | | | | |
Net asset value, beginning of period | | | 17.79 | 14.24 | 13.15 | 15.09 | 12.50 |
Investment Operations: | | | | | | | |
Investment income (loss)—netb | | | .03 | (.03) | (.02) | (.01) | .02 |
Net realized and unrealized gain (loss)
on investments | | | (3.75) | 3.58 | 1.11 | (1.77) | 2.57 |
Total from Investment Operations | | | (3.72) | 3.55 | 1.09 | (1.78) | 2.59 |
Distributions: | | | | | | | |
Dividends from investment income—net | | | (.21) | — | — | (.04) | – |
Dividends from net realized gain
on investments | | | — | — | — | (.12) | — |
Total Distributions | | | (.21) | — | — | (.16) | – |
Net asset value, end of period | | | 13.86 | 17.79 | 14.24 | 13.15 | 15.09 |
Total Return (%)c | | | (21.19) | 25.02 | 8.13 | (11.80) | 20.72d |
Ratios/Supplemental Data (%): | | | | | | |
Ratio of total expenses
to average net assets | | | 1.34 | 1.55 | 1.82 | 1.82 | 2.35e |
Ratio of net expenses
to average net assets | | | 1.25 | 1.28 | 1.53 | 1.60 | 1.60e |
Ratio of net investment income (loss)
to average net assets | | | .16 | (.17) | (.18) | (.05) | .20e |
Portfolio Turnover Rate | | | 41.94 | 36.79 | 51.42 | 32.72 | 30.66d |
Net Assets, end of period ($ x 1,000) | | | 5,109 | 4,117 | 297 | 174 | 120 |
a From February 3, 2014 (commencement of operations) to October 31, 2014.
b Based on average shares outstanding.
c Exclusive of sales charge.
d Not annualized.
e Annualized.
See notes to financial statements.
18
| | | | | | | | | | |
| | | | | |
| | | | | | |
| | | | Year Ended October 31, |
Class C Shares | | | 2018 | 2017 | 2016 | 2015 | 2014a |
Per Share Data ($): | | | | | | | |
Net asset value, beginning of period | | | 17.32 | 13.96 | 12.99 | 15.01 | 12.50 |
Investment Operations: | | | | | | | |
Investment (loss)—netb | | | (.10) | (.15) | (.13) | (.13) | (.05) |
Net realized and unrealized gain (loss)
on investments | | | (3.63) | 3.51 | 1.10 | (1.75) | 2.56 |
Total from Investment Operations | | | (3.73) | 3.36 | .97 | (1.88) | 2.51 |
Distributions: | | | | | | | |
Dividends from investment income—net | | | (.17) | — | — | (.02) | — |
Dividends from net realized gain
on investments | | | — | — | — | (.12) | — |
Total Distributions | | | (.17) | — | — | (.14) | — |
Net asset value, end of period | | | 13.42 | 17.32 | 13.96 | 12.99 | 15.01 |
Total Return (%)c | | | (21.80) | 24.07 | 7.39 | (12.51) | 20.08d |
Ratios/Supplemental Data (%): | | | | | | |
Ratio of total expenses
to average net assets | | | 2.11 | 2.30 | 2.80 | 2.67 | 2.95e |
Ratio of net expenses
to average net assets | | | 2.00 | 2.01 | 2.28 | 2.35 | 2.35e |
Ratio of net investment (loss)
to average net assets | | | (.60) | (.94) | (.97) | (.96) | (.45)e |
Portfolio Turnover Rate | | | 41.94 | 36.79 | 51.42 | 32.72 | 30.66d |
Net Assets, end of period ($ x 1,000) | | | 4,793 | 3,335 | 54 | 35 | 46 |
a From February 3, 2014 (commencement of operations) to October 31, 2014.
b Based on average shares outstanding.
c Exclusive of sales charge.
d Not annualized.
e Annualized.
See notes to financial statements.
19
FINANCIAL HIGHLIGHTS (continued)
| | | | | | | | | | | | | |
| | | | | |
| | | | | | | |
| | | | Year Ended October 31, |
Class I Shares | | | 2018 | 2017 | 2016 | 2015 | 2014a |
Per Share Data ($): | | | | | | | |
Net asset value, beginning of period | | | 17.89 | 14.29 | 13.16 | 15.09 | 12.50 |
Investment Operations: | | | | | | | |
Investment income (loss)—netb | | | .07 | .01 | (.03) | (.00)c | .66 |
Net realized and unrealized gain (loss)
on investments | | | (3.77) | 3.59 | 1.16 | (1.76) | 1.93 |
Total from Investment Operations | | | (3.70) | 3.60 | 1.13 | (1.76) | 2.59 |
Distributions: | | | | | | | |
Dividends from investment income—net | | | (.23) | (.00)c | — | (.05) | — |
Dividends from net realized gain
on investments | | | — | — | — | (.12) | — |
Total Distributions | | | (.23) | (.00)c | — | (.17) | — |
Net asset value, end of period | | | 13.96 | 17.89 | 14.29 | 13.16 | 15.09 |
Total Return (%) | | | (21.01) | 25.24 | 8.50 | (11.68) | 20.72d |
Ratios/Supplemental Data (%): | | | | | | | |
Ratio of total expenses
to average net assets | | | 1.06 | 1.29 | 1.54 | 1.35 | 1.41e |
Ratio of net expenses
to average net assets | | | 1.00 | 1.02 | 1.27 | 1.35 | 1.35e |
Ratio of net investment income (loss)
to average net assets | | | .38 | .07 | (.24) | (.03) | 2.86e |
Portfolio Turnover Rate | | | 41.94 | 36.79 | 51.42 | 32.72 | 30.66d |
Net Assets, end of period ($ x 1,000) | | | 78,037 | 108,787 | 2,618 | 347 | 784 |
a From February 3, 2014 (commencement of operations) to October 31, 2014.
b Based on average shares outstanding.
c Amount represents less than $.01 per share.
d Not annualized.
e Annualized.
See notes to financial statements.
20
| | | | | | | |
| |
| | | |
| | | Year Ended October 31, |
Class Y Shares | | 2018 | 2017 | 2016 | 2015 | 2014a |
Per Share Data ($): | | | | | | |
Net asset value, beginning of period | | 17.97 | 14.35 | 13.22 | 15.13 | 12.50 |
Investment Operations: | | | | | | |
Investment income—netb | | .08 | .03 | .01 | .02 | .05 |
Net realized and unrealized gain (loss)
on investments | | (3.79) | 3.59 | 1.12 | (1.76) | 2.58 |
Total from Investment Operations | | (3.71) | 3.62 | 1.13 | (1.74) | 2.63 |
Distributions: | | | | | | |
Dividends from investment income—net | | (.23) | (.00)c | — | (.05) | — |
Dividends from net realized gain
on investments | | — | — | — | (.12) | — |
Total Distributions | | (.23) | (.00)c | — | (.17) | — |
Net asset value, end of period | | 14.03 | 17.97 | 14.35 | 13.22 | 15.13 |
Total Return (%) | | (20.98) | 25.27 | 8.47 | (11.51) | 21.04d |
Ratios/Supplemental Data (%): | | | | | | |
Ratio of total expenses
to average net assets | | .94 | 1.18 | 1.42 | 1.28 | 1.70e |
Ratio of net expenses
to average net assets | | .94 | 1.11 | 1.26 | 1.28 | 1.35e |
Ratio of net investment income
to average net assets | | .44 | .17 | .07 | .13 | .52e |
Portfolio Turnover Rate | | 41.94 | 36.79 | 51.42 | 32.72 | 30.66d |
Net Assets, end of period ($ x 1,000) | | 201,273 | 156,027 | 103,139 | 97,314 | 96,129 |
a From February 3, 2014 (commencement of operations) to October 31, 2014.
b Based on average shares outstanding.
c Amount represents less than $.01 per share.
d Not annualized.
e Annualized.
See notes to financial statements.
21
NOTES TO FINANCIAL STATEMENTS
NOTE 1—Significant Accounting Policies:
Dreyfus Global Emerging Markets Fund (the “fund”) is a separate non-diversified series of Dreyfus BNY Mellon Funds, Inc. (the “Company”), which is registered under the Investment Company Act of 1940, as amended (the “Act”), as an open-end management investment company and operates as a series company currently offering four series, including the fund. The fund’s investment objective is to seek long-term capital appreciation. The Dreyfus Corporation (the “Manager” or “Dreyfus”), a wholly-owned subsidiary of The Bank of New York Mellon Corporation (“BNY Mellon”), serves as the fund’s investment adviser. Newton Investment Management (North America) Limited (“Newton”), a wholly-owned subsidiary of BNY Mellon and affiliate of Dreyfus, serves as the fund’s sub-investment adviser.
MBSC Securities Corporation (the “Distributor”), a wholly-owned subsidiary of Dreyfus, is the distributor of the fund’s shares. The fund is authorized to issue 100 million shares of $.001 par value Common Stock in each of the following classes of shares: Class A, Class C, Class I, Class T and Class Y. Class A, Class C and Class T shares are sold primarily to retail investors through financial intermediaries and bear Distribution and/or Shareholder Services Plan fees. Class A and Class T shares generally are subject to a sales charge imposed at the time of purchase. Class C shares are subject to a contingent deferred sales charge (“CDSC”) imposed on Class C shares redeemed within one year of purchase. Class C shares automatically convert to Class A shares ten years after the date of purchase, without the imposition of a sales charge. Class I shares are sold primarily to bank trust departments and other financial service providers (including The Bank of New York Mellon, a subsidiary of BNY Mellon and an affiliate of Dreyfus, and its affiliates), acting on behalf of customers having a qualified trust or an investment account or relationship at such institution, and bear no Distribution or Shareholder Services Plan fees. Class Y shares are sold at net asset value per share generally to institutional investors, and bear no Distribution or Shareholder Services Plan fees. Class I and Class Y shares are offered without a front-end sales charge or CDSC. As of the date of this report, the fund did not offer Class T shares for purchase. Other differences between the classes include the services offered to and the expenses borne by each class, the allocation of certain transfer agency costs, and certain voting rights. Income, expenses (other than expenses attributable to a specific class), and realized and unrealized gains or losses on investments are allocated to each class of shares based on its relative net assets.
22
The Company accounts separately for the assets, liabilities and operations of each series. Expenses directly attributable to each series are charged to that series’ operations; expenses which are applicable to all series are allocated among them on a pro rata basis.
The Financial Accounting Standards Board (“FASB”) Accounting Standards Codification (“ASC”) is the exclusive reference of authoritative U.S. generally accepted accounting principles (“GAAP”) recognized by the FASB to be applied by nongovernmental entities. Rules and interpretive releases of the Securities and Exchange Commission (“SEC”) under authority of federal laws are also sources of authoritative GAAP for SEC registrants. The fund’s financial statements are prepared in accordance with GAAP, which may require the use of management estimates and assumptions. Actual results could differ from those estimates.
(a) Portfolio valuation: The fair value of a financial instrument is the amount that would be received to sell an asset or paid to transfer a liability in an orderly transaction between market participants at the measurement date (i.e., the exit price). GAAP establishes a fair value hierarchy that prioritizes the inputs of valuation techniques used to measure fair value. This hierarchy gives the highest priority to unadjusted quoted prices in active markets for identical assets or liabilities (Level 1 measurements) and the lowest priority to unobservable inputs (Level 3 measurements).
Additionally, GAAP provides guidance on determining whether the volume and activity in a market has decreased significantly and whether such a decrease in activity results in transactions that are not orderly. GAAP requires enhanced disclosures around valuation inputs and techniques used during annual and interim periods.
Various inputs are used in determining the value of the fund’s investments relating to fair value measurements. These inputs are summarized in the three broad levels listed below:
Level 1—unadjusted quoted prices in active markets for identical investments.
Level 2—other significant observable inputs (including quoted prices for similar investments, interest rates, prepayment speeds, credit risk, etc.).
Level 3—significant unobservable inputs (including the fund’s own assumptions in determining the fair value of investments).
The inputs or methodology used for valuing securities are not necessarily an indication of the risk associated with investing in those securities.
23
NOTES TO FINANCIAL STATEMENTS (continued)
Changes in valuation techniques may result in transfers in or out of an assigned level within the disclosure hierarchy. Valuation techniques used to value the fund’s investments are as follows:
Investments in securities are valued at the last sales price on the securities exchange or national securities market on which such securities are primarily traded. Securities listed on the National Market System for which market quotations are available are valued at the official closing price or, if there is no official closing price that day, at the last sales price. For open short positions, asked prices are used for valuation purposes. Bid price is used when no asked price is available. Registered investment companies that are not traded on an exchange are valued at their net asset value. All of the preceding securities are generally categorized within Level 1 of the fair value hierarchy.
Securities not listed on an exchange or the national securities market, or securities for which there were no transactions, are valued at the average of the most recent bid and asked prices. These securities are generally categorized within Level 2 of the fair value hierarchy.
Fair valuing of securities may be determined with the assistance of a pricing service using calculations based on indices of domestic securities and other appropriate indicators, such as prices of relevant ADRs and futures. Utilizing these techniques may result in transfers between Level 1 and Level 2 of the fair value hierarchy.
When market quotations or official closing prices are not readily available, or are determined not to accurately reflect fair value, such as when the value of a security has been significantly affected by events after the close of the exchange or market on which the security is principally traded (for example, a foreign exchange or market), but before the fund calculates its net asset value, the fund may value these investments at fair value as determined in accordance with the procedures approved by the Company’s Board of Directors (the “Board”). Certain factors may be considered when fair valuing investments such as: fundamental analytical data, the nature and duration of restrictions on disposition, an evaluation of the forces that influence the market in which the securities are purchased and sold, and public trading in similar securities of the issuer or comparable issuers. These securities are either categorized within Level 2 or 3 of the fair value hierarchy depending on the relevant inputs used.
For restricted securities where observable inputs are limited, assumptions about market activity and risk are used and such securities are generally categorized within Level 3 of the fair value hierarchy.
24
Investments denominated in foreign currencies are translated to U.S. dollars at the prevailing rates of exchange.
Forward foreign currency exchange contracts (“forward contracts”) are valued at the forward rate and are generally categorized within Level 2 of the fair value hierarchy.
The following is a summary of the inputs used as of October 31, 2018 in valuing the fund’s investments:
| | | | | | |
| | Level 1 - Unadjusted Quoted Prices | Level 2 - Other Significant Observable Inputs | | Level 3 - Significant Unobservable Inputs | Total |
Assets ($) | | | |
Investments in Securities: | | | |
Equity Securities –
Common Stocks | 76,468,596 | 212,973,314 | † | — | 289,441,910 |
Investment Company | 566,825 | — | | — | 566,825 |
Other Financial Instruments: | | | | | |
Forward Foreign Currency
Exchange Contracts†† | — | 29 | | — | 29 |
† Securities classified within Level 2 at period end as the values were determined pursuant to the fund’s fair valuation procedures.
†† Amount shown represents unrealized appreciation at period end, but only variation margin on exchanged traded and centrally cleared derivatives are reported in the Statement of Assets and Liabilities.
At October 31, 2018, the amount of securities transferred between levels equals fair value of exchange traded equity securities reported as Level 2 in the table above. At October 31, 2017, there were no transfer between levels of the fair value hierarchy. It is the fund’s policy to recognize transfers between levels at the end of the reporting period.
(b) Foreign currency transactions: The fund does not isolate that portion of the results of operations resulting from changes in foreign exchange rates on investments from the fluctuations arising from changes in the market prices of securities held. Such fluctuations are included with the net realized and unrealized gain or loss on investments.
Net realized foreign exchange gains or losses arise from sales of foreign currencies, currency gains or losses realized on securities transactions between trade and settlement date, and the difference between the amounts of dividends, interest and foreign withholding taxes recorded on the fund’s books and the U.S. dollar equivalent of the amounts actually received or paid. Net unrealized foreign exchange gains and losses arise from changes in the value of assets and liabilities other than investments resulting from changes in exchange rates. Foreign currency gains and losses
25
NOTES TO FINANCIAL STATEMENTS (continued)
on foreign currency transactions are also included with net realized and unrealized gain or loss on investments.
(c) Securities transactions and investment income: Securities transactions are recorded on a trade date basis. Realized gains and losses from securities transactions are recorded on the identified cost basis. Dividend income is recognized on the ex-dividend date and interest income, including, where applicable, accretion of discount and amortization of premium on investments, is recognized on the accrual basis.
(d) Affiliated issuers: Investments in other investment companies advised by Dreyfus are considered “affiliated” under the Act.
Certain affiliated investment companies may also invest in the fund. At October 31, 2018, Dreyfus Diversified Emerging Markets Fund, an affiliate of the fund, held 4,797,354 Class Y shares.
(e) Risk: Investing in foreign markets may involve special risks and considerations not typically associated with investing in the U.S. These risks include revaluation of currencies, high rates of inflation, repatriation restrictions on income and capital, and adverse political and economic developments. Moreover, securities issued in these markets may be less liquid, subject to government ownership controls and delayed settlements, and their prices may be more volatile than those of comparable securities in the U.S.
(f) Dividends and distributions to shareholders: Dividends and distributions are recorded on the ex-dividend date. Dividends from investment income-net and dividends from net realized capital gains, if any, are normally declared and paid annually, but the fund may make distributions on a more frequent basis to comply with the distribution requirements of the Internal Revenue Code of 1986, as amended (the “Code”). To the extent that net realized capital gains can be offset by capital loss carryovers, it is the policy of the fund not to distribute such gains. Income and capital gain distributions are determined in accordance with income tax regulations, which may differ from GAAP.
(g) Federal income taxes: It is the policy of the fund to continue to qualify as a regulated investment company, if such qualification is in the best interests of its shareholders, by complying with the applicable provisions of the Code, and to make distributions of taxable income and net realized capital gain sufficient to relieve it from substantially all federal income and excise taxes.
26
As of and during the period ended October 31, 2018, the fund did not have any liabilities for any uncertain tax positions. The fund recognizes interest and penalties, if any, related to uncertain tax positions as income tax expense in the Statement of Operations. During the period ended October 31, 2018, the fund did not incur any interest or penalties.
Each tax year in the four-year period ended October 31, 2018 remains subject to examination by the Internal Revenue Service and state taxing authorities.
At October 31, 2018, the components of accumulated earnings on a tax basis were as follows: undistributed ordinary income $3,589,777, accumulated capital losses $20,213,755 and unrealized depreciation $36,432,494.
The fund is permitted to carry forward capital losses for an unlimited period. Furthermore, capital loss carryovers retain their character as either short-term or long-term capital losses.
The accumulated capital loss carryover is available for federal income tax purposes to be applied against future net realized capital gains, if any, realized subsequent to October 31, 2018. The fund has $13,739,537 of short-term capital losses and $6,474,218 of long-term capital losses which can be carried forward for an unlimited period.
The tax character of distributions paid to shareholders during the fiscal periods ended October 31, 2018 and October 31, 2017 were as follows: undistributed ordinary income $3,739,517 and $35,311, respectively.
NOTE 2—Bank Lines of Credit:
The fund participates with other Dreyfus-managed funds in an $830 million unsecured credit facility led by Citibank, N.A. and a $300 million unsecured credit facility provided by The Bank of New York Mellon (each, a “Facility”), each to be utilized primarily for temporary or emergency purposes, including the financing of redemptions. In connection therewith, the fund has agreed to pay its pro rata portion of commitment fees for each Facility. Interest is charged to the fund based on rates determined pursuant to the terms of the respective Facility at the time of borrowing.
The average amount of borrowings outstanding under the Facilities during the period ended October 31, 2018 was approximately $16,400 with a related weighted average annualized interest rate of 3.18%.
27
NOTES TO FINANCIAL STATEMENTS (continued)
NOTE 3—Management Fee, Sub-Investment Advisory Fee and Other Transactions with Affiliates:
(a) Pursuant to a management agreement with Dreyfus, the management fee is computed at the annual rate of .75% of the value of the fund’s average daily net assets. Dreyfus has contractually agreed, from November 1, 2018 through March 1, 2019, to waive receipt of its fees and/or assume the direct expenses of the fund so that the direct expenses of none of the classes (excluding Rule 12b-1 Distribution Plan fees, Shareholder Services Plan fees, taxes, interest expense, brokerage commissions, commitment fees on borrowings and extraordinary expenses) exceed 1.00% of the value of the fund’s average daily net assets. On or after March 1, 2019, Dreyfus may terminate this expense limitation at any time. The reduction in expenses, pursuant to the undertaking amounted to $95,352 during the period ended October 31, 2018.
Pursuant to a sub-investment advisory agreement between Dreyfus and Newton, Newton serves as the fund’s sub-investment adviser responsible for the day-to-day management of the fund’s portfolio. Dreyfus pays Newton a monthly fee at an annual percentage of the value of the fund’s average daily net assets. Dreyfus has obtained an exemptive order from the SEC (the “Order”), upon which the fund may rely, to use a manager of managers approach that permits Dreyfus, subject to certain conditions and approval by the Board, to enter into and materially amend sub-investment advisory agreements with one or more sub-investment advisers who are either unaffiliated with Dreyfus or are wholly-owned subsidiaries (as defined under the Act) of Dreyfus’ ultimate parent company, BNY Mellon, without obtaining shareholder approval. The Order also allows the fund to disclose the sub-investment advisory fee paid by Dreyfus to any unaffiliated sub-investment adviser in the aggregate with other unaffiliated sub-investment advisers in documents filed with the SEC and provided to shareholders. In addition, pursuant to the Order, it is not necessary to disclose the sub-investment advisory fee payable by Dreyfus separately to a sub-investment adviser that is a wholly-owned subsidiary of BNY Mellon in documents filed with the SEC and provided to shareholders; such fees are to be aggregated with fees payable to Dreyfus. Dreyfus has ultimate responsibility (subject to oversight by the Board) to supervise any sub-investment adviser and recommend the hiring, termination, and replacement of any sub-investment adviser to the Board.
During the period ended October 31, 2018, the Distributor retained $14,935 commissions earned on sales of the fund’s Class A shares and $383 from CDSC fees on redemptions of the fund’s Class C shares.
28
(b) Under the Distribution Plan adopted pursuant to Rule 12b-1 under the Act, Class C shares pay the Distributor for distributing its shares at an annual rate of .75% of the value of its average daily net assets. During the period ended October 31, 2018, Class C shares were charged $44,762 pursuant to the Distribution Plan.
(c) Under the Shareholder Services Plan, Class A and Class C shares pay the Distributor at an annual rate of .25% of the value of their average daily net assets for the provision of certain services. The services provided may include personal services relating to shareholder accounts, such as answering shareholder inquiries regarding the fund and providing reports and other information, and services related to the maintenance of shareholder accounts. The Distributor may make payments to Service Agents (securities dealers, financial institutions or other industry professionals) with respect to these services. The Distributor determines the amounts to be paid to Service Agents. During the period ended October 31, 2018, Class A and Class C shares were charged $19,143 and $14,921, respectively, pursuant to the Shareholder Services Plan.
Under its terms, the Distribution Plan and Shareholder Services Plan shall remain in effect from year to year, provided such continuance is approved annually by a vote of a majority of those Directors who are not “interested persons” of the Company and who have no direct or indirect financial interest in the operation of or in any agreement related to the Distribution Plan and Shareholder Services Plan.
The fund has arrangements with the transfer agent and the custodian whereby the fund may receive earnings credits when positive cash balances are maintained, which are used to offset transfer agency and custody fees. For financial reporting purposes, the fund includes net earnings credits, if any, as an expense offset in the Statement of Operations.
The fund compensates Dreyfus Transfer, Inc., a wholly-owned subsidiary of Dreyfus, under a transfer agency agreement for providing transfer agency and cash management services for the fund. The majority of transfer agency fees are comprised of amounts paid on a per account basis, while cash management fees are related to fund subscriptions and redemptions. During the period ended October 31, 2018, the fund was charged $4,988 for transfer agency services. These fees are included in Shareholder servicing costs in the Statement of Operations.
The fund compensates The Bank of New York Mellon under a custody agreement for providing custodial services for the fund. These fees are determined based on net assets, geographic region and transaction activity. During the period ended October 31, 2018, the fund was charged $341,437
29
NOTES TO FINANCIAL STATEMENTS (continued)
pursuant to the custody agreement. These fees were partially offset by earnings credits of $697.
During the period ended October 31, 2018, the fund was charged $12,797 for services performed by the Chief Compliance Officer and his staff. These fees are included in Miscellaneous in the Statement of Operations.
The components of “Due to The Dreyfus Corporation and affiliates” in the Statement of Assets and Liabilities consist of: management fees $196,797, Distribution Plan fees $3,261, Shareholder Services Plan fees $2,243, custodian fees $136,562, Chief Compliance Officer fees $4,193 and transfer agency fees $521, which are offset against an expense reimbursement currently in effect in the amount of $28,305.
(d) Each Board member also serves as a Board member of other funds within the Dreyfus complex. Annual retainer fees and attendance fees are allocated to each fund based on net assets.
(e) A 2% redemption fee is charged and retained by the fund on certain shares redeemed within sixty days following the date of issuance subject to certain exceptions, including redemptions made through use of the fund’s exchange privilege. During the period ended October 31, 2018, redemption fees charged and retained by the fund amounted to $54,014.
NOTE 4—Securities Transactions:
The aggregate amount of purchases and sales of investment securities, excluding short-term securities and forward contracts, during the period ended October 31, 2018, amounted to $263,059,429 and $143,190,307, respectively.
Derivatives: A derivative is a financial instrument whose performance is derived from the performance of another asset. The fund enters into International Swaps and Derivatives Association, Inc. Master Agreements or similar agreements (collectively, “Master Agreements”) with its over-the-counter (“OTC”) derivative contract counterparties in order to, among other things, reduce its credit risk to counterparties. Master Agreements include provisions for general obligations, representations, collateral and events of default or termination. Under a Master Agreement, the fund may offset with the counterparty certain derivative financial instrument’s payables and/or receivables with collateral held and/or posted and create one single net payment in the event of default or termination.
Each type of derivative instrument that was held by the fund during the period ended October 31, 2018 is discussed below.
30
Forward Foreign Currency Exchange Contracts: The fund enters into forward contracts in order to hedge its exposure to changes in foreign currency exchange rates on its foreign portfolio holdings, to settle foreign currency transactions or as a part of its investment strategy. When executing forward contracts, the fund is obligated to buy or sell a foreign currency at a specified rate on a certain date in the future. With respect to sales of forward contracts, the fund incurs a loss if the value of the contract increases between the date the forward contract is opened and the date the forward contract is closed. The fund realizes a gain if the value of the contract decreases between those dates. With respect to purchases of forward contracts, the fund incurs a loss if the value of the contract decreases between the date the forward contract is opened and the date the forward contract is closed. The fund realizes a gain if the value of the contract increases between those dates. Any realized or unrealized gains or losses which occurred during the period are reflected in the Statement of Operations. The fund is exposed to foreign currency risk as a result of changes in value of underlying financial instruments. The fund is also exposed to credit risk associated with counterparty nonperformance on these forward contracts, which is generally limited to the unrealized gain on each open contract. This risk may be mitigated by Master Agreements, if any, between the fund and the counterparty and the posting of collateral, if any, by the counterparty to the fund to cover the fund’s exposure to the counterparty. Forward contracts open at October 31, 2018 are set forth in the Statement of Forward Foreign Currency Exchange Contracts.
The provisions of ASC Topic 210 “Disclosures about Offsetting Assets and Liabilities” require disclosure on the offsetting of financial assets and liabilities. These disclosures are required for certain investments, including derivative financial instruments subject to Master Agreements which are eligible for offsetting in the Statement of Assets and Liabilities and require the fund to disclose both gross and net information with respect to such investments. For financial reporting purposes, the fund does not offset derivative assets and derivative liabilities that are subject to Master Agreements in the Statement of Assets and Liabilities.
31
NOTES TO FINANCIAL STATEMENTS (continued)
At October 31, 2018, derivative assets and liabilities (by type) on a gross basis are as follows:
| | | | | | |
Derivative Financial Instruments: | | Assets ($) | | Liabilities ($) | |
Forward contracts | | 29 | | - | |
Total gross amount of derivative | | | | | |
assets and liabilities in the | | | | | |
Statement of Assets and Liabilities | | 29 | | - | |
Derivatives not subject to | | | | | |
Master Agreements | | - | | - | |
Total gross amount of assets | | | | | |
and liabilities subject to | | | | | |
Master Agreements | | 29 | | - | |
The following table presents derivative assets net of amounts available for offsetting under Master Agreements and net of related collateral received or pledged, if any, as of October 31, 2018:
| | | | | | | |
| | | | Financial | | | |
| | | | Instruments | | | |
| | | | and Derivatives | | | |
| | Gross Amount of | | Available | Collateral | | Net Amount of |
Counterparty | Assets ($) | 1 | for Offset ($) | Received ($) | | Assets ($) |
Citigroup | 29 | | - | - | | 29 |
| | | | | | | |
| | | | | | | |
1 Absent a default event or early termination, OTC derivative assets and liabilities are presented at gross amounts
and are not offset in the Statement of Assets and Liabilities. |
The following summarizes the average market value of derivatives outstanding during the period ended October 31, 2018:
| | | |
| | Average Market Value ($) |
Forward contracts | | 905,735 |
At October 31, 2018, the cost of investments for federal income tax purposes was $326,427,962; accordingly, accumulated net unrealized depreciation on investments inclusive of derivative contracts was $36,419,198, consisting of $20,312,015 gross unrealized appreciation and $56,731,213 gross unrealized depreciation.
32
REPORT OF INDEPENDENT REGISTERED PUBLIC ACCOUNTING FIRM
To the Shareholders and Board of Directors
Dreyfus BNY Mellon Funds, Inc.
Opinion on the Financial Statements
We have audited the accompanying statement of assets and liabilities of Dreyfus Global Emerging Markets Fund (the “Fund”), a series of Dreyfus BNY Mellon Funds, Inc., including the statements of investments, investments in affiliated issuers and forward foreign currency exchange contracts, as of October 31, 2018, the related statement of operations for the year then ended, the statements of changes in net assets for each of the years in the two-year period then ended and the related notes (collectively, the financial statements) and the financial highlights for each of the years or period in the five-year period then ended. In our opinion, the financial statements and financial highlights present fairly, in all material respects, the financial position of the Fund as of October 31, 2018, the results of its operations for the year then ended, the changes in its net assets for each of the years in the two-year period then ended and the financial highlights for each of the years or period in the five-year period then ended, in conformity with U.S. generally accepted accounting principles.
Basis for Opinion
These financial statements and financial highlights are the responsibility of the Fund’s management. Our responsibility is to express an opinion on these financial statements and financial highlights based on our audits. We are a public accounting firm registered with the Public Company Accounting Oversight Board (United States) (PCAOB) and are required to be independent with respect to the Fund in accordance with the U.S. federal securities laws and the applicable rules and regulations of the Securities and Exchange Commission and the PCAOB.
We conducted our audits in accordance with the standards of the PCAOB. Those standards require that we plan and perform the audit to obtain reasonable assurance about whether the financial statements and financial highlights are free of material misstatement, whether due to error or fraud. Our audits included performing procedures to assess the risks of material misstatement of the financial statements and financial highlights, whether due to error or fraud, and performing procedures that respond to those risks. Such procedures included examining, on a test basis, evidence regarding the amounts and disclosures in the financial statements and financial highlights. Such procedures also included confirmation of securities owned as of October 31, 2018, by correspondence with the custodian and brokers or by other appropriate auditing procedures when replies from brokers were not received. Our audits also included evaluating the accounting principles used and significant estimates made by management, as well as evaluating the overall presentation of the financial statements and financial highlights. We believe that our audits provide a reasonable basis for our opinion.

We have served as the auditor of one or more Dreyfus Corporation investment companies since 1994.
New York, New York
December 28, 2018
33
IMPORTANT TAX INFORMATION (Unaudited)
For federal tax purposes, the fund elects to provide each shareholder with their portion of the fund’s income sourced from foreign countries and taxes paid from foreign countries. The fund reports the maximum amount allowable but not less than $5,284,311 as income sourced from foreign countries for the fiscal year ended October 31, 2018 in accordance with Section 853(c)(2) of the Internal Revenue Code and also the fund reports the maximum amount allowable but not less than $884,199 as taxes paid from foreign countries for the fiscal year ended October 31, 2018 in accordance with Section 853(a) of the Internal Revenue Code. Where required by federal tax rules, shareholders will receive notification of their proportionate share of foreign sourced income and foreign taxes paid for the 2018 calendar year with Form 1099-DIV which will be mailed in early 2019. Also the fund designates the maximum amount allowable, but not less than $1,393,807 as ordinary income dividends paid during the fiscal year ended October 31, 2018 as qualified dividend income in accordance with Section 854(b)(1)(B) of the Internal Revenue Code.
34
BOARD MEMBERS INFORMATION (Unaudited)
INDEPENDENT BOARD MEMBERS
Joseph S. DiMartino (75)
Chairman of the Board (1999)
Principal Occupation During Past 5 Years:
· Corporate Director and Trustee (1995-present)
Other Public Company Board Memberships During Past 5 Years:
· CBIZ (formerly, Century Business Services, Inc.), a provider of outsourcing functions for small and medium size companies, Director (1997-present)
No. of Portfolios for which Board Member Serves: 124
———————
Francine J. Bovich (67)
Board Member (2012)
Principal Occupation During Past 5 Years:
· Trustee, The Bradley Trusts, private trust funds (2011-present)
Other Public Company Board Memberships During Past 5 Years:
· Annaly Capital Management, Inc., a real estate trust, Director (2014-present)
No. of Portfolios for which Board Member Serves: 72
———————
Kenneth A. Himmel (72)
Board Member (1994)
Principal Occupation During Past 5 Years:
· Managing Partner, Gulf Related, an international real estate development company (2010-present)
· President and CEO, Related Urban Development, a real estate development company (1996-present)
· President and CEO, Himmel & Company, a real estate development company (1980-present)
· CEO, American Food Management, a restaurant company (1983-present)
No. of Portfolios for which Board Member Serves: 25
———————
35
BOARD MEMBERS INFORMATION (Unaudited) (continued)
INDEPENDENT BOARD MEMBERS (continued)
Stephen J. Lockwood (71)
Board Member (1994)
Principal Occupation During Past 5 Years:
· Chairman of the Board, Stephen J. Lockwood and Company LLC, a real estate investment company (2000-present)
No. of Portfolios for which Board Member Serves: 25
———————
Roslyn M. Watson (69)
Board Member (1994)
Principal Occupation During Past 5 Years:
· Principal, Watson Ventures, Inc., a real estate investment company (1993-present)
No. of Portfolios for which Board Member Serves: 58
———————
Benaree Pratt Wiley (72)
Board Member (1998)
Principal Occupation During Past 5 Years:
· Principal, The Wiley Group, a firm specializing in strategy and business development (2005-present)
Other Public Company Board Memberships During Past 5 Years:
· CBIZ (formerly, Century Business Services, Inc.), a provider of outsourcing functions for small and medium size companies, Director (2008-present)
No. of Portfolios for which Board Member Serves: 79
———————
Once elected all Board Members serve for an indefinite term, but achieve Emeritus status upon reaching age 80. The address of the Board Members and Officers is c/o The Dreyfus Corporation, 200 Park Avenue, New York, New York 10166. Additional information about the Board Members is available in the fund’s Statement of Additional Information which can be obtained from Dreyfus free of charge by calling this toll free number: 1-800-DREYFUS.
James M. Fitzgibbons, Emeritus Board Member
36
OFFICERS OF THE FUND (Unaudited)
BRADLEY J. SKAPYAK, President since January 2010.
Chief Operating Officer and a director of the Manager since June 2009, Chairman of Dreyfus Transfer, Inc., an affiliate of the Manager and the transfer agent of the funds, since May 2011 and Chief Executive Officer of MBSC Securities Corporation since August 2016. He is an officer of 62 investment companies (comprised of 124 portfolios) managed by the Manager. He is 59 years old and has been an employee of the Manager since February 1988.
BENNETT A. MACDOUGALL, Chief Legal Officer since October 2015.
Chief Legal Officer of the Manager and Associate General Counsel and Managing Director of BNY Mellon since June 2015; from June 2005 to June 2015, he served in various capacities with Deutsche Bank – Asset & Wealth Management Division, including as Director and Associate General Counsel, and Chief Legal Officer of Deutsche Investment Management Americas Inc. from June 2012 to May 2015. He is an officer of 63 investment companies (comprised of 149 portfolios) managed by the Manager. He is 47 years old and has been an employee of the Manager since June 2015.
JAMES BITETTO, Vice President since August 2005 and Secretary since February 2018.
Managing Counsel of BNY Mellon and Secretary of the Manager, and an officer of 63 investment companies (comprised of 149 portfolios) managed by the Manager. He is 52 years old and has been an employee of the Manager since December 1996.
JOSEPH M. CHIOFFI, Vice President and Assistant Secretary since August 2005.
Managing Counsel of BNY Mellon, and an officer of 63 investment companies (comprised of 149 portfolios) managed by the Manager. He is 56 years old and has been an employee of the Manager since June 2000.
SONALEE CROSS, Vice President and Assistant Secretary since March 2018.
Counsel of BNY Mellon since October 2016; Associate at Proskauer Rose LLP from April 2016 to September 2016; Attorney at EnTrust Capital from August 2015 to February 2016; Associate at Sidley Austin LLP from September 2013 until August 2015. She is an officer of 63 investment companies (comprised of 149 portfolios) managed by Dreyfus. She is 31 years old and has been an employee of the Manager since October 2016.
MAUREEN E. KANE, Vice President and Assistant Secretary since April 2015.
Managing Counsel of BNY Mellon since July 2014; from October 2004 until July 2014, General Counsel, and from May 2009 until July 2014, Chief Compliance Officer of Century Capital Management. She is an officer of 63 investment companies (comprised of 149 portfolios) managed by the Manager. She is 56 years old and has been an employee of the Manager since July 2014.
SARAH S. KELLEHER, Vice President and Assistant Secretary since April 2014.
Managing Counsel of BNY Mellon since December 2017, from March 2013 to December 2017, Senior Counsel of BNY Mellon. She is an officer of 63 investment companies (comprised of 149 portfolios) managed by the Manager. She is 43 years old and has been an employee of the Manager since March 2013.
JEFF PRUSNOFSKY, Vice President and Assistant Secretary since August 2005.
Senior Managing Counsel of BNY Mellon, and an officer of 63 investment companies (comprised of 149 portfolios) managed by the Manager. He is 53 years old and has been an employee of the Manager since October 1990.
NATALYA ZELENSKY, Vice President and Assistant Secretary since March 2017.
Counsel of BNY Mellon since May 2016; Attorney at Wildermuth Endowment Strategy Fund/Wildermuth Advisory, LLC from November 2015 until May 2016; Assistant General Counsel at RCS Advisory Services from July 2014 until November 2015; Associate at Sutherland, Asbill & Brennan from January 2013 until January 2014. She is an officer of 63 investment companies (comprised of 149 portfolios) managed by Dreyfus. She is 33 years old and has been an employee of the Manager since May 2016.
JAMES WINDELS, Treasurer since November 2001.
Director – Mutual Fund Accounting of the Manager, and an officer of 63 investment companies (comprised of 149 portfolios) managed by the Manager. He is 60 years old and has been an employee of the Manager since April 1985.
37
OFFICERS OF THE FUND (Unaudited) (continued)
GAVIN C. REILLY, Assistant Treasurer since December 2005.
Tax Manager of the Investment Accounting and Support Department of the Manager, and an officer of 63 investment companies (comprised of 149 portfolios) managed by the Manager. He is 50 years old and has been an employee of the Manager since April 1991.
ROBERT S. ROBOL, Assistant Treasurer since December 2002.
Senior Accounting Manager – Dreyfus Financial Reporting of the Manager, and an officer of 63 investment companies (comprised of 149 portfolios) managed by the Manager. He is 54 years old and has been an employee of the Manager since October 1988.
ROBERT SALVIOLO, Assistant Treasurer since July 2007.
Senior Accounting Manager – Equity Funds of the Manager, and an officer of 63 investment companies (comprised of 149 portfolios) managed by the Manager. He is 51 years old and has been an employee of the Manager since June 1989.
ROBERT SVAGNA, Assistant Treasurer since December 2002.
Senior Accounting Manager – Fixed Income and Equity Funds of the Manager, and an officer of 63 investment companies (comprised of 149 portfolios) managed by the Manager. He is 51 years old and has been an employee of the Manager since November 1990.
JOSEPH W. CONNOLLY, Chief Compliance Officer since October 2004.
Chief Compliance Officer of the Manager, the Dreyfus Family of Funds and BNY Mellon Funds Trust (63 investment companies, comprised of 149 portfolios). He is 61 years old and has served in various capacities with the Manager since 1980, including manager of the firm’s Fund Accounting Department from 1997 through October 2001.
CARIDAD M. CAROSELLA, Anti-Money Laundering Compliance Officer since January 2016.
Anti-Money Laundering Compliance Officer of the Dreyfus Family of Funds and BNY Mellon Funds Trust since January 2016; from May 2015 to December 2015, Interim Anti-Money Laundering Compliance Officer of the Dreyfus Family of Funds and BNY Mellon Funds Trust and the Distributor; from January 2012 to May 2015, AML Surveillance Officer of the Distributor and from 2007 to December 2011, Financial Processing Manager of the Distributor. She is an officer of 57 investment companies (comprised of 143 portfolios) managed by the Manager. She is 50 years old and has been an employee of the Distributor since 1997.
38
NOTES
39
NOTES
40
NOTES
41
Dreyfus Global Emerging Markets Fund
200 Park Avenue
New York, NY 10166
Manager
The Dreyfus Corporation
200 Park Avenue
New York, NY 10166
Sub-Investment Adviser
Newton Investment Management
(North America) Limited
160 Queen Victoria Street,
London, EC4V, 4LA, UK
Custodian
The Bank of New York Mellon
240 Greenwich Street
New York, NY 10286
Transfer Agent &
Dividend Disbursing Agent
Dreyfus Transfer, Inc.
200 Park Avenue
New York, NY 10166
Distributor
MBSC Securities Corporation
200 Park Avenue
New York, NY 10166
| | |
Ticker Symbols: | Class A: DGEAX Class C: DGECX Class I: DGIEX Class Y: DGEYX |
Telephone Call your financial representative or 1-800-DREYFUS
Mail The Dreyfus Family of Funds, 144 Glenn Curtiss Boulevard, Uniondale, NY 11556-0144
E-mail Send your request to info@dreyfus.com
Internet Information can be viewed online or downloaded at www.dreyfus.com
The fund files its complete schedule of portfolio holdings with the Securities and Exchange Commission (“SEC”) for the first and third quarters of each fiscal year on Form N-Q. The fund’s Forms N-Q are available on the SEC’s website at www.sec.gov.
A description of the policies and procedures that the fund uses to determine how to vote proxies relating to portfolio securities and information regarding how the fund voted these proxies for the most recent 12-month period ended June 30 is available at www.dreyfus.com and on the SEC’s website at www.sec.gov and without charge, upon request, by calling 1-800-DREYFUS.
| | |
© 2018 MBSC Securities Corporation
6243AR1018 | 
|
Dreyfus Select Managers Long/Short Fund
| | | |

| | ANNUAL REPORT October 31, 2018 |
| |
Save time. Save paper. View your next shareholder report online as soon as it’s available. Log into www.dreyfus.com and sign up for Dreyfus eCommunications. It’s simple and only takes a few minutes. |
| |
The views expressed in this report reflect those of the portfolio manager(s) only through the end of the period covered and do not necessarily represent the views of Dreyfus or any other person in the Dreyfus organization. Any such views are subject to change at any time based upon market or other conditions and Dreyfus disclaims any responsibility to update such views. These views may not be relied on as investment advice and, because investment decisions for a Dreyfus fund are based on numerous factors, may not be relied on as an indication of trading intent on behalf of any Dreyfus fund. |
| |
Not FDIC-Insured • Not Bank-Guaranteed • May Lose Value |
Contents
THE FUND
FOR MORE INFORMATION
Back Cover
| | | | |
| |
Dreyfus Select Managers Long/Short Fund
| | The Fund |
A LETTER FROM THE PRESIDENT OF DREYFUS
Dear Shareholder:
We are pleased to present this annual report for Dreyfus Select Managers Long/Short Fund, covering the 12-month period from November 1, 2017 through October 31, 2018. For information about how the fund performed during the reporting period, as well as general market perspectives, we provide a Discussion of Fund Performance on the pages that follow.
Markets began the reporting period on solid footing as major global economies experienced above-trend growth across the board. In the United States, the Federal Reserve continued to move away from its accommodative monetary policy while other major central banks also began to consider monetary tightening. In the equity markets, both U.S. and non-U.S. markets enjoyed an upward trend, though investor concerns about volatility and inflation later began to weigh on returns. Interest rates rose across the curve, putting pressure on bond prices.
Later in the reporting period, global growth trends began to diverge. While a strong economic performance continued to bolster U.S. equity markets, slower growth and political concerns pressured markets in the Eurozone. Emerging markets also came under pressure as weakness in their currencies added to investors’ uneasiness. Fixed income markets continued to struggle as interest rates rose; the yield on the benchmark 10-year Treasury bond surged late in the reporting period, but growing investor concerns about global growth helped keep it from rising further.
Despite continuing doubts regarding trade, U.S. inflationary pressures, and global growth, we are optimistic that the U.S. economy will remain strong in the near term. However, we will stay attentive to signs that signal potential changes on the horizon. As always, we encourage you to discuss the risks and opportunities of today’s investment environment with your financial advisor.
Thank you for your continued confidence and support.
Sincerely,

Renee Laroche-Morris
President
The Dreyfus Corporation
November 15, 2018
2
DISCUSSION OF FUND PERFORMANCE (Unaudited)
For the period from November 1, 2017 through October 31, 2018, as provided by the fund’s portfolio allocation manager Jeffrey A. Brozek of EACM Advisors, LLC.
Market and Fund Performance Overview
For the 12-month period ended October 31, 2018, Dreyfus Select Managers Long/Short Fund’s Class A shares produced a total return of -2.47%, Class C shares returned -3.19%, Class I shares returned -2.29%, and Class Y shares returned -2.28%.1 In comparison, the fund’s benchmark, the HFRX Equity Hedge Index, produced a total return of -2.99%, and the MSCI ACWI Index — a broad-based index — produced a total return of -0.52% for the same period.2,3 Due to several factors, including the MSCI ACWI Index’s exclusion of short positions, we believe the HFRX Equity Hedge Index may be a more meaningful performance benchmark.
Equities generally advanced during the reporting period amid improving global economic prospects, better-than-expected corporate earnings, and lower U.S. tax rates. The fund’s A, I, and Y shares outperformed the HFRX Equity Hedge Index (its benchmark), mainly due to gains from long positions in North America.
The Fund’s Investment Approach
The fund seeks long-term capital appreciation. The fund seeks to achieve this investment objective with lower volatility than — and moderate correlation to — major equity-market indices. The fund uses a “manager-of-managers” approach by selecting one or more experienced equity managers to serve as sub-adviser to manage its assets. The fund allocates its assets among sub-advisers that use long/short equity investment strategies that are not expected to have returns that are highly correlated to each other or major equity-market indices. Each of the fund’s sub-advisers acts independently of any other sub-adviser and uses its own methodology to select portfolio investments.
The fund normally invests in equity securities (typically common stocks), including securities issued by other investment companies, such as exchange-traded funds (ETFs). The fund expects to maintain significant short positions in equity securities and equity-related instruments, including through derivative instruments and by selling short shares of ETFs. Although the fund intends to maintain an overall long position in its portfolio investments, in certain circumstances, the fund’s short positions may approach or reach the size of the fund’s overall long position.
Global Growth Trends Diverge
Global equity markets gained ground at the start of the reporting period, supported by improving economic conditions worldwide. Asian equity markets led the advance, as Japanese equities responded positively to better-than-expected corporate earnings and upward revisions of domestic growth forecasts from the Bank of Japan. U.S. stocks posted gains when tax-reform legislation reduced corporate tax rates and domestic labor markets continued to strengthen. Positive global growth trends enabled U.K. equities to climb despite concerns regarding the country’s exit from the European Union (EU). Eurozone markets proved more sluggish despite improving regional economic fundamentals. Volatility returned to markets early in 2018, and stock prices declined on perceived U.S. inflationary pressures and uncertainties surrounding the possibility of more protectionist trade policies.
3
DISCUSSION OF FUND PERFORMANCE (Unaudited) (continued)
Later in the period, global economic performance began to diverge. While the U.S. economy remained robust, European and emerging-market countries began to weaken as trade tensions heated up. Tightening monetary policy among developed markets and a strengthening U.S. dollar led to weakness in emerging-market currencies, which added to investors’ concerns. In addition, geopolitical events in Europe — including concerns about Brexit negotiations and Italy’s budget stand-off with the EU — heightened market uncertainty. Global equity markets sold off late in the period on concerns about higher interest rates, tariffs, and slower economic growth.
Positions in Health Care and Industrials Sectors Proved Productive
The two biggest positive contributors to the fund’s performance were positions in the health care and industrials sectors. Long positions faring best in the health care sector included Becton Dickinson, Boston Scientific, and Universal Health Services. In the industrials sector, both long and short positions were positive contributors. On the long side, positions in railroad operator CSX, European aerospace company Airbus Group, waste-management company Clean Harbors, and overnight shipper FedEx were profitable. Short positions in General Electric, cabinet manufacturer American Woodmark, machine-tools company Kennametal, and European lighting company Signify also added to the fund’s performance. The third-largest positive contributors to the fund’s returns were short positions in equity indices and currency-hedging positions.
The sectors detracting most from the fund’s performance were consumer staples, financials, and materials. In consumer staples, long positions in Indian beverage company United Spirits, household-products seller Edgewell Personal Care, and Philip Morris International hindered the fund’s performance most. Short positions in Japanese convenience-store company FamilyMart UNY Holdings, Hormel Foods, and Costco Wholesale also detracted from returns. In the financials sector, long positions in Affiliated Managers Group, AIG, Korean insurer Meritz Financial, AXA, and UBS Group proved unsuccessful. In the materials sector, the long positions that detracted from performance included DowDuPont, mining company Turquoise Hill Resources, and Indian cement companies Dalmia Bharat and Grasim Industries. Also hindering performance was a long position in Linde, a European chemical company.
Fund Liquidation
The Board of Directors of Dreyfus BNY Mellon Funds, Inc. (the “Company”) has approved the liquidation of the fund, a series of the Company, effective on or about November 30, 2018 (the “Liquidation Date”). Before the Liquidation Date, and at the discretion of fund management, the fund’s portfolio securities will be sold and the fund will cease to pursue its investment objective and policies. The liquidation of the fund may result in one or more taxable events for shareholders subject to federal income tax.
November 15, 2018
1 Total return includes reinvestment of dividends and any capital gains paid, and does not take into consideration the maximum initial sales charge in the case of Class A shares, or the applicable contingent deferred sales charge imposed on redemptions in the case of Class C shares. Had these charges been reflected, returns would have been lower. Share price and investment return fluctuate such that upon redemption, fund shares may be worth more or less than their original cost. Return figures provided reflect the absorption of certain fund expenses pursuant to an agreement by The Dreyfus Corporation in effect until March 1, 2019, at which time it may be extended, terminated, or modified. Had these expenses not been absorbed, the fund’s returns would have been lower. Past performance is no guarantee of future results.
4
2 Source: Lipper, Inc. — The HFRX Equity Hedge Index maintains positions, both long and short, in primarily equity and equity derivative securities. A wide variety of investment processes can be employed to arrive at an investment decision, including both quantitative and fundamental techniques; strategies can be broadly diversified or narrowly focused on specific sectors and can range broadly in terms of levels of net exposure, leverage employed, holding period, concentrations of market capitalizations and valuation ranges of typical portfolios. Investors cannot invest directly in any index.
3 Source: Lipper, Inc. — The MSCI ACWI Index captures large- and mid-cap representation across Developed Market (DM) countries and Emerging Market (EM) countries. It reflects reinvestment of net dividends and, where applicable, capital gain distributions. Investors cannot invest directly in any index.
Please note: the position in any security highlighted with italicized typeface was sold, or with respect to short positions in securities, closed, during the reporting period.
Equities are subject generally to market, market sector, market liquidity, issuer, and investment style risks, among other factors, to varying degrees, all of which are more fully described in the fund’s prospectus.
Small and midsized companies carry additional risks because their earnings and revenues tend to be less predictable, and their share prices more volatile, than those of larger, more established companies.
The ability of the fund to achieve its investment goal depends on the ability to allocate effectively the fund’s assets among the sub-advisers. There can be no assurance that the actual allocations will be effective in achieving the fund’s investment goal.
Manager-of-managers funds carry risks because each sub-adviser makes investment decisions independently, and it is possible that the investment styles of the sub-advisers may not complement one another. As a result, the fund’s different exposures to a given stock, industry, sector, market capitalization, geographic area, or investment style could unintentionally be more or less than it would have been if the fund had a single adviser or investment strategy.
Short sales involve selling a security the fund does not own in anticipation that the security’s price will decline. Short sales may involve substantial risk and leverage, and expose the fund to the risk that it will be required to buy the security sold short at a time when the security has appreciated in value, thus resulting in a loss to the fund. Short positions in stocks involve more risk than long positions in stocks because the maximum sustainable loss on a stock purchased is limited to the amount paid for the stock plus the transaction costs, whereas there is no maximum attainable price on the shorted stock. In theory, stocks sold short have unlimited risk. It is possible that the market value of securities the fund holds in long positions will decline at the same time that the market value of the securities the fund has sold short increases, thereby increasing the fund’s potential volatility. Leveraging occurs when the fund increases its assets available for investment using borrowing or similar transactions. Short sales effectively leverage the fund’s assets. The use of leverage may magnify the fund’s gains or losses.
5
FUND PERFORMANCE (Unaudited)
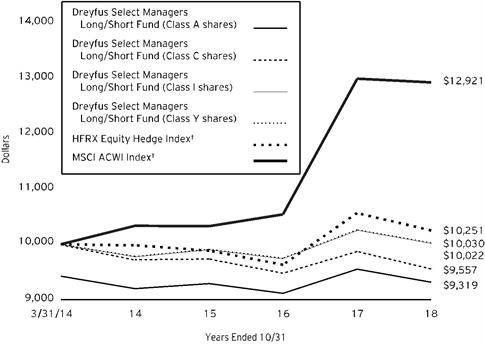
Comparison of change in value of $10,000 investment in Dreyfus Select Managers Long/Short Fund Class A shares, Class C shares, Class I shares and Class Y shares, with the HFRX Equity Hedge Index and the MSCI ACWI Index
† Source: Lipper Inc.
Past performance is not predictive of future performance.
The above graph compares a $10,000 investment made in each of the Class A, Class C, Class I and Class Y shares of Dreyfus Select Managers Long/Short Fund on 3/31/14 (inception date) to a $10,000 investment made in the HFRX Equity Hedge Index and the MSCI ACWI Index on that date. All dividends and capital gain distributions are reinvested.
The fund’s performance shown in the line graph above takes into account the maximum initial sales charge on Class A shares and all other applicable fees and expenses on all classes. The HFRX Equity Hedge Index maintains positions both long and short in primarily equity and equity derivative securities. A wide variety of investment processes can be employed to arrive at an investment decision, including both quantitative and fundamental techniques; strategies can be broadly diversified or narrowly focused on specific sectors and can range broadly in terms of levels of net exposure, leverage employed, holding period, concentrations of market capitalizations and valuation ranges of typical portfolios. The MSCI ACWI Index captures large- and mid-cap representation across Developed Market (DM) countries and Emerging Market (EM) countries. Unlike a mutual fund, the indices are not subject to charges, fees and other expenses. Investors cannot invest directly in any index. Further information relating to fund performance, including expense reimbursements, if applicable, is contained in the Financial Highlights section of the prospectus and elsewhere in this report.
6
| | | | | |
Average Annual Total Returns as of 10/31/18 |
| | Inception
Date | 1 Year | From
Inception |
Class A shares | | | | |
with maximum sales charge (5.75%) | | 3/31/14 | -8.06% | -1.53% |
without sales charge | | 3/31/14 | -2.47% | -0.25% |
Class C shares | | | | |
with applicable redemption charge† | | 3/31/14 | -4.15% | -0.98% |
without redemption | | 3/31/14 | -3.19% | -0.98% |
Class I shares | | 3/31/14 | -2.29% | 0.05% |
Class Y shares | | 3/31/14 | -2.28% | 0.06% |
HFRX Equity Hedge Index | | 3/31/14 | -2.99% | 0.54%†† |
MSCI ACWI Index | | 3/31/14 | -0.52% | 5.75%†† |
† The maximum contingent deferred sales charge for Class C shares is 1% for shares redeemed within one year of the date of purchase.
†† Index date is based on the inception date of the fund.
The performance data quoted represents past performance, which is no guarantee of future results. Share price and investment return fluctuate and an investor’s shares may be worth more or less than original cost upon redemption. Current performance may be lower or higher than the performance quoted. Go to Dreyfus.com for the fund’s most recent month-end returns.
The fund’s performance shown in the graph and table does not reflect the deduction of taxes that a shareholder would pay on fund distributions or the redemption of fund shares. In addition to the performance of Class A shares shown with and without a maximum sales charge, the fund’s performance shown in the table takes into account all other applicable fees and expenses on all classes.
7
UNDERSTANDING YOUR FUND’S EXPENSES (Unaudited)
As a mutual fund investor, you pay ongoing expenses, such as management fees and other expenses. Using the information below, you can estimate how these expenses affect your investment and compare them with the expenses of other funds. You also may pay one-time transaction expenses, including sales charges (loads) and redemption fees, which are not shown in this section and would have resulted in higher total expenses. For more information, see your fund’s prospectus or talk to your financial adviser.
Review your fund’s expenses
The table below shows the expenses you would have paid on a $1,000 investment in Dreyfus Select Managers Long/Short Fund from May 1, 2018 to October 31, 2018. It also shows how much a $1,000 investment would be worth at the close of the period, assuming actual returns and expenses.
| | | | | | | | | |
Expenses and Value of a $1,000 Investment | | |
assuming actual returns for the six months ended October 31, 2018 |
| | | | | |
| Class A | Class C | Class I | Class Y |
Expenses paid per $1,000† | | $12.78 | | $17.03 | | $11.73 | | $11.73 |
Ending value (after expenses) | | $980.00 | | $976.10 | | $981.00 | | $981.00 |
COMPARING YOUR FUND’S EXPENSES
WITH THOSE OF OTHER FUNDS (Unaudited)
Using the SEC’s method to compare expenses
The Securities and Exchange Commission (“SEC”) has established guidelines to help investors assess fund expenses. Per these guidelines, the table below shows your fund’s expenses based on a $1,000 investment, assuming a hypothetical 5% annualized return. You can use this information to compare the ongoing expenses (but not transaction expenses or total cost) of investing in the fund with those of other funds. All mutual fund shareholder reports will provide this information to help you make this comparison. Please note that you cannot use this information to estimate your actual ending account balance and expenses paid during the period.
| | | | | | | | | |
Expenses and Value of a $1,000 Investment |
assuming a hypothetical 5% annualized return for the six months ended October 31, 2018 |
| | | | | |
| | Class A | Class C | Class I | Class Y |
Expenses paid per $1,000† | | $12.98 | | $17.31 | | $11.93 | | $11.93 |
Ending value (after expenses) | | $1,012.30 | | $1,007.96 | | $1,013.36 | | $1,013.36 |
† Expenses are equal to the fund’s annualized expense ratio of 2.56% for Class A, 3.42 for Class C, 2.35% for Class I and 2.35% for Class Y, multiplied by the average account value over the period, multiplied by 184/365 (to reflect the one-half year period).
8
STATEMENT OF INVESTMENTS
October 31, 2018
| | | | | | | | |
| |
Description | | | | Shares | | Value ($) | |
Common Stocks - 59.9% | | | | | |
Automobiles & Components - .1% | | | | | |
Aston Martin Lagonda Global Holdings | | | | 6,265 | a,b | 122,137 | |
BorgWarner | | | | 1,063 | | 41,893 | |
Ford Motor | | | | 12,361 | | 118,048 | |
Garrett Motion | | | | 1 | | 11 | |
Goodyear Tire & Rubber | | | | 957 | | 20,154 | |
Harley-Davidson | | | | 879 | | 33,595 | |
| | | | | 335,838 | |
Banks - 3.8% | | | | | |
Associated Banc-Corp | | | | 53,933 | | 1,250,167 | |
Bank of America | | | | 57,341 | | 1,576,877 | |
Boston Private Financial Holdings | | | | 71,680 | | 967,680 | |
FCB Financial Holdings, Cl. A | | | | 1,724 | b | 67,460 | |
JPMorgan Chase & Co. | | | | 20,529 | c | 2,238,072 | |
Regions Financial | | | | 26,139 | | 443,579 | |
Synovus Financial | | | | 3,603 | | 135,329 | |
Wells Fargo & Co. | | | | 41,622 | | 2,215,539 | |
Western Alliance Bancorp | | | | 1,642 | b | 79,210 | |
| | | | | 8,973,913 | |
Capital Goods - 7.2% | | | | | |
3M | | | | 958 | | 182,269 | |
A.O. Smith | | | | 884 | | 40,249 | |
Airbus Group | | | | 24,590 | | 2,710,229 | |
Alfa Laval | | | | 16,097 | | 410,881 | |
Arconic | | | | 6,198 | | 126,006 | |
Boeing | | | | 546 | | 193,754 | |
Caterpillar | | | | 2,768 | | 335,814 | |
Cummins | | | | 535 | | 73,129 | |
Dover | | | | 18,812 | | 1,558,386 | |
Eaton | | | | 484 | | 34,688 | |
Emerson Electric | | | | 3,940 | | 267,447 | |
Engility Holdings | | | | 1,487 | b | 46,142 | |
Fortune Brands Home & Security | | | | 783 | | 35,102 | |
General Dynamics | | | | 10,920 | | 1,884,574 | |
Harris | | | | 195 | | 28,998 | |
Honeywell International | | | | 9,793 | | 1,418,222 | |
Illinois Tool Works | | | | 1,780 | | 227,075 | |
Ingersoll-Rand | | | | 1,315 | | 126,161 | |
Jacobs Engineering Group | | | | 788 | | 59,171 | |
Lockheed Martin | | | | 385 | | 113,132 | |
Masco | | | | 1,104 | | 33,120 | |
MTU Aero Engines Holding | | | | 1,948 | | 414,148 | |
9
STATEMENT OF INVESTMENTS (continued)
| | | | | | | | |
| |
Description | | | | Shares | | Value ($) | |
Common Stocks - 59.9% (continued) | | | | | |
Capital Goods - 7.2% (continued) | | | | | |
Parker-Hannifin | | | | 911 | | 138,135 | |
Pentair | | | | 916 | | 36,777 | |
Raytheon | | | | 1,324 | | 231,753 | |
Resideo Technologies | | | | 2 | b | 15 | |
Rockwell Automation | | | | 3,783 | | 623,174 | |
Rockwell Collins | | | | 20,232 | | 2,590,101 | |
Safran | | | | 3,505 | | 451,485 | |
Sandvik | | | | 40,139 | | 634,796 | |
Snap-on | | | | 385 | | 59,267 | |
United Technologies | | | | 13,801 | | 1,714,222 | |
Univar | | | | 269 | b | 6,623 | |
USG | | | | 1,342 | | 56,659 | |
W.W. Grainger | | | | 306 | | 86,895 | |
| | | | | 16,948,599 | |
Commercial & Professional Services - 2.3% | | | | | |
Clean Harbors | | | | 26,000 | b | 1,769,040 | |
Copart | | | | 1,361 | b | 66,567 | |
Dun & Bradstreet | | | | 5,779 | | 822,236 | |
IHS Markit | | | | 11,162 | | 586,340 | |
Nielsen Holdings | | | | 422 | | 10,964 | |
Republic Services | | | | 850 | | 61,778 | |
Robert Half International | | | | 890 | | 53,872 | |
TriNet Group | | | | 39,115 | b | 1,838,014 | |
Waste Management | | | | 2,076 | | 185,740 | |
| | | | | 5,394,551 | |
Consumer Durables & Apparel - 1.3% | | | | | |
D.R. Horton | | | | 12,725 | | 457,591 | |
Garmin | | | | 1,299 | | 85,942 | |
G-III Apparel Group | | | | 25,935 | b | 1,033,769 | |
Leggett & Platt | | | | 132 | | 4,793 | |
Michael Kors Holdings | | | | 485 | b | 26,874 | |
Mohawk Industries | | | | 398 | b | 49,643 | |
NIKE, Cl. B | | | | 930 | | 69,787 | |
PVH | | | | 11,150 | c | 1,346,808 | |
Whirlpool | | | | 381 | | 41,819 | |
| | | | | 3,117,026 | |
Consumer Services - 1.0% | | | | | |
Darden Restaurants | | | | 240 | | 25,572 | |
McDonald's | | | | 9,232 | | 1,633,141 | |
Papa John's International | | | | 1,692 | | 92,282 | |
Vail Resorts | | | | 2,260 | | 567,983 | |
| | | | | 2,318,978 | |
10
| | | | | | | | |
| |
Description | | | | Shares | | Value ($) | |
Common Stocks - 59.9% (continued) | | | | | |
Diversified Financials - 3.1% | | | | | |
Affiliated Managers Group | | | | 12,416 | | 1,411,203 | |
Berkshire Hathaway | | | | 11,920 | b | 2,446,938 | |
BlackRock | | | | 950 | | 390,849 | |
Franklin Resources | | | | 3,641 | | 111,050 | |
Invesco | | | | 2,813 | | 61,070 | |
Investor, Cl. B | | | | 28,610 | | 1,239,150 | |
Moody's | | | | 1,228 | | 178,649 | |
MSCI | | | | 462 | | 69,476 | |
Nasdaq | | | | 1,170 | | 101,451 | |
S&P Global | | | | 1,254 | | 228,629 | |
T. Rowe Price Group | | | | 1,673 | | 162,264 | |
UBS Group | | | | 59,109 | b | 824,775 | |
| | | | | 7,225,504 | |
Energy - 2.5% | | | | | |
Chevron | | | | 3,279 | | 366,100 | |
ConocoPhillips | | | | 7,026 | | 491,117 | |
Devon Energy | | | | 2,602 | | 84,305 | |
Eni | | | | 68,537 | | 1,218,983 | |
EQT | | | | 22,490 | | 763,985 | |
Exxon Mobil | | | | 7,207 | | 574,254 | |
HollyFrontier | | | | 1,231 | | 83,019 | |
Kinder Morgan | | | | 12,441 | | 211,746 | |
Marathon Oil | | | | 4,539 | | 86,196 | |
Marathon Petroleum | | | | 935 | | 65,871 | |
Occidental Petroleum | | | | 1,578 | | 105,836 | |
PBF Energy, Cl. A | | | | 9,353 | | 391,423 | |
Phillips 66 | | | | 3,193 | | 328,304 | |
Pioneer Natural Resources | | | | 3,509 | | 516,770 | |
Royal Dutch Shell, Cl. A, ADR | | | | 1,860 | | 117,533 | |
Schlumberger | | | | 3,900 | | 200,109 | |
Valero Energy | | | | 2,148 | | 195,661 | |
| | | | | 5,801,212 | |
Food & Staples Retailing - 1.0% | | | | | |
BJ's Wholesale Club Holdings | | | | 59,001 | b | 1,306,872 | |
Sysco | | | | 3,388 | | 241,666 | |
Walgreens Boots Alliance | | | | 2,207 | | 176,052 | |
Wal-Mart Stores | | | | 5,407 | | 542,214 | |
| | | | | 2,266,804 | |
Food, Beverage & Tobacco - 2.9% | | | | | |
Altria Group | | | | 5,729 | | 372,614 | |
Archer-Daniels-Midland | | | | 3,852 | | 182,007 | |
Coca-Cola | | | | 23,021 | | 1,102,245 | |
Constellation Brands, Cl. A | | | | 2,018 | | 402,046 | |
11
STATEMENT OF INVESTMENTS (continued)
| | | | | | | | |
| |
Description | | | | Shares | | Value ($) | |
Common Stocks - 59.9% (continued) | | | | | |
Food, Beverage & Tobacco - 2.9% (continued) | | | | | |
Cott | | | | 73,580 | | 1,106,643 | |
Kellogg | | | | 1,811 | | 118,584 | |
Kraft Heinz | | | | 1,640 | | 90,151 | |
Molson Coors Brewing, Cl. B | | | | 1,105 | | 70,720 | |
Nestle | | | | 14,455 | | 1,219,114 | |
PepsiCo | | | | 2,887 | | 324,441 | |
Philip Morris International | | | | 21,752 | c | 1,915,699 | |
| | | | | 6,904,264 | |
Health Care Equipment & Services - 7.8% | | | | | |
Abbott Laboratories | | | | 31,970 | | 2,204,012 | |
Aetna | | | | 18,540 | | 3,678,336 | |
AmerisourceBergen | | | | 45 | | 3,960 | |
Anthem | | | | 1,287 | | 354,659 | |
athenahealth | | | | 2,145 | b | 273,573 | |
Becton Dickinson and Co. | | | | 9,090 | c | 2,095,245 | |
Boston Scientific | | | | 47,720 | | 1,724,601 | |
Cardinal Health | | | | 1,811 | | 91,637 | |
Centene | | | | 604 | b | 78,713 | |
Cigna | | | | 1,564 | | 334,399 | |
CVS Health | | | | 1,251 | | 90,560 | |
Danaher | | | | 17,985 | c | 1,787,709 | |
Express Scripts Holding | | | | 14,055 | b | 1,362,913 | |
HCA Healthcare | | | | 1,979 | | 264,256 | |
Humana | | | | 2,597 | | 832,105 | |
Laboratory Corporation of America Holdings | | | | 675 | b | 108,371 | |
McKesson | | | | 579 | | 72,236 | |
Medtronic | | | | 3,095 | | 277,993 | |
NxStage Medical | | | | 550 | b | 15,609 | |
Quest Diagnostics | | | | 259 | | 24,374 | |
ResMed | | | | 437 | | 46,287 | |
UnitedHealth Group | | | | 1,668 | | 435,932 | |
Universal Health Services, Cl. B | | | | 7,774 | c | 945,007 | |
WellCare Health Plans | | | | 289 | b | 79,761 | |
Zimmer Biomet Holdings | | | | 9,997 | | 1,135,559 | |
| | | | | 18,317,807 | |
Household & Personal Products - 1.3% | | | | | |
Beiersdorf | | | | 1,674 | | 173,275 | |
Church & Dwight | | | | 1,350 | | 80,149 | |
Clorox | | | | 616 | | 91,445 | |
Colgate-Palmolive | | | | 5,254 | | 312,876 | |
Edgewell Personal Care | | | | 29,825 | b | 1,431,003 | |
Procter & Gamble | | | | 2,688 | | 238,372 | |
12
| | | | | | | | |
| |
Description | | | | Shares | | Value ($) | |
Common Stocks - 59.9% (continued) | | | | | |
Household & Personal Products - 1.3% (continued) | | | | | |
Unilever | | | | 15,318 | | 824,687 | |
| | | | | 3,151,807 | |
Insurance - 1.0% | | | | | |
Allianz | | | | 2,971 | | 620,393 | |
American International Group | | | | 20,475 | | 845,413 | |
Arthur J. Gallagher & Co. | | | | 360 | | 26,644 | |
Aspen Insurance Holdings | | | | 3,780 | | 158,307 | |
Genworth Financial, Cl. A | | | | 3,069 | b | 13,135 | |
Hartford Financial Services | | | | 843 | | 38,289 | |
Loews | | | | 1,434 | | 66,767 | |
Marsh & McLennan Cos. | | | | 1,284 | | 108,819 | |
MetLife | | | | 197 | | 8,114 | |
Progressive | | | | 3,327 | | 231,892 | |
Stewart Information Services | | | | 7,617 | | 314,430 | |
Torchmark | | | | 309 | | 26,160 | |
| | | | | 2,458,363 | |
Materials - 4.1% | | | | | |
Air Products & Chemicals | | | | 11,352 | c | 1,752,181 | |
Akzo Nobel | | | | 9,631 | | 810,011 | |
Avery Dennison | | | | 498 | | 45,179 | |
Bemis Co. | | | | 12,873 | | 589,197 | |
CF Industries Holdings | | | | 1,108 | | 53,217 | |
DowDuPont | | | | 39,826 | | 2,147,418 | |
FMC | | | | 941 | | 73,473 | |
Freeport-McMoRan | | | | 9,300 | | 108,345 | |
International Paper | | | | 2,697 | | 122,336 | |
LyondellBasell Industries, Cl. A | | | | 2,381 | | 212,552 | |
Nucor | | | | 1,720 | | 101,686 | |
Packaging Corporation of America | | | | 480 | | 44,069 | |
PPG Industries | | | | 131 | | 13,767 | |
Sealed Air | | | | 891 | | 28,833 | |
Sherwin-Williams | | | | 5,326 | c | 2,095,621 | |
W.R. Grace & Co. | | | | 19,535 | | 1,265,673 | |
WestRock | | | | 1,780 | | 76,487 | |
| | | | | 9,540,045 | |
Media & Entertainment - .9% | | | | | |
CBS, Cl. B | | | | 942 | | 54,024 | |
DISH Network, Cl. A | | | | 1 | b | 31 | |
Interpublic Group of Companies | | | | 2,083 | | 48,242 | |
News Corp., Cl. A | | | | 3,879 | | 51,164 | |
Omnicom Group | | | | 106 | | 7,878 | |
Tribune Media Co | | | | 3,653 | | 138,851 | |
Twenty-First Century Fox, Cl. A | | | | 17,508 | | 796,965 | |
13
STATEMENT OF INVESTMENTS (continued)
| | | | | | | | |
| |
Description | | | | Shares | | Value ($) | |
Common Stocks - 59.9% (continued) | | | | | |
Media & Entertainment - .9% (continued) | | | | | |
Twenty-First Century Fox, Cl. B | | | | 4,571 | | 206,518 | |
Walt Disney | | | | 1,271 | | 145,949 | |
World Wrestling Entertainment, Cl. A | | | | 9,862 | | 715,883 | |
Zynga | | | | 8,532 | b | 31,056 | |
| | | | | 2,196,561 | |
Pharmaceuticals Biotechnology & Life Sciences - 2.8% | | | | | |
AbbVie | | | | 1,641 | | 127,752 | |
Akorn | | | | 1,174 | b | 7,831 | |
Allergan | | | | 14,638 | c | 2,312,950 | |
Amgen | | | | 130 | | 25,063 | |
Biogen | | | | 865 | b | 263,194 | |
Bristol-Myers Squibb | | | | 4,110 | | 207,719 | |
Celgene | | | | 3,827 | b | 274,013 | |
Gilead Sciences | | | | 420 | | 28,636 | |
Mylan | | | | 1,735 | | 54,219 | |
Nektar Therapeutics | | | | 1,063 | b | 41,117 | |
Novartis | | | | 9,776 | | 853,701 | |
Roche Holding | | | | 5,853 | | 1,420,220 | |
Shire, ADR | | | | 4,116 | | 748,289 | |
Takeda Pharmaceutical, ADR | | | | 15,231 | | 321,374 | |
| | | | | 6,686,078 | |
Real Estate - .1% | | | | | |
Realty Income | | | | 526 | d | 31,702 | |
Weyerhaeuser | | | | 4,474 | d | 119,143 | |
| | | | | 150,845 | |
Retailing - 2.7% | | | | | |
Advance Auto Parts | | | | 407 | | 65,022 | |
Amazon.com | | | | 6 | b | 9,588 | |
AutoZone | | | | 1,761 | b,c | 1,291,641 | |
CarMax | | | | 9,745 | | 661,783 | |
Dollar General | | | | 1,184 | | 131,874 | |
eBay | | | | 5,387 | b | 156,385 | |
Expedia | | | | 13,595 | | 1,705,221 | |
Foot Locker | | | | 558 | | 26,304 | |
Genuine Parts | | | | 1,028 | | 100,662 | |
Home Depot | | | | 2,972 | | 522,715 | |
Kohl's | | | | 818 | | 61,947 | |
Lowe's | | | | 4,665 | | 444,201 | |
The TJX Companies | | | | 766 | | 84,168 | |
Tiffany & Co. | | | | 10,879 | c | 1,210,833 | |
| | | | | 6,472,344 | |
Semiconductors & Semiconductor Equipment - 1.6% | | | | | |
Applied Materials | | | | 1,390 | | 45,703 | |
14
| | | | | | | | |
| |
Description | | | | Shares | | Value ($) | |
Common Stocks - 59.9% (continued) | | | | | |
Semiconductors & Semiconductor Equipment - 1.6% (continued) | | | | | |
Broadcom | | | | 4,591 | | 1,026,043 | |
Integrated Device Technology | | | | 27,615 | b | 1,292,658 | |
Intel | | | | 9,351 | | 438,375 | |
KLA-Tencor | | | | 814 | | 74,514 | |
Micron Technology | | | | 6,644 | b | 250,612 | |
Texas Instruments | | | | 7,476 | | 693,997 | |
| | | | | 3,821,902 | |
Software & Services - 5.4% | | | | | |
Accenture | | | | 2,744 | | 432,509 | |
Alliance Data Systems | | | | 300 | | 61,854 | |
Automatic Data Processing | | | | 2,020 | | 291,042 | |
Broadridge Financial Solutions | | | | 728 | | 85,132 | |
CA | | | | 42,717 | | 1,894,926 | |
Check Point Software Technologies | | | | 1,136 | b | 126,096 | |
CommVault Systems | | | | 16,555 | b | 963,832 | |
DXC Technology | | | | 45,156 | c | 3,288,712 | |
Imperva | | | | 6,005 | b | 332,377 | |
International Business Machines | | | | 6,305 | | 727,786 | |
Intuit | | | | 1,689 | | 356,379 | |
Mastercard, Cl. A | | | | 274 | | 54,162 | |
Microsoft | | | | 14,805 | | 1,581,322 | |
Paychex | | | | 1,518 | | 99,414 | |
PayPal Holdings | | | | 4,399 | b | 370,352 | |
Perspecta | | | | 14,607 | | 357,725 | |
Red Hat | | | | 697 | | 119,633 | |
SAP | | | | 13,256 | | 1,420,647 | |
Visa, Cl. A | | | | 1,041 | | 143,502 | |
| | | | | 12,707,402 | |
Technology Hardware & Equipment - 1.9% | | | | | |
Amphenol | | | | 255 | | 22,822 | |
Apple | | | | 1,249 | | 273,356 | |
Cisco Systems | | | | 8,549 | | 391,117 | |
CommScope Holding | | | | 503 | b | 12,102 | |
Corning | | | | 4,294 | | 137,193 | |
Extreme Networks | | | | 124,830 | b | 692,806 | |
F5 Networks | | | | 310 | b | 54,337 | |
FLIR Systems | | | | 14,051 | | 650,702 | |
Hewlett Packard Enterprise | | | | 3,275 | | 49,944 | |
HP | | | | 9,805 | | 236,693 | |
NetApp | | | | 1,387 | | 108,866 | |
Orbotech | | | | 24,963 | b | 1,396,430 | |
Seagate Technology | | | | 2,025 | | 81,466 | |
15
STATEMENT OF INVESTMENTS (continued)
| | | | | | | | |
| |
Description | | | | Shares | | Value ($) | |
Common Stocks - 59.9% (continued) | | | | | |
Technology Hardware & Equipment - 1.9% (continued) | | | | | |
TE Connectivity | | | | 2,397 | | 180,782 | |
Western Digital | | | | 1,688 | | 72,702 | |
Xerox | | | | 776 | | 21,627 | |
| | | | | 4,382,945 | |
Telecommunication Services - .7% | | | | | |
CenturyLink | | | | 5,750 | | 118,680 | |
VEON | | | | 53,941 | | 151,574 | |
Verizon Communications | | | | 8,634 | | 492,915 | |
Zayo Group Holdings | | | | 32,865 | b | 982,006 | |
| | | | | 1,745,175 | |
Transportation - 3.7% | | | | | |
American Airlines Group | | | | 2,515 | | 88,226 | |
CSX | | | | 39,797 | | 2,740,421 | |
Expeditors International of Washington | | | | 1,207 | | 81,086 | |
FedEx | | | | 11,710 | c | 2,580,181 | |
Kansas City Southern | | | | 16,610 | | 1,693,556 | |
Norfolk Southern | | | | 686 | | 115,131 | |
Old Dominion Freight Line | | | | 8,734 | | 1,139,088 | |
Union Pacific | | | | 241 | | 35,239 | |
United Continental Holdings | | | | 1,483 | b | 126,811 | |
United Parcel Service, Cl. B | | | | 178 | | 18,964 | |
| | | | | 8,618,703 | |
Utilities - .7% | | | | | |
Avista | | | | 3,585 | | 184,341 | |
E.ON | | | | 83,713 | | 811,062 | |
FirstEnergy | | | | 2,265 | | 84,439 | |
NRG Energy | | | | 2,095 | | 75,818 | |
PPL | | | | 3,526 | | 107,190 | |
Southern | | | | 6,633 | | 298,684 | |
WEC Energy Group | | | | 2,159 | | 147,676 | |
| | | | | 1,709,210 | |
Total Common Stocks (cost $134,153,206) | | | | 141,245,876 | |
| | | Preferred Dividend
Yield (%) | | | | | |
Preferred Stocks - .6% | | | | | |
Automobiles & Components - .6% | | | | | |
Volkswagen
(cost $1,413,938) | | 2.57 | | 8,391 | | 1,413,220 | |
16
| | | | | | | | |
| |
Description | Coupon
Rate (%) | Maturity Date | | Principal Amount ($) | | Value ($) | |
Bonds and Notes - .2% | | | | | |
Health Care Equipment & Services - .2% | | | | | |
LifePoint Health
(cost $458,372) | 5.875 | 12/01/23 | | 439,000 | | 460,127 | |
Description/Number of Contracts | Exercise Price | Expiration Date | | Notional Value ($) | | Value ($) | |
Options Purchased - .1% | | | | | |
Call Options - .0% | | | | | |
Cvs Health Corp Contracts 2,300, | 77.5 | 1/18/19 | | 1,783 | | 4,577 | |
Cvs Health Corp Contracts 2,100, | 80 | 1/18/19 | | 1,680 | | 3,024 | |
Cvs Health Corp Contracts 4,600, | 77.5 | 12/21/18 | | 3,565 | | 6,762 | |
Diamondback Energy Inc Contracts 1,500, | 135 | 12/21/18 | | 2,025 | | 2,250 | |
Twenty-First Century Fox Inc Contracts 1,100, | 46 | 1/18/19 | | 2,576 | | 11,760 | |
Twenty-First Century Fox Inc Contracts 2,800, | 47 | 1/18/19 | | 1,927 | | 6,765 | |
Twenty-First Century Fox Inc Contracts 300, | 48 | 1/18/19 | | 624 | | 1,300 | |
Ishares Russell 2000 Etf Contracts 2,100, | 167 | 12/21/18 | | 3,507 | | 714 | |
Kla-Tencor Corp Contracts 1,300, | 105 | 11/16/18 | | 1,365 | | 130 | |
Science Applications Internati Contracts 3,600, | 85 | 11/16/18 | | 3,400 | | 2,100 | |
Synovus Financial Corp Contracts 300, | 45 | 2/15/19 | | 945 | | 578 | |
Synovus Financial Corp Contracts 1,700, | 45 | 11/16/18 | | 765 | | 42 | |
Synovus Financial Corp Contracts 500, | 52.5 | 11/16/18 | | 2,258 | | 108 | |
Synovus Financial Corp Contracts 3,800, | 42 | 12/21/18 | | 1,596 | | 1,425 | |
Synnex Corp Contracts 3,500, | 100 | 11/16/18 | | 3,500 | | 1,312 | |
Synnex Corp Contracts 1,600, | 100 | 12/21/18 | | 2,100 | | 367 | |
Spdr S&P 500 Etf Trust Contracts 1,100, | 291.5 | 10/31/18 | | 3,207 | | 6 | |
Spdr S&P 500 Etf Trust Contracts 2,300, | 295 | 10/31/18 | | 6,785 | | 12 | |
Spdr S&P 500 Etf Trust Contracts 3,400, | 295.5 | 10/31/18 | | 10,047 | | 17 | |
Spdr S&P 500 Etf Trust Contracts 1,100, | 290 | 11/16/18 | | 3,190 | | 99 | |
Spdr S&P 500 Etf Trust Contracts 1,100, | 291 | 11/16/18 | | 16,587 | | 513 | |
Spdr S&P 500 Etf Trust Contracts 1,600, | 292 | 12/21/18 | | 4,672 | | 928 | |
Spdr S&P 500 Etf Trust Contracts 2,300, | 293 | 12/21/18 | | 6,739 | | 1,127 | |
Spdr S&P 500 Etf Trust Contracts 3,700, | 296 | 12/21/18 | | 10,952 | | 1,073 | |
Spdr S&P 500 Etf Trust Contracts 1,100, | 297 | 12/21/18 | | 3,267 | | 352 | |
Spdr S&P 500 Etf Trust Contracts 3,400, | 298 | 12/21/18 | | 10,132 | | 850 | |
Tronox Ltd Contracts 4,700, | 17 | 11/16/18 | | 799 | | 470 | |
Tronox Ltd Contracts 4,700, | 20 | 11/16/18 | | 940 | | 235 | |
United Natural Foods Inc Contracts 100, | 35 | 11/16/18 | | 420 | | 31 | |
United Natural Foods Inc Contracts 200, | 40 | 11/16/18 | | 3,600 | | 900 | |
United Technologies Corp Contracts 600, | 129 | 11/16/18 | | 774 | | 606 | |
United Technologies Corp Contracts 500, | 130 | 11/16/18 | | 3,900 | | 3,120 | |
Westrock Co Contracts 1,000, | 42.5 | 1/18/19 | | 765 | | 5,040 | |
17
STATEMENT OF INVESTMENTS (continued)
| | | | | | | | |
| |
Description/Number of Contracts | Exercise Price | Expiration Date | | Notional Value ($) | | Value ($) | |
Options Purchased - .1% (continued) | | | | | |
Call Options - .0% (continued) | | | | | |
Westrock Co Contracts 1,600, | 45 | 1/18/19 | | 855 | | 3,040 | |
| | | | | 61,633 | |
Put Options - .1% | | | | | |
Athenahealth Inc Contracts 800, | 120 | 11/16/18 | | 960 | | 1,040 | |
Ca Inc Contracts 4,600, | 38 | 11/16/18 | | 1,748 | | 805 | |
Walt Disney Co/The Contracts 200, | 97.5 | 1/18/19 | | 8,775 | | 6,930 | |
Twenty-First Century Fox Inc Contracts 2,600, | 40 | 1/18/19 | | 1,440 | | 4,860 | |
Scana Corp Contracts 2,500, | 35 | 11/16/18 | | 875 | | 1,437 | |
Synovus Financial Corp Contracts 2,900, | 36 | 11/16/18 | | 1,044 | | 1,232 | |
Synovus Financial Corp Contracts 1,000, | 37 | 11/16/18 | | 370 | | 750 | |
Synovus Financial Corp Contracts 1,700, | 37 | 12/21/18 | | 629 | | 2,346 | |
Synovus Financial Corp Contracts 300, | 39 | 12/21/18 | | 117 | | 772 | |
S&P 500 Index Contracts 1,200, | 2,560 | 11/16/18 | | 30,720 | | 14,820 | |
S&P 500 Index Contracts 1,200, | 2,720 | 11/16/18 | | 32,640 | | 52,116 | |
| | | | | 87,108 | |
Total Options Purchased (cost $205,579) | | | | 148,741 | |
| | | 7-Day
Yield (%) | | | | | |
Investment Companies - 21.8% | | | | | |
Registered Investment Companies - 21.8% | | | | | |
Dreyfus Institutional Preferred Government Plus Money Market Fund
(cost $51,295,571) | | 2.21 | | 51,295,571 | e | 51,295,571 | |
Total Investments (cost $187,526,666) | | 82.6% | | 194,563,535 | |
Cash and Receivables (Net) | | 17.4% | | 41,009,725 | |
Net Assets | | 100.0% | | 235,573,260 | |
ADR—American Depository Receipt
a Security exempt from registration pursuant to Rule 144A under the Securities Act of 1933. These securities may be resold in transactions exempt from registration, normally to qualified institutional buyers. At October 31, 2018, these securities were valued at $122,137 or .05% of net assets.
b Non-income producing security.
c Held by a broker as collateral for open short positions.
d Investment in real estate investment trust.
e Investment in affiliated issuer. The investment objective of this investment company is publicly available and can be found within the investment company’s prospectus.
18
| | |
Portfolio Summary (Unaudited) † | Value (%) |
Investment Companies | 21.8 |
Industrials | 13.1 |
Health Care | 10.8 |
Information Technology | 8.9 |
Financials | 7.9 |
Consumer Discretionary | 5.8 |
Consumer Staples | 5.2 |
Materials | 4.0 |
Energy | 2.5 |
Communication Services | 1.7 |
Utilities | .7 |
Real Estate | .1 |
Options Purchased | .1 |
| | 82.6 |
† Based on net assets.
See notes to financial statements.
19
STATEMENT OF SECURITIES SOLD SHORT
October 31, 2018
| | | | | | |
Common Stocks - 20.5% | | Shares | | Value ($) | |
Automobiles & Components - .3% | | | | | |
Aptiv | | 1,430 | | 109,824 | |
Garrett Motion | | 36,555 | | 554,539 | |
Banks - 1.4% | | | | | |
Bank of America | | 7,948 | | 218,570 | |
BB&T | | 3,340 | | 164,194 | |
Citigroup | | 3,842 | | 251,497 | |
Citizens Financial Group | | 2,055 | | 76,754 | |
Comerica | | 720 | | 58,723 | |
Fifth Third Bancorp | | 2,917 | | 78,730 | |
Fulton Financial | | 50,620 | | 810,426 | |
Huntington Bancshares | | 4,432 | | 63,511 | |
JPMorgan Chase & Co. | | 166 | | 18,097 | |
KeyCorp | | 5,904 | | 107,217 | |
M&T Bank | | 599 | | 99,081 | |
National Bank of Canada | | 25,030 | | 1,136,232 | |
Regions Financial | | 4,734 | | 80,336 | |
SunTrust Banks | | 496 | | 31,079 | |
SVB Financial Group | | 33 | | 7,829 | |
U.S. Bancorp | | 263 | | 13,747 | |
Wells Fargo & Co. | | 1,017 | | 54,135 | |
Zions Bancorporation | | 834 | | 39,240 | |
Capital Goods - 2.4% | | | | | |
Allegion | | 523 | | 44,837 | |
Deere & Co. | | 197 | | 26,682 | |
Fastenal | | 1,202 | | 61,795 | |
Flowserve | | 734 | | 33,691 | |
Gamesa Corp Tecnologica | | 52,890 | | 586,002 | |
General Dynamics | | 1,443 | | 249,033 | |
General Electric | | 20,914 | | 211,231 | |
Huntington Ingalls Industries | | 198 | | 43,259 | |
Johnson Controls International | | 4,047 | | 129,383 | |
L3 Technologies | | 387 | | 73,325 | |
Mercury Systems | | 10,870 | | 509,368 | |
Nexeo Solutions | | 877 | | 9,165 | |
Northrop Grumman | | 955 | | 250,162 | |
PACCAR | | 9,089 | | 519,982 | |
Quanta Services | | 438 | | 13,666 | |
Rockwell Automation | | 3,450 | | 568,319 | |
Rockwell Collins | | 709 | | 90,766 | |
Roper Technologies | | 132 | | 37,343 | |
Signify | | 16,030 | | 395,733 | |
20
| | | | | | |
Common Stocks - 20.5% (continued) | | Shares | | Value ($) | |
Capital Goods - 2.4% (continued) | | | | | |
Stanley Black & Decker | | 310 | | 36,121 | |
Textron | | 162 | | 8,688 | |
TransDigm Group | | 49 | | 16,182 | |
United Rentals | | 338 | | 40,584 | |
United Technologies | | 3,024 | | 375,611 | |
Vestas Wind Systems | | 10,485 | | 656,664 | |
Volvo, Cl. B | | 49,300 | | 735,868 | |
Xylem | | 814 | | 53,382 | |
Commercial & Professional Services - .4% | | | | | |
Cintas | | 455 | | 82,751 | |
Equifax | | 493 | | 50,010 | |
IHS Markit | | 1,638 | | 86,044 | |
Robert Half International | | 10,639 | | 643,979 | |
Rollins | | 72 | | 4,262 | |
Consumer Durables & Apparel - .9% | | | | | |
Brunswick | | 4,600 | | 239,154 | |
Carter's | | 6,015 | | 577,320 | |
D.R. Horton | | 1,569 | | 56,421 | |
Fossil Group | | 18,430 | | 400,115 | |
Hanesbrands | | 2,014 | | 34,560 | |
Hasbro | | 523 | | 47,964 | |
Mattel | | 1,893 | | 25,707 | |
Newell Brands | | 2,684 | | 42,622 | |
PVH | | 334 | | 40,344 | |
Ralph Lauren | | 455 | | 58,973 | |
Tapestry | | 463 | | 19,590 | |
Under Armour, Cl. C | | 2,450 | | 48,584 | |
VF | | 7,781 | | 644,889 | |
Consumer Services - .3% | | | | | |
Chipotle Mexican Grill | | 121 | | 55,700 | |
Marriott International, Cl. A | | 1,306 | | 152,658 | |
MGM Resorts International | | 3,068 | | 81,854 | |
Norwegian Cruise Line Holdings | | 1,189 | | 52,399 | |
Royal Caribbean Cruises | | 1,147 | | 120,125 | |
Starbucks | | 2,388 | | 139,149 | |
Wynn Resorts | | 607 | | 61,064 | |
Diversified Financials - .3% | | | | | |
Ameriprise Financial | | 465 | | 59,167 | |
Capital One Financial | | 2,053 | | 183,333 | |
CBOE Holdings | | 447 | | 50,444 | |
CME Group | | 944 | | 172,979 | |
Discover Financial Services | | 316 | | 22,016 | |
Intercontinental Exchange | | 219 | | 16,872 | |
Jefferies Financial Group | | 1,588 | | 34,094 | |
21
STATEMENT OF SECURITIES SOLD SHORT (continued)
| | | | | | | | |
Common Stocks - 20.5% (continued) | | Shares | | Value ($) | |
Diversified Financials - .3% (continued) | | | | | |
Northern Trust | | 969 | | 91,154 | |
Raymond James Financial | | 510 | | 39,112 | |
Synchrony Financial | | 3,090 | | 89,239 | |
Energy - 1.1% | | | | | |
Anadarko Petroleum | | 2,279 | | 121,243 | |
Apache | | 1,942 | | 73,466 | |
Cabot Oil & Gas | | 2,459 | | 59,582 | |
Cimarex Energy | | 525 | | 41,722 | |
Concho Resources | | 856 | | 119,061 | |
EOG Resources | | 2,533 | | 266,826 | |
EQT | | 1,429 | | 48,543 | |
Exxon Mobil | | 5,506 | | 438,718 | |
Halliburton | | 339 | | 11,757 | |
Helmerich & Payne | | 606 | | 37,748 | |
Hess | | 1,486 | | 85,296 | |
Linde | | 849 | | 140,484 | |
Marathon Petroleum | | 3,785 | | 266,640 | |
National Oilwell Varco | | 1,975 | | 72,680 | |
Newfield Exploration | | 1,153 | | 23,291 | |
Noble Energy | | 2,692 | | 66,896 | |
ONEOK | | 1,833 | | 120,245 | |
Pioneer Natural Resources | | 740 | | 108,980 | |
Schlumberger | | 5,903 | | 302,883 | |
TechnipFMC | | 1,946 | | 51,180 | |
Williams Cos. | | 4,610 | | 112,161 | |
Food & Staples Retailing - .6% | | | | | |
Kroger | | 2,145 | | 63,835 | |
Walgreens Boots Alliance | | 7,815 | | 623,403 | |
Wal-Mart Stores | | 6,924 | | 694,339 | |
Food, Beverage & Tobacco - 1.8% | | | | | |
Altria Group | | 15,011 | | 976,315 | |
Brown-Forman, Cl. B | | 2,092 | | 96,943 | |
Campbell Soup | | 1,740 | | 65,093 | |
Flowers Foods | | 63,325 | | 1,222,806 | |
General Mills | | 131 | | 5,738 | |
Hershey | | 5,905 | | 632,721 | |
Hormel Foods | | 19,003 | | 829,291 | |
J.M. Smucker | | 507 | | 54,918 | |
Mondelez International, Cl. A | | 1,894 | | 79,510 | |
Monster Beverage | | 2,633 | | 139,154 | |
Tyson Foods, Cl. A | | 950 | | 56,924 | |
Health Care Equipment & Services - 1.4% | | | | | |
ABIOMED | | 224 | | 76,429 | |
Align Technology | | 424 | | 93,789 | |
22
| | | | | | | | |
Common Stocks - 20.5% (continued) | | Shares | | Value ($) | |
Health Care Equipment & Services - 1.4% (continued) | | | | | |
Baxter International | | 2,350 | | 146,899 | |
Boston Scientific | | 6,046 | | 218,502 | |
Cerner | | 1,541 | | 88,268 | |
Cigna | | 3,416 | | 730,375 | |
Cooper | | 206 | | 53,212 | |
CVS Health | | 12,082 | | 874,616 | |
Dentsply Sirona | | 892 | | 30,890 | |
Edwards Lifesciences | | 962 | | 141,991 | |
Henry Schein | | 835 | | 69,305 | |
Hologic | | 1,449 | | 56,497 | |
IDEXX Laboratories | | 409 | | 86,757 | |
Intuitive Surgical | | 494 | | 257,463 | |
Stryker | | 1,626 | | 263,770 | |
Universal Health Services, Cl. B | | 390 | | 47,408 | |
Varian Medical Systems | | 391 | | 46,674 | |
Zimmer Biomet Holdings | | 1,114 | | 126,539 | |
Household & Personal Products - .4% | | | | | |
Coty | | 3,974 | | 41,926 | |
Estee Lauder, Cl. A | | 6,894 | | 947,511 | |
Insurance - .6% | | | | | |
Allstate | | 350 | | 33,502 | |
American International Group | | 613 | | 25,311 | |
Aon | | 872 | | 136,189 | |
Brighthouse Financial | | 570 | | 22,589 | |
Chubb | | 276 | | 34,475 | |
Cincinnati Financial | | 718 | | 56,464 | |
Everest Re Group | | 78 | | 16,993 | |
FNF Group | | 4,421 | | 147,882 | |
Lincoln National | | 253 | | 15,228 | |
Principal Financial Group | | 1,183 | | 55,684 | |
Travelers Cos. | | 164 | | 20,521 | |
Willis Towers Watson | | 713 | | 102,073 | |
WR Berkley | | 10,070 | | 764,313 | |
Materials - .5% | | | | | |
Air Products & Chemicals | | 1,159 | | 178,892 | |
Albemarle | | 436 | | 43,260 | |
Ball | | 1,508 | | 67,558 | |
Ecolab | | 346 | | 52,990 | |
International Flavors & Fragrances | | 331 | | 47,882 | |
LyondellBasell Industries, Cl. A | | 5,838 | | 521,158 | |
Martin Marietta Materials | | 364 | | 62,346 | |
Mosaic | | 2,101 | | 65,005 | |
Newmont Mining | | 2,313 | | 71,518 | |
Vulcan Materials | | 731 | | 73,933 | |
23
STATEMENT OF SECURITIES SOLD SHORT (continued)
| | | | | | | | |
Common Stocks - 20.5% (continued) | | Shares | | Value ($) | |
Media & Entertainment - 1.6% | | | | | |
Activision Blizzard | | 4,073 | | 281,241 | |
Alphabet, Cl. A | | 283 | | 308,634 | |
Charter Communications, Cl. A | | 899 | | 288,013 | |
Cineworld Group | | 113,995 | | 429,112 | |
Discovery Communications, Cl. A | | 3,702 | | 119,908 | |
Electronic Arts | | 380 | | 34,572 | |
Facebook, Cl. A | | 915 | | 138,888 | |
Netflix | | 1,487 | | 448,747 | |
Omnicom Group | | 11,300 | | 839,816 | |
Publicis Groupe | | 8,691 | | 504,158 | |
Take-Two Interactive Software | | 622 | | 80,157 | |
TripAdvisor | | 768 | | 40,044 | |
Twitter | | 4,169 | | 144,873 | |
Walt Disney | | 858 | | 98,524 | |
Pharmaceuticals Biotechnology & Life Sciences - 1.4% | | | | | |
Agilent Technologies | | 1,537 | | 99,582 | |
Alexion Pharmaceuticals | | 1,200 | | 134,484 | |
Allergan | | 1,770 | | 279,678 | |
Amgen | | 2,510 | | 483,903 | |
Illumina | | 643 | | 200,069 | |
Incyte | | 1,202 | | 77,914 | |
IQVIA Holdings | | 901 | | 110,760 | |
Mettler-Toledo International | | 128 | | 69,993 | |
Mylan | | 2,840 | | 88,750 | |
PerkinElmer | | 484 | | 41,856 | |
Perrigo | | 740 | | 52,022 | |
Pfizer | | 1,622 | | 69,843 | |
Regeneron Pharmaceuticals | | 543 | | 184,207 | |
Roche Holding | | 4,855 | | 1,178,057 | |
Vertex Pharmaceuticals | | 1,345 | | 227,924 | |
Waters | | 349 | | 66,202 | |
Real Estate - .9% | | | | | |
American Tower | | 2,383 | a | 371,295 | |
Apartment Investment & Management, Cl. A | | 472 | a | 20,315 | |
AvalonBay Communities | | 59 | a | 10,347 | |
Boston Properties | | 662 | a | 79,943 | |
CBRE Group, Cl. A | | 1,900 | | 76,551 | |
Crown Castle International | | 2,137 | a | 232,377 | |
Equinix | | 436 | a | 165,131 | |
Essex Property Trust | | 304 | a | 76,237 | |
Federal Realty Investment Trust | | 256 | a | 31,757 | |
HCP | | 1,983 | a | 54,632 | |
Host Hotels & Resorts | | 3,038 | a | 58,056 | |
Iron Mountain | | 1,514 | a | 46,344 | |
24
| | | | | | | | | | | |
Common Stocks - 20.5% (continued) | | Shares | | Value ($) | |
Real Estate - .9% (continued) | | | | | |
Kimco Realty | | 2,367 | a | 38,085 | |
Macerich | | 778 | a | 40,160 | |
Mid-America Apartment Communities | | 118 | a | 11,530 | |
Prologis | | 2,166 | a | 139,642 | |
Realogy Holdings | | 20,290 | | 386,930 | |
Regency Centers | | 393 | a | 24,900 | |
SBA Communications | | 641 | a | 103,951 | |
Simon Property Group | | 525 | a | 96,348 | |
SL Green Realty | | 425 | a | 38,786 | |
Vornado Realty Trust | | 835 | a | 56,847 | |
Retailing - 1.2% | | | | | |
Canadian Tire, Cl. A | | 5,000 | | 562,649 | |
CarMax | | 82 | | 5,569 | |
Dollar General | | 3,957 | | 440,731 | |
Dollar Tree | | 1,124 | | 94,753 | |
Expedia | | 792 | | 99,341 | |
Gap | | 1,549 | | 42,288 | |
Home Depot | | 5,220 | | 918,094 | |
L Brands | | 1,521 | | 49,311 | |
LKQ | | 1,837 | | 50,095 | |
Macy's | | 1,263 | | 43,308 | |
Rent-A-Center | | 9,278 | | 132,212 | |
Sleep Number | | 12,215 | | 444,260 | |
Tiffany & Co. | | 40 | | 4,452 | |
Semiconductors & Semiconductor Equipment - .9% | | | | | |
Advanced Micro Devices | | 5,284 | | 96,222 | |
Broadcom | | 1,234 | | 275,787 | |
KLA-Tencor | | 6,244 | | 571,576 | |
Maxim Integrated Products | | 8,805 | | 440,426 | |
Microchip Technology | | 1,440 | | 94,723 | |
NVIDIA | | 1,755 | | 370,007 | |
Qorvo | | 508 | | 37,343 | |
Skyworks Solutions | | 1,009 | | 87,541 | |
Texas Instruments | | 188 | | 17,452 | |
Xilinx | | 1,264 | | 107,908 | |
Software & Services - 1.0% | | | | | |
Accenture | | 5,419 | | 854,143 | |
Adobe Systems | | 998 | | 245,268 | |
Akamai Technologies | | 652 | | 47,107 | |
ANSYS | | 382 | | 57,128 | |
Autodesk | | 1,068 | | 138,039 | |
Cadence Design Systems | | 1,536 | | 68,460 | |
Fidelity National Information Services | | 1,574 | | 163,853 | |
Fortinet | | 181 | | 14,875 | |
25
STATEMENT OF SECURITIES SOLD SHORT (continued)
| | | | | | | | | |
Common Stocks - 20.5% (continued) | | Shares | | Value ($) | |
Software & Services - 1.0% (continued) | | | | | |
Gartner | | 35 | | 5,163 | |
Global Payments | | 879 | | 100,408 | |
Red Hat | | 910 | | 156,192 | |
salesforce.com | | 916 | | 125,712 | |
Science Applications International | | 651 | | 45,251 | |
Symantec | | 3,403 | | 61,764 | |
Synopsys | | 617 | | 55,240 | |
Total System Services | | 791 | | 72,100 | |
Western Union | | 2,539 | | 45,804 | |
Technology Hardware & Equipment - .1% | | | | | |
Arista Networks | | 403 | | 92,831 | |
IPG Photonics | | 176 | | 23,505 | |
Juniper Networks | | 1,505 | | 44,051 | |
Transportation - .2% | | | | | |
CH Robinson Worldwide | | 58 | | 5,164 | |
Delta Air Lines | | 524 | | 28,679 | |
J.B. Hunt Transport Services | | 541 | | 59,840 | |
Kansas City Southern | | 544 | | 55,466 | |
Landstar System | | 2,320 | | 232,209 | |
Utilities - .8% | | | | | |
Alliant Energy | | 910 | | 39,112 | |
Ameren | | 1,008 | | 65,097 | |
American Water Works | | 861 | | 76,224 | |
CenterPoint Energy | | 1,763 | | 47,619 | |
Consolidated Edison | | 256 | | 19,456 | |
Duke Energy | | 616 | | 50,900 | |
Edison International | | 1,008 | | 69,945 | |
Entergy | | 814 | | 68,335 | |
Eversource Energy | | 748 | | 47,318 | |
NextEra Energy | | 1,409 | | 243,053 | |
NiSource | | 1,607 | | 40,754 | |
PG&E | | 2,241 | | 104,901 | |
Pinnacle West Capital | | 485 | | 39,891 | |
Public Service Enterprise Group | | 2,341 | | 125,080 | |
SCANA | | 680 | | 27,234 | |
Sempra Energy | | 970 | | 106,816 | |
Vectren | | 8,078 | | 577,819 | |
26
| | | | | | | | |
Common Stocks - 20.5% (continued) | | Shares | | Value ($) | |
Utilities - .8% (continued) | | | | | |
Xcel Energy | | 2,161 | | 105,911 | |
Total Common Stocks (proceeds $50,745,818) | | | | 48,322,090 | |
Limited Partnerships .0% | | | | | |
Real Estate .0% | | | | | |
Brookfield Property Partners | | 1 | | 19 | |
Exchange-Traded Funds - 4.0% | | | | | |
Registered Investment Companies - 4.0% | | | | | |
Amex Consumer Discretionary Select Sector SPDR Fund | | 12,531 | | 1,320,517 | |
Industrial Select Sector SPDR Fund | | 2,424 | | 169,389 | |
iShares Russell 1000 ETF | | 12,277 | | 1,844,496 | |
iShares U.S. Real Estate ETF | | 4,355 | | 340,169 | |
SPDR S&P 500 ETF Trust | | 10,979 | | 2,971,246 | |
SPDR S&P Regional Banking ETF | | 7,524 | | 406,221 | |
Technology Select Sector SPDR Fund | | 32,197 | | 2,231,252 | |
Total Exchange-Traded Funds (proceeds $9,551,557) | | | | 9,283,290 | |
Total Securities Sold Short (proceeds $60,297,395) | | | | 57,605,399 | |
ETF—Exchange-Traded Fund
SPDR—Standard & Poor's Depository Receipt
a Investment in real estate investment trust.
27
STATEMENT OF INVESTMENTS IN AFFILIATED ISSUERS
| | | | | | | |
Registered Investment Companies | Value
10/31/17($) | Purchases($) | Sales($) | Value
10/31/18($) | Net
Assets(%) | Dividends/
Distributions($) |
Dreyfus Institutional Preferred Government Plus Money Market Fund | 94,668,842 | 419,729,021 | 463,102,292 | 51,295,571 | 21.8 | 570,762 |
See notes to financial statements.
28
STATEMENT OF FUTURES
October 31, 2018
| | | | | | | |
Description | Number of
Contracts | Expiration | Notional
Value ($) | Value ($) | Unrealized Appreciation (Depreciation) ($) | |
Futures Short | | |
CAC 40 10 Euro | 43 | 11/18 | 2,476,030a | 2,479,031 | (3,001) | |
DAX | 3 | 12/18 | 1,011,521a | 973,300 | 38,221 | |
DJ Euro Stoxx 50 | 209 | 12/18 | 7,864,180a | 7,560,960 | 303,220 | |
FTSE 100 | 30 | 12/18 | 2,729,410a | 2,726,784 | 2,626 | |
OMX Stockholm 30 Index | 29 | 11/18 | 475,058a | 485,491 | (10,433) | |
Gross Unrealized Appreciation | | 344,067 | |
Gross Unrealized Depreciation | | (13,434) | |
a Notional amounts in foreign currency have been converted to USD using relevant foreign exchange rates.
See notes to financial statements.
29
STATEMENT OF OPTIONS WRITTEN
October 31, 2018
| | | | | | | |
Description/ Contracts | Exercise Price | Expiration Date | Notional Amount | | Value ($) | |
Call Options: | | | | | | |
Twenty-First Century Fox Inc
Contracts 9 | 46 | 1/18/19 | 41,400 | | (1,890) | |
Twenty-First Century Fox Inc
Contracts 10 | 47 | 1/18/19 | 47,000 | | (1,650) | |
Twenty-First Century Fox Inc
Contracts 13 | 48 | 1/18/19 | 62,400 | | (1,300) | |
Put Options: | | | | | | |
S&P 500 Index
Contracts 24 | 2,640 | 11/16/18 | 6,336,000 | | (50,160) | |
Total Options Written (premiums received $57,498) | | | | (55,000) | |
See notes to financial statements.
30
STATEMENT OF FORWARD FOREIGN CURRENCY EXCHANGE CONTRACTS October 31, 2018
| | | | | | |
Counterparty/ Purchased
Currency | Purchased Currency
Amounts | Currency
Sold | Sold
Currency
Amounts | Settlement Date | Unrealized Appreciation (Depreciation)($) |
Morgan Stanley | | | |
United States Dollar | 1,179,215 | Japanese Yen | 132,403,950 | 11/30/18 | 3,226 |
Danish Krone | 11,587,000 | United States Dollar | 1,880,959 | 5/15/19 | (88,221) |
United States Dollar | 776,399 | Danish Krone | 4,831,000 | 5/15/19 | 28,948 |
United States Dollar | 19,695,658 | Euro | 15,420,000 | 5/15/19 | 1,916,314 |
United States Dollar | 110,785 | Euro | 95,000 | 5/15/19 | 1,249 |
United States Dollar | 5,128,767 | Norwegian Krone | 40,521,000 | 5/15/19 | 278,809 |
British Pound | 74,310 | United States Dollar | 94,741 | 11/30/18 | 368 |
Swedish Krona | 57,449,715 | United States Dollar | 6,508,764 | 5/15/19 | (118,177) |
United States Dollar | 2,264,457 | Swedish Krona | 20,316,000 | 5/15/19 | 4,547 |
United States Dollar | 1,151,137 | Danish Krone | 6,756,000 | 5/15/19 | 105,850 |
Swiss Franc | 14,131,000 | United States Dollar | 14,684,405 | 5/15/19 | (369,737) |
British Pound | 39,000 | United States Dollar | 51,647 | 12/19/18 | (1,669) |
United States Dollar | 173,926 | British Pound | 133,000 | 12/19/18 | 3,489 |
British Pound | 45,000 | United States Dollar | 60,034 | 5/15/19 | (1,933) |
Swedish Krona | 1,641,000 | United States Dollar | 185,380 | 12/19/18 | (5,191) |
United States Dollar | 183,467 | Swedish Krona | 1,641,000 | 12/19/18 | 3,278 |
Euro | 29,816,000 | United States Dollar | 36,015,158 | 5/15/19 | (1,637,147) |
United States Dollar | 37,888,996 | Euro | 31,451,000 | 5/15/19 | 1,625,821 |
British Pound | 179,000 | United States Dollar | 229,943 | 5/15/19 | 1,170 |
Norwegian Krone | 26,661,000 | United States Dollar | 3,371,278 | 5/15/19 | (180,223) |
Euro | 2,287,000 | United States Dollar | 2,667,021 | 12/19/18 | (65,007) |
United States Dollar | 6,150,746 | Euro | 5,244,000 | 12/19/18 | 184,432 |
Australian Dollar | 1 | United States Dollar | 1 | 11/2/18 | - |
31
STATEMENT OF FORWARD FOREIGN CURRENCY EXCHANGE CONTRACTS (continued)
| | | | | | |
Counterparty/ Purchased
Currency | Purchased Currency
Amounts | Currency
Sold | Sold
Currency
Amounts | Settlement Date | Unrealized Appreciation (Depreciation)($) |
Morgan Stanley (continued) |
Norwegian Krone | 15,729,000 | United States Dollar | 1,917,643 | 5/15/19 | (35,039) |
United States Dollar | 226,355 | Norwegian Krone | 1,869,000 | 5/15/19 | 2,654 |
United States Dollar | 4,676 | British Pound | 3,663 | 11/2/18 | (6) |
Swedish Krona | 5,235,000 | United States Dollar | 642,651 | 5/15/19 | (60,321) |
United States Dollar | 46,545 | Singapore Dollar | 64,372 | 11/1/18 | 71 |
Chinese Yuan Renminbi | 41,416,700 | United States Dollar | 5,947,257 | 4/17/19 | (51,654) |
United States Dollar | 6,500,000 | Chinese Yuan Renminbi | 41,416,700 | 4/17/19 | 604,397 |
United States Dollar | 22,557,798 | Swiss Franc | 21,571,000 | 5/15/19 | 706,428 |
United States Dollar | 242,978 | Hong Kong Dollar | 1,906,750 | 11/1/18 | (179) |
United States Dollar | 56 | Japanese Yen | 6,334 | 11/2/18 | - |
Swiss Franc | 585,921 | United States Dollar | 581,432 | 11/2/18 | 430 |
Euro | 15,240,000 | United States Dollar | 17,953,326 | 5/15/19 | (381,523) |
United States Dollar | 8,771,712 | Euro | 7,407,000 | 5/15/19 | 231,401 |
United States Dollar | 22,099 | Hong Kong Dollar | 173,326 | 11/2/18 | (5) |
United States Dollar | 416,688 | Swedish Krona | 3,816,864 | 11/2/18 | (468) |
Swiss Franc | 4,924,000 | United States Dollar | 5,141,949 | 5/15/19 | (153,949) |
United States Dollar | 1,911,498 | Swiss Franc | 1,878,000 | 5/15/19 | 9,089 |
United States Dollar | 114,256 | Japanese Yen | 12,893,797 | 11/1/18 | (23) |
Swedish Krona | 9,188,000 | United States Dollar | 1,028,120 | 5/15/19 | (6,066) |
United States Dollar | 2,012,506 | Euro | 1,778,225 | 11/2/18 | (1,910) |
British Pound | 28,840 | United States Dollar | 36,862 | 11/30/18 | 50 |
United States Dollar | 190,755 | British Pound | 148,545 | 11/30/18 | 632 |
United States Dollar | 293,545 | British Pound | 224,000 | 5/15/19 | 4,331 |
Swedish Krona | 65,644,000 | United States Dollar | 7,682,742 | 5/15/19 | (380,640) |
32
| | | | | | |
Counterparty/ Purchased
Currency | Purchased Currency
Amounts | Currency
Sold | Sold
Currency
Amounts | Settlement Date | Unrealized Appreciation (Depreciation)($) |
Morgan Stanley (continued) |
United States Dollar | 16,253,580 | Swedish Krona | 137,656,715 | 5/15/19 | 940,934 |
Gross Unrealized Appreciation | | | 6,657,918 |
Gross Unrealized Depreciation | | | (3,539,088) |
See notes to financial statements.
33
STATEMENT OF SWAP AGREEMENTS
October 31, 2018
| | | | | | | |
OTC Total Return Swaps | |
Received
Reference
Entity | Paid
Reference
Entity | Counterparties | Maturity Date | Notional
Amount | Unrealized Appreciation (Depreciation) ($) |
Sterling Overnight Index Average | BHP Billiton | Morgan Stanley | 11/24/18 | 796,610 | 6,438 |
Diageo Plc | Sterling Overnight Index Average | Morgan Stanley | 11/21/18 | 839,984 | 56,086 |
Hsbc Holdings Plc | Sterling Overnight Index Average | Morgan Stanley | 11/24/18 | 1,298,637 | (98) |
Legal & General Group Plc | Sterling Overnight Index Average | Morgan Stanley | 11/24/18 | 313,322 | (4,727) |
Legal & General Group Plc | Sterling Overnight Index Average | Morgan Stanley | 11/24/18 | 132,154 | 3,386 |
Legal & General Group Plc | Sterling Overnight Index Average | Morgan Stanley | 11/24/18 | 375,029 | (23,728) |
Prudential Plc | Sterling Overnight Index Average | Morgan Stanley | 11/24/18 | 370,929 | (39,186) |
Prudential Plc | Sterling Overnight Index Average | Morgan Stanley | 11/24/18 | 212,496 | 8,477 |
Prudential Plc | Sterling Overnight Index Average | Morgan Stanley | 11/24/18 | 245,133 | (20,662) |
Sterling Overnight Index Average | Rio Tinto Plc | Morgan Stanley | 11/21/18 | 800,017 | 14,946 |
Rio Tinto Plc | Sterling Overnight Index Average | Morgan Stanley | 11/21/18 | 119,742 | 1,188 |
BP Plc | Sterling Overnight Index Average | Morgan Stanley | 11/21/18 | 857,731 | (65) |
Lloyds Banking Group Plc | Sterling Overnight Index Average | Morgan Stanley | 11/21/18 | 787,335 | (7,313) |
Glaxosmithkline Plc | Sterling Overnight Index Average | Morgan Stanley | 11/24/18 | 586,104 | (41) |
Bouygues Sa | Effective Overnight Index Average | Morgan Stanley | 11/24/18 | 215,878 | (19,323) |
Bouygues Sa | Effective Overnight Index Average | Morgan Stanley | 11/24/18 | 114,600 | (18,795) |
34
| | | | | | | |
OTC Total Return Swaps | |
Received
Reference
Entity | Paid
Reference
Entity | Counterparties | Maturity Date | Notional
Amount | Unrealized Appreciation (Depreciation) ($) |
Bouygues Sa | Effective Overnight Index Average | Morgan Stanley | 11/24/18 | 76,278 | (13,763) |
Airbus Group NV Se | Effective Overnight Index Average | Morgan Stanley | 11/24/18 | 1,413,825 | 14,025 |
LVMH Moet Hennessy Louis Vuitton | Effective Overnight Index Average | Morgan Stanley | 11/24/18 | 398,691 | 11,619 |
Effective Overnight Index Average | LVMH Moet Hennessy Louis Vuitton | Morgan Stanley | 11/24/18 | 433,228 | 10,590 |
LVMH Moet Hennessy Louis Vuitton | Effective Overnight Index Average | Morgan Stanley | 11/24/18 | 200,941 | 1,993 |
LVMH Moet Hennessy Louis Vuitton | Effective Overnight Index Average | Morgan Stanley | 11/24/18 | 104,823 | (5,184) |
LVMH Moet Hennessy Louis Vuitton | Effective Overnight Index Average | Morgan Stanley | 11/24/18 | 278,114 | (14,117) |
Thales Sa | Effective Overnight Index Average | Morgan Stanley | 11/24/18 | 51,452 | 113 |
Thales Sa | Effective Overnight Index Average | Morgan Stanley | 11/24/18 | 353,906 | (2,204) |
Thales Sa | Effective Overnight Index Average | Morgan Stanley | 11/24/18 | 168,527 | (8,510) |
Pernod Ricard Sa | Effective Overnight Index Average | Morgan Stanley | 11/21/18 | 616,450 | 19,681 |
Schneider Electric Se | Effective Overnight Index Average | Morgan Stanley | 11/24/18 | 617,886 | 18,937 |
Schneider Electric Se | Effective Overnight Index Average | Morgan Stanley | 11/24/18 | 396,053 | 3,929 |
Accor Sa | Effective Overnight Index Average | Morgan Stanley | 11/21/18 | 811,157 | 5,282 |
US Federal Funds Effective Rate | Amcor Ltd/Australia | Morgan Stanley | 5/17/20 | 302,656 | 42,425 |
US Federal Funds Effective Rate | Amcor Ltd/Australia | Morgan Stanley | 8/12/20 | 21,676 | (6,250) |
35
STATEMENT OF SWAP AGREEMENTS (continued)
| | | | | | | |
OTC Total Return Swaps | |
Received
Reference
Entity | Paid
Reference
Entity | Counterparties | Maturity Date | Notional
Amount | Unrealized Appreciation (Depreciation) ($) |
Unsecured On Call Estimate Bank of Japan | Takeda Pharmaceutical Co Ltd | Morgan Stanley | 5/17/20 | 368,851 | (12,910) |
Unsecured On Call Estimate Bank of Japan | Takeda Pharmaceutical Co Ltd | Credit Suisse International | 5/17/20 | 47,925 | (2,384) |
Unsecured On Call Estimate Bank of Japan | Takeda Pharmaceutical Co Ltd | Morgan Stanley | 5/17/20 | 153,270 | (7,427) |
Unsecured On Call Estimate Bank of Japan | Takeda Pharmaceutical Co Ltd | Morgan Stanley | 5/17/20 | 341,777 | (10,535) |
Unsecured On Call Estimate Bank of Japan | Takeda Pharmaceutical Co Ltd | Morgan Stanley | 5/17/20 | 220,510 | (4,561) |
Peugeot Sa | Effective Overnight Index Average | Morgan Stanley | 11/24/18 | 408,341 | 11,965 |
Peugeot Sa | Effective Overnight Index Average | Morgan Stanley | 11/24/18 | 403,338 | (32) |
Safran Sa | Effective Overnight Index Average | Morgan Stanley | 11/24/18 | 408,977 | 15,510 |
Safran Sa | Effective Overnight Index Average | Morgan Stanley | 11/24/18 | 203,136 | 4,939 |
Safran Sa | Effective Overnight Index Average | Morgan Stanley | 11/24/18 | 246,861 | (20) |
Electricite De France Sa | Effective Overnight Index Average | Morgan Stanley | 11/21/18 | 402,685 | (383) |
Total Sa | Effective Overnight Index Average | Morgan Stanley | 11/21/18 | 1,540,960 | (81) |
Vinci Sa | Effective Overnight Index Average | Morgan Stanley | 11/24/18 | 162,960 | (4,960) |
Vinci Sa | Effective Overnight Index Average | Morgan Stanley | 11/24/18 | 645,409 | 13,150 |
Vinci Sa | Effective Overnight Index Average | Morgan Stanley | 11/24/18 | 320,562 | (7,319) |
Vinci Sa | Effective Overnight Index Average | Morgan Stanley | 11/24/18 | 28,574 | (1,152) |
Anglo American Plc | Sterling Overnight Index Average | Morgan Stanley | 11/21/18 | 805,612 | 25,064 |
36
| | | | | | | |
OTC Total Return Swaps | |
Received
Reference
Entity | Paid
Reference
Entity | Counterparties | Maturity Date | Notional
Amount | Unrealized Appreciation (Depreciation) ($) |
Effective Overnight Index Average | Danone Sa | Morgan Stanley | 11/21/18 | 398,749 | (1,759) |
Danone Sa | Effective Overnight Index Average | Morgan Stanley | 11/21/18 | 192,502 | (2,441) |
Air Liquide Sa | Effective Overnight Index Average | Morgan Stanley | 11/24/18 | 793,665 | (5,668) |
Shire Plc | US Federal Funds Effective Rate | Morgan Stanley | 5/2/20 | 144,868 | 10,173 |
Shire Plc | US Federal Funds Effective Rate | Morgan Stanley | 5/2/20 | 410,021 | 25,038 |
Shire Plc | US Federal Funds Effective Rate | Morgan Stanley | 5/2/20 | 43,484 | 1,809 |
Shire Plc | US Federal Funds Effective Rate | Morgan Stanley | 5/2/20 | 62,924 | 2,357 |
Shire Plc | US Federal Funds Effective Rate | Morgan Stanley | 5/2/20 | 56,045 | 1,381 |
Ocado Group Plc | Sterling Overnight Index Average | Morgan Stanley | 11/24/18 | 170,034 | (10,305) |
Ocado Group Plc | Sterling Overnight Index Average | Morgan Stanley | 11/24/18 | 161,880 | (12,349) |
Ocado Group Plc | Sterling Overnight Index Average | Morgan Stanley | 11/24/18 | 141,712 | (23,844) |
Effective Overnight Index Average | Gemalto Nv | Morgan Stanley | 1/3/19 | 23,215 | (245) |
Effective Overnight Index Average | Gemalto Nv | Morgan Stanley | 1/3/19 | 30,973 | (292) |
Effective Overnight Index Average | Gemalto Nv | Morgan Stanley | 1/3/19 | 252,232 | (2,227) |
Effective Overnight Index Average | Gemalto Nv | Morgan Stanley | 1/3/19 | 44,548 | (176) |
Effective Overnight Index Average | Gemalto Nv | Morgan Stanley | 1/3/19 | 37,361 | (126) |
37
STATEMENT OF SWAP AGREEMENTS (continued)
| | | | | | | |
OTC Total Return Swaps | |
Received
Reference
Entity | Paid
Reference
Entity | Counterparties | Maturity Date | Notional
Amount | Unrealized Appreciation (Depreciation) ($) |
Effective Overnight Index Average | Gemalto Nv | Morgan Stanley | 1/3/19 | 82,879 | (250) |
Effective Overnight Index Average | Gemalto Nv | Morgan Stanley | 1/3/19 | 90,979 | (237) |
Vodafone Group Plc | Sterling Overnight Index Average | Morgan Stanley | 11/21/18 | 766,211 | (17,196) |
B&M European Value Retail Sa | Sterling Overnight Index Average | Morgan Stanley | 11/9/18 | 475,219 | 33,817 |
Industria De Diseno Textil Sa | Effective Overnight Index Average | Morgan Stanley | 11/21/18 | 398,327 | 6,195 |
NEX Group Plc | US Federal Funds Effective Rate | Morgan Stanley | 5/2/20 | 19,210 | 1,833 |
NEX Group Plc | US Federal Funds Effective Rate | Morgan Stanley | 5/2/20 | 87,558 | 8,288 |
NEX Group Plc | US Federal Funds Effective Rate | Morgan Stanley | 5/2/20 | 25,062 | 1,301 |
Vinci Sa | Effective Overnight Index Average | Morgan Stanley | 11/24/18 | 50,629 | (1,075) |
Effective Overnight Index Average | Gemalto Nv | Morgan Stanley | 1/3/19 | 57,953 | (184) |
Effective Overnight Index Average | Gemalto Nv | Morgan Stanley | 1/3/19 | 1,597 | (4) |
Gross Unrealized Appreciation | 381,935 |
Gross Unrealized Depreciation | (314,108) |
See notes to financial statements.
38
STATEMENT OF ASSETS AND LIABILITIES
October 31, 2018
| | | | | | | |
| | | | | | |
| | | Cost | | Value | |
Assets ($): | | | | |
Investments in securities—See Statement of Investments: | | | |
Unaffiliated issuers | 136,231,095 | | 143,267,964 | |
Affiliated issuers | | 51,295,571 | | 51,295,571 | |
Cash | | | | | 244,411 | |
Cash denominated in foreign currency | | | 6,294,191 | | 6,209,248 | |
Cash collateral held by broker—Note 4 | | 81,737,947 | |
Receivable for investment securities sold | | 15,795,657 | |
Unrealized appreciation on forward foreign
currency exchange contracts—Note 4 | | 6,657,918 | |
Dividends and interest receivable | | 533,627 | |
Unrealized appreciation on swap agreements—Note 4 | | 381,935 | |
Prepaid expenses | | | | | 15,375 | |
| | | | | 306,139,653 | |
Liabilities ($): | | | | |
Due to The Dreyfus Corporation and affiliates—Note 3(c) | | | | 415,159 | |
Securities sold short, at value (proceeds $60,297,395)—Note 4 | | 57,605,399 | |
Payable for investment securities purchased | | 7,220,166 | |
Unrealized depreciation on forward foreign
currency exchange contracts—Note 4 | | 3,539,088 | |
Payable for shares of Common Stock redeemed | | 794,845 | |
Unrealized depreciation on swap agreements—Note 4 | | 314,108 | |
Payable for futures variation margin—Note 4 | | 231,025 | |
Unrealized depreciation on foreign currency transactions | | 216,293 | |
Payable for dividends on securities sold short | | 106,095 | |
Outstanding options written, at value
(premiums received $57,498)—Note 4 | | 55,000 | |
Directors fees and expenses payable | | 6,493 | |
Due to broker | | 780 | |
Accrued expenses | | | | | 61,942 | |
| | | | | 70,566,393 | |
Net Assets ($) | | | 235,573,260 | |
Composition of Net Assets ($): | | | | |
Paid-in capital | | | | | 225,491,725 | |
Total distributable earnings (loss) | | | | | 10,081,535 | |
Net Assets ($) | | | 235,573,260 | |
| | | | | | |
Net Asset Value Per Share | Class A | Class C | Class I | Class Y | |
Net Assets ($) | 136,367 | 129,366 | 882,673 | 234,424,854 | |
Shares Outstanding | 11,149 | 10,941 | 71,146 | 18,886,289 | |
Net Asset Value Per Share ($) | 12.23 | 11.82 | 12.41 | 12.41 | |
| | | | | | |
See notes to financial statements. | | | | | |
39
STATEMENT OF OPERATIONS
Year Ended October 31, 2018
| | | | | | | |
| | | | | | |
| | | | | | |
Investment Income ($): | | | | |
Income: | | | | |
Cash dividends (net of $218,316 foreign taxes withheld at source): | |
Unaffiliated issuers | | | 4,491,230 | |
Affiliated issuers | | | 570,762 | |
Interest | | | 1,486,668 | |
Total Income | | | 6,548,660 | |
Expenses: | | | | |
Management fee—Note 3(a) | | | 8,039,572 | |
Dividends on securities sold short | | | 2,339,287 | |
Custodian fees—Note 3(c) | | | 119,173 | |
Professional fees | | | 100,630 | |
Registration fees | | | 61,104 | |
Directors’ fees and expenses—Note 3(d) | | | 46,987 | |
Loan commitment fees—Note 2 | | | 6,554 | |
Prospectus and shareholders’ reports | | | 6,349 | |
Shareholder servicing costs—Note 3(c) | | | 2,493 | |
Distribution fees—Note 3(b) | | | 958 | |
Miscellaneous | | | 84,745 | |
Total Expenses | | | 10,807,852 | |
Less—reduction in expenses due to undertaking—Note 3(a) | | | (703,852) | |
Less—reduction in fees due to earnings credits—Note 3(c) | | | (103,873) | |
Net Expenses | | | 10,000,127 | |
Investment (Loss)—Net | | | (3,451,467) | |
Realized and Unrealized Gain (Loss) on Investments—Note 4 ($): | | |
Net realized gain (loss) on investments and foreign currency transactions: | | |
Long transactions | | | | 25,756,383 | |
Short sale transactions | �� | | | (16,196,320) | |
Net realized gain (loss) on options transactions | (709,645) | |
Net realized gain (loss) on futures | 269,014 | |
Net realized gain (loss) on swap agreements | 463,883 | |
Net realized gain (loss) on forward foreign currency exchange contracts | 248,223 | |
Net Realized Gain (Loss) | | | 9,831,538 | |
Net unrealized appreciation (depreciation) on investments
and foreign currency transactions | | | (21,680,567) | |
Net unrealized appreciation (depreciation) on options transactions | 451,519 | |
Net unrealized appreciation (depreciation) on futures | | | 1,307,733 | |
Net unrealized appreciation (depreciation) on swap agreements | | | (825,869) | |
Net unrealized appreciation (depreciation) on
forward foreign currency exchange contracts | | | 2,390,424 | |
Net unrealized appreciation (depreciation) on securities sold short | 7,869,348 | |
Net Unrealized Appreciation (Depreciation) | | | (10,487,412) | |
Net Realized and Unrealized Gain (Loss) on Investments | | | (655,874) | |
Net (Decrease) in Net Assets Resulting from Operations | | (4,107,341) | |
| | | | | | | |
See notes to financial statements. | | | | | |
40
STATEMENT OF CHANGES IN NET ASSETS
| | | | | | | | | | |
| | | | Year Ended October 31, |
| | | | 2018 | | 2017 | a |
Operations ($): | | | | | | | | |
Investment (loss)—net | | | (3,451,467) | | | | (7,428,896) | |
Net realized gain (loss) on investments | | 9,831,538 | | | | 22,894,351 | |
Net unrealized appreciation (depreciation)
on investments | | (10,487,412) | | | | 6,419,679 | |
Net Increase (Decrease) in Net Assets
Resulting from Operations | (4,107,341) | | | | 21,885,134 | |
Distributions ($): | |
Distributions to shareholders: | | | | | | | | |
Class A | | | (1,817) | | | | - | |
Class C | | | (1,103) | | | | - | |
Class I | | | (9,651) | | | | - | |
Class Y | | | (4,249,691) | | | | - | |
Total Distributions | | | (4,262,262) | | | | - | |
Capital Stock Transactions ($): | |
Net proceeds from shares sold: | | | | | | | | |
Class A | | | 197,643 | | | | 86,167 | |
Class C | | | 20,805 | | | | 14,994 | |
Class I | | | 1,621,394 | | | | 2,158,165 | |
Class Y | | | 52,330,013 | | | | 111,263,645 | |
Distributions reinvested: | | | | | | | | |
Class A | | | 862 | | | | - | |
Class I | | | 6,248 | | | | - | |
Class Y | | | 2,535,313 | | | | - | |
Cost of shares redeemed: | | | | | | | | |
Class A | | | (274,338) | | | | (163,244) | |
Class C | | | - | | | | (9,334) | |
Class I | | | (1,556,036) | | | | (1,760,039) | |
Class Y | | | (274,747,314) | | | | (93,046,050) | |
Increase (Decrease) in Net Assets
from Capital Stock Transactions | (219,865,410) | | | | 18,544,304 | |
Total Increase (Decrease) in Net Assets | (228,235,013) | | | | 40,429,438 | |
Net Assets ($): | |
Beginning of Period | | | 463,808,273 | | | | 423,378,835 | |
End of Period | | | 235,573,260 | | | | 463,808,273 | |
41
STATEMENT OF CHANGES IN NET ASSETS (continued)
| | | | | | | | | | |
| | | | Year Ended October 31, |
| | | | 2018 | | 2017 | a |
Capital Share Transactions (Shares): | |
Class Ab | | | | | | | | |
Shares sold | | | 15,595 | | | | 6,963 | |
Shares issued for distributions reinvested | | | 69 | | | | - | |
Shares redeemed | | | (21,695) | | | | (13,239) | |
Net Increase (Decrease) in Shares Outstanding | (6,031) | | | | (6,276) | |
Class C | | | | | | | | |
Shares sold | | | 1,710 | | | | 1,231 | |
Shares redeemed | | | - | | | | (771) | |
Net Increase (Decrease) in Shares Outstanding | 1,710 | | | | 460 | |
Class Ib | | | | | | | | |
Shares sold | | | 127,215 | | | | 173,575 | |
Shares issued for distributions reinvested | | | 494 | | | | - | |
Shares redeemed | | | (122,043) | | | | (140,995) | |
Net Increase (Decrease) in Shares Outstanding | 5,666 | | | | 32,580 | |
Class Yb | | | | | | | | |
Shares sold | | | 4,086,075 | | | | 8,873,100 | |
Shares issued for distributions reinvested | | | 200,262 | | | | - | |
Shares redeemed | | | (21,470,358) | | | | (7,459,780) | |
Net Increase (Decrease) in Shares Outstanding | (17,184,021) | | | | 1,413,320 | |
| | | | | | | | | | |
a Accumulated investment (loss)—net was $5,655,377 in 2017 and is no longer presented as a result of the adoption of SEC’s Disclosure Update and Simplification Rule. | |
b During the period ended October 31, 2018, 122,771 Class Y shares representing $1,565,100 were exchanged for 122,852 Class I shares and during the period ended October 31, 2017, 143,252 Class Y shares representing $1,781,761 were exchanged for143,344 Class I shares and 12,950 Class A shares representing $159,725 were exchanged for 12,836 Class I shares. | |
See notes to financial statements.
| | | | | | | | |
42
FINANCIAL HIGHLIGHTS
The following tables describe the performance for each share class for the fiscal periods indicated. All information (except portfolio turnover rate) reflects financial results for a single fund share. Total return shows how much your investment in the fund would have increased (or decreased) during each period, assuming you had reinvested all dividends and distributions. These figures have been derived from the fund’s financial statements.
| | | | | | | |
| | | |
| | | Year Ended October 31, |
Class A Shares | | 2018 | 2017 | 2016 | 2015 | 2014a |
Per Share Data ($): | | | | | | |
Net asset value, beginning of period | | 12.67 | 12.09 | 12.32 | 12.20 | 12.50 |
Investment Operations: | | | | | | |
Investment income (loss)—netb | | .05 | (.24) | (.22) | (.27) | (.16) |
Net realized and unrealized
gain (loss) on investments | | (.37) | .82 | (.01)c | .39 | (.14) |
Total from Investment Operations | | (.32) | .58 | (.23) | .12 | (.30) |
Distributions: | | | | | | |
Dividends from net realized
gain on investments | | (.12) | - | - | - | - |
Net asset value, end of period | | 12.23 | 12.67 | 12.09 | 12.32 | 12.20 |
Total Return (%)d | | (2.47) | 4.80 | (1.87) | .98 | (2.40)e |
Ratios/Supplemental Data (%): | | | | | | |
Ratio of total expenses
to average net assets | | 3.12 | 3.39 | 3.41 | 3.16 | 3.14f |
Ratio of net expenses
to average net assets | | 2.68 | 3.07 | 3.29 | 3.16 | 3.10f |
Ratio of net investment income (loss)
to average net assets | | .41 | (1.96) | (1.84) | (2.21) | (2.26)f |
Portfolio Turnover Rate | | 320.90 | 369.32 | 369.03 | 524.89 | 312.91e |
Net Assets, end of period ($ x 1,000) | | 136 | 218 | 284 | 304 | 220 |
a From March 31, 2014 (commencement of operations) to October 31, 2014.
b Based on average shares outstanding.
c In addition to net realized and unrealized losses on investments, this amount includes an increase in net asset value per share resulting from the timing of issuances and redemptions of shares in relation to fluctuating market values for the portfolio investments.
d Exclusive of sales charge.
e Not annualized.
f Annualized.
See notes to financial statements.
43
FINANCIAL HIGHLIGHTS (continued)
| | | | | | | |
| | | |
| | | Year Ended October 31, |
Class C Shares | | 2018 | 2017 | 2016 | 2015 | 2014a |
Per Share Data ($): | | | | | | |
Net asset value, beginning of period | | 12.35 | 11.85 | 12.17 | 12.15 | 12.50 |
Investment Operations: | | | | | | |
Investment (loss)—netb | | (.48) | (.33) | (.31) | (.37) | (.21) |
Net realized and unrealized
gain (loss) on investments | | .07 | .83 | (.01)c | .39 | (.14) |
Total from Investment Operations | | (.41) | .50 | (.32) | .02 | (.35) |
Distributions: | | | | | | |
Dividends from net realized
gain on investments | | (.12) | - | - | - | - |
Net asset value, end of period | | 11.82 | 12.35 | 11.85 | 12.17 | 12.15 |
Total Return (%)d | | (3.19) | 4.14 | (2.63) | .17 | (2.80)e |
Ratios/Supplemental Data (%): | | | | | | |
Ratio of total expenses
to average net assets | | 3.82 | 4.13 | 4.17 | 3.96 | 3.87f |
Ratio of net expenses
to average net assets | | 3.51 | 3.83 | 4.05 | 3.96 | 3.77f |
Ratio of net investment (loss)
to average net assets | | (3.96) | (2.71) | (2.60) | (3.03) | (2.97)f |
Portfolio Turnover Rate | | 320.90 | 369.32 | 369.03 | 524.89 | 312.91e |
Net Assets, end of period ($ x 1,000) | | 129 | 114 | 104 | 116 | 107 |
a From March 31, 2014 (commencement of operations) to October 31, 2014.
b Based on average shares outstanding.
c In addition to net realized and unrealized losses on investments, this amount includes an increase in net asset value per share resulting from the timing of issuances and redemptions of shares in relation to fluctuating market values for the portfolio investments.
d Exclusive of sales charge.
e Not annualized.
f Annualized.
See notes to financial statements.
44
| | | | | | | |
| | | |
| | | Year Ended October 31, |
Class I Shares | | 2018 | 2017 | 2016 | 2015 | 2014a |
Per Share Data ($): | | | | | | |
Net asset value, beginning of period | | 12.82 | 12.18 | 12.38 | 12.22 | 12.50 |
Investment Operations: | | | | | | |
Investment (loss)—netb | | (.53) | (.20) | (.19) | (.23) | (.14) |
Net realized and unrealized
gain (loss) on investments | | .24 | .84 | (.01)c | .39 | (.14) |
Total from Investment Operations | | (.29) | .64 | (.20) | .16 | (.28) |
Distributions: | | | | | | |
Dividends from net realized
gain on investments | | (.12) | - | - | - | - |
Net asset value, end of period | | 12.41 | 12.82 | 12.18 | 12.38 | 12.22 |
Total Return (%) | | (2.29) | 5.26 | (1.62) | 1.31 | (2.24)d |
Ratios/Supplemental Data (%): | | | | | | |
Ratio of total expenses
to average net assets | | 2.78 | 3.07 | 3.13 | 2.90 | 2.87e |
Ratio of net expenses
to average net assets | | 2.51 | 2.81 | 3.02 | 2.90 | 2.77e |
Ratio of net investment (loss)
to average net assets | | (4.18) | (1.64) | (1.52) | (1.83) | (1.96)e |
Portfolio Turnover Rate | | 320.90 | 369.32 | 369.03 | 524.89 | 312.91d |
Net Assets, end of period ($ x 1,000) | | 883 | 839 | 401 | 355 | 98 |
a From March 31, 2014 (commencement of operations) to October 31, 2014.
b Based on average shares outstanding.
c In addition to net realized and unrealized losses on investments, this amount includes an increase in net asset value per share resulting from the timing of issuances and redemptions of shares in relation to fluctuating market values for the portfolio investments.
d Not annualized.
e Annualized.
See notes to financial statements.
45
FINANCIAL HIGHLIGHTS (continued)
| | | | | | | |
| | | |
| | | Year Ended October 31, |
Class Y Shares | | 2018 | 2017 | 2016 | 2015 | 2014a |
Per Share Data ($): | | | | | | |
Net asset value, beginning of period | | 12.83 | 12.19 | 12.39 | 12.23 | 12.50 |
Investment Operations: | | | | | | |
Investment (loss)—netb | | (.11) | (.21) | (.19) | (.23) | (.15) |
Net realized and unrealized
gain (loss) on investments | | (.19) | .85 | (.01)c | .39 | (.12) |
Total from Investment Operations | | (.30) | .64 | (.20) | .16 | (.27) |
Distributions: | | | | | | |
Dividends from net realized
gain on investments | | (.12) | - | - | - | - |
Net asset value, end of period | | 12.41 | 12.83 | 12.19 | 12.39 | 12.23 |
Total Return (%) | | (2.28) | 5.25 | (1.62) | 1.31 | (2.16)d |
Ratios/Supplemental Data (%): | | | | | | |
Ratio of total expenses
to average net assets | | 2.69 | 2.99 | 3.05 | 2.80 | 2.75e |
Ratio of net expenses
to average net assets | | 2.49 | 2.83 | 2.98 | 2.80 | 2.75e |
Ratio of net investment (loss)
to average net assets | | (.85) | (1.70) | (1.55) | (1.88) | (1.96)e |
Portfolio Turnover Rate | | 320.90 | 369.32 | 369.03 | 524.89 | 312.91d |
Net Assets, end of period ($ x 1,000) | | 234,425 | 462,637 | 422,590 | 319,481 | 289,600 |
a From March 31, 2014 (commencement of operations) to October 31, 2014.
b Based on average shares outstanding.
c In addition to net realized and unrealized losses on investments, this amount includes an increase in net asset value per share resulting from the timing of issuances and redemptions of shares in relation to fluctuating market values for the portfolio investments.
d Not annualized.
e Annualized.
See notes to financial statements.
46
NOTES TO FINANCIAL STATEMENTS
NOTE 1—Significant Accounting Policies:
Dreyfus Select Managers Long/Short Fund (the “fund”) is a separate non-diversified series of Dreyfus BNY Mellon Funds, Inc. (the “Company”), which is registered under the Investment Company Act of 1940, as amended (the “Act”), as an open-end management investment company and operates as a series company currently offering four series, including the fund. The fund’s investment objective is to seek long-term capital appreciation. The Dreyfus Corporation (the “Manager” or “Dreyfus”), a wholly-owned subsidiary of The Bank of New York Mellon Corporation (“BNY Mellon”), serves as the fund’s investment adviser. EACM Advisors LLC (“EACM”), a subsidiary of BNY Mellon and an affiliate of Dreyfus, serves as the fund’s portfolio allocation manager. Sirios Capital Management, L.P. (“Sirios”), Ramius Advisors, LLC (“Ramius”), Three Bridges Capital, LP (“Three Bridges”), Cramer Rosenthal McGlynn, LLC (“CRM”), Dalton Investments LLC (“Dalton”) and Gotham Asset Management, LLC (“Gotham”) serve as the fund’s sub-investment advisers, each managing an allocated portion of the fund’s portfolio. Effective May 14, 2018, the Company’s Board of Directors (the “Board”) approved a new sub-investment advisory agreement with Gotham.
Effective May 12, 2018, the sub-investment advisory agreement between Dreyfus and Longhorn Capital Partners, L.P. was terminated.
MBSC Securities Corporation (the “Distributor”), a wholly-owned subsidiary of Dreyfus, is the distributor of the fund’s shares. The fund is authorized to issue 100 million shares of $.001 par value Common Stock in each of the following classes of shares: Class A, Class C, Class I, Class T and Class Y. Class A, Class C and Class T shares are sold primarily to retail investors through financial intermediaries and bear Distribution and/or Shareholder Services Plan fees. Class A and Class T shares generally are subject to a sales charge imposed at the time of purchase. Class C shares are subject to a contingent deferred sales charge (“CDSC”) imposed on Class C shares redeemed within one year of purchase. Class C shares automatically convert to Class A shares ten years after the date of purchase, without the imposition of a sales charge. Class I shares are sold primarily to bank trust departments and other financial service providers (including The Bank of New York Mellon, a subsidiary of BNY Mellon and an affiliate of Dreyfus, and its affiliates), acting on behalf of customers having a qualified trust or an investment account or relationship at such institution, and bear no Distribution or Shareholder Services Plan fees. Class Y shares are sold at net asset value per share generally to institutional
47
NOTES TO FINANCIAL STATEMENTS (continued)
investors, and bear no Distribution or Shareholder Services Plan fees. Class I and Class Y shares are offered without a front-end sales charge or CDSC. As of the date of this report, the fund did not offer Class T shares for purchase. Other differences between the classes include the services offered to and the expenses borne by each class, the allocation of certain transfer agency costs and certain voting rights. Income, expenses (other than expenses attributable to a specific class), and realized and unrealized gains or losses on investments are allocated to each class of shares based on its relative net assets.
As of October 31, 2018, MBC Investments Corp., an indirect subsidiary of BNY Mellon, held 8,000 Class A, 8,000 Class C and 8,000 Class I shares of the fund.
The Company accounts separately for the assets, liabilities and operations of each series. Expenses directly attributable to each series are charged to that series’ operations; expenses which are applicable to all series are allocated among them on a pro rata basis.
The Financial Accounting Standards Board (“FASB”) Accounting Standards Codification (“ASC”) is the exclusive reference of authoritative U.S. generally accepted accounting principles (“GAAP”) recognized by the FASB to be applied by nongovernmental entities. Rules and interpretive releases of the Securities and Exchange Commission (“SEC”) under authority of federal laws are also sources of authoritative GAAP for SEC registrants. The fund’s financial statements are prepared in accordance with GAAP, which may require the use of management estimates and assumptions. Actual results could differ from those estimates.
(a) Portfolio valuation: The fair value of a financial instrument is the amount that would be received to sell an asset or paid to transfer a liability in an orderly transaction between market participants at the measurement date (i.e., the exit price). GAAP establishes a fair value hierarchy that prioritizes the inputs of valuation techniques used to measure fair value. This hierarchy gives the highest priority to unadjusted quoted prices in active markets for identical assets or liabilities (Level 1 measurements) and the lowest priority to unobservable inputs (Level 3 measurements).
Additionally, GAAP provides guidance on determining whether the volume and activity in a market has decreased significantly and whether such a decrease in activity results in transactions that are not orderly. GAAP requires enhanced disclosures around valuation inputs and techniques used during annual and interim periods.
48
Various inputs are used in determining the value of the fund’s investments relating to fair value measurements. These inputs are summarized in the three broad levels listed below:
Level 1—unadjusted quoted prices in active markets for identical investments.
Level 2—other significant observable inputs (including quoted prices for similar investments, interest rates, prepayment speeds, credit risk, etc.).
Level 3—significant unobservable inputs (including the fund’s own assumptions in determining the fair value of investments).
The inputs or methodology used for valuing securities are not necessarily an indication of the risk associated with investing in those securities.
Changes in valuation techniques may result in transfers in or out of an assigned level within the disclosure hierarchy. Valuation techniques used to value the fund’s investments are as follows:
Investments in debt securities, excluding short-term investments (other than U.S. Treasury Bills), futures, options and forward foreign currency exchange contracts (“forward contracts”) are valued each business day by an independent pricing service (the “Service”) approved by the Board. Investments for which quoted bid prices are readily available and are representative of the bid side of the market in the judgment of the Service are valued at the mean between the quoted bid prices (as obtained by the Service from dealers in such securities) and asked prices (as calculated by the Service based upon its evaluation of the market for such securities). Other investments are valued as determined by the Service, based on methods which include consideration of the following: yields or prices of securities of comparable quality, coupon, maturity and type; indications as to values from dealers; and general market conditions. These securities are generally categorized within Level 2 of the fair value hierarchy.
Investments in equity securities are valued at the last sales price on the securities exchange or national securities market on which such securities are primarily traded. Securities listed on the National Market System for which market quotations are available are valued at the official closing price or, if there is no official closing price that day, at the last sales price. For open short positions, asked prices are used for valuation purposes. Bid price is used when no asked price is available. Registered investment companies that are not traded on an exchange are valued at their net asset value. All of the preceding securities are generally categorized within Level 1 of the fair value hierarchy.
49
NOTES TO FINANCIAL STATEMENTS (continued)
Securities not listed on an exchange or the national securities market, or securities for which there were no transactions, are valued at the average of the most recent bid and asked prices. These securities are generally categorized within Level 2 of the fair value hierarchy.
The Service is engaged under the general supervision of the Board.
Fair valuing of securities may be determined with the assistance of a pricing service using calculations based on indices of domestic securities and other appropriate indicators, such as prices of relevant ADRs and futures. Utilizing these techniques may result in transfers between Level 1 and Level 2 of the fair value hierarchy.
When market quotations or official closing prices are not readily available, or are determined not to accurately reflect fair value, such as when the value of a security has been significantly affected by events after the close of the exchange or market on which the security is principally traded (for example, a foreign exchange or market), but before the fund calculates its net asset value, the fund may value these investments at fair value as determined in accordance with the procedures approved by the Board. Certain factors may be considered when fair valuing investments such as: fundamental analytical data, the nature and duration of restrictions on disposition, an evaluation of the forces that influence the market in which the securities are purchased and sold, and public trading in similar securities of the issuer or comparable issuers. These securities are either categorized within Level 2 or 3 of the fair value hierarchy depending on the relevant inputs used.
For restricted securities where observable inputs are limited, assumptions about market activity and risk are used and such securities are generally categorized within Level 3 of the fair value hierarchy.
Investments denominated in foreign currencies are translated to U.S. dollars at the prevailing rates of exchange.
Futures and options, which are traded on an exchange, are valued at the last sales price on the securities exchange on which such securities are primarily traded or at the last sales price on the national securities market on each business day and are generally categorized within Level 1 of the fair value hierarchy. Options traded over-the-counter (“OTC”) are valued at the mean between the bid and asked price and are generally categorized within Level 2 of the fair value hierarchy. Investments in swap agreements are valued each business day by an independent pricing service (the “Service”). Swaps are valued by the Service by using a swap pricing model which incorporates among other factors, default probabilities, recovery rates, credit curves of the underlying issuer and swap spreads on interest
50
rates and are generally categorized within Level 2 of the fair value hierarchy. Forward foreign currency exchange contracts (“forward contracts”) are valued at the forward rate and are generally categorized within Level 2 of the fair value hierarchy.
The following is a summary of the inputs used as of October 31, 2018 in valuing the fund’s investments:
| | | | | | |
| | Level 1 - Unadjusted Quoted Prices | Level 2 - Other Significant Observable Inputs | Level 3 -Significant Unobservable Inputs | Total |
Assets ($) | | | |
Investments in Securities: | | | |
Corporate Bonds† | - | 460,127 | - | 460,127 |
Equity Securities – Common Stocks† | 126,486,402 | 14,759,474†† | - | 141,245,876 |
Equity Securities – Preferred Stocks† | - | 1,413,220†† | - | 1,413,220 |
Investment Company | 51,295,571 | - | - | 51,295,571 |
Other Financial Instruments: | | | | |
Futures††† | 344,067 | - | - | 344,067 |
Forward Foreign Currency
Exchange Contracts††† | - | 6,657,918 | - | 6,657,918 |
Options Purchased | 148,741 | - | - | 148,741 |
Swaps††† | - | 381,935 | - | 381,935 |
Liabilities ($) | | | |
Other Financial Instruments: | | | | |
Futures††† | (13,434) | - | - | (13,434) |
Forward Foreign Currency
Exchange Contracts††† | - | (3,539,088) | - | (3,539,088) |
Options Written | (55,000) | - | - | (55,000) |
Swaps††† | - | (314,108) | - | (314,108) |
Securities Sold Short: |
Equity Securities – Common Stock†††† | (43,836,496) | (4,485,594)†† | - | (48,322,090) |
Exchange-Traded Funds†††† | (9,283,290) | - | - | (9,283,290) |
Limited Partnership Interests†††† | (19) | - | - | (19) |
† See Statement of Investments for additional detailed categorizations.
†† Securities classified within Level 2 at period end as the values were determined pursuant to the fund's fair valuation procedures.
††† Amount shown represents unrealized appreciation (depreciation) at period end, but only variation margin on exchanged traded and centrally cleared derivatives are reported in the Statement of Assets and Liabilities.
†††† See Statement of Securities Sold Short for additional detailed classifications.
51
NOTES TO FINANCIAL STATEMENTS (continued)
At October 31, 2018, the amount of securities transferred between levels equals fair value of exchange traded equity securities reported as Level 2 in the table above. At October 31, 2017, there were no transfer between levels of the fair value hierarchy. It is the fund’s policy to recognize transfers between levels at the end of the reporting period.
(b) Foreign currency transactions: The fund does not isolate that portion of the results of operations resulting from changes in foreign exchange rates on investments from the fluctuations arising from changes in the market prices of securities held. Such fluctuations are included with the net realized and unrealized gain or loss on investments.
Net realized foreign exchange gains or losses arise from sales of foreign currencies, currency gains or losses realized on securities transactions between trade and settlement date, and the difference between the amounts of dividends, interest and foreign withholding taxes recorded on the fund’s books and the U.S. dollar equivalent of the amounts actually received or paid. Net unrealized foreign exchange gains and losses arise from changes in the value of assets and liabilities other than investments resulting from changes in exchange rates. Foreign currency gains and losses on foreign currency transactions are also included with net realized and unrealized gain or loss on investments.
(c) Securities transactions and investment income: Securities transactions are recorded on a trade date basis. Realized gains and losses from securities transactions are recorded on the identified cost basis. Dividend income is recognized on the ex-dividend date and interest income, including, where applicable, accretion of discount and amortization of premium on investments, is recognized on the accrual basis.
(d) Affiliated issuers: Investments in other investment companies advised by Dreyfus are considered “affiliated” under the Act.
Certain affiliated investment companies may also invest in the fund. At October 31, 2018, Dreyfus Alternative Diversifier Strategies Fund, an affiliate of the fund, held 7,296,451 Class Y shares representing approximately 38% of the fund’s net assets.
(e) Dividends and distributions to shareholders: Dividends and distributions are recorded on the ex-dividend date. Dividends from investment income-net and dividends from net realized capital gains, if any, are normally declared and paid annually, but the fund may make distributions on a more frequent basis to comply with the distribution requirements of the Internal Revenue Code of 1986, as amended (the “Code”). To the extent that net realized capital gains can be offset by
52
capital loss carryovers, it is the policy of the fund not to distribute such gains. Income and capital gain distributions are determined in accordance with income tax regulations, which may differ from GAAP.
(f) Federal income taxes: It is the policy of the fund to continue to qualify as a regulated investment company, if such qualification is in the best interests of its shareholders, by complying with the applicable provisions of the Code, and to make distributions of taxable income and net realized capital gain sufficient to relieve it from substantially all federal income and excise taxes.
As of and during the period ended October 31, 2018, the fund did not have any liabilities for any uncertain tax positions. The fund recognizes interest and penalties, if any, related to uncertain tax positions as income tax expense in the Statement of Operations. During the period ended October 31, 2018, the fund did not incur any interest or penalties.
Each tax year in the four-year period ended October 31, 2018 remains subject to examination by the Internal Revenue Service and state taxing authorities.
At October 31, 2018, the components of accumulated earnings on a tax basis were as follows: undistributed capital gains $5,925,570 and unrealized appreciation $5,085,762. In addition, the fund deferred for tax purposes late year ordinary losses of $929,797 to the first day of the following fiscal year.
The tax character of distributions paid to shareholders during the fiscal period ended October 31, 2018 and October 31, 2017 were as follows: ordinary income $2,248,932 and $0, and long-term capital gains $2,013,330 and $0, respectively.
(g) New Accounting Pronouncements: In March 2017, the FASB issued Accounting Standards Update 2017-08, Receivables—Nonrefundable Fees and Other Costs (Subtopic 310-20): Premium Amortization On Purchased Callable Debt Securities (“ASU 2017-08”). The update shortens the amortization period for the premium on certain purchased callable debt securities to the earliest call date. ASU 2017-08 will be effective for annual periods beginning after December 15, 2018.
Also in August 2018, the FASB issued Accounting Standards Update 2018-13, Fair Value Measurement (Topic 820): Disclosure Framework—Changes to the Disclosure Requirements for Fair Value Measurement (“ASU 2018-13”). The update provides guidance that eliminates, adds and modifies certain disclosure requirements for fair value measurements. ASU 2018-13 will be effective for annual periods beginning after December 15,
53
NOTES TO FINANCIAL STATEMENTS (continued)
2019. Management is currently assessing the potential impact of these changes to future financial statements.
NOTE 2—Bank Lines of Credit:
The fund participates with other Dreyfus-managed funds in an $830 million unsecured credit facility led by Citibank, N.A. and a $300 million unsecured credit facility provided by The Bank of New York Mellon (each, a “Facility”), each to be utilized primarily for temporary or emergency purposes, including the financing of redemptions. In connection therewith, the fund has agreed to pay its pro rata portion of commitment fees for each Facility. Interest is charged to the fund based on rates determined pursuant to the terms of the respective Facility at the time of borrowing. During the period ended October 31, 2018, the fund did not borrow under the Facilities.
NOTE 3—Management Fee, Sub-Investment Advisory Fee and Other Transactions with Affiliates:
(a) Pursuant to a management agreement with Dreyfus, the management fee is computed at the annual rate of 2.00% of the value of the fund’s average daily net assets and is payable monthly. Dreyfus had contractually agreed, from November 1, 2017 through March 1, 2018, to waive receipt of its fees and/or assume the expenses of the fund, so that the expenses of none of classes (excluding Rule 12b-1 Distribution Plan fees, Shareholder Services Plan fees, taxes, dividend and interest expenses on securities sold short, interest expense, brokerage commissions, commitment fees on borrowings and extraordinary expenses) exceeded 2.00% of the value of the fund’s average daily net assets. Dreyfus has contractually agreed, from March 2, 2018 through March 1, 2019, to waive receipt of its fees and/or assume the direct expenses of the fund, so that the expenses of none of classes (excluding certain expenses as described above) exceed 1.90% of the value of the fund’s average daily net assets. The reduction in expenses, pursuant to the undertaking, amounted to $703,852 during the period ended October 31, 2018.
Pursuant to a Portfolio Allocation Management Agreement between Dreyfus and EACM, Dreyfus pays EACM a monthly fee at an annual percentage of the value of the fund’s average daily net assets.
Pursuant to separate sub-investment advisory agreement between Dreyfus and Sirios, Ramius, Three Bridges, CRM, Dalton and Gotham, each serves as the fund’s sub-investment adviser responsible for the day-to-day management of the fund’s portfolio. Dreyfus pays each sub-investment advisor a monthly fee at an annual percentage of the value of the fund’s average daily net assets allocated to the respective sub-investment advisor.
54
Dreyfus has obtained an exemptive order from the SEC (the “Order”), upon which the fund may rely, to use a manager of managers approach that permits Dreyfus, subject to certain conditions and approval by the Board, to enter into and materially amend sub-investment advisory agreements with one or more sub-investment advisers who are either unaffiliated with Dreyfus or are wholly-owned subsidiaries (as defined under the Act) of Dreyfus’ ultimate parent company, BNY Mellon, without obtaining shareholder approval. The Order also allows the fund to disclose the sub-investment advisory fee paid by Dreyfus to any unaffiliated sub-investment adviser in the aggregate with other unaffiliated sub-investment advisers in documents filed with the SEC and provided to shareholders. In addition, pursuant to the Order, it is not necessary to disclose the sub-investment advisory fee payable by Dreyfus separately to a sub-investment adviser that is a wholly-owned subsidiary of BNY Mellon in documents filed with the SEC and provided to shareholders; such fees are to be aggregated with fees payable to Dreyfus. Dreyfus has ultimate responsibility (subject to oversight by the Board) to supervise any sub-investment adviser and recommend the hiring, termination, and replacement of any sub-investment adviser to the Board.
During the period ended October 31, 2018, the Distributor retained $1,222 from commissions earned on sales of the fund’s Class A shares.
(b) Under the Distribution Plan adopted pursuant to Rule 12b-1 under the Act, Class C shares pay the Distributor for distributing its shares at an annual rate of .75% of the value of its average daily net assets. During the period ended October 31, 2018, Class C shares were charged $958 pursuant to the Distribution Plan.
(c) Under the Shareholder Services Plan, Class A and Class C shares pay the Distributor at an annual rate of .25% of the value of their average daily net assets for the provision of certain services. The services provided may include personal services relating to shareholder accounts, such as answering shareholder inquiries regarding the fund and providing reports and other information, and services related to the maintenance of shareholder accounts. The Distributor may make payments to Service Agents (securities dealers, financial institutions or other industry professionals) with respect to these services. The Distributor determines the amounts to be paid to Service Agents. During the period ended October 31, 2018, Class A and Class C shares were charged $404 and $319, respectively, pursuant to the Shareholder Services Plan.
Under its terms, the Distribution Plan and Shareholder Services Plan shall remain in effect from year to year, provided such continuance is approved annually by a vote of a majority of those Directors who are not “interested
55
NOTES TO FINANCIAL STATEMENTS (continued)
persons” of the Company and who have no direct or indirect financial interest in the operation of or in any agreement related to the Distribution Plan or Shareholder Services Plan.
The fund has arrangements with the transfer agent and the custodian whereby the fund may receive earnings credits when positive cash balances are maintained, which are used to offset transfer agency and custody fees. For financial reporting purposes, the fund includes net earnings credits, if any, as an expense offset in the Statement of Operations.
The fund compensates Dreyfus Transfer, Inc., a wholly-owned subsidiary of Dreyfus, under a transfer agency agreement for providing transfer agency and cash management services for the fund. The majority of transfer agency fees are comprised of amounts paid on a per account basis, while cash management fees are related to fund subscriptions and redemptions. During the period ended October 31, 2018, the fund was charged $1,370 for transfer agency services. These fees are included in Shareholder servicing costs in the Statement of Operations.
The fund compensates The Bank of New York Mellon under a custody agreement for providing custodial services for the fund. These fees are determined based on net assets, geographic region and transaction activity. During the period ended October 31, 2018, the fund was charged $119,173 pursuant to the custody agreement. These fees were partially offset by earnings credits of $103,873.
During the period ended October 31, 2018, the fund was charged $28,154 for services performed by the Chief Compliance Officer and his staff. These fees are included in Miscellaneous in the Statement of Operations.
The components of “Due to The Dreyfus Corporation and affiliates” in the Statement of Assets and Liabilities consist of: management fees $466,448, Distribution Plan fees $84, Shareholder Services Plan fees $62, custodian fees $50,000, Chief Compliance Officer fees $9,224 and transfer agency fees $383, which are offset against an expense reimbursement currently in effect in the amount of $111,043.
(d) Each Board member also serves as a Board member of other funds within the Dreyfus complex. Annual retainer fees and attendance fees are allocated to each fund based on net assets.
NOTE 4—Securities Transactions:
The aggregate amount of purchases and sales of investment securities and securities sold short, excluding short-term securities, futures, options transactions, forward contracts and swap agreements, during the period ended October 31, 2018 were as follows:
56
| | | | |
| | Purchases ($) | Sales ($) |
Long transactions | | 509,634,349 | 584,333,208 |
Short sale transactions | | 404,362,289 | 499,056,580 |
Total | | 913,996,638 | 1,083,389,788 |
Short Sales: The fund is engaged in short-selling which obligates the fund to replace the security borrowed by purchasing the security at current market value. The fund incurs a loss if the price of the security increases between the date of the short sale and the date on which the fund replaces the borrowed security. The fund realizes a gain if the price of the security declines between those dates. Until the fund replaces the borrowed security, the fund will maintain daily a segregated account with a broker or custodian of permissible liquid assets sufficient to cover its short positions. Securities Sold Short at October 31, 2018 and their related market values and proceeds, are set forth in the Statement of Securities Sold Short.
The fund is liable for any dividends payable on securities while those securities are in a short position. Dividends declared on short positions are recorded on the ex-dividend date and recorded as an expense in the Statement of Operations. The fund is charged a securities loan fee in connection with short sale transactions which is recorded as interest on securities sold short in the Statement of Operations.
Derivatives: A derivative is a financial instrument whose performance is derived from the performance of another asset. The fund enters into International Swaps and Derivatives Association, Inc. Master Agreements or similar agreements (collectively, “Master Agreements”) with its OTC derivative contract counterparties in order to, among other things, reduce its credit risk to counterparties. Master Agreements include provisions for general obligations, representations, collateral and events of default or termination. Under a Master Agreement, the fund may offset with the counterparty certain derivative financial instrument’s payables and/or receivables with collateral held and/or posted and create one single net payment in the event of default or termination.
Each type of derivative instrument that was held by the fund during the period ended October 31, 2018 is discussed below.
Futures: In the normal course of pursuing its investment objective, the fund is exposed to market risk, including equity price risk, as a result of changes in value of underlying financial instruments. The fund invests in futures in order to manage its exposure to or protect against changes in the
57
NOTES TO FINANCIAL STATEMENTS (continued)
market. A futures contract represents a commitment for the future purchase or a sale of an asset at a specified date. Upon entering into such contracts, these investments require initial margin deposits with a counterparty, which consist of cash or cash equivalents. The amount of these deposits is determined by the exchange or Board of Trade on which the contract is traded and is subject to change. Accordingly, variation margin payments are received or made to reflect daily unrealized gains or losses which are recorded in the Statement of Operations. When the contracts are closed, the fund recognizes a realized gain or loss which is reflected in the Statement of Operations. There is minimal counterparty credit risk to the fund with futures since they are exchange traded, and the exchange guarantees the futures against default. Futures open at October 31, 2018 are set forth in the Statement of Futures.
Options Transactions: The fund purchases and writes (sells) put and call options to hedge against changes in the values of of equities or as a substitute for an investment. The fund is subject to market risk in the course of pursuing its investment objectives through its investments in options contracts. A call option gives the purchaser of the option the right (but not the obligation) to buy, and obligates the writer to sell, the underlying financial instrument at the exercise price at any time during the option period, or at a specified date. Conversely, a put option gives the purchaser of the option the right (but not the obligation) to sell, and obligates the writer to buy the underlying financial instrument at the exercise price at any time during the option period, or at a specified date.
As a writer of call options, the fund receives a premium at the outset and then bears the market risk of unfavorable changes in the price of the financial instrument underlying the option. Generally, the fund realizes a gain, to the extent of the premium, if the price of the underlying financial instrument decreases between the date the option is written and the date on which the option is terminated. Generally, the fund incurs a loss if the price of the financial instrument increases between those dates. The maximum payout for those contracts is limited to the number of call option contracts written and the related strike prices, respectively.
As a writer of put options, the fund receives a premium at the outset and then bears the market risk of unfavorable changes in the price of the financial instrument underlying the option. Generally, the fund realizes a gain, to the extent of the premium, if the price of the underlying financial instrument increases between the date the option is written and the date on which the option is terminated. Generally, the fund incurs a loss if the price of the financial instrument decreases between those dates. The
58
maximum payout for those contracts is limited to the number of put option contracts written and the related strike prices, respectively.
As a writer of an option, the fund has no control over whether the underlying financial instrument may be sold (call) or purchased (put) and as a result bears the market risk of an unfavorable change in the price of the financial instrument underlying the written option. There is a risk of loss from a change in value of such options which may exceed the related premiums received. This risk is mitigated by Master Agreements between the fund and the counterparty and the posting of collateral, if any, by the counterparty to the fund to cover the fund’s exposure to the counterparty. The Statement of Operations reflects any unrealized gains or losses which occurred during the period as well as any realized gains or losses which occurred upon the expiration or closing of the option transaction. Options written open at October 31, 2018 are set forth in the Statement of Options Written.
Forward Foreign Currency Exchange Contracts: The fund enters into forward contracts in order to hedge its exposure to changes in foreign currency exchange rates on its foreign portfolio holdings, to settle foreign currency transactions or as a part of its investment strategy. When executing forward contracts, the fund is obligated to buy or sell a foreign currency at a specified rate on a certain date in the future. With respect to sales of forward contracts, the fund incurs a loss if the value of the contract increases between the date the forward contract is opened and the date the forward contract is closed. The fund realizes a gain if the value of the contract decreases between those dates. With respect to purchases of forward contracts, the fund incurs a loss if the value of the contract decreases between the date the forward contract is opened and the date the forward contract is closed. The fund realizes a gain if the value of the contract increases between those dates. Any realized or unrealized gains or losses which occurred during the period are reflected in the Statement of Operations. The fund is exposed to foreign currency risk as a result of changes in value of underlying financial instruments. The fund is also exposed to credit risk associated with counterparty nonperformance on these forward contracts, which is generally limited to the unrealized gain on each open contract. This risk may be mitigated by Master Agreements, if any, between the fund and the counterparty and the posting of collateral, if any, by the counterparty to the fund to cover the fund’s exposure to the counterparty. Forward contracts open at October 31, 2018 are set forth in the Statement of Forward Foreign Currency Exchange Contracts.
Swap Agreements: The fund enters into swap agreements to exchange the interest rate on, or return generated by, one nominal instrument for the
59
NOTES TO FINANCIAL STATEMENTS (continued)
return generated by another nominal instrument. Swap agreements are privately negotiated in the OTC market or centrally cleared. The fund enters into these agreements to hedge certain market or interest rate risks, to manage the interest rate sensitivity (sometimes called duration) of fixed income securities, to provide a substitute for purchasing or selling particular securities or to increase potential returns.
For OTC swaps, the fund accrues for interim payments on a daily basis, with the net amount recorded within unrealized appreciation (depreciation) on swap agreements in the Statement of Assets and Liabilities. Once the interim payments are settled in cash, the net amount is recorded as a realized gain (loss) on swaps, in addition to realized gain (loss) recorded upon the termination of swap agreements in the Statement of Operations. Upfront payments made and/or received by the fund, are recorded as an asset and/or liability in the Statement of Assets and Liabilities and are recorded as a realized gain or loss ratably over the agreement’s term/event with the exception of forward starting interest rate swaps which are recorded as realized gains or losses on the termination date.
Fluctuations in the value of swap agreements are recorded for financial statement purposes as unrealized appreciation or depreciation on swap agreements.
Total Return Swaps: Total return swaps involve commitments to pay interest in exchange for a market-linked return based on a notional principal amount. To the extent the total return of the security or index underlying the transaction exceeds or falls short of the specific reference entity, the fund either receives a payment from or makes a payment to the counterparty, respectively. Total return swaps are subject to general market risk, liquidity risk, counterparty risk and credit risk. This risk is mitigated by Master Agreements between the fund and the counterparty and the posting of collateral, if any, by the counterparty to the fund to cover the fund’s exposure to the counterparty. Total return swaps at October 31, 2018 are set forth in the Statement of Swap Agreements.
The following tables show the fund’s exposure to different types of market risk as it relates to the Statement of Assets and Liabilities and the Statement of Operations, respectively.
60
Fair value of derivative instruments as of October 31, 2018 is shown below:
| | | | | | | | |
| | Derivative
Assets ($) | | | | Derivative
Liabilities ($) | |
Equity risk | 874,743 | 1,2,3 | Equity risk | (382,542) | 1,2,4 |
Foreign exchange risk | 6,657,918 | 5 | Foreign exchange risk | (3,539,088) | 5 |
Gross fair value of
derivative contracts | 7,532,661 | | | | (3,921,630) | |
| | | | | | | |
Statement of Assets and Liabilities location: | |
1 Includes cumulative appreciation (depreciation) on futures as reported in the Statement of Futures, but only the unpaid variation margin is reported in the Statement of Assets and Liabilities. |
2 Unrealized appreciation (depreciation) on swap agreements. |
3 Options purchased are included in Investments in securities—Unaffiliated issuers, at value. |
4 Outstanding options written, at value. | |
5 Unrealized appreciation (depreciation) on forward foreign currency exchange contracts. |
The effect of derivative instruments in the Statement of Operations during the period ended October 31, 2018 is shown below:
| | | | | | | | | | | | |
Amount of realized gain (loss) on derivatives recognized in income ($) | |
Underlying
risk | Futures | 1 | Options
Transactions | 2 | Forward
Contracts | 3 | Swap
Agreements | 4 | Total | |
Equity | 269,014 | | (709,645) | | - | | 463,883 | | 23,252 | |
Foreign
exchange | - | | - | | 248,223 | | - | | 248,223 | |
Total | 269,014 | | (709,645) | | 248,223 | | 463,883 | | 271,475 | |
| | | | | | | | | | | |
Change in unrealized appreciation (depreciation)
on derivatives recognized in income ($) | |
Underlying
risk | Futures | 5 | Options
Transactions | 6 | Forward
Contracts | 7 | Swap
Agreements | 8 | Total | |
Equity | 1,307,733 | | 451,519 | | - | | (825,869) | | 933,383 | |
Foreign
exchange | - | | - | | 2,390,424 | | - | | 2,390,424 | |
Total | 1,307,733 | | 451,519 | | 2,390,424 | | (825,869) | | 3,323,807 | |
| | | | | | | | | | | | |
Statement of Operations location: | |
1 Net realized gain (loss) on futures. | | |
2 Net realized gain (loss) on options transactions. |
3 Net realized gain (loss) on forward foreign currency exchange contracts. | | |
4 Net realized gain (loss) on swap agreements. | | |
5 Net unrealized appreciation (depreciation) on futures. | | |
6 Net unrealized appreciation (depreciation) on options transactions. | | |
7 Net unrealized appreciation (depreciation) on forward foreign currency exchange contracts. | |
8 Net unrealized appreciation (depreciation) on swap agreements. | | |
The provisions of ASC Topic 210 “Disclosures about Offsetting Assets and Liabilities” require disclosure on the offsetting of financial assets and
61
NOTES TO FINANCIAL STATEMENTS (continued)
liabilities. These disclosures are required for certain investments, including derivative financial instruments subject to Master Agreements which are eligible for offsetting in the Statement of Assets and Liabilities and require the fund to disclose both gross and net information with respect to such investments. For financial reporting purposes, the fund does not offset derivative assets and derivative liabilities that are subject to Master Agreements in the Statement of Assets and Liabilities.
At October 31, 2018, derivative assets and liabilities (by type) on a gross basis are as follows:
| | | | | | |
Derivative Financial Instruments: | | Assets ($) | | Liabilities ($) | |
Futures | | 344,067 | | (13,434) | |
Options | | 148,741 | | (55,000) | |
Forward contracts | | 6,657,918 | | (3,539,088) | |
Swaps | | 381,935 | | (314,108) | |
Total gross amount of derivative | | | | | |
assets and liabilities in the | | | | | |
Statement of Assets and Liabilities | | 7,532,661 | | (3,921,630) | |
Derivatives not subject to | | | | | |
Master Agreements | | (492,808) | | 70,818 | |
Total gross amount of assets | | | | | |
and liabilities subject to | | | | | |
Master Agreements | | 7,039,853 | | (3,850,812) | |
The following tables present derivative assets and liabilities net of amounts available for offsetting under Master Agreements and net of related collateral received or pledged, if any, as of October 31, 2018:
| | | | | | | |
| | | | Financial | | | |
| | | | Instruments | | | |
| | | | and Derivatives | | | |
| | Gross Amount of | | Available | Collateral | | Net Amount of |
Counterparty | Assets ($) | 1 | for Offset ($) | Received ($) | 2 | Assets ($) |
Morgan Stanley | 7,039,853 | | (3,850,812) | (3,189,041) | | - |
| | | | | | | |
| | | | Financial | | | |
| | | | Instruments | | | |
| | | | and Derivatives | | | |
| | Gross Amount of | | Available | Collateral | | Net Amount of |
Counterparty | Liabilities ($) | 1 | for Offset ($) | Pledged ($) | 2 | Liabilities ($) |
Morgan Stanley | (3,850,812) | | 3,850,812 | - | | - |
| | | | | | | |
1 Absent a default event or early termination, OTC derivative assets and liabilities are presented at gross amounts and are not offset in the Statement of Assets and Liabilities. |
2 In some instances, the actual collateral received and/or pledged may be more than the amount shown due to over collateralization. |
62
The following summarizes the average market value of derivatives outstanding during the period ended October 31, 2018:
| | | |
| | Average Market Value ($) |
Equity futures | | 29,691,662 |
Equity options contracts | | 1,929,034 |
Forward contracts | | 127,544,593 |
| | | |
The following summarizes the average notional value of swap agreements outstanding during the period ended October 31, 2018:
| | | |
| | Average Notional Value ($) |
Equity total return swap agreements | | 42,135,204 |
| | | |
At October 31, 2018, the cost of investments for federal income tax purposes was $192,538,166; accordingly, accumulated net unrealized appreciation on investments inclusive of derivative contracts was $2,079,999, consisting of $14,037,113 gross unrealized appreciation and $11,957,114 gross unrealized depreciation.
NOTE 5—Plan of Liquidation:
On September 24, 2018, the Board approved a Plan of Liquidation (the “Plan”). The Plan provides for the liquidation of the fund, the pro rata distribution of the assets of the fund to its shareholders and the closing of fund shareholder accounts (the “Liquidation”). The Liquidation of the fund occurred on November 30, 2018. Accordingly, effective October 26, 2018, the fund is closed to any investments for new accounts.
63
REPORT OF INDEPENDENT REGISTERED PUBLIC ACCOUNTING FIRM
To the Shareholders and Board of Directors
Dreyfus BNY Mellon Funds, Inc.
Opinion on the Financial Statements
We have audited the accompanying statement of assets and liabilities of Dreyfus Select Managers Long/Short Fund (the “Fund”), a series of Dreyfus BNY Mellon Funds, Inc., including the statements of investments, securities sold short, investments in affiliated issuers, futures, options written, forward foreign currency exchange contracts and swap agreements, as of October 31, 2018, the related statement of operations for the year then ended, the statements of changes in net assets for each of the years in the two-year period then ended, and the related notes (collectively, the financial statements) and the financial highlights for each of the years or period in the five-year period then ended. In our opinion, the financial statements and financial highlights present fairly, in all material respects, the financial position of the Fund as of October 31, 2018, the results of its operations for the year then ended, the changes in its net assets for each of the years in the two-year period then ended, and the financial highlights for each of the years or period in the five-year period then ended, in conformity with U.S. generally accepted accounting principles.
Basis for Opinion
These financial statements and financial highlights are the responsibility of the Fund’s management. Our responsibility is to express an opinion on these financial statements and financial highlights based on our audits. We are a public accounting firm registered with the Public Company Accounting Oversight Board (United States) (PCAOB) and are required to be independent with respect to the Fund in accordance with the U.S. federal securities laws and the applicable rules and regulations of the Securities and Exchange Commission and the PCAOB.
We conducted our audits in accordance with the standards of the PCAOB. Those standards require that we plan and perform the audit to obtain reasonable assurance about whether the financial statements and financial highlights are free of material misstatement, whether due to error or fraud. Our audits included performing procedures to assess the risks of material misstatement of the financial statements and financial highlights, whether due to error or fraud, and performing procedures that respond to those risks. Such procedures included examining, on a test basis, evidence regarding the amounts and disclosures in the financial statements and financial highlights. Such procedures also included confirmation of securities owned as of October 31, 2018, by correspondence with the custodian and brokers or by other appropriate auditing procedures when replies from brokers were not received. Our audits also included evaluating the accounting principles used and significant estimates made by management, as well as evaluating the overall presentation of the financial statements and financial highlights. We believe that our audits provide a reasonable basis for our opinion.
Emphasis of Matter
As discussed in Note 5 to the financial statements, the Fund’s Board of Directors approved a plan of liquidation on September 24, 2018. Our opinion is not modified with respect to this matter.

We have served as the auditor of one or more Dreyfus Corporation investment companies since 1994.
New York, New York
December 28, 2018
64
IMPORTANT TAX INFORMATION (Unaudited)
The fund reports the maximum amount allowable but not less than $.0564 per share as a capital gain dividend in accordance with Section 852(b)(3)(C) of the Internal Revenue Code. Also, the fund reports the maximum amount allowable but not less than $.0630 as a short-term capital gain dividend paid on December 22, 2017 in accordance with Sections 871(k)(2) and 881(e) of the Internal Revenue Code.
65
BOARD MEMBERS INFORMATION (Unaudited)
INDEPENDENT BOARD MEMBERS
Joseph S. DiMartino (75)
Chairman of the Board (1999)
Principal Occupation During Past 5 Years:
· Corporate Director and Trustee (1995-present)
Other Public Company Board Memberships During Past 5 Years:
· CBIZ (formerly, Century Business Services, Inc.), a provider of outsourcing functions for small and medium size companies, Director (1997-present)
No. of Portfolios for which Board Member Serves: 124
———————
Francine J. Bovich (67)
Board Member (2012)
Principal Occupation During Past 5 Years:
· Trustee, The Bradley Trusts, private trust funds (2011-present)
Other Public Company Board Memberships During Past 5 Years:
· Annaly Capital Management, Inc., a real estate trust, Director (2014-present)
No. of Portfolios for which Board Member Serves: 72
———————
Kenneth A. Himmel (72)
Board Member (1994)
Principal Occupation During Past 5 Years:
· Managing Partner, Gulf Related, an international real estate development company (2010-present)
· President and CEO, Related Urban Development, a real estate development company (1996-present)
· President and CEO, Himmel & Company, a real estate development company (1980-present)
· CEO, American Food Management, a restaurant company (1983-present)
No. of Portfolios for which Board Member Serves: 25
———————
66
Stephen J. Lockwood (71)
Board Member (1994)
Principal Occupation During Past 5 Years:
· Chairman of the Board, Stephen J. Lockwood and Company LLC, a real estate investment company (2000-present)
No. of Portfolios for which Board Member Serves: 25
———————
Roslyn M. Watson (69)
Board Member (1994)
Principal Occupation During Past 5 Years:
· Principal, Watson Ventures, Inc., a real estate investment company (1993-present)
No. of Portfolios for which Board Member Serves: 58
———————
Benaree Pratt Wiley (72)
Board Member (1998)
Principal Occupation During Past 5 Years:
· Principal, The Wiley Group, a firm specializing in strategy and business development (2005-present)
Other Public Company Board Memberships During Past 5 Years:
· CBIZ (formerly, Century Business Services, Inc.), a provider of outsourcing functions for small and medium size companies, Director (2008-present)
No. of Portfolios for which Board Member Serves: 79
———————
Once elected all Board Members serve for an indefinite term, but achieve Emeritus status upon reaching age 80. The address of the Board Members and Officers is c/o The Dreyfus Corporation, 200 Park Avenue, New York, New York 10166. Additional information about the Board Members is available in the fund’s Statement of Additional Information which can be obtained from Dreyfus free of charge by calling this toll free number: 1-800-DREYFUS.
James M. Fitzgibbons, Emeritus Board Member
67
OFFICERS OF THE FUND (Unaudited)
BRADLEY J. SKAPYAK, President since January 2010.
Chief Operating Officer and a director of the Manager since June 2009, Chairman of Dreyfus Transfer, Inc., an affiliate of the Manager and the transfer agent of the funds, since May 2011 and Chief Executive Officer of MBSC Securities Corporation since August 2016. He is an officer of 62 investment companies (comprised of 124 portfolios) managed by the Manager. He is 59 years old and has been an employee of the Manager since February 1988.
BENNETT A. MACDOUGALL, Chief Legal Officer since October 2015.
Chief Legal Officer of the Manager and Associate General Counsel and Managing Director of BNY Mellon since June 2015; from June 2005 to June 2015, he served in various capacities with Deutsche Bank – Asset & Wealth Management Division, including as Director and Associate General Counsel, and Chief Legal Officer of Deutsche Investment Management Americas Inc. from June 2012 to May 2015. He is an officer of 63 investment companies (comprised of 149 portfolios) managed by the Manager. He is 47 years old and has been an employee of the Manager since June 2015.
JAMES BITETTO, Vice President since August 2005 and Secretary since February 2018.
Managing Counsel of BNY Mellon and Secretary of the Manager, and an officer of 63 investment companies (comprised of 149 portfolios) managed by the Manager. He is 52 years old and has been an employee of the Manager since December 1996.
JOSEPH M. CHIOFFI, Vice President and Assistant Secretary since August 2005.
Managing Counsel of BNY Mellon, and an officer of 63 investment companies (comprised of 149 portfolios) managed by the Manager. He is 56 years old and has been an employee of the Manager since June 2000.
SONALEE CROSS, Vice President and Assistant Secretary since March 2018.
Counsel of BNY Mellon since October 2016; Associate at Proskauer Rose LLP from April 2016 to September 2016; Attorney at EnTrust Capital from August 2015 to February 2016; Associate at Sidley Austin LLP from September 2013 until August 2015. She is an officer of 63 investment companies (comprised of 149 portfolios) managed by Dreyfus. She is 31 years old and has been an employee of the Manager since October 2016.
MAUREEN E. KANE, Vice President and Assistant Secretary since April 2015.
Managing Counsel of BNY Mellon since July 2014; from October 2004 until July 2014, General Counsel, and from May 2009 until July 2014, Chief Compliance Officer of Century Capital Management. She is an officer of 63 investment companies (comprised of 149 portfolios) managed by the Manager. She is 56 years old and has been an employee of the Manager since July 2014.
SARAH S. KELLEHER, Vice President and Assistant Secretary since April 2014.
Managing Counsel of BNY Mellon since December 2017, from March 2013 to December 2017, Senior Counsel of BNY Mellon. She is an officer of 63 investment companies (comprised of 149 portfolios) managed by the Manager. She is 43 years old and has been an employee of the Manager since March 2013.
JEFF PRUSNOFSKY, Vice President and Assistant Secretary since August 2005.
Senior Managing Counsel of BNY Mellon, and an officer of 63 investment companies (comprised of 149 portfolios) managed by the Manager. He is 53 years old and has been an employee of the Manager since October 1990.
NATALYA ZELENSKY, Vice President and Assistant Secretary since March 2017.
Counsel of BNY Mellon since May 2016; Attorney at Wildermuth Endowment Strategy Fund/Wildermuth Advisory, LLC from November 2015 until May 2016; Assistant General Counsel at RCS Advisory Services from July 2014 until November 2015; Associate at Sutherland, Asbill & Brennan from January 2013 until January 2014. She is an officer of 63 investment companies (comprised of 149 portfolios) managed by Dreyfus. She is 33 years old and has been an employee of the Manager since May 2016.
JAMES WINDELS, Treasurer since November 2001.
Director – Mutual Fund Accounting of the Manager, and an officer of 63 investment companies (comprised of 149 portfolios) managed by the Manager. He is 60 years old and has been an employee of the Manager since April 1985.
68
GAVIN C. REILLY, Assistant Treasurer since December 2005.
Tax Manager of the Investment Accounting and Support Department of the Manager, and an officer of 63 investment companies (comprised of 149 portfolios) managed by the Manager. He is 50 years old and has been an employee of the Manager since April 1991.
ROBERT S. ROBOL, Assistant Treasurer since December 2002.
Senior Accounting Manager – Dreyfus Financial Reporting of the Manager, and an officer of 63 investment companies (comprised of 149 portfolios) managed by the Manager. He is 54 years old and has been an employee of the Manager since October 1988.
ROBERT SALVIOLO, Assistant Treasurer since July 2007.
Senior Accounting Manager – Equity Funds of the Manager, and an officer of 63 investment companies (comprised of 149 portfolios) managed by the Manager. He is 51 years old and has been an employee of the Manager since June 1989.
ROBERT SVAGNA, Assistant Treasurer since December 2002.
Senior Accounting Manager – Fixed Income and Equity Funds of the Manager, and an officer of 63 investment companies (comprised of 149 portfolios) managed by the Manager. He is 51 years old and has been an employee of the Manager since November 1990.
JOSEPH W. CONNOLLY, Chief Compliance Officer since October 2004.
Chief Compliance Officer of the Manager, the Dreyfus Family of Funds and BNY Mellon Funds Trust (63 investment companies, comprised of 149 portfolios). He is 61 years old and has served in various capacities with the Manager since 1980, including manager of the firm’s Fund Accounting Department from 1997 through October 2001.
CARIDAD M. CAROSELLA, Anti-Money Laundering Compliance Officer since January 2016.
Anti-Money Laundering Compliance Officer of the Dreyfus Family of Funds and BNY Mellon Funds Trust since January 2016; from May 2015 to December 2015, Interim Anti-Money Laundering Compliance Officer of the Dreyfus Family of Funds and BNY Mellon Funds Trust and the Distributor; from January 2012 to May 2015, AML Surveillance Officer of the Distributor and from 2007 to December 2011, Financial Processing Manager of the Distributor. She is an officer of 57 investment companies (comprised of 143 portfolios) managed by the Manager. She is 50 years old and has been an employee of the Distributor since 1997.
69
Dreyfus Select Managers Long/Short Fund
200 Park Avenue
New York, NY 10166
Manager
The Dreyfus Corporation
200 Park Avenue
New York, NY 10166
Portfolio Allocation Manager
EACM Advisors LLC
200 Connecticut Avenue
Norwalk, CT 06854-1958
Sub-Investment Adviser
Sirios Capital Management, L.P.
One International Place
Boston, MA 02110
Ramius Advisors, LLC
599 Lexington Avenue 30th Floor
New York, NY 10022
Three Bridges Capital, LP
810 Seventh Avenue, 32nd Floor
New York, NY 10019
Cramer Rosenthal McGlynn, LLC
520 Madison Avenue, 20th Floor
New York, NY 10022
Dalton Investments LLC
1601 Cloverfield Boulevard
Suite 5050N
Santa Monica, CA 90404
Gotham Asset Management LLC
535 Madison Ave
30th Floor
New York, NY 10022-4231
Custodian
The Bank of New York Mellon
240 Greenwich Street
New York, NY 10286
Transfer Agent &
Dividend Disbursing Agent
Dreyfus Transfer, Inc.
200 Park Avenue
New York, NY 10166
Distributor
MBSC Securities Corporation
200 Park Avenue
New York, NY 10166
| | |
Ticker Symbols: | ClassA: DBNAX Class C: DBNCX Class I: DBNIX Class Y: DBNYX |
Telephone Call your financial representative or 1-800-DREYFUS
Mail The Dreyfus Family of Funds, 144 Glenn Curtiss Boulevard, Uniondale, NY 11556-0144
E-mail Send your request to info@dreyfus.com
Internet Information can be viewed online or downloaded at www.dreyfus.com
The fund files its complete schedule of portfolio holdings with the Securities and Exchange Commission (“SEC”) for the first and third quarters of each fiscal year on Form N-Q. The fund’s Forms N-Q are available on the SEC’s website at www.sec.gov.
A description of the policies and procedures that the fund uses to determine how to vote proxies relating to portfolio securities and information regarding how the fund voted these proxies for the most recent 12-month period ended June 30 is available at www.dreyfus.com and on the SEC’s website at www.sec.gov and without charge, upon request, by calling 1-800-DREYFUS.
| | |
© 2018 MBSC Securities Corporation
6250AR1018 | 
|
Dreyfus Yield Enhancement Strategy Fund
| | | |

| | ANNUAL REPORT October 31, 2018 |
| |
Save time. Save paper. View your next shareholder report online as soon as it’s available. Log into www.dreyfus.com and sign up for Dreyfus eCommunications. It’s simple and only takes a few minutes. |
| |
The views expressed in this report reflect those of the portfolio manager(s) only through the end of the period covered and do not necessarily represent the views of Dreyfus or any other person in the Dreyfus organization. Any such views are subject to change at any time based upon market or other conditions and Dreyfus disclaims any responsibility to update such views. These views may not be relied on as investment advice and, because investment decisions for a Dreyfus fund are based on numerous factors, may not be relied on as an indication of trading intent on behalf of any Dreyfus fund. |
| |
Not FDIC-Insured • Not Bank-Guaranteed • May Lose Value |
Contents
THE FUND
FOR MORE INFORMATION
Back Cover
| | | | |
| |
Dreyfus Yield Enhancement Strategy Fund
| | The Fund |
A LETTER FROM THE PRESIDENT OF DREYFUS
Dear Shareholder:
We are pleased to present this annual report for Dreyfus Yield Enhancement Strategy Fund, covering the 12-month period from November 1, 2017 through October 31, 2018. For information about how the fund performed during the reporting period, as well as general market perspectives, we provide a Discussion of Fund Performance on the pages that follow.
Markets began the reporting period on solid footing as major global economies experienced above-trend growth across the board. In the United States, the Federal Reserve continued to move away from its accommodative monetary policy while other major central banks also began to consider monetary tightening. In the equity markets, both U.S. and non-U.S. markets enjoyed an upward trend, though investor concerns about volatility and inflation later began to weigh on returns. Interest rates rose across the curve, putting pressure on bond prices.
Later in the reporting period, global growth trends began to diverge. While a strong economic performance continued to bolster U.S. equity markets, slower growth and political concerns pressured markets in the Eurozone. Emerging markets also came under pressure as weakness in their currencies added to investors’ uneasiness. Fixed income markets continued to struggle as interest rates rose; the yield on the benchmark 10-year Treasury bond surged late in the reporting period, but growing investor concerns about global growth helped keep it from rising further.
Despite continuing doubts regarding trade, U.S. inflationary pressures, and global growth, we are optimistic that the U.S. economy will remain strong in the near term. However, we will stay attentive to signs that signal potential changes on the horizon. As always, we encourage you to discuss the risks and opportunities of today’s investment environment with your financial advisor.
Thank you for your continued confidence and support.
Sincerely,

Renee Laroche-Morris
President
The Dreyfus Corporation
November 15, 2018
2
DISCUSSION OF FUND PERFORMANCE (Unaudited)
For the period from November 1, 2017 through October 31, 2018, as provided by Jeffrey M. Mortimer, CFA, and Caroline Lee-Tsao, Portfolio Managers
Market and Fund Performance Overview
For the 12-month period ended October 31, 2018, Dreyfus Yield Enhancement Strategy Fund’s Class A shares produced a total return of 0.83%, Class C shares returned 0.02%, Class I shares returned 1.20%, and Class Y shares returned 1.23%.1 In comparison, the Bloomberg Barclays U.S. Aggregate Bond Index (the “Barclays Agg Index”) produced a total return of -2.05% for the same period, and the Lipper Alternative Credit Focus Funds Index (the “Index”) produced a total return of 0.09% for the same period.2
U.S. bonds lost a degree of value over the reporting period due to rising interest rates, and international bond markets also posted modestly negative total returns. The combination of strong U.S. growth, higher U.S. rates and an associated strong dollar made the period difficult for emerging-market assets. The fund generally produced higher returns than the Barclays Agg Index and the Index, largely due to its exposure to higher-yielding bond market sectors.
The Fund’s Investment Approach
The fund seeks high current income. To pursue its goal, it normally allocates its assets across fixed-income investment strategies. The fund is designed to complement and diversify traditional bond portfolios. The fund normally allocates its assets among other investment companies (underlying funds) that employ various fixed-income investment strategies, including those focusing on domestic and foreign corporate bonds, high yield securities (“junk” bonds), senior loans, emerging-market debt, municipal securities and Treasury Inflation-Protected Securities (TIPS).
The Dreyfus Corporation determines the fund’s asset allocation to the fixed-income investment strategies and sets the investment ranges using fundamental and quantitative analysis, and its economic and financial markets outlook. Underlying funds are selected based on their investment objectives and management policies, investment strategies and portfolio holdings, risk/reward profiles, historical performance, and other factors. As of October 31, 2018, the fund held investments in: BNY Mellon Corporate Bond Fund, BNY Mellon Municipal Opportunities Fund, Dreyfus Floating Rate Income Fund, Dreyfus High Yield Fund, Dreyfus Global Dynamic Bond Income Fund, and TCW Emerging Markets Income Fund.
Rising Interest Rates Dampened Bond Market Returns
U.S. bonds lost a degree of value over the reporting period as the Federal Reserve Board raised short-term interest rates four times and continued to unwind its balance sheet. Treasury yields rose, and spreads on investment-grade corporate
3
DISCUSSION OF FUND PERFORMANCE (Unaudited) (continued)
bonds also widened. As global growth trends began to diverge, with the U.S. economy remaining strong and certain other developed markets weakening, risk premiums for higher-yielding credit sectors narrowed through most of the reporting period.
The global economic backdrop became challenging late in the reporting period in part because the trade dispute between the U.S. and a number of its important trading partners intensified. In addition, some central banks followed the example of the U.S. by raising short-term interest rates.
The combination of strong U.S. growth, higher U.S. rates and an associated strong dollar made the period difficult for emerging market assets. Currency weakness against the greenback was noticeable – especially in countries such as Argentina that had their own specific economic problems. While the fundamentals for most of the emerging market countries were little changed, difficulties in countries like Turkey led to confidence-related contagion effects across the investment space.
Toward the end of the reporting period, political issues became more important, especially in Europe. Fiscal problems in Italy and difficulties in the negotiations between the European Union and the U.K. regarding Brexit weighed on returns.
Underlying Funds Produced Mixed Results
The fund’s performance compared to the Index was bolstered during the reporting period from its investment in BNY Mellon Municipal Opportunities Fund, which benefited from successful security selection among securities with longer maturities and lower credit ratings. A position in Dreyfus Floating Rate Income Fund also contributed positively to performance; it benefited from an overweight position to lower-quality loans. Overall fund performance also was helped by its exposure to high yield bonds.
Detracting from performance was a position in TCW Emerging Markets Income Fund, which was hindered by security selection in Argentina and by an underweight to China. A position in BNY Mellon Corporate Bond Fund also detracted from the fund’s return; its performance was inhibited by certain holdings of interest-rate sensitive debt in markets where interest rates were rising.
In November 2017, we liquidated the fund’s position in Dreyfus Emerging Markets Debt U.S. Dollar Fund, which ceased operations, and redeployed those assets to a new investment in TCW Emerging Markets Income Fund. In February 2018, we shifted some assets from Dreyfus High Yield Fund to Dreyfus Floating Rate Income Fund to protect the fund from rising interest rates. We also added to the fund’s position in Dreyfus Global Dynamic Bond Fund in an attempt to adopt a somewhat more defensive investment posture.
4
Positioning the Portfolio for Changing Interest Rates
We expect the global economic expansion to persist, increasing the likelihood that interest rates will rise as central banks continue to move away from the aggressively accommodative monetary policies of the past decade. We also have taken note of recent heightened volatility in emerging markets in response to political developments in the U.S. Therefore, we have maintained the fund’s overweight exposure to market sectors that tend to be less sensitive to changing interest rates.
November 15, 2018
1 Total return includes reinvestment of dividends and any capital gains paid, and does not take into consideration the maximum initial sales charge in the case of Class A shares, or the applicable contingent deferred sales charge imposed on redemptions in the case of Class C shares. Had these charges been reflected, returns would have been lower. Class I and Class Y shares are not subject to any initial or deferred sales charges. Share price, yield, and investment return fluctuate such that upon redemption, fund shares may be worth more or less than their original cost. Past performance is no guarantee of future results.
2 Source: Lipper Inc. — The Bloomberg Barclays U.S. Aggregate Bond Index is a broad-based flagship benchmark that measures the investment-grade, U.S. dollar-denominated, fixed-rate taxable bond market. The index includes Treasuries, government-related and corporate securities, MBS (agency fixed-rate and hybrid ARM pass-throughs), ABS and CMBS (agency and non-agency). The Lipper Alternative Credit Focus Funds Index consists of funds that, by prospectus language, invest in a wide range of credit-structured vehicles by using either fundamental credit research analysis or quantitative credit portfolio modeling trying to benefit from any changes in credit quality, credit spreads, and market liquidity. Investors cannot invest directly in any index.
Bonds are subject generally to interest-rate, credit, liquidity, and market risks, to varying degrees, all of which are more fully described in the fund’s prospectus. Generally, all other factors being equal, bond prices are inversely related to interest-rate changes, and rate increases can cause price declines.
High yield bonds are subject to increased credit risk and are considered speculative in terms of the issuer’s perceived ability to continue making interest payments on a timely basis and to repay principal upon maturity.
Foreign bonds are subject to special risks, including exposure to currency fluctuations, changing political and economic conditions, and potentially less liquidity. These risks are generally greater with emerging market countries than with more economically and politically established foreign countries.
Investments in foreign currencies are subject to the risk that those currencies will decline in value relative to the U.S. dollar, or, in the case of hedged positions, that the U.S. dollar will decline relative to the currency being hedged. Currency rates in foreign countries may fluctuate significantly over short periods of time. A decline in the value of foreign currencies relative to the U.S. dollar will reduce the value of securities held by the fund and denominated in those currencies. The use of leverage may magnify the fund’s gains or losses. For derivatives with a leveraging component, adverse changes in the value or level of the underlying asset can result in a loss that is much greater than the original investment in the derivative.
The underlying funds’ underlying strategies may use derivative instruments, such as options, futures, options on futures, forward contracts, swaps (including credit default swaps on corporate bonds and asset-backed securities), options on swaps, and other credit derivatives. A small investment in derivatives could have a potentially large impact on the fund’s performance. The use of derivatives involves risks different from, or possibly greater than, the risks associated with investing directly in the underlying assets.
The ability of the fund to achieve its investment goal depends, in part, on the ability of Dreyfus to effectively allocate the fund’s assets among the investment strategies and the underlying funds.
5
FUND PERFORMANCE (Unaudited)

Comparison of change in value of $10,000 investment in Dreyfus Yield Enhancement Strategy Fund Class A shares, Class C shares, Class I shares and Class Y shares and the Bloomberg Barclays U.S. Aggregate Bond Index and Lipper Alternative Credit Focus Funds Index
† Source: Lipper Inc.
Past performance is not predictive of future performance.
The above graph compares a $10,000 investment made in each of the Class A, Class C, Class I and Class Y shares of Dreyfus Yield Enhancement Strategy Fund on 3/7/14 (inception date) to a $10,000 investment made in the Bloomberg Barclays U.S. Aggregate Bond Index and Lipper Alternative Credit Focus Funds Index on that date. All dividends and capital gain distributions are reinvested.
The fund’s performance shown in the line graph above takes into account the maximum initial sales charge on Class A shares and all other applicable fees and expenses on all classes. The Bloomberg Barclays U.S. Aggregate Bond Index is a broad-based flagship benchmark that measures the investment-grade, U.S. dollar-denominated, fixed-rate taxable bond market. The index includes Treasuries, government-related and corporate securities, MBS (agency fixed-rate and hybrid ARM pass-throughs), ABS and CMBS (agency and nonagency). The Lipper Alternative Credit Focus Funds Index consists of funds that, by prospectus language, invest in a wide range of credit structured vehicles by using either fundamental credit research analysis or quantitative credit portfolio modeling trying to benefit from any changes in credit quality, credit spreads, and market liquidity. Unlike a mutual fund, the indices are not subject to charges, fees and other expenses. Investors cannot invest directly in any index. Further information relating to fund performance, including expense reimbursements, if applicable, is contained in the Financial Highlights section of the prospectus and elsewhere in this report.
6
| | | | | | |
Average Annual Total Returns as of 10/31/18 | | |
| Inception
Date | 1 Year | From
Inception | |
Class A shares | | | | |
with maximum sales charge (4.50%) | 3/7/14 | -3.68% | 1.80% | |
without sales charge | 3/7/14 | 0.83% | 2.81% | |
Class C shares | | | | |
with applicable redemption charge † | 3/7/14 | -0.95% | 1.99% | |
without redemption | 3/7/14 | 0.02% | 1.99% | |
Class I shares | 3/7/14 | 1.20% | 3.10% | |
Class Y shares | 3/7/14 | 1.23% | 3.16% | |
Bloomberg Barclays U.S.
Aggregate Bond Index | 2/28/14 | -2.05% | 1.74% | †† |
Lipper Alternative
Credit Focus Funds Index | 2/28/14 | 0.09% | 1.30% | †† |
† The maximum contingent deferred sales charge for Class C shares is 1% for shares redeemed within one year of the date of purchase.
†† For comparative purposes, the value of each index on 2/28/14 is used as the beginning value on 3/7/14.
The performance data quoted represents past performance, which is no guarantee of future results. Share price and investment return fluctuate and an investor’s shares may be worth more or less than original cost upon redemption. Current performance may be lower or higher than the performance quoted. Go to Dreyfus.com for the fund’s most recent month-end returns.
The fund’s performance shown in the graph and table does not reflect the deduction of taxes that a shareholder would pay on fund distributions or the redemption of fund shares. In addition to the performance of Class A shares shown with and without a maximum sales charge, the fund’s performance shown in the table takes into account all other applicable fees and expenses on all classes.
7
UNDERSTANDING YOUR FUND’S EXPENSES (Unaudited)
As a mutual fund investor, you pay ongoing expenses, such as management fees and other expenses. Using the information below, you can estimate how these expenses affect your investment and compare them with the expenses of other funds. You also may pay one-time transaction expenses, including sales charges (loads) and redemption fees, which are not shown in this section and would have resulted in higher total expenses. For more information, see your fund’s prospectus or talk to your financial adviser.
Review your fund’s expenses
The table below shows the expenses you would have paid on a $1,000 investment in Dreyfus Yield Enhancement Strategy Fund from May 1, 2018 to October 31, 2018. It also shows how much a $1,000 investment would be worth at the close of the period, assuming actual returns and expenses.
| | | | | | | | | | | | |
Expenses and Value of a $1,000 Investment | | |
assuming actual returns for the six months ended October 31, 2018 |
| | | | Class A | Class C | Class I | Class Y |
Expenses paid per $1,000† | | $1.92 | | $7.47 | | $.46 | | $.30 |
Ending value (after expenses) | | $1,007.30 | | $1,002.10 | | $1,009.60 | | $1,008.90 |
COMPARING YOUR FUND’S EXPENSES
WITH THOSE OF OTHER FUNDS (Unaudited)
Using the SEC’s method to compare expenses
The Securities and Exchange Commission (“SEC”) has established guidelines to help investors assess fund expenses. Per these guidelines, the table below shows your fund’s expenses based on a $1,000 investment, assuming a hypothetical 5% annualized return. You can use this information to compare the ongoing expenses (but not transaction expenses or total cost) of investing in the fund with those of other funds. All mutual fund shareholder reports will provide this information to help you make this comparison. Please note that you cannot use this information to estimate your actual ending account balance and expenses paid during the period.
| | | | | | | | | | | | |
Expenses and Value of a $1,000 Investment | | |
assuming a hypothetical 5% annualized return for the six months ended October 31, 2018 |
| | | | Class A | Class C | Class I | Class Y |
Expenses paid per $1,000† | | $1.94 | | $7.53 | | $.46 | | $.31 |
Ending value (after expenses) | | $1,023.29 | | $1,017.74 | | $1,024.75 | | $1,024.90 |
† Expenses are equal to the fund’s annualized expense ratio of .38% for Class A, 1.48% for Class C, .09% for Class I and .06% for Class Y, multiplied by the average account value over the period, multiplied by 184/365 (to reflect the one-half year period).
8
STATEMENT OF INVESTMENTS
October 31, 2018
| | | | | | | | |
| |
Description | | | | Shares | | Value ($) | |
Investment Companies - 100.2% | | | | | |
Domestic Fixed Income - 54.9% | | | | | |
BNY Mellon Corporate Bond Fund, Cl. M | | | | 3,471,437 | a | 42,802,819 | |
Dreyfus Floating Rate Income Fund, Cl. Y | | | | 11,697,086 | a | 140,365,028 | |
Dreyfus High Yield Fund, Cl. I | | | | 8,877,523 | a | 53,265,139 | |
| | | | | 236,432,986 | |
Foreign Equity - 3.3% | | | | | |
TCW Emerging Markets Income Fund, Cl. I | | | | 1,838,332 | | 14,283,842 | |
Foreign Fixed Income - 7.6% | | | | | |
Dreyfus Global Dynamic Bond Income Fund | | | | 2,712,622 | a | 32,795,598 | |
Municipal Bond - 34.4% | | | | | |
BNY Mellon Municipal Opportunities Fund, Cl. M | | | | 11,457,001 | a | 148,024,455 | |
Total Investments (cost $439,113,304) | | 100.2% | | 431,536,881 | |
Liabilities, Less Cash and Receivables | | (.2%) | | (956,473) | |
Net Assets | | 100.0% | | 430,580,408 | |
a Investment in affiliated issuer. The investment objective of this investment company is publicly available and can be found within the investment company’s prospectus.
| | |
Portfolio Summary (Unaudited) † | Value (%) |
Investment Companies | 100.2 |
| | 100.2 |
† Based on net assets.
See notes to financial statements.
9
STATEMENT OF INVESTMENTS IN AFFILIATED ISSUERS
| | | | | |
Registered Investment Companies | Value
10/31/17 ($) | Purchases ($)† | Sales ($) | Net Realized
Gain (Loss) ($) |
BNY Mellon Corporate Bond
Fund, Cl. M | 43,882,227 | 5,897,310 | 4,722,736 | 49,508 |
BNY Mellon Municipal
Opportunities Fund, CI. M | 133,599,861 | 16,594,783 | - | - |
Dreyfus Emerging Markets Debt
U.S. Dollar Fund, CI. Y | 14,193,729 | 61,774 | 14,166,195 | 1,308,301 |
Dreyfus Floating Rate Income
Fund, CI. Y | 98,044,431 | 43,697,037 | - | - |
Dreyfus Global Dynamic Bond
Income Fund, CI. Y | 27,456,618 | 5,786,298 | - | - |
Dreyfus High Yield Fund, CI. I | 143,156,856 | 16,654,945 | 100,046,384 | (6,843,948) |
Total | 460,333,722 | 88,692,147 | 118,935,315 | (5,486,139) |
| | | | | | |
Registered Investment Companies | Change in Net
Unrealized
Appreciation
(Depreciation) ($) | Value
10/31/18 ($) | Net
Assets (%) | Dividends/
Distributions ($) |
BNY Mellon Corporate Bond
Fund, Cl. M | (2,303,490) | 42,802,819 | 9.9 | 1,567,130 |
BNY Mellon Municipal Opportunities Fund, CI. M | (2,170,189) | 148,024,455 | 34.4 | 4,737,769 |
Dreyfus Emerging Markets Debt
U.S. Dollar Fund, CI. Y | (1,397,609) | - | - | 61,774 |
Dreyfus Floating Rate Income
Fund, CI. Y | (1,376,440) | 140,365,028 | 32.6 | 5,336,382 |
Dreyfus Global Dynamic Bond
Income Fund, CI. Y | (447,318) | 32,795,598 | 7.6 | 542,826 |
Dreyfus High Yield Fund, CI. I | 343,670 | 53,265,139 | 12.4 | 5,951,841 |
Total | | (7,351,376) | 417,253,039 | 96.9 | 18,197,722 |
† Includes reinvested dividends/distributions.
See notes to financial statements.
10
STATEMENT OF ASSETS AND LIABILITIES
October 31, 2018
| | | | | | | |
| | | | | | |
| | | Cost | | Value | |
Assets ($): | | | | |
Investments in securities—See Statement of Investments: | | | |
Unaffiliated issuers | 15,688,541 | | 14,283,842 | |
Affiliated issuers | | 423,424,763 | | 417,253,039 | |
Cash | | | | | 1,070,263 | |
Dividends receivable | | 871,400 | |
Receivable for shares of Common Stock subscribed | | 194,983 | |
Receivable for investment securities sold | | 13,000 | |
Prepaid expenses | | | | | 13,466 | |
| | | | | 433,699,993 | |
Liabilities ($): | | | | |
Due to The Dreyfus Corporation and affiliates—Note 3(c) | | | | 7,861 | |
Payable for shares of Common Stock redeemed | | 2,163,095 | |
Payable for investment securities purchased | | 876,430 | |
Directors fees and expenses payable | | 1,717 | |
Interest payable—Note 2 | | 783 | |
Accrued expenses and other liabilities | | | | | 69,699 | |
| | | | | 3,119,585 | |
Net Assets ($) | | | 430,580,408 | |
Composition of Net Assets ($): | | | | |
Paid-in capital | | | | | 450,511,487 | |
Total distributable earnings (loss) | | | | | (19,931,079) | |
Net Assets ($) | | | 430,580,408 | |
| | | | | | |
Net Asset Value Per Share | Class A | Class C | Class I | Class Y | |
Net Assets ($) | 1,026,575 | 24,038 | 9,264,298 | 420,265,497 | |
Shares Outstanding | 85,386 | 2,000 | 768,966 | 34,909,131 | |
Net Asset Value Per Share ($) | 12.02 | 12.02 | 12.05 | 12.04 | |
| | | | | | |
See notes to financial statements. | | | | | |
11
STATEMENT OF OPERATIONS
Year Ended October 31, 2018
| | | | | | | |
| | | | | | |
| | | | | | |
Investment Income ($): | | | | |
Income: | | | | |
Cash dividends: | |
Unaffiliated issuers | | | 876,655 | |
Affiliated issuers | | | 18,088,693 | |
Interest | | | 1,329 | |
Total Income | | | 18,966,677 | |
Expenses: | | | | |
Professional fees | | | 94,219 | |
Registration fees | | | 62,890 | |
Directors’ fees and expenses—Note 3(d) | | | 34,277 | |
Chief Compliance Officer fees | | | 12,797 | |
Prospectus and shareholders’ reports | | | 11,967 | |
Loan commitment fees—Note 2 | | | 8,063 | |
Shareholder servicing costs—Note 3(c) | | | 5,256 | |
Interest expense—Note 2 | | | 1,537 | |
Custodian fees—Note 3(c) | | | 610 | |
Distribution fees—Note 3(b) | | | 183 | |
Miscellaneous | | | 20,357 | |
Total Expenses | | | 252,156 | |
Less—reduction in fees due to earnings credits—Note 3(c) | | | (610) | |
Net Expenses | | | 251,546 | |
Investment Income—Net | | | 18,715,131 | |
Realized and Unrealized Gain (Loss) on Investments—Note 4 ($): | | |
Net realized gain (loss) on investments: | | |
Affiliated issuers | | | | (5,486,139) | |
Capital gain distributions from affiliated issuers | 109,029 | |
Net Realized Gain (Loss) | | | (5,377,110) | |
Net unrealized appreciation (depreciation) on investments: | | | | |
Unaffiliated issuers | | | | (327,620) | |
Affiliated issuers | | | | (7,351,376) | |
Net Unrealized Appreciation (Depreciation) | | | (7,678,996) | |
Net Realized and Unrealized Gain (Loss) on Investments | | | (13,056,106) | |
Net Increase in Net Assets Resulting from Operations | | 5,659,025 | |
| | | | | | | |
See notes to financial statements. | | | | | |
12
STATEMENT OF CHANGES IN NET ASSETS
| | | | | | | | | | |
| | | | Year Ended October 31, |
| | | | 2018 | | 2017 | a |
Operations ($): | | | | | | | | |
Investment income—net | | | 18,715,131 | | | | 17,975,970 | |
Net realized gain (loss) on investments | | (5,377,110) | | | | (437,740) | |
Net unrealized appreciation (depreciation)
on investments | | (7,678,996) | | | | 2,540,439 | |
Net Increase (Decrease) in Net Assets
Resulting from Operations | 5,659,025 | | | | 20,078,669 | |
Distributions ($): | |
Distributions to shareholders: | | | | | | | | |
Class A | | | (28,661) | | | | (9,223) | |
Class C | | | (767) | | | | (996) | |
Class I | | | (275,253) | | | | (89,130) | |
Class Y | | | (18,996,217) | | | | (17,155,682) | |
Total Distributions | | | (19,300,898) | | | | (17,255,031) | |
Capital Stock Transactions ($): | |
Net proceeds from shares sold: | | | | | | | | |
Class A | | | 715,571 | | | | 268,453 | |
Class I | | | 8,616,334 | | | | 6,873,469 | |
Class Y | | | 82,730,882 | | | | 105,396,858 | |
Distributions reinvested: | | | | | | | | |
Class A | | | 24,898 | | | | 5,734 | |
Class C | | | - | | | | 377 | |
Class I | | | 244,641 | | | | 77,667 | |
Class Y | | | 1,987,366 | | | | 1,924,810 | |
Cost of shares redeemed: | | | | | | | | |
Class A | | | (118,871) | | | | (4,087) | |
Class C | | | - | | | | (25,305) | |
Class I | | | (5,135,278) | | | | (1,793,552) | |
Class Y | | | (107,740,862) | | | | (75,797,990) | |
Increase (Decrease) in Net Assets
from Capital Stock Transactions | (18,675,319) | | | | 36,926,434 | |
Total Increase (Decrease) in Net Assets | (32,317,192) | | | | 39,750,072 | |
Net Assets ($): | |
Beginning of Period | | | 462,897,600 | | | | 423,147,528 | |
End of Period | | | 430,580,408 | | | | 462,897,600 | |
13
STATEMENT OF CHANGES IN NET ASSETS (continued)
| | | | | | | | | | |
| | | | Year Ended October 31, |
| | | | 2018 | | 2017 | a |
Capital Share Transactions (Shares): | |
Class A | | | | | | | | |
Shares sold | | | 58,618 | | | | 21,845 | |
Shares issued for distributions reinvested | | | 2,047 | | | | 467 | |
Shares redeemed | | | (9,811) | | | | (333) | |
Net Increase (Decrease) in Shares Outstanding | 50,854 | | | | 21,979 | |
Class C | | | | | | | | |
Shares issued for distributions reinvested | | | - | | | | 31 | |
Shares redeemed | | | - | | | | (2,064) | |
Net Increase (Decrease) in Shares Outstanding | - | | | | (2,033) | |
Class Ib | | | | | | | | |
Shares sold | | | 705,948 | | | | 558,634 | |
Shares issued for distributions reinvested | | | 20,067 | | | | 6,308 | |
Shares redeemed | | | (419,817) | | | | (145,804) | |
Net Increase (Decrease) in Shares Outstanding | 306,198 | | | | 419,138 | |
Class Yb | | | | | | | | |
Shares sold | | | 6,776,043 | | | | 8,605,031 | |
Shares issued for distributions reinvested | | | 162,876 | | | | 157,348 | |
Shares redeemed | | | (8,857,760) | | | | (6,199,076) | |
Net Increase (Decrease) in Shares Outstanding | (1,918,841) | | | | 2,563,303 | |
| | | | | | | | | | |
a Distributions to shareholders include only distributions from net investment income. Undistributed investment income—net was $1,905,358 in 2017 and is no longer presented as a result of the adoption of SEC’s Disclosure Update and Simplification Rule. | |
b During the period ended October 31, 2018, 291,566 Class Y shares representing $3,547,650 were exchanged for 291,331 Class I shares and during the period ended October 31, 2017, 235,319 Class Y shares representing $2,892,898 were exchanged for 235,134 Class I shares. | |
See notes to financial statements.
| | | | | | | | |
14
FINANCIAL HIGHLIGHTS
The following tables describe the performance for each share class for the fiscal periods indicated. All information (except portfolio turnover rate) reflects financial results for a single fund share. Total return shows how much your investment in the fund would have increased (or decreased) during each period, assuming you had reinvested all dividends and distributions. These figures have been derived from the fund’s financial statements.
| | | | | | | | | | |
| | | | | | | | |
| | | | | | |
Class A Shares | | Year Ended October 31, |
| | 2018 | 2017 | 2016 | 2015 | 2014 | a |
Per Share Data ($): | | | | | | | |
Net asset value, beginning of period | | 12.39 | 12.32 | 12.21 | 12.65 | 12.50 | |
Investment Operations: | | | | | | | |
Investment income—netb | | .45 | .45 | .50 | .49 | .26 | |
Net realized and unrealized
gain (loss) on investments | | (.35) | .07 | .10 | (.48) | .10 | |
Total from Investment Operations | | .10 | .52 | .60 | .01 | .36 | |
Distributions: | | | | | | | |
Dividends from investment income—net | | (.47) | (.45) | (.49) | (.45) | (.21) | |
Net asset value, end of period | | 12.02 | 12.39 | 12.32 | 12.21 | 12.65 | |
Total Return (%)c | | .83 | 4.38 | 4.98 | .10 | 2.89 | d |
Ratios/Supplemental Data (%): | | | | | | | |
Ratio of total expenses
to average net assetse | | .38 | .41 | .31 | .33 | .91 | f |
Ratio of net expenses
to average net assetse | | .38 | .41 | .31 | .33 | .43 | f |
Ratio of net investment income
to average net assetse | | 3.67 | 3.63 | 4.03 | 3.88 | 3.18 | f |
Portfolio Turnover Rate | | 22.78 | 10.47 | 16.14 | 17.13 | 14.04 | d |
Net Assets, end of period ($ x 1,000) | | 1,027 | 428 | 155 | 544 | 27 | |
a From March 7, 2014 (commencement of operations) to October 31, 2014.
b Based on average shares outstanding.
c Exclusive of sales charge.
d Not annualized.
e Amount does not include the expenses of the underlying funds.
f Annualized.
See notes to financial statements.
15
FINANCIAL HIGHLIGHTS (continued)
| | | | | | | | | | |
| | | | | | | | | |
| | | | | | |
Class C Shares | | Year Ended October 31, |
| | 2018 | 2017 | 2016 | 2015 | 2014 | a |
Per Share Data ($): | | | | | | | | |
Net asset value, beginning of period | | | 12.40 | 12.31 | 12.19 | 12.63 | 12.50 | |
Investment Operations: | | | | | | | | |
Investment income—netb | | | .35 | .35 | .38 | .37 | .20 | |
Net realized and unrealized
gain (loss) on investments | | | (.35) | .05 | .13 | (.45) | .09 | |
Total from Investment Operations | | | - | .40 | .51 | (.08) | .29 | |
Distributions: | | | | | | | | |
Dividends from investment income—net | | | (.38) | (.31) | (.39) | (.36) | (.16) | |
Net asset value, end of period | | | 12.02 | 12.40 | 12.31 | 12.19 | 12.63 | |
Total Return (%)c | | | .02 | 3.31 | 4.34 | (.66) | 2.34 | d |
Ratios/Supplemental Data (%): | | | | | | | | |
Ratio of total expenses
to average net assetse | | | 1.26 | 1.37 | 1.12 | 1.13 | 1.65 | f |
Ratio of net expenses
to average net assetse | | | 1.26 | 1.37 | 1.12 | 1.13 | 1.16 | f |
Ratio of net investment income
to average net assetse | | | 2.84 | 2.90 | 3.18 | 2.96 | 2.43 | f |
Portfolio Turnover Rate | | | 22.78 | 10.47 | 16.14 | 17.13 | 14.04 | d |
Net Assets, end of period ($ x 1,000) | | | 24 | 25 | 50 | 24 | 25 | |
a From March 7, 2014 (commencement of operations) to October 31, 2014.
b Based on average shares outstanding.
c Exclusive of sales charge.
d Not annualized.
e Amount does not include the expenses of the underlying funds.
f Annualized.
See notes to financial statements.
16
| | | | | | | | | | | | | |
| | | | | | | |
| | | | | | |
Class I Shares | | Year Ended October 31, |
| | 2018 | 2017 | 2016 | 2015 | 2014 | a |
Per Share Data ($): | | | | | | | |
Net asset value, beginning of period | | 12.41 | 12.34 | 12.22 | 12.66 | 12.50 | |
Investment Operations: | | | | | | | |
Investment income—netb | | .48 | .47 | .48 | .50 | .23 | |
Net realized and unrealized
gain (loss) on investments | | (.33) | .08 | .15 | (.46) | .15 | |
Total from Investment Operations | | .15 | .55 | .63 | .04 | .38 | |
Distributions: | | | | | | | |
Dividends from investment income—net | | (.51) | (.48) | (.51) | (.48) | (.22) | |
Net asset value, end of period | | 12.05 | 12.41 | 12.34 | 12.22 | 12.66 | |
Total Return (%) | | 1.20 | 4.66 | 5.22 | .33 | 3.08 | c |
Ratios/Supplemental Data (%): | | | | | | | |
Ratio of total expenses
to average net assetsd | | .08 | .11 | .19 | .15 | .54 | e |
Ratio of net expenses
to average net assetsd | | .08 | .11 | .19 | .15 | .15 | e |
Ratio of net investment income
to average net assetsd | | 3.99 | 3.85 | 4.16 | 4.05 | 3.85 | e |
Portfolio Turnover Rate | | 22.78 | 10.47 | 16.14 | 17.13 | 14.04 | c |
Net Assets, end of period ($ x 1,000) | | 9,264 | 5,742 | 538 | 250 | 193 | |
a From March 7, 2014 (commencement of operations) to October 31, 2014.
b Based on average shares outstanding.
c Not annualized.
d Amount does not include the expenses of the underlying funds.
e Annualized.
See notes to financial statements.
17
FINANCIAL HIGHLIGHTS (continued)
| | | | | | | | | | | | | |
| | | | | | | |
| | | | | | |
Class Y Shares | | Year Ended October 31, |
| | 2018 | 2017 | 2016 | 2015 | 2014 | a |
Per Share Data ($): | | | | | | | |
Net asset value, beginning of period | | 12.40 | 12.33 | 12.21 | 12.65 | 12.50 | |
Investment Operations: | | | | | | | |
Investment income—netb | | .50 | .50 | .52 | .51 | .29 | |
Net realized and unrealized
gain (loss) on investments | | (.35) | .06 | .12 | (.46) | .09 | |
Total from Investment Operations | | .15 | .56 | .64 | .05 | .38 | |
Distributions: | | | | | | | |
Dividends from investment income—net | | (.51) | (.49) | (.52) | (.49) | (.23) | |
Net asset value, end of period | | 12.04 | 12.40 | 12.33 | 12.21 | 12.65 | |
Total Return (%) | | 1.23 | 4.72 | 5.37 | .42 | 3.02 | c |
Ratios/Supplemental Data (%): | | | | | | | |
Ratio of total expenses
to average net assetsd | | .05 | .05 | .05 | .06 | .13 | e |
Ratio of net expenses
to average net assetsd | | .05 | .04 | .05 | .06 | .10 | e |
Ratio of net investment income
to average net assetsd | | 4.06 | 4.11 | 4.28 | 4.05 | 3.67 | e |
Portfolio Turnover Rate | | 22.78 | 10.47 | 16.14 | 17.13 | 14.04 | c |
Net Assets, end of period ($ x 1,000) | | 420,265 | 456,703 | 422,405 | 409,077 | 331,526 | |
a From March 7, 2014 (commencement of operations) to October 31, 2014.
b Based on average shares outstanding.
c Not annualized.
d Amount does not include the expenses of the underlying funds.
e Annualized.
See notes to financial statements.
18
NOTES TO FINANCIAL STATEMENTS
NOTE 1—Significant Accounting Policies:
Dreyfus Yield Enhancement Strategy Fund (the “fund”) is a separate diversified series of Dreyfus BNY Mellon Funds, Inc. (the “Company”), which is registered under the Investment Company Act of 1940, as amended (the “Act”), as an open-end management investment company and operates as a series company currently offering four series, including the fund. The fund’s investment objective is to seek high current income. The Dreyfus Corporation (the “Manager” or “Dreyfus”), a wholly-owned subsidiary of The Bank of New York Mellon Corporation (“BNY Mellon”), serves as the fund’s investment adviser.
MBSC Securities Corporation (the “Distributor”), a wholly-owned subsidiary of Dreyfus, is the distributor of the fund’s shares. The fund is authorized to issue 100 million shares of $.001 par value Common Stock in each of the following classes of shares: Class A, Class C, Class I, Class T and Class Y. Class A, Class C and Class T shares are sold primarily to retail investors through financial intermediaries and bear Distribution and/or Shareholder Services Plan fees. Class A and Class T shares generally are subject to a sales charge imposed at the time of purchase. Class C shares are subject to a contingent deferred sales charge (“CDSC”) imposed on Class C shares redeemed within one year of purchase. Class C shares automatically convert to Class A shares ten years after the date of purchase, without the imposition of a sales charge. Class I shares are sold primarily to bank trust departments and other financial service providers (including The Bank of New York Mellon, a subsidiary of BNY Mellon and an affiliate of Dreyfus, and its affiliates), acting on behalf of customers having a qualified trust or an investment account or relationship at such institution, and bear no Distribution or Shareholder Services Plan fees. Class Y shares are sold at net asset value per share generally to institutional investors, and bear no Distribution or Shareholder Services Plan fees. Class I and Class Y shares are offered without a front-end sales charge or CDSC. As of the date of this report, the fund did not offer Class T shares for purchase. Other differences between the classes include the services offered to and the expenses borne by each class, the allocation of certain transfer agency costs, and certain voting rights. Income, expenses (other than expenses attributable to a specific class), and realized and unrealized gains or losses on investments are allocated to each class of shares based on its relative net assets.
As of October 31, 2018, MBC Investments Corp., an indirect subsidiary of BNY Mellon, held all of the outstanding Class C shares of the fund.
19
NOTES TO FINANCIAL STATEMENTS (continued)
The Company accounts separately for the assets, liabilities and operations of each series. Expenses directly attributable to each series are charged to that series’ operations; expenses which are applicable to all series are allocated among them on a pro rata basis.
The Financial Accounting Standards Board (“FASB”) Accounting Standards Codification is the exclusive reference of authoritative U.S. generally accepted accounting principles (“GAAP”) recognized by the FASB to be applied by nongovernmental entities. Rules and interpretive releases of the Securities and Exchange Commission (“SEC”) under authority of federal laws are also sources of authoritative GAAP for SEC registrants. The fund’s financial statements are prepared in accordance with GAAP, which may require the use of management estimates and assumptions. Actual results could differ from those estimates.
(a) Portfolio valuation: The fair value of a financial instrument is the amount that would be received to sell an asset or paid to transfer a liability in an orderly transaction between market participants at the measurement date (i.e., the exit price). GAAP establishes a fair value hierarchy that prioritizes the inputs of valuation techniques used to measure fair value. This hierarchy gives the highest priority to unadjusted quoted prices in active markets for identical assets or liabilities (Level 1 measurements) and the lowest priority to unobservable inputs (Level 3 measurements).
Additionally, GAAP provides guidance on determining whether the volume and activity in a market has decreased significantly and whether such a decrease in activity results in transactions that are not orderly. GAAP requires enhanced disclosures around valuation inputs and techniques used during annual and interim periods.
Various inputs are used in determining the value of the fund’s investments relating to fair value measurements. These inputs are summarized in the three broad levels listed below:
Level 1—unadjusted quoted prices in active markets for identical investments.
Level 2—other significant observable inputs (including quoted prices for similar investments, interest rates, prepayment speeds, credit risk, etc.).
Level 3—significant unobservable inputs (including the fund’s own assumptions in determining the fair value of investments).
The inputs or methodology used for valuing securities are not necessarily an indication of the risk associated with investing in those securities.
20
Investments are valued at the net asset value of each underlying fund determined as of the close of the New York Stock Exchange (generally 4 p.m., Eastern time) on the valuation date and are generally categorized within Level 1 of the fair value hierarchy.
The following is a summary of the inputs used as of October 31, 2018 in valuing the fund’s investments:
| | | | | | |
Assets ($) | Level 1 - Unadjusted Quoted Prices | Level 2 - Other Significant Observable Inputs | Level 3 - Significant Unobservable Inputs | Total |
Investments in Securities: | | | |
Investment
Companies† | 431,536,881 | - | - | 431,536,881 |
† See Statement of Investments for additional detailed categorizations.
At October 31, 2018, there were no transfers between levels of the fair value hierarchy. It is the fund’s policy to recognize transfers between levels at the end of the reporting period.
(b) Securities transactions and investment income: Securities transactions are recorded on a trade date basis. Realized gains and losses from securities transactions are recorded on the identified cost basis. Dividend income is recognized on the ex-dividend date and interest income, including, where applicable, accretion of discount and amortization of premium on investments, is recognized on the accrual basis.
(c) Affiliated issuers: Investments in other investment companies advised by Dreyfus are considered “affiliated” under the Act.
(d) Dividends and distributions to shareholders: Dividends and distributions are recorded on the ex-dividend date. Dividends from investment income-net are normally declared and paid on a monthly basis. Dividends from net realized capital gains, if any, are normally declared and paid annually, but the fund may make distributions on a more frequent basis to comply with the distribution requirements of the Internal Revenue Code of 1986, as amended (the “Code”). To the extent that net realized capital gains can be offset by capital loss carryovers, it is the policy of the fund not to distribute such gains. Income and capital gain distributions are determined in accordance with income tax regulations, which may differ from GAAP.
(e) Federal income taxes: It is the policy of the fund to continue to qualify as a regulated investment company, if such qualification is in the best interests of its shareholders, by complying with the applicable
21
NOTES TO FINANCIAL STATEMENTS (continued)
provisions of the Code, and to make distributions of taxable income and net realized capital gain sufficient to relieve it from substantially all federal income and excise taxes.
As of and during the period ended October 31, 2018, the fund did not have any liabilities for any uncertain tax positions. The fund recognizes interest and penalties, if any, related to uncertain tax positions as income tax expense in the Statement of Operations. During the period ended October 31, 2018, the fund did not incur any interest or penalties.
Each tax year in the four-year period ended October 31, 2018 remains subject to examination by the Internal Revenue Service and state taxing authorities.
At October 31, 2018, the components of accumulated earnings on a tax basis were as follows: undistributed ordinary income $1,428,078, accumulated capital losses $11,633,093 and unrealized depreciation $9,726,064.
The fund is permitted to carry forward capital losses for an unlimited period. Furthermore, capital loss carryovers retain their character as either short-term or long-term capital losses.
The accumulated capital loss carryover is available for federal income tax purposes to be applied against future net realized capital gains, if any, realized subsequent to October 31, 2018. The fund has $2,794,585 of short-term capital losses and $8,838,508 of long-term capital losses which can be carried forward for an unlimited period.
The tax character of distributions paid to shareholders during the fiscal periods ended October 31, 2018 and October 31, 2017 were as follows: ordinary income $14,662,110 and $13,086,790, and tax-exempt income $4,638,788 and $4,168,241, respectively.
(f) New Accounting Pronouncements: In August 2018, the FASB issued Accounting Standards Update 2018-13, Fair Value Measurement (Topic 820): Disclosure Framework—Changes to the Disclosure Requirements for Fair Value Measurement (“ASU 2018-13”). The update provides guidance that eliminates, adds and modifies certain disclosure requirements for fair value measurements. ASU 2018-13 will be effective for annual periods beginning after December 15, 2019. Management is currently assessing the potential impact of these changes to future financial statements.
22
NOTE 2—Bank Lines of Credit:
The fund participates with other Dreyfus-managed funds in an $830 million unsecured credit facility led by Citibank, N.A. and a $300 million unsecured credit facility provided by The Bank of New York Mellon (each, a “Facility”), each to be utilized primarily for temporary or emergency purposes, including the financing of redemptions. In connection therewith, the fund has agreed to pay its pro rata portion of commitment fees for each Facility. Interest is charged to the fund based on rates determined pursuant to the terms of the respective Facility at the time of borrowing.
The average amount of borrowings outstanding under the Facilities during the period ended October 31, 2018 was approximately $44,400 with a related weighted average annualized interest rate of 3.46%.
NOTE 3—Management Fee and Other Transactions with Affiliates:
(a) Pursuant to a management agreement with Dreyfus, there is no management fee paid to Dreyfus. The fund may invest in other affiliated mutual funds advised by Dreyfus and unaffiliated open-end funds, closed-end funds and exchange-traded funds. All fees and expenses of the underlying funds are reflected in the underlying fund’s net asset value.
During the period ended October 31, 2018, the Distributor retained $42 from commissions earned on sales of the fund’s Class A shares.
(b) Under the Distribution Plan adopted pursuant to Rule 12b-1 under the Act, Class C shares pay the Distributor for distributing its shares at an annual rate of .75% of the value of its average daily net assets. During the period ended October 31, 2018, Class C shares were charged $183 pursuant to the Distribution Plan.
(c) Under the Shareholder Services Plan, Class A and Class C shares pay the Distributor at an annual rate of .25% of the value of their average daily net assets for the provision of certain services. The services provided may include personal services relating to shareholder accounts, such as answering shareholder inquiries regarding the fund and providing reports and other information, and services related to the maintenance of shareholder accounts. The Distributor may make payments to Service Agents (securities dealers, financial institutions or other industry professionals) with respect to these services. The Distributor determines the amounts to be paid to Service Agents. During the period ended October 31, 2018, Class A and Class C shares were charged $1,964 and $61, respectively, pursuant to the Shareholder Services Plan.
23
NOTES TO FINANCIAL STATEMENTS (continued)
Under its terms, the Distribution Plan and Shareholder Services Plan shall remain in effect from year to year, provided such continuance is approved annually by a vote of a majority of those Directors who are not “interested persons” of the Company and who have no direct or indirect financial interest in the operation of or in any agreement related to the Distribution Plan or Shareholder Services Plan.
The fund has arrangements with the transfer agent and the custodian whereby the fund may receive earnings credits when positive cash balances are maintained, which are used to offset transfer agency and custody fees. For financial reporting purposes, the fund includes net earnings credits, if any, as an expense offset in the Statement of Operations.
The fund compensates Dreyfus Transfer, Inc., a wholly-owned subsidiary of Dreyfus, under a transfer agency agreement for providing transfer agency and cash management services for the fund. The majority of transfer agency fees are comprised of amounts paid on a per account basis, while cash management fees are related to fund subscriptions and redemptions. During the period ended October 31, 2018, the fund was charged $1,749 for transfer agency services. These fees are included in Shareholder servicing costs in the Statement of Operations.
The fund compensates The Bank of New York Mellon under a custody agreement for providing custodial services for the fund. These fees are determined based on net assets, geographic region and transaction activity. During the period ended October 31, 2018, the fund was charged $610 pursuant to the custody agreement. These fees were offset by earnings credits of $610.
During the period ended October 31, 2018, the fund was charged $12,797 for services performed by the Chief Compliance Officer and his staff.
The components of “Due to The Dreyfus Corporation and affiliates” in the Statement of Assets and Liabilities consist of: Distribution Plan fees $16, Shareholder Services Plan fees $232, custodian fees $3,410, Chief Compliance Officer fees $4,193 and transfer agency fees $10.
(d) Each Board member also serves as a Board member of other funds within the Dreyfus complex. Annual retainer fees and attendance fees are allocated to each fund based on net assets.
NOTE 4—Securities Transactions:
The aggregate amount of purchases and sales of investment securities, excluding short-term securities, during the period ended October 31, 2018, amounted to $104,380,687 and $118,935,314, respectively.
24
At October 31, 2018, the cost of investments for federal income tax purposes was $441,262,945; accordingly, accumulated net unrealized depreciation on investments was $9,726,064, consisting of all gross unrealized depreciation.
25
REPORT OF INDEPENDENT REGISTERED PUBLIC ACCOUNTING FIRM
To the Shareholders and Board of Directors
Dreyfus BNY Mellon Funds, Inc.
Opinion on the Financial Statements
We have audited the accompanying statement of assets and liabilities of Dreyfus Yield Enhancement Strategy Fund (the “Fund”), a series of Dreyfus BNY Mellon Funds, Inc., including the statements of investments and investments in affiliated issuers, as of October 31, 2018, the related statement of operations for the year then ended, the statements of changes in net assets for each of the years in the two-year period then ended, and the related notes (collectively, the financial statements) and the financial highlights for each of the years or period in the five-year period then ended. In our opinion, the financial statements and financial highlights present fairly, in all material respects, the financial position of the Fund as of October 31, 2018, the results of its operations for the year then ended, the changes in its net assets for each of the years in the two-year period then ended, and the financial highlights for each of the years or period in the five-year period then ended, in conformity with U.S. generally accepted accounting principles.
Basis for Opinion
These financial statements and financial highlights are the responsibility of the Fund’s management. Our responsibility is to express an opinion on these financial statements and financial highlights based on our audits. We are a public accounting firm registered with the Public Company Accounting Oversight Board (United States) (PCAOB) and are required to be independent with respect to the Fund in accordance with the U.S. federal securities laws and the applicable rules and regulations of the Securities and Exchange Commission and the PCAOB.
We conducted our audits in accordance with the standards of the PCAOB. Those standards require that we plan and perform the audit to obtain reasonable assurance about whether the financial statements and financial highlights are free of material misstatement, whether due to error or fraud. Our audits included performing procedures to assess the risks of material misstatement of the financial statements and financial highlights, whether due to error or fraud, and performing procedures that respond to those risks. Such procedures included examining, on a test basis, evidence regarding the amounts and disclosures in the financial statements and financial highlights. Such procedures also included confirmation of securities owned as of October 31, 2018, by correspondence with the custodian and brokers or by other appropriate auditing procedures when replies from brokers were not received, and confirmation of fund of funds investments with transfer agents. Our audits also included evaluating the accounting principles used and significant estimates made by management, as well as evaluating the overall presentation of the financial statements and financial highlights. We believe that our audits provide a reasonable basis for our opinion.

We have served as the auditor of one or more Dreyfus Corporation investment companies since 1994.
New York, New York
December 28, 2018
26
IMPORTANT TAX INFORMATION (Unaudited)
For federal tax purposes, the fund reports the maximum amount allowable, but not less than $14,662,114 as ordinary income dividends paid during the year ended October 31, 2018 as qualified dividend income in accordance with Section 854(b)(1)(B) of the Internal Revenue Code. Also, the fund reports the maximum amount allowable but not less than 100% of ordinary income dividends paid during the year ended October 31, 2018 as eligible for the corporate dividends received deduction provided under Section 243 of the Internal Revenue Code in accordance with Section 854(b)(1)(A) of the Internal Revenue Code. Shareholders will receive notification in early 2019 of the percentage applicable to the preparation of their 2018 income tax returns. Also, in accordance with federal tax law, the fund hereby reports $4,638,788 as “exempt-interest dividends paid” during its fiscal year ended October 31, 2018. Where required by federal tax law rules, shareholders will receive notification of their portion of the fund’s tax-exempt dividends paid for the 2018 calendar year on Form 1099-DIV, which will be mailed in early 2019.
27
BOARD MEMBERS INFORMATION (Unaudited)
INDEPENDENT BOARD MEMBERS
Joseph S. DiMartino (75)
Chairman of the Board (1999)
Principal Occupation During Past 5 Years:
· Corporate Director and Trustee (1995-present)
Other Public Company Board Memberships During Past 5 Years:
· CBIZ (formerly, Century Business Services, Inc.), a provider of outsourcing functions for small and medium size companies, Director (1997-present)
No. of Portfolios for which Board Member Serves: 124
———————
Francine J. Bovich (67)
Board Member (2012)
Principal Occupation During Past 5 Years:
· Trustee, The Bradley Trusts, private trust funds (2011-present)
Other Public Company Board Memberships During Past 5 Years:
· Annaly Capital Management, Inc., a real estate trust, Director (2014-present)
No. of Portfolios for which Board Member Serves: 72
———————
Kenneth A. Himmel (72)
Board Member (1994)
Principal Occupation During Past 5 Years:
· Managing Partner, Gulf Related, an international real estate development company (2010-present)
· President and CEO, Related Urban Development, a real estate development company (1996-present)
· President and CEO, Himmel & Company, a real estate development company (1980-present)
· CEO, American Food Management, a restaurant company (1983-present)
No. of Portfolios for which Board Member Serves: 25
———————
28
Stephen J. Lockwood (71)
Board Member (1994)
Principal Occupation During Past 5 Years:
· Chairman of the Board, Stephen J. Lockwood and Company LLC, a real estate investment company (2000-present)
No. of Portfolios for which Board Member Serves: 25
———————
Roslyn M. Watson (69)
Board Member (1994)
Principal Occupation During Past 5 Years:
· Principal, Watson Ventures, Inc., a real estate investment company (1993-present)
No. of Portfolios for which Board Member Serves: 58
———————
Benaree Pratt Wiley (72)
Board Member (1998)
Principal Occupation During Past 5 Years:
· Principal, The Wiley Group, a firm specializing in strategy and business development (2005-present)
Other Public Company Board Memberships During Past 5 Years:
· CBIZ (formerly, Century Business Services, Inc.), a provider of outsourcing functions for small and medium size companies, Director (2008-present)
No. of Portfolios for which Board Member Serves: 79
———————
Once elected all Board Members serve for an indefinite term, but achieve Emeritus status upon reaching age 80. The address of the Board Members and Officers is c/o The Dreyfus Corporation, 200 Park Avenue, New York, New York 10166. Additional information about the Board Members is available in the fund’s Statement of Additional Information which can be obtained from Dreyfus free of charge by calling this toll free number: 1-800-DREYFUS.
James M. Fitzgibbons, Emeritus Board Member
29
OFFICERS OF THE FUND (Unaudited)
BRADLEY J. SKAPYAK, President since January 2010.
Chief Operating Officer and a director of the Manager since June 2009, Chairman of Dreyfus Transfer, Inc., an affiliate of the Manager and the transfer agent of the funds, since May 2011 and Chief Executive Officer of MBSC Securities Corporation since August 2016. He is an officer of 62 investment companies (comprised of 124 portfolios) managed by the Manager. He is 59 years old and has been an employee of the Manager since February 1988.
BENNETT A. MACDOUGALL, Chief Legal Officer since October 2015.
Chief Legal Officer of the Manager and Associate General Counsel and Managing Director of BNY Mellon since June 2015; from June 2005 to June 2015, he served in various capacities with Deutsche Bank – Asset & Wealth Management Division, including as Director and Associate General Counsel, and Chief Legal Officer of Deutsche Investment Management Americas Inc. from June 2012 to May 2015. He is an officer of 63 investment companies (comprised of 149 portfolios) managed by the Manager. He is 47 years old and has been an employee of the Manager since June 2015.
JAMES BITETTO, Vice President since August 2005 and Secretary since February 2018.
Managing Counsel of BNY Mellon and Secretary of the Manager, and an officer of 63 investment companies (comprised of 149 portfolios) managed by the Manager. He is 52 years old and has been an employee of the Manager since December 1996.
JOSEPH M. CHIOFFI, Vice President and Assistant Secretary since August 2005.
Managing Counsel of BNY Mellon, and an officer of 63 investment companies (comprised of 149 portfolios) managed by the Manager. He is 56 years old and has been an employee of the Manager since June 2000.
SONALEE CROSS, Vice President and Assistant Secretary since March 2018.
Counsel of BNY Mellon since October 2016; Associate at Proskauer Rose LLP from April 2016 to September 2016; Attorney at EnTrust Capital from August 2015 to February 2016; Associate at Sidley Austin LLP from September 2013 until August 2015. She is an officer of 63 investment companies (comprised of 149 portfolios) managed by Dreyfus. She is 31 years old and has been an employee of the Manager since October 2016.
MAUREEN E. KANE, Vice President and Assistant Secretary since April 2015.
Managing Counsel of BNY Mellon since July 2014; from October 2004 until July 2014, General Counsel, and from May 2009 until July 2014, Chief Compliance Officer of Century Capital Management. She is an officer of 63 investment companies (comprised of 149 portfolios) managed by the Manager. She is 56 years old and has been an employee of the Manager since July 2014.
SARAH S. KELLEHER, Vice President and Assistant Secretary since April 2014.
Managing Counsel of BNY Mellon since December 2017, from March 2013 to December 2017, Senior Counsel of BNY Mellon. She is an officer of 63 investment companies (comprised of 149 portfolios) managed by the Manager. She is 43 years old and has been an employee of the Manager since March 2013.
JEFF PRUSNOFSKY, Vice President and Assistant Secretary since August 2005.
Senior Managing Counsel of BNY Mellon, and an officer of 63 investment companies (comprised of 149 portfolios) managed by the Manager. He is 53 years old and has been an employee of the Manager since October 1990.
NATALYA ZELENSKY, Vice President and Assistant Secretary since March 2017.
Counsel of BNY Mellon since May 2016; Attorney at Wildermuth Endowment Strategy Fund/Wildermuth Advisory, LLC from November 2015 until May 2016; Assistant General Counsel at RCS Advisory Services from July 2014 until November 2015; Associate at Sutherland, Asbill & Brennan from January 2013 until January 2014. She is an officer of 63 investment companies (comprised of 149 portfolios) managed by Dreyfus. She is 33 years old and has been an employee of the Manager since May 2016.
JAMES WINDELS, Treasurer since November 2001.
Director – Mutual Fund Accounting of the Manager, and an officer of 63 investment companies (comprised of 149 portfolios) managed by the Manager. He is 60 years old and has been an employee of the Manager since April 1985.
30
GAVIN C. REILLY, Assistant Treasurer since December 2005.
Tax Manager of the Investment Accounting and Support Department of the Manager, and an officer of 63 investment companies (comprised of 149 portfolios) managed by the Manager. He is 50 years old and has been an employee of the Manager since April 1991.
ROBERT S. ROBOL, Assistant Treasurer since December 2002.
Senior Accounting Manager – Dreyfus Financial Reporting of the Manager, and an officer of 63 investment companies (comprised of 149 portfolios) managed by the Manager. He is 54 years old and has been an employee of the Manager since October 1988.
ROBERT SALVIOLO, Assistant Treasurer since July 2007.
Senior Accounting Manager – Equity Funds of the Manager, and an officer of 63 investment companies (comprised of 149 portfolios) managed by the Manager. He is 51 years old and has been an employee of the Manager since June 1989.
ROBERT SVAGNA, Assistant Treasurer since July 2007.
Senior Accounting Manager – Fixed Income and Equity Funds of the Manager, and an officer of 63 investment companies (comprised of 149 portfolios) managed by the Manager. He is 51 years old and has been an employee of the Manager since November 1990.
JOSEPH W. CONNOLLY, Chief Compliance Officer since October 2004.
Chief Compliance Officer of the Manager, the Dreyfus Family of Funds and BNY Mellon Funds Trust (63 investment companies, comprised of 149 portfolios). He is 61 years old and has served in various capacities with the Manager since 1980, including manager of the firm’s Fund Accounting Department from 1997 through October 2001.
CARIDAD M. CAROSELLA, Anti-Money Laundering Compliance Officer since January 2016.
Anti-Money Laundering Compliance Officer of the Dreyfus Family of Funds and BNY Mellon Funds Trust since January 2016; from May 2015 to December 2015, Interim Anti-Money Laundering Compliance Officer of the Dreyfus Family of Funds and BNY Mellon Funds Trust and the Distributor; from January 2012 to May 2015, AML Surveillance Officer of the Distributor and from 2007 to December 2011, Financial Processing Manager of the Distributor. She is an officer of 57 investment companies (comprised of 143 portfolios) managed by the Manager. She is 50 years old and has been an employee of the Distributor since 1997.
31
NOTES
32
NOTES
33
Dreyfus Yield Enhancement Strategy Fund
200 Park Avenue
New York, NY 10166
Manager
The Dreyfus Corporation
200 Park Avenue
New York, NY 10166
Custodian
The Bank of New York Mellon
240 Greenwich Street
New York, NY 10286
Transfer Agent &
Dividend Disbursing Agent
Dreyfus Transfer, Inc.
200 Park Avenue
New York, NY 10166
Distributor
MBSC Securities Corporation
200 Park Avenue
New York, NY 10166
| | |
Ticker Symbols: | Class A: DABMX Class C: DABLX Class I: DABKX Class Y: DABJX |
Telephone Call your financial representative or 1-800-DREYFUS
Mail The Dreyfus Family of Funds, 144 Glenn Curtiss Boulevard, Uniondale, NY 11556-0144
E-mail Send your request to info@dreyfus.com
Internet Information can be viewed online or downloaded at www.dreyfus.com
The fund files its complete schedule of portfolio holdings with the Securities and Exchange Commission (“SEC”) for the first and third quarters of each fiscal year on Form N-Q. The fund’s Forms N-Q are available on the SEC’s website at www.sec.gov.
A description of the policies and procedures that the fund uses to determine how to vote proxies relating to portfolio securities and information regarding how the fund voted these proxies for the most recent 12-month period ended June 30 is available at www.dreyfus.com and on the SEC’s website at www.sec.gov and without charge, upon request, by calling 1-800-DREYFUS.
| | |
© 2018 MBSC Securities Corporation
6327AR1018 | 
|
Item 2. Code of Ethics.
The Registrant has adopted a code of ethics that applies to the Registrant's principal executive officer, principal financial officer, principal accounting officer or controller, or persons performing similar functions. There have been no amendments to, or waivers in connection with, the Code of Ethics during the period covered by this Report.
Item 3. Audit Committee Financial Expert.
The Registrant's Board has determined that Joseph S. DiMartino, a member of the Audit Committee of the Board, is an audit committee financial expert as defined by the Securities and Exchange Commission (the "SEC"). Mr. DiMartino is "independent" as defined by the SEC for purposes of audit committee financial expert determinations.
Item 4. Principal Accountant Fees and Services.
(a) Audit Fees. The aggregate fees billed for each of the last two fiscal years (the "Reporting Periods") for professional services rendered by the Registrant's principal accountant (the "Auditor") for the audit of the Registrant's annual financial statements or services that are normally provided by the Auditor in connection with the statutory and regulatory filings or engagements for the Reporting Periods, were $170,975 in 2017 and $127,410 in 2018.
(b) Audit-Related Fees. The aggregate fees billed in the Reporting Periods for assurance and related services by the Auditor that are reasonably related to the performance of the audit of the Registrant's financial statements and are not reported under paragraph (a) of this Item 4 were $26,730 in 2017 and $20,920 in 2018. These services consisted of one or more of the following: (i) agreed upon procedures related to compliance with Internal Revenue Code section 817(h), (ii) security counts required by Rule 17f-2 under the Investment Company Act of 1940, as amended, (iii) advisory services as to the accounting or disclosure treatment of Registrant transactions or events and (iv) advisory services to the accounting or disclosure treatment of the actual or potential impact to the Registrant of final or proposed rules, standards or interpretations by the Securities and Exchange Commission, the Financial Accounting Standards Boards or other regulatory or standard-setting bodies.
The aggregate fees billed in the Reporting Periods for non-audit assurance and related services by the Auditor to the Registrant's investment adviser (not including any sub-investment adviser whose role is primarily portfolio management and is subcontracted with or overseen by another investment adviser), and any entity controlling, controlled by or under common control with the investment adviser that provides ongoing services to the Registrant ("Service Affiliates"), that were reasonably related to the performance of the annual audit of the Service Affiliate, which required pre-approval by the Audit Committee were $0 in 2017 and $0 in 2018.
(c) Tax Fees. The aggregate fees billed in the Reporting Periods for professional services rendered by the Auditor for tax compliance, tax advice, and tax planning ("Tax Services") were $15,900 in 2017 and $13,060 in 2018. These services consisted of review or preparation of U.S. federal, state, local and excise tax returns. The aggregate fees billed in the Reporting Periods for Tax Services by the Auditor to Service Affiliates, which required pre-approval by the Audit Committee were $0 in 2017 and $0 in 2018.
(d) All Other Fees. The aggregate fees billed in the Reporting Periods for products and services provided by the Auditor, other than the services reported in paragraphs (a) through (c) of this Item, were $0 in 2017 and $0 in 2018.
The aggregate fees billed in the Reporting Periods for Non-Audit Services by the Auditor to Service Affiliates, other than the services reported in paragraphs (b) through (c) of this Item, which required pre-approval by the Audit Committee, were $0 in 2017 and $0 in 2018.
(e)(1) Audit Committee Pre-Approval Policies and Procedures. The Registrant's Audit Committee has established policies and procedures (the "Policy") for pre-approval (within specified fee limits) of the Auditor's engagements for non-audit services to the Registrant and Service Affiliates without specific case-by-case consideration. The pre-approved services in the Policy can include pre-approved audit services, pre-approved audit-related services, pre-approved tax services and pre-approved all other services. Pre-approval considerations include whether the proposed services are compatible with maintaining the Auditor's independence. Pre-approvals pursuant to the Policy are considered annually.
(e)(2) Note. None of the services described in paragraphs (b) through (d) of this Item 4 were approved by the Audit Committee pursuant to paragraph (c)(7)(i)(C) of Rule 2-01 of Regulation S-X.
(f) None of the hours expended on the principal accountant's engagement to audit the registrant's financial statements for the most recent fiscal year were attributed to work performed by persons other than the principal account's full-time, permanent employees.
Non-Audit Fees. The aggregate non-audit fees billed by the Auditor for services rendered to the Registrant, and rendered to Service Affiliates, for the Reporting Periods were $20,070,000 in 2017 and $3,635,000 in 2018.
Auditor Independence. The Registrant's Audit Committee has considered whether the provision of non-audit services that were rendered to Service Affiliates, which were not pre-approved (not requiring pre-approval), is compatible with maintaining the Auditor's independence.
Item 5. Audit Committee of Listed Registrants.
Not applicable.
Item 6. Investments.
(a) Not applicable.
Item 7. Disclosure of Proxy Voting Policies and Procedures for Closed-End Management Investment Companies.
Not applicable.
Item 8. Portfolio Managers of Closed-End Management Investment Companies.
Not applicable.
Item 9. Purchases of Equity Securities by Closed-End Management Investment Companies and Affiliated Purchasers.
Not applicable.
Item 10. Submission of Matters to a Vote of Security Holders.
There have been no material changes to the procedures applicable to Item 10.
Item 11. Controls and Procedures.
(a) The Registrant's principal executive and principal financial officers have concluded, based on their evaluation of the Registrant's disclosure controls and procedures as of a date within 90 days of the filing date of this report, that the Registrant's disclosure controls and procedures are reasonably designed to ensure that information required to be disclosed by the Registrant on Form N-CSR is recorded, processed, summarized and reported within the required time periods and that information required to be disclosed by the Registrant in the reports that it files or submits on Form N-CSR is accumulated and communicated to the Registrant's management, including its principal executive and principal financial officers, as appropriate to allow timely decisions regarding required disclosure.
(b) There were no changes to the Registrant's internal control over financial reporting that occurred during the second fiscal quarter of the period covered by this report that have materially affected, or are reasonably likely to materially affect, the Registrant's internal control over financial reporting.
Item 12. Disclosure of Securities Lending Activities for Closed-End Management Investment Companies.
Not applicable.
Item 13. Exhibits.
(a)(1) Code of ethics referred to in Item 2.
(a)(2) Certifications of principal executive and principal financial officers as required by Rule 30a-2(a) under the Investment Company Act of 1940.
(a)(3) Not applicable.
(b) Certification of principal executive and principal financial officers as required by Rule 30a-2(b) under the Investment Company Act of 1940.
SIGNATURES
Pursuant to the requirements of the Securities Exchange Act of 1934 and the Investment Company Act of 1940, the Registrant has duly caused this Report to be signed on its behalf by the undersigned, thereunto duly authorized.
Dreyfus BNY Mellon Funds, Inc.
By: /s/ Bradley J. Skapyak
Bradley J. Skapyak
President
Date: January 2, 2019
Pursuant to the requirements of the Securities Exchange Act of 1934 and the Investment Company Act of 1940, this Report has been signed below by the following persons on behalf of the Registrant and in the capacities and on the dates indicated.
By: /s/ Bradley J. Skapyak
Bradley J. Skapyak
President
Date: January 2, 2019
By: /s/ James Windels
James Windels
Treasurer
Date: January 2, 2019
EXHIBIT INDEX
(a)(1) Code of ethics referred to in Item 2.
(a)(2) Certifications of principal executive and principal financial officers as required by Rule 30a-2(a) under the Investment Company Act of 1940. (EX-99.CERT)
(b) Certification of principal executive and principal financial officers as required by Rule 30a-2(b) under the Investment Company Act of 1940. (EX-99.906CERT)