We are pleased to present this annual report for Dreyfus Yield Enhancement Strategy Fund, covering the 12-month period from November 1, 2015 through October 31, 2016. For information about how the fund performed during the reporting period, as well as general market perspectives, we provide a Discussion of Fund Performance on the pages that follow.
Stocks and bonds generally advanced over the reporting period in the midst of heightened market volatility stemming from various global economic developments. Toward the end of 2015, investor sentiment deteriorated amid sluggish global economic growth, falling commodity prices, and the first increase in short-term U.S. interest rates in nearly a decade. These worries sparked sharp stock market declines in January 2016, but equities began to rally in February when U.S. monetary policymakers refrained from additional rate hikes, other central banks eased their monetary policies further, and commodity prices began to rebound. Stocks generally continued to climb through the summer, driving several broad measures of U.S. stock market performance to record highs in July and August before moderating as a result of uncertainty regarding U.S. elections and potential rate hikes. In the bond market, yields of high-quality sovereign bonds generally moved lower and their prices increased in response to robust investor demand for current income in a low interest rate environment.
The outcome of the U.S. presidential election and ongoing global economic headwinds suggest that uncertainty will persist in the financial markets over the foreseeable future. Some asset classes and industry groups may benefit from a changing economic and political landscape, while others probably will face challenges. Consequently, selectivity could become a more important determinant of investment success. As always, we encourage you to discuss the implications of our observations with your financial advisor.
Thank you for your continued confidence and support.
DISCUSSION OF FUND PERFORMANCE
For the period from November 1, 2015 through October 31, 2016, as provided by Jeffrey M. Mortimer, CFA, and Caroline Lee-Tsao, Portfolio Managers
Market and Fund Performance Overview
For the 12-month period ended October 31, 2016, Dreyfus Yield Enhancement Strategy Fund’s Class A shares produced a total return of 4.98%, Class C shares returned 4.34%, Class I shares returned 5.22%, and Class Y shares returned 5.37%.1 In comparison, the Bloomberg Barclays U.S. Aggregate Bond Index produced a total return of 4.37% for the same period, and the Lipper Alternative Credit Focus Funds Index produced a total return of 2.20% for the same period.2
Bonds generally gained value as interest rates declined and yield differences narrowed along the market’s credit-quality spectrum. Strong contributions from higher yielding corporate and municipal bonds enabled the fund to outperform its benchmarks.
As of August 24, 2016, the fund’s broad-based benchmark, the Barclays U.S. Aggregate Bond Index, was renamed the Bloomberg Barclays U.S. Aggregate Bond Index.
The Fund’s Investment Approach
The fund seeks high current income. The fund is designed to complement and diversify traditional bond portfolios.
To pursue its goal, the fund normally allocates its assets across fixed-income investment strategies using a “fund of funds” approach that apportions assets among other investment companies (underlying funds) employing various fixed income investment strategies, including those focusing on domestic and foreign corporate bonds, high yield securities (“junk” bonds), senior loans, emerging markets debt, municipal securities, and Treasury Inflation-Protected Securities (TIPS).
Dreyfus determines the fund’s asset allocation to the fixed income investment strategies and sets the investment ranges using fundamental and quantitative analysis, and its economic and financial markets outlook. Underlying funds are selected based on their investment objectives and management policies, investment strategies and portfolio holdings, risk/reward profiles, historical performance, and other factors. As of October 31, 2016, the fund held investments in: BNY Mellon Corporate Bond Fund, BNY Mellon Municipal Opportunities Fund, Dreyfus Floating Rate Income Fund, Dreyfus High Yield Fund, Dreyfus Global Dynamic Bond Fund, and Dreyfus Emerging Markets Debt U.S. Dollar Fund.
Robust Investor Demand Supported Bond Prices
Investors grew increasingly averse to risks over the final months of 2015 due to sluggish growth in international markets and a December increase in short-term U.S. interest rates. Riskier fixed-income securities suffered particularly steep declines in January 2016 amid an economic downturn in China, plunging commodity prices, and worries about the potential impact of additional rate hikes on the U.S. economy. In contrast, high quality sovereign and municipal bonds benefited from robust investor demand during the ensuing flight to traditional safe havens.
Investor sentiment began to improve in mid-February in response to better-than-expected U.S. economic data and corporate earnings. Risk appetites continued to expand through the spring when U.S. monetary policymakers refrained from additional rate hikes, commodity prices rebounded, and foreign currencies strengthened against the U.S. dollar. A referendum in the United Kingdom to leave the European Union triggered another flight to quality in late June, sending yields of long-term U.S. Treasury securities to historical lows. However, investor sentiment bounced back quickly, and riskier bond market sectors continued to advance over the summer as global investors sought higher levels of current income than were available in overseas markets.
3
DISCUSSION OF FUND PERFORMANCE (continued)
Higher Yielding Bonds Bolstered Fund Results
In this generally constructive environment, the fund achieved favorable relative results from some of its more aggressive underlying investments. Dreyfus High Yield Fund benefited from an emphasis on corporate bonds with credit ratings at the lower end of the high yield range, more than offsetting relative weakness stemming from relatively light exposure to commodities-related issuers. Likewise, BNY Mellon Municipal Opportunities Fund participated in gains among lower rated holdings, and performance was further buoyed by a relatively long duration posture and favorable credit selections. BNY Mellon Corporate Bond Fund also maintained a constructive duration positioning, which enabled it to capture higher yields and participate more fully in capital gains as longer term interest rates fell.
On the other hand, Dreyfus Opportunistic Fixed Income Fund lagged market averages when weakness among lower rated securities early in the reporting period led it to reduce its exposure to such bonds, preventing the fund from participating more fully in the subsequent rally.
Maintaining a Diversified Portfolio
We currently expect the choppy U.S. economic recovery to continue. While the Federal Reserve Board seems likely to raise short-term interest rates, any increases are likely to be modest, and high-quality bond yields could remain low compared to historical norms. Therefore, we have continued to focus on a diverse array of underlying investments that can provide competitive levels of current income.
During the reporting period, we eliminated the fund’s positon in TCW Emerging Markets Income Fund and redeployed those assets to Dreyfus Emerging Markets Debt U.S. Dollar Fund. In July, we eliminated the fund’s exposure to the underperforming Dreyfus Opportunistic Fixed Income Fund in favor of larger allocations to Dreyfus High Yield Fund and Dreyfus Global Dynamic Bond Fund. In our judgment, these adjustments position the fund well for the prevailing investment climate.
November 15, 2016
Bonds are subject generally to interest-rate, credit, liquidity, and market risks, to varying degrees, all of which are more fully described in the fund’s prospectus. Generally, all other factors being equal, bond prices are inversely related to interest-rate changes, and rate increases can cause price declines.
High yield bonds are subject to increased credit risk and are considered speculative in terms of the issuer’s perceived ability to continue making interest payments on a timely basis and to repay principal upon maturity.
Foreign bonds are subject to special risks including exposure to currency fluctuations, changing political and economic conditions, and potentially less liquidity. These risks are generally greater with emerging market countries than with more economically and politically established foreign countries.
Investments in foreign currencies are subject to the risk that those currencies will decline in value relative to the U.S. dollar, or, in the case of hedged positions, that the U.S. dollar will decline relative to the currency being hedged. Currency rates in foreign countries may fluctuate significantly over short periods of time. A decline in the value of foreign currencies relative to the U.S. dollar will reduce the value of securities held by the fund and denominated in those currencies. The use of leverage may magnify the fund’s gains or losses. For derivatives with a leveraging component, adverse changes in the value or level of the underlying asset can result in a loss that is much greater than the original investment in the derivative.
The underlying fund’s underlying strategies may use derivative instruments, such as options, futures, options on futures, forward contracts, swaps (including credit default swaps on corporate bonds and asset-backed securities), options on swaps, and other credit derivatives. A small investment in derivatives could have a potentially large impact on the fund’s performance. The use of derivatives involves risks different from, or possibly greater than, the risks associated with investing directly in the underlying assets.
The ability of the fund to achieve its investment goal depends, in part, on the ability of Dreyfus to allocate effectively the fund’s assets among the investment strategies and the underlying funds.
1 Total return includes reinvestment of dividends and any capital gains paid, and does not take into consideration the maximum initial sales charge in the case of Class A shares, or the applicable contingent deferred sales charge imposed on redemptions in the case of Class C shares. Had these charges been reflected, returns would have been lower. Class I and Class Y shares are not subject to any initial or deferred sales charges. Share price, yield, and investment return fluctuate such that upon redemption, fund shares may be worth more or less than their original cost. Past performance is no guarantee of future results.
² Source: Lipper Inc. — Reflects reinvestment of dividends and, where applicable, capital gain distributions. The Bloomberg Barclays U.S. Aggregate Bond Index is a widely accepted, unmanaged total return index of corporate, U.S. government and U.S. government-agency debt instruments, mortgage-backed securities, and asset-backed securities with an average maturity of 1-10 years. The Lipper Alternative Credit Focus Funds Index reflects the returns of mutual funds to show how the fund’s performance compares with the returns of mutual funds that, by prospectus language, invest in a wide range of credit-structured vehicles by using either fundamental credit research analysis or quantitative credit portfolio modeling in seeking to benefit from any changes in credit quality, credit spreads, and market liquidity. Investors cannot invest directly in any index.
4
FUND PERFORMANCE
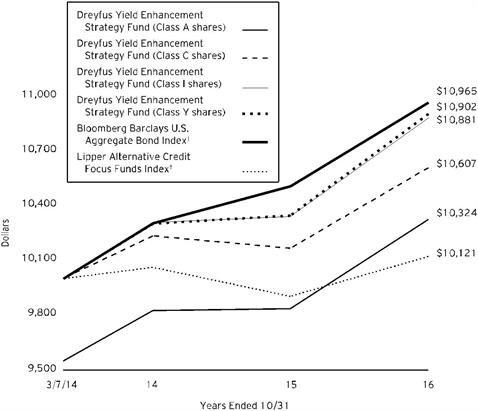
Comparison of change in value of $10,000 investment in Dreyfus Yield Enhancement Strategy Fund Class A shares, Class C shares, Class I shares and Class Y shares, with the Bloomberg Barclays U.S. Aggregate Bond Index and the Lipper Alternative Credit Focus Funds Index
† Source: Lipper Inc.
Past performance is not predictive of future performance.
The above graph compares a $10,000 investment made in each of the Class A, Class C, Class I and Class Y shares of Dreyfus Yield Enhancement Strategy Fund on 3/7/14 (inception date) to a $10,000 investment made in the Bloomberg Barclays U.S. Aggregate Bond Index and the Lipper Alternative Credit Focus Funds Index on that date. All dividends and capital gain distributions are reinvested.
The fund’s performance shown in the line graph above takes into account the maximum initial sales charge on Class A shares and all other applicable fees and expenses on all classes. The Bloomberg Barclays U.S. Aggregate Bond Index is a widely accepted, unmanaged index of corporate, government and government agency debt instruments, mortgage-backed securities and asset-backed securities with an average maturity of 1-10 years. Unlike a mutual fund, the indices are not subject to charges, fees and other expenses. Investors cannot invest directly in any index. The Lipper Alternative Credit Focus Funds Index reflects the returns of mutual funds to show how the fund’s performance compares with the returns of mutual funds that, by prospectus language, invest in a wide-range of credit-structured vehicles by using either fundamental credit research analysis or quantitative credit portfolio modeling in seeking to benefit from any changes in credit quality, credit spreads, and market liquidity. Further information relating to fund performance, including expense reimbursements, if applicable, is contained in the Financial Highlights section of the prospectus and elsewhere in this report.
5
FUND PERFORMANCE (continued)
| | | | | | |
Average Annual Total Returns as of 10/31/16 | | |
| Inception
Date | 1 Year | From
Inception |
Class A shares | | | | |
with maximum sales charge (4.50%) | 3/7/14 | 0.22% | 1.21% | |
without sales charge | 3/7/14 | 4.98% | 2.99% | |
Class C shares | | | | |
with applicable redemption charge † | 3/7/14 | 3.34% | 2.25% | |
without redemption | 3/7/14 | 4.34% | 2.25% | |
Class I shares | 3/7/14 | 5.22% | 3.24% | |
Class Y shares | 3/7/14 | 5.37% | 3.31% | |
Bloomberg Barclays U.S.
Aggregate Bond Index | 2/28/14 | 4.37% | 3.51% | †† |
Lipper Alternative
Credit Focus Funds Index | 2/28/14 | 2.20% | 0.45% | †† |
Past performance is not predictive of future performance. The fund’s performance shown in the graph and table does not reflect the deduction of taxes that a shareholder would pay on fund distributions or the redemption of fund shares. In addition to the performance of Class A shares shown with and without a maximum sales charge, the fund’s performance shown in the table takes into account all other applicable fees and expenses on all classes.
† The maximum contingent deferred sales charge for Class C shares is 1% for shares redeemed within one year of the date of purchase.
†† For comparative purposes, the value of each index on 2/28/14 is used as the beginning value on 3/7/14.
6
UNDERSTANDING YOUR FUND’S EXPENSES (Unaudited)
As a mutual fund investor, you pay ongoing expenses, such as management fees and other expenses. Using the information below, you can estimate how these expenses affect your investment and compare them with the expenses of other funds. You also may pay one-time transaction expenses, including sales charges (loads) and redemption fees, which are not shown in this section and would have resulted in higher total expenses. For more information, see your fund’s prospectus or talk to your financial adviser.
Review your fund’s expenses
The table below shows the expenses you would have paid on a $1,000 investment in Dreyfus Yield Enhancement Strategy Fund from May 1, 2016 to October 31, 2016. It also shows how much a $1,000 investment would be worth at the close of the period, assuming actual returns and expenses.
| | | | | | | | | | | | |
Expenses and Value of a $1,000 Investment | | |
assuming actual returns for the six months ended October 31, 2016 |
| | | | Class A | Class C | Class I | Class Y |
Expenses paid per $1,000† | | $1.64 | | $5.72 | | $.92 | | $.26 |
Ending value (after expenses) | | $1,032.90 | | $1,030.00 | | $1,034.80 | | 1,034.60 |
COMPARING YOUR FUND’S EXPENSES
WITH THOSE OF OTHER FUNDS (Unaudited)
Using the SEC’s method to compare expenses
The Securities and Exchange Commission (SEC) has established guidelines to help investors assess fund expenses. Per these guidelines, the table below shows your fund’s expenses based on a $1,000 investment, assuming a hypothetical 5% annualized return. You can use this information to compare the ongoing expenses (but not transaction expenses or total cost) of investing in the fund with those of other funds. All mutual fund shareholder reports will provide this information to help you make this comparison. Please note that you cannot use this information to estimate your actual ending account balance and expenses paid during the period.
| | | | | | | | | | | | |
Expenses and Value of a $1,000 Investment | | |
assuming a hypothetical 5% annualized return for the six months ended October 31, 2016 |
| | | | Class A | Class C | Class I | Class Y |
Expenses paid per $1,000† | | $1.63 | | $5.69 | | $.92 | | $.25 |
Ending value (after expenses) | | $1,023.53 | | $1,019.51 | | $1,024.23 | | $1,024.89 |
† Expenses are equal to the fund’s annualized expense ratio of .32% for Class A, 1.12% for Class C, .18% for Class I and .05% for Class Y, multiplied by the average account value over the period, multiplied by 184/366 (to reflect the one-half year period).
7
STATEMENT OF INVESTMENTS
October 31, 2016
| | | | | | |
| |
Registered Investment Companies - 99.4% | | Shares | | Value ($) | |
Domestic Fixed Income - 90.8% | | | | | |
BNY Mellon Corporate Bond Fund, Cl. M | | 5,696,099 | a | 74,106,243 | |
BNY Mellon Municipal Opportunities Fund, Cl. M | | 9,333,726 | a,b | 123,671,870 | |
Dreyfus Floating Rate Income Fund, Cl. Y | | 5,474,391 | a | 66,130,641 | |
Dreyfus High Yield Fund, Cl. I | | 19,485,223 | a,b | 120,418,676 | |
| | | | | 384,327,430 | |
Foreign Fixed Income - 8.6% | | | | | |
Dreyfus Emerging Markets Debt U.S. Dollar Fund, Cl. Y | | 950,983 | a | 11,944,351 | |
Dreyfus Global Dynamic Bond Fund, Cl. Y | | 1,974,098 | a | 24,340,633 | |
| | | | | 36,284,984 | |
Total Investments (cost $423,050,280) | | 99.4% | | 420,612,414 | |
Cash and Receivables (Net) | | .6% | | 2,535,114 | |
Net Assets | | 100.0% | | 423,147,528 | |
aInvestment in affiliated mutual fund.
bThe fund's investment in the BNY Mellon Municipal Opportunities Fund and Dreyfus High Yield Fund represents 29.2% and 28.5%, respectively, of the fund's net assets. BNY Mellon Municipal Opportunities Fund seeks to provide total return (consisting of capital appreciation and current income) and Dreyfus High Yield Fund seeks to maximize total return consisting of current income exempt from federal income tax and capital appreciation.
| | |
Portfolio Summary (Unaudited) † | Value (%) |
Mutual Funds: Domestic | 90.8 |
Mutual Funds: Foreign | 8.6 |
| | 99.4 |
† Based on net assets.
See notes to financial statements.
8
STATEMENT OF ASSETS AND LIABILITIES
October 31, 2016
| | | | | | | |
| | | | | | |
| | | Cost | | Value | |
Assets ($): | | | | |
Investments in affliated issuers—See Statement of Investments | | 423,050,280 | | 420,612,414 | |
Cash | | | | | 2,518,880 | |
Receivable for shares of Common Stock subscribed | | | | | 156,166 | |
Prepaid expenses | | | | | 10,220 | |
| | | | | 423,297,680 | |
Liabilities ($): | | | | |
Due to The Dreyfus Corporation and affiliates—Note 3(c) | | | | | 8,201 | |
Payable for shares of Common Stock redeemed | | | | | 89,086 | |
Accrued expenses | | | | | 52,865 | |
| | | | | 150,152 | |
Net Assets ($) | | | 423,147,528 | |
Composition of Net Assets ($): | | | | |
Paid-in capital | | | | | 432,260,372 | |
Accumulated undistributed investment income—net | | | | | 1,151,565 | |
Accumulated net realized gain (loss) on investments | | | | | (7,826,543) | |
Accumulated net unrealized appreciation (depreciation)
on investments | | | | | (2,437,866) | |
Net Assets ($) | | | 423,147,528 | |
| | | | | | |
Net Asset Value Per Share | Class A | Class C | Class I | Class Y | |
Net Assets ($) | 154,610 | 49,642 | 538,234 | 422,405,042 | |
Shares Outstanding | 12,553 | 4,033 | 43,630 | 34,264,669 | |
Net Asset Value Per Share ($) | 12.32 | 12.31 | 12.34 | 12.33 | |
| | | | | | |
See notes to financial statements. | | | | | |
9
STATEMENT OF OPERATIONS
Year Ended October 31, 2016
| | | | | | | |
| | | | | | |
| | | | | | |
Investment Income ($): | | | | |
Income: | | | | |
Cash dividends: | | | | |
Unaffiliated issuers | | | 93,947 | |
Affiliated issuers | | | 16,914,657 | |
Total Income | | | 17,008,604 | |
Expenses: | | | | |
Professional fees | | | 57,712 | |
Registration fees | | | 57,234 | |
Directors’ fees and expenses—Note 3(d) | | | 27,058 | |
Prospectus and shareholders’ reports | | | 9,450 | |
Loan commitment fees—Note 2 | | | 6,266 | |
Custodian fees—Note 3(c) | | | 2,702 | |
Shareholder servicing costs—Note 3(c) | | | 2,158 | |
Distribution fees—Note 3(b) | | | 191 | |
Miscellaneous | | | 17,142 | |
Total Expenses | | | 179,913 | |
Less—reduction in fees due to earnings credits—Note 3(c) | | | (12) | |
Net Expenses | | | 179,901 | |
Investment Income—Net | | | 16,828,703 | |
Realized and Unrealized Gain (Loss) on Investments—Note 4 ($): | | |
Net realized gain (loss) on investments: | | |
Unaffiliated issuers | | | | (2,029,933) | |
Affiliated issuers | | | | (3,300,317) | |
Capital gain distributions from affiliated issuers | 18,997 | |
Net Realized Gain (Loss) | | | (5,311,253) | |
Net unrealized appreciation (depreciation) on investments: | | | | |
Unaffiliated issuers | | | | 1,492,476 | |
Affiliated issuers | | | | 7,085,201 | |
Net Unrealized Appreciation (Depreciation) | | | 8,577,677 | |
Net Realized and Unrealized Gain (Loss) on Investments | | | 3,266,424 | |
Net Increase in Net Assets Resulting from Operations | | 20,095,127 | |
| | | | | | | |
See notes to financial statements. | | | | | |
10
STATEMENT OF CHANGES IN NET ASSETS
| | | | | | | | | | |
| | | | Year Ended October 31, |
| | | | 2016 | | | | 2015 | |
Operations ($): | | | | | | | | |
Investment income—net | | | 16,828,703 | | | | 15,396,721 | |
Net realized gain (loss) on investments | | (5,311,253) | | | | (1,811,234) | |
Net unrealized appreciation (depreciation)
on investments | | 8,577,677 | | | | (12,274,519) | |
Net Increase (Decrease) in Net Assets
Resulting from Operations | 20,095,127 | | | | 1,310,968 | |
Dividends to Shareholders from ($): | | | | | | | | |
Investment income—net: | | | | | | | | |
Class A | | | (20,920) | | | | (9,722) | |
Class C | | | (789) | | | | (718) | |
Class I | | | (14,688) | | | | (13,090) | |
Class Y | | | (16,990,590) | | | | (14,951,061) | |
Total Dividends | | | (17,026,987) | | | | (14,974,591) | |
Capital Stock Transactions ($): | | | | | | | | |
Net proceeds from shares sold: | | | | | | | | |
Class A | | | 105,305 | | | | 525,000 | |
Class C | | | 25,026 | | | | - | |
Class I | | | 1,107,876 | | | | 1,030,666 | |
Class Y | | | 116,164,542 | | | | 157,807,930 | |
Dividends reinvested: | | | | | | | | |
Class A | | | 10,908 | | | | 8,575 | |
Class I | | | 8,685 | | | | 5,666 | |
Class Y | | | 2,099,345 | | | | 1,606,608 | |
Cost of shares redeemed: | | | | | | | | |
Class A | | | (509,838) | | | | (2,012) | |
Class I | | | (839,692) | | | | (964,774) | |
Class Y | | | (107,988,094) | | | | (68,230,098) | |
Increase (Decrease) in Net Assets
from Capital Stock Transactions | 10,184,063 | | | | 91,787,561 | |
Total Increase (Decrease) in Net Assets | 13,252,203 | | | | 78,123,938 | |
Net Assets ($): | | | | | | | | |
Beginning of Period | | | 409,895,325 | | | | 331,771,387 | |
End of Period | | | 423,147,528 | | | | 409,895,325 | |
Undistributed investment income—net | 1,151,565 | | | | 1,349,849 | |
11
STATEMENT OF CHANGES IN NET ASSETS (continued)
| | | | | | | | | | |
| | | | Year Ended October 31, |
| | | | 2016 | | | | 2015 | |
Capital Share Transactions (Shares): | | | | | | | | |
Class A | | | | | | | | |
Shares sold | | | 8,518 | | | | 41,844 | |
Shares issued for dividends reinvested | | | 914 | | | | 696 | |
Shares redeemed | | | (41,417) | | | | (160) | |
Net Increase (Decrease) in Shares Outstanding | (31,985) | | | | 42,380 | |
Class C | | | | | | | | |
Shares sold | | | 2,033 | | | | - | |
Class Ia | | | | | | | | |
Shares sold | | | 91,394 | | | | 83,157 | |
Shares issued for dividends reinvested | | | 716 | | | | 455 | |
Shares redeemed | | | (68,948) | | | | (78,370) | |
Net Increase (Decrease) in Shares Outstanding | 23,162 | | | | 5,242 | |
Class Ya | | | | | | | | |
Shares sold | | | 9,599,105 | | | | 12,659,959 | |
Shares issued for dividends reinvested | | | 173,783 | | | | 129,262 | |
Shares redeemed | | | (9,009,128) | | | | (5,490,173) | |
Net Increase (Decrease) in Shares Outstanding | 763,760 | | | | 7,299,048 | |
| | | | | | | | | | |
a | During the period ended October 31, 2016, 76,679 Class Y shares representing $927,899 were exchanged for 76,599 Class I shares. | |
See notes to financial statements. | | | | | | | | |
12
FINANCIAL HIGHLIGHTS
The following tables describe the performance for each share class for the fiscal periods indicated. All information (except portfolio turnover rate) reflects financial results for a single fund share. Total return shows how much your investment in the fund would have increased (or decreased) during each period, assuming you had reinvested all dividends and distributions. These figures have been derived from the fund’s financial statements.
| | | | | | | | | | |
| | | | | | | | |
| | | | | | |
Class A Shares | | | | Year Ended October 31, |
| | | | 2016 | 2015 | 2014 | a |
Per Share Data ($): | | | | | | | |
Net asset value, beginning of period | | | | 12.21 | 12.65 | 12.50 | |
Investment Operations: | | | | | | | |
Investment income—netb | | | | .50 | .49 | .26 | |
Net realized and unrealized
gain (loss) on investments | | | | .10 | (.48) | .10 | |
Total from Investment Operations | | | | .60 | .01 | .36 | |
Distributions: | | | | | | | |
Dividends from investment income—net | | | | (.49) | (.45) | (.21) | |
Net asset value, end of period | | | | 12.32 | 12.21 | 12.65 | |
Total Return (%)c | | | | 4.98 | .10 | 2.89 | d |
Ratios/Supplemental Data (%): | | | | | | | |
Ratio of total expenses
to average net assetse | | | | .31 | .33 | .91 | f |
Ratio of net expenses
to average net assetse | | | | .31 | .33 | .43 | f |
Ratio of net investment income
to average net assetse | | | | 4.03 | 3.88 | 3.18 | f |
Portfolio Turnover Rate | | | | 16.14 | 17.13 | 14.04 | d |
Net Assets, end of period ($ x 1,000) | | | | 155 | 544 | 27 | |
a From March 7, 2014 (commencement of operations) to October 31, 2014.
b Based on average shares outstanding.
c Exclusive of sales charge.
d Not annualized.
e Amount does not include the expenses of the underlying funds.
f Annualized.
See notes to financial statements.
13
FINANCIAL HIGHLIGHTS (continued)
| | | | | | | | | |
| | | | | | | | | |
| | | | | | | |
Class C Shares | | | | | Year Ended October 31, |
| | | | | 2016 | 2015 | 2014 | a |
Per Share Data ($): | | | | | | | | |
Net asset value, beginning of period | | | | | 12.19 | 12.63 | 12.50 | |
Investment Operations: | | | | | | | | |
Investment income—netb | | | | | .38 | .37 | .20 | |
Net realized and unrealized
gain (loss) on investments | | | | | .13 | (.45) | .09 | |
Total from Investment Operations | | | | | .51 | (.08) | .29 | |
Distributions: | | | | | | | | |
Dividends from investment income—net | | | | | (.39) | (.36) | (.16) | |
Net asset value, end of period | | | | | 12.31 | 12.19 | 12.63 | |
Total Return (%)c | | | | | 4.34 | (.66) | 2.34 | d |
Ratios/Supplemental Data (%): | | | | | | | | |
Ratio of total expenses
to average net assetse | | | | | 1.12 | 1.13 | 1.65 | f |
Ratio of net expenses
to average net assetse | | | | | 1.12 | 1.13 | 1.16 | f |
Ratio of net investment income
to average net assetse | | | | | 3.18 | 2.96 | 2.43 | f |
Portfolio Turnover Rate | | | | | 16.14 | 17.13 | 14.04 | d |
Net Assets, end of period ($ x 1,000) | | | | | 50 | 24 | 25 | |
a From March 7, 2014 (commencement of operations) to October 31, 2014.
b Based on average shares outstanding.
c Exclusive of sales charge.
d Not annualized.
e Amount does not include the expenses of the underlying funds.
f Annualized.
See notes to financial statements.
14
| | | | | | | | | | |
| | | | | | | | |
| | | | | | | |
Class I Shares | | | | | Year Ended October 31, |
| | | | | 2016 | 2015 | 2014 | a |
Per Share Data ($): | | | | | | | | |
Net asset value, beginning of period | | | | | 12.22 | 12.66 | 12.50 | |
Investment Operations: | | | | | | | | |
Investment income—netb | | | | | .48 | .50 | .23 | |
Net realized and unrealized
gain (loss) on investments | | | | | .15 | (.46) | .15 | |
Total from Investment Operations | | | | | .63 | .04 | .38 | |
Distributions: | | | | | | | | |
Dividends from investment income—net | | | | | (.51) | (.48) | (.22) | |
Net asset value, end of period | | | | | 12.34 | 12.22 | 12.66 | |
Total Return (%) | | | | | 5.22 | .33 | 3.08 | c |
Ratios/Supplemental Data (%): | | | | | | | | |
Ratio of total expenses
to average net assetsd | | | | | .19 | .15 | .54 | e |
Ratio of net expenses
to average net assetsd | | | | | .19 | .15 | .15 | e |
Ratio of net investment income
to average net assetsd | | | | | 4.16 | 4.05 | 3.85 | e |
Portfolio Turnover Rate | | | | | 16.14 | 17.13 | 14.04 | c |
Net Assets, end of period ($ x 1,000) | | | | | 538 | 250 | 193 | |
a From March 7, 2014 (commencement of operations) to October 31, 2014.
b Based on average shares outstanding.
c Not annualized.
d Amount does not include the expenses of the underlying funds.
e Annualized.
See notes to financial statements.
15
FINANCIAL HIGHLIGHTS (continued)
| | | | | | | | | | |
| | | | | | | |
| | | | | | |
Class Y Shares | | | | Year Ended October 31, |
| | | | 2016 | 2015 | 2014 | a |
Per Share Data ($): | | | | | | | |
Net asset value, beginning of period | | | | 12.21 | 12.65 | 12.50 | |
Investment Operations: | | | | | | | |
Investment income—netb | | | | .52 | .51 | .29 | |
Net realized and unrealized
gain (loss) on investments | | | | .12 | (.46) | .09 | |
Total from Investment Operations | | | | .64 | .05 | .38 | |
Distributions: | | | | | | | |
Dividends from investment income—net | | | | (.52) | (.49) | (.23) | |
Net asset value, end of period | | | | 12.33 | 12.21 | 12.65 | |
Total Return (%) | | | | 5.37 | .42 | 3.02 | c |
Ratios/Supplemental Data (%): | | | | | | | |
Ratio of total expenses
to average net assetsd | | | | .05 | .06 | .13 | e |
Ratio of net expenses
to average net assetsd | | | | .05 | .06 | .10 | e |
Ratio of net investment income
to average net assetsd | | | | 4.28 | 4.05 | 3.67 | e |
Portfolio Turnover Rate | | | | 16.14 | 17.13 | 14.04 | c |
Net Assets, end of period ($ x 1,000) | | | | | 422,405 | 409,077 | 331,526 | |
a From March 7, 2014 (commencement of operations) to October 31, 2014.
b Based on average shares outstanding.
c Not annualized.
d Amount does not include the expenses of the underlying funds.
e Annualized.
See notes to financial statements.
16
NOTES TO FINANCIAL STATEMENTS
NOTE 1—Significant Accounting Policies:
Dreyfus Yield Enhancement Strategy Fund (the “fund”) is a separate diversified series of Dreyfus BNY Mellon Funds, Inc. (the “Company”), which is registered under the Investment Company Act of 1940, as amended (the “Act”), as an open-end management investment company and operates as a series company currently offering five series, including the fund. The fund’s investment objective is to seek high current income. The Dreyfus Corporation (the “Manager” or “Dreyfus”), a wholly-owned subsidiary of The Bank of New York Mellon Corporation (“BNY Mellon”), serves as the fund’s investment adviser.
MBSC Securities Corporation (the “Distributor”), a wholly-owned subsidiary of Dreyfus, is the distributor of the fund’s shares. The fund is authorized to issue 100 million shares of $.001 par value Common Stock in each of the following classes of shares: Class A, Class C, Class I and Class Y. Class A and Class C shares are sold primarily to retail investors through financial intermediaries and bear Distribution and/or Shareholder Services Plan fees. Class A shares generally are subject to a sales charge imposed at the time of purchase. Class C shares are subject to a contingent deferred sales charge (“CDSC”) imposed on Class C shares redeemed within one year of purchase. Class I shares are sold primarily to bank trust departments and other financial service providers (including The Bank of New York Mellon, a subsidiary of BNY Mellon and an affiliate of Dreyfus, and its affiliates), acting on behalf of customers having a qualified trust or an investment account or relationship at such institution, and bear no Distribution or Shareholder Services Plan fees. Class Y shares are sold at net asset value per share generally to institutional investors, and bear no Distribution or Shareholder Services Plan fees. Class I and Class Y shares are offered without a front-end sales charge or CDSC. Other differences between the classes include the services offered to and the expenses borne by each class, the allocation of certain transfer agency costs, and certain voting rights. Income, expenses (other than expenses attributable to a specific class), and realized and unrealized gains or losses on investments are allocated to each class of shares based on its relative net assets.
As of October 31, 2016, MBC Investments Corp., an indirect subsidiary of BNY Mellon, held 2,000 Class A and Class C shares of the fund.
The Company accounts separately for the assets, liabilities and operations of each series. Expenses directly attributable to each series are charged to that series’ operations; expenses which are applicable to all series are allocated among them on a pro rata basis.
17
NOTES TO FINANCIAL STATEMENTS (continued)
The Financial Accounting Standards Board (“FASB”) Accounting Standards Codification is the exclusive reference of authoritative U.S. generally accepted accounting principles (“GAAP”) recognized by the FASB to be applied by nongovernmental entities. Rules and interpretive releases of the Securities and Exchange Commission (“SEC”) under authority of federal laws are also sources of authoritative GAAP for SEC registrants. The fund’s financial statements are prepared in accordance with GAAP, which may require the use of management estimates and assumptions. Actual results could differ from those estimates.
(a) Portfolio valuation: The fair value of a financial instrument is the amount that would be received to sell an asset or paid to transfer a liability in an orderly transaction between market participants at the measurement date (i.e., the exit price). GAAP establishes a fair value hierarchy that prioritizes the inputs of valuation techniques used to measure fair value. This hierarchy gives the highest priority to unadjusted quoted prices in active markets for identical assets or liabilities (Level 1 measurements) and the lowest priority to unobservable inputs (Level 3 measurements).
Additionally, GAAP provides guidance on determining whether the volume and activity in a market has decreased significantly and whether such a decrease in activity results in transactions that are not orderly. GAAP requires enhanced disclosures around valuation inputs and techniques used during annual and interim periods.
Various inputs are used in determining the value of the fund’s investments relating to fair value measurements. These inputs are summarized in the three broad levels listed below:
Level 1—unadjusted quoted prices in active markets for identical investments.
Level 2—other significant observable inputs (including quoted prices for similar investments, interest rates, prepayment speeds, credit risk, etc.).
Level 3—significant unobservable inputs (including the fund’s own assumptions in determining the fair value of investments).
The inputs or methodology used for valuing securities are not necessarily an indication of the risk associated with investing in those securities.
Investments are valued at the net asset value of each underlying fund determined as of the close of the New York Stock Exchange (generally 4 p.m., Eastern time) on the valuation date and are generally categorized within Level 1 of the fair value hierarchy.
18
The following is a summary of the inputs used as of October 31, 2016 in valuing the fund’s investments:
| | | | | |
Assets ($) | Level 1 - Unadjusted Quoted Prices | Level 2 - Other Significant Observable Inputs | Level 3 - Significant Unobservable Inputs | Total |
Investments in Securities: | | | |
Mutual Funds† | 420,612,414 | - | - | 420,612,414 |
† See Statement of Investments for additional detailed categorizations.
At October 31, 2016, there were no transfers between levels of the fair value hierarchy.
(b) Securities transactions and investment income: Securities transactions are recorded on a trade date basis. Realized gains and losses from securities transactions are recorded on the identified cost basis. Dividend income is recognized on the ex-dividend date and interest income, including, where applicable, accretion of discount and amortization of premium on investments, is recognized on the accrual basis.
(c) Affiliated issuers: Investments in other investment companies advised by Dreyfus are defined as “affiliated” under the Act. Investments in affiliated investment companies during the period ended October 31, 2016 were as follows:
| | | | | | |
Affiliated Investment Company | Value 10/31/2015 ($) | Purchases ($) | † | Sales ($) | Net Realized Gain (Loss) ($) |
BNY Mellon Corporate Bond Fund, Cl. M | 85,393,115 | 9,384,523 | | 22,382,500 | (843,654) |
BNY Mellon Municipal Opportunities Fund, Cl. M | 115,716,405 | 14,384,054 | | 7,857,300 | (90,463) |
Dreyfus Emerging Markets Debt
U.S. Dollar
Fund, Cl. Y | - | 10,893,351 | | 9,490 | (40) |
Dreyfus Floating Rate Income Fund, Cl. Y | 61,473,111 | 8,590,396 | | 3,756,860 | (270,098) |
Dreyfus Global Dynamic Bond Fund, Cl. Y | 12,832,701 | 11,572,944 | | 370,590 | (6,884) |
Dreyfus High Yield Fund, Cl. I | 103,038,054 | 19,283,187 | | 2,554,840 | (327,619) |
Dreyfus Opportunistic Fixed Income Fund, Cl. Y | 12,462,255 | 592,514 | | 11,857,500 | (1,761,559) |
Total | 390,915,641 | 74,700,969 | | 48,789,080 | (3,300,317) |
19
NOTES TO FINANCIAL STATEMENTS (continued)
| | | | | |
Affiliated Investment Company | Change in Net Unrealized Appreciation (Depreciation) ($) | Value
10/31/2016 ($) | Net Assets (%) | Dividends/ Distributions ($) |
BNY Mellon Corporate Bond Fund, Cl. M | 2,554,759 | 74,106,243 | 17.5 | 2,546,393 |
BNY Mellon Municipal Opportunities Fund, Cl. M | 1,519,174 | 123,671,870 | 29.2 | 4,158,606 |
Dreyfus Emerging Markets Debt
U.S. Dollar
Fund, Cl. Y | 1,060,530 | 11,944,351 | 2.8 | 393,901 |
Dreyfus Floating Rate Income Fund, Cl. Y | 94,092 | 66,130,641 | 15.6 | 2,640,985 |
Dreyfus Global Dynamic Bond Fund Cl. Y | 312,462 | 24,340,633 | 5.8 | 292,418 |
Dreyfus High Yield Fund, Cl. I | 979,894 | 120,418,676 | 28.5 | 6,308,837 |
Dreyfus Opportunistic Fixed Income Fund, Cl. Y | 564,290 | - | - | 592,514 |
Total | 7,085,201 | 420,612,414 | 99.4 | 16,933,654 |
† Includes reinvested dividends/distributions.
(d) Dividends to shareholders: Dividends are recorded on the ex-dividend date. Dividends from investment income-net are normally declared and paid on a monthly basis. Dividends from net realized capital gains, if any, are normally declared and paid annually, but the fund may make distributions on a more frequent basis to comply with the distribution requirements of the Internal Revenue Code of 1986, as amended (the “Code”). To the extent that net realized capital gains can be offset by capital loss carryovers, it is the policy of the fund not to distribute such gains. Income and capital gain distributions are determined in accordance with income tax regulations, which may differ from GAAP.
(e) Federal income taxes: It is the policy of the fund to continue to qualify as a regulated investment company, if such qualification is in the best interests of its shareholders, by complying with the applicable provisions of the Code, and to make distributions of taxable income sufficient to relieve it from substantially all federal income and excise taxes.
As of and during the period ended October 31, 2016, the fund did not have any liabilities for any uncertain tax positions. The fund recognizes interest and penalties, if any, related to uncertain tax positions as income
20
tax expense in the Statement of Operations. During the period ended October 31, 2016, the fund did not incur any interest or penalties.
Each tax year in the three-year period ended October 31, 2016 remains subject to examination by the Internal Revenue Service and state taxing authorities.
At October 31, 2016, the components of accumulated earnings on a tax basis were as follows: undistributed ordinary income $1,151,565, accumulated capital losses $6,839,054 and unrealized depreciation $3,425,355.
Under the Regulated Investment Company Modernization Act of 2010, the fund is permitted to carry forward capital losses for an unlimited period. Furthermore, capital loss carryovers retain their character as either short-term or long-term capital losses.
The accumulated capital loss carryover is available for federal income tax purposes to be applied against future net realized capital gains, if any, realized subsequent to October 31, 2016. The fund has $2,619,190 of short-term capital losses and $4,219,864 of long-term capital losses which can be carried forward for an unlimited period.
The tax character of distributions paid to shareholders during the fiscal periods ended October 31, 2016 and October 31, 2015 were as follows: ordinary income $12,912,367 and $11,295,569, and tax-exempt income $4,114,620 and $3,679,022, respectively.
NOTE 2—Bank Lines of Credit:
The fund participates with other Dreyfus-managed funds in a $810 million unsecured credit facility led by Citibank, N.A. and a $300 million unsecured credit facility provided by The Bank of New York Mellon (each, a “Facility”), each to be utilized primarily for temporary or emergency purposes, including the financing of redemptions. Prior to October 5, 2016, the unsecured credit facility with Citibank, N.A. was $555 million and prior to January 11, 2016, the unsecured credit facility with Citibank, N.A. was $480 million. In connection therewith, the fund has agreed to pay its pro rata portion of commitment fees for each Facility. Interest is charged to the fund based on rates determined pursuant to the terms of the respective Facility at the time of borrowing. During the period ended October 31, 2016, the fund did not borrow under the Facilities.
21
NOTES TO FINANCIAL STATEMENTS (continued)
NOTE 3—Management Fee and Other Transactions with Affiliates:
(a) Pursuant to a management agreement with Dreyfus, there is no management fee paid to Dreyfus. The fund invests in other affiliated mutual funds advised by Dreyfus. All fees and expenses of the underlying funds are reflected in the underlying fund’s net asset value. Dreyfus had contractually agreed, from November 1, 2015 through March 1, 2016, to assume the direct expenses of the fund so that the expenses of none of the classes (excluding Rule 12b-1 Distribution Plan fees, Shareholder Services Plan fees, acquired fund fees and expenses incurred by underlying funds, taxes, interest expense, brokerage commissions, commitment fees on borrowings and extraordinary expenses) exceeded .30% of the value of the fund’s average daily net assets. During the period ended October 31, 2016, there was no reduction in management fee, pursuant to the undertaking.
(b) Under the Distribution Plan adopted pursuant to Rule 12b-1 under the Act, Class C shares pay the Distributor for distributing its shares at an annual rate of .75% of the value of its average daily net assets. During the period ended October 31, 2016, Class C shares were charged $191 pursuant to the Distribution Plan.
(c) Under the Shareholder Services Plan, Class A and Class C shares pay the Distributor at an annual rate of .25% of the value of their average daily net assets for the provision of certain services. The services provided may include personal services relating to shareholder accounts, such as answering shareholder inquiries regarding the fund and providing reports and other information, and services related to the maintenance of shareholder accounts. The Distributor may make payments to Service Agents (securities dealers, financial institutions or other industry professionals) with respect to these services. The Distributor determines the amounts to be paid to Service Agents. During the period ended October 31, 2016, Class A and Class C shares were charged $1,250 and $64, respectively, pursuant to the Shareholder Services Plan.
Under its terms, the Distribution Plan and Shareholder Services Plan shall remain in effect from year to year, provided such continuance is approved annually by a vote of a majority of those Directors who are not “interested persons” of the Company and who have no direct or indirect financial interest in the operation of or in any agreement related to the Distribution Plan or Shareholder Services Plan.
The fund has arrangements with the transfer agent and the custodian whereby the fund may receive earnings credits when positive cash balances are maintained, which are used to offset transfer agency and custody fees.
22
For financial reporting purposes, the fund includes net earnings credits as an expense offset in the Statement of Operations.
The fund compensates Dreyfus Transfer, Inc., a wholly-owned subsidiary of Dreyfus, under a transfer agency agreement for providing transfer agency and cash management services for the fund. The majority of transfer agency fees are comprised of amounts paid on a per account basis, while cash management fees are related to fund subscriptions and redemptions. During the period ended October 31, 2016, the fund was charged $749 for transfer agency services and $28 for cash management services. These fees are included in Shareholder servicing costs in the Statement of Operations. Cash management fees were partially offset by earnings credits of $12.
The fund compensates The Bank of New York Mellon under a custody agreement for providing custodial services for the fund. These fees are determined based on net assets, geographic region and transaction activity. During the period ended October 31, 2016, the fund was charged $2,702 pursuant to the custody agreement.
During the period ended October 31, 2016, the fund was charged $9,804 for services performed by the Chief Compliance Officer and his staff.
The components of “Due to The Dreyfus Corporation and affiliates” in the Statement of Assets and Liabilities consist of: Distribution Plan fees $25, Shareholder Services Plan fees $41, custodian fees $2,288, Chief Compliance Officer fees $5,688 and transfer agency fees $159.
(d) Each Board member also serves as a Board member of other funds within the Dreyfus complex. Annual retainer fees and attendance fees are allocated to each fund based on net assets.
NOTE 4—Securities Transactions:
The aggregate amount of purchases and sales of investment securities, excluding short-term securities, during the period ended October 31, 2016, amounted to $74,795,152 and $63,313,365, respectively.
At October 31, 2016, the cost of investments for federal income tax purposes was $424,037,769; accordingly, accumulated net unrealized depreciation on investments was $3,425,355, consisting of $5,265,241 gross unrealized appreciation and $8,690,596 gross unrealized depreciation.
23
REPORT OF INDEPENDENT REGISTERED
PUBLIC ACCOUNTING FIRM
The Board of Trustees and Shareholders of
Dreyfus BNY Mellon Funds, Inc.
We have audited the accompanying statement of assets and liabilities of Dreyfus Yield Enhancement Strategy Fund (the “Fund”), a series of Dreyfus BNY Mellon Funds, Inc., including the statement of investments, as of October 31, 2016, and the related statement of operations for the year then ended, the statements of changes in net assets for each of the years in the two-year period then ended, and the financial highlights for each of the years or periods in the three-year period then ended. These financial statements and financial highlights are the responsibility of the Fund’s management. Our responsibility is to express an opinion on these financial statements and financial highlights based on our audits.
We conducted our audits in accordance with the standards of the Public Company Accounting Oversight Board (United States). Those standards require that we plan and perform the audit to obtain reasonable assurance about whether the financial statements and financial highlights are free of material misstatement. An audit includes examining, on a test basis, evidence supporting the amounts and disclosures in the financial statements. Our procedures included confirmation of securities owned as of October 31, 2016, by correspondence with the custodian and brokers or by other appropriate auditing procedures. An audit also includes assessing the accounting principles used and significant estimates made by management, as well as evaluating the overall financial statement presentation. We believe that our audits provide a reasonable basis for our opinion.
In our opinion, the financial statements and financial highlights referred to above present fairly, in all material respects, the financial position of Dreyfus Yield Enhancement Strategy Fund as of October 31, 2016, and the results of its operations for the year then ended, the changes in its net assets for each of the years in the two-year period then ended, and the financial highlights for each of the years or periods in the three-year period then ended, in conformity with U.S. generally accepted accounting principles.

New York, New York
December 29, 2016
24
IMPORTANT TAX INFORMATION (Unaudited)
For federal tax purposes, the fund reports the maximum amount allowable, but not less than $12,912,367 as ordinary income dividends paid during the year ended October 31, 2016 as qualified dividend income in accordance with Section 854(b)(1)(B) of the Internal Revenue Code. Also, the fund reports the maximum amount allowable but not less than 100% of ordinary income dividends paid during the year ended October 31, 2016 as eligible for the corporate dividends received deduction provided under Section 243 of the Internal Revenue Code in accordance with Section 854(b)(1)(A) of the Internal Revenue Code. Shareholders will receive notification in early 2017 of the percentage applicable to the preparation of their 2016 income tax returns. Also, in accordance with federal tax law, the fund hereby reports $4,114,620 as “exempt-interest dividends paid” during its fiscal year ended October 31, 2016. Where required by federal tax law rules, shareholders will receive notification of their portion of the fund’s tax-exempt dividends paid for the 2016 calendar year on Form 1099-DIV, which will be mailed in early 2017.
25
BOARD MEMBERS INFORMATION (Unaudited)
INDEPENDENT BOARD MEMBERS
Joseph S. DiMartino (73)
Chairman of the Board (1999)
Principal Occupation During Past 5 Years:
· Corporate Director and Trustee (1995-present)
Other Public Company Board Memberships During Past 5 Years:
· CBIZ (formerly, Century Business Services, Inc.), a provider of outsourcing functions for small and medium size companies, Director (1997-present)
No. of Portfolios for which Board Member Serves: 135
———————
Francine J. Bovich (65)
Board Member (2012)
Principal Occupation During Past 5 Years:
· Trustee, The Bradley Trusts, private trust funds (2011-present)
Other Public Company Board Memberships During Past 5 Years:
· Annaly Capital Management, Inc., Board Member (May 2014-present)
No. of Portfolios for which Board Member Serves: 76
———————
Kenneth A. Himmel (70)
Board Member (1994)
Principal Occupation During Past 5 Years:
· Managing Partner, Gulf Related, an international real estate development company (2010-present)
· President and CEO, Related Urban Development, a real estate development company (1996-present)
· President and CEO, Himmel & Company, a real estate development company (1980-present)
· CEO, American Food Management, a restaurant company (1983-present)
No. of Portfolios for which Board Member Serves: 28
———————
26
Stephen J. Lockwood (69)
Board Member (1994)
Principal Occupation During Past 5 Years:
· Chairman of the Board, Stephen J. Lockwood and Company LLC, a real estate investment company (2000-present)
No. of Portfolios for which Board Member Serves: 28
———————
Roslyn M. Watson (67)
Board Member (1994)
Principal Occupation During Past 5 Years:
· Principal, Watson Ventures, Inc., a real estate investment company (1993-present)
No. of Portfolios for which Board Member Serves: 62
———————
Benaree Pratt Wiley (70)
Board Member (1998)
Principal Occupation During Past 5 Years:
· Principal, The Wiley Group, a firm specializing in strategy and business development (2005-present)
Other Public Company Board Memberships During Past 5 Years:
· CBIZ (formerly, Century Business Services, Inc.), a provider of outsourcing functions for small and medium size companies, Director (2008-present)
No. of Portfolios for which Board Member Serves: 86
———————
Once elected all Board Members serve for an indefinite term, but achieve Emeritus status upon reaching age 80. The address of the Board Members and Officers is c/o The Dreyfus Corporation, 200 Park Avenue, New York, New York 10166. Additional information about the Board Members is available in the fund’s Statement of Additional Information which can be obtained from Dreyfus free of charge by calling this toll free number: 1-800-DREYFUS.
James M. Fitzgibbons, Emeritus Board Member
27
OFFICERS OF THE FUND (Unaudited)
BRADLEY J. SKAPYAK, President since January 2010.
Chief Operating Officer and a director of the Manager since June 2009, Chairman of Dreyfus Transfer, Inc., an affiliate of the Manager and the transfer agent of the funds, since May 2011 and Executive Vice President of the Distributor since June 2007. From April 2003 to June 2009, Mr. Skapyak was the head of the Investment Accounting and Support Department of the Manager. He is an officer of 64 investment companies (comprised of 135 portfolios) managed by the Manager. He is 57 years old and has been an employee of the Manager since February 1988.
BENNETT A. MACDOUGALL, Chief Legal Officer since October 2015.
Chief Legal Officer of the Manager since June 2015; from June 2005 to June 2015, he served in various capacities with Deutsche Bank – Asset & Wealth Management Division, including as Director and Associate General Counsel, and Chief Legal Officer of Deutsche Investment Management Americas Inc. from June 2012 to May 2015. He is an officer of 65 investment companies (comprised of 160 portfolios) managed by the Manager. He is 45 years old and has been an employee of the Manager since June 2015.
JANETTE E. FARRAGHER, Vice President and Secretary since December 2011.
Assistant General Counsel of BNY Mellon, and an officer of 65 investment companies (comprised of 160 portfolios) managed by the Manager. She is 53 years old and has been an employee of the Manager since February 1984.
JAMES BITETTO, Vice President and Assistant Secretary since August 2005.
Managing Counsel of BNY Mellon and Secretary of the Manager, and an officer of 65 investment companies (comprised of 160 portfolios) managed by the Manager. He is 50 years old and has been an employee of the Manager since December 1996.
JONI LACKS CHARATAN, Vice President and Assistant Secretary since August 2005.
Managing Counsel of BNY Mellon, and an officer of 65 investment companies (comprised of 160 portfolios) managed by the Manager. She is 60 years old and has been an employee of the Manager since October 1988.
JOSEPH M. CHIOFFI, Vice President and Assistant Secretary since August 2005.
Managing Counsel of BNY Mellon, and an officer of 65 investment companies (comprised of 160 portfolios) managed by the Manager. He is 54 years old and has been an employee of the Manager since June 2000.
MAUREEN E. KANE, Vice President and Assistant Secretary since April 2015.
Managing Counsel of BNY Mellon since July 2014; from October 2004 until July 2014, General Counsel, and from May 2009 until July 2014, Chief Compliance Officer of Century Capital Management. She is an officer of 65 investment companies (comprised of 160 portfolios) managed by the Manager. She is 54 years old and has been an employee of the Manager since July 2014.
SARAH S. KELLEHER, Vice President and Assistant Secretary since April 2014.
Senior Counsel of BNY Mellon, and an officer of 65 investment companies (comprised of 160 portfolios) managed by the Manager; from August 2005 to March 2013, Associate General Counsel of Third Avenue Management. She is 41 years old and has been an employee of the Manager since March 2013.
JEFF PRUSNOFSKY, Vice President and Assistant Secretary since August 2005.
Senior Managing Counsel of BNY Mellon, and an officer of 65 investment companies (comprised of 160 portfolios) managed by the Manager. He is 51 years old and has been an employee of the Manager since October 1990.
JAMES WINDELS, Treasurer since November 2001.
Director – Mutual Fund Accounting of the Manager, and an officer of 65 investment companies (comprised of 160 portfolios) managed by the Manager. He is 58 years old and has been an employee of the Manager since April 1985.
RICHARD CASSARO, Assistant Treasurer since January 2008.
Senior Accounting Manager – Money Market, Municipal Bond and Equity Funds of the Manager, and an officer of 65 investment companies (comprised of 160 portfolios) managed by the Manager. He is 57 years old and has been an employee of the Manager since September 1982.
28
GAVIN C. REILLY, Assistant Treasurer since December 2005.
Tax Manager of the Investment Accounting and Support Department of the Manager, and an officer of 65 investment companies (comprised of 160 portfolios) managed by the Manager. He is 48 years old and has been an employee of the Manager since April 1991.
ROBERT S. ROBOL, Assistant Treasurer since December 2002.
Senior Accounting Manager of the Manager, and an officer of 65 investment companies (comprised of 160 portfolios) managed by the Manager. He is 52 years old and has been an employee of the Manager since October 1988.
ROBERT SALVIOLO, Assistant Treasurer since July 2007.
Senior Accounting Manager – Equity Funds of the Manager, and an officer of 65 investment companies (comprised of 160 portfolios) managed by the Manager. He is 49 years old and has been an employee of the Manager since June 1989.
ROBERT SVAGNA, Assistant Treasurer since July 2007.
Senior Accounting Manager – Fixed Income and Equity Funds of the Manager, and an officer of 65 investment companies (comprised of 160 portfolios) managed by the Manager. He is 49 years old and has been an employee of the Manager since November 1990.
JOSEPH W. CONNOLLY, Chief Compliance Officer since October 2004.
Chief Compliance Officer of the Manager and The Dreyfus Family of Funds (65 investment companies, comprised of 160 portfolios). He is 59 years old and has served in various capacities with the Manager since 1980, including manager of the firm’s Fund Accounting Department from 1997 through October 2001.
CARIDAD M. CAROSELLA, Anti-Money Laundering Compliance Officer since January 2016
Anti-Money Laundering Compliance Officer of the Dreyfus Family of Funds and BNY Mellon Funds Trust since January 2016; from May 2015 to December 2015, Interim Anti-Money Laundering Compliance Officer of the Dreyfus Family of Funds and BNY Mellon Funds Trust and the Distributor; from January 2012 to May 2015, AML Surveillance Officer of the Distributor and from 2007 to December 2011, Financial Processing Manager of the Distributor. She is an officer of 60 investment companies (comprised of 155 portfolios) managed by the Manager. She is 48 years old and has been an employee of the Distributor since 1997.
29
Dreyfus Yield Enhancement Strategy Fund
200 Park Avenue
New York, NY 10166
Manager
The Dreyfus Corporation
200 Park Avenue
New York, NY 10166
Custodian
The Bank of New York Mellon
225 Liberty Street
New York, NY 10286
Transfer Agent &
Dividend Disbursing Agent
Dreyfus Transfer, Inc.
200 Park Avenue
New York, NY 10166
Distributor
MBSC Securities Corporation
200 Park Avenue
New York, NY 10166
| | |
Ticker Symbols: | Class A: DABMX Class C: DABLX Class I: DABKX Class Y: DABJX |
Telephone Call your financial representative or 1-800-DREYFUS
Mail The Dreyfus Family of Funds, 144 Glenn Curtiss Boulevard, Uniondale, NY 11556-0144
E-mail Send your request to info@dreyfus.com
Internet Information can be viewed online or downloaded at www.dreyfus.com
The fund files its complete schedule of portfolio holdings with the Securities and Exchange Commission (“SEC”) for the first and third quarters of each fiscal year on Form N-Q. The fund’s Forms N-Q are available on the SEC’s website at www.sec.gov and may be reviewed and copied at the SEC’s Public Reference Room in Washington, DC. (phone 1-800-SEC-0330 for information).
A description of the policies and procedures that the fund uses to determine how to vote proxies relating to portfolio securities and information regarding how the fund voted these proxies for the most recent 12-month period ended June 30 is available at www.dreyfus.com and on the SEC’s website at www.sec.gov and without charge, upon request, by calling 1-800-DREYFUS.
| | |
© 2016 MBSC Securities Corporation
6327AR1016 | 
|