UNITED STATES
SECURITIES AND EXCHANGE COMMISSION
Washington, D.C. 20549
FORM N-CSR
CERTIFIED SHAREHOLDER REPORT OF REGISTERED MANAGEMENT
INVESTMENT COMPANIES
Investment Company Act file number | 811-22912 |
| |
| Dreyfus BNY Mellon Funds, Inc. | |
| (Exact name of Registrant as specified in charter) | |
| | |
| c/o The Dreyfus Corporation 200 Park Avenue New York, New York 10166 | |
| (Address of principal executive offices) (Zip code) | |
| | |
| Bennett A. MacDougall, Esq. 200 Park Avenue New York, New York 10166 | |
| (Name and address of agent for service) | |
|
Registrant's telephone number, including area code: | (212) 922-6000 |
| |
Date of fiscal year end: | 10/31 | |
Date of reporting period: | 10/31/15 | |
| | | | | | | |
The following N-CSR relates only to the Registrant’s series listed below and does not affect the other series of the Registrant, which has a different fiscal year end and, therefore, different N-CSR reporting requirement. A separate N-CSR will be filed for those series, as appropriate.
Dreyfus Alternative Diversifier Strategies Fund
Dreyfus Emerging Markets Debt U.S. Dollar Fund
Dreyfus Global Emerging Markets Fund
Dreyfus Select Managers Long/Short Fund
Dreyfus Yield Enhancement Strategy Fund
FORM N-CSR
Item 1. Reports to Stockholders.
Dreyfus Alternative Diversifier Strategies Fund
| | | |

| | ANNUAL REPORT October 31, 2015 |
| |
Save time. Save paper. View your next shareholder report online as soon as it’s available. Log into www.dreyfus.com and sign up for Dreyfus eCommunications. It’s simple and only takes a few minutes. |
| |
The views expressed in this report reflect those of the portfolio manager only through the end of the period covered and do not necessarily represent the views of Dreyfus or any other person in the Dreyfus organization. Any such views are subject to change at any time based upon market or other conditions and Dreyfus disclaims any responsibility to update such views. These views may not be relied on as investment advice and, because investment decisions for a Dreyfus fund are based on numerous factors, may not be relied on as an indication of trading intent on behalf of any Dreyfus fund. |
| |
Not FDIC-Insured • Not Bank-Guaranteed • May Lose Value |
Contents
T H E F U N D
F O R M O R E I N F O R M AT I O N
Back Cover
| | | | |
| |
Dreyfus Alternative Diversifier Strategies Fund
| | The Fund |
A LETTER FROM THE PRESIDENT
Dear Shareholder:
We are pleased to present this annual report for Dreyfus Alternative Diversifier Strategies Fund, covering the 12-month period from November 1, 2014, through October 31, 2015. For information about how the fund performed during the reporting period, as well as general market perspectives, we provide a Discussion of Fund Performance on the pages that follow.
Financial markets proved volatile over the reporting period amid choppy U.S. and global economic growth. U.S. stocks advanced over the final months of 2014 and the spring of 2015, with some broad measures of market performance setting new record highs. Those gains were largely erased over the summer when global economic instability undermined investor sentiment, but a renewed rally in October enabled most broad stock indices to end the reporting period in positive territory. In contrast, international stocks generally lost a degree of value, with developed markets faring far better than emerging markets amid falling commodity prices and depreciating currency values. U.S. bonds generally produced modestly positive total returns, with municipal bonds and longer term U.S. government securities faring better, on average, than corporate-backed bonds.
We expect market volatility to persist over the near term until investors see greater clarity regarding short-term U.S. interest rates and global economic conditions. Our investment strategists and portfolio managers are monitoring developments carefully, keeping a close watch on credit spreads, currency values, commodity prices, corporate profits, economic trends in the emerging markets, and other developments that could influence investor sentiment. Over the longer term, we remain confident that markets are likely to benefit as investors increasingly recognize that inflation is likely to stay low, economic growth expectations are stabilizing, and monetary policies remain accommodative in most regions of the world. In our view, investors will continue to be well served under these circumstances by a long-term perspective and a disciplined investment approach.
Thank you for your continued confidence and support.
Sincerely,

J. Charles Cardona
President
The Dreyfus Corporation
November 16, 2015
2
DISCUSSION OF FUND PERFORMANCE
For the period of November 1, 2014, through October 31, 2015, as provided by Jeffrey M. Mortimer, CFA, Portfolio Manager
Fund and Market Performance Overview
For the 12-month period ended October 31, 2015, Dreyfus Alternative Diversifier Strategies Fund’s Class A shares produced a total return of 0.29%, Class C shares returned –0.37%, Class I shares returned 0.45%, and Class Y shares returned 0.82%.1 In comparison, the Standard & Poor’s® 500 Composite Stock Price Index (“S&P 500 Index”) returned 5.21%, and the Barclays U.S. Aggregate Index returned 1.96% for the same period.2 The Hybrid Index, which reflects a 50%/50% blend of the S&P 500 Index and the Barclays U.S. Aggregate Index, returned 3.92% for that period. 3
Financial markets encountered heightened volatility during the reporting period amid shifting global economic sentiment. The fund lagged the Hybrid Index, mainly due to its exposure to falling commodity prices.
The Fund’s Investment Approach
The fund seeks long-term capital appreciation. To pursue its goal, the fund normally allocates its assets across non-traditional or “alternative” asset classes and investment strategies. The fund is designed to complement and diversify traditional stock and bond portfolios. The fund uses a “fund of funds” approach in which we allocate assets among other investment companies (the underlying funds) that invest in asset classes and investment strategies that typically have had a low correlation to each other and to traditional equity and fixed-income asset classes. We currently intend to allocate the fund’s assets among underlying funds that employ the following alternative investment strategies: long/short equity strategies, absolute return hedge strategies, real estate-related strategies, commodities strategies, global macro strategies, and managed futures strategies.
As of October 31, 2015, the fund held positions in nine underlying funds: AQR Managed Futures Strategy Fund, ASG Global Alternatives Fund, ASG Managed Futures Strategy Fund, DFA Commodity Strategy Portfolio, Dynamic Total Return Fund, Dreyfus Research Long/Short Equity Fund, Dreyfus Select Managers Long/Short Fund, Dreyfus Global Real Estate Securities Fund, and Dreyfus Global Real Return Fund.
Shifting Economic Sentiment Sparked Market Turmoil
Financial markets encountered heightened volatility throughout the reporting period. A U.S. stock market rally over the first several months of the reporting period was sparked by employment gains and improved consumer and business sentiment. In contrast, investors responded negatively in March to sluggish domestic economic growth stemming in part from severe winter weather. The economy regained traction in the spring, and stocks resumed their advance until a debt crisis in Greece and slowing economic growth in China again sent U.S. stock prices lower over the summer, but a strong rebound in October enabled the S&P 500 Index to end the reporting period with a moderate gain.
In the U.S. bond market, aggressively accommodative monetary policies in Europe and Japan triggered robust demand for U.S. government securities from global investors, sending longer term yields lower through the end of 2014. In the spring of 2015, a strengthening
3
DISCUSSION OF FUND PERFORMANCE (continued)
domestic economy sent bond yields higher, erasing previous price gains. However, renewed worries over the summer about economic instability in China caused yields to fall again, and the Barclays U.S. Aggregate Index ended the reporting period in positive territory.
An appreciating U.S. dollar undermined returns from international investments for U.S. residents. Moreover, stocks and bonds in the emerging markets lost considerable value amid economic instability and declining commodity prices.
Alternative Investments Produced Mixed Results
The fund’s various underlying strategies produced divergent results in this environment. Most notably, relative performance was undermined by modest exposure to struggling commodity markets through DFA Commodity Strategy Portfolio. In addition, Dreyfus Research Long/Short Equity Fund experienced shortfalls in the financials sector.
The fund achieved better relative results from ASG Managed Futures Strategy Fund, which benefited from long positions among fixed-income securities and short positions among commodities and emerging-markets currencies. AQR Managed Futures Strategy Fund also fared well. Finally, Dreyfus Select Managers Long/Short Fund successfully established short positions among biotechnology companies in the health care sector and oil-and-gas producers in the energy sector.
Positioned for Continued Market Volatility
We expect market volatility to persist due to uncertain global economic conditions, upcoming short-term interest-rate hikes in the United States, and a strong U.S. dollar. Still, the U.S. economy has continued to grow, inflation has remained low, and aggressively accommodative monetary policies have set the stage for recoveries in several international markets.
In our judgment, the fund’s diversifier strategies can help mitigate the impact of market volatility on more traditional investments. In anticipation of further market turbulence, we recently made several adjustments to the fund’s allocations. We reduced the fund’s exposure to Dreyfus Select Managers Long/Short Fund, Dreyfus Global Real Return Fund, and Dreyfus Dynamic Total Return Fund. We reallocated those assets to increased positions in AQR Managed Futures Strategy Fund, ASG Global Alternatives Fund, and ASG Managed Futures Strategy Fund. In our view, these changes position the fund appropriately for the foreseeable future, and we remain prepared to readjust the fund’s allocations as circumstances warrant.
November 16, 2015
Equity securities are subject generally to market, market sector, market liquidity, issuer, and investment style risks, among other factors, to varying degrees, all of which are more fully described in the fund’s prospectus. Bond securities are subject generally to interest rate, credit, liquidity, call, sector, and market risks, to varying degrees, all of which are more fully described in the fund’s prospectus.
Investing internationally involves special risks, including changes in currency exchange rates, political, economic, and social instability, a lack of comprehensive company information, differing auditing and legal standards, and less market liquidity. These risks generally are greater with emerging market countries than with more economically and politically established foreign countries.
Short sales involve selling a security the fund does not own in anticipation that the security’s price will decline. Short sales may involve substantial risk and leverage, and expose the fund to the risk that it will be required to buy the security sold short at a time when the security has appreciated in value, thus resulting in a loss to the fund. Short positions in stocks involve more risk than long positions in stocks because the maximum sustainable loss on a stock purchased is limited to the amount paid for the stock plus the transaction costs, whereas there is no maximum attainable price on the shorted stock. In theory, stocks sold short have unlimited risk. It is
4
possible that the market value of securities the fund holds in long positions will decline at the same time that the market value of the securities in the fund has sold short increases, thereby increasing the fund’s potential volatility. Leveraging occurs when the fund increases its assets available for investment using borrowing or similar transactions. Short sales effectively leverage the fund’s assets. The use of leverage may magnify the fund’s gains or losses.
Exposure to the commodities markets may subject the fund to greater volatility than investments in traditional securities. The values of commodities and commodity-linked investments are affected by events that might have less impact on the values of stocks and bonds. Investments linked to the prices of commodities are considered speculative. Prices of commodities and related contracts may fluctuate significantly over short periods for a variety of factors.
1 Total return includes reinvestment of dividends and any capital gains paid, and does not take into consideration the maximum initial sales charge in the case of Class A shares, or the applicable contingent deferred sales charge imposed on redemptions in the case of Class C shares. Had these charges been reflected, returns would have been lower. Past performance is no guarantee of future results. Share price, yield, and investment return fluctuate such that upon redemption, fund shares may be worth more or less than their original cost. Return figures provided reflect the absorption of certain fund expenses pursuant to an agreement by The Dreyfus Corporation in effect until March 1, 2016, at which time it may be extended, terminated, or modified. Had these expenses not been absorbed, the fund’s returns would have been lower.
² SOURCE: Lipper Inc. — Reflects reinvestment of dividends and, where applicable, capital gain distributions. The Standard & Poor’s 500 Composite Stock Price Index is a widely accepted, unmanaged index of U.S. stock market performance. Investors cannot invest directly in any index. The Barclays U.S. Aggregate Index is a widely accepted, unmanaged total return index of corporate, U.S. government and U.S. government agency debt instruments, mortgage-backed securities, and asset-backed securities with an average maturity of 1-10 years. Investors cannot invest directly in any index.
3 SOURCE: FactSet — Reflects reinvestment of dividends and, where applicable, capital gain distributions. The Hybrid Index reflects a 50/50 blend of the Standard & Poor’s 500 Composite Index and the Barclays U.S. Aggregate Index. Investors cannot invest directly in any index.
5
FUND PERFORMANCE

Comparison of change in value of $10,000 investment in Dreyfus Alternative Diversifier Strategies Fund Class A shares, Class C shares, Class I shares, and Class Y shares, with Standard & Poor’s 500 Composite Price Index, the Hybrid Index and Barclays U.S. Aggregate Index
† Source: Lipper Inc.
†† Source: Factset.
Past performance is not predictive of future performance.
The above graph compares a $10,000 investment made in each of the Class A, Class C, Class I and Class Y shares of Dreyfus Alternative Diversifier Strategies Fund on 3/31/14 (inception date) to a $10,000 investment made in the Standard & Poor’s 500 Composite Stock Price Index (the “S&P 500 Index”) as well as to a Hybrid Index reflecting a 50/50 blend of the Standard & Poor’s 500 Composite Stock Price Index and the Barclays U.S. Aggregate Index (the “Barclays Index”) on that date. All dividends and capital gain distributions are reinvested.
The fund’s performance shown in the line graph above takes into account the maximum initial sales charge on Class A shares and all other applicable fees and expenses on all classes. The S&P 500 Index is a widely accepted, unmanaged index of U.S. stock market performance. The Barclays Index is a widely accepted, unmanaged index of corporate, government and government agency debt instruments, mortgage-backed securities and asset-backed securities with an average maturity of 1-10 years. Unlike a mutual fund, the indices are not subject to charges, fees and other expenses. Investors cannot invest directly in any index. Further information relating to fund performance, including expense reimbursements, if applicable, is contained in the Financial Highlights section of the prospectus and elsewhere in this report.
6
| | | | |
Average Annual Total Returns as of 10/31/15 |
| | Inception Date | 1 Year | From Inception |
|
Class A shares | | | |
with maximum sales charge (5.75%) | 3/31/14 | -5.46% | -2.65% |
without sales charge | 3/31/14 | 0.29% | 1.03% |
Class C shares | | | |
with applicable redemption charge † | 3/31/14 | -1.36% | 0.47% |
without redemption | 3/31/14 | -0.37% | 0.47% |
Class I shares | 3/31/14 | 0.45% | 1.29% |
Class Y shares | 3/31/14 | 0.82% | 1.57% |
Standard & Poor's 500
Composite Price Index | 3/31/14 | 5.21% | 9.04% |
Barclays U.S. Aggregate Index | 3/31/14 | 1.96% | 3.28% |
Hybrid Index | 3/31/14 | 3.92% | 6.42% |
Past performance is not predictive of future performance. The fund’s performance shown in the graph and table does not reflect the deduction of taxes that a shareholder would pay on fund distributions or the redemption of fund shares. In addition to the performance of Class A shares shown with and without a maximum sales charge, the fund’s performance shown in the table takes into account all other applicable fees and expenses on all classes.
† The maximum contingent deferred sales charge for Class C shares is 1% for shares redeemed within one year of the date of purchase.
7
UNDERSTANDING YOUR FUND’S EXPENSES (Unaudited)
As a mutual fund investor, you pay ongoing expenses, such as management fees and other expenses. Using the information below, you can estimate how these expenses affect your investment and compare them with the expenses of other funds. You also may pay one-time transaction expenses, including sales charges (loads) and redemption fees, which are not shown in this section and would have resulted in higher total expenses. For more information, see your fund’s prospectus or talk to your financial adviser.
Review your fund’s expenses
The table below shows the expenses you would have paid on a $1,000 investment in Dreyfus Alternative Diversifier Strategies Fund from May 1, 2015 to October 31, 2015. It also shows how much a $1,000 investment would be worth at the close of the period, assuming actual returns and expenses.
| | | | | | | | | |
Expenses and Value of a $1,000 Investment | | |
assuming actual returns for the six months ended October 31, 2015 |
| | | | | | | | |
| | | | Class A | Class C | Class I | Class Y |
Expenses paid per $1,000† | $ 3.96 | $ 7.32 | $ 1.88 | $ 1.44 |
Ending value (after expenses) | $965.30 | $962.40 | $966.90 | $967.80 |
COMPARING YOUR FUND’S EXPENSES
WITH THOSE OF OTHER FUNDS (Unaudited)
Using the SEC’s method to compare expenses
The Securities and Exchange Commission (SEC) has established guidelines to help investors assess fund expenses. Per these guidelines, the table below shows your fund’s expenses based on a $1,000 investment, assuming a hypothetical 5% annualized return. You can use this information to compare the ongoing expenses (but not transaction expenses or total cost) of investing in the fund with those of other funds. All mutual fund shareholder reports will provide this information to help you make this comparison. Please note that you cannot use this information to estimate your actual ending account balance and expenses paid during the period.
| | | | | | | | |
Expenses and Value of a $1,000 Investment | | |
assuming a hypothetical 5% annualized return for the six months ended October 31, 2015 |
| | | | | | | | |
| | | | Class A | Class C | Class I | Class Y |
Expenses paid per $1,000† | $ 4.08 | $ 7.53 | $ 1.94 | $ 1.48 |
Ending value (after expenses) | $1,021.17 | $1,017.74 | $1,023.29 | $1,023.74 |
† Expenses are equal to the fund's annualized expense ratio of .80% for Class A, 1.48% for Class C, .38% for Class I and .29% for Class Y, multiplied by the average account value over the period, multiplied by 184/365 (to reflect the one-half year period).
8
STATEMENT OF INVESTMENTS
October 31, 2015
| | | | | | |
Registered Investment Companies - 99.5% | | Shares | | Value ($) | |
Alternative Investments - 32.5% | | | | | |
AQR Managed Futures Strategy Fund, Cl. I | | 2,407,409 | a | 26,144,468 | |
ASG Global Alternatives Fund, Cl. Y | | 3,707,135 | a | 40,037,058 | |
ASG Managed Futures Strategy Fund, Cl. Y | | 2,470,701 | a | 26,510,626 | |
DFA Commodity Strategy Portfolio | | 1,438,414 | | 8,529,796 | |
Dynamic Total Return Fund, Cl. Y | | 3,422,295 | a,b | 54,448,709 | |
| | | | | 155,670,657 | |
Domestic Equity - 39.5% | | | | | |
Dreyfus Research Long/Short Equity Fund, Cl. Y | | 3,603,744 | a,b | 45,875,658 | |
Dreyfus Select Managers Long/Short Fund, Cl. Y | | 11,555,637 | a,b,c | 143,174,337 | |
| | | | | 189,049,995 | |
Foreign Equity - 27.5% | | | | | |
Dreyfus Global Real Estate Securities Fund, Cl. Y | | 5,563,446 | b | 51,294,976 | |
Dreyfus Global Real Return Fund, Cl. Y | | 5,454,238 | b | 80,122,752 | |
| | | | | 131,417,728 | |
Total Registered Investment Companies (cost $473,707,082) | | | | 476,138,380 | |
Total Investments (cost $473,707,082) | | 99.5% | | 476,138,380 | |
Cash and Receivables (Net) | | .5% | | 2,456,205 | |
Net Assets | | 100.0% | | 478,594,585 | |
a Non-income producing security.
b Investment in affiliated mutual fund.
c The fund's investment in the Dreyfus Select Managers Long/Short Fund represents 30.1% of the fund's total investments. The Dreyfus Select Managers Long/Short Fund seeks to provide long-term capital appreciation.
| | |
Portfolio Summary (Unaudited) † | Value (%) |
Mutual Funds: Domestic | 39.5 |
Mutual Funds: Alternative | 32.5 |
Mutual Funds: Foreign | 27.5 |
| | 99.5 |
†Based on net assets.
See notes to financial statements.
9
STATEMENT OF ASSETS AND LIABILITIES
October 31, 2015
| | | | | | | |
| | | | | | |
| | | Cost | | Value | |
Assets ($): | | | | |
Investments in securities—See Statement of Investments: | | | | |
Unaffiliated issuers | | 104,098,342 | | 101,221,948 | |
Affiliated issuers | | 369,608,740 | | 374,916,432 | |
Cash | | | | | 2,630,682 | |
Receivable for shares of Common Stock subscribed | | | | | 700,249 | |
Prepaid expenses | | | | | 11,382 | |
| | | | | 479,480,693 | |
Liabilities ($): | | | | |
Due to The Dreyfus Corporation and affiliates—Note 3(c) | | | | | 105,972 | |
Payable for shares of Common Stock redeemed | | | | | 727,116 | |
Accrued expenses | | | | | 53,020 | |
| | | | | 886,108 | |
Net Assets ($) | | | 478,594,585 | |
Composition of Net Assets ($): | | | | |
Paid-in capital | | | | | 478,164,694 | |
Accumulated distributions in excess of investment income—net | | | | | (750,407) | |
Accumulated net realized gain (loss) on investments | | | | | (1,251,000) | |
Accumulated net unrealized appreciation (depreciation)
on investments | | | | | 2,431,298 | |
Net Assets ($) | | | 478,594,585 | |
| | | | | | |
Net Asset Value Per Share | Class A | Class C | Class I | Class Y | |
Net Assets ($) | 61,550 | 33,652 | 632,984 | 477,866,399 | |
Shares Outstanding | 4,909 | 2,684 | 50,300 | 37,842,254 | |
Net Asset Value Per Share ($) | 12.54 | 12.54 | 12.58 | 12.63 | |
See notes to financial statements.
10
STATEMENT OF OPERATIONS
Year Ended October 31, 2015
| | | | | | | |
| | | | | | |
| | | | | | |
Investment Income ($): | | | | |
Income: | | | | |
Cash dividends: | | | | |
Unaffiliated issuers | | | 921,754 | |
Affiliated issuers | | | 4,635,891 | |
Total Income | | | 5,557,645 | |
Expenses: | | | | |
Management fee—Note 3(a) | | | 1,075,981 | |
Registration fees | | | 85,630 | |
Professional fees | | | 74,892 | |
Directors’ fees and expenses—Note 3(d) | | | 26,677 | |
Prospectus and shareholders’ reports | | | 14,533 | |
Custodian fees—Note 3(c) | | | 10,076 | |
Loan commitment fees—Note 2 | | | 4,535 | |
Shareholder servicing costs—Note 3(c) | | | 989 | |
Interest expense—Note 2 | | | 319 | |
Distribution fees—Note 3(b) | | | 242 | |
Miscellaneous | | | 19,686 | |
Total Expenses | | | 1,313,560 | |
Less—reduction in expenses due to undertaking—Note 3(a) | | | (129) | |
Less—reduction in fees due to earnings credits—Note 3(c) | | | (1) | |
Net Expenses | | | 1,313,430 | |
Investment Income—Net | | | 4,244,215 | |
Realized and Unrealized Gain (Loss) on Investments—Note 4 ($): | | |
Net realized gain (loss) on investments: | | |
Unaffiliated issuers | | | (178,016) | |
Affiliated issuers | | | (2,634,681) | |
Capital gain distributions on unaffiliated issuers | | | 2,360,305 | |
Capital gain distributions from affiliated issuers | | | 179,914 | |
Net Realized Gain (Loss) | | | (272,478) | |
Net unrealized appreciation (depreciation) on investments: | | | | |
Unaffiliated issuers | | | (3,320,609) | |
Affiliated issuers | | | 684,169 | |
Net Unrealized Appreciation (Depreciation) | | | (2,636,440) | |
Net Realized and Unrealized Gain (Loss) on Investments | | | (2,908,918) | |
Net Increase in Net Assets Resulting from Operations | | 1,335,297 | |
See notes to financial statements.
11
STATEMENT OF CHANGES IN NET ASSETS
| | | | | | | | | | |
| | | | | | | | | | |
| | | | Year Ended October 31, |
| | | | 2015 | | | | 2014a | |
Operations ($): | | | | | | | | |
Investment income (loss)—net | | | 4,244,215 | | | | (651,131) | |
Net realized gain (loss) on investments | | (272,478) | | | | 206,457 | |
Net unrealized appreciation (depreciation)
on investments | | (2,636,440) | | | | 5,067,738 | |
Net Increase (Decrease) in Net Assets
Resulting from Operations | 1,335,297 | | | | 4,623,064 | |
Dividends to Shareholders from ($): | | | | | | | | |
Investment income—net: | | | | | | | | |
Class A | | | (724) | | | | - | |
Class C | | | (97) | | | | - | |
Class I | | | (1,946) | | | | - | |
Class Y | | | (5,396,070) | | | | - | |
Net realized gain on investments: | | | | | | | | |
Class A | | | (22) | | | | - | |
Class C | | | (10) | | | | - | |
Class I | | | (55) | | | | - | |
Class Y | | | (147,467) | | | | - | |
Total Dividends | | | (5,546,391) | | | | - | |
Capital Stock Transactions ($): | | | | | | | | |
Net proceeds from shares sold: | | | | | | | | |
Class A | | | 7,491 | | | | 161,520 | |
Class C | | | 8,960 | | | | 38,600 | |
Class I | | | 1,094,238 | | | | 117,592 | |
Class Y | | | 158,975,972 | | | | 383,299,429 | |
Dividends reinvested: | | | | | | | | |
Class A | | | 411 | | | | - | |
Class I | | | 801 | | | | - | |
Class Y | | | 393,646 | | | | - | |
Cost of shares redeemed: | | | | | | | | |
Class A | | | (2,054) | | | | (106,321) | |
Class C | | | (13,827) | | | | - | |
Class I | | | (577,346) | | | | - | |
Class Y | | | (50,637,333) | | | | (14,579,164) | |
Increase (Decrease) in Net Assets
from Capital Stock Transactions | 109,250,959 | | | | 368,931,656 | |
Total Increase (Decrease) in Net Assets | 105,039,865 | | | | 373,554,720 | |
Net Assets ($): | | | | | | | | |
Beginning of Period | | | 373,554,720 | | | | - | |
End of Period | | | 478,594,585 | | | | 373,554,720 | |
Distributions in excess of investment income—net | (750,407) | | | | (564,134) | |
12
| | | | | | | | | | |
| | | | Year Ended October 31, |
| | | | 2015 | | | | 2014a | |
Capital Share Transactions: | | | | | | | | |
Class A | | | | | | | | |
Shares sold | | | 576 | | | | 12,958 | |
Shares issued for dividends reinvested | | | 33 | | | | - | |
Shares redeemed | | | (159) | | | | (8,499) | |
Net Increase (Decrease) in Shares Outstanding | 450 | | | | 4,459 | |
Class C | | | | | | | | |
Shares sold | | | 684 | | | | 3,083 | |
Shares redeemed | | | (1,083) | | | | - | |
Net Increase (Decrease) in Shares Outstanding | (399) | | | | 3,083 | |
Class I | | | | | | | | |
Shares sold | | | 86,139 | | | | 9,351 | |
Shares issued for dividends reinvested | | | 64 | | | | - | |
Shares redeemed | | | (45,254) | | | | - | |
Net Increase (Decrease) in Shares Outstanding | 40,949 | | | | 9,351 | |
Class Y | | | | | | | | |
Shares sold | | | 12,385,722 | | | | 30,528,956 | |
Shares issued for dividends reinvested | | | 31,118 | | | | - | |
Shares redeemed | | | (3,948,427) | | | | (1,155,115) | |
Net Increase (Decrease) in Shares Outstanding | 8,468,413 | | | | 29,373,841 | |
| | | | | | | | | | |
a | From March 31, 2014 (commencement of operations) to October 31, 2014. | |
See notes to financial statements.
13
FINANCIAL HIGHLIGHTS
The following tables describe the performance for each share class for the fiscal periods indicated. All information (except portfolio turnover rate) reflects financial results for a single fund share. Total return shows how much your investment in the fund would have increased (or decreased) during each period, assuming you had reinvested all dividends and distributions. These figures have been derived from the fund’s financial statements.
| | | | | | | |
| | | | |
| | Year Ended October 31, |
Class A Shares | | | 2015 | | 2014a | |
Per Share Data ($): | | | | | | |
Net asset value, beginning of period | | | 12.67 | | 12.50 | |
Investment Operations: | | | | | | |
Investment income (loss)—netb | | | .07 | | (.04) | |
Net realized and unrealized
gain (loss) on investments | | | (.04) | | .21 | |
Total from Investment Operations | | | .03 | | .17 | |
Distributions: | | | | | | |
Dividends from investment income—net | | | (.16) | | - | |
Dividends from net realized
gain on investments | | | (.00)c | | - | |
Total Distributions | | | (.16) | | - | |
Net asset value, end of period | | | 12.54 | | 12.67 | |
Total Return (%)d | | | .29 | | 1.36e | |
Ratios/Supplemental Data (%): | | | | | | |
Ratio of total expenses to average net assetsf | | | .86 | | 1.02g | |
Ratio of net expenses to average net assetsf | | | .80 | | .54 g | |
Ratio of net investment income
(loss) to average net assetsf | | | .58 | | (.53)g | |
Portfolio Turnover Rate | | | 16.73 | | .09e | |
Net Assets, end of period ($ x 1,000) | | | 62 | | 57 | |
a From March 31, 2014 (commencement of operations) to October 31, 2014.
b Based on average shares outstanding.
c Amount represents less than $.01 per share.
d Exclusive of sales charge.
e Not annualized.
f Amounts do not include the expenses of the underlying funds.
g Annualized.
See notes to financial statements.
14
| | | | | | | |
| | | | |
| | Year Ended October 31, |
Class C Shares | | | 2015 | | 2014a | |
Per Share Data ($): | | | | | | |
Net asset value, beginning of period | | | 12.64 | | 12.50 | |
Investment Operations: | | | | | | |
Investment (loss)—netb | | | (.05) | | (.10) | |
Net realized and unrealized
gain (loss) on investments | | | .00c | | .24 | |
Total from Investment Operations | | | (.05) | | .14 | |
Distributions: | | | | | | |
Dividends from investment income—net | | | (.05) | | - | |
Dividends from net realized
gain on investments | | | (.00)c | | - | |
Total Distributions | | | (.05) | | - | |
Net asset value, end of period | | | 12.54 | | 12.64 | |
Total Return (%)d | | | (.37) | | 1.12e | |
Ratios/Supplemental Data (%): | | | | | | |
Ratio of total expenses to average net assetsf | | | 1.59 | | 2.16g | |
Ratio of net expenses to average net assetsf | | | 1.50 | | 1.34g | |
Ratio of net investment (loss)
to average net assetsf | | | (.36) | | (1.34)g | |
Portfolio Turnover Rate | | | 16.73 | | .09e | |
Net Assets, end of period ($ x 1,000) | | | 34 | | 39 | |
a From March 31, 2014 (commencement of operations) to October 31, 2014.
b Based on average shares outstanding.
c Amount represents less than $.01 per share.
d Exclusive of sales charge.
e Not annualized.
f Amounts do not include the expenses of the underlying funds.
g Annualized.
See notes to financial statements.
15
FINANCIAL HIGHLIGHTS (continued)
| | | | | | | | | | |
| | | | | | | |
| | Year Ended October 31, |
Class I Shares | | | 2015 | | 2014a | |
Per Share Data ($): | | | | | | |
Net asset value, beginning of period | | | 12.70 | | 12.50 | |
Investment Operations: | | | | | | |
Investment income (loss)—netb | | | .03 | | (.05) | |
Net realized and unrealized
gain (loss) on investments | | | .02 | | .25 | |
Total from Investment Operations | | | .05 | | .20 | |
Distributions: | | | | | | |
Dividends from investment income—net | | | (.17) | | - | |
Dividends from net realized
gain on investments | | | (.00)c | | - | |
Total Distributions | | | (.17) | | - | |
Net asset value, end of period | | | 12.58 | | 12.70 | |
Total Return (%) | | | .45 | | 1.60d | |
Ratios/Supplemental Data (%): | | | | | | |
Ratio of total expenses to average net assetse | | | .43 | | 1.06f | |
Ratio of net expenses to average net assetse | | | .41 | | .52 f | |
Ratio of net investment income
(loss)to average net assetse | | | .23 | | (.51) f | |
Portfolio Turnover Rate | | | 16.73 | | .09d | |
Net Assets, end of period ($ x 1,000) | | | 633 | | 119 | |
a From March 31, 2014 (commencement of operations) to October 31, 2014.
b Based on average shares outstanding.
c Amount represents less than $.01 per share.
d Not annualized.
e Amounts do not include the expenses of the underlying funds.
f Annualized.
See notes to financial statements.
16
| | | | | | | | | | |
| | | | | | | |
| | Year Ended October 31, |
Class Y Shares | | | 2015 | | 2014a | |
Per Share Data ($): | | | | | | |
Net asset value, beginning of period | | | 12.71 | | 12.50 | |
Investment Operations: | | | | | | |
Investment income (loss)—netb | | | .13 | | (.03) | |
Net realized and unrealized
gain (loss) on investments | | | (.03) | | .24 | |
Total from Investment Operations | | | .10 | | .21 | |
Distributions: | | | | | | |
Dividends from investment income—net | | | (.18) | | - | |
Dividends from net realized
gain on investments | | | (.00)c | | - | |
Total Distributions | | | (.18) | | - | |
Net asset value, end of period | | | 12.63 | | 12.71 | |
Total Return (%) | | | .82 | | 1.68d | |
Ratios/Supplemental Data (%): | | | | | | |
Ratio of total expenses to average net assetse | | | .31 | | .36f | |
Ratio of net expenses to average net assetse | | | .31 | | .36f | |
Ratio of net investment income
(loss) to average net assetse | | | .99 | | (.36)f | |
Portfolio Turnover Rate | | | 16.73 | | .09d | |
Net Assets, end of period ($ x 1,000) | | | 477,866 | | 373,341 | |
a From March 31, 2014 (commencement of operations) to October 31, 2014.
b Based on average shares outstanding.
c Amount represents less than $.01 per share.
d Not annualized.
e Amounts do not include the expenses of the underlying funds.
f Annualized.
See notes to financial statements.
17
NOTES TO FINANCIAL STATEMENTS
NOTE 1—Significant Accounting Policies:
Dreyfus Alternative Diversifier Strategies Fund (the “fund”) is a separate diversified series of Dreyfus BNY Mellon Funds, Inc. (the “Company”), which is registered under the Investment Company Act of 1940, as amended (the “Act”), as an open-end management investment company and operates as a series company currently offering five series, including the fund. The fund’s investment objective is to seek long-term capital appreciation. The Dreyfus Corporation (the “Manager” or “Dreyfus”), a wholly-owned subsidiary of The Bank of New York Mellon Corporation (“BNY Mellon”), serves as the fund’s investment adviser.
MBSC Securities Corporation (the “Distributor”), a wholly-owned subsidiary of Dreyfus, is the distributor of the fund’s shares. The fund is authorized to issue 100 million shares of $.001 par value Common Stock in each of the following classes of shares: Class A, Class C, Class I and Class Y. Class A and Class C shares are sold primarily to retail investors through financial intermediaries and bear Distribution and/or Shareholder Services Plan fees. Class A shares generally are subject to a sales charge imposed at the time of purchase. Class C shares are subject to a contingent deferred sales charge (“CDSC”) imposed on Class C shares redeemed within one year of purchase. Class I shares are sold primarily to bank trust departments and other financial service providers (including The Bank of New York Mellon, a subsidiary of BNY Mellon and an affiliate of Dreyfus, and its affiliates), acting on behalf of customers having a qualified trust or an investment account or relationship at such institution, and bear no Distribution or Shareholder Services Plan fees. Class Y shares are sold at net asset value per share generally to institutional investors, and bear no Distribution or Shareholder Services Plan fees. Class I and Class Y shares are offered without a front-end sales charge or CDSC. Other differences between the classes include the services offered to and the expenses borne by each class, the allocation of certain transfer agency costs, and certain voting rights. Income, expenses (other than expenses attributable to a specific class), and realized and unrealized gains or losses on investments are allocated to each class of shares based on its relative net assets.
As of October 31, 2015, MBC Investments Corp., an indirect subsidiary of BNY Mellon, held 2,000 Class A, 2,000 Class C and 2,000 Class I shares of the fund.
The Company accounts separately for the assets, liabilities and operations of each series. Expenses directly attributable to each series are charged to
18
that series’ operations; expenses which are applicable to all series are allocated among them on a pro rata basis.
The Financial Accounting Standards Board (“FASB”) Accounting Standards Codification (“ASC”) is the exclusive reference of authoritative U.S. generally accepted accounting principles (“GAAP”) recognized by the FASB to be applied by nongovernmental entities. Rules and interpretive releases of the Securities and Exchange Commission (“SEC”) under authority of federal laws are also sources of authoritative GAAP for SEC registrants. The fund’s financial statements are prepared in accordance with GAAP, which may require the use of management estimates and assumptions. Actual results could differ from those estimates.
(a) Portfolio valuation: The fair value of a financial instrument is the amount that would be received to sell an asset or paid to transfer a liability in an orderly transaction between market participants at the measurement date (i.e., the exit price). GAAP establishes a fair value hierarchy that prioritizes the inputs of valuation techniques used to measure fair value. This hierarchy gives the highest priority to unadjusted quoted prices in active markets for identical assets or liabilities (Level 1 measurements) and the lowest priority to unobservable inputs (Level 3 measurements).
Additionally, GAAP provides guidance on determining whether the volume and activity in a market has decreased significantly and whether such a decrease in activity results in transactions that are not orderly. GAAP requires enhanced disclosures around valuation inputs and techniques used during annual and interim periods.
Various inputs are used in determining the value of the fund’s investments relating to fair value measurements. These inputs are summarized in the three broad levels listed below:
Level 1—unadjusted quoted prices in active markets for identical investments.
Level 2—other significant observable inputs (including quoted prices for similar investments, interest rates, prepayment speeds, credit risk, etc.).
Level 3—significant unobservable inputs (including the fund’s own assumptions in determining the fair value of investments).
The inputs or methodology used for valuing securities are not necessarily an indication of the risk associated with investing in those securities.
Investments are valued at the net asset value of each underlying fund determined as of the close of the New York Stock Exchange (generally 4
19
NOTES TO FINANCIAL STATEMENTS (continued)
p.m., Eastern time) on the valuation date and are generally categorized within Level 1 of the fair value hierarchy.
The following is a summary of the inputs used as of October 31, 2015 in valuing the fund’s investments:
| | | | | |
| | Level 1 - Unadjusted Quoted Prices | Level 2 - Other Significant Observable Inputs | Level 3 -Significant Unobservable Inputs | Total |
Assets ($) | | | |
Investments in Securities: | | | |
Mutual Funds† | 476,138,380 | - | - | 476,138,380 |
† See Statement of Investments for additional detailed categorizations.
At October 31, 2015, there were no transfers between Level 1, Level 2 and Level 3 of the fair value hierarchy.
(b) Securities transactions and investment income: Securities transactions are recorded on a trade date basis. Realized gains and losses from securities transactions are recorded on the identified cost basis. Dividend income is recognized on the ex-dividend date and interest income, including, where applicable, accretion of discount and amortization of premium on investments, is recognized on the accrual basis.
(c) Affiliated issuers: Investments in other investment companies advised by Dreyfus are defined as “affiliated” under the Act. Investments in affiliated investment companies during the period ended October 31, 2015 were as follows:
| | | | | |
Affiliated
Investment
Company | Value
10/31/2014 ($) | Purchases($)† | Sales ($) | Net Realized
(Loss) ($) |
Dreyfus Global
Real Estate
Securities
Fund, Cl. Y | 39,430,887 | 13,438,832 | 1,449,858 | (38,943) |
Dreyfus Global
Real Return
Fund, Cl. Y | 74,397,390 | 27,809,604 | 19,210,150 | (979,765) |
Dreyfus Research
Long/Short
Equity Fund,
Cl. Y | 36,368,548 | 11,922,251 | 2,157,534 | (20,848) |
20
| | | | | |
Affiliated
Investment
Company | Value
10/31/2014 ($) | Purchases($)† | Sales ($) | Net Realized
(Loss) ($) |
Dreyfus Select
Managers
Long/Short
Fund, Cl. Y | 125,671,368 | 41,663,317 | 25,367,119 | (706,321) |
Dynamic Total
Return
Fund, Cl. Y | 58,238,833 | 18,024,698 | 21,914,123 | (888,804) |
TOTAL | 334,107,026 | 112,858,702 | 70,098,784 | (2,634,681) |
† Includes reinvested dividends/distributions. |
Affiliated
Investment
Company | Change in Net Unrealized Appreciation
(Depreciation) ($) | Value
10/31/2015 ($) | Net
Assets (%) | Dividends/
Distributions ($) |
Dreyfus Global
Real Estate
Securities
Fund, Cl. Y | (85,942) | 51,294,976 | 10.7 | 1,212,995 |
Dreyfus Global
Real Return
Fund, Cl. Y | (1,894,327) | 80,122,752 | 16.7 | 3,602,810 |
Dreyfus Research
Long/Short
Equity
Fund, Cl. Y | (236,759) | 45,875,658 | 9.6 | - |
Dreyfus Select
Managers
Long/Short
Fund, Cl. Y | 1,913,092 | 143,174,337 | 29.9 | - |
Dynamic Total
Return
Fund, Cl. Y | 988,105 | 54,448,709 | 11.4 | - |
TOTAL | 684,169 | 374,916,432 | 78.3 | 4,815,805 |
(d) Dividends to shareholders: Dividends are recorded on the ex-dividend date. Dividends from investment income-net and dividends from net realized capital gains, if any, are normally declared and paid annually, but the fund may make distributions on a more frequent basis to comply with the distribution requirements of the Internal Revenue Code of 1986, as amended (the “Code”). To the extent that net realized capital gains can be offset by capital loss carryovers, it is the policy of the fund not to distribute such gains. Income and capital gain distributions are determined in accordance with income tax regulations, which may differ from GAAP.
21
NOTES TO FINANCIAL STATEMENTS (continued)
(e) Federal income taxes: It is the policy of the fund to continue to qualify as a regulated investment company, if such qualification is in the best interests of its shareholders, by complying with the applicable provisions of the Code, and to make distributions of taxable income sufficient to relieve it from substantially all federal income and excise taxes.
As of and during the period ended October 31, 2015, the fund did not have any liabilities for any uncertain tax positions. The fund recognizes interest and penalties, if any, related to uncertain tax positions as income tax expense in the Statement of Operations. During the period ended October 31, 2015, the fund did not incur any interest or penalties.
Each tax year in the two-year period ended October 31, 2015 remains subject to examination by the Internal Revenue Service and state taxing authorities.
At October 31, 2015, the components of accumulated earnings on a tax basis were as follows: accumulated capital losses $385,242 and unrealized appreciation $1,565,540. In addition, the fund deferred for tax purposes late year ordinary losses of $750,407 to the first day of the following year.
Under the Regulated Investment Company Modernization Act of 2010, the fund is permitted to carry forward capital losses for an unlimited period. Furthermore, capital loss carryovers retain their character as either short-term or long-term capital losses.
The accumulated capital loss carryover is available for federal income tax purposes to be applied against future net realized capital gains, if any, realized subsequent to October 31, 2015. The fund has $385,242 of short-term capital losses which can be carried forward for an unlimited period.
The tax character of distributions paid to shareholders during the fiscal periods ended October 31, 2015 and October 31, 2014 were as follows: ordinary income $5,398,837 and $0, and long-term capital gains $147,554 and $0, respectively.
During the period ended October 31, 2015, as a result of permanent book to tax differences, primarily due to the tax treatment for Short-term capital gain distributions from regulated investment company holdings, the fund increased accumulated undistributed investment income-net by $968,349, decreased accumulated net realized gain (loss) on investments by $966,747 and decreased paid-in capital by $1,602. Net assets and net asset value per share were not affected by this reclassification.
22
NOTE 2—Bank Lines of Credit:
The fund participates with other Dreyfus-managed funds in a $480 million unsecured credit facility led by Citibank, N.A. and a $300 million unsecured credit facility provided by The Bank of New York Mellon (each, a “Facility”), each to be utilized primarily for temporary or emergency purposes, including the financing of redemptions. Prior to October 7, 2015, the unsecured credit facility with Citibank, N.A. was $430 million. In connection therewith, the fund has agreed to pay its pro rata portion of commitment fees for each Facility. Interest is charged to the fund based on rates determined pursuant to the terms of the respective Facility at the time of borrowing.
The average amount of borrowings outstanding under the Facilities during the period ended October 31, 2015, was approximately $28,800 with a related weighted average annualized interest rate of 1.11%.
NOTE 3—Management Fee and Other Transactions with Affiliates:
(a) Pursuant to a management agreement with Dreyfus, the fund has agreed to pay a management fee at the annual rate of 1.35% applied to the portion of the fund’s average daily net assets allocated to direct investments in securities and .25% applied to that portion of the fund’s average daily net assets allocated to investments in other investment companies (underlying funds) and money market instruments (including cash and equivalents). Dreyfus has contractually agreed, from November 1, 2014 through March 1, 2016, to waive receipt of its fees and/or assume the direct expenses of the fund, so that the expenses of none of the classes (excluding Rule 12b-1 Distribution Plan fees, Shareholder Services Plan fees, taxes, interest expense, brokerage commissions, commitment fees on borrowings and extraordinary expenses) exceed .55% of the value of the fund’s average daily net assets. The reduction in expenses, pursuant to the undertaking, amounted to $129 during the period ended October 31, 2015.
(b) Under the Distribution Plan adopted pursuant to Rule 12b-1 under the Act, Class C shares pay the Distributor for distributing its shares at an annual rate of .75% of the value of its average daily net assets. During the period ended October 31, 2015, Class C shares were charged $242 pursuant to the Distribution Plan.
(c) Under the Shareholder Services Plan, Class A and Class C shares pay the Distributor at an annual rate of .25% of the value of their average daily net assets for the provision of certain services. The services provided may include personal services relating to shareholder accounts, such as answering shareholder inquiries regarding the fund and providing reports
23
NOTES TO FINANCIAL STATEMENTS (continued)
and other information, and services related to the maintenance of shareholder accounts. The Distributor may make payments to Service Agents (securities dealers, financial institutions or other industry professionals) with respect to these services. The Distributor determines the amounts to be paid to Service Agents. During the period ended October 31, 2015, Class A and Class C shares were charged $148 and $81, respectively, pursuant to the Shareholder Services Plan.
Under its terms, the Distribution Plan and Shareholder Services Plan shall remain in effect from year to year, provided such continuance is approved annually by a vote of a majority of those Company who are not “interested persons” of the Company and who have no direct or indirect financial interest in the operation of or in any agreement related to the Distribution Plan or Shareholder Services Plan.
The fund has arrangements with the transfer agent and the custodian whereby the fund may receive earnings credits when positive cash balances are maintained, which are used to offset transfer agency and custody fees. For financial reporting purposes, the fund includes net earnings credits as an expense offset in the Statement of Operations.
The fund compensates Dreyfus Transfer, Inc., a wholly-owned subsidiary of Dreyfus, under a transfer agency agreement for providing transfer agency and cash management services for the fund. The majority of transfer agency fees are comprised of amounts paid on a per account basis, while cash management fees are related to fund subscriptions and redemptions. During the period ended October 31, 2015, the fund was charged $656 for transfer agency services and $21 for cash management services. These fees are included in Shareholder servicing costs in the Statement of Operations. Cash management fees were partially offset by earnings credits of $1.
The fund compensates The Bank of New York Mellon under a custody agreement for providing custodial services for the fund. These fees are determined based on net assets, geographic region and transaction activity. During the period ended October 31, 2015, the fund was charged $10,076 pursuant to the custody agreement.
During the period ended October 31, 2015, the fund was charged $11,159 for services performed by the Chief Compliance Officer and his staff.
The components of “Due to The Dreyfus Corporation and affiliates” in the Statement of Assets and Liabilities consist of: management fees $99,815, Distribution Plan fees $21, Shareholder Services Plan fees $20, custodian fees $5,142, Chief Compliance Officer fees $882 and transfer agency fees $92.
24
(d) Each Board member also serves as a Board member of other funds within the Dreyfus complex. Annual retainer fees and attendance fees are allocated to each fund based on net assets.
NOTE 4—Securities Transactions:
The aggregate amount of purchases and sales of investment securities, excluding short-term securities, during the period ended October 31, 2015, amounted to $181,840,412 and $71,637,789, respectively.
At October 31, 2015, the cost of investments for federal income tax purposes was $474,572,840; accordingly, accumulated net unrealized appreciation on investments was $1,565,540, consisting of $7,563,222 gross unrealized appreciation and $5,997,682 gross unrealized depreciation.
25
REPORT OF INDEPENDENT REGISTERED
PUBLIC ACCOUNTING FIRM
The Board of Directors and Shareholders of
Dreyfus BNY Mellon Funds, Inc.
We have audited the accompanying statement of assets and liabilities of Dreyfus Alternative Diversifier Strategies Fund (the “Fund”), a series of Dreyfus BNY Mellon Funds, Inc., including the statement of investments as of October 31, 2015, and the related statement of operations for the year then ended, the statement of changes in net assets and the financial highlights for each of the year or period in the two-year period then ended. These financial statements and financial highlights are the responsibility of the Fund’s management. Our responsibility is to express an opinion on these financial statements and financial highlights based on our audits.
We conducted our audits in accordance with the standards of the Public Company Accounting Oversight Board (United States). Those standards require that we plan and perform the audit to obtain reasonable assurance about whether the financial statements and financial highlights are free of material misstatement. An audit includes examining, on a test basis, evidence supporting the amounts and disclosures in the financial statements. Our procedures included confirmation of securities owned as of October 31, 2015, by correspondence with the custodian, the transfer agent of the underlying funds and brokers or by other appropriate auditing procedures. An audit also includes assessing the accounting principles used and significant estimates made by management, as well as evaluating the overall financial statement presentation. We believe that our audits provide a reasonable basis for our opinion.
In our opinion, the financial statements and financial highlights referred to above present fairly, in all material respects, the financial position of Dreyfus Alternative Diversifier Strategies Fund as of October 31, 2015, and the results of its operations for the year then ended, the changes in its net assets, and the financial highlights for each of the year or period in the two-year period then ended, in conformity with U.S. generally accepted accounting principles.

New York, New York
December 30, 2015
26
IMPORTANT TAX INFORMATION (Unaudited)
For federal tax purposes, the fund reports the maximum amount allowable, but not less than $5,398,837 as ordinary income dividends paid during the year ended October 31, 2015 as qualified dividend income in accordance with Section 854(b)(1)(B) of the Internal Revenue Code. Also, the fund reports the maximum amount allowable but not less than 100% of ordinary income dividends paid during the year ended October 31, 2015 as eligible for the corporate dividends received deduction provided under Section 243 of the Internal Revenue Code in accordance with Section 854(b)(1)(A) of the Internal Revenue Code. Shareholders will receive notification in early 2016 of the percentage applicable to the preparation of their 2015 income tax returns. Also the fund reports the maximum amount allowable but not less than $.0049 per share as a capital gain dividend in accordance with Section 852(b)(3)(C) of the Internal Revenue Code.
27
BOARD MEMBERS INFORMATION (Unaudited)
INDEPENDENT BOARD MEMBERS
Joseph S. DiMartino (72)
Chairman of the Board (1999)
Principal Occupation During Past 5 Years:
· Corporate Director and Trustee (1995-present)
Other Public Company Board Memberships During Past 5 Years:
· CBIZ (formerly, Century Business Services, Inc.), a provider of outsourcing functions for small and medium size companies, Director (1997-present)
· The Newark Group, a provider of a national market of paper recovery facilities, paperboard mills and paperboard converting plants, Director (2000-2010)
No. of Portfolios for which Board Member Serves: 140
———————
Francine J. Bovich (64)
Board Member (2012)
Principal Occupation During Past 5 Years:
· Trustee, The Bradley Trusts, private trust funds (2011-present)
· Managing Director, Morgan Stanley Investment Management (1993-2010)
Other Public Company Board Memberships During Past 5 Years:
· Annaly Capital Management, Inc., Board Member (May 2014-present)
No. of Portfolios for which Board Member Serves: 79
———————
Kenneth A. Himmel (69)
Board Member (1994)
Principal Occupation During Past 5 Years:
· Managing Partner, Gulf Related, an international real estate development company (2010-present)
· President and CEO, Related Urban Development, a real estate development company (1996-present)
· President and CEO, Himmel & Company, a real estate development company (1980-present)
· CEO, American Food Management, a restaurant company (1983-present)
No. of Portfolios for which Board Member Serves: 29
———————
28
Stephen J. Lockwood (68)
Board Member (1994)
Principal Occupation During Past 5 Years:
· Chairman of the Board, Stephen J. Lockwood and Company LLC, a real estate investment company (2000-present)
No. of Portfolios for which Board Member Serves: 29
———————
Roslyn M. Watson (66)
Board Member (1994)
Principal Occupation During Past 5 Years:
· Principal, Watson Ventures, Inc., a real estate investment company (1993-present)
No. of Portfolios for which Board Member Serves: 65
———————
Benaree Pratt Wiley (69)
Board Member (1998)
Principal Occupation During Past 5 Years:
· Principal, The Wiley Group, a firm specializing in strategy and business development (2005-present)
Other Public Company Board Memberships During Past 5 Years:
· CBIZ (formerly, Century Business Services, Inc.), a provider of outsourcing functions for small and medium size companies, Director (2008-present)
No. of Portfolios for which Board Member Serves: 65
———————
Once elected all Board Members serve for an indefinite term, but achieve Emeritus status upon reaching age 80. The address of the Board Members and Officers is c/o The Dreyfus Corporation, 200 Park Avenue, New York, New York 10166. Additional information about the Board Members is available in the fund's Statement of Additional Information which can be obtained from Dreyfus free of charge by calling this toll free number: 1-800-DREYFUS.
James M. Fitzgibbons, Emeritus Board Member
29
OFFICERS OF THE FUND (Unaudited)
BRADLEY J. SKAPYAK, President since January 2010.
Chief Operating Officer and a director of the Manager since June 2009, Chairman of Dreyfus Transfer, Inc., an affiliate of the Manager and the transfer agent of the funds, since May 2011 and Executive Vice President of the Distributor since June 2007. From April 2003 to June 2009, Mr. Skapyak was the head of the Investment Accounting and Support Department of the Manager. He is an officer of 66 investment companies (comprised of 140 portfolios) managed by the Manager. He is 56 years old and has been an employee of the Manager since February 1988.
BENNETT A. MACDOUGALL, Chief Legal Officer since October 2015
Chief Legal Officer of the Manager since June 2015; from June 2005 to June 2015, Director and Associate General Counsel of Deutsche Bank – Asset & Wealth Management Division, and Chief Legal Officer of Deutsche Investment Management Americas Inc. He is an officer of 67 investment companies (comprised of 165 portfolios) managed by the Manager. He is 44 years old and has been an employee of the Manager since June 2015.
JANETTE E. FARRAGHER, Vice President and Secretary since December 2011.
Assistant General Counsel of BNY Mellon, and an officer of 67 investment companies (comprised of 165 portfolios) managed by the Manager. She is 52 years old and has been an employee of the Manager since February 1984.
JAMES BITETTO, Vice President and Assistant Secretary since August 2005.
Managing Counsel of BNY Mellon and Secretary of the Manager, and an officer of 67 investment companies (comprised of 165 portfolios) managed by the Manager. He is 49 years old and has been an employee of the Manager since December 1996.
JONI LACKS CHARATAN, Vice President and Assistant Secretary since August 2005.
Managing Counsel of BNY Mellon, and an officer of 67 investment companies (comprised of 165 portfolios) managed by the Manager. She is 59 years old and has been an employee of the Manager since October 1988.
JOSEPH M. CHIOFFI, Vice President and Assistant Secretary since August 2005.
Managing Counsel of BNY Mellon, and an officer of 67 investment companies (comprised of 165 portfolios) managed by the Manager. He is 53 years old and has been an employee of the Manager since June 2000.
JOHN B. HAMMALIAN, Vice President and Assistant Secretary since August 2005.
Senior Managing Counsel of BNY Mellon, and an officer of 67 investment companies (comprised of 165 portfolios) managed by the Manager. He is 52 years old and has been an employee of the Manager since February 1991.
MAUREEN E. KANE, Vice President and Assistant Secretary since April 2015.
Managing Counsel of BNY Mellon since July 2014; from October 2004 until July 2014, General Counsel, and from May 2009 until July 2014, Chief Compliance Officer of Century Capital Management. She is an officer of 67 investment companies (comprised of 165 portfolios) managed by the Manager. She is 53 years old and has been an employee of the Manager since July 2014.
SARAH S. KELLEHER, Vice President and Assistant Secretary since April 2014.
Senior Counsel of BNY Mellon, and an officer of 67 investment companies (comprised of 165 portfolios) managed by the Manager; from August 2005 to March 2013, Associate General Counsel of Third Avenue Management. She is 40 years old and has been an employee of the Manager since March 2013.
JEFF PRUSNOFSKY, Vice President and Assistant Secretary since August 2005.
Senior Managing Counsel of BNY Mellon, and an officer of 67 investment companies (comprised of 165 portfolios) managed by the Manager. He is 50 years old and has been an employee of the Manager since October 1990.
JAMES WINDELS, Treasurer since November 2001.
Director – Mutual Fund Accounting of the Manager, and an officer of 67 investment companies (comprised of 165 portfolios) managed by the Manager. He is 57 years old and has been an employee of the Manager since April 1985.
30
RICHARD CASSARO, Assistant Treasurer since January 2008.
Senior Accounting Manager – Money Market and Municipal Bond Funds of the Manager, and an officer of 67 investment companies (comprised of 165 portfolios) managed by the Manager. He is 56 years old and has been an employee of the Manager since September 1982.
GAVIN C. REILLY, Assistant Treasurer since December 2005.
Tax Manager of the Investment Accounting and Support Department of the Manager, and an officer of 67 investment companies (comprised of 165 portfolios) managed by the Manager. He is 47 years old and has been an employee of the Manager since April 1991.
ROBERT S. ROBOL, Assistant Treasurer since December 2002.
Senior Accounting Manager – Fixed Income Funds of the Manager, and an officer of 67 investment companies (comprised of 165 portfolios) managed by the Manager. He is 51 years old and has been an employee of the Manager since October 1988.
ROBERT SALVIOLO, Assistant Treasurer since July 2007.
Senior Accounting Manager – Equity Funds of the Manager, and an officer of 67 investment companies (comprised of 165 portfolios) managed by the Manager. He is 48 years old and has been an employee of the Manager since June 1989.
ROBERT SVAGNA, Assistant Treasurer since December 2002.
Senior Accounting Manager – Equity Funds of the Manager, and an officer of 67 investment companies (comprised of 165 portfolios) managed by the Manager. He is 48 years old and has been an employee of the Manager since November 1990.
JOSEPH W. CONNOLLY, Chief Compliance Officer since October 2004.
Chief Compliance Officer of the Manager and The Dreyfus Family of Funds (67 investment companies, comprised of 165 portfolios). He is 58 years old and has served in various capacities with the Manager since 1980, including manager of the firm’s Fund Accounting Department from 1997 through October 2001.
31
NOTES
32
NOTES
33
Dreyfus Alternative Diversifier Strategies Fund
200 Park Avenue
New York, NY 10166
Manager
The Dreyfus Corporation
200 Park Avenue
New York, NY 10166
Custodian
The Bank of New York Mellon
225 Liberty Street
New York, NY 10286
Transfer Agent &
Dividend Disbursing Agent
Dreyfus Transfer, Inc.
200 Park Avenue
New York, NY 10166
Distributor
MBSC Securities Corporation
200 Park Avenue
New York, NY 10166
| | |
Ticker Symbols: | Class A: DRNAX Class C: DRNCX Class I: DRNIX Class Y: DRYNX |
Telephone Call your financial representative or 1-800-DREYFUS
Mail The Dreyfus Family of Funds, 144 Glenn Curtiss Boulevard, Uniondale, NY 11556-0144
E-mail Send your request to info@dreyfus.com
Internet Information can be viewed online or downloaded at www.dreyfus.com
The fund files its complete schedule of portfolio holdings with the Securities and Exchange Commission (“SEC”) for the first and third quarters of each fiscal year on Form N-Q. The fund’s Forms N-Q are available on the SEC’s website at www.sec.gov and may be reviewed and copied at the SEC’s Public Reference Room in Washington, DC. (phone 1-800-SEC-0330 for information).
A description of the policies and procedures that the fund uses to determine how to vote proxies relating to portfolio securities and information regarding how the fund voted these proxies for the most recent 12-month period ended June 30 is available at www.dreyfus.com and on the SEC’s website at www.sec.gov and without charge, upon request, by calling 1-800-DREYFUS.
| | |
© 2015 MBSC Securities Corporation
6253AR1015 | 
|
Dreyfus Emerging Markets Debt U.S. Dollar Fund
| | | |

| | ANNUAL REPORT October 31, 2015 |
| |
Save time. Save paper. View your next shareholder report online as soon as it’s available. Log into www.dreyfus.com and sign up for Dreyfus eCommunications. It’s simple and only takes a few minutes. |
| |
The views expressed in this report reflect those of the portfolio manager only through the end of the period covered and do not necessarily represent the views of Dreyfus or any other person in the Dreyfus organization. Any such views are subject to change at any time based upon market or other conditions and Dreyfus disclaims any responsibility to update such views. These views may not be relied on as investment advice and, because investment decisions for a Dreyfus fund are based on numerous factors, may not be relied on as an indication of trading intent on behalf of any Dreyfus fund. |
| |
Not FDIC-Insured • Not Bank-Guaranteed • May Lose Value |
Contents
T H E F U N D
F O R M O R E I N F O R M AT I O N
Back Cover
| | | | |
| |
Dreyfus Emerging Markets Debt U.S. Dollar Fund
| | The Fund |
A LETTER FROM THE PRESIDENT
Dear Shareholder:
We are pleased to present this annual report for Dreyfus Emerging Markets Debt U.S. Dollar Fund, from the fund’s inception on December 3, 2014 to the end of its fiscal year on October 31, 2015. For information about how the fund performed during the reporting period, as well as general market perspectives, we provide a Discussion of Fund Performance on the pages that follow.
Financial markets proved volatile over the reporting period amid choppy U.S. and global economic growth. U.S. stocks advanced over the final months of 2014 and the spring of 2015, with some broad measures of market performance setting new record highs. Those gains were largely erased over the summer when global economic instability undermined investor sentiment, but a renewed rally in October enabled most broad stock indices to end the reporting period in positive territory. In contrast, international stocks generally lost a degree of value, with developed markets faring far better than emerging markets amid falling commodity prices and depreciating currency values. U.S. bonds generally produced modestly positive total returns, with municipal bonds and longer term U.S. government securities faring better, on average, than corporate-backed bonds.
We expect market volatility to persist over the near term until investors see greater clarity regarding short-term U.S. interest rates and global economic conditions. Our investment strategists and portfolio managers are monitoring developments carefully, keeping a close watch on credit spreads, currency values, commodity prices, corporate profits, economic trends in the emerging markets, and other developments that could influence investor sentiment. Over the longer term, we remain confident that markets are likely to benefit as investors increasingly recognize that inflation is likely to stay low, economic growth expectations are stabilizing, and monetary policies remain accommodative in most regions of the world. In our view, investors will continue to be well served under these circumstances by a long-term perspective and a disciplined investment approach.
.
Thank you for your continued confidence and support.
Sincerely,

J. Charles Cardona
President
The Dreyfus Corporation
November 16, 2015
2
DISCUSSION OF FUND PERFORMANCE
For the period from the fund’s inception on December 3, 2014, through October 31, 2015, as provided by Alexander Kozhemiakin and Josephine Shea, Primary Portfolio Managers
Fund and Market Performance Overview
From the fund’s inception on December 3, 2014 to the end of its fiscal year on October 31, 2015, Dreyfus Emerging Markets Debt U.S. Dollar Fund’s Class A shares produced a total return of -1.28%, Class C shares returned -1.91%, Class I shares returned -0.99%, and Class Y shares returned -1.05%.1 For comparison, the fund uses a customized blended index (the “Blended Index”), composed of 50% JPMorgan Corporate Emerging Markets Bond Index — Broad (CEMBI-Broad Index) and 50% JPMorgan Emerging Markets Bond Index — Global (EMBI-Global Index). For the same period, CEMBI-Broad Index returned 0.59%, the EMBI-Global Index returned -0.11%, and the Blended Index returned 0.24%.2 3
Emerging market bonds proved volatile over the reporting period as a result of global macroeconomic headwinds as well as various national and regional developments. The fund’s lack of exposure to Ukrainian and Venezuelan debt securities caused its returns to lag the benchmark.
The Fund’s Investment Approach
The fund seeks to maximize total return. To pursue its goal, the fund normally invests at least 80% of its net assets in emerging market bonds and other debt instruments denominated in U.S. dollars, and in derivative instruments that provide investment exposure to such securities.
When choosing investments, we employ in-depth fundamental country and credit analysis. A “top down” analysis of macroeconomics and financial and political variables guides country allocations, while a “bottom-up” analysis of the fundamental measures of an issuer’s creditworthiness guides securities selection. We also consider technical market factors and the global risk environment. We typically sell a security if we believe it is overvalued from a valuation standpoint, another sector becomes relatively more attractive, or we expect fundamentals to deteriorate.
Macroeconomic Shifts Produced Heightened Volatility
Several ongoing macroeconomic developments led to a volatile environment for financial markets in many developing nations. Slowing demand for industrial materials from the decelerating Chinese economy and falling global commodity prices pressured many exporters of oil and basic materials, such as Russia and Brazil. In China, monetary easing encouraged investors until late summer 2015, when continued economic weakness and a currency devaluation undermined confidence and securities prices. India’s economy proved somewhat insulated from the slowdown in Chinese growth, but the rate of domestic growth disappointed those who expected more from the current, business-friendly government.
U.S. economic developments rippled through the emerging markets as well. Emerging market bonds were affected by shifts in the outlook for changes in U.S. monetary policy from the Federal Reserve Board, with securities’ prices coming under pressure when the timing of expected rate hikes proved uncertain. The rising value of the U.S. dollar against most local currencies also raised some investor concerns over the ability of borrowers to
3
DISCUSSION OF FUND PERFORMANCE (continued)
repay bonds issued in dollars, although most of these issuers have US dollar revenues and have found their competitiveness enhanced. In any case, US dollar-denominated emerging markets bonds were considerably less affected by dollar strength then were bonds denominated in local currencies.
Risk Control Strategies Hampered Fund Performance
The fund’s dollar-denominated investment strategy insulated U.S. investors from the currency fluctuations that sharply undercut the value of emerging market bonds denominated in local currencies. However, the fund’s risk-control approach detracted from returns relative to the benchmark. In particular, the fund avoided both corporate and government securities linked to the fragile Venezuelan and Ukrainian economies. In both cases, the countries’ bonds performed relatively well despite local economic difficulties. In addition, while the fund avoided most exposure to countries heavily leveraged to petroleum and other commodity exports, it held a few oil companies’ bonds that sold off with the decline in petroleum prices. Some company-specific problems affecting corporate holdings in India further hurt relative returns.
On a more positive note, the fund enhanced relative performance with strong security selections in Russia, where we avoided most private sector and pure sovereign bonds. Instead, the fund emphasized bonds issued by government agencies and state-controlled enterprises, which outperformed market averages. Similarly, the fund’s investments in Turkish agency and corporate bonds generated stronger returns than the country’s pure sovereign bonds due to their relative attractive valuations. Good security selections further bolstered relative results in Peru and South Africa. A relatively short average duration starting in July 2015 proved an effective strategy during a widespread market selloff in August and September, as did the fund’s relatively high cash position.
Continuing to Focus on Individual Securities
Emerging market bond valuations generally appear attractive in the wake of the recent market selloff. Therefore, as of the end of the reporting period, we have begun reducing the fund’s cash position, adding opportunistically to pure sovereign bond holdings, an area where the fund has remained underweighted. We have increased the fund’s duration exposure and maintained the generally high credit quality of its portfolio. As for country allocations, we have found a relatively large number of attractive opportunities in Chile, Panama, Brazil, Mexico, and Colombia. In contrast, we have maintained relatively little exposure to the Philippines, South Korea, Hong Kong, China, and Malaysia.
November 16, 2015
Bond funds are subject generally to interest rate, credit, liquidity, and market risks, to varying degrees, all of which are more fully described in the fund’s prospectus. Generally, all other factors being equal, bond prices are inversely related to interest-rate changes, and rate increases can cause price declines.
Foreign bonds are subject to special risks including exposure to changing political and economic conditions, and potentially less liquidity. The fixed income securities of issuers located in emerging markets can be more volatile and less liquid than those of issuers in more mature economies, and emerging markets generally have less diverse and less mature economic structures and less stable political systems than those of developed countries. The securities of issuers located or doing substantial business in emerging markets are often subject to rapid and large changes in price.
The fund may use derivative instruments, such as options, futures, and options on futures, forward contracts, swaps (including credit default swaps on corporate bonds and asset-backed securities), options on swaps, and other credit derivatives. A small investment in derivatives could have a potentially large impact on the fund’s performance.
4
The fund is non-diversified, which means that the fund may invest a relatively high percentage of its assets in a limited number of issuers. Therefore, the fund’s performance may be more vulnerable to changes in the market value of a single issuer or group of issuers and more susceptible to risks associated with a single economic, political, or regulatory occurrence than a diversified fund.
1 Total return includes reinvestment of dividends and any capital gains paid, and does not take into consideration the maximum initial sales charge in the case of Class A shares, or the applicable contingent deferred sales charge imposed on redemptions in the case of Class C shares. Had these charges been reflected, returns would have been lower. Share price and investment return fluctuate such that upon redemption, fund shares may be worth more or less than their original cost. Return figures provided reflect the absorption of certain fund expenses pursuant to an agreement by The Dreyfus Corporation through March 1, 2017, at which time it may be extended, terminated, or modified. Had these expenses not been absorbed, the fund’s returns would have been lower. Past performance is no guarantee of future results.
2 SOURCE: FactSet — JPMorgan Corporate Emerging Markets Bond Index is a market capitalization weighted index consisting of U.S. dollar denominated emerging market corporate bonds. JPMorgan Emerging Markets Bond Index is a market capitalization weighted index consisting of U.S. dollar denominated emerging market bonds. The Blended Index is a static blend of 50% JPMorgan Corporate Emerging Markets Bond Index and 50% JPMorgan Emerging Markets Bond Index. Investors cannot invest directly in any index.
3 For comparative purpose, the value of the indexes as of 11/30/14 is used as the beginning value on 12/3/14.
5
FUND PERFORMANCE
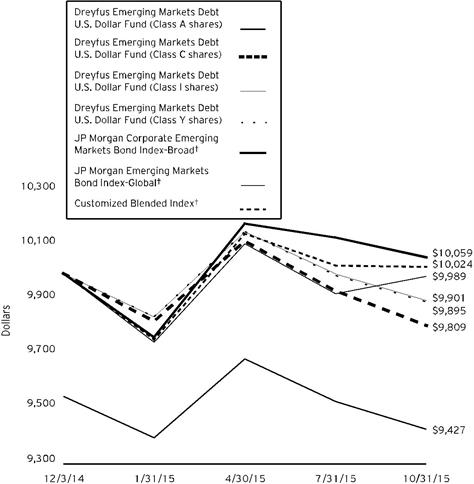
Comparison of change in value of $10,000 investment in Dreyfus Emerging Markets Debts U.S. Dollar Fund Class A shares, Class C shares, Class I shares and Class Y shares, with the JP Morgan Corporate Emerging Markets Bond Index-Board, the JP Morgan Emerging Markets Bond Index-Global and the Customized Index
† Source: Factset.
Past performance is not predictive of future performance.
The above graph compares a $10,000 investment made in each of the Class A, Class C, Class I and Class Y shares of Dreyfus Emerging Markets Debt U.S. Dollar Fund on 12/3/14 (inception date) to a $10,000 investment made in the JP Morgan Corporate Emerging Markets Bond Index-Broad (the “CEMBI-Broad Index”), the JP Morgan Emerging Markets Bond Index-Global (the “EMBI-Global Index”) and as well as to a Customized Blended index comprised of 50% of CEMBI-Broad and 50% of EMBI-Global (the “Customized Index”) on that date. All dividends and capital gain distributions are reinvested.
The fund’s performance shown in the line graph above takes into account the maximum initial sales charge on Class A shares, the applicable contingent deferred sales charge on Class C sales and all other applicable fees and expenses on all classes. The CEMBI-Broad Index is a market capitalization weighted index consisting of U.S. dollar denominated emerging market corporate bonds. The EMBI-Global Index is a market capitalization weighted index consisting of U.S. dollar denominated emerging market bonds. Unlike a mutual fund, the indices are not subject to charges, fees and other expenses. Investors cannot invest directly in any index. Further information relating to fund expenses, including expense reimbursements, if applicable, is contained in the Fees and Expenses section of the prospectus and elsewhere in this report.
6
| | | | | | | |
Average Annual Total Returns as of 10/31/15 | | |
| | Inception Date | | | From |
| | Inception |
Class A shares | | | | |
with maximum sales charge (4.50%) | | 12/3/14 | | | -5.73% | |
without sales charge | | 12/3/14 | | | -1.28% | |
Class C shares | | | | |
with applicable redemption charge † | | 12/3/14 | | | -2.86% | |
without redemption | | 12/3/14 | | | -1.91% | |
Class I shares | | 12/3/14 | | | -0.99% | |
Class Y shares | | 12/3/14 | | | -1.05% | |
JP Morgan Corporate Emerging Markets | | | | |
Bond Index-Board | | 11/30/14 | | 0.59% | †† |
JP Morgan Emerging Markets Bond | | | | | |
Index-Global | | 11/30/14 | | | -0.11% | †† |
Customized Blended Index | | 11/30/14 | | | 0.24% | †† |
Past performance is not predictive of future performance. The fund’s performance shown in the graph and table does not reflect the deduction of taxes that a shareholder would pay on fund distributions or the redemption of fund shares. In addition to the performance of Class A shares shown with and without a maximum sales charge, the fund’s performance shown in the table takes into account all other applicable fees and expenses on all classes.
† The maximum contingent deferred sales charge for Class C shares is 1% for shares redeemed within one year of the date of purchase.
†† For comparative purpose, the value of the index as of 11/30/14 is used as the beginning value on 12/3/14.
7
UNDERSTANDING YOUR FUND’S EXPENSES (Unaudited)
As a mutual fund investor, you pay ongoing expenses, such as management fees and other expenses. Using the information below, you can estimate how these expenses affect your investment and compare them with the expenses of other funds. You also may pay one-time transaction expenses, including sales charges (loads) and redemption fees, which are not shown in this section and would have resulted in higher total expenses. For more information, see your fund’s prospectus or talk to your financial adviser.
Review your fund’s expenses
The table below shows the expenses you would have paid on a $1,000 investment in Dreyfus Emerging Markets Debt U.S. Dollar Fund from May 1, 2015 to October 31, 2015. It also shows how much a $1,000 investment would be worth at the close of the period, assuming actual returns and expenses.
| | | | | | | | | | | | |
Expenses and Value of a $1,000 Investment | | |
assuming actual returns for the six months ended October 31, 2015 |
| | | | | | | | |
| | | | Class A | Class C | Class I | Class Y |
Expenses paid per $1,000† | $ | 4.48 | $ | 8.19 | $ | 3.24 | $ | 3.23 |
Ending value (after expenses) | $ | 973.20 | $ | 969.40 | $ | 975.00 | $ | 974.40 |
COMPARING YOUR FUND’S EXPENSES
WITH THOSE OF OTHER FUNDS (Unaudited)
Using the SEC’s method to compare expenses
The Securities and Exchange Commission (SEC) has established guidelines to help investors assess fund expenses. Per these guidelines, the table below shows your fund’s expenses based on a $1,000 investment, assuming a hypothetical 5% annualized return. You can use this information to compare the ongoing expenses (but not transaction expenses or total cost) of investing in the fund with those of other funds. All mutual fund shareholder reports will provide this information to help you make this comparison. Please note that you cannot use this information to estimate your actual ending account balance and expenses paid during the period.
| | | | | | | | | | | | |
Expenses and Value of a $1,000 Investment | | |
assuming a hypothetical 5% annualized return for the six months ended October 31, 2015 |
| | | | | | | | |
| | | | Class A | Class C | Class I | Class Y |
Expenses paid per $1,000† | $ | 4.58 | $ | 8.39 | $ | 3.31 | $ | 3.31 |
Ending value (after expenses) | $ | 1,020.67 | $ | 1,016.89 | $ | 1,021.93 | $ | 1,021.93 |
† Expenses are equal to the fund’s annualized expense ratio of .90% for Class A, 1.65% for Class C, .65% for Class I and .65% for Class Y, multiplied by the average account value over the period, multiplied by 184/365 (to reflect the one-half year period).
8
STATEMENT OF INVESTMENTS
October 31, 2015
| | | | | | | | | | | |
Bonds and Notes - 97.8% | | Coupon Rate (%) | | Maturity Date | | Principal Amount ($) | | Value ($) | |
Consumer Discretionary - 4.2% | | | | | |
Alibaba Group Holding,
Gtd. Notes | | 3.13 | | 11/28/21 | | 200,000 | | 197,395 | |
Arcelik,
Sr. Unscd. Notes | | 5.00 | | 4/3/23 | | 260,000 | | 244,653 | |
Cencosud,
Gtd. Notes | | 4.88 | | 1/20/23 | | 250,000 | | 247,920 | |
InRetail Shopping Malls,
Gtd. Notes | | 6.50 | | 7/9/21 | | 80,000 | | 82,200 | |
Tenedora Nemak,
Sr. Unscd. Notes | | 5.50 | | 2/28/23 | | 240,000 | | 246,600 | |
| | 1,018,768 | |
Consumer Staples - 1.0% | | | | | |
King Power Capital,
Gtd. Bonds | | 5.63 | | 11/3/24 | | 225,000 | | 236,783 | |
Energy - 7.2% | | | | | |
AES Panama,
Sr. Unscd. Notes | | 6.00 | | 6/25/22 | | 200,000 | a | 199,000 | |
ONGC Videsh,
Gtd. Notes | | 4.63 | | 7/15/24 | | 210,000 | | 217,142 | |
Pacific Rubiales Energy,
Gtd. Notes | | 5.13 | | 3/28/23 | | 100,000 | | 37,000 | |
Petrobras Global Finance,
Gtd. Notes | | 3.25 | | 3/17/17 | | 505,000 | | 482,527 | |
Petrobras Global Finance,
Gtd. Notes | | 6.25 | | 3/17/24 | | 280,000 | | 224,966 | |
Petronas Capital,
Gtd. Bonds | | 7.88 | | 5/22/22 | | 280,000 | | 351,814 | |
YPF,
Sr. Unscd. Notes | | 8.50 | | 7/28/25 | | 130,000 | | 128,440 | |
YPF,
Sr. Unscd. Notes | | 8.50 | | 7/28/25 | | 120,000 | a | 118,560 | |
| | 1,759,449 | |
Financials - 14.3% | | | | | |
Akbank TAS,
Sr. Unscd. Notes | | 4.00 | | 1/24/20 | | 200,000 | a | 196,695 | |
AkBank TAS,
Sr. Unscd. Bonds | | 5.13 | | 3/31/25 | | 200,000 | a | 191,304 | |
Alternatifbank,
Gtd. Bonds | | 3.13 | | 7/22/19 | | 250,000 | | 248,750 | |
Banco Davivienda,
Sub. Notes | | 5.88 | | 7/9/22 | | 240,000 | | 245,100 | |
Banco Internacional del Peru,
Sr. Unscd. Bonds | | 5.75 | | 10/7/20 | | 140,000 | | 151,200 | |
Bank Rakyat Indonesia Persero,
Sr. Unscd. Notes | | 2.95 | | 3/28/18 | | 200,000 | | 200,000 | |
BBVA Banco Continental,
Sr. Unscd. Bonds | | 5.25 | | 9/22/29 | | 90,000 | b | 90,450 | |
BBVA Bancomer,
Jr. Sub. Notes | | 7.25 | | 4/22/20 | | 220,000 | | 245,318 | |
China Cinda Finance 2014,
Gtd. Notes | | 5.63 | | 5/14/24 | | 250,000 | | 263,590 | |
China Overseas Finance,
Gtd. Bonds | | 5.95 | | 5/8/24 | | 430,000 | | 480,332 | |
9
STATEMENT OF INVESTMENTS (continued)
| | | | | | | | | | | |
Bonds and Notes - 97.8% (continued) | | Coupon Rate (%) | | Maturity Date | | Principal Amount ($) | | Value ($) | |
Financials - 14.3% (continued) | | | | | |
Embraer Netherlands,
Gtd. Notes | | 5.05 | | 6/15/25 | | 120,000 | | 115,200 | |
Global Bank,
Sr. Unscd. Notes | | 5.13 | | 10/30/19 | | 200,000 | a | 203,000 | |
Itau Unibanco Holding,
Sub. Notes | | 5.65 | | 3/19/22 | | 240,000 | | 228,000 | |
Krung Thai Bank,
Sub. Notes | | 5.20 | | 12/26/24 | | 250,000 | b | 255,243 | |
MAF Global Securities,
Gtd. Bonds | | 4.75 | | 5/7/24 | | 240,000 | | 247,178 | |
Tanner Servicios Financieros,
Sr. Unscd. Notes | | 4.38 | | 3/13/18 | | 125,000 | | 127,000 | |
| | 3,488,360 | |
Foreign/Governmental - 52.5% | | | | | |
Argentine Government,
Sr. Unscd. Bonds | | 3.00 | | 12/15/35 | | 540,000 | c | 53,973 | |
Argentine Government,
Sr. Unscd. Notes | | 9.95 | | 6/9/21 | | 150,000 | a | 154,875 | |
Banco Nacional de Desenvolvimento Economico e Social,
Sr. Unscd. Notes | | 5.75 | | 9/26/23 | | 645,000 | | 574,050 | |
Bank of Ceylon,
Sr. Unscd. Notes | | 5.33 | | 4/16/18 | | 240,000 | | 239,100 | |
Brazil Minas,
Govt. Gtd. Notes | | 5.33 | | 2/15/28 | | 715,000 | | 585,406 | |
Brazilian Government,
Sr. Unscd. Bonds | | 7.13 | | 1/20/37 | | 190,000 | | 185,725 | |
CNOOC Curtis Funding,
Gtd. Notes | | 4.50 | | 10/3/23 | | 230,000 | | 241,210 | |
Colombian Government,
Sr. Unscd. Bonds | | 4.50 | | 1/28/26 | | 200,000 | | 198,750 | |
Colombian Government,
Sr. Unscd. Bonds | | 7.38 | | 9/18/37 | | 130,000 | | 151,450 | |
Comision Federal de Electricidad,
Sr. Unscd. Notes | | 4.88 | | 1/15/24 | | 630,000 | | 647,325 | |
Comision Federal de Electricidad,
Sr. Unscd. Notes | | 5.75 | | 2/14/42 | | 340,000 | | 320,875 | |
Corp Nacional del Cobre de Chile,
Sr. Unscd. Bonds | | 4.88 | | 11/4/44 | | 245,000 | | 219,653 | |
Corp Nacional del Cobre de Chile ,
Sr. Unscd. Notes | | 4.50 | | 9/16/25 | | 200,000 | a | 198,924 | |
Corporación Financiera de Desarrollo,
Sr. Unscd. Notes | | 4.75 | | 7/15/25 | | 200,000 | a | 203,750 | |
Development Bank of Kazakhstan,
Sr. Unscd. Notes | | 4.13 | | 12/10/22 | | 220,000 | | 193,463 | |
Dominican Republic Government,
Sr. Unscd. Bonds | | 5.88 | | 4/18/24 | | 385,000 | | 392,700 | |
Ecopetrol,
Sr. Unscd. Notes | | 5.38 | | 6/26/26 | | 180,000 | | 168,187 | |
El Salvador Government,
Sr. Unscd. Notes | | 8.25 | | 4/10/32 | | 100,000 | | 100,125 | |
El Salvador Government,
Sr. Unscd. Notes | | 7.65 | | 6/15/35 | | 190,000 | | 173,138 | |
Export Credit Bank of Turkey,
Sr. Unscd. Notes | | 5.88 | | 4/24/19 | | 325,000 | | 341,361 | |
10
| | | | | | | | | | | |
Bonds and Notes - 97.8% (continued) | �� | Coupon Rate (%) | | Maturity Date | | Principal Amount ($) | | Value ($) | |
Foreign/Governmental - 52.5% (continued) | | | | | |
Gazprom,
Sr. Unscd. Bonds | | 6.00 | | 11/27/23 | | 310,000 | | 299,987 | |
Ghanaian Government,
Govt. Gtd. Bonds | | 10.75 | | 10/14/30 | | 200,000 | a | 212,450 | |
Hungarian Government,
Sr. Unscd. Notes | | 5.38 | | 10/21/20 | | 110,000 | | 121,825 | |
Israel Electric,
Sr. Scd. Bonds | | 5.00 | | 11/12/24 | | 240,000 | a | 249,804 | |
Ivory Coast Government,
Sr. Unscd. Notes | | 5.38 | | 7/23/24 | | 270,000 | | 242,764 | |
Jamaican Government,
Sr. Unscd. Notes | | 6.75 | | 4/28/28 | | 285,000 | | 290,700 | |
KazAgro National Management Holding,
Sr. Unscd. Notes | | 4.63 | | 5/24/23 | | 220,000 | | 180,004 | |
Kazakhstan Temir Zholy Finance,
Gtd. Notes | | 6.95 | | 7/10/42 | | 200,000 | | 166,022 | |
Lithuanian Government,
Sr. Unscd. Notes | | 6.63 | | 2/1/22 | | 200,000 | | 243,460 | |
Magyar Export-Import Bank,
Gtd. Bonds | | 4.00 | | 1/30/20 | | 250,000 | | 255,050 | |
Mexican Government,
Sr. Unscd. Notes | | 4.75 | | 3/8/44 | | 320,000 | | 304,800 | |
MFB Magyar Fejlesztesi Bank,
Govt. Gtd. Notes | | 6.25 | | 10/21/20 | | 220,000 | | 246,147 | |
NTPC,
Sr. Unscd. Notes | | 4.75 | | 10/3/22 | | 240,000 | | 254,313 | |
OCP,
Sr. Unscd. Notes | | 5.63 | | 4/25/24 | | 230,000 | | 240,867 | |
Panamanian Government,
Sr. Unscd. Bonds, Ser. A | | 5.63 | | 7/25/22 | | 45,000 | | 49,808 | |
Pertamina,
Sr. Unscd. Notes | | 4.30 | | 5/20/23 | | 440,000 | | 417,337 | |
Perusahaan Gas Negara,
Sr. Unscd. Notes | | 5.13 | | 5/16/24 | | 240,000 | | 238,590 | |
Perusahaan Listrik Negara,
Sr. Unscd. Notes | | 5.25 | | 10/24/42 | | 270,000 | | 223,425 | |
Peruvian Government,
Sr. Unscd. Bonds | | 4.13 | | 8/25/27 | | 65,000 | | 65,650 | |
Petroleos Mexicanos,
Gtd. Bonds | | 6.63 | | 6/15/35 | | 210,000 | | 207,638 | |
Petroleos Mexicanos,
Gtd. Notes | | 4.25 | | 1/15/25 | | 250,000 | | 238,500 | |
Petroleos Mexicanos,
Gtd. Notes | | 4.50 | | 1/23/26 | | 240,000 | | 229,752 | |
Petroleos Mexicanos,
Gtd. Notes | | 6.38 | | 1/23/45 | | 115,000 | | 109,538 | |
Petroleum Co. of Trinidad & Tobago,
Sr. Unscd. Notes | | 6.00 | | 5/8/22 | | 70,000 | | 67,585 | |
Petroliam Nasional,
Sr. Unscd. Notes | | 7.63 | | 10/15/26 | | 100,000 | | 131,735 | |
Polish Government,
Sr. Unscd. Notes | | 4.00 | | 1/22/24 | | 1,000 | | 1,067 | |
Russian Agricultural Bank,
Sr. Unscd. Notes | | 7.75 | | 5/29/18 | | 240,000 | | 255,965 | |
Sberbank of Russia,
Sr. Unscd. Notes | | 6.13 | | 2/7/22 | | 250,000 | | 257,374 | |
11
STATEMENT OF INVESTMENTS (continued)
| | | | | | | | | | | |
Bonds and Notes - 97.8% (continued) | | Coupon Rate (%) | | Maturity Date | | Principal Amount ($) | | Value ($) | |
Foreign/Governmental - 52.5% (continued) | | | | | |
Sinopec Group Oversea 2015,
Gtd. Notes | | 3.25 | | 4/28/25 | | 300,000 | a | 288,592 | |
Sri Lankan Government,
Sr. Unscd. Notes | | 6.13 | | 6/3/25 | | 200,000 | | 189,796 | |
Transnet,
Sr. Unscd. Notes | | 4.00 | | 7/26/22 | | 260,000 | | 246,285 | |
Turkish Government,
Sr. Unscd. Notes | | 7.38 | | 2/5/25 | | 90,000 | | 107,845 | |
Uruguayan Government,
Sr. Unscd. Bonds | | 7.88 | | 1/15/33 | | 95,000 | | 121,600 | |
Vietnam Government,
Sr. Unscd. Bonds | | 4.80 | | 11/19/24 | | 240,000 | a | 236,788 | |
Vnesheconombank,
Sr. Unscd. Notes | | 6.03 | | 7/5/22 | | 290,000 | | 281,588 | |
Vnesheconombank,
Sr. Unscd. Notes | | 6.80 | | 11/22/25 | | 170,000 | | 167,766 | |
| | 12,786,457 | |
Industrials - 3.2% | | | | | |
Alliance Global Group,
Gtd. Notes | | 6.50 | | 8/18/17 | | 230,000 | | 242,880 | |
DP World,
Sr. Unscd. Notes | | 6.85 | | 7/2/37 | | 220,000 | | 233,475 | |
ENA Norte Trust,
Pass Through Certificates | | 4.95 | | 4/25/28 | | 156,414 | | 160,794 | |
Rolta Americas,
Sub. Notes | | 8.88 | | 7/24/19 | | 250,000 | | 129,750 | |
| | 766,899 | |
Information Technology - 2.0% | | | | | |
Alibaba Group Holding,
Gtd. Notes | | 3.60 | | 11/28/24 | | 245,000 | | 238,238 | |
Tencent Holdings,
Sr. Unscd. Notes | | 3.80 | | 2/11/25 | | 245,000 | | 244,052 | |
| | 482,290 | |
Materials - 6.2% | | | | | |
Cementos Pacasmayo,
Gtd. Notes | | 4.50 | | 2/8/23 | | 130,000 | | 123,338 | |
CEMEX Espana,
Sr. Scd. Notes | | 9.88 | | 4/30/19 | | 170,000 | | 182,113 | |
Minsur,
Sr. Unscd. Notes | | 6.25 | | 2/7/24 | | 170,000 | | 177,140 | |
MMC Norilsk Nickel,
Sr. Unscd. Notes | | 6.63 | | 10/14/22 | | 200,000 | a | 205,250 | |
Severstal,
Sr. Unscd. Notes | | 5.90 | | 10/17/22 | | 270,000 | | 263,967 | |
Southern Copper,
Sr. Unscd. Notes | | 5.88 | | 4/23/45 | | 130,000 | | 114,379 | |
Turkiye Sise ve Cam Fabrikalari AS,
Sr. Unscd. Notes | | 4.25 | | 5/9/20 | | 250,000 | | 245,925 | |
Vedanta Resources,
Sr. Unscd. Notes | | 6.75 | | 6/7/16 | | 200,000 | | 199,000 | |
| | 1,511,112 | |
Telecommunications - 5.3% | | | | | |
Bharti Airtel International,
Gtd. Notes | | 5.13 | | 3/11/23 | | 230,000 | | 244,487 | |
12
| | | | | | | | | | | |
Bonds and Notes - 97.8% (continued) | | Coupon Rate (%) | | Maturity Date | | Principal Amount ($) | | Value ($) | |
Telecommunications - 5.3% (continued) | | | | | |
Globo Comunicacao e Participacoes,
Sr. Unscd. Notes | | 4.84 | | 6/8/25 | | 200,000 | b | 186,250 | |
Oi,
Sr. Unscd. Notes | | 5.75 | | 2/10/22 | | 260,000 | | 163,800 | |
Turkcell Iletisim Hizmetleri,
Unscd. Notes | | 5.75 | | 10/15/25 | | 200,000 | a | 200,125 | |
VimpelCom Holdings,
Gtd. Notes | | 7.50 | | 3/1/22 | | 470,000 | | 496,729 | |
| | 1,291,391 | |
Utilities - 1.9% | | | | | |
AES Gener,
Sr. Unscd. Notes | | 5.00 | | 7/14/25 | | 200,000 | a | 201,996 | |
Talent Yield Investments,
Gtd. Notes | | 4.50 | | 4/25/22 | | 240,000 | | 250,842 | |
| | 452,838 | |
Total Bonds and Notes (cost $24,520,357) | | 23,794,347 | |
Other Investment - 2.0% | | | | | | Shares | | Value ($) | |
Registered Investment Company | | | | | |
Dreyfus Institutional Preferred Plus Money Market Fund
(cost $487,526) | | | | | | 487,526 | d | 487,526 | |
Total Investments (cost $25,007,883) | | 99.8% | 24,281,873 | |
Cash and Receivables (Net) | | .2% | 60,828 | |
Net Assets | | 100.0% | 24,342,701 | |
a Security exempt from registration pursuant to Rule 144A under the Securities Act of 1933. These securities may be resold in transactions exempt from registration, normally to qualified institutional buyers. At October 31, 2015, these securities were valued at $3,061,113, or 12.6% of net assets.
b Variable rate security--interest rate subject to periodic change.
c Non-income producing--security in default.
d Investment in affiliated money market mutual fund.
13
STATEMENT OF INVESTMENTS (continued)
| | |
Portfolio Summary (Unaudited) † | Value (%) |
Mexico | 12.4 |
Brazil | 11.3 |
Russia | 9.2 |
China | 9.1 |
Turkey | 7.3 |
Indonesia | 4.4 |
India | 4.3 |
Chile | 4.1 |
Panama | 3.1 |
Colombia | 3.1 |
Peru | 3.0 |
Hungary | 2.6 |
Kazakhstan | 2.2 |
Money Market Investment | 2.0 |
United Arab Emirates | 2.0 |
Argentina | 1.9 |
Sri Lanka | 1.8 |
Dominican Republic | 1.6 |
Jamaica | 1.2 |
El Salvador | 1.1 |
Thailand | 1.0 |
Israel | 1.0 |
South Africa | 1.0 |
Lithuania | 1.0 |
Philippine | 1.0 |
Ivory Coast | 1.0 |
Morocco | 1.0 |
Vietnam | 1.0 |
United Kingdom | 1.0 |
Ghana | .9 |
Spain | .7 |
Malaysia | .5 |
Uruguay | .5 |
Trinidad and Tobago | .3 |
Canada | .2 |
Poland | .0 |
| | 99.8 |
†Based on net assets.
See notes to financial statements.
14
STATEMENT OF ASSETS AND LIABILITIES
October 31, 2015
| | | | | | | |
| | | | | | |
| | | Cost | | Value | |
Assets ($): | | | | |
Investments in securities—See Statement of Investments: | | | | |
Unaffiliated issuers | | 24,520,357 | | 23,794,347 | |
Affiliated issuers | | 487,526 | | 487,526 | |
Dividends and interest receivable | | | | | 332,217 | |
Receivable for investment securities sold | | | | | 134,121 | |
Due from The Dreyfus Corporation and affiliates—Note 3(c) | | | | | 4,524 | |
Prepaid expenses | | | | | 37,927 | |
| | | | | 24,790,662 | |
Liabilities ($): | | | | |
Payable for investment securities purchased | | | | | 401,100 | |
Accrued expenses | | | | | 46,861 | |
| | | | | 447,961 | |
Net Assets ($) | | | 24,342,701 | |
Composition of Net Assets ($): | | | | |
Paid-in capital | | | | | 25,498,132 | |
Accumulated undistributed investment income—net | | | | | 124,004 | |
Accumulated net realized gain (loss) on investments | | | | | (553,425) | |
Accumulated net unrealized appreciation (depreciation)
on investments | | | | | (726,010) | |
Net Assets ($) | | | 24,342,701 | |
| | | | | | |
Net Asset Value Per Share | Class A | Class C | Class I | Class Y | |
Net Assets ($) | 95,491 | 95,447 | 23,572,295 | 579,468 | |
Shares Outstanding | 8,000 | 8,000 | 1,976,000 | 48,602 | |
Net Asset Value Per Share ($) | 11.94 | 11.93 | 11.93 | 11.92 | |
See notes to financial statements.
15
STATEMENT OF OPERATIONS
From December 3, 2014 (commencement of operations) to October 31, 2015
| | | | | | | |
| | | | | | |
| | | | | | |
Investment Income ($): | | | | |
Income: | | | | |
Interest | | | 1,064,941 | |
Dividends from affiliated issuers | | | 1,484 | |
Total Income | | | 1,066,425 | |
Expenses: | | | | |
Investment advisory fee—Note 3(a) | | | 112,190 | |
Professional fees | | | 100,809 | |
Registration fees | | | 66,438 | |
Custodian fees—Note 3(c) | | | 8,532 | |
Prospectus and shareholders’ reports | | | 7,421 | |
Directors’ fees and expenses—Note 3(d) | | | 1,432 | |
Shareholder servicing costs—Note 3(c) | | | 714 | |
Distribution fees—Note 3(b) | | | 667 | |
Loan commitment fees—Note 2 | | | 112 | |
Miscellaneous | | | 27,848 | |
Total Expenses | | | 326,163 | |
Less—reduction in expenses due to undertaking—Note 3(a) | | | (179,204) | |
Less—reduction in fees due to earnings credits—Note 3(c) | | | (1) | |
Net Expenses | | | 146,958 | |
Investment Income—Net | | | 919,467 | |
Realized and Unrealized Gain (Loss) on Investments—Note 4 ($): | | |
Net realized gain (loss) on investments | (448,586) | |
Net realized gain (loss) on financial futures | | | (7,212) | |
Net Realized Gain (Loss) | | | (455,798) | |
Net unrealized appreciation (depreciation) on investments | | | (726,010) | |
Net Realized and Unrealized Gain (Loss) on Investments | | | (1,181,808) | |
Net (Decrease) in Net Assets Resulting from Operations | | (262,341) | |
See notes to financial statements.
16
STATEMENT OF CHANGES IN NET ASSETS
From December 3, 2014 (commencement of operations) to October 31, 2015
| | | | | | | | | | |
| | | | | | | | | | |
| | | | Year Ended October 31, |
| | | | 2015 |
| | | | | |
Operations ($): | | | | |
Investment income—net | | | 919,467 | |
Net realized gain (loss) on investments | | (455,798) | |
Net unrealized appreciation (depreciation)
on investments | | (726,010) | |
Net Increase (Decrease) in Net Assets
Resulting from Operations | (262,341) | |
Dividends to Shareholders from ($): | | | | |
Investment income—net: | | | | |
Class A | | | (3,296) | |
Class C | | | (2,672) | |
Class I | | | (883,272) | |
Class Y | | | (12,870) | |
Total Dividends | | | (902,110) | |
Capital Stock Transactions ($): | | | | |
Net proceeds from shares sold: | | | | |
Class A | | | 100,000 | |
Class C | | | 100,000 | |
Class I | | | 24,701,002 | |
Class Y | | | 597,864 | |
Dividends reinvested | | | | |
Class Y | | | 9,270 | |
Cost of shares redeemed | | | | |
Class I | | | (984) | |
Increase (Decrease) in Net Assets
from Capital Stock Transactions | 25,507,152 | |
Total Increase (Decrease) in Net Assets | 24,342,701 | |
Net Assets ($): | | | | |
Beginning of Period | | | - | |
End of Period | | | 24,342,701 | |
Undistributed investment income—net | 124,004 | |
Capital Share Transactions (Shares): | | | | |
Class A | | | | |
Shares sold | | | 8,000 | |
Class C | | | | |
Shares sold | | | 8,000 | |
Class I | | | | |
Shares sold | | | 1,976,081 | |
Shares redeemed | | | (81) | |
Net Increase (Decrease) in Shares Outstanding | 1,976,000 | |
Class Y | | | | |
Shares sold | | | 47,829 | |
Shares issued for dividends reinvested | | | 773 | |
Net Increase (Decrease) in Shares Outstanding | 48,602 | |
See notes to financial statements.
17
FINANCIAL HIGHLIGHTS
The following table describes the performance for each share class for the period from December 3, 2014 (commencement of operations) to October 31, 2015. All information (except portfolio turnover rate) reflects financial results for a single fund share. Total return shows how much your investment in the fund would have increased (or decreased) during each period, assuming you had reinvested all dividends and distributions. These figures have been derived from the fund’s financial statements.
| | | | | | |
| | | Class A | Class C | Class I | Class Y |
| | | Shares | Shares | Shares | Shares |
Per Share Data ($): | | | | | |
Net asset value, beginning of period | | 12.50 | 12.50 | 12.50 | 12.50 |
Investment Operations: | | | | | |
Investment income—neta | | .43 | .34 | .46 | .41 |
Net realized and unrealized gain (loss) on investments | | (.58) | (.58) | (.58) | (.54) |
Total from Investment Operations | | (.15) | (.24) | (.12) | (.13) |
Distributions: | | | | | |
Dividends from investment income—net | | (.41) | (.33) | (.45) | (.45) |
Net asset value, end of period | | 11.94 | 11.93 | 11.93 | 11.92 |
Total Return (%)b | | (1.28)c | (1.91)c | (.99) | (1.05) |
Ratios/Supplemental Data (%): | | | | | |
Ratio of total expenses to average net assetsd | | 1.75 | 2.49 | 1.45 | 1.46 |
Ratio of net expenses to average net assetsd | | .90 | 1.65 | .65 | .65 |
Ratio of net investment income to average net assetsd | | 3.85 | 3.10 | 4.10 | 4.15 |
Portfolio Turnover Rateb | | 67.64 | 67.64 | 67.64 | 67.64 |
Net Assets, end of period ($ x 1,000) | | 95 | 95 | 23,572 | 579 |
a Based on average shares outstanding.
b Not annualized.
c Exclusive of sales charge.
d Annualized.
See notes to financial statements.
18
NOTES TO FINANCIAL STATEMENTS
NOTE 1—Significant Accounting Policies:
Dreyfus Emerging Markets Debt U.S. Dollar Fund (the “fund”) is a separate non-diversified series of Dreyfus BNY Mellon Funds, Inc. (the “Company”), which is registered under the Investment Company Act of 1940, as amended (the “Act”), as an open-end management investment company and operates as a series company currently offering five series, including the fund. The fund commenced operations on December 3, 2014. The fund’s investment objective is to seek to maximize total return. The Dreyfus Corporation (the “Manager” or “Dreyfus”), a wholly-owned subsidiary of The Bank of New York Mellon Corporation (“BNY Mellon”), serves as the fund’s investment adviser. Standish Mellon Asset Management Company LLC (“Standish”), a wholly-owned subsidiary of BNY Mellon and an affiliate of Dreyfus, serves as the fund’s sub-investment adviser.
MBSC Securities Corporation (the “Distributor”), a wholly-owned subsidiary of Dreyfus, is the distributor of the fund’s shares. The fund is authorized to issue 100 million shares of $.001 par value Common Stock in each of the following classes of shares: Class A, Class C, Class I and Class Y. Class A and Class C shares are sold primarily to retail investors through financial intermediaries and bear Distribution and/or Shareholder Services Plan fees. Class A shares generally are subject to a sales charge imposed at the time of purchase. Class C shares are subject to a contingent deferred sales charge (“CDSC”) imposed on Class C shares redeemed within one year of purchase. Class I shares are sold primarily to bank trust departments and other financial service providers (including The Bank of New York Mellon, a subsidiary of BNY Mellon and an affiliate of Dreyfus, and its affiliates), acting on behalf of customers having a qualified trust or an investment account or relationship at such institution, and bear no Distribution or Shareholder Services Plan fees. Class Y shares are sold at net asset value per share generally to institutional investors, and bear no Distribution or Shareholder Services Plan fees. Class I and Class Y shares are offered without a front-end sales charge or CDSC. Other differences between the classes include the services offered to and the expenses borne by each class, the allocation of certain transfer agency costs, and certain voting rights. Income, expenses (other than expenses attributable to a specific class), and realized and unrealized gains or losses on investments are allocated to each class of shares based on its relative net assets.
19
NOTES TO FINANCIAL STATEMENTS (continued)
As of October 31, 2015, MBC Investments Corp., an indirect subsidiary of BNY Mellon, held all of the outstanding Class A, Class C, Class I shares and 8,000 Class Y shares of the fund.
The Company accounts separately for the assets, liabilities and operations of each series. Expenses directly attributable to each series are charged to that series’ operations; expenses which are applicable to all series are allocated among them on a pro rata basis.
The Financial Accounting Standards Board (“FASB”) Accounting Standards Codification (“ASC”) is the exclusive reference of authoritative U.S. generally accepted accounting principles (“GAAP”) recognized by the FASB to be applied by nongovernmental entities. Rules and interpretive releases of the Securities and Exchange Commission (“SEC”) under authority of federal laws are also sources of authoritative GAAP for SEC registrants. The fund’s financial statements are prepared in accordance with GAAP, which may require the use of management estimates and assumptions. Actual results could differ from those estimates.
(a) Portfolio valuation: The fair value of a financial instrument is the amount that would be received to sell an asset or paid to transfer a liability in an orderly transaction between market participants at the measurement date (i.e., the exit price). GAAP establishes a fair value hierarchy that prioritizes the inputs of valuation techniques used to measure fair value. This hierarchy gives the highest priority to unadjusted quoted prices in active markets for identical assets or liabilities (Level 1 measurements) and the lowest priority to unobservable inputs (Level 3 measurements).
Additionally, GAAP provides guidance on determining whether the volume and activity in a market has decreased significantly and whether such a decrease in activity results in transactions that are not orderly. GAAP requires enhanced disclosures around valuation inputs and techniques used during annual and interim periods.
Various inputs are used in determining the value of the fund’s investments relating to fair value measurements. These inputs are summarized in the three broad levels listed below:
Level 1—unadjusted quoted prices in active markets for identical investments.
Level 2—other significant observable inputs (including quoted prices for similar investments, interest rates, prepayment speeds, credit risk, etc.).
Level 3—significant unobservable inputs (including the fund’s own assumptions in determining the fair value of investments).
20
The inputs or methodology used for valuing securities are not necessarily an indication of the risk associated with investing in those securities.
Changes in valuation techniques may result in transfers in or out of an assigned level within the disclosure hierarchy. Valuation techniques used to value the fund’s investments are as follows:
Registered investment companies that are not traded on an exchange are valued at their net asset value and are generally categorized within Level 1 of the fair value hierarchy.
Investments in securities, excluding short-term investments (other than U.S. Treasury Bills), and financial futures are valued each business day by an independent pricing service (the “Service”) approved by the Company’s Board of Directors (the “Board”). Investments for which quoted bid prices are readily available and are representative of the bid side of the market in the judgment of the Service are valued at the mean between the quoted bid prices (as obtained by the Service from dealers in such securities) and asked prices (as calculated by the Service based upon its evaluation of the market for such securities). Other investments (which constitute a majority of the portfolio securities) are valued as determined by the Service, based on methods which include consideration of the following: yields or prices of securities of comparable quality, coupon, maturity and type; indications as to values from dealers; and general market conditions. These securities are generally categorized within Level 2 of the fair value hierarchy.
The Service’s procedures are reviewed by Dreyfus under the general supervision of the Board.
When market quotations or official closing prices are not readily available, or are determined not to reflect accurately fair value, such as when the value of a security has been significantly affected by events after the close of the exchange or market on which the security is principally traded (for example, a foreign exchange or market), but before the fund calculates its net asset value, the fund may value these investments at fair value as determined in accordance with the procedures approved by the Board. Certain factors may be considered when fair valuing investments such as: fundamental analytical data, the nature and duration of restrictions on disposition, an evaluation of the forces that influence the market in which the securities are purchased and sold, and public trading in similar securities of the issuer or comparable issuers. These securities are either categorized within Level 2 or 3 of the fair value hierarchy depending on the relevant inputs used.
21
NOTES TO FINANCIAL STATEMENTS (continued)
For restricted securities where observable inputs are limited, assumptions about market activity and risk are used and are generally categorized within Level 3 of the fair value hierarchy.
Financial futures, which are traded on an exchange, are valued at the last sales price on the securities exchange on which such securities are primarily traded or at the last sales price on the national securities market on each business day and are generally categorized within Level 1 of the fair value hierarchy.
The following is a summary of the inputs used as of October 31, 2015 in valuing the fund’s investments:
| | | | | | |
Assets ($) | Level 1 Unadjusted Quoted Prices | Level 2 - Other Significant Observable Inputs | | Level 3 Significant Unobservable Inputs | Total |
Investments in Securities: | | | |
Corporate Bonds† | - | 11,007,890 | | — | 11,007,890 |
Foreign Government | - | 12,786,457 | | — | 12,786,457 |
Mutual Funds | 487,526 | - | | — | 487,526 |
† See Statement of Investments for additional detailed categorizations.
At October 31, 2015, there were no transfers between Level 1, Level 2 and Level 3 of the fair value hierarchy.
(b) Securities transactions and investment income: Securities transactions are recorded on a trade date basis. Realized gains and losses from securities transactions are recorded on the identified cost basis. Dividend income is recognized on the ex-dividend date and interest income, including, where applicable, accretion of discount and amortization of premium on investments, is recognized on the accrual basis.
(c) Affiliated issuers: Investments in other investment companies advised by Dreyfus are defined as “affiliated” under the Act. Investments in affiliated investment companies during the period ended October 31, 2015 were as follows:
22
| | | | | | |
Affiliated Investment Company | Value 12/3/2014 ($) | Purchases ($) | Sales ($) | Value 10/31/2015 ($) | Net Asset (%) |
Dreyfus Institutional Preferred Plus Money Market Fund | — | 36,935,806 | 36,448,280 | 487,526 | 2.0 |
(d) Risk: The fund invests primarily in debt securities. Failure of an issuer of the debt securities to make timely interest or principal payments, or a decline or the perception of a decline in the credit quality of a debt security, can cause the debt security’s price to fall, potentially lowering the fund’s share price. In addition, the value of debt securities may decline due to general market conditions that are not specifically related to a particular issuer, such as real or perceived adverse economic conditions, changes in outlook for corporate earnings, changes in interest or currency rates or adverse investor sentiment. They may also decline because of factors that affect a particular industry.
(e) Dividends to shareholders: Dividends are recorded on the ex-dividend date. Dividends from investment income-net are normally declared and paid on a monthly basis. Dividends from net realized capital gains, if any, are normally declared and paid annually, but the fund may make distributions on a more frequent basis to comply with the distribution requirements of the Internal Revenue Code of 1986, as amended (the “Code”). To the extent that net realized capital gains can be offset by capital loss carryovers, it is the policy of the fund not to distribute such gains. Income and capital gain distributions are determined in accordance with income tax regulations, which may differ from GAAP.
On October 30, 2015, the Board declared a cash dividend of $.045, $.038, $.047 and $.048 per share from undistributed investment income-net for Class A, Class C, Class I and Class Y shares, respectively, payable on November 2, 2015 (ex-dividend date), to shareholders of record as of the close of business on October 30, 2015.
(f) Federal income taxes: It is the policy of the fund to continue to qualify as a regulated investment company, if such qualification is in the best interests of its shareholders, by complying with the applicable provisions of the Code, and to make distributions of taxable income sufficient to relieve it from substantially all federal income and excise taxes.
As of and during the period ended October 31, 2015, the fund did not have any liabilities for any uncertain tax positions. The fund recognizes interest and penalties, if any, related to uncertain tax positions as income
23
NOTES TO FINANCIAL STATEMENTS (continued)
tax expense in the Statement of Operations. During the period ended October 31, 2015, the fund did not incur any interest or penalties.
The tax year for the period ended October 31, 2015 remains subject to examination by the Internal Revenue Service and state taxing authorities.
At October 31, 2015, the components of accumulated earnings on a tax basis were as follows: undistributed ordinary income $124,004, accumulated capital losses $488,509 and unrealized depreciation $790,926.
Under the Regulated Investment Company Modernization Act of 2010, the fund is permitted to carry forward capital losses for an unlimited period. Furthermore, capital loss carryovers retain their character as either short-term or long-term capital losses.
The accumulated capital loss carryover is available for federal income tax purposes to be applied against future net realized capital gains, if any, realized subsequent to October 31, 2015. The fund has $484,182 of short-term capital losses and $4,327 of long-term capital losses which can be carried forward for an unlimited period.
The tax character of distributions paid to shareholders during the fiscal period ended October 31, 2015 was as follows: ordinary income $902,110.
During the period ended October 31, 2015, as a result of permanent book to tax differences, primarily due to the tax treatment for amortization of premiums and fund start-up costs, the fund increased accumulated undistributed investment income-net by $106,647, decreased accumulated net realized gain (loss) on investments by $97,627 and decreased paid-in capital by $9,020. Net assets and net asset value per share were not affected by this reclassification.
NOTE 2—Bank Lines of Credit:
The fund participates with other Dreyfus-managed funds in a $480 million unsecured credit facility led by Citibank, N.A. and a $300 million unsecured credit facility provided by The Bank of New York Mellon (each, a “Facility”), each to be utilized primarily for temporary or emergency purposes, including the financing of redemptions. In connection therewith, the fund has agreed to pay its pro rata portion of commitment fees for each Facility. Interest is charged to the fund based on rates determined pursuant to the terms of the respective Facility at the time of borrowing. During the period ended October 31, 2015, the fund did not borrow under the Facilities.
24
NOTE 3—Investment Advisory Fee, Sub-Investment Advisory Fee and Other Transactions with Affiliates:
(a) Pursuant to a management agreement with Dreyfus, the management fee is computed at the annual rate of .50% of the value of the fund’s average daily net assets and is payable monthly. Dreyfus has contractually agreed, from December 3, 2014 through March 1, 2016, to waive receipt of its fees and/or assume the direct expenses of the fund, so that the expenses of none of the classes (excluding Rule 12b-1 Distribution Plan fees, Shareholder Services Plan fees, taxes, brokerage commissions and extraordinary expenses) exceed .65% of the value of the fund’s average daily net assets. The reduction in expenses, pursuant to the undertaking amounted to $179,204 during the period ended October 31, 2015.
Pursuant to a sub-investment advisory agreement between Dreyfus and Standish, Standish serves as the fund’s sub-investment adviser responsible for the day-to–day management of the fund’s portfolio. Dreyfus pays the sub-investment adviser a monthly fee at an annual percentage of the value of the fund’s average daily net assets. Dreyfus has obtained an exemptive order from the SEC (the “Order”), upon which the fund may rely, to use a manager of managers approach that permits Dreyfus, subject to certain conditions and approval by the Board, to enter into and materially amend sub-investment advisory agreements with one or more sub-investment advisers who are either unaffiliated with Dreyfus or are wholly-owned subsidiaries (as defined under the Act) of Dreyfus’ ultimate parent company, BNY Mellon, without obtaining shareholder approval. The Order also allows the fund to disclose the sub-investment advisory fee paid by Dreyfus to any unaffiliated sub-investment adviser in the aggregate with other unaffiliated sub-investment advisers in documents filed with the SEC and provided to shareholders. In addition, pursuant to the Order, it is not necessary to disclose the sub-investment advisory fee payable by Dreyfus separately to a sub-investment adviser that is a wholly-owned subsidiary of BNY Mellon in documents filed with the SEC and provided to shareholders; such fees are to be aggregated with fees payable to Dreyfus. Dreyfus has ultimate responsibility (subject to oversight by the Board) to supervise any sub-investment adviser and recommend the hiring, termination, and replacement of any sub-investment adviser to the Board.
(b) Under the Distribution Plan adopted pursuant to Rule 12b-1 under the Act, Class C shares pay the Distributor for distributing its shares at an annual rate of .75% of the value of its average daily net assets. During the period ended October 31, 2015, Class C shares were charged $667 pursuant to the Distribution Plan.
25
NOTES TO FINANCIAL STATEMENTS (continued)
(c) Under the Shareholder Services Plan, Class A and Class C shares pay the Distributor at an annual rate of .25% of the value of their average daily net assets for the provision of certain services. The services provided may include personal services relating to shareholder accounts, such as answering shareholder inquiries regarding the fund and providing reports and other information, and services related to the maintenance of shareholder accounts. The Distributor may make payments to Service Agents (securities dealers, financial institutions or other industry professionals) with respect to these services. The Distributor determines the amounts to be paid to Service Agents. During the period ended October 31, 2015, Class A and Class C shares were charged $223 and $222, respectively, pursuant to the Shareholder Services Plan.
Under its terms, the Distribution Plan and Shareholder Services Plan shall remain in effect from year to year, provided such continuance is approved annually by a vote of a majority of those Directors who are not “interested persons” of the Company and who have no direct or indirect financial interest in the operation of or in any agreement related to the Distribution Plan and Shareholder Services Plan.
The fund has arrangements with the transfer agent and the custodian whereby the fund may receive earnings credits when positive cash balances are maintained, which are used to offset transfer agency and custody fees. For financial reporting purposes, the fund includes net earnings credits as an expense offset in the Statement of Operations.
The fund compensates Dreyfus Transfer, Inc., a wholly-owned subsidiary of Dreyfus, under a transfer agency agreement for providing transfer agency and cash management services for the fund. The majority of transfer agency fees are comprised of amounts paid on a per account basis, while cash management fees are related to fund subscriptions and redemptions. During the period ended October 31, 2015, the fund was charged $34 for transfer agency services and $258 for cash management services. These fees are included in Shareholder servicing costs in the Statement of Operations. Cash management fees were partially offset by earnings credits of $1.
The fund compensates The Bank of New York Mellon under a custody agreement for providing custodial services for the fund. These fees are determined based on net assets, geographic region and transaction activity. During the period ended October 31, 2015, the fund was charged $8,532 pursuant to the custody agreement.
During the period ended October 31, 2015, the fund was charged $9,843 for services performed by the Chief Compliance Officer and his staff.
26
The components of “Due from The Dreyfus Corporation and affiliates” in the Statement of Assets and Liabilities consist of: management fees $10,239, Distribution Plan fees $60, Shareholder Services Plan fees $40, custodian fees $4,085, Chief Compliance Officer fees $882 and transfer agency fees $34, which are offset against an expense reimbursement currently in effect in the amount of $19,864.
(d) Each Board member also serves as a Board member of other funds within the Dreyfus complex. Annual retainer fees and attendance fees are allocated to each fund based on net assets.
(e) A 2% redemption fee is charged and retained by the fund on certain shares redeemed within sixty days following the date of issuance subject to certain exceptions, including redemptions made through use of the fund’s exchange privilege. During the period ended October 31, 2015, redemption fees charged and retained by the fund amounted to $20.
NOTE 4—Securities Transactions:
The aggregate amount of purchases and sales of investment securities, excluding short-term securities and financial futures during the period ended October 31, 2015, amounted to $40,690,110 and $15,666,675, respectively.
Derivatives: A derivative is a financial instrument whose performance is derived from the performance of another asset. Each type of derivative instrument that was held by the fund during the period ended October 31, 2015 is discussed below.
Financial Futures: In the normal course of pursuing its investment objective, the fund is exposed to market risk, including interest rate risk as a result of changes in value of underlying financial instruments. The fund invests in financial futures in order to manage its exposure to or protect against changes in the market. A financial futures contract represents a commitment for the future purchase or a sale of an asset at a specified date. Upon entering into such contracts, these investments require initial margin deposits with a counterparty, which consist of cash or cash equivalents. The amount of these deposits is determined by the exchange or Board of Trade on which the contract is traded and is subject to change. Accordingly, variation margin payments are received or made to reflect daily unrealized gains or losses which are recorded in the Statement of Operations. When the contracts are closed, the fund recognizes a realized gain or loss which is reflected in the Statement of Operations. There is minimal counterparty credit risk to the fund with financial futures since they are exchange traded, and the exchange guarantees the financial futures
27
NOTES TO FINANCIAL STATEMENTS (continued)
against default. At October 31, 2015, there were no financial futures outstanding.
The following summarizes the average market value of derivatives outstanding during the period ended October 31, 2015:
| | | | | | |
| | | | | Average Market Value ($) |
Interest rate financial futures | | | 785,115 |
At October 31, 2015, the cost of investments for federal income tax purposes was $25,072,799; accordingly, accumulated net unrealized depreciation on investments was $790,926, consisting of $307,253 gross unrealized appreciation and $1,098,179 gross unrealized depreciation.
28
REPORT OF INDEPENDENT REGISTERED
PUBLIC ACCOUNTING FIRM
The Board of Directors and Shareholders of
Dreyfus BNY Mellon Fund, Inc.
We have audited the accompanying statement of assets and liabilities of Dreyfus Emerging Markets Debt U.S. Dollar Fund (the “Fund”), a series of Dreyfus BNY Mellon Fund, Inc., including the statement of investments, as of October 31, 2015, and the related statement of operations, the statement of changes in net assets and the financial highlights for the period from December 3, 2014 (commencement of operations) through October 31, 2015. These financial statements and financial highlights are the responsibility of the Fund’s management. Our responsibility is to express an opinion on these financial statements and financial highlights based on our audit.
We conducted our audit in accordance with the standards of the Public Company Accounting Oversight Board (United States). Those standards require that we plan and perform the audit to obtain reasonable assurance about whether the financial statements and financial highlights are free of material misstatement. An audit includes examining, on a test basis, evidence supporting the amounts and disclosures in the financial statements. Our procedures included confirmation of securities owned as of October 31, 2015, by correspondence with the custodian and brokers or by other appropriate auditing procedures. An audit also includes assessing the accounting principles used and significant estimates made by management, as well as evaluating the overall financial statement presentation. We believe that our audit provides a reasonable basis for our opinion.
In our opinion, the financial statements and financial highlights referred to above present fairly, in all material respects, the financial position of Dreyfus Emerging Markets Debt U.S. Dollar Fund as of October 31, 2015, and the results of its operations, the changes in its net assets and the financial highlights for the period from December 3, 2014 (commencement of operations) through October 31, 2015, in conformity with U.S. generally accepted accounting principles.

New York, New York
December 30, 2015
29
BOARD MEMBERS INFORMATION (Unaudited)
INDEPENDENT BOARD MEMBERS
Joseph S. DiMartino (72)
Chairman of the Board (1999)
Principal Occupation During Past 5 Years:
· Corporate Director and Trustee (1995-present)
Other Public Company Board Memberships During Past 5 Years:
· CBIZ (formerly, Century Business Services, Inc.), a provider of outsourcing functions for small and medium size companies, Director (1997-present)
· The Newark Group, a provider of a national market of paper recovery facilities, paperboard mills and paperboard converting plants, Director (2000-2010)
No. of Portfolios for which Board Member Serves: 140
———————
Francine J. Bovich (64)
Board Member (2012)
Principal Occupation During Past 5 Years:
· Trustee, The Bradley Trusts, private trust funds (2011-present)
· Managing Director, Morgan Stanley Investment Management (1993-2010)
Other Public Company Board Memberships During Past 5 Years:
· Annaly Capital Management, Inc., Board Member (May 2014-present)
No. of Portfolios for which Board Member Serves: 79
———————
Kenneth A. Himmel (69)
Board Member (1994)
Principal Occupation During Past 5 Years:
· Managing Partner, Gulf Related, an international real estate development company (2010-present)
· President and CEO, Related Urban Development, a real estate development company (1996-present)
· President and CEO, Himmel & Company, a real estate development company (1980-present)
· CEO, American Food Management, a restaurant company (1983-present)
No. of Portfolios for which Board Member Serves: 29
———————
30
Stephen J. Lockwood (68)
Board Member (1994)
Principal Occupation During Past 5 Years:
· Chairman of the Board, Stephen J. Lockwood and Company LLC, a real estate investment company (2000-present)
No. of Portfolios for which Board Member Serves: 29
———————
Roslyn M. Watson (66)
Board Member (1994)
Principal Occupation During Past 5 Years:
· Principal, Watson Ventures, Inc., a real estate investment company (1993-present)
No. of Portfolios for which Board Member Serves: 65
———————
Benaree Pratt Wiley (69)
Board Member (1998)
Principal Occupation During Past 5 Years:
· Principal, The Wiley Group, a firm specializing in strategy and business development (2005-present)
Other Public Company Board Memberships During Past 5 Years:
· CBIZ (formerly, Century Business Services, Inc.), a provider of outsourcing functions for small and medium size companies, Director (2008-present)
No. of Portfolios for which Board Member Serves: 65
———————
Once elected all Board Members serve for an indefinite term, but achieve Emeritus status upon reaching age 80. The address of the Board Members and Officers is c/o The Dreyfus Corporation, 200 Park Avenue, New York, New York 10166. Additional information about the Board Members is available in the fund’s Statement of Additional Information which can be obtained from Dreyfus free of charge by calling this toll free number: 1-800-DREYFUS.
James M. Fitzgibbons, Emeritus Board Member
31
OFFICERS OF THE FUND (Unaudited)
BRADLEY J. SKAPYAK, President since January 2010.
Chief Operating Officer and a director of the Manager since June 2009, Chairman of Dreyfus Transfer, Inc., an affiliate of the Manager and the transfer agent of the funds, since May 2011 and Executive Vice President of the Distributor since June 2007. From April 2003 to June 2009, Mr. Skapyak was the head of the Investment Accounting and Support Department of the Manager. He is an officer of 66 investment companies (comprised of 140 portfolios) managed by the Manager. He is 56 years old and has been an employee of the Manager since February 1988.
BENNETT A. MACDOUGALL, Chief Legal Officer since October 2015
Chief Legal Officer of the Manager since June 2015; from June 2005 to June 2015, Director and Associate General Counsel of Deutsche Bank – Asset & Wealth Management Division, and Chief Legal Officer of Deutsche Investment Management Americas Inc. He is an officer of 67 investment companies (comprised of 165 portfolios) managed by the Manager. He is 44 years old and has been an employee of the Manager since June 2015.
JANETTE E. FARRAGHER, Vice President and Secretary since December 2011.
Assistant General Counsel of BNY Mellon, and an officer of 67 investment companies (comprised of 165 portfolios) managed by the Manager. She is 52 years old and has been an employee of the Manager since February 1984.
JAMES BITETTO, Vice President and Assistant Secretary since August 2005.
Managing Counsel of BNY Mellon and Secretary of the Manager, and an officer of 67 investment companies (comprised of 165 portfolios) managed by the Manager. He is 49 years old and has been an employee of the Manager since December 1996.
JONI LACKS CHARATAN, Vice President and Assistant Secretary since August 2005.
Managing Counsel of BNY Mellon, and an officer of 67 investment companies (comprised of 165 portfolios) managed by the Manager. She is 59 years old and has been an employee of the Manager since October 1988.
JOSEPH M. CHIOFFI, Vice President and Assistant Secretary since August 2005.
Managing Counsel of BNY Mellon, and an officer of 67 investment companies (comprised of 165 portfolios) managed by the Manager. He is 53 years old and has been an employee of the Manager since June 2000.
JOHN B. HAMMALIAN, Vice President and Assistant Secretary since August 2005.
Senior Managing Counsel of BNY Mellon, and an officer of 67 investment companies (comprised of 165 portfolios) managed by the Manager. He is 52 years old and has been an employee of the Manager since February 1991.
MAUREEN E. KANE, Vice President and Assistant Secretary since April 2015.
Managing Counsel of BNY Mellon since July 2014; from October 2004 until July 2014, General Counsel, and from May 2009 until July 2014, Chief Compliance Officer of Century Capital Management. She is an officer of 67 investment companies (comprised of 165 portfolios) managed by the Manager. She is 53 years old and has been an employee of the Manager since July 2014.
SARAH S. KELLEHER, Vice President and Assistant Secretary since April 2014.
Senior Counsel of BNY Mellon, and an officer of 67 investment companies (comprised of 165 portfolios) managed by the Manager; from August 2005 to March 2013, Associate General Counsel of Third Avenue Management. She is 40 years old and has been an employee of the Manager since March 2013.
JEFF PRUSNOFSKY, Vice President and Assistant Secretary since August 2005.
Senior Managing Counsel of BNY Mellon, and an officer of 67 investment companies (comprised of 165 portfolios) managed by the Manager. He is 50 years old and has been an employee of the Manager since October 1990.
JAMES WINDELS, Treasurer since November 2001.
Director – Mutual Fund Accounting of the Manager, and an officer of 67 investment companies (comprised of 165 portfolios) managed by the Manager. He is 57 years old and has been an employee of the Manager since April 1985.
32
RICHARD CASSARO, Assistant Treasurer since January 2008.
Senior Accounting Manager – Money Market and Municipal Bond Funds of the Manager, and an officer of 67 investment companies (comprised of 165 portfolios) managed by the Manager. He is 56 years old and has been an employee of the Manager since September 1982.
GAVIN C. REILLY, Assistant Treasurer since December 2005.
Tax Manager of the Investment Accounting and Support Department of the Manager, and an officer of 67 investment companies (comprised of 165 portfolios) managed by the Manager. He is 47 years old and has been an employee of the Manager since April 1991.
ROBERT S. ROBOL, Assistant Treasurer since December 2002.
Senior Accounting Manager – Fixed Income Funds of the Manager, and an officer of 67 investment companies (comprised of 165 portfolios) managed by the Manager. He is 51 years old and has been an employee of the Manager since October 1988.
ROBERT SALVIOLO, Assistant Treasurer since July 2007.
Senior Accounting Manager – Equity Funds of the Manager, and an officer of 67 investment companies (comprised of 165 portfolios) managed by the Manager. He is 48 years old and has been an employee of the Manager since June 1989.
ROBERT SVAGNA, Assistant Treasurer since December 2002.
Senior Accounting Manager – Equity Funds of the Manager, and an officer of 67 investment companies (comprised of 165 portfolios) managed by the Manager. He is 48 years old and has been an employee of the Manager since November 1990.
JOSEPH W. CONNOLLY, Chief Compliance Officer since October 2004.
Chief Compliance Officer of the Manager and The Dreyfus Family of Funds (67 investment companies, comprised of 165 portfolios). He is 58 years old and has served in various capacities with the Manager since 1980, including manager of the firm’s Fund Accounting Department from 1997 through October 2001.
33
Dreyfus Emerging Markets Debt U.S. Dollar Fund
200 Park Avenue
New York, NY 10166
Manager
The Dreyfus Corporation
200 Park Avenue
New York, NY 10166
Sub-Investment Adviser
Newton Capital Management Limited
160 Queen Victoria Street,
London, EC4V, 4LA, UK
Custodian
The Bank of New York Mellon
225 Liberty Street
New York, NY 10286
Transfer Agent &
Dividend Disbursing Agent
Dreyfus Transfer, Inc.
200 Park Avenue
New York, NY 10166
Distributor
MBSC Securities Corporation
200 Park Avenue
New York, NY 10166
| | |
Ticker Symbols: | Class A: DMEAX Class C: DMMCX Class I: DMEIX Class Y: DMEYX |
Telephone Call your financial representative or 1-800-DREYFUS
Mail The Dreyfus Family of Funds, 144 Glenn Curtiss Boulevard, Uniondale, NY 11556-0144
E-mail Send your request to info@dreyfus.com
Internet Information can be viewed online or downloaded at www.dreyfus.com
The fund files its complete schedule of portfolio holdings with the Securities and Exchange Commission (“SEC”) for the first and third quarters of each fiscal year on Form N-Q. The fund’s Forms N-Q are available on the SEC’s website at www.sec.gov and may be reviewed and copied at the SEC’s Public Reference Room in Washington, DC. (phone 1-800-SEC-0330 for information).
A description of the policies and procedures that the fund uses to determine how to vote proxies relating to portfolio securities and information regarding how the fund voted these proxies for the most recent 12-month period ended June 30 is available at www.dreyfus.com and on the SEC’s website at www.sec.gov and without charge, upon request, by calling 1-800-DREYFUS.
| | |
© 2015 MBSC Securities Corporation
4000AR1015 | 
|
Dreyfus Global Emerging Markets Fund
| | | |
| | ANNUAL REPORT October 31, 2015 |
| |
Save time. Save paper. View your next shareholder report online as soon as it’s available. Log into www.dreyfus.com and sign up for Dreyfus eCommunications. It’s simple and only takes a few minutes. |
| |
The views expressed in this report reflect those of the portfolio manager only through the end of the period covered and do not necessarily represent the views of Dreyfus or any other person in the Dreyfus organization. Any such views are subject to change at any time based upon market or other conditions and Dreyfus disclaims any responsibility to update such views. These views may not be relied on as investment advice and, because investment decisions for a Dreyfus fund are based on numerous factors, may not be relied on as an indication of trading intent on behalf of any Dreyfus fund. |
| |
Not FDIC-Insured • Not Bank-Guaranteed • May Lose Value |
Contents
T H E F U N D
F O R M O R E I N F O R M AT I O N
Back Cover
| | | | |
| |
Dreyfus Global Emerging Markets Fund
| | The Fund |
A LETTER FROM THE PRESIDENT
Dear Shareholder:
We are pleased to present this annual report for Dreyfus Global Emerging Markets Fund, covering the 12-month period from November 1, 2014, through October 31, 2015. For information about how the fund performed during the reporting period, as well as general market perspectives, we provide a Discussion of Fund Performance on the pages that follow.
Financial markets proved volatile over the reporting period amid choppy U.S. and global economic growth. U.S. stocks advanced over the final months of 2014 and the spring of 2015, with some broad measures of market performance setting new record highs. Those gains were largely erased over the summer when global economic instability undermined investor sentiment, but a renewed rally in October enabled most broad stock indices to end the reporting period in positive territory. In contrast, international stocks generally lost a degree of value, with developed markets faring far better than emerging markets amid falling commodity prices and depreciating currency values. U.S. bonds generally produced modestly positive total returns, with municipal bonds and longer term U.S. government securities faring better, on average, than corporate-backed bonds.
We expect market volatility to persist over the near term until investors see greater clarity regarding short-term U.S. interest rates and global economic conditions. Our investment strategists and portfolio managers are monitoring developments carefully, keeping a close watch on credit spreads, currency values, commodity prices, corporate profits, economic trends in the emerging markets, and other developments that could influence investor sentiment. Over the longer term, we remain confident that markets are likely to benefit as investors increasingly recognize that inflation is likely to stay low, economic growth expectations are stabilizing, and monetary policies remain accommodative in most regions of the world. In our view, investors will continue to be well served under these circumstances by a long-term perspective and a disciplined investment approach.
Thank you for your continued confidence and support.
Sincerely,

J. Charles Cardona
President
The Dreyfus Corporation
November 16, 2015
2
DISCUSSION OF FUND PERFORMANCE
For the period of November 1, 2014, through October 31, 2015, as provided by Robert Marshall-Lee and Sophia Whitbread, CFA, Primary Portfolio Managers of Newton Capital Management Limited, Sub-Investment Adviser
Fund and Market Performance Overview
For the 12-month period ended October 31, 2015, Dreyfus Global Emerging Markets Fund’s Class A shares produced a total return of -11.80%, Class C shares returned -12.51%, Class I shares returned -11.68%, and Class Y shares returned -11.51%.1 In comparison, the Morgan Stanley Capital International Emerging Markets Index (“MSCI EM Index”), the fund’s benchmark, returned -14.53% for the same period.2
Emerging-markets equities suffered during the reporting period amid economic slowdowns, falling commodity prices, and depreciating currency values. Our sector and geographic allocation strategies enabled the fund to outperform its benchmark.
The Fund’s Investment Approach
The fund seeks long-term capital appreciation. To pursue its goal, the fund normally invests at least 80% of its assets in common stocks and other equity securities of companies in emerging market countries. We employ a fundamental, bottom-up investment process that emphasizes quality, return on capital employed, and governance. The process of identifying investment ideas begins by identifying a core list of investment themes. These themes are based primarily on observable global economic, industrial, or social trends that we believe will positively affect certain regions or industries and cause stocks within these regions or industries to outperform others on a five year view. We then focus our stock-picking using investment themes to help focus on areas where our themes suggest superior growth potential and fundamental analysis to ensure that we have the right stocks to best capture this growth potential in terms of capital appreciation with a reduced absolute risk profile by avoiding the riskiest areas, as identified via these themes.
Emerging Markets Equities Fell Sharply
The emerging markets endured very difficult economic and market conditions over much of the reporting period. Slowing demand for industrial materials from the rebalancing Chinese economy and plummeting petroleum prices pressured commodity exporters, such as Russia and Brazil, where the fund was heavily underweight. In China, monetary easing supported the local stock market until late summer 2015, when continued economic weakness and currency devaluation drove stocks sharply lower, providing great opportunities to buy great companies caught unfairly in the downdraught. We do not share the market’s fear of a large devaluation of the Chinese Renminbi. India’s economy proved somewhat insulated from the slowdown in Chinese growth, but Indian equities dipped over the reporting period’s second half when domestic growth disappointed some investors whom had expected more from the business-friendly government. Latin America was especially hard hit by weak commodity prices, and Brazil further suffered amid corporate and government scandals. Markets more heavily leveraged to defensive sectors, such as the Philippines, and those more closely tied to the growing U.S. economy, such as Mexico, tended to perform better during the second half of the reporting period.
3
DISCUSSION OF FUND PERFORMANCE (continued)
Falling emerging-markets stock prices were magnified for U.S. investors by declines in most local currencies against the U.S. dollar, with many such currencies now trading at attractive levels, as highlighted by inflections in current account balances.
Structural Growth Strategies Boosted Relative Performance
Although we are never satisfied with double-digit negative returns, our benchmark agnostic strategy and stock selection helped cushion the brunt of the market’s weakness. We maintained relatively heavy exposure to the better performing consumer, technology, and health care sectors, and underweighted positions in the struggling energy and basic materials sectors. From a country allocation perspective, our focus on India and the Philippines fared well when local economic growth and currency values remained robust. A large underweighted position in Brazil also was helpful.
Among individual stocks, the reporting period’s top contributor to relative performance was Indian car company Maruti Suzuki, as growing consumer confidence and relatively low consumer debt provided a fertile environment for the firm’s growth. In South Africa, Naspers continued to benefit from its substantial holding in fast-growing Chinese Internet social network Tencent Holdings, also held by the fund. Elsewhere, India’s Glenmark Pharmaceuticals performed well after adding to its string of U.S. approvals for the company’s drugs.
On a more negative note, the most significant detractor from relative performance was gaming company Wynn Macau, which encountered declining traffic volumes in its VIP and mass markets due to aggressive anti-corruption measures in China. India’s Tata Motors performed poorly amid worries about exports to China. In addition, Mexico’s Genomma Lab underperformed due to some company-specific issues, but has since replaced the management team and we retain a reduced position.
A Selective Investment Posture
We view the emerging markets as a collection of differentiated prospects depending on the specific country, industry group, and company being considered, which can be lost via an index-level analysis. Macroeconomic factors have continued to dominate developing markets due to the impact of falling commodities prices, sluggish global demand, the rebalancing of China’s economy towards a more sustainable consumer-driven model, and the likelihood of higher short-term interest rates in the United States. China’s rebalancing will continue to lead to overcapacity in commodities and consequent problems for commodity exporters, but this is also very positive for other developing economies, which import commodities, such as India, which tends to be hidden at the aggregated Emerging Market asset class level. With a benchmark agnostic strategy, we can avoid the unattractive areas and focus on the attractive areas of strong growth potential.
In this environment, we have retained our general preference for companies in countries—such as India, the Philippines, and Mexico—that are adjusting towards the changing global backdrop and are reforming to address fiscal deficits while stimulating new avenues of growth. We also have focused on individual companies whose structural growth potential relies more on secular trends than economic growth, such as certain Internet and health care companies. Finally, in our judgment, recent market weakness has provided attractive buying
4
opportunities among highly selective, high-quality growth companies for long-term investors at depressed currency exchange rates.
November 16, 2015
Equity securities are subject generally to market, market sector, market liquidity, issuer, and investment style risks, among other factors, to varying degrees, all of which are more fully described in the fund’s prospectus.
Emerging markets tend to be more volatile than the markets of more mature economies and generally have less diverse and less mature economic structures and less stable political systems than those of developed countries. The securities of companies located in emerging markets are often subject to rapid and large changes in price. An investment in this fund should be considered only as a supplement to a complete investment program for those investors willing to accept the greater risks associated with investing in emerging market countries.
Investing internationally involves special risks, including changes in currency exchange rates, political, economic, and social instability, a lack of comprehensive company information, differing auditing and legal standards, and less market liquidity. These risks generally are greater with emerging market countries than with more economically and politically established foreign countries.
¹ Total return includes reinvestment of dividends and any capital gains paid and does not take into consideration the maximum initial sales charge in the case of Class A shares, or the applicable contingent deferred sales charges imposed on redemptions in the case of Class C shares. Had these charges been reflected, returns would have been lower. Past performance is no guarantee of future results. Share price, yield, and investment return fluctuate such that upon redemption, fund shares may be worth more or less than their original cost. Return figures provided reflect an undertaking for the absorption of certain fund expenses by The Dreyfus Corporation through March 1, 2016, at which time it may be extended, terminated, or modified. Had these expenses not been absorbed, the fund’s returns would have been lower.
2 SOURCE: Lipper Inc. — Reflects reinvestment of net dividends and, where applicable, capital gain distributions. The Morgan Stanley Capital International Emerging Markets (MSCI EM) Index is a market capitalization-weighted index composed of companies representative of the market structure of select designated emerging market countries in Europe, Latin America, and the Pacific Basin. Investors cannot invest directly in any index.
5
FUND PERFORMANCE
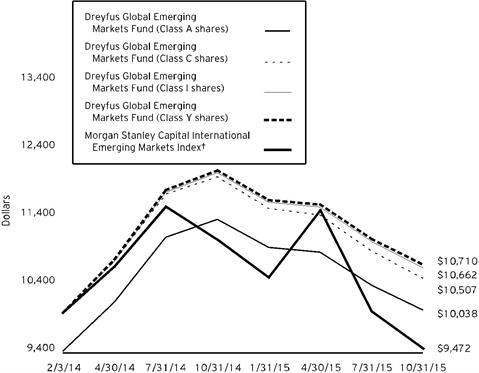
Comparison of change in value of $10,000 investment in Dreyfus Global Emerging Markets Fund Class A shares, Class C shares, Class I shares and Class Y shares, and the Morgan Stanley Capital International Emerging Markets Index.
† Source: Lipper Inc.
Past performance is not predictive of future performance.
The above graph compares a $10,000 investment made in each of the Class A, Class C, Class I and Class Y shares of Dreyfus Global Emerging Markets Fund on 2/3/14 (inception date) to a $10,000 investment made in the Morgan Stanley Capital International Emerging Markets Index (the “Index”) on that date. All dividends and capital gain distributions are reinvested.
The fund’s performance shown in the line graph above takes into account the maximum initial sales charge on Class A shares and all other applicable fees and expenses on all classes. The Index is a free-float-adjusted market-capitalization weighted index designed to measure the equity performance of emerging markets countries in Africa, Asia, Europe, Latin America and the Middle East. Unlike a mutual fund, the Index is not subject to charges, fees and other performance. Investors cannot invest directly in any index. Further information relating to fund performance, including expense reimbursements, if applicable, is contained in the Financial Highlights section of the prospectus and elsewhere in this report.
6
| | | | | | | |
Average Annual Total Returns as of 10/31/15 | | |
| | Inception Date | 1 Year | | From |
| | Inception |
Class A shares | | | | |
with maximum sales charge (5.75%) | | 2/3/14 | -16.86% | | 0.22% | |
without sales charge | | 2/3/14 | -11.80% | | 3.67% | |
Class C shares | | | | |
with applicable redemption charge † | | 2/3/14 | -13.37% | | 2.88% | |
without redemption | | 2/3/14 | -12.51% | | 2.88% | |
Class I shares | | 2/3/14 | -11.68% | | 3.75% | |
Class Y shares | | 2/3/14 | -11.51% | | 4.02% | |
Morgan Stanley Capital International | | | | |
Emerging Markets Index | | 1/31/14 | -14.53% | | -3.05% | †† |
Past performance is not predictive of future performance. The fund’s performance shown in the graph and table does not reflect the deduction of taxes that a shareholder would pay on fund distributions or the redemption of fund shares. In addition to the performance of Class A shares shown with and without a maximum sales charge, the fund’s performance shown in the table takes into account all other applicable fees and expenses on all classes.
† The maximum contingent deferred sales charge for Class C shares is 1% for shares redeemed within one year of the date of purchase.
†† For comparative purposes, the value of the Index as of 1/31/14 is used as the beginning value on 2/3/14.
7
UNDERSTANDING YOUR FUND’S EXPENSES (Unaudited)
As a mutual fund investor, you pay ongoing expenses, such as management fees and other expenses. Using the information below, you can estimate how these expenses affect your investment and compare them with the expenses of other funds. You also may pay one-time transaction expenses, including sales charges (loads) and redemption fees, which are not shown in this section and would have resulted in higher total expenses. For more information, see your fund’s prospectus or talk to your financial adviser.
Review your fund’s expenses
The table below shows the expenses you would have paid on a $1,000 investment in Dreyfus Global Emerging Markets Fund from May 1, 2015 to October 31, 2015. It also shows how much a $1,000 investment would be worth at the close of the period, assuming actual returns and expenses.
| | | | | | | | | | | | |
Expenses and Value of a $1,000 Investment | | |
assuming actual returns for the six months ended October 31, 2015 |
| | | | | | | | |
| | | | Class A | Class C | Class I | Class Y |
Expenses paid per $1,000† | $ | 7.75 | $ | 11.36 | $ | 6.54 | $ | 6.30 |
Ending value (after expenses) | $ | 921.60 | $ | 918.10 | $ | 922.30 | $ | 923.20 |
COMPARING YOUR FUND’S EXPENSES
WITH THOSE OF OTHER FUNDS (Unaudited)
Using the SEC’s method to compare expenses
The Securities and Exchange Commission (SEC) has established guidelines to help investors assess fund expenses. Per these guidelines, the table below shows your fund’s expenses based on a $1,000 investment, assuming a hypothetical 5% annualized return. You can use this information to compare the ongoing expenses (but not transaction expenses or total cost) of investing in the fund with those of other funds. All mutual fund shareholder reports will provide this information to help you make this comparison. Please note that you cannot use this information to estimate your actual ending account balance and expenses paid during the period.
| | | | | | | | | | | | |
Expenses and Value of a $1,000 Investment | | |
assuming a hypothetical 5% annualized return for the six months ended October 31, 2015 |
| | | | | | | | |
| | | | Class A | Class C | Class I | Class Y |
Expenses paid per $1,000† | $ | 8.13 | $ | 11.93 | $ | 6.87 | $ | 6.61 |
Ending value (after expenses) | $ | 1,017.14 | $ | 1,013.36 | $ | 1,018.40 | $ | 1,018.65 |
† Expenses are equal to the fund’s annualized expense ratio of 1.60% for Class A, 2.35% for Class C, 1.35% for Class I and 1.30% for Class Y, multiplied by the average account value over the period, multiplied by 184/365 (to reflect the one-half year period).
8
STATEMENT OF INVESTMENTS
October 31, 2015
| | | | | | |
Common Stocks - 99.2% | | Shares | | Value ($) | |
Australia - .4% | | | | | |
Oil Search | | 67,717 | | 379,068 | |
Chile - .4% | | | | | |
Sociedad Quimica y Minera Chile, ADR | | 18,922 | | 366,708 | |
China - 23.8% | | | | | |
3SBio | | 693,500 | a | 786,502 | |
Alibaba Group Holding, ADR | | 40,665 | b | 3,408,947 | |
Baidu, ADR | | 26,544 | b | 4,976,204 | |
China Biologic Products | | 24,622 | b | 2,805,431 | |
Ctrip.com International, ADR | | 20,052 | b | 1,864,234 | |
Hengan International Group | | 112,500 | | 1,218,535 | |
PetroChina, Cl. H | | 1,280,000 | | 1,000,800 | |
TAL Education Group, ADR | | 57,073 | b | 2,194,457 | |
Tencent Holdings | | 82,023 | | 1,551,438 | |
Vipshop Holdings, ADR | | 142,036 | b | 2,914,579 | |
YY, ADR | | 10,169 | b | 579,023 | |
| | | | | 23,300,150 | |
Cyprus - .1% | | | | | |
Eurasia Drilling, GDR | | 17,698 | | 135,226 | |
Germany - .1% | | | | | |
Rocket Internet | | 4,518 | a | 140,278 | |
Hong Kong - 4.5% | | | | | |
AIA Group | | 745,000 | | 4,383,144 | |
India - 28.6% | | | | | |
Amara Raja Batteries | | 81,519 | | 1,119,841 | |
Apollo Hospitals Enterprise | | 67,748 | | 1,360,255 | |
Axis Bank | | 304,056 | | 2,212,078 | |
Glenmark Pharmaceuticals | | 148,850 | | 2,258,547 | |
Godrej Consumer Products | | 112,172 | | 2,160,592 | |
Grasim Industries | | 15,794 | | 897,100 | |
Hero MotoCorp | | 49,384 | | 1,947,589 | |
ITC | | 728,440 | | 3,725,131 | |
Jubilant Foodworks | | 55,408 | | 1,241,831 | |
Maruti Suzuki India | | 61,433 | | 4,085,263 | |
Tata Consultancy Services | | 65,513 | | 2,498,974 | |
Tata Motors, ADR | | 132,965 | b | 3,931,775 | |
Titan | | 95,103 | | 509,077 | |
| | | | | 27,948,053 | |
9
STATEMENT OF INVESTMENTS (continued)
| | | | | | |
Common Stocks - 99.2% (continued) | | Shares | | Value ($) | |
Indonesia - .5% | | | | | |
Surya Citra Media | | 2,212,700 | | 472,851 | |
Macau - 3.2% | | | | | |
Sands China | | 512,800 | | 1,862,478 | |
Wynn Macau | | 890,000 | | 1,230,976 | |
| | | | | 3,093,454 | |
Malaysia - 1.3% | | | | | |
IHH Healthcare | | 900,800 | | 1,323,102 | |
Mexico - 5.0% | | | | | |
Arca Continental | | 63,977 | | 408,663 | |
Fibra Shop Portafolios Inmobiliarios | | 291,345 | | 291,759 | |
Fibra Uno Administracion | | 156,390 | | 342,930 | |
Genomma Lab Internacional, Cl. B | | 608,447 | b | 446,450 | |
Grupo Financiero Santander Mexico, Cl. B, ADR | | 165,694 | | 1,516,100 | |
Kimberly-Clark de Mexico, Cl. A | | 591,572 | | 1,415,736 | |
Southern Copper | | 15,749 | | 437,192 | |
| | | | | 4,858,830 | |
Philippines - 8.7% | | | | | |
Energy Development | | 3,011,500 | | 427,090 | |
First Gen | | 954,600 | | 515,835 | |
GT Capital Holdings | | 53,870 | | 1,511,858 | |
Metropolitan Bank & Trust | | 886,425 | | 1,610,219 | |
Robinsons Retail Holdings | | 440,600 | | 723,668 | |
Security Bank | | 368,394 | | 1,118,086 | |
Universal Robina | | 618,230 | | 2,648,803 | |
| | | | | 8,555,559 | |
Portugal - .5% | | | | | |
Galp Energia | | 43,588 | | 471,503 | |
South Africa - 12.5% | | | | | |
British American Tobacco | | 50,975 | | 3,023,250 | |
Cie Financiere Richemont | | 185,100 | | 1,594,463 | |
Discovery | | 98,730 | | 1,055,859 | |
Life Healthcare Group Holdings | | 454,722 | | 1,268,319 | |
Naspers, Cl. N | | 31,585 | | 4,626,259 | |
Net 1 UEPS Technologies | | 39,320 | b | 669,620 | |
| | | | | 12,237,770 | |
Taiwan - 5.8% | | | | | |
Catcher Technology | | 90,000 | | 887,150 | |
MediaTek | | 109,000 | | 854,513 | |
Taiwan Semiconductor Manufacturing | | 945,000 | | 3,973,462 | |
| | | | | 5,715,125 | |
10
| | | | | | |
Common Stocks - 99.2% (continued) | | Shares | | Value ($) | |
Turkey - .4% | | | | | |
Cola-Cola Icecek | | 29,062 | | 368,334 | |
United Arab Emirates - .5% | | | | | |
Al Noor Hospitals Group | | 28,688 | | 520,088 | |
United Kingdom - .8% | | | | | |
Bank of Georgia Holdings | | 25,504 | | 786,335 | |
United States - 2.1% | | | | | |
Yum! Brands | | 29,296 | | 2,077,379 | |
| | | | | | |
Total Investments (cost $92,531,839) | | 99.2% | | 97,132,957 | |
Cash and Receivables (Net) | | 0.8% | | 736,172 | |
Net Assets | | 100.0% | | 97,869,129 | |
ADR—American Depository Receipt
GDR—Global Depository Receipt
a Security exempt from registration pursuant to Rule 144A under the Securities Act of 1933. These securities may be resold in transactions exempt from registration, normally to qualified institutional buyers. At October 31, 2015, these securities were valued at $926,780 or 0.9% of net assets.
b Non-income producing security.
| | |
Portfolio Summary (Unaudited) † | Value (%) |
Consumer Discretionary | 27.8 |
Information Technology | 20.3 |
Financials | 15.2 |
Consumer Staples | 14.0 |
Health Care | 12.2 |
Industrials | 5.9 |
Energy | 2.0 |
Utilities | 1.0 |
Materials | .8 |
| | 99.2 |
†Based on net assets.
See notes to financial statements.
11
STATEMENT OF ASSETS AND LIABILITIES
October 31, 2015
| | | | | | | |
| | | | | | |
| | | Cost | | Value | |
Assets ($): | | | | |
Investments in securities—See Statement of Investments | | 92,531,839 | | 97,132,957 | |
Cash | | | | | 282,568 | |
Cash denominated in foreign currency | | | 792,002 | | 792,970 | |
Receivable for investment securities sold | | | | | 1,604,465 | |
Receivable for shares of Common Stock subscribed | | | | | 50,690 | |
Dividends receivable | | | | | 20,511 | |
Unrealized appreciation on forward foreign
currency exchange contracts—Note 4 | | | | | 2,024 | |
Prepaid expenses | | | | | 7,371 | |
| | | | | 99,893,556 | |
Liabilities ($): | | | | |
Due to The Dreyfus Corporation and affiliates—Note 3(c) | | | | | 168,689 | |
Note payable—Note 2 | | | | | 1,200,000 | |
Payable for investment securities purchased | | | | | 408,799 | |
Payable for shares of Common Stock redeemed | | | | | 205,162 | |
Interest payable—Note 2 | | | | | 243 | |
Unrealized depreciation on forward foreign
currency exchange contracts—Note 4 | | | | | 105 | |
Accrued expenses | | | | | 41,429 | |
| | | | | 2,024,427 | |
Net Assets ($) | | | 97,869,129 | |
Composition of Net Assets ($): | | | | |
Paid-in capital | | | | | 99,857,285 | |
Accumulated distributions in excess of investment income—net | | | | | (3,546) | |
Accumulated net realized gain (loss) on investments | | | | | (6,583,563) | |
Accumulated net unrealized appreciation (depreciation)
on investments and foreign currency transactions | | | | | 4,598,953 | |
Net Assets ($) | | | 97,869,129 | |
| | | | | | |
Net Asset Value Per Share | Class A | Class C | Class I | Class Y | |
Net Assets ($) | 173,516 | 35,051 | 346,908 | 97,313,654 | |
Shares Outstanding | 13,197 | 2,698 | 26,353 | 7,363,734 | |
Net Asset Value Per Share ($) | 13.15 | 12.99 | 13.16 | 13.22 | |
See notes to financial statements.
12
STATEMENT OF OPERATIONS
Year Ended October 31, 2015
| | | | | | | |
| | | | | | |
| | | | | | |
Investment Income ($): | | | | |
Income: | | | | |
Cash dividends (net of $144,322 foreign taxes withheld at source): | | | | |
Unaffiliated issuers | | | 1,387,032 | |
Affiliated issuers | | | 2,100 | |
Total Income | | | 1,389,132 | |
Expenses: | | | | |
Management fee—Note 3(a) | | | 985,823 | |
Custodian fees—Note 3(c) | | | 107,662 | |
Professional fees | | | 68,788 | |
Registration fees | | | 64,627 | |
Directors’ fees and expenses—Note 3(d) | | | 5,902 | |
Prospectus and shareholders’ reports | | | 4,990 | |
Shareholder servicing costs—Note 3(c) | | | 1,743 | |
Loan commitment fees—Note 2 | | | 1,062 | |
Interest expense—Note 2 | | | 352 | |
Distribution fees—Note 3(b) | | | 315 | |
Miscellaneous | | | 26,075 | |
Total Expenses | | | 1,267,339 | |
Less—reduction in expenses due to undertaking—Note 3(a) | | | (466) | |
Less—reduction in fees due to earnings credits—Note 3(c) | | | (2) | |
Net Expenses | | | 1,266,871 | |
Investment Income—Net | | | 122,261 | |
Realized and Unrealized Gain (Loss) on Investments—Note 4 ($): | | |
Net realized gain (loss) on investments and foreign currency transactions | (6,434,667) | |
Net realized gain (loss) on forward foreign currency exchange contracts | 1,459 | |
Net Realized Gain (Loss) | | | (6,433,208) | |
Net unrealized appreciation (depreciation) on investments
and foreign currency transactions | | | (6,144,584) | |
Net unrealized appreciation (depreciation) on
forward foreign currency exchange contracts | | | (540) | |
Net Unrealized Appreciation (Depreciation) | | | (6,145,124) | |
Net Realized and Unrealized Gain (Loss) on Investments | | | (12,578,332) | |
Net (Decrease) in Net Assets Resulting from Operations | | (12,456,071) | |
See notes to financial statements.
13
STATEMENT OF CHANGES IN NET ASSETS
| | | | | | | | | | |
| | | | | | | | | | |
| | | | Year Ended October 31, |
| | | | 2015 | | | | 2014 | a |
Operations ($): | | | | | | | | |
Investment income—net | | | 122,261 | | | | 312,933 | |
Net realized gain (loss) on investments | | (6,433,208) | | | | 426,069 | |
Net unrealized appreciation (depreciation)
on investments | | (6,145,124) | | | | 10,744,077 | |
Net Increase (Decrease) in Net Assets
Resulting from Operations | (12,456,071) | | | | 11,483,079 | |
Dividends to Shareholders from ($): | | | | | | | | |
Investment income—net: | | | | | | | | |
Class A | | | (246) | | | | - | |
Class C | | | (68) | | | | - | |
Class I | | | (2,339) | | | | - | |
Class Y | | | (292,156) | | | | - | |
Net realized gain on investments: | | | | | | | | |
Class A | | | (761) | | | | - | |
Class C | | | (370) | | | | - | |
Class I | | | (5,993) | | | | - | |
Class Y | | | (748,416) | | | | - | |
Total Dividends | | | (1,050,349) | | | | - | |
Capital Stock Transactions ($): | | | | | | | | |
Net proceeds from shares sold: | | | | | | | | |
Class A | | | 249,547 | | | | 126,094 | |
Class C | | | - | | | | 40,885 | |
Class I | | | 184,173 | | | | 20,222,652 | |
Class Y | | | 36,631,423 | | | | 89,152,604 | |
Dividends reinvested: | | | | | | | | |
Class A | | | 688 | | | | - | |
Class C | | | 153 | | | | - | |
Class I | | | 6,292 | | | | - | |
Class Y | | | 939,605 | | | | - | |
Cost of shares redeemed: | | | | | | | | |
Class A | | | (175,387) | | | | (11,488) | |
Class C | | | (4,754) | | | | - | |
Class I | | | (540,488) | | | | (20,173,543) | |
Class Y | | | (22,994,550) | | | | (3,761,436) | |
Increase (Decrease) in Net Assets
from Capital Stock Transactions | 14,296,702 | | | | 85,595,768 | |
Total Increase (Decrease) in Net Assets | 790,282 | | | | 97,078,847 | |
Net Assets ($): | | | | | | | | |
Beginning of Period | | | 97,078,847 | | | | - | |
End of Period | | | 97,869,129 | | | | 97,078,847 | |
Undistributed (distributions in excess of)
investment income—net | (3,546) | | | | 215,212 | |
14
| | | | | | | | | | |
| | | | | | | | | | |
| | | | Year Ended October 31, |
| | | | 2015 | | | | 2014 | a |
Capital Share Transactions: | | | | | | | | |
Class A | | | | | | | | |
Shares sold | | | 17,382 | | | | 8,765 | |
Shares issued for dividends reinvested | | | 49 | | | | - | |
Shares redeemed | | | (12,200) | | | | (799) | |
Net Increase (Decrease) in Shares Outstanding | 5,231 | | | | 7,966 | |
Class C | | | | | | | | |
Shares sold | | | - | | | | 3,070 | |
Shares issued for dividends reinvested | | | 11 | | | | - | |
Shares redeemed | | | (383) | | | | - | |
Net Increase (Decrease) in Shares Outstanding | (372) | | | | 3,070 | |
Class I | | | | | | | | |
Shares sold | | | 13,529 | | | | 1,602,278 | |
Shares issued for dividends reinvested | | | 450 | | | | - | |
Shares redeemed | | | (39,592) | | | | (1,550,312) | |
Net Increase (Decrease) in Shares Outstanding | (25,613) | | | | 51,966 | |
Class Y | | | | | | | | |
Shares sold | | | 2,679,139 | | | | 6,615,948 | |
Shares issued for dividends reinvested | | | 67,019 | | | | - | |
Shares redeemed | | | (1,735,368) | | | | (263,004) | |
Net Increase (Decrease) in Shares Outstanding | 1,010,790 | | | | 6,352,944 | |
a | From February 3, 2014 (commencement of operations) to October 31, 2014. | |
See notes to financial statements.
15
FINANCIAL HIGHLIGHTS
The following tables describe the performance for each share class for the fiscal periods indicated. All information(except portfolio turnover rate) reflects financial results for a single fund share. Total return shows how much your investment in the fund would have increased (or decreased) during each period, assuming you had reinvested all dividends and distributions. These figures have been derived from the fund’s financial statements.
| | | | | | | | | | |
| | | | | |
| | Year Ended October 31, |
Class A Shares | | | | | | 2015 | 2014 | a |
Per Share Data ($): | | | | | | |
Net asset value, beginning of period | | | | | | 15.09 | 12.50 | |
Investment Operations: | | | | | | |
Investment income (loss)—netb | | | | | | (.01) | .02 | |
Net realized and unrealized gain (loss) on investments | | | | | | (1.77) | 2.57 | |
Total from Investment Operations | | | | | | (1.78) | 2.59 | |
Distributions: | | | | | | |
Dividends from investment income—net | | | | | | (.04) | – | |
Dividends from net realized gain on investments | | | | | | (.12) | — | |
Total Distributions | | | | | | (.16) | – | |
Net asset value, end of period | | | | | | 13.15 | 15.09 | |
Total Return (%)c | | | | | | (11.80) | 20.72 | d |
Ratios/Supplemental Data (%): | | | | | |
Ratio of total expenses to average net assets | | | | | | 1.82 | 2.35 | e |
Ratio of net expenses to average net assets | | | | | | 1.60 | 1.60 | e |
Ratio of net investment income (loss) to average net assets | | | | | | (.05) | .20 | e |
Portfolio Turnover Rate | | | | | | 32.72 | 30.66 | d |
Net Assets, end of period ($ x 1,000) | | | | | | 174 | 120 | |
a From February 3, 2014 (commencement of operations) to October 31, 2014.
b Based on average shares outstanding.
c Exclusive of sales charge.
d Not annualized.
e Annualized.
See notes to financial statements.
16
| | | | | | | | | | | |
| | | | | |
| | | | | | | Year Ended October 31, | |
Class C Shares | | | | | | 2015 | 2014 | a |
Per Share Data ($): | | | | | | |
Net asset value, beginning of period | | | | | | 15.01 | 12.50 | |
Investment Operations: | | | | | | |
Investment (loss)—netb | | | | | | (.13) | (.05) | |
Net realized and unrealized gain (loss) on investments | | | | | | (1.75) | 2.56 | |
Total from Investment Operations | | | | | | (1.88) | 2.51 | |
Distributions: | | | | | | |
Dividends from investment income—net | | | | | | (.02) | — | |
Dividends from net realized gain on investments | | | | | | (.12) | — | |
Total Distributions | | | | | | (.14) | — | |
Net asset value, end of period | | | | | | 12.99 | 15.01 | |
Total Return (%)c | | | | | | (12.51) | 20.08 | d |
Ratios/Supplemental Data (%): | | | | | |
Ratio of total expenses to average net assets | | | | | | 2.67 | 2.95 | e |
Ratio of net expenses to average net assets | | | | | | 2.35 | 2.35 | e |
Ratio of net investment (loss) to average net assets | | | | | | (.96) | (.45) | e |
Portfolio Turnover Rate | | | | | | 32.72 | 30.66 | d |
Net Assets, end of period ($ x 1,000) | | | | | | 35 | 46 | |
a From February 3, 2014 (commencement of operations) to October 31, 2014.
b Based on average shares outstanding.
c Exclusive of sales charge.
d Not annualized.
e Annualized.
See notes to financial statements.
17
FINANCIAL HIGHLIGHTS (continued)
| | | | | | | | | | | | | |
| | | | | |
| | | | | | | Year Ended October 31, | |
Class I Shares | | | | | | 2015 | | 2014 | a |
Per Share Data ($): | | | | | | |
Net asset value, beginning of period | | | | | | 15.09 | | 12.50 | |
Investment Operations: | | | | | | |
Investment income (loss)—netb | | | | | | (.00) | c | .66 | |
Net realized and unrealized gain (loss) on investments | | | | | | (1.76) | | 1.93 | |
Total from Investment Operations | | | | | | (1.76) | | 2.59 | |
Distributions: | | | | | | |
Dividends from investment income—net | | | | | | (.05) | | — | |
Dividends from net realized gain on investments | | | | | | (.12) | | — | |
Total Distributions | | | | | | (.17) | | — | |
Net asset value, end of period | | | | | | 13.16 | | 15.09 | |
Total Return (%) | | | | | | (11.68) | | 20.72 | d |
Ratios/Supplemental Data (%): | | | | | |
Ratio of total expenses to average net assets | | | | | | 1.35 | | 1.41 | e |
Ratio of net expenses to average net assets | | | | | | 1.35 | | 1.35 | e |
Ratio of net investment income (loss) to average net assets | | | | | | (.03) | | 2.86 | e |
Portfolio Turnover Rate | | | | | | 32.72 | | 30.66 | d |
Net Assets, end of period ($ x 1,000) | | | | | | 347 | | 784 | |
a From February 3, 2014 (commencement of operations) to October 31, 2014.
b Based on average shares outstanding.
c Amount represents less than $.01 per share.
d Not annualized.
e Annualized.
See notes to financial statements.
18
| | | | |
| | | |
| | Year Ended October 31, | |
Class Y Shares | 2015 | 2014 | a |
Per Share Data ($): | | | |
Net asset value, beginning of period | 15.13 | 12.50 | |
Investment Operations: | | | |
Investment income—netb | .02 | .05 | |
Net realized and unrealized gain (loss) on investments | (1.76) | 2.58 | |
Total from Investment Operations | (1.74) | 2.63 | |
Distributions: | | | |
Dividends from investment income—net | (.05) | — | |
Dividends from net realized gain on investments | (.12) | — | |
Total Distributions | (.17) | — | |
Net asset value, end of period | 13.22 | 15.13 | |
Total Return (%) | (11.51) | 21.04 | c |
Ratios/Supplemental Data (%): | | | |
Ratio of total expenses to average net assets | 1.28 | 1.70 | d |
Ratio of net expenses to average net assets | 1.28 | 1.35 | d |
Ratio of net investment income to average net assets | .13 | .52 | d |
Portfolio Turnover Rate | 32.72 | 30.66 | c |
Net Assets, end of period ($ x 1,000) | 97,314 | 96,129 | |
a From February 3, 2014 (commencement of operations) to October 31, 2014.
b Based on average shares outstanding.
c Not annualized.
d Annualized.
See notes to financial statements.
19
NOTES TO FINANCIAL STATEMENTS
NOTE 1—Significant Accounting Policies:
Dreyfus Global Emerging Markets Fund (the “fund”) is a separate non-diversified series of Dreyfus BNY Mellon Funds, Inc. (the “Company”), which is registered under the Investment Company Act of 1940, as amended (the “Act”), as an open-end management investment company and operates as a series company currently offering five series, including the fund. The fund’s investment objective is to seek long-term capital appreciation. The Dreyfus Corporation (the “Manager” or “Dreyfus”), a wholly-owned subsidiary of The Bank of New York Mellon Corporation (“BNY Mellon”), serves as the fund’s investment adviser. Newton Capital Management Limited (“Newton”) serves as the fund’s sub-investment adviser.
MBSC Securities Corporation (the “Distributor”), a wholly-owned subsidiary of Dreyfus, is the distributor of the fund’s shares. The fund is authorized to issue 100 million shares of $.001 par value Common Stock in each of the following classes of shares: Class A, Class C, Class I and Class Y. Class A and Class C shares are sold primarily to retail investors through financial intermediaries and bear Distribution and/or Shareholder Services Plan fees. Class A shares generally are subject to a sales charge imposed at the time of purchase. Class C shares are subject to a contingent deferred sales charge (“CDSC”) imposed on Class C shares redeemed within one year of purchase. Class I shares are sold primarily to bank trust departments and other financial service providers (including The Bank of New York Mellon, a subsidiary of BNY Mellon and an affiliate of Dreyfus, and its affiliates), acting on behalf of customers having a qualified trust or an investment account or relationship at such institution, and bear no Distribution or Shareholder Services Plan fees. Class Y shares are sold at net asset value per share generally to institutional investors, and bear no Distribution or Shareholder Services Plan fees. Class I and Class Y shares are offered without a front-end sales charge or CDSC. Other differences between the classes include the services offered to and the expenses borne by each class, the allocation of certain transfer agency costs, and certain voting rights. Income, expenses (other than expenses attributable to a specific class), and realized and unrealized gains or losses on investments are allocated to each class of shares based on its relative net assets.
As of October 31, 2015, MBC Investments Corp., an indirect subsidiary of BNY Mellon, held 2,000 Class A, C and I shares of the fund.
The Company accounts separately for the assets, liabilities and operations of each series. Expenses directly attributable to each series are charged to
20
that series’ operations; expenses which are applicable to all series are allocated among them on a pro rata basis.
The Financial Accounting Standards Board (“FASB”) Accounting Standards Codification (“ASC”) is the exclusive reference of authoritative U.S. generally accepted accounting principles (“GAAP”) recognized by the FASB to be applied by nongovernmental entities. Rules and interpretive releases of the Securities and Exchange Commission (“SEC”) under authority of federal laws are also sources of authoritative GAAP for SEC registrants. The fund’s financial statements are prepared in accordance with GAAP, which may require the use of management estimates and assumptions. Actual results could differ from those estimates.
(a) Portfolio valuation: The fair value of a financial instrument is the amount that would be received to sell an asset or paid to transfer a liability in an orderly transaction between market participants at the measurement date (i.e., the exit price). GAAP establishes a fair value hierarchy that prioritizes the inputs of valuation techniques used to measure fair value. This hierarchy gives the highest priority to unadjusted quoted prices in active markets for identical assets or liabilities (Level 1 measurements) and the lowest priority to unobservable inputs (Level 3 measurements).
Additionally, GAAP provides guidance on determining whether the volume and activity in a market has decreased significantly and whether such a decrease in activity results in transactions that are not orderly. GAAP requires enhanced disclosures around valuation inputs and techniques used during annual and interim periods.
Various inputs are used in determining the value of the fund’s investments relating to fair value measurements. These inputs are summarized in the three broad levels listed below:
Level 1—unadjusted quoted prices in active markets for identical investments.
Level 2—other significant observable inputs (including quoted prices for similar investments, interest rates, prepayment speeds, credit risk, etc.).
Level 3—significant unobservable inputs (including the fund’s own assumptions in determining the fair value of investments).
The inputs or methodology used for valuing securities are not necessarily an indication of the risk associated with investing in those securities.
21
NOTES TO FINANCIAL STATEMENTS (continued)
Changes in valuation techniques may result in transfers in or out of an assigned level within the disclosure hierarchy. Valuation techniques used to value the fund’s investments are as follows:
Investments in securities are valued at the last sales price on the securities exchange or national securities market on which such securities are primarily traded. Securities listed on the National Market System for which market quotations are available are valued at the official closing price or, if there is no official closing price that day, at the last sales price. For open short positions, asked prices are used for valuation purposes. Bid price is used when no asked price is available. Registered investment companies that are not traded on an exchange are valued at their net asset value. All of the preceding securities are generally categorized within Level 1 of the fair value hierarchy.
Securities not listed on an exchange or the national securities market, or securities for which there were no transactions, are valued at the average of the most recent bid and asked prices. These securities are generally categorized within Level 2 of the fair value hierarchy.
Fair valuing of securities may be determined with the assistance of a pricing service using calculations based on indices of domestic securities and other appropriate indicators, such as prices of relevant ADRs and financial futures. Utilizing these techniques may result in transfers between Level 1 and Level 2 of the fair value hierarchy.
When market quotations or official closing prices are not readily available, or are determined not to reflect accurately fair value, such as when the value of a security has been significantly affected by events after the close of the exchange or market on which the security is principally traded (for example, a foreign exchange or market), but before the fund calculates its net asset value, the fund may value these investments at fair value as determined in accordance with the procedures approved by the Company’s Board of Directors (the “Board”). Certain factors may be considered when fair valuing investments such as: fundamental analytical data, the nature and duration of restrictions on disposition, an evaluation of the forces that influence the market in which the securities are purchased and sold, and public trading in similar securities of the issuer or comparable issuers. These securities are either categorized within Level 2 or 3 of the fair value hierarchy depending on the relevant inputs used.
For restricted securities where observable inputs are limited, assumptions about market activity and risk are used and are generally categorized within Level 3 of the fair value hierarchy.
22
Investments denominated in foreign currencies are translated to U.S. dollars at the prevailing rates of exchange.
Forward foreign currency exchange contracts (“forward contracts”) are valued at the forward rate and are generally categorized within Level 2 of the fair value hierarchy.
The following is a summary of the inputs used as of October 31, 2015 in valuing the fund’s investments:
| | | | | | |
Assets ($) | Level 1 - Unadjusted Quoted Prices | Level 2 - Other Significant Observable Inputs | | Level 3 - Significant Unobservable Inputs | Total |
Investments in Securities: | | | |
Equity Securities - Domestic Common Stocks† | 2,077,379 | — | | — | 2,077,379 |
Equity Securities - Foreign Common Stocks† | 95,055,578 | — | | — | 95,055,578 |
Other Financial Instruments: | | | |
Forward Foreign Currency Exchange Contracts†† | — | 2,024 | | — | 2,024 |
Liabilities ($) | | | |
Other Financial Instruments: | | | |
Forward Foreign Currency Exchange Contracts†† | — | (105) | | — | (105) |
† See Statement of Investments for additional detailed categorizations.
†† Amount shown represents unrealized appreciation (depreciation) at period end.
At October 31, 2014, $70,680,364 of exchange traded foreign equity securities were classified within Level 2 of the fair value hierarchy pursuant to the fund’s fair valuation procedures.
(b) Foreign currency transactions: The fund does not isolate that portion of the results of operations resulting from changes in foreign exchange rates on investments from the fluctuations arising from changes in the market prices of securities held. Such fluctuations are included with the net realized and unrealized gain or loss on investments.
Net realized foreign exchange gains or losses arise from sales of foreign currencies, currency gains or losses realized on securities transactions between trade and settlement date, and the difference between the amounts of dividends, interest and foreign withholding taxes recorded on the fund’s books and the U.S. dollar equivalent of the amounts actually received or paid. Net unrealized foreign exchange gains and losses arise from changes in the value of assets and liabilities other than investments
23
NOTES TO FINANCIAL STATEMENTS (continued)
resulting from changes in exchange rates. Foreign currency gains and losses on foreign currency transactions are also included with net realized and unrealized gain or loss on investments.
(c) Securities transactions and investment income: Securities transactions are recorded on a trade date basis. Realized gains and losses from securities transactions are recorded on the identified cost basis. Dividend income is recognized on the ex-dividend date and interest income, including, where applicable, accretion of discount and amortization of premium on investments, is recognized on the accrual basis.
(d) Affiliated issuers: Investments in other investment companies advised by Dreyfus are defined as “affiliated” under the Act. Investments in affiliated investment companies during the period ended October 31, 2015 were as follows:
| | | | | | |
Affiliated Investment Company | Value 10/31/2014 ($) | Purchases ($) | Sales ($) | Value 10/31/2015 ($) | Net Assets (%) |
Dreyfus Institutional Preferred Plus Money Market Fund | — | 33,836,034 | 33,836,034 | — | — |
(e) Risk: Investing in foreign markets may involve special risks and considerations not typically associated with investing in the U.S. These risks include revaluation of currencies, high rates of inflation, repatriation restrictions on income and capital, and adverse political and economic developments. Moreover, securities issued in these markets may be less liquid, subject to government ownership controls and delayed settlements, and their prices may be more volatile than those of comparable securities in the U.S.
(f) Dividends to shareholders: Dividends are recorded on the ex-dividend date. Dividends from investment income-net and dividends from net realized capital gains, if any, are normally declared and paid annually, but the fund may make distributions on a more frequent basis to comply with the distribution requirements of the Internal Revenue Code of 1986, as amended (the “Code”). To the extent that net realized capital gains can be offset by capital loss carryovers, it is the policy of the fund not to distribute such gains. Income and capital gain distributions are determined in accordance with income tax regulations, which may differ from GAAP.
(g) Federal income taxes: It is the policy of the fund to continue to qualify as a regulated investment company, if such qualification is in the
24
best interests of its shareholders, by complying with the applicable provisions of the Code, and to make distributions of taxable income sufficient to relieve it from substantially all federal income and excise taxes.
As of and during the period ended October 31, 2015, the fund did not have any liabilities for any uncertain tax positions. The fund recognizes interest and penalties, if any, related to uncertain tax positions as income tax expense in the Statement of Operations. During the period ended October 31, 2015, the fund did not incur any interest or penalties.
Each tax year in the two-year period ended October 31, 2015 remains subject to examination by the Internal Revenue Service and state taxing authorities.
At October 31, 2015, the components of accumulated earnings on a tax basis were as follows: accumulated capital losses $4,613,304 and unrealized appreciation $2,625,148.
Under the Regulated Investment Company Modernization Act of 2010, the fund is permitted to carry forward capital losses for an unlimited period. Furthermore, capital loss carryovers retain their character as either short-term or long-term capital losses.
The accumulated capital loss carryover is available for federal income tax purposes to be applied against future net realized capital gains, if any, realized subsequent to October 31, 2015. The fund has $2,181,909 of short-term capital losses and $2,431,395 of long-term capital losses which can be carried forward for an unlimited period.
The tax character of distributions paid to shareholders during the fiscal periods ended October 31, 2015 and October 31, 2014 were as follows: undistributed ordinary income $1,050,349 and $0, respectively.
During the period ended October 31, 2015, as a result of permanent book to tax differences, primarily due to the tax treatment for foreign currency gains and losses, foreign capital gain taxes, excess distributions and net operating losses the fund decreased accumulated undistributed investment income-net by $46,210, increased accumulated net realized gain (loss) on investments by $69,723 and decreased paid-in capital by $23,513. Net assets and net asset value per share were not affected by this reclassification.
NOTE 2—Bank Lines of Credit:
The fund participates with other Dreyfus-managed funds in a $480 million unsecured credit facility led by Citibank, N.A. and a $300 million unsecured credit facility provided by The Bank of New York Mellon (each,
25
NOTES TO FINANCIAL STATEMENTS (continued)
a “Facility”), each to be utilized primarily for temporary or emergency purposes, including the financing of redemptions. Prior to October 7, 2015, the unsecured credit facility with Citibank, N.A. was $430 million. In connection therewith, the fund has agreed to pay its pro rata portion of commitment fees for each Facility. Interest is charged to the fund based on rates determined pursuant to the terms of the respective Facility at the time of borrowing.
The average amount of borrowings outstanding under the Facilities during the period ended October 31, 2015 was approximately $33,700 with a related weighted average annualized interest rate of 1.04%.
NOTE 3—Management Fee, Sub-Investment Advisory Fee and Other Transactions with Affiliates:
(a) Pursuant to a management agreement with Dreyfus, the fund has agreed to pay a management fee at the annual rate of 1.00% of the value of the fund’s average daily net assets and is payable monthly. Dreyfus has contractually agreed, from November 1, 2014 through March 1, 2016, to waive receipt of its fees and/or assume the direct expenses of the fund so that the expenses of none of the classes (excluding Rule 12b-1 Distribution Plan fees, Shareholder Services Plan fees, taxes, interest expense, brokerage commissions, commitment fees on borrowings and extraordinary expenses) exceed 1.35% of the value of the fund’s average daily net assets. The reduction in expenses, pursuant to the undertaking amounted to $466 during the period ended October 31, 2015.
Pursuant to a sub-investment advisory agreement between Dreyfus and Newton, Newton serves as the fund’s sub-investment adviser responsible for the day-to–day management of the fund’s portfolio. Dreyfus pays Newton a monthly fee at an annual percentage of the value of the fund’s average daily net assets. Dreyfus has obtained an exemptive order from the SEC (the “Order”), upon which the fund may rely, to use a manager of managers approach that permits Dreyfus, subject to certain conditions and approval by the Board, to enter into and materially amend sub-investment advisory agreements with one or more sub-investment advisers who are either unaffiliated with Dreyfus or are wholly-owned subsidiaries (as defined under the Act) of Dreyfus’ ultimate parent company, BNY Mellon, without obtaining shareholder approval. The Order also allows the fund to disclose the sub-investment advisory fee paid by Dreyfus to any unaffiliated sub-investment adviser in the aggregate with other unaffiliated sub-investment advisers in documents filed with the SEC and provided to shareholders. In addition, pursuant to the Order, it is not necessary to disclose the sub-investment advisory fee payable by Dreyfus separately to a sub-investment adviser that is a wholly-owned subsidiary of BNY Mellon
26
in documents filed with the SEC and provided to shareholders; such fees are to be aggregated with fees payable to Dreyfus. Dreyfus has ultimate responsibility (subject to oversight by the Board) to supervise any sub-investment adviser and recommend the hiring, termination, and replacement of any sub-investment adviser to the Board.
(b) Under the Distribution Plan adopted pursuant to Rule 12b-1 under the Act, Class C shares pay the Distributor for distributing its shares at an annual rate of .75% of the value of its average daily net assets. During the period ended October 31, 2015, Class C shares were charged $315 pursuant to the Distribution Plan.
(c) Under the Shareholder Services Plan, Class A and Class C shares pay the Distributor at an annual rate of .25% of the value of their average daily net assets for the provision of certain services. The services provided may include personal services relating to shareholder accounts, such as answering shareholder inquiries regarding the fund and providing reports and other information, and services related to the maintenance of shareholder accounts. The Distributor may make payments to Service Agents (securities dealers, financial institutions or other industry professionals) with respect to these services. The Distributor determines the amounts to be paid to Service Agents. During the period ended October 31, 2015, Class A and Class C shares were charged $376 and $105, respectively, pursuant to the Shareholder Services Plan.
Under its terms, the Distribution Plan and Shareholder Services Plan shall remain in effect from year to year, provided such continuance is approved annually by a vote of a majority of those Directors who are not “interested persons” of the Company and who have no direct or indirect financial interest in the operation of or in any agreement related to the Distribution Plan and Shareholder Services Plan.
The fund has arrangements with the transfer agent and the custodian whereby the fund may receive earnings credits when positive cash balances are maintained, which are used to offset transfer agency and custody fees. For financial reporting purposes, the fund includes net earnings credits as an expense offset in the Statement of Operations.
The fund compensates Dreyfus Transfer, Inc., a wholly-owned subsidiary of Dreyfus, under a transfer agency agreement for providing transfer agency and cash management services for the fund. The majority of transfer agency fees are comprised of amounts paid on a per account basis, while cash management fees are related to fund subscriptions and redemptions. During the period ended October 31, 2015, the fund was charged $1,056 for transfer agency services and $36 for cash management
27
NOTES TO FINANCIAL STATEMENTS (continued)
services. These fees are included in Shareholder servicing costs in the Statement of Operations. Cash management fees were partially offset by earnings credits of $2.
The fund compensates The Bank of New York Mellon under a custody agreement for providing custodial services for the fund. These fees are determined based on net assets, geographic region and transaction activity. During the period ended October 31, 2015, the fund was charged $107,662 pursuant to the custody agreement.
During the period ended October 31, 2015, the fund was charged $11,159 for services performed by the Chief Compliance Officer and his staff.
The components of “Due to The Dreyfus Corporation and affiliates” in the Statement of Assets and Liabilities consist of: management fees $83,579, Distribution Plan fees $22, Shareholder Services Plan fees $45, custodian fees $84,004, Chief Compliance Officer fees $882 and transfer agency fees $157.
(d) Each Board member also serves as a Board member of other funds within the Dreyfus complex. Annual retainer fees and attendance fees are allocated to each fund based on net assets.
(e) A 2% redemption fee is charged and retained by the fund on certain shares redeemed within sixty days following the date of issuance subject to certain exceptions, including redemptions made through use of the fund’s exchange privilege. During the period ended October 31, 2015, redemption fees charged and retained by the fund amounted to $8,976.
NOTE 4—Securities Transactions:
The aggregate amount of purchases and sales of investment securities, excluding short-term securities and forward contracts, during the period ended October 31, 2015, amounted to $44,548,531 and $31,621,320, respectively.
Derivatives: A derivative is a financial instrument whose performance is derived from the performance of another asset. The fund enters into International Swaps and Derivatives Association, Inc. Master Agreements or similar agreements (collectively, “Master Agreements”) with its over-the-counter (“OTC”) derivative contract counterparties in order to, among other things, reduce its credit risk to counterparties. Master Agreements include provisions for general obligations, representations, collateral and events of default or termination. Under a Master Agreement, the fund may offset with the counterparty certain derivative financial instrument’s payables and/or receivables with collateral held and/or
28
posted and create one single net payment in the event of default or termination.
Each type of derivative instrument that was held by the fund during the period ended October 31, 2015 is discussed below.
Forward Foreign Currency Exchange Contracts: The fund enters into forward contracts in order to hedge its exposure to changes in foreign currency exchange rates on its foreign portfolio holdings, to settle foreign currency transactions or as a part of its investment strategy. When executing forward contracts, the fund is obligated to buy or sell a foreign currency at a specified rate on a certain date in the future. With respect to sales of forward contracts, the fund incurs a loss if the value of the contract increases between the date the forward contract is opened and the date the forward contract is closed. The fund realizes a gain if the value of the contract decreases between those dates. With respect to purchases of forward contracts, the fund incurs a loss if the value of the contract decreases between the date the forward contract is opened and the date the forward contract is closed. The fund realizes a gain if the value of the contract increases between those dates. Any realized or unrealized gains or losses which occurred during the period are reflected in the Statement of Operations. The fund is exposed to foreign currency risk as a result of changes in value of underlying financial instruments. The fund is also exposed to credit risk associated with counterparty nonperformance on these forward contracts, which is generally limited to the unrealized gain on each open contract. This risk may be mitigated by Master Agreements, if any, between the fund and the counterparty and the posting of collateral, if any, by the counterparty to the fund to cover the fund’s exposure to the counterparty. The following summarizes open forward contracts at October 31, 2015:
| | | | | |
Forward Foreign Currency Exchange Contracts | Foreign Currency Amounts |
Proceeds ($)
| Value ($) | Unrealized Appreciation (Depreciation)($) |
Sales: | | | |
Barclays Bank | | | |
Hong Kong Dollar, | | | | |
Expiring | | | | |
11/3/2015 | 447,661 | 57,762 | 57,758 | 4 |
JP Morgan Chase Bank | | | |
Euro, | | | | |
Expiring | | | | |
11/3/2015 | 83,824 | 92,648 | 92,177 | 471 |
29
NOTES TO FINANCIAL STATEMENTS (continued)
| | | | | |
Forward Foreign Currency Exchange Contracts | Foreign Currency Amounts |
Proceeds ($)
| Value ($) | Unrealized Appreciation (Depreciation)($) |
Sales: (continued) | | | |
Royal Bank of Scotland | | | |
British Pound, | | | | |
Expiring | | | | |
11/2/2015 | 4,034 | 6,190 | 6,218 | (28) |
Euro, | | | | |
Expiring | | | | |
11/2/2015 | 3,018 | 3,322 | 3,318 | 4 |
South African Rand, | | | | |
Expiring | | | | |
11/2/2015 | 2,133,678 | 155,722 | 154,179 | 1,543 |
UBS | | | |
Mexican New Peso, | | | | |
Expiring | | | | |
11/4/2015 | 559,598 | 33,801 | 33,878 | (77) |
Turkish Lira, | | | | |
Expiring | | | | |
11/3/2015 | 4,972 | 1,708 | 1,706 | 2 |
Gross Unrealized Appreciation | | | 2,024 |
Gross Unrealized Depreciation | | | (105) |
The provisions of ASC Topic 210 “Disclosures about Offsetting Assets and Liabilities” require disclosure on the offsetting of financial assets and liabilities. These disclosures are required for certain investments, including derivative financial instruments subject to Master Agreements which are eligible for offsetting in the Statement of Assets and Liabilities and require the fund to disclose both gross and net information with respect to such investments. For financial reporting purposes, the fund does not offset derivative assets and derivative liabilities that are subject to Master Agreements in the Statement of Assets and Liabilities.
At October 31, 2015, derivative assets and liabilities (by type) on a gross basis are as follows:
30
| | | | | | |
Derivative Financial Instruments: | | Assets ($) | | Liabilities ($) | |
Forward contracts | | 2,024 | | (105) | |
Total gross amount of derivative | | | | | |
assets and liabilities in the | | | | | |
Statement of Assets and Liabilities | | 2,024 | | (105) | |
Derivatives not subject to | | | | | |
Master Agreements | | - | | - | |
Total gross amount of assets | | | | | |
and liabilities subject to | | | | | |
Master Agreements | | 2,024 | | (105) | |
The following tables present derivative assets and liabilities net of amounts available for offsetting under Master Agreements and net of related collateral received or pledged, if any, as of October 31, 2015:
| | | | | | | |
| | | | Financial | | | |
| | | | Instruments | | | |
| | | | and Derivatives | | | |
| | Gross Amount of | | Available | Collateral | | Net Amount of |
Counterparty | Assets ($) | 1 | for Offset ($) | Received ($) | | Assets ($) |
Barclays Bank | 4 | | - | - | | 4 |
JP Morgan
Chase Bank | 471 | | - | - | | 471 |
Royal Bank of
Scotland | 1,547 | | (28) | - | | 1,519 |
UBS | 2 | | (2) | - | | - |
Total | 2,024 | | (30) | - | | 1,994 |
| | | | | | | |
| | | | Financial | | | |
| | | | Instruments | | | |
| | | | and Derivatives | | | |
| | Gross Amount of | | Available | Collateral | | Net Amount of |
Counterparty | Liabilities ($) | 1 | for Offset ($) | Pledged ($) | | Liabilities ($) |
Royal Bank of
Scotland | (28) | | 28 | - | | - |
UBS | (77) | | 2 | - | | (75) |
Total | (105) | | 30 | - | | (75) |
| | | | | | | |
1 Absent a default event or early termination, OTC derivative assets and liabilities are presented
at gross amounts and are not offset in the Statement of Assets and Liabilities. |
The following summarizes the average market value of derivatives outstanding during the period ended October 31, 2015:
| | | | | |
| | | | | Average Market Value ($) |
Forward contracts | | | | 276,381 |
At October 31, 2015, the cost of investments for federal income tax purposes was $94,504,178; accordingly, accumulated net unrealized appreciation on investments was $2,628,779, consisting of $12,834,112
31
NOTES TO FINANCIAL STATEMENTS (continued)
gross unrealized appreciation and $10,205,333 gross unrealized depreciation.
32
REPORT OF INDEPENDENT REGISTERED
PUBLIC ACCOUNTING FIRM
The Board of Directors and Shareholders of
Dreyfus BNY Mellon Fund, Inc.
We have audited the accompanying statement of assets and liabilities of Dreyfus Global Emerging Markets Fund (the “Fund”), a series of Dreyfus BNY Mellon Fund, Inc., including the statement of investments, as of October 31, 2015, the related statement of operations for the year then ended, the statements of changes in net assets and the financial highlights for each of the year or period in the two-year period then ended. These financial statements and financial highlights are the responsibility of the Fund’s management. Our responsibility is to express an opinion on these financial statements and financial highlights based on our audits.
We conducted our audits in accordance with the standards of the Public Company Accounting Oversight Board (United States). Those standards require that we plan and perform the audit to obtain reasonable assurance about whether the financial statements and financial highlights are free of material misstatement. An audit includes examining, on a test basis, evidence supporting the amounts and disclosures in the financial statements. Our procedures included confirmation of securities owned as of October 31, 2015, by correspondence with the custodian and brokers or by other appropriate auditing procedures. An audit also includes assessing the accounting principles used and significant estimates made by management, as well as evaluating the overall financial statement presentation. We believe that our audits provide a reasonable basis for our opinion.
In our opinion, the financial statements and financial highlights referred to above present fairly, in all material respects, the financial position of Dreyfus Global Emerging Markets Fund as of October 31, 2015, and the results of its operations for the year then ended, the changes in its net assets, and the financial highlights for each of the year or period in the two-year period then ended, in conformity with U.S. generally accepted accounting principles.

New York, New York
December 30, 2015
33
IMPORTANT TAX INFORMATION (Unaudited)
For federal tax purposes, the fund elects to provide each shareholder with their portion of the fund's income sourced from foreign countries and taxes paid from foreign countries. The fund reports the maximum amount allowable but not less than $1,477,468 as income sourced from foreign countries for the fiscal year ended October 31, 2015 in accordance with Section 853(c)(2) of the Internal Revenue Code and also the fund reports the maximum amount allowable but not less than $159,464 as taxes paid from foreign countries for the fiscal year ended October 31, 2015 in accordance with Section 853(a) of the Internal Revenue Code. Where required by federal tax rules, shareholders will receive notification of their proportionate share of foreign sourced income and foreign taxes paid for the 2015 calendar year with Form 1099-DIV which will be mailed in early 2016. Also the fund designates the maximum amount allowable, but not less than $632,532 as ordinary income dividends paid during the fiscal year ended October 31, 2015 as qualified dividend income in accordance with Section 854(b)(1)(B) of the Internal Revenue Code. Also, the fund reports the maximum amount allowable but not less than $.1204 as a short-term capital gain dividend paid on December 26, 2014 in accordance with Sections 871(k)(2) and 881(e) of the Internal Revenue Code.
34
BOARD MEMBERS INFORMATION (Unaudited)
INDEPENDENT BOARD MEMBERS
Joseph S. DiMartino (72)
Chairman of the Board (1999)
Principal Occupation During Past 5 Years:
· Corporate Director and Trustee (1995-present)
Other Public Company Board Memberships During Past 5 Years:
· CBIZ (formerly, Century Business Services, Inc.), a provider of outsourcing functions for small and medium size companies, Director (1997-present)
· The Newark Group, a provider of a national market of paper recovery facilities, paperboard mills and paperboard converting plants, Director (2000-2010)
No. of Portfolios for which Board Member Serves: 140
———————
Francine J. Bovich (64)
Board Member (2012)
Principal Occupation During Past 5 Years:
· Trustee, The Bradley Trusts, private trust funds (2011-present)
· Managing Director, Morgan Stanley Investment Management (1993-2010)
Other Public Company Board Memberships During Past 5 Years:
· Annaly Capital Management, Inc., Board Member (May 2014-present)
No. of Portfolios for which Board Member Serves: 79
———————
Kenneth A. Himmel (69)
Board Member (1994)
Principal Occupation During Past 5 Years:
· Managing Partner, Gulf Related, an international real estate development company (2010-present)
· President and CEO, Related Urban Development, a real estate development company (1996-present)
· President and CEO, Himmel & Company, a real estate development company (1980-present)
· CEO, American Food Management, a restaurant company (1983-present)
No. of Portfolios for which Board Member Serves: 29
———————
35
BOARD MEMBERS INFORMATION (Unaudited) (continued)
INDEPENDENT BOARD MEMBERS (continued)
Stephen J. Lockwood (68)
Board Member (1994)
Principal Occupation During Past 5 Years:
· Chairman of the Board, Stephen J. Lockwood and Company LLC, a real estate investment company (2000-present)
No. of Portfolios for which Board Member Serves: 29
———————
Roslyn M. Watson (66)
Board Member (1994)
Principal Occupation During Past 5 Years:
· Principal, Watson Ventures, Inc., a real estate investment company (1993-present)
No. of Portfolios for which Board Member Serves: 65
———————
Benaree Pratt Wiley (69)
Board Member (1998)
Principal Occupation During Past 5 Years:
· Principal, The Wiley Group, a firm specializing in strategy and business development (2005-present)
Other Public Company Board Memberships During Past 5 Years:
· CBIZ (formerly, Century Business Services, Inc.), a provider of outsourcing functions for small and medium size companies, Director (2008-present)
No. of Portfolios for which Board Member Serves: 65
———————
Once elected all Board Members serve for an indefinite term, but achieve Emeritus status upon reaching age 80. The address of the Board Members and Officers is c/o The Dreyfus Corporation, 200 Park Avenue, New York, New York 10166. Additional information about the Board Members is available in the fund’s Statement of Additional Information which can be obtained from Dreyfus free of charge by calling this toll free number: 1-800-DREYFUS.
James M. Fitzgibbons, Emeritus Board Member
36
OFFICERS OF THE FUND (Unaudited)
BRADLEY J. SKAPYAK, President since January 2010.
Chief Operating Officer and a director of the Manager since June 2009, Chairman of Dreyfus Transfer, Inc., an affiliate of the Manager and the transfer agent of the funds, since May 2011 and Executive Vice President of the Distributor since June 2007. From April 2003 to June 2009, Mr. Skapyak was the head of the Investment Accounting and Support Department of the Manager. He is an officer of 66 investment companies (comprised of 140 portfolios) managed by the Manager. He is 56 years old and has been an employee of the Manager since February 1988.
BENNETT A. MACDOUGALL, Chief Legal Officer since October 2015
Chief Legal Officer of the Manager since June 2015; from June 2005 to June 2015, Director and Associate General Counsel of Deutsche Bank – Asset & Wealth Management Division, and Chief Legal Officer of Deutsche Investment Management Americas Inc. He is an officer of 67 investment companies (comprised of 165 portfolios) managed by the Manager. He is 44 years old and has been an employee of the Manager since June 2015.
JANETTE E. FARRAGHER, Vice President and Secretary since December 2011.
Assistant General Counsel of BNY Mellon, and an officer of 67 investment companies (comprised of 165 portfolios) managed by the Manager. She is 52 years old and has been an employee of the Manager since February 1984.
JAMES BITETTO, Vice President and Assistant Secretary since August 2005.
Managing Counsel of BNY Mellon and Secretary of the Manager, and an officer of 67 investment companies (comprised of 165 portfolios) managed by the Manager. He is 49 years old and has been an employee of the Manager since December 1996.
JONI LACKS CHARATAN, Vice President and Assistant Secretary since August 2005.
Managing Counsel of BNY Mellon, and an officer of 67 investment companies (comprised of 165 portfolios) managed by the Manager. She is 59 years old and has been an employee of the Manager since October 1988.
JOSEPH M. CHIOFFI, Vice President and Assistant Secretary since August 2005.
Managing Counsel of BNY Mellon, and an officer of 67 investment companies (comprised of 165 portfolios) managed by the Manager. He is 53 years old and has been an employee of the Manager since June 2000.
JOHN B. HAMMALIAN, Vice President and Assistant Secretary since August 2005.
Senior Managing Counsel of BNY Mellon, and an officer of 67 investment companies (comprised of 165 portfolios) managed by the Manager. He is 52 years old and has been an employee of the Manager since February 1991.
MAUREEN E. KANE, Vice President and Assistant Secretary since April 2015.
Managing Counsel of BNY Mellon since July 2014; from October 2004 until July 2014, General Counsel, and from May 2009 until July 2014, Chief Compliance Officer of Century Capital Management. She is an officer of 67 investment companies (comprised of 165 portfolios) managed by the Manager. She is 53 years old and has been an employee of the Manager since July 2014.
SARAH S. KELLEHER, Vice President and Assistant Secretary since April 2014.
Senior Counsel of BNY Mellon, and an officer of 67 investment companies (comprised of 165 portfolios) managed by the Manager; from August 2005 to March 2013, Associate General Counsel of Third Avenue Management. She is 40 years old and has been an employee of the Manager since March 2013.
JEFF PRUSNOFSKY, Vice President and Assistant Secretary since August 2005.
Senior Managing Counsel of BNY Mellon, and an officer of 67 investment companies (comprised of 165 portfolios) managed by the Manager. He is 50 years old and has been an employee of the Manager since October 1990.
JAMES WINDELS, Treasurer since November 2001.
Director – Mutual Fund Accounting of the Manager, and an officer of 67 investment companies (comprised of 165 portfolios) managed by the Manager. He is 57 years old and has been an employee of the Manager since April 1985.
37
OFFICERS OF THE FUND (Unaudited) (continued)
RICHARD CASSARO, Assistant Treasurer since January 2008.
Senior Accounting Manager – Money Market and Municipal Bond Funds of the Manager, and an officer of 67 investment companies (comprised of 165 portfolios) managed by the Manager. He is 56 years old and has been an employee of the Manager since September 1982.
GAVIN C. REILLY, Assistant Treasurer since December 2005.
Tax Manager of the Investment Accounting and Support Department of the Manager, and an officer of 67 investment companies (comprised of 165 portfolios) managed by the Manager. He is 47 years old and has been an employee of the Manager since April 1991.
ROBERT S. ROBOL, Assistant Treasurer since December 2002.
Senior Accounting Manager – Fixed Income Funds of the Manager, and an officer of 67 investment companies (comprised of 165 portfolios) managed by the Manager. He is 51 years old and has been an employee of the Manager since October 1988.
ROBERT SALVIOLO, Assistant Treasurer since July 2007.
Senior Accounting Manager – Equity Funds of the Manager, and an officer of 67 investment companies (comprised of 165 portfolios) managed by the Manager. He is 48 years old and has been an employee of the Manager since June 1989.
ROBERT SVAGNA, Assistant Treasurer since December 2002.
Senior Accounting Manager – Equity Funds of the Manager, and an officer of 67 investment companies (comprised of 165 portfolios) managed by the Manager. He is 48 years old and has been an employee of the Manager since November 1990.
JOSEPH W. CONNOLLY, Chief Compliance Officer since October 2004.
Chief Compliance Officer of the Manager and The Dreyfus Family of Funds (67 investment companies, comprised of 165 portfolios). He is 58 years old and has served in various capacities with the Manager since 1980, including manager of the firm’s Fund Accounting Department from 1997 through October 2001.
38
NOTES
39
NOTES
40
NOTES
41
Dreyfus Global Emerging Markets Fund
200 Park Avenue
New York, NY 10166
Manager
The Dreyfus Corporation
200 Park Avenue
New York, NY 10166
Sub-Investment Adviser
Newton Capital Management Limited
160 Queen Victoria Street,
London, EC4V, 4LA, UK
Custodian
The Bank of New York Mellon
225 Liberty Street
New York, NY 10286
Transfer Agent &
Dividend Disbursing Agent
Dreyfus Transfer, Inc.
200 Park Avenue
New York, NY 10166
Distributor
MBSC Securities Corporation
200 Park Avenue
New York, NY 10166
| | |
Ticker Symbols: | Class A: DGEAX Class C: DGECX Class I: DGIEX Class Y: DGEYX |
Telephone Call your financial representative or 1-800-DREYFUS
Mail The Dreyfus Family of Funds, 144 Glenn Curtiss Boulevard, Uniondale, NY 11556-0144
E-mail Send your request to info@dreyfus.com
Internet Information can be viewed online or downloaded at www.dreyfus.com
The fund files its complete schedule of portfolio holdings with the Securities and Exchange Commission (“SEC”) for the first and third quarters of each fiscal year on Form N-Q. The fund’s Forms N-Q are available on the SEC’s website at www.sec.gov and may be reviewed and copied at the SEC’s Public Reference Room in Washington, DC. (phone 1-800-SEC-0330 for information).
A description of the policies and procedures that the fund uses to determine how to vote proxies relating to portfolio securities and information regarding how the fund voted these proxies for the most recent 12-month period ended June 30 is available at www.dreyfus.com and on the SEC’s website at www.sec.gov and without charge, upon request, by calling 1-800-DREYFUS.
| | |
© 2015 MBSC Securities Corporation
6243AR1015 | 
|
Dreyfus Select Managers Long/Short Fund
| | | |
| | ANNUAL REPORT October 31, 2015 |
| |
Save time. Save paper. View your next shareholder report online as soon as it’s available. Log into www.dreyfus.com and sign up for Dreyfus eCommunications. It’s simple and only takes a few minutes. |
| |
The views expressed in this report reflect those of the portfolio manager only through the end of the period covered and do not necessarily represent the views of Dreyfus or any other person in the Dreyfus organization. Any such views are subject to change at any time based upon market or other conditions and Dreyfus disclaims any responsibility to update such views. These views may not be relied on as investment advice and, because investment decisions for a Dreyfus fund are based on numerous factors, may not be relied on as an indication of trading intent on behalf of any Dreyfus fund. |
| |
Not FDIC-Insured • Not Bank-Guaranteed • May Lose Value |
Contents
T H E F U N D
F O R M O R E I N F O R M AT I O N
Back Cover
| | | | |
| |
Dreyfus Select Managers Long/Short Fund
| | The Fund |
A LETTER FROM THE PRESIDENT
Dear Shareholder:
We are pleased to present this annual report for Dreyfus Select Managers Long/Short Fund, covering the 12-month period from November 1, 2014, through October 31, 2015. For information about how the fund performed during the reporting period, as well as general market perspectives, we provide a Discussion of Fund Performance on the pages that follow.
Financial markets proved volatile over the reporting period amid choppy U.S. and global economic growth. U.S. stocks advanced over the final months of 2014 and the spring of 2015, with some broad measures of market performance setting new record highs. Those gains were largely erased over the summer when global economic instability undermined investor sentiment, but a renewed rally in October enabled most broad stock indices to end the reporting period in positive territory. In contrast, international stocks generally lost a degree of value, with developed markets faring far better than emerging markets amid falling commodity prices and depreciating currency values. U.S. bonds generally produced modestly positive total returns, with municipal bonds and longer term U.S. government securities faring better, on average, than corporate-backed bonds.
We expect market volatility to persist over the near term until investors see greater clarity regarding short-term U.S. interest rates and global economic conditions. Our investment strategists and portfolio managers are monitoring developments carefully, keeping a close watch on credit spreads, currency values, commodity prices, corporate profits, economic trends in the emerging markets, and other developments that could influence investor sentiment. Over the longer term, we remain confident that markets are likely to benefit as investors increasingly recognize that inflation is likely to stay low, economic growth expectations are stabilizing, and monetary policies remain accommodative in most regions of the world. In our view, investors will continue to be well served under these circumstances by a long-term perspective and a disciplined investment approach.
Thank you for your continued confidence and support.
Sincerely,

J. Charles Cardona
President
The Dreyfus Corporation
November 16, 2015
2
DISCUSSION OF FUND PERFORMANCE
For the period of November 1, 2014, through October 31, 2015, as provided by Christopher E. Crerend and Jeffrey A. Brozek, Portfolio Allocation Managers of EACM Advisors LLC
Fund and Market Performance Overview
For the 12-month period ended October 31, 2015, Dreyfus Select Managers Long/Short Fund’s Class A shares produced a total return of 0.98%, Class C shares returned 0.17%, Class I shares returned 1.31%, and Class Y shares returned 1.31%.1 In comparison, the HFRX Equity Hedge Index (the “HFRX Index”) produced a total return of -0.96% and the Morgan Stanley Capital International-All Country World Index (the “MSCI ACWI Index”), a broad-based index, produced a total return of -0.03% for the same period.2 Because of several factors, including that the MSCI ACWI does not include short positions, we believe the HFRX Index may be a more meaningful performance benchmark to the extent the fund is actively engaged in long and short positions.
Roughly flat overall results from global stocks for the reporting period masked heightened volatility from shifting economic sentiment. The fund outperformed the HFRX Index, mainly due to its subadvisers’ positions in the consumer discretionary, information technology, industrials, and financials sectors.
The Fund’s Investment Approach
The fund seeks long-term capital appreciation with lower volatility than, and moderate correlation to, major equity market indices. The fund uses a “manager of managers” approach by selecting one or more experienced equity managers to serve as subadvisers to manage the fund’s assets. The fund allocates its assets among subadvisers that use long/short equity investment strategies that are not expected to have returns that are highly correlated to each other or major equity market indices. Each of the fund’s subadvisers acts independently of any other subadviser and uses its own methodology to select portfolio investments.
The fund normally invests in equity securities, typically common stocks, including securities issued by other investment companies, such as exchange-traded funds (ETFs). The fund expects to maintain significant short positions in equity securities and equity-related instruments, including derivative instruments and ETFs. Although the fund intends to maintain an overall long position in its investments, in certain circumstances, the fund’s short positions may approach or reach the size of the fund’s overall long position.
Global Economic Concerns Sparked Market Turmoil
Global equities produced roughly flat returns overall, masking heightened volatility stemming from divergent monetary policies from central banks worldwide. Monetary easing in Europe and Japan stood in contrast to expectations of higher short-term interest rates in the United States, resulting in varied outlooks for regional growth. In this environment, the U.S. dollar strengthened against most other currencies as investors flocked to higher yields from U.S. government securities.
At various times, global equities suffered short-lived sell-offs due to plunging commodity prices, a Greek debt crisis, and an economic slowdown in China. At other times, investors responded positively to strengthening U.S. labor markets, improved economic data in
3
DISCUSSION OF FUND PERFORMANCE (continued)
Europe, and greater export activity in Japan. Therefore, stocks in the United States, Japan, and Continental Europe generally outperformed market averages, while commodity-dependent countries such as Australia, Brazil and Canada ranked among the world’s weaker markets.
Long Positions Supported Relative Performance
In the aggregate the fund’s subadvisers proved relatively successful in their long equity positions, but short positions detracted slightly from overall performance.
Long positions in the consumer discretionary sector fared especially well, where U.S. companies such as Internet retailer eBay benefited from spinning off its online payments division, travel site Expedia posted impressive growth, and cruise line Carnival encountered positive travel trends. In France, outdoor advertising specialist JCDecaux gained value as an accretive acquisition and share repurchase bolstered the stock. Overweighted exposure to Internet-related companies in the information technology sector buoyed the fund’s relative performance, as global industry leaders Alphabet in the US and Tencent Holdings in Hong Kong reported better-than-expected earnings, while Japanese electronics maker Sony restructured to focus on more profitable businesses.
In the industrials sector, long positions in Europe, including Airbus Group and construction firm Vinci, benefited from rising order volumes, while short positions in U.S. companies Caterpillar and Cummins added value amid a slowdown in the energy and mining industries. Among financial companies, successful long positions included Signature Bank, AXA, and Mitsubishi UFJ Financial Group, and effective short positions included certain U.S. real estate investment trusts and banks in the emerging markets of Asia.
Only the utilities sector produced results that lagged market averages, mostly due to long positions such as German electricity producer E.ON. Some long positions in the energy sector also proved ineffective, but their impact was offset by more successful short positions in the sector.
A Diversified Allocation Strategy
In light of ongoing global economic uncertainty, we have adopted a modestly conservative bias in the fund at present. Yet, we intend to remain nimble in our allocation strategy, balancing subadvisers that tend to do well in down markets with those that prosper as equity markets rise. Accordingly, at various times during the reporting period, we eliminated two subadvisers and added three new ones, bringing the total number of subadvisers in the fund to seven.
November 16, 2015
Please note, the position in any security highlighted with italicized typeface was sold during the reporting period.
Equity funds are subject generally to market, market sector, market liquidity, issuer, and investment style risks, among other factors, to varying degrees, all of which are more fully described in the fund’s prospectus.
Small and midsize companies carry additional risks because their earnings and revenues tend to be less predictable, and their share prices more volatile, than those of larger, more established companies.
Short sales involve selling a security the fund does not own in anticipation that the security’s price will decline. Short sales may involve substantial risk and leverage, and expose the fund to the risk that it will be required to buy the security sold short at a time when the security has appreciated in value, thus resulting in a loss to the fund. Short positions in stocks involve more risk than long positions in stocks because the maximum sustainable loss on a stock purchased is limited to the amount paid for the stock plus the transaction costs, whereas there is no maximum attainable price on the shorted stock. In theory, stocks sold short have unlimited risk. It is
4
possible that the market value of securities the fund holds in long positions will decline at the same time that the market value of the securities in the fund has sold short increases, thereby increasing the fund’s potential volatility. Leveraging occurs when the fund increases its assets available for investment using borrowing or similar transactions. Short sales effectively leverage the fund’s assets. The use of leverage may magnify the fund’s gains or losses.
The fund may use derivative instruments, such as options, futures, and options on futures, and swaps. A small investment in derivatives could have a potentially large impact on the fund’s performance. The use of derivatives involves risks different from, or possibly greater than, the risks associated with investing directly in the underlying assets.
1 Total return includes reinvestment of dividends and any capital gains paid and does not take into consideration the maximum initial sales charge in the case of Class A shares, or the applicable contingent deferred sales charge imposed on redemptions in the case of Class C shares. Had these charges been reflected, returns would have been lower. Past performance is no guarantee of future results. Share price and investment return fluctuate such that upon redemption, fund shares may be worth more or less than their original cost. Return figures provided reflect the absorption of certain fund expenses pursuant to an agreement by The Dreyfus Corporation in effect until March 1, 2016, at which time it may be extended, terminated, or modified. Had these expenses not been absorbed, the fund’s returns would have been lower.
2 SOURCE: Lipper Inc. – Reflects reinvestment of net dividends and, where applicable, capital gain distributions. The HFRX Equity Hedge Index (the “HFRX Index”) is designed to be representative of the overall composition of the equity hedge segment of the hedge fund universe. In an equity hedge strategy both long and short positions primarily in equities are maintained. The Index is sponsored by Hedge Fund Research, Inc. and is constructed using robust filtering, monitoring, and quantitative constituent selection process using the Hedge Fund Research database (HFR Database), an industry standard for hedge fund data. Constituents of the Index are selected from an eligible pool of the more than 2270 hedge funds that report to the HFR Database. These hedge funds are screened for various reporting characteristics, asset and duration of track record qualities, unique hedge fund strategy inclusion, and whether they are open to accepting new investment via a fully transparent format. The Index performance is based on the return of the constituent hedge funds after deducting constituent hedge fund fees and Index Provider fees. The Index is calculated in USD (Dollars) and is priced daily, with 2-day lag. The Morgan Stanley Capital International All Country World Index (the “MSCI ACWI Index”) is a free float-adjusted market capitalization index that is designed to measure equity-market performance in the developed and emerging markets throughout the world. Investors cannot invest directly in any index.
5
FUND PERFORMANCE

Comparison of change in value of $10,000 investment in Dreyfus Select Managers Long/Short Fund Class A shares, Class C shares, Class I shares, and Class Y shares, with the HFRX Equity Hedge Index and the Morgan Stanley Capital International – All Country World Index
† Source: Lipper Inc.
Past performance is not predictive of future performance.
The above graph compares a $10,000 investment made in each of the Class A, Class C, Class I and Class Y shares of Dreyfus Select Managers Long/Short Fund on 3/31/14 (inception date) to a $10,000 investment made in the HFRX Equity Hedge Index (the “HFRX Index”) and the Morgan Stanley Capital International-All Country World Index (the “MSCI ACWI Index”) on that date. All dividends and capital gain distributions are reinvested.
The fund’s performance shown in the line graph above takes into account the maximum initial sales charge on Class A shares and all other applicable fees and expenses on all classes. The HFRX Index is designed to be representative of the overall composition of the equity hedge segment of the hedge fund universe. In an equity hedge strategy both long and short positions primarily in equities are maintained. The HFRX Index is sponsored by Hedge Fund Research, Inc. and is constructed using robust filtering, monitoring and quantitative constituent selection process using the Hedge Fund Research database (HFR Database), an industry standard for hedge fund data. Constituents of the HFRX Index are selected from an eligible pool of the more than 2270 [hedge] funds that report to the HFR Database. These [hedge] funds are screened for various reporting characteristics, asset and duration of track record qualities, unique [hedge] fund strategy inclusion, and whether they are open to accepting new investment via a fully transparent format. The HFRX Index performance is based on the return of the constituent hedge funds after deducting constituent hedge fund fees and HFRX Index Provider fees. The HFRX Index is calculated in USD (Dollars) and is priced daily, with 2-day lag. (Source: Hedge Fund Research, Inc). The MSCI ACWI Index is a free float-adjusted market capitalization index that is designed to measure the equity-market performance of developed and emerging markets throughout the world. Unlike a mutual fund, the indices are not subject to
6
charges, fees and other expenses. Investors cannot invest directly in any index. Further information relating to fund performance, including expense reimbursements, if applicable, is contained in the Financial Highlights section of the prospectus and elsewhere in this report.
| | | | | | |
Average Annual Total Returns as of 10/31/15 |
| | Inception Date | 1 Year | From Inception | |
Class A shares | | | | |
with maximum sales charge (5.75%) | | 3/31/14 | -4.79% | -4.52% | |
without sales charge | | 3/31/14 | 0.98% | -0.91% | |
Class C shares | | | | |
with applicable redemption charge† | | 3/31/14 | -0.84% | -1.67% | |
without redemption | | 3/31/14 | 0.17% | -1.67% | |
Class I shares | | 3/31/14 | 1.31% | -0.61% | |
Class Y shares | | 3/31/14 | 1.31% | -0.55% | |
HFRX Equity Hedge Index | | 3/31/14 | -0.96% | -0.71% | |
Morgan Stanley Capital International-
All Country World Index | | 3/31/14 | -0.03% | 2.08% | |
Past performance is not predictive of future performance. The fund’s performance shown in the graph and table does not reflect the deduction of taxes that a shareholder would pay on fund distributions or the redemption of fund shares. In addition to the performance of Class A shares shown with and without a maximum sales charge, the fund’s performance shown in the table takes into account all other applicable fees and expenses on all classes.
† The maximum contingent deferred sales charge for Class C shares is 1% for shares redeemed within one year of the date of purchase.
7
UNDERSTANDING YOUR FUND’S EXPENSES (Unaudited)
As a mutual fund investor, you pay ongoing expenses, such as management fees and other expenses. Using the information below, you can estimate how these expenses affect your investment and compare them with the expenses of other funds. You also may pay one-time transaction expenses, including sales charges (loads) and redemption fees, which are not shown in this section and would have resulted in higher total expenses. For more information, see your fund’s prospectus or talk to your financial adviser.
Review your fund’s expenses
The table below shows the expenses you would have paid on a $1,000 investment in Dreyfus Select Managers Long/Short Fund from May 1, 2015 to October 31, 2015. It also shows how much a $1,000 investment would be worth at the close of the period, assuming actual returns and expenses.
| | | | | | | | | | | | | |
Expenses and Value of a $1,000 Investment | | |
assuming actual returns for the six months ended October 31, 2015 |
| | | | | | | | |
| | | | Class A | Class C | Class I | Class Y |
Expenses paid per $1,000† | $ | 16.01 | $ | 20.11 | $ | 14.47 | $ | 14.27 |
Ending value (after expenses) | $ | 978.50 | $ | 974.40 | $ | 980.20 | $ | 980.20 |
COMPARING YOUR FUND’S EXPENSES
WITH THOSE OF OTHER FUNDS (Unaudited)
Using the SEC’s method to compare expenses
The Securities and Exchange Commission (SEC) has established guidelines to help investors assess fund expenses. Per these guidelines, the table below shows your fund’s expenses based on a $1,000 investment, assuming a hypothetical 5% annualized return. You can use this information to compare the ongoing expenses (but not transaction expenses or total cost) of investing in the fund with those of other funds. All mutual fund shareholder reports will provide this information to help you make this comparison. Please note that you cannot use this information to estimate your actual ending account balance and expenses paid during the period.
| | | | | | | | | | | | |
Expenses and Value of a $1,000 Investment | | |
assuming a hypothetical 5% annualized return for the six months ended October 31, 2015 |
| | | | | | | | |
| | | | Class A | Class C | Class I | Class Y |
Expenses paid per $1,000† | $ | 16.25 | $ | 20.42 | $ | 14.70 | $ | 14.50 |
Ending value (after expenses) | $ | 1,009.02 | $ | 1,004.84 | $ | 1,010.59 | $ | 1,010.79 |
† Expenses are equal to the fund's annualized expense ratio of 3.21% for Class A, 4.04% for Class C, 2.90% for Class I and 2.86% for Class Y, multiplied by the average account value over the period, multiplied by 184/365 (to reflect the one-half year period).
8
STATEMENT OF INVESTMENTS
October 31, 2015
| | | | | | |
Common Stocks - 61.0% | | Shares | | Value ($) | |
Automobiles & Components - 2.9% | | | | | |
Autoliv, SDR | | 6,563 | | 787,386 | |
Bayerische Motoren Werke | | 3,358 | | 344,744 | |
China Harmony New Energy Auto Holding | | 524,500 | | 350,542 | |
Daimler | | 15,179 | | 1,318,135 | |
Delphi Automotive | | 31,368 | a | 2,609,504 | |
Fiat Chrysler Automobiles | | 53,531 | b | 789,973 | |
Magna International, Cl. A | | 31,410 | a | 1,656,249 | |
Visteon | | 11,905 | a,b | 1,298,478 | |
| | | | | 9,155,011 | |
Banks - 4.3% | | | | | |
Banca Popolare dell'Emilia Romagna | | 49,366 | | 398,726 | |
Bank of America | | 276,085 | a | 4,632,706 | |
Bank of the Ozarks | | 27,935 | | 1,397,309 | |
Danske Bank | | 25,187 | | 692,588 | |
Erste Group Bank | | 23,030 | b | 675,416 | |
JPMorgan Chase & Co. | | 12,884 | | 827,797 | |
Mediobanca | | 64,613 | | 650,123 | |
Nordea Bank | | 57,013 | | 630,619 | |
Signature Bank | | 9,370 | b | 1,395,380 | |
SunTrust Banks | | 24,125 | | 1,001,670 | |
Swedbank, Cl. A | | 20,087 | | 461,057 | |
Unione di Banche Italiane | | 85,501 | | 640,284 | |
Western Alliance Bancorp | | 13,056 | b | 466,752 | |
| | | | | 13,870,427 | |
Capital Goods - 4.3% | | | | | |
Acuity Brands | | 872 | a | 190,619 | |
AerCap Holdings | | 33,719 | a,b | 1,399,338 | |
Airbus Group | | 11,140 | | 776,167 | |
Alfa Laval | | 31,556 | | 555,140 | |
Atlas Copco, Cl. A | | 17,966 | | 468,941 | |
Danaher | | 6,460 | | 602,783 | |
Finmeccanica | | 22,299 | b | 291,801 | |
General Electric | | 39,000 | | 1,127,880 | |
Honeywell International | | 7,840 | a | 809,715 | |
Koninklijke Philips | | 42,314 | | 1,144,187 | |
MTU Aero Engines Holding | | 2,687 | | 248,702 | |
Mueller Water Products, Cl. A | | 148,525 | a | 1,307,020 | |
Precision Castparts | | 11,304 | a | 2,609,076 | |
9
STATEMENT OF INVESTMENTS (continued)
| | | | | | |
Common Stocks - 61.0% (continued) | | Shares | | Value ($) | |
Capital Goods - 4.3% (continued) | | | | | |
Rheinmetall | | 5,440 | | 342,535 | |
Thermo Fisher Scientific | | 8,404 | | 1,099,075 | |
Vestas Wind Systems | | 5,172 | | 301,443 | |
Xylem | | 15,925 | | 579,829 | |
| | | | | 13,854,251 | |
Commercial & Professional Services - .3% | | | | | |
ISS | | 11,284 | | 397,132 | |
Tyco International | | 17,875 | a | 651,365 | |
| | | | | 1,048,497 | |
Consumer Durables & Apparel - 1.3% | | | | | |
adidas | | 4,231 | | 379,421 | |
Cie Financiere Richemont | | 7,388 | | 633,823 | |
Coach | | 25,425 | a | 793,260 | |
Electrolux, Ser. B | | 12,795 | | 377,401 | |
Garmin | | 1,638 | | 58,100 | |
Mohawk Industries | | 3,489 | a,b | 682,100 | |
PVH | | 8,855 | a | 805,362 | |
Sony | | 15,000 | | 432,585 | |
| | | | | 4,162,052 | |
Consumer Services - 1.7% | | | | | |
Bloomin' Brands | | 35,650 | a | 604,981 | |
Carnival | | 28,363 | | 1,533,871 | |
McDonald's | | 6,214 | | 697,521 | |
Melco Crown Entertainment, ADR | | 15,420 | | 288,817 | |
Sands China | | 111,389 | | 404,562 | |
Vipshop Holdings, ADR | | 14,451 | b | 296,535 | |
Yum! Brands | | 21,702 | a | 1,538,889 | |
| | | | | 5,365,176 | |
Diversified Financials - 2.2% | | | | | |
GMO Payment Gateway | | 16,400 | | 651,678 | |
Intercontinental Exchange | | 3,422 | | 863,713 | |
Invincible Investment | | 688 | | 409,938 | |
Morgan Stanley | | 11,700 | | 385,749 | |
Nihon M&A Center | | 11,900 | | 494,066 | |
OM Asset Management | | 18,655 | | 283,183 | |
Pace Holdings | | 141,700 | a | 1,487,850 | |
Synchrony Financial | | 25,450 | b | 782,842 | |
WL Ross Holding | | 182,775 | b | 1,831,405 | |
| | | | | 7,190,424 | |
10
| | | | | | |
Common Stocks - 61.0% (continued) | | Shares | | Value ($) | |
Energy - 3.4% | | | | | |
Anadarko Petroleum | | 20,927 | a | 1,399,598 | |
Apache | | 12,501 | | 589,172 | |
Baker Hughes | | 6,540 | a | 344,527 | |
Canadian Natural Resources | | 24,650 | | 572,373 | |
ConocoPhillips | | 16,737 | a | 892,919 | |
EOG Resources | | 10,647 | a | 914,045 | |
Halliburton | | 50,450 | a | 1,936,271 | |
Noble Energy | | 22,298 | | 799,160 | |
Pioneer Natural Resources | | 17,798 | a | 2,440,818 | |
Valero Energy | | 14,710 | a | 969,683 | |
| | | | | 10,858,566 | |
Food & Staples Retailing - .6% | | | | | |
CVS Health | | 5,805 | | 573,418 | |
Koninklijke Ahold | | 28,142 | | 573,127 | |
METRO | | 20,284 | | 625,218 | |
| | | | | 1,771,763 | |
Food, Beverage & Tobacco - 2.5% | | | | | |
CALBEE | | 13,300 | | 486,061 | |
Coca-Cola | | 31,750 | a | 1,344,612 | |
Constellation Brands, Cl. A | | 26,641 | a | 3,591,207 | |
J.M. Smucker | | 21,161 | | 2,484,090 | |
Molson Coors Brewing, Cl. B | | 2,817 | | 248,178 | |
| | | | | 8,154,148 | |
Health Care Equipment & Services - 2.7% | | | | | |
Aetna | | 5,182 | a | 594,790 | |
C.R. Bard | | 4,125 | a | 768,694 | |
Cerner | | 11,304 | b | 749,342 | |
Cigna | | 4,464 | a | 598,355 | |
HCA Holdings | | 10,823 | a,b | 744,514 | |
McKesson | | 7,857 | | 1,404,832 | |
Medtronic | | 27,390 | a | 2,024,669 | |
St. Jude Medical | | 7,369 | | 470,216 | |
Universal Health Services, Cl. B | | 11,408 | a | 1,392,803 | |
| | | | | 8,748,215 | |
Household & Personal Products - .8% | | | | | |
Herbalife | | 7,570 | a,b | 424,223 | |
Shiseido | | 35,100 | | 840,922 | |
Unilever | | 25,321 | | 1,144,955 | |
| | | | | 2,410,100 | |
11
STATEMENT OF INVESTMENTS (continued)
| | | | | | |
Common Stocks - 61.0% (continued) | | Shares | | Value ($) | |
Insurance - 1.0% | | | | | |
Allianz | | 3,358 | | 588,420 | |
Assicurazioni Generali | | 29,150 | | 552,625 | |
Chubb | | 11,556 | a | 1,494,769 | |
Swiss Life Holding | | 1,948 | b | 465,297 | |
| | | | | 3,101,111 | |
Materials - 3.2% | | | | | |
Air Products & Chemicals | | 11,555 | a | 1,605,914 | |
Akzo Nobel | | 6,649 | | 471,231 | |
Givaudan | | 181 | b | 324,113 | |
LyondellBasell Industries, Cl. A | | 24,364 | a | 2,263,659 | |
Monsanto | | 8,940 | | 833,387 | |
Norsk Hydro | | 226,893 | | 813,389 | |
Sherwin-Williams | | 5,100 | a | 1,360,833 | |
Sigma-Aldrich | | 13,246 | a | 1,850,731 | |
Voestalpine | | 8,530 | | 308,931 | |
Yara International | | 11,890 | | 539,733 | |
| | | | | 10,371,921 | |
Media - 3.7% | | | | | |
Baidu, ADR | | 1,138 | b | 213,341 | |
CBS, Cl. B | | 25,088 | a | 1,167,094 | |
DISH Network, Cl. A | | 49,792 | b | 3,135,402 | |
Houghton Mifflin Harcourt | | 27,300 | b | 534,807 | |
JCDecaux | | 50,531 | | 2,058,736 | |
Time Warner | | 52,946 | | 3,988,952 | |
Twenty-First Century Fox, Cl. A | | 25,550 | | 784,129 | |
| | | | | 11,882,461 | |
Pharmaceuticals, Biotechnology & Life Sciences - 3.4% | | | | | |
Actelion | | 2,351 | b | 326,802 | |
Allergan | | 19,971 | a,b | 6,160,454 | |
Bayer | | 10,075 | | 1,344,434 | |
Gilead Sciences | | 11,274 | | 1,219,058 | |
Roche Holding | | 2,351 | | 638,144 | |
Teva Pharmaceutical Industries, ADR | | 8,326 | a | 492,816 | |
Zoetis | | 20,050 | | 862,350 | |
| | | | | 11,044,058 | |
Real Estate - 2.2% | | | | | |
Equinix | | 1,998 | a,c | 592,767 | |
Kennedy Wilson Europe Real Estate | | 56,639 | | 1,044,278 | |
Lamar Advertising, Cl. A | | 7,278 | | 410,698 | |
Mack-Cali Realty | | 35,450 | c | 771,392 | |
12
| | | | | | |
Common Stocks - 61.0% (continued) | | Shares | | Value ($) | |
Real Estate - 2.2% (continued) | | | | | |
NorthStar Realty Finance | | 93,625 | | 1,124,442 | |
Realogy Holdings | | 42,277 | b | 1,653,031 | |
Takara Leben | | 168,300 | | 882,853 | |
Vonovia | | 14,978 | | 499,717 | |
| | | | | 6,979,178 | |
Retailing - 2.6% | | | | | |
Amazon.com | | 1,528 | a,b | 956,375 | |
AutoZone | | 1,455 | a,b | 1,141,317 | |
Blue Buffalo Pet Products | | 15,501 | | 278,088 | |
Dollar Tree | | 27,245 | b | 1,784,275 | |
Don Quijote Holdings | | 10,700 | | 396,805 | |
Expedia | | 9,912 | a | 1,351,006 | |
Isetan Mitsukoshi Holdings | | 53,000 | | 858,664 | |
Laox | | 120,700 | b | 341,085 | |
Priceline Group | | 935 | a,b | 1,359,714 | |
| | | | | 8,467,329 | |
Semiconductors & Semiconductor Equipment - 1.4% | | | | | |
Altera | | 11,850 | | 622,718 | |
Atmel | | 67,250 | a | 511,100 | |
Broadcom, Cl. A | | 42,748 | a | 2,197,247 | |
Kone, Cl. B | | 7,791 | | 332,928 | |
Silicon Motion Technology, ADR | | 23,374 | | 743,059 | |
| | | | | 4,407,052 | |
Software & Services - 5.8% | | | | | |
58.com, ADR | | 13,800 | b | 724,362 | |
Benefit One | | 31,000 | | 547,195 | |
Citrix Systems | | 10,686 | a,b | 877,321 | |
Cognizant Technology Solutions, Cl. A | | 23,680 | a,b | 1,612,845 | |
CommVault Systems | | 9,569 | b | 387,736 | |
Computer Sciences | | 41,670 | a | 2,774,805 | |
Intuit | | 4,765 | | 464,254 | |
Nintendo | | 9,400 | a | 1,517,461 | |
PTC | | 38,201 | a,b | 1,353,843 | |
SAP | | 16,388 | | 1,295,354 | |
Square Enix Holdings | | 20,200 | | 549,068 | |
Symantec | | 33,135 | | 682,581 | |
Tencent Holdings | | 14,064 | | 266,016 | |
Verint Systems | | 18,075 | a,b | 860,008 | |
Visa, Cl. A | | 10,043 | a | 779,136 | |
13
STATEMENT OF INVESTMENTS (continued)
| | | | | | |
Common Stocks - 61.0% (continued) | | Shares | | Value ($) | |
Software & Services - 5.8% (continued) | | | | | |
VMware, Cl. A | | 9,587 | a,b | 576,658 | |
Yahoo! | | 90,102 | a,b | 3,209,433 | |
| | | | | 18,478,076 | |
Technology Hardware & Equipment - 4.9% | | | | | |
Alphabet, Cl. A | | 3,871 | a,b | 2,854,437 | |
Alphabet, Cl. C | | 7,152 | a,b | 5,083,713 | |
Alps Electric | | 21,977 | | 690,253 | |
EMC | | 115,116 | a | 3,018,342 | |
Hewlett-Packard | | 29,562 | a | 796,992 | |
Western Digital | | 47,397 | a | 3,167,068 | |
| | | | | 15,610,805 | |
Telecommunication Services - 2.8% | | | | | |
Cellnex Telecom | | 30,533 | d | 529,823 | |
Deutsche Telekom | | 30,224 | | 565,175 | |
Nokia | | 174,629 | | 1,300,049 | |
QUALCOMM | | 9,044 | | 537,394 | |
Radware | | 15,501 | b | 231,120 | |
Ruckus Wireless | | 33,150 | b | 373,932 | |
Sunrise Communications Group | | 14,159 | d | 773,520 | |
T-Mobile US | | 49,860 | b | 1,889,195 | |
Verizon Communications | | 56,627 | a | 2,654,674 | |
XL Axiata | | 562,000 | b | 127,900 | |
| | | | | 8,982,782 | |
Transportation - 3.0% | | | | | |
Avis Budget Group | | 17,484 | a,b | 873,151 | |
Delta Air Lines | | 45,064 | a | 2,291,054 | |
FedEx | | 16,844 | | 2,628,506 | |
Hertz Global Holdings | | 51,668 | a,b | 1,007,526 | |
Japan Airport Terminal | | 5,720 | | 312,853 | |
Old Dominion Freight Line | | 15,599 | a,b | 966,202 | |
Saia | | 8,830 | b | 208,476 | |
Seino Holdings | | 42,000 | | 502,594 | |
United Continential Holdings | | 11,931 | b | 719,559 | |
| | | | | 9,509,921 | |
Total Common Stocks (cost $187,494,023) | | | | 195,423,324 | |
14
| | | | | | |
Warrants - .2% | | Number of Warrants | | Value ($) | |
Banks - .2% | | | | | |
JPMorgan Chase & Co. Ser. CW18 (10/28/18) | | 22,541 | b | 504,017 | |
Total Warrants (cost $406,281) | | | | | |
Options Purchased - .2% | | Number of Contracts | | Value ($) | |
Call Options - .0% | | | | | |
Aetna, January 2016 @ $130 | | 4,400 | | 8,756 | |
Avago Technologies, January 2016 @ $125 | | 900 | | 9,549 | |
Cigna, January 2016 @ $140 | | 1,800 | | 9,360 | |
Cigna, January 2016 @ $155 | | 3,500 | | 2,625 | |
Hewlett-Packard, November 2015 @ $34 | | 8,200 | | 246 | |
Market Vectors Semiconductor, February 2016 @ $55 | | 4,800 | | 9,120 | |
| | | | | 39,656 | |
Put Options - .2% | | | | | |
Apple, February 2016 @ $115 | | 7,200 | | 37,800 | |
Avago Technologies, January 2016 @ $125 | | 700 | | 9,170 | |
General Electric, November 2015 @ $35 | | 29,200 | | 174,616 | |
iShares Russell 2000 ETF, December 2015 @ $112 | | 59,000 | | 112,100 | |
SPDR S&P 500 ETF Trust, December 2015 @ $185 | | 71,700 | | 67,398 | |
SPDR S&P 500 ETF Trust, December 2015 @ $195 | | 58,200 | | 108,252 | |
| | | | | 509,336 | |
Total Options Purchased (cost $991,525) | | | | 548,992 | |
Total Investments (cost $188,891,829) | | 61.4% | | 196,476,333 | |
Cash and Receivables (Net) | | 38.6% | | 123,780,743 | |
Net Assets | | 100.0% | | 320,257,076 | |
ADR—American Depository Receipt
ETF—Exchange-Traded Fund
SDR—Swedish Depository Receipts
SPDR—Standard & Poor's Depository Receipt
a Held by a broker as collateral for open short positions.
b Non-income producing security.
c Investment in real estate investment trust.
d Securities exempt from registration pursuant to Rule 144A under the Securities Act of 1933. These securities may be resold in transactions exempt from registration, normally to qualified institutional buyers. At October 31, 2015, these securities were valued at $1,303,343 or 0.4% of net assets.
15
STATEMENT OF INVESTMENTS (continued)
| | |
Portfolio Summary (Unaudited) † | Value (%) |
Software & Services | 5.8 |
Technology Hardware & Equipment | 4.9 |
Banks | 4.5 |
Capital Goods | 4.3 |
Media | 3.7 |
Energy | 3.4 |
Pharmaceuticals, Biotech & Life Sciences | 3.4 |
Materials | 3.2 |
Transportation | 3.0 |
Automobiles & Components | 2.9 |
Telecommunication Services | 2.8 |
Health Care Equipment & Services | 2.7 |
Retailing | 2.6 |
Food, Beverage & Tobacco | 2.5 |
Diversified Financials | 2.2 |
Real Estate | 2.2 |
Consumer Services | 1.7 |
Semiconductors & Semiconductor Equipment | 1.4 |
Consumer Durables & Apparel | 1.3 |
Insurance | 1.0 |
Household & Personal Products | .8 |
Food & Staples Retailing | .6 |
Commercial & Professional Services | .3 |
Options Purchased | .2 |
| | 61.4 |
† Based on net assets.
See notes to financial statements.
16
STATEMENT OF SECURITIES SOLD SHORT
October 31, 2015
| | | | | | |
Common Stocks-32.4% | | Shares | | Value ($) | |
Automobiles & Components-1.0% | | | | | |
Dorman Products | | 5,000 | | 233,400 | |
Fiat Chrysler Automobiles | | 36,714 | | 537,493 | |
Ford Motor | | 27,136 | | 401,884 | |
General Motors | | 16,235 | | 566,764 | |
Gentherm | | 7,000 | | 344,120 | |
Tata Motors, ADR | | 18,075 | | 534,478 | |
Toyota Motor, ADR | | 3,257 | | 399,373 | |
| | | | | 3,017,512 | |
Banks-.2% | | | | | |
PNC Financial Services Group | | 6,675 | | 602,485 | |
Capital Goods-3.4% | | | | | |
3M | | 8,012 | | 1,259,566 | |
Applied Industrial Technologies | | 2,225 | | 91,915 | |
Boeing | | 11,886 | | 1,759,960 | |
Caterpillar | | 15,539 | | 1,134,192 | |
Cummins | | 3,375 | | 349,346 | |
Danaher | | 5,146 | | 480,173 | |
Deere & Co. | | 8,871 | | 691,938 | |
Encore Wire | | 7,000 | | 299,390 | |
Fastenal | | 9,400 | | 368,104 | |
Northrop Grumman | | 1,967 | | 369,304 | |
Parker Hannifin | | 19,573 | | 2,049,293 | |
Trex | | 7,500 | | 293,025 | |
United Technologies | | 4,209 | | 414,208 | |
W.W. Grainger | | 5,434 | | 1,141,140 | |
| | | | | 10,701,554 | |
Consumer Durables & Apparel-.8% | | | | | |
D.R. Horton | | 13,800 | | 406,272 | |
Electronic Arts | | 5,089 | | 366,764 | |
iRobot | | 10,000 | | 300,100 | |
Lululemon Athletica | | 8,150 | | 400,736 | |
Michael Kors Holdings | | 18,075 | | 698,418 | |
Smith & Wesson Holding | | 14,500 | | 258,970 | |
| | | | | 2,431,260 | |
Consumer Services-.6% | | | | | |
American Public Education | | 15,000 | | 325,950 | |
17
STATEMENT OF SECURITIES SOLD SHORT (continued)
| | | | | | |
Common Stocks-32.4%(continued) | | Shares | | Value ($) | |
Career Education | | 60,000 | | 216,600 | |
Jack in the Box | | 1,050 | | 78,257 | |
K12 Inc | | 14,000 | | 135,940 | |
Papa Murphy's Holdings | | 22,000 | | 303,820 | |
Potbelly | | 28,000 | | 313,600 | |
Sonic | | 14,425 | | 411,689 | |
| | | | | 1,785,856 | |
Diversified Financials-.1% | | | | | |
KKR & Co. | | 23,350 | | 400,452 | |
Energy-3.4% | | | | | |
Calfrac Well Services | | 45,350 | | 80,115 | |
Chevron | | 16,461 | | 1,495,976 | |
Devon Energy | | 15,099 | | 633,101 | |
Hess | | 18,487 | | 1,039,154 | |
Marathon Petroleum | | 16,131 | | 835,586 | |
National Oilwell Varco | | 60,638 | | 2,282,414 | |
Occidental Petroleum | | 20,527 | | 1,530,083 | |
Range Resources | | 19,075 | | 580,643 | |
RigNet Inc | | 6,000 | | 180,000 | |
Schlumberger | | 29,844 | | 2,332,607 | |
| | | | | 10,989,679 | |
Exchange-Traded Funds-7.6% | | | | | |
Amex Consumer Discretionary Select Sector SPDR Fund | | 15,166 | | 1,227,991 | |
CurrencyShares Euro Trust | | 13,700 | | 1,476,312 | |
Health Care Select Sector SPDR Fund | | 7,583 | | 540,971 | |
Industrial Select Sector SPDR Fund | | 20,199 | | 1,096,200 | |
Materials Select Sector SPDR Fund | | 25,030 | | 1,133,358 | |
SPDR S&P 500 ETF Trust | | 79,697 | | 16,571,397 | |
SPDR S&P Biotech ETF | | 8,120 | | 541,036 | |
SPDR S&P Regional Banking ETF | | 26,909 | | 1,152,512 | |
Technology Select Sector SPDR Fund | | 8,455 | | 369,061 | |
| | | | | 24,108,838 | |
Food & Staples Retailing-.3% | | | | | |
Amplify Snack Brands | | 30,000 | | 362,400 | |
Walgreens Boots Alliance | | 4,439 | | 375,895 | |
Wal-Mart Stores | | 5,503 | | 314,992 | |
| | | | | 1,053,287 | |
Food, Beverage & Tobacco-.3% | | | | | |
Boulder Brands | | 38,000 | | 336,680 | |
Campbell Soup | | 7,075 | | 359,339 | |
Chefs' Warehouse | | 7,000 | | 106,050 | |
18
| | | | | | |
Common Stocks-32.4%(continued) | | Shares | | Value ($) | |
DAVIDsTEA | | 20,000 | | 292,600 | |
| | | | | 1,094,669 | |
Health Care Equipment & Services-2.6% | | | | | |
Abbott Laboratories | | 5,262 | | 235,738 | |
AmerisourceBergen | | 12,052 | | 1,163,138 | |
Anthem | | 13,473 | | 1,874,768 | |
Baxter International | | 17,051 | | 637,537 | |
Cardinal Health | | 5,542 | | 455,552 | |
Coloplast, Cl. B | | 6,875 | | 493,247 | |
DaVita HealthCare Partners | | 8,224 | | 637,442 | |
HCA Holdings | | 6,644 | | 457,041 | |
LivaNova | | 9,225 | | 611,433 | |
Mindray Medical International, ADR | | 15,000 | | 359,700 | |
Novadaq Technologies | | 30,000 | | 391,500 | |
Stryker | | 9,424 | | 901,123 | |
| | | | | 8,218,219 | |
Household & Personal Products-.2% | | | | | |
Coty Inc | | 13,350 | | 386,482 | |
Natural Health Trends | | 7,000 | | 344,820 | |
| | | | | 731,302 | |
Insurance-.7% | | | | | |
ACE | | 6,956 | | 789,784 | |
Aon | | 6,361 | | 593,545 | |
HCI Group | | 3,000 | | 130,830 | |
Primerica | | 8,650 | | 411,999 | |
Progressive | | 9,950 | | 329,644 | |
| | | | | 2,255,802 | |
Materials-1.0% | | | | | |
Air Products & Chemicals | | 5,404 | | 751,048 | |
Domtar | | 10,225 | | 421,679 | |
Praxair | | 5,375 | | 597,109 | |
Senomyx | | 45,000 | | 222,750 | |
Syngenta, ADR | | 5,500 | | 370,095 | |
Tronox | | 35,300 | | 219,213 | |
Valspar | | 3,650 | | 295,468 | |
WestRock | | 7,500 | | 403,200 | |
| | | | | 3,280,562 | |
Media-.7% | | | | | |
John Wiley & Sons, Cl. A | | 5,600 | | 293,048 | |
MDC Partners, Cl. A | | 10,000 | | 207,800 | |
Netflix | | 4,984 | | 540,166 | |
19
STATEMENT OF SECURITIES SOLD SHORT (continued)
| | | | | | |
Common Stocks-32.4%(continued) | | Shares | | Value ($) | |
Omnicom Group | | 6,600 | | 494,472 | |
TEGNA | | 11,000 | | 297,440 | |
Walt Disney | | 3,042 | | 345,997 | |
| | | | | 2,178,923 | |
Pharmaceuticals, Biotechnology & Life Sciences-.6% | | | | | |
ANI Pharmaceuticals | | 3,400 | | 142,256 | |
BioCryst Pharmaceuticals | | 19,400 | | 174,406 | |
Exact Sciences | | 12,200 | | 101,626 | |
Insys Therapeutics | | 13,000 | | 334,880 | |
MiMedx Group | | 34,100 | | 248,248 | |
NeoGenomics | | 36,000 | | 253,800 | |
Novavax | | 17,000 | | 114,750 | |
OPKO Health | | 28,100 | | 265,545 | |
Pacific Biosciences of California Inc | | 50,000 | | 355,000 | |
| | | | | 1,990,511 | |
Real Estate-.6% | | | | | |
Equinix | | 1,360 | a | 403,485 | |
HCP | | 3,373 | a | 125,476 | |
Howard Hughes | | 3,000 | | 370,740 | |
Pennsylvania Real Estate Investment Trust | | 27,500 | a | 618,200 | |
Ventas | | 8,145 | a | 437,549 | |
| | | | | 1,955,450 | |
Retailing-.6% | | | | | |
Foot Locker | | 2,420 | | 163,955 | |
Francesca's Holdings | | 22,000 | | 312,620 | |
L Brands | | 4,375 | | 419,913 | |
Overstock.com | | 14,000 | | 219,240 | |
Sportsman's Warehouse Holdings | | 30,000 | | 322,800 | |
Tile Shop Holdings | | 22,500 | | 326,475 | |
| | | | | 1,765,003 | |
Semiconductors & Semiconductor Equipment-.5% | | | | | |
Avago Technologies | | 3,035 | | 373,700 | |
Power Integrations | | 5,000 | | 253,050 | |
Skyworks Solutions | | 7,001 | | 540,757 | |
Texas Instruments | | 6,600 | | 374,352 | |
| | | | | 1,541,859 | |
Software & Services-3.8% | | | | | |
Accenture, Cl. A | | 6,868 | | 736,250 | |
Adobe Systems | | 16,730 | | 1,483,282 | |
Alibaba Group Holding, ADR | | 23,967 | | 2,009,154 | |
Constant Contact | | 12,000 | | 313,200 | |
20
| | | | | | |
Common Stocks-32.4%(continued) | | Shares | | Value ($) | |
Cyber-Ark Software | | 5,500 | | 273,020 | |
Ebix | | 7,688 | | 213,188 | |
Infosys Ltd | | 129,398 | | 2,349,868 | |
Interactive Intelligence Group | | 6,500 | | 210,210 | |
International Business Machines | | 11,808 | | 1,654,065 | |
LinkedIn, Cl. A | | 4,259 | | 1,025,865 | |
Microsoft | | 8,179 | | 430,543 | |
SAP | | 2,617 | | 206,855 | |
TubeMogul | | 18,000 | | 215,100 | |
Workday, Cl. A | | 10,108 | | 798,229 | |
Yelp | | 15,000 | | 333,750 | |
| | | | | 12,252,579 | |
Technology Hardware & Equipment-1.9% | | | | | |
Apple | | 20,217 | | 2,415,931 | |
Clearfield | | 5,941 | | 83,352 | |
Corning | | 97,735 | | 1,817,871 | |
Itron | | 10,000 | | 367,300 | |
Motorola Solutions | | 11,302 | | 790,801 | |
Palo Alto Networks | | 1,200 | | 193,200 | |
Sensata Technologies Holding | | 8,600 | | 413,574 | |
| | | | | 6,082,029 | |
Telecommunication Services-.5% | | | | | |
8x8 | | 33,400 | | 356,044 | |
AT&T | | 10,871 | | 364,287 | |
Boingo Wireless | | 35,000 | | 270,550 | |
Gogo | | 20,000 | | 282,600 | |
NETGEAR | | 6,000 | | 248,400 | |
Straight Path Communications, Cl. B | | 3,800 | | 117,800 | |
| | | | | 1,639,681 | |
Transportation-1.0% | | | | | |
Deutsche Lufthansa | | 45,725 | | 675,281 | |
Pentair | | 3,475 | | 194,322 | |
Royal Mail | | 68,450 | | 469,889 | |
Union Pacific | | 10,184 | | 909,940 | |
United Parcel Service, Cl. B | | 8,570 | | 882,881 | |
| | | | | 3,132,313 | |
Total Securities Sold Short (proceeds $104,081,602) | | | | 103,209,825 | |
ADR—American Depository Receipt
ETF—Exchange-Traded Fund
SPDR—Standard & Poor's Depository Receipt
21
STATEMENT OF SECURITIES SOLD SHORT (continued)
a Investment in real estate investment trust.
| | |
Portfolio Summary (Unaudited) † | Value (%) |
Exchange-Traded Funds | 7.5 |
Software & Services | 3.8 |
Capital Goods | 3.4 |
Energy | 3.4 |
Health Care Equipment & Services | 2.6 |
Technology Hardware & Equipment | 1.9 |
Materials | 1.0 |
Transportation | 1.0 |
Automobiles & Components | .9 |
Consumer Durables & Apparel | .8 |
Insurance | .7 |
Media | .7 |
Consumer Services | .6 |
Pharmaceuticals, Biotech & Life Sciences | .6 |
Real Estate | .6 |
Retailing | .6 |
Semiconductors & Semiconductor Equipment | .5 |
Telecommunication Services | .5 |
Food, Beverage & Tobacco | .3 |
Food & Staples Retailing | .3 |
Banks | .2 |
Household & Personal Products | .2 |
Diversified Financials | .1 |
| | 32.2 |
† Based on net assets.
See notes to financial statements.
22
STATEMENT OF FINANCIAL FUTURES
October 31, 2015
| | | | | | |
| | Contracts | Market Value Covered by Contracts ($) | Expiration | Unrealized Appreciation (Depreciation)at 10/31/2015 ($) | |
| | | | | | |
Financial Futures Short | | | | | |
Amsterdam Exchange Index | 5 | (507,269) | November 2015 | (704) | |
CAC 40 10 Euro | 41 | (2,207,169) | November 2015 | (85,009) | |
DAX | 5 | (1,487,208) | December 2015 | (150,450) | |
DJ Euro Stoxx 50 | 163 | (6,099,639) | December 2015 | (406,811) | |
FTSE 100 | 24 | (2,338,287) | December 2015 | (46,147) | |
IBEX 35 Index | 4 | (452,405) | November 2015 | 738 | |
OMX Stockholm 30 Index | 47 | (822,983) | November 2015 | (4,397) | |
Gross Unrealized Appreciation | | | | 738 | |
Gross Unrealized Depreciation | | | | (693,518) | |
| | | | | | |
See notes to financial statements.
23
STATEMENT OF OPTIONS WRITTEN
October 31, 2015
| | | | |
| | Number of Contacts | Value ($) | |
Call Options: | | | |
General Electric | | | |
November 2015 @ $35 | 29,200 | (876) | |
Total Options Written (premiums received $1,060) | | (876) | |
See notes to financial statements.
24
STATEMENT OF ASSETS AND LIABILITIES
October 31, 2015
| | | | | | | |
| | | | | | |
| | | Cost | | Value | |
Assets ($): | | | | |
Investments in securities—See Statement of Investments | | 188,891,829 | | 196,476,333 | |
Cash | | | | | 74,104,218 | |
Cash denominated in foreign currency | | | 630,175 | | 634,557 | |
Receivable from brokers for proceeds on securities
sold short—Note 4 | | | | | 104,081,602 | |
Cash collateral—Note 4 | | | | | 41,470,000 | |
Receivable for investment securities sold | | | | | 17,588,224 | |
Receivable for shares of Common Stock subscribed | | | | | 1,560,050 | |
Unrealized appreciation on forward foreign
currency exchange contracts—Note 4 | | | | | 1,136,724 | |
Unrealized appreciation on swap agreements—Note 4 | | | | | 1,090,482 | |
Receivable from broker for swap transactions—Note 4 | | | | | 237,486 | |
Dividends receivable | | | | | 221,451 | |
Receivable for futures variation margin—Note 4 | | | | | 3,833 | |
Prepaid expenses | | | | | 18,076 | |
| | | | | 438,623,036 | |
Liabilities ($): | | | | |
Due to The Dreyfus Corporation and affiliates—Note 3(c) | | | | | 593,139 | |
Securities sold short, at value (proceeds $104,081,602—See
Statement of Securities Sold Short—Note 4 | | | | | 103,209,825 | |
Payable for investment securities purchased | | | | | 13,402,894 | |
Unrealized depreciation on swap agreements—Note 4 | | | | | 458,468 | |
Unrealized depreciation on forward foreign
currency exchange contracts—Note 4 | | | | | 408,808 | |
Payable for dividends on securities sold short | | | | | 96,127 | |
Payable for shares of Common Stock redeemed | | | | | 66,292 | |
Due to broker | | | | | 46,879 | |
Outstanding options written, at value (premiums received
$1,060—See Statement of Options Written—Note 4 | | | | | 876 | |
Accrued expenses | | | | | 82,652 | |
| | | | | 118,365,960 | |
Net Assets ($) | | | 320,257,076 | |
Composition of Net Assets ($): | | | | |
Paid-in capital | | | | | 321,479,356 | |
Accumulated investment (loss)—net | | | | | (2,269,476) | |
Accumulated net realized gain (loss) on investments | | | | | (8,061,853) | |
Accumulated net unrealized appreciation (depreciation)
on investments, options transactions, swap transactions,
securities sold short and foreign currency transactions
[including ($692,780) net unrealized (depreciation)
on financial futures] | | | | | 9,109,049 | |
Net Assets ($) | | | 320,257,076 | |
| | | | | | |
Net Asset Value Per Share | Class A | Class C | Class I | Class Y | |
Net Assets ($) | 304,464 | 116,237 | 354,973 | 319,481,402 | |
Shares Outstanding | 24,716 | 9,549 | 28,667 | 25,785,939 | |
Net Asset Value Per Share ($) | 12.32 | 12.17 | 12.38 | 12.39 | |
See notes to financial statements.
25
STATEMENT OF OPERATIONS
Year Ended October 31, 2015
| | | | | | | |
| | | | | | |
| | | | | | |
Investment Income ($): | | | | |
Income: | | | | |
Interest | | | 505,404 | |
Cash dividends from unaffiliated issuers (net of $119,491 foreign taxes
withheld at source): | | | 2,202,014 | |
Total Income | | | 2,707,418 | |
Expenses: | | | | |
Management fee—Note 3(a) | | | 5,887,591 | |
Dividends on securities sold short | | | 1,200,057 | |
Interest on securities sold short | | | 632,634 | |
Custodian fees—Note 3(c) | | | 176,246 | |
Professional fees | | | 125,929 | |
Registration fees | | | 77,505 | |
Prospectus and shareholders’ reports | | | 37,644 | |
Directors’ fees and expenses—Note 3(d) | | | 30,385 | |
Loan commitment fees—Note 2 | | | 3,222 | |
Shareholder servicing costs—Note 3(c) | | | 2,519 | |
Distribution fees—Note 3(b) | | | 846 | |
Miscellaneous | | | 64,939 | |
Total Expenses | | | 8,239,517 | |
Less—reduction in fees due to earnings credits—Note 3(c) | | | (1) | |
Net Expenses | | | 8,239,516 | |
Investment (Loss)—Net | | | (5,532,098) | |
Realized and Unrealized Gain (Loss) on Investments—Note 4 ($): | | |
Net realized gain (loss) on investments and foreign currency transactions: | | |
Long transactions | | | 8,072,439 | |
Short sale transactions | | | 680,110 | |
Net realized gain (loss) on options transactions | | | 46,841 | |
Net realized gain (loss) on financial futures | | | (4,602,673) | |
Net realized gain (loss) on swap transactions | | | 421,328 | |
Net realized gain (loss) on forward foreign currency exchange contracts | 3,402,958 | |
Net Realized Gain (Loss) | | | 8,021,003 | |
Net unrealized appreciation (depreciation) on investments
and foreign currency transactions | | | (2,684,023) | |
Net unrealized appreciation (depreciation) on options transactions | | | (398,962) | |
Net unrealized appreciation (depreciation) on financial futures | | | 971,624 | |
Net unrealized appreciation (depreciation) on swap transactions | | | 785,215 | |
Net unrealized appreciation (depreciation) on
forward foreign currency exchange contracts | | | 258,158 | |
Net unrealiazed appreciation (depreciation) on securities sold short | | | 2,538,275 | |
Net Unrealized Appreciation (Depreciation) | | | 1,470,287 | |
Net Realized and Unrealized Gain (Loss) on Investments | | | 9,491,290 | |
Net Increase in Net Assets Resulting from Operations | | 3,959,192 | |
See notes to financial statements.
26
STATEMENT OF CHANGES IN NET ASSETS
| | | | | | | | | | |
| | | | | | | | | | |
| | | | Year Ended October 31, |
| | | | 2015 | | | | 2014 | a |
Operations ($): | | | | | | | | |
Investment (loss)—net | | | (5,532,098) | | | | (2,707,798) | |
Net realized gain (loss) on investments | | 8,021,003 | | | | (10,141,571) | |
Net unrealized appreciation (depreciation)
on investments | | 1,470,287 | | | | 7,638,762 | |
Net Increase (Decrease) in Net Assets
Resulting from Operations | 3,959,192 | | | | (5,210,607) | |
Capital Stock Transactions ($): | | | | | | | | |
Net proceeds from shares sold: | | | | | | | | |
Class A | | | 146,633 | | | | 330,822 | |
Class C | | | 10,000 | | | | 109,521 | |
Class I | | | 642,991 | | | | 100,000 | |
Class Y | | | 171,017,253 | | | | 296,474,641 | |
Cost of shares redeemed: | | | | | | | | |
Class A | | | (63,514) | | | | (108,698) | |
Class C | | | (350) | | | | - | |
Class I | | | (376,418) | | | | - | |
Class Y | | | (145,103,009) | | | | (1,671,381) | |
Increase (Decrease) in Net Assets
from Capital Stock Transactions | 26,273,586 | | | | 295,234,905 | |
Total Increase (Decrease) in Net Assets | 30,232,778 | | | | 290,024,298 | |
Net Assets ($): | | | | | | | | |
Beginning of Period | | | 290,024,298 | | | | - | |
End of Period | | | 320,257,076 | | | | 290,024,298 | |
Accumulated investment (loss)—net | (2,269,476) | | | | (2,341,909) | |
27
STATEMENT OF CHANGES IN NET ASSETS (continued)
| | | | | | | | | | |
| | | | | | | | | | |
| | | | Year Ended October 31, |
| | | | 2015 | | | | 2014 | a |
Capital Share Transactions: | | | | | | | | |
Class A | | | | | | | | |
Shares sold | | | 11,837 | | | | 26,822 | |
Shares redeemed | | | (5,181) | | | | (8,762) | |
Net Increase (Decrease) in Shares Outstanding | 6,656 | | | | 18,060 | |
Class C | | | | | | | | |
Shares sold | | | 799 | | | | 8,778 | |
Shares redeemed | | | (28) | | | | - | |
Net Increase (Decrease) in Shares Outstanding | 771 | | | | 8,778 | |
Class I | | | | | | | | |
Shares sold | | | 50,668 | | | | 8,000 | |
Shares redeemed | | | (30,001) | | | | - | |
Net Increase (Decrease) in Shares Outstanding | 20,667 | | | | 8,000 | |
Class Y | | | | | | | | |
Shares sold | | | 13,696,890 | | | | 23,824,299 | |
Shares redeemed | | | (11,599,142) | | | | (136,108) | |
Net Increase (Decrease) in Shares Outstanding | 2,097,748 | | | | 23,688,191 | |
| | | | | | | | | | |
a | From March 31, 2014 (commencement of operations) to October 31, 2014. | |
See notes to financial statements.
28
FINANCIAL HIGHLIGHTS
The following tables describe the performance for each share class for the fiscal periods indicated. All information (except portfolio turnover rate) reflects financial results for a single fund share. Total return shows how much your investment in the fund would have increased (or decreased) during each period, assuming you had reinvested all dividends and distributions. These figures have been derived from the fund’s financial statements.
| | | | | | | | |
| | | | |
| | Year Ended October 31, |
Class A Shares | | | | | 2015 | 2014 | a |
Per Share Data ($): | | | | | | |
Net asset value, beginning of period | | | | | 12.20 | 12.50 | |
Investment Operations: | | | | | | |
Investment (loss)—netb | | | | | (.27) | (.16) | |
Net realized and unrealized
gain (loss) on investments | | | | | .39 | (.14) | |
Total from Investment Operations | | | | | .12 | (.30) | |
Net asset value, end of period | | | | | 12.32 | 12.20 | |
Total Return (%)c | | | | | .98 | (2.40) | d |
Ratios/Supplemental Data (%): | | | | | | |
Ratio of total expenses
to average net assets | | | | | 3.16 | 3.14 | e |
Ratio of net expenses
to average net assets | | | | | 3.16 | 3.10 | e |
Ratio of net investment (loss)
to average net assets | | | | | (2.21) | (2.26) | e |
Portfolio Turnover Rate | | | | | 524.89 | 312.91 | d |
Net Assets, end of period ($ x 1,000) | | | | | 304 | 220 | |
a From March 31, 2014 (commencement of operations) to October 31, 2014.
b Based on average shares outstanding.
c Exclusive of sales charge.
d Not annualized.
e Annualized.
See notes to financial statements.
29
FINANCIAL HIGHLIGHTS (continued)
| | | | | | | | |
| | | | |
| | Year Ended October 31, |
Class C Shares | | | | | 2015 | 2014 | a |
Per Share Data ($): | | | | | | |
Net asset value, beginning of period | | | | | 12.15 | 12.50 | |
Investment Operations: | | | | | | |
Investment (loss)—netb | | | | | (.37) | (.21) | |
Net realized and unrealized
gain (loss) on investments | | | | | .39 | (.14) | |
Total from Investment Operations | | | | | .02 | (.35) | |
Net asset value, end of period | | | | | 12.17 | 12.15 | |
Total Return (%)c | | | | | .17 | (2.80) | d |
Ratios/Supplemental Data (%): | | | | | | |
Ratio of total expenses
to average net assets | | | | | 3.96 | 3.87 | e |
Ratio of net expenses
to average net assets | | | | | 3.96 | 3.77 | e |
Ratio of net investment (loss)
to average net assets | | | | | (3.03) | (2.97) | e |
Portfolio Turnover Rate | | | | | 524.89 | 312.91 | d |
Net Assets, end of period ($ x 1,000) | | | | | 116 | 107 | |
a From March 31, 2014 (commencement of operations) to October 31, 2014.
b Based on average shares outstanding.
c Exclusive of sales charge.
d Not annualized.
e Annualized.
See notes to financial statements.
30
| | | | | | | | | | | |
| | | | | | | |
| | Year Ended October 31, |
Class I Shares | | | | | 2015 | 2014 | a |
Per Share Data ($): | | | | | | |
Net asset value, beginning of period | | | | | 12.22 | 12.50 | |
Investment Operations: | | | | | | |
Investment (loss)—netb | | | | | (.23) | (.14) | |
Net realized and unrealized
gain (loss) on investments | | | | | .39 | (.14) | |
Total from Investment Operations | | | | | .16 | (.28) | |
Net asset value, end of period | | | | | 12.38 | 12.22 | |
Total Return (%) | | | | | 1.31 | (2.24) | c |
Ratios/Supplemental Data (%): | | | | | | |
Ratio of total expenses
to average net assets | | | | | 2.90 | 2.87 | d |
Ratio of net expenses
to average net assets | | | | | 2.90 | 2.77 | d |
Ratio of net investment (loss)
to average net assets | | | | | (1.83) | (1.96) | d |
Portfolio Turnover Rate | | | | | 524.89 | 312.91 | c |
Net Assets, end of period ($ x 1,000) | | | | | 355 | 98 | |
a From March 31, 2014 (commencement of operations) to October 31, 2014.
b Based on average shares outstanding.
c Not annualized.
d Annualized.
See notes to financial statements.
31
FINANCIAL HIGHLIGHTS (continued)
| | | | | | | | | | | |
| | | | | | | |
| | Year Ended October 31, |
Class Y Shares | | | | | 2015 | 2014 | a |
Per Share Data ($): | | | | | | |
Net asset value, beginning of period | | | | | 12.23 | 12.50 | |
Investment Operations: | | | | | | |
Investment (loss)—netb | | | | | (.23) | (.15) | |
Net realized and unrealized
gain (loss) on investments | | | | | .39 | (.12) | |
Total from Investment Operations | | | | | .16 | (.27) | |
Net asset value, end of period | | | | | 12.39 | 12.23 | |
Total Return (%) | | | | | 1.31 | (2.16) | c |
Ratios/Supplemental Data (%): | | | | | | |
Ratio of total expenses
to average net assets | | | | | 2.80 | 2.75 | d |
Ratio of net expenses
to average net assets | | | | | 2.80 | 2.75 | d |
Ratio of net investment (loss)
to average net assets | | | | | (1.88) | (1.96) | d |
Portfolio Turnover Rate | | | | | 524.89 | 312.91 | c |
Net Assets, end of period ($ x 1,000) | | | | | 319,481 | 289,600 | |
a From March 31, 2014 (commencement of operations) to October 31, 2014.
b Based on average shares outstanding.
c Not annualized.
d Annualized.
See notes to financial statements.
32
NOTES TO FINANCIAL STATEMENTS
NOTE 1—Significant Accounting Policies:
Dreyfus Select Managers Long/Short Fund (the “fund”) is a separate non-diversified series of Dreyfus BNY Mellon Funds, Inc. (the “Company”), which is registered under the Investment Company Act of 1940, as amended (the “Act”), as an open-end management investment company and operates as a series company currently offering five series, including the fund. The fund’s investment objective is to seek long-term capital appreciation. The Dreyfus Corporation (the “Manager” or “Dreyfus”), a wholly-owned subsidiary of The Bank of New York Mellon Corporation (“BNY Mellon”), serves as the fund’s investment adviser. EACM Advisors LLC (“EACM”), a subsidiary of BNY Mellon and an affiliate of Dreyfus, serves as the fund’s portfolio allocation manager. Owl Creek Asset Management, L.P. (“Owl Creek”), Sirios Capital Management, L.P. (“Sirios”), Kingsford Capital Management, LLC (“Kingsford Capital”), Standard Pacific Capital, LLC (“Standard Pacific”), Three Bridges Capital, LP (“Three Bridges”), Cramer Rosenthal McGlynn, LLC (“CRM”) and Pine River Capital Management, L.P. (“Pine River”) serve as the fund’s sub-investment advisers, each managing an allocated portion of the fund’s portfolio.
At an October 29-30, 2014 meeting, the Company’s Board of Directors (the “Board”) approved a new sub-investment advisory agreement with Three Bridges, which became effective on November 17, 2014. At a July 29-30, 2015 meeting, the Board approved new sub-investment advisory agreements with CRM and Pine River which became effective on August 3, 2015. At a November 25, 2014 meeting, the Board voted to terminate the fund’s sub-investment advisory agreement with Perella Weinberg Capital Management LP, which became effective on November 28, 2014. At a July 29-30, 2015 meeting, the Board voted to terminate the fund’s sub-investment advisory agreement with Union Point Advisors, LLC, which became effective on July 31, 2015.
MBSC Securities Corporation (the “Distributor”), a wholly-owned subsidiary of Dreyfus, is the distributor of the fund’s shares. The fund is authorized to issue 100 million shares of $.001 par value Common Stock in each of the following classes of shares: Class A, Class C, Class I and Class Y. Class A and Class C shares are sold primarily to retail investors through financial intermediaries and bear Distribution and/or Shareholder Services Plan fees. Class A shares generally are subject to a sales charge imposed at the time of purchase. Class C shares are subject to a contingent deferred sales charge (“CDSC”) imposed on Class C shares redeemed within one
33
NOTES TO FINANCIAL STATEMENTS (continued)
year of purchase. Class I shares are sold primarily to bank trust departments and other financial service providers (including The Bank of New York Mellon, a subsidiary of BNY Mellon and an affiliate of Dreyfus, and its affiliates), acting on behalf of customers having a qualified trust or an investment account or relationship at such institution, and bear no Distribution or Shareholder Services Plan fees. Class Y shares are sold at net asset value per share generally to institutional investors, and bear no Distribution or Shareholder Services Plan fees. Class I and Class Y shares are offered without a front-end sales charge or CDSC. Other differences between the classes include the services offered to and the expenses borne by each class, the allocation of certain transfer agency costs, and certain voting rights. Income, expenses (other than expenses attributable to a specific class), and realized and unrealized gains or losses on investments are allocated to each class of shares based on its relative net assets.
As of October 31, 2015, MBC Investments Corp., an indirect subsidiary of BNY Mellon, held 8,000 Class A, C and I shares of the fund.
The Company accounts separately for the assets, liabilities and operations of each series. Expenses directly attributable to each series are charged to that series’ operations; expenses which are applicable to all series are allocated among them on a pro rata basis.
The Financial Accounting Standards Board (“FASB”) Accounting Standards Codification (“ASC”) is the exclusive reference of authoritative U.S. generally accepted accounting principles (“GAAP”) recognized by the FASB to be applied by nongovernmental entities. Rules and interpretive releases of the Securities and Exchange Commission (“SEC”) under authority of federal laws are also sources of authoritative GAAP for SEC registrants. The fund’s financial statements are prepared in accordance with GAAP, which may require the use of management estimates and assumptions. Actual results could differ from those estimates.
(a) Portfolio valuation: The fair value of a financial instrument is the amount that would be received to sell an asset or paid to transfer a liability in an orderly transaction between market participants at the measurement date (i.e., the exit price). GAAP establishes a fair value hierarchy that prioritizes the inputs of valuation techniques used to measure fair value. This hierarchy gives the highest priority to unadjusted quoted prices in active markets for identical assets or liabilities (Level 1 measurements) and the lowest priority to unobservable inputs (Level 3 measurements).
Additionally, GAAP provides guidance on determining whether the volume and activity in a market has decreased significantly and whether such a decrease in activity results in transactions that are not orderly.
34
GAAP requires enhanced disclosures around valuation inputs and techniques used during annual and interim periods.
Various inputs are used in determining the value of the fund’s investments relating to fair value measurements. These inputs are summarized in the three broad levels listed below:
Level 1—unadjusted quoted prices in active markets for identical investments.
Level 2—other significant observable inputs (including quoted prices for similar investments, interest rates, prepayment speeds, credit risk, etc.).
Level 3—significant unobservable inputs (including the fund’s own assumptions in determining the fair value of investments).
The inputs or methodology used for valuing securities are not necessarily an indication of the risk associated with investing in those securities.
Changes in valuation techniques may result in transfers in or out of an assigned level within the disclosure hierarchy. Valuation techniques used to value the fund’s investments are as follows:
Investments in securities are valued at the last sales price on the securities exchange or national securities market on which such securities are primarily traded. Securities listed on the National Market System for which market quotations are available are valued at the official closing price or, if there is no official closing price that day, at the last sales price. For open short positions, asked prices are used for valuation purposes. Bid price is used when no asked price is available. Registered investment companies that are not traded on an exchange are valued at their net asset value. All of the preceding securities are generally categorized within Level 1 of the fair value hierarchy.
Securities not listed on an exchange or the national securities market, or securities for which there were no transactions, are valued at the average of the most recent bid and asked prices. These securities are generally categorized within Level 2 of the fair value hierarchy.
Fair valuing of securities may be determined with the assistance of a pricing service using calculations based on indices of domestic securities and other appropriate indicators, such as prices of relevant ADRs and financial futures. Utilizing these techniques may result in transfers between Level 1 and Level 2 of the fair value hierarchy.
When market quotations or official closing prices are not readily available, or are determined not to reflect accurately fair value, such as when the
35
NOTES TO FINANCIAL STATEMENTS (continued)
value of a security has been significantly affected by events after the close of the exchange or market on which the security is principally traded (for example, a foreign exchange or market), but before the fund calculates its net asset value, the fund may value these investments at fair value as determined in accordance with the procedures approved by the Board. Certain factors may be considered when fair valuing investments such as: fundamental analytical data, the nature and duration of restrictions on disposition, an evaluation of the forces that influence the market in which the securities are purchased and sold, and public trading in similar securities of the issuer or comparable issuers. These securities are either categorized within Level 2 or 3 of the fair value hierarchy depending on the relevant inputs used.
For restricted securities where observable inputs are limited, assumptions about market activity and risk are used and are generally categorized within Level 3 of the fair value hierarchy.
Investments denominated in foreign currencies are translated to U.S. dollars at the prevailing rates of exchange.
Financial futures and options, which are traded on an exchange, are valued at the last sales price on the securities exchange on which such securities are primarily traded or at the last sales price on the national securities market on each business day and are generally categorized within Level 1 of the fair value hierarchy. Options traded over-the-counter (“OTC”) are valued at the mean between the bid and asked price and are generally categorized within Level 2 of the fair value hierarchy. Investments in swap transactions are valued each business day by an independent pricing service (the “Service”). Swaps are valued by the Service by using a swap pricing model which incorporates among other factors, default probabilities, recovery rates, credit curves of the underlying issuer and swap spreads on interest rates and are generally categorized within Level 2 of the fair value hierarchy. Forward foreign currency exchange contracts (“forward contracts”) are valued at the forward rate and are generally categorized within Level 2 of the fair value hierarchy.
The following is a summary of the inputs used as of October 31, 2015 in valuing the fund’s investments:
36
| | | | | | |
| | Level 1 - Unadjusted Quoted Prices | Level 2 - Other Significant Observable Inputs | Level 3 -Significant Unobservable Inputs | Total |
Assets ($) | | | |
Investments in Securities: | | | |
Equity Securities - Domestic Common Stocks† | 147,037,285 | — | — | 147,037,285 |
Equity Securities - Foreign Common Stocks† | 48,386,039 | — | — | 48,386,039 |
Warrants† | 504,017 | — | — | 504,017 |
Other Financial Instruments: | | | | |
Financial Futures†† | 738 | — | — | 738 |
Forward Foreign Currency Exchange Contracts†† | - | 1,136,724 | - | 1,136,724 |
Options Purchased | 548,992 | - | - | 548,992 |
Swaps†† | - | 1,090,482 | - | 1,090,482 |
Liabilities ($) | | | |
Other Financial Instruments: | | | | |
Financial Futures†† | (693,518) | - | - | (693,518) |
Forward Foreign Currency Exchange Contracts†† | — | (408,808) | — | (408,808) |
Options Written | | (876) | - | (876) |
Swaps†† | - | (458,468) | - | (458,468) |
Securities Sold Short: |
Equity Securities - Domestic††† | (67,574,033) | — | — | (67,574,033) |
Equity Securities - Foreign††† | (11,526,954) | — | — | (11,526,954) |
Exchange-Traded Funds††† | (24,108,838) | — | — | (24,108,838) |
† See Statement of Investments for additional detailed categorizations.
†† Amount shown represents unrealized appreciation (depreciation) at period end.
††† See Statement of Securities Sold Short for additional detailed classifications.
At October 31, 2014, $17,096,305 of exchange traded foreign equity securities were classified within Level 2 of the fair value hierarchy pursuant to the fund’s fair valuation procedures.
(b) Foreign currency transactions: The fund does not isolate that portion of the results of operations resulting from changes in foreign exchange rates on investments from the fluctuations arising from changes
37
NOTES TO FINANCIAL STATEMENTS (continued)
in the market prices of securities held. Such fluctuations are included with the net realized and unrealized gain or loss on investments.
Net realized foreign exchange gains or losses arise from sales of foreign currencies, currency gains or losses realized on securities transactions between trade and settlement date, and the difference between the amounts of dividends, interest and foreign withholding taxes recorded on the fund’s books and the U.S. dollar equivalent of the amounts actually received or paid. Net unrealized foreign exchange gains and losses arise from changes in the value of assets and liabilities other than investments resulting from changes in exchange rates. Foreign currency gains and losses on foreign currency transactions are also included with net realized and unrealized gain or loss on investments.
(c) Securities transactions and investment income: Securities transactions are recorded on a trade date basis. Realized gains and losses from securities transactions are recorded on the identified cost basis. Dividend income is recognized on the ex-dividend date and interest income, including, where applicable, accretion of discount and amortization of premium on investments, is recognized on the accrual basis.
(d) Dividends to shareholders: Dividends are recorded on the ex-dividend date. Dividends from investment income-net and dividends from net realized capital gains, if any, are normally declared and paid annually, but the fund may make distributions on a more frequent basis to comply with the distribution requirements of the Internal Revenue Code of 1986, as amended (the “Code”). To the extent that net realized capital gains can be offset by capital loss carryovers, it is the policy of the fund not to distribute such gains. Income and capital gain distributions are determined in accordance with income tax regulations, which may differ from GAAP.
(e) Federal income taxes: It is the policy of the fund to continue to qualify as a regulated investment company, if such qualification is in the best interests of its shareholders, by complying with the applicable provisions of the Code, and to make distributions of taxable income sufficient to relieve it from substantially all federal income and excise taxes.
As of and during the period ended October 31, 2015, the fund did not have any liabilities for any uncertain tax positions. The fund recognizes interest and penalties, if any, related to uncertain tax positions as income tax expense in the Statement of Operations. During the period ended October 31, 2015, the fund did not incur any interest or penalties.
38
Each tax year in the two-year period ended October 31, 2015 remains subject to examination by the Internal Revenue Service and state taxing authorities.
At October 31, 2015, the components of accumulated earnings on a tax basis were as follows: unrealized appreciation $334,761. In addition, the fund deferred for tax purposes late year ordinary losses of $1,557,041 to the first day of the following fiscal year.
During the period ended October 31, 2015, as a result of permanent book to tax differences, primarily due to the tax treatment for foreign currency transactions, swap periodic payments, real estate investment trusts, net operating losses, short sale 45 day reclassification and passive foreign investment companies, the fund increased accumulated undistributed investment income-net by $5,604,531, decreased accumulated net realized gain (loss) on investments by $5,606,529 and increased paid-in capital by $1,998. Net assets and net asset value per share were not affected by this reclassification.
NOTE 2—Bank Lines of Credit:
The fund participates with other Dreyfus-managed funds in a $480 million unsecured credit facility led by Citibank, N.A. and a $300 million unsecured credit facility provided by The Bank of New York Mellon (each, a “Facility”), each to be utilized primarily for temporary or emergency purposes, including the financing of redemptions. Prior to October 7, 2015, the unsecured credit facility with Citibank, N.A. was $430 million. In connection therewith, the fund has agreed to pay its pro rata portion of commitment fees for each Facility. Interest is charged to the fund based on rates determined pursuant to the terms of the respective Facility at the time of borrowing. During the period ended October 31, 2015, the fund did not borrow under the Facilities.
NOTE 3—Management Fee, Sub-Investment Advisory Fee and Other Transactions with Affiliates:
(a) Pursuant to a management agreement with Dreyfus, the management fee is computed at the annual rate of 2.00% of the value of the fund’s average daily net assets and is payable monthly. Dreyfus has contractually agreed, from November 1, 2014 through March 1, 2016, to waive receipt of its fees and/or assume the expenses of the fund, so that the expenses of none of the classes (excluding Rule 12b-1 Distribution Plan fees, Shareholder Services Plan fees, dividend and interest expenses on securities sold short, taxes, interest expense, brokerage commissions, commitment fees on borrowings and extraordinary expenses) exceed 2.50% of the value
39
NOTES TO FINANCIAL STATEMENTS (continued)
of the fund’s average daily net assets. There was no reduction in expenses, pursuant to the undertaking, during the period ended October 31, 2015.
Pursuant to a Portfolio Allocation Management Agreement between Dreyfus and EACM, Dreyfus pays EACM a monthly fee at an annual percentage of the value of the fund’s average daily net assets.
Pursuant to separate sub-investment advisory agreement between Dreyfus and Owl Creek, Sirios, Kingsford Capital, Standard Pacific, Three Bridges, CRM and Pine River, each serves as the fund’s sub-investment adviser responsible for the day-to–day management of the fund’s portfolio. Dreyfus pays each sub-investment advisor a monthly fee at an annual percentage of the value of the fund’s average daily net assets allocated to the respective sub-investment advisor. Dreyfus has obtained an exemptive order from the SEC (the “Order”), upon which the fund may rely, to use a manager of managers approach that permits Dreyfus, subject to certain conditions and approval by the Board, to enter into and materially amend sub-investment advisory agreements with one or more sub-investment advisers who are either unaffiliated with Dreyfus or are wholly-owned subsidiaries (as defined under the Act) of Dreyfus’ ultimate parent company, BNY Mellon, without obtaining shareholder approval. The Order also allows the fund to disclose the sub-investment advisory fee paid by Dreyfus to any unaffiliated sub-investment adviser in the aggregate with other unaffiliated sub-investment advisers in documents filed with the SEC and provided to shareholders. In addition, pursuant to the Order, it is not necessary to disclose the sub-investment advisory fee payable by Dreyfus separately to a sub-investment adviser that is a wholly-owned subsidiary of BNY Mellon in documents filed with the SEC and provided to shareholders; such fees are to be aggregated with fees payable to Dreyfus. Dreyfus has ultimate responsibility (subject to oversight by the Board) to supervise any sub-investment adviser and recommend the hiring, termination, and replacement of any sub-investment adviser to the Board.
(b) Under the Distribution Plan adopted pursuant to Rule 12b-1 under the Act, Class C shares pay the Distributor for distributing its shares at an annual rate of .75% of the value of its average daily net assets. During the period ended October 31, 2015, Class C shares were charged $846 pursuant to the Distribution Plan.
(c) Under the Shareholder Services Plan, Class A and Class C shares pay the Distributor at an annual rate of .25% of the value of their average daily net assets for the provision of certain services. The services provided may include personal services relating to shareholder accounts, such as answering shareholder inquiries regarding the fund and providing reports and other information, and services related to the maintenance of
40
shareholder accounts. The Distributor may make payments to Service Agents (securities dealers, financial institutions or other industry professionals) with respect to these services. The Distributor determines the amounts to be paid to Service Agents. During the period ended October 31, 2015, Class A and Class C shares were charged $655 and $282, respectively, pursuant to the Shareholder Services Plan.
Under its terms, the Distribution Plan and Shareholder Services Plan shall remain in effect from year to year, provided such continuance is approved annually by a vote of a majority of those Directors who are not “interested persons” of the Company and who have no direct or indirect financial interest in the operation of or in any agreement related to the Distribution Plan or Shareholder Services Plan.
The fund has arrangements with the transfer agent and the custodian whereby the fund may receive earnings credits when positive cash balances are maintained, which are used to offset transfer agency and custody fees. For financial reporting purposes, the fund includes net earnings credits as an expense offset in the Statement of Operations.
The fund compensates Dreyfus Transfer, Inc., a wholly-owned subsidiary of Dreyfus, under a transfer agency agreement for providing transfer agency and cash management services for the fund. The majority of transfer agency fees are comprised of amounts paid on a per account basis, while cash management fees are related to fund subscriptions and redemptions. During the period ended October 31, 2015, the fund was charged $638 for transfer agency services and $21 for cash management services. These fees are included in Shareholder servicing costs in the Statement of Operations. Cash management fees were partially offset by earnings credits of $1.
The fund compensates The Bank of New York Mellon under a custody agreement for providing custodial services for the fund. These fees are determined based on net assets, geographic region and transaction activity. During the period ended October 31, 2015, the fund was charged $176,246 pursuant to the custody agreement.
During the period ended October 31, 2015, the fund was charged $17,863 for services performed by the Chief Compliance Officer and his staff.
The components of “Due to The Dreyfus Corporation and affiliates” in the Statement of Assets and Liabilities consist of: management fees $513,268, Distribution Plan fees $74, Shareholder Services Plan fees $89, custodian fees $78,176, Chief Compliance Officer fees $1,412 and transfer agency fees $120.
41
NOTES TO FINANCIAL STATEMENTS (continued)
(d) Each Board member also serves as a Board member of other funds within the Dreyfus complex. Annual retainer fees and attendance fees are allocated to each fund based on net assets.
NOTE 4—Securities Transactions:
The aggregate amount of purchases and sales of investment securities and securities sold short, excluding short-term securities, financial futures, options transactions, forward contracts and swap transactions, during the period ended October 31, 2015 were as follows:
| | | | |
| | Purchases ($) | Sales ($) |
Long transactions | | 907,334,910 | 900,905,722 |
Short sale transactions | | 179,310,744 | 234,987,009 |
Total | | 1,086,645,654 | 1,135,892,731 |
Short Sales: The fund is engaged in short-selling which obligates the fund to replace the security borrowed by purchasing the security at current market value. The fund incurs a loss if the price of the security increases between the date of the short sale and the date on which the fund replaces the borrowed security. The fund realizes a gain if the price of the security declines between those dates. Until the fund replaces the borrowed security, the fund will maintain daily a segregated account with a broker or custodian of permissible liquid assets sufficient to cover its short positions. Securities Sold Short at October 31, 2015 and their related market values and proceeds, are set forth in the Statement of Securities Sold Short.
The fund is liable for any dividends payable on securities while those securities are in a short position. Dividends declared on short positions are recorded on the ex-dividend date and recorded as an expense in the Statement of Operations. The fund is charged a securities loan fee in connection with short sale transactions which is recorded as interest on securities sold short in the Statement of Operations.
Derivatives: A derivative is a financial instrument whose performance is derived from the performance of another asset. The fund enters into International Swaps and Derivatives Association, Inc. Master Agreements or similar agreements (collectively, “Master Agreements”) with its OTC derivative contract counterparties in order to, among other things, reduce its credit risk to counterparties. Master Agreements include provisions for general obligations, representations, collateral and events of default or termination. Under a Master Agreement, the fund may offset with the counterparty certain derivative financial instrument’s payables and/or
42
receivables with collateral held and/or posted and create one single net payment in the event of default or termination.
Each type of derivative instrument that was held by the fund during the period ended October 31, 2015 is discussed below.
Financial Futures: In the normal course of pursuing its investment objective, the fund is exposed to market risk, including equity price risk, as a result of changes in value of underlying financial instruments. The fund invests in financial futures in order to manage its exposure to or protect against changes in the market. A financial futures contract represents a commitment for the future purchase or a sale of an asset at a specified date. Upon entering into such contracts, these investments require initial margin deposits with a counterparty, which consist of cash or cash equivalents. The amount of these deposits is determined by the exchange or Board of Trade on which the contract is traded and is subject to change. Accordingly, variation margin payments are received or made to reflect daily unrealized gains or losses which are recorded in the Statement of Operations. When the contracts are closed, the fund recognizes a realized gain or loss which is reflected in the Statement of Operations. There is minimal counterparty credit risk to the fund with financial futures since they are exchange traded, and the exchange guarantees the financial futures against default. Financial futures open at October 31, 2015 are set forth in the Statement of Financial Futures.
Options Transactions: The fund purchases and writes (sells) put and call options to hedge against changes in the values of equities or as a substitute for an investment. The fund is subject to market risk in the course of pursuing its investment objectives through its investments in options contracts. A call option gives the purchaser of the option the right (but not the obligation) to buy, and obligates the writer to sell, the underlying financial instrument at the exercise price at any time during the option period, or at a specified date. Conversely, a put option gives the purchaser of the option the right (but not the obligation) to sell, and obligates the writer to buy the underlying financial instrument at the exercise price at any time during the option period, or at a specified date.
As a writer of call options, the fund receives a premium at the outset and then bears the market risk of unfavorable changes in the price of the financial instrument underlying the option. Generally, the fund realizes a gain, to the extent of the premium, if the price of the underlying financial instrument decreases between the date the option is written and the date on which the option is terminated. Generally, the fund incurs a loss if the price of the financial instrument increases between those dates.
43
NOTES TO FINANCIAL STATEMENTS (continued)
As a writer of put options, the fund receives a premium at the outset and then bears the market risk of unfavorable changes in the price of the financial instrument underlying the option. Generally, the fund realizes a gain, to the extent of the premium, if the price of the underlying financial instrument increases between the date the option is written and the date on which the option is terminated. Generally, the fund incurs a loss if the price of the financial instrument decreases between those dates.
As a writer of an option, the fund has no control over whether the underlying financial instrument may be sold (call) or purchased (put) and as a result bears the market risk of an unfavorable change in the price of the financial instrument underlying the written option. There is a risk of loss from a change in value of such options which may exceed the related premiums received. This risk is mitigated by Master Agreements between the fund and the counterparty and the posting of collateral, if any, by the counterparty to the fund to cover the fund’s exposure to the counterparty. The Statement of Operations reflects any unrealized gains or losses which occurred during the period as well as any realized gains or losses which occurred upon the expiration or closing of the option transaction.
The following summarizes the fund’s call/put options written during the period ended October 31, 2015:
| | | | | |
| | | | Options Terminated |
| | Number of | Premiums | | Net Realized |
Option Written: | Contracts ($) | Received ($) | Cost ($) | Gain ($) |
Contracts outstanding |
October 31, 2014 | 106,700 | 66,605 | | |
Contracts written | 181,400 | 188,088 | | |
Contracts terminated: | | | | |
Contracts closed | 258,400 | 248,047 | 228,148 | 19,899 |
Contracts expired | 500 | 5,586 | - | 5,586 |
Total contracts terminated | 258,900 | 253,633 | 228,148 | 25,485 |
Contracts Outstanding |
October 31, 2015 | 29,200 | 1,060 | | |
Forward Foreign Currency Exchange Contracts: The fund enters into forward contracts in order to hedge its exposure to changes in foreign currency exchange rates on its foreign portfolio holdings, to settle foreign currency transactions or as a part of its investment strategy. When executing forward contracts, the fund is obligated to buy or sell a foreign
44
currency at a specified rate on a certain date in the future. With respect to sales of forward contracts, the fund incurs a loss if the value of the contract increases between the date the forward contract is opened and the date the forward contract is closed. The fund realizes a gain if the value of the contract decreases between those dates. With respect to purchases of forward contracts, the fund incurs a loss if the value of the contract decreases between the date the forward contract is opened and the date the forward contract is closed. The fund realizes a gain if the value of the contract increases between those dates. Any realized or unrealized gains or losses which occurred during the period are reflected in the Statement of Operations. The fund is exposed to foreign currency risk as a result of changes in value of underlying financial instruments. The fund is also exposed to credit risk associated with counterparty nonperformance on these forward contracts, which is generally limited to the unrealized gain on each open contract. This risk may be mitigated by Master Agreements, if any, between the fund and the counterparty and the posting of collateral, if any, by the counterparty to the fund to cover the fund’s exposure to the counterparty. The following summarizes open forward contracts at October 31, 2015:
| | | | | |
Forward Foreign Currency Exchange Contracts | Foreign Currency Amounts | Cost/
Proceeds ($) | Value ($) | Unrealized Appreciation (Depreciation)($) |
Purchases: | | | |
Goldman Sachs International | | | |
Euro, | | | | |
Expiring | | | | |
12/18/2015 | 1,168,000 | 1,310,441 | 1,285,490 | (24,951) |
Morgan Stanley Capital Services | | | |
British Pound, | | | | |
Expiring | | | | |
11/18/2015 | 127,000 | 195,372 | 195,761 | 389 |
Chinese Yuan Renminbi, | | | | |
Expiring | | | | |
11/30/2015 | 7,975,076 | 1,241,100 | 1,257,056 | 15,956 |
7/29/2016 | 11,121,330 | 1,698,804 | 1,724,678 | 25,874 |
Danish Krone, | | | | |
Expiring | | | | |
11/18/2015 | 7,098,000 | 1,070,023 | 1,047,004 | (23,019) |
Euro, | | | | |
Expiring | | | | |
11/18/2015 | 1,914,000 | 2,111,914 | 2,105,219 | (6,695) |
Indian Rupee, | | | | |
Expiring | | | | |
12/16/2015 | 110,355,733 | 1,676,322 | 1,674,249 | (2,073) |
45
NOTES TO FINANCIAL STATEMENTS (continued)
| | | | | | | | | |
Forward Foreign Currency Exchange Contracts | Foreign Currency Amounts | Cost/
Proceeds ($) | Value ($) | Unrealized Appreciation (Depreciation)($) |
Purchases: (continued) | | | |
Morgan Stanley Capital Services (continued) | | | |
Indonesian Rupiah, | | | | |
Expiring | | | | |
12/16/2015 | 12,696,612,259 | 889,291 | 914,665 | 25,374 |
Japanese Yen, | | | | |
Expiring | | | | |
11/4/2015 | 2,100,757 | 17,362 | 17,409 | 47 |
12/16/2015 | 568,116,838 | 4,752,530 | 4,711,970 | (40,560) |
Malaysian Ringgit, | | | | |
Expiring | | | | |
12/16/2015 | 1,937,608 | 464,521 | 449,526 | (14,995) |
Norwegian Krone, | | | | |
Expiring | | | | |
11/18/2015 | 2,153,000 | 260,916 | 253,310 | (7,606) |
Singapore Dollar, | | | | |
Expiring | | | | |
12/16/2015 | 312,577 | 219,955 | 222,759 | 2,804 |
Swedish Krona, | | | | |
Expiring | | | | |
11/18/2015 | 4,614,000 | 547,232 | 540,272 | (6,960) |
Swiss Franc, | | | | |
Expiring | | | | |
11/18/2015 | 1,780,000 | 1,824,143 | 1,801,821 | (22,322) |
Taiwan Dollar, | | | | |
Expiring | | | | |
12/16/2015 | 28,917,899 | 886,262 | 890,870 | 4,608 |
Thai Baht, | | | | |
Expiring | | | | |
12/16/2015 | 41,007,987 | 1,132,481 | 1,150,960 | 18,479 |
Sales: | | | |
Goldman Sachs International | | | |
Euro, | | | | |
Expiring | | | | |
12/18/2015 | 3,974,000 | 4,424,417 | 4,373,748 | 50,669 |
Swiss Franc, | | | | |
Expiring | | | | |
12/18/2015 | 740,000 | 764,194 | 749,959 | 14,235 |
Morgan Stanley Capital Services | | | |
British Pound, | | | | |
Expiring | | | | |
11/18/2015 | 181,000 | 278,157 | 278,997 | (840) |
46
| | | | | | | | | |
Forward Foreign Currency Exchange Contracts | Foreign Currency Amounts | Cost/
Proceeds ($) | Value ($) | Unrealized Appreciation (Depreciation)($) |
Sales: (continued) | | | |
Morgan Stanley Capital Services (continued) | | | |
Chinese Yuan Renminbi, | | | | |
Expiring | | | | |
11/30/2015 | 7,086,049 | 1,098,498 | 1,116,925 | (18,427) |
7/29/2016 | 17,722,904 | 2,672,041 | 2,748,440 | (76,399) |
Danish Krone, | | | | |
Expiring | | | | |
11/3/2015 | 2,063,139 | 304,125 | 304,192 | (67) |
11/18/2015 | 16,543,000 | 2,509,733 | 2,440,208 | 69,525 |
Euro, | | | | |
Expiring | | | | |
11/3/2015 | 226,772 | 249,184 | 249,370 | (186) |
11/18/2015 | 16,770,000 | 19,070,099 | 18,445,413 | 624,686 |
Hong Kong Dollar, | | | | |
Expiring | | | | |
11/3/2015 | 4,012,332 | 517,707 | 517,680 | 27 |
Indian Rupee, | | | | |
Expiring | | | | |
12/16/2015 | 376,093,906 | 5,549,600 | 5,705,863 | (156,263) |
Indonesian Rupiah, | | | | |
Expiring | | | | |
12/16/2015 | 5,677,106,700 | 412,790 | 408,979 | 3,811 |
Japanese Yen, | | | | |
Expiring | | | | |
11/2/2015 | 16,255,267 | 134,910 | 134,708 | 202 |
11/5/2015 | 50,446,495 | 417,949 | 418,053 | (104) |
12/16/2015 | 1,764,147,478 | 14,674,886 | 14,631,867 | 43,019 |
Norwegian Krone, | | | | |
Expiring | | | | |
11/3/2015 | 888,006 | 104,416 | 104,511 | (95) |
11/18/2015 | 13,660,000 | 1,631,930 | 1,607,161 | 24,769 |
Singapore Dollar, | | | | |
Expiring | | | | |
12/16/2015 | 312,577 | 223,509 | 222,759 | 750 |
Swedish Krona, | | | | |
Expiring | | | | |
11/3/2015 | 2,382,457 | 278,617 | 278,860 | (243) |
11/18/2015 | 33,049,000 | 3,982,818 | 3,869,844 | 112,974 |
Swiss Franc, | | | | |
Expiring | | | | |
11/3/2015 | 1,143,269 | 1,156,558 | 1,156,628 | (70) |
11/18/2015 | 4,180,000 | 4,328,368 | 4,231,242 | 97,126 |
47
NOTES TO FINANCIAL STATEMENTS (continued)
| | | | | | | | | |
Forward Foreign Currency Exchange Contracts | Foreign Currency Amounts | Cost/
Proceeds ($) | Value ($) | Unrealized Appreciation (Depreciation)($) |
Sales: (continued) | | | |
Morgan Stanley Capital Services (continued) | | | |
Taiwan Dollar, | | | | |
Expiring | | | | |
12/16/2015 | 9,769,080 | 302,355 | 300,955 | 1,400 |
Thai Baht, | | | | |
Expiring | | | | |
12/16/2015 | 23,423,740 | 650,495 | 657,428 | (6,933) |
Gross Unrealized Appreciation | | | 1,136,724 |
Gross Unrealized Depreciation | | | (408,808) |
Swap Transactions: The fund enters into swap agreements to exchange the interest rate on, or return generated by, one nominal instrument for the return generated by another nominal instrument. Swap agreements are privately negotiated in the OTC market or centrally cleared. The fund enters into these agreements to hedge certain market or interest rate risks, to manage the interest rate sensitivity (sometimes called duration) of fixed income securities, to provide a substitute for purchasing or selling particular securities or to increase potential returns.
For OTC swaps, the fund accrues for the interim payments on a daily basis, with the net amount recorded within unrealized appreciation (depreciation) on swap agreements in the Statement of Assets and Liabilities. Once the interim payments are settled in cash, the net amount is recorded as a realized gain (loss) on swaps, in addition to realized gain (loss) recorded upon the termination of swap transactions in the Statement of Operations. Upfront payments made and/or received by the fund, are recorded as an asset and/or liability in the Statement of Assets and Liabilities and are recorded as a realized gain or loss ratably over the agreement’s term/event with the exception of forward starting interest rate swaps which are recorded as realized gains or losses on the termination date.
Fluctuations in the value of swap agreements are recorded for financial statement purposes as unrealized appreciation or depreciation on swap transactions.
Total Return Swaps: Total return swaps involve commitments to pay interest in exchange for a market-linked return based on a notional principal amount. To the extent the total return of the security or index
48
underlying the transaction exceeds or falls short of the specific reference entity, the fund either receives a payment from or makes a payment to the counterparty, respectively. Total return swaps are subject to general market risk, liquidity risk, counterparty risk and credit risk. This risk is mitigated by Master Agreements between the fund and the counterparty and the posting of collateral, if any, by the counterparty to the fund to cover the fund’s exposure to the counterparty. The following summarizes open total return swaps entered into by the fund at October 31, 2015:
49
NOTES TO FINANCIAL STATEMENTS (continued)
| | | | | | |
OTC Total Return Swaps | | | | |
| | | | | | |
Pay/Receive | Notional
Amount | Reference
Entity | Counterparty | Expiration | Unrealized
Appreciation(Depreciation) ($) |
Receive | 410,257 | CRH | Morgan Stanley Capital Services | 11/21/2016 | (37,182) |
Receive | 498,531 | Bank of Ireland | Morgan Stanley Capital Services | 11/21/2016 | (47,595) |
Receive | 770,397 | BT Group | Morgan Stanley Capital Services | 11/21/2016 | 63,861 |
Receive | 301,331 | Kingfisher | Morgan Stanley Capital Services | 11/21/2016 | (14,053) |
Receive | 221,032 | ITV | Morgan Stanley Capital Services | 11/21/2016 | 4,438 |
Receive | 1,034,123 | Airbus Group | Morgan Stanley Capital Services | 11/21/2016 | 177,620 |
Receive | 455,752 | LVMH Moet Hennessy Louis Vuitton | Morgan Stanley Capital Services | 11/21/2016 | (40) |
Receive | 602,340 | Pernod-Ricard | Morgan Stanley Capital Services | 11/21/2016 | 10,593 |
Receive | 570,064 | Renault | Morgan Stanley Capital Services | 11/21/2016 | (50) |
Receive | 1,000,109 | Vivendi | Morgan Stanley Capital Services | 11/21/2016 | 16,775 |
Receive | 691,257 | Orange | Morgan Stanley Capital Services | 11/21/2016 | 68,778 |
Receive | 323,527 | Acciona | Morgan Stanley Capital Services | 11/21/2016 | 12,406 |
Receive | 1,314,713 | Indusind Bank Ltd | Morgan Stanley Capital Services | 8/19/2016 | 39,085 |
Receive | 551,149 | Prism Cement Ltd | Morgan Stanley Capital Services | 8/19/2016 | (32,554) |
Receive | 1,010,582 | Suncorp Group | Goldman Sachs International | 9/20/2016 | (13,184) |
Receive | 226,056 | Persimmon | Morgan Stanley Capital Services | 11/21/2016 | (2,062) |
Receive | 1,095,768 | AXA | Morgan Stanley Capital Services | 11/21/2016 | 124,385 |
Receive | 789,214 | BNP Paribas | Morgan Stanley Capital Services | 11/21/2016 | (14,989) |
Receive | 637,615 | BP | Morgan Stanley Capital Services | 11/21/2016 | 57,000 |
Receive | 472,254 | Lloyds Banking Group | Morgan Stanley Capital Services | 11/21/2016 | (1,313) |
Receive | 226,159 | Taylor Wimpey | Morgan Stanley Capital Services | 11/21/2016 | 4,141 |
Receive | 221,463 | Smith & Nephew | Morgan Stanley Capital Services | 11/21/2016 | (5,212) |
Receive | 349,298 | ACS Actividades de Construccion | Morgan Stanley Capital Services | 11/21/2016 | 15,848 |
50
| | | | | | |
OTC Total Return Swaps | | | | |
| | | | | | |
Pay/Receive | Notional
Amount | Reference
Entity | Counterparty | Expiration | Unrealized
Appreciation(Depreciation) ($) |
Receive | 401,948 | Ashok Leyland | Morgan Stanley Capital Services | 8/19/2016 | 249 |
Receive | 225,018 | The Berkeley Group | Morgan Stanley Capital Services | 11/21/2016 | 3,504 |
Receive | 667,172 | Yes Bank | Morgan Stanley Capital Services | 8/19/2016 | 6,459 |
Receive | 331,643 | Legrand | Morgan Stanley Capital Services | 11/21/2016 | (3,325) |
Receive | 578,213 | Total SA | Morgan Stanley Capital Services | 11/21/2016 | (51) |
Receive | 1,154,653 | Vinci | Morgan Stanley Capital Services | 11/21/2016 | 122,156 |
Receive | 685,774 | Danone | Morgan Stanley Capital Services | 11/21/2016 | 41,958 |
Receive | 354,358 | Air Liquide | Morgan Stanley Capital Services | 11/21/2016 | 2,100 |
Receive | 312,627 | Amadeus IT Holding, Cl. A | Morgan Stanley Capital Services | 11/21/2016 | 28,330 |
Receive | 439,198 | Bharti Infratel | Morgan Stanley Capital Services | 8/19/2016 | (38,961) |
Receive | 739,192 | Ashoka Buildcon Ltd | Morgan Stanley Capital Services | 8/19/2016 | (62,264) |
Receive | 402,229 | Vodafone Group | Morgan Stanley Capital Services | 11/21/2016 | 724 |
Receive | 566,874 | Inditex | Morgan Stanley Capital Services | 11/21/2016 | 93,064 |
Receive | 408,553 | Aena | Morgan Stanley Capital Services | 11/21/2016 | (6,983) |
Pay | 530,316 | Bangkok Bank Public Company | Morgan Stanley Capital Services | 1/30/2017 | (9,659) |
Pay | 590,092 | Catcher Technology | Morgan Stanley Capital Services | 7/24/2017 | 24,195 |
Pay | 533,680 | Kasikornbank, NVDR | Morgan Stanley Capital Services | 1/30/2017 | 21,755 |
Pay | 3,104,046 | Wharf Holdings | Morgan Stanley Capital Services | 8/22/2016 | 3,393 |
Pay | 848,453 | Hon Hai Precision Industry | Morgan Stanley Capital Services | 7/24/2017 | (12,441) |
Pay | 63,367,577 | Ibiden | Morgan Stanley Capital Services | 5/15/2017 | (743) |
Pay | 49,529,408 | Kyocera | Morgan Stanley Capital Services | 5/15/2017 | 18,222 |
Pay | 432,190 | Malayan Banking | Morgan Stanley Capital Services | 9/7/2017 | 3,696 |
Pay | 132,689 | Bank Mandiri | Morgan Stanley Capital Services | 8/22/2016 | 1,054 |
Pay | 502,111 | Bank Rakyat Indonesia | Morgan Stanley Capital Services | 8/22/2016 | (23,353) |
51
NOTES TO FINANCIAL STATEMENTS (continued)
| | | | | | |
OTC Total Return Swaps | | | | |
| | | | | | |
Pay/Receive | Notional
Amount | Reference
Entity | Counterparty | Expiration | Unrealized
Appreciation(Depreciation) ($) |
Pay | 46,531,316 | TDK | Morgan Stanley Capital Services | 5/15/2017 | (33,031) |
Pay | 386,562 | Taiwan Semiconductor Manufacturing | Morgan Stanley Capital Services | 7/24/2017 | (20,125) |
Pay | 733,574 | Woolworths | Goldman Sachs International | 9/2/2016 | 75,671 |
Pay | 16,579,157 | Idea Cellular | Morgan Stanley Capital Services | 10/6/2017 | 3,048 |
Pay | 25,567,692 | DLF Ltd | Morgan Stanley Capital Services | 10/6/2017 | 33,099 |
Pay | 59,982,730 | Gree | Morgan Stanley Capital Services | 5/15/2017 | (57,079) |
Pay | 31,597,891 | Junilant Foodworks Ltd | Morgan Stanley Capital Services | 10/6/2017 | 12,875 |
Pay | 986,717 | MS Canada Short Basket | Morgan Stanley Capital Services | 2/4/2016 | (22,219) |
| | | | | | |
Gross Unrealized Appreciation | | | | 1,090,482 |
Gross Unrealized Depreciation | | | | (458,468) |
The following tables show the fund’s exposure to different types of market risk as it relates to the Statement of Assets and Liabilities and the Statement of Operations, respectively.
Fair value of derivative instruments as of October 31, 2015 is shown below:
| | | | |
| Derivative
Assets ($) | | Derivative Liabilities ($) |
Equity risk 1,2,3 | 1,640,212 | Equity risk 1,3,4 | (1,152,862) |
Foreign exchange risk 5 | 1,136,724 | Foreign exchange risk 5 | (408,808) |
Gross fair value of
derivatives contracts | 2,776,936 | | (1,561,670) |
1 Includes cumulative appreciation (depreciation) on financial futures as reported in the Statement of Financial Futures, but only the unpaid variation margin is reported in the Statement of Assets and Liabilities.
2 Options purchased are included in Investments in securities—Unaffiliated issuers, at value.
3 Unrealized appreciation (depreciation) on swap agreements.
4 Outstanding options written, at value.
52
5 Unrealized appreciation (depreciation) on forward foreign currency exchange contracts.
The effect of derivative instruments in the Statement of Operations during the period ended October 31, 2015 is shown below:
| | | | | | |
Amount of realized gain (loss) on derivatives recognized in income ($) |
Underlying risk | Financial Futures6 | Options Transactions7 | Forward Contracts8 | Swap Transactions9 | Total |
Equity rate | (4,602,673) | 46,841 | - | 421,328 | (4,134,504) |
Foreign exchange | - | - | 3,402,958 | - | 3,402,958 |
Total | (4,602,673) | 46,841 | 3,402,958 | 421,328 | (731,546) |
Change in unrealized appreciation (depreciation) on derivatives recognized in income ($) |
Underlying risk | Financial Futures10 | Options Transactions11 | Forward Contracts12 | Swap Transactions13 | Total |
Equity rate | 971,624 | (398,962) | - | 785,215 | 1,357,877 |
Foreign exchange | - | - | 258,158 | - | 258,158 |
Total | 971,624 | (398,962) | 258,158 | 785,215 | 1,616,035 |
Statement of Operations location:
6 Net realized gain (loss) on financial futures.
7 Net realized gain (loss) on options transactions.
8 Net realized gain (loss) on forward foreign currency exchange contracts.
9 Net realized gain (loss) on swap transactions.
10 Net unrealized appreciation (depreciation) on financial futures.
11 Net unrealized appreciation (depreciation) on options transactions.
12 Net unrealized appreciation (depreciation) on forward foreign currency exchange contracts.
13 Net unrealized appreciation (depreciation) on swap transactions.
The provisions of ASC Topic 210 “Disclosures about Offsetting Assets and Liabilities” require disclosure on the offsetting of financial assets and liabilities. These disclosures are required for certain investments, including derivative financial instruments subject to Master Agreements which are eligible for offsetting in the Statement of Assets and Liabilities and require the fund to disclose both gross and net information with respect to such investments. For financial reporting purposes, the fund does not offset derivative assets and derivative liabilities that are subject to Master Agreements in the Statement of Assets and Liabilities.
At October 31, 2015, derivative assets and liabilities (by type) on a gross basis are as follows:
53
NOTES TO FINANCIAL STATEMENTS (continued)
| | | | | | |
Derivative Financial Instruments: | | Assets ($) | | Liabilities ($) | |
Financial futures | | 738 | | (693,518) | |
Options | | 548,992 | | (876) | |
Forward contracts | | 1,136,724 | | (408,808) | |
Swaps | | 1,090,482 | | (458,468) | |
Total gross amount of derivative | | | | | |
assets and liabilities in the | | | | | |
Statement of Assets and Liabilities | | 2,776,936 | | (1,561,670) | |
Derivatives not subject to | | | | | |
Master Agreements | | (549,730) | | 694,394 | |
Total gross amount of assets | | | | | |
and liabilities subject to | | | | | |
Master Agreements | | 2,227,206 | | (867,276) | |
The following tables present derivative assets and liabilities net of amounts available for offsetting under Master Agreements and net of related collateral received or pledged, if any, as of October 31, 2015:
| | | | | | | |
| | | | Financial | | | |
| | | | Instruments | | | |
| | | | and Derivatives | | | |
| | Gross Amount of | | Available | Collateral | | Net Amount of |
Counterparty | Assets ($) | 1 | for Offset ($) | Received ($) | | Assets ($) |
Goldman Sachs
International | 140,575 | | (38,135) | - | | 102,440 |
Morgan Stanley
Capital Services | 2,086,631 | | (829,141) | - | | 1,257,490 |
Total | 2,227,206 | | (867,276) | - | | 1,359,930 |
| | | | | | | |
| | | | Financial | | | |
| | | | Instruments | | | |
| | | | and Derivatives | | | |
| | Gross Amount of | | Available | Collateral | | Net Amount of |
Counterparty | Liabilities ($) | 1 | for Offset ($) | Pledged ($) | | Liabilities ($) |
Goldman Sachs
International | (38,135) | | 38,135 | - | | - |
Morgan Stanley
Capital Services | (829,141) | | 829,141 | - | | - |
Total | (867,276) | | 867,276 | - | | - |
| | | | | | | |
1 Absent a default event or early termination, OTC derivative assets and liabilities are presented
at gross amounts and are not offset in the Statement of Assets and Liabilities. |
The following summarizes the average market value of derivatives outstanding during the period ended October 31, 2015:
| | | | | |
| | | | | Average Market Value ($) |
Equity financial futures | | | | 29,465,261 |
Forward contracts | | | | 45,320,696 |
Equity options contracts | | | | 135,238 |
54
The following summarizes the average notional value of swap agreements outstanding during the period ended October 31, 2015:
| | | | | |
| | | | | Average Notional Value ($) |
Equity total return swap agreements | | | | 19,689,415 |
At October 31, 2015, the cost of investments for federal income tax purposes was $196,498,494; accordingly, accumulated net unrealized depreciation on investments was $22,161, consisting of $12,409,710 gross unrealized appreciation and $12,431,871 gross unrealized depreciation.
55
REPORT OF INDEPENDENT REGISTERED
PUBLIC ACCOUNTING FIRM
The Board of Directors and Shareholders of
Dreyfus BNY Mellon Funds, Inc.
We have audited the accompanying statement of assets and liabilities of Dreyfus Select Managers Long/Short Fund (the “Fund”), a series of Dreyfus BNY Mellon Funds, Inc., including the statements of investments, securities sold short, financial futures and options written as of October 31, 2015, and the related statement of operations for the year then ended, and the statements of changes in net assets and the financial highlights for each of the year or period in the two-year period then ended. These financial statements and financial highlights are the responsibility of the Fund’s management. Our responsibility is to express an opinion on these financial statements and financial highlights based on our audits.
We conducted our audits in accordance with the standards of the Public Company Accounting Oversight Board (United States). Those standards require that we plan and perform the audit to obtain reasonable assurance about whether the financial statements and financial highlights are free of material misstatement. An audit includes examining, on a test basis, evidence supporting the amounts and disclosures in the financial statements. Our procedures included confirmation of securities owned as of October 31, 2015, by correspondence with the custodian and brokers or by other appropriate auditing procedures. An audit also includes assessing the accounting principles used and significant estimates made by management, as well as evaluating the overall financial statement presentation. We believe that our audits provide a reasonable basis for our opinion.
In our opinion, the financial statements and financial highlights referred to above present fairly, in all material respects, the financial position of Dreyfus Select Managers Long/Short Fund as of October 31, 2015, and the results of its operations for the year then ended, and the changes in its net assets and the financial highlights for each of the year or period in the two-year period then ended, in conformity with U.S. generally accepted accounting principles.

New York, New York
December 30, 2015
56
INFORMATION ABOUT THE RENEWAL OF THE FUND'S MANAGEMENT AND SUB-INVESTMENT ADVISORY AGREEMENTS (Unaudited)
At a meeting of the fund's Board of Directors (the "Board") held on July 29-30, 2015 (the "Meeting"), Dreyfus and EACM recommended the appointment of Pine River Capital Management L.P. ("Pine River") and Cramer Rosenthal McGlynn, LLC ("Cramer Rosenthal" and, together with Pine River, the "New Sub-Advisers") to serve as new sub-investment advisers for the fund. The recommendation of the New Sub-Advisers was based on, among other information, EACM's review and due diligence report relating to the New Sub-Advisers and their investment advisory services. In the opinion of Dreyfus and EACM, the proposed allocation to each New Sub-Adviser of a portion of the fund's assets would help minimize any capacity constraints from the termination of another sub-adviser, effectively complement the fund's other current sub-advisers and increase portfolio diversification. The target percentage of the fund's assets to be allocated to each New Sub-Adviser will occur over time.
At the Meeting, the Board, including a majority of the Directors who are not "interested persons" (as defined in the Investment Company Act of 1940, as amended (the "1940 Act")) of the fund ("Independent Directors"), considered and approved a Sub-Investment Advisory Agreement between Dreyfus and each of Pine River and Cramer Rosenthal pursuant to which each would provide day-to-day management of a portion of the fund's investments (the "New Sub-Advisory Agreements"). In determining whether to approve the New Sub-Advisory Agreements, the Board considered the due diligence materials prepared by EACM and other information, which included: (i) a copy of each New Sub-Advisory Agreement between Dreyfus and the New Sub-Adviser; (ii) information regarding the process by which EACM recommended and Dreyfus selected and recommended each New Sub-Adviser for Board approval; (iii) information regarding the nature, extent and quality of the services each New Sub-Adviser would provide to the fund; (iv) information regarding each New Sub-Adviser's reputation, investment management business, personnel, and operations; (v) information regarding each New Sub-Adviser's brokerage and trading policies and practices; (vi) information regarding the level of the sub-investment advisory fee to be charged by each New Sub-Adviser; (vii) information regarding each New Sub-Adviser's compliance program; and (viii) information regarding each New Sub-Adviser's historical performance returns managing investment mandates similar to the fund's investment mandate with respect to the portion of the fund's assets to be allocated to the New Sub-Adviser, with such performance compared to relevant indices. The Board also considered the substance of discussions with representatives of Dreyfus and EACM at the Meeting. Additionally, the Board reviewed materials supplied by counsel that were prepared for use by the Board in fulfilling its duties under the 1940 Act.
Nature, Extent and Quality of Services to be Provided by the New Sub-Advisers. In examining the nature, extent and quality of the services to be provided by the New Sub-Advisers to the fund, the Board considered each New Sub-Adviser's: (i) organization, history, reputation, qualification and background, as well as the qualifications of its personnel; (ii) expertise in providing portfolio management services to other similar investment portfolios and the performance history of those portfolios; (iii) proposed
57
INFORMATION ABOUT THE RENEWAL OF THE FUND'S MANAGEMENT AND SUB-INVESTMENT ADVISORY AGREEMENTS (Unaudited) (continued)
investment strategy for the fund; (iv) long- and short-term performance relative to unmanaged indices; and (v) compliance program. The Board specifically took into account each New Sub-Adviser's investment process and research resources and capabilities, evaluating how the New Sub-Adviser would complement the fund's existing sub-advisers. The Board also discussed the acceptability of the terms of each New Sub-Advisory Agreement, noting the substantial similarity to the terms of the fund's other sub-investment advisory agreements. The Board also considered the review process undertaken by EACM, subject to Dreyfus' supervision, and EACM's favorable assessment of the nature and quality of the sub-investment advisory services expected to be provided to the fund by the New Sub-Advisers. The Board concluded that the fund will benefit from the quality and experience of each New Sub-Adviser's investment professionals. Based on their consideration and review of the foregoing information, the Board concluded that the nature, extent and quality of the sub-investment advisory services to be provided by the New Sub-Advisers were adequate and appropriate in light of each New Sub-Adviser's experience with the proposed investment strategy for the portion of the fund's assets to be allocated to the New Sub-Adviser, each New Sub-Adviser's portfolio management and research resources to be applied in managing a portion of the fund's portfolio, and Dreyfus' and EACM's recommendation to engage the New Sub-Advisers, and supported a decision to approve each New Sub-Advisory Agreement.
Investment Performance of the New Sub-Advisers. Because the New Sub-Advisers were newly-appointed sub-advisers for the fund, the Board could not consider their investment performance in managing a portion of the fund's portfolio as a factor in evaluating the New Sub-Advisory Agreements during the Meeting. However, the Board did review each New Sub-Adviser's historical performance record in managing other portfolios that were comparable to the fund with respect to its investment mandate for the portion of the fund's assets to be allocated to the New Sub-Adviser. The Board also discussed with representatives of Dreyfus and EACM the investment strategies to be employed by each New Sub-Adviser in the management of its portion of the fund's assets. The Board noted each New Sub-Adviser's reputation and experience with respect to the proposed investment strategy for the portion of the fund's assets to be allocated to the New Sub-Adviser, the portfolio managers' experience with such investment strategy, and EACM's experience and reputation in selecting, evaluating, and overseeing investment managers. Based on their consideration and review of the foregoing information, the Board concluded that these factors supported a decision to approve each New Sub-Advisory Agreement.
Costs of Services to be Provided and Profitability. The Board considered the proposed fee payable under each New Sub-Advisory Agreement, noting that the proposed fee would be paid by Dreyfus and, thus, would not impact the fees paid by the fund. The Board recognized that, because each New Sub-Adviser's fee would be paid by Dreyfus, and not the fund, an analysis of profitability was more appropriate in the context of the Board's consideration of the Management Agreement and, therefore, the Board received and considered a profitability analysis of Dreyfus and its affiliates with respect to the proposed addition of Pine River and Cramer Rosenthal as additional sub-advisers for
58
the fund. The Board concluded that the proposed fee payable to each New Sub-Adviser by Dreyfus with respect to the assets to be allocated to each New Sub-Adviser in their respective capacities as sub-advisers was reasonable and appropriate and Dreyfus' profitability was not excessive in light of the nature, extent and quality of the services to be provided to the fund by Dreyfus and the New Sub-Advisers.
Economies of Scale to be Realized. The Board recognized that, because each New Sub-Adviser's fee would be paid by Dreyfus, and not the fund, an analysis of economies of scale was more appropriate in the context of the Board's consideration of the Management Agreement. Accordingly, consideration of economies of scale with respect to the New Sub-Advisers was not relevant to the Board's determination to approve the New Sub-Advisory Agreements.
The Board also considered whether there were any ancillary benefits that may accrue to the New Sub-Advisers as a result of the New Sub-Advisers' relationships with the fund. The Board concluded that the New Sub-Advisers may direct fund brokerage transactions to certain brokers to obtain research and other services. However, the Board noted that the New Sub-Advisers were required to select brokers who met the fund's requirements for seeking best execution, and that Dreyfus would monitor and evaluate each New Sub-Adviser's trade execution with respect to fund brokerage transactions on a quarterly basis and would provide reports to the Board on these matters. The Board concluded that the benefits that were expected to accrue to each New Sub-Adviser by virtue of its relationship with the fund were reasonable.
In considering the materials and information described above, the Independent Directors received assistance from, and met separately with, their independent legal counsel, and were provided with a written description of their statutory responsibilities and the legal standards that are applicable to the approval of investment advisory and sub-investment advisory agreements.
After full consideration of the factors discussed above, with no single factor identified as being of paramount importance, the Board, including a majority of the Independent Directors, with the assistance of independent legal counsel, concluded that the initial approval of each New Sub-Advisory Agreement was in the best interests of the fund, and approved the New Sub-Advisory Agreements for the fund.
59
BOARD MEMBERS INFORMATION (Unaudited)
INDEPENDENT BOARD MEMBERS
Joseph S. DiMartino (72)
Chairman of the Board (1999)
Principal Occupation During Past 5 Years:
· Corporate Director and Trustee (1995-present)
Other Public Company Board Memberships During Past 5 Years:
· CBIZ (formerly, Century Business Services, Inc.), a provider of outsourcing functions for small and medium size companies, Director (1997-present)
· The Newark Group, a provider of a national market of paper recovery facilities, paperboard mills and paperboard converting plants, Director (2000-2010)
No. of Portfolios for which Board Member Serves: 140
———————
Francine J. Bovich (64)
Board Member (2012)
Principal Occupation During Past 5 Years:
· Trustee, The Bradley Trusts, private trust funds (2011-present)
· Managing Director, Morgan Stanley Investment Management (1993-2010)
Other Public Company Board Memberships During Past 5 Years:
· Annaly Capital Management, Inc., Board Member (May 2014-present)
No. of Portfolios for which Board Member Serves: 79
———————
Kenneth A. Himmel (69)
Board Member (1994)
Principal Occupation During Past 5 Years:
· Managing Partner, Gulf Related, an international real estate development company (2010-present)
· President and CEO, Related Urban Development, a real estate development company (1996-present)
· President and CEO, Himmel & Company, a real estate development company (1980-present)
· CEO, American Food Management, a restaurant company (1983-present)
No. of Portfolios for which Board Member Serves: 29
———————
60
Stephen J. Lockwood (68)
Board Member (1994)
Principal Occupation During Past 5 Years:
· Chairman of the Board, Stephen J. Lockwood and Company LLC, a real estate investment company (2000-present)
No. of Portfolios for which Board Member Serves: 29
———————
Roslyn M. Watson (66)
Board Member (1994)
Principal Occupation During Past 5 Years:
· Principal, Watson Ventures, Inc., a real estate investment company (1993-present)
No. of Portfolios for which Board Member Serves: 65
———————
Benaree Pratt Wiley (69)
Board Member (1998)
Principal Occupation During Past 5 Years:
· Principal, The Wiley Group, a firm specializing in strategy and business development (2005-present)
Other Public Company Board Memberships During Past 5 Years:
· CBIZ (formerly, Century Business Services, Inc.), a provider of outsourcing functions for small and medium size companies, Director (2008-present)
No. of Portfolios for which Board Member Serves: 65
———————
Once elected all Board Members serve for an indefinite term, but achieve Emeritus status upon reaching age 80. The address of the Board Members and Officers is c/o The Dreyfus Corporation, 200 Park Avenue, New York, New York 10166. Additional information about the Board Members is available in the fund's Statement of Additional Information which can be obtained from Dreyfus free of charge by calling this toll free number: 1-800-DREYFUS.
James M. Fitzgibbons, Emeritus Board Member
61
OFFICERS OF THE FUND (Unaudited)
BRADLEY J. SKAPYAK, President since January 2010.
Chief Operating Officer and a director of the Manager since June 2009, Chairman of Dreyfus Transfer, Inc., an affiliate of the Manager and the transfer agent of the funds, since May 2011 and Executive Vice President of the Distributor since June 2007. From April 2003 to June 2009, Mr. Skapyak was the head of the Investment Accounting and Support Department of the Manager. He is an officer of 66 investment companies (comprised of 140 portfolios) managed by the Manager. He is 56 years old and has been an employee of the Manager since February 1988.
BENNETT A. MACDOUGALL, Chief Legal Officer since October 2015
Chief Legal Officer of the Manager since June 2015; from June 2005 to June 2015, Director and Associate General Counsel of Deutsche Bank – Asset & Wealth Management Division, and Chief Legal Officer of Deutsche Investment Management Americas Inc. He is an officer of 67 investment companies (comprised of 165 portfolios) managed by the Manager. He is 44 years old and has been an employee of the Manager since June 2015.
JANETTE E. FARRAGHER, Vice President and Secretary since December 2011.
Assistant General Counsel of BNY Mellon, and an officer of 67 investment companies (comprised of 165 portfolios) managed by the Manager. She is 52 years old and has been an employee of the Manager since February 1984.
JAMES BITETTO, Vice President and Assistant Secretary since August 2005.
Managing Counsel of BNY Mellon and Secretary of the Manager, and an officer of 67 investment companies (comprised of 165 portfolios) managed by the Manager. He is 49 years old and has been an employee of the Manager since December 1996.
JONI LACKS CHARATAN, Vice President and Assistant Secretary since August 2005.
Managing Counsel of BNY Mellon, and an officer of 67 investment companies (comprised of 165 portfolios) managed by the Manager. She is 59 years old and has been an employee of the Manager since October 1988.
JOSEPH M. CHIOFFI, Vice President and Assistant Secretary since August 2005.
Managing Counsel of BNY Mellon, and an officer of 67 investment companies (comprised of 165 portfolios) managed by the Manager. He is 53 years old and has been an employee of the Manager since June 2000.
JOHN B. HAMMALIAN, Vice President and Assistant Secretary since August 2005.
Senior Managing Counsel of BNY Mellon, and an officer of 67 investment companies (comprised of 165 portfolios) managed by the Manager. He is 52 years old and has been an employee of the Manager since February 1991.
MAUREEN E. KANE, Vice President and Assistant Secretary since April 2015.
Managing Counsel of BNY Mellon since July 2014; from October 2004 until July 2014, General Counsel, and from May 2009 until July 2014, Chief Compliance Officer of Century Capital Management. She is an officer of 67 investment companies (comprised of 165 portfolios) managed by the Manager. She is 53 years old and has been an employee of the Manager since July 2014.
SARAH S. KELLEHER, Vice President and Assistant Secretary since April 2014.
Senior Counsel of BNY Mellon, and an officer of 67 investment companies (comprised of 165 portfolios) managed by the Manager; from August 2005 to March 2013, Associate General Counsel of Third Avenue Management. She is 40 years old and has been an employee of the Manager since March 2013.
JEFF PRUSNOFSKY, Vice President and Assistant Secretary since August 2005.
Senior Managing Counsel of BNY Mellon, and an officer of 67 investment companies (comprised of 165 portfolios) managed by the Manager. He is 50 years old and has been an employee of the Manager since October 1990.
JAMES WINDELS, Treasurer since November 2001.
Director – Mutual Fund Accounting of the Manager, and an officer of 67 investment companies (comprised of 165 portfolios) managed by the Manager. He is 57 years old and has been an employee of the Manager since April 1985.
62
RICHARD CASSARO, Assistant Treasurer since January 2008.
Senior Accounting Manager – Money Market and Municipal Bond Funds of the Manager, and an officer of 67 investment companies (comprised of 165 portfolios) managed by the Manager. He is 56 years old and has been an employee of the Manager since September 1982.
GAVIN C. REILLY, Assistant Treasurer since December 2005.
Tax Manager of the Investment Accounting and Support Department of the Manager, and an officer of 67 investment companies (comprised of 165 portfolios) managed by the Manager. He is 47 years old and has been an employee of the Manager since April 1991.
ROBERT S. ROBOL, Assistant Treasurer since December 2002.
Senior Accounting Manager – Fixed Income Funds of the Manager, and an officer of 67 investment companies (comprised of 165 portfolios) managed by the Manager. He is 51 years old and has been an employee of the Manager since October 1988.
ROBERT SALVIOLO, Assistant Treasurer since July 2007.
Senior Accounting Manager – Equity Funds of the Manager, and an officer of 67 investment companies (comprised of 165 portfolios) managed by the Manager. He is 48 years old and has been an employee of the Manager since June 1989.
ROBERT SVAGNA, Assistant Treasurer since December 2002.
Senior Accounting Manager – Equity Funds of the Manager, and an officer of 67 investment companies (comprised of 165 portfolios) managed by the Manager. He is 48 years old and has been an employee of the Manager since November 1990.
JOSEPH W. CONNOLLY, Chief Compliance Officer since October 2004.
Chief Compliance Officer of the Manager and The Dreyfus Family of Funds (67 investment companies, comprised of 165 portfolios). He is 58 years old and has served in various capacities with the Manager since 1980, including manager of the firm’s Fund Accounting Department from 1997 through October 2001.
63
NOTES
64
NOTES
65
Dreyfus Select Managers Long/Short Fund
200 Park Avenue
New York, NY 10166
Manager
The Dreyfus Corporation
200 Park Avenue
New York, NY 10166
Portfolio Allocation Manager
EACM Advisors LLC
200 Connecticut Avenue
Norwalk, CT 06854-1958
Sub-Investment Adviser
Owl Creek Asset Management, L.P.
640 Fifth Avenue, 20th Floor
New York, NY 10019
Sirios Capital Management, L.P.
One International Place
Boston, MA 02110
Kingsford Capital Management, LLC
1160 Brickyard Cove Road
Point Richmond, CA 94801
Standard Pacific Capital, LLC
101 California Street
San Francisco, CA 94111
Three Bridges Capital, LP
810 Seventh Avenue, 32nd Floor
New York, NY 10019
Cramer Rosenthal McGlynn, LLC
520 Madison Avenue, 20th Floor
New York, NY 10022
Pine River Capital Management L.P.
601 Carlson Parkway, Suite330
Minnetonka, MN 55305
Custodian
The Bank of New York Mellon
225 Liberty Street
New York, NY 10286
Transfer Agent &
Dividend Disbursing Agent
Dreyfus Transfer, Inc.
200 Park Avenue
New York, NY 10166
Distributor
MBSC Securities Corporation
200 Park Avenue
New York, NY 10166
| | |
Ticker Symbols: | ClassA: DBNAX Class C: DBNCX Class I: DBNIX Class Y: DBNYX |
Telephone Call your financial representative or 1-800-DREYFUS
Mail The Dreyfus Family of Funds, 144 Glenn Curtiss Boulevard, Uniondale, NY 11556-0144
E-mail Send your request to info@dreyfus.com
Internet Information can be viewed online or downloaded at www.dreyfus.com
The fund files its complete schedule of portfolio holdings with the Securities and Exchange Commission (“SEC”) for the first and third quarters of each fiscal year on Form N-Q. The fund’s Forms N-Q are available on the SEC’s website at www.sec.gov and may be reviewed and copied at the SEC’s Public Reference Room in Washington, DC. (phone 1-800-SEC-0330 for information).
A description of the policies and procedures that the fund uses to determine how to vote proxies relating to portfolio securities and information regarding how the fund voted these proxies for the most recent 12-month period ended June 30 is available at www.dreyfus.com and on the SEC’s website at www.sec.gov and without charge, upon request, by calling 1-800-DREYFUS.
| | |
© 2015 MBSC Securities Corporation
6250AR1015 | 
|
Dreyfus Yield Enhancement Strategy Fund
| | | |
| | ANNUAL REPORT October 31, 2015 |
| |
Save time. Save paper. View your next shareholder report online as soon as it’s available. Log into www.dreyfus.com and sign up for Dreyfus eCommunications. It’s simple and only takes a few minutes. |
| |
The views expressed in this report reflect those of the portfolio manager only through the end of the period covered and do not necessarily represent the views of Dreyfus or any other person in the Dreyfus organization. Any such views are subject to change at any time based upon market or other conditions and Dreyfus disclaims any responsibility to update such views. These views may not be relied on as investment advice and, because investment decisions for a Dreyfus fund are based on numerous factors, may not be relied on as an indication of trading intent on behalf of any Dreyfus fund. |
| |
Not FDIC-Insured • Not Bank-Guaranteed • May Lose Value |
Contents
T H E F U N D
F O R M O R E I N F O R M AT I O N
Back Cover
| | | | |
| |
Dreyfus Yield Enhancement Strategy Fund
| | The Fund |
A LETTER FROM THE PRESIDENT
Dear Shareholder:
We are pleased to present this annual report for Dreyfus Yield Enhancement Strategy Fund, covering the 12-month period from November 1, 2014, through October 31, 2015. For information about how the fund performed during the reporting period, as well as general market perspectives, we provide a Discussion of Fund Performance on the pages that follow.
Financial markets proved volatile over the reporting period amid choppy U.S. and global economic growth. U.S. stocks advanced over the final months of 2014 and the spring of 2015, with some broad measures of market performance setting new record highs. Those gains were largely erased over the summer when global economic instability undermined investor sentiment, but a renewed rally in October enabled most broad stock indices to end the reporting period in positive territory. In contrast, international stocks generally lost a degree of value, with developed markets faring far better than emerging markets amid falling commodity prices and depreciating currency values. U.S. bonds generally produced modestly positive total returns, with municipal bonds and longer term U.S. government securities faring better, on average, than corporate-backed bonds.
We expect market volatility to persist over the near term until investors see greater clarity regarding short-term U.S. interest rates and global economic conditions. Our investment strategists and portfolio managers are monitoring developments carefully, keeping a close watch on credit spreads, currency values, commodity prices, corporate profits, economic trends in the emerging markets, and other developments that could influence investor sentiment. Over the longer term, we remain confident that markets are likely to benefit as investors increasingly recognize that inflation is likely to stay low, economic growth expectations are stabilizing, and monetary policies remain accommodative in most regions of the world. In our view, investors will continue to be well served under these circumstances by a long-term perspective and a disciplined investment approach
Thank you for your continued confidence and support.
Sincerely,

J. Charles Cardona
President
The Dreyfus Corporation
November 16, 2015
2
DISCUSSION OF FUND PERFORMANCE
For the period of November 1, 2014, through October 31, 2015, as provided by Jeffrey M. Mortimer, CFA, Portfolio Manager
Fund and Market Performance Overview
For the 12-month period ended October 31, 2015, Dreyfus Yield Enhancement Strategy Fund’s Class A shares produced a total return of 0.10%, Class C shares returned -0.66%, Class I shares returned 0.33%, and Class Y shares returned 0.42%.1 In comparison, the fund’s primary benchmark, the Barclays U.S. Aggregate Bond Index (the “Index”), produced a total return of 1.96% for the same period.2 The fund’s secondary benchmark, the Lipper Alternative Credit Focus Funds Index, produced a total return of -1.58% for the same period.2
Fixed-income securities produced mildly positive returns, on average, in the midst of changing economic sentiment during the reporting period. The fund lagged the Index, mainly due to its exposure to emerging markets debt securities.
The Fund’s Investment Approach
The fund seeks high current income. The fund is designed to complement and diversify traditional bond portfolios.
To pursue its goal, the fund normally allocates its assets across fixed-income investment strategies using a “fund of funds” approach that apportions assets among other investment companies (underlying funds) employing various fixed-income investment strategies, including those focusing on domestic and foreign corporate bonds, high yield securities (“junk” bonds), senior loans, emerging markets debt, municipal securities, and Treasury and other inflation-protected securities (TIPS).
Dreyfus determines the fund’s asset allocation to the fixed-income investment strategies and sets the investment ranges using fundamental and quantitative analysis, and its economic and financial markets outlook. Underlying funds are selected based on their investment objectives and management policies, investment strategies and portfolio holdings, risk/reward profiles, historical performance, and other factors. As of October 31, 2015, the fund held investments in: BNY Mellon Corporate Bond Fund, BNY Mellon Municipal Opportunities Fund, Dreyfus Floating Rate Income Fund, Dreyfus High Yield Fund, Dreyfus Opportunistic Fixed Income Fund, Dreyfus Global Dynamic Bond Fund, and TCW Emerging Markets Income Fund.
Volatility Roiled Bond Markets
The reporting period began during a U.S. bond market rally in which aggressively accommodative monetary policies in Europe and Japan sent yields of high-quality sovereign bonds sharply lower, and global investors flocked to higher yielding alternatives in the United States. Consequently, longer term U.S. interest rates declined through the end of 2014. Investor demand began to normalize in early 2015, and robust employment gains briefly sent long-term bond yields higher until investors responded to weaker-than-expected data in other areas of the economy. In fact, U.S. GDP expanded at an anemic 0.6% annualized rate over the first quarter of 2015 due to a strengthening U.S. dollar and severe
3
DISCUSSION OF FUND PERFORMANCE (continued)
winter weather. The economy regained strength in the spring, posting a 3.9% annualized GDP growth rate for the second quarter, and rising long-term U.S. Treasury yields erased previous price gains. However, renewed worries about economic instability in China and other emerging markets again sparked a renewed flight to quality over the summer, causing long-term bond yields to fall again. Meanwhile, U.S. economic growth decelerated to a more moderate 1.5% annualized rate for the third quarter of 2015.
U.S. government securities produced some of the market’s higher returns in this turbulent environment. In contrast, high yield securities lost a degree of value as credit spreads widened. Emerging markets debt securities fared particularly poorly due to persistent economic concerns and plummeting commodity prices.
Emerging Markets Exposure Dampened Fund Results
The fund’s underperformance compared to its benchmark was due, in large part, to its exposure to emerging markets debt securities through TCW Emerging Markets Income Fund, which lost value amid falling commodity prices despite providing a relatively generous stream of current income. The fund also briefly held a modest position in Dreyfus Emerging Markets Debt Local Currency Fund, but we quickly eliminated the position in the face of market weakness. A more substantial allocation to Dreyfus High Yield Fund also undermined relative results when a more risk-averse attitude among investors caused credit spreads to widen.
On a more positive note, overweighted exposure to municipal bonds rated toward the lower end of the investment-grade range enabled BNY Mellon Municipal Opportunities Fund to outperform market averages. BNY Mellon Corporate Bond Fund and Dreyfus Floating Rate Income Fund helped buoy the fund’s relative performance to a lesser degree.
Positioned for Changing Interest Rates
We currently expect heighted fixed-income market volatility to persist over the near term. The Federal Reserve Board is widely expected to begin raising short-term interest rates, perhaps as soon as December 2015. Meanwhile, central banks in Europe and Japan appear set to adopt more accommodative monetary policies, and China has continued to implement measures to boost its economy.
In anticipation of these developments, which we believe could lead to more divergent bond market conditions across the globe; we recently increased the fund’s diversification across investment strategies. In June, we added two new underlying mutual funds that employ an opportunistic approach. In our judgment, allocations to Dreyfus Opportunistic Fixed Income Fund and Dreyfus Global Dynamic Bond Fund can provide the flexibility required to successfully navigate a broader range of interest-rate and credit environments.
November 16, 2015
Bond funds are subject generally to interest rate, credit, liquidity, and market risks, to varying degrees, all of which are more fully described in the fund’s prospectus. Generally, all other factors being equal, bond prices are inversely related to interest-rate changes, and rate increases can cause price declines.
High yield bonds are subject to increased credit risk and are considered speculative in terms of the issuer’s perceived ability to continue making interest payments on a timely basis and to repay principal upon maturity.
Foreign bonds are subject to special risks including exposure to currency fluctuations, changing political and economic conditions, and potentially less liquidity. These risks are generally greater with emerging market countries than with more economically and politically established foreign countries.
4
Investments in foreign currencies are subject to the risk that those currencies will decline in value relative to the U.S. dollar, or, in the case of hedged positions, that the U.S. dollar will decline relative to the currency being hedged. Currency rates in foreign countries may fluctuate significantly over short periods of time. A decline in the value of foreign currencies relative to the U.S. dollar will reduce the value of securities held by the fund and denominated in those currencies. The use of leverage may magnify the fund’s gains or losses. For derivatives with a leveraging component, adverse changes in the value or level of the underlying asset can result in a loss that is much greater than the original investment in the derivative.
The fund’s underlying strategies may use derivative instruments, such as options, futures and options on futures, forward contracts, swaps (including credit default swaps on corporate bonds and asset-backed securities), options on swaps, and other credit derivatives. A small investment in derivatives could have a potentially large impact on the fund’s performance. The use of derivatives involves risks different from, or possibly greater than, the risks associated with investing directly in the underlying assets.
The ability of the fund to achieve its investment goal depends, in part, on the ability of Dreyfus to allocate effectively the fund’s assets among the investment strategies and the underlying funds.
1 Total return includes reinvestment of dividends and any capital gains paid, and does not take into consideration the maximum initial sales charge in the case of Class A shares, or the applicable contingent deferred sales charge imposed on redemptions in the case of Class C shares. Had these charges been reflected, returns would have been lower. Past performance is no guarantee of future results. Class I and Class Y shares are not subject to any initial or deferred sales charges. Share price, yield, and investment return fluctuate such that upon redemption, fund shares may be worth more or less than their original cost. Return figures provided reflect the absorption of certain fund expenses by The Dreyfus Corporation pursuant to an agreement in effect until March 1, 2016. Had these expenses not been absorbed, the fund’s returns would have been lower.
² SOURCE: Lipper Inc. — Reflects reinvestment of dividends and, where applicable, capital gain distributions. The Barclays U.S. Aggregate Index is a widely accepted, unmanaged total return index of corporate, U.S. government and U.S. government agency debt instruments, mortgage-backed securities, and asset-backed securities with an average maturity of 1-10 years. Investors cannot invest directly in any index. The Lipper Alternative Credit Focus Funds Index reflects the returns of mutual funds to show how the fund's performance compares with the returns of mutual funds that, by prospectus language, invest in a wide-range of credit-structured vehicles by using either fundamental credit research analysis or quantitative credit portfolio modeling in seeking to benefit from any changes in credit quality, credit spreads, and market liquidity.
5
FUND PERFORMANCE
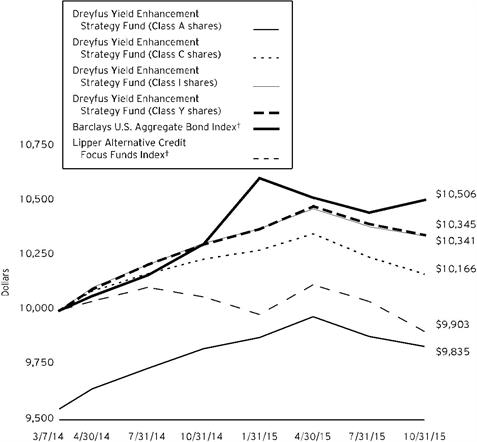
Comparison of change in value of $10,000 investment in Dreyfus Yield Enhancement Strategy Fund Class A shares, Class C shares, Class I shares and Class Y shares, with the Barclays U.S. Aggregate Bond Index and the Lipper Alternative Credit Focus Funds Index
† Source: Lipper Inc.
Past performance is not predictive of future performance.
The above graph compares a $10,000 investment made in each of the Class A, Class C, Class I and Class Y shares of Dreyfus Yield Enhancement Strategy Fund on 3/7/14 (inception date) to a $10,000 investment made in the Barclays U.S. Aggregate Bond Index and the Lipper Alternative Credit Focus Funds Index on that date. All dividends and capital gain distributions are reinvested.
The fund’s performance shown in the line graph above takes into account the maximum initial sales charge on Class A shares and all other applicable fees and expenses on all classes. The Barclays U.S. Aggregate Bond Index is a widely accepted, unmanaged index of corporate, government and government agency debt instruments, mortgage-backed securities and asset-backed securities with an average maturity of 1-10 years. Unlike a mutual fund, the indices are not subject to charges, fees and other expenses. Investors cannot invest directly in any index. The Lipper Alternative Credit Focus Funds Index reflects the returns of mutual funds to show how the fund’s performance compares with the returns of mutual funds that, by prospectus language, invest in a wide-range of credit-structured vehicles by using either fundamental credit research analysis or quantitative credit portfolio modeling in seeking to benefit from any changes in credit quality, credit spreads, and market liquidity. Further information relating to fund performance, including expense reimbursements, if applicable, is contained in the Financial Highlights section of the prospectus and elsewhere in this report.
6
| | | | | |
Average Annual Total Returns as of 10/31/15 | | |
| | | | | |
| Inception
Date | 1 Year | From
Inception | |
Class A shares | | | | |
with maximum sales charge (4.50%) | 3/7/14 | -4.44% | -1.00% | |
without sales charge | 3/7/14 | 0.10% | 1.80% | |
Class C shares | | | | |
with applicable redemption charge † | 3/7/14 | -1.63% | 1.00% | |
without redemption | 3/7/14 | -0.66% | 1.00% | |
Class I shares | 3/7/14 | 0.33% | 2.05% | |
Class Y shares | 3/7/14 | 0.42% | 2.08% | |
Barclays U.S
Aggregate Bond Index | 2/28/14 | 1.96% | 3.00% | †† |
Lipper Alternative
Credit Focus Funds Index | 2/28/14 | -1.58% | -0.58% | †† |
Past performance is not predictive of future performance. The fund’s performance shown in the graph and table does not reflect the deduction of taxes that a shareholder would pay on fund distributions or the redemption of fund shares. In addition to the performance of Class A shares shown with and without a maximum sales charge, the fund’s performance shown in the table takes into account all other applicable fees and expenses on all classes.
† The maximum contingent deferred sales charge for Class C shares is 1% for shares redeemed within one year of the date of purchase.
†† For comparative purposes, the value of each index on 2/28/14 is used as the beginning value on 3/7/14.
7
UNDERSTANDING YOUR FUND’S EXPENSES (Unaudited)
As a mutual fund investor, you pay ongoing expenses, such as management fees and other expenses. Using the information below, you can estimate how these expenses affect your investment and compare them with the expenses of other funds. You also may pay one-time transaction expenses, including sales charges (loads) and redemption fees, which are not shown in this section and would have resulted in higher total expenses. For more information, see your fund’s prospectus or talk to your financial adviser.
Review your fund’s expenses
The table below shows the expenses you would have paid on a $1,000 investment in Dreyfus Yield Enhancement Strategy Fund from May 1, 2015 to October 31, 2015. It also shows how much a $1,000 investment would be worth at the close of the period, assuming actual returns and expenses.
| | | | | | | | | | | | |
Expenses and Value of a $1,000 Investment | | |
assuming actual returns for the six months ended October 31, 2015 |
| | | | | | | | |
| | | | Class A | Class C | Class I | Class Y |
Expenses paid per $1,000† | $ | 1.55 | $ | 5.70 | $ | .55 | $ | .25 |
Ending value (after expenses) | $ | 986.20 | $ | 982.20 | $ | 988.00 | $ | 987.60 |
COMPARING YOUR FUND’S EXPENSES
WITH THOSE OF OTHER FUNDS (Unaudited)
Using the SEC’s method to compare expenses
The Securities and Exchange Commission (SEC) has established guidelines to help investors assess fund expenses. Per these guidelines, the table below shows your fund’s expenses based on a $1,000 investment, assuming a hypothetical 5% annualized return. You can use this information to compare the ongoing expenses (but not transaction expenses or total cost) of investing in the fund with those of other funds. All mutual fund shareholder reports will provide this information to help you make this comparison. Please note that you cannot use this information to estimate your actual ending account balance and expenses paid during the period.
| | | | | | | | | | | | |
Expenses and Value of a $1,000 Investment | | |
assuming a hypothetical 5% annualized return for the six months ended October 31, 2015 |
| | | | | | | | |
| | | | Class A | Class C | Class I | Class Y |
Expenses paid per $1,000† | $ | 1.58 | $ | 5.80 | $ | .56 | $ | .26 |
Ending value (after expenses) | $ | 1,023.64 | $ | 1,019.46 | $ | 1,024.65 | $ | 1,024.95 |
† Expenses are equal to the fund’s annualized expense ratio of .31% for Class A, 1.14% for Class C, .11% for Class I and .05% for Class Y, multiplied by the average account value over the period, multiplied by 184/365 (to reflect the one-half year period).
8
STATEMENT OF INVESTMENTS
October 31, 2015
| | | | | | |
Registered Investment Companies - 99.0% | | Shares | | Value ($) | |
Domestic Fixed Income - 92.2% | | | | | |
BNY Mellon Corporate Bond Fund, Cl. M | | 6,771,857 | a | 85,393,115 | |
BNY Mellon Municipal Opportunities Fund, Cl. M | | 8,853,589 | a,b | 115,716,405 | |
Dreyfus Floating Rate Income Fund, Cl. Y | | 5,072,039 | a | 61,473,111 | |
Dreyfus High Yield Fund, Cl. I | | 16,672,824 | a,b | 103,038,054 | |
Dreyfus Opportunistic Fixed Income Fund, Cl. Y | | 1,013,192 | a | 12,462,255 | |
| | | | | 378,082,940 | |
Foreign Fixed Income - 6.8% | | | | | |
Dreyfus Global Dynamic Bond Fund, Cl. Y | | 1,057,059 | a | 12,832,701 | |
TCW Emerging Markets Income Fund, Cl. I | | 1,951,422 | | 14,967,558 | |
| | | | | 27,800,259 | |
Total Registered Investment Companies (cost $416,898,742) | | | | 405,883,199 | |
Total Investments (cost $416,898,742) | | 99.0% | | 405,883,199 | |
Cash and Receivables (Net) | | 1.0% | | 4,012,126 | |
Net Assets | | 100.0% | | 409,895,325 | |
a Investment in affiliated mutual fund.
b The fund's invesment in the BNY Mellon Municipal Opportunities Fund, Cl. M and Dreyfus High Yield Fund, Cl. I represents 28.5% and 25.3%, respectively, of the fund's total investments.BNY Mellon Municipal Opportunities Fund, Cl. M seeks to provide total return (consisting of capital appreciation and current income) and Dreyfus High Yield Fund, Cl. I seeks to maximize total return consisting of current income exempt from federal income tax and capital appreciation.
| | |
Portfolio Summary (Unaudited) † | Value (%) |
Mutual Funds: Domestic | 92.2 |
Mutual Funds: Foreign | 6.8 |
| | 99.0 |
†Based on net assets.
See notes to financial statements.
9
STATEMENT OF ASSETS AND LIABILITIES
October 31, 2015
| | | | | | | |
| | | | | | |
| | | Cost | | Value | |
Assets ($): | | | | |
Investments in securities—See Statement of Investments: | | | | |
Unaffiliated issuers | | 16,460,032 | | 14,967,558 | |
Affiliated issuers | | 400,438,710 | | 390,915,641 | |
Cash | | | | | 4,787,433 | |
Receivable for shares of Common Stock subscribed | | | | | 303,990 | |
Prepaid expenses | | | | | 9,957 | |
| | | | | 410,984,579 | |
Liabilities ($): | | | | |
Due to The Dreyfus Corporation and affiliates—Note 3(c) | | | | | 3,872 | |
Payable for shares of Common Stock redeemed | | | | | 1,029,521 | |
Accrued expenses | | | | | 55,861 | |
| | | | | 1,089,254 | |
Net Assets ($) | | | 409,895,325 | |
Composition of Net Assets ($): | | | | |
Paid-in capital | | | | | 422,076,309 | |
Accumulated undistributed investment income—net | | | | | 1,349,849 | |
Accumulated net realized gain (loss) on investments | | | | | (2,515,290) | |
Accumulated net unrealized appreciation (depreciation)
on investments | | | | | (11,015,543) | |
Net Assets ($) | | | 409,895,325 | |
| | | | | | |
Net Asset Value Per Share | Class A | Class C | Class I | Class Y | |
Net Assets ($) | 543,714 | 24,387 | 250,106 | 409,077,118 | |
Shares Outstanding | 44,538 | 2,000 | 20,468 | 33,500,909 | |
Net Asset Value Per Share ($) | 12.21 | 12.19 | 12.22 | 12.21 | |
See notes to financial statements.
10
STATEMENT OF OPERATIONS
Year Ended October 31, 2015
| | | | | | | |
| | | | | | |
| | | | | | |
Investment Income ($): | | | | |
Income: | | | | |
Cash dividends: | | | | |
Unaffiliated issuers | | | 732,825 | |
Affiliated issuers | | | 14,887,394 | |
Total Income | | | 15,620,219 | |
Expenses: | | | | |
Professional fees | | | 79,454 | |
Registration fees | | | 78,604 | |
Directors’ fees and expenses—Note 3(d) | | | 23,857 | |
Prospectus and shareholders’ reports | | | 12,371 | |
Loan commitment fees—Note 2 | | | 4,416 | |
Custodian fees—Note 3(c) | | | 3,304 | |
Shareholder servicing costs—Note 3(c) | | | 1,338 | |
Distribution fees—Note 3(b) | | | 187 | |
Miscellaneous | | | 19,968 | |
Total Expenses | | | 223,499 | |
Less—reduction in fees due to earnings credits—Note 3(c) | | | (1) | |
Net Expenses | | | 223,498 | |
Investment Income—Net | | | 15,396,721 | |
Realized and Unrealized Gain (Loss) on Investments—Note 4 ($): | | |
Net realized gain (loss) on investments: | | |
Unaffiliated issuers | | | (39,278) | |
Affiliated issuers | | | (1,887,247) | |
Capital gain distributions from affiliated issuers | | | 115,291 | |
Net Realized Gain (Loss) | | | (1,811,234) | |
Net unrealized appreciation (depreciation) on investments: | | | | |
Unaffiliated issuers | | | (1,458,965) | |
Affiliated issuers | | | (10,815,554) | |
Net Unrealized Appreciation (Depreciation) | | | (12,274,519) | |
Net Realized and Unrealized Gain (Loss) on Investments | | | (14,085,753) | |
Net Increase in Net Assets Resulting from Operations | | 1,310,968 | |
See notes to financial statements.
11
STATEMENT OF CHANGES IN NET ASSETS
| | | | | | | | | | |
| | | | | | | | | | |
| | | | Year Ended October 31, |
| | | | 2015 | | | | 2014 | a |
Operations ($): | | | | | | | | |
Investment income—net | | | 15,396,721 | | | | 5,571,327 | |
Net realized gain (loss) on investments | | (1,811,234) | | | | (651,143) | |
Net unrealized appreciation (depreciation)
on investments | | (12,274,519) | | | | 1,258,976 | |
Net Increase (Decrease) in Net Assets
Resulting from Operations | 1,310,968 | | | | 6,179,160 | |
Dividends to Shareholders from ($): | | | | | | | | |
Investment income—net: | | | | | | | | |
Class A | | | (9,722) | | | | (429) | |
Class C | | | (718) | | | | (322) | |
Class I | | | (13,090) | | | | (490) | |
Class Y | | | (14,951,061) | | | | (4,706,508) | |
Total Dividends | | | (14,974,591) | | | | (4,707,749) | |
Capital Stock Transactions ($): | | | | | | | | |
Net proceeds from shares sold: | | | | | | | | |
Class A | | | 525,000 | | | | 27,000 | |
Class C | | | - | | | | 25,000 | |
Class I | | | 1,030,666 | | | | 192,218 | |
Class Y | | | 157,807,930 | | | | 344,631,984 | |
Dividends reinvested: | | | | | | | | |
Class A | | | 8,575 | | | | 11 | |
Class I | | | 5,666 | | | | 46 | |
Class Y | | | 1,606,608 | | | | 347,469 | |
Cost of shares redeemed: | | | | | | | | |
Class A | | | (2,012) | | | | - | |
Class I | | | (964,774) | | | | - | |
Class Y | | | (68,230,098) | | | | (14,923,752) | |
Increase (Decrease) in Net Assets
from Capital Stock Transactions | 91,787,561 | | | | 330,299,976 | |
Total Increase (Decrease) in Net Assets | 78,123,938 | | | | 331,771,387 | |
Net Assets ($): | | | | | | | | |
Beginning of Period | | | 331,771,387 | | | | - | |
End of Period | | | 409,895,325 | | | | 331,771,387 | |
Undistributed investment income—net | 1,349,849 | | | | 874,806 | |
12
| | | | | | | | | | |
| | | | | | | | | | |
| | | | Year Ended October 31, |
| | | | 2015 | | | | 2014 | a |
Capital Share Transactions: | | | | | | | | |
Class A | | | | | | | | |
Shares sold | | | 41,844 | | | | 2,157 | |
Shares issued for dividends reinvested | | | 696 | | | | 1 | |
Shares redeemed | | | (160) | | | | - | |
Net Increase (Decrease) in Shares Outstanding | 42,380 | | | | 2,158 | |
Class C | | | | | | | | |
Shares sold | | | - | | | | 2,000 | |
Class I | | | | | | | | |
Shares sold | | | 83,157 | | | | 15,222 | |
Shares issued for dividends reinvested | | | 455 | | | | 4 | |
Shares redeemed | | | (78,370) | | | | - | |
Net Increase (Decrease) in Shares Outstanding | 5,242 | | | | 15,226 | |
Class Y | | | | | | | | |
Shares sold | | | 12,659,959 | | | | 27,354,036 | |
Shares issued for dividends reinvested | | | 129,262 | | | | 27,515 | |
Shares redeemed | | | (5,490,173) | | | | (1,179,690) | |
Net Increase (Decrease) in Shares Outstanding | 7,299,048 | | | | 26,201,861 | |
| | | | | | | | | | |
a | From March 7, 2014 (commencement of operations) to October 31, 2014. | |
See notes to financial statements.
13
FINANCIAL HIGHLIGHTS
The following tables describe the performance for each share class for the fiscal periods indicated. All information (except portfolio turnover rate) reflects financial results for a single fund share. Total return shows how much your investment in the fund would have increased (or decreased) during each period, assuming you had reinvested all dividends and distributions. These figures have been derived from the fund’s financial statements.
| | | | | | | | | | | |
| | | | | | |
| | | Year Ended October 31, |
Class A Shares | | | | | | 2015 | 2014 | a |
Per Share Data ($): | | | | | | | |
Net asset value, beginning of period | | | | | | 12.65 | 12.50 | |
Investment Operations: | | | | | | | |
Investment income—netb | | | | | | .49 | .26 | |
Net realized and unrealized
gain (loss) on investments | | | | | | (.48) | .10 | |
Total from Investment Operations | | | | | | .01 | .36 | |
Distributions: | | | | | | | |
Dividends from investment income—net | | | | | | (.45) | (.21) | |
Net asset value, end of period | | | | | | 12.21 | 12.65 | |
Total Return (%)c | | | | | | .10 | 2.89 | d |
Ratios/Supplemental Data (%): | | | | | | |
Ratio of total expenses
to average net assetse | | | | | | .33 | .91 | f |
Ratio of net expenses
to average net assetse | | | | | | .33 | .43 | f |
Ratio of net investment income
to average net assetse | | | | | | 3.88 | 3.18 | f |
Portfolio Turnover Rate | | | | | | 17.13 | 14.04 | d |
Net Assets, end of period ($ x 1,000) | | | | | | 544 | 27 | |
a From March 7, 2014 (commencement of operations) to October 31, 2014.
b Based on average shares outstanding.
c Exclusive of sales charge.
d Not annualized.
e Amount does not include the expenses of the underlying funds.
f Annualized.
See notes to financial statements.
14
| | | | | | | | | | | |
| | | | | | |
| | | Year Ended October 31, |
Class C Shares | | | | | | 2015 | 2014 | a |
Per Share Data ($): | | | | | | | |
Net asset value, beginning of period | | | | | | 12.63 | 12.50 | |
Investment Operations: | | | | | | | |
Investment income—netb | | | | | | .37 | .20 | |
Net realized and unrealized
gain (loss) on investments | | | | | | (.45) | .09 | |
Total from Investment Operations | | | | | | (.08) | .29 | |
Distributions: | | | | | | | |
Dividends from investment income—net | | | | | | (.36) | (.16) | |
Net asset value, end of period | | | | | | 12.19 | 12.63 | |
Total Return (%)c | | | | | | (.66) | 2.34 | d |
Ratios/Supplemental Data (%): | | | | | | |
Ratio of total expenses
to average net assetse | | | | | | 1.13 | 1.65 | f |
Ratio of net expenses
to average net assetse | | | | | | 1.13 | 1.16 | f |
Ratio of net investment income
to average net assetse | | | | | | 2.96 | 2.43 | f |
Portfolio Turnover Rate | | | | | | 17.13 | 14.04 | d |
Net Assets, end of period ($ x 1,000) | | | | | | 24 | 25 | |
a From March 7, 2014 (commencement of operations) to October 31, 2014.
b Based on average shares outstanding.
c Exclusive of sales charge.
d Not annualized.
e Amount does not include the expenses of the underlying funds.
f Annualized.
See notes to financial statements.
15
FINANCIAL HIGHLIGHTS (continued)
| | | | | | | | | | | | |
| | | | | |
| | | Year Ended October 31, |
Class I Shares | | | | | | 2015 | 2014 | a |
Per Share Data ($): | | | | | | | |
Net asset value, beginning of period | | | | | | 12.66 | 12.50 | |
Investment Operations: | | | | | | | |
Investment income—netb | | | | | | .50 | .23 | |
Net realized and unrealized
gain (loss) on investments | | | | | | (.46) | .15 | |
Total from Investment Operations | | | | | | .04 | .38 | |
Distributions: | | | | | | | |
Dividends from investment income—net | | | | | | (.48) | (.22) | |
Net asset value, end of period | | | | | | 12.22 | 12.66 | |
Total Return (%) | | | | | | .33 | 3.08 | c |
Ratios/Supplemental Data (%): | | | | | | |
Ratio of total expenses
to average net assetsd | | | | | | .15 | .54 | e |
Ratio of net expenses
to average net assetsd | | | | | | .15 | .15 | e |
Ratio of net investment income
to average net assetsd | | | | | | 4.05 | 3.85 | e |
Portfolio Turnover Rate | | | | | | 17.13 | 14.04 | c |
Net Assets, end of period ($ x 1,000) | | | | | | 250 | 193 | |
a From March 7, 2014 (commencement of operations) to October 31, 2014.
b Based on average shares outstanding.
c Not annualized.
d Amount does not include the expenses of the underlying funds.
e Annualized.
See notes to financial statements.
16
| | | | |
| | | |
| | Year Ended October 31, |
Class Y Shares | 2015 | 2014 | a |
Per Share Data ($): | | | |
Net asset value, beginning of period | 12.65 | 12.50 | |
Investment Operations: | | | |
Investment income—netb | .51 | .29 | |
Net realized and unrealized gain (loss) on investments | (.46) | .09 | |
Total from Investment Operations | .05 | .38 | |
Distributions: | | | |
Dividends from investment income—net | (.49) | (.23) | |
Net asset value, end of period | 12.21 | 12.65 | |
Total Return (%) | .42 | 3.02 | c |
Ratios/Supplemental Data (%): | | | |
Ratio of total expenses to average net assetsd | .06 | .13 | e |
Ratio of net expenses to average net assetsd | .06 | .10 | e |
Ratio of net investment income to average net assetsd | 4.05 | 3.67 | e |
Portfolio Turnover Rate | 17.13 | 14.04 | c |
Net Assets, end of period ($ x 1,000) | 409,077 | 331,526 | |
a From March 7, 2014 (commencement of operations) to October 31, 2014.
b Based on average shares outstanding.
c Not annualized.
d Amount does not include the expenses of the underlying funds.
e Annualized.
See notes to financial statements.
17
NOTES TO FINANCIAL STATEMENTS
NOTE 1—Significant Accounting Policies:
Dreyfus Yield Enhancement Strategy Fund (the “fund”) is a separate diversified series of Dreyfus BNY Mellon Funds, Inc. (the “Company”), which is registered under the Investment Company Act of 1940, as amended (the “Act”), as an open-end management investment company and operates as a series company currently offering five series, including the fund. The fund’s investment objective is to seek high current income. The Dreyfus Corporation (the “Manager” or “Dreyfus”), a wholly-owned subsidiary of The Bank of New York Mellon Corporation (“BNY Mellon”), serves as the fund’s investment adviser.
MBSC Securities Corporation (the “Distributor”), a wholly-owned subsidiary of Dreyfus, is the distributor of the fund’s shares. The fund is authorized to issue 100 million shares of $.001 par value Common Stock in each of the following classes of shares: Class A, Class C, Class I and Class Y. Class A and Class C shares are sold primarily to retail investors through financial intermediaries and bear Distribution and/or Shareholder Services Plan fees. Class A shares generally are subject to a sales charge imposed at the time of purchase. Class C shares are subject to a contingent deferred sales charge (“CDSC”) imposed on Class C shares redeemed within one year of purchase. Class I shares are sold primarily to bank trust departments and other financial service providers (including The Bank of New York Mellon, a subsidiary of BNY Mellon and an affiliate of Dreyfus, and its affiliates), acting on behalf of customers having a qualified trust or an investment account or relationship at such institution, and bear no Distribution or Shareholder Services Plan fees. Class Y shares are sold at net asset value per share generally to institutional investors, and bear no Distribution or Shareholder Services Plan fees. Class I and Class Y shares are offered without a front-end sales charge or CDSC. Other differences between the classes include the services offered to and the expenses borne by each class, the allocation of certain transfer agency costs, and certain voting rights. Income, expenses (other than expenses attributable to a specific class), and realized and unrealized gains or losses on investments are allocated to each class of shares based on its relative net assets.
As of October 31, 2015, MBC Investments Corp., an indirect subsidiary of BNY Mellon, held 2,000 Class A, all of the outstanding Class C and 2,000 Class I of the fund.
The Company accounts separately for the assets, liabilities and operations of each series. Expenses directly attributable to each series are charged to
18
that series’ operations; expenses which are applicable to all series are allocated among them on a pro rata basis.
The Financial Accounting Standards Board (“FASB”) Accounting Standards Codification (“ASC”) is the exclusive reference of authoritative U.S. generally accepted accounting principles (“GAAP”) recognized by the FASB to be applied by nongovernmental entities. Rules and interpretive releases of the Securities and Exchange Commission (“SEC”) under authority of federal laws are also sources of authoritative GAAP for SEC registrants. The fund’s financial statements are prepared in accordance with GAAP, which may require the use of management estimates and assumptions. Actual results could differ from those estimates.
(a) Portfolio valuation: The fair value of a financial instrument is the amount that would be received to sell an asset or paid to transfer a liability in an orderly transaction between market participants at the measurement date (i.e., the exit price). GAAP establishes a fair value hierarchy that prioritizes the inputs of valuation techniques used to measure fair value. This hierarchy gives the highest priority to unadjusted quoted prices in active markets for identical assets or liabilities (Level 1 measurements) and the lowest priority to unobservable inputs (Level 3 measurements).
Additionally, GAAP provides guidance on determining whether the volume and activity in a market has decreased significantly and whether such a decrease in activity results in transactions that are not orderly. GAAP requires enhanced disclosures around valuation inputs and techniques used during annual and interim periods.
Various inputs are used in determining the value of the fund’s investments relating to fair value measurements. These inputs are summarized in the three broad levels listed below:
Level 1—unadjusted quoted prices in active markets for identical investments.
Level 2—other significant observable inputs (including quoted prices for similar investments, interest rates, prepayment speeds, credit risk, etc.).
Level 3—significant unobservable inputs (including the fund’s own assumptions in determining the fair value of investments).
The inputs or methodology used for valuing securities are not necessarily an indication of the risk associated with investing in those securities.
Investments are valued at the net asset value of each underlying fund determined as of the close of the New York Stock Exchange (generally 4
19
NOTES TO FINANCIAL STATEMENTS (continued)
p.m., Eastern time) on the valuation date and are generally categorized within Level 1 of the fair value hierarchy.
The following is a summary of the inputs used as of October 31, 2015 in valuing the fund’s investments:
| | | | | | |
Assets ($) | Level 1 - Unadjusted Quoted Prices | Level 2 - Other Significant Observable Inputs | | Level 3 - Significant Unobservable Inputs | Total |
Investments in Securities: | | | |
Mutual Funds† | 405,883,199 | - | | — | 405,883,199 |
† See Statement of Investments for additional detailed categorizations.
At October 31, 2015, there were no transfers between Level 1, Level 2 and Level 3 of the fair value hierarchy.
(b) Securities transactions and investment income: Securities transactions are recorded on a trade date basis. Realized gains and losses from securities transactions are recorded on the identified cost basis. Dividend income is recognized on the ex-dividend date and interest income, including, where applicable, accretion of discount and amortization of premium on investments, is recognized on the accrual basis.
(c) Affiliated issuers: Investments in other investment companies advised by Dreyfus are defined as “affiliated” under the Act. Investments in affiliated investment companies during the period ended October 31, 2015 were as follows:
| | | | | | |
Affiliated Investment Company | Value 10/31/2014 ($) | Purchases ($) | † | Sales ($) | Net Realized Gain (Loss) ($) |
BNY Mellon Corporate Bond Fund, Cl. M | 92,426,696 | 22,500,808 | | 27,516,208 | (345,819) |
BNY Mellon Municipal Opportunities Fund, Cl. M | 93,919,015 | 26,025,394 | | 2,919,483 | (25,277) |
Dreyfus Global Dynamic Bond Fund, Cl. Y | — | 12,985,765 | | 34,760 | (458) |
Dreyfus Emerging Markets Debt Local Currency Fund, Cl. Y | — | 6,000,000 | | 5,358,005 | (641,995) |
Dreyfus Floating Rate Income Fund, Cl. Y | 55,650,394 | 19,334,956 | | 11,557,281 | (303,346) |
20
| | | | | | |
Affiliated Investment Company | Value 10/31/2014 ($) | Purchases ($) | † | Sales ($) | Net Realized Gain (Loss) ($) |
Dreyfus High Yield Fund, Cl. I | 46,093,972 | 65,170,894 | | 2,329,183 | (126,273) |
Dreyfus Inflation Adjusted Securities Fund, Cl. Y | 12,881,304 | 414,872 | | 13,099,035 | (442,298) |
Dreyfus Opportunistic Fixed Income Fund, Cl. Y | — | 13,063,087 | | 34,760 | (1,781) |
Total | 300,971,381 | 165,495,776 | | 62,848,715 | (1,887,247) |
| | | | | |
Affiliated Investment Company | Change in Net Unrealized Appreciation (Depreciation) ($) | Value 10/31/2015 ($) | Net Assets (%) | Dividends/ Distributions ($) |
BNY Mellon Corporate Bond Fund, Cl. M | (1,672,362) | 85,393,115 | 20.9 | 2,951,810 |
BNY Mellon Municipal Opportunities Fund, Cl. M | (1,283,244) | 115,716,405 | 28.2 | 3,732,425 |
Dreyfus Global Dynamic Bond Fund Cl. Y | (117,846) | 12,832,701 | 3.1 | 49,385 |
Dreyfus Emerging Markets Debt Local Currency Fund, Cl. Y | — | — | — | — |
Dreyfus Floating Rate Income Fund, Cl. Y | (1,651,612) | 61,473,111 | 15.0 | 2,399,636 |
Dreyfus High Yield Fund, Cl. I | (5,771,356) | 103,038,054 | 25.1 | 5,731,514 |
Dreyfus Inflation Adjusted Securities Fund, Cl. Y | 245,157 | — | — | 11,208 |
Dreyfus Opportunistic Fixed Income Fund, Cl. Y | (564,291) | 12,462,255 | 3.1 | 126,707 |
Total | (10,815,554) | 390,915,641 | 95.4 | 15,002,685 |
† Includes reinvested dividends/distributions.
(d) Dividends to shareholders: Dividends are recorded on the ex-dividend date. Dividends from investment income-net are normally declared and paid on a monthly basis. Dividends from net realized capital gains, if any, are normally declared and paid annually, but the fund may make distributions on a more frequent basis to comply with the distribution requirements of the Internal Revenue Code of 1986, as amended (the “Code”). To the extent that net realized capital gains can be
21
NOTES TO FINANCIAL STATEMENTS (continued)
offset by capital loss carryovers, it is the policy of the fund not to distribute such gains. Income and capital gain distributions are determined in accordance with income tax regulations, which may differ from GAAP.
(e) Federal income taxes: It is the policy of the fund to continue to qualify as a regulated investment company, if such qualification is in the best interests of its shareholders, by complying with the applicable provisions of the Code, and to make distributions of taxable income sufficient to relieve it from substantially all federal income and excise taxes.
As of and during the period ended October 31, 2015, the fund did not have any liabilities for any uncertain tax positions. The fund recognizes interest and penalties, if any, related to uncertain tax positions as income tax expense in the Statement of Operations. During the period ended October 31, 2015, the fund did not incur any interest or penalties.
Each tax year in the two-year period ended October 31, 2015 remains subject to examination by the Internal Revenue Service and state taxing authorities.
At October 31, 2015, the components of accumulated earnings on a tax basis were as follows: undistributed ordinary income $1,349,849, accumulated capital losses $1,932,572 and unrealized depreciation $11,598,261.
Under the Regulated Investment Company Modernization Act of 2010, the fund is permitted to carry forward capital losses for an unlimited period. Furthermore, capital loss carryovers retain their character as either short-term or long-term capital losses.
The accumulated capital loss carryover is available for federal income tax purposes to be applied against future net realized capital gains, if any, realized subsequent to October 31, 2015. The fund has $1,932,572 of short-term capital losses which can be carried forward for an unlimited period.
The tax character of distributions paid to shareholders during the fiscal periods ended October 31, 2015 and October 31, 2014 were as follows: ordinary income $11,295,569 and $3,276,122, and tax-exempt income $3,679,022 and $1,431,627, respectively.
During the period ended October 31, 2015, as a result of permanent book to tax differences, primarily due to the tax treatment for short-term capital gain distributions from regulated investment company holdings, the fund increased accumulated undistributed investment income-net by $52,913 and decreased accumulated net realized gain (loss) on investments by the
22
same amount. Net assets and net asset value per share were not affected by this reclassification.
NOTE 2—Bank Lines of Credit:
The fund participates with other Dreyfus-managed funds in a $480 million unsecured credit facility led by Citibank, N.A. and a $300 million unsecured credit facility provided by The Bank of New York Mellon (each, a “Facility”), each to be utilized primarily for temporary or emergency purposes, including the financing of redemptions. Prior to October 7, 2015, the unsecured credit facility with Citibank, N.A. was $430 million. In connection therewith, the fund has agreed to pay its pro rata portion of commitment fees for each Facility. Interest is charged to the fund based on rates determined pursuant to the terms of the respective Facility at the time of borrowing. During the period ended October 31, 2015, the fund did not borrow under the Facilities.
NOTE 3—Management Fee and Other Transactions with Affiliates:
(a) Pursuant to a management agreement with Dreyfus, there is no management fee paid to Dreyfus. The fund invests in other affiliated mutual funds advised by Dreyfus. All fees and expenses of the underlying funds are reflected in the underlying fund’s net asset value. Dreyfus has contractually agreed, from November 1, 2014 through March 1, 2016, to assume the direct expenses of the fund so that the expenses of none of the classes (excluding Rule 12b-1 Distribution Plan fees, Shareholder Services Plan fees, acquired fund fees and expenses incurred by underlying funds, taxes, interest expense, brokerage commissions, commitment fees on borrowings and extraordinary expenses) exceed .30% of the value of the fund’s average daily net assets. At October 31, 2015, there was no reduction in management fee, pursuant to the undertaking.
(b) Under the Distribution Plan adopted pursuant to Rule 12b-1 under the Act, Class C shares pay the Distributor for distributing its shares at an annual rate of .75% of the value of its average daily net assets. During the period ended October 31, 2015, Class C shares were charged $187 pursuant to the Distribution Plan.
(c) Under the Shareholder Services Plan, Class A and Class C shares pay the Distributor at an annual rate of .25% of the value of their average daily net assets for the provision of certain services. The services provided may include personal services relating to shareholder accounts, such as answering shareholder inquiries regarding the fund and providing reports and other information, and services related to the maintenance of shareholder accounts. The Distributor may make payments to Service
23
NOTES TO FINANCIAL STATEMENTS (continued)
Agents (securities dealers, financial institutions or other industry professionals) with respect to these services. The Distributor determines the amounts to be paid to Service Agents. During the period ended October 31, 2015, Class A and Class C shares were charged $713 and $62, respectively, pursuant to the Shareholder Services Plan.
Under its terms, the Distribution Plan and Shareholder Services Plan shall remain in effect from year to year, provided such continuance is approved annually by a vote of a majority of those Directors who are not “interested persons” of the Company and who have no direct or indirect financial interest in the operation of or in any agreement related to the Distribution Plan or Shareholder Services Plan.
The fund has arrangements with the transfer agent and the custodian whereby the fund may receive earnings credits when positive cash balances are maintained, which are used to offset transfer agency and custody fees. For financial reporting purposes, the fund includes net earnings credits as an expense offset in the Statement of Operations.
The fund compensates Dreyfus Transfer, Inc., a wholly-owned subsidiary of Dreyfus, under a transfer agency agreement for providing transfer agency and cash management services for the fund. The majority of transfer agency fees are comprised of amounts paid on a per account basis, while cash management fees are related to fund subscriptions and redemptions. During the period ended October 31, 2015, the fund was charged $523 for transfer agency services and $20 for cash management services. These fees are included in Shareholder servicing costs in the Statement of Operations. Cash management fees were partially offset by earnings credits of $1.
The fund compensates The Bank of New York Mellon under a custody agreement for providing custodial services for the fund. These fees are determined based on net assets, geographic region and transaction activity. During the period ended October 31, 2015, the fund was charged $3,304 pursuant to the custody agreement.
During the period ended October 31, 2015, the fund was charged $11,159 for services performed by the Chief Compliance Officer and his staff.
The components of “Due to The Dreyfus Corporation and affiliates” in the Statement of Assets and Liabilities consist of: Distribution Plan fees $15, Shareholder Services Plan fees $120, custodian fees $2,750, Chief Compliance Officer fees $882 and transfer agency fees $105.
24
(d) Each Board member also serves as a Board member of other funds within the Dreyfus complex. Annual retainer fees and attendance fees are allocated to each fund based on net assets.
NOTE 4—Securities Transactions:
The aggregate amount of purchases and sales of investment securities, excluding short-term securities and forward contracts, during the period ended October 31, 2015, amounted to $169,375,808 and $63,261,803, respectively.
At October 31, 2015, the cost of investments for federal income tax purposes was $417,481,460; accordingly, accumulated net unrealized depreciation on investments was $11,598,261, consisting of $1,140,729 gross unrealized appreciation and $12,738,990 gross unrealized depreciation.
25
REPORT OF INDEPENDENT REGISTERED
PUBLIC ACCOUNTING FIRM
The Board of Trustees and Shareholders of
Dreyfus BNY Mellon Funds, Inc.
We have audited the accompanying statement of assets and liabilities of Dreyfus Yield Enhancement Strategy Fund (the “Fund”), a series of Dreyfus BNY Mellon Funds, Inc., including the statement of investments, as of October 31, 2015, and the related statement of operations for the year then ended, the statements of changes in net assets, and the financial highlights for each of the year or period in the two-year period then ended. These financial statements and financial highlights are the responsibility of the Fund’s management. Our responsibility is to express an opinion on these financial statements and financial highlights based on our audits.
We conducted our audits in accordance with the standards of the Public Company Accounting Oversight Board (United States). Those standards require that we plan and perform the audit to obtain reasonable assurance about whether the financial statements and financial highlights are free of material misstatement. An audit includes examining, on a test basis, evidence supporting the amounts and disclosures in the financial statements. Our procedures included confirmation of securities owned as of October 31, 2015, by correspondence with the custodian and brokers or by other appropriate auditing procedures. An audit also includes assessing the accounting principles used and significant estimates made by management, as well as evaluating the overall financial statement presentation. We believe that our audits provide a reasonable basis for our opinion.
In our opinion, the financial statements and financial highlights referred to above present fairly, in all material respects, the financial position of Dreyfus Yield Enhancement Strategy Fund as of October 31, 2015, and the results of its operations for the year then ended, the changes in its net assets, and the financial highlights for each of the year or period in the two-year period then ended, in conformity with U.S. generally accepted accounting principles.

New York, New York
December 30, 2015
26
IMPORTANT TAX INFORMATION (Unaudited)
For federal tax purposes, the fund reports the maximum amount allowable, but not less than $11,295,569 as ordinary income dividends paid during the year ended October 31, 2015 as qualified dividend income in accordance with Section 854(b)(1)(B) of the Internal Revenue Code. Also, the fund reports the maximum amount allowable but not less than 99.98% of ordinary income dividends paid during the year ended October 31, 2015 as eligible for the corporate dividends received deduction provided under Section 243 of the Internal Revenue Code in accordance with Section 854(b)(1)(A) of the Internal Revenue Code. Shareholders will receive notification in early 2016 of the percentage applicable to the preparation of their 2015 income tax returns. Also, in accordance with federal tax law, the fund hereby reports $3,679,022 as “exempt-interest dividends paid” during its fiscal year ended October 31, 2015. Where required by federal tax law rules, shareholders will receive notification of their portion of the fund’s tax-exempt dividends paid for the 2015 calendar year on Form 1099-DIV, which will be mailed in early 2016.
27
BOARD MEMBERS INFORMATION (Unaudited)
INDEPENDENT BOARD MEMBERS
Joseph S. DiMartino (72)
Chairman of the Board (1999)
Principal Occupation During Past 5 Years:
· Corporate Director and Trustee (1995-present)
Other Public Company Board Memberships During Past 5 Years:
· CBIZ (formerly, Century Business Services, Inc.), a provider of outsourcing functions for small and medium size companies, Director (1997-present)
· The Newark Group, a provider of a national market of paper recovery facilities, paperboard mills and paperboard converting plants, Director (2000-2010)
No. of Portfolios for which Board Member Serves: 140
———————
Francine J. Bovich (64)
Board Member (2012)
Principal Occupation During Past 5 Years:
· Trustee, The Bradley Trusts, private trust funds (2011-present)
· Managing Director, Morgan Stanley Investment Management (1993-2010)
Other Public Company Board Memberships During Past 5 Years:
· Annaly Capital Management, Inc., Board Member (May 2014-present)
No. of Portfolios for which Board Member Serves: 79
———————
Kenneth A. Himmel (69)
Board Member (1994)
Principal Occupation During Past 5 Years:
· Managing Partner, Gulf Related, an international real estate development company (2010-present)
· President and CEO, Related Urban Development, a real estate development company (1996-present)
· President and CEO, Himmel & Company, a real estate development company (1980-present)
· CEO, American Food Management, a restaurant company (1983-present)
No. of Portfolios for which Board Member Serves: 29
———————
28
Stephen J. Lockwood (68)
Board Member (1994)
Principal Occupation During Past 5 Years:
· Chairman of the Board, Stephen J. Lockwood and Company LLC, a real estate investment company (2000-present)
No. of Portfolios for which Board Member Serves: 29
———————
Roslyn M. Watson (66)
Board Member (1994)
Principal Occupation During Past 5 Years:
· Principal, Watson Ventures, Inc., a real estate investment company (1993-present)
No. of Portfolios for which Board Member Serves: 65
———————
Benaree Pratt Wiley (69)
Board Member (1998)
Principal Occupation During Past 5 Years:
· Principal, The Wiley Group, a firm specializing in strategy and business development (2005-present)
Other Public Company Board Memberships During Past 5 Years:
· CBIZ (formerly, Century Business Services, Inc.), a provider of outsourcing functions for small and medium size companies, Director (2008-present)
No. of Portfolios for which Board Member Serves: 65
———————
Once elected all Board Members serve for an indefinite term, but achieve Emeritus status upon reaching age 80. The address of the Board Members and Officers is c/o The Dreyfus Corporation, 200 Park Avenue, New York, New York 10166. Additional information about the Board Members is available in the fund’s Statement of Additional Information which can be obtained from Dreyfus free of charge by calling this toll free number: 1-800-DREYFUS.
James M. Fitzgibbons, Emeritus Board Member
29
OFFICERS OF THE FUND (Unaudited)
BRADLEY J. SKAPYAK, President since January 2010.
Chief Operating Officer and a director of the Manager since June 2009, Chairman of Dreyfus Transfer, Inc., an affiliate of the Manager and the transfer agent of the funds, since May 2011 and Executive Vice President of the Distributor since June 2007. From April 2003 to June 2009, Mr. Skapyak was the head of the Investment Accounting and Support Department of the Manager. He is an officer of 66 investment companies (comprised of 140 portfolios) managed by the Manager. He is 56 years old and has been an employee of the Manager since February 1988.
BENNETT A. MACDOUGALL, Chief Legal Officer since October 2015
Chief Legal Officer of the Manager since June 2015; from June 2005 to June 2015, Director and Associate General Counsel of Deutsche Bank – Asset & Wealth Management Division, and Chief Legal Officer of Deutsche Investment Management Americas Inc. He is an officer of 67 investment companies (comprised of 165 portfolios) managed by the Manager. He is 44 years old and has been an employee of the Manager since June 2015.
JANETTE E. FARRAGHER, Vice President and Secretary since December 2011.
Assistant General Counsel of BNY Mellon, and an officer of 67 investment companies (comprised of 165 portfolios) managed by the Manager. She is 52 years old and has been an employee of the Manager since February 1984.
JAMES BITETTO, Vice President and Assistant Secretary since August 2005.
Managing Counsel of BNY Mellon and Secretary of the Manager, and an officer of 67 investment companies (comprised of 165 portfolios) managed by the Manager. He is 49 years old and has been an employee of the Manager since December 1996.
JONI LACKS CHARATAN, Vice President and Assistant Secretary since August 2005.
Managing Counsel of BNY Mellon, and an officer of 67 investment companies (comprised of 165 portfolios) managed by the Manager. She is 59 years old and has been an employee of the Manager since October 1988.
JOSEPH M. CHIOFFI, Vice President and Assistant Secretary since August 2005.
Managing Counsel of BNY Mellon, and an officer of 67 investment companies (comprised of 165 portfolios) managed by the Manager. He is 53 years old and has been an employee of the Manager since June 2000.
JOHN B. HAMMALIAN, Vice President and Assistant Secretary since August 2005.
Senior Managing Counsel of BNY Mellon, and an officer of 67 investment companies (comprised of 165 portfolios) managed by the Manager. He is 52 years old and has been an employee of the Manager since February 1991.
MAUREEN E. KANE, Vice President and Assistant Secretary since April 2015.
Managing Counsel of BNY Mellon since July 2014; from October 2004 until July 2014, General Counsel, and from May 2009 until July 2014, Chief Compliance Officer of Century Capital Management. She is an officer of 67 investment companies (comprised of 165 portfolios) managed by the Manager. She is 53 years old and has been an employee of the Manager since July 2014.
SARAH S. KELLEHER, Vice President and Assistant Secretary since April 2014.
Senior Counsel of BNY Mellon, and an officer of 67 investment companies (comprised of 165 portfolios) managed by the Manager; from August 2005 to March 2013, Associate General Counsel of Third Avenue Management. She is 40 years old and has been an employee of the Manager since March 2013.
JEFF PRUSNOFSKY, Vice President and Assistant Secretary since August 2005.
Senior Managing Counsel of BNY Mellon, and an officer of 67 investment companies (comprised of 165 portfolios) managed by the Manager. He is 50 years old and has been an employee of the Manager since October 1990.
JAMES WINDELS, Treasurer since November 2001.
Director – Mutual Fund Accounting of the Manager, and an officer of 67 investment companies (comprised of 165 portfolios) managed by the Manager. He is 57 years old and has been an employee of the Manager since April 1985.
30
RICHARD CASSARO, Assistant Treasurer since January 2008.
Senior Accounting Manager – Money Market and Municipal Bond Funds of the Manager, and an officer of 67 investment companies (comprised of 165 portfolios) managed by the Manager. He is 56 years old and has been an employee of the Manager since September 1982.
GAVIN C. REILLY, Assistant Treasurer since December 2005.
Tax Manager of the Investment Accounting and Support Department of the Manager, and an officer of 67 investment companies (comprised of 165 portfolios) managed by the Manager. He is 47 years old and has been an employee of the Manager since April 1991.
ROBERT S. ROBOL, Assistant Treasurer since December 2002.
Senior Accounting Manager – Fixed Income Funds of the Manager, and an officer of 67 investment companies (comprised of 165 portfolios) managed by the Manager. He is 51 years old and has been an employee of the Manager since October 1988.
ROBERT SALVIOLO, Assistant Treasurer since July 2007.
Senior Accounting Manager – Equity Funds of the Manager, and an officer of 67 investment companies (comprised of 165 portfolios) managed by the Manager. He is 48 years old and has been an employee of the Manager since June 1989.
ROBERT SVAGNA, Assistant Treasurer since July 2007.
Senior Accounting Manager – Equity Funds of the Manager, and an officer of 67 investment companies (comprised of 165 portfolios) managed by the Manager. He is 48 years old and has been an employee of the Manager since November 1990.
JOSEPH W. CONNOLLY, Chief Compliance Officer since October 2004.
Chief Compliance Officer of the Manager and The Dreyfus Family of Funds (67 investment companies, comprised of 165 portfolios). He is 58 years old and has served in various capacities with the Manager since 1980, including manager of the firm’s Fund Accounting Department from 1997 through October 2001.
31
NOTES
32
NOTES
33
Dreyfus Yield Enhancement Strategy Fund
200 Park Avenue
New York, NY 10166
Manager
The Dreyfus Corporation
200 Park Avenue
New York, NY 10166
Custodian
The Bank of New York Mellon
225 Liberty Street
New York, NY 10286
Transfer Agent &
Dividend Disbursing Agent
Dreyfus Transfer, Inc.
200 Park Avenue
New York, NY 10166
Distributor
MBSC Securities Corporation
200 Park Avenue
New York, NY 10166
| | |
Ticker Symbols: | Class A: DABMX Class C: DABLX Class I: DABKX Class Y: DABJX |
Telephone Call your financial representative or 1-800-DREYFUS
Mail The Dreyfus Family of Funds, 144 Glenn Curtiss Boulevard, Uniondale, NY 11556-0144
E-mail Send your request to info@dreyfus.com
Internet Information can be viewed online or downloaded at www.dreyfus.com
The fund files its complete schedule of portfolio holdings with the Securities and Exchange Commission (“SEC”) for the first and third quarters of each fiscal year on Form N-Q. The fund’s Forms N-Q are available on the SEC’s website at www.sec.gov and may be reviewed and copied at the SEC’s Public Reference Room in Washington, DC. (phone 1-800-SEC-0330 for information).
A description of the policies and procedures that the fund uses to determine how to vote proxies relating to portfolio securities and information regarding how the fund voted these proxies for the most recent 12-month period ended June 30 is available at www.dreyfus.com and on the SEC’s website at www.sec.gov and without charge, upon request, by calling 1-800-DREYFUS.
| | |
© 2015 MBSC Securities Corporation
6327AR1015 | 
|
Item 2. Code of Ethics.
The Registrant has adopted a code of ethics that applies to the Registrant's principal executive officer, principal financial officer, principal accounting officer or controller, or persons performing similar functions. There have been no amendments to, or waivers in connection with, the Code of Ethics during the period covered by this Report.
Item 3. Audit Committee Financial Expert.
The Registrant's Board has determined that Joseph S. DiMartino, a member of the Audit Committee of the Board, is an audit committee financial expert as defined by the Securities and Exchange Commission (the "SEC"). Mr. DiMartino is "independent" as defined by the SEC for purposes of audit committee financial expert determinations.
Item 4. Principal Accountant Fees and Services.
(a) Audit Fees. The aggregate fees billed for each of the last two fiscal years (the "Reporting Periods") for professional services rendered by the Registrant's principal accountant (the "Auditor") for the audit of the Registrant's annual financial statements or services that are normally provided by the Auditor in connection with the statutory and regulatory filings or engagements for the Reporting Periods, were $150,150 in 2014 and $162,350 in 2015.
(b) Audit-Related Fees. The aggregate fees billed in the Reporting Periods for assurance and related services by the Auditor that are reasonably related to the performance of the audit of the Registrant's financial statements and are not reported under paragraph (a) of this Item 4 were $0 in 2014 and $19,200 in 2015. These services consisted of one or more of the following: (i) agreed upon procedures related to compliance with Internal Revenue Code section 817(h), (ii) security counts required by Rule 17f-2 under the Investment Company Act of 1940, as amended, (iii) advisory services as to the accounting or disclosure treatment of Registrant transactions or events and (iv) advisory services to the accounting or disclosure treatment of the actual or potential impact to the Registrant of final or proposed rules, standards or interpretations by the Securities and Exchange Commission, the Financial Accounting Standards Boards or other regulatory or standard-setting bodies.
The aggregate fees billed in the Reporting Periods for non-audit assurance and related services by the Auditor to the Registrant's investment adviser (not including any sub-investment adviser whose role is primarily portfolio management and is subcontracted with or overseen by another investment adviser), and any entity controlling, controlled by or under common control with the investment adviser that provides ongoing services to the Registrant ("Service Affiliates"), that were reasonably related to the performance of the annual audit of the Service Affiliate, which required pre-approval by the Audit Committee were $0 in 2014 and $0 in 2015.
(c) Tax Fees. The aggregate fees billed in the Reporting Periods for professional services rendered by the Auditor for tax compliance, tax advice, and tax planning ("Tax Services") were $0 in 2014 and $12,000 in 2015. These services consisted of the review or preparation of U.S. federal, state, local and excise tax returns. The aggregate fees billed in the Reporting Periods for Tax Services by the Auditor to Service Affiliates, which required pre-approval by the Audit Committee were $0 in 2014 and $0 in 2015.
(d) All Other Fees. The aggregate fees billed in the Reporting Periods for products and services provided by the Auditor, other than the services reported in paragraphs (a) through (c) of this Item, were $0 in 2014 and $0 in 2015.
The aggregate fees billed in the Reporting Periods for Non-Audit Services by the Auditor to Service Affiliates, other than the services reported in paragraphs (b) through (c) of this Item, which required pre-approval by the Audit Committee, were $0 in 2014 and $0 in 2015.
(e)(1) Audit Committee Pre-Approval Policies and Procedures. The Registrant's Audit Committee has established policies and procedures (the "Policy") for pre-approval (within specified fee limits) of the Auditor's engagements for non-audit services to the Registrant and Service Affiliates without specific case-by-case consideration. The pre-approved services in the Policy can include pre-approved audit services, pre-approved audit-related services, pre-approved tax services and pre-approved all other services. Pre-approval considerations include whether the proposed services are compatible with maintaining the Auditor's independence. Pre-approvals pursuant to the Policy are considered annually.
(e)(2) Note: None of the services described in paragraphs (b) through (d) of this Item 4 were approved by the Audit Committee pursuant to paragraph (c)(7)(i)(C) of Rule 2-01 of Regulation S-X.
(f) None of the hours expended on the principal accountant's engagement to audit the registrant's financial statements for the most recent fiscal year were attributed to work performed by persons other than the principal account's full-time, permanent employees.
Non-Audit Fees. The aggregate non-audit fees billed by the Auditor for services rendered to the Registrant, and rendered to Service Affiliates, for the Reporting Periods were $15,598,229 in 2014 and $14,933,643 in 2015.
Auditor Independence. The Registrant's Audit Committee has considered whether the provision of non-audit services that were rendered to Service Affiliates, which were not pre-approved (not requiring pre-approval), is compatible with maintaining the Auditor's independence.
Item 5. Audit Committee of Listed Registrants.
Not applicable.
Item 6. Investments.
(a) Not applicable.
Item 7. Disclosure of Proxy Voting Policies and Procedures for Closed-End Management Investment Companies.
Not applicable.
Item 8. Portfolio Managers of Closed-End Management Investment Companies.
Not applicable.
Item 9. Purchases of Equity Securities by Closed-End Management Investment Companies and Affiliated Purchasers.
Not applicable.
Item 10. Submission of Matters to a Vote of Security Holders.
There have been no material changes to the procedures applicable to Item 10.
Item 11. Controls and Procedures.
(a) The Registrant's principal executive and principal financial officers have concluded, based on their evaluation of the Registrant's disclosure controls and procedures as of a date within 90 days of the filing date of this report, that the Registrant's disclosure controls and procedures are reasonably designed to ensure that information required to be disclosed by the Registrant on Form N-CSR is recorded, processed, summarized and reported within the required time periods and that information required to be disclosed by the Registrant in the reports that it files or submits on Form N-CSR is accumulated and communicated to the Registrant's management, including its principal executive and principal financial officers, as appropriate to allow timely decisions regarding required disclosure.
(b) There were no changes to the Registrant's internal control over financial reporting that occurred during the second fiscal quarter of the period covered by this report that have materially affected, or are reasonably likely to materially affect, the Registrant's internal control over financial reporting.
Item 12. Exhibits.
(a)(1) Code of ethics referred to in Item 2.
(a)(2) Certifications of principal executive and principal financial officers as required by Rule 30a-2(a) under the Investment Company Act of 1940.
(a)(3) Not applicable.
(b) Certification of principal executive and principal financial officers as required by Rule 30a-2(b) under the Investment Company Act of 1940.
SIGNATURES
Pursuant to the requirements of the Securities Exchange Act of 1934 and the Investment Company Act of 1940, the Registrant has duly caused this Report to be signed on its behalf by the undersigned, thereunto duly authorized.
Dreyfus BNY Mellon Funds, Inc.
By: /s/ Bradley J. Skapyak
Bradley J. Skapyak,
President
Date: December 22, 2015
Pursuant to the requirements of the Securities Exchange Act of 1934 and the Investment Company Act of 1940, this Report has been signed below by the following persons on behalf of the Registrant and in the capacities and on the dates indicated.
By: /s/ Bradley J. Skapyak
Bradley J. Skapyak,
President
Date: December 22, 2015
By: /s/ James Windels
James Windels,
Treasurer
Date: December 22, 2015
EXHIBIT INDEX
(a)(1) Code of ethics referred to in Item 2.
(a)(2) Certifications of principal executive and principal financial officers as required by Rule 30a-2(a) under the Investment Company Act of 1940. (EX-99.CERT)
(b) Certification of principal executive and principal financial officers as required by Rule 30a-2(b) under the Investment Company Act of 1940. (EX-99.906CERT)


