UNITED STATES
SECURITIES AND EXCHANGE COMMISSION
Washington, D.C. 20549
FORM N-CSR - A
CERTIFIED SHAREHOLDER REPORT OF REGISTERED MANAGEMENT
INVESTMENT COMPANIES
Investment Company Act file number | 811-22912 |
| |
| BNY Mellon Investment Funds II, Inc. | |
| (Exact name of Registrant as specified in charter) | |
| | |
| c/o BNY Mellon Investment Adviser, Inc. 240 Greenwich Street New York, New York 10286 | |
| (Address of principal executive offices) (Zip code) | |
| | |
| Bennett A. MacDougall, Esq. 240 Greenwich Street New York, New York 10286 | |
| (Name and address of agent for service) | |
|
Registrant's telephone number, including area code: | (212) 922-6400 |
| |
Date of fiscal year end: | 10/31 | |
Date of reporting period: | 10/31/19 | |
| | | | | | | |
The following N-CSR relates only to the Registrant's series listed below and does not relate to any series of the Registrant with a different fiscal year end and, therefore, different N-CSR reporting requirements. A separate N-CSR will be filed for any series with a different fiscal year end, as appropriate.
BNY Mellon Alternative Diversifier Strategies Fund
BNY Mellon Global Emerging Markets Fund
BNY Mellon Yield Enhancement Strategy Fund
FORM N-CSR
Item 1. Reports to Stockholders.
BNY Mellon Alternative Diversifier Strategies Fund
| |
ANNUAL REPORT October 31, 2019 |
| |
Save time. Save paper. View your next shareholder report online as soon as it’s available. Log into www.bnymellonim.com/us and sign up for eCommunications. It’s simple and only takes a few minutes. |
| |
The views expressed in this report reflect those of the portfolio manager(s) only through the end of the period covered and do not necessarily represent the views of BNY Mellon Investment Adviser, Inc. or any other person in the BNY Mellon Investment Adviser, Inc. organization. Any such views are subject to change at any time based upon market or other conditions and BNY Mellon Investment Adviser, Inc. disclaims any responsibility to update such views. These views may not be relied on as investment advice and, because investment decisions for a fund in the BNY Mellon Family of Funds are based on numerous factors, may not be relied on as an indication of trading intent on behalf of any fund in the BNY Mellon Family of Funds. |
| |
Not FDIC-Insured • Not Bank-Guaranteed • May Lose Value |
Contents
THE FUND
FOR MORE INFORMATION
Back Cover
| | | | |
| |
BNY Mellon Alternative Diversifier Strategies Fund
| | The Fund |
A LETTER FROM THE PRESIDENT OF BNY MELLON INVESTMENT ADVISER, INC.
Dear Shareholder:
We are pleased to present this annual report for BNY Mellon Alternative Diversifier Strategies Fund (formerly, Dreyfus Alternative Diversifier Strategies Fund), covering the 12-month period from November 1, 2018 through October 31, 2019. For information about how the fund performed during the reporting period, as well as general market perspectives, we provide a Discussion of Fund Performance on the pages that follow.
Equity markets weakened in the fourth quarter of 2018, as concerns about rising interest rates, trade tensions and slowing global growth provided downward pressure on returns. In December 2018, stocks experienced a sharp sell-off, as it appeared that the U.S. Federal Reserve (the “Fed”) would maintain its hawkish stance on monetary policy. In January 2019, a pivot in stance from the Fed helped stimulate a rebound across equity markets that continued into the second quarter. Escalating trade tensions disrupted equity markets again in May. The dip was short-lived, as markets rose once again in June and July of 2019, when a trade deal appeared more likely, and the pace of U.S. economic growth remained steady. Nevertheless, concerns continued to emerge over slowing global growth, resulting in bouts of market volatility in August 2019. Stocks rebounded in September and continued an upward path through most of October 2019, supported in part by central bank policy and consistent consumer spending.
In fixed-income markets, a risk-off mentality prevailed to start the period, fueled in part by equity market volatility. A flight to quality supported price increases for U.S. Treasuries, which continued through the end of 2018, leading to a flattening yield curve. After the Fed’s supportive statements in January 2019, other developed-market central banks followed suit and reiterated their abilities to bolster flagging growth by continuing accommodative policies. This further buoyed fixed-income instrument prices. The Fed cut rates in July, September and October of 2019, for a total 75-basis-point reduction in the federal funds rate during the 12 months. Concerns about the pace of global economic growth also fueled demand for fixed-income instruments during much of the reporting period, resulting in positive bond market returns.
We believe that over the near term, the outlook for the U.S. remains positive, but we will monitor relevant data for any signs of a change. As always, we encourage you to discuss the risks and opportunities in today’s investment environment with your financial advisor.
Thank you for your continued confidence and support.
Sincerely,

Renee LaRoche-Morris
President
BNY Mellon Investment Adviser, Inc.
November 15, 2019
2
DISCUSSION OF FUND PERFORMANCE(Unaudited)
For the period from November 1, 2018 through October 31, 2019, as provided by Jeffrey M. Mortimer, CFA, and Caroline Lee, primary portfolio managers
Market and Fund Performance Overview
For the 12-month period ended October 31, 2019, BNY Mellon Alternative Diversifier Strategies Fund’s (formerly, Dreyfus Alternative Diversifier Strategies Fund) Class A shares produced a total return of 5.57%, Class C shares returned 4.85%, Class I shares returned 6.05%, and Class Y shares returned 6.11%.1In comparison, the S&P 500® Index (the “Index”) returned 14.31% for the same period, and the Lipper Alternative Multi-Strategy Funds Index (the “Lipper Index”) produced a total return of 3.52% for the period.2
Global financial markets generally posted moderate gains over the reporting period, in an environment of divergent global economic growth trends and shifting central bank policy. The fund lagged the Index but outperformed the Lipper Index. Outperformance was due primarily to returns in BNY Mellon Global Real Estate Securities Fund and BNY Mellon Global Real Return Fund.
The Fund’s Investment Approach
The fund seeks long-term capital appreciation. To pursue its goal, the fund normally allocates its assets across non-traditional or “alternative” asset classes and investment strategies. The fund is designed to complement and diversify traditional stock and bond portfolios. The fund normally allocates its assets among other investment companies (the underlying funds) that employ alternative investment strategies. The fund seeks to achieve its investment objective by allocating its assets among asset classes and investment strategies that typically have had a low correlation to each other and to traditional equity and fixed-income asset classes. The fund currently intends to allocate its assets among underlying funds that employ the following alternative investment strategies: long/short strategies, absolute return hedge strategies, real estate-related strategies, commodities strategies, global macro strategies, managed futures strategies and options strategies.
As of October 31, 2019, the fund held positions in 11 underlying funds: AQR Managed Futures Strategy Fund, ASG Global Alternatives Fund, ASG Managed Futures Strategy Fund, DFA Commodity Strategy Portfolio, BNY Mellon Dynamic Total Return Fund, Boston Partners Long/Short Research Fund, BNY Mellon Global Real Estate Securities Fund, BNY Mellon Global Real Return Fund, Gateway Fund, Neuberger Berman Long/Short Fund and 361 Global Long/Short Equity Fund. 361 Global Long/Short Equity Fund became an investment option effective June 1, 2019 and we believe this fund will bring further diversification to the overall fund, based on its investment philosophy and global focus.
3
DISCUSSION OF FUND PERFORMANCE(Unaudited) (continued)
Global Slowdown Leads to a Strong Response From Central Banks
Global equity markets tumbled significantly towards the end of 2018 but reached new, all-time highs by the end of the reporting period. Global stocks began the period with a double-digit decline in December 2018, yet ended the 12-month reporting period with a gain of more than 12%. Bonds also rallied after the U.S. Federal Reserve (the “Fed”) capitulated on any further interest-rate hikes in 2019 and ended the quantitative tightening (QT) program in the fall of 2019.
Fiscal stimulus, led by tax cuts in the U.S., fostered increased expectations of higher growth and corporate profits through 2018 and into 2019. The fiscal stimulus, combined with a robust labor market, continued to lead the Fed toward policy normalization. The Fed hiked short-term interest rates four times in quarter-point increments in 2018, bringing the target range of the federal funds rate to 2.25%-2.50%. However, toward the end of 2018, the market rapidly began to expect a significant global growth slowdown in early 2019. Furthermore, the market feared that future anticipated Fed rate hikes and QT actions would tip the economy into recession.
Volatility after the December 2018 rate hike got the attention of Fed Chair Jerome Powell, and in his January press conference, he began to make it clear that the Fed would alter its plans should growth expectations fall. This signal from the Fed led to a sharp reversal in markets, and by March, the Fed capitulated on any further rate hikes in 2019 and announced its plan to end QT by the fall. By the end of the reporting period, the Fed had cut the federal funds target rate three times, bringing the target rate to a range of 1.50%-1.75%. Other major central banks around the world also became more supportive in light of economic sluggishness, especially in the manufacturing sector.
As fears of a significant growth slowdown eased in the latter half of the reporting period, and prospects brightened for an interim U.S.-China trade agreement, volatility retreated, and additional positive economic and geopolitical data emerged. The U.S. economy proved to be the bulwark for global growth, as economic growth averaged around 2.0%, when many had feared a recession was imminent.
Underlying Strategies Produced Mixed Results
The fund’s performance compared to the Lipper Index was driven by relatively strong results from some of its underlying funds. BNY Mellon Global Real Estate Securities Fund was the leading contributor to performance. BNY Mellon Global Real Return Fund contributed positively as well, primarily on the strength of strong returns to its global equity holdings. In addition, BNY Mellon Dynamic Total Return Fund’s allocation to equities and high yield bonds enabled it to contribute positively to performance.
The fund’s performance was constrained by 361 Global Long/Short Equity Fund, which lagged in the second half of the reporting period, primarily due to unfavorable stock selection. AQR Managed Futures Strategy Fund also detracted from performance, as the fund’s short position in fixed-income markets and its exposure to commodities hindered results.
4
Maintaining a Focus on Diversification
We believe the fund is well positioned for market volatility, which we expect to continue. The fund’s various diversification strategies can help reduce the impact of heightened market volatility on investors’ overall investment portfolios, and we intend to continue to mitigate the risks of investing in stocks and bonds by diversifying across several alternative asset classes.
November 15, 2019
1 Total return includes reinvestment of dividends and any capital gains paid, and does not take into consideration the maximum initial sales charge in the case of Class A shares, or the applicable contingent deferred sales charge imposed on redemptions in the case of Class C shares. Had these charges been reflected, returns would have been lower. Share price, yield and investment return fluctuate such that upon redemption, fund shares may be worth more or less than their original cost. Return figures provided reflect the absorption of certain fund expenses pursuant to an agreement by BNY Mellon Investment Adviser, Inc. in effect until March 1, 2020, at which time it may be extended, terminated, or modified. Had these expenses not been absorbed, the fund’s returns would have been lower. Past performance is no guarantee of future results.
² Source: Lipper Inc. — The S&P 500® Index is widely regarded as the best single gauge of large-cap U.S. equities. The index includes 500 leading companies and captures approximately 80% coverage of available market capitalization. The Lipper Alternative Multi-Strategy Funds Index consists of funds that, by prospectus language, seek total returns through the management of several different hedge-like strategies. These funds are typically quantitatively driven to measure the existing relationship between instruments and in some cases to identify positions in which the risk-adjusted spread between these instruments represents an opportunity for the investment manager. Investors cannot invest directly in any index.
Equities are subject generally to market, market sector, market liquidity, issuer and investment style risks, among other factors, to varying degrees, all of which are more fully described in the fund’s prospectus. Bonds are subject generally to interest-rate, credit, liquidity, call, sector and market risks, to varying degrees, all of which are more fully described in the fund’s prospectus.
Investing internationally involves special risks, including changes in currency exchange rates, political, economic, and social instability, a lack of comprehensive company information, differing auditing and legal standards and less market liquidity. These risks generally are greater with emerging-market countries than with more economically and politically established foreign countries.
Short sales involve selling a security the fund does not own in anticipation that the security’s price will decline. Short sales may involve substantial risk and leverage, and expose the fund to the risk that it will be required to buy the security sold short at a time when the security has appreciated in value, thus resulting in a loss to the fund. Short positions in stocks involve more risk than long positions in stocks because the maximum sustainable loss on a stock purchased is limited to the amount paid for the stock plus the transaction costs, whereas there is no maximum attainable price on the shorted stock. In theory, stocks sold short have unlimited risk. It is possible that the market value of securities the fund holds in long positions will decline at the same time that the market value of the securities the fund has sold short increases, thereby increasing the fund’s potential volatility. Leveraging occurs when the fund increases its assets available for investment using borrowing or similar transactions. Short sales effectively leverage the fund’s assets. The use of leverage may magnify the fund’s gains or losses.
Exposure to the commodities markets may subject the fund to greater volatility than investments in traditional securities. The values of commodities and commodity-linked investments are affected by events that might have less impact on the values of stocks and bonds. Investments linked to the prices of commodities are considered speculative. Prices of commodities and related contracts may fluctuate significantly over short periods due to a variety of factors.
The underlying funds’ underlying strategies may use derivative instruments, such as options, futures, options on futures, forward contracts, swaps (including credit default swaps on corporate bonds and asset-backed securities), options on swaps and other credit derivatives. A small investment in derivatives could have a potentially large impact on the fund’s performance. The use of derivatives involves risks different from, or possibly greater than, the risks associated with investing directly in the underlying assets.
The ability of the fund to achieve its investment goal depends, in part, on the ability of BNY Mellon Investment Adviser, Inc. to allocate effectively the fund’s assets among the investment strategies and the underlying funds.
5
FUND PERFORMANCE(Unaudited)
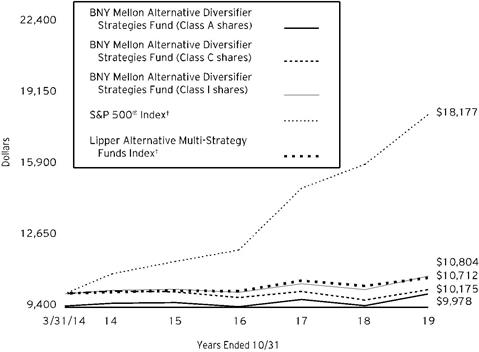
Comparison of change in value of a $10,000 investment in Class A shares, Class C shares and Class I shares of BNY Mellon Alternative Diversifier Strategies Fund with a hypothetical investment of $10,000 in the S&P 500® Index and Lipper Alternative Multi-Strategy Funds Index
† Source: Lipper Inc.
Past performance is not predictive of future performance.
The above graph compares a hypothetical $10,000 investment made in the Class A, Class C and Class I shares of BNY Mellon Alternative Diversifier Strategies Fund on 3/31/14 (inception date) to a hypothetical investment of $10,000 made in the S&P 500® Index and Lipper Alternative Multi-Strategy Funds Index on that date. All dividends and capital gain distributions are reinvested.
The fund’s performance shown in the line graph above takes into account the maximum initial sales charge on Class A shares and all other applicable fees and expenses on Class A, Class C and Class I shares. The S&P 500® Index is widely regarded as the best single gauge of large-cap U.S. equities. The Index includes 500 leading companies and captures approximately 80% coverage of available market capitalization. The Lipper Alternative Multi-Strategy Funds Index consists of funds that, by prospectus language, seek total returns through the management of several different hedge-like strategies. These funds are typically quantitatively driven to measure the existing relationship between instruments and in some cases to identify positions in which the risk-adjusted spread between these instruments represents an opportunity for the investment manager. Unlike a mutual fund, the Index is not subject to charges, fees and other expenses. Investors cannot invest directly in any index. These factors can contribute to the Index potentially outperforming the fund. Further information relating to fund performance, including expense reimbursements, if applicable, is contained in the Financial Highlights section of the prospectus and elsewhere in this report.
6
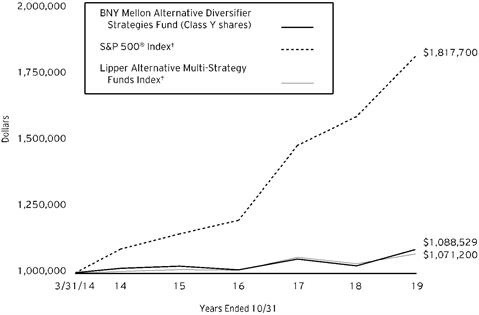
Comparison of change in value of a $1,000,000 investment in Class Y shares of BNY Mellon Alternative Diversifier Strategies Fund with a hypothetical investment of $1,000,000 in the S&P 500® Index and Lipper Alternative Multi-Strategy Funds Index
† Source: Lipper Inc.
Past performance is not predictive of future performance.
The above graph compares a hypothetical $1,000,000 investment made in Class Y shares of BNY Mellon Alternative Diversifier Strategies Fund on 3/31/14 (inception date) to a hypothetical investment of $1,000,000 made in the S&P 500® Index and Lipper Alternative Multi-Strategy Funds Index on that date. All dividends and capital gain distributions are reinvested.
The fund’s performance shown in the line graph above takes into account all applicable fees and expenses of the fund’s Class Y shares. The S&P 500® Index is widely regarded as the best single gauge of large-cap U.S. equities. The Index includes 500 leading companies and captures approximately 80% coverage of available market capitalization. The Lipper Alternative Multi-Strategy Funds Index consists of funds that, by prospectus language, seek total returns through the management of several different hedge-like strategies. These funds are typically quantitatively driven to measure the existing relationship between instruments and in some cases to identify positions in which the risk-adjusted spread between these instruments represents an opportunity for the investment manager. Unlike a mutual fund, the Index is not subject to charges, fees and other expenses. Investors cannot invest directly in any index. These factors can contribute to the Index potentially outperforming the fund. Further information relating to fund performance, including expense reimbursements, if applicable, is contained in the Financial Highlights section of the prospectus and elsewhere in this report.
7
FUND PERFORMANCE(Unaudited) (continued)
| | | | | |
Average Annual Total Returns as of 10/31/19 |
| | Inception | | | From |
| Date | 1 Year | 5 Years | Inception |
Class A shares | | | | |
with maximum sales charge (5.75%) | 3/31/14 | -0.52% | -0.31% | -0.04% |
without sales charge | 3/31/14 | 5.57% | 0.87% | 1.02% |
Class C shares | | | | |
with applicable redemption charge† | 3/31/14 | 3.85% | 0.12% | 0.31% |
without redemption | 3/31/14 | 4.85% | 0.12% | 0.31% |
Class I shares | 3/31/14 | 6.05% | 1.24% | 1.39% |
Class Y shares | 3/31/14 | 6.11% | 1.37% | 1.53% |
S&P 500® Index | 3/31/14 | 14.31% | 10.77% | 11.30%†† |
Lipper Alternative
Multi-Strategy Funds Index | 3/31/14 | 3.52% | 1.26% | 1.24%†† |
† The maximum contingent deferred sales charge for Class C shares is 1% for shares redeemed within one year of the date of purchase.
†† Index date is based on the inception date of the fund.
The performance data quoted represents past performance, which is no guarantee of future results. Share price and investment return fluctuate and an investor’s shares may be worth more or less than original cost upon redemption. Current performance may be lower or higher than the performance quoted. Go to www.bnymellonim.com/us for the fund’s most recent month-end returns.
The fund’s performance shown in the graphs and table does not reflect the deduction of taxes that a shareholder would pay on fund distributions or the redemption of fund shares. In addition to the performance of Class A shares shown with and without a maximum sales charge, the fund’s performance shown in the table takes into account all other applicable fees and expenses on all classes.
8
UNDERSTANDING YOUR FUND’S EXPENSES(Unaudited)
As a mutual fund investor, you pay ongoing expenses, such as management fees and other expenses. Using the information below, you can estimate how these expenses affect your investment and compare them with the expenses of other funds. You also may pay one-time transaction expenses, including sales charges (loads) and redemption fees, which are not shown in this section and would have resulted in higher total expenses. For more information, see your fund’s prospectus or talk to your financial adviser.
Review your fund’s expenses
The table below shows the expenses you would have paid on a $1,000 investment in BNY Mellon Alternative Diversifier Strategies Fund from May 1, 2019 to October 31, 2019. It also shows how much a $1,000 investment would be worth at the close of the period, assuming actual returns and expenses.
| | | | | | | |
Expenses and Value of a $1,000 Investment | |
Assume actual returns for the six months ended October 31, 2019 | |
| | | | | | |
| | Class A | Class C | Class I | Class Y | |
Expense paid per $1,000† | $4.08 | $7.88 | $2.19 | $1.58 | |
Ending value (after expenses) | $1,021.50 | $1,017.80 | $1,023.10 | $1,023.80 | |
COMPARING YOUR FUND’S EXPENSES
WITH THOSE OF OTHER FUNDS(Unaudited)
Using the SEC’s method to compare expenses
The Securities and Exchange Commission (“SEC”) has established guidelines to help investors assess fund expenses. Per these guidelines, the table below shows your fund’s expenses based on a $1,000 investment, assuming a hypothetical 5% annualized return. You can use this information to compare the ongoing expenses (but not transaction expenses or total cost) of investing in the fund with those of other funds. All mutual fund shareholder reports will provide this information to help you make this comparison. Please note that you cannot use this information to estimate your actual ending account balance and expenses paid during the period.
| | | | | | | |
Expenses and Value of a $1,000 Investment | |
Assuming a hypothetical 5% annualized return for the six months ended October 31, 2019 | |
| | | | | | |
| | Class A | Class C | Class I | Class Y | |
Expense paid per $1,000† | $4.08 | $7.88 | $2.19 | $1.58 | |
Ending value (after expenses) | $1,021.17 | $1,017.39 | $1,023.04 | $1,023.64 | |
† Expenses are equal to the fund’s annualized expense ratio of .80% for Class A, 1.55% for Class C, .43% for Class I and .31% for Class Y, multiplied by the average account value over the period, multiplied by 184/365 (to reflect the one-half year period). |
9
STATEMENT OF INVESTMENTS
October 31, 2019
| | | | | | | | |
| |
Description | | | | Shares | | Value ($) | |
Investment Companies - 99.1% | | | | | |
Alternative Investments - 41.2% | | | | | |
361 Global Long/Short Equity Fund, CI. Y | | | | 3,729,009 | a | 41,392,002 | |
AQR Managed Futures Strategy Fund, Cl. I | | | | 2,255,718 | a | 19,151,048 | |
ASG Global Alternatives Fund, Cl. Y | | | | 3,917,096 | | 44,106,500 | |
ASG Managed Futures Strategy Fund, Cl. Y | | | | 1,737,197 | a | 17,232,994 | |
DFA Commodity Strategy Portfolio | | | | 1,913,268 | | 10,446,444 | |
Gateway Fund, CI. Y | | | | 1,280,319 | | 43,582,034 | |
| | | | | 175,911,022 | |
Domestic Equity - 30.7% | | | | | |
Boston Partners Long/Short Research Fund, Institutional Class | | | | 4,150,694 | | 64,916,856 | |
Neuberger Berman Long Short Fund, Institutional Class | | | | 4,533,831 | a | 66,511,298 | |
| | | | | 131,428,154 | |
Foreign Balanced - 10.3% | | | | | |
BNY Mellon Global Real Return Fund, CI. Y | | | | 2,847,711 | b | 43,997,135 | |
Foreign Equity - 10.6% | | | | | |
BNY Mellon Global Real Estate Securities Fund, CI. Y | | | | 4,471,154 | b | 45,426,922 | |
Foreign Fixed Income - 6.3% | | | | | |
BNY Mellon Dynamic Total Return Fund, CI. Y | | | | 1,607,770 | b | 26,833,685 | |
Total Investments(cost $412,558,896) | | 99.1% | | 423,596,918 | |
Cash and Receivables (Net) | | .9% | | 3,956,189 | |
Net Assets | | 100.0% | | 427,553,107 | |
aNon-income producing security.
bInvestment in affiliated issuer. The investment objective of this investment company is publicly available and can be found within the investment company’s prospectus.
| | |
Portfolio Summary (Unaudited)† | Value (%) |
Investment Companies | 99.1 |
| | 99.1 |
† Based on net assets.
See notes to financial statements.
10
STATEMENT OF INVESTMENTS IN AFFILIATED ISSUERS
| | | | | |
Investment Companies | Value
10/31/18 ($) | Purchases ($)† | Sales ($) | Net Realized Gains (Loss) ($) |
BNY Mellon Absolute Insight Multi-Strategy Fund, Cl.Y | 44,748,500 | 4,981,201 | 48,644,126 | (1,230,747) |
BNY Mellon Global Real Estate Securities Fund, Cl.Y | 54,421,843 | 5,879,275 | 21,795,204 | 56,906 |
BNY Mellon Global Real Return Fund, Cl.Y | 43,666,842 | 4,976,010 | 7,606,993 | (353,403) |
Dreyfus Select Managers Long/Short Fund, Cl.Y | 90,621,925 | - | 91,275,955 | 2,149,624 |
BNY Mellon Dynamic Total Return Fund, Cl.Y | 55,528,574 | 4,613,526 | 36,161,915 | 1,838,700 |
Total | 288,987,684 | 20,450,012 | 205,484,193 | 2,461,080 |
| | | | | |
Investment Companies | Net Change in Unrealized Appreciation (Depreciation) ($) | Value
10/31/19 ($) | Net
Assets (%) | Dividends/
Distributions ($) |
BNY Mellon Absolute Insight Multi-Strategy Fund, Cl.Y | 145,172 | - | - | 945,853 |
BNY Mellon Global Real Estate Securities Fund, Cl.Y | 6,864,102 | 45,426,922 | 10.6 | 1,698,357 |
BNY Mellon Global Real Return Fund, Cl.Y | 3,314,679 | 43,997,135 | 10.3 | 1,580,797 |
Dreyfus Select Managers Long/Short Fund, Cl.Y | (1,495,594) | - | - | - |
BNY Mellon Dynamic Total Return Fund, Cl.Y | 1,014,800 | 26,833,685 | 6.3 | 818,886 |
Total | 9,843,159 | 116,257,742 | 27.2 | 5,043,893 |
† Includes reinvested dividend/distributions.
See notes to financial statements.
11
STATEMENT OF ASSETS AND LIABILITIES
October 31, 2019
| | | | | | | |
| | | | | | |
| | | Cost | | Value | |
Assets ($): | | | | |
Investments in securities—See Statement of Investments | | | |
Unaffiliated issuers | 310,922,477 | | 307,339,176 | |
Affiliated issuers | | 101,636,419 | | 116,257,742 | |
Cash | | | | | 3,892,603 | |
Receivable for shares of Common Stock subscribed | | 224,049 | |
Receivable for investment securities sold | | 163,164 | |
Interest receivable | | 23,023 | |
Prepaid expenses | | | | | 27,645 | |
| | | | | 427,927,402 | |
Liabilities ($): | | | | |
Due to BNY Mellon Investment Adviser, Inc. and affiliates—Note 3(c) | | 97,440 | |
Payable for shares of Common Stock redeemed | | 221,910 | |
Directors fees and expenses payable | | 2,961 | |
Other accrued expenses | | | | | 51,984 | |
| | | | | 374,295 | |
Net Assets ($) | | | 427,553,107 | |
Composition of Net Assets ($): | | | | |
Paid-in capital | | | | | 419,058,512 | |
Total distributable earnings (loss) | | | | | 8,494,595 | |
Net Assets ($) | | | 427,553,107 | |
| | | | | | |
Net Asset Value Per Share | Class A | Class C | Class I | Class Y | |
Net Assets ($) | 41,944 | 27,545 | 1,205,977 | 426,277,641 | |
Shares Outstanding | 3,266 | 2,188 | 93,960 | 33,036,309 | |
Net Asset Value Per Share ($) | 12.84 | 12.59 | 12.84 | 12.90 | |
| | | | | |
See notes to financial statements. | | | | | |
12
STATEMENT OF OPERATIONS
Year Ended October 31, 2019
| | | | | | | |
| | | | | | |
| | | | | | |
Investment Income ($): | | | | |
Income: | | | | |
Cash dividends: | |
Unaffiliated issuers | | | 1,063,283 | |
Affiliated issuers | | | 4,315,450 | |
Interest | | | 101,086 | |
Total Income | | | 5,479,819 | |
Expenses: | | | | |
Management fee—Note 3(a) | | | 1,068,936 | |
Professional fees | | | 74,845 | |
Registration fees | | | 65,629 | |
Directors’ fees and expenses—Note 3(d) | | | 37,707 | |
Prospectus and shareholders’ reports | | | 11,990 | |
Loan commitment fees—Note 2 | | | 10,146 | |
Custodian fees—Note 3(c) | | | 3,851 | |
Shareholder servicing costs—Note 3(c) | | | 2,170 | |
Distribution fees—Note 3(b) | | | 230 | |
Miscellaneous | | | 30,331 | |
Total Expenses | | | 1,305,835 | |
Less—reduction in expenses due to undertaking—Note 3(a) | | | (117) | |
Net Expenses | | | 1,305,718 | |
Investment Income—Net | | | 4,174,101 | |
Realized and Unrealized Gain (Loss) on Investments—Note 4 ($): | | |
Net realized gain (loss) on investments: | | |
Unaffiliated issuers | | | | (5,557,576) | |
Affiliated issuers | | | | 2,461,080 | |
Capital gain distributions on unaffiliated issuers | 6,442,973 | |
Capital gain distributions from affiliated issuers | 728,443 | |
Net Realized Gain (Loss) | | | 4,074,920 | |
Net change in unrealized appreciation (depreciation) on investments: | | |
Unaffiliated issuers | | | | 6,259,412 | |
Affiliated issuers | | | | 9,843,159 | |
Net Change in Unrealized Appreciation (Depreciation) | | | 16,102,571 | |
Net Realized and Unrealized Gain (Loss) on Investments | | | 20,177,491 | |
Net Increase in Net Assets Resulting from Operations | | 24,351,592 | |
| | | | | | |
See notes to financial statements. | | | | | |
13
STATEMENT OF CHANGES IN NET ASSETS
| | | | | | | | | | |
| | | | Year Ended October 31, |
| | | | 2019 | | 2018 | |
Operations ($): | | | | | | | | |
Investment income—net | | | 4,174,101 | | | | 1,235,723 | |
Net realized gain (loss) on investments | | 4,074,920 | | | | 5,807,758 | |
Net change in unrealized appreciation
(depreciation) on investments | | 16,102,571 | | | | (18,411,572) | |
Net Increase (Decrease) in Net Assets
Resulting from Operations | 24,351,592 | | | | (11,368,091) | |
Distributions ($): | |
Distributions to shareholders: | | | | | | | | |
Class A | | | (239) | | | | (221) | |
Class C | | | (242) | | | | - | |
Class I | | | (18,149) | | | | (7,692) | |
Class Y | | | (5,704,719) | | | | (3,843,329) | |
Total Distributions | | | (5,723,349) | | | | (3,851,242) | |
Capital Stock Transactions ($): | |
Net proceeds from shares sold: | | | | | | | | |
Class A | | | 1,002 | | | | - | |
Class C | | | 15,123 | | | | - | |
Class I | | | 1,566,135 | | | | 2,431,791 | |
Class Y | | | 75,145,013 | | | | 45,731,957 | |
Distributions reinvested: | | | | | | | | |
Class A | | | 89 | | | | 130 | |
Class C | | | 103 | | | | - | |
Class I | | | 13,626 | | | | 7,505 | |
Class Y | | | 1,620,010 | | | | 212,919 | |
Cost of shares redeemed: | | | | | | | | |
Class A | | | (20,128) | | | | (80) | |
Class C | | | (15,906) | | | | - | |
Class I | | | (1,863,423) | | | | (2,714,391) | |
Class Y | | | (115,590,391) | | | | (59,924,530) | |
Increase (Decrease) in Net Assets
from Capital Stock Transactions | (39,128,747) | | | | (14,254,699) | |
Total Increase (Decrease) in Net Assets | (20,500,504) | | | | (29,474,032) | |
Net Assets ($): | |
Beginning of Period | | | 448,053,611 | | | | 477,527,643 | |
End of Period | | | 427,553,107 | | | | 448,053,611 | |
14
| | | | | | | | | | |
| | | | Year Ended October 31, |
| | | | 2019 | | 2018 | |
Capital Share Transactions (Shares): | |
Class A | | | | | | | | |
Shares sold | | | 80 | | | | - | |
Shares issued for distributions reinvested | | | 8 | | | | 11 | |
Shares redeemed | | | (1,668) | | | | - | |
Net Increase (Decrease) in Shares Outstanding | (1,580) | | | | 11 | |
Class C | | | | | | | | |
Shares sold | | | 1,298 | | | | - | |
Shares issued for distributions reinvested | | | 9 | | | | - | |
Shares redeemed | | | (1,306) | | | | - | |
Net Increase (Decrease) in Shares Outstanding | 1 | | | | - | |
Class Ia | | | | | | | | |
Shares sold | | | 125,472 | | | | 192,627 | |
Shares issued for distributions reinvested | | | 1,162 | | | | 591 | |
Shares redeemed | | | (150,507) | | | | (215,707) | |
Net Increase (Decrease) in Shares Outstanding | (23,873) | | | | (22,489) | |
Class Ya | | | | | | | | |
Shares sold | | | 6,110,495 | | | | 3,608,788 | |
Shares issued for distributions reinvested | | | 137,639 | | | | 16,726 | |
Shares redeemed | | | (9,434,107) | | | | (4,740,435) | |
Net Increase (Decrease) in Shares Outstanding | (3,185,973) | | | | (1,114,921) | |
| | | | | | | | | |
a During the period ended October 31, 2019, 115,468 Class Y shares representing $1,452,491 were exchanged for 116,041 Class I shares and during the period ended October 31, 2018, 185,563 Class Y shares representing $2,352,291 were exchanged for 186,333 Class I shares. | |
See notes to financial statements.
| | | | | | | | |
15
FINANCIAL HIGHLIGHTS
The following tables describe the performance for each share class for the fiscal periods indicated. All information (except portfolio turnover rate) reflects financial results for a single fund share. Total return shows how much your investment in the fund would have increased (or decreased) during each period, assuming you had reinvested all dividends and distributions. These figures have been derived from the fund’s financial statements.
| | | | | | | |
| | | |
| | | Year Ended October 31, |
Class A Shares | | 2019 | 2018 | 2017 | 2016 | 2015 |
Per Share Data ($): | | | | | | |
Net asset value, beginning of period | | 12.24 | 12.65 | 12.23 | 12.54 | 12.67 |
Investment Operations: | | | | | | |
Investment income (loss)—neta | | .08 | (.03) | .01 | .06 | .07 |
Net realized and unrealized
gain (loss) on investments | | .60 | (.33) | .42 | (.30) | (.04) |
Total from Investment Operations | | .68 | (.36) | .43 | (.24) | .03 |
Distributions: | | | | | | |
Dividends from investment income—net | | (.02) | (.05) | (.01) | (.07) | (.16) |
Dividends from net realized
gain on investments | | (.06) | – | – | – | (.00)b |
Total Distributions | | (.08) | (.05) | (.01) | (.07) | (.16) |
Net asset value, end of period | | 12.84 | 12.24 | 12.65 | 12.23 | 12.54 |
Total Return (%)c | | 5.57 | (2.89) | 3.52 | (1.88) | .29 |
Ratios/Supplemental Data (%): | | | | | | |
Ratio of total expenses
to average net assetsd | | .97 | .86 | .82 | .85 | .86 |
Ratio of net expenses
to average net assetsd | | .80 | .80 | .75 | .79 | .80 |
Ratio of net investment income (loss)
to average net assetsd | | .67 | (.24) | .07 | .48 | .58 |
Portfolio Turnover Rate | | 51.61 | 19.18 | 16.45 | 20.39 | 16.73 |
Net Assets, end of period ($ x 1,000) | | 42 | 59 | 61 | 61 | 62 |
a Based on average shares outstanding.
b Amount represents less than $.01 per share.
c Exclusive of sales charge.
d Amounts do not include the expenses of the underlying funds.
See notes to financial statements.
16
| | | | | | | |
| | | |
| | | Year Ended October 31, |
Class C Shares | | 2019 | 2018 | 2017 | 2016 | 2015 |
Per Share Data ($): | | | | | | |
Net asset value, beginning of period | | 12.08 | 12.57 | 12.22 | 12.54 | 12.64 |
Investment Operations: | | | | | | |
Investment (loss)—neta | | (.03) | (.12) | (.08) | (.02) | (.05) |
Net realized and unrealized
gain (loss) on investments | | .61 | (.37) | .43 | (.30) | .00b |
Total from Investment Operations | | .58 | (.49) | .35 | (.32) | (.05) |
Distributions: | | | | | | |
Dividends from investment income—net | | (.01) | – | – | – | (.05) |
Dividends from net realized
gain on investments | | (.06) | – | – | – | (.00)b |
Total Distributions | | (.07) | – | – | – | (.05) |
Net asset value, end of period | | 12.59 | 12.08 | 12.57 | 12.22 | 12.54 |
Total Return (%)c | | 4.85 | (3.90) | 2.86 | (2.55) | (.37) |
Ratios/Supplemental Data (%): | | | | | | |
Ratio of total expenses
to average net assetsd | | 1.69 | 1.59 | 1.41 | 1.44 | 1.59 |
Ratio of net expenses
to average net assetsd | | 1.55 | 1.55 | 1.41 | 1.44 | 1.50 |
Ratio of net investment (loss)
to average net assetsd | | (.21) | (.99) | (.63) | (.16) | (.36) |
Portfolio Turnover Rate | | 51.61 | 19.18 | 16.45 | 20.39 | 16.73 |
Net Assets, end of period ($ x 1,000) | | 28 | 26 | 27 | 33 | 34 |
a Based on average shares outstanding.
b Amount represents less than $.01 per share.
c Exclusive of sales charge.
d Amounts do not include the expenses of the underlying funds.
See notes to financial statements.
17
FINANCIAL HIGHLIGHTS (continued)
| | | | | | | |
| | | |
| | | Year Ended October 31, |
Class I Shares | | 2019 | 2018 | 2017 | 2016 | 2015 |
Per Share Data ($): | | | | | | |
Net asset value, beginning of period | | 12.27 | 12.69 | 12.27 | 12.58 | 12.70 |
Investment Operations: | | | | | | |
Investment income—neta | | .14 | .01 | .05 | .10 | .03 |
Net realized and unrealized
gain (loss) on investments | | .59 | (.34) | .43 | (.28) | .02 |
Total from Investment Operations | | .73 | (.33) | .48 | (.18) | .05 |
Distributions: | | | | | | |
Dividends from investment income—net | | (.10) | (.09) | (.06) | (.13) | (.17) |
Dividends from net realized
gain on investments | | (.06) | – | – | – | (.00)b |
Total Distributions | | (.16) | (.09) | (.06) | (.13) | (.17) |
Net asset value, end of period | | 12.84 | 12.27 | 12.69 | 12.27 | 12.58 |
Total Return (%) | | 6.05 | (2.60) | 3.97 | (1.44) | .45 |
Ratios/Supplemental Data (%): | | | | | | |
Ratio of total expenses
to average net assetsc | | .42 | .38 | .35 | .37 | .43 |
Ratio of net expenses
to average net assetsc | | .42 | .38 | .35 | .37 | .41 |
Ratio of net investment income
to average net assetsc | | 1.11 | .08 | .43 | .79 | .23 |
Portfolio Turnover Rate | | 51.61 | 19.18 | 16.45 | 20.39 | 16.73 |
Net Assets, end of period ($ x 1,000) | | 1,206 | 1,446 | 1,780 | 1,336 | 633 |
a Based on average shares outstanding.
b Amount represents less than $.01 per share.
c Amounts do not include the expenses of the underlying funds.
See notes to financial statements.
18
| | | | | | | |
| | |
| | Year Ended October 31, |
Class Y Shares | | 2019 | 2018 | 2017 | 2016 | 2015 |
Per Share Data ($): | | | | | | |
Net asset value, beginning of period | | 12.33 | 12.74 | 12.32 | 12.63 | 12.71 |
Investment Operations: | | | | | | |
Investment income—neta | | .12 | .03 | .06 | .11 | .13 |
Net realized and unrealized
gain (loss) on investments | | .62 | (.34) | .43 | (.28) | (.03) |
Total from Investment Operations | | .74 | (.31) | .49 | (.17) | .10 |
Distributions: | | | | | | |
Dividends from
investment income—net | | (.11) | (.10) | (.07) | (.14) | (.18) |
Dividends from net realized
gain on investments | | (.06) | – | – | – | (.00)b |
Total Distributions | | (17) | (.10) | (.07) | (.14) | (.18) |
Net asset value, end of period | | 12.90 | 12.33 | 12.74 | 12.32 | 12.63 |
Total Return (%) | | 6.11 | (2.43) | 4.01 | (1.39) | .82 |
Ratios/Supplemental Data (%): | | | | | | |
Ratio of total expenses
to average net assetsc | | .30 | .30 | .29 | .30 | .31 |
Ratio of net expenses
to average net assetsc | | .30 | .30 | .29 | .30 | .31 |
Ratio of net investment income
to average net assetsc | | .98 | .27 | .52 | .92 | .99 |
Portfolio Turnover Rate | | 51.61 | 19.18 | 16.45 | 20.39 | 16.73 |
Net Assets, end of period ($ x 1,000) | | 426,278 | 446,522 | 475,659 | 509,333 | 477,866 |
a Based on average shares outstanding.
b Amount represents less than $.01 per share.
c Amounts do not include the expenses of the underlying funds.
See notes to financial statements.
19
NOTES TO FINANCIAL STATEMENTS
NOTE 1—Significant Accounting Policies:
BNY Mellon Alternative Diversifier Strategies Fund (the “fund”) is a separate diversified series of of BNY Mellon Investment Funds II, Inc. (the “Company”), which is registered under the Investment Company Act of 1940, as amended (the “Act”), as an open-end management investment company and operates as a series company currently offering three series, including the fund. The fund’s investment objective is to seek long-term capital appreciation. BNY Mellon Investment Adviser, Inc. (the “Adviser”), a wholly-owned subsidiary of The Bank of New York Mellon Corporation (“BNY Mellon”), serves as the fund’s investment adviser.
Effective June 3, 2019, the fund changed its name from Dreyfus Alternative Diversifier Strategies Fund to BNY Mellon Alternative Diversifier Strategies Fund and the Company changed its name from Dreyfus BNY Mellon Funds, Inc. to BNY Mellon Investment Funds II, Inc. In addition, The Dreyfus Corporation, the fund’s investment adviser, changed its name to “BNY Mellon Investment Adviser, Inc.”, MBSC Securities Corporation, the fund’s distributor, changed its name to “BNY Mellon Securities Corporation” and Dreyfus Transfer, Inc., the fund’s transfer agent, changed its name to “BNY Mellon Transfer, Inc.”
BNY Mellon Securities Corporation (the “Distributor”), a wholly-owned subsidiary of the Adviser, is the distributor of the fund’s shares. The fund is authorized to issue 100 million shares of $.001 par value Common Stock in each of the following classes of shares: Class A, Class C, Class I, Class T and Class Y. Class A, Class C and Class T shares are sold primarily to retail investors through financial intermediaries and bear Distribution and/or Shareholder Services Plan fees. Class A and Class T shares generally are subject to a sales charge imposed at the time of purchase. Class C shares are subject to a contingent deferred sales charge (“CDSC”) imposed on Class C shares redeemed within one year of purchase. Class C shares automatically convert to Class A shares ten years after the date of purchase, without the imposition of a sales charge. Class I shares are sold primarily to bank trust departments and other financial service providers (including The Bank of New York Mellon, a subsidiary of BNY Mellon and an affiliate of the Adviser, and its affiliates), acting on behalf of customers having a qualified trust or an investment account or relationship at such institution, and bear no Distribution or Shareholder Services Plan fees. Class Y shares are sold at net asset value per share generally to institutional investors, and bear no Distribution or Shareholder Services Plan fees. Class I and Class Y shares are offered without a front-end sales
20
charge or CDSC. As of the date of this report, the fund did not offer Class T shares for purchase. Other differences between the classes include the services offered to and the expenses borne by each class, the allocation of certain transfer agency costs, and certain voting rights. Income, expenses (other than expenses attributable to a specific class), and realized and unrealized gains or losses on investments are allocated to each class of shares based on its relative net assets.
As of October 31, 2019, MBC Investments Corp., an indirect subsidiary of BNY Mellon, held 2,000 Class A and 2,000 Class C shares of the fund.
The Company accounts separately for the assets, liabilities and operations of each series. Expenses directly attributable to each series are charged to that series’ operations; expenses which are applicable to all series are allocated among them on a pro rata basis.
The Financial Accounting Standards Board (“FASB”) Accounting Standards Codification (“ASC”) is the exclusive reference of authoritative U.S. generally accepted accounting principles (“GAAP”) recognized by the FASB to be applied by nongovernmental entities. Rules and interpretive releases of the Securities and Exchange Commission (“SEC”) under authority of federal laws are also sources of authoritative GAAP for SEC registrants. The fund is an investment company and applies the accounting and reporting guidance of the FASB ASC Topic 946 Financial Services-Investment Companies. The fund’s financial statements are prepared in accordance with GAAP, which may require the use of management estimates and assumptions. Actual results could differ from those estimates.
The Companyenters into contracts that contain a variety of indemnifications. The fund’s maximum exposure under these arrangements is unknown. The fund does not anticipate recognizing any loss related to these arrangements.
(a) Portfolio valuation: The fair value of a financial instrument is the amount that would be received to sell an asset or paid to transfer a liability in an orderly transaction between market participants at the measurement date (i.e., the exit price). GAAP establishes a fair value hierarchy that prioritizes the inputs of valuation techniques used to measure fair value. This hierarchy gives the highest priority to unadjusted quoted prices in active markets for identical assets or liabilities (Level 1 measurements) and the lowest priority to unobservable inputs (Level 3 measurements).
Additionally, GAAP provides guidance on determining whether the volume and activity in a market has decreased significantly and whether such a decrease in activity results in transactions that are not orderly.
21
NOTES TO FINANCIAL STATEMENTS(continued)
GAAP requires enhanced disclosures around valuation inputs and techniques used during annual and interim periods.
Various inputs are used in determining the value of the fund’s investments relating to fair value measurements. These inputs are summarized in the three broad levels listed below:
Level 1—unadjusted quoted prices in active markets for identical investments.
Level 2—other significant observable inputs (including quoted prices for similar investments, interest rates, prepayment speeds, credit risk, etc.).
Level 3—significant unobservable inputs (including the fund’s own assumptions in determining the fair value of investments).
The inputs or methodology used for valuing securities are not necessarily an indication of the risk associated with investing in those securities.
Investments are valued at the net asset value of each underlying fund determined as of the close of the New York Stock Exchange (generally 4 p.m., Eastern time) on the valuation date and are generally categorized within Level 1 of the fair value hierarchy.
The following is a summary of the inputs used as of October 31, 2019in valuing the fund’s investments:
| | | | | |
| | Level 1 - Unadjusted Quoted Prices | Level 2 - Other Significant Observable Inputs | Level 3 -Significant Unobservable Inputs | Total |
Assets ($) | | | |
Investments in Securities:† | | | |
Investment Companies | 423,596,918 | - | - | 423,596,918 |
† See Statement of Investments for additional detailed categorizations, if any.
(b)Securities transactions and investment income: Securities transactions are recorded on a trade date basis. Realized gains and losses from securities transactions are recorded on the identified cost basis. Dividend income is recognized on the ex-dividend date and interest income, including, where applicable, accretion of discount and amortization of premium on investments, is recognized on the accrual basis.
(c) Affiliated issuers: Investments in other investment companies advised by the Adviser are considered “affiliated” under the Act.
22
(d) Dividends and distributions to shareholders: Dividends and distributions are recorded on the ex-dividend date. Dividends from investment income-net and dividends from net realized capital gains, if any, are normally declared and paid annually, but the fund may make distributions on a more frequent basis to comply with the distribution requirements of the Internal Revenue Code of 1986, as amended (the “Code”). To the extent that net realized capital gains can be offset by capital loss carryovers, it is the policy of the fund not to distribute such gains. Income and capital gain distributions are determined in accordance with income tax regulations, which may differ from GAAP.
(e) Federal income taxes: It is the policy of the fund to continue to qualify as a regulated investment company, if such qualification is in the best interests of its shareholders, by complying with the applicable provisions of the Code, and to make distributions of taxable income and net realized capital gain sufficient to relieve it from substantially all federal income and excise taxes.
As of and during the period ended October 31, 2019, the fund did not have any liabilities for any uncertain tax positions. The fund recognizes interest and penalties, if any, related to uncertain tax positions as income tax expense in the Statement of Operations. During the period ended October 31, 2019, the fund did not incur any interest or penalties.
Each tax year in the four-year period ended October 31, 2019 remains subject to examination by the Internal Revenue Service and state taxing authorities.
At October 31, 2019, the components of accumulated earnings on a tax basis were as follows: undistributed ordinary income $8,961, undistributed capital gains $4,079,196 and unrealized appreciation $4,951,779. In addition, the fund deferred for tax purposes late year ordinary losses of $545,341 to the first day of the following fiscal year.
The tax character of distributions paid to shareholders during the fiscal periods ended October 31, 2019 and October 31, 2018 were as follows: ordinary income $3,702,941 and $3,851,242, and long-term capital gains $2,020,408 and $0, respectively.
(f) New Accounting Pronouncements: Effective June 1, 2019, the fund adopted Accounting Standards Update 2018-13, Fair Value Measurement (Topic 820): Disclosure Framework—Changes to the Disclosure Requirements for Fair Value Measurement (“ASU 2018-13”). The update provides guidance that eliminates, adds and modifies certain disclosure requirements for fair value measurements. The adoption of ASU 2018-13
23
NOTES TO FINANCIAL STATEMENTS(continued)
had no impact on the operations of the fund for the period ended October 31, 2019.
NOTE 2—Bank Lines of Credit:
The fund participates with other long-term open-end funds managed by the Adviser in a $1.030 billion unsecured credit facility led by Citibank, N.A. (the “Citibank Credit Facility”) and a $300 million unsecured credit facility provided by The Bank of New York Mellon (the “BNYM Credit Facility”), each to be utilized primarily for temporary or emergency purposes, including the financing of redemptions (each, a “Facility”). The Citibank Credit Facility is available in two tranches: (i) Tranche A is in an amount equal to $830 million and is available to all long-term open-ended funds, including the fund, and (ii) Tranche B is in amount equal to $200 million and is available only to BNY Mellon Floating Rate Income Fund, a series of BNY Mellon Investment Funds IV, Inc. In connection therewith, the fund has agreed to pay its pro rata portion of commitment fees for Tranche A of the Citibank Credit Facility and the BNYM Credit Facility. Interest is charged to the fund based on rates determined pursuant to the terms of the respective Facility at the time of borrowing. During the period ended October 31, 2019, the fund did not borrow under the Facilities.
NOTE 3—Management Fee and Other Transactions with Affiliates:
(a)Pursuant to a management agreement with the Adviser, the fund has agreed to pay a management fee at the annual rate of 1.35% applied to the portion of the fund’s average daily net assets allocated to direct investments in securities and .25% applied to that portion of the fund’s average daily net assets allocated to investments in other investment companies (underlying funds) and money market instruments (including cash and equivalents). The Adviser has contractually agreed, from November 1, 2018 through March 1, 2020, to waive receipt of its fees and/or assume the direct expenses of the fund, so that the direct expenses of none of the classes (excluding Rule 12b-1 Distribution Plan fees, Shareholder Services Plan fees, acquired fund fees and expenses incurred by underlying funds, taxes, interest expense, brokerage commissions, commitment fees on borrowings and extraordinary expenses) exceed .55% of the value of the fund’s average daily net assets. On or after March 1, 2020, the Adviser may terminate this expense limitation at any time. Because “acquired fund fees and expenses” are incurred indirectly by the fund, such fees and expenses are not included in the expense limitations. The reduction in expenses, pursuant to the undertaking, amounted to $117 during the period ended October 31, 2019.
24
(b) Under the Distribution Plan adopted pursuant to Rule 12b-1 under the Act, Class C shares pay the Distributor for distributing its shares at an annual rate of .75% of the value of its average daily net assets. During the period ended October 31, 2019, Class C shares were charged $230 pursuant to the Distribution Plan.
(c)Under the Shareholder Services Plan, Class A and Class C shares pay the Distributor at an annual rate of .25% of the value of their average daily net assets for the provision of certain services. The services provided may include personal services relating to shareholder accounts, such as answering shareholder inquiries regarding the fund and providing reports and other information, and services related to the maintenance of shareholder accounts. The Distributor may make payments to Service Agents (securities dealers, financial institutions or other industry professionals) with respect to these services. The Distributor determines the amounts to be paid to Service Agents. During the period ended October 31, 2019, Class A and Class C shares were charged $106and $77, respectively, pursuant to the Shareholder Services Plan.
Under its terms, the Distribution Plan and Shareholder Services Plan shall remain in effect from year to year, provided such continuance is approved annually by a vote of a majority of those Directors who are not “interested persons” of the Company and who have no direct or indirect financial interest in the operation of or in any agreement related to the Distribution Plan or Shareholder Services Plan.
The fund has an arrangement with the transfer agent whereby the fund may receive earnings credits when positive cash balances are maintained, which are used to offset transfer agency fees and the fund has an arrangement with the custodian to receive interest income or be charged an overdraft fees when cash balances are maintained. For financial reporting purposes, the fund includes net earnings credits, if any, as an expense offset in the Statement of Operations.
The fund compensates BNY Mellon Transfer, Inc., a wholly-owned subsidiary of the Adviser, under a transfer agency agreement for providing transfer agency and cash management services for the fund. The majority of transfer agency fees are comprised of amounts paid on a per account basis, while cash management fees are related to fund subscriptions and redemptions. During the period ended October 31, 2019, the fund was charged $1,562 for transfer agency services. These fees are included in Shareholder servicing costs in the Statement of Operations.
The fund compensates The Bank of New York Mellon under a custody agreement for providing custodial services for the fund. These fees are
25
NOTES TO FINANCIAL STATEMENTS(continued)
determined based on net assets, geographic region and transaction activity. During the period ended October 31, 2019, the fund was charged $3,851 pursuant to the custody agreement.
During the period ended October 31, 2019, the fund was charged $11,610 for services performed by the Chief Compliance Officer and his staff. These fees are included in Miscellaneous in the Statement of Operations.
The components of “Due to BNY Mellon Investment Adviser, Inc. and affiliates” in the Statement of Assets and Liabilities consist of: management fees of $90,580, Distribution Plan fees of $17, Shareholder Services Plan fees of $15, custodian fees of $2,058, Chief Compliance Officer fees of $4,504 and transfer agency fees of $266.
(d) Each Board member also serves as a Board member of other funds in the BNY Mellon Family of Funds complex. Annual retainer fees and attendance fees are allocated to each fund based on net assets.
NOTE 4—Securities Transactions:
The aggregate amount of purchases and sales of investment securities, excluding short-term securities, during the period ended October 31, 2019, amounted to $218,545,416 and $252,408,236, respectively.
At October 31, 2019, the cost of investments for federal income tax purposes was $418,645,139, accordingly, accumulated net unrealized appreciation on investments was $4,951,779, consisting of $17,311,420 gross unrealized appreciation and $12,359,641 gross unrealized depreciation.
26
REPORT OF INDEPENDENT REGISTERED PUBLIC ACCOUNTING FIRM
To the Shareholders of the Fund and Board of Directors of
BNY Mellon Investment Funds II, Inc. (formerly, Dreyfus BNY Mellon Funds, Inc.):
Opinion on the Financial Statements
We have audited the accompanying statement of assets and liabilities of BNY Mellon Alternative Diversifier Strategies Fund (formerly, Dreyfus Alternative Diversifier Strategies Fund) (the “Fund”), a series of BNY Mellon Investment Funds II, Inc., including the statement of investments, as of October 31, 2019, and the statement of investments in affiliated issuers as of and for the year then ended, the related statement of operations for the year then ended, the statements of changes in net assets for each of the years in the two-year period then ended, and the related notes (collectively, the financial statements), and the financial highlights for each of the years in the five-year period then ended. In our opinion, the financial statements and financial highlights present fairly, in all material respects, the financial position of the Fund as of October 31, 2019, the results of its operations for the year then ended, the changes in its net assets for each of the years in the two-year period then ended, and the financial highlights for each of the years in the five-year period then ended, in conformity with U.S. generally accepted accounting principles.
Basis for Opinion
These financial statements and financial highlights are the responsibility of the Fund’s management. Our responsibility is to express an opinion on these financial statements and financial highlights based on our audits. We are a public accounting firm registered with the Public Company Accounting Oversight Board (United States) (PCAOB) and are required to be independent with respect to the Fund in accordance with the U.S. federal securities laws and the applicable rules and regulations of the Securities and Exchange Commission and the PCAOB.
We conducted our audits in accordance with the standards of the PCAOB. Those standards require that we plan and perform the audit to obtain reasonable assurance about whether the financial statements and financial highlights are free of material misstatement, whether due to error or fraud. Our audits included performing procedures to assess the risks of material misstatement of the financial statements and financial highlights, whether due to error or fraud, and performing procedures that respond to those risks. Such procedures included examining, on a test basis, evidence regarding the amounts and disclosures in the financial statements and financial highlights. Such procedures also included confirmation of securities owned as of October 31, 2019, by correspondence with the transfer agent and custodian. Our audits also included evaluating the accounting principles used and significant estimates made by management, as well as evaluating the overall presentation of the financial statements and financial highlights. We believe that our audits provide a reasonable basis for our opinion.

We have served as the auditor of one or more BNY Mellon Investment Adviser, Inc. investment companies since 1994.
New York, New York
December 20, 2019
27
IMPORTANT TAX INFORMATION(Unaudited)
For federal tax purposes, the fund reports the maximum amount allowable, but not less than $3,702,941 as ordinary income dividends paid during the year ended October 31, 2019 as qualified dividend income in accordance with Section 854(b)(1)(B) of the Internal Revenue Code. Also, the fund reports the maximum amount allowable but not less than 100% of ordinary income dividends paid during the year ended October 31, 2019 as eligible for the corporate dividends received deduction provided under Section 243 of the Internal Revenue Code in accordance with Section 854(b)(1)(A) of the Internal Revenue Code. Shareholders will receive notification in early 2020 of the percentage applicable to the preparation of their 2019 income tax returns. Also, the fund reports the maximum amount allowable but not less than $.0589 per share as a capital gain dividend in accordance with Section 852(b)(3)(C) of the Internal Revenue Code.
28
BOARD MEMBERS INFORMATION(Unaudited)
INDEPENDENT BOARD MEMBERS
Joseph S. DiMartino (76)
Chairman of the Board (1999)Principal Occupation During Past 5 Years:
· Corporate Director and Trustee (1995-Present)
Other Public Company Board Memberships During Past 5 Years:
· CBIZ, Inc., a public company providing professional business services, products and solutions,Director (1997-Present)
No. of Portfolios for which Board Member Serves:120
———————
Francine J. Bovich (68)
Board Member (2012)
Principal Occupation During Past 5 Years:
· Trustee, The Bradley Trusts, private trust funds (2011-Present)
Other Public Company Board Memberships During Past 5 Years:
· Annaly Capital Management, Inc., a real estate investment trust,Director (2014-Present)
No. of Portfolios for which Board Member Serves:70
———————
Andrew J. Donohue (68)
Board Member (2019)
Principal Occupation During Past 5 Years:
· Of Counsel, Shearman & Sterling LLP (2017-2019)
· Chief of Staff to the Chair of the SEC (2015-2017)
· Managing Director and Investment Company General Counsel of Goldman Sachs (2012-2015)
Other Public Company Board Memberships During Past 5 Years:
· Oppenheimer Funds (58 funds),Director (2017-2019)
No. of Portfolios for which Board Member Serves:56
———————
Kenneth A. Himmel (72)
Board Member (1994)
Principal Occupation During Past 5 Years:
· Managing Partner, Gulf Related, an international real estate development company (2010-Present)
· President and CEO, Related Urban Development, a real estate development company (1996-Present)
· President and CEO, Himmel & Company, a real estate development company (1980-Present)
· CEO, American Food Management, a restaurant company (1983-Present)
No. of Portfolios for which Board Member Serves:23
———————
29
BOARD MEMBERS INFORMATION (Unaudited) (continued)
INDEPENDENT BOARD MEMBERS (continued)
Stephen J. Lockwood (72)
Board Member (1994)
Principal Occupation During Past 5 Years:
· Chairman of the Board, Stephen J. Lockwood and Company LLC, a real estate investment company (2000-Present)
No. of Portfolios for which Board Member Serves:23
———————
Roslyn M. Watson (70)
Board Member (1994)
Principal Occupation During Past 5 Years:
· Principal, Watson Ventures, Inc., a real estate investment company (1993-Present)
Other Public Company Board Memberships During Past 5 Years:
· American Express Bank, FSB,Director (1993-2018)
No. of Portfolios for which Board Member Serves:56
———————
Benaree Pratt Wiley (73)
Board Member (1998)
Principal Occupation During Past 5 Years:
· Principal, The Wiley Group, a firm specializing in strategy and business development (2005-Present)
Other Public Company Board Memberships During Past 5 Years:
· CBIZ, Inc., a public company providing professional business services, products and solutions,Director(2008-Present)
· Blue Cross-Blue Shield of Massachusetts (2004-Present)
No. of Portfolios for which Board Member Serves:76
———————
Once elected all Board Members serve for an indefinite term, but achieve Emeritus status upon reaching age 80. The address of the Board Members and Officers is c/o BNY Mellon Investment Adviser, Inc. 240 Greenwich Street, New York, New York 10286. Additional information about the Board Members is available in the fund’s Statement of Additional Information which can be obtained from the Adviser free of charge by calling this toll free number: 1-800-373-9387.
James M. Fitzgibbons, Emeritus Board Member
30
OFFICERS OF THE FUND(Unaudited)
RENEE LAROCHE-MORRIS, President since May 2019.
President and a director of BNY Mellon Investment Adviser, Inc. since January 2018. She is an officer of 63 investment companies (comprised of 120 portfolios) managed by the Adviser. She is 48 years old and has been an employee of BNY Mellon since 2003.
JAMES WINDELS, Treasurer since November 2001.
Director- BNY Mellon Fund Administration, and an officer of 64 investment companies (comprised of 143 portfolios) managed by the Adviser. He is 61 years old and has been an employee of the Adviser since April 1985.
BENNETT A. MACDOUGALL, Chief Legal Officer since October 2015.
Chief Legal Officer of the Adviser and Associate General Counsel and Managing Director of BNY Mellon since June 2015; Director and Associate General Counsel of Deutsche Bank – Asset & Wealth Management Division from June 2005 to June 2015, and as Chief Legal Officer of Deutsche Investment Management Americas Inc. from June 2012 to May 2015. He is an officer of 64 investment companies (comprised of 143 portfolios) managed by the Adviser. He is 48 years old and has been an employee of the Adviser since June 2015.
DAVID DIPETRILLO, Vice President since May 2019.
Head of North America Product, BNY Mellon Investment Management since January 2018, Director of Product Strategy, BNY Mellon Investment Management from January 2016 to December 2017; Head of US Retail Product and Channel Marketing, BNY Mellon Investment Management from January 2014 to December 2015. He is an officer of 63 investment companies (comprised of 120 portfolios) managed by the Adviser. He is 41 years old and has been an employee of BNY Mellon since 2005.
JAMES BITETTO, Vice President since August 2005 and Secretary since February 2018.
Senior Managing Counsel of BNY Mellon since November 2019; Managing Counsel of BNY Mellon from April 2014 to November 2019; Secretary of the Adviser, and an officer of 64 investment companies (comprised of 143 portfolios) managed by the Adviser. He is 53 years old and has been an employee of the Adviser since December 1996.
SONALEE CROSS, Vice President and Assistant Secretary since March 2018.
Counsel of BNY Mellon since October 2016; Associate at Proskauer Rose LLP from April 2016 to September 2016; Attorney at EnTrust Capital from August 2015 to February 2016; Associate at Sidley Austin LLP from September 2013 to August 2015. She is an officer of 64 investment companies (comprised of 143 portfolios) managed by the Adviser. She is 32 years old and has been an employee of the Adviser since October 2016.
DEIRDRE CUNNANE, Vice President and Assistant Secretary since March 2019.
Counsel of BNY Mellon since August 2018; Senior Regulatory Specialist at BNY Mellon Investment Management Services from February 2016 to August 2018; Trustee Associate at BNY Mellon Trust Company (Ireland) Limited from August 2013 to February 2016. She is an officer of 64 investment companies (comprised of 143 portfolios) managed by the Adviser. She is 29 years old and has been an employee of the Adviser since August 2018.
SARAH S. KELLEHER, Vice President and Assistant Secretary since April 2014.
Managing Counsel of BNY Mellon since December 2017, Senior Counsel of BNY Mellon from March 2013 to December 2017. She is an officer of 64 investment companies (comprised of 143 portfolios) managed by the Adviser. She is 44 years old and has been an employee of the Adviser since March 2013.
JEFF PRUSNOFSKY, Vice President and Assistant Secretary since August 2005.
Senior Managing Counsel of BNY Mellon, and an officer of 64 investment companies (comprised of 143 portfolios) managed by the Adviser. He is 54 years old and has been an employee of the Adviser since October 1990.
PETER M. SULLIVAN, Vice President and Assistant Secretary since March 2019.
Managing Counsel of BNY Mellon, and an officer of 64 investment companies (comprised of 143 portfolios) managed by the Adviser. He is 51 years old and has been an employee of the Adviser since April 2004.
31
OFFICERS OF THE FUND (Unaudited)(continued)
NATALYA ZELENSKY, Vice President and Assistant Secretary since March 2017.
Managing Counsel of BNY Mellon since November 2019; Counsel of BNY Mellon from May 2016 to November 2019; Attorney at Wildermuth Endowment Strategy Fund/Wildermuth Advisory, LLC from November 2015 to May 2016 and Assistant General Counsel at RCS Advisory Services from July 2014 to November 2015. She is an officer of 64 investment companies (comprised of 143 portfolios) managed by the Adviser. She is 34 years old and has been an employee of the Adviser since May 2016.
GAVIN C. REILLY, Assistant Treasurer since December 2005.
Tax Manager - BNY Mellon Fund Administration, and an officer of 64 investment companies (comprised of 143 portfolios) managed by the Adviser. He is 51 years old and has been an employee of the Adviser since April 1991.
ROBERT S. ROBOL, Assistant Treasurer since December 2002.
Senior Accounting Manager- BNY Mellon Fund Administration, and an officer of 64 investment companies (comprised of 143 portfolios) managed by the Adviser. He is 55 years old and has been an employee of the Adviser since October 1988.
ROBERT SALVIOLO, Assistant Treasurer since July 2007.
Senior Accounting Manager – BNY Mellon Fund Administration, and an officer of 64 investment companies (comprised of 143 portfolios) managed by the Adviser. He is 52 years old and has been an employee of the Adviser since June 1989.
ROBERT SVAGNA, Assistant Treasurer since December 2002.
Senior Accounting Manager – BNY Mellon Fund Administration, and an officer of 64 investment companies (comprised of 143 portfolios) managed by the Adviser. He is 52 years old and has been an employee of the Adviser since November 1990.
JOSEPH W. CONNOLLY, Chief Compliance Officer since October 2004.
Chief Compliance Officer of the Adviser, the BNY Mellon Family of Funds and BNY Mellon Funds Trust (64 investment companies, comprised of 143 portfolios). He is 62 years old and has served in various capacities with the the Adviser since 1980, including manager of the firm’s Fund Accounting Department from 1997 through October 2001.
CARIDAD M. CAROSELLA, Anti-Money Laundering Compliance Officer since January 2016.
Anti-Money Laundering Compliance Officer of the BNY Mellon Family of Funds and BNY Mellon Funds Trust since January 2016; from May 2015 to December 2015, Interim Anti-Money Laundering Compliance Officer of the BNY Mellon Family of Funds and BNY Mellon Funds Trust and the Distributor; from January 2012 to May 2015, AML Surveillance Officer of the Distributor. She is an officer of 57 investment companies (comprised of 136 portfolios) managed by the Adviser. She is 51 years old and has been an employee of the Distributor since 1997.
32
NOTES
33
BNY Mellon Alternative Diversifier Strategies Fund
240 Greenwich Street
New York, NY 10286
Adviser
BNY Mellon Investment Adviser, Inc.
240 Greenwich Street
New York, NY 10286
Custodian
The Bank of New York Mellon
240 Greenwich Street
New York, NY 10286
Transfer Agent &
Dividend Disbursing Agent
BNY Mellon Transfer, Inc.
240 Greenwich Street
New York, NY 10286
Distributor
BNY Mellon Securities Corporation
240 Greenwich Street
New York, NY 10286
| | |
Ticker Symbols: | Class A: DRNAX Class C: DRNCX Class I: DRNIX Class Y: DRYNX |
Telephone Call your financial representative or 1-800-373-9387
Mail The BNY Mellon Family of Funds, 144 Glenn Curtiss Boulevard, Uniondale, NY 11556-0144
E-mailSend your request toinfo@bnymellon.com
InternetInformation can be viewed online or downloaded atwww.bnymellonim.com/us
The fund files its complete schedule of portfolio holdings with the Securities and Exchange Commission (“SEC”) for the first and third quarters of each fiscal year on Form N-PORT. The fund’s Forms N-PORT are available on the SEC’s website atwww.sec.gov.
A description of the policies and procedures that the fund uses to determine how to vote proxies relating to portfolio securities and information regarding how the fund voted these proxies for the most recent 12-month period ended June 30 is available atwww.bnymellonim.com/us and on the SEC’s website atwww.sec.gov and without charge, upon request, by calling 1-800-373-9387.
| | |
© 2019 BNY Mellon Securities Corporation
6253AR1019 | 
|
BNY Mellon Global Emerging Markets Fund
| |
ANNUAL REPORT October 31, 2019 |
| |
Save time. Save paper. View your next shareholder report online as soon as it’s available. Log into www.bnymellonim.com/us and sign up for eCommunications. It’s simple and only takes a few minutes. |
| |
The views expressed in this report reflect those of the portfolio manager(s) only through the end of the period covered and do not necessarily represent the views of BNY Mellon Investment Adviser, Inc. or any other person in the BNY Mellon Investment Adviser, Inc. organization. Any such views are subject to change at any time based upon market or other conditions and BNY Mellon Investment Adviser, Inc. disclaims any responsibility to update such views. These views may not be relied on as investment advice and, because investment decisions for a fund in the BNY Mellon Family of Funds are based on numerous factors, may not be relied on as an indication of trading intent on behalf of any fund in the BNY Mellon Family of Funds. |
| |
Not FDIC-Insured • Not Bank-Guaranteed • May Lose Value |
Contents
THE FUND
FOR MORE INFORMATION
Back Cover
| | | | |
| |
BNY Mellon Global Emerging Markets Fund
| | The Fund |
A LETTER FROM THE PRESIDENT OF BNY MELLON INVESTMENT ADVISER, INC.
Dear Shareholder:
We are pleased to present this annual report for BNY Mellon Global Emerging Markets Fund (formerly, Dreyfus Global Emerging Markets Fund), covering the 12-month period from November 1, 2018 through October 31, 2019. For information about how the fund performed during the reporting period, as well as general market perspectives, we provide a Discussion of Fund Performance on the pages that follow.
Equity markets weakened in the fourth quarter of 2018, as concerns about rising interest rates, trade tensions and slowing global growth provided downward pressure on returns. In December 2018, stocks experienced a sharp sell-off, as it appeared that the U.S. Federal Reserve (the “Fed”) would maintain its hawkish stance on monetary policy. In January 2019, a pivot in stance from the Fed helped stimulate a rebound across equity markets that continued into the second quarter. Escalating trade tensions disrupted equity markets again in May. The dip was short-lived, as markets rose once again in June and July of 2019, when a trade deal appeared more likely, and the pace of U.S. economic growth remained steady. Nevertheless, concerns continued to emerge over slowing global growth, resulting in bouts of market volatility in August 2019. Stocks rebounded in September and continued an upward path through most of October 2019, supported in part by central bank policy and consistent consumer spending.
In fixed-income markets, a risk-off mentality prevailed to start the period, fueled in part by equity market volatility. A flight to quality supported price increases for U.S. Treasuries, which continued through the end of 2018, leading to a flattening yield curve. After the Fed’s supportive statements in January 2019, other developed-market central banks followed suit and reiterated their abilities to bolster flagging growth by continuing accommodative policies. This further buoyed fixed-income instrument prices. The Fed cut rates in July, September and October of 2019, for a total 75-basis-point reduction in the federal funds rate during the 12 months. Concerns about the pace of global economic growth also fueled demand for fixed-income instruments during much of the reporting period, resulting in positive bond market returns.
We believe that over the near term, the outlook for the U.S. remains positive, but we will monitor relevant data for any signs of a change. As always, we encourage you to discuss the risks and opportunities in today’s investment environment with your financial advisor.
Thank you for your continued confidence and support.
Sincerely,

Renee LaRoche-Morris
President
BNY Mellon Investment Adviser, Inc.
November 15, 2019
2
DISCUSSION OF FUND PERFORMANCE(Unaudited)
For the period from November 1, 2018 through October 31, 2019, as provided by portfolio managers Robert Marshall-Lee, Sophia Whitbread, CFA and Naomi Waistell, CFA, of Newton Investment Management (North America) Limited, Sub-Investment Adviser
Market and Fund Performance Overview
For the 12-month period ended October 31, 2019, BNY Mellon Global Emerging Markets Fund’s (formerly, Dreyfus Global Emerging Markets Fund) Class A shares produced a total return of 18.28%, Class C shares returned 17.35%, Class I shares returned 18.61%, and Class Y shares returned 18.61%.1 In comparison, the fund’s benchmark, the MSCI Emerging Markets Index (the “Index”), produced a total return of 11.86% for the same period.2
Emerging markets encountered pockets of volatility during the reporting period, but posted gains for the 12 months, due in part to continued accommodative monetary policies from major central banks and optimism regarding a U.S.-China trade resolution. The fund outperformed the Index, mainly due to stock selection within the consumer discretionary, financials and health care sectors.
The Fund’s Investment Approach
The fund seeks long-term capital appreciation. To pursue its goal, the fund normally invests at least 80% of its net assets, plus any borrowings for investment purposes, in common stocks and other equity securities (or derivatives or other strategic instruments with similar economic characteristics) of companies organized or with their principal place of business, or majority of assets or business, in emerging-market countries. The portfolio managers employ a fundamental, bottom-up investment process that emphasizes quality, return on capital employed and governance. The process of identifying investment ideas begins by identifying a core list of investment themes. These themes are based primarily on observable global economic, industrial or social trends that the portfolio managers believe will positively affect certain sectors or industries and cause stocks within these sectors or industries to outperform others. The portfolio managers then identify specific companies, using investment themes to help focus on areas where thematic and strategic research indicates positive returns are likely to be achieved.
Markets Pivot on Central Bank and Trade Policy
Concerns over the U.S.-China trade dispute had depressed Chinese asset prices early in the fourth quarter 2018 before the reporting period began, but we saw a relief rally in November 2018, in the lead-up to the G20 meeting, from which a more constructive tone emerged. However, in December 2018, global equities plumbed new lows for the year, as the tone of the U.S. Federal Reserve’s (the “Fed”) forward-looking commentary once again unnerved investors. Political concerns in developed as well as emerging markets contributed to the broader malaise. However, emerging-market equities outperformed U.S. and broader developed markets toward the end of 2018, even though they were not immune to the fourth-quarter pullback. China, in particular, suffered declines. In contrast, the first quarter of 2019 heralded a rebound in equity markets from the lows of late 2018. Despite fears over moderating economic growth in emerging markets and the world at large, markets rose on improving sentiment regarding the U.S.-China trade talks, although no agreement had been
3
DISCUSSION OF FUND PERFORMANCE(Unaudited) (continued)
reached by the end of the period. The market rise over the period was also attributable to interest-rate cuts by the Fed and some emerging-market central banks.
China, following an excessive sell-off through 2018, was the best-performing major market in the first three months of 2019 though only marginally outperformed over the full period. Third-quarter 2019 gross domestic product (GDP) growth fell, as both the domestic and export sides of the economy remained under pressure, though a lot of consumer-focused areas continued to show robust growth. China’s central bank cut large banks’ reserve requirement ratios. The Indian market outperformed through the period, having rallied through November 2018 after a weak October and November, and remaining resilient in December. However, it lagged over the first quarter of 2019, despite a dramatic rise in March, as uncertainty weighed around upcoming elections—and a rising oil price added some pressure. Prime Minister Narendra Modi’s subsequent re-election was seen as a positive political development, but economic news generally disappointed, linked to the 2018 liquidity squeeze on non-bank financial companies and associated credit becoming less accessible for consumers and corporates, with the GDP growth rate softening in the latter half of the period. However, a series of interest rate cuts, as inflationary pressures subsided, and a cut in corporate tax rates in September 2019 provided a marked shift. Brazil marginally outperformed the Index over the review period, after the election of right-wing candidate Jair Bolsonaro to the presidency raised expectations of economic reform and greater stability. Brazil’s central bank also cut interest rates. Conversely, Argentina was the worst-performing market, with the country gripped by economic and political crisis, and with the government implementing currency controls to support the peso and stem currency outflows.
Consumer Discretionary, Financials, and Health Care Stock Selection Drives Outperformance
At the sector level, the fund benefited most from stock selection within the consumer discretionary, financials and health care sectors. At a country level, positioning in India was strong. Five of the fund’s ten top performance contributors over the period were Indian stocks. Positioning within China and Argentina was also beneficial, owing largely to the holdings in New Oriental Education & Technology Group and IT services company Globant, respectively. The top contributor to performance over the period was New Oriental Education & Technology Group, which has appreciated sharply over the review period, thanks to strong growth in its core, after-school tutoring business. We initiated a position in New Oriental Education & Technology Group, when it was out of favor in late 2018 on China trade fears, as we were attracted by its thematic support, its strong cash generation and its robust balance sheet. India was a very positive contributor on a country basis, led by consumer stocks jeweler Titan, food services company Jubilant Foodworks and financial services company Reliance Nippon Life Asset Management.
Conversely, positioning within materials and consumer staples, and the void in real estate, were the biggest detractors at the sector level. At a country level, South Africa was the largest detractor, owing to the holdings in British American Tobacco and insurer Discovery. The void position in Russia hurt relative performance as it rallied, led by oil stocks. Battery maker Samsung SDI was a large individual stock detractor, after the company reported slightly softer-than-expected results and guidance in March. The company faced issues with its
4
energy-storage system battery business, and the rollback of electric-vehicle subsidies in China also caused concern. There was also weakness in the somewhat related lithium mining stocks Sociedad Química y Minera de Chile and Orocobre, because of soft spot prices and delays to production. The manager remains very positive on these electric vehicle related investments as European and Chinese regulation will drive rapid adoption in coming years. Indian finance company Edelweiss Financial Services also detracted, a victim of the Indian liquidity squeeze mentioned above. In addition, the fund’s positioning in South Africa was a negative factor. British American Tobacco (BAT) detracted owing to negative sentiment and news flow about the company and the sector as a whole, in relation to e-cigarettes. BAT retains its attraction, owing to the combination of its diversified global footprint, its portfolio of next-generation products and attractive valuation. Life and health insurer Discovery fell, following the release of a National Health Insurance Bill, which has been widely anticipated, but surprised the market by suggesting that medical schemes would only be able to cover services not offered by the National Health Insurance. We continue to believe that this company has excellent growth prospects, led by an innovative management team in behavioral finance.
Seeking Growth Opportunities at Attractive Valuations
For 2020, we believe the investment backdrop in emerging markets is likely to remain mixed. However, on a relative basis, overall growth for some emerging markets is forecast to improve, due in part to supportive reform agendas such as tax cuts in India and a potential reduction in trade frictions with China. Looser central bank policy globally and less potential for dollar appreciation should also aid emerging-market performance next year, reigniting their growth premium over developed markets. It should be noted that emerging market equities have derated, as have their currencies, providing attractive value for the growth on offer.
Emerging-market economies and opportunities are not homogeneous, and looking at them in aggregate causes a number of distortions, not least the terms-of-trade shock experienced by the commodity-reliant bloc of countries, whose poster child has been Brazil. As China rebalances away from heavy, commodity-fueled, investment-led growth, toward a consumption- and services-led model, the growth of certain emerging markets has waned. The new emerging-market growth drivers are related to rising wealth effects and still nascent service sectors. The size of the market opportunity, given the vast populations in China and India—with still low levels of penetration and monetization—make this a compelling prospect for many emerging-market investors.
Recently, we have witnessed a significant de-rating, even for stocks with good growth prospects, which contrasts with the U.S. equity market, which has re-rated. We believe this bodes well for future emerging-market equity performance, as emerging-market equities appear cheap, not least for the high sustainable growth rates of a number of companies. Due to this, we continue to believe the best, long-term, emerging-market investment opportunities lie within the consumer and service sectors, such as the Internet, education or specific discretionary spending beneficiaries. Thematically-supported areas such as this, with structural growth, are not immune from cyclicality, but tend to be far more defensive and have more robust growth runways. Our strategy focuses on structural growth opportunities,
5
DISCUSSION OF FUND PERFORMANCE(Unaudited) (continued)
in preference to reliance on cyclical growth, but the share prices and currencies are still buffeted by sentiment, providing opportunities to the more discerning investor.
November 15, 2019
1 Total return includes reinvestment of dividends and any capital gains paid and does not take into consideration the maximum initial sales charge in the case of Class A shares, or the applicable contingent deferred sales charges imposed on redemptions in the case of Class C shares. Had these charges been reflected, returns would have been lower. Share price, yield and investment return fluctuate such that upon redemption, fund shares may be worth more or less than their original cost. Past performance is no guarantee of future results. The fund’s figures provided reflect the absorption of certain fund expenses by BNY Mellon Investment Adviser, Inc. pursuant to an agreement in effect through March 1, 2020, at which time it may be extended, terminated or modified. Had these expenses not been absorbed, the fund’s returns would have been lower.
2 Source: Lipper Inc. — The MSCI Emerging Markets Index is a free float-adjusted, market capitalization-weighted index that is designed to measure equity market performance of emerging markets. It reflects reinvestment of net dividends and, where applicable, capital gain distributions. Investors cannot invest directly in any index.
Equities are subject generally to market, market sector, market liquidity, issuer and investment style risks, among other factors, to varying degrees, all of which are more fully described in the fund’s prospectus.
Emerging markets tend to be more volatile than the markets of more mature economies and generally have less diverse and less mature economic structures and less stable political systems than those of developed countries. The securities of companies located in emerging markets are often subject to rapid and large changes in price. An investment in this fund should be considered only as a supplement to a complete investment program for those investors willing to accept the greater risks associated with investing in emerging-market countries.
Investing internationally involves special risks, including changes in currency exchange rates, political, economic, and social instability, a lack of comprehensive company information, differing auditing and legal standards and less market liquidity. These risks generally are greater with emerging-market countries than with more economically and politically established foreign countries.
The fund may, but is not required to, use derivative instruments, such as options, futures, options on futures, forward contracts and other credit derivatives. A small investment in derivatives could have a potentially large impact on the fund’s performance. The use of derivatives involves risks different from, or possibly greater than, the risks associated with investing directly in the underlying assets.
6
FUND PERFORMANCE(Unaudited)
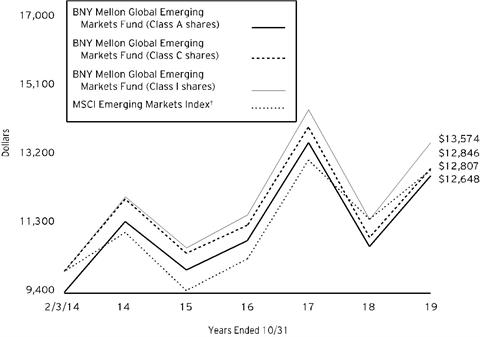
Comparison of change in value of a $10,000 investment in Class A shares, Class C shares and Class I shares of BNY Mellon Global Emerging Markets Fund with a hypothetical investment of $10,000 in the MSCI Emerging Markets Index (the “Index”)
† Source: Lipper Inc.
Past performance is not predictive of future performance.
The above graph compares a hypothetical $10,000 investment made in each of the Class A, Class C, and Class I shares of BNY Mellon Global Emerging Markets Fund on 2/3/14 (inception date) to a hypothetical investment of $10,000 made in the Index on that date. All dividends and capital gain distributions are reinvested.
The fund’s performance shown in the line graph above takes into account the maximum initial sales charge on Class A shares and all other applicable fees and expenses on all classes. The Index is a free float-adjusted market capitalization-weighted index that is designed to measure equity market performance of emerging markets. Unlike a mutual fund, the Index is not subject to charges, fees and other expenses. Investors cannot invest directly in any index. Further information relating to fund performance, including expense reimbursements, if applicable, is contained in the Financial Highlights section of the prospectus and elsewhere in this report.
7
FUND PERFORMANCE(Unaudited) (continued)
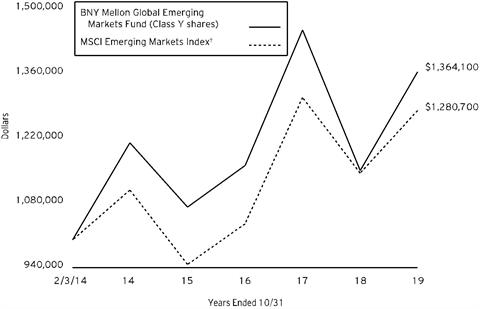
Comparison of change in value of a $1,000,000 investment in Class Y shares of BNY Mellon Global Emerging Markets Fund with a hypothetical investment of $1,000,000 in the MSCI Emerging Markets Index (the “Index”)
† Source: Lipper Inc.
Past performance is not predictive of future performance.
The above graph compares a hypothetical $1,000,000 investment made in Class Y shares of BNY Mellon Global Emerging Markets Fund on 2/3/14 (inception date) to a hypothetical investment of $1,000,000 made in the Index on that date. All dividends and capital gain distributions are reinvested.
The fund’s performance shown in the line graph above takes into account all applicable fees and expenses of the fund’s Class Y shares. The Index is a free float-adjusted market capitalization-weighted index that is designed to measure equity market performance of emerging markets. Unlike a mutual fund, the Index is not subject to charges, fees and other expenses. Investors cannot invest directly in any index. Further information relating to fund performance, including expense reimbursements, if applicable, is contained in the Financial Highlights section of the prospectus and elsewhere in this report.
8
| | | | | | | |
Average Annual Total Returns as of 10/31/19
|
| Inception
Date | 1 Year | 5 Year | | From
Inception | |
Class A shares |
|
|
| |
| |
with maximum sales charge (5.75%) | 2/3/14 | 11.44% | 0.93% | | 4.18% | |
without sales charge | 2/3/14 | 18.28% | 2.14% | | 5.26% | |
Class C shares | | | | |
with applicable redemption charge† | 2/3/14 | 16.35% | 1.36% | | 4.46% | |
without redemption | 2/3/14 | 17.35% | 1.36% | | 4.46% | |
Class I shares | 2/3/14 | 18.61% | 2.37% | | 5.47% | |
Class Y shares | 2/3/14 | 18.61% | 2.42% | | 5.56% | |
MSCI Emerging Markets Index | 1/31/14 | 11.86% | 2.93% | | 4.40% | †† |
† The maximum contingent deferred sales charge for Class C shares is 1% for shares redeemed within one year of the date of purchase.
†† For comparative purposes, the value of the Index as of 1/31/14 is used as the beginning value on 2/3/14.
The performance data quoted represents past performance, which is no guarantee of future results. Share price and investment return fluctuate and an investor’s shares may be worth more or less than original cost upon redemption. Current performance may be lower or higher than the performance quoted. Go to www.bnymellonim.com/us for the fund’s most recent month-end returns.
The fund’s performance shown in the graphs and table does not reflect the deduction of taxes that a shareholder would pay on fund distributions or the redemption of fund shares. In addition to the performance of Class A shares shown with and without a maximum sales charge, the fund’s performance shown in the table takes into account all other applicable fees and expenses on all classes.
9
UNDERSTANDING YOUR FUND’S EXPENSES(Unaudited)
As a mutual fund investor, you pay ongoing expenses, such as management fees and other expenses. Using the information below, you can estimate how these expenses affect your investment and compare them with the expenses of other funds. You also may pay one-time transaction expenses, including sales charges (loads) and redemption fees, which are not shown in this section and would have resulted in higher total expenses. For more information, see your fund’s prospectus or talk to your financial adviser.
Review your fund’s expenses
The table below shows the expenses you would have paid on a $1,000 investment in BNY Mellon Global Emerging Markets Fund from May 1, 2019 to October 31, 2019. It also shows how much a $1,000 investment would be worth at the close of the period, assuming actual returns and expenses.
| | | | | | | |
Expenses and Value of a $1,000 Investment | |
Assume actual returns for the six months ended October 31, 2019 | |
| | | | | | |
| | Class A | Class C | Class I | Class Y | |
Expense paid per $1,000† | $6.29 | $10.05 | $5.04 | $4.79 | |
Ending value (after expenses) | $997.50 | $993.00 | $998.80 | $998.80 | |
COMPARING YOUR FUND’S EXPENSES
WITH THOSE OF OTHER FUNDS(Unaudited)
Using the SEC’s method to compare expenses
The Securities and Exchange Commission (“SEC”) has established guidelines to help investors assess fund expenses. Per these guidelines, the table below shows your fund’s expenses based on a $1,000 investment, assuming a hypothetical 5% annualized return. You can use this information to compare the ongoing expenses (but not transaction expenses or total cost) of investing in the fund with those of other funds. All mutual fund shareholder reports will provide this information to help you make this comparison. Please note that you cannot use this information to estimate your actual ending account balance and expenses paid during the period.
| | | | | | | |
Expenses and Value of a $1,000 Investment | |
Assuming a hypothetical 5% annualized return for the six months ended October 31, 2019 | |
| | | | | | |
| | Class A | Class C | Class I | Class Y | |
Expense paid per $1,000† | $6.36 | $10.16 | $5.09 | $4.84 | |
Ending value (after expenses) | $1,018.90 | $1,015.12 | $1,020.16 | $1,020.42 | |
† Expenses are equal to the fund’s annualized expense ratio of 1.25% for Class A, 2.00% for Class C, 1.00% for Class I and .95% for Class Y, multiplied by the average account value over the period, multiplied by 184/365 (to reflect the one-half year period). |
10
STATEMENT OF INVESTMENTS
October 31, 2019
| | | | | | | | |
| |
Description | | | | Shares | | Value ($) | |
Common Stocks - 98.0% | | | | | |
Argentina - 3.0% | | | | | |
Globant | | | | 69,186 | a,b | 6,452,286 | |
MercadoLibre | | | | 3,846 | b | 2,005,766 | |
| | | | | 8,458,052 | |
Australia - 1.6% | | | | | |
IDP Education | | | | 125,248 | | 1,536,847 | |
Orocobre | | | | 1,595,863 | a,b | 2,893,284 | |
| | | | | 4,430,131 | |
Brazil - 2.6% | | | | | |
Arco Platform, Cl. A | | | | 50,314 | b | 2,088,031 | |
CVC Brasil Operadora e Agencia de Viagens | | | | 399,200 | | 5,088,419 | |
| | | | | 7,176,450 | |
Chile - .7% | | | | | |
Sociedad Quimica y Minera de Chile, ADR | | | | 76,244 | a | 2,072,312 | |
China - 24.8% | | | | | |
3SBio | | | | 473,000 | b,c | 884,919 | |
51job, ADR | | | | 63,599 | a,b | 5,009,693 | |
Alibaba Group Holding, ADR | | | | 87,768 | b | 15,505,973 | |
Autohome, ADR | | | | 128,087 | a,b | 10,831,037 | |
China Harmony New Energy Auto Holding | | | | 7,220,500 | | 2,487,937 | |
China Yongda Automobiles Services Holdings | | | | 3,045,500 | | 2,592,345 | |
GSX Techedu | | | | 114,507 | a,b | 1,962,650 | |
Meituan Dianping, Cl. B | | | | 347,018 | b | 4,147,326 | |
New Oriental Education & Technology Group, ADR | | | | 134,757 | b | 16,448,439 | |
Tencent Holdings | | | | 236,722 | | 9,691,284 | |
| | | | | 69,561,603 | |
Germany - 1.7% | | | | | |
Delivery Hero | | | | 101,043 | b,c | 4,736,498 | |
Hong Kong - 4.4% | | | | | |
AIA Group | | | | 1,235,000 | | 12,364,263 | |
India - 26.1% | | | | | |
Apollo Hospitals Enterprise | | | | 152,686 | | 3,196,280 | |
Asian Paints Ltd | | | | 55,325 | | 1,411,503 | |
Edelweiss Financial Services | | | | 1,565,112 | | 2,038,896 | |
Godrej Consumer Products | | | | 617,652 | | 6,447,014 | |
Hindustan Unilever | | | | 140,883 | | 4,320,813 | |
Housing Development Finance | | | | 425,053 | | 12,775,786 | |
Info Edge India | | | | 211,836 | | 7,672,582 | |
11
STATEMENT OF INVESTMENTS (continued)
| | | | | | | | |
| |
Description | | | | Shares | | Value ($) | |
Common Stocks - 98.0% (continued) | | | | | |
India - 26.1% (continued) | | | | | |
Jubilant Foodworks | | | | 325,621 | | 7,349,441 | |
Maruti Suzuki India | | | | 102,525 | | 10,926,845 | |
PVR | | | | 204,660 | | 5,127,411 | |
Reliance Nippon Life Asset Management | | | | 525,003 | c | 2,680,575 | |
Titan | | | | 501,840 | | 9,418,598 | |
| | | | | 73,365,744 | |
Netherlands - 2.5% | | | | | |
ASML Holding | | | | 10,273 | | 2,692,507 | |
Prosus | | | | 64,601 | b | 4,454,820 | |
| | | | | 7,147,327 | |
South Africa - 6.5% | | | | | |
Clicks Group | | | | 262,154 | | 4,264,069 | |
Discovery | | | | 637,320 | | 5,072,241 | |
Naspers, Cl. N | | | | 63,615 | | 9,033,073 | |
| | | | | 18,369,383 | |
South Korea - 11.5% | | | | | |
Iljin Materials Co Ltd | | | | 127,985 | b | 4,323,186 | |
LG Household & Health Care | | | | 6,195 | | 6,714,423 | |
Samsung Electronics | | | | 127,949 | | 5,542,679 | |
Samsung SDI | | | | 80,011 | | 15,645,281 | |
| | | | | 32,225,569 | |
Taiwan - 5.7% | | | | | |
Taiwan Semiconductor Manufacturing | | | | 1,625,000 | | 15,934,774 | |
Thailand - .3% | | | | | |
Kasikornbank | | | | 165,800 | | 763,246 | |
United Kingdom - 1.8% | | | | | |
British American Tobacco | | | | 78,977 | | 2,771,682 | |
Unilever | | | | 36,596 | | 2,161,182 | |
| | | | | 4,932,864 | |
United States - 4.8% | | | | | |
Applied Materials | | | | 94,542 | | 5,129,849 | |
EPAM Systems | | | | 17,251 | b | 3,035,486 | |
Laureate Education, Cl. A | | | | 110,842 | b | 1,713,063 | |
Livent | | | | 506,728 | b | 3,476,154 | |
| | | | | 13,354,552 | |
Total Common Stocks(cost $224,495,782) | | | | 274,892,768 | |
| | | 1-Day
Yield (%) | | | | | |
Investment Companies - 1.7% | | | | | |
Registered Investment Companies - 1.7% | | | | | |
Dreyfus Institutional Preferred Government Plus Money Market Fund
(cost $4,912,165) | | 1.79 | | 4,912,165 | d | 4,912,165 | |
12
| | | | | | | | |
| |
Description | | 1-Day
Yield (%) | | Shares | | Value ($) | |
Investment of Cash Collateral for Securities Loaned - 1.5% | | | | | |
Registered Investment Companies - 1.5% | | | | | |
Dreyfus Institutional Preferred Government Plus Money Market Fund
(cost $4,090,097) | | 1.79 | | 4,090,097 | d | 4,090,097 | |
Total Investments(cost $233,498,044) | | 101.2% | | 283,895,030 | |
Liabilities, Less Cash and Receivables | | (1.2%) | | (3,295,538) | |
Net Assets | | 100.0% | | 280,599,492 | |
ADR—American Depository Receipt
aSecurity, or portion thereof, on loan. At October 31, 2019, the value of the fund’s securities on loan was $20,779,827 and the value of the collateral was $21,344,924, consisting of cash collateral of $4,090,097 and U.S. Government & Agency securities valued at $17,254,827.
bNon-income producing security.
cSecurity exempt from registration pursuant to Rule 144A under the Securities Act of 1933. These securities may be resold in transactions exempt from registration, normally to qualified institutional buyers. At October 31, 2019, these securities were valued at $8,301,992 or 2.96% of net assets.
dInvestment in affiliated issuer. The investment objective of this investment company is publicly available and can be found within the investment company’s prospectus.
| | |
Portfolio Summary (Unaudited)† | Value (%) |
Retailing | 16.0 |
Consumer Services | 12.9 |
Media & Entertainment | 11.9 |
Technology Hardware & Equipment | 9.1 |
Semiconductors & Semiconductor Equipment | 8.5 |
Household & Personal Products | 7.0 |
Insurance | 6.2 |
Banks | 4.8 |
Automobiles & Components | 3.9 |
Materials | 3.5 |
Software & Services | 3.4 |
Consumer Durables & Apparel | 3.4 |
Investment Companies | 3.2 |
Commercial & Professional Services | 1.8 |
Diversified Financials | 1.7 |
Food & Staples Retailing | 1.5 |
Health Care Equipment & Services | 1.1 |
Food, Beverage & Tobacco | 1.0 |
Pharmaceuticals Biotechnology & Life Sciences | .3 |
| | 101.2 |
† Based on net assets.
See notes to financial statements.
13
STATEMENT OF INVESTMENTS IN AFFILIATED ISSUERS
| | | | | | | |
Investment Companies | Value
10/31/18 ($) | Purchases ($) | Sales ($) | Value
10/31/19 ($) | Net
Assets (%) | Dividends/
Distributions ($) |
Registered
Investment Companies; | | | | |
Dreyfus Institutional Preferred Government Plus Money Market Fund | 566,825 | 86,562,877 | 82,217,537 | 4,912,165 | 1.7 | 86,527 |
Investment of Cash Collateral
for Securities Loaned; | | | | |
Dreyfus Institutional Preferred Government Plus Money Market Fund | - | 81,019,482 | 76,929,385 | 4,090,097 | 1.5 | - |
Total | 566,825 | 167,582,359 | 159,146,922 | 9,002,262 | 3.2 | 86,527 |
See notes to financial statements.
14
STATEMENT OF FORWARD FOREIGN CURRENCY EXCHANGE CONTRACTSOctober 31, 2019
| | | | | | |
Counterparty/ Purchased
Currency | Purchased Currency
Amounts | Currency
Sold | Sold
Currency
Amounts | Settlement Date | Unrealized (Depreciation)($) |
Barclays Capital | | | |
United States Dollar | 1,721 | Hong Kong Dollar | 13,489 | 11/4/19 | - |
State Street Bank and Trust Company | | | |
United States Dollar | 3,088 | Hong Kong Dollar | 24,212 | 11/1/19 | (2) |
Gross Unrealized Depreciation | | | (2) |
See notes to financial statements.
15
STATEMENT OF ASSETS AND LIABILITIES
October 31, 2019
| | | | | | | |
| | | | | | |
| | | Cost | | Value | |
Assets ($): | | | | |
Investments in securities—See Statement of Investments
(including securities on loan, valued at $20,779,827)—Note 1(c): | | | |
Unaffiliated issuers | 224,495,782 | | 274,892,768 | |
Affiliated issuers | | 9,002,262 | | 9,002,262 | |
Cash denominated in foreign currency | | | 1,624,790 | | 1,636,046 | |
Receivable for shares of Common Stock subscribed | | 207,795 | |
Dividends, interest and securities lending income receivable | | 191,048 | |
Tax reclaim receivable | | 8,915 | |
Receivable for investment securities sold | | 4,809 | |
Prepaid expenses | | | | | 21,098 | |
| | | | | 285,964,741 | |
Liabilities ($): | | | | |
Due to BNY Mellon Investment Adviser, Inc. and affiliates—Note 3(c) | | 291,881 | |
Liability for securities on loan—Note 1(c) | | 4,090,097 | |
Payable for investment securities purchased | | 760,244 | |
Payable for shares of Common Stock redeemed | | 140,946 | |
Directors fees and expenses payable | | 5,754 | |
Unrealized depreciation on forward foreign
currency exchange contracts—Note 4 | | 2 | |
Other accrued expenses | | | | | 76,325 | |
| | | | | 5,365,249 | |
Net Assets ($) | | | 280,599,492 | |
Composition of Net Assets ($): | | | | |
Paid-in capital | | | | | 289,730,170 | |
Total distributable earnings (loss) | | | | | (9,130,678) | |
Net Assets ($) | | | 280,599,492 | |
| | | | | | |
Net Asset Value Per Share | Class A | Class C | Class I | Class Y | |
Net Assets ($) | 3,795,438 | 3,798,278 | 50,398,926 | 222,606,850 | |
Shares Outstanding | 233,625 | 241,450 | 3,085,152 | 13,576,752 | |
Net Asset Value Per Share ($) | 16.25 | 15.73 | 16.34 | 16.40 | |
| | | | | |
See notes to financial statements. | | | | | |
16
STATEMENT OF OPERATIONS
Year Ended October 31, 2019
| | | | | | | |
| | | | | | |
| | | | | | |
Investment Income ($): | | | | |
Income: | | | | |
Cash dividends (net of $432,822 foreign taxes withheld at source): | |
Unaffiliated issuers | | | 3,447,359 | |
Affiliated issuers | | | 86,527 | |
Income from securities lending—Note 1(c) | | | 516,106 | |
Interest | | | 1,941 | |
Total Income | | | 4,051,933 | |
Expenses: | | | | |
Management fee—Note 3(a) | | | 2,091,770 | |
Custodian fees—Note 3(c) | | | 269,696 | |
Professional fees | | | 187,521 | |
Registration fees | | | 64,933 | |
Shareholder servicing costs—Note 3(c) | | | 51,851 | |
Distribution fees—Note 3(b) | | | 32,541 | |
Directors’ fees and expenses—Note 3(d) | | | 25,900 | |
Prospectus and shareholders’ reports | | | 25,855 | |
Loan commitment fees—Note 2 | | | 6,150 | |
Interest expense—Note 2 | | | 4,070 | |
Miscellaneous | | | 45,897 | |
Total Expenses | | | 2,806,184 | |
Less—reduction in expenses due to undertaking—Note 3(a) | | | (7,340) | |
Net Expenses | | | 2,798,844 | |
Investment Income—Net | | | 1,253,089 | |
Realized and Unrealized Gain (Loss) on Investments—Note 4 ($): | | |
Net realized gain (loss) on investments and foreign currency transactions | (29,217,041) | |
Net realized gain (loss) on forward foreign currency exchange contracts | (28,387) | |
Net Realized Gain (Loss) | | | (29,245,428) | |
Net change in unrealized appreciation (depreciation) on investments
and foreign currency transactions | 75,517,014 | |
Net change in unrealized appreciation (depreciation) on
forward foreign currency exchange contracts | (31) | |
Net Change in Unrealized Appreciation (Depreciation) | | | 75,516,983 | |
Net Realized and Unrealized Gain (Loss) on Investments | | | 46,271,555 | |
Net Increase in Net Assets Resulting from Operations | | 47,524,644 | |
| | | | | | |
See notes to financial statements. | | | | | |
17
STATEMENT OF CHANGES IN NET ASSETS
| | | | | | | | | | |
| | | | Year Ended October 31, |
| | | | 2019 | | 2018 | |
Operations ($): | | | | | | | | |
Investment income—net | | | 1,253,089 | | | | 1,423,352 | |
Net realized gain (loss) on investments | | (29,245,428) | | | | (13,452,915) | |
Net change in unrealized appreciation
(depreciation) on investments | | 75,516,983 | | | | (76,631,277) | |
Net Increase (Decrease) in Net Assets
Resulting from Operations | 47,524,644 | | | | (88,660,840) | |
Distributions ($): | |
Distributions to shareholders: | | | | | | | | |
Class A | | | (35,070) | | | | (64,752) | |
Class C | | | (5,385) | | | | (39,963) | |
Class I | | | (806,435) | | | | (1,578,968) | |
Class Y | | | (2,751,960) | | | | (2,055,834) | |
Total Distributions | | | (3,598,850) | | | | (3,739,517) | |
Capital Stock Transactions ($): | |
Net proceeds from shares sold: | | | | | | | | |
Class A | | | 996,504 | | | | 8,786,724 | |
Class C | | | 319,913 | | | | 5,037,505 | |
Class I | | | 15,921,975 | | | | 125,517,169 | |
Class Y | | | 35,012,923 | | | | 123,713,498 | |
Distributions reinvested: | | | | | | | | |
Class A | | | 34,189 | | | | 63,574 | |
Class C | | | 5,352 | | | | 39,628 | |
Class I | | | 781,819 | | | | 1,533,173 | |
Class Y | | | 1,980,059 | | | | 1,533,173 | |
Cost of shares redeemed: | | | | | | | | |
Class A | | | (2,972,769) | | | | (5,782,678) | |
Class C | | | (2,029,843) | | | | (1,888,477) | |
Class I | | | (53,972,963) | | | | (125,928,486) | |
Class Y | | | (48,615,555) | | | | (23,279,177) | |
Increase (Decrease) in Net Assets
from Capital Stock Transactions | (52,538,396) | | | | 109,345,626 | |
Total Increase (Decrease) in Net Assets | (8,612,602) | | | | 16,945,269 | |
Net Assets ($): | |
Beginning of Period | | | 289,212,094 | | | | 272,266,825 | |
End of Period | | | 280,599,492 | | | | 289,212,094 | |
18
| | | | | | | | | | |
| | | | Year Ended October 31, |
| | | | 2019 | | 2018 | |
Capital Share Transactions (Shares): | |
Class A | | | | | | | | |
Shares sold | | | 64,821 | | | | 474,831 | |
Shares issued for distributions reinvested | | | 2,440 | | | | 3,429 | |
Shares redeemed | | | (202,357) | | | | (341,007) | |
Net Increase (Decrease) in Shares Outstanding | (135,096) | | | | 137,253 | |
Class C | | | | | | | | |
Shares sold | | | 21,865 | | | | 280,331 | |
Shares issued for distributions reinvested | | | 392 | | | | 2,193 | |
Shares redeemed | | | (138,004) | | | | (117,933) | |
Net Increase (Decrease) in Shares Outstanding | (115,747) | | | | 164,591 | |
Class Ia | | | | | | | | |
Shares sold | | | 1,042,122 | | | | 6,891,404 | |
Shares issued for distributions reinvested | | | 55,817 | | | | 82,252 | |
Shares redeemed | | | (3,602,252) | | | | (7,464,373) | |
Net Increase (Decrease) in Shares Outstanding | (2,504,313) | | | | (490,717) | |
Class Ya | | | | | | | | |
Shares sold | | | 2,342,188 | | | | 7,005,617 | |
Shares issued for distributions reinvested | | | 140,430 | | | | 77,954 | |
Shares redeemed | | | (3,252,946) | | | | (1,421,158) | |
Net Increase (Decrease) in Shares Outstanding | (770,328) | | | | 5,662,413 | |
| | | | | | | | | |
a During the period ended October 31, 2019, 46,253 Class Y shares representing $715,595 were exchanged for 46,433 Class I shares and during the period ended October 31, 2018, 5,878 Class Y shares representing $106,075 were exchanged for 5,905 Class I shares. | |
See notes to financial statements.
| | | | | | | | |
19
FINANCIAL HIGHLIGHTS
The following tables describe the performance for each share class for the fiscal periods indicated. All information (except portfolio turnover rate) reflects financial results for a single fund share. Total return shows how much your investment in the fund would have increased (or decreased) during each period, assuming you had reinvested all dividends and distributions. These figures have been derived from the fund’s financial statements.
| | | | | | | | | | | | |
| | | | | |
| | | | |
| | Year Ended October 31, |
Class A Shares | | 2019 | 2018 | 2017 | 2016 | 2015 |
Per Share Data ($): | | | | | | |
Net asset value, beginning of period | | 13.86 | 17.79 | 14.24 | 13.15 | 15.09 |
Investment Operations: | | | | | | |
Investment income (loss)—neta | | .03 | .03 | (.03) | (.02) | (.01) |
Net realized and unrealized gain (loss)
on investments | | 2.48 | (3.75) | 3.58 | 1.11 | (1.77) |
Total from Investment Operations | | 2.51 | (3.72) | 3.55 | 1.09 | (1.78) |
Distributions: | | | | | | |
Dividends from investment income—net | | (.12) | (.21) | − | − | (.04) |
Dividends from net realized gain
on investments | | − | − | − | − | (.12) |
Total Distributions | | (.12) | (.21) | − | − | (.16) |
Net asset value, end of period | | 16.25 | 13.86 | 17.79 | 14.24 | 13.15 |
Total Return (%)b | | 18.28 | (21.19) | 25.02 | 8.13 | (11.80) |
Ratios/Supplemental Data (%): | | | | | | |
Ratio of total expenses
to average net assets | | 1.32 | 1.34 | 1.55 | 1.82 | 1.82 |
Ratio of net expenses
to average net assets | | 1.25 | 1.25 | 1.28 | 1.53 | 1.60 |
Ratio of net investment income (loss)
to average net assets | | .22 | .16 | (.17) | (.18) | (.05) |
Portfolio Turnover Rate | | 48.73 | 41.94 | 36.79 | 51.42 | 32.72 |
Net Assets, end of period ($ x 1,000) | | 3,795 | 5,109 | 4,117 | 297 | 174 |
a Based on average shares outstanding.
b Exclusive of sales charge.
See notes to financial statements.
20
| | | | | | | | | |
| | | | |
| | | | |
| | Year Ended October 31, |
Class C Shares | | 2019 | 2018 | 2017 | 2016 | 2015 |
Per Share Data ($): | | | | | | |
Net asset value, beginning of period | | 13.42 | 17.32 | 13.96 | 12.99 | 15.01 |
Investment Operations: | | | | | | |
Investment (loss)—neta | | (.08) | (.10) | (.15) | (.13) | (.13) |
Net realized and unrealized gain (loss)
on investments | | 2.41 | (3.63) | 3.51 | 1.10 | (1.75) |
Total from Investment Operations | | 2.33 | (3.73) | 3.36 | .97 | (1.88) |
Distributions: | | | | | | |
Dividends from investment income—net | | (.02) | (.17) | − | − | (.02) |
Dividends from net realized gain
on investments | | − | − | − | − | (.12) |
Total Distributions | | (.02) | (.17) | − | − | (.14) |
Net asset value, end of period | | 15.73 | 13.42 | 17.32 | 13.96 | 12.99 |
Total Return (%)b | | 17.35 | (21.80) | 24.07 | 7.39 | (12.51) |
Ratios/Supplemental Data (%): | | | | | | |
Ratio of total expenses
to average net assets | | 2.10 | 2.11 | 2.30 | 2.80 | 2.67 |
Ratio of net expenses
to average net assets | | 2.00 | 2.00 | 2.01 | 2.28 | 2.35 |
Ratio of net investment (loss)
to average net assets | | (.51) | (.60) | (.94) | (.97) | (.96) |
Portfolio Turnover Rate | | 48.73 | 41.94 | 36.79 | 51.42 | 32.72 |
Net Assets, end of period ($ x 1,000) | | 3,798 | 4,793 | 3,335 | 54 | 35 |
a Based on average shares outstanding.
b Exclusive of sales charge.
See notes to financial statements.
21
FINANCIAL HIGHLIGHTS (continued)
| | | | | | | | | | | | | | |
| | | | | |
| | | | | |
| | Year Ended October 31, |
Class I Shares | | 2019 | 2018 | 2017 | 2016 | 2015 |
Per Share Data ($): | | | | | | |
Net asset value, beginning of period | | 13.96 | 17.89 | 14.29 | 13.16 | 15.09 |
Investment Operations: | | | | | | |
Investment income (loss)—neta | | .07 | .07 | .01 | (.03) | (.00)b |
Net realized and unrealized gain (loss)
on investments | | 2.50 | (3.77) | 3.59 | 1.16 | (1.76) |
Total from Investment Operations | | 2.57 | (3.70) | 3.60 | 1.13 | (1.76) |
Distributions: | | | | | | |
Dividends from investment income—net | | (.19) | (.23) | (.00)b | − | (.05) |
Dividends from net realized gain
on investments | | − | − | − | − | (.12) |
Total Distributions | | (.19) | (.23) | (.00)b | − | (.17) |
Net asset value, end of period | | 16.34 | 13.96 | 17.89 | 14.29 | 13.16 |
Total Return (%) | | 18.61 | (21.01) | 25.24 | 8.50 | (11.68) |
Ratios/Supplemental Data (%): | | | | | | |
Ratio of total expenses
to average net assets | | 1.00 | 1.06 | 1.29 | 1.54 | 1.35 |
Ratio of net expenses
to average net assets | | 1.00 | 1.00 | 1.02 | 1.27 | 1.35 |
Ratio of net investment income (loss)
to average net assets | | .47 | .38 | .07 | (.24) | (.03) |
Portfolio Turnover Rate | | 48.73 | 41.94 | 36.79 | 51.42 | 32.72 |
Net Assets, end of period ($ x 1,000) | | 50,399 | 78,037 | 108,787 | 2,618 | 347 |
a Based on average shares outstanding.
b Amount represents less than $.01 per share.
See notes to financial statements.
22
| | | | | | | | |
| |
| | |
| | Year Ended October, 31 |
Class Y Shares | | 2019 | 2018 | 2017 | 2016 | 2015 |
Per Share Data ($): | | | | | | |
Net asset value, beginning of period | | 14.03 | 17.97 | 14.35 | 13.22 | 15.13 |
Investment Operations: | | | | | | |
Investment income—neta | | .07 | .08 | .03 | .01 | .02 |
Net realized and unrealized gain (loss)
on investments | | 2.51 | (3.79) | 3.59 | 1.12 | (1.76) |
Total from Investment Operations | | 2.58 | (3.71) | 3.62 | 1.13 | (1.74) |
Distributions: | | | | | | |
Dividends from
investment income—net | | (.21) | (.23) | (.00)b | − | (.05) |
Dividends from net realized gain
on investments | | − | − | − | − | (.12) |
Total Distributions | | (.21) | (.23) | (.00)b | − | (.17) |
Net asset value, end of period | | 16.40 | 14.03 | 17.97 | 14.35 | 13.22 |
Total Return (%) | | 18.61 | (20.98) | 25.27 | 8.47 | (11.51) |
Ratios/Supplemental Data (%): | | | | | | |
Ratio of total expenses
to average net assets | | .98 | .94 | 1.18 | 1.42 | 1.28 |
Ratio of net expenses
to average net assets | | .98 | .94 | 1.11 | 1.26 | 1.28 |
Ratio of net investment income
to average net assets | | .47 | .44 | .17 | .07 | .13 |
Portfolio Turnover Rate | | 48.73 | 41.94 | 36.79 | 51.42 | 32.72 |
Net Assets, end of period ($ x 1,000) | | 222,607 | 201,273 | 156,027 | 103,139 | 97,314 |
a Based on average shares outstanding.
b Amount represents less than $.01 per share.
See notes to financial statements.
23
NOTES TO FINANCIAL STATEMENTS
NOTE 1—Significant Accounting Policies:
BNY Mellon Global Emerging Markets Fund (the “fund”) is a separate non-diversified series of BNY Mellon Investment Funds II, Inc. (the “Company”), which is registered under the Investment Company Act of 1940, as amended (the “Act”), as an open-end management investment company and operates as a series company currently offering three series, including the fund. The fund’s investment objective is to seek long-term capital appreciation. BNY Mellon Investment Adviser, Inc. (the “Adviser”), a wholly-owned subsidiary of The Bank of New York Mellon Corporation (“BNY Mellon”), serves as the fund’s investment adviser. Newton Investment Management (North America) Limited (the “Sub-Adviser”), a wholly-owned subsidiary of BNY Mellon and an affiliate of the Adviser, serves as the fund’s sub-investment adviser.
Effective June 3, 2019, the fund changed its name from Dreyfus Global Emerging Markets Fund to BNY Mellon Global Emerging Markets Fund and the Company changed its name from Dreyfus BNY Mellon Funds, Inc. to BNY Mellon Investment Funds II, Inc. In addition, The Dreyfus Corporation, the fund’s investment adviser, changed its name to “BNY Mellon Investment Adviser, Inc.”, MBSC Securities Corporation, the fund’s distributor, changed its name to “BNY Mellon Securities Corporation” and Dreyfus Transfer, Inc., the fund’s transfer agent, changed its name to “BNY Mellon Transfer, Inc.”
BNY Mellon Securities Corporation (the “Distributor”), a wholly-owned subsidiary of the Adviser, is the distributor of the fund’s shares. The fund is authorized to issue 100 million shares of $.001 par value Common Stock in each of the following classes of shares: Class A, Class C, Class I, Class T and Class Y. Class A, Class C and Class T shares are sold primarily to retail investors through financial intermediaries and bear Distribution and/or Shareholder Services Plan fees. Class A and Class T shares generally are subject to a sales charge imposed at the time of purchase. Class C shares are subject to a contingent deferred sales charge (“CDSC”) imposed on Class C shares redeemed within one year of purchase. Class C shares automatically convert to Class A shares ten years after the date of purchase, without the imposition of a sales charge. Class I shares are sold primarily to bank trust departments and other financial service providers (including The Bank of New York Mellon, a subsidiary of BNY Mellon and an affiliate of the Adviser, and its affiliates), acting on behalf of customers having a qualified trust or an investment account or relationship at such institution, and bear no Distribution or Shareholder Services Plan
24
fees. Class Y shares are sold at net asset value per share generally to institutional investors, and bear no Distribution or Shareholder Services Plan fees. Class I and Class Y shares are offered without a front-end sales charge or CDSC. As of the date of this report, the fund did not offer Class T shares for purchase. Other differences between the classes include the services offered to and the expenses borne by each class, the allocation of certain transfer agency costs, and certain voting rights. Income, expenses (other than expenses attributable to a specific class), and realized and unrealized gains or losses on investments are allocated to each class of shares based on its relative net assets.
The Company accounts separately for the assets, liabilities and operations of each series. Expenses directly attributable to each series are charged to that series’ operations; expenses which are applicable to all series are allocated among them on a pro rata basis.
The Financial Accounting Standards Board (“FASB”) Accounting Standards Codification (“ASC”) is the exclusive reference of authoritative U.S. generally accepted accounting principles (“GAAP”) recognized by the FASB to be applied by nongovernmental entities. Rules and interpretive releases of the Securities and Exchange Commission (“SEC”) under authority of federal laws are also sources of authoritative GAAP for SEC registrants. The fund is an investment company and applies the accounting and reporting guidance of the FASB ASC Topic 946 Financial Services-Investment Companies. The fund’s financial statements are prepared in accordance with GAAP, which may require the use of management estimates and assumptions. Actual results could differ from those estimates.
The Companyenters into contracts that contain a variety of indemnifications. The fund’s maximum exposure under these arrangements is unknown. The fund does not anticipate recognizing any loss related to these arrangements.
(a) Portfolio valuation: The fair value of a financial instrument is the amount that would be received to sell an asset or paid to transfer a liability in an orderly transaction between market participants at the measurement date (i.e., the exit price). GAAP establishes a fair value hierarchy that prioritizes the inputs of valuation techniques used to measure fair value. This hierarchy gives the highest priority to unadjusted quoted prices in active markets for identical assets or liabilities (Level 1 measurements) and the lowest priority to unobservable inputs (Level 3 measurements).
Additionally, GAAP provides guidance on determining whether the volume and activity in a market has decreased significantly and whether
25
NOTES TO FINANCIAL STATEMENTS(continued)
such a decrease in activity results in transactions that are not orderly. GAAP requires enhanced disclosures around valuation inputs and techniques used during annual and interim periods.
Various inputs are used in determining the value of the fund’s investments relating to fair value measurements. These inputs are summarized in the three broad levels listed below:
Level 1—unadjusted quoted prices in active markets for identical investments.
Level 2—other significant observable inputs (including quoted prices for similar investments, interest rates, prepayment speeds, credit risk, etc.).
Level 3—significant unobservable inputs (including the fund’s own assumptions in determining the fair value of investments).
The inputs or methodology used for valuing securities are not necessarily an indication of the risk associated with investing in those securities.
Changes in valuation techniques may result in transfers in or out of an assigned level within the disclosure hierarchy. Valuation techniques used to value the fund’s investments are as follows:
Investments in equity securities are valued at the last sales price on the securities exchange or national securities market on which such securities are primarily traded. Securities listed on the National Market System for which market quotations are available are valued at the official closing price or, if there is no official closing price that day, at the last sales price. For open short positions, asked prices are used for valuation purposes. Bid price is used when no asked price is available. Registered investment companies that are not traded on an exchange are valued at their net asset value. All of the preceding securities are generally categorized within Level 1 of the fair value hierarchy.
Securities not listed on an exchange or the national securities market, or securities for which there were no transactions, are valued at the average of the most recent bid and asked prices. These securities are generally categorized within Level 2 of the fair value hierarchy.
Fair valuing of securities may be determined with the assistance of a pricing service using calculations based on indices of domestic securities and other appropriate indicators, such as prices of relevant ADRs and futures. Utilizing these techniques may result in transfers between Level 1 and Level 2 of the fair value hierarchy.
26
When market quotations or official closing prices are not readily available, or are determined not to accurately reflect fair value, such as when the value of a security has been significantly affected by events after the close of the exchange or market on which the security is principally traded (for example, a foreign exchange or market), but before the fund calculates its net asset value, the fund may value these investments at fair value as determined in accordance with the procedures approved by the Company’s Board of Directors (the “Board”). Certain factors may be considered when fair valuing investments such as: fundamental analytical data, the nature and duration of restrictions on disposition, an evaluation of the forces that influence the market in which the securities are purchased and sold, and public trading in similar securities of the issuer or comparable issuers. These securities are either categorized within Level 2 or 3 of the fair value hierarchy depending on the relevant inputs used.
For restricted securities where observable inputs are limited, assumptions about market activity and risk are used and such securities are generally categorized within Level 3 of the fair value hierarchy.
Investments denominated in foreign currencies are translated to U.S. dollars at the prevailing rates of exchange.
Forward foreign currency exchange contracts (“forward contracts”) are valued at the forward rate and are generally categorized within Level 2 of the fair value hierarchy.
The following is a summary of the inputs used as of October 31, 2019in valuing the fund’s investments:
| | | | | | |
| | Level 1 - Unadjusted Quoted Prices | Level 2 - Other Significant Observable Inputs | | Level 3 - Significant Unobservable Inputs | Total |
Assets ($) | | | |
Investments in Securities:† | | | |
Equity Securities –
Common Stocks | 274,129,522 | 763,246 | †† | - | 274,892,768 |
Investment Companies | 9,002,262 | - | | - | 9,002,262 |
Liabilities ($) | | | |
Other Financial Instruments: | | | |
Forward Foreign Currency
Exchange Contracts††† | - | (2) | | - | (2) |
† See Statement of Investments for additional detailed categorizations, if any.
†† Securities classified within Level 2 at period end as the values were determined pursuant to the fund’s fair valuation procedures.
††† Amount shown represents unrealized appreciation (depreciation) at period end, but only variation margin on exchanged traded and centrally cleared derivatives, if any, are reported in the Statement of Assets and Liabilities.
27
NOTES TO FINANCIAL STATEMENTS(continued)
(b) Foreign currency transactions: The fund does not isolate that portion of the results of operations resulting from changes in foreign exchange rates on investments from the fluctuations arising from changes in the market prices of securities held. Such fluctuations are included with the net realized and unrealized gain or loss on investments.
Net realized foreign exchange gains or losses arise from sales of foreign currencies, currency gains or losses realized on securities transactions between trade and settlement date, and the difference between the amounts of dividends, interest and foreign withholding taxes recorded on the fund’s books and the U.S. dollar equivalent of the amounts actually received or paid. Net unrealized foreign exchange gains and losses arise from changes in the value of assets and liabilities other than investments resulting from changes in exchange rates. Foreign currency gains and losses on foreign currency transactions are also included with net realized and unrealized gain or loss on investments.
(c)Securities transactions and investment income: Securities transactions are recorded on a trade date basis. Realized gains and losses from securities transactions are recorded on the identified cost basis. Dividend income is recognized on the ex-dividend date and interest income, including, where applicable, accretion of discount and amortization of premium on investments, is recognized on the accrual basis.
Pursuant to a securities lending agreement with The Bank of New York Mellon, a subsidiary of BNY Mellon and an affiliate of the Adviser, the fund may lend securities to qualified institutions. It is the fund’s policy that, at origination, all loans are secured by collateral of at least 102% of the value of U.S. securities loaned and 105% of the value of foreign securities loaned. Collateral equivalent to at least 100% of the market value of securities on loan is maintained at all times. Collateral is either in the form of cash, which can be invested in certain money market mutual funds managed by the Adviser, or U.S. Government and Agency securities. The fund is entitled to receive all dividends, interest and distributions on securities loaned, in addition to income earned as a result of the lending transaction. Should a borrower fail to return the securities in a timely manner, The Bank of New York Mellon is required to replace the securities for the benefit of the fund or credit the fund with the market value of the unreturned securities and is subrogated to the fund’s rights against the borrower and the collateral. Additionally, the contractual maturity of security lending transactions are on an overnight and continuous basis. During the period ended October 31, 2019, The Bank of
28
New York Mellon earned $119,257 from the lending of the fund’s portfolio securities, pursuant to the securities lending agreement.
(d) Affiliated issuers: Investments in other investment companies advised by the Adviser are considered “affiliated” under the Act.
Certain affiliated investment companies may also invest in the fund. At October 31, 2019, BNY Mellon Diversified Emerging Markets Fund, an affiliate of the fund, held 4,380,142 Class Y shares representing approximately 25.6% of the fund’s net assets.
(e) Risk: Investing in foreign markets may involve special risks and considerations not typically associated with investing in the U.S. These risks include revaluation of currencies, high rates of inflation, repatriation restrictions on income and capital, and adverse political and economic developments. Moreover, securities issued in these markets may be less liquid, subject to government ownership controls and delayed settlements, and their prices may be more volatile than those of comparable securities in the U.S.
(f) Dividends and distributions to shareholders: Dividends and distributions are recorded on the ex-dividend date. Dividends from investment income-net and dividends from net realized capital gains, if any, are normally declared and paid annually, but the fund may make distributions on a more frequent basis to comply with the distribution requirements of the Internal Revenue Code of 1986, as amended (the “Code”). To the extent that net realized capital gains can be offset by capital loss carryovers, it is the policy of the fund not to distribute such gains. Income and capital gain distributions are determined in accordance with income tax regulations, which may differ from GAAP.
(g) Federal income taxes: It is the policy of the fund to continue to qualify as a regulated investment company, if such qualification is in the best interests of its shareholders, by complying with the applicable provisions of the Code, and to make distributions of taxable income and net realized capital gain sufficient to relieve it from substantially all federal income and excise taxes.
As of and during the period ended October 31, 2019, the fund did not have any liabilities for any uncertain tax positions. The fund recognizes interest and penalties, if any, related to uncertain tax positions as income tax expense in the Statement of Operations. During the period ended October 31, 2019, the fund did not incur any interest or penalties.
29
NOTES TO FINANCIAL STATEMENTS(continued)
Each tax year in the four-year period ended October 31, 2019 remains subject to examination by the Internal Revenue Service and state taxing authorities.
At October 31, 2019, the components of accumulated earnings on a tax basis were as follows: undistributed ordinary income $6,620,538, accumulated capital losses $50,520,872 and unrealized appreciation $34,769,656.
The fund is permitted to carry forward capital losses for an unlimited period. Furthermore, capital loss carryovers retain their character as either short-term or long-term capital losses.
The accumulated capital loss carryover is available for federal income tax purposes to be applied against future netrealized capital gains, if any, realized subsequent to October 31, 2019. The fund has $24,474,991 of short-term capital losses and $26,045,881 of long-term capital losses which can be carried forward for an unlimited period.
The tax character of distributions paid to shareholders during the fiscal periods ended October 31, 2019 and October 31, 2018 were as follows: undistributed ordinary income $3,598,850 and $3,739,517, respectively.
NOTE 2—Bank Lines of Credit:
The fund participates with other long-term open-end funds managed by the Adviser in a $1.030 billion unsecured credit facility led by Citibank, N.A. (the “Citibank Credit Facility”) and a $300 million unsecured credit facility provided by The Bank of New York Mellon (the “BNYM Credit Facility”), each to be utilized primarily for temporary or emergency purposes, including the financing of redemptions (each, a “Facility”). The Citibank Credit Facility is available in two tranches: (i) Tranche A is in an amount equal to $830 million and is available to all long-term open-ended funds, including the fund, and (ii) Tranche B is in amount equal to $200 million and is available only to BNY Mellon Floating Rate Income Fund, a series of BNY Mellon Investment Funds IV, Inc. In connection therewith, the fund has agreed to pay its pro rata portion of commitment fees for Tranche A of the Citibank Credit Facility and the BNYM Credit Facility. Interest is charged to the fund based on rates determined pursuant to the terms of the respective Facility at the time of borrowing.
The average amount of borrowings outstanding under the Facilities during the period ended October 31, 2019 was approximately $127,120 with a related weighted average annualized interest rate of 3.20%.
30
NOTE 3—Management Fee, Sub-Investment Advisory Fee and Other Transactions with Affiliates:
(a)Pursuant to a management agreement with the Adviser, the management fee is computed at the annual rate of .75% of the value of the fund’s average daily net assets. The Adviser has contractually agreed, from November 1, 2018 through March 1, 2020, to waive receipt of its fees and/or assume the direct expenses of the fund so that the direct expenses of none of the classes (excluding Rule 12b-1 Distribution Plan fees, Shareholder Services Plan fees, taxes, interest expense, brokerage commissions, commitment fees on borrowings and extraordinary expenses) exceed 1.00% of the value of the fund’s average daily net assets. On or after March 1, 2020, the Adviser may terminate this expense limitation at any time. The reduction in expenses, pursuant to the undertaking amounted to $7,340 during the period ended October 31, 2019.
Pursuant to a sub-investment advisory agreement between the Adviser and the Sub-Adviser, the Sub-Adviser serves as the fund’s sub-investment adviser responsible for the day-to-day management of the fund’s portfolio. The Adviser pays the Sub Adviser a monthly fee at an annual percentage of the value of the fund’s average daily net assets. The Adviser has obtained an exemptive order from the SEC (the “Order”), upon which the fund may rely, to use a manager of managers approach that permits the Adviser, subject to certain conditions and approval by the Board, to enter into and materially amend sub-investment advisory agreements with one or more sub-investment advisers who are either unaffiliated with the Adviser or are wholly-owned subsidiaries (as defined under the Act) of the Adviser’s ultimate parent company, BNY Mellon, without obtaining shareholder approval. The Order also allows the fund to disclose the sub-investment advisory fee paid by the Adviser to any unaffiliated sub-investment adviser in the aggregate with other unaffiliated sub-investment advisers in documents filed with the SEC and provided to shareholders. In addition, pursuant to the Order, it is not necessary to disclose the sub-investment advisory fee payable by the Adviser separately to a sub-investment adviser that is a wholly-owned subsidiary of BNY Mellon in documents filed with the SEC and provided to shareholders; such fees are to be aggregated with fees payable to the Adviser. The Adviser has ultimate responsibility (subject to oversight by the Board) to supervise any sub-investment adviser and recommend the hiring, termination, and replacement of any sub-investment adviser to the Board.
31
NOTES TO FINANCIAL STATEMENTS(continued)
During the period ended October 31, 2019, the Distributor retained $977 commissions earned on sales of the fund’s Class A shares and $2,286 from CDSC fees on redemptions of the fund’s Class C shares.
(b) Under the Distribution Plan adopted pursuant to Rule 12b-1 under the Act, Class C shares pay the Distributor for distributing its shares at an annual rate of .75% of the value of its average daily net assets. During the period ended October 31, 2019, Class C shares were charged $32,541 pursuant to the Distribution Plan.
(c)Under the Shareholder Services Plan, Class A and Class C shares pay the Distributor at an annual rate of .25% of the value of their average daily net assets for the provision of certain services. The services provided may include personal services relating to shareholder accounts, such as answering shareholder inquiries regarding the fund and providing reports and other information, and services related to the maintenance of shareholder accounts. The Distributor may make payments to Service Agents (securities dealers, financial institutions or other industry professionals) with respect to these services. The Distributor determines the amounts to be paid to Service Agents. During the period ended October 31, 2019, Class A and Class C shares were charged $10,368and $10,847, respectively, pursuant to the Shareholder Services Plan.
Under its terms, the Distribution Plan and Shareholder Services Plan shall remain in effect from year to year, provided such continuance is approved annually by a vote of a majority of those Directors who are not “interested persons” of the Company and who have no direct or indirect financial interest in the operation of or in any agreement related to the Distribution Plan and Shareholder Services Plan.
The fund has an arrangement with the transfer agent whereby the fund may receive earnings credits when positive cash balances are maintained, which are used to offset transfer agency fees. The fund had an arrangement with the custodian to receive earnings credits when positive cash balances were maintained, which were used to offset custody fees. Effective February 1, 2019, the arrangement with the custodian changed whereby the fund will no longer receive earnings credits to offset its custody fees and will receive interest income or overdraft fees going forward. For financial reporting purposes, the fund includes net earnings credits, if any, as an expense offset in the Statement of Operations.
The fund compensates BNY Mellon Transfer, Inc., a wholly-owned subsidiary of the Adviser, under a transfer agency agreement for providing transfer agency and cash management services for the fund. The majority of transfer agency fees are comprised of amounts paid on a per account
32
basis, while cash management fees are related to fund subscriptions and redemptions. During the period ended October 31, 2019, the fund was charged $5,507 for transfer agency services. These fees are included in Shareholder servicing costs in the Statement of Operations.
The fund compensates The Bank of New York Mellon under a custody agreement for providing custodial services for the fund. These fees are determined based on net assets, geographic region and transaction activity. During the period ended October 31, 2019, the fund was charged $269,696 pursuant to the custody agreement.
During the period ended October 31, 2019, the fund was charged $11,610 for services performed by the Chief Compliance Officer and his staff. These fees are included in Miscellaneous in the Statement of Operations.
The components of “Due to BNY Mellon Investment Adviser, Inc. and affiliates” in the Statement of Assets and Liabilities consist of: management fees of $178,222, Distribution Plan fees of $2,373, Shareholder Services Plan fees of $1,578, custodian fees of $104,304, Chief Compliance Officer fees of $4,504 and transfer agency fees of $900.
(d) Each Board member also serves as a Board member of other funds in the BNY Mellon Family of Funds complex. Annual retainer fees and attendance fees are allocated to each fund based on net assets.
(e)A 2% redemption fee is charged and retained by the fund on certain shares redeemed within sixty days following the date of issuance subject to certain exceptions, including redemptions made through use of the fund’s exchange privilege. During the period ended October 31, 2019, redemption fees charged and retained by the fund amounted to $65,688.
NOTE 4—Securities Transactions:
The aggregate amount of purchases and sales of investment securities, excluding short-term securities and forward contracts, during the period ended October 31, 2019, amounted to $134,024,568 and $189,410,679, respectively.
Derivatives: A derivative is a financial instrument whose performance is derived from the performance of another asset. The fund enters into International Swaps and Derivatives Association, Inc. Master Agreements or similar agreements (collectively, “Master Agreements”) with its over-the-counter (“OTC”) derivative contract counterparties in order to, among other things, reduce its credit risk to counterparties. Master Agreements include provisions for general obligations, representations, collateral and events of default or termination. Under a Master Agreement, the fund may offset with the counterparty certain derivative financial
33
NOTES TO FINANCIAL STATEMENTS(continued)
instruments’ payables and/or receivables with collateral held and/or posted and create one single net payment in the event of default or termination.
Each type of derivative instrument that was held by the fund during the period ended October 31, 2019 is discussed below.
Forward Foreign Currency Exchange Contracts: The fund enters into forward contracts in order to hedge its exposure to changes in foreign currency exchange rates on its foreign portfolio holdings, to settle foreign currency transactions or as a part of its investment strategy. When executing forward contracts, the fund is obligated to buy or sell a foreign currency at a specified rate on a certain date in the future. With respect to sales of forward contracts, the fund incurs a loss if the value of the contract increases between the date the forward contract is opened and the date the forward contract is closed. The fund realizes a gain if the value of the contract decreases between those dates. With respect to purchases of forward contracts, the fund incurs a loss if the value of the contract decreases between the date the forward contract is opened and the date the forward contract is closed. The fund realizes a gain if the value of the contract increases between those dates. Any realized or unrealized gains or losses which occurred during the period are reflected in the Statement of Operations. The fund is exposed to foreign currency risk as a result of changes in value of underlying financial instruments. The fund is also exposed to credit risk associated with counterparty nonperformance on these forward contracts, which is generally limited to the unrealized gain on each open contract. This risk may be mitigated by Master Agreements, if any, between the fund and the counterparty and the posting of collateral, if any, by the counterparty to the fund to cover the fund’s exposure to the counterparty. Forward contracts open at October 31, 2019 are set forth in the Statement of Forward Foreign Currency Exchange Contracts.
The provisions of ASC Topic 210 “Disclosures about Offsetting Assets and Liabilities” require disclosure on the offsetting of financial assets and liabilities. These disclosures are required for certain investments, including derivative financial instruments subject to Master Agreements which are eligible for offsetting in the Statement of Assets and Liabilities and require the fund to disclose both gross and net information with respect to such investments. For financial reporting purposes, the fund does not offset derivative assets and derivative liabilities that are subject to Master Agreements in the Statement of Assets and Liabilities.
34
At October 31, 2019, derivative assets and liabilities (by type) on a gross basis are as follows:
| | | | | | |
Derivative Financial Instruments: | | Assets ($) | | Liabilities ($) | |
Forward contracts | | - | | (2) | |
Total gross amount of derivative | | | | | |
assets and liabilities in the | | | | | |
Statement of Assets and Liabilities | | - | | (2) | |
Derivatives not subject to | | | | | |
Master Agreements | | - | | - | |
Total gross amount of assets | | | | | |
and liabilities subject to | | | | | |
Master Agreements | | - | | (2) | |
The following table presents derivative Liabilities net of amounts available for offsetting under Master Agreements and net of related collateral received or pledged, if any, as of October 31, 2019:
| | | | | | | |
| | | | | | |
| | | Financial | | | |
| | | Instruments | | | |
| | | and Derivatives | | | |
| Gross Amount of | | Available | Collateral | | Net Amount of |
Counterparty | Liabilities ($) | 1 | for Offset ($) | Pledged ($) | | Liabilities ($) |
State Street Bank
and Trust Company | (2) | | - | - | | (2) |
Total | (2) | | - | - | | (2) |
| | | | | | |
1 Absent a default event or early termination, OTC derivative assets and liabilities are presented at gross amounts and are not offset in the Statement of Assets and Liabilities. |
The following summarizes the average market value of derivatives outstanding duringthe period ended October 31, 2019:
| | | |
| | Average Market Value ($) |
Forward contracts | | 387,564 |
| | |
At October 31, 2019, the cost of investments for federal income tax purposes was $249,142,454; accordingly, accumulated net unrealized appreciation on investments inclusive of derivative contracts was $34,752,574, consisting of $63,093,454 gross unrealized appreciation and $28,340,880 gross unrealized depreciation.
35
REPORT OF INDEPENDENT REGISTERED PUBLIC ACCOUNTING FIRM
To the Shareholders of the Fund and Board of Directors of
BNY Mellon Investment Funds II, Inc. (formerly, Dreyfus BNY Mellon Funds, Inc.):
Opinion on the Financial Statements
We have audited the accompanying statement of assets and liabilities of BNY Mellon Global Emerging Markets Fund (formerly, Dreyfus Global Emerging Markets Fund) (the “Fund”), a series of BNY Mellon Investment Funds II, Inc., including the statements of investments and forward foreign currency exchange contracts, as of October 31, 2019, and the statement of investments in affiliated issuers as of and for the year then ended, the related statement of operations for the year then ended, the statements of changes in net assets for each of the years in the two-year period then ended, and the related notes (collectively, the financial statements), and the financial highlights for each of the years in the five-year period then ended. In our opinion, the financial statements and financial highlights present fairly, in all material respects, the financial position of the Fund as of October 31, 2019, the results of its operations for the year then ended, the changes in its net assets for each of the years in the two-year period then ended, and the financial highlights for each of the years in the five-year period then ended, in conformity with U.S. generally accepted accounting principles.
Basis for Opinion
These financial statements and financial highlights are the responsibility of the Fund’s management. Our responsibility is to express an opinion on these financial statements and financial highlights based on our audits. We are a public accounting firm registered with the Public Company Accounting Oversight Board (United States) (PCAOB) and are required to be independent with respect to the Fund in accordance with the U.S. federal securities laws and the applicable rules and regulations of the Securities and Exchange Commission and the PCAOB.
We conducted our audits in accordance with the standards of the PCAOB. Those standards require that we plan and perform the audit to obtain reasonable assurance about whether the financial statements and financial highlights are free of material misstatement, whether due to error or fraud. Our audits included performing procedures to assess the risks of material misstatement of the financial statements and financial highlights, whether due to error or fraud, and performing procedures that respond to those risks. Such procedures included examining, on a test basis, evidence regarding the amounts and disclosures in the financial statements and financial highlights. Such procedures also included confirmation of securities owned as of October 31, 2019, by correspondence with the custodian and brokers or by other appropriate auditing procedures when replies from brokers were not received. Our audits also included evaluating the accounting principles used and significant estimates made by management, as well as evaluating the overall presentation of the financial statements and financial highlights. We believe that our audits provide a reasonable basis for our opinion.

We have served as the auditor of one or more BNY Mellon Investment Adviser, Inc. investment companies since 1994.
New York, New York
December 20, 2019
36
IMPORTANT TAX INFORMATION(Unaudited)
For federal tax purposes, the fund elects to provide each shareholder with their portion of the fund’s income sourced from foreign countries and taxes paid from foreign countries. The fund reports the maximum amount allowable but not less than $9,203,446 as income sourced from foreign countries for the fiscal year ended October 31, 2019 in accordance with Section 853(c)(2) of the Internal Revenue Code and also the fund reports the maximum amount allowable but not less than $304,781 as taxes paid from foreign countries for the fiscal year ended October 31, 2019 in accordance with Section 853(a) of the Internal Revenue Code. Where required by federal tax rules, shareholders will receive notification of their proportionate share of foreign sourced income and foreign taxes paid for the 2019 calendar year with Form 1099-DIV which will be mailed in early 2020. Also, the fund designates the maximum amount allowable, but not less than $1,961,456 as ordinary income dividends paid during the fiscal year ended October 31, 2018 as qualified dividend income in accordance with Section 854(b)(1)(B) of the Internal Revenue Code.
37
INFORMATION ABOUT THE RENEWAL OF THE FUND’S MANAGEMENT AND SUB-INVESTMENT ADVISORY AGREEMENTS (Unaudited)
At a meeting of the fund’s Board of Directors (the “Board”) held on October 23-24, 2019 (the “Meeting”), the Board discussed with representatives of the Adviser (a) plans to wind down the operations of and dissolve the fund’s then-current sub-investment adviser, Newton Investment Management (North America) Limited (“NIMNA”); and (b) a proposal that Newton Investment Management Limited (“NIM”), an affiliate of NIMNA and the Adviser, assume the investment advisory responsibilities of NIMNA, pursuant to a sub-investment advisory agreement between the Adviser and NIM (the “New Sub-Advisory Agreement”), to be effective December 31, 2019 (the “Effective Date”).
At the Meeting, the Adviser recommended the approval of the New Sub-Advisory Agreement, pursuant to which NIM would serve as sub-adviser to the fund. The recommendation for the approval of the New Sub-Advisory Agreement was based on the following considerations, among others: (i) the transfer of the provision of sub-investment advisory services from NIMNA to NIM was not expected to have a material impact on the fund’s day-to-day operations, or the nature, extent or quality of the sub-investment advisory services currently provided to the fund; (ii) the personnel who have been principally responsible for managing the fund’s investment portfolio would continue to serve in that capacity following the Effective Date; and (iii) the substantive terms of the New Sub-Advisory Agreement were substantially similar to those of the current sub-investment advisory agreement between the Adviser and NIMNA (the “Current Agreement”). The Board also considered the fact that the Adviser expressed confidence in NIM and its investment management capabilities.
At the Meeting, the Board, including a majority of the Trustees who are not “interested persons” (as defined in the Investment Company Act of 1940, as amended (the “1940 Act”)) of the fund (the “Independent Trustees”), considered and approved the New Sub-Advisory Agreement. In determining whether to approve the New Sub-Advisory Agreement, the Board considered the materials prepared by the Adviser received in advance of the Meeting and other information presented at the Meeting, which included: (i) a form of the New Sub-Advisory Agreement; (ii) information regarding the transition of sub-investment advisory services from NIMNA to NIM; (iii) information regarding investment due diligence of NIM performed by the Adviser; (iv) information regarding NIM’s compliance program; and (v) an opinion of counsel that replacing NIMNA with NIM as the sub-investment adviser to the fund would not result in a “change of control” or an “assignment” of an advisory contract within the meaning of the 1940 Act, and, therefore, does not require the approval of fund shareholders. The Board also considered the substance of discussions with representatives of the Adviser at the Meeting and at a Board meeting on February 27-28, 2019 (the “February Meeting”), at which the Board re-approved the Current Agreement for the ensuing year until April 4, 2020.
Nature, Extent and Quality of Services to be Provided by NIM. In examining the nature, extent and quality of the services that had been furnished by NIMNA to the
38
fund under the Current Agreement, and were expected to be provided by NIM to the fund under the New Sub-Advisory Agreement, the Board considered: (i) NIM’s organization, qualification and background, as well as the qualifications of its personnel; (ii) the expertise of the personnel providing portfolio management services, which would remain the same after the Effective Date; (iii) the investment strategy for the fund, which would remain the same after the Effective Date; and (iv) NIM’s compliance program. The Board also considered the review process undertaken by the Adviser and the Adviser’s favorable assessment of the nature and quality of the sub-investment advisory services provided by NIMNA and expected to be provided to the fund by NIM after the Effective Date. Based on their consideration and review of the foregoing information, the Board concluded that the nature, extent and quality of the sub-investment advisory services to be provided by NIM under the New Sub-Advisory Agreement, as well as NIM’s ability to render such services based on its resources and the experience of the investment team, which will remain the same, were adequate and appropriate for the fund in light of the fund’s investment objective, and supported a decision to approve the New Sub-Advisory Agreement.
Investment Performance of NIM. The Board had considered NIMNA’s investment performance in managing the fund’s portfolio at the February Meeting (including comparative data provided by Broadridge Financial Solutions, Inc.). The Board considered the performance and that the same investment professionals would continue to manage the fund’s assets after the Effective Date, as factors in evaluating the services to be provided by NIM under the New Sub-Advisory Agreement after the Effective Date, and determined that these factors, when viewed together with the other factors considered by the Board, supported a decision to approve the New Sub-Advisory Agreement.
Costs of Services to be Provided and Profitability. The Board considered the proposed fee payable under the New Sub-Advisory Agreement (which was the same as that payable under the Current Agreement and had been considered at the February Meeting), noting that the proposed fee would be paid by the Adviser and, thus, would not impact the fees paid by the fund or the Adviser’s profitability. The Board recognized that, because NIM’s fee would be paid by the Adviser, and not the fund, an analysis of profitability was more appropriate in the context of the Board’s consideration of the fund’s Management Agreement, pursuant to which the Adviser provides the fund with investment management and administrative services (the “Management Agreement”), and, therefore, the Board had received and considered a profitability analysis of the Adviser and its affiliates at the February Meeting. The Board concluded that the proposed fee payable to NIM by the Adviser was appropriate and the Adviser’s profitability was not excessive in light of the nature, extent and quality of the services to be provided to the fund by the Adviser and NIM under the New Sub-Advisory Agreement.
Economies of Scale to be Realized. The Board recognized that, because NIM’s fee would continue to be paid by the Adviser, and not the fund, an analysis of economies of
39
INFORMATION ABOUT THE RENEWAL OF THE FUND’S MANAGEMENT AND SUB-INVESTMENT ADVISORY AGREEMENTS (Unaudited) (continued)
scale was more appropriate in the context of the Board’s consideration of the Management Agreement, which had been done at the February Meeting.
The Board also considered whether there were any ancillary benefits that would accrue to NIM as a result of NIM’s relationship with the fund. The Board concluded that NIM may direct fund brokerage transactions to certain brokers to obtain research and other services, but noted that NIMNA currently paid, and that, after the Effective Date, NIM would pay, for such research and other services, not the fund by way of brokerage commission costs.
In considering the materials and information described above, the Independent Trustees received assistance from, and met separately with, their independent legal counsel, and were provided with a written description of their statutory responsibilities and the legal standards that are applicable to the approval of investment advisory and sub-investment advisory agreements.
After full consideration of the factors discussed above, with no single factor identified as being of paramount importance, the Board, including a majority of the Independent Trustees, with the assistance of independent legal counsel, approved the New Sub-Advisory Agreement for the fund effective as of the Effective Date.
40
BOARD MEMBERS INFORMATION(Unaudited)
INDEPENDENT BOARD MEMBERS
Joseph S. DiMartino (76)
Chairman of the Board (1999)
Principal Occupation During Past 5 Years:
· Corporate Director and Trustee (1995-Present)
Other Public Company Board Memberships During Past 5 Years:
· CBIZ, Inc., a public company providing professional business services, products and solutions,Director (1997-Present)
No. of Portfolios for which Board Member Serves:120
———————
Francine J. Bovich (68)
Board Member (2012)
Principal Occupation During Past 5 Years:
· Trustee, The Bradley Trusts, private trust funds (2011-Present)
Other Public Company Board Memberships During Past 5 Years:
· Annaly Capital Management, Inc., a real estate investment trust,Director (2014-Present)
No. of Portfolios for which Board Member Serves:70
———————
Andrew J. Donohue (68)
Board Member (2019)
Principal Occupation During Past 5 Years:
· Of Counsel, Shearman & Sterling LLP (2017-2019)
· Chief of Staff to the Chair of the SEC (2015-2017)
· Managing Director and Investment Company General Counsel of Goldman Sachs (2012-2015)
Other Public Company Board Memberships During Past 5 Years:
· Oppenheimer Funds (58 funds),Director (2017-2019)
No. of Portfolios for which Board Member Serves:56
———————
41
BOARD MEMBERS INFORMATION (Unaudited) (continued)
INDEPENDENT BOARD MEMBERS (continued)
Kenneth A. Himmel (72)
Board Member (1994)
Principal Occupation During Past 5 Years:
· Managing Partner, Gulf Related, an international real estate development company (2010-Present)
· President and CEO, Related Urban Development, a real estate development company (1996-Present)
· President and CEO, Himmel & Company, a real estate development company (1980-Present)
· CEO, American Food Management, a restaurant company (1983-Present)
No. of Portfolios for which Board Member Serves:23
———————
Stephen J. Lockwood (72)
Board Member (1994)
Principal Occupation During Past 5 Years:
· Chairman of the Board, Stephen J. Lockwood and Company LLC, a real estate investment company (2000-Present)
No. of Portfolios for which Board Member Serves:23
———————
Roslyn M. Watson (70)
Board Member (1994)
Principal Occupation During Past 5 Years:
· Principal, Watson Ventures, Inc., a real estate investment company (1993-Present)
Other Public Company Board Memberships During Past 5 Years:
· American Express Bank, FSB,Director (1993-2018)
No. of Portfolios for which Board Member Serves:56
———————
42
Benaree Pratt Wiley (73)
Board Member (1998)
Principal Occupation During Past 5 Years:
· Principal, The Wiley Group, a firm specializing in strategy and business development (2005-Present)
Other Public Company Board Memberships During Past 5 Years:
· CBIZ, Inc., a public company providing professional business services, products and solutions,Director(2008-Present)
· Blue Cross-Blue Shield of Massachusetts (2004-Present)
No. of Portfolios for which Board Member Serves:76
———————
Once elected all Board Members serve for an indefinite term, but achieve Emeritus status upon reaching age 80. The address of the Board Members and Officers is c/o BNY Mellon Investment Adviser, Inc. 240 Greenwich Street, New York, New York 10286. Additional information about the Board Members is available in the fund’s Statement of Additional Information which can be obtained from the Adviser free of charge by calling this toll free number: 1-800-373-9387.
James M. Fitzgibbons, Emeritus Board Member
43
OFFICERS OF THE FUND(Unaudited)
RENEE LAROCHE-MORRIS, President since May 2019.
President and a director of BNY Mellon Investment Adviser, Inc. since January 2018. She is an officer of 63 investment companies (comprised of 120 portfolios) managed by the Adviser. She is 48 years old and has been an employee of BNY Mellon since 2003.
JAMES WINDELS, Treasurer since November 2001.
Director- BNY Mellon Fund Administration, and an officer of 64 investment companies (comprised of 143 portfolios) managed by the Adviser. He is 61 years old and has been an employee of the Adviser since April 1985.
BENNETT A. MACDOUGALL, Chief Legal Officer since October 2015.
Chief Legal Officer of the Adviser and Associate General Counsel and Managing Director of BNY Mellon since June 2015; Director and Associate General Counsel of Deutsche Bank – Asset & Wealth Management Division from June 2005 to June 2015, and as Chief Legal Officer of Deutsche Investment Management Americas Inc. from June 2012 to May 2015. He is an officer of 64 investment companies (comprised of 143 portfolios) managed by the Adviser. He is 48 years old and has been an employee of the Adviser since June 2015.
DAVID DIPETRILLO, Vice President since May 2019.
Head of North America Product, BNY Mellon Investment Management since January 2018, Director of Product Strategy, BNY Mellon Investment Management from January 2016 to December 2017; Head of US Retail Product and Channel Marketing, BNY Mellon Investment Management from January 2014 to December 2015. He is an officer of 63 investment companies (comprised of 120 portfolios) managed by the Adviser. He is 41 years old and has been an employee of BNY Mellon since 2005.
JAMES BITETTO, Vice President since August 2005 and Secretary since February 2018.
Senior Managing Counsel of BNY Mellon since November 2019; Managing Counsel of BNY Mellon from April 2014 to November 2019; Secretary of the Adviser, and an officer of 64 investment companies (comprised of 143 portfolios) managed by the Adviser. He is 53 years old and has been an employee of the Adviser since December 1996.
SONALEE CROSS, Vice President and Assistant Secretary since March 2018.
Counsel of BNY Mellon since October 2016; Associate at Proskauer Rose LLP from April 2016 to September 2016; Attorney at EnTrust Capital from August 2015 to February 2016; Associate at Sidley Austin LLP from September 2013 to August 2015. She is an officer of 64 investment companies (comprised of 143 portfolios) managed by the Adviser. She is 32 years old and has been an employee of the Adviser since October 2016.
DEIRDRE CUNNANE, Vice President and Assistant Secretary since March 2019.
Counsel of BNY Mellon since August 2018; Senior Regulatory Specialist at BNY Mellon Investment Management Services from February 2016 to August 2018; Trustee Associate at BNY Mellon Trust Company (Ireland) Limited from August 2013 to February 2016. She is an officer of 64 investment companies (comprised of 143 portfolios) managed by the Adviser. She is 29 years old and has been an employee of the Adviser since August 2018.
SARAH S. KELLEHER, Vice President and Assistant Secretary since April 2014.
Managing Counsel of BNY Mellon since December 2017, Senior Counsel of BNY Mellon from March 2013 to December 2017. She is an officer of 64 investment companies (comprised of 143 portfolios) managed by the Adviser. She is 44 years old and has been an employee of the Adviser since March 2013.
JEFF PRUSNOFSKY, Vice President and Assistant Secretary since August 2005.
Senior Managing Counsel of BNY Mellon, and an officer of 64 investment companies (comprised of 143 portfolios) managed by the Adviser. He is 54 years old and has been an employee of the Adviser since October 1990.
PETER M. SULLIVAN, Vice President and Assistant Secretary since March 2019.
Managing Counsel of BNY Mellon, and an officer of 64 investment companies (comprised of 143 portfolios) managed by the Adviser. He is 51 years old and has been an employee of the Adviser since April 2004.
44
NATALYA ZELENSKY, Vice President and Assistant Secretary since March 2017.
Managing Counsel of BNY Mellon since November 2019; Counsel of BNY Mellon from May 2016 to November 2019; Attorney at Wildermuth Endowment Strategy Fund/Wildermuth Advisory, LLC from November 2015 to May 2016 and Assistant General Counsel at RCS Advisory Services from July 2014 to November 2015. She is an officer of 64 investment companies (comprised of 143 portfolios) managed by the Adviser. She is 34 years old and has been an employee of the Adviser since May 2016.
GAVIN C. REILLY, Assistant Treasurer since December 2005.
Tax Manager - BNY Mellon Fund Administration, and an officer of 64 investment companies (comprised of 143 portfolios) managed by the Adviser. He is 51 years old and has been an employee of the Adviser since April 1991.
ROBERT S. ROBOL, Assistant Treasurer since December 2002.
Senior Accounting Manager- BNY Mellon Fund Administration, and an officer of 64 investment companies (comprised of 143 portfolios) managed by the Adviser. He is 55 years old and has been an employee of the Adviser since October 1988.
ROBERT SALVIOLO, Assistant Treasurer since July 2007.
Senior Accounting Manager – BNY Mellon Fund Administration, and an officer of 64 investment companies (comprised of 143 portfolios) managed by the Adviser. He is 52 years old and has been an employee of the Adviser since June 1989.
ROBERT SVAGNA, Assistant Treasurer since December 2002.
Senior Accounting Manager – BNY Mellon Fund Administration, and an officer of 64 investment companies (comprised of 143 portfolios) managed by the Adviser. He is 52 years old and has been an employee of the Adviser since November 1990.
JOSEPH W. CONNOLLY, Chief Compliance Officer since October 2004.
Chief Compliance Officer of the Adviser, the BNY Mellon Family of Funds and BNY Mellon Funds Trust (64 investment companies, comprised of 143 portfolios). He is 62 years old and has served in various capacities with the the Adviser since 1980, including manager of the firm’s Fund Accounting Department from 1997 through October 2001.
CARIDAD M. CAROSELLA, Anti-Money Laundering Compliance Officer since January 2016.
Anti-Money Laundering Compliance Officer of the BNY Mellon Family of Funds and BNY Mellon Funds Trust since January 2016; from May 2015 to December 2015, Interim Anti-Money Laundering Compliance Officer of the BNY Mellon Family of Funds and BNY Mellon Funds Trust and the Distributor; from January 2012 to May 2015, AML Surveillance Officer of the Distributor. She is an officer of 57 investment companies (comprised of 136 portfolios) managed by the Adviser. She is 51 years old and has been an employee of the Distributor since 1997.
45
BNY Mellon Global Emerging Markets Fund
240 Greenwich Street
New York, NY 10286
Adviser
BNY Mellon Investment Adviser, Inc.
240 Greenwich Street
New York, NY 10286
Sub-Adviser
Newton Investment Management
(North America) Limited
160 Queen Victoria Street,
London, EC4V, 4LA, UK
Custodian
The Bank of New York Mellon
240 Greenwich Street
New York, NY 10286
Transfer Agent &
Dividend Disbursing Agent
BNY Mellon Transfer, Inc.
240 Greenwich Street
New York, NY 10286
Distributor
BNY Mellon Securities Corporation
240 Greenwich Street
New York, NY 10286
| | |
Ticker Symbols: | Class A: DGEAX Class C: DGECX Class I: DGIEX Class Y: DGEYX |
Telephone Call your financial representative or 1-800-373-9387
Mail The BNY Mellon Family of Funds, 144 Glenn Curtiss Boulevard, Uniondale, NY 11556-0144
E-mailSend your request toinfo@bnymellon.com
InternetInformation can be viewed online or downloaded atwww.bnymellonim.com/us
The fund files its complete schedule of portfolio holdings with the Securities and Exchange Commission (“SEC”) for the first and third quarters of each fiscal year on Form N-PORT. The fund’s Forms N-PORT are available on the SEC’s website atwww.sec.gov.
A description of the policies and procedures that the fund uses to determine how to vote proxies relating to portfolio securities and information regarding how the fund voted these proxies for the most recent 12-month period ended June 30 is available atwww.bnymellonim.com/us and on the SEC’s website atwww.sec.gov and without charge, upon request, by calling 1-800-373-9387.
| | |
© 2019 BNY Mellon Securities Corporation
6243AR1019A | 
|
BNY Mellon Yield Enhancement Strategy Fund
| |
ANNUAL REPORT October 31, 2019 |
| |
Save time. Save paper. View your next shareholder report online as soon as it’s available. Log into www.bnymellonim.com/us and sign up for eCommunications. It’s simple and only takes a few minutes. |
| |
The views expressed in this report reflect those of the portfolio manager(s) only through the end of the period covered and do not necessarily represent the views of BNY Mellon Investment Adviser, Inc. or any other person in the BNY Mellon Investment Adviser, Inc. organization. Any such views are subject to change at any time based upon market or other conditions and BNY Mellon Investment Adviser, Inc. disclaims any responsibility to update such views. These views may not be relied on as investment advice and, because investment decisions for a fund in the BNY Mellon Family of Funds are based on numerous factors, may not be relied on as an indication of trading intent on behalf of any fund in the BNY Mellon Family of Funds. |
| |
Not FDIC-Insured • Not Bank-Guaranteed • May Lose Value |
Contents
THE FUND
FOR MORE INFORMATION
Back Cover
| | | | |
| |
BNY Mellon Yield Enhancement Strategy Fund
| | The Fund |
A LETTER FROM THE PRESIDENT OF BNY MELLON INVESTMENT ADVISER, INC.
Dear Shareholder:
We are pleased to present this annual report for BNY Mellon Yield Enhancement Strategy Fund (formerly, Dreyfus Yield Enhancement Strategy Fund), covering the 12-month period from November 1, 2018 through October 31, 2019. For information about how the fund performed during the reporting period, as well as general market perspectives, we provide a Discussion of Fund Performance on the pages that follow.
Equity markets weakened in the fourth quarter of 2018, as concerns about rising interest rates, trade tensions and slowing global growth provided downward pressure on returns. In December 2018, stocks experienced a sharp sell-off, as it appeared that the U.S. Federal Reserve (the “Fed”) would maintain its hawkish stance on monetary policy. In January 2019, a pivot in stance from the Fed helped stimulate a rebound across equity markets that continued into the second quarter. Escalating trade tensions disrupted equity markets again in May. The dip was short-lived, as markets rose once again in June and July of 2019, when a trade deal appeared more likely, and the pace of U.S. economic growth remained steady. Nevertheless, concerns continued to emerge over slowing global growth, resulting in bouts of market volatility in August 2019. Stocks rebounded in September and continued an upward path through most of October 2019, supported in part by central bank policy and consistent consumer spending.
In fixed-income markets, a risk-off mentality prevailed to start the period, fueled in part by equity market volatility. A flight to quality supported price increases for U.S. Treasuries, which continued through the end of 2018, leading to a flattening yield curve. After the Fed’s supportive statements in January 2019, other developed-market central banks followed suit and reiterated their abilities to bolster flagging growth by continuing accommodative policies. This further buoyed fixed-income instrument prices. The Fed cut rates in July, September and October of 2019, for a total 75-basis-point reduction in the federal funds rate during the 12 months. Concerns about the pace of global economic growth also fueled demand for fixed-income instruments during much of the reporting period, resulting in positive bond market returns.
We believe that over the near term, the outlook for the U.S. remains positive, but we will monitor relevant data for any signs of a change. As always, we encourage you to discuss the risks and opportunities in today’s investment environment with your financial advisor.
Thank you for your continued confidence and support.
Sincerely,

Renee LaRoche-Morris
President
BNY Mellon Investment Adviser, Inc.
November 15, 2019
2
DISCUSSION OF FUND PERFORMANCE(Unaudited)
For the period from November 1, 2018 through October 31, 2019, as provided by Jeffrey M. Mortimer, CFA, and Caroline Lee, portfolio managers
Market and Fund Performance Overview
For the 12-month period ended October 31, 2019, BNY Mellon Yield Enhancement Strategy Fund’s (formerly, Dreyfus Yield Enhancement Strategy Fund) Class A shares produced a total return of 6.47%, Class C shares returned 5.84%, Class I shares returned 6.85%, and Class Y shares returned 6.89%.1 In comparison, the Bloomberg Barclays U.S. Aggregate Bond Index (the “Barclays Agg Index”) produced a total return of 11.51% for the same period, and the Lipper Alternative Credit Focus Funds Index (the “Index”) produced a total return of 5.12% for the same period.2
Bonds produced positive results over the reporting period in an environment of accommodative monetary policy and falling interest rates. The fund underperformed the Barclays Agg Index, but produced higher returns than the Index. Performance was driven by strong absolute and relative performance of BNY Mellon Corporate Bond Fund, TCW Emerging Markets Income Fund and BNY Mellon Global Dynamic Bond Income Fund (formerly, Dreyfus Global Dynamic Bond Income Fund).
The Fund’s Investment Approach
The fund seeks high current income. To pursue its goal, it normally allocates its assets across fixed-income investment strategies. The fund is designed to complement and diversify traditional bond portfolios. The fund normally allocates its assets among other investment companies (underlying funds) that employ various fixed-income investment strategies, including those focusing on domestic and foreign corporate bonds, high yield securities (“junk” bonds), senior loans, emerging-market debt, municipal securities and treasury inflation-protected securities (TIPS).
BNY Mellon Investment Adviser, Inc. determines the fund’s asset allocation to the fixed-income investment strategies and sets the investment ranges using fundamental and quantitative analysis, and its economic and financial markets outlook. Underlying funds are selected based on their investment objectives and management policies, investment strategies and portfolio holdings, risk/reward profiles, historical performance, and other factors. As of October 31, 2019, the fund held investments in: BNY Mellon Corporate Bond Fund, BNY Mellon Municipal Opportunities Fund, BNY Mellon Floating Rate Income Fund (formerly, Dreyfus Floating Rate Income Fund), BNY Mellon High Yield Fund (formerly, Dreyfus High Yield Fund), BNY Mellon Global Dynamic Bond Income Fund, and TCW Emerging Markets Income Fund.
Bond Markets Pivot on Central Bank Policy
Financial-market volatility persisted in November and December 2018, as tightening U.S. dollar liquidity, softening global growth momentum, and deteriorating equity and credit markets helped government bonds to rally. Slower employment growth and weaker headline inflation, aided by lower oil prices, were supportive of a more gradual approach to U.S. monetary tightening. In January 2019, rising expectations that the U.S.
3
DISCUSSION OF FUND PERFORMANCE(Unaudited) (continued)
Federal Reserve (the “Fed”) would pause its interest-rate hikes was confirmed by Fed Chair Jerome Powell, which helped spur a recovery for fixed-income markets, most of which posted strong returns for the 12 months.
The chief cause of this strong performance was the Fed’s pivot from raising interest rates through much of 2018, to cutting rates in 2019, in response to slowing global growth and escalating trade wars. After a pause, the Fed cut the federal funds rate three times during the summer and fall months. Other central banks around the world also continued their accommodative policies. Somewhat unusually, investment-grade bonds delivered the best return on average, benefiting from a combination of reasonably long duration and credit-spread narrowing. Developed-market government bonds responded well to the Fed’s turnaround, falling inflationary pressures and new bouts of quantitative and monetary easing elsewhere. With the exception of Argentina, emerging-market bonds also performed strongly, as falling U.S. interest rates increased their allure to yield-hungry investors. High yield bonds generally performed well, with the exception of the energy sector. Performance across investment-grade sectors was uniformly strong, with only the automotive sector lagging.
Underlying Funds Produced Mixed Results
The fund’s performance compared to the Index was bolstered during the reporting period by the strong performance of BNY Mellon Corporate Bond Fund, TCW Emerging Markets Income Fund and BNY Mellon Global Dynamic Bond Income Fund. BNY Mellon Corporate Bond Fund bolstered the fund’s return, as the corporate bond fund outperformed due to its positions in energy and information technology. A large overweight to BBB-rated debt and long duration positioning were also beneficial. Investment in TCW Emerging Markets Income Fund was beneficial to fund performance, as the emerging-market fund benefited from security selection within Indonesia and China. Overall fund performance also was helped by its exposure to BNY Mellon Global Dynamic Bond Income Fund, which held long-term U.S. and Australian government debt, which outperformed the broader market during the period.
Detracting from performance was BNY Mellon Floating Rate Income Fund, which was hindered by a relatively large cash position that created a drag on results as rates fell. The fund also had an overweight to B-rated instruments, which provided a headwind to performance, as the credit segment underperformed during part of the period.
In December 2018, we reduced exposure to BNY Mellon Floating Rate Income Fund and redeployed those assets to BNY Mellon Global Dynamic Bond Income Fund, BNY Mellon Municipal Opportunities Fund, and BNY Mellon High Yield Fund. The change was made in order to realize gains from the floating-rate fund and redeploy proceeds in higher-yielding investment options.
Positioning the Portfolio for a Low-Rate Environment
Given recent statements by the Fed, we expect rates to remain relatively low for the near term. Based on this, we have increased positioning to funds that invest in higher-yielding bonds, such as BNY Mellon High Yield Fund and BNY Mellon Municipal
4
Opportunities Fund. We believe the higher coupon rates garnered by the investments within these funds will add value for investors in a low-rate environment.
November 15, 2019
1 Total return includes reinvestment of dividends and any capital gains paid and does not take into consideration the maximum initial sales charge in the case of Class A shares, or the applicable contingent deferred sales charge imposed on redemptions in the case of Class C shares. Had these charges been reflected, returns would have been lower. Class I and Class Y shares are not subject to any initial or deferred sales charges. Share price, yield and investment return fluctuate such that upon redemption, fund shares may be worth more or less than their original cost. Past performance is no guarantee of future results.
2 Source: Lipper Inc. — The Bloomberg Barclays U.S. Aggregate Bond Index is a broad-based, flagship benchmark that measures the investment-grade, U.S. dollar-denominated, fixed-rate taxable bond market. The index includes Treasuries, government-related and corporate securities, MBS (agency fixed-rate and hybrid ARM pass-throughs), ABS and CMBS (agency and non-agency). The Lipper Alternative Credit Focus Funds Index consists of funds that, by prospectus language, invest in a wide range of credit-structured vehicles by using either fundamental credit research analysis or quantitative credit portfolio modeling trying to benefit from any changes in credit quality, credit spreads and market liquidity. Investors cannot invest directly in any index.
Bonds are subject generally to interest-rate, credit, liquidity and market risks, to varying degrees, all of which are more fully described in the fund’s prospectus. Generally, all other factors being equal, bond prices are inversely related to interest-rate changes, and rate increases can cause price declines.
High yield bonds are subject to increased credit risk and are considered speculative in terms of the issuer’s perceived ability to continue making interest payments on a timely basis and to repay principal upon maturity.
Foreign bonds are subject to special risks, including exposure to currency fluctuations, changing political and economic conditions and potentially less liquidity. These risks are generally greater with emerging-market countries than with more economically and politically established foreign countries.
Investments in foreign currencies are subject to the risk that those currencies will decline in value relative to the U.S. dollar, or, in the case of hedged positions, that the U.S. dollar will decline relative to the currency being hedged. Currency rates in foreign countries may fluctuate significantly over short periods of time. A decline in the value of foreign currencies relative to the U.S. dollar will reduce the value of securities held by the fund and denominated in those currencies. The use of leverage may magnify the fund’s gains or losses. For derivatives with a leveraging component, adverse changes in the value or level of the underlying asset can result in a loss that is much greater than the original investment in the derivative.
The underlying funds’ underlying strategies may use derivative instruments, such as options, futures, options on futures, forward contracts, swaps (including credit default swaps on corporate bonds and asset-backed securities), options on swaps and other credit derivatives. A small investment in derivatives could have a potentially large impact on the fund’s performance. The use of derivatives involves risks different from, or possibly greater than, the risks associated with investing directly in the underlying assets.
The ability of the fund to achieve its investment goal depends, in part, on the ability of BNY Mellon Investment Adviser, Inc. to effectively allocate the fund’s assets among the investment strategies and the underlying funds.
5
FUND PERFORMANCE(Unaudited)

Comparison of change in value of a $10,000 investment in Class A shares, Class C shares and Class I shares of BNY Mellon Yield Enhancement Strategy Fund with a hypothetical investment of $10,000 in the Bloomberg Barclays U.S. Aggregate Bond Index and Lipper Alternative Credit Focus Funds Index
† Source: Lipper Inc.
Past performance is not predictive of future performance.
The above graph compares a hypothetical $10,000 investment made in the Class A, Class C and Class I shares of BNY Mellon Yield Enhancement Strategy Fund on 3/7/14 (inception date) to a hypothetical investment of $10,000 made in the Bloomberg Barclays U.S. Aggregate Bond Index and Lipper Alternative Credit Focus Funds Index on that date. All dividends and capital gain distributions are reinvested.
The fund’s performance shown in the line graph above takes into account the maximum initial sales charge on Class A shares and all other applicable fees and expenses on Class A, Class C and Class I shares. The Bloomberg Barclays U.S. Aggregate Bond Index is a broad-based flagship benchmark that measures the investment-grade, U.S. dollar-denominated, fixed-rate taxable bond market. The index includes Treasuries, government-related and corporate securities, MBS (agency fixed-rate and hybrid ARM pass-throughs), ABS and CMBS (agency and nonagency). The Lipper Alternative Credit Focus Funds Index consists of funds that, by prospectus language, invest in a wide range of credit-structured vehicles by using either fundamental credit research analysis or quantitative credit portfolio modeling trying to benefit from any changes in credit quality, credit spreads, and market liquidity. Unlike a mutual fund, the indices are not subject to charges, fees and other expenses. Investors cannot invest directly in any index. Further information relating to fund performance, including expense reimbursements, if applicable, is contained in the Financial Highlights section of the prospectus and elsewhere in this report.
6

Comparison of change in value of a $1,000,000 investment in Class Y shares of BNY Mellon Yield Enhancement Strategy Fund with a hypothetical investment of $1,000,000 in the Bloomberg Barclays U.S. Aggregate Bond Index and Lipper Alternative Credit Focus Funds Index
† Source: Lipper Inc.
Past performance is not predictive of future performance.
The above graph compares a hypothetical $1,000,000 investment made in Class Y shares of BNY Mellon Yield Enhancement Strategy Fund on 3/7/14 (inception date) to a hypothetical investment of $1,000,000 made in the Bloomberg Barclays U.S. Aggregate Bond Index and Lipper Alternative Credit Focus Funds Index on that date. All dividends and capital gain distributions are reinvested.
The fund’s performance shown in the line graph above takes into account all applicable fees and expenses of the fund’s Class Y shares. The Bloomberg Barclays U.S. Aggregate Bond Index is a broad-based flagship benchmark that measures the investment-grade, U.S. dollar-denominated, fixed-rate taxable bond market. The index includes Treasuries, government-related and corporate securities, MBS (agency fixed-rate and hybrid ARM pass-throughs), ABS and CMBS (agency and nonagency). The Lipper Alternative Credit Focus Funds Index consists of funds that, by prospectus language, invest in a wide range of credit-structured vehicles by using either fundamental credit research analysis or quantitative credit portfolio modeling trying to benefit from any changes in credit quality, credit spreads, and market liquidity. Unlike a mutual fund, the indices are not subject to charges, fees and other expenses. Investors cannot invest directly in any index. Further information relating to fund performance, including expense reimbursements, if applicable, is contained in the Financial Highlights section of the prospectus and elsewhere in this report.
7
FUND PERFORMANCE(Unaudited) (continued)
| | | | | | | |
Average Annual Total Returns as of 10/31/19 | | |
| Inception
Date | 1 Year | 5 Year | From
Inception |
Class A shares | | | | | |
with maximum sales charge (4.50%) | 3/7/14 | 1.65% | 2.37% | 2.61% | |
without sales charge | 3/7/14 | 6.47% | 3.32% | 3.45% | |
Class C shares | | | | | |
with applicable redemption charge† | 3/7/14 | 4.84% | 2.54% | 2.66% | |
without redemption | 3/7/14 | 5.84% | 2.54% | 2.66% | |
Class I shares | 3/7/14 | 6.85% | 3.62% | 3.75% | |
Class Y shares | 3/7/14 | 6.89% | 3.70% | 3.81% | |
Bloomberg Barclays U.S.
Aggregate Bond Index | 2/28/14 | 11.51% | 3.24% | 3.40% | †† |
Lipper Alternative
Credit Focus Funds Index | 2/28/14 | 5.12% | 2.11% | 1.97% | †† |
† The maximum contingent deferred sales charge for Class C shares is 1% for shares redeemed within one year of the date of purchase.
†† For comparative purposes, the value of each index on 2/28/14 is used as the beginning value on 3/7/14.
The performance data quoted represents past performance, which is no guarantee of future results. Share price and investment return fluctuate and an investor’s shares may be worth more or less than original cost upon redemption. Current performance may be lower or higher than the performance quoted. Go to www.bnymellonim.com/us for the fund’s most recent month-end returns.
The fund’s performance shown in the graphs and table does not reflect the deduction of taxes that a shareholder would pay on fund distributions or the redemption of fund shares. In addition to the performance of Class A shares shown with and without a maximum sales charge, the fund’s performance shown in the table takes into account all other applicable fees and expenses on all classes.
8
UNDERSTANDING YOUR FUND’S EXPENSES(Unaudited)
As a mutual fund investor, you pay ongoing expenses, such as management fees and other expenses. Using the information below, you can estimate how these expenses affect your investment and compare them with the expenses of other funds. You also may pay one-time transaction expenses, including sales charges (loads) and redemption fees, which are not shown in this section and would have resulted in higher total expenses. For more information, see your fund’s prospectus or talk to your financial adviser.
Review your fund’s expenses
The table below shows the expenses you would have paid on a $1,000 investment in BNY Mellon Yield Enhancement Strategy Fund from May 1, 2019 to October 31, 2019. It also shows how much a $1,000 investment would be worth at the close of the period, assuming actual returns and expenses.
| | | | | | | |
Expenses and Value of a $1,000 Investment | |
Assume actual returns for the six months ended October 31, 2019 | |
| | | | | | |
| | Class A | Class C | Class I | Class Y | |
Expense paid per $1,000† | $2.45 | $5.56 | $.46 | $.31 | |
Ending value (after expenses) | $1,025.00 | $1,023.30 | $1,027.80 | $1,027.10 | |
COMPARING YOUR FUND’S EXPENSES
WITH THOSE OF OTHER FUNDS(Unaudited)
Using the SEC’s method to compare expenses
The Securities and Exchange Commission (“SEC”) has established guidelines to help investors assess fund expenses. Per these guidelines, the table below shows your fund’s expenses based on a $1,000 investment, assuming a hypothetical 5% annualized return. You can use this information to compare the ongoing expenses (but not transaction expenses or total cost) of investing in the fund with those of other funds. All mutual fund shareholder reports will provide this information to help you make this comparison. Please note that you cannot use this information to estimate your actual ending account balance and expenses paid during the period.
| | | | | | | |
Expenses and Value of a $1,000 Investment | |
Assuming a hypothetical 5% annualized return for the six months ended October 31, 2019 | |
| | | | | | |
| | Class A | Class C | Class I | Class Y | |
Expense paid per $1,000† | $2.45 | $5.55 | $.46 | $.31 | |
Ending value (after expenses) | $1,022.79 | $1,019.71 | $1,024.75 | $1,024.90 | |
† Expenses are equal to the fund’s annualized expense ratio of .48% for Class A, 1.09% for Class C, .09% for Class I and .06% for Class Y, multiplied by the average account value over the period, multiplied by 184/365 (to reflect the one-half year period). |
9
STATEMENT OF INVESTMENTS
October 31, 2019
| | | | | | | | |
| |
Description | | | | Shares | | Value ($) | |
Investment Companies - 99.6% | | | | | |
Domestic Fixed Income - 48.2% | | | | | |
BNY Mellon Corporate Bond Fund, Cl. M | | | | 3,403,666 | a | 45,472,976 | |
BNY Mellon Floating Rate Income Fund, Cl. Y | | | | 8,741,317 | a | 100,350,312 | |
BNY Mellon High Yield Fund, Cl. I | | | | 9,305,147 | a | 56,854,448 | |
| | | | | 202,677,736 | |
Foreign Equity - 3.5% | | | | | |
TCW Emerging Markets Income Fund, Cl. I | | | | 1,746,557 | | 14,548,819 | |
Foreign Fixed Income - 9.3% | | | | | |
BNY Mellon Global Dynamic Bond Income Fund, Cl. Y | | | | 3,116,166 | a | 39,045,563 | |
Municipal Bond - 38.6% | | | | | |
BNY Mellon Municipal Opportunities Fund, Cl. M | | | | 11,974,504 | a | 162,254,531 | |
Total Investments(cost $410,787,212) | | 99.6% | | 418,526,649 | |
Cash and Receivables (Net) | | .4% | | 1,868,226 | |
Net Assets | | 100.0% | | 420,394,875 | |
a Investment in affiliated issuer. The investment objective of this investment company is publicly available and can be found within the investment company’s prospectus.
| | |
Portfolio Summary (Unaudited)† | Value (%) |
Investment Companies | 99.6 |
| | 99.6 |
† Based on net assets.
See notes to financial statements.
10
STATEMENT OF INVESTMENTS IN AFFILIATED ISSUERS
| | | | | |
Investment Companies | Value
10/31/18 ($) | Purchases ($)† | Sales ($) | Net Realized
Gain (Loss) ($) |
BNY Mellon Corporate Bond
Fund, Cl. M | 42,802,819 | 5,587,876 | 6,424,581 | (117,395) |
BNY Mellon Floating Rate
Income Fund, CI. Y | 140,365,028 | 14,727,675 | 49,059,532 | (3,965,553) |
BNY Mellon Global Dynamic
Bond Income Fund, CI. Y | 32,795,598 | 10,364,498 | 5,547,879 | (129,900) |
BNY Mellon High Yield Fund, CI. I | 53,265,139 | 27,125,751 | 24,868,597 | (1,529,309) |
BNY Mellon Municipal
Opportunities Fund, CI. M | 148,024,455 | 29,435,597 | 22,774,206 | (228,799) |
Total | 417,253,039 | 87,241,397 | 108,674,795 | (5,970,956) |
| | | | | | |
Investment Companies | Net Change in
Unrealized
Appreciation
(Depreciation) ($) | Value
10/31/19 ($) | Net
Assets (%) | Dividends/
Distributions ($) |
BNY Mellon Corporate Bond
Fund, Cl. M | 3,624,257 | 45,472,976 | 10.8 | 1,634,155 |
BNY Mellon Floating Rate
Income Fund, CI. Y | (1,717,306) | 100,350,312 | 23.9 | 6,101,395 |
BNY Mellon Global Dynamic
Bond Income Fund, CI. Y | 1,563,246 | 39,045,563 | 9.3 | 1,787,358 |
BNY Mellon High Yield Fund, CI. I | 2,861,464 | 56,854,448 | 13.5 | 3,215,366 |
BNY Mellon Municipal
Opportunities Fund, CI. M | 7,797,484 | 162,254,531 | 38.6 | 5,118,716 |
Total | | 14,129,145 | 403,977,830 | 96.1 | 17,856,990 |
† Includes reinvested dividends/distributions.
See notes to financial statements.
11
STATEMENT OF ASSETS AND LIABILITIES
October 31, 2019
| | | | | | | |
| | | | | | |
| | | Cost | | Value | |
Assets ($): | | | | |
Investments in securities—See Statement of Investments | | | |
Unaffiliated issuers | 14,766,803 | | 14,548,819 | |
Affiliated issuers | | 396,020,409 | | 403,977,830 | |
Cash | | | | | 998,607 | |
Receivable for shares of Common Stock subscribed | | 916,852 | |
Dividends and interest receivable | | 877,195 | |
Receivable for investment securities sold | | 59,400 | |
Prepaid expenses | | | | | 24,517 | |
| | | | | 421,403,220 | |
Liabilities ($): | | | | |
Due to BNY Mellon Investment Adviser, Inc. and affiliates—Note 3(c) | | 8,181 | |
Payable for investment securities purchased | | 811,513 | |
Payable for shares of Common Stock redeemed | | 126,132 | |
Directors fees and expenses payable | | 3,724 | |
Other accrued expenses | | | | | 58,795 | |
| | | | | 1,008,345 | |
Net Assets ($) | | | 420,394,875 | |
Composition of Net Assets ($): | | | | |
Paid-in capital | | | | | 431,209,500 | |
Total distributable earnings (loss) | | | | | (10,814,625) | |
Net Assets ($) | | | 420,394,875 | |
| | | | | | |
Net Asset Value Per Share | Class A | Class C | Class I | Class Y | |
Net Assets ($) | 584,522 | 24,584 | 9,803,707 | 409,982,062 | |
Shares Outstanding | 47,558 | 2,000 | 795,823 | 33,307,190 | |
Net Asset Value Per Share ($) | 12.29 | 12.29 | 12.32 | 12.31 | |
| | | | | |
See notes to financial statements. | | | | | |
12
STATEMENT OF OPERATIONS
Year Ended October 31, 2019
| | | | | | | |
| | | | | | |
| | | | | | |
Investment Income ($): | | | | |
Income: | | | | |
Cash dividends: | |
Unaffiliated issuers | | | 770,463 | |
Affiliated issuers | | | 17,754,919 | |
Interest | | | 22,835 | |
Total Income | | | 18,548,217 | |
Expenses: | | | | |
Professional fees | | | 70,093 | |
Registration fees | | | 65,936 | |
Directors’ fees and expenses—Note 3(d) | | | 39,332 | |
Loan commitment fees—Note 2 | | | 10,933 | |
Prospectus and shareholders’ reports | | | 9,038 | |
Shareholder servicing costs—Note 3(c) | | | 6,182 | |
Interest expense—Note 2 | | | 6,072 | |
Custodian fees—Note 3(c) | | | 619 | |
Distribution fees—Note 3(b) | | | 182 | |
Miscellaneous | | | 29,772 | |
Total Expenses | | | 238,159 | |
Investment Income—Net | | | 18,310,058 | |
Realized and Unrealized Gain (Loss) on Investments—Note 4 ($): | | |
Net realized gain (loss) on investments: | | |
Unaffiliated issuers | | | | (211,812) | |
Affiliated issuers | | | | (5,970,956) | |
Capital gain distributions from affiliated issuers | 102,071 | |
Net Realized Gain (Loss) | | | (6,080,697) | |
Net change in unrealized appreciation (depreciation) on investments: | | |
Unaffiliated issuers | | | | 1,186,715 | |
Affiliated issuers | | | | 14,129,145 | |
Net Change in Unrealized Appreciation (Depreciation) | | | 15,315,860 | |
Net Realized and Unrealized Gain (Loss) on Investments | | | 9,235,163 | |
Net Increase in Net Assets Resulting from Operations | | 27,545,221 | |
| | | | | | |
See notes to financial statements. | | | | | |
13
STATEMENT OF CHANGES IN NET ASSETS
| | | | | | | | | | |
| | | | Year Ended October 31, |
| | | | 2019 | | 2018 | |
Operations ($): | | | | | | | | |
Investment income—net | | | 18,310,058 | | | | 18,715,131 | |
Net realized gain (loss) on investments | | (6,080,697) | | | | (5,377,110) | |
Net change in unrealized appreciation
(depreciation) on investments | | 15,315,860 | | | | (7,678,996) | |
Net Increase (Decrease) in Net Assets
Resulting from Operations | 27,545,221 | | | | 5,659,025 | �� |
Distributions ($): | |
Distributions to shareholders: | | | | | | | | |
Class A | | | (29,749) | | | | (28,661) | |
Class C | | | (834) | | | | (767) | |
Class I | | | (404,073) | | | | (275,253) | |
Class Y | | | (17,994,111) | | | | (18,996,217) | |
Total Distributions | | | (18,428,767) | | | | (19,300,898) | |
Capital Stock Transactions ($): | |
Net proceeds from shares sold: | | | | | | | | |
Class A | | | 193,677 | | | | 715,571 | |
Class I | | | 6,741,942 | | | | 8,616,334 | |
Class Y | | | 106,540,860 | | | | 82,730,882 | |
Distributions reinvested: | | | | | | | | |
Class A | | | 23,400 | | | | 24,898 | |
Class I | | | 361,343 | | | | 244,641 | |
Class Y | | | 1,503,195 | | | | 1,987,366 | |
Cost of shares redeemed: | | | | | | | | |
Class A | | | (671,612) | | | | (118,871) | |
Class I | | | (6,754,330) | | | | (5,135,278) | |
Class Y | | | (127,240,462) | | | | (107,740,862) | |
Increase (Decrease) in Net Assets
from Capital Stock Transactions | (19,301,987) | | | | (18,675,319) | |
Total Increase (Decrease) in Net Assets | (10,185,533) | | | | (32,317,192) | |
Net Assets ($): | |
Beginning of Period | | | 430,580,408 | | | | 462,897,600 | |
End of Period | | | 420,394,875 | | | | 430,580,408 | |
14
| | | | | | | | | | |
| | | | Year Ended October 31, |
| | | | 2019 | | 2018 | |
Capital Share Transactions (Shares): | |
Class A | | | | | | | | |
Shares sold | | | 15,835 | | | | 58,618 | |
Shares issued for distributions reinvested | | | 1,952 | | | | 2,047 | |
Shares redeemed | | | (55,615) | | | | (9,811) | |
Net Increase (Decrease) in Shares Outstanding | (37,828) | | | | 50,854 | |
Class Ia | | | | | | | | |
Shares sold | | | 551,139 | | | | 705,948 | |
Shares issued for distributions reinvested | | | 29,905 | | | | 20,067 | |
Shares redeemed | | | (554,187) | | | | (419,817) | |
Net Increase (Decrease) in Shares Outstanding | 26,857 | | | | 306,198 | |
Class Ya | | | | | | | | |
Shares sold | | | 8,842,781 | | | | 6,776,043 | |
Shares issued for distributions reinvested | | | 124,634 | | | | 162,876 | |
Shares redeemed | | | (10,569,356) | | | | (8,857,760) | |
Net Increase (Decrease) in Shares Outstanding | (1,601,941) | | | | (1,918,841) | |
| | | | | | | | | |
a During the period ended October 31, 2019, 309,744 Class Y shares representing $3,792,712 were exchanged for 309,491 Class I shares and during the period ended October 31, 2018, 291,566 Class Y shares representing $3,547,650 were exchanged for 291,331 Class I shares. | |
See notes to financial statements.
| | | | | | | | |
15
FINANCIAL HIGHLIGHTS
The following tables describe the performance for each share class for the fiscal periods indicated. All information (except portfolio turnover rate) reflects financial results for a single fund share. Total return shows how much your investment in the fund would have increased (or decreased) during each period, assuming you had reinvested all dividends and distributions. These figures have been derived from the fund’s financial statements.
| | | | | | | | | | |
| | | | | | | | |
| | | | | | |
Class A Shares | | Year Ended October 31, |
| | 2019 | 2018 | 2017 | 2016 | 2015 | |
Per Share Data ($): | | | | | | | |
Net asset value, beginning of period | | 12.02 | 12.39 | 12.32 | 12.21 | 12.65 | |
Investment Operations: | | | | | | | |
Investment income—neta | | .49 | .45 | .45 | .50 | .49 | |
Net realized and unrealized
gain (loss) on investments | | .27 | (.35) | .07 | .10 | (.48) | |
Total from Investment Operations | | .76 | .10 | .52 | .60 | .01 | |
Distributions: | | | | | | | |
Dividends from
investment income—net | | (.49) | (.47) | (.45) | (.49) | (.45) | |
Net asset value, end of period | | 12.29 | 12.02 | 12.39 | 12.32 | 12.21 | |
Total Return (%)b | | 6.47 | .83 | 4.38 | 4.98 | .10 | |
Ratios/Supplemental Data (%): | | | | | | | |
Ratio of total expenses
to average net assetsc | | .47 | .38 | .41 | .31 | .33 | |
Ratio of net expenses
to average net assetsc | | .47 | .38 | .41 | .31 | .33 | |
Ratio of net investment income
to average net assetsc | | 4.19 | 3.67 | 3.63 | 4.03 | 3.88 | |
Portfolio Turnover Rate | | 21.45 | 22.78 | 10.47 | 16.14 | 17.13 | |
Net Assets, end of period ($ x 1,000) | | 585 | 1,027 | 428 | 155 | 544 | |
a Based on average shares outstanding.
b Exclusive of sales charge.
c Amount does not include the expenses of the underlying funds.
See notes to financial statements.
16
| | | | | | | | | | |
| | | | | | | | | |
| | | | | | |
Class C Shares | | Year Ended October 31, |
| | 2019 | 2018 | 2017 | 2016 | 2015 |
Per Share Data ($): | | | | | | | |
Net asset value, beginning of period | | | 12.02 | 12.40 | 12.31 | 12.19 | 12.63 |
Investment Operations: | | | | | | | |
Investment income—neta | | | .40 | .35 | .35 | .38 | .37 |
Net realized and unrealized
gain (loss) on investments | | | .29 | (.35) | .05 | .13 | (.45) |
Total from Investment Operations | | | .69 | - | .40 | .51 | (.08) |
Distributions: | | | | | | | |
Dividends from
investment income—net | | | (.42) | (.38) | (.31) | (.39) | (.36) |
Net asset value, end of period | | | 12.29 | 12.02 | 12.40 | 12.31 | 12.19 |
Total Return (%)b | | | 5.84 | .02 | 3.31 | 4.34 | (.66) |
Ratios/Supplemental Data (%): | | | | | | | |
Ratio of total expenses
to average net assetsc | | | 1.12 | 1.26 | 1.37 | 1.12 | 1.13 |
Ratio of net expenses
to average net assetsc | | | 1.12 | 1.26 | 1.37 | 1.12 | 1.13 |
Ratio of net investment income
to average net assetsc | | | 3.32 | 2.84 | 2.90 | 3.18 | 2.96 |
Portfolio Turnover Rate | | | 21.45 | 22.78 | 10.47 | 16.14 | 17.13 |
Net Assets, end of period ($ x 1,000) | | | 25 | 24 | 25 | 50 | 24 |
a Based on average shares outstanding.
b Exclusive of sales charge.
c Amount does not include the expenses of the underlying funds.
See notes to financial statements.
17
FINANCIAL HIGHLIGHTS (continued)
| | | | | | | | | | | | | |
| | | | | | | |
| | | | | | |
Class I Shares | | Year Ended October 31, |
| | 2019 | 2018 | 2017 | 2016 | 2015 | |
Per Share Data ($): | | | | | | | |
Net asset value, beginning of period | | 12.05 | 12.41 | 12.34 | 12.22 | 12.66 | |
Investment Operations: | | | | | | | |
Investment income—neta | | .53 | .48 | .47 | .48 | .50 | |
Net realized and unrealized
gain (loss) on investments | | .27 | (.33) | .08 | .15 | (.46) | |
Total from Investment Operations | | .80 | .15 | .55 | .63 | .04 | |
Distributions: | | | | | | | |
Dividends from
investment income—net | | (.53) | (.51) | (.48) | (.51) | (.48) | |
Net asset value, end of period | | 12.32 | 12.05 | 12.41 | 12.34 | 12.22 | |
Total Return (%) | | 6.85 | 1.20 | 4.66 | 5.22 | .33 | |
Ratios/Supplemental Data (%): | | | | | | | |
Ratio of total expenses
to average net assetsb | | .09 | .08 | .11 | .19 | .15 | |
Ratio of net expenses
to average net assetsb | | .09 | .08 | .11 | .19 | .15 | |
Ratio of net investment income
to average net assetsb | | 4.34 | 3.99 | 3.85 | 4.16 | 4.05 | |
Portfolio Turnover Rate | | 21.45 | 22.78 | 10.47 | 16.14 | 17.13 | |
Net Assets, end of period ($ x 1,000) | | 9,804 | 9,264 | 5,742 | 538 | 250 | |
a Based on average shares outstanding.
b Amount does not include the expenses of the underlying funds.
See notes to financial statements.
18
| | | | | | | | | | | | | |
| | | | | | | |
| | | | | | |
Class Y Shares | | Year Ended October 31, |
| | 2019 | 2018 | 2017 | 2016 | 2015 | |
Per Share Data ($): | | | | | | | |
Net asset value, beginning of period | | 12.04 | 12.40 | 12.33 | 12.21 | 12.65 | |
Investment Operations: | | | | | | | |
Investment income—neta | | .53 | .50 | .50 | .52 | .51 | |
Net realized and unrealized
gain (loss) on investments | | .28 | (.35) | .06 | .12 | (.46) | |
Total from Investment Operations | | .81 | .15 | .56 | .64 | .05 | |
Distributions: | | | | | | | |
Dividends from
investment income—net | | (.54) | (.51) | (.49) | (.52) | (.49) | |
Net asset value, end of period | | 12.31 | 12.04 | 12.40 | 12.33 | 12.21 | |
Total Return (%) | | 6.89 | 1.23 | 4.72 | 5.37 | .42 | |
Ratios/Supplemental Data (%): | | | | | | | |
Ratio of total expenses
to average net assetsb | | .06 | .05 | .05 | .05 | .06 | |
Ratio of net expenses
to average net assetsb | | .06 | .05 | .04 | .05 | .06 | |
Ratio of net investment income
to average net assetsb | | 4.39 | 4.06 | 4.11 | 4.28 | 4.05 | |
Portfolio Turnover Rate | | 21.45 | 22.78 | 10.47 | 16.14 | 17.13 | |
Net Assets, end of period ($ x 1,000) | | 409,982 | 420,265 | 456,703 | 422,405 | 409,077 | |
a Based on average shares outstanding.
b Amount does not include the expenses of the underlying funds.
See notes to financial statements.
19
NOTES TO FINANCIAL STATEMENTS
NOTE 1—Significant Accounting Policies:
BNY Mellon Yield Enhancement Strategy Fund (the “fund”) is a separate diversified series of BNY Mellon Investment Funds II, Inc. (the “Company”), which is registered under the Investment Company Act of 1940, as amended (the “Act”), as an open-end management investment company and operates as a series company currently offering three series, including the fund. The fund’s investment objective is to seek high current income. BNY Mellon Investment Adviser, Inc. (the “Adviser”), a wholly-owned subsidiary of The Bank of New York Mellon Corporation (“BNY Mellon”), serves as the fund’s investment adviser.
Effective June 3, 2019, the fund changed its name from Dreyfus Yield Enhancement Strategy Fund to BNY Mellon Yield Enhancement Strategy Fund and the Company changed its name from Dreyfus BNY Mellon Funds, Inc. to BNY Mellon Investment Funds II, Inc. In addition, The Dreyfus Corporation, the fund’s investment adviser, changed its name to “BNY Mellon Investment Adviser, Inc.”, MBSC Securities Corporation, the fund’s distributor, changed its name to “BNY Mellon Securities Corporation” and Dreyfus Transfer, Inc., the fund’s transfer agent, changed its name to “BNY Mellon Transfer, Inc.”
BNY Mellon Securities Corporation (the “Distributor”), a wholly-owned subsidiary of the Adviser, is the distributor of the fund’s shares. The fund is authorized to issue 100 million shares of $.001 par value Common Stock in each of the following classes of shares: Class A, Class C, Class I, Class T and Class Y. Class A, Class C and Class T shares are sold primarily to retail investors through financial intermediaries and bear Distribution and/or Shareholder Services Plan fees. Class A and Class T shares generally are subject to a sales charge imposed at the time of purchase. Class C shares are subject to a contingent deferred sales charge (“CDSC”) imposed on Class C shares redeemed within one year of purchase. Class C shares automatically convert to Class A shares ten years after the date of purchase, without the imposition of a sales charge. Class I shares are sold primarily to bank trust departments and other financial service providers (including The Bank of New York Mellon, a subsidiary of BNY Mellon and an affiliate of the Adviser, and its affiliates), acting on behalf of customers having a qualified trust or an investment account or relationship at such institution, and bear no Distribution or Shareholder Services Plan fees. Class Y shares are sold at net asset value per share generally to institutional investors, and bear no Distribution or Shareholder Services Plan fees. Class I and Class Y shares are offered without a front-end sales
20
charge or CDSC. As of the date of this report, the fund did not offer Class T shares for purchase. Other differences between the classes include the services offered to and the expenses borne by each class, the allocation of certain transfer agency costs, and certain voting rights. Income, expenses (other than expenses attributable to a specific class), and realized and unrealized gains or losses on investments are allocated to each class of shares based on its relative net assets.
As of October 31, 2019, MBC Investments Corp., an indirect subsidiary of BNY Mellon, held all of the outstanding Class C shares of the fund.
The Company accounts separately for the assets, liabilities and operations of each series. Expenses directly attributable to each series are charged to that series’ operations; expenses which are applicable to all series are allocated among them on a pro rata basis.
The Financial Accounting Standards Board (“FASB”) Accounting Standards Codification (“ASC”) is the exclusive reference of authoritative U.S. generally accepted accounting principles (“GAAP”) recognized by the FASB to be applied by nongovernmental entities. Rules and interpretive releases of the Securities and Exchange Commission (“SEC”) under authority of federal laws are also sources of authoritative GAAP for SEC registrants. The fund is an investment company and applies the accounting and reporting guidance of the FASB ASC Topic 946 Financial Services-Investment Companies. The fund’s financial statements are prepared in accordance with GAAP, which may require the use of management estimates and assumptions. Actual results could differ from those estimates.
The Companyenters into contracts that contain a variety of indemnifications. The fund’s maximum exposure under these arrangements is unknown. The fund does not anticipate recognizing any loss related to these arrangements.
(a) Portfolio valuation: The fair value of a financial instrument is the amount that would be received to sell an asset or paid to transfer a liability in an orderly transaction between market participants at the measurement date (i.e., the exit price). GAAP establishes a fair value hierarchy that prioritizes the inputs of valuation techniques used to measure fair value. This hierarchy gives the highest priority to unadjusted quoted prices in active markets for identical assets or liabilities (Level 1 measurements) and the lowest priority to unobservable inputs (Level 3 measurements).
Additionally, GAAP provides guidance on determining whether the volume and activity in a market has decreased significantly and whether such a decrease in activity results in transactions that are not orderly.
21
NOTES TO FINANCIAL STATEMENTS(continued)
GAAP requires enhanced disclosures around valuation inputs and techniques used during annual and interim periods.
Various inputs are used in determining the value of the fund’s investments relating to fair value measurements. These inputs are summarized in the three broad levels listed below:
Level 1—unadjusted quoted prices in active markets for identical investments.
Level 2—other significant observable inputs (including quoted prices for similar investments, interest rates, prepayment speeds, credit risk, etc.).
Level 3—significant unobservable inputs (including the fund’s own assumptions in determining the fair value of investments).
The inputs or methodology used for valuing securities are not necessarily an indication of the risk associated with investing in those securities.
Investments are valued at the net asset value of each underlying fund determined as of the close of the New York Stock Exchange (generally 4 p.m., Eastern time) on the valuation date and are generally categorized within Level 1 of the fair value hierarchy.
The following is a summary of the inputs used as of October 31, 2019in valuing the fund’s investments:
| | | | | | |
Assets ($) | Level 1 - Unadjusted Quoted Prices | Level 2 - Other Significant Observable Inputs | Level 3 - Significant Unobservable Inputs | Total |
Investments in Securities:† | | | |
Investment
Companies | 418,526,649 | - | - | 418,526,649 |
† See Statement of Investments for additional detailed categorizations, if any.
(b)Securities transactions and investment income: Securities transactions are recorded on a trade date basis. Realized gains and losses from securities transactions are recorded on the identified cost basis. Dividend income is recognized on the ex-dividend date and interest income, including, where applicable, accretion of discount and amortization of premium on investments, is recognized on the accrual basis.
(c) Affiliated issuers: Investments in other investment companies advised by the Adviser are considered “affiliated” under the Act.
22
(d) Dividends and distributions to shareholders: Dividends and distributions are recorded on the ex-dividend date. Dividends from investment income-net are normally declared and paid on a monthly basis. Dividends from net realized capital gains, if any, are normally declared and paid annually, but the fund may make distributions on a more frequent basis to comply with the distribution requirements of the Internal Revenue Code of 1986, as amended (the “Code”). To the extent that net realized capital gains can be offset by capital loss carryovers, it is the policy of the fund not to distribute such gains. Income and capital gain distributions are determined in accordance with income tax regulations, which may differ from GAAP.
(e) Federal income taxes: It is the policy of the fund to continue to qualify as a regulated investment company, if such qualification is in the best interests of its shareholders, by complying with the applicable provisions of the Code, and to make distributions of taxable income and net realized capital gain sufficient to relieve it from substantially all federal income and excise taxes.
As of and during the period ended October 31, 2019, the fund did not have any liabilities for any uncertain tax positions. The fund recognizes interest and penalties, if any, related to uncertain tax positions as income tax expense in the Statement of Operations. During the period ended October 31, 2019, the fund did not incur any interest or penalties.
Each tax year in the four-year period ended October 31, 2019 remains subject to examination by the Internal Revenue Service and state taxing authorities.
At October 31, 2019, the components of accumulated earnings on a tax basis were as follows: undistributed ordinary income $1,374,530, accumulated capital losses $15,277,912 and unrealized appreciation $3,088,757.
The fund is permitted to carry forward capital losses for an unlimited period. Furthermore, capital loss carryovers retain their character as either short-term or long-term capital losses.
The accumulated capital loss carryover is available for federal income tax purposes to be applied against future netrealized capital gains, if any, realized subsequent to October 31, 2019. The fund has $2,704,625 of short-term capital losses and $12,573,287 of long-term capital losses which can be carried forward for an unlimited period.
The tax character of distributions paid to shareholders during the fiscal periods ended October 31, 2019 and October 31, 2018 were as follows:
23
NOTES TO FINANCIAL STATEMENTS(continued)
ordinary income $13,412,211 and $14,662,110, and tax-exempt income $5,016,556 and $4,638,788, respectively.
(f) New Accounting Pronouncements: Effective June 1, 2019, the fund adopted Accounting Standards Update 2018-13, Fair Value Measurement (Topic 820): Disclosure Framework—Changes to the Disclosure Requirements for Fair Value Measurement (“ASU 2018-13”). The update provides guidance that eliminates, adds and modifies certain disclosure requirements for fair value measurements. The adoption of ASU 2018-13 had no impact on the operations of the fund for the period ended October 31, 2019.
NOTE 2—Bank Lines of Credit:
The fund participates with other long-term open-end funds managed by the Adviser in a $1.030 billion unsecured credit facility led by Citibank, N.A. (the “Citibank Credit Facility”) and a $300 million unsecured credit facility provided by The Bank of New York Mellon (the “BNYM Credit Facility”), each to be utilized primarily for temporary or emergency purposes, including the financing of redemptions (each, a “Facility”). The Citibank Credit Facility is available in two tranches: (i) Tranche A is in an amount equal to $830 million and is available to all long-term open-ended funds, including the fund, and (ii) Tranche B is in amount equal to $200 million and is available only to BNY Mellon Floating Rate Income Fund, a series of BNY Mellon Investment Funds IV, Inc. In connection therewith, the fund has agreed to pay its pro rata portion of commitment fees for Tranche A of the Citibank Credit Facility and the BNYM Credit Facility. Interest is charged to the fund based on rates determined pursuant to the terms of the respective Facility at the time of borrowing.
The average amount of borrowings outstanding under the Facilities during the period ended October 31, 2019 was approximately $173,700 with a related weighted average annualized interest rate of 3.50%.
NOTE 3—Management Fee and Other Transactions with Affiliates:
(a)Pursuant to a management agreement with the Adviser, there is no management fee paid to the Adviser. The fund may invest in other affiliated mutual funds advised by the Adviser and unaffiliated open-end funds, closed-end funds and exchange-traded funds. All fees and expenses of the underlying funds are reflected in the underlying fund’s net asset value.
During the period ended October 31, 2019, the Distributor retained $157 from commissions earned on sales of the fund’s Class A shares.
24
(b) Under the Distribution Plan adopted pursuant to Rule 12b-1 under the Act, Class C shares pay the Distributor for distributing its shares at an annual rate of .75% of the value of its average daily net assets. During the period ended October 31, 2019, Class C shares were charged $182 pursuant to the Distribution Plan.
(c)Under the Shareholder Services Plan, Class A and Class C shares pay the Distributor at an annual rate of .25% of the value of their average daily net assets for the provision of certain services. The services provided may include personal services relating to shareholder accounts, such as answering shareholder inquiries regarding the fund and providing reports and other information, and services related to the maintenance of shareholder accounts. The Distributor may make payments to Service Agents (securities dealers, financial institutions or other industry professionals) with respect to these services. The Distributor determines the amounts to be paid to Service Agents. During the period ended October 31, 2019, Class A and Class C shares were charged $1,698and $61, respectively, pursuant to the Shareholder Services Plan.
Under its terms, the Distribution Plan and Shareholder Services Plan shall remain in effect from year to year, provided such continuance is approved annually by a vote of a majority of those Directors who are not “interested persons” of the Company and who have no direct or indirect financial interest in the operation of or in any agreement related to the Distribution Plan or Shareholder Services Plan.
The fund has an arrangement with the transfer agent whereby the fund may receive earnings credits when positive cash balances are maintained, which are used to offset transfer agency fees and the fund has an arrangement with the custodian to receive interest income or be charged an overdraft fees when cash balances are maintained. For financial reporting purposes, the fund includes net earnings credits, if any, as an expense offset in the Statement of Operations.
The fund compensates BNY Mellon Transfer, Inc., a wholly-owned subsidiary of the Adviser, under a transfer agency agreement for providing transfer agency and cash management services for the fund. The majority of transfer agency fees are comprised of amounts paid on a per account basis, while cash management fees are related to fund subscriptions and redemptions. During the period ended October 31, 2019, the fund was charged $2,501 for transfer agency services. These fees are included in Shareholder servicing costs in the Statement of Operations.
The fund compensates The Bank of New York Mellon under a custody agreement for providing custodial services for the fund. These fees are
25
NOTES TO FINANCIAL STATEMENTS(continued)
determined based on net assets, geographic region and transaction activity. During the period ended October 31, 2019, the fund was charged $619 pursuant to the custody agreement.
During the period ended October 31, 2019, the fund was charged $11,610 for services performed by the Chief Compliance Officer and his staff.
The components of “Due to BNY Mellon Investment Adviser, Inc. and affiliates” in the Statement of Assets and Liabilities consist of: Distribution Plan fees of $16, Shareholder Services Plan fees of $123, custodian fees of $3,150, Chief Compliance Officer fees of $4,504 and transfer agency fees of $388.
(d) Each Board member also serves as a Board member of other funds in the BNY Mellon Family of Funds complex. Annual retainer fees and attendance fees are allocated to each fund based on net assets.
NOTE 4—Securities Transactions:
The aggregate amount of purchases and sales of investment securities, excluding short-term securities, during the period ended October 31, 2019, amounted to $89,182,896 and $111,326,219, respectively.
At October 31, 2019, the cost of investments for federal income tax purposes was $415,437,892; accordingly, accumulated net unrealized appreciation on investments was $3,088,757, consisting of $12,684,985 gross unrealized appreciation and $9,596,228 gross unrealized depreciation.
26
REPORT OF INDEPENDENT REGISTERED PUBLIC ACCOUNTING FIRM
To the Shareholders of the Fund and Board of Directors of
BNY Mellon Investment Funds II, Inc. (formerly, Dreyfus BNY Mellon Funds, Inc.):
Opinion on the Financial Statements
We have audited the accompanying statement of assets and liabilities of BNY Mellon Yield Enhancement Strategy Fund (formerly, Dreyfus Yield Enhancement Strategy Fund) (the “Fund”), a series of BNY Mellon Investment Funds II, Inc., including the statement of investments, as of October 31, 2019, and the statement of investments in affiliated issuers as of and for the year then ended, the related statement of operations for the year then ended, the statements of changes in net assets for each of the years in the two-year period then ended, and the related notes (collectively, the financial statements), and the financial highlights for each of the years in the five-year period then ended. In our opinion, the financial statements and financial highlights present fairly, in all material respects, the financial position of the Fund as of October 31, 2019, the results of its operations for the year then ended, the changes in its net assets for each of the years in the two-year period then ended, and the financial highlights for each of the years in the five-year period then ended, in conformity with U.S. generally accepted accounting principles.
Basis for Opinion
These financial statements and financial highlights are the responsibility of the Fund’s management. Our responsibility is to express an opinion on these financial statements and financial highlights based on our audits. We are a public accounting firm registered with the Public Company Accounting Oversight Board (United States) (PCAOB) and are required to be independent with respect to the Fund in accordance with the U.S. federal securities laws and the applicable rules and regulations of the Securities and Exchange Commission and the PCAOB.
We conducted our audits in accordance with the standards of the PCAOB. Those standards require that we plan and perform the audit to obtain reasonable assurance about whether the financial statements and financial highlights are free of material misstatement, whether due to error or fraud. Our audits included performing procedures to assess the risks of material misstatement of the financial statements and financial highlights, whether due to error or fraud, and performing procedures that respond to those risks. Such procedures included examining, on a test basis, evidence regarding the amounts and disclosures in the financial statements and financial highlights. Such procedures also included confirmation of securities owned as of October 31, 2019, by correspondence with the transfer agent and custodian. Our audits also included evaluating the accounting principles used and significant estimates made by management, as well as evaluating the overall presentation of the financial statements and financial highlights. We believe that our audits provide a reasonable basis for our opinion.

We have served as the auditor of one or more BNY Mellon Investment Adviser, Inc. investment companies since 1994.
New York, New York
December 20, 2019
27
IMPORTANT TAX INFORMATION(Unaudited)
For federal tax purposes, the fund reports the maximum amount allowable, but not less than $13,412,211 as ordinary income dividends paid during the year ended October 31, 2019 as qualified dividend income in accordance with Section 854(b)(1)(B) of the Internal Revenue Code. Also, the fund reports the maximum amount allowable but not less than 100% of ordinary income dividends paid during the year ended October 31, 2019 as eligible for the corporate dividends received deduction provided under Section 243 of the Internal Revenue Code in accordance with Section 854(b)(1)(A) of the Internal Revenue Code. Shareholders will receive notification in early 2020 of the percentage applicable to the preparation of their 2019 income tax returns. Also, in accordance with federal tax law, the fund hereby reports $5,016,556 as “exempt-interest dividends paid” during its fiscal year ended October 31, 2019. Where required by federal tax law rules, shareholders will receive notification of their portion of the fund’s tax-exempt dividends paid for the 2019 calendar year on Form 1099-DIV, which will be mailed in early 2020.
28
BOARD MEMBERS INFORMATION(Unaudited)
INDEPENDENT BOARD MEMBERS
Joseph S. DiMartino (76)
Chairman of the Board (1999)
Principal Occupation During Past 5 Years:
· Corporate Director and Trustee (1995-Present)
Other Public Company Board Memberships During Past 5 Years:
· CBIZ, Inc., a public company providing professional business services, products and solutions,Director (1997-Present)
No. of Portfolios for which Board Member Serves:120
———————
Francine J. Bovich (68)
Board Member (2012)
Principal Occupation During Past 5 Years:
· Trustee, The Bradley Trusts, private trust funds (2011-Present)
Other Public Company Board Memberships During Past 5 Years:
· Annaly Capital Management, Inc., a real estate investment trust,Director (2014-Present)
No. of Portfolios for which Board Member Serves:70
———————
Andrew J. Donohue (68)
Board Member (2019)
Principal Occupation During Past 5 Years:
· Of Counsel, Shearman & Sterling LLP (2017-2019)
· Chief of Staff to the Chair of the SEC (2015-2017)
· Managing Director and Investment Company General Counsel of Goldman Sachs (2012-2015)
Other Public Company Board Memberships During Past 5 Years:
· Oppenheimer Funds (58 funds),Director (2017-2019)
No. of Portfolios for which Board Member Serves:56
———————
29
BOARD MEMBERS INFORMATION (Unaudited) (continued)
INDEPENDENT BOARD MEMBERS (continued)
Kenneth A. Himmel (72)
Board Member (1994)
Principal Occupation During Past 5 Years:
· Managing Partner, Gulf Related, an international real estate development company (2010-Present)
· President and CEO, Related Urban Development, a real estate development company (1996-Present)
· President and CEO, Himmel & Company, a real estate development company (1980-Present)
· CEO, American Food Management, a restaurant company (1983-Present)
No. of Portfolios for which Board Member Serves:23
———————
Stephen J. Lockwood (72)
Board Member (1994)
Principal Occupation During Past 5 Years:
· Chairman of the Board, Stephen J. Lockwood and Company LLC, a real estate investment company (2000-Present)
No. of Portfolios for which Board Member Serves:23
———————
Roslyn M. Watson (70)
Board Member (1994)
Principal Occupation During Past 5 Years:
· Principal, Watson Ventures, Inc., a real estate investment company (1993-Present)
Other Public Company Board Memberships During Past 5 Years:
· American Express Bank, FSB,Director (1993-2018)
No. of Portfolios for which Board Member Serves:56
———————
30
Benaree Pratt Wiley (73)
Board Member (1998)
Principal Occupation During Past 5 Years:
· Principal, The Wiley Group, a firm specializing in strategy and business development (2005-Present)
Other Public Company Board Memberships During Past 5 Years:
· CBIZ, Inc., a public company providing professional business services, products and solutions,Director(2008-Present)
· Blue Cross-Blue Shield of Massachusetts (2004-Present)
No. of Portfolios for which Board Member Serves:76
———————
Once elected all Board Members serve for an indefinite term, but achieve Emeritus status upon reaching age 80. The address of the Board Members and Officers is c/o BNY Mellon Investment Adviser, Inc. 240 Greenwich Street, New York, New York 10286. Additional information about the Board Members is available in the fund’s Statement of Additional Information which can be obtained from the Adviser free of charge by calling this toll free number: 1-800-373-9387.
James M. Fitzgibbons, Emeritus Board Member
31
OFFICERS OF THE FUND(Unaudited)
RENEE LAROCHE-MORRIS, President since May 2019.
President and a director of BNY Mellon Investment Adviser, Inc. since January 2018. She is an officer of 63 investment companies (comprised of 120 portfolios) managed by the Adviser. She is 48 years old and has been an employee of BNY Mellon since 2003.
JAMES WINDELS, Treasurer since November 2001.
Director- BNY Mellon Fund Administration, and an officer of 64 investment companies (comprised of 143 portfolios) managed by the Adviser. He is 61 years old and has been an employee of the Adviser since April 1985.
BENNETT A. MACDOUGALL, Chief Legal Officer since October 2015.
Chief Legal Officer of the Adviser and Associate General Counsel and Managing Director of BNY Mellon since June 2015; Director and Associate General Counsel of Deutsche Bank – Asset & Wealth Management Division from June 2005 to June 2015, and as Chief Legal Officer of Deutsche Investment Management Americas Inc. from June 2012 to May 2015. He is an officer of 64 investment companies (comprised of 143 portfolios) managed by the Adviser. He is 48 years old and has been an employee of the Adviser since June 2015.
DAVID DIPETRILLO, Vice President since May 2019.
Head of North America Product, BNY Mellon Investment Management since January 2018, Director of Product Strategy, BNY Mellon Investment Management from January 2016 to December 2017; Head of US Retail Product and Channel Marketing, BNY Mellon Investment Management from January 2014 to December 2015. He is an officer of 63 investment companies (comprised of 120 portfolios) managed by the Adviser. He is 41 years old and has been an employee of BNY Mellon since 2005.
JAMES BITETTO, Vice President since August 2005 and Secretary since February 2018.
Senior Managing Counsel of BNY Mellon since November 2019; Managing Counsel of BNY Mellon from April 2014 to November 2019; Secretary of the Adviser, and an officer of 64 investment companies (comprised of 143 portfolios) managed by the Adviser. He is 53 years old and has been an employee of the Adviser since December 1996.
SONALEE CROSS, Vice President and Assistant Secretary since March 2018.
Counsel of BNY Mellon since October 2016; Associate at Proskauer Rose LLP from April 2016 to September 2016; Attorney at EnTrust Capital from August 2015 to February 2016; Associate at Sidley Austin LLP from September 2013 to August 2015. She is an officer of 64 investment companies (comprised of 143 portfolios) managed by the Adviser. She is 32 years old and has been an employee of the Adviser since October 2016.
DEIRDRE CUNNANE, Vice President and Assistant Secretary since March 2019.
Counsel of BNY Mellon since August 2018; Senior Regulatory Specialist at BNY Mellon Investment Management Services from February 2016 to August 2018; Trustee Associate at BNY Mellon Trust Company (Ireland) Limited from August 2013 to February 2016. She is an officer of 64 investment companies (comprised of 143 portfolios) managed by the Adviser. She is 29 years old and has been an employee of the Adviser since August 2018.
SARAH S. KELLEHER, Vice President and Assistant Secretary since April 2014.
Managing Counsel of BNY Mellon since December 2017, Senior Counsel of BNY Mellon from March 2013 to December 2017. She is an officer of 64 investment companies (comprised of 143 portfolios) managed by the Adviser. She is 44 years old and has been an employee of the Adviser since March 2013.
JEFF PRUSNOFSKY, Vice President and Assistant Secretary since August 2005.
Senior Managing Counsel of BNY Mellon, and an officer of 64 investment companies (comprised of 143 portfolios) managed by the Adviser. He is 54 years old and has been an employee of the Adviser since October 1990.
PETER M. SULLIVAN, Vice President and Assistant Secretary since March 2019.
Managing Counsel of BNY Mellon, and an officer of 64 investment companies (comprised of 143 portfolios) managed by the Adviser. He is 51 years old and has been an employee of the Adviser since April 2004.
32
NATALYA ZELENSKY, Vice President and Assistant Secretary since March 2017.
Managing Counsel of BNY Mellon since November 2019; Counsel of BNY Mellon from May 2016 to November 2019; Attorney at Wildermuth Endowment Strategy Fund/Wildermuth Advisory, LLC from November 2015 to May 2016 and Assistant General Counsel at RCS Advisory Services from July 2014 to November 2015. She is an officer of 64 investment companies (comprised of 143 portfolios) managed by the Adviser. She is 34 years old and has been an employee of the Adviser since May 2016.
GAVIN C. REILLY, Assistant Treasurer since December 2005.
Tax Manager - BNY Mellon Fund Administration, and an officer of 64 investment companies (comprised of 143 portfolios) managed by the Adviser. He is 51 years old and has been an employee of the Adviser since April 1991.
ROBERT S. ROBOL, Assistant Treasurer since December 2002.
Senior Accounting Manager- BNY Mellon Fund Administration, and an officer of 64 investment companies (comprised of 143 portfolios) managed by the Adviser. He is 55 years old and has been an employee of the Adviser since October 1988.
ROBERT SALVIOLO, Assistant Treasurer since July 2007.
Senior Accounting Manager – BNY Mellon Fund Administration, and an officer of 64 investment companies (comprised of 143 portfolios) managed by the Adviser. He is 52 years old and has been an employee of the Adviser since June 1989.
ROBERT SVAGNA, Assistant Treasurer since July 2007.
Senior Accounting Manager – BNY Mellon Fund Administration, and an officer of 64 investment companies (comprised of 143 portfolios) managed by the Adviser. He is 52 years old and has been an employee of the Adviser since November 1990.
JOSEPH W. CONNOLLY, Chief Compliance Officer since October 2004.
Chief Compliance Officer of the Adviser, the BNY Mellon Family of Funds and BNY Mellon Funds Trust (64 investment companies, comprised of 143 portfolios). He is 62 years old and has served in various capacities with the the Adviser since 1980, including manager of the firm’s Fund Accounting Department from 1997 through October 2001.
CARIDAD M. CAROSELLA, Anti-Money Laundering Compliance Officer since January 2016.
Anti-Money Laundering Compliance Officer of the BNY Mellon Family of Funds and BNY Mellon Funds Trust since January 2016; from May 2015 to December 2015, Interim Anti-Money Laundering Compliance Officer of the BNY Mellon Family of Funds and BNY Mellon Funds Trust and the Distributor; from January 2012 to May 2015, AML Surveillance Officer of the Distributor. She is an officer of 57 investment companies (comprised of 136 portfolios) managed by the Adviser. She is 51 years old and has been an employee of the Distributor since 1997.
33
BNY Mellon Yield Enhancement Strategy Fund
240 Greenwich Street
New York, NY 10286
Adviser
BNY Mellon Investment Adviser, Inc.
240 Greenwich Street
New York, NY 10286
Custodian
The Bank of New York Mellon
240 Greenwich Street
New York, NY 10286
Transfer Agent &
Dividend Disbursing Agent
BNY Mellon Transfer, Inc.
240 Greenwich Street
New York, NY 10286
Distributor
BNY Mellon Securities Corporation
240 Greenwich Street
New York, NY 10286
| | |
Ticker Symbols: | Class A: DABMX Class C: DABLX Class I: DABKX Class Y: DABJX |
Telephone Call your financial representative or 1-800-373-9387
Mail The BNY Mellon Family of Funds, 144 Glenn Curtiss Boulevard, Uniondale, NY 11556-0144
E-mailSend your request toinfo@bnymellon.com
InternetInformation can be viewed online or downloaded atwww.bnymellonim.com/us
The fund files its complete schedule of portfolio holdings with the Securities and Exchange Commission (“SEC”) for the first and third quarters of each fiscal year on Form N-PORT. The fund’s Forms N-PORT are available on the SEC’s website atwww.sec.gov.
A description of the policies and procedures that the fund uses to determine how to vote proxies relating to portfolio securities and information regarding how the fund voted these proxies for the most recent 12-month period ended June 30 is available atwww.bnymellonim.com/us and on the SEC’s website atwww.sec.gov and without charge, upon request, by calling 1-800-373-9387.
| | |
© 2019 BNY Mellon Securities Corporation
6327AR1019 | 
|
Item 2. Code of Ethics.
The Registrant has adopted a code of ethics that applies to the Registrant's principal executive officer, principal financial officer, principal accounting officer or controller, or persons performing similar functions. There have been no amendments to, or waivers in connection with, the Code of Ethics during the period covered by this Report.
Item 3. Audit Committee Financial Expert.
The Registrant's Board has determined that Joseph S. DiMartino, a member of the Audit Committee of the Board, is an audit committee financial expert as defined by the Securities and Exchange Commission (the "SEC"). Mr. DiMartino is "independent" as defined by the SEC for purposes of audit committee financial expert determinations.
Item 4. Principal Accountant Fees and Services.
(a) Audit Fees. The aggregate fees billed for each of the last two fiscal years (the "Reporting Periods") for professional services rendered by the Registrant's principal accountant (the "Auditor") for the audit of the Registrant's annual financial statements or services that are normally provided by the Auditor in connection with the statutory and regulatory filings or engagements for the Reporting Periods, were $90,230 in 2018 and $99,840 in 2019.
(b) Audit-Related Fees. The aggregate fees billed in the Reporting Periods for assurance and related services by the Auditor that are reasonably related to the performance of the audit of the Registrant's financial statements and are not reported under paragraph (a) of this Item 4 were $15,690 in 2018 and $15,960 in 2019. These services consisted of one or more of the following: (i) agreed upon procedures related to compliance with Internal Revenue Code section 817(h), (ii) security counts required by Rule 17f-2 under the Investment Company Act of 1940, as amended, (iii) advisory services as to the accounting or disclosure treatment of Registrant transactions or events and (iv) advisory services to the accounting or disclosure treatment of the actual or potential impact to the Registrant of final or proposed rules, standards or interpretations by the Securities and Exchange Commission, the Financial Accounting Standards Boards or other regulatory or standard-setting bodies.
The aggregate fees billed in the Reporting Periods for non-audit assurance and related services by the Auditor to the Registrant's investment adviser (not including any sub-investment adviser whose role is primarily portfolio management and is subcontracted with or overseen by another investment adviser), and any entity controlling, controlled by or under common control with the investment adviser that provides ongoing services to the Registrant ("Service Affiliates"), that were reasonably related to the performance of the annual audit of the Service Affiliate, which required pre-approval by the Audit Committee were $0 in 2018 and $0 in 2019 .
(c) Tax Fees. The aggregate fees billed in the Reporting Periods for professional services rendered by the Auditor for tax compliance, tax advice, and tax planning ("Tax Services") were $9,930 in 2018 and $10,080 in 2019. These services consisted of: (i) review or preparation of U.S. federal, state, local and excise tax returns. The aggregate fees billed in the Reporting Periods for Tax Services by the Auditor to Service Affiliates, which required pre-approval by the Audit Committee were $0 in 2018 and $0 in 2019.
(d) All Other Fees. The aggregate fees billed in the Reporting Periods for products and services provided by the Auditor, other than the services reported in paragraphs (a) through (c) of this Item, were $0 in 2018 and $0 in 2019.
The aggregate fees billed in the Reporting Periods for Non-Audit Services by the Auditor to Service Affiliates, other than the services reported in paragraphs (b) through (c) of this Item, which required pre-approval by the Audit Committee, were $0 in 2018 and $0 in 2019.
(e)(1) Audit Committee Pre-Approval Policies and Procedures. The Registrant's Audit Committee has established policies and procedures (the "Policy") for pre-approval (within specified fee limits) of the Auditor's engagements for non-audit services to the Registrant and Service Affiliates without specific case-by-case consideration. The pre-approved services in the Policy can include pre-approved audit services, pre-approved audit-related services, pre-approved tax services and pre-approved all other services. Pre-approval considerations include whether the proposed services are compatible with maintaining the Auditor's independence. Pre-approvals pursuant to the Policy are considered annually.
(e)(2) Note. None of the services described in paragraphs (b) through (d) of this Item 4 were approved by the Audit Committee pursuant to paragraph (c)(7)(i)(C) of Rule 2-01 of Regulation S-X.
(f) None of the hours expended on the principal accountant's engagement to audit the registrant's financial statements for the most recent fiscal year were attributed to work performed by persons other than the principal accountant's full-time, permanent employees.
Non-Audit Fees. The aggregate non-audit fees billed by the Auditor for services rendered to the Registrant, and rendered to Service Affiliates, for the Reporting Periods were $331,000 in 2018 and $463,000 in 2019.
Auditor Independence. The Registrant's Audit Committee has considered whether the provision of non-audit services that were rendered to Service Affiliates, which were not pre-approved (not requiring pre-approval), is compatible with maintaining the Auditor's independence.
Item 5. Audit Committee of Listed Registrants.
Not applicable.
Item 6. Investments.
(a) Not applicable.
Item 7. Disclosure of Proxy Voting Policies and Procedures for Closed-End Management Investment Companies.
Not applicable.
Item 8. Portfolio Managers of Closed-End Management Investment Companies.
Not applicable.
Item 9. Purchases of Equity Securities by Closed-End Management Investment Companies and Affiliated Purchasers.
Not applicable.
Item 10. Submission of Matters to a Vote of Security Holders.
There have been no material changes to the procedures applicable to Item 10.
Item 11. Controls and Procedures.
(a) The Registrant's principal executive and principal financial officers have concluded, based on their evaluation of the Registrant's disclosure controls and procedures as of a date within 90 days of the filing date of this report, that the Registrant's disclosure controls and procedures are reasonably designed to ensure that information required to be disclosed by the Registrant on Form N-CSR is recorded, processed, summarized and reported within the required time periods and that information required to be disclosed by the Registrant in the reports that it files or submits on Form N-CSR is accumulated and communicated to the Registrant's management, including its principal executive and principal financial officers, as appropriate to allow timely decisions regarding required disclosure.
(b) There were no changes to the Registrant's internal control over financial reporting that occurred during the second fiscal quarter of the period covered by this report that have materially affected, or are reasonably likely to materially affect, the Registrant's internal control over financial reporting.
Item 12. Disclosure of Securities Lending Activities for Closed-End Management Investment Companies.
Not applicable.
Item 13. Exhibits.
(a)(1) Code of ethics referred to in Item 2.
(a)(2) Certifications of principal executive and principal financial officers as required by Rule 30a-2(a) under the Investment Company Act of 1940.
(a)(3) Not applicable.
(b) Certification of principal executive and principal financial officers as required by Rule 30a-2(b) under the Investment Company Act of 1940.
SIGNATURES
Pursuant to the requirements of the Securities Exchange Act of 1934 and the Investment Company Act of 1940, the Registrant has duly caused this Report to be signed on its behalf by the undersigned, thereunto duly authorized.
BNY Mellon Investment Funds II, Inc.
By: /s/ Renee LaRoche-Morris
Renee LaRoche-Morris
President (Principal Executive Officer)
Date: January 27, 2020
Pursuant to the requirements of the Securities Exchange Act of 1934 and the Investment Company Act of 1940, this Report has been signed below by the following persons on behalf of the Registrant and in the capacities and on the dates indicated.
By: /s/ Renee LaRoche-Morris
Renee LaRoche-Morris
President (Principal Executive Officer)
Date: January 27, 2020
By: /s/ James Windels
James Windels
Treasurer (Principal Financial Officer)
Date: January 24, 2020
EXHIBIT INDEX
(a)(1) Code of ethics referred to in Item 2.
(a)(2) Certifications of principal executive and principal financial officers as required by Rule 30a-2(a) under the Investment Company Act of 1940. (EX-99.CERT)
(b) Certification of principal executive and principal financial officers as required by Rule 30a-2(b) under the Investment Company Act of 1940. (EX-99.906CERT)


