
Business Plan Presentation February 2023 Exhibit 99.1

01 – EXECUTIVE SUMMARY
Introduction Pursuant to Section 1.01(b) of the Senior Secured Superpriority Debtor-In-Possession Term Loan Credit Agreement (“DIP”), Party City Holdings Inc. (“PCHI” or the “Company”) has prepared an updated Business Plan (“Updated Plan”) Updates from the last Business Plan (“Prior Plan”) presented to the lenders on January 4, 2023 include: Incorporation of FY 2022 actuals (Prior Plan included actuals through October 2022) Incorporation of the by-store forecast model, including: Overall sales comps substantially in-line with Prior Plan Revised store closure assumptions and estimated closed stores recoveries Revised assumptions for NXTGEN remodels (-20 from 2023-2025; 166 to 146) and relos (+20 from 2023-2025; 34 to 54) Change from Adjusted Cash Rent to GAAP Rent (EBITDA impact by year = 2023: +$6mm; 2024: -$12mm; 2025: -$11mm) Reduction of Halloween City store count assumptions and revisions to gross margin/cost assumptions Updates to wholesale forecast associated with revised retail forecast and revisions based on 2022 actual results Adjustments to capex forecast based on revised NXTGEN rollout assumptions Incorporation of balance sheet and cash flow assumptions The Updated Plan has been prepared based on information currently available to the Company The lease restructuring process is ongoing, and the actual go-forward store portfolio and lease restructuring savings may differ materially from what is presented herein The Business Plan does not reflect any potential exit financing and certain cash payments that may be required to emerge from Chapter 11 are not incorporated
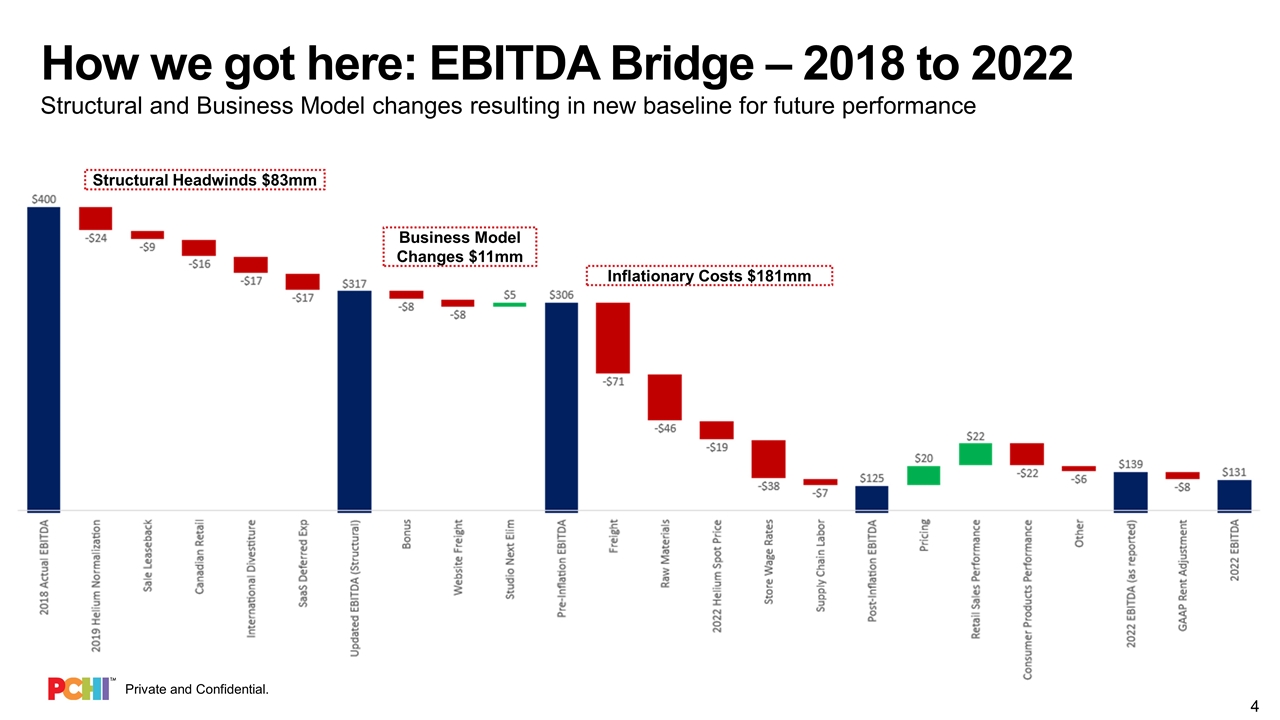
How we got here: EBITDA Bridge – 2018 to 2022 Structural and Business Model changes resulting in new baseline for future performance Structural Headwinds $83mm Business Model Changes $11mm Inflationary Costs $181mm
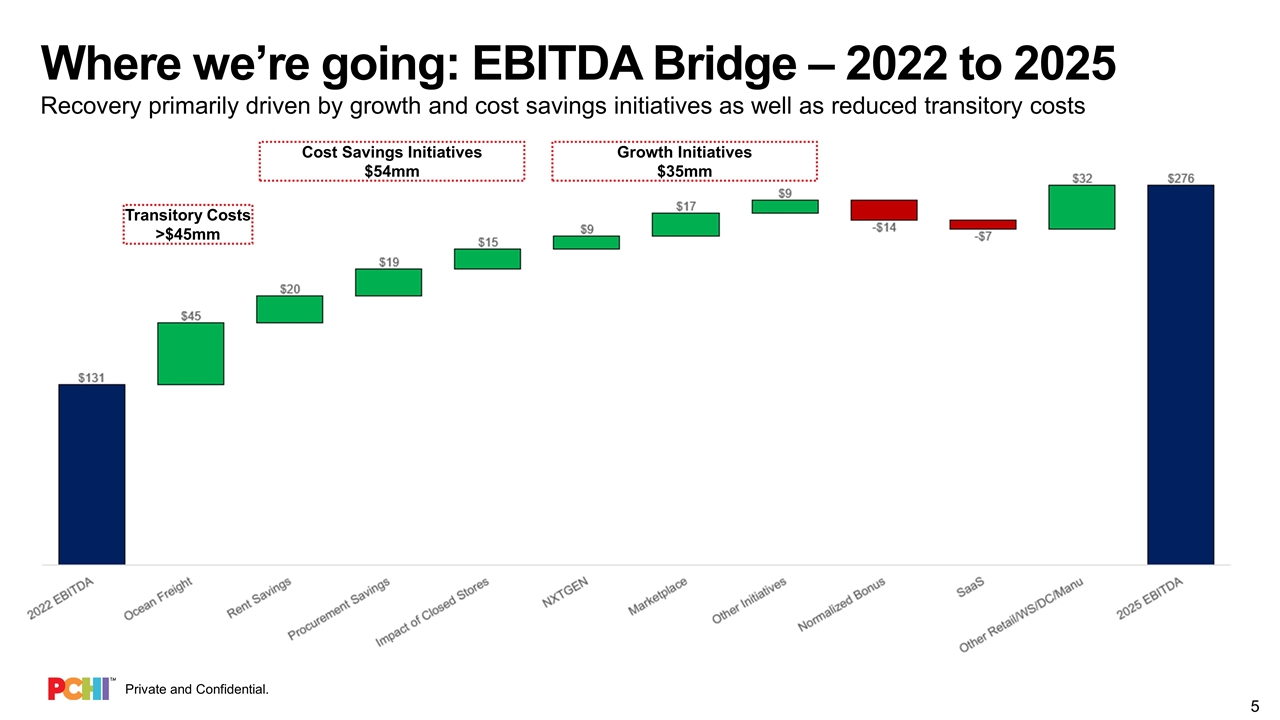
Where we’re going: EBITDA Bridge – 2022 to 2025 Growth Initiatives $35mm Recovery primarily driven by growth and cost savings initiatives as well as reduced transitory costs Cost Savings Initiatives $54mm Transitory Costs >$45mm
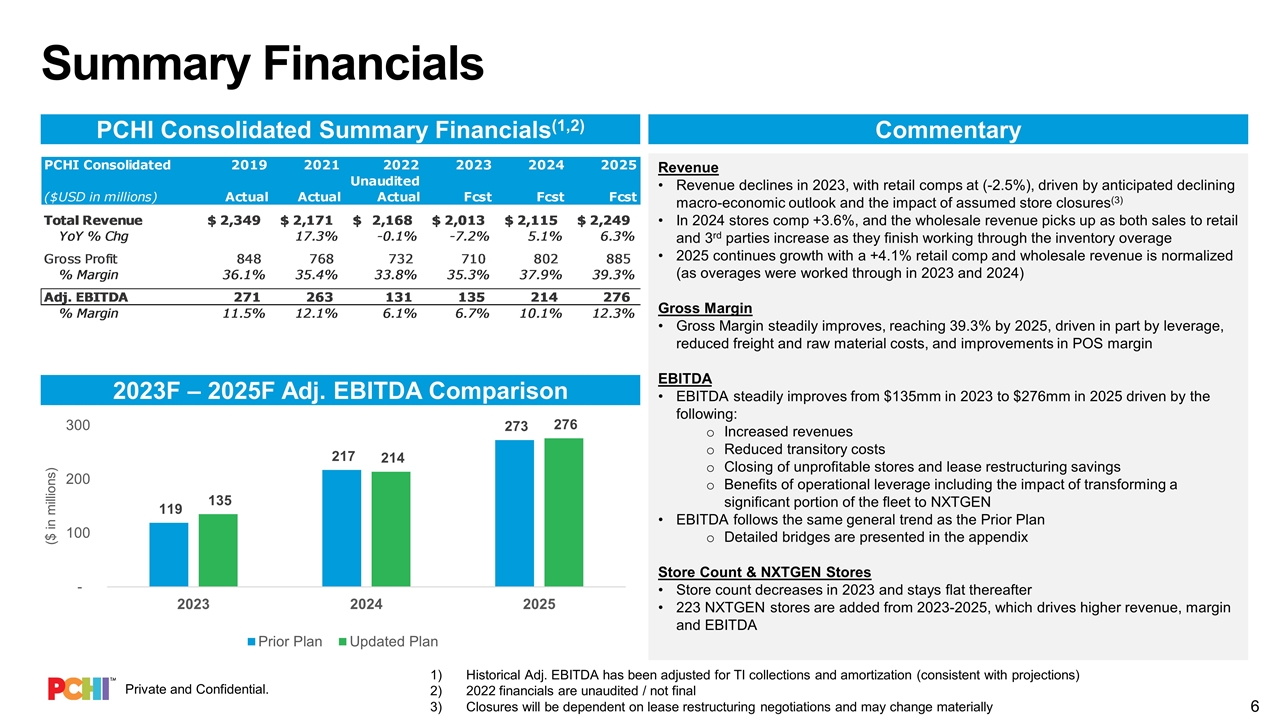
Summary Financials PCHI Consolidated Summary Financials(1,2) Commentary Revenue Revenue declines in 2023, with retail comps at (-2.5%), driven by anticipated declining macro-economic outlook and the impact of assumed store closures(3) In 2024 stores comp +3.6%, and the wholesale revenue picks up as both sales to retail and 3rd parties increase as they finish working through the inventory overage 2025 continues growth with a +4.1% retail comp and wholesale revenue is normalized (as overages were worked through in 2023 and 2024) Gross Margin Gross Margin steadily improves, reaching 39.3% by 2025, driven in part by leverage, reduced freight and raw material costs, and improvements in POS margin EBITDA EBITDA steadily improves from $135mm in 2023 to $276mm in 2025 driven by the following: Increased revenues Reduced transitory costs Closing of unprofitable stores and lease restructuring savings Benefits of operational leverage including the impact of transforming a significant portion of the fleet to NXTGEN EBITDA follows the same general trend as the Prior Plan Detailed bridges are presented in the appendix Store Count & NXTGEN Stores Store count decreases in 2023 and stays flat thereafter 223 NXTGEN stores are added from 2023-2025, which drives higher revenue, margin and EBITDA 2023F – 2025F Adj. EBITDA Comparison Historical Adj. EBITDA has been adjusted for TI collections and amortization (consistent with projections) 2022 financials are unaudited / not final Closures will be dependent on lease restructuring negotiations and may change materially

02 – CONSOLIDATED FINANCIALS
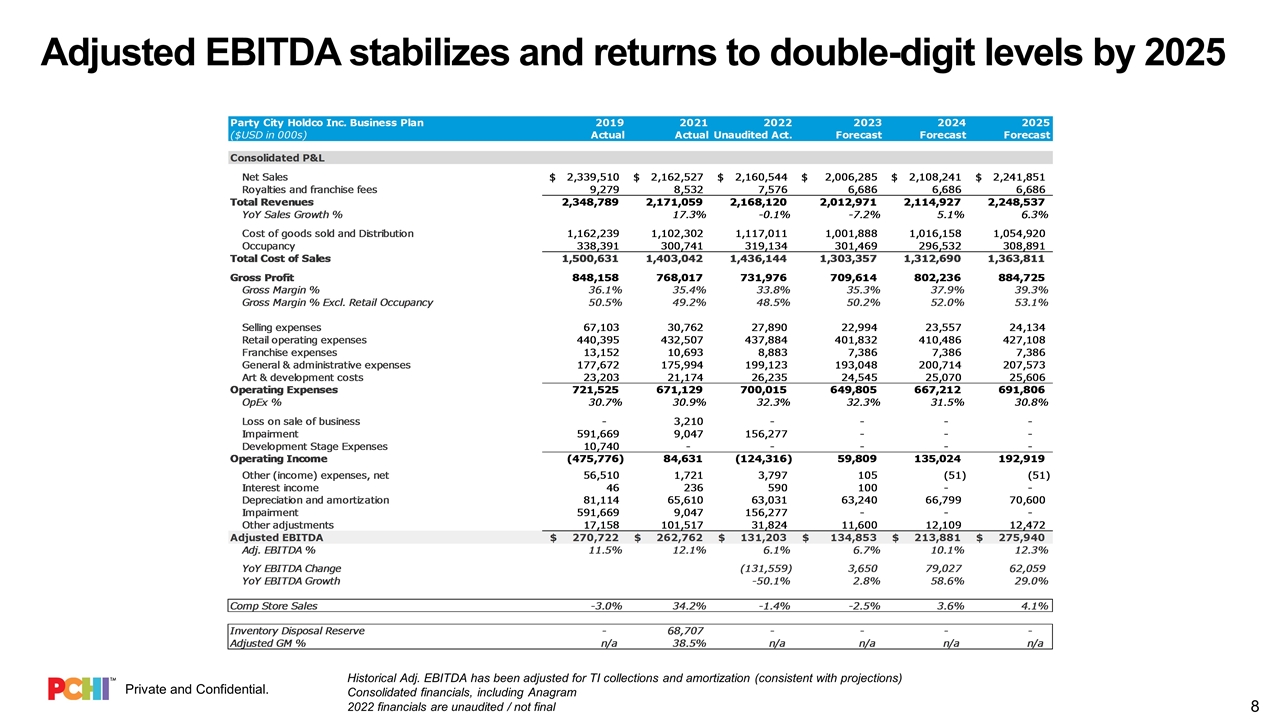
Adjusted EBITDA stabilizes and returns to double-digit levels by 2025 Historical Adj. EBITDA has been adjusted for TI collections and amortization (consistent with projections) Consolidated financials, including Anagram 2022 financials are unaudited / not final
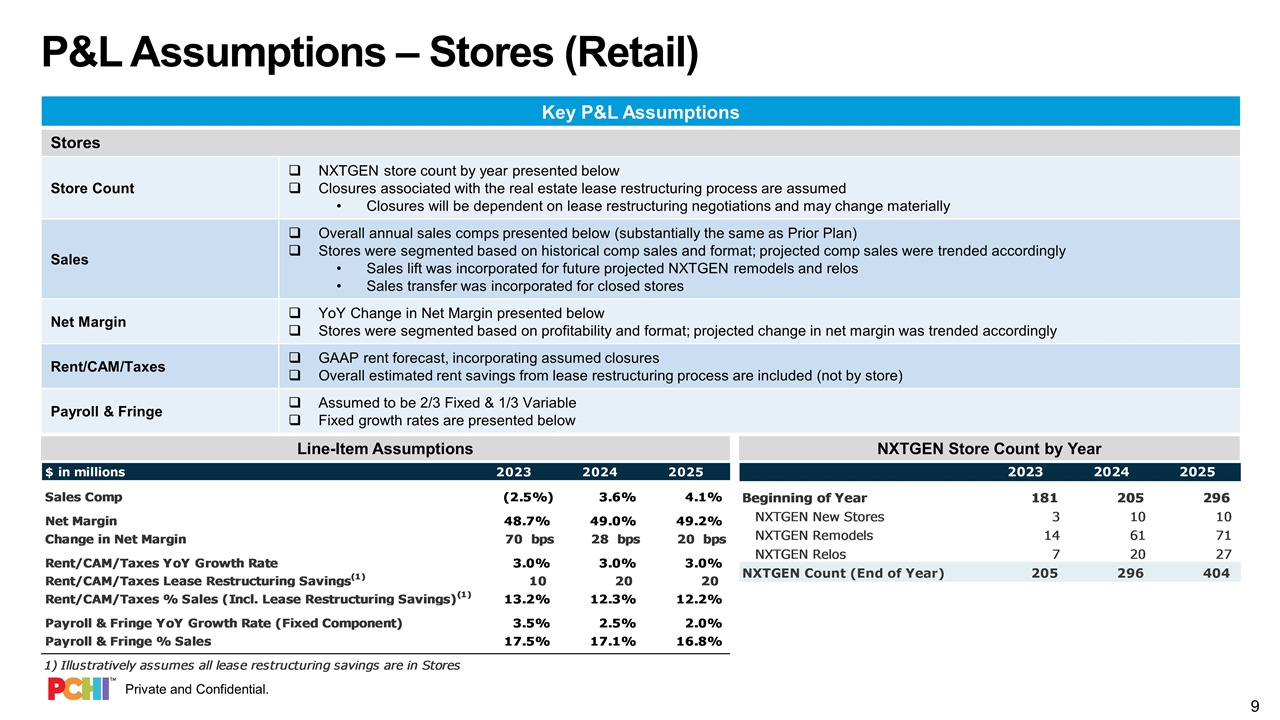
P&L Assumptions – Stores (Retail) Key P&L Assumptions Stores Store Count NXTGEN store count by year presented below Closures associated with the real estate lease restructuring process are assumed Closures will be dependent on lease restructuring negotiations and may change materially Sales Overall annual sales comps presented below (substantially the same as Prior Plan) Stores were segmented based on historical comp sales and format; projected comp sales were trended accordingly Sales lift was incorporated for future projected NXTGEN remodels and relos Sales transfer was incorporated for closed stores Net Margin YoY Change in Net Margin presented below Stores were segmented based on profitability and format; projected change in net margin was trended accordingly Rent/CAM/Taxes GAAP rent forecast, incorporating assumed closures Overall estimated rent savings from lease restructuring process are included (not by store) Payroll & Fringe Assumed to be 2/3 Fixed & 1/3 Variable Fixed growth rates are presented below NXTGEN Store Count by Year Line-Item Assumptions
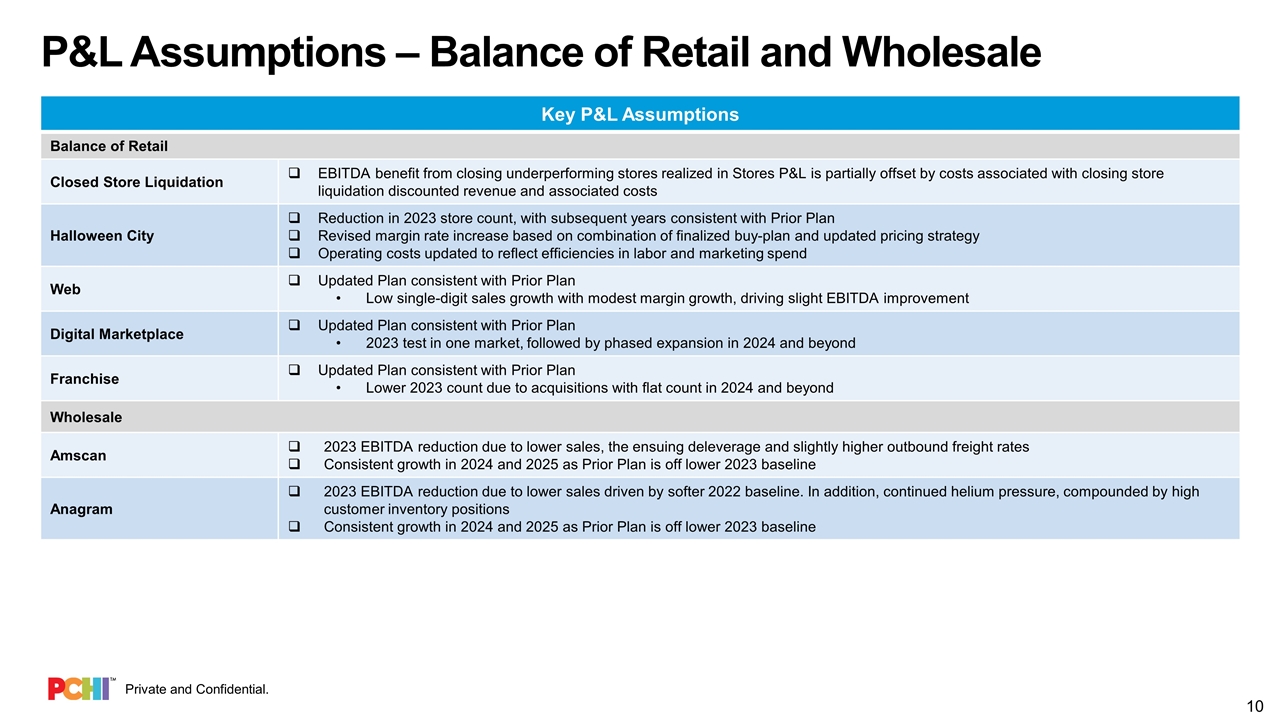
P&L Assumptions – Balance of Retail and Wholesale Key P&L Assumptions Balance of Retail Closed Store Liquidation EBITDA benefit from closing underperforming stores realized in Stores P&L is partially offset by costs associated with closing store liquidation discounted revenue and associated costs Halloween City Reduction in 2023 store count, with subsequent years consistent with Prior Plan Revised margin rate increase based on combination of finalized buy-plan and updated pricing strategy Operating costs updated to reflect efficiencies in labor and marketing spend Web Updated Plan consistent with Prior Plan Low single-digit sales growth with modest margin growth, driving slight EBITDA improvement Digital Marketplace Updated Plan consistent with Prior Plan 2023 test in one market, followed by phased expansion in 2024 and beyond Franchise Updated Plan consistent with Prior Plan Lower 2023 count due to acquisitions with flat count in 2024 and beyond Wholesale Amscan 2023 EBITDA reduction due to lower sales, the ensuing deleverage and slightly higher outbound freight rates Consistent growth in 2024 and 2025 as Prior Plan is off lower 2023 baseline Anagram 2023 EBITDA reduction due to lower sales driven by softer 2022 baseline. In addition, continued helium pressure, compounded by high customer inventory positions Consistent growth in 2024 and 2025 as Prior Plan is off lower 2023 baseline
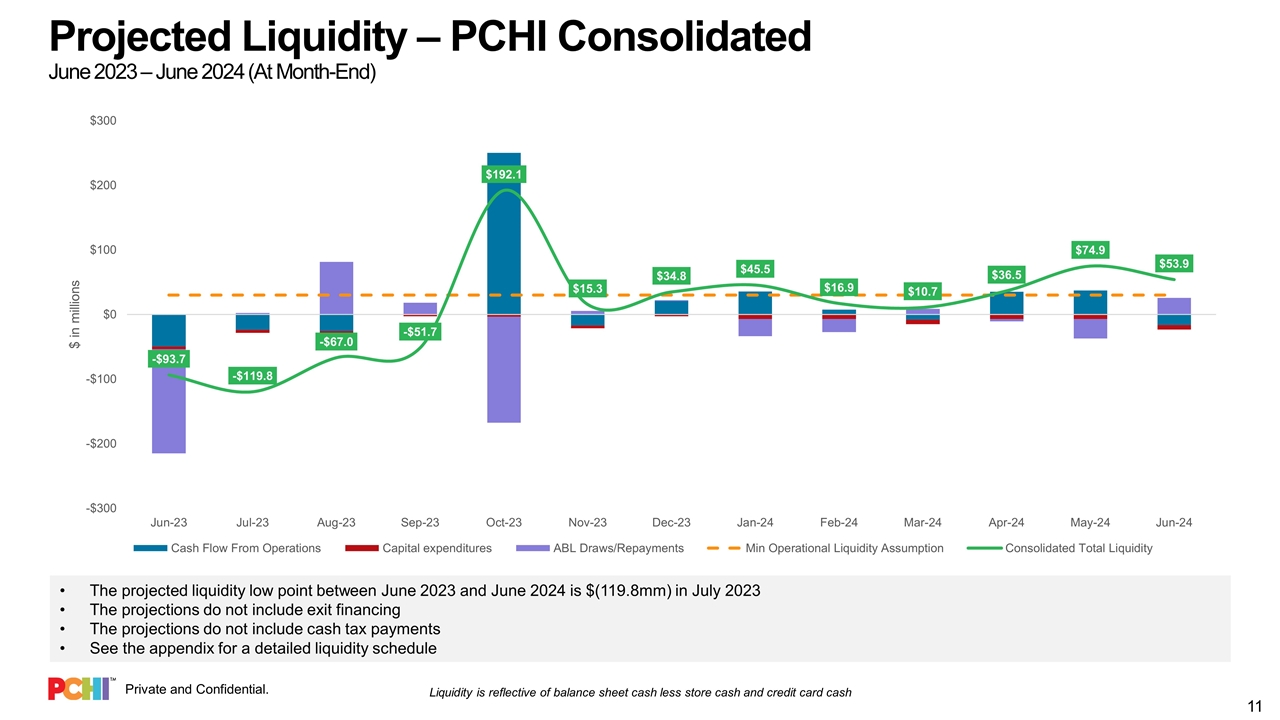
Projected Liquidity – PCHI Consolidated June 2023 – June 2024 (At Month-End) The projected liquidity low point between June 2023 and June 2024 is $(119.8mm) in July 2023 The projections do not include exit financing The projections do not include cash tax payments See the appendix for a detailed liquidity schedule Liquidity is reflective of balance sheet cash less store cash and credit card cash
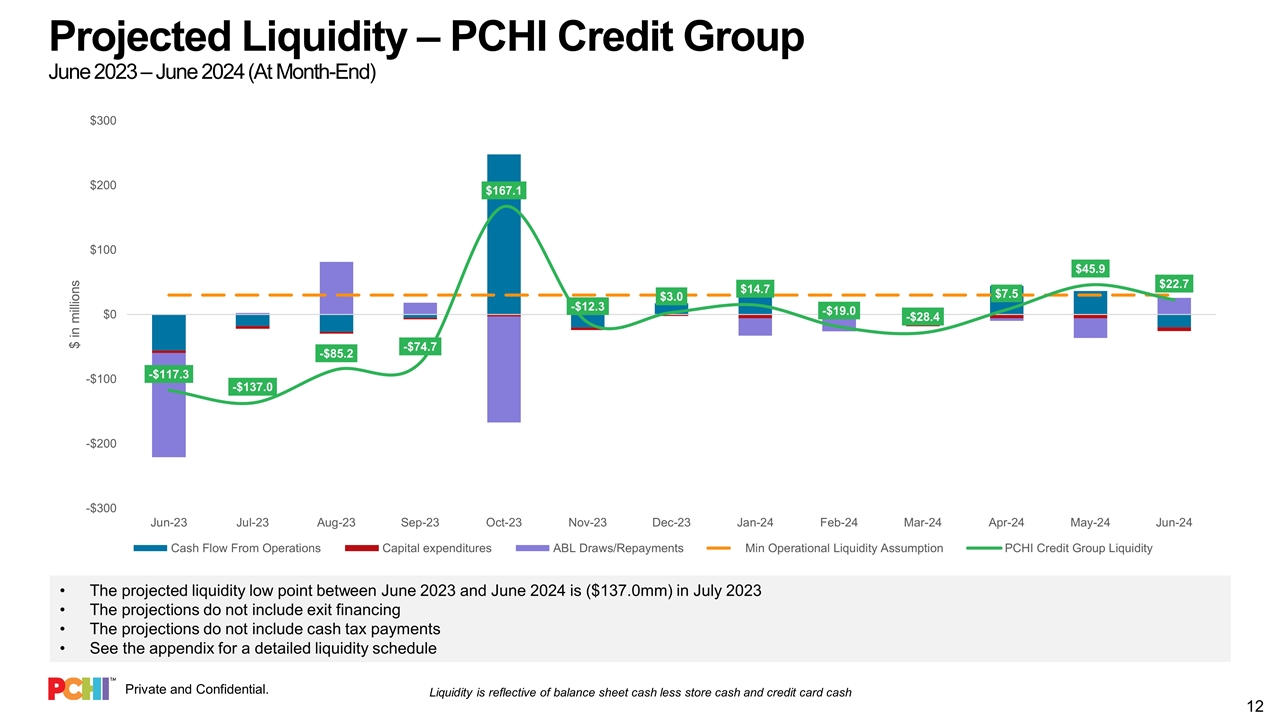
Projected Liquidity – PCHI Credit Group June 2023 – June 2024 (At Month-End) The projected liquidity low point between June 2023 and June 2024 is ($137.0mm) in July 2023 The projections do not include exit financing The projections do not include cash tax payments See the appendix for a detailed liquidity schedule Liquidity is reflective of balance sheet cash less store cash and credit card cash
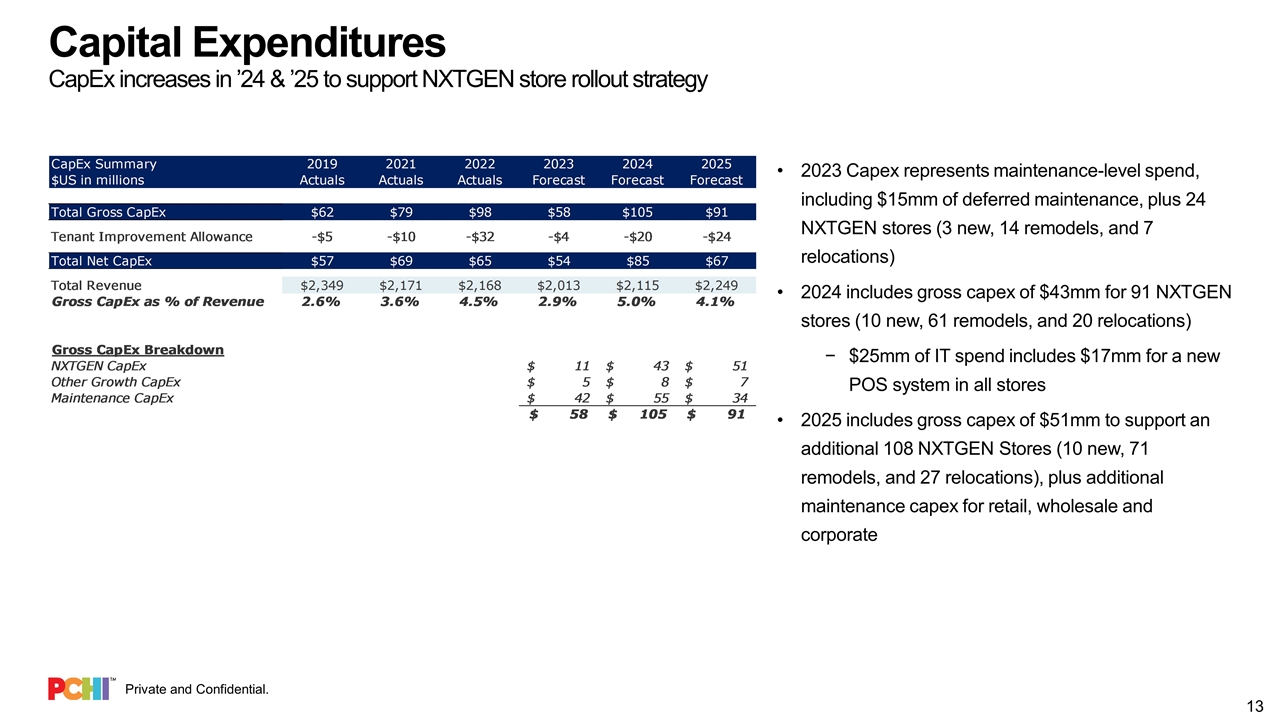
Capital Expenditures CapEx increases in ’24 & ’25 to support NXTGEN store rollout strategy 2023 Capex represents maintenance-level spend, including $15mm of deferred maintenance, plus 24 NXTGEN stores (3 new, 14 remodels, and 7 relocations) 2024 includes gross capex of $43mm for 91 NXTGEN stores (10 new, 61 remodels, and 20 relocations) $25mm of IT spend includes $17mm for a new POS system in all stores 2025 includes gross capex of $51mm to support an additional 108 NXTGEN Stores (10 new, 71 remodels, and 27 relocations), plus additional maintenance capex for retail, wholesale and corporate
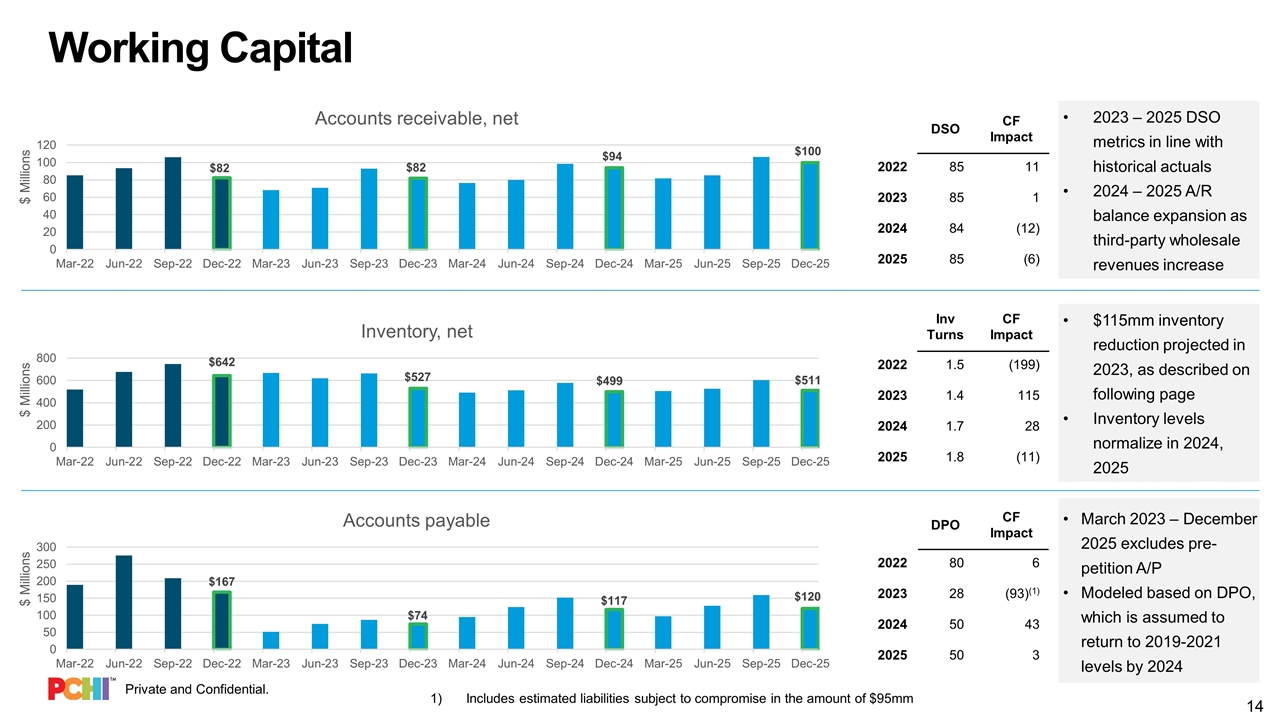
Working Capital DSO CF Impact 2022 85 11 2023 85 1 2024 84 (12) 2025 85 (6) Inv Turns CF Impact 2022 1.5 (199) 2023 1.4 115 2024 1.7 28 2025 1.8 (11) DPO CF Impact 2022 80 6 2023 28 (93)(1) 2024 50 43 2025 50 3 $115mm inventory reduction projected in 2023, as described on following page Inventory levels normalize in 2024, 2025 March 2023 – December 2025 excludes pre-petition A/P Modeled based on DPO, which is assumed to return to 2019-2021 levels by 2024 2023 – 2025 DSO metrics in line with historical actuals 2024 – 2025 A/R balance expansion as third-party wholesale revenues increase Includes estimated liabilities subject to compromise in the amount of $95mm
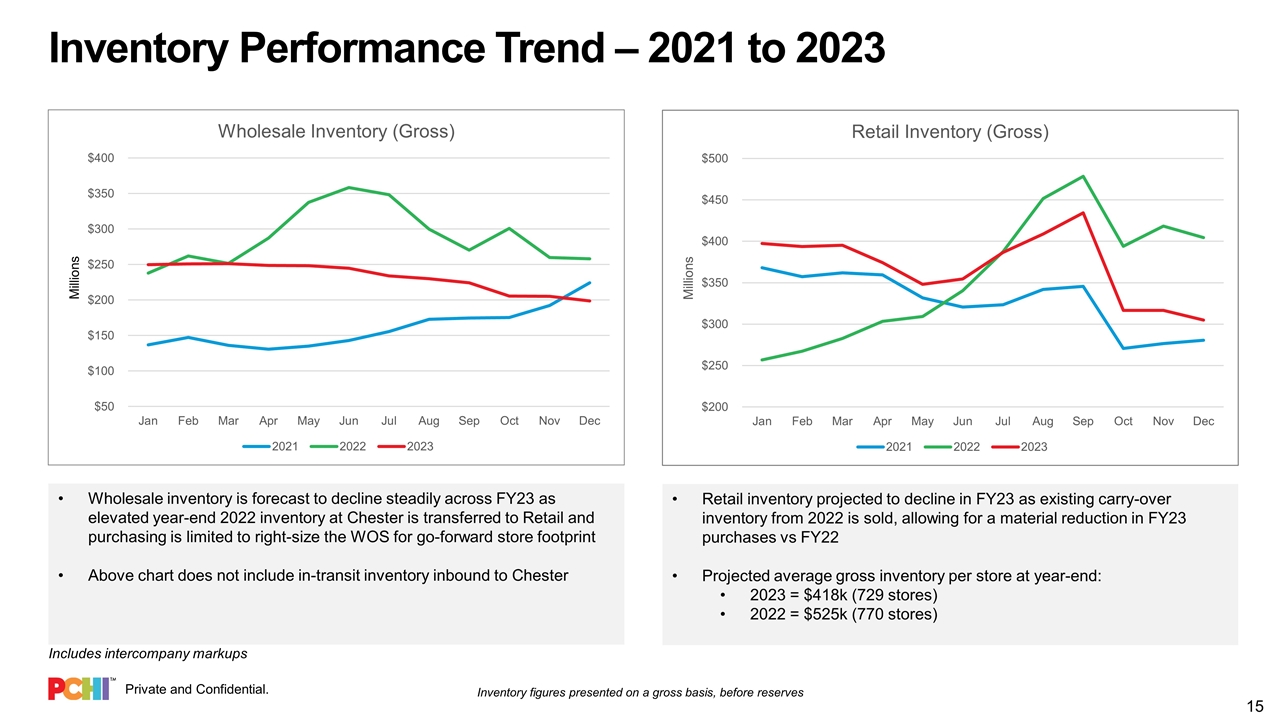
Inventory Performance Trend – 2021 to 2023 Retail inventory projected to decline in FY23 as existing carry-over inventory from 2022 is sold, allowing for a material reduction in FY23 purchases vs FY22 Projected average gross inventory per store at year-end: 2023 = $418k (729 stores) 2022 = $525k (770 stores) Inventory figures presented on a gross basis, before reserves Wholesale inventory is forecast to decline steadily across FY23 as elevated year-end 2022 inventory at Chester is transferred to Retail and purchasing is limited to right-size the WOS for go-forward store footprint Above chart does not include in-transit inventory inbound to Chester Includes intercompany markups
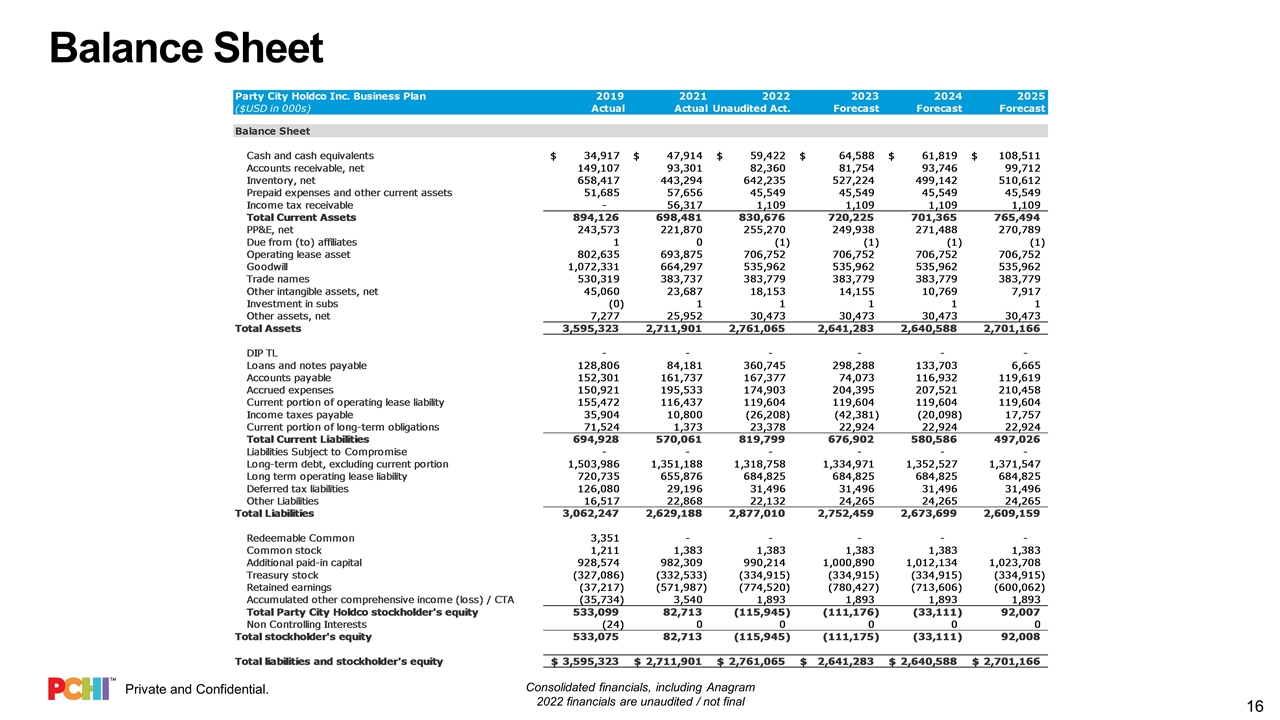
Balance Sheet Consolidated financials, including Anagram 2022 financials are unaudited / not final
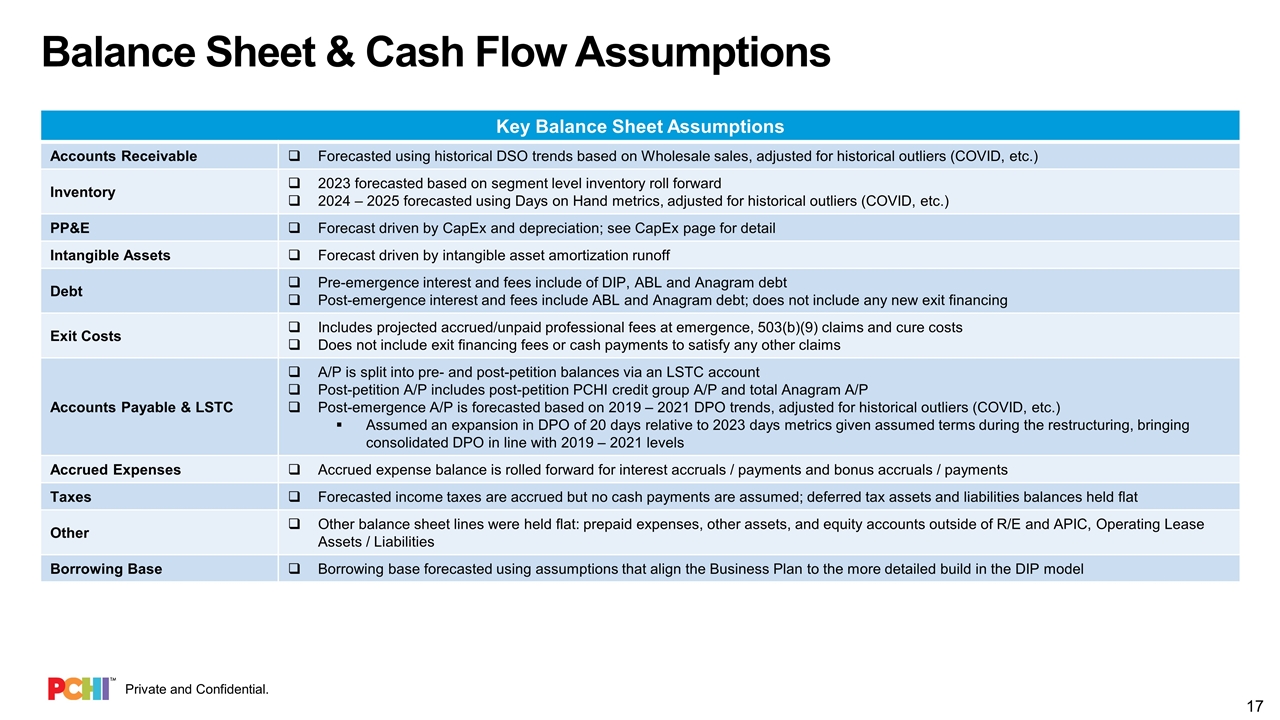
Balance Sheet & Cash Flow Assumptions Key Balance Sheet Assumptions Accounts Receivable Forecasted using historical DSO trends based on Wholesale sales, adjusted for historical outliers (COVID, etc.) Inventory 2023 forecasted based on segment level inventory roll forward 2024 – 2025 forecasted using Days on Hand metrics, adjusted for historical outliers (COVID, etc.) PP&E Forecast driven by CapEx and depreciation; see CapEx page for detail Intangible Assets Forecast driven by intangible asset amortization runoff Debt Pre-emergence interest and fees include of DIP, ABL and Anagram debt Post-emergence interest and fees include ABL and Anagram debt; does not include any new exit financing Exit Costs Includes projected accrued/unpaid professional fees at emergence, 503(b)(9) claims and cure costs Does not include exit financing fees or cash payments to satisfy any other claims Accounts Payable & LSTC A/P is split into pre- and post-petition balances via an LSTC account Post-petition A/P includes post-petition PCHI credit group A/P and total Anagram A/P Post-emergence A/P is forecasted based on 2019 – 2021 DPO trends, adjusted for historical outliers (COVID, etc.) Assumed an expansion in DPO of 20 days relative to 2023 days metrics given assumed terms during the restructuring, bringing consolidated DPO in line with 2019 – 2021 levels Accrued Expenses Accrued expense balance is rolled forward for interest accruals / payments and bonus accruals / payments Taxes Forecasted income taxes are accrued but no cash payments are assumed; deferred tax assets and liabilities balances held flat Other Other balance sheet lines were held flat: prepaid expenses, other assets, and equity accounts outside of R/E and APIC, Operating Lease Assets / Liabilities Borrowing Base Borrowing base forecasted using assumptions that align the Business Plan to the more detailed build in the DIP model

03 – CONSOLIDATING FINANCIALS
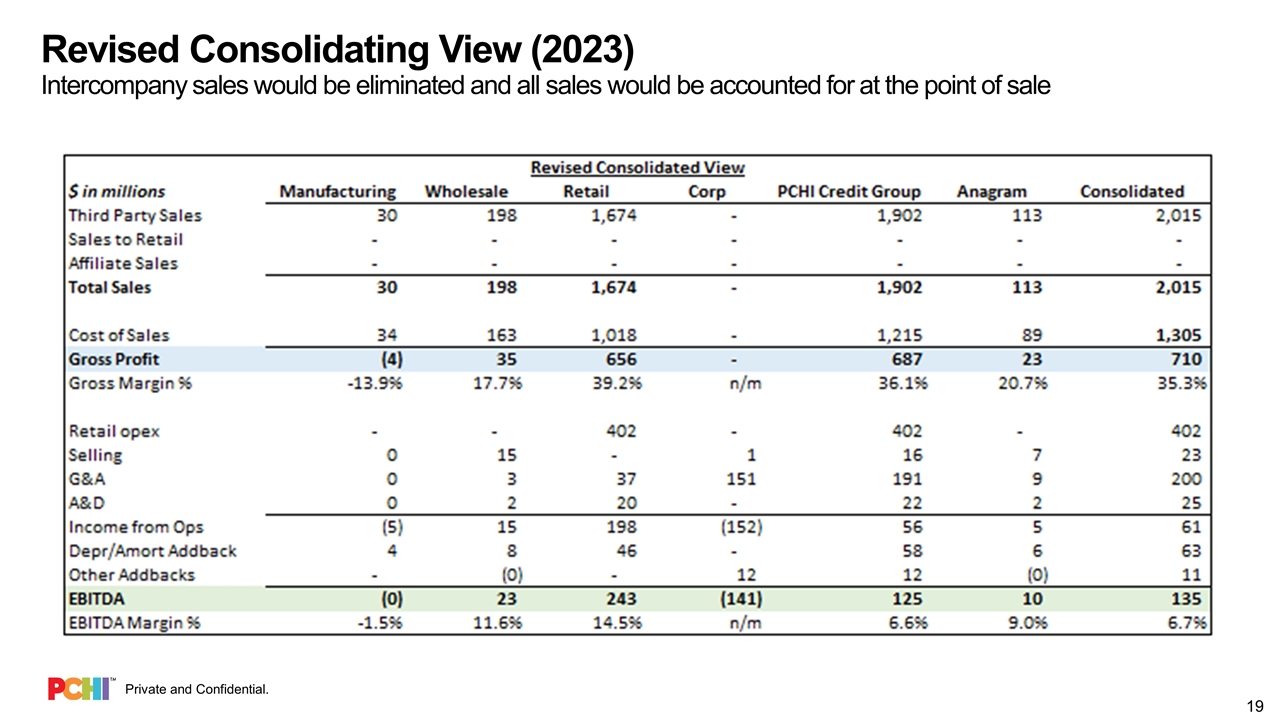
Revised Consolidating View (2023) Intercompany sales would be eliminated and all sales would be accounted for at the point of sale
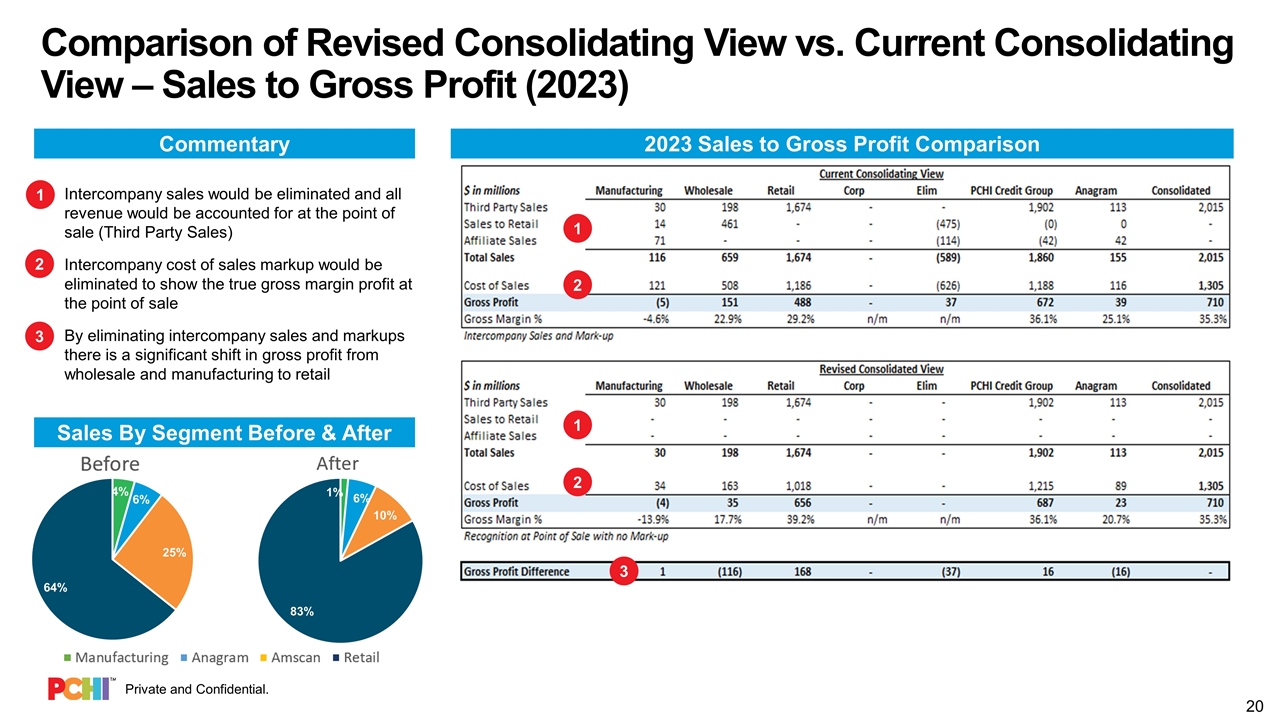
Comparison of Revised Consolidating View vs. Current Consolidating View – Sales to Gross Profit (2023) Intercompany sales would be eliminated and all revenue would be accounted for at the point of sale (Third Party Sales) Intercompany cost of sales markup would be eliminated to show the true gross margin profit at the point of sale By eliminating intercompany sales and markups there is a significant shift in gross profit from wholesale and manufacturing to retail 1 2 2023 Sales to Gross Profit Comparison Sales By Segment Before & After Commentary 3 1 2 1 2 3
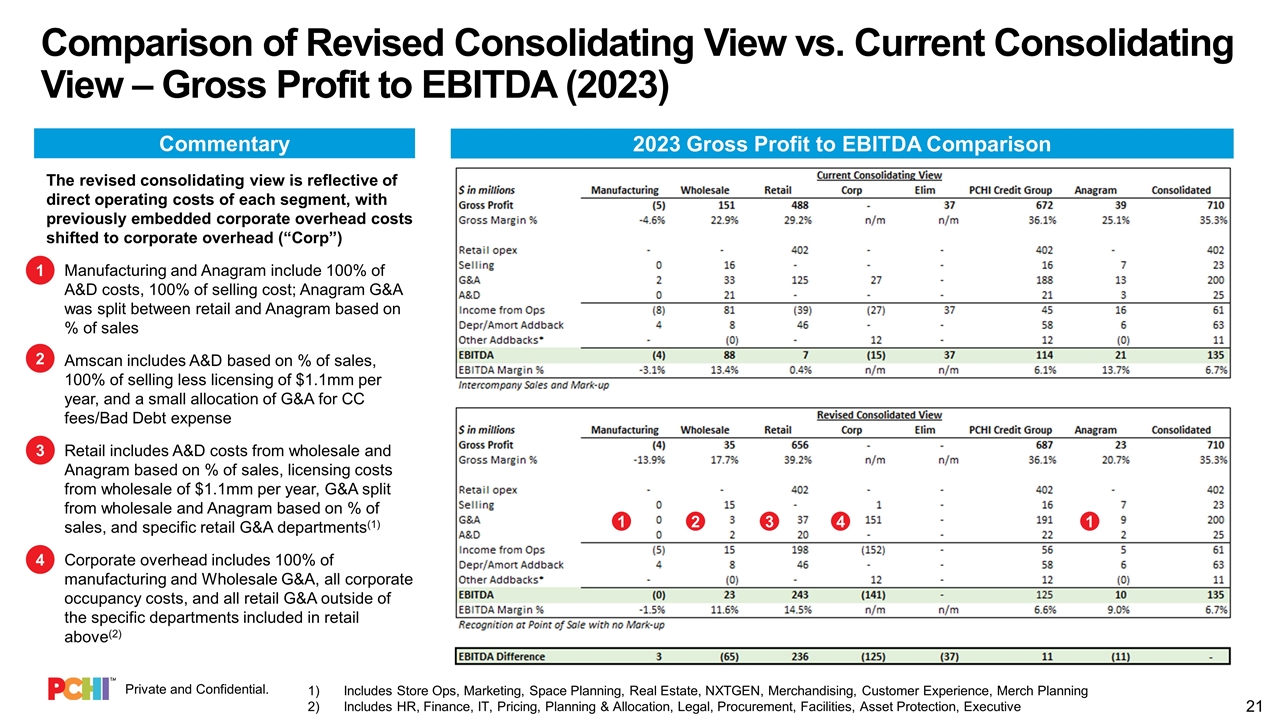
Comparison of Revised Consolidating View vs. Current Consolidating View – Gross Profit to EBITDA (2023) 2023 Gross Profit to EBITDA Comparison Commentary The revised consolidating view is reflective of direct operating costs of each segment, with previously embedded corporate overhead costs shifted to corporate overhead (“Corp”) Manufacturing and Anagram include 100% of A&D costs, 100% of selling cost; Anagram G&A was split between retail and Anagram based on % of sales Amscan includes A&D based on % of sales, 100% of selling less licensing of $1.1mm per year, and a small allocation of G&A for CC fees/Bad Debt expense Retail includes A&D costs from wholesale and Anagram based on % of sales, licensing costs from wholesale of $1.1mm per year, G&A split from wholesale and Anagram based on % of sales, and specific retail G&A departments(1) Corporate overhead includes 100% of manufacturing and Wholesale G&A, all corporate occupancy costs, and all retail G&A outside of the specific departments included in retail above(2) 1 2 3 4 1 1 2 3 4 Includes Store Ops, Marketing, Space Planning, Real Estate, NXTGEN, Merchandising, Customer Experience, Merch Planning Includes HR, Finance, IT, Pricing, Planning & Allocation, Legal, Procurement, Facilities, Asset Protection, Executive
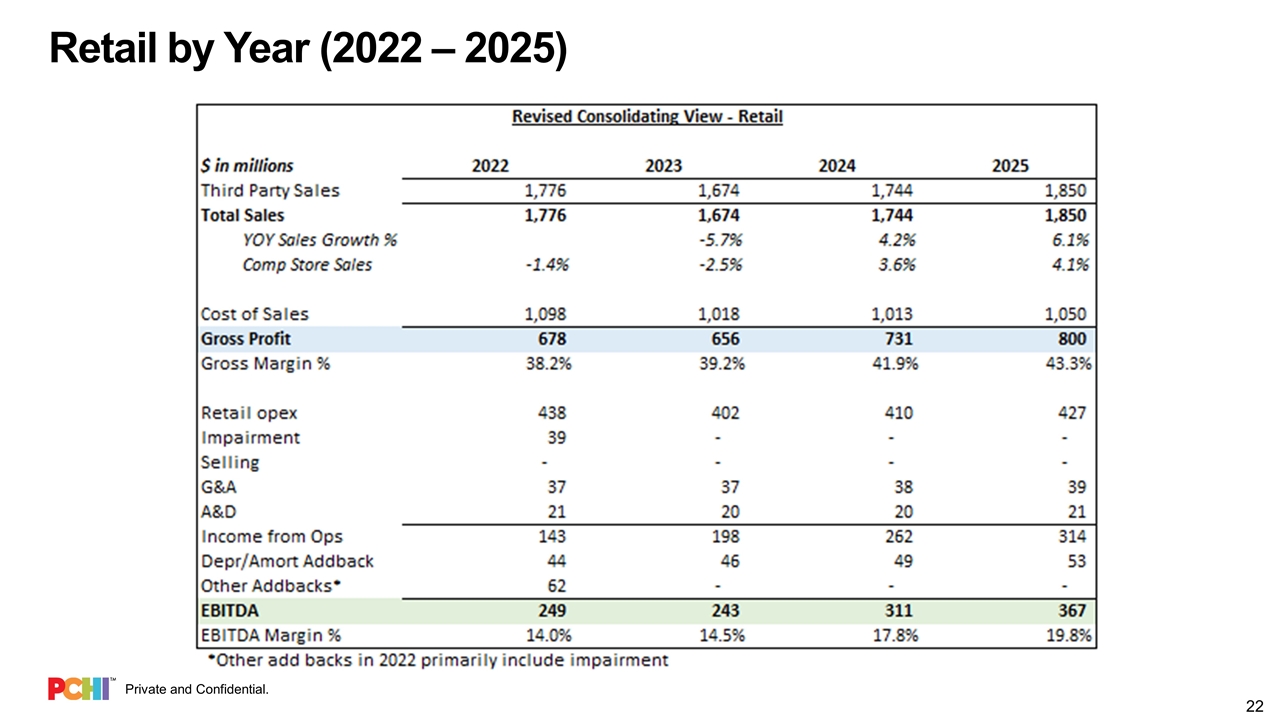
Retail by Year (2022 – 2025)
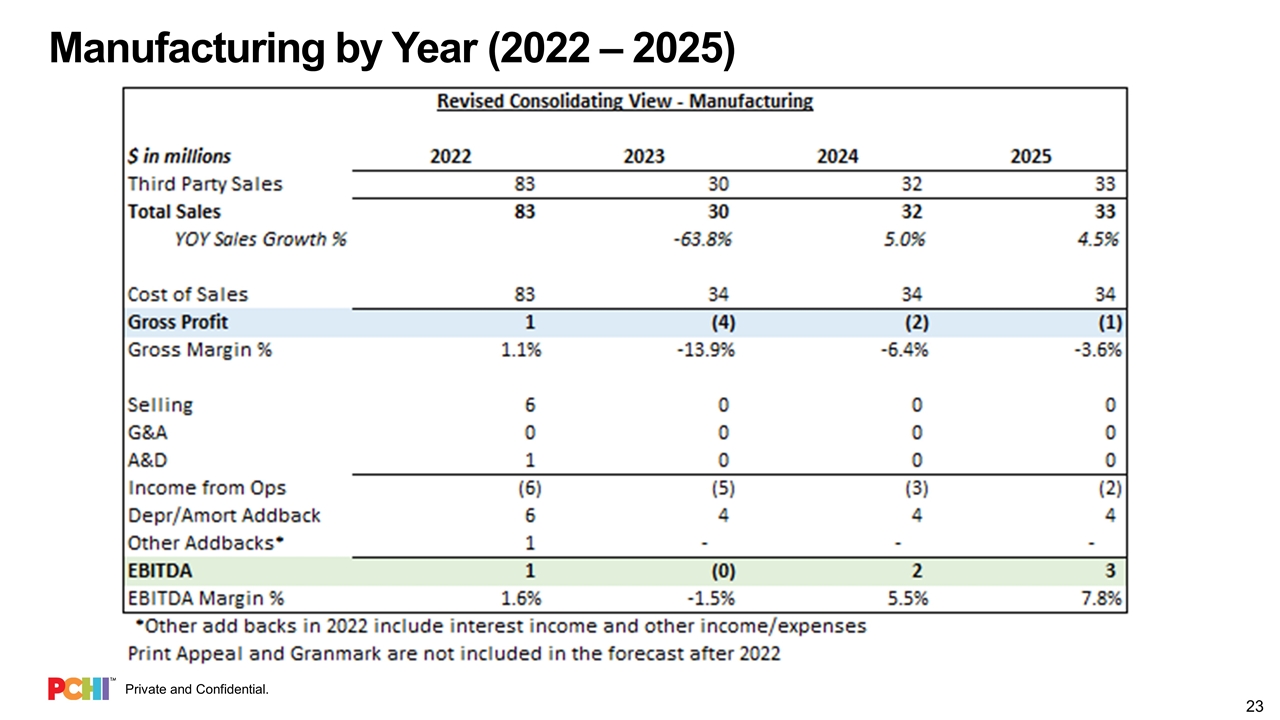
Manufacturing by Year (2022 – 2025)
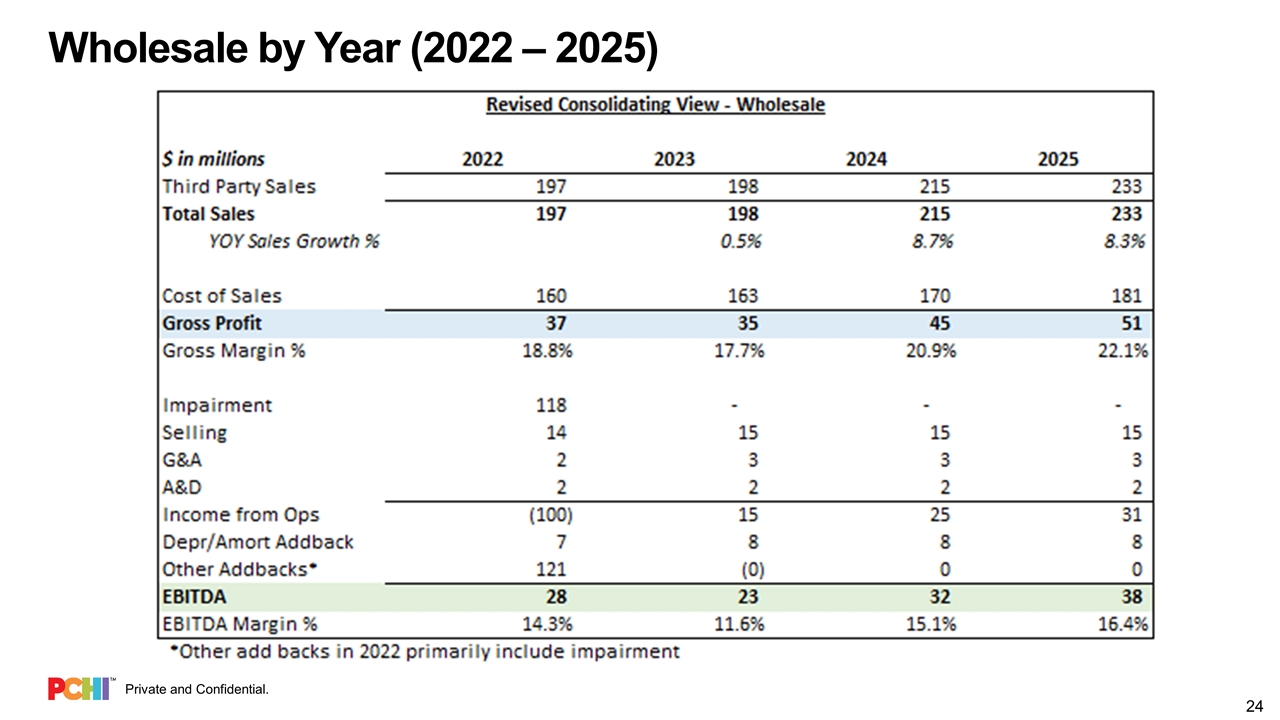
Wholesale by Year (2022 – 2025)
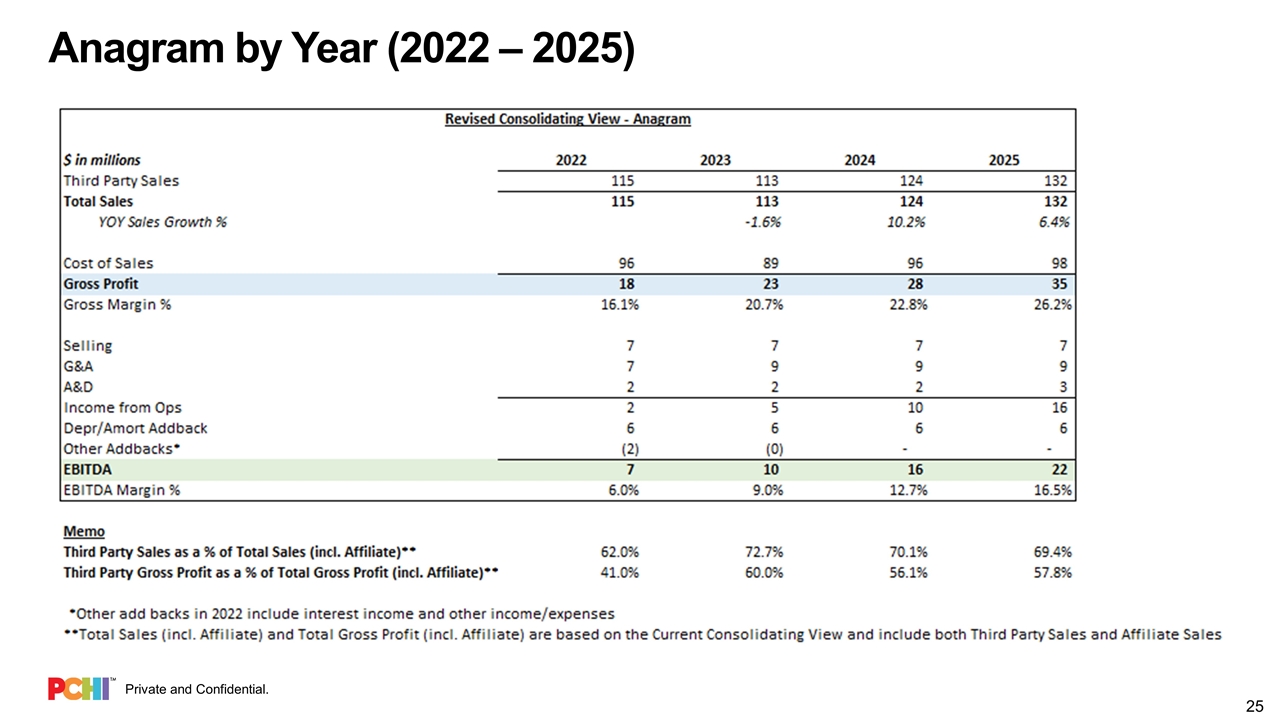
Anagram by Year (2022 – 2025)

04 – INITIATIVES
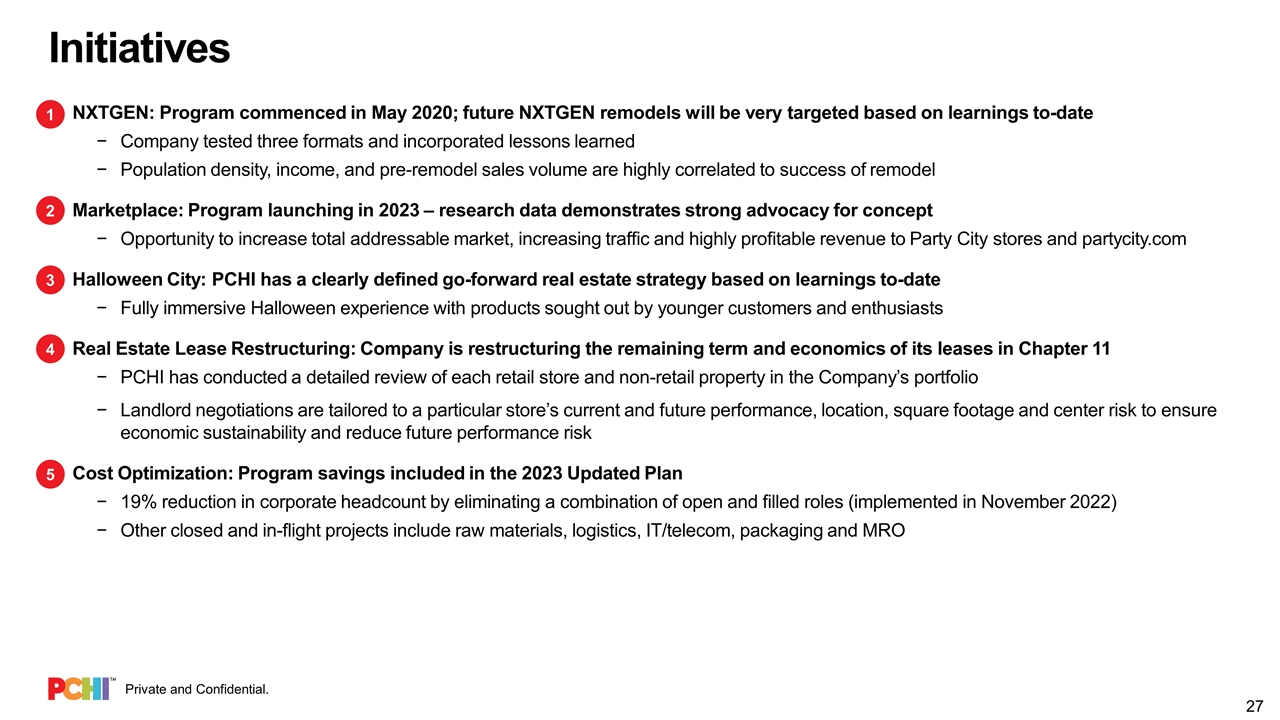
Initiatives NXTGEN: Program commenced in May 2020; future NXTGEN remodels will be very targeted based on learnings to-date Company tested three formats and incorporated lessons learned Population density, income, and pre-remodel sales volume are highly correlated to success of remodel Marketplace: Program launching in 2023 – research data demonstrates strong advocacy for concept Opportunity to increase total addressable market, increasing traffic and highly profitable revenue to Party City stores and partycity.com Halloween City: PCHI has a clearly defined go-forward real estate strategy based on learnings to-date Fully immersive Halloween experience with products sought out by younger customers and enthusiasts Real Estate Lease Restructuring: Company is restructuring the remaining term and economics of its leases in Chapter 11 PCHI has conducted a detailed review of each retail store and non-retail property in the Company’s portfolio Landlord negotiations are tailored to a particular store’s current and future performance, location, square footage and center risk to ensure economic sustainability and reduce future performance risk Cost Optimization: Program savings included in the 2023 Updated Plan 19% reduction in corporate headcount by eliminating a combination of open and filled roles (implemented in November 2022) Other closed and in-flight projects include raw materials, logistics, IT/telecom, packaging and MRO 1 2 3 4 5

05 – APPENDIX

EBITDA Bridge – 2023 Prior Plan to 2023 Updated Plan Key drivers: GAAP Rent Adj: Adjustment from Adjusted Cash Rent to GAAP Rent Amscan / Anagram: Reduction in third party sales at Anagram ($3mm); Reduction in third party and affiliate sales at Amscan ($4mm) Freight Out: Revised outbound freight from Chester; realizing higher rates than assumed in Prior Plan Stores: Incremental store closures (+$8mm); Adjustments to Comp Base (+$7mm) Close Store Liquidation: Estimated recoveries from closed stores liquidation sales Rent Savings: Incorporation of $10mm in estimated lease restructuring savings for 2023(1) Dependent on lease restructuring negotiations and may change materially
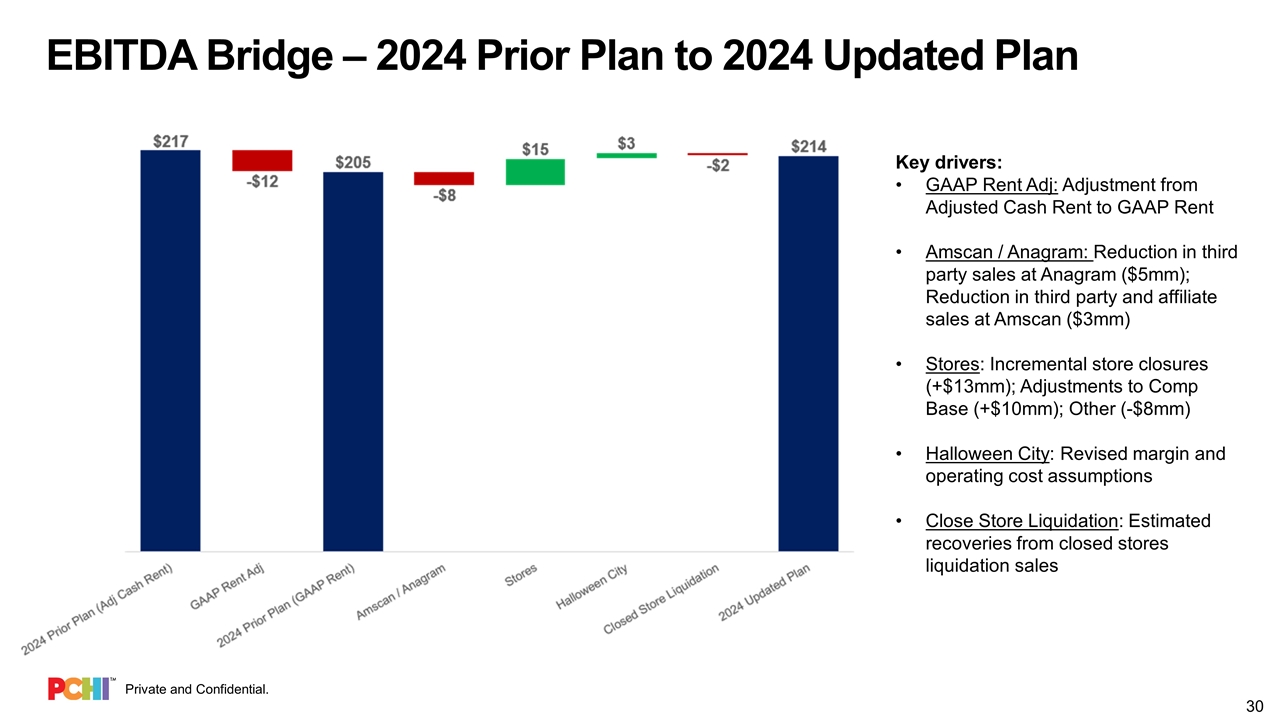
EBITDA Bridge – 2024 Prior Plan to 2024 Updated Plan Key drivers: GAAP Rent Adj: Adjustment from Adjusted Cash Rent to GAAP Rent Amscan / Anagram: Reduction in third party sales at Anagram ($5mm); Reduction in third party and affiliate sales at Amscan ($3mm) Stores: Incremental store closures (+$13mm); Adjustments to Comp Base (+$10mm); Other (-$8mm) Halloween City: Revised margin and operating cost assumptions Close Store Liquidation: Estimated recoveries from closed stores liquidation sales
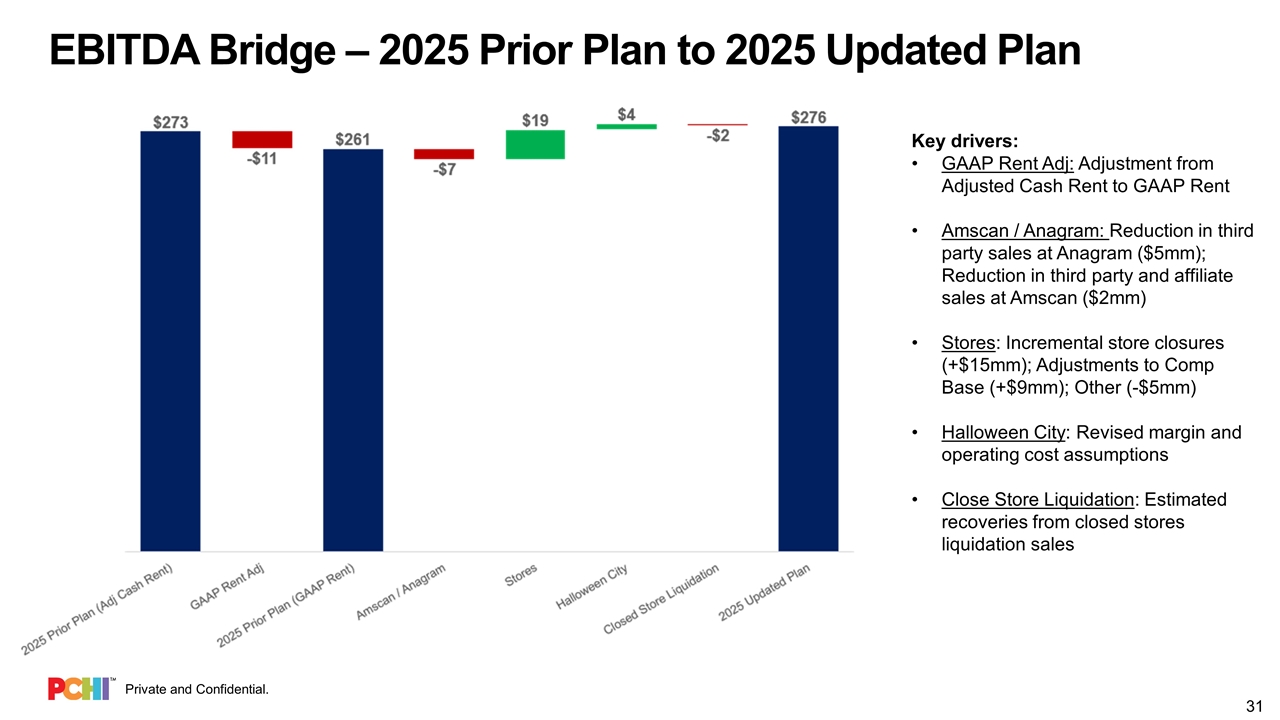
EBITDA Bridge – 2025 Prior Plan to 2025 Updated Plan Key drivers: GAAP Rent Adj: Adjustment from Adjusted Cash Rent to GAAP Rent Amscan / Anagram: Reduction in third party sales at Anagram ($5mm); Reduction in third party and affiliate sales at Amscan ($2mm) Stores: Incremental store closures (+$15mm); Adjustments to Comp Base (+$9mm); Other (-$5mm) Halloween City: Revised margin and operating cost assumptions Close Store Liquidation: Estimated recoveries from closed stores liquidation sales
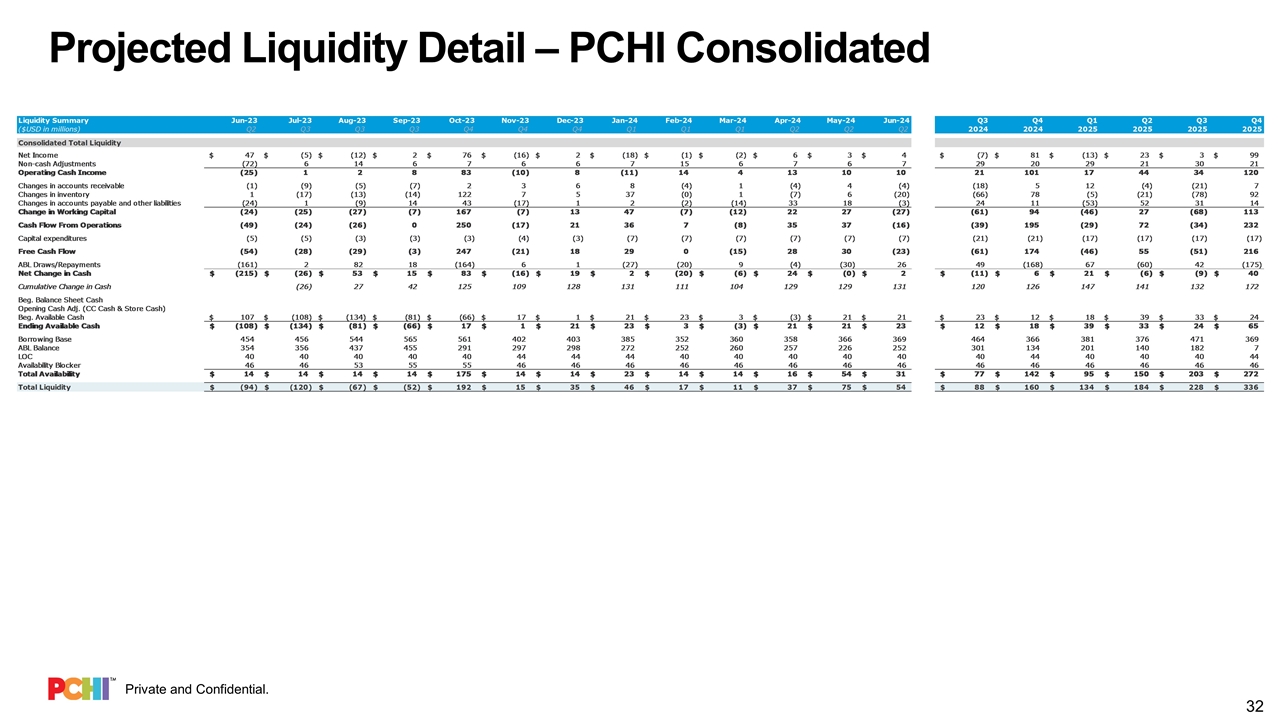
Projected Liquidity Detail – PCHI Consolidated
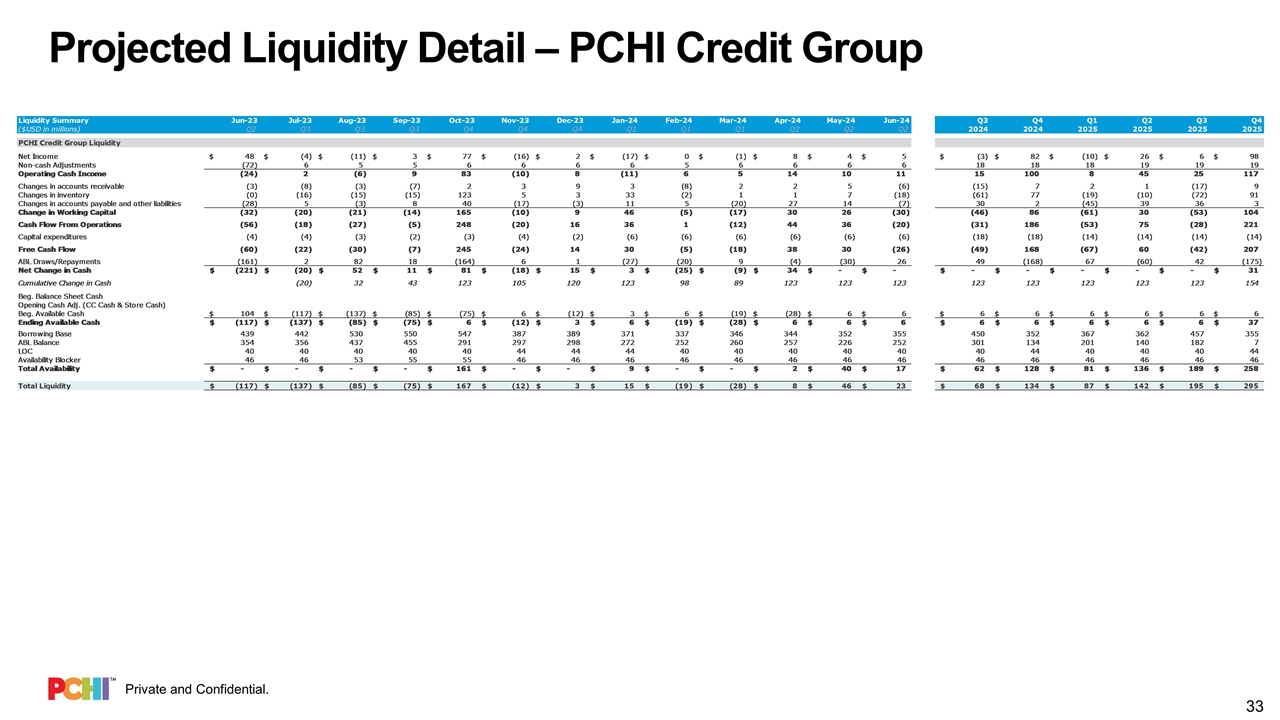
Projected Liquidity Detail – PCHI Credit Group


