UNITED STATES
SECURITIES AND EXCHANGE COMMISSION
Washington, D.C. 20549
FORM N-CSR
CERTIFIED SHAREHOLDER REPORT OF REGISTERED
MANAGEMENT INVESTMENT COMPANIES
Investment Company Act file number 811-22961
EA Series Trust
(Exact name of registrant as specified in charter)
19 E. Eagle Road
Havertown, PA 19083
(Address of principal executive offices) (Zip code)
19 E. Eagle Road
Havertown, PA 19083
(Name and address of agent for service)
215-882-9983
Registrant’s telephone number, including area code
Date of fiscal year end: June 30, 2024
Date of reporting period: June 30, 2024
Item 1. Report to Stockholders.
(a)
| | | | | | | | |
| EA Bridgeway Blue Chip ETF Ticker: BBLU Listed on: NYSE Arca, Inc.
| June 30, 2024 Annual Shareholder Report www.bridgewayetfs.com/bblu/ |
|
| | | | | | | | | | | |
| This annual shareholder report contains important information about the EA Bridgeway Blue Chip ETF (the “Fund”) for the period of July 1, 2023 to June 30, 2024 (the “Period”). You can find additional information about the Fund at www.bridgewayetfs.com/bblu/. You can also request this information by contacting us at (215) 882-9983. |
| | | | | | | | | | | |
WHAT WERE THE FUND COSTS FOR THE PERIOD?
(based on a hypothetical $10,000 investment) |
| COST OF $10,000 INVESTMENT | | COST PAID AS A PERCENTAGE OF $10,000 INVESTMENT |
| $17 | | 0.15% |
| | | | | | | | | | | |
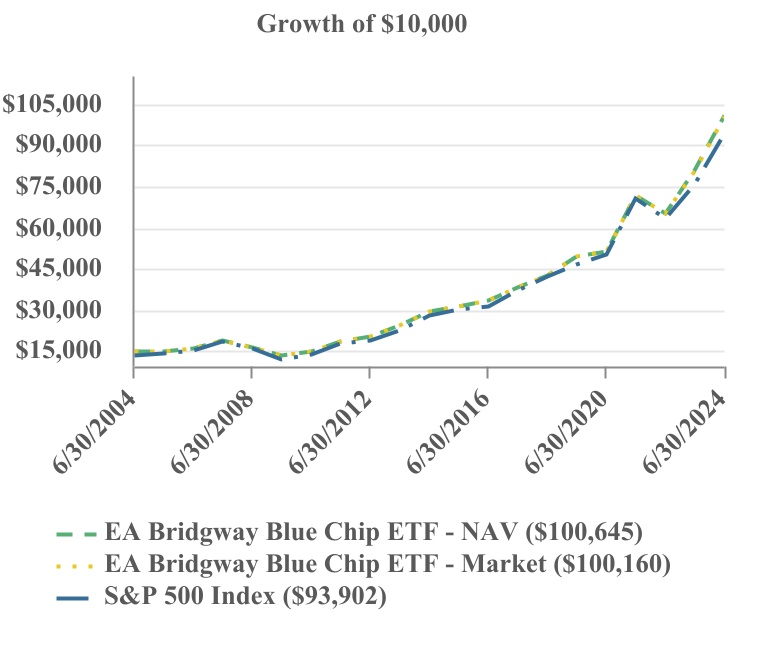
PERFORMANCE OF HYPOTHETICAL
$10,000 INVESTMENT |
| | | | | | | | | | | |
| WHAT FACTORS INFLUENCED PERFORMANCE FOR THE PERIOD? |
The Fund returned 24.75% (NAV) for the Period vs 24.56% for the S&P 500 Index. During the period, markets responded positively to strong corporate earnings, resilient economic conditions, and Federal Reserve policy.
The Fund’s focus on mega-cap stocks contributed positively to returns, as the largest stocks in the benchmark generally outperformed its smaller constituents. The Fund’s roughly equal weight portfolio design also helped by creating overweightings in some of the smaller stocks in the mega-cap category that performed well during the year.
| | | | | | | | | | | | | | | | | | | | |
| AVERAGE ANNUAL TOTAL RETURNS |
| | 1 Year | | 5 Year | | 10 Year |
| EA Bridgeway Blue Chip ETF - NAV | | 24.75% | | 15.29% | | 13.08% |
| EA Bridgeway Blue Chip ETF - Market | | 24.64% | | 15.18% | | 13.02% |
| S&P 500 Index | | 24.56% | | 15.05% | | 12.86% |
| | | | | | |
The Fund’s past performance is not a good predictor of how the Fund will perform in the future. The graph and table do not reflect the deduction of taxes that a shareholder would pay on fund distributions or redemption of fund shares. The Fund converted from a mutual fund to an ETF on October 14, 2022. The Fund has adopted the mutual fund’s prior performance for the periods before the conversion. Visit www.bridgewayetfs.com/bblu/ for more recent performance information. |
Annual Shareholder Report: June 30, 2024
The Fund is distributed by Quasar Distributors, LLC.
| | | | | | | | |
| EA Bridgeway Blue Chip ETF Ticker: BBLU Listed on: NYSE Arca, Inc.
| June 30, 2024 Annual Shareholder Report www.bridgewayetfs.com/bblu/ |
|
| | | | | | | | | | | | | | | | | | | | |
| KEY FUND STATISTICS (as of Period End) |
| Net Assets | | $181,370,007 | | Portfolio Turnover Rate* | | 6% |
| Number of Portfolio Holdings | | 38 | | Advisory Fees Paid | | $204,867 |
| *Excludes in-kind transactions. |
| | | | | |
SECTOR WEIGHTING
(as a % of Net Assets) |
| Information Technology | 25.3 | % |
| Financials | 17.1 | % |
| Communication Services | 14.2 | % |
| Health Care | 13.8 | % |
| Consumer Discretionary | 9.8 | % |
| Consumer Staples | 9.8 | % |
| Energy | 4.9 | % |
| Industrials | 4.8 | % |
| Cash & Cash Equivalents | 0.3 | % |
| | | | | | | | |
TOP 10 HOLDINGS (as a % of Net Assets) |
| Eli Lilly & Co. | 4.0% |
| Nvidia Corp. | 4.0% |
| Meta Platforms, Inc. - Class A | 3.9% |
| Microsoft Corp. | 3.9% |
| JPMorgan Chase & Co. | 3.9% |
| Broadcom, Inc. | 3.7% |
| Apple, Inc. | 3.5% |
| Visa, Inc. - Class A | 3.4% |
| Qualcomm, Inc. | 2.8% |
| Bank of America Corp. | 2.5% |
Availability of Additional Information
For additional information about the Fund, including its prospectus, financial information, and holdings, visit www.bridgewayetfs.com/bblu/. Information about the Fund’s proxy voting records is available by calling (215) 882-9983.
Householding
Householding is an option available to certain investors of the Fund. Householding is a method of delivery, based on the preference of the individual investor, in which a single copy of certain shareholder documents can be delivered to investors who share the same address, even if their accounts are registered under different names. Householding for the Fund is available through certain broker-dealers. If you are interested in enrolling in householding and receiving a single copy of prospectuses and other shareholder documents or you are currently enrolled in householding and wish to change your householding status, please contact your broker-dealer.
Annual Shareholder Report: June 30, 2024
The Fund is distributed by Quasar Distributors, LLC.
| | | | | | | | |
| EA Bridgeway Omni Small-Cap Value ETF Ticker: BSVO Listed on: The Nasdaq Stock Market LLC
| June 30, 2024 Annual Shareholder Report www.bridgewayetfs.com/bsvo/ |
|
| | | | | | | | | | | |
| This annual shareholder report contains important information about the EA Bridgeway Omni Small-Cap Value ETF (the “Fund”) for the period of July 1, 2023 to June 30, 2024 (the “Period”). You can find additional information about the Fund at www.bridgewayetfs.com/bsvo/. You can also request this information by contacting us at (215) 882-9983. |
| | | | | | | | | | | |
WHAT WERE THE FUND COSTS FOR THE PERIOD?
(based on a hypothetical $10,000 investment) |
| COST OF $10,000 INVESTMENT | | COST PAID AS A PERCENTAGE OF $10,000 INVESTMENT |
| $51 | | 0.47% |
| | | | | | | | | | | |
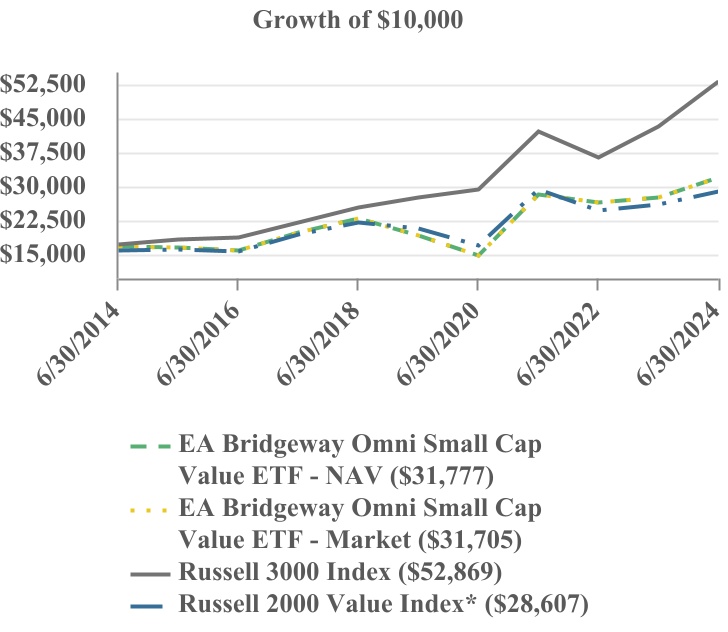
PERFORMANCE OF HYPOTHETICAL
$10,000 INVESTMENT |
| | | | | | | | | | | |
| WHAT FACTORS INFLUENCED PERFORMANCE FOR THE PERIOD? |
The Fund returned 16.27% (NAV) for the Period vs 23.13% for the Russell 3000 Index. During the period, markets responded positively to strong corporate earnings, resilient economic conditions, and Federal Reserve policy. Markets were led by stocks with larger market capitalization.
The Fund’s tilt toward smaller, deeper value stocks across multiple valuation metrics contributed negatively to returns relative to the benchmark during the period.
| | | | | | | | | | | | | | | | | | | | |
| AVERAGE ANNUAL TOTAL RETURNS |
| | 1 Year | | 5 Year | | 10 Year |
| EA Bridgeway Omni Small Cap Value ETF - NAV | | 16.27% | | 10.87% | | 6.81% |
| EA Bridgeway Omni Small Cap Value ETF - Market | | 15.87% | | 10.82% | | 6.79% |
| Russell 3000 Index | | 23.13% | | 14.14% | | 12.15% |
| Russell 2000 Value Index | | 10.90% | | 7.07% | | 6.23% |
| The Russell 3000 Index is provided as a broad measure of market performance. The Russell 2000 Value Index is provided as a measure of the Fund’s investment strategy and universe. |
| | | | | | |
The Fund’s past performance is not a good predictor of how the Fund will perform in the future. The graph and table do not reflect the deduction of taxes that a shareholder would pay on fund distributions or redemption of fund shares. The Fund converted from a mutual fund to an ETF on March 10, 2023. The Fund has adopted the mutual fund’s prior performance for the periods before the conversion. Visit www.bridgewayetfs.com/bsvo/ for more recent performance information. |
Annual Shareholder Report: June 30, 2024
The Fund is distributed by Quasar Distributors, LLC.
| | | | | | | | |
| EA Bridgeway Omni Small-Cap Value ETF Ticker: BSVO Listed on: The Nasdaq Stock Market LLC
| June 30, 2024 Annual Shareholder Report www.bridgewayetfs.com/bsvo/ |
|
| | | | | | | | | | | | | | | | | | | | |
| KEY FUND STATISTICS (as of Period End) |
| Net Assets | | $1,272,957,860 | | Portfolio Turnover Rate* | | 6% |
| Number of Portfolio Holdings | | 605 | | Advisory Fees Paid | | $4,812,357 |
| *Excludes in-kind transactions. |
| | | | | |
SECTOR WEIGHTING
(as a % of Net Assets) |
| Financials | 33.2 | % |
| Industrials | 15.7 | % |
| Consumer Discretionary | 14.0 | % |
| Energy | 12.0 | % |
| Materials | 5.8 | % |
| Communication Services | 5.6 | % |
| Information Technology | 5.1 | % |
| Health Care | 3.7 | % |
| Consumer Staples | 3.0 | % |
| Real Estate | 1.7 | % |
| Cash & Cash Equivalents | 0.2 | % |
| |
| | | | | | | | |
TOP 10 HOLDINGS (as a % of Net Assets) |
| SkyWest, Inc. | 1.1% |
| Golden Ocean Group Ltd. | 1.0% |
| United States Cellular Corp. | 0.9% |
| Warrior Met Coal, Inc. | 0.8% |
| Teekay Tankers Ltd. - Class A | 0.8% |
| Gulfport Energy Corp. | 0.8% |
| Tronox Holdings PLC | 0.8% |
| M/I Homes, Inc. | 0.8% |
| Telephone and Data Systems, Inc. | 0.8% |
| TTM Technologies, Inc. | 0.8% |
Availability of Additional Information
For additional information about the Fund, including its prospectus, financial information, and holdings, visit www.bridgewayetfs.com/bsvo/. Information about the Fund’s proxy voting records is available by calling (215) 882-9983.
Householding
Householding is an option available to certain investors of the Fund. Householding is a method of delivery, based on the preference of the individual investor, in which a single copy of certain shareholder documents can be delivered to investors who share the same address, even if their accounts are registered under different names. Householding for the Fund is available through certain broker-dealers. If you are interested in enrolling in householding and receiving a single copy of prospectuses and other shareholder documents or you are currently enrolled in householding and wish to change your householding status, please contact your broker-dealer.
Annual Shareholder Report: June 30, 2024
The Fund is distributed by Quasar Distributors, LLC.
(b)
Item 2. Code of Ethics.
The registrant has adopted a code of ethics that applies to the registrant’s principal executive officer and principal financial officer. The registrant has not made any amendments to its code of ethics during the year covered by this report. The registrant has not granted any waivers from any provisions of the code of ethics during the year covered by this report.
A copy of the registrant’s Code of Ethics is incorporated by reference.
Item 3. Audit Committee Financial Expert.
The registrant’s Board of Trustees of the Trust has determined that there is at least one audit committee financial expert serving on its audit committee. Dr. Michael Pagano is an “audit committee financial expert” and is considered to be “independent” as each term is defined in Item 3 of Form N-CSR.
Item 4. Principal Accountant Fees and Services.
The registrant has engaged its principal accountant to perform audit services, audit-related services, tax services and other services during the past fiscal year. “Audit services” refer to performing an audit of the registrant’s annual financial statements or services that are normally provided by the accountant in connection with statutory and regulatory filings or engagements for those fiscal years. “Audit-related services” refer to the assurance and related services by the principal accountant that are reasonably related to the performance of the audit. “Tax services” refer to professional services rendered by the principal accountant for tax compliance, tax advice, and tax planning, including review of the registrant’s tax returns and calculations of required income, capital gain and excise distributions. There were no “Other services” provided by the principal accountant. The following table details the aggregate fees billed or expected to be billed for the last fiscal year for audit fees, audit-related fees, tax fees and other fees by the principal accountant.
| | | | | | | | | | | | | | | | | |
| EA Bridgeway Blue
Chip ETF | | EA Bridgeway Omni Small-Cap Value ETF |
| | FYE 06/30/2024 | FYE 06/30/2023 | | FYE 06/30/2024 | FYE 06/30/2023 |
| (a) Audit Fees | $8,750 | $8,750 | | $8,750 | $8,750 |
| (b) Audit-Related Fees | N/A | N/A | | N/A | N/A |
| (c)Tax Fees | $2,250 | $2,250 | | $2,250 | $2,250 |
| (d) All Other Fees | N/A | N/A | | N/A | N/A |
(e)(1) The audit committee has adopted pre-approval policies and procedures that require the audit committee to pre-approve all audit and non-audit services of the registrant, including services provided to any entity affiliated with the registrant.
(e)(2) The percentage of fees billed by its principal accountant applicable to non-audit services pursuant to waiver of pre-approval requirement were as follows:
| | | | | | | | | | | | | | | | | |
| EA Bridgeway Blue
Chip ETF | | EA Bridgeway Omni Small-Cap Value ETF |
| | FYE 06/30/2024 | FYE 06/30/2023 | | FYE 06/30/2024 | FYE 06/30/2023 |
| Audit-Related Fees | 0% | 0% | | 0% | 0% |
| Tax Fees | 0% | 0% | | 0% | 0% |
| All Other Fees | 0% | 0% | | 0% | 0% |
(f) All of the principal accountant’s hours spent on auditing the registrant’s financial statements were attributed to work performed by full-time permanent employees of the principal accountant.
(g) The following table indicates the non-audit fees billed or expected to be billed by the registrant’s accountant for services to the registrant and to the registrant’s investment adviser (and any other controlling entity, etc.—not sub-adviser) for the last two years.
| | | | | | | | | | | | | | | | | |
| Non-Audit Related Fees | EA Bridgeway Blue
Chip ETF | | EA Bridgeway Omni Small-Cap Value ETF |
FYE 06/30/2024 | FYE 06/30/2023 | | FYE 06/30/2024 | FYE 06/30/2023 |
| Registrant | N/A | N/A | | N/A | N/A |
| Registrant’s Investment Adviser | N/A | N/A | | N/A | N/A |
(h) The audit committee of the board of trustees/directors has considered whether the provision of non-audit services that were rendered to the registrant's investment adviser is compatible with maintaining the principal accountant's independence and has concluded that the provision of such non-audit services by the accountant has not compromised the accountant’s independence.
(i) The registrant has not been identified by the U.S. Securities and Exchange Commission as having filed an annual report issued by a registered public accounting firm branch or office that is located in a foreign jurisdiction where the Public Company Accounting Oversight Board is unable to inspect or completely investigate because of a position taken by an authority in that jurisdiction..
(j) The registrant is not a foreign issuer.
Item 5. Audit Committee of Listed Registrants.
(a) The registrant is an issuer as defined in Rule 10A-3 under the Securities Exchange Act of 1934, (the “Act”) and has a separately-designated standing audit committee established in accordance with Section 3(a)(58)(A) of the Act. The independent members of the committee are as follows: Daniel Dorn, Chukwuemeka (Emeka) Oguh, and Michael Pagano.
(b) Not applicable.
Item 6. Investments
(a)
| | |
| EA BRIDGEWAY BLUE CHIP ETF |
| SCHEDULE OF INVESTMENTS |
| June 30, 2024 |
| | | | | | | | | | | | | | |
| COMMON STOCKS - 99.7% | | Shares | | Value |
| Aerospace & Defense - 2.4% | | | | |
| RTX Corp. | | 44,081 | | | $ | 4,425,292 | |
| | | | |
| Air Freight & Logistics - 2.4% | | | | |
| United Parcel Service, Inc. - Class B | | 32,418 | | | 4,436,403 | |
| | | | |
| Automobile Manufacturers - 2.5% | | | | |
Tesla, Inc.(a) | | 22,895 | | | 4,530,463 | |
| | | | |
| Broadline Retail - 2.4% | | | | |
Amazon.com, Inc.(a) | | 22,394 | | | 4,327,640 | |
| | | | |
| Cable & Satellite - 2.5% | | | | |
| Comcast Corp. - Class A | | 113,851 | | | 4,458,405 | |
| | | | |
| Communications Equipment - 2.4% | | | | |
| Cisco Systems, Inc. | | 93,406 | | | 4,437,719 | |
| | | | |
| Consumer Staples Merchandise Retail - 2.4% | | | | |
| Walmart, Inc. | | 65,215 | | | 4,415,708 | |
| | | | |
| Diversified Banks - 8.9% | | | | |
| Bank of America Corp. | | 115,789 | | | 4,604,928 | |
| JPMorgan Chase & Co. | | 34,891 | | | 7,057,054 | |
| Wells Fargo & Co. | | 76,133 | | | 4,521,539 | |
| | | | 16,183,521 | |
| | | | |
| Home Improvement Retail - 2.5% | | | | |
| Home Depot, Inc. | | 12,968 | | | 4,464,104 | |
| | | | |
| Household Products - 2.5% | | | | |
| Procter & Gamble Co. | | 27,263 | | | 4,496,214 | |
| | | | |
| Integrated Oil & Gas - 4.9% | | | | |
| Chevron Corp. | | 28,289 | | | 4,424,965 | |
| Exxon Mobil Corp. | | 38,421 | | | 4,423,026 | |
| | | | 8,847,991 | |
| | | | |
| Integrated Telecommunication Services - 2.5% | | | | |
| Verizon Communications, Inc. | | 108,371 | | | 4,469,220 | |
The accompanying notes are an integral part of these financial statements.
1
| | |
| EA BRIDGEWAY BLUE CHIP ETF |
| SCHEDULE OF INVESTMENTS (CONTINUED) |
| June 30, 2024 |
| | | | | | | | | | | | | | |
| COMMON STOCKS - 99.7% (CONTINUED) | | Shares | | Value |
| | | | |
| Interactive Media & Services - 6.8% | | | | |
| Alphabet, Inc. - Class A - Class A | | 14,458 | | | $ | 2,633,525 | |
| Alphabet, Inc. - Class C - Class C | | 14,147 | | | 2,594,843 | |
| Meta Platforms, Inc. - Class A | | 14,147 | | | 7,133,200 | |
| | | | 12,361,568 | |
| | | | |
| Managed Health Care - 2.5% | | | | |
| UnitedHealth Group, Inc. | | 8,913 | | | 4,539,034 | |
| | | | |
| Movies & Entertainment - 2.4% | | | | |
| Walt Disney Co. | | 43,771 | | | 4,346,023 | |
| | | | |
| Multi-Sector Holdings - 2.4% | | | | |
Berkshire Hathaway, Inc. - Class B(a) | | 10,855 | | | 4,415,814 | |
| | | | |
| Pharmaceuticals - 11.3% | | | | |
| Eli Lilly & Co. | | 8,007 | | | 7,249,378 | |
| Johnson & Johnson | | 30,515 | | | 4,460,072 | |
| Merck & Co., Inc. | | 34,329 | | | 4,249,930 | |
| Pfizer, Inc. | | 158,741 | | | 4,441,573 | |
| | | | 20,400,953 | |
| | | | |
| Restaurants - 2.4% | | | | |
| McDonald's Corp. | | 17,221 | | | 4,388,600 | |
| | | | |
| Semiconductors - 13.0% | | | | |
| Broadcom, Inc. | | 4,201 | | | 6,744,832 | |
| Intel Corp. | | 144,676 | | | 4,480,616 | |
| Nvidia Corp. | | 58,239 | | | 7,194,846 | |
| Qualcomm, Inc. | | 25,736 | | | 5,126,096 | |
| | | | 23,546,390 | |
| | | | |
| Soft Drinks & Non-alcoholic Beverages - 4.9% | | | | |
| Coca-Cola Co. | | 70,133 | | | 4,463,966 | |
| PepsiCo, Inc. | | 26,982 | | | 4,450,141 | |
| | | | 8,914,107 | |
| | | | |
| Systems Software - 6.4% | | | | |
| Microsoft Corp. | | 15,934 | | | 7,121,701 | |
| Oracle Corp. | | 31,674 | | | 4,472,369 | |
| | | | 11,594,070 | |
| | | | |
| Technology Hardware, Storage & Peripherals - 3.5% | | | | |
| Apple, Inc. | | 30,002 | | | 6,319,021 | |
| | | | |
The accompanying notes are an integral part of these financial statements.
2
| | |
| EA BRIDGEWAY BLUE CHIP ETF |
| SCHEDULE OF INVESTMENTS (CONTINUED) |
| June 30, 2024 |
| | | | | | | | | | | | | | |
| COMMON STOCKS - 99.7% (CONTINUED) | | Shares | | Value |
| Transaction & Payment Processing Services - 5.8% | | | | |
| Mastercard, Inc. - Class A | | 9,994 | | | $ | 4,408,953 | |
| Visa, Inc. - Class A | | 23,264 | | | 6,106,102 | |
| | | | 10,515,055 | |
TOTAL COMMON STOCKS (Cost $110,880,800) | | | | 180,833,315 | |
| | | | |
| SHORT-TERM INVESTMENTS - 0.3% | | | | |
| Money Market Funds - 0.3% | | | | |
First American Government Obligations Fund - Class X, 5.23%(b) | | 455,415 | | | 455,415 | |
TOTAL SHORT-TERM INVESTMENTS (Cost $455,415) | | | | 455,415 | |
| | | | |
TOTAL INVESTMENTS - 100.0% (Cost $111,336,215) | | | | $ | 181,288,730 | |
Other Assets in Excess of Liabilities - 0.0%(c) | | | | 81,277 | |
| TOTAL NET ASSETS - 100.0% | | | | $ | 181,370,007 | |
Percentages are stated as a percent of net assets.
| | | | | | | | |
| (a) | | Non-income producing security. |
| (b) | | The rate shown represents the 7-day effective yield as of June 30, 2024. |
| (c) | | Represents less than 0.05% of net assets. |
The Global Industry Classification Standard (GICS®) was developed by and/or is the exclusive property of MSCI, Inc. and Standard & Poor’s Financial Services LLC (“S&P”). GICS is a service mark of MSCI, Inc. and S&P and has been licensed for use by U.S. Bank Global Fund Services.
The accompanying notes are an integral part of these financial statements.
3
| | |
| EA BRIDGEWAY OMNI SMALL CAP VALUE ETF |
| SCHEDULE OF INVESTMENTS |
| June 30, 2024 |
| | | | | | | | | | | | | | |
| COMMON STOCKS - 99.7% | | Shares | | Value |
| Advertising - 0.6% | | | | |
Advantage Solutions, Inc.(a) | | 1,420,224 | | | $ | 4,573,121 | |
comScore, Inc.(a) | | 8,395 | | | 119,125 | |
| Entravision Communications Corp. - Class A | | 395,550 | | | 802,967 | |
Fluent, Inc.(a) | | 53,767 | | | 194,099 | |
Thryv Holdings, Inc.(a) | | 102,648 | | | 1,829,187 | |
| | | | 7,518,499 | |
| | | | |
Aerospace & Defense - 0.0%(b) | | | | |
SIFCO Industries, Inc.(a) | | 6,050 | | | 18,755 | |
| | | | |
| Agricultural & Farm Machinery - 0.2% | | | | |
Titan International, Inc.(a) | | 282,000 | | | 2,089,620 | |
| | | | |
| Agricultural Products & Services - 0.4% | | | | |
| Alico, Inc. | | 14,993 | | | 388,469 | |
Fresh Del Monte Produce, Inc.(e) | | 236,744 | | | 5,172,856 | |
| | | | 5,561,325 | |
| | | | |
| Air Freight & Logistics - 0.4% | | | | |
Air Transport Services Group, Inc.(a) | | 261,319 | | | 3,624,495 | |
Radiant Logistics, Inc.(a) | | 194,921 | | | 1,109,100 | |
| | | | 4,733,595 | |
| | | | |
| Alternative Carriers - 0.8% | | | | |
Liberty Latin America Ltd. - Class A(a)(e) | | 180,815 | | | 1,737,632 | |
Liberty Latin America Ltd. - Class C(a)(e) | | 845,722 | | | 8,135,846 | |
| | | | 9,873,478 | |
| | | | |
| Aluminum - 0.1% | | | | |
Century Aluminum Co.(a) | | 52,502 | | | 879,408 | |
| | | | |
| Apparel Retail - 2.8% | | | | |
Abercrombie & Fitch Co. - Class A(a) | | 36,628 | | | 6,513,923 | |
| Caleres, Inc. | | 127,362 | | | 4,279,363 | |
Cato Corp. - Class A(c) | | 42,726 | | | 236,702 | |
Citi Trends, Inc.(a) | | 22,877 | | | 486,365 | |
| Designer Brands, Inc. - Class A | | 269,529 | | | 1,840,883 | |
Destination XL Group, Inc.(a) | | 60,128 | | | 218,866 | |
Duluth Holdings, Inc. - Class B(a) | | 83,969 | | | 309,846 | |
| Foot Locker, Inc. | | 363,504 | | | 9,058,520 | |
Genesco, Inc.(a) | | 55,600 | | | 1,437,816 | |
Guess?, Inc.(c) | | 164,226 | | | 3,350,210 | |
Lands' End, Inc.(a) | | 58,480 | | | 794,743 | |
| Shoe Carnival, Inc. | | 122,893 | | | 4,533,523 | |
The accompanying notes are an integral part of these financial statements.
1
| | |
| EA BRIDGEWAY OMNI SMALL CAP VALUE ETF |
| SCHEDULE OF INVESTMENTS (CONTINUED) |
| June 30, 2024 |
| | | | | | | | | | | | | | |
| COMMON STOCKS - 99.7% (CONTINUED) | | Shares | | Value |
| Apparel Retail - 2.8% (Continued) | | | | |
Tilly's, Inc. - Class A(a) | | 119,724 | | | $ | 721,936 | |
Zumiez, Inc.(a) | | 78,861 | | | 1,536,212 | |
| | | | 35,318,908 | |
| | | | |
| Apparel, Accessories & Luxury Goods - 0.8% | | | | |
Delta Apparel, Inc.(a) | | 38,080 | | | 22,086 | |
G-III Apparel Group Ltd.(a) | | 212,632 | | | 5,755,948 | |
| Jerash Holdings US, Inc. | | 700 | | | 2,135 | |
| Lakeland Industries, Inc. | | 11,593 | | | 265,943 | |
| Movado Group, Inc. | | 92,764 | | | 2,306,113 | |
| Superior Group of Cos., Inc. | | 77,483 | | | 1,465,204 | |
Vera Bradley, Inc.(a) | | 136,974 | | | 857,457 | |
Vince Holding Corp.(a) | | 5,633 | | | 7,774 | |
| | | | 10,682,660 | |
| | | | |
| Application Software - 1.0% | | | | |
Cleanspark, Inc.(a)(c) | | 165,747 | | | 2,643,665 | |
E2open Parent Holdings, Inc. - Class A(a) | | 720,107 | | | 3,233,280 | |
NCR Voyix Corp.(a) | | 547,340 | | | 6,759,649 | |
NetSol Technologies, Inc.(a) | | 44,240 | | | 112,370 | |
| | | | 12,748,964 | |
| | | | |
| Asset Management & Custody Banks - 0.2% | | | | |
Great Elm Group, Inc.(a) | | 3,272 | | | 5,890 | |
| Hennessy Advisors, Inc. | | 8,016 | | | 57,074 | |
| US Global Investors, Inc. - Class A | | 50,940 | | | 132,953 | |
| Virtus Investment Partners, Inc. | | 6,427 | | | 1,451,538 | |
| Westwood Holdings Group, Inc. | | 23,901 | | | 291,114 | |
| | | | 1,938,569 | |
| | | | |
| Automobile Manufacturers - 0.5% | | | | |
| Winnebago Industries, Inc. | | 117,893 | | | 6,389,801 | |
| | | | |
| Automotive Parts & Equipment - 1.9% | | | | |
American Axle & Manufacturing Holdings, Inc.(a) | | 497,560 | | | 3,477,944 | |
China Automotive Systems, Inc.(a) | | 129,769 | | | 460,680 | |
| Dana, Inc. | | 564,384 | | | 6,840,334 | |
Holley, Inc.(a) | | 236,377 | | | 846,230 | |
Kandi Technologies Group, Inc.(a) | | 88,749 | | | 194,360 | |
| Patrick Industries, Inc. | | 85,832 | | | 9,317,064 | |
| Standard Motor Products, Inc. | | 99,983 | | | 2,772,529 | |
Strattec Security Corp.(a) | | 4,482 | | | 112,050 | |
| | | | 24,021,191 | |
| | | | |
The accompanying notes are an integral part of these financial statements.
2
| | |
| EA BRIDGEWAY OMNI SMALL CAP VALUE ETF |
| SCHEDULE OF INVESTMENTS (CONTINUED) |
| June 30, 2024 |
| | | | | | | | | | | | | | |
| COMMON STOCKS - 99.7% (CONTINUED) | | Shares | | Value |
| Automotive Retail - 0.1% | | | | |
CarParts.com, Inc.(a) | | 61,064 | | | $ | 61,064 | |
OneWater Marine, Inc. - Class A(a) | | 52,808 | | | 1,455,917 | |
RumbleON, Inc. - Class B(a)(c) | | 62,800 | | | 257,480 | |
| Sonic Automotive, Inc. - Class A | | 969 | | | 52,781 | |
| | | | 1,827,242 | |
| | | | |
| Biotechnology - 0.8% | | | | |
Carisma Therapeutics, Inc.(a)(c) | | 28,964 | | | 44,025 | |
iTeos Therapeutics, Inc.(a) | | 62,417 | | | 926,268 | |
Ovid therapeutics, Inc.(a) | | 137,970 | | | 106,127 | |
Vanda Pharmaceuticals, Inc.(a) | | 216,763 | | | 1,224,711 | |
Vir Biotechnology, Inc.(a) | | 493,504 | | | 4,392,186 | |
Voyager Therapeutics, Inc.(a) | | 42,531 | | | 336,420 | |
XBiotech, Inc.(a) (e) | | 69,137 | | | 355,364 | |
Zymeworks, Inc.(a) | | 318,643 | | | 2,711,652 | |
| | | | 10,096,753 | |
| | | | |
| Broadcasting - 0.7% | | | | |
AMC Networks, Inc. - Class A(a) | | 166,656 | | | 1,609,897 | |
Cumulus Media, Inc. - Class A(a) | | 16,176 | | | 32,999 | |
EW Scripps Co. - Class A(a) | | 262,768 | | | 825,092 | |
| Gray Television, Inc. | | 342,654 | | | 1,781,801 | |
| Saga Communications, Inc. - Class A | | 26,050 | | | 410,287 | |
Salem Media Group, Inc.(a) | | 58,752 | | | 13,513 | |
| Sinclair, Inc. | | 220,298 | | | 2,936,572 | |
| Townsquare Media, Inc. - Class A | | 68,985 | | | 756,076 | |
Urban One, Inc.(a) | | 143,597 | | | 215,395 | |
| | | | 8,581,632 | |
| | | | |
Broadline Retail - 0.0%(b) | | | | |
Qurate Retail, Inc. - Class A(a) | | 483,582 | | | 304,657 | |
| | | | |
| Building Products - 2.0% | | | | |
American Woodmark Corp.(a) | | 80,504 | | | 6,327,615 | |
| AZZ, Inc. | | 20,293 | | | 1,567,634 | |
JELD-WEN Holding, Inc.(a) | | 387,717 | | | 5,222,548 | |
Masterbrand, Inc.(a) | | 587,246 | | | 8,620,771 | |
| Quanex Building Products Corp. | | 136,032 | | | 3,761,285 | |
| | | | 25,499,853 | |
| | | | |
| Cable & Satellite - 0.4% | | | | |
EchoStar Corp. - Class A(a) | | 304,637 | | | 5,425,585 | |
WideOpenWest, Inc.(a) | | 40,024 | | | 216,530 | |
| | | | 5,642,115 | |
| | | | |
The accompanying notes are an integral part of these financial statements.
3
| | |
| EA BRIDGEWAY OMNI SMALL CAP VALUE ETF |
| SCHEDULE OF INVESTMENTS (CONTINUED) |
| June 30, 2024 |
| | | | | | | | | | | | | | |
| COMMON STOCKS - 99.7% (CONTINUED) | | Shares | | Value |
| Cargo Ground Transportation - 1.0% | | | | |
| ArcBest Corp. | | 2,954 | | | $ | 316,314 | |
| Covenant Logistics Group, Inc. | | 85,334 | | | 4,206,113 | |
| Heartland Express, Inc. | | 243,173 | | | 2,998,323 | |
PAM Transportation Services, Inc.(a) | | 58,556 | | | 1,017,118 | |
| Universal Logistics Holdings, Inc. | | 93,197 | | | 3,782,866 | |
| | | | 12,320,734 | |
| | | | |
| Casinos & Gaming - 0.2% | | | | |
Bally's Corp.(a) | | 150,930 | | | 1,806,632 | |
Century Casinos, Inc.(a) | | 71,975 | | | 199,371 | |
| Golden Entertainment, Inc. | | 8,018 | | | 249,440 | |
| | | | 2,255,443 | |
| | | | |
| Coal & Consumable Fuels - 0.2% | | | | |
| CONSOL Energy, Inc. | | 1,449 | | | 147,841 | |
Hallador Energy Co.(a) | | 210,641 | | | 1,636,681 | |
| NACCO Industries, Inc. - Class A | | 32,986 | | | 912,723 | |
| | | | 2,697,245 | |
| | | | |
| Commercial & Residential Mortgage Finance - 1.6% | | | | |
| Federal Agricultural Mortgage Corp. - Class C | | 30,362 | | | 5,490,057 | |
| Guild Holdings Co. - Class A | | 256,213 | | | 3,789,390 | |
loanDepot, Inc. - Class A(a) | | 221,750 | | | 365,887 | |
| Merchants Bancorp | | 152,181 | | | 6,169,418 | |
Onity Group, Inc.(a) | | 40,572 | | | 972,917 | |
Security National Financial Corp. - Class A(a) | | 45,159 | | | 360,820 | |
Velocity Financial, Inc.(a) | | 131,753 | | | 2,362,331 | |
| Waterstone Financial, Inc. | | 70,316 | | | 899,342 | |
| | | | 20,410,162 | |
| | | | |
| Commercial Printing - 0.5% | | | | |
| Deluxe Corp. | | 209,269 | | | 4,700,182 | |
| Quad Graphics, Inc. | | 265,282 | | | 1,445,787 | |
| | | | 6,145,969 | |
| | | | |
| Commodity Chemicals - 1.6% | | | | |
| AdvanSix, Inc. | | 142,814 | | | 3,273,297 | |
Core Molding Technologies, Inc.(a) | | 34,440 | | | 548,973 | |
| Koppers Holdings, Inc. | | 43,126 | | | 1,595,231 | |
| Kronos Worldwide, Inc. | | 76,976 | | | 966,049 | |
| Mativ Holdings, Inc. | | 212,659 | | | 3,606,697 | |
Tronox Holdings PLC (f) | | 654,415 | | | 10,267,771 | |
| | | | 20,258,018 | |
| | | | |
The accompanying notes are an integral part of these financial statements.
4
| | |
| EA BRIDGEWAY OMNI SMALL CAP VALUE ETF |
| SCHEDULE OF INVESTMENTS (CONTINUED) |
| June 30, 2024 |
| | | | | | | | | | | | | | |
| COMMON STOCKS - 99.7% (CONTINUED) | | Shares | | Value |
| Communications Equipment - 0.5% | | | | |
| ClearOne, Inc. | | 26,370 | | | $ | 17,143 | |
KVH Industries, Inc.(a) | | 26,280 | | | 122,202 | |
NETGEAR, Inc.(a) | | 115,220 | | | 1,762,866 | |
NetScout Systems, Inc.(a) | | 232,613 | | | 4,254,492 | |
| Network-1 Technologies, Inc. | | 98,697 | | | 175,681 | |
| | | | 6,332,384 | |
| | | | |
| Construction & Engineering - 0.9% | | | | |
Concrete Pumping Holdings, Inc.(a) | | 288,972 | | | 1,736,722 | |
Limbach Holdings, Inc.(a) | | 8,216 | | | 467,737 | |
Northwest Pipe Co.(a) | | 41,508 | | | 1,410,027 | |
Orion Group Holdings, Inc.(a) | | 237,291 | | | 2,256,637 | |
Tutor Perini Corp.(a) | | 235,845 | | | 5,136,704 | |
| | | | 11,007,827 | |
| | | | |
| Construction Machinery & Heavy Transportation Equipment - 1.0% | | | | |
Commercial Vehicle Group, Inc.(a) | | 94,403 | | | 462,575 | |
| Greenbrier Cos., Inc. | | 144,176 | | | 7,143,921 | |
Manitowoc Co., Inc.(a) | | 159,924 | | | 1,843,924 | |
| REV Group, Inc. | | 380 | | | 9,458 | |
| Twin Disc, Inc. | | 13,161 | | | 155,036 | |
| Wabash National Corp. | | 142,223 | | | 3,106,150 | |
| | | | 12,721,064 | |
| | | | |
| Consumer Electronics - 0.1% | | | | |
Koss Corp.(a)(c) | | 5,955 | | | 26,500 | |
Universal Electronics, Inc.(a) | | 40,836 | | | 474,514 | |
VOXX International Corp.(a)(c) | | 71,190 | | | 224,960 | |
| | | | 725,974 | |
| | | | |
| Consumer Finance - 3.5% | | | | |
Atlanticus Holdings Corp.(a) | | 16,174 | | | 455,783 | |
| Bread Financial Holdings, Inc. | | 206,041 | | | 9,181,187 | |
Consumer Portfolio Services, Inc.(a)(c) | | 135,284 | | | 1,325,783 | |
Encore Capital Group, Inc.(a) | | 80,524 | | | 3,360,266 | |
Enova International, Inc.(a) | | 118,495 | | | 7,376,314 | |
EZCORP, Inc. - Class A(a) | | 308,325 | | | 3,228,163 | |
Green Dot Corp. - Class A(a) | | 167,460 | | | 1,582,497 | |
LendingClub Corp.(a) | | 339,029 | | | 2,868,185 | |
LendingTree, Inc.(a) | | 33,476 | | | 1,392,267 | |
Moneylion, Inc.(a) | | 33,504 | | | 2,463,884 | |
| Navient Corp. | | 421,821 | | | 6,141,714 | |
Nicholas Financial, Inc.(a)(e) | | 26,209 | | | 172,193 | |
Oportun Financial Corp.(a) | | 104,992 | | | 304,477 | |
The accompanying notes are an integral part of these financial statements.
5
| | |
| EA BRIDGEWAY OMNI SMALL CAP VALUE ETF |
| SCHEDULE OF INVESTMENTS (CONTINUED) |
| June 30, 2024 |
| | | | | | | | | | | | | | |
| COMMON STOCKS - 99.7% (CONTINUED) | | Shares | | Value |
| Consumer Finance - 3.5% (Continued) | | | | |
| PROG Holdings, Inc. | | 29,632 | | | $ | 1,027,638 | |
| Regional Management Corp. | | 39,639 | | | 1,139,225 | |
World Acceptance Corp.(a) | | 20,358 | | | 2,515,842 | |
| | | | 44,535,418 | |
| | | | |
| Data Processing & Outsourced Services - 0.2% | | | | |
Conduent, Inc.(a) | | 757,052 | | | 2,467,989 | |
| | | | |
| Distributors - 0.6% | | | | |
| A-Mark Precious Metals, Inc. | | 16,054 | | | 519,668 | |
| AMCON Distributing Co. | | 2,622 | | | 369,702 | |
GigaCloud Technology, Inc. - Class A(a)(c) | | 176,110 | | | 5,357,266 | |
| Weyco Group, Inc. | | 34,300 | | | 1,039,976 | |
| | | | 7,286,612 | |
| | | | |
| Diversified Banks - 0.3% | | | | |
Bank of NT Butterfield & Son Ltd. (e) | | 124,213 | | | 4,362,361 | |
| | | | |
| Diversified Financial Services - 0.1% | | | | |
| Alerus Financial Corp. | | 44,659 | | | 875,763 | |
| | | | |
| Diversified Support Services - 0.3% | | | | |
Civeo Corp.(e) | | 91,039 | | | 2,268,692 | |
| Matthews International Corp. - Class A | | 67,427 | | | 1,689,046 | |
| | | | 3,957,738 | |
| | | | |
| Education Services - 1.2% | | | | |
American Public Education, Inc.(a) | | 82,011 | | | 1,441,753 | |
Chegg, Inc.(a) | | 353,540 | | | 1,117,186 | |
Lincoln Educational Services Corp.(a) | | 134,796 | | | 1,598,681 | |
| Perdoceo Education Corp. | | 340,761 | | | 7,299,101 | |
Universal Technical Institute, Inc.(a) | | 203,361 | | | 3,198,868 | |
| | | | 14,655,589 | |
| | | | |
| Electrical Components & Equipment - 0.1% | | | | |
CBAK Energy Technology, Inc.(a)(c) | | 294,525 | | | 403,499 | |
| LSI Industries, Inc. | | 4,482 | | | 64,855 | |
| Preformed Line Products Co. | | 4,471 | | | 556,818 | |
Servotronics, Inc.(a) | | 1,500 | | | 17,850 | |
Ultralife Corp.(a) | | 33,736 | | | 358,276 | |
| | | | 1,401,298 | |
| | | | |
| Electronic Components - 0.1% | | | | |
| Bel Fuse, Inc. - Class B | | 20,000 | | | 1,304,800 | |
| | | | |
The accompanying notes are an integral part of these financial statements.
6
| | |
| EA BRIDGEWAY OMNI SMALL CAP VALUE ETF |
| SCHEDULE OF INVESTMENTS (CONTINUED) |
| June 30, 2024 |
| | | | | | | | | | | | | | |
| COMMON STOCKS - 99.7% (CONTINUED) | | Shares | | Value |
| Electronic Equipment & Instruments - 0.2% | | | | |
Daktronics, Inc.(a) | | 214,546 | | | $ | 2,992,917 | |
| | | | |
| Electronic Manufacturing Services - 1.5% | | | | |
| Benchmark Electronics, Inc. | | 165,050 | | | 6,512,873 | |
Kimball Electronics, Inc.(a) | | 74,022 | | | 1,627,003 | |
| Methode Electronics, Inc. | | 106,176 | | | 1,098,922 | |
TTM Technologies, Inc.(a) | | 517,472 | | | 10,054,481 | |
| | | | 19,293,279 | |
| | | | |
| Environmental & Facilities Services - 0.7% | | | | |
BrightView Holdings, Inc.(a) | | 449,737 | | | 5,981,502 | |
Enviri Corp.(a) | | 379,221 | | | 3,272,677 | |
| | | | 9,254,179 | |
| | | | |
| Fertilizers & Agricultural Chemicals - 0.1% | | | | |
| American Vanguard Corp. | | 61,699 | | | 530,611 | |
Intrepid Potash, Inc.(a) | | 51,093 | | | 1,197,109 | |
| | | | 1,727,720 | |
| | | | |
| Food Distributors - 1.0% | | | | |
| Andersons, Inc. | | 158,367 | | | 7,855,003 | |
| SpartanNash Co. | | 161,119 | | | 3,022,592 | |
United Natural Foods, Inc.(a) | | 184,856 | | | 2,421,614 | |
| | | | 13,299,209 | |
| Food Retail - 0.8% | | | | |
| Ingles Markets, Inc. - Class A | | 85,293 | | | 5,851,953 | |
| Natural Grocers by Vitamin Cottage, Inc. | | 50,508 | | | 1,070,769 | |
| Village Super Market, Inc. - Class A | | 53,981 | | | 1,425,638 | |
| Weis Markets, Inc. | | 25,544 | | | 1,603,397 | |
| | | | 9,951,757 | |
| | | | |
| Footwear - 0.1% | | | | |
| Rocky Brands, Inc. | | 29,520 | | | 1,091,059 | |
| | | | |
Gold - 0.0%(b) | | | | |
Caledonia Mining Corp. PLC(f) | | 52,108 | | | 506,490 | |
| | | | |
| Health Care Distributors - 0.8% | | | | |
AdaptHealth Corp.(a) | | 541,822 | | | 5,418,220 | |
Owens & Minor, Inc.(a) | | 320,614 | | | 4,328,289 | |
| | | | 9,746,509 | |
| | | | |
The accompanying notes are an integral part of these financial statements.
7
| | |
| EA BRIDGEWAY OMNI SMALL CAP VALUE ETF |
| SCHEDULE OF INVESTMENTS (CONTINUED) |
| June 30, 2024 |
| | | | | | | | | | | | | | |
| COMMON STOCKS - 99.7% (CONTINUED) | | Shares | | Value |
| Health Care Equipment - 0.2% | | | | |
FONAR Corp.(a)(c) | | 17,752 | | | $ | 284,032 | |
Varex Imaging Corp.(a) | | 150,833 | | | 2,221,770 | |
| | | | 2,505,802 | |
| | | | |
| Health Care Services - 1.0% | | | | |
American Shared Hospital Services(a) | | 11,188 | | | 35,746 | |
Cross Country Healthcare, Inc.(a) | | 121,930 | | | 1,687,511 | |
Enhabit, Inc.(a) | | 158,934 | | | 1,417,691 | |
Fulgent Genetics, Inc.(a) | | 85,846 | | | 1,684,299 | |
Pediatrix Medical Group, Inc.(a) | | 253,304 | | | 1,912,445 | |
| Premier, Inc. - Class A | | 332,238 | | | 6,202,883 | |
| | | | 12,940,575 | |
| | | | |
| Health Care Supplies - 0.4% | | | | |
Avanos Medical, Inc.(a) | | 191,234 | | | 3,809,381 | |
OraSure Technologies, Inc.(a) | | 293,209 | | | 1,249,071 | |
| | | | 5,058,452 | |
| | | | |
| Health Care Technology - 0.1% | | | | |
CareCloud, Inc.(a) | | 38,480 | | | 73,882 | |
Multiplan Corp.(a)(c) | | 1,671,040 | | | 649,032 | |
| | | | 722,914 | |
| | | | |
Heavy Electrical Equipment - 0.0%(b) | | | | |
Broadwind, Inc.(a) | | 53,190 | | | 174,463 | |
| | | | |
| Home Furnishings - 0.9% | | | | |
| Bassett Furniture Industries, Inc. | | 24,213 | | | 344,067 | |
| Ethan Allen Interiors, Inc. | | 32,196 | | | 897,946 | |
| Flexsteel Industries, Inc. | | 20,976 | | | 651,515 | |
| Hooker Furnishings Corp. | | 46,776 | | | 677,316 | |
| La-Z-Boy, Inc. | | 192,468 | | | 7,175,207 | |
Live Ventures, Inc.(a) | | 16,911 | | | 383,711 | |
Lovesac Co.(a) | | 46,872 | | | 1,058,370 | |
| | | | 11,188,132 | |
| | | | |
Home Improvement Retail - 0.0%(b) | | | | |
GrowGeneration Corp.(a) | | 106,552 | | | 229,087 | |
| | | | |
| Homebuilding - 1.6% | | | | |
Beazer Homes USA, Inc.(a) | | 154,043 | | | 4,233,102 | |
Hovnanian Enterprises, Inc. - Class A(a) | | 27,732 | | | 3,935,725 | |
Landsea Homes Corp.(a) | | 174,768 | | | 1,606,118 | |
The accompanying notes are an integral part of these financial statements.
8
| | |
| EA BRIDGEWAY OMNI SMALL CAP VALUE ETF |
| SCHEDULE OF INVESTMENTS (CONTINUED) |
| June 30, 2024 |
| | | | | | | | | | | | | | |
| COMMON STOCKS - 99.7% (CONTINUED) | | Shares | | Value |
| Homebuilding - 1.6% (Continued) | | | | |
Legacy Housing Corp.(a) | | 39,602 | | | $ | 908,470 | |
M/I Homes, Inc.(a) | | 83,963 | | | 10,255,241 | |
| | | | 20,938,656 | |
| | | | |
| Homefurnishing Retail - 0.3% | | | | |
| Aaron's Co., Inc. | | 164,139 | | | 1,638,107 | |
| Haverty Furniture Cos., Inc. | | 77,491 | | | 1,959,748 | |
| | | | 3,597,855 | |
| | | | |
| Household Appliances - 0.1% | | | | |
| Hamilton Beach Brands Holding Co. - Class A | | 25,912 | | | 445,427 | |
Traeger, Inc.(a) | | 138,393 | | | 332,143 | |
| | | | 777,570 | |
| | | | |
| Housewares & Specialties - 0.1% | | | | |
| Lifetime Brands, Inc. | | 91,269 | | | 784,001 | |
| | | | |
| Human Resource & Employment Services - 0.5% | | | | |
Asure Software, Inc.(a) | | 35,333 | | | 296,797 | |
| Heidrick & Struggles International, Inc. | | 37,953 | | | 1,198,556 | |
| Kelly Services, Inc. - Class A | | 186,367 | | | 3,990,118 | |
TrueBlue, Inc.(a) | | 121,988 | | | 1,256,476 | |
| | | | 6,741,947 | |
| | | | |
| Industrial Machinery & Supplies & Components - 0.4% | | | | |
| Eastern Co. | | 16,436 | | | 418,625 | |
| Hurco Cos., Inc. | | 26,092 | | | 398,164 | |
Mayville Engineering Co., Inc.(a) | | 82,595 | | | 1,376,032 | |
NN, Inc.(a) | | 170,525 | | | 511,575 | |
| Park-Ohio Holdings Corp. | | 10,338 | | | 267,651 | |
Proto Labs, Inc.(a) | | 58,657 | | | 1,811,915 | |
| | | | 4,783,962 | |
| | | | |
Insurance Brokers - 0.0%(b) | | | | |
| Crawford & Co. - Class A | | 8,316 | | | 71,850 | |
| Crawford & Co. - Class B | | 101 | | | 809 | |
GoHealth, Inc.(a) | | 20,976 | | | 203,887 | |
| | | | 276,546 | |
| | | | |
| Integrated Telecommunication Services - 0.1% | | | | |
| ATN International, Inc. | | 73,204 | | | 1,669,051 | |
| | | | |
The accompanying notes are an integral part of these financial statements.
9
| | |
| EA BRIDGEWAY OMNI SMALL CAP VALUE ETF |
| SCHEDULE OF INVESTMENTS (CONTINUED) |
| June 30, 2024 |
| | | | | | | | | | | | | | |
| COMMON STOCKS - 99.7% (CONTINUED) | | Shares | | Value |
Interactive Media & Services - 0.0%(b) | | | | |
DHI Group, Inc.(a) | | 4,460 | | | $ | 9,321 | |
Outbrain, Inc.(a) | | 26,370 | | | 131,323 | |
| | | | 140,644 | |
| | | | |
| Investment Banking & Brokerage - 0.2% | | | | |
| Oppenheimer Holdings, Inc. - Class A | | 40,071 | | | 1,919,802 | |
| | | | |
IT Consulting & Other Services - 0.0%(b) | | | | |
WidePoint Corp.(a) | | 25,720 | | | 107,767 | |
| | | | |
| Leisure Products - 1.3% | | | | |
American Outdoor Brands, Inc.(a) | | 21,376 | | | 192,384 | |
AMMO, Inc.(a) | | 542,462 | | | 911,336 | |
| Clarus Corp. | | 90,464 | | | 608,823 | |
JAKKS Pacific, Inc.(a) | | 51,733 | | | 926,538 | |
| Johnson Outdoors, Inc. - Class A | | 17,473 | | | 611,205 | |
Latham Group, Inc.(a) | | 292,280 | | | 885,608 | |
MasterCraft Boat Holdings, Inc.(a) | | 73,877 | | | 1,394,798 | |
| Smith & Wesson Brands, Inc. | | 70,171 | | | 1,006,252 | |
Solo Brands, Inc. - Class A(a) | | 381,347 | | | 869,471 | |
Vista Outdoor, Inc.(a) | | 252,887 | | | 9,521,196 | |
| | | | 16,927,611 | |
| | | | |
Life & Health Insurance - 0.0%(b) | | | | |
Citizens, Inc.(a)(c) | | 131,313 | | | 357,171 | |
| | | | |
| Marine Transportation - 2.5% | | | | |
Costamare, Inc.(e) | | 543,630 | | | 8,931,841 | |
Genco Shipping & Trading Ltd.(e) | | 242,777 | | | 5,173,578 | |
Golden Ocean Group Ltd.(e) | | 882,462 | | | 12,177,976 | |
Pangaea Logistics Solutions Ltd.(e) | | 321,527 | | | 2,517,556 | |
Safe Bulkers, Inc.(e) | | 493,569 | | | 2,872,571 | |
| | | | 31,673,522 | |
| | | | |
| Movies & Entertainment - 0.6% | | | | |
| Marcus Corp. | | 152,802 | | | 1,737,359 | |
Sphere Entertainment Co.(a) | | 162,337 | | | 5,691,535 | |
| | | | 7,428,894 | |
| | | | |
| Multi-line Insurance - 0.4% | | | | |
| Atlantic American Corp. | | 1,204 | | | 2,035 | |
| Horace Mann Educators Corp. | | 154,739 | | | 5,047,586 | |
| | | | 5,049,621 | |
| | | | |
The accompanying notes are an integral part of these financial statements.
10
| | |
| EA BRIDGEWAY OMNI SMALL CAP VALUE ETF |
| SCHEDULE OF INVESTMENTS (CONTINUED) |
| June 30, 2024 |
| | | | | | | | | | | | | | |
| COMMON STOCKS - 99.7% (CONTINUED) | | Shares | | Value |
| Office Services & Supplies - 1.5% | | | | |
| ACCO Brands Corp. | | 413,811 | | | $ | 1,944,912 | |
| Acme United Corp. | | 3,696 | | | 129,619 | |
| ARC Document Solutions, Inc. | | 242,094 | | | 639,128 | |
| CompX International, Inc. | | 1,500 | | | 37,005 | |
| MillerKnoll, Inc. | | 340,920 | | | 9,030,971 | |
| NL Industries, Inc. | | 147,644 | | | 890,293 | |
| Steelcase, Inc. - Class A | | 529,336 | | | 6,860,194 | |
| | | | 19,532,122 | |
| | | | |
| Oil & Gas Equipment & Services - 2.3% | | | | |
| Archrock, Inc. | | 61,503 | | | 1,243,591 | |
Bristow Group, Inc.(a) | | 35,486 | | | 1,189,846 | |
DMC Global, Inc.(a) | | 86,455 | | | 1,246,681 | |
| Energy Services of America Corp. | | 8,116 | | | 58,111 | |
Forum Energy Technologies, Inc.(a) | | 11,788 | | | 198,746 | |
Geospace Technologies Corp.(a) | | 28,904 | | | 259,558 | |
Helix Energy Solutions Group, Inc.(a) | | 113,018 | | | 1,349,435 | |
Mammoth Energy Services, Inc.(a) | | 79,003 | | | 259,130 | |
Natural Gas Services Group, Inc.(a) | | 84,435 | | | 1,698,832 | |
NCS Multistage Holdings, Inc.(a) | | 18,204 | | | 305,463 | |
Newpark Resources, Inc.(a) | | 90,776 | | | 754,349 | |
Oil States International, Inc.(a) | | 336,783 | | | 1,495,316 | |
ProPetro Holding Corp.(a) | | 500,987 | | | 4,343,557 | |
| Ranger Energy Services, Inc. | | 108,066 | | | 1,136,854 | |
| RPC, Inc. | | 838,466 | | | 5,240,412 | |
SEACOR Marine Holdings, Inc.(a) | | 82,487 | | | 1,112,750 | |
| Select Water Solutions, Inc. | | 545,169 | | | 5,833,308 | |
Smart Sand, Inc.(a) | | 136,747 | | | 288,536 | |
| Solaris Oilfield Infrastructure, Inc. - Class A | | 124,000 | | | 1,063,920 | |
| | | | 29,078,395 | |
| Oil & Gas Exploration & Production - 4.4% | | | | |
Amplify Energy Corp.(a) | | 140,602 | | | 953,282 | |
| Barnwell Industries, Inc. | | 47,768 | | | 112,255 | |
Battalion Oil Corp.(a) | | 993 | | | 3,317 | |
| Berry Corp. | | 368,314 | | | 2,379,308 | |
| Crescent Energy Co. - Class A | | 830,353 | | | 9,839,683 | |
Epsilon Energy Ltd.(f) | | 81,963 | | | 446,698 | |
Gran Tierra Energy, Inc.(a) | | 148,629 | | | 1,437,242 | |
Gulfport Energy Corp.(a) | | 68,271 | | | 10,308,921 | |
HighPeak Energy, Inc.(c) | | 165,044 | | | 2,320,519 | |
PEDEVCO Corp.(a) | | 57,043 | | | 51,601 | |
| PHX Minerals, Inc. | | 122,278 | | | 398,626 | |
PrimeEnergy Resources Corp.(a) | | 2,010 | | | 213,763 | |
The accompanying notes are an integral part of these financial statements.
11
| | |
| EA BRIDGEWAY OMNI SMALL CAP VALUE ETF |
| SCHEDULE OF INVESTMENTS (CONTINUED) |
| June 30, 2024 |
| | | | | | | | | | | | | | |
| COMMON STOCKS - 99.7% (CONTINUED) | | Shares | | Value |
| Oil & Gas Exploration & Production - 4.4% (Continued) | | | | |
| Riley Exploration Permian, Inc. | | 28,092 | | | $ | 795,285 | |
Ring Energy, Inc.(a) | | 577,180 | | | 975,434 | |
| SandRidge Energy, Inc. | | 220,397 | | | 2,849,733 | |
SilverBow Resources, Inc.(a) | | 88,713 | | | 3,356,013 | |
Talos Energy, Inc.(a) | | 729,725 | | | 8,866,159 | |
US Energy Corp.(a) | | 20,376 | | | 20,784 | |
| VAALCO Energy, Inc. | | 490,472 | | | 3,075,259 | |
Vital Energy, Inc.(a) | | 174,355 | | | 7,814,591 | |
| | | | 56,218,473 | |
| | | | |
| Oil & Gas Refining & Marketing - 2.0% | | | | |
| Adams Resources & Energy, Inc. | | 17,604 | | | 492,912 | |
| Delek US Holdings, Inc. | | 303,373 | | | 7,511,515 | |
| FutureFuel Corp. | | 210,874 | | | 1,081,784 | |
Par Pacific Holdings, Inc.(a) | | 283,386 | | | 7,155,496 | |
REX American Resources Corp.(a) | | 68,303 | | | 3,113,934 | |
| World Kinect Corp. | | 260,787 | | | 6,728,305 | |
| | | | 26,083,946 | |
| | | | |
| Oil & Gas Storage & Transportation - 3.1% | | | | |
Ardmore Shipping Corp.(e) | | 197,289 | | | 4,444,921 | |
Dorian LPG Ltd.(e) | | 190,795 | | | 8,005,758 | |
Golar LNG Ltd.(e) | | 57,659 | | | 1,807,610 | |
SFL Corp. Ltd.(e) | | 666,101 | | | 9,245,482 | |
Teekay Corp.(a)(e) | | 644,338 | | | 5,779,712 | |
Teekay Tankers Ltd. - Class A(e) | | 150,192 | | | 10,334,711 | |
| | | | 39,618,194 | |
| | | | |
| Other Specialty Retail - 1.1% | | | | |
1-800-Flowers.com, Inc. - Class A(a) | | 226,565 | | | 2,156,899 | |
Big 5 Sporting Goods Corp.(c) | | 109,355 | | | 323,691 | |
MarineMax, Inc.(a) | | 20,401 | | | 660,380 | |
ODP Corp.(a) | | 176,047 | | | 6,913,366 | |
Sally Beauty Holdings, Inc.(a) | | 315,516 | | | 3,385,487 | |
Sportsman's Warehouse Holdings, Inc.(a) | | 114,428 | | | 275,771 | |
| | | | 13,715,594 | |
| | | | |
| Packaged Foods & Meats - 0.7% | | | | |
| B&G Foods, Inc. | | 299,540 | | | 2,420,283 | |
| Dole PLC | | 440,219 | | | 5,388,281 | |
Seneca Foods Corp. - Class A(a) | | 14,151 | | | 812,267 | |
| | | | 8,620,831 | |
| | | | |
The accompanying notes are an integral part of these financial statements.
12
| | |
| EA BRIDGEWAY OMNI SMALL CAP VALUE ETF |
| SCHEDULE OF INVESTMENTS (CONTINUED) |
| June 30, 2024 |
| | | | | | | | | | | | | | |
| COMMON STOCKS - 99.7% (CONTINUED) | | Shares | | Value |
| Paper & Plastic Packaging Products & Materials - 0.7% | | | | |
| Pactiv Evergreen, Inc. | | 630,941 | | | $ | 7,142,252 | |
Ranpak Holdings Corp.(a) | | 291,425 | | | 1,873,863 | |
| | | | 9,016,115 | |
| Paper Products - 0.6% | | | | |
Clearwater Paper Corp.(a) | | 101,159 | | | 4,903,177 | |
| Mercer International, Inc. | | 267,083 | | | 2,280,889 | |
| | | | 7,184,066 | |
| | | | |
| Passenger Airlines - 2.2% | | | | |
| Allegiant Travel Co. | | 76,675 | | | 3,851,385 | |
JetBlue Airways Corp.(a) | | 1,223,577 | | | 7,451,584 | |
SkyWest, Inc.(a) | | 172,777 | | | 14,179,808 | |
Sun Country Airlines Holdings, Inc.(a) | | 202,591 | | | 2,544,543 | |
| | | | 28,027,320 | |
| | | | |
| Personal Care Products - 0.1% | | | | |
| Lifevantage Corp. | | 78,859 | | | 506,275 | |
| Mannatech, Inc. | | 5,650 | | | 39,606 | |
Natural Alternatives International, Inc.(a) | | 22,848 | | | 137,545 | |
Nature's Sunshine Products, Inc.(a) | | 7,253 | | | 109,303 | |
| | | | 792,729 | |
| | | | |
| Pharmaceuticals - 0.4% | | | | |
Assertio Holdings, Inc.(a)(c) | | 409,937 | | | 508,322 | |
Innoviva, Inc.(a) | | 269,086 | | | 4,413,010 | |
JanOne, Inc.(a) | | 15,822 | | | 35,441 | |
Ocuphire Pharma, Inc.(a)(c) | | 39,305 | | | 60,137 | |
ProPhase Labs, Inc.(a) | | 3,672 | | | 15,349 | |
SCYNEXIS, Inc.(a) | | 95,254 | | | 190,508 | |
| | | | 5,222,767 | |
| | | | |
| Property & Casualty Insurance - 1.5% | | | | |
Ambac Financial Group, Inc.(a) | | 164,139 | | | 2,104,262 | |
| Donegal Group, Inc. - Class A | | 119,856 | | | 1,543,745 | |
| Employers Holdings, Inc. | | 742 | | | 31,631 | |
Hallmark Financial Services, Inc.(a)(d) | | 11,510 | | | 1 | |
Heritage Insurance Holdings, Inc.(a) | | 104,058 | | | 736,731 | |
| Investors Title Co. | | 4,385 | | | 789,870 | |
James River Group Holdings Ltd.(f) | | 107,013 | | | 827,211 | |
| Mercury General Corp. | | 9,139 | | | 485,646 | |
| Stewart Information Services Corp. | | 81,014 | | | 5,029,349 | |
| Tiptree, Inc. | | 167,953 | | | 2,769,545 | |
The accompanying notes are an integral part of these financial statements.
13
| | |
| EA BRIDGEWAY OMNI SMALL CAP VALUE ETF |
| SCHEDULE OF INVESTMENTS (CONTINUED) |
| June 30, 2024 |
| | | | | | | | | | | | | | |
| COMMON STOCKS - 99.7% (CONTINUED) | | Shares | | Value |
| Property & Casualty Insurance - 1.5% (Continued) | | | | |
| United Fire Group, Inc. | | 67,452 | | | $ | 1,449,544 | |
| Universal Insurance Holdings, Inc. | | 176,656 | | | 3,314,067 | |
| | | | 19,081,602 | |
| | | | |
| Publishing - 0.7% | | | | |
Gannett Co., Inc.(a) | | 842,288 | | | 3,882,948 | |
| Scholastic Corp. | | 142,270 | | | 5,046,317 | |
| | | | 8,929,265 | |
| | | | |
| Real Estate Development - 0.6% | | | | |
AMREP Corp.(a) | | 40,652 | | | 768,729 | |
Forestar Group, Inc.(a) | | 231,652 | | | 7,410,548 | |
| | | | 8,179,277 | |
| | | | |
| Real Estate Services - 1.1% | | | | |
Anywhere Real Estate, Inc.(a) | | 520,113 | | | 1,721,574 | |
| Newmark Group, Inc. - Class A | | 707,449 | | | 7,237,203 | |
Opendoor Technologies, Inc.(a) | | 2,497,562 | | | 4,595,514 | |
| RE/MAX Holdings, Inc. - Class A | | 54,304 | | | 439,863 | |
| | | | 13,994,154 | |
| | | | |
| Regional Banks - 23.6% | | | | |
| 1st Source Corp. | | 80,304 | | | 4,305,900 | |
| ACNB Corp. | | 44,996 | | | 1,632,005 | |
| Amalgamated Financial Corp. | | 118,224 | | | 3,239,338 | |
| AmeriServ Financial, Inc. | | 90,192 | | | 203,834 | |
| Ames National Corp. | | 7,916 | | | 162,199 | |
| Arrow Financial Corp. | | 28,744 | | | 748,781 | |
| Auburn National BanCorp, Inc. | | 10,062 | | | 184,034 | |
| Banc of California, Inc. | | 195,893 | | | 2,503,513 | |
| Bank of Marin Bancorp | | 21,572 | | | 349,251 | |
| Bank of the James Financial Group, Inc. | | 18,704 | | | 210,607 | |
| Bank7 Corp. | | 31,164 | | | 975,433 | |
| BankUnited, Inc. | | 300,205 | | | 8,787,000 | |
| Bankwell Financial Group, Inc. | | 18,704 | | | 474,520 | |
| Banner Corp. | | 88,005 | | | 4,368,568 | |
| Bar Harbor Bankshares | | 41,489 | | | 1,115,224 | |
| BayCom Corp. | | 31,187 | | | 634,655 | |
| BCB Bancorp, Inc. | | 69,503 | | | 738,817 | |
| Berkshire Hills Bancorp, Inc. | | 130,852 | | | 2,983,426 | |
Blue Ridge Bankshares, Inc.(a)(c) | | 31,245 | | | 81,549 | |
Bridgewater Bancshares, Inc.(a) | | 15,719 | | | 182,498 | |
| Brookline Bancorp, Inc. | | 230,362 | | | 1,923,523 | |
| Burke & Herbert Financial Services Corp. | | 108 | | | 5,506 | |
The accompanying notes are an integral part of these financial statements.
14
| | |
| EA BRIDGEWAY OMNI SMALL CAP VALUE ETF |
| SCHEDULE OF INVESTMENTS (CONTINUED) |
| June 30, 2024 |
| | | | | | | | | | | | | | |
| COMMON STOCKS - 99.7% (CONTINUED) | | Shares | | Value |
| Regional Banks - 23.6% (Continued) | | | | |
| Business First Bancshares, Inc. | | 71,251 | | | $ | 1,550,422 | |
| Byline Bancorp, Inc. | | 147,301 | | | 3,496,926 | |
C&F Financial Corp.(c) | | 12,862 | | | 619,948 | |
California BanCorp(a) | | 6,493 | | | 139,599 | |
| Camden National Corp. | | 36,016 | | | 1,188,528 | |
| Capital Bancorp, Inc. | | 84,688 | | | 1,736,104 | |
| Capital City Bank Group, Inc. | | 23,603 | | | 671,269 | |
| Capitol Federal Financial, Inc. | | 390,608 | | | 2,144,438 | |
Carter Bankshares, Inc.(a) | | 76,455 | | | 1,156,000 | |
| CB Financial Services, Inc. | | 30,964 | | | 701,644 | |
| Central Pacific Financial Corp. | | 81,963 | | | 1,737,616 | |
| CF Bankshares, Inc. | | 2,672 | | | 50,127 | |
| Chemung Financial Corp. | | 20,173 | | | 968,304 | |
| ChoiceOne Financial Services, Inc. | | 25,720 | | | 736,878 | |
| Citizens Community Bancorp, Inc. | | 55,284 | | | 639,636 | |
| Citizens Financial Services, Inc. | | 1,461 | | | 65,678 | |
| Citizens Holding Co. | | 4,072 | | | 31,965 | |
| Civista Bancshares, Inc. | | 47,589 | | | 737,154 | |
| CNB Financial Corp. | | 65,472 | | | 1,336,283 | |
Coastal Financial Corp.(a) | | 10,548 | | | 486,685 | |
| Codorus Valley Bancorp, Inc. | | 51,704 | | | 1,242,964 | |
| Colony Bankcorp, Inc. | | 33,736 | | | 413,266 | |
| Community Trust Bancorp, Inc. | | 61,224 | | | 2,673,040 | |
| Community West Bancshares | | 72,572 | | | 1,342,582 | |
| ConnectOne Bancorp, Inc. | | 130,004 | | | 2,455,776 | |
CrossFirst Bankshares, Inc.(a) | | 174,027 | | | 2,439,859 | |
Customers Bancorp, Inc.(a) | | 20,568 | | | 986,853 | |
| Dime Community Bancshares, Inc. | | 70,356 | | | 1,435,262 | |
| Eagle Bancorp Montana, Inc. | | 21,376 | | | 283,659 | |
| Eagle Bancorp, Inc. | | 26,960 | | | 509,544 | |
| Enterprise Bancorp, Inc. | | 55,059 | | | 1,369,868 | |
| Enterprise Financial Services Corp. | | 96,930 | | | 3,965,406 | |
| Equity Bancshares, Inc. - Class A | | 70,644 | | | 2,486,669 | |
| ESSA Bancorp, Inc. | | 45,196 | | | 794,998 | |
Evans Bancorp, Inc.(c) | | 3,751 | | | 105,441 | |
| Farmers National Banc Corp. | | 24,715 | | | 308,690 | |
| FB Financial Corp. | | 131,750 | | | 5,142,202 | |
| Financial Institutions, Inc. | | 63,100 | | | 1,219,092 | |
Finwise Bancorp(a) | | 20,376 | | | 208,039 | |
| First Bancorp, Inc. | | 6,344 | | | 157,648 | |
| First Bancorp/Southern Pines NC | | 65,696 | | | 2,097,016 | |
| First Bancshares, Inc. | | 88,376 | | | 2,296,008 | |
| First Bank Hamilton NJ | | 80,221 | | | 1,022,016 | |
The accompanying notes are an integral part of these financial statements.
15
| | |
| EA BRIDGEWAY OMNI SMALL CAP VALUE ETF |
| SCHEDULE OF INVESTMENTS (CONTINUED) |
| June 30, 2024 |
| | | | | | | | | | | | | | |
| COMMON STOCKS - 99.7% (CONTINUED) | | Shares | | Value |
| Regional Banks - 23.6% (Continued) | | | | |
| First Busey Corp. | | 182,152 | | | $ | 4,409,900 | |
| First Business Financial Services, Inc. | | 44,161 | | | 1,633,515 | |
| First Capital, Inc. | | 13,360 | | | 406,812 | |
| First Commonwealth Financial Corp. | | 198,417 | | | 2,740,139 | |
| First Community Bankshares, Inc. | | 27,992 | | | 1,031,225 | |
First Community Corp.(c) | | 35,208 | | | 607,338 | |
| First Financial Bancorp | | 276,442 | | | 6,142,541 | |
| First Financial Corp. | | 43,576 | | | 1,607,083 | |
| First Financial Northwest, Inc. | | 20,276 | | | 428,432 | |
| First Foundation, Inc. | | 49,980 | | | 327,369 | |
| First Guaranty Bancshares, Inc. | | 38,328 | | | 344,952 | |
| First Merchants Corp. | | 199,082 | | | 6,627,440 | |
| First Mid Bancshares, Inc. | | 57,166 | | | 1,879,618 | |
| First National Corp. | | 12,860 | | | 195,343 | |
| First Northwest Bancorp | | 16,132 | | | 156,319 | |
| First of Long Island Corp. | | 55,100 | | | 552,102 | |
| First Savings Financial Group, Inc. | | 30,590 | | | 544,196 | |
| First United Corp. | | 22,507 | | | 459,593 | |
| First US Bancshares, Inc. | | 6,344 | | | 58,682 | |
First Western Financial, Inc.(a) | | 20,787 | | | 353,379 | |
| Flushing Financial Corp. | | 87,622 | | | 1,152,229 | |
| FNCB Bancorp, Inc. | | 122,576 | | | 827,388 | |
| Franklin Financial Services Corp. | | 30,064 | | | 850,210 | |
| FS Bancorp, Inc. | | 32,777 | | | 1,194,722 | |
FVCBankcorp, Inc.(a) | | 51,525 | | | 562,653 | |
| Guaranty Bancshares, Inc. | | 23,253 | | | 733,400 | |
Hanmi Financial Corp.(c) | | 98,220 | | | 1,642,238 | |
| HarborOne Bancorp, Inc. | | 111,894 | | | 1,245,380 | |
| Hawthorn Bancshares, Inc. | | 25,829 | | | 511,414 | |
| Heartland Financial USA, Inc. | | 101,716 | | | 4,521,276 | |
| Heritage Commerce Corp. | | 143,095 | | | 1,244,926 | |
| Heritage Financial Corp. | | 107,366 | | | 1,935,809 | |
| Hilltop Holdings, Inc. | | 180,208 | | | 5,636,906 | |
| HMN Financial, Inc. | | 29,904 | | | 684,503 | |
| Home Bancorp, Inc. | | 28,489 | | | 1,139,845 | |
| HomeTrust Bancshares, Inc. | | 10,524 | | | 316,036 | |
| Hope Bancorp, Inc. | | 389,550 | | | 4,183,767 | |
| Horizon Bancorp, Inc. | | 105,766 | | | 1,308,325 | |
| Independent Bank Corp. | | 110,147 | | | 5,586,656 | |
| Independent Bank Corp. | | 89,479 | | | 2,415,933 | |
| Independent Bank Group, Inc. | | 100,912 | | | 4,593,514 | |
| Investar Holding Corp. | | 48,978 | | | 754,261 | |
| Kearny Financial Corp. | | 159,397 | | | 980,292 | |
The accompanying notes are an integral part of these financial statements.
16
| | |
| EA BRIDGEWAY OMNI SMALL CAP VALUE ETF |
| SCHEDULE OF INVESTMENTS (CONTINUED) |
| June 30, 2024 |
| | | | | | | | | | | | | | |
| COMMON STOCKS - 99.7% (CONTINUED) | | Shares | | Value |
| Regional Banks - 23.6% (Continued) | | | | |
| Landmark Bancorp, Inc. | | 12,943 | | | $ | 248,506 | |
| LCNB Corp. | | 53,012 | | | 737,397 | |
MainStreet Bancshares, Inc.(c) | | 39,546 | | | 701,151 | |
| Mercantile Bank Corp. | | 50,137 | | | 2,034,058 | |
| Metrocity Bankshares, Inc. | | 48,030 | | | 1,267,992 | |
Metropolitan Bank Holding Corp.(a) | | 36,376 | | | 1,531,066 | |
| Mid Penn Bancorp, Inc. | | 33,608 | | | 737,696 | |
| Middlefield Banc Corp. | | 15,732 | | | 378,355 | |
| Midland States Bancorp, Inc. | | 69,899 | | | 1,583,212 | |
| MidWestOne Financial Group, Inc. | | 57,166 | | | 1,285,663 | |
| MVB Financial Corp. | | 11,818 | | | 220,288 | |
| National Bank Holdings Corp. - Class A | | 116,730 | | | 4,558,306 | |
| Nicolet Bankshares, Inc. | | 36,203 | | | 3,006,297 | |
| Northeast Community Bancorp, Inc. | | 58,160 | | | 1,036,411 | |
| Northfield Bancorp, Inc. | | 116,783 | | | 1,107,103 | |
| Northrim BanCorp, Inc. | | 19,759 | | | 1,138,909 | |
| Northwest Bancshares, Inc. | | 326,039 | | | 3,765,750 | |
| Oak Valley Bancorp | | 36,128 | | | 902,116 | |
| OceanFirst Financial Corp. | | 153,868 | | | 2,444,963 | |
| Ohio Valley Banc Corp. | | 8,016 | | | 160,320 | |
| Old Point Financial Corp. | | 17,504 | | | 256,784 | |
| Old Second Bancorp, Inc. | | 109,419 | | | 1,620,495 | |
| OP Bancorp | | 47,768 | | | 458,095 | |
| Origin Bancorp, Inc. | | 81,197 | | | 2,575,569 | |
| Orrstown Financial Services, Inc. | | 23,712 | | | 648,760 | |
| Parke Bancorp, Inc. | | 43,188 | | | 751,471 | |
| Pathward Financial, Inc. | | 1,572 | | | 88,928 | |
| PCB Bancorp | | 49,494 | | | 805,762 | |
| Peapack-Gladstone Financial Corp. | | 46,298 | | | 1,048,650 | |
| Penns Woods Bancorp, Inc. | | 25,920 | | | 532,656 | |
| Peoples Bancorp of North Carolina, Inc. | | 28,804 | | | 841,077 | |
| Peoples Bancorp, Inc. | | 129,514 | | | 3,885,420 | |
| Peoples Financial Services Corp. | | 28,592 | | | 1,302,080 | |
Pioneer Bancorp, Inc.(a) | | 54,571 | | | 546,256 | |
| Plumas Bancorp | | 2,672 | | | 96,139 | |
Ponce Financial Group, Inc.(a) | | 10,088 | | | 92,204 | |
| Preferred Bank | | 44,089 | | | 3,328,279 | |
| Premier Financial Corp. | | 83,761 | | | 1,713,750 | |
| Primis Financial Corp. | | 51,965 | | | 544,593 | |
| Princeton Bancorp, Inc. | | 30,564 | | | 1,011,668 | |
Provident Bancorp, Inc.(a) | | 38,080 | | | 388,035 | |
| Provident Financial Holdings, Inc. | | 24,451 | | | 305,637 | |
| Provident Financial Services, Inc. | | 235,898 | | | 3,385,136 | |
The accompanying notes are an integral part of these financial statements.
17
| | |
| EA BRIDGEWAY OMNI SMALL CAP VALUE ETF |
| SCHEDULE OF INVESTMENTS (CONTINUED) |
| June 30, 2024 |
| | | | | | | | | | | | | | |
| COMMON STOCKS - 99.7% (CONTINUED) | | Shares | | Value |
| Regional Banks - 23.6% (Continued) | | | | |
| QCR Holdings, Inc. | | 60,811 | | | $ | 3,648,660 | |
| RBB Bancorp | | 50,418 | | | 948,363 | |
| Red River Bancshares, Inc. | | 1,350 | | | 64,786 | |
| Renasant Corp. | | 181,429 | | | 5,540,842 | |
| Republic Bancorp, Inc. - Class A | | 60,621 | | | 3,249,892 | |
Rhinebeck Bancorp, Inc.(a) | | 47,768 | | | 375,456 | |
| Riverview Bancorp, Inc. | | 85,326 | | | 340,451 | |
| S&T Bancorp, Inc. | | 123,668 | | | 4,129,275 | |
| Sandy Spring Bancorp, Inc. | | 106,781 | | | 2,601,185 | |
| SB Financial Group, Inc. | | 35,886 | | | 502,404 | |
| Shore Bancshares, Inc. | | 140,326 | | | 1,606,733 | |
| Sierra Bancorp | | 71,242 | | | 1,594,396 | |
| Simmons First National Corp. - Class A | | 318,757 | | | 5,603,748 | |
| SmartFinancial, Inc. | | 63,937 | | | 1,513,389 | |
| Sound Financial Bancorp, Inc. | | 13,075 | | | 574,777 | |
| South Plains Financial, Inc. | | 97,374 | | | 2,629,098 | |
Southern First Bancshares, Inc.(a) | | 13,760 | | | 402,342 | |
| Southern Missouri Bancorp, Inc. | | 18,961 | | | 853,435 | |
| Southern States Bancshares, Inc. | | 6,500 | | | 176,410 | |
| Southside Bancshares, Inc. | | 70,498 | | | 1,946,450 | |
| Stellar Bancorp, Inc. | | 132,112 | | | 3,033,292 | |
Sterling Bancorp, Inc.(a) | | 94,945 | | | 496,562 | |
Third Coast Bancshares, Inc.(a) | | 26,913 | | | 572,439 | |
| Timberland Bancorp, Inc. | | 48,076 | | | 1,302,379 | |
| Towne Bank | | 212,180 | | | 5,786,149 | |
| TriCo Bancshares | | 50,154 | | | 1,984,594 | |
| TrustCo Bank Corp. | | 67,998 | | | 1,956,302 | |
| Trustmark Corp. | | 196,219 | | | 5,894,419 | |
| Union Bankshares, Inc. | | 400 | | | 8,592 | |
| United Bancorp, Inc. | | 1,509 | | | 18,938 | |
| United Security Bancshares | | 46,789 | | | 339,220 | |
| Unity Bancorp, Inc. | | 31,695 | | | 937,221 | |
| Univest Financial Corp. | | 89,001 | | | 2,031,893 | |
| Veritex Holdings, Inc. | | 138,268 | | | 2,916,072 | |
| Virginia National Bankshares Corp. | | 1,687 | | | 55,334 | |
| WaFd, Inc. | | 247,529 | | | 7,074,379 | |
| Washington Trust Bancorp, Inc. | | 42,777 | | | 1,172,518 | |
| WesBanco, Inc. | | 176,552 | | | 4,927,566 | |
| Western New England Bancorp, Inc. | | 75,525 | | | 519,612 | |
| | | | 299,891,520 | |
| | | | |
The accompanying notes are an integral part of these financial statements.
18
| | |
| EA BRIDGEWAY OMNI SMALL CAP VALUE ETF |
| SCHEDULE OF INVESTMENTS (CONTINUED) |
| June 30, 2024 |
| | | | | | | | | | | | | | |
| COMMON STOCKS - 99.7% (CONTINUED) | | Shares | | Value |
| Reinsurance - 0.7% | | | | |
Greenlight Capital Re Ltd. - Class A(a) | | 20,088 | | | $ | 263,153 | |
SiriusPoint Ltd.(a)(e) | | 669,815 | | | 8,171,743 | |
| | | | 8,434,896 | |
| | | | |
| Research & Consulting Services - 0.2% | | | | |
Mistras Group, Inc.(a) | | 183,732 | | | 1,523,138 | |
| Resources Connection, Inc. | | 150,390 | | | 1,660,306 | |
| | | | 3,183,444 | |
| | | | |
| Restaurants - 0.3% | | | | |
| Ark Restaurants Corp. | | 18,804 | | | 244,640 | |
Biglari Holdings, Inc. - Class B(a) | | 8,716 | | | 1,685,500 | |
El Pollo Loco Holdings, Inc.(a) | | 158,561 | | | 1,793,325 | |
| Flanigan's Enterprises, Inc. | | 13,360 | | | 359,117 | |
Good Times Restaurants, Inc.(a) | | 36,008 | | | 91,100 | |
| | | | 4,173,682 | |
| | | | |
| Semiconductor Materials & Equipment - 0.5% | | | | |
AXT, Inc.(a) | | 170,891 | | | 577,611 | |
Photronics, Inc.(a) | | 235,146 | | | 5,801,052 | |
Trio-Tech International(a) | | 32,736 | | | 199,356 | |
| | | | 6,578,019 | |
| | | | |
| Semiconductors - 0.2% | | | | |
Alpha & Omega Semiconductor Ltd.(a)(e) | | 38,293 | | | 1,431,009 | |
Magnachip Semiconductor Corp.(a) | | 125,949 | | | 613,372 | |
| | | | 2,044,381 | |
| | | | |
| Specialized Finance - 0.4% | | | | |
Acacia Research Corp.(a) | | 185,796 | | | 930,838 | |
Banco Latinoamericano de Comercio Exterior S(e) | | 131,827 | | | 3,911,307 | |
SWK Holdings Corp.(a) | | 51,880 | | | 881,441 | |
| | | | 5,723,586 | |
| | | | |
| Specialty Chemicals - 0.3% | | | | |
Alto Ingredients, Inc.(a) | | 229,649 | | | 331,843 | |
Rayonier Advanced Materials, Inc.(a) | | 278,538 | | | 1,515,247 | |
| Valhi, Inc. | | 126,129 | | | 2,248,880 | |
| | | | 4,095,970 | |
| | | | |
| Steel - 2.4% | | | | |
Ascent Industries Co.(a) | | 40,500 | | | 395,280 | |
| Friedman Industries, Inc. | | 33,136 | | | 500,353 | |
Metallus, Inc.(a) | | 228,215 | | | 4,625,918 | |
The accompanying notes are an integral part of these financial statements.
19
| | |
| EA BRIDGEWAY OMNI SMALL CAP VALUE ETF |
| SCHEDULE OF INVESTMENTS (CONTINUED) |
| June 30, 2024 |
| | | | | | | | | | | | | | |
| COMMON STOCKS - 99.7% (CONTINUED) | | Shares | | Value |
| Steel - 2.4% | | | | |
| Olympic Steel, Inc. | | 54,923 | | | $ | 2,462,198 | |
| Radius Recycling, Inc. - Class A | | 120,452 | | | 1,839,302 | |
Ramaco Resources, Inc.(a) | | 109,255 | | | 1,360,225 | |
| Ramaco Resources, Inc. - Class B | | 13,574 | | | 147,414 | |
| Ryerson Holding Corp. | | 182,985 | | | 3,568,207 | |
| SunCoke Energy, Inc. | | 438,585 | | | 4,298,133 | |
Universal Stainless & Alloy Products, Inc.(a) | | 33,536 | | | 918,216 | |
| Warrior Met Coal, Inc. | | 167,614 | | | 10,521,131 | |
| | | | 30,636,377 | |
| | | | |
| Systems Software - 0.1% | | | | |
| Adeia, Inc. | | 125,616 | | | 1,405,015 | |
| | | | |
| Technology Distributors - 0.4% | | | | |
ScanSource, Inc.(a) | | 123,147 | | | 5,456,644 | |
| | | | |
| Technology Hardware, Storage & Peripherals - 0.6% | | | | |
Eastman Kodak Co.(a) | | 325,040 | | | 1,748,715 | |
| Xerox Holdings Corp. | | 531,994 | | | 6,181,770 | |
| | | | 7,930,485 | |
| | | | |
Textiles - 0.0%(b) | | | | |
| Crown Crafts, Inc. | | 40,802 | | | 213,395 | |
Unifi, Inc.(a) | | 34,562 | | | 203,570 | |
| | | | 416,965 | |
| | | | |
| Trading Companies & Distributors - 1.1% | | | | |
BlueLinx Holdings, Inc.(a) | | 42,690 | | | 3,974,012 | |
DNOW, Inc.(a) | | 508,458 | | | 6,981,129 | |
Hudson Technologies, Inc.(a) | | 170 | | | 1,494 | |
Titan Machinery, Inc.(a) | | 77,788 | | | 1,236,829 | |
| Willis Lease Finance Corp. | | 23,682 | | | 1,641,163 | |
| | | | 13,834,627 | |
| | | | |
| Transaction & Payment Processing Services - 0.6% | | | | |
BM Technologies, Inc.(a) | | 23,640 | | | 53,190 | |
Paysafe Ltd.(a) | | 226,388 | | | 4,002,540 | |
Repay Holdings Corp.(a) | | 336,951 | | | 3,558,202 | |
| | | | 7,613,932 | |
| | | | |
| Wireless Telecommunication Services - 1.7% | | | | |
| Telephone and Data Systems, Inc. | | 493,655 | | | 10,233,468 | |
The accompanying notes are an integral part of these financial statements.
20
| | |
| EA BRIDGEWAY OMNI SMALL CAP VALUE ETF |
| SCHEDULE OF INVESTMENTS (CONTINUED) |
| June 30, 2024 |
| | | | | | | | | | | | | | |
| COMMON STOCKS - 99.7% (CONTINUED) | | Shares | | Value |
| Wireless Telecommunication Services - 1.7% (Continued) | | | | |
United States Cellular Corp.(a) | | 205,097 | | | $ | 11,448,515 | |
| | | | 21,681,983 | |
TOTAL COMMON STOCKS (Cost $1,126,036,342) | | | | 1,269,702,953 | |
| | | | |
CLOSED END FUNDS - 0.0%(b) | | | | |
| Logan Ridge Finance Corp. | | 13,460 | | | 302,716 | |
| Medallion Financial Corp. | | 15,456 | | | 118,702 | |
TOTAL CLOSED END FUNDS (Cost $441,655) | | | | 421,418 | |
| | | | |
CONTINGENT VALUE RIGHTS - 0.0%(b) | | | | |
Pineapple Holdings(a)(d) | | 3,750 | | | 1,387 | |
Resolute Forest Products(a)(d) | | 236,000 | | | 68,440 | |
TOTAL CONTINGENT VALUE RIGHTS (Cost $0) | | | | 69,827 | |
| | | | |
| REAL ESTATE INVESTMENT TRUSTS - 0.1% | | | | |
| AFC Gamma, Inc. | | 55,284 | | | 674,465 | |
Transcontinental Realty Investors, Inc.(a) | | 1,400 | | | 38,822 | |
TOTAL REAL ESTATE INVESTMENT TRUSTS (Cost $871,163) | | | | 713,287 | |
| | | | |
| | | | |
WARRANTS - 0.0%(b) | | Contracts | | |
Oil & Gas Drilling - 0.0%(b) | | | | |
Nabors Industries Ltd., Expires 06/11/2026, Exercise Price $166.67(a)(e) | | 5,200 | | | 34,320 | |
TOTAL WARRANTS (Cost $0) | | | | 34,320 | |
| | | | |
PREFERRED STOCKS - 0.0%(b) | | Shares | | |
Air Freight & Logistics - 0.0%(b) | | | | |
| Air T Funding, 8.00%, 06/07/2049 | | 529 | | | 8,940 | |
TOTAL PREFERRED STOCKS (Cost $11,003) | | | | 8,940 | |
| | | | |
| SHORT-TERM INVESTMENTS - 1.4% | | | | |
| Investments Purchased with Proceeds from Securities Lending - 1.3% | | | | |
First American Government Obligations Fund - Class X, 5.23%(f) | | 15,764,056 | | | 15,764,056 | |
| | | | |
| Money Market Funds - 0.1% | | | | |
First American Government Obligations Fund - Class X, 5.23%(f) | | 1,566,498 | | | 1,566,498 | |
TOTAL SHORT-TERM INVESTMENTS (Cost $17,330,554) | | | | 17,330,554 | |
| | | | |
TOTAL INVESTMENTS - 101.2% (Cost $1,144,690,717) | | | | $ | 1,288,281,299 | |
| Liabilities in Excess of Other Assets - (1.2)% | | | | (15,323,439) | |
| TOTAL NET ASSETS - 100.0% | | | | $ | 1,272,957,860 | |
The accompanying notes are an integral part of these financial statements.
21
| | |
| EA BRIDGEWAY OMNI SMALL CAP VALUE ETF |
| SCHEDULE OF INVESTMENTS (CONTINUED) |
| June 30, 2024 |
Percentages are stated as a percent of net assets.
AMBAC American Municipal Bond Assurance Corporation
PLC - Public Limited Company
SA - Sociedad Anónima
| | | | | | | | |
| (a) | | Non-income producing security. |
| (b) | | Represents less than 0.05% of net assets. |
| (c) | | All or a portion of this security is on loan as of June 30, 2024. The total market value of these securities was $14,817,410 which represented 1.2% of net assets. |
| (d) | | Fair value determined using significant unobservable inputs in accordance with procedures established by and under the supervision of the Adviser, acting as Valuation Designee. These securities represented $69,828 or 0.0% of net assets as of June 30, 2024. |
| (e) | | Foreign issued security. |
| (f) | | The rate shown represents the 7-day effective yield as of June 30, 2024. |
The Global Industry Classification Standard (GICS®) was developed by and/or is the exclusive property of MSCI, Inc. and Standard & Poor’s Financial Services LLC (“S&P”). GICS is a service mark of MSCI, Inc. and S&P and has been licensed for use by U.S. Bank Global Fund Services.
(b) Not applicable
The accompanying notes are an integral part of these financial statements.
22
Item 7. Financial Statements and Financial Highlights for Open-End Management Investment
Companies.
STATEMENT OF ASSETS AND LIABILITIES
June 30, 2024
| | | | | | | | | | | |
| EA Bridgeway Blue Chip ETF | | EA Bridgeway Omni Small-Cap Value ETF |
| Assets: | | | |
Investments in securities, at value (See Note 2) (1) | $ | 181,288,730 | | | $ | 1,288,281,299 | |
| Cash | — | | | 3,810 | |
| Receivable for investments sold | 5,597,875 | | | — | |
| Receivable for fund shares sold | — | | | 1,530,810 | |
| Dividends and interest receivable | 60,670 | | | 859,005 | |
| Securities lending income receivable (See Note 5) | — | | | 22,369 | |
| ETF variable fee receivable | — | | | 59 | |
| Total assets | 186,947,275 | | | 1,290,697,352 | |
| | | |
| Liabilities: | | | |
| Due to securities lending agent (See Note 5) | — | | | 15,764,056 | |
| Payable for investment securities purchased | 5,555,552 | | | 1,504,710 | |
| Accrued investment advisory fees (See Note 4) | 21,716 | | | 470,726 | |
| Total liabilities | 5,577,268 | | | 17,739,492 | |
| Net Assets | $ | 181,370,007 | | | $ | 1,272,957,860 | |
| | | | |
| Net Assets Consist of: | | | |
| Paid-in capital | $ | 111,671,853 | | | $ | 1,138,975,337 | |
| Total distributable earnings (accumulated deficit) | 69,698,154 | | | 133,982,523 | |
| Net Assets: | $ | 181,370,007 | | | $ | 1,272,957,860 | |
| | | |
| Calculation of Net Asset Value Per Share: | | | |
| Net Assets | $ | 181,370,007 | | | $ | 1,272,957,860 | |
Shares Outstanding (unlimited shares of beneficial interest
authorized, no par value) | 15,031,288 | | | 62,366,561 | |
| Net Asset Value per Share | $ | 12.07 | | | $ | 20.41 | |
| | | |
| Cost of Investments in Securities | $ | 111,336,215 | | | $ | 1,144,690,717 | |
| | | |
(1) Includes loaned securities with a value of | $ | — | | | $ | 14,817,410 | |
The accompanying notes are an integral part of these financial statements.
1
STATEMENT OF OPERATIONS
For the Year Ended June 30, 2024
| | | | | | | | | | | |
| EA Bridgeway Blue Chip ETF | | EA Bridgeway Omni Small-Cap Value ETF |
| Investment Income: | | | |
Dividend income
(net of foreign withholding tax of $0 and $25,085, respectively) | $ | 2,575,935 | | | $ | 23,251,254 | |
| Interest income | 21,607 | | | 93,408 | |
| Securities lending income, net (See Note 5) | — | | | 251,210 | |
| Total investment income | 2,597,542 | | | 23,595,872 | |
| | | |
| Expenses: | | | |
| Investment advisory fees (See Note 4) | 204,867 | | | 4,812,357 | |
| Net expenses | 204,867 | | | 4,812,357 | |
| | | |
| Net Investment Income (Loss) | 2,392,675 | | | 18,783,515 | |
| | | |
| Realized and Unrealized Gain (Loss) on Investments: | | | |
| Net realized gain (loss) on: | | | |
| Investments | 25,102,160 | | | 114,546,157 | |
| 25,102,160 | | | 114,546,157 | |
| Net change in unrealized appreciation (depreciation) on: | | | |
| Investments | 3,736,968 | | | 11,727,221 | |
| 3,736,968 | | | 11,727,221 | |
| Net realized and unrealized gain (loss) on investments: | 28,839,128 | | | 126,273,378 | |
| Net Increase (Decrease) in Net Assets Resulting from Operations | $ | 31,231,803 | | | $ | 145,056,893 | |
The accompanying notes are an integral part of these financial statements.
2
STATEMENT OF CHANGES IN NET ASSETS
| | | | | | | | | | | | | | | | | | | | | | | |
| EA Bridgeway
Blue Chip ETF | | EA Bridgeway
Omni Small-Cap Value ETF |
| For the Year Ended
June 30, 2024 | | For the Year Ended June 30, 2023 ⁽¹⁾ | | For the Year Ended
June 30, 2024 | | For the Year Ended June 30, 2023 ⁽²⁾ |
| Increase (Decrease) in Net Assets from: | | | | | | | |
| Operations: | | | | | | | |
| Net investment income (loss) | $ | 2,392,675 | | | $ | 3,658,154 | | | $ | 18,783,515 | | | $ | 15,821,551 | |
| Net realized gain (loss) on investments | 25,102,160 | | | 124,406,295 | | | 114,546,157 | | | 53,987,821 | |
| Net change in unrealized appreciation (depreciation) on investments | 3,736,968 | | | (99,720,655) | | | 11,727,221 | | | (35,972,003) | |
| Net increase (decrease) in net assets resulting from operations | 31,231,803 | | | 28,343,794 | | | 145,056,893 | | | 33,837,369 | |
| | | | | | | | |
| Distributions to Shareholders: | | | | | | | |
| Distributable earnings | (2,206,508) | | | (92,657,053) | | | (15,734,014) | | | (99,730,578) | |
| Total distributions to shareholders | (2,206,508) | | | (92,657,053) | | | (15,734,014) | | | (99,730,578) | |
| | | | | | | | |
| Capital Share Transactions: | | | | | | | |
| Proceeds from shares sold | 68,428,906 | | | 56,730,584 | | | 627,965,070 | | | 281,727,056 | |
| Reinvestment of distributions | — | | | 45,451,187 | | | — | | | 99,141,350 | |
| Payments for shares redeemed | (40,348,930) | | | (239,844,160) | | | (269,441,835) | | | (344,419,140) | |
| Transaction fees (See Note 1) | 13 | | | 31 | | | 522 | | | 57 | |
| Net increase (decrease) in net assets derived from net change in capital share transactions | 28,079,989 | | | (137,662,358) | | | 358,523,757 | | | 36,449,323 | |
| | | | | | | |
| Net Increase (Decrease) in Net Assets | 57,105,284 | | | (201,975,617) | | | 487,846,636 | | | (29,443,886) | |
| | | | | | | |
| Net Assets: | | | | | | | |
| Beginning of period | 124,264,723 | | | 326,240,340 | | | 785,111,224 | | | 814,555,110 | |
| End of period | $ | 181,370,007 | | | $ | 124,264,723 | | | $ | 1,272,957,860 | | | $ | 785,111,224 | |
| | | | | | | |
| Changes in Shares Outstanding: | | | | | | | |
| Shares outstanding, beginning of period | 12,631,288 | | | 26,851,745 | | | 44,066,561 | | | 41,941,392 | |
| Shares sold | 6,200,000 | | | 6,582,706 | | | 32,150,000 | | | 15,464,678 | |
| Shares reinvested | — | | | 4,239,850 | | | — | | | 5,489,554 | |
| Shares repurchased | (3,800,000) | | | (25,043,013) | | | (13,850,000) | | | (18,829,063) | |
| Shares outstanding, end of period | 15,031,288 | | | 12,631,288 | | | 62,366,561 | | | 44,066,561 | |
| | |
| (1) The Fund acquired all of the assets and liabilities of the Bridgeway Blue Chip Fund (“Predecessor Fund”) in a reorganization on October 14, 2022. The Predecessor Fund’s Class N Shares’ performance and financial history have been adopted by the Fund and will be used going forward. As a result, the information prior to October 14, 2022, will be used going forward. As a result, the information reflects that of the Predecessor Fund’s Class N Shares. |
| (2) The Fund acquired all of the assets and liabilities of the Bridgeway Omni Tax Managed Small-Cap Value Fund (“Predecessor Fund”) in a reorganization on March 10, 2023. The Predecessor Fund’s Class N Shares’ performance and financial history have been adopted by the Fund and will be used going forward. As a result, the information prior to March 10, 2023, reflects that of the Predecessor Fund’s Class N Shares. |
The accompanying notes are an integral part of these financial statements.
3
FINANCIAL HIGHLIGHTS
| | | | | | | | | | | | | | | | | | | | | | | | | | | | | | | | | | | | | | | | | | | | | | | | | | | | | | | | | | | | | | | | | | | | | | | | | | | | | | | | | | | |
| Net Asset Value, Beginning of Period | | Net Investment Income (Loss)(1) | | Net Realized and Unrealized Gain (Loss) on Investments | | Net Increase (Decrease) in Net Asset Value Resulting from Operations | | Distributions from Net Investment Income | | Distributions from Net Realized Gain | | Total Distributions | | Net Asset Value, End of Period | | Total Return(2) | | Net Assets, End of Period (000's) | | Net Expenses(3) | | Gross Expenses(3) | | Net Investment Income (Loss)(3) | | Portfolio Turnover Rate(5) |
| EA Bridgeway Blue Chip ETF |
| Year Ended June 30, 2024 | $9.84 | | 0.19 | | 2.21 | | 2.40 | | (0.17) | | — | | (0.17) | | $12.07 | | 24.75% | | $181,370 | | 0.15% | | 0.15% | | 1.75% | | 6% |
Year Ended June 30, 2023(6) | $12.15 | | 0.20 | | 1.84 | | 2.04 | | (0.26) | | (4.09) | | (4.35) | | $9.84 | | 24.50% | | $124,265 | | 0.15% | | 0.22% | | 1.90% | | 12% |
| Year Ended June 30, 2022 | $15.84 | | 0.27 | | (1.34) | | (1.07) | | (0.30) | | (2.32) | | (2.62) | | $12.15 | | -9.32% | | $326,240 | | 0.15% | | 0.23% | | 1.81% | | 24% |
| Year Ended June 30, 2021 | $13.96 | | 0.31 | | 4.73 | | 5.04 | | (0.35) | | (2.81) | | (3.16) | | $15.84 | | 39.75% | | $432,186 | | 0.15% | | 0.24% | | 2.07% | | 7% |
| Year Ended June 30, 2020 | $14.99 | | 0.33 | | 0.28 | | 0.61 | | (0.32) | | (1.32) | | (1.64) | | $13.96 | | 3.49% | | $477,400 | | 0.15% | | 0.27% | | 2.28% | | 15% |
| | | | | | | | | | | | | | | | | | | | | | | | | | | |
| | | | | | | | | | | | | | | | | | | | | | | | | | | |
| EA Bridgeway Omni Small-Cap Value ETF |
| Year Ended June 30, 2024 | $17.82 | | 0.36 | | 2.53 | | 2.89 | | (0.30) | | — | | (0.30) | | $20.41 | | 16.27% | | $1,272,958 | | 0.47% | | 0.47% | | 1.82% | | 6% |
Year Ended June 30, 2023(7) | $19.42 | | 0.37 | | 0.53 | | 0.90 | | (0.45) | | (2.05) | | (2.50) | | $17.82 | | 4.41% | | $785,111 | | 0.47% | | 0.62% | | 1.93% | | 45% |
| Year Ended June 30, 2022 | $20.89 | | 0.27 | | (1.54) | | (1.27) | | (0.20) | | — | | (0.20) | | $19.42 | | -6.17% | | $814,555 | | 0.47% | | 0.67% | | 1.26% | | 30% |
| Year Ended June 30, 2021 | $10.92 | | 0.19 | | 9.95 | | 10.14 | | (0.17) | | — | | (0.17) | | $20.89 | | 93.49% | | $853,248 | | 0.47% | | 0.69% | | 1.18% | | 26% |
| Year Ended June 30, 2020 | $14.43 | | 0.19 | | (3.63) | | (3.44) | | (0.07) | | — | | (0.07) | | $10.92 | | -23.98% | | $427,515 | | 0.55%(4) | | 0.74%(4) | | 1.40% | | 63% |
| | | | | | | | | | | | | | | | | | | | | | | | | | | |
| | | | | |
| (1) | Net investment income per share represents net investment income divided by the daily average shares of beneficial interest outstanding throughout the period. |
| (2) | All returns reflect reinvested dividends, if any, but do not reflect the impact of taxes. Total return for a period of less than one year is not annualized. |
| (3) | Net expenses include effects of any reimbursement or recoupment. |
| (4) | Includes interest expense of 0.01%. |
| (5) | For periods of less than one year, portfolio turnover is not annualized and is calculated without regard to short-term securities having a maturity of less than one year. Excludes the impact of in-kind transactions. |
| (6) | EA Bridgeway Blue Chip ETF (the “Fund”) acquired all of the assets and liabilities of the Bridgeway Blue Chip Fund (“Predecessor Fund”) in a reorganization on October 14, 2022. Market price returns are calculated using the official closing price listing exchange as of the time that the Fund’s NAV of the Fund on the is calculated. Prior to the Fund’s listing on October 14, 2022, the NAV performance of the Class N Shares of the Predecessor Fund are used as proxy market price returns. |
| (7) | EA Bridgeway Omni Small-Cap Value ETF (the “Fund”) acquired all of the assets and liabilities of the Bridgeway Omni Tax Managed Small-Cap Value Fund (“Predecessor Fund”) in a reorganization on March 10, 2023. Market price returns are calculated using the official closing price listing exchange as of the time that the Fund’s NAV of the Fund on the is calculated. Prior to the Fund’s listing on March 10, 2023, the NAV performance of the Class N Shares of the Predecessor Fund are used as proxy market price returns. |
The accompanying notes are an integral part of these financial statements.
4
BRIDGEWAY ETFs
NOTES TO THE FINANCIAL STATEMENTS
June 30, 2024
NOTE 1 – ORGANIZATION
EA Bridgeway Blue Chip ETF and EA Bridgeway Omni Small-Cap Value ETF (the “Funds”) are each a series of the EA Series Trust (the “Trust”), which was organized as a Delaware statutory trust on October 11, 2013. The Trust is registered with the Securities and Exchange Commission (“SEC”) under the Investment Company Act of 1940, as amended (the “1940 Act”), as an open-end management investment company and the offering of the Fund’s shares (“Shares”) is registered under the Securities Act of 1933, as amended (the “Securities Act”). The Funds are considered diversified under the 1940 Act. Each Fund qualifies as an investment company as defined in the Financial Accounting Standards Codification Topic 946-Financial Services-Investment Companies. EA Bridgeway Blue Chip ETF’s investment objective is to seek long-term total return on capital, primarily through capital appreciation, but also some income. EA Bridgeway Omni Small-Cap Value ETF’s investment objective is to seek long-term total return on capital, primarily through capital appreciation.
EA Bridgeway Blue Chip ETF converted from an open-end mutual fund to an exchange-traded fund (“ETF”) on October 14, 2022. EA Bridgeway Blue Chip ETF is the successor to the Bridgeway Blue Chip Fund (the “Predecessor Fund”), a series of Bridgeway Funds, Inc., which had the same investment objective as the Fund. Bridgeway Capital Management, LLC (the “Sub-Adviser”), the sub-adviser to the Fund, was the adviser to the Predecessor Fund. Effective as of prior to the open of business on October 14, 2022, the assets and liabilities of the Predecessor Fund were transferred to the Fund in exchange for shares of the Fund. For financial reporting purposes, assets received and shares issued by the Fund were recorded at fair value; however, for tax purposes the cost basis of the investments received from the Predecessor Fund was carried forward to align ongoing reporting of the Fund’s realized and in realized gains and losses with amounts distributable to shareholders for tax purposes. Costs incurred by the Fund in connection with the reorganization were paid by the Sub-Adviser. The fiscal year end of the Predecessor Fund and the Fund is June 30. As of October 14, 2022, the net assets of the Predecessor Fund were $194,242,031, including $102,508,842 of net unrealized appreciation from a tax basis, all of which were transferred into the Fund at the closing of the reorganization. The transfer of net assets resulted in the creation of 19,806,290 shares of the Fund and an initial NAV per share of $9.81 at the closing of the reorganization.
EA Bridgeway Omni Small-Cap Value ETF converted from an open-end mutual fund to an ETF on March 10, 2023. EA Bridgeway Omni Small-Cap Value ETF is the successor to the Bridgeway Omni Tax Managed Small-Cap Value Fund (the “Predecessor Fund”), a series of Bridgeway Funds, Inc., which had the same investment objective as the Fund. Bridgeway Capital Management, LLC (the “Sub-Adviser”), the sub-adviser to the Fund, was the adviser to the Predecessor Fund. Effective as of prior to the open of business on March 10, 2023, the assets and liabilities of the Predecessor Fund were transferred to the Fund in exchange for shares of the Fund. For financial reporting purposes, assets received and shares issued by the Fund were recorded at fair value; however, for tax purposes the cost basis of the investments received from the Predecessor Fund was carried forward to align ongoing reporting of the Fund’s realized and in realized gains and losses with amounts distributable to shareholders for tax purposes. Costs incurred by the Fund in connection with the reorganization were paid by the Sub-Adviser. The fiscal year end of the Predecessor Fund and the Fund is June 30. As of March 10, 2023, the net assets of the Predecessor Fund were $814,020,096, including $159,235,124 of net unrealized appreciation from a tax basis, all of which were transferred into the Fund at the closing of the reorganization. The transfer of net assets resulted in the creation of 44,891,561 shares of the Fund and an initial NAV per share of $18.13 at the closing of the reorganization.
The primary purpose of the reorganizations into the Trust were to provide shareholders the continued benefit of stable and highly regulated investment vehicles in addition to the benefits of tax efficiency.
The reorganizations were accomplished by a tax-free exchange of shares. Fees and expenses incurred to affect the reorganizations were borne by the Sub-Adviser. The Funds are expected to experience the same or lower overall expenses as compared to their respective Predecessor Fund because the Funds have a unitary fee structure under which both operating expenses and management fees are paid.
The Reorganizations did not result in a material change to either Predecessor Fund’s investment portfolio as compared to that of the corresponding Fund. There are no material differences in accounting policies of either Predecessor Fund as compared to that of the corresponding Fund. Neither Fund purchased or sold securities following the Reorganization for purposes of realigning their investment portfolio. Accordingly, the acquisition of the Predecessor Funds did not affect either Fund’s portfolio turnover ratio for the period ended June 30 2023.
BRIDGEWAY ETFs
NOTES TO THE FINANCIAL STATEMENTS (CONTINUED)
June 30, 2024
Shares of EA Bridgeway Blue Chip ETF are listed and traded on NYSE Arca, Inc., and shares of EA Bridgeway Omni Small-Cap Value ETF are listed on the The Nasdaq Stock Market LLC. Market prices for the shares may be different from their net asset value (“NAV”). Each Fund issues and redeems shares on a continuous basis at NAV only in blocks of 25,000 shares, called “Creation Units.” Creation Units are issued and redeemed principally in-kind for securities included in a specified universe. Once created, shares generally trade in the secondary market at market prices that change throughout the day in share amounts less than a Creation Unit. Except when aggregated in Creation Units, shares are not redeemable securities of the Fund. Shares of the Fund may only be purchased or redeemed by certain financial institutions (“Authorized Participants”). An Authorized Participant is a participant of a clearing agency registered with the SEC, which has a written agreement with the Trust or one of its service providers that allows the authorized participant to place orders for the purchase and redemption of creation units. Most retail investors do not qualify as Authorized Participants nor have the resources to buy and sell whole Creation Units. Therefore, they are unable to purchase or redeem the shares directly from a Fund. Rather, most retail investors may purchase Shares in the secondary market with the assistance of a broker and are subject to customary brokerage commissions or fees.
Authorized Participants may be required to pay a transaction fee to compensate the Trust or its custodian for costs incurred in connection with creation and redemption transactions. The transaction fee, which is payable to the Trust’s custodian, typically applies to in-kind purchases of the Fund effected through the Clearing Process on any Business Day, regardless of the number of Creation Units purchased or redeemed that day (assuming, in the case of multiple orders on the same day, that the orders are received at or near the same time). A transaction fee of up to four times the standard fee may apply to creation and redemption transactions that occur outside the Clearing Process. Certain Fund Deposits consisting of cash-in-lieu or Cash Value may be subject to a variable charge, which is payable to the relevant Fund, of up to 2.00% of the value of the order in addition to the transaction fee. The transaction fee may be waived on certain orders if the Trust’s custodian has determined to waive the transaction costs associated with the order or another party, such as the Adviser, has agreed to pay such fee. A Fund may determine to waive the variable charge on certain orders when such waiver is determined to be in the best interests of Fund shareholders. The Funds may adjust the transaction fee from time to time. The transaction fee is based, in part, on the number of holdings in a Fund’s portfolio and may be adjusted on a quarterly basis if the number of holdings change. Further, investors who, directly or indirectly, use the services of a broker or other intermediary to compose a Creation Unit in addition to an Authorized Participant to effect a transaction in Creation Units may be charged an additional fee by such intermediary for such services. Transaction fees received by the Fund, if any, are displayed in the Capital Share Transactions sections of the Statements of Changes in Net Assets.
Because, among other things, the Funds impose transaction fees on purchases and redemptions of Shares to cover the custodial and other costs incurred by the Funds in effecting trades, the Board determined that it is not necessary to adopt policies and procedures to detect and deter market timing of the Funds’ Shares.
NOTE 2 – SIGNIFICANT ACCOUNTING POLICIES
The following is a summary of significant accounting policies consistently followed by the Fund. These policies are in conformity with accounting principles generally accepted in the United States of America (“GAAP”).
A.Security Valuation. Equity securities that are traded on a national securities exchange, except those listed on the NASDAQ Global Market® (“NASDAQ”) are valued at the last reported sale price on the exchange on which the security is principally traded. Securities traded on NASDAQ will be valued at the NASDAQ Official Closing Price (“NOCP”). If, on a particular day, an exchange-traded or NASDAQ security does not trade, then the most recent quoted bid for exchange-traded or the mean between the most recent quoted bid and ask price for NASDAQ securities will be used. Equity securities that are not traded on a listed exchange are generally valued at the last sale price in the over-the-counter market. If a non-exchange traded security does not trade on a particular day, then the mean between the last quoted closing bid and asked price will be used. Prices denominated in foreign currencies are converted to U.S. dollar equivalents at the current exchange rate, which approximates fair value. Redeemable securities issued by open-end investment companies are valued at the investment company’s applicable net asset value, with the exception of exchange-traded open-end investment companies which are priced as equity securities. Fair values for long-term debt securities, including asset-backed securities (“ABS”), collateralized loan obligations (“CLO”), collateralized mortgage obligations (“CMO”), corporate obligations, whole loans, and mortgage-backed securities (“MBS”) are normally determined on the basis of valuations provided by independent pricing services.
BRIDGEWAY ETFs
NOTES TO THE FINANCIAL STATEMENTS (CONTINUED)
June 30, 2024
Vendors typically value such securities based on one or more inputs, including but not limited to, benchmark yields, transactions, bids, offers, quotations from dealers and trading systems, new issues, spreads and other relationships observed in the markets among comparable securities; and pricing models such as yield measurers calculated using factors such as cash flows, financial or collateral performance and other reference data. In addition to these inputs, MBS and ABS may utilize cash flows, prepayment information, default rates, delinquency and loss assumptions, collateral characteristics, credit enhancements and specific deal information. Reverse repurchase agreements are priced at their acquisition cost, and assessed for credit adjustments, which represents fair value. Futures contracts are carried at fair value using the primary exchange’s closing (settlement) price.
Subject to its oversight, the Trust’s Board of Trustees (the “Board”) has delegated primary responsibility for determining or causing to be determined the value of the Fund’s investments to Empowered Funds, LLC dba EA Advisers (the “Adviser”), pursuant to the Trust’s valuation policy and procedures, which have been adopted by the Trust and approved by the Board. In accordance with Rule 2a-5 under the 1940 Act, the Board designated the Adviser as the “valuation designee” of the Funds. If the Adviser, as valuation designee, determines that reliable market quotations are not readily available for an investment, the investment is valued at fair value as determined in good faith by the Adviser in accordance with the Trust’s fair valuation policy and procedures. The Adviser will provide the Board with periodic reports, no less frequently than quarterly, that discuss the functioning of the valuation process, if applicable, and that identify issues and valuation problems that have arisen, if any. As appropriate, the Adviser and the Board will review any securities valued by the Adviser in accordance with the Trust’s valuation policies during these periodic reports. The use of fair value pricing by the Funds may cause the net asset value of its shares to differ significantly from the net asset value that would be calculated without regard to such considerations. As of June 30, 2024, EA Bridgeway Blue Chip ETF did not hold any securities that required fair valuation due to unobservable inputs while EA Bridgeway Omni Small-Cap Value ETF did hold securities that required fair valuation due to unobservable inputs.
As described above, the Funds may use various methods to measure the fair value of their investments on a recurring basis. GAAP establishes a hierarchy that prioritizes inputs to valuation methods. The three levels of inputs are:
Level 1 – Unadjusted quoted prices in active markets for identical assets or liabilities that the Funds has the ability to access.
Level 2 – Observable inputs other than quoted prices included in Level 1 that are observable for the asset or liability, either directly or indirectly. These inputs may include quoted prices for the identical instrument on an inactive market, prices for similar instruments, interest rates, prepayment speeds, credit risk, yield curves, default rates and similar data.
Level 3 – Unobservable inputs for the asset or liability, to the extent relevant observable inputs are not available; representing each Fund’s own assumptions about the assumptions a market participant would use in valuing the asset or liability and would be based on the best information available.
The availability of observable inputs can vary from security to security and is affected by a wide variety of factors, including, for example, the type of security, whether the security is new and not yet established in the marketplace, the liquidity of markets, and other characteristics particular to the security. To the extent that valuation is based on models or inputs that are less observable or unobservable in the market, the determination of fair value requires more judgment. Accordingly, the degree of judgment exercised in determining fair value is greatest for instruments categorized in Level 3.
The inputs used to measure fair value may fall into different levels of the fair value hierarchy. In such cases, for disclosure purposes, the level in the fair value hierarchy within which the fair value measurement falls in its entirety, is determined based on the lowest level input that is significant to the fair value measurement in its entirety.
BRIDGEWAY ETFs
NOTES TO THE FINANCIAL STATEMENTS (CONTINUED)
June 30, 2024
The following is a summary of the fair value classification of each Fund’s investments as of June 30, 2024:
| | | | | | | | | | | | | | | | | | | | | | | | | | |
| DESCRIPTION | | LEVEL 1 | | LEVEL 2 | | LEVEL 3 | | TOTAL |
| EA Bridgeway Blue Chip ETF |
| Assets | | | | | | | | |
| Common Stocks | | $ | 180,833,315 | | | $ | — | | | $ | — | | | $ | 180,833,315 | |
| Money Market Funds | | 455,415 | | | — | | | — | | | 455,415 | |
| Total Investments in Securities | | $ | 181,288,730 | | | $ | — | | | $ | — | | | $ | 181,288,730 | |
| | | | | | | | | | | | | | | | | | | | | | | | | | |
| DESCRIPTION | | LEVEL 1 | | LEVEL 2 | | LEVEL 3 | | TOTAL |
| EA Bridgeway Omni Small-Cap Value ETF |
| Assets | | | | | | | | |
| Common Stocks | | $ | 1,269,333,250 | | | $ | 369,702 | | | $ | 1 | | | $ | 1,269,702,953 | |
| Real Estate Investment Trusts | | 713,287 | | | — | | | — | | | 713,287 | |
| Closed End Funds | | 421,418 | | | — | | | — | | | 421,418 | |
| Contingent Value Rights | | — | | | — | | | 69,827 | | | 69,827 | |
| Warrants | | 34,320 | | | — | | | — | | | 34,320 | |
| Preferred Stocks | | 8,940 | | | — | | | — | | | 8,940 | |
| Investments Purchased with Proceeds from Securities Lending | | 15,764,056 | | | — | | | — | | | 15,764,056 | |
| Money Market Funds | | 1,566,498 | | | — | | | — | | | 1,566,498 | |
| Total Investments in Securities | | $ | 1,287,841,769 | | | $ | 369,702 | | | $ | 69,828 | | | $ | 1,288,281,299 | |
Refer to the Schedules of Investments for additional information.
During the fiscal year ended June 30, 2024, the EA Bridgeway Blue Chip ETF did not invest in Level 3 investments nor recognized transfers to/from Level 3.
During the fiscal year ended June 30, 2024, EA Bridgeway Omni Small-Cap Value ETF did invest in Level 3 investments and recognized transfers to/from Level 3. Transfers between levels are recognized at the end of the reporting period.
| | | | | | | | | | | | | | |
| | EA Bridgeway Omni Small-Cap Value ETF |
| | Contingent Value Rights | | Common Stock |
| Value, Beginning of Year | | $ | 68,440 | | | $ | — | |
| Purchases | | — | | | — | |
| Proceeds from Sales | | — | | | — | |
| Net Realized Gains (Losses) | | — | | | — | |
| Return of Capital | | — | | | — | |
| Change in Unrealized Appreciation (Depreciation) | | 1,387 | | | — | |
| Transfers In/(Out) of Level 3 | | — | | | 1 | |
| Value, End of Year | | $ | 69,827 | | | $ | 1 | |
BRIDGEWAY ETFs
NOTES TO THE FINANCIAL STATEMENTS (CONTINUED)
June 30, 2024
Significant unobservable valuation inputs monitored by the Valuation Designee under the supervision of the Adviser for restricted securities or material Level 3 investments as of June 30, 2024, for the Fund are as follows:
| | | | | | | | | | | | | | | | | | | | | | | | | | |
| | Fair Value at June 30, 2024 | | Valuation Technique | | Unobservable Input | | Input Values (Ranges) |
| Contingent Value Rights | | $ | 68,440 | | | Projected Final Distribution | | Discount of Projected Distribution | | $0.29 |
| Contingent Value Rights | | $ | 1,387 | | | Projected Final Distribution | | Discount of Projected Distribution | | $0.00 - $0.37 |
| Common Stock | | $ | 1 | | | Last Trade Price | | Last Trade Price | | $0.0001 |
B.Foreign Currency. Investment securities and other assets and liabilities denominated in foreign currencies are translated into U.S. dollar amounts using the spot rate of exchange at the date of valuation. Purchases and sales of investment securities and income and expense items denominated in foreign currencies are translated into U.S. dollar amounts on the respective dates of such transactions. Each Fund isolates the portion of the results of operations resulting from changes in foreign exchange rates on investments from the fluctuations arising from changes in market prices of securities held. That portion of gains (losses) attributable to the changes in market prices and the portion of gains (losses) attributable to changes in foreign exchange rates are included on the “Statement of Operations” under “Net realized gain (loss) – Foreign currency” and “Change in Net Unrealized Appreciation (Depreciation) – Foreign Currency,” respectively.
Each Fund reports net realized foreign exchange gains or losses that arise from sales of foreign currencies, currency gains or losses realized between the trade and settlement dates on securities transactions, and the difference between the amounts of dividends, interest, and foreign withholding taxes recorded on each Fund’s books and the U.S. dollar equivalent of the amounts actually received or paid. Net unrealized foreign exchange gains and losses arise from changes in the fair values of assets and liabilities, other than investments in securities at fiscal period end, resulting from changes in exchange rates.
C.Federal Income Taxes. Each Fund intends to continue to comply with the requirements of subchapter M of the Internal Revenue Code of 1986, as amended, as necessary to qualify as a regulated investment company and distribute substantially all net taxable investment income and net realized gains to shareholders in a manner which results in no tax cost to each Fund. Therefore, no federal income tax provision is required. As of and during the fiscal year ended June 30, 2024, the Funds did not have any tax positions that did not meet the “more-likely-than-not” threshold of being sustained by the applicable tax authority. As of and during the fiscal year ended June 30, 2024, the Funds did not have liabilities for any unrecognized tax benefits. The Funds would/will recognize interest and penalties, if any, related to unrecognized tax benefits on uncertain tax positions as income tax expense in the Statement of Operations. During the fiscal year ended June 30, 2024, the Funds did not incur any interest or penalties. The Funds are subject to examination by U.S. taxing authorities for the tax periods since each Fund’s commencement of operations.
Each Fund may be subject to taxes imposed on realized and unrealized gains on securities of certain foreign countries in which the Fund invests. The foreign tax expense, if any, was recorded on an accrual basis and is included in “Net realized gain (loss) on investments” and “Net increase (decrease) in unrealized appreciation or depreciation on investments” on the accompanying Statements of Operations. The amount of foreign tax owed, if any, is included in“Payable for foreign taxes” on the accompanying Statements of Assets and Liabilities and is comprised of and taxes on unrealized gains.
D.Security Transactions and Investment Income. Investment securities transactions are accounted for on the trade date. Gains and losses realized on sales of securities are determined on a specific identification basis. Dividend income is recorded on the ex-dividend date, net of any foreign taxes withheld at source. Interest income is recorded on an accrual basis. Withholding taxes on foreign dividends have been provided for in accordance with each Fund’s understanding of the applicable tax rules and regulations.
BRIDGEWAY ETFs
NOTES TO THE FINANCIAL STATEMENTS (CONTINUED)
June 30, 2024
Distributions to shareholders from net investment income for each Fund are declared and paid on a quarterly basis and distributions to shareholders from net realized gains on securities normally are declared and paid on an annual basis. Distributions are recorded on the ex-dividend date. Each Fund may distribute more frequently, if necessary, for tax purposes.
E.Use of Estimates. The preparation of financial statements in conformity with GAAP requires management to make estimates and assumptions that affect the reported amounts of assets and liabilities at the date of the financial statements, as well as the reported amounts of increases and decreases in net assets from operations during the period. Actual results could differ from those estimates.
F.Share Valuation. The NAV per share of each Fund is calculated by dividing the sum of the value of the securities held by the Fund, plus cash and other assets, minus all liabilities (including estimated accrued expenses) by the total number of shares outstanding for each Fund, rounded to the nearest cent. Each Fund’s shares will not be priced on the days on which the New York Stock Exchange (“NYSE”) is closed for regular trading. The offering and redemption price per share for each Fund is equal to the Fund’s net asset value per share.
G.Guarantees and Indemnifications. In the normal course of business, each Fund enters into contracts with service providers that contain general indemnification clauses. Additionally, as is customary, the Trust’s organizational documents permit the Trust to indemnify its officers and trustees against certain liabilities under certain circumstances. Each Fund’s maximum exposure under these arrangements is unknown as this would involve future claims that may be against each Fund that have not yet occurred. As of the date of this Report, no claim has been made for indemnification pursuant to any such agreement of either Fund.
H.Reclassification of Capital Accounts. GAAP requires that certain components of net assets relating to permanent differences be reclassified between financial and tax reporting. These reclassifications have no effect on net assets or net asset value per share. The Funds’ realized net capital gains resulting from in-kind redemptions, in which shareholders exchanged Funds shares for securities held by the Funds rather than for cash, are not taxable to the Funds and are not distributed to shareholders. As such, they have been reclassified from distributable earnings to paid-in capital. For the fiscal year ended June 30, 2024 the following table shows the reclassifications made:
| | | | | | | | | | | |
| Distributable
Earnings | | Paid-in
Capital |
| EA Bridgeway Blue Chip ETF | $ | (25,460,100) | | | $ | 25,460,100 | |
| EA Bridgeway Omni Small-Cap Value ETF | (127,681,900) | | | 127,681,900 | |
NOTE 3 – RISKS
Markets may perform poorly and the returns from the securities in which the each Fund invests may underperform returns from the general securities markets. Securities markets may experience periods of high volatility and reduced liquidity in response to governmental actions or intervention, economic or market developments, or other external factors. The value of a company’s securities may rise or fall in response to company, market, economic or other news.
Blue Chip Stocks Risk (EA Bridgeway Blue Chip ETF Only). The Fund is subject to the risk that blue-chip company stocks will underperform other kinds of investments for a period of time. This risk is true of any market segment. Based on historical data, such periods of underperformance may persist for multiple years. Large companies do not have the same growth potential of smaller companies and shareholders of large companies may have less overall influence than they would in smaller companies.
Small-Cap Company Risk (EA Bridgeway Omni Small-Cap Value ETF Only). Investing in small-cap stocks may involve greater volatility and risk than investing in large- or mid-cap stocks because small-cap companies may have less management experience, limited financial resources and minimal product diversification. Therefore, securities of small-cap companies may be and have historically been more volatile and less liquid than those of large- and mid-cap companies.
BRIDGEWAY ETFs
NOTES TO THE FINANCIAL STATEMENTS (CONTINUED)
June 30, 2024
Sector Risk. Companies with similar characteristics may be grouped together in broad categories called sectors. A
certain sector may underperform other sectors or the market as a whole. As the Sub-Adviser allocates more of a
Fund’s portfolio holdings to a particular sector, a Fund’s performance will be more susceptible to any economic,
business or other developments which generally affect that sector.
See each Fund’s Prospectus and Statement of Additional Information regarding the risks of investing in shares of each Fund.
NOTE 4 – COMMITMENTS AND OTHER RELATED PARTY TRANSACTIONS.
Empowered Funds, LLC dba EA Advisers (the “Adviser”) serves as the investment adviser to the Funds. Pursuant to an investment advisory agreement (the “Advisory Agreement”) between the Trust, on behalf of the Funds, and the Adviser, the Adviser provides investment advice to the Funds and oversees the day-to-day operations of the Funds, subject to the direction and control of the Board and the officers of the Trust. Under the Advisory Agreement, the Adviser is also responsible for arranging transfer agency, custody, fund administration and accounting, and other non-distribution related services necessary for the Funds to operate. The Adviser administers the Funds’ business affairs, provides office facilities and equipment and certain clerical, bookkeeping and administrative services. The Adviser agrees to pay all expenses incurred by the Funds except for the fee paid to the Adviser pursuant to the Advisory Agreement, payments under any distribution plan adopted pursuant to Rule 12b-1, brokerage expenses, acquired fund fees and expenses, taxes (including tax-related services), interest (including borrowing costs), litigation expense (including class action-related services) and other non-routine or extraordinary expenses. Per the Advisory Agreement, the EA Bridgeway Blue Chip ETF and EA Bridgeway Omni Small-Cap Value ETF each pays an annual rate with breakpoints as noted below to the Adviser monthly based on average daily net assets.
| | | | | | | | |
| Fund | AUM Level | Fee |
| EA Bridgeway Blue Chip ETF | < 3 billion | 15 bps |
| 3 billion to 10 billion | 13 bps |
| 10 billion to 20 billion | 12 bps |
| > 20 billion | 11 bps |
| EA Bridgeway Omni Small-Cap Value ETF | < 1 billion | 47 bps |
| 1 billion to 2 billion | 42 bps |
| > 2 billion | 40 bps |
Prior to conversion, the Bridgeway Blue Chip Fund paid an annual rate of 0.08% to the Adviser monthly based on average daily net assets. In addition, the Bridgeway Blue Chip Fund capped expenses at an annual rate 0.15% based on average daily net assets. Prior to conversion, the Bridgeway Omni Tax-Managed Small-Cap Value Fund paid an annual rate of 0.50% to the Adviser monthly based on average daily net assets. In addition, the Bridgeway Omni Tax-Managed Small-Cap Value Fund capped expenses at an annual rate 0.60% based on average daily net assets. Effective January 1, 2020, the Bridgeway Capital Management, LLC, voluntarily agreed to waive its management fees and/or reimburse expenses in an additional amount such that the net fiscal year expense ratio for the Bridgeway Omni Tax-Managed Small-Cap Value Fund did not exceed 0.47%.
Bridgeway Capital Management, LLC (the “Sub-Adviser”), serves as a discretionary investment sub-adviser to the Funds. Pursuant to an investment sub-advisory agreement (the “Sub-Advisory Agreement”) among the Trust, the Adviser, and the Sub-Adviser, the Sub-Adviser is responsible for determining the investment exposures for the Funds, subject to the overall supervision and oversight of the Adviser and the Board.
U.S. Bancorp Fund Services, LLC (“Fund Services” or “Administrator”), doing business as U.S. Bank Global Fund Services, acts as the Funds’ Administrator and, in that capacity, performs various administrative and accounting services for the Funds. The Administrator prepares various federal and state regulatory filings, reports and returns for the Funds, including regulatory compliance monitoring and financial reporting; prepares reports and materials to be supplied to the trustees; monitors the activities of the Funds’ Custodian, transfer agent and fund accountant. Fund Services also serves as the transfer agent and
BRIDGEWAY ETFs
NOTES TO THE FINANCIAL STATEMENTS (CONTINUED)
June 30, 2024
fund accountant to the Funds. U.S. Bank N.A. (the “Custodian”), an affiliate of the Administrator, serves as the Funds’ Custodian.
The Custodian acts as the securities lending agent (the “Securities Lending Agent”) for the Funds.
NOTE 5 - SECURITIES LENDING
Each Fund may lend up to 33⅓% of the value of the securities in its portfolio to brokers, dealers and financial institutions (but not individuals) under terms of participation in a securities lending program administered by the Securities Lending Agent. The securities lending agreement requires that loans are collateralized at all times in an amount equal to at least 102% of the value of any domestic loaned securities at the time of the loan, plus accrued interest. The use of loans of foreign securities, which are denominated and payable in U.S. dollars, shall be collateralized in an amount equal to 105% of the value of any loaned securities at the time of the loan plus accrued interest. The Funds receive compensation in the form of fees and earns interest on the cash collateral. The amount of fees depends on a number of factors including the type of security and length of the loan. The Funds continue to receive interest payments or dividends on the securities loaned during the borrowing period. Gain or loss on the value of securities loaned that may occur during the term of the loan will be for the account of the Fund. The Funds have the right under the terms of the securities lending agreement to recall the securities from the borrower on demand.
The securities lending agreement provides that, in the event of a borrower’s material default, the Securities Lending Agent shall take all actions the Securities Lending Agent deems appropriate to liquidate the collateral, purchase replacement securities at the Securities Lending Agent’s expense, or pay the Funds an amount equal to the market value of the loaned securities, subject to certain limitations which are set forth in detail in the securities lending agreement between the Funds and the Securities Lending Agent.
During the fiscal period, the EA Bridgeway Omni Small-Cap Value ETF had loaned securities and received cash collateral for the loans. The cash collateral is invested by the Securities Lending Agent in accordance with the Trust approved investment guidelines. Those guidelines require the cash collateral to be invested in readily marketable, high quality, short-term obligations; however, such investments are subject to risk of payment delays or default on the part of the issuer or counterparty or otherwise may not generate sufficient interest to support the costs associated with securities lending. The Fund could also experience delays in recovering its securities and possible loss of income or value if the borrower fails to return the borrowed securities, although the Fund is indemnified from this risk by contract with the Securities Lending Agent. The EA Bridgeway Blue Chip ETF did not lend securities during the fiscal period.
As of the end of the current fiscal year, the value of the securities on loan and payable for collateral due to broker for the EA Bridgeway Omni Small-Cap Value ETF were as follows:
| | | | | | | | | | | | | | | | |
| | Values of Securities on Loan | | Payment for Collateral
received* | | Percentage of Net Assets of Securities on Loan |
| | | | | | |
| | $14,817,410 | | $15,764,056 | | 1.2% |
* The cash collateral received was invested in the First American Money Market Government Obligations Fund as shown on the Schedule of Investments. The investment objective is to seek maximum current income to the extent consistent with the preservation of capital and maintenance of liquidity.
The interest income earned by the Funds, if any, on the investment of cash collateral received from borrowers for the securities loaned to them (“Securities Lending Income, Net”) is reflected in the Fund’s Statement of Operations. Net securities lending income earned on collateral investments and recognized by the EA Bridgeway Omni Small-Cap Value ETF during the current fiscal year was $251,210.
Due to the absence of a master netting agreement related to the Funds’ participation in securities lending, no additional offsetting disclosures have been made on behalf of the Fund for the total borrowings listed above.
BRIDGEWAY ETFs
NOTES TO THE FINANCIAL STATEMENTS (CONTINUED)
June 30, 2024
NOTE 6 – PURCHASES AND SALES OF SECURITIES
For the fiscal year ended June 30, 2024, purchases and sales of securities for each Fund, excluding short-term securities and in-kind transactions, were as follows:
| | | | | | | | | | | | | | |
| | Purchases | | Sales |
| EA Bridgeway Blue Chip ETF | | $ | 18,004,030 | | | $ | 7,902,940 | |
| EA Bridgeway Omni Small-Cap Value ETF | | 322,023,906 | | | $ | 58,075,526 | |
For the fiscal year ended June 30, 2024, in-kind transactions associated with creations and redemptions were as follows:
| | | | | | | | | | | | | | |
| | Purchases | | Sales |
| EA Bridgeway Blue Chip ETF | | $ | 54,312,229 | | | $ | 36,275,712 | |
| EA Bridgeway Omni Small-Cap Value ETF | | 361,034,981 | | | 261,688,625 | |
For the fiscal year ended June 30, 2024, short-term and long-term gains on in-kind transactions were as follows:
| | | | | | | | | | | | | | |
| | Short Term | | Long Term |
| EA Bridgeway Blue Chip ETF | | $ | 146,430 | | | $ | 25,313,668 | |
| EA Bridgeway Omni Small-Cap Value ETF | | 18,791,369 | | | 108,890,531 | |
There were no purchases or sales of U.S. Government securities during the fiscal year.
NOTE 7 – TAX INFORMATION
The components of tax basis cost of investments and net unrealized appreciation (depreciation) for federal income tax purposes at June 30, 2024 were as follows:
| | | | | | | | | | | |
| EA Bridgeway Blue Chip ETF | | EA Bridgeway Omni Small-Cap Value ETF |
| Tax cost of Investments | $ | 111,870,922 | | | $ | 1,146,774,461 | |
| Gross tax unrealized appreciation | 72,516,345 | | | 236,484,435 | |
| Gross tax unrealized depreciation | (3,098,537) | | | (94,977,597) | |
| Net tax unrealized appreciation (depreciation) | $ | 69,417,808 | | | $ | 141,506,838 | |
| Undistributed ordinary income | 1,004,533 | | | 7,848,805 | |
| Undistributed long-term gain | — | | | — | |
| Total distributable earnings | $ | 1,004,533 | | | $ | 7,848,805 | |
| Other accumulated gain (loss) | (724,187) | | | (15,373,120) | |
| Total accumulated gain (loss) | $ | 69,698,154 | | | $ | 133,982,523 | |
Under tax law, certain capital and foreign currency losses realized after October 31 and within the taxable year are deemed to arise on the first business day of each Fund’s next taxable year.
For the fiscal year ended June 30, 2024, the Funds did not defer any post-October capital losses or late year losses.
BRIDGEWAY ETFs
NOTES TO THE FINANCIAL STATEMENTS (CONTINUED)
June 30, 2024
At June 30, 2024, the Funds had the following capital loss carryforwards: | | | | | | | | |
| Unlimited
Short-Term Capital Loss Carryover | Unlimited Long-Term Capital Loss Carryover |
| EA Bridgeway Blue Chip ETF | $ | (16,777) | | $ | (707,410) | |
| EA Bridgeway Omni Small-Cap Value ETF | $ | (8,947,532) | | $ | (6,425,588) | |
NOTE 8 – DISTRIBUTIONS TO SHAREHOLDERS
The tax character of distributions paid by the Funds during the fiscal years ended June 30, 2024 and June 30, 2023 were as follows:
| | | | | | | | | | | | | | | | | | | | | | | | | | |
| | EA Bridgeway Blue Chip ETF | | EA Bridgeway Omni Small-Cap Value ETF |
| | June 30, 2024 | | June 30, 2023 | | June 30, 2024 | | June 30, 2023 |
| Ordinary Income | | $ | 2,206,508 | | | $ | 5,479,841 | | | $ | 15,734,014 | | | $ | 21,115,457 | |
| Long Term Capital Gain | | — | | | 87,177,212 | | | — | | | 78,615,121 | |
| Total Distributions Paid | | $ | 2,206,508 | | | $ | 92,657,053 | | | $ | 15,734,014 | | | $ | 99,730,578 | |
NOTE 9 – SUBSEQUENT EVENTS
In preparing these financial statements, management of the Funds has evaluated events and transactions for potential recognition or disclosure through the date the financial statements were issued. There were no transactions that occurred during the year subsequent to June 30, 2024, that materially impacted the amounts or disclosures in the Funds’ financial statements.
REPORT OF INDEPENDENT REGISTERED PUBLIC ACCOUNTING FIRM
To the Shareholders of
EA Bridgeway Blue Chip ETF,
EA Bridgeway Omni Small-Cap Value ETF and
The Board of Trustees of
EA Series Trust
Opinion on the Financial Statements
We have audited the accompanying statements of assets and liabilities of EA Bridgeway Blue Chip ETF and EA Bridgeway Omni Small-Cap Value ETF (the “Funds”), each a series of EA Series Trust (the “Trust”), including the schedules of investments, as of June 30, 2024, the related statements of operations for the year ended June 30, 2024, the statements of changes in net assets and the financial highlights for each of the two years ended June 30, 2024 and the related notes (collectively referred to as the “financial statements”). In our opinion, the financial statements present fairly, in all material respects, the financial position of the Funds as of June 30, 2024, and the results of their operations, the changes in their net assets and the financial highlights for the periods stated above, in conformity with accounting principles generally accepted in the United States of America.
The financial highlights for each of the three years in the period ended June 30, 2022 have been audited by other auditors, whose report dated August 25, 2022 expressed an unqualified opinion on such financial statement and financial highlights.
Basis for Opinion
These financial statements are the responsibility of the Funds’ management. Our responsibility is to express an opinion on the Funds’ financial statements based on our audits. We are a public accounting firm registered with the Public Company Accounting Oversight Board (United States) (“PCAOB”) and are required to be independent with respect to the Funds in accordance with the U.S. federal securities laws and the applicable rules and regulations of the Securities and Exchange Commission and the PCAOB. We have served as the auditor of one or more of the funds in the Trust since 2023.
We conducted our audits in accordance with the standards of the PCAOB. Those standards require that we plan and perform the audits to obtain reasonable assurance about whether the financial statements are free of material misstatement, whether due to error or fraud. The Funds are not required to have, nor were we engaged to perform, an audit of their internal control over financial reporting. As part of our audits, we are required to obtain an understanding of internal control over financial reporting, but not for the purpose of expressing an opinion on the effectiveness of the Funds’ internal control over financial reporting. Accordingly, we express no such opinion.
Our audits included performing procedures to assess the risks of material misstatement of the financial statements, whether due to error or fraud, and performing procedures that respond to those risks. Such procedures included examining, on a test basis, evidence regarding the amounts and disclosures in the financial statements. Our audits also included evaluating the accounting principles used and significant estimates made by management, as well as evaluating the overall presentation of the financial statements. Our procedures included confirmation of securities owned as of June 30, 2024 by correspondence with the custodian and brokers or through other appropriate auditing procedures when replies from brokers were unable to be obtained. We believe that our audits provides a reasonable basis for our opinion.
TAIT, WELLER & BAKER LLP
Philadelphia, Pennsylvania
August 28, 2024
FEDERAL TAX INFORMATION (UNAUDITED)
For the fiscal year ended June 30, 2024, certain dividends paid by the Funds may be subject to a maximum tax rate of 23.8%, as provided for by the Tax Cuts and Jobs Act of 2017. The percentage of dividends declared from ordinary income designated as qualified dividend income was as follows:
| | | | | |
| EA Bridgeway Blue Chip ETF | 100.00% |
| EA Bridgeway Omni Small-Cap Value ETF | 100.00% |
For corporate shareholders, the percent of ordinary income distributions qualifying for the corporate dividends received deduction for the fiscal year ended June 30, 2024 was as follows:
| | | | | |
| EA Bridgeway Blue Chip ETF | 100.00% |
| EA Bridgeway Omni Small-Cap Value ETF | 86.49 |
The percentage of taxable ordinary income distributions that are designated as short-term capital gain distributions under the Internal Revenue Section 871 (k)(2)(C) for each of the Funds was as follows:
| | | | | |
| EA Bridgeway Blue Chip ETF | 0.00% |
| EA Bridgeway Omni Small-Cap Value ETF | 0.00% |
Item 8. Changes in and Disagreements with Accountants for Open-End Management Investment
Companies.
There were no matters concerning changes in and disagreements with Accountants on accounting and financial disclosures required by Item 304 of Regulation S-K.
Item 9. Proxy Disclosures for Open-End Management Investment Companies.
There were no matters submitted during the period covered by the report to a vote of shareholders.
Item 10. Remuneration Paid to Directors, Officers, and Others of Open-End Management
Investment Companies
Not applicable. The Independent Trustees are paid by the Adviser out. See Note 4 to the Financial Statements under Item 7.
Item 11. Statement Regarding Basis for Approval of Investment Advisory Contracts.
The Board (the members of which are referred to as “Trustees”) of the EA Series Trust (the “Trust”) met in-person on June 7, 2024 to consider the approval of the continuation of the Advisory Agreement between the Trust, on behalf of the EA Bridgeway Blue Chip ETF and EA Bridgeway Omni Small-Cap Value ETF (each, a “Fund,” and collectively, the “Funds”), and Empowered Funds, LLC dba EA Advisers (the “Adviser”), as well as to consider the approval of the continuation of the Sub-Advisory Agreement between the Adviser and Bridgeway Capital Management, LLC (the “Sub-Adviser), each for an additional annual term. In accordance with Section 15(c) of the 1940 Act, the Board requested, reviewed and considered materials furnished by the Adviser and Sub-Adviser relevant to the Board’s consideration of whether to approve the continuation of the Advisory Agreement and Sub-Advisory Agreement. In connection with considering the approval of both the Advisory Agreement and Sub-Advisory Agreement, the Trustees who are not “interested persons” of the Trust, as that term is defined in the 1940 Act (the “Independent Trustees”), met in executive session with counsel to the Trust, who provided assistance and advice. In reaching the decision to approve both the Advisory Agreement and Sub-Advisory Agreement, the Board considered and reviewed information provided by the Adviser and Sub-Adviser at this meeting and throughout the year, including among other things information about their respective personnel, operations, financial condition, and compliance and risk management. The Board also reviewed the Advisory Agreement and Sub-Advisory Agreement. During its review and consideration, the Board focused on and reviewed the factors it deemed relevant, including:
Nature, Quality, and Extent of Services. The Board was presented with and considered information concerning the nature, quality, and extent of the overall services provided by the Adviser to the Funds. In this connection, the Board considered the responsibilities of the Adviser, recognizing that the Adviser had invested significant time and effort in structuring the Trust and the Funds, and arranging service providers for the Funds. In addition, the Board considered that the Adviser is responsible for providing investment advisory oversight services to the Funds, executing all Fund transactions, monitoring compliance with the Funds’ objectives, policies and restrictions, and carrying out directives of the Board. The Board also considered the services provided by the Adviser in the oversight of the Trust’s administrator, transfer agent and custodian. In addition, the Board evaluated the integrity of each of the Adviser’s and Sub-Adviser’s personnel, the experience of the portfolio managers in managing assets and the adequacy of each of the Adviser’s and the Sub-Adviser’s resources to perform the services provided under the Advisory Agreement and Sub-Advisory Agreement. The Board also considered the Adviser’s ongoing oversight responsibilities vis-à-vis the Sub-Adviser.
Performance. The Board considered the third-party peer group analysis comparing the Funds’ performance to the performance of other funds that the third-party deemed to be comparable to a Fund. It was determined that the Adviser and the Sub-Adviser have consistently managed each Fund’s portfolio in accordance with its stated investment objective and strategies. The Board noted that BBLU underperformed the average total return of its ETF peer group by 699 (6.99%) and outperformed the mutual fund peer group by 336 (3.36%) basis points, respectively, over the past 12 months ended March 31, 2024. The Board noted that BSVO outperformed the average total return of its ETF peer group by 336 (3.36%) and underperformed the mutual fund peer group by 248 (2.48%) basis points, respectively, over the past 12 months ended March 31, 2024. The Board concluded that the Funds’ performance was reasonable. The Board noted that the Sub-Adviser does not manage any other accounts that follow BBLU’s strategy. The Board did consider the performance of a mutual fund that follows a strategy similar to BSVO’s and found that both funds performed very similarly over the relevant periods.
Comparative Fees and Expenses. In considering the advisory fees and sub-advisory fees, the Board reviewed and considered the fees in light of the nature, quality, and extent of the services being provided by the Adviser and the Sub-Adviser, respectively. With respect to the advisory fees and expense ratio for each Fund, the Board also considered the fees and expense ratio versus the fees and expenses charged to other actively managed funds, including both ETFs and mutual funds. The Board also considered the allocation of fees between the Adviser and the Sub-Adviser.
The Board compared each Fund’s gross total expense ratio, net total expense ratio, and management fee against the average gross total expense ratio, average net total expense ratio, and average management fee for ETFs and mutual funds in a Fund’s peer group. BBLU’s gross total expense ratio (0.15%) was lower than the average for both ETFs (0.75%) and mutual funds (0.82%); BBLU’s net total expense ratio (0.15%) was lower than the average for both ETFs (0.48%) and mutual funds (0.77%); and BBLU’s management fee (0.15%) was lower than the average for both ETFs (0.50%) and mutual funds (0.62%). BSVO’s gross total expense ratio (0.47%) was lower than the average for both ETFs (0.54%) and mutual funds (0.85%); BSVO’s net total expense ratio (0.47%) was lower than the average for both ETFs (0.54%) and mutual funds (0.82%); and BSVO’s management fee (0.47%) was lower than the average for both ETFs (0.53%) and mutual funds (0.64%). The Board considered that each Fund’s fee arrangement in which the Adviser is responsible for paying most of the Funds’ operating expenses out of its resources, noting that comparisons with a Fund’s overall expense ratio may be more relevant than comparisons to management fees only. They stated that such a comparison demonstrates each Fund’s overall cost structure is within the range of expense ratios of its respective ETF and mutual fund peers.
The Board considered, among other information, the data provided in the third-party report comparing each Fund’s fees to those of other funds that the third-party deemed to be comparable to a Fund. Fee information was provided in quartiles, ranging from quartile one (the least expensive) to quartile four (the most expensive). This data included a comparison of each Fund’s expense ratio against both ETFs and mutual funds. Each Fund’s total expense ratio (for both gross and net) and management fee were in the following quartiles:
| | | | | | | | | | | | | | | | | | | | |
| Funds | Total Expense Ratio | Net Expense Ratio | Management Fee Only |
| ETFs | Mutual Funds | ETFs | Mutual Funds | ETFs | Mutual Funds |
| BBLU | Quartile 1 | Quartile 1 | Quartile 1 | Quartile 1 | Quartile 1 | Quartile 1 |
| BSVO | Quartile 2 | Quartile 1 | Quartile 2 | Quartile 1 | Quartile 2 | Quartile 1 |
With respect to the sub-advisory fee, the Board noted that it was payable solely out of the unitary management fee payable to the Adviser. The Board considered the representations from the Adviser and the Sub-Adviser (as it relates to BBLU only) that neither firm manages any other accounts that follow a similar strategy as the Funds. As it relates to the Sub-Adviser, the Board noted that the Sub-Adviser manages a mutual fund that follows a similar strategy to BSVO and that it has overall cost structure aligned with the Fund. The Board was agreeable to the fee levels.
Costs and Profitability. The Board further considered information regarding the potential profits, if any, that may be realized by each of the Adviser and the Sub-Adviser in connection with providing their respective services to the Funds. The Board reviewed the profit and loss information provided by the Adviser with respect to the Funds, noting that the Adviser is profitable as it relates to BSVO but is not profitable as it relates to BBLU. The Board also reviewed the same type of information provided by the Sub-Adviser that showed it was not profitable at this time as it relates to BBLU. The Board considered the Sub-Adviser’s profitability as it relates to BSVO. They also considered the information provided by the Sub-Adviser that estimated it would not be profitable as it relates to BBLU over the next two years but it would remain profitable as it relates to BSVO. The Board discussed the financial condition of the Sub-Adviser, noting that the Sub-Adviser has sufficient capital to maintain its commitment to the Funds for an additional annual period. The Board also reviewed the costs associated with the personnel, systems and equipment necessary to manage the Funds and to meet the regulatory and compliance requirements adopted by the SEC and other regulatory bodies. The Board also considered other expenses of the Funds that the Adviser would pay in accordance with the Advisory Agreement. The Board took into consideration that the Adviser agreed to pay all expenses incurred by the Funds except for the fees paid to the Adviser pursuant to the Advisory Agreement, payments under any distribution plan adopted pursuant to Rule 12b-1, brokerage expenses, acquired fund fees and expenses, taxes, interest (including borrowing costs), the fees and expenses associated with each Fund’s securities lending program (if applicable), litigation expenses and other non-routine or extraordinary expenses. The Board also considered the respective financial obligations of the Adviser, as well as the Sub-Adviser, who serves as the sponsor of each Fund.
Other Benefits. The Board further considered the extent to which the Adviser or the Sub-Adviser might derive ancillary benefits from each Fund’s operations. For example, the Adviser may engage in soft dollar transactions in the future, although it did not currently plan to do so. In addition, the Adviser may benefit from continued growth in the Trust by potentially negotiating better fee arrangements with key vendors serving the Funds and other series in the Trust.
Economies of Scale. The Board also considered whether economies of scale would be realized by the Funds as their assets grow larger, including the extent to which this is reflected in the level of fees to be charged. The Board also noted that the advisory and sub-advisory fees include breakpoints. The Board acknowledged that not only does BBLU’s fee structure include breakpoints, but the initial fee was also priced very aggressively from inception thus benefiting shareholders. As it relates to BSVO, the Board noted that shareholders are currently enjoying economies of scale as the Fund has reached the first breakpoint in the fee schedule.
Conclusion. No single factor was determinative of the Board’s decision to approve the continuation of the Advisory Agreement and Sub-Advisory Agreement for an additional annual term; rather, the Board based its determination on the total mix of information available to it. Based on a consideration of all the factors in their totality, the Board, including the Independent Trustees, unanimously determined that the Advisory Agreement and Sub-Advisory Agreement, including the compensation payable under each Agreement, were fair and reasonable to the Funds. The Board, including the Independent Trustees, unanimously determined that the approval of the continuation of each of the Advisory Agreement and the Sub-Advisory Agreement was in the best interests of the Funds and their shareholders.
Item 12. Disclosure of Proxy Voting Policies and Procedures for Closed-End Management Investment Companies.
Not applicable to open-end investment companies.
Item 13. Portfolio Managers of Closed-End Management Investment Companies.
Not applicable to open-end investment companies.
Item 14. Purchases of Equity Securities by Closed-End Management Investment Company and Affiliated Purchasers.
Not applicable to open-end investment companies.
Item 15. Submission of Matters to a Vote of Security Holders.
There have been no material changes to the procedures by which shareholders may recommend nominees to the registrant’s board of trustees.
Item 16. Controls and Procedures.
(a) The Registrant’s President (principal executive officer) and Treasurer (principal financial officer) have reviewed the Registrant's disclosure controls and procedures (as defined in Rule 30a-3(c) under the Investment Company Act of 1940 (the “Act”)) as of a date within 90 days of the filing of this report, as required by Rule 30a-3(b) under the Act and Rules 13a-15(b) or 15d‑15(b) under the Securities Exchange Act of 1934. Based on their review, such officers have concluded that the disclosure controls and procedures are effective in ensuring that information required to be disclosed in this report is appropriately recorded, processed, summarized and reported and made known to them by others within the Registrant and by the Registrant’s service provider.
(b) There were no changes in the Registrant’s internal control over financial reporting (as defined in Rule 30a-3(d) under the Act) that occurred during the period covered by this report that have materially affected, or are reasonably likely to materially affect, the Registrant’s internal control over financial reporting.
Item 17. Disclosure of Securities Lending Activities for Closed-End Management Investment Companies
Not applicable to open-end investment companies.
Item 18. Recovery of Erroneously Awarded Compensation.
(a) Not applicable.
(b) Not applicable.
Item 19. Exhibits.
SIGNATURES
Pursuant to the requirements of the Securities Exchange Act of 1934 and the Investment Company Act of 1940, the registrant has duly caused this report to be signed on its behalf by the undersigned, thereunto duly authorized.
| | | | | | | | |
| (Registrant) | EA Series Trust | |
| | |
| By (Signature and Title) | /s/ Patrick Cleary | |
| | Patrick Cleary, President, Chief Executive Officer, and Principal Executive Officer | |
| | |
| Date: | August 30, 2024 | |
Pursuant to the requirements of the Securities Exchange Act of 1934 and the Investment Company Act of 1940, this report has been signed below by the following persons on behalf of the registrant and in the capacities and on the dates indicated.
| | | | | | | | |
| By (Signature and Title) | /s/ Patrick Cleary | |
| | Patrick Cleary, President, Chief Executive Officer, and Principal Executive Officer | |
| | | |
| Date: | August 30, 2024 | |
| | | |
| By (Signature and Title) | /s/ Sean Hegarty | |
| | Sean Hegarty, Treasurer, Chief Financial Officer, Comptroller, and Principal Financial Officer | |
| | | |
| Date: | August 30, 2024 | |