UNITED STATES
SECURITIES AND EXCHANGE COMMISSION
Washington, D.C. 20549
FORM N-CSR
CERTIFIED SHAREHOLDER REPORT OF REGISTERED
MANAGEMENT INVESTMENT COMPANIES
Investment Company Act file number 811-22961
EA Series Trust
(Exact name of registrant as specified in charter)
19 E. Eagle Road
Havertown, PA 19083
(Address of principal executive offices) (Zip code)
19 E. Eagle Road
Havertown, PA 19083
(Name and address of agent for service)
215-882-9983
Registrant’s telephone number, including area code
Date of fiscal year end: July 31, 2024
Date of reporting period: July 31, 2024
Item 1. Report to Stockholders.
(a)
| | | | | | | | |
| Fund Name: Strive 500 ETF Ticker: STRV Listed on: New York Stock Exchange | July 31, 2024 Annual Shareholder Report www.strivefunds.com/strv |
|
| | | | | | | | | | | |
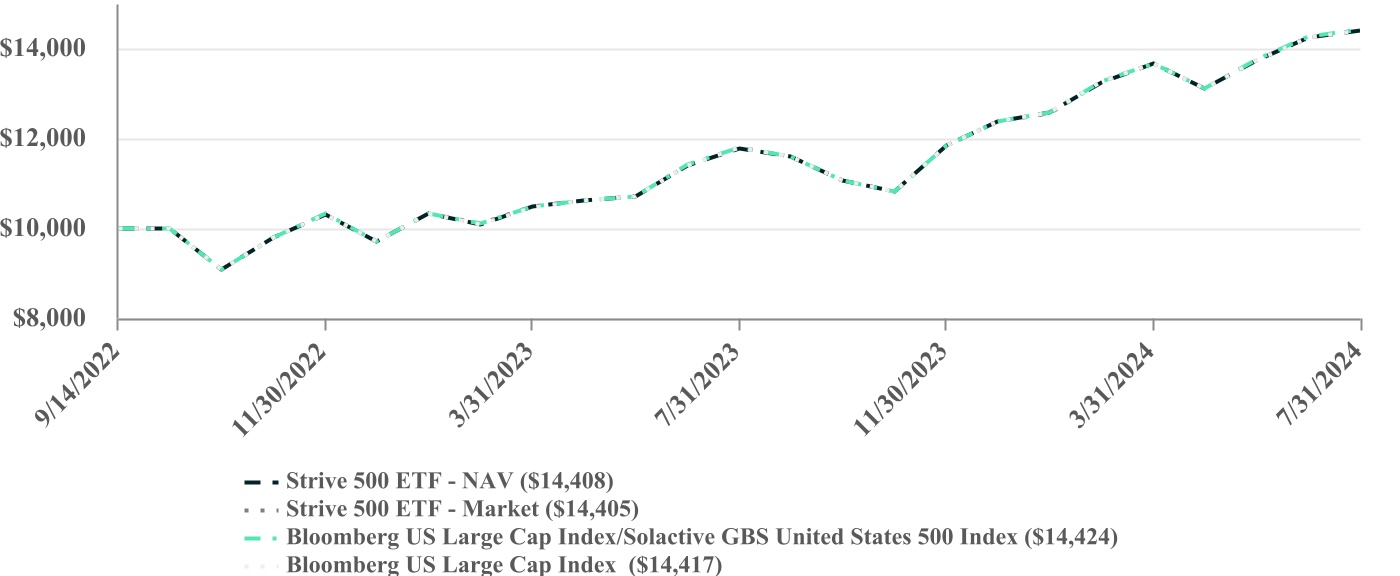
| This annual shareholder report contains important information about the Strive 500 ETF (the “Fund”) for the period of August 1, 2023 to July 31, 2024 (the “Period”). You can find additional information about the Fund at www.strivefunds.com/strv. You can also request this information by contacting us at (215) 882-9983. This report describes changes to the Fund that occurred during the Period. |
| | | | | | | | | | | |
WHAT WERE THE FUND COSTS FOR THE PERIOD?
(based on a hypothetical $10,000 investment) |
| COST OF $10,000 INVESTMENT | COST PAID AS A PERCENTAGE OF $10,000 INVESTMENT |
| $6 | 0.05% |
| | | | | | | | | | | |
| PERFORMANCE OF A HYPOTHETICAL $10,000 INVESTMENT |
| | | | | | | | | | | | | | |
| AVERAGE ANNUAL TOTAL RETURNS |
| | One Year | | Since Inception (9/14/2022) |
| Strive 500 ETF - NAV | | 22.26% | | 21.48% |
| Strive 500 ETF - Market | | 22.16% | | 21.47% |
| Bloomberg US Large Cap Index/Solactive GBS United States 500 Index | | 22.29% | | 21.55% |
| Bloomberg US Large Cap Index | | 21.52% | | 22.24% |
| | | | |
The Fund’s past performance is not a good predictor of how the Fund will perform in the future. The graph and table do not reflect the deduction of taxes that a shareholder would pay on Fund distributions or redemption of Fund shares. Effective January 26, 2024, the Fund’s investment strategy changed to track the investment results of the Bloomberg US Large Cap Index. Prior to January 26, 2024, the Fund’s investment strategy was to track the investment results of the Solactive GBS United States 500 Index. Performance shown for the Bloomberg US Large Cap Index/Solactive GBS United States 500 Index for the period prior to January 26, 2024 is that of the Solactive GBS United States 500 Index and for the period beginning January 26, 2024 is that of the Bloomberg US Large Cap Index. Visit www.strivefunds.com/strv for more recent performance information. |
| | | | | | | | | | | |
| WHAT FACTORS INFLUENCED PERFORMANCE FOR THE PERIOD? |
U.S. large-cap stocks rose strongly during the Period amid solid economic growth, easing inflation, and shifting monetary policy. Companies in the technology sector, particularly those in the semiconductor industry, benefited from increased demand due to the rapid advancements in artificial intelligence (AI) technology, demand for specialized chips, and increased computing power. Companies in the financials sector benefited from elevated interest rates and stable economic conditions.
Annual Shareholder Report: July 31, 2024
The Fund is distributed by Quasar Distributors, LLC.
| | | | | | | | |
| Fund Name: Strive 500 ETF Ticker: STRV Listed on: New York Stock Exchange | July 31, 2024 Annual Shareholder Report www.strivefunds.com/strv |
|
| | | | | | | | | | | | | | | | | | | | |
| KEY FUND STATISTICS (as of Period End) |
| Net Assets | | $601,207,978 | | Portfolio Turnover Rate* | | 4% |
| # of Portfolio Holdings | | 501 | | Advisory Fees Paid | | $222,292 |
| *Excludes impact of in-kind transactions. |
| | | | | | |
| | | | | |
SECTOR WEIGHTING
(as a % of Net Assets) |
| Information Technology | 32.0% |
| Financials | 12.7% |
| Health Care | 12.0% |
| Consumer Discretionary | 9.9% |
| Communication Services | 9.0% |
| Industrials | 8.3% |
| Consumer Staples | 5.8% |
| Energy | 3.7% |
| Utilities | 2.2% |
| Real Estate | 2.1% |
| Materials | 1.9% |
| Cash & Cash Equivalents | 0.4% |
| | | | | |
TOP 10 HOLDINGS
(as a % of Net Assets) |
| Apple, Inc. | 6.9% |
| Microsoft Corp. | 6.7% |
| Nvidia Corp. | 6.0% |
| Amazon.com, Inc. | 3.7% |
| Meta Platforms, Inc. - Class A | 2.2% |
| Alphabet, Inc. - Class A | 2.2% |
| Alphabet, Inc. - Class C | 1.8% |
| Broadcom, Inc. | 1.6% |
| Eli Lilly & Co. | 1.5% |
| Tesla, Inc. | 1.4% |
Material Fund Changes
Effective January 26, 2024, the Fund’s investment strategy changed to track the investment results of the Bloomberg US Large Cap Index. Prior to January 26, 2024, the Fund’s investment strategy was to track the investment results of the Solactive GBS United States 500 Index. For more complete information, you may review the Fund’s next prospectus, which we expect to be available by November 30, 2024 at www.strivefunds.com/strv or upon request by calling (215) 882-9983.
Availability of Additional Information
For additional information about the Fund, including its prospectus, financial information, holdings, and proxy information, visit www.strivefunds.com/strv. You can also request information by calling (215) 882-9983.
Householding
Householding is an option available to certain investors of the Fund. Householding is a method of delivery, based on the preference of the individual investor, in which a single copy of certain shareholder documents can be delivered to investors who share the same address, even if their accounts are registered under different names. Householding for the Fund is available through certain broker-dealers. If you are interested in enrolling in householding and receiving a single copy of prospectuses and other shareholder documents or you are currently enrolled in householding and wish to change your householding status, please contact your broker-dealer.
Annual Shareholder Report: July 31, 2024
The Fund is distributed by Quasar Distributors, LLC.
| | | | | | | | |
| Fund Name: Strive Mid-Cap ETF Ticker: STXM Listed on: New York Stock Exchange | July 31, 2024 Annual Shareholder Report www.strivefunds.com/stxm |
|
| | | | | | | | | | | |
| This annual shareholder report contains important information about the Strive Mid-Cap ETF (the “Fund”) for the period of April 10, 2024 to July 31, 2024 (the “Period”). You can find additional information about the Fund at www.strivefunds.com/stxm. You can also request this information by contacting us at (215) 882-9983. |
| | | | | | | | | | | |
WHAT WERE THE FUND COSTS FOR THE PERIOD?
(based on a hypothetical $10,000 investment) |
| COST OF $10,000 INVESTMENT | COST PAID AS A PERCENTAGE OF $10,000 INVESTMENT |
| $6 | 0.18% |
| | | | | | | | | | | |
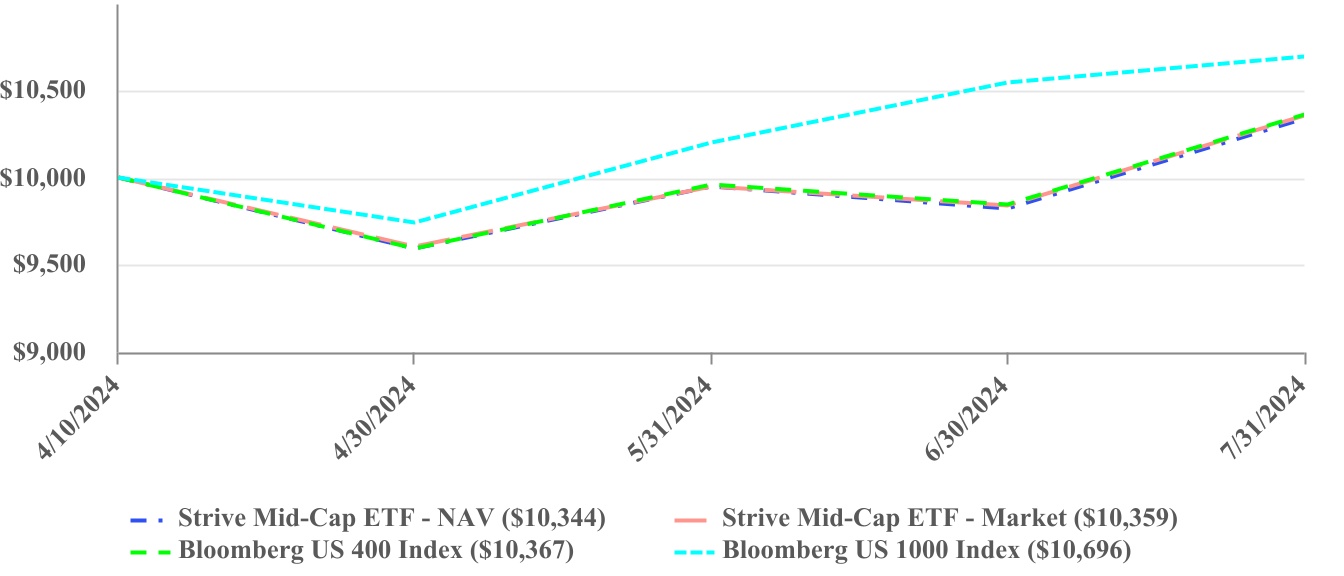
| PERFORMANCE OF A HYPOTHETICAL $10,000 INVESTMENT |
| | | | | | | | | | | | | | |
| CUMULATIVE TOTAL RETURNS |
| | | | Since Inception (4/10/2024) |
| Strive Mid-Cap ETF - NAV | | | | 3.44% |
| Strive Mid-Cap ETF - Market | | | | 3.59% |
| Bloomberg US 400 Index | | | | 3.67% |
| Bloomberg US 1000 Index | | | | 6.96% |
| | | | |
The Fund’s past performance is not a good predictor of how the Fund will perform in the future. The graph and table do not reflect the deduction of taxes that a shareholder would pay on Fund distributions or redemption of Fund shares. Visit www.strivefunds.com/stxm for more recent performance information. |
| | | | | | | | | | | |
| WHAT FACTORS INFLUENCED PERFORMANCE FOR THE PERIOD? |
U.S. mid-cap stocks rose modestly for the Period amid solid economic growth, easing inflation, and shifting monetary policy. Companies in the financials sector benefited from elevated interest rates and stable economic conditions. Companies in the consumer discretionary sector benefited from the home construction industry’s favorable performance despite elevated interest rates and higher borrowing costs.
Annual Shareholder Report: July 31, 2024
The Fund is distributed by Quasar Distributors, LLC.
| | | | | | | | |
| Fund Name: Strive Mid-Cap ETF Ticker: STXM Listed on: New York Stock Exchange | July 31, 2024 Annual Shareholder Report www.strivefunds.com/stxm |
|
| | | | | | | | | | | | | | | | | | | | |
| KEY FUND STATISTICS (as of Period End) |
| Net Assets | | $12,387,821 | | Portfolio Turnover Rate* | | 4% |
| # of Portfolio Holdings | | 397 | | Advisory Fees Paid | | $4,421 |
| *Portfolio turnover is not annualized and is calculated without regard to short-term securities having a maturity of less than one year. Excludes impact of in-kind transactions. |
| | | | | | |
| | | | | |
SECTOR WEIGHTING
(as a % of Net Assets) |
| Industrials | 20.9% |
| Consumer Discretionary | 14.4% |
| Financials | 14.2% |
| Information Technology | 14.0% |
| Health Care | 8.8% |
| Real Estate | 7.3% |
| Materials | 6.6% |
| Consumer Staples | 4.2% |
| Energy | 4.2% |
| Communication Services | 2.5% |
| Utilities | 2.5% |
| Cash & Cash Equivalents | 0.4% |
| | | | | |
TOP 10 HOLDINGS
(as a % of Net Assets) |
| Vistra Corp. | 0.8% |
| MicroStrategy, Inc. - Class A | 0.7% |
| GoDaddy, Inc. - Class A | 0.6% |
| Carlisle Cos., Inc. | 0.6% |
| Williams-Sonoma, Inc. | 0.6% |
| Lennox International, Inc. | 0.6% |
| AerCap Holdings NV | 0.5% |
| Pure Storage, Inc. - Class A | 0.5% |
| EMCOR Group, Inc. | 0.5% |
| Textron, Inc. | 0.5% |
Availability of Additional Information
For additional information about the Fund, including its prospectus, financial information, holdings, and proxy information, visit www.strivefunds.com/stxm. You can also request information by calling (215) 882-9983.
Householding
Householding is an option available to certain investors of the Fund. Householding is a method of delivery, based on the preference of the individual investor, in which a single copy of certain shareholder documents can be delivered to investors who share the same address, even if their accounts are registered under different names. Householding for the Fund is available through certain broker-dealers. If you are interested in enrolling in householding and receiving a single copy of prospectuses and other shareholder documents or you are currently enrolled in householding and wish to change your householding status, please contact your broker-dealer.
Annual Shareholder Report: July 31, 2024
The Fund is distributed by Quasar Distributors, LLC.
| | | | | | | | |
| Fund Name: Strive Small-Cap ETF Ticker: STXK Listed on: New York Stock Exchange | July 31, 2024 Annual Shareholder Report www.strivefunds.com/stxk |
|
| | | | | | | | | | | |
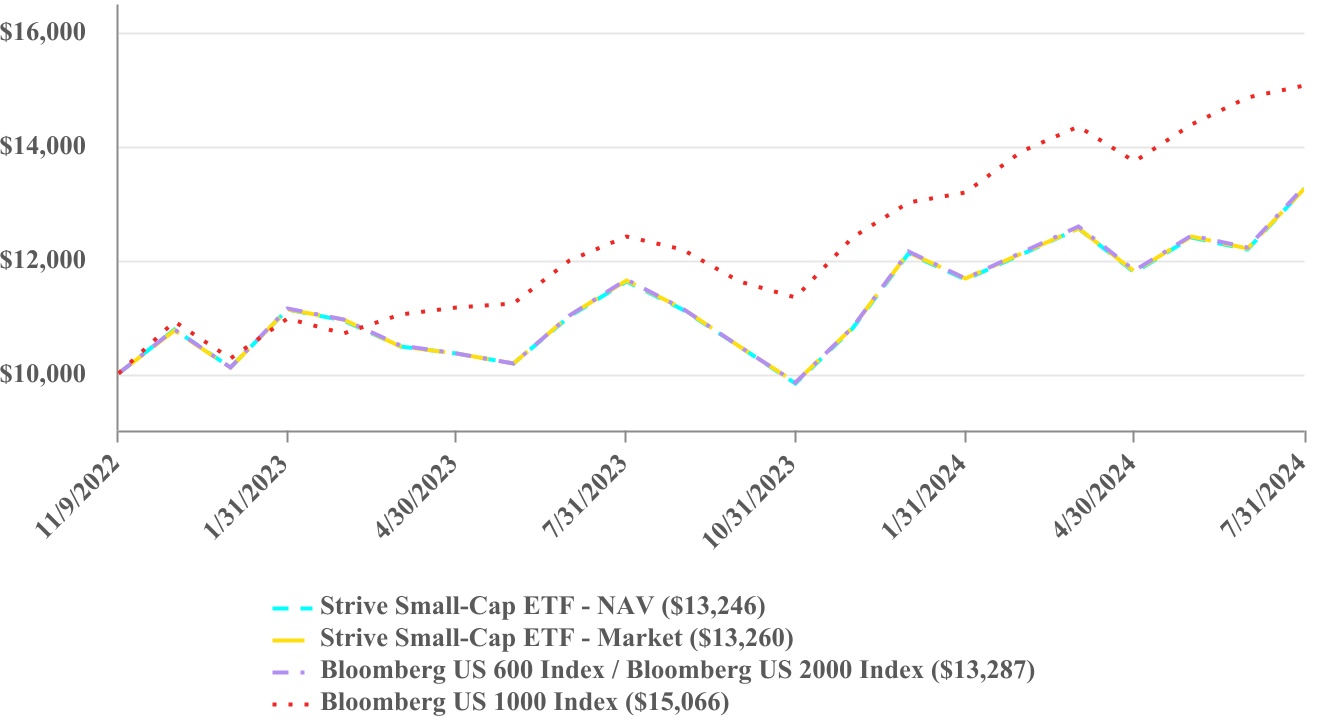
| This annual shareholder report contains important information about the Strive Small-Cap ETF (the “Fund”) for the period of August 1, 2023 to July 31, 2024 (the “Period”). You can find additional information about the Fund at www.strivefunds.com/stxk. You can also request this information by contacting us at (215) 882-9983. |
| | | | | | | | | | | |
WHAT WERE THE FUND COSTS FOR THE PERIOD?
(based on a hypothetical $10,000 investment) |
| COST OF $10,000 INVESTMENT | COST PAID AS A PERCENTAGE OF $10,000 INVESTMENT |
| $19 | 0.18% |
| | | | | | | | | | | |
| PERFORMANCE OF A HYPOTHETICAL $10,000 INVESTMENT |
| | | | | | | | | | | | | | |
| AVERAGE ANNUAL TOTAL RETURNS |
| | One Year | | Since Inception (11/9/2022) |
| Strive Small-Cap ETF - NAV | | 13.99% | | 17.72% |
| Strive Small-Cap ETF - Market | | 13.99% | | 17.79% |
| Bloomberg US 600 Index/Bloomberg US 2000 Index | | 14.14% | | 17.93% |
| Bloomberg US 1000 Index | | 21.51% | | 26.85% |
| | | | |
The Fund’s past performance is not a good predictor of how the Fund will perform in the future. The graph and table do not reflect the deduction of taxes that a shareholder would pay on Fund distributions or redemption of Fund shares. Effective January 25, 2023, the Fund’s investment objective changed to track the total return performance, before fees and expenses, of an index composed of U.S. small-capitalization companies, and the Fund’s investment strategy changed to track the investment results of the Bloomberg 600 Index. Prior to January 25, 2023, the Fund’s investment objective was to track the total return performance, before fees and expenses, of an index composed of U.S. small- and mid-capitalization companies, and the Fund’s investment strategy was to track the investment results of the Bloomberg US 2000 Index. Performance shown for the Bloomberg US 600 Index/Bloomberg US 2000 Index for periods prior to January 25, 2023 is that of the Bloomberg US 2000 Index and for periods beginning January 25, 2023 is that of the Bloomberg US 600 Index. Visit www.strivefunds.com/stxk for more recent performance information. |
Annual Shareholder Report: July 31, 2024
The Fund is distributed by Quasar Distributors, LLC.
| | | | | | | | |
| Fund Name: Strive Small-Cap ETF Ticker: STXK Listed on: New York Stock Exchange | July 31, 2024 Annual Shareholder Report www.strivefunds.com/stxk |
|
| | | | | | | | | | | |
| WHAT FACTORS INFLUENCED PERFORMANCE FOR THE PERIOD? |
U.S. small-cap stocks rose strongly during the Period amid solid economic growth, easing inflation, and shifting monetary policy. Companies in the financials sector, particularly those in the financial services, banking, and insurance industries, benefited from elevated interest rates and stable economic conditions. Companies in the industrials sector benefited from economic data bolstering estimates of future demand.
| | | | | | | | | | | | | | | | | | | | |
| KEY FUND STATISTICS (as of Period End) |
| Net Assets | | $54,845,733 | | Portfolio Turnover Rate* | | 31% |
| # of Portfolio Holdings | | 590 | | Advisory Fees Paid | | $66,975 |
| *Excludes impact of in-kind transactions. |
| | | | | |
SECTOR WEIGHTING
(as a % of Net Assets) |
| Industrials | 18.0% |
| Financials | 16.9% |
| Information Technology | 12.9% |
| Health Care | 12.9% |
| Consumer Discretionary | 12.3% |
| Materials | 6.4% |
| Real Estate | 6.1% |
| Energy | 5.3% |
| Utilities | 4.1% |
| Consumer Staples | 2.8% |
| Communication Services | 2.1% |
| Cash & Cash Equivalents | 0.2% |
| | | | | |
TOP 10 HOLDINGS
(as a % of Net Assets) |
| Insmed, Inc | 0.6% |
| Sprouts Farmers Market, Inc. | 0.5% |
| FTAI Aviation Ltd. | 0.5% |
| ATI, Inc. | 0.4% |
| Mueller Industries, Inc. | 0.4% |
| Allison Transmission Holdings, Inc. | 0.4% |
| DT Midstream, Inc. | 0.4% |
| Abercrombie & Fitch Co. - Class A | 0.4% |
| Carpenter Technology Corp. | 0.4% |
| Kirby Corp. | 0.4% |
Availability of Additional Information
For additional information about the Fund, including its prospectus, financial information, holdings, and proxy information, visit www.strivefunds.com/stxk. You can also request information by calling (215) 882-9983.
Householding
Householding is an option available to certain investors of the Fund. Householding is a method of delivery, based on the preference of the individual investor, in which a single copy of certain shareholder documents can be delivered to investors who share the same address, even if their accounts are registered under different names. Householding for the Fund is available through certain broker-dealers. If you are interested in enrolling in householding and receiving a single copy of prospectuses and other shareholder documents or you are currently enrolled in householding and wish to change your householding status, please contact your broker-dealer.
Annual Shareholder Report: July 31, 2024
The Fund is distributed by Quasar Distributors, LLC.
| | | | | | | | |
| Fund Name: Strive 1000 Growth ETF Ticker: STXG Listed on: New York Stock Exchange | July 31, 2024 Annual Shareholder Report www.strivefunds.com/stxg |
|
| | | | | | | | | | | |
| This annual shareholder report contains important information about the Strive 1000 Growth ETF (the “Fund”) for the period of August 1, 2023 to July 31, 2024 (the “Period”). You can find additional information about the Fund at www.strivefunds.com/stxg. You can also request this information by contacting us at (215) 882-9983. |
| | | | | | | | | | | |
WHAT WERE THE FUND COSTS FOR THE PERIOD?
(based on a hypothetical $10,000 investment) |
| COST OF $10,000 INVESTMENT | COST PAID AS A PERCENTAGE OF $10,000 INVESTMENT |
| $20 | 0.18% |
| | | | | | | | | | | |
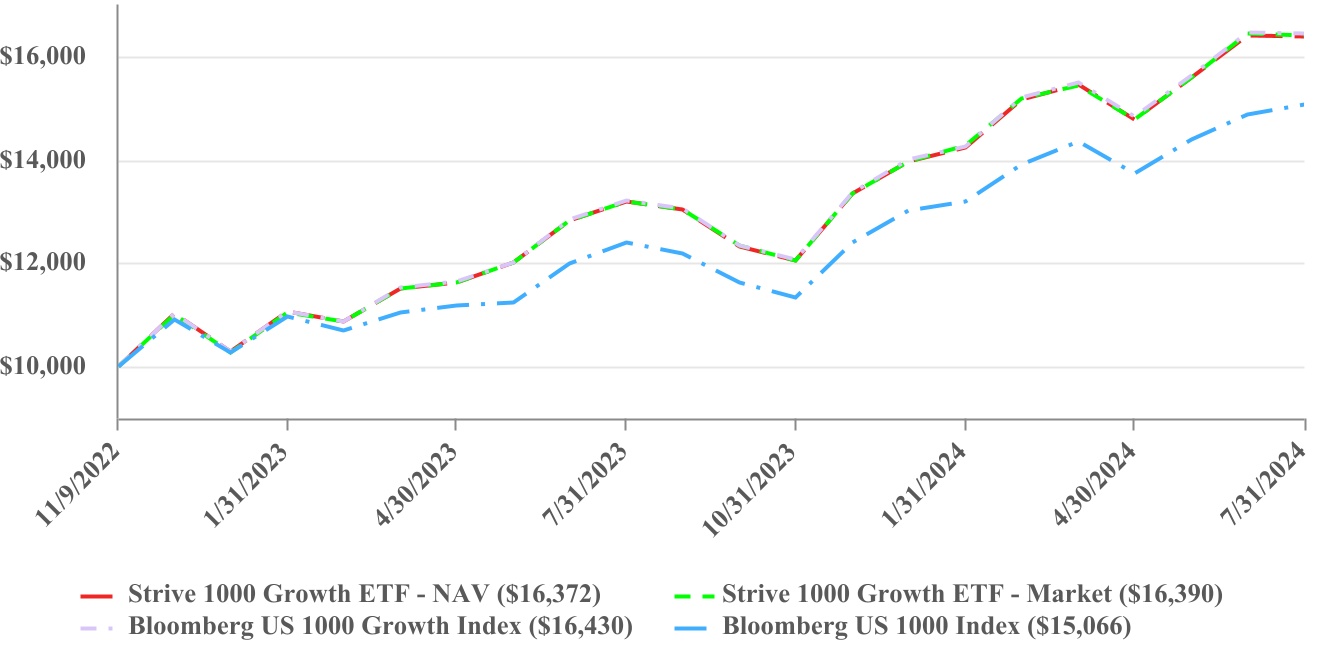
| PERFORMANCE OF A HYPOTHETICAL $10,000 INVESTMENT |
| | | | | | | | | | | | | | |
| AVERAGE ANNUAL TOTAL RETURNS |
| | One Year | | Since Inception (11/9/2022) |
| Strive 1000 Growth ETF - NAV | | 24.14% | | 33.12% |
| Strive 1000 Growth ETF - Market | | 24.37% | | 33.20% |
| Bloomberg US 1000 Growth Index | | 24.36% | | 33.39% |
| Bloomberg US 1000 Index | | 21.51% | | 26.85% |
| | | | |
The Fund’s past performance is not a good predictor of how the Fund will perform in the future. The graph and table do not reflect the deduction of taxes that a shareholder would pay on Fund distributions or redemption of Fund shares. Visit www.strivefunds.com/stxg for more recent performance information. |
| | | | | | | | | | | |
| WHAT FACTORS INFLUENCED PERFORMANCE FOR THE PERIOD? |
Growth tilted U.S. large- and mid-cap stocks rose strongly during the Period as solid economic growth, easing inflation, and shifting monetary policy supported equities. Companies in the technology sector, particularly those in the semiconductor industry, benefited from increased demand due to the rapid advancements in artificial intelligence (AI) technology, demand for specialized chips, and increased computing power. Companies in the communications sector, particularly those in the internet media and services industry, benefited from the growth of online advertising, which boosted revenue and income.
Annual Shareholder Report: July 31, 2024
The Fund is distributed by Quasar Distributors, LLC.
| | | | | | | | |
| Fund Name: Strive 1000 Growth ETF Ticker: STXG Listed on: New York Stock Exchange | July 31, 2024 Annual Shareholder Report www.strivefunds.com/stxg |
|
| | | | | | | | | | | | | | | | | | | | |
| KEY FUND STATISTICS (as of Period End) |
| Net Assets | | $86,952,529 | | Portfolio Turnover Rate* | | 9% |
| # of Portfolio Holdings | | 698 | | Advisory Fees Paid | | $94,514 |
| *Excludes impact of in-kind transactions. |
| | | | | |
SECTOR WEIGHTING
(as a % of Net Assets) |
| Information Technology | 41.1% |
| Consumer Discretionary | 11.8% |
| Health Care | 10.9% |
| Communication Services | 10.1% |
| Industrials | 8.8% |
| Financials | 8.2% |
| Consumer Staples | 3.8% |
| Real Estate | 2.0% |
| Materials | 1.8% |
| Energy | 0.8% |
| Utilities | 0.4% |
| Cash & Cash Equivalents | 0.3% |
| | | | | |
TOP 10 HOLDINGS
(as a % of Net Assets) |
| Apple, Inc. | 9.2% |
| Microsoft Corp. | 8.8% |
| Nvidia Corp. | 8.0% |
| Amazon.com, Inc. | 4.9% |
| Meta Platforms, Inc. - Class A | 3.0% |
| Alphabet, Inc. - Class A | 2.9% |
| Alphabet, Inc. - Class C | 2.4% |
| Broadcom, Inc. | 2.1% |
| Eli Lilly & Co. | 1.9% |
| Tesla, Inc. | 1.8% |
Availability of Additional Information
For additional information about the Fund, including its prospectus, financial information, holdings, and proxy information, visit www.strivefunds.com/stxg. You can also request information by calling (215) 882-9983.
Householding
Householding is an option available to certain investors of the Fund. Householding is a method of delivery, based on the preference of the individual investor, in which a single copy of certain shareholder documents can be delivered to investors who share the same address, even if their accounts are registered under different names. Householding for the Fund is available through certain broker-dealers. If you are interested in enrolling in householding and receiving a single copy of prospectuses and other shareholder documents or you are currently enrolled in householding and wish to change your householding status, please contact your broker-dealer.
Annual Shareholder Report: July 31, 2024
The Fund is distributed by Quasar Distributors, LLC.
| | | | | | | | |
| Fund Name: Strive 1000 Value ETF Ticker: STXV Listed on: New York Stock Exchange | July 31, 2024 Annual Shareholder Report www.strivefunds.com/stxv |
|
| | | | | | | | | | | |
| This annual shareholder report contains important information about the Strive 1000 Value ETF (the “Fund”) for the period of August 1, 2023 to July 31, 2024 (the “Period”). You can find additional information about the Fund at www.strivefunds.com/stxv. You can also request this information by contacting us at (215) 882-9983. |
| | | | | | | | | | | |
WHAT WERE THE FUND COSTS FOR THE PERIOD?
(based on a hypothetical $10,000 investment) |
| COST OF $10,000 INVESTMENT | COST PAID AS A PERCENTAGE OF $10,000 INVESTMENT |
| $19 | 0.18% |
| | | | | | | | | | | |
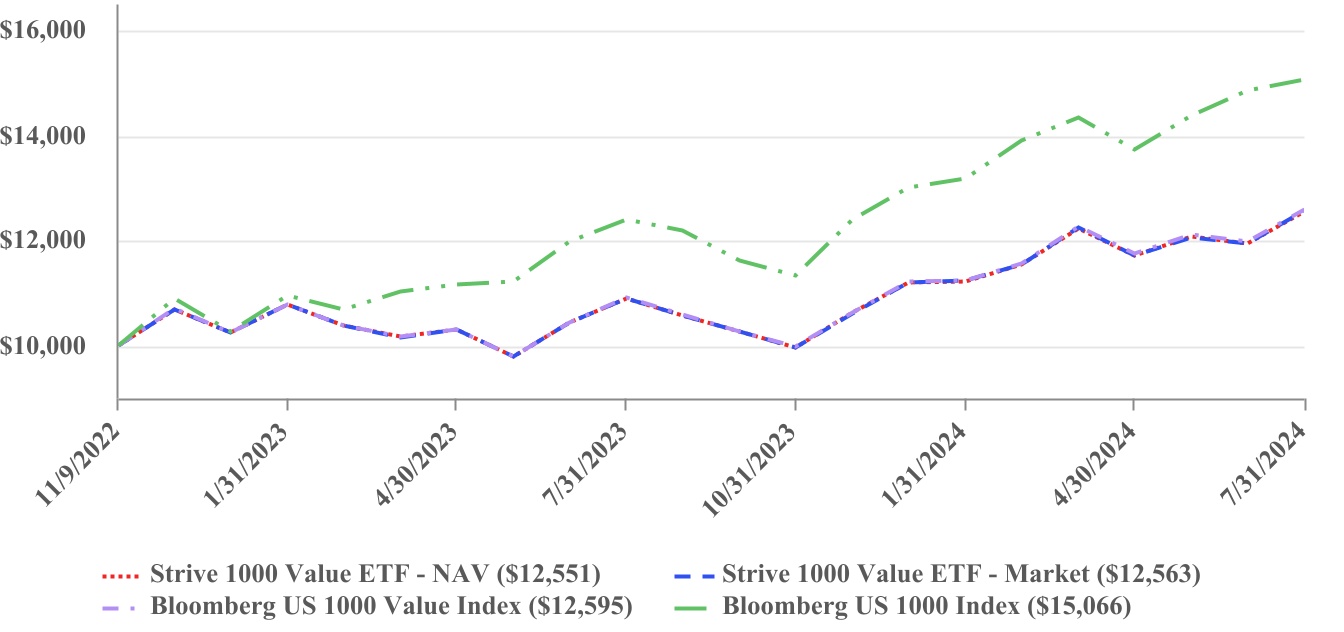
| PERFORMANCE OF A HYPOTHETICAL $10,000 INVESTMENT |
| | | | | | | | | | | | | | |
| AVERAGE ANNUAL TOTAL RETURNS |
| | One Year | | Since Inception (11/9/2022) |
| Strive 1000 Value ETF - NAV | | 15.12% | | 14.09% |
| Strive 1000 Value ETF - Market | | 15.33% | | 14.16% |
| Bloomberg US 1000 Value Index | | 15.39% | | 14.33% |
| Bloomberg US 1000 Index | | 21.51% | | 26.85% |
| | | | |
The Fund’s past performance is not a good predictor of how the Fund will perform in the future. The graph and table do not reflect the deduction of taxes that a shareholder would pay on Fund distributions or redemption of Fund shares. Visit www.strivefunds.com/stxv for more recent performance information. |
| | | | | | | | | | | |
| WHAT FACTORS INFLUENCED PERFORMANCE FOR THE PERIOD? |
U.S. large- and mid-cap stocks rose strongly during the Period as solid economic growth, easing inflation, and shifting monetary policy supported equities, though value-tilted stocks trailed the stronger returns of growth-tilted companies favored by investors during the Period. Companies in the financials sector, particularly those in the financial services, banking, and insurance industries, benefited from elevated interest rates and stable economic conditions. Companies in the industrials sector benefited from economic data bolstering estimates of future demand. Value-tilted companies in the technology sector benefited from increased demand due to the rapid advancements in artificial intelligence (AI) technology.
Annual Shareholder Report: July 31, 2024
The Fund is distributed by Quasar Distributors, LLC.
| | | | | | | | |
| Fund Name: Strive 1000 Value ETF Ticker: STXV Listed on: New York Stock Exchange | July 31, 2024 Annual Shareholder Report www.strivefunds.com/stxv |
|
| | | | | | | | | | | | | | | | | | | | |
| KEY FUND STATISTICS (as of Period End) |
| Net Assets | | $54,678,934 | | Portfolio Turnover Rate* | | 13% |
| # of Portfolio Holdings | | 700 | | Advisory Fees Paid | | $55,133 |
| *Excludes impact of in-kind transactions. |
| | | | | |
SECTOR WEIGHTING
(as a % of Net Assets) |
| Financials | 23.6% |
| Health Care | 13.8% |
| Energy | 10.5% |
| Industrials | 10.2% |
| Consumer Staples | 9.9% |
| Utilities | 6.5% |
| Information Technology | 6.3% |
| Consumer Discretionary | 6.0% |
| Communication Services | 5.3% |
| Real Estate | 3.7% |
| Materials | 3.6% |
| Cash & Cash Equivalents | 0.6% |
| | | | | |
TOP 10 HOLDINGS
(as a % of Net Assets) |
| JPMorgan Chase & Co. | 4.0% |
| Exxon Mobil Corp. | 3.4% |
| Chevron Corp. | 1.8% |
| Bank of America Corp. | 1.8% |
| Johnson & Johnson | 1.8% |
| Walmart, Inc. | 1.4% |
| Wells Fargo & Co. | 1.4% |
| Berkshire Hathaway, Inc. - Class B | 1.3% |
| AbbVie, Inc. | 1.2% |
| Philip Morris International, Inc. | 1.2% |
Availability of Additional Information
For additional information about the Fund, including its prospectus, financial information, holdings, and proxy information, visit www.strivefunds.com/stxv. You can also request information by calling (215) 882-9983.
Householding
Householding is an option available to certain investors of the Fund. Householding is a method of delivery, based on the preference of the individual investor, in which a single copy of certain shareholder documents can be delivered to investors who share the same address, even if their accounts are registered under different names. Householding for the Fund is available through certain broker-dealers. If you are interested in enrolling in householding and receiving a single copy of prospectuses and other shareholder documents or you are currently enrolled in householding and wish to change your householding status, please contact your broker-dealer.
Annual Shareholder Report: July 31, 2024
The Fund is distributed by Quasar Distributors, LLC.
| | | | | | | | |
| Fund Name: Strive 1000 Dividend Growth ETF Ticker: STXD Listed on: New York Stock Exchange | July 31, 2024 Annual Shareholder Report www.strivefunds.com/stxd |
|
| | | | | | | | | | | |
| This annual shareholder report contains important information about the Strive 1000 Dividend Growth ETF (the “Fund”) for the period of August 1, 2023 to July 31, 2024 (the “Period”). You can find additional information about the Fund at www.strivefunds.com/stxd. You can also request this information by contacting us at (215) 882-9983. |
| | | | | | | | | | | |
WHAT WERE THE FUND COSTS FOR THE PERIOD?
(based on a hypothetical $10,000 investment) |
| COST OF $10,000 INVESTMENT | COST PAID AS A PERCENTAGE OF $10,000 INVESTMENT |
| $38 | 0.35% |
| | | | | | | | | | | |
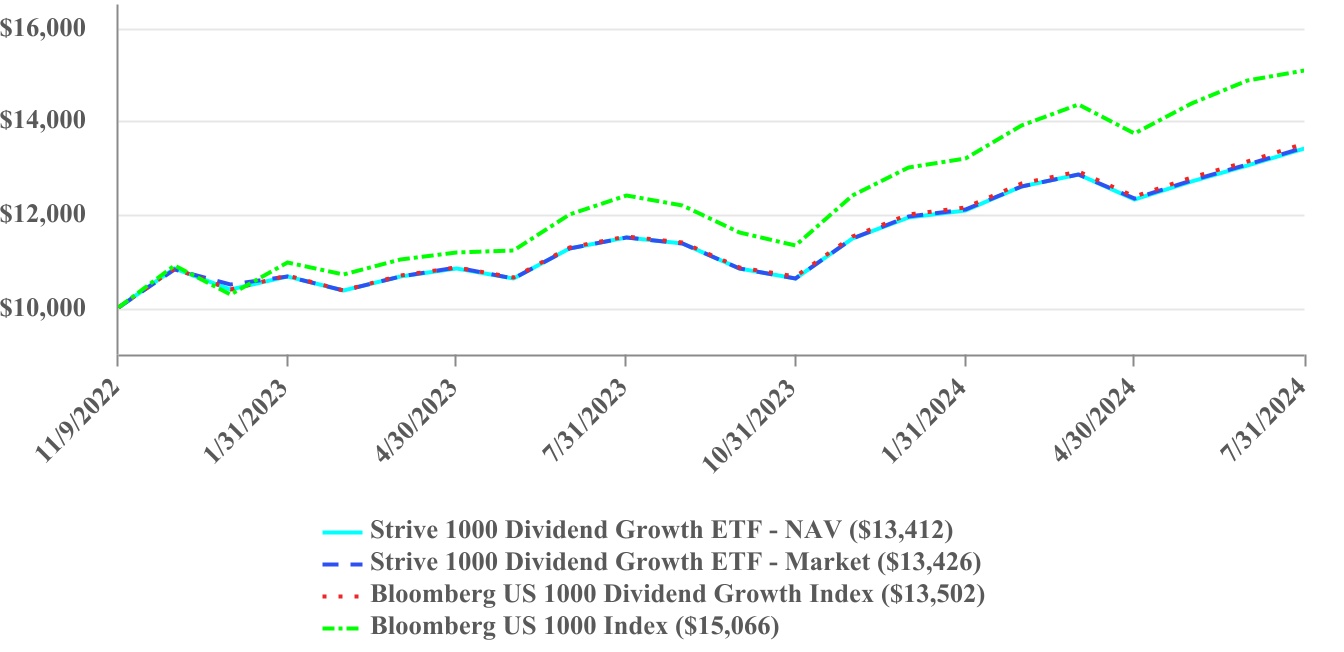
| PERFORMANCE OF A HYPOTHETICAL $10,000 INVESTMENT |
| | | | | | | | | | | | | | |
| AVERAGE ANNUAL TOTAL RETURNS |
| | One Year | | Since Inception (11/9/2022) |
| Strive 1000 Dividend Growth ETF - NAV | | 16.73% | | 18.57% |
| Strive 1000 Dividend Growth ETF - Market | | 16.78% | | 18.64% |
| Bloomberg US 1000 Dividend Growth Index | | 17.18% | | 19.03% |
| Bloomberg US 1000 Index | | 21.51% | | 26.85% |
| | | | |
The Fund’s past performance is not a good predictor of how the Fund will perform in the future. The graph and table do not reflect the deduction of taxes that a shareholder would pay on Fund distributions or redemption of Fund shares. Visit www.strivefunds.com/stxd for more recent performance information. |
| | | | | | | | | | | |
| WHAT FACTORS INFLUENCED PERFORMANCE FOR THE PERIOD? |
Growth tilted U.S. large- and mid-cap stocks with a history of consistently growing dividends rose strongly during the Period. Companies in the technology sector, particularly those in the semiconductor industry, benefited from increased demand due to the rapid advancements in artificial intelligence (AI) technology, demand for specialized chips, and increased computing power. Companies in the health care sector, particularly those in the pharmaceuticals industry, benefited from the development of new drugs, like the popular new GLP-1 drugs for weight loss. Companies in the financials sector benefited from elevated interest rates and stable economic conditions.
Annual Shareholder Report: July 31, 2024
The Fund is distributed by Quasar Distributors, LLC.
| | | | | | | | |
| Fund Name: Strive 1000 Dividend Growth ETF Ticker: STXD Listed on: New York Stock Exchange | July 31, 2024 Annual Shareholder Report www.strivefunds.com/stxd |
|
| | | | | | | | | | | | | | | | | | | | |
| KEY FUND STATISTICS (as of Period End) |
| Net Assets | | $43,199,757 | | Portfolio Turnover Rate* | | 10% |
| # of Portfolio Holdings | | 215 | | Advisory Fees Paid | | $116,836 |
| *Excludes impact of in-kind transactions. |
| | | | | |
SECTOR WEIGHTING
(as a % of Net Assets) |
| Information Technology | 24.7% |
| Health Care | 22.8% |
| Industrials | 14.1% |
| Financials | 13.8% |
| Consumer Staples | 8.1% |
| Consumer Discretionary | 7.5% |
| Materials | 3.6% |
| Real Estate | 3.1% |
| Utilities | 1.6% |
| Energy | 0.4% |
| Communication Services | 0.1% |
| Cash & Cash Equivalents | 0.2% |
| | | | | |
TOP 10 HOLDINGS
(as a % of Net Assets) |
| Apple, Inc. | 5.2% |
| Broadcom, Inc. | 4.7% |
| Microsoft Corp. | 4.6% |
| Eli Lilly & Co. | 4.4% |
| UnitedHealth Group, Inc. | 3.4% |
| Visa, Inc. - Class A | 2.7% |
| Mastercard, Inc. - Class A | 2.4% |
| Procter & Gamble Co. | 2.4% |
| Johnson & Johnson | 2.4% |
| Home Depot, Inc. | 2.3% |
Availability of Additional Information
For additional information about the Fund, including its prospectus, financial information, holdings, and proxy information, visit www.strivefunds.com/stxd. You can also request information by calling (215) 882-9983.
Householding
Householding is an option available to certain investors of the Fund. Householding is a method of delivery, based on the preference of the individual investor, in which a single copy of certain shareholder documents can be delivered to investors who share the same address, even if their accounts are registered under different names. Householding for the Fund is available through certain broker-dealers. If you are interested in enrolling in householding and receiving a single copy of prospectuses and other shareholder documents or you are currently enrolled in householding and wish to change your householding status, please contact your broker-dealer.
Annual Shareholder Report: July 31, 2024
The Fund is distributed by Quasar Distributors, LLC.
| | | | | | | | |
| Fund Name: Strive U.S. Energy ETF Ticker: DRLL Listed on: New York Stock Exchange | July 31, 2024 Annual Shareholder Report www.strivefunds.com/drll |
|
This annual shareholder report contains important information about the Strive U.S. Energy ETF (the “Fund”) for the period of August 1, 2023 to July 31, 2024 (the “Period”). You can find additional information about the Fund at www.strivefunds.com/drll. You can also request this information by contacting us at (215) 882-9983. This report describes changes to the Fund that occurred during the Period.
| | | | | | | | | | | |
WHAT WERE THE FUND COSTS FOR THE PERIOD?
(based on a hypothetical $10,000 investment) |
| COST OF $10,000 INVESTMENT | COST PAID AS A PERCENTAGE OF $10,000 INVESTMENT |
| $42 | 0.41% |
| | | | | | | | | | | |
| PERFORMANCE OF A HYPOTHETICAL $10,000 INVESTMENT |
| | | | | | | | | | | | | | |
| AVERAGE ANNUAL TOTAL RETURNS |
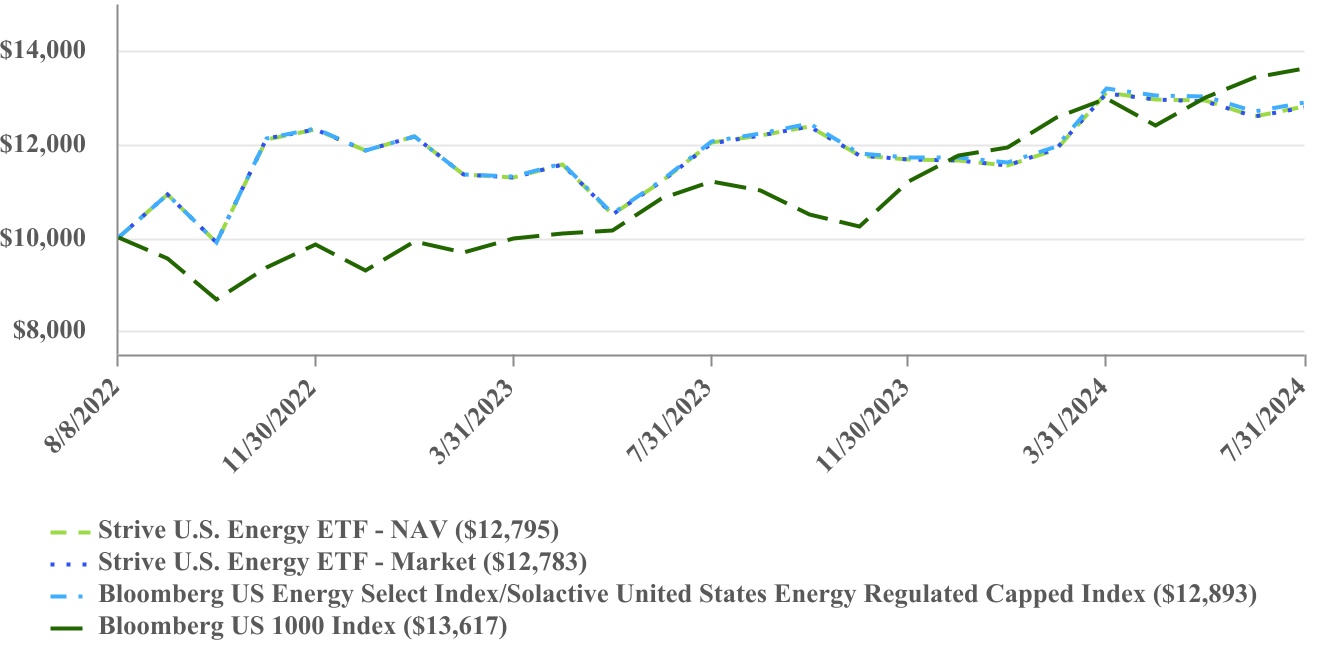
| | One Year | | Since Inception (8/8/2022) |
| Strive U.S. Energy ETF - NAV | | 6.43% | | 13.27% |
| Strive U.S. Energy ETF - Market | | 6.40% | | 13.22% |
| Bloomberg US Energy Select Index/Solactive United States Energy Regulated Capped Index | | 6.91% | | 13.71% |
| Bloomberg US 1000 Index | | 21.51% | | 16.89% |
| | | | |
The Fund’s past performance is not a good predictor of how the Fund will perform in the future. The graph and table do not reflect the deduction of taxes that a shareholder would pay on Fund distributions or redemption of Fund shares. Effective April 11, 2024, the Fund’s investment strategy changed to track the investment results of the Bloomberg US Energy Select Index. Prior to April 11, 2024, the Fund’s investment strategy was to track the investment results of the Solactive United States Energy Regulated Capped Index. Performance shown for the Bloomberg US Energy Select Index/Solactive United States Energy Regulated Capped Index for periods prior to April 11, 2024 is that of the Solactive United States Energy Regulated Capped Index and for periods beginning April 11, 2024 is that of the Bloomberg US Energy Select Index. Visit www.strivefunds.com/drll for more recent performance information. |
Annual Shareholder Report: July 31, 2024
The Fund is distributed by Quasar Distributors, LLC.
| | | | | | | | |
| Fund Name: Strive U.S. Energy ETF Ticker: DRLL Listed on: New York Stock Exchange | July 31, 2024 Annual Shareholder Report www.strivefunds.com/drll |
|
| | | | | | | | | | | |
| WHAT FACTORS INFLUENCED PERFORMANCE FOR THE PERIOD? |
U.S. large- and mid-cap energy stocks returned positive in the Period amid a volatile year for the energy sector. The Fund’s return was largely correlated to the price of oil, which saw significant volatility in the fall and declined by the end of the calendar year 2023. Oil prices and the corresponding energy sector equities then recovered rapidly during February and March 2024.
| | | | | | | | | | | | | | | | | | | | |
| KEY FUND STATISTICS (as of Period End) |
| Net Assets | | $344,210,854 | | Portfolio Turnover Rate* | | 21% |
| # of Portfolio Holdings | | 40 | | Advisory Fees Paid | | $1,419,497 |
| *Excludes impact of in-kind transactions. |
| | | | | |
INDUSTRY WEIGHTING
(as a % of Net Assets) |
| Integrated Oil & Gas | 47.5% |
| Oil & Gas Exploration & Production | 36.5% |
| Oil & Gas Refining & Marketing | 15.0% |
| Automotive Retail | 0.9% |
| Cash & Cash Equivalents | 0.1% |
| | | | | |
Top 10 Holdings
(as a % of Net Assets) |
| Exxon Mobil Corp. | 22.9% |
| Chevron Corp. | 20.9% |
| Phillips 66 | 4.5% |
| EOG Resources, Inc. | 4.5% |
| Marathon Petroleum Corp. | 4.5% |
| Valero Energy Corp. | 4.3% |
| Hess Corp. | 4.2% |
| ConocoPhillips | 3.7% |
| Occidental Petroleum Corp. | 3.5% |
| Diamondback Energy, Inc. | 2.9% |
Material Fund Changes
Effective April 11, 2024, the Fund’s investment strategy changed to track the investment results of the Bloomberg US Energy Select Index. Prior to April 11, 2024, the Fund’s investment strategy was to track the investment results of the Solactive United States Energy Regulated Capped Index. For more complete information, you may review the Fund’s next prospectus, which we expect to be available by November 30, 2024, at www.strivefunds.com/drll or upon request by calling (215) 882-9983.
Availability of Additional Information
For additional information about the Fund, including its prospectus, financial information, holdings, and proxy information, visit www.strivefunds.com/drll. You can also request information by calling (215) 882-9983.
Householding
Householding is an option available to certain investors of the Fund. Householding is a method of delivery, based on the preference of the individual investor, in which a single copy of certain shareholder documents can be delivered to investors who share the same address, even if their accounts are registered under different names. Householding for the Fund is available through certain broker-dealers. If you are interested in enrolling in householding and receiving a single copy of prospectuses and other shareholder documents or you are currently enrolled in householding and wish to change your householding status, please contact your broker-dealer.
Annual Shareholder Report: July 31, 2024
The Fund is distributed by Quasar Distributors, LLC.
| | | | | | | | |
| Fund Name: Strive U.S. Semiconductor ETF Ticker: SHOC Listed on: New York Stock Exchange | July 31, 2024 Annual Shareholder Report www.strivefunds.com/shoc |
|
| | | | | | | | | | | |
| This annual shareholder report contains important information about the Strive U.S. Semiconductor ETF (the “Fund”) for the period of August 1, 2023 to July 31, 2024 (the “Period”). You can find additional information about the Fund at www.strivefunds.com/shoc. You can also request this information by contacting us at (215) 882-9983. This report describes changes to the Fund that occurred during the Period. |
| | | | | | | | | | | |
WHAT WERE THE FUND COSTS FOR THE PERIOD?
(based on a hypothetical $10,000 investment) |
| COST OF $10,000 INVESTMENT | COST PAID AS A PERCENTAGE OF $10,000 INVESTMENT |
| $46 | 0.40% |
| | | | | | | | | | | |
| PERFORMANCE OF A HYPOTHETICAL $10,000 INVESTMENT |
| | | | | | | | | | | | | | |
| AVERAGE ANNUAL TOTAL RETURNS |
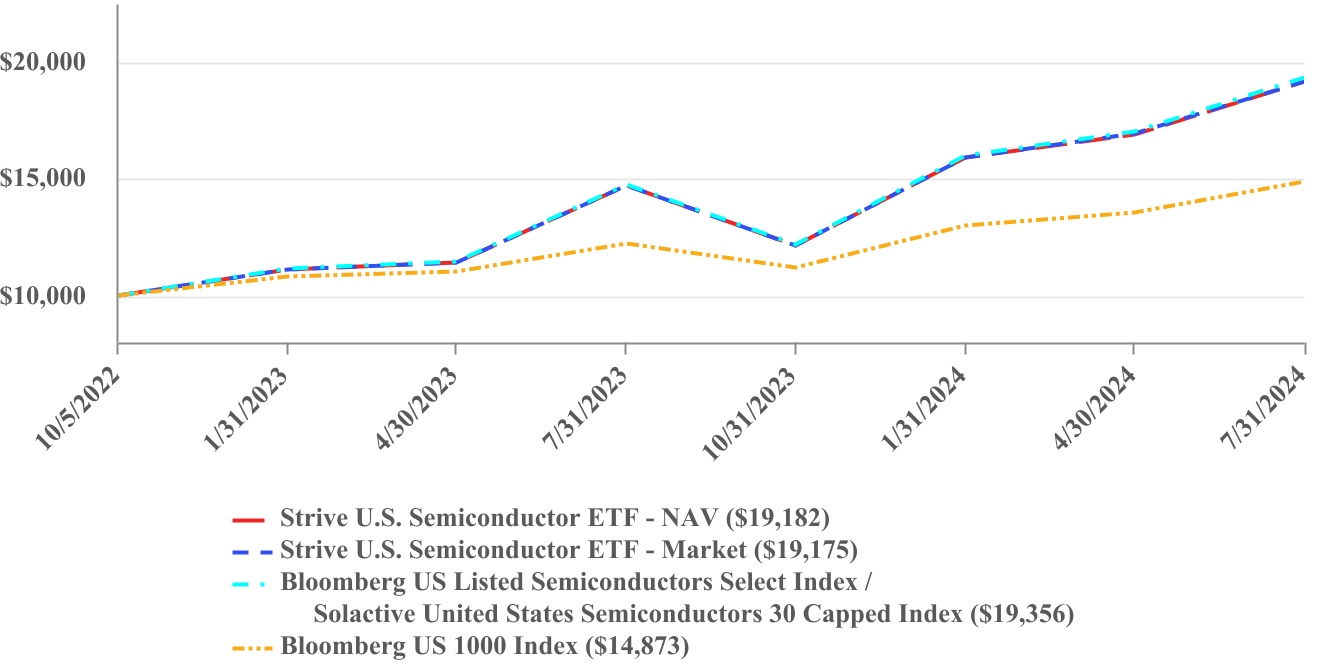
| | One Year | | Since Inception (10/5/2022) |
| Strive U.S. Semiconductor ETF - NAV | | 30.46% | | 43.03% |
| Strive U.S. Semiconductor ETF - Market | | 30.38% | | 43.06% |
| Bloomberg US Listed Semiconductors Select Index/Solactive United States Semiconductors 30 Capped Index | | 31.12% | | 43.77% |
| Bloomberg US 1000 Index | | 21.51% | | 24.39% |
| | | | |
The Fund’s past performance is not a good predictor of how the Fund will perform in the future. The graph and table do not reflect the deduction of taxes that a shareholder would pay on Fund distributions or redemption of Fund shares. Effective March 21, 2024, the Fund’s investment strategy changed to track the investment results of the Bloomberg US Listed Semiconductors Select Index. Prior to March 21, 2024, the Fund’s investment strategy was to track the investment results of the Solactive United States Semiconductors 30 Capped Index. Performance shown for the Bloomberg US Listed Semiconductors Select Index/Solactive United States Semiconductors 30 Capped Index for periods prior to March 21, 2024 is that of the Solactive United States Semiconductors 30 Capped Index and for periods beginning March 21, 2024 is that of the Bloomberg US Listed Semiconductors Select Index. Visit www.strivefunds.com/shoc for more recent performance information. |
Annual Shareholder Report: July 31, 2024
The Fund is distributed by Quasar Distributors, LLC.
| | | | | | | | |
| Fund Name: Strive U.S. Semiconductor ETF Ticker: SHOC Listed on: New York Stock Exchange | July 31, 2024 Annual Shareholder Report www.strivefunds.com/shoc |
|
| | | | | | | | | | | |
| WHAT FACTORS INFLUENCED PERFORMANCE FOR THE PERIOD? |
The U.S. listed semiconductor industry saw remarkable returns over the Period as a result of major advancements in artificial intelligence (AI) technology. The rapid advancements in generative AI and large language models, which allow users to generate output from simple natural language queries, drove a surge in demand for specialized chips and increased computing power. | | | | | | | | | | | | | | | | | | | | |
| KEY FUND STATISTICS (as of Period End) |
| Net Assets | | $83,169,291 | | Portfolio Turnover Rate* | | 29% |
| # of Portfolio Holdings | | 31 | | Advisory Fees Paid | | $211,458 |
| *Excludes impact of in-kind transactions. |
| | | | | |
INDUSTRY WEIGHTING
(as a % of Net Assets) |
| Semiconductors | 62.8% |
| Semiconductor Materials & Equipment | 25.2% |
| Electronic Components | 2.7% |
| Application Software | 5.4% |
| Electronic Manufacturing Services | 1.6% |
| Electronic Equipment & Instruments | 0.8% |
| Specialty Chemicals | 0.4% |
| Electrical Components & Equipment | 0.2% |
| Cash & Cash Equivalents | 0.9% |
| | | | | |
TOP 10 HOLDINGS
(as a % of Net Assets) |
| Nvidia Corp. | 24.7% |
| ASML Holding NV | 11.3% |
| Advanced Micro Devices, Inc. | 7.2% |
| Broadcom, Inc. | 5.1% |
| Texas Instruments, Inc. | 4.5% |
| Intel Corp. | 4.4% |
| Applied Materials, Inc. | 4.3% |
| Lam Research Corp. | 4.1% |
| Analog Devices, Inc. | 4.0% |
| Micron Technology, Inc. | 3.9% |
Material Fund Changes
Effective March 21, 2024, the Fund’s investment strategy changed to track the investment results of the Bloomberg US Listed Semiconductors Select Index. Prior to March 21, 2024, the Fund’s investment strategy was to track the investment results of the Solactive United States Semiconductors 30 Capped Index. For more complete information, you may review the Fund’s next prospectus, which we expect to be available by November 30, 2024, at www.strivefunds.com/shoc or upon request by calling (215) 882-9983.
Availability of Additional Information
For additional information about the Fund, including its prospectus, financial information, holdings, and proxy information, visit www.strivefunds.com/shoc. You can also request information by calling (215) 882-9983.
Householding
Householding is an option available to certain investors of the Fund. Householding is a method of delivery, based on the preference of the individual investor, in which a single copy of certain shareholder documents can be delivered to investors who share the same address, even if their accounts are registered under different names. Householding for the Fund is available through certain broker-dealers. If you are interested in enrolling in householding and receiving a single copy of prospectuses and other shareholder documents or you are currently enrolled in householding and wish to change your householding status, please contact your broker-dealer.
Annual Shareholder Report: July 31, 2024
The Fund is distributed by Quasar Distributors, LLC.
| | | | | | | | |
| Fund Name: Strive Natural Resources and Security ETF Ticker: FTWO Listed on: New York Stock Exchange | July 31, 2024 Annual Shareholder Report www.strivefunds.com/ftwo |
|
| | | | | | | | | | | |
| This annual shareholder report contains important information about the Strive Natural Resources and Security ETF (the “Fund”) for the period of August 30, 2023 to July 31, 2024 (the “Period”). You can find additional information about the Fund at www.strivefunds.com/ftwo. You can also request this information by contacting us at (215) 882-9983. This report describes changes to the Fund that occurred subsequent to the Period end. |
| | | | | | | | | | | |
WHAT WERE THE FUND COSTS FOR THE PERIOD?
(based on a hypothetical $10,000 investment) |
| COST OF $10,000 INVESTMENT | COST PAID AS A PERCENTAGE OF $10,000 INVESTMENT |
| $49 | 0.49% |
| | | | | | | | | | | |
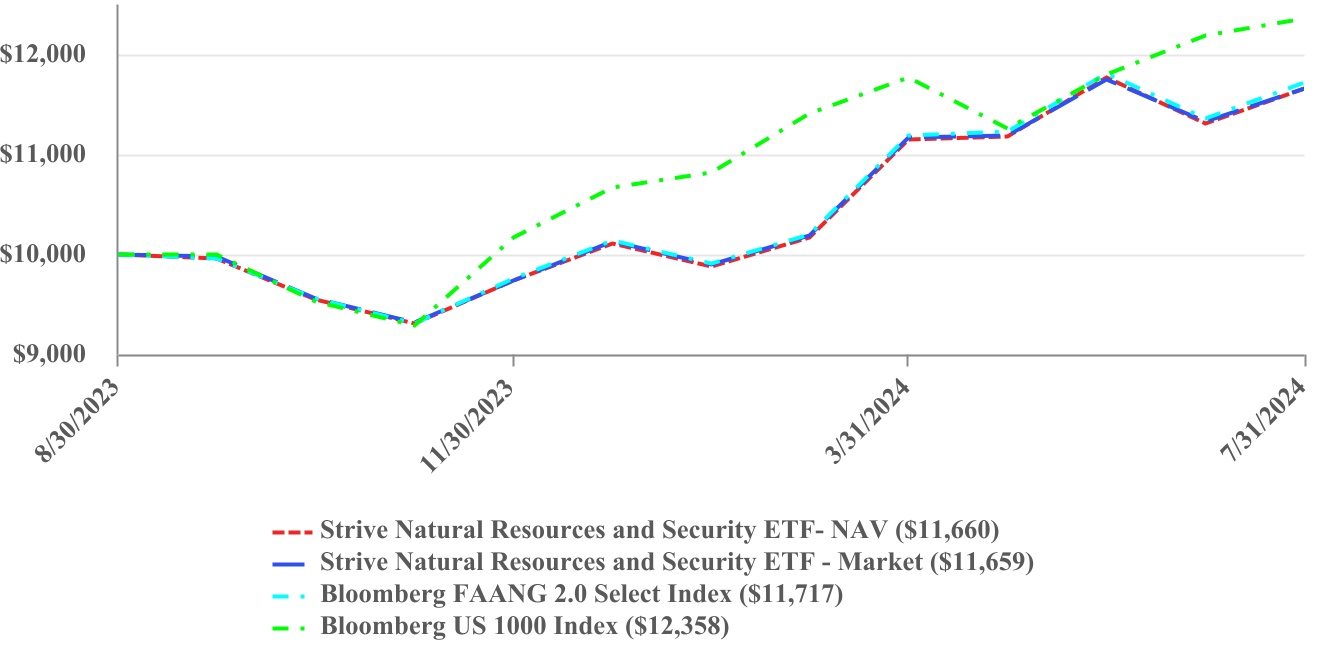
| PERFORMANCE OF A HYPOTHETICAL $10,000 INVESTMENT |
| | | | | | | | | | | | | | |
| CUMULATIVE TOTAL RETURNS |
| | | | Since Inception (8/30/2023) |
| Strive Natural Resources and Security ETF - NAV | | | | 16.60% |
| Strive Natural Resources and Security ETF- Market | | | | 16.59% |
| Bloomberg FAANG 2.0 Select Index | | | | 17.17% |
| Bloomberg US 1000 Index | | | | 23.58% |
| | | | |
The Fund’s past performance is not a good predictor of how the Fund will perform in the future. The graph and table do not reflect the deduction of taxes that a shareholder would pay on fund distributions or redemption of fund shares. Visit www.strivefunds.com/ftwo for more recent performance information. |
| | | | | | | | | | | |
| WHAT FACTORS INFLUENCED PERFORMANCE FOR THE PERIOD? |
North American stocks in the natural resources and security industries rose strongly during the reporting period. The Fund invests in companies whose primary business activities are involved in Fuel, Aerospace & Defense, Agriculture, Nuclear, and Gold & Precious Metals. Companies in the nuclear energy industry benefited from the market’s expectation for significant demand growth as advances in artificial intelligence (AI) technology require large amounts of reliable energy. Fuel companies benefited from the price of oil during the Period. Both Aerospace & Defense and Gold & Precious Metals companies benefited from increased revenue due to increased geopolitical tensions and expectations of persistent inflation.
Annual Shareholder Report: July 31, 2024
The Fund is distributed by Quasar Distributors, LLC.
| | | | | | | | |
| Fund Name: Strive Natural Resources and Security ETF Ticker: FTWO Listed on: New York Stock Exchange | July 31, 2024 Annual Shareholder Report www.strivefunds.com/ftwo |
|
| | | | | | | | | | | | | | | | | | | | |
| KEY FUND STATISTICS (as of Period End) |
| Net Assets | | $23,207,766 | | Portfolio Turnover Rate* | | 27% |
| # of Portfolio Holdings | | 49 | | Advisory Fees Paid | | $35,619 |
| *Portfolio turnover is not annualized and is calculated without regard to short-term securities having a maturity of less than one year. Excludes impact of in-kind transactions. |
| | | | | |
SECTOR WEIGHTING
(as a % of Net Assets) |
| Industrials | 33.5% |
| Materials | 29.0% |
| Energy | 25.6% |
| Utilities | 10.9% |
| Consumer Staples | 0.7% |
| Cash & Cash Equivalents | 0.3% |
| | | | | |
TOP 10 HOLDINGS
(as a % of Net Assets) |
| Constellation Energy Corp. | 10.9% |
| Deere & Co. | 8.3% |
| Exxon Mobil Corp. | 8.0% |
| Freeport-McMoRan, Inc. | 4.8% |
| General Electric Co. | 4.3% |
| Newmont Corp. | 4.2% |
| Chevron Corp. | 4.2% |
| RTX Corp. | 3.7% |
| Cameco Corp. | 3.6% |
| Corteva, Inc. | 3.3% |
Material Fund Changes
Effective August 16, 2024, the Fund’s name changed from Strive FAANG 2.0 ETF to Strive Natural Resources and Security ETF. For more complete information, you may review the Fund’s next prospectus, which we expect to be available by November 30, 2024, at www.strivefunds.com/ftwo or upon request by calling (215) 882-9983.
Availability of Additional Information
For additional information about the Fund, including its prospectus, financial information, holdings, and proxy information, visit www.strivefunds.com/ftwo. You can also request information by calling (215) 882-9983.
Householding
Householding is an option available to certain investors of the Fund. Householding is a method of delivery, based on the preference of the individual investor, in which a single copy of certain shareholder documents can be delivered to investors who share the same address, even if their accounts are registered under different names. Householding for the Fund is available through certain broker-dealers. If you are interested in enrolling in householding and receiving a single copy of prospectuses and other shareholder documents or you are currently enrolled in householding and wish to change your householding status, please contact your broker-dealer.
Annual Shareholder Report: July 31, 2024
The Fund is distributed by Quasar Distributors, LLC.
| | | | | | | | |
| Fund Name: Strive Emerging Markets Ex-China ETF Ticker: STXE Listed on: New York Stock Exchange | July 31, 2024 Annual Shareholder Report www.strivefunds.com/stxe |
|
| | | | | | | | | | | |
| This annual shareholder report contains important information about the Strive Emerging Markets Ex-China ETF (the “Fund”) for the period of August 1, 2023 to July 31, 2024 (the “Period”). You can find additional information about the Fund at www.strivefunds.com/stxe. You can also request this information by contacting us at (215) 882-9983. |
| | | | | | | | | | | |
WHAT WERE THE FUND COSTS FOR THE PERIOD?
(based on a hypothetical $10,000 investment) |
| COST OF $10,000 INVESTMENT | COST PAID AS A PERCENTAGE OF $10,000 INVESTMENT |
| $34 | 0.32% |
| | | | | | | | | | | |
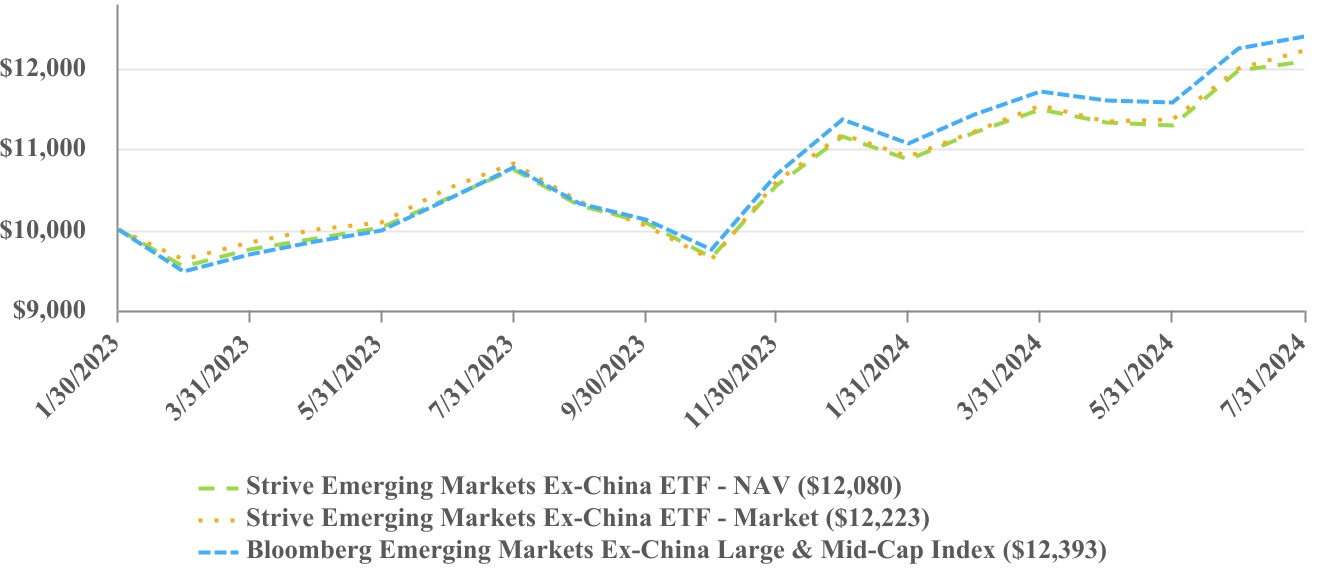
| PERFORMANCE OF A HYPOTHETICAL $10,000 INVESTMENT |
| | | | | | | | | | | | | | |
| AVERAGE ANNUAL TOTAL RETURNS |
| | One Year | | Since Inception (1/30/2023) |
| Strive Emerging Markets Ex-China ETF - NAV | | 12.38% | | 13.44% |
| Strive Emerging Markets Ex-China ETF - Market | | 12.92% | | 14.33% |
| Bloomberg Emerging Markets Ex-China Large & Mid-Cap Index | | 15.14% | | 15.39% |
| | | | |
The Fund’s past performance is not a good predictor of how the Fund will perform in the future. The graph and table do not reflect the deduction of taxes that a shareholder would pay on Fund distributions or redemption of Fund shares. Visit www.strivefunds.com/stxe for more recent performance information. |
| | | | | | | | | | | |
| WHAT FACTORS INFLUENCED PERFORMANCE FOR THE PERIOD? |
Stocks in the emerging market countries excluding China increased during the reporting period, led by strong returns from equities in India and Taiwan. Indian companies benefited from increasing infrastructure investment, and other Southeast Asian countries benefited from stable demand for manufactured goods. Stocks in the emerging market countries excluding China trailed markets in the United States due to a strong dollar and higher-than-expected interest rates set by the Federal Reserve.
Annual Shareholder Report: July 31, 2024
The Fund is distributed by Quasar Distributors, LLC.
| | | | | | | | |
| Fund Name: Strive Emerging Markets Ex-China ETF Ticker: STXE Listed on: New York Stock Exchange | July 31, 2024 Annual Shareholder Report www.strivefunds.com/stxe |
|
| | | | | | | | | | | | | | | | | | | | |
| KEY FUND STATISTICS (as of Period End) |
| Net Assets | | $100,345,667 | | Portfolio Turnover Rate* | | 80% |
| # of Portfolio Holdings | | 271 | | Advisory Fees Paid | | $305,035 |
| *Excludes impact of in-kind transactions. |
| | | | | |
SECTOR WEIGHTING
(as a % of Net Assets) |
| Information Technology | 31.5% |
| Financials | 28.9% |
| Materials | 7.0% |
| Energy | 5.8% |
| Consumer Discretionary | 5.5% |
| Industrials | 5.3% |
| Consumer Staples | 5.1% |
| Communication Services | 3.9% |
| Utilities | 3.2% |
| Health Care | 2.6% |
| Real Estate | 0.9% |
| Cash & Cash Equivalents | 0.3% |
| | | | | |
TOP 10 HOLDINGS
(as a % of Net Assets) |
| Taiwan Semiconductor Manufacturing Co. Ltd. | 13.1% |
| Samsung Electronics Co. Ltd. | 6.7% |
| HDFC Bank Ltd. | 3.0% |
| Reliance Industries Ltd. | 2.3% |
| ICICI Bank Ltd. | 2.1% |
| Al Rajhi Bank | 2.0% |
| Infosys Ltd. | 1.5% |
| SK Hynix, Inc. | 1.5% |
| Hon Hai Precision Industry Co. Ltd. | 1.3% |
| Tata Consultancy Services Ltd. | 1.0% |
| | | | | |
COUNTRY WEIGHTING
(as a % of Net Assets) |
| India | 30.5% |
| Taiwan | 22.9% |
| South Korea | 15.1% |
| Saudi Arabia | 7.2% |
| Brazil | 5.9% |
| Mexico | 3.1% |
| South Africa | 2.8% |
| Indonesia | 2.4% |
| United Arab Emirates | 2.2% |
| Thailand | 2.0% |
| Kuwait | 1.1% |
| Poland | 1.1% |
| Qatar | 0.8% |
| Philippines | 0.7% |
| Malaysia | 0.6% |
| Turkey | 0.4% |
| Hungry | 0.3% |
| Peru | 0.3% |
| Greece | 0.1% |
| Chile | 0.1% |
| Cash & Cash Equivalents | 0.3% |
Availability of Additional Information
For additional information about the Fund, including its prospectus, financial information, holdings, and proxy information, visit www.strivefunds.com/stxe. You can also request information by calling (215) 882-9983.
Householding
Householding is an option available to certain investors of the Fund. Householding is a method of delivery, based on the preference of the individual investor, in which a single copy of certain shareholder documents can be delivered to investors who share the same address, even if their accounts are registered under different names. Householding for the Fund is available through certain broker-dealers. If you are interested in enrolling in householding and receiving a single copy of prospectuses and other shareholder documents or you are currently enrolled in householding and wish to change your householding status, please contact your broker-dealer.
Annual Shareholder Report: July 31, 2024
The Fund is distributed by Quasar Distributors, LLC.
| | | | | | | | |
| Fund Name: Strive International Developed Markets ETF Ticker: STXI Listed on: New York Stock Exchange | July 31, 2024 Annual Shareholder Report www.strivefunds.com/stxi |
|
| | | | | | | | | | | |
| This annual shareholder report contains important information about the Strive International Developed Markets ETF (the “Fund”) for the period of June 25, 2024 to July 31, 2024 (the “Period”). You can find additional information about the Fund at www.strivefunds.com/stxi. You can also request this information by contacting us at (215) 882-9983. |
| | | | | | | | | | | |
WHAT WERE THE FUND COSTS FOR THE PERIOD?
(based on a hypothetical $10,000 investment) |
| COST OF $10,000 INVESTMENT | COST PAID AS A PERCENTAGE OF $10,000 INVESTMENT |
| $3 | 0.29% |
| | | | | | | | | | | |
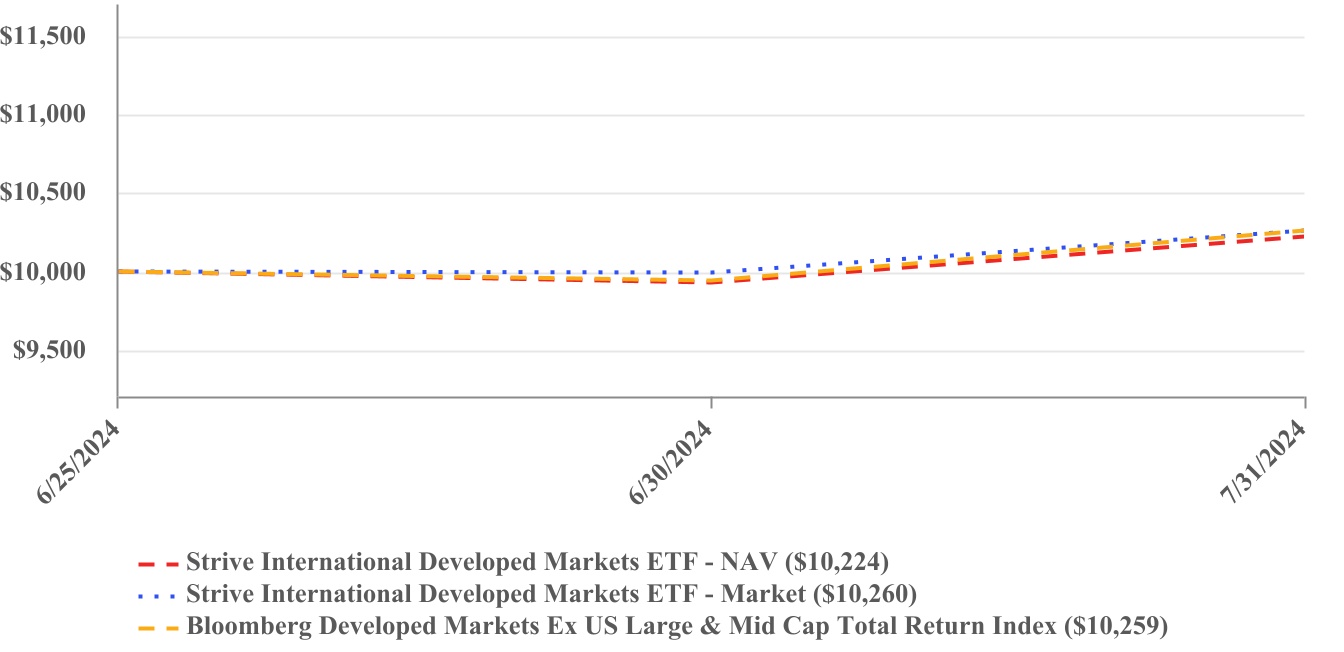
| PERFORMANCE OF A HYPOTHETICAL $10,000 INVESTMENT |
| | | | | | | | | | | | | | |
| CUMULATIVE TOTAL RETURNS |
| | | | Since Inception (6/25/2024) |
| Strive International Developed Markets ETF - NAV | | | | 2.24% |
| Strive International Developed Markets ETF - Market | | | | 2.60% |
| Bloomberg Developed Markets Ex US Large & Mid Cap Total Return Index | | | | 2.59% |
| | | | |
The Fund’s past performance is not a good predictor of how the Fund will perform in the future. The graph and table do not reflect the deduction of taxes that a shareholder would pay on Fund distributions or redemption of Fund shares. Visit www.strivefunds.com/stxi for more recent performance information. |
| | | | | | | | | | | |
| WHAT FACTORS INFLUENCED PERFORMANCE FOR THE PERIOD? |
Stocks in developed market countries outside of the United States returned modestly positive results in the reporting period since the Fund’s inception. Japan and Canada led performance of developed markets equities outside of the United States. Stocks in ex-U.S. markets trailed those in the United States due to a strong dollar and higher-than-expected interest rates set by the Federal Reserve.
Annual Shareholder Report: July 31, 2024
The Fund is distributed by Quasar Distributors, LLC.
| | | | | | | | |
| Fund Name: Strive International Developed Markets ETF Ticker: STXI Listed on: New York Stock Exchange | July 31, 2024 Annual Shareholder Report www.strivefunds.com/stxi |
|
| | | | | | | | | | | | | | | | | | | | |
| KEY FUND STATISTICS (as of Period End) |
| Net Assets | | $10,269,481 | | Portfolio Turnover Rate* | | 0% |
| # of Portfolio Holdings | | 269 | | Advisory Fees Paid | | $1,863 |
| *Portfolio turnover is not annualized and is calculated without regard to short-term securities having a maturity of less than one year. Excludes impact of in-kind transactions. |
| | | | | |
SECTOR WEIGHTING
(as a % of Net Assets) |
| Financials | 24.0% |
| Industrials | 15.6% |
| Health Care | 13.5% |
| Consumer Discretionary | 10.1% |
| Information Technology | 9.4% |
| Consumer Staples | 7.8% |
| Materials | 6.9% |
| Energy | 5.8% |
| Communication Services | 3.4% |
| Utilities | 2.4% |
| Real Estate | 0.8% |
| Cash & Cash Equivalents | 0.3% |
| | | | | |
TOP 10 HOLDINGS
(as a % of Net Assets) |
| Novo Nordisk AS | 3.1% |
| ASML Holding NV | 2.4% |
| Nestle SA | 1.8% |
| Novartis AG | 1.6% |
| AstraZeneca PLC | 1.6% |
| Shell PLC | 1.6% |
| Roche Holding AG | 1.6% |
| SAP SE | 1.5% |
| Toyota Motor Corp. | 1.5% |
| LVMH Moet Hennessy Louis Vuitton SE | 1.2% |
| | | | | |
COUNTRY WEIGHTING
(as a % of Net Assets) |
| Japan | 19.8% |
| United Kingdom | 13.4% |
| France | 11.6% |
| Canada | 11.3% |
| Switzerland | 10.6% |
| Germany | 7.7% |
| Australia | 6.3% |
| Netherlands | 4.9% |
| Denmark | 3.8% |
| Spain | 2.6% |
| Sweden | 2.0% |
| Italy | 2.0% |
| Singapore | 1.0% |
| Hong Kong | 0.9% |
| Belgium | 0.7% |
| Finland | 0.6% |
| Ireland | 0.5% |
| Cash & Cash Equivalents | 0.3% |
Availability of Additional Information
For additional information about the Fund, including its prospectus, financial information, holdings, and proxy information, visit www.strivefunds.com/stxi. You can also request information by calling (215) 882-9983.
Householding
Householding is an option available to certain investors of the Fund. Householding is a method of delivery, based on the preference of the individual investor, in which a single copy of certain shareholder documents can be delivered to investors who share the same address, even if their accounts are registered under different names. Householding for the Fund is available through certain broker-dealers. If you are interested in enrolling in householding and receiving a single copy of prospectuses and other shareholder documents or you are currently enrolled in householding and wish to change your householding status, please contact your broker-dealer.
Annual Shareholder Report: July 31, 2024
The Fund is distributed by Quasar Distributors, LLC.
| | | | | | | | |
| Fund Name: Strive Total Return Bond ETF Ticker: STXT Listed on: New York Stock Exchange | July 31, 2024 Annual Shareholder Report www.strivefunds.com/stxt |
|
| | | | | | | | | | | |
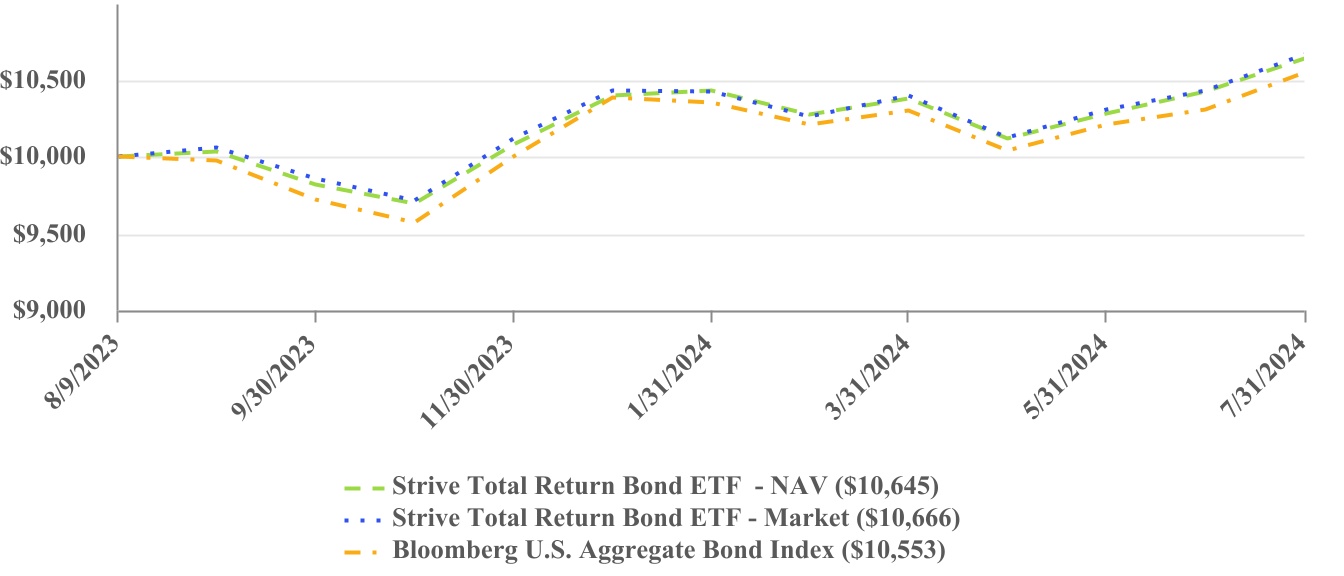
| This annual shareholder report contains important information about the Strive Total Return Bond ETF (the “Fund”) for the period of August 9, 2023 to July 31, 2024 (the “Period”). You can find additional information about the Fund at www.strivefunds.com/stxt. You can also request this information by contacting us at (215) 882-9983. |
| | | | | | | | | | | |
WHAT WERE THE FUND COSTS FOR THE PERIOD?
(based on a hypothetical $10,000 investment) |
| COST OF $10,000 INVESTMENT | COST PAID AS A PERCENTAGE OF $10,000 INVESTMENT |
| $49 | 0.49% |
| | | | | | | | | | | |
| PERFORMANCE OF A HYPOTHETICAL $10,000 INVESTMENT |
| | | | | | | | | | | | | | |
| CUMULATIVE TOTAL RETURNS |
| | | | Since Inception (8/9/2023) |
| Strive Total Return Bond ETF - NAV | | | | 6.45% |
| Strive Total Return Bond ETF - Market | | | | 6.66% |
| Bloomberg U.S. Aggregate Bond Index | | | | 5.53% |
| | | | |
The Fund’s past performance is not a good predictor of how the Fund will perform in the future. The graph and table do not reflect the deduction of taxes that a shareholder would pay on Fund distributions or redemption of Fund shares. Visit www.strivefunds.com/stxt for more recent performance information. |
| | | | | | | | | | | |
| WHAT FACTORS INFLUENCED PERFORMANCE FOR THE PERIOD? |
The Fund provides actively managed core fixed income exposure with a tactical allocation to structured credit and high-yield corporates. The Fund’s return was impacted by changes in interest rates over the Period.
The Fund’s allocation to agency residential mortgage-backed securities (RMBS), asset-backed securities, and non-agency RMBS were the most significant drivers of positive performance, while collateralized loan obligations, corporate bonds, and non-agency commercial mortgage-backed securities were smaller positive contributors to overall performance. The Fund’s allocation to agency RMBS was the largest contributor to positive performance because of bond selection and an overweight up-in-coupon. The use of treasury futures to increase the Fund’s duration in line with the Bloomberg U.S. Aggregate Bond Index detracted from performance, particularly in the first half of 2024, with a move wider in treasury rates.
Annual Shareholder Report: July 31, 2024
The Fund is distributed by Quasar Distributors, LLC.
| | | | | | | | |
| Fund Name: Strive Total Return Bond ETF Ticker: STXT Listed on: New York Stock Exchange | July 31, 2024 Annual Shareholder Report www.strivefunds.com/stxt |
|
| | | | | | | | | | | | | | | | | | | | |
| KEY FUND STATISTICS (as of Period End) |
| Net Assets | | $101,856,254 | | Portfolio Turnover Rate* | | 51% |
| # of Portfolio Holdings | | 201 | | Advisory Fees Paid | | $339,288 |
| *Portfolio turnover is not annualized and is calculated without regard to short-term securities having a maturity of less than one year. Excludes impact of in-kind transactions. |
| | | | | |
SECTOR WEIGHTING
(as a % of Net Assets) |
| Mortgage-Backed Securities | 45.6% |
| Asset-Backed Securities | 17.2% |
| U.S. Treasury Securities | 15.2% |
| Corporate Bonds | 9.8% |
| Collateralized Loan Obligations | 4.8% |
| Collateralized Mortgage Obligations | 4.5% |
| Cash & Cash Equivalents | 2.9% |
| | | | | |
TOP 10 HOLDINGS
(as a % of Net Assets) |
| Federal Home Loan Mortgage Corp. Pool SD8384, 6.00%, 12/01/2053 | 2.3% |
| Ginnie Mae II Pool Pool SD8384, 6.00%, 12/01/2053 | 2.1% |
| Ginnie Mae II Pool Pool MA9105, 5.00%, 08/20/2053 | 1.9% |
| Federal Home Loan Mortgage Corp. Pool SD8256, 4.00%, 10/01/2052 | 1.8% |
| United States Treasury Note/Bond 4.13%, 10/31/2027 | 1.8% |
| Federal National Mortgage Association Pool FS5635, 4.00%, 11/01/2052 | 1.7% |
| Ginnie Mae II Pool Pool MA8491, 5.50%, 12/20/2052 | 1.5% |
| United States Treasury Note/Bond 3.13%, 08/15/2025 | 1.4% |
| Ginnie Mae II Pool Pool MA9106, 5.50%, 08/20/2053 | 1.4% |
| Federal Home Loan Mortgage Corp. Pool SD5809, 6.00%, 07/01/2054 | 1.4% |
Availability of Additional Information
For additional information about the Fund, including its prospectus, financial information, holdings, and proxy information, visit www.strivefunds.com/stxt. You can also request information by calling (215) 882-9983.
Householding
Householding is an option available to certain investors of the Fund. Householding is a method of delivery, based on the preference of the individual investor, in which a single copy of certain shareholder documents can be delivered to investors who share the same address, even if their accounts are registered under different names. Householding for the Fund is available through certain broker-dealers. If you are interested in enrolling in householding and receiving a single copy of prospectuses and other shareholder documents or you are currently enrolled in householding and wish to change your householding status, please contact your broker-dealer.
Annual Shareholder Report: July 31, 2024
The Fund is distributed by Quasar Distributors, LLC.
| | | | | | | | |
| Fund Name: Strive Enhanced Income Short Maturity ETF Ticker: BUXX Listed on: New York Stock Exchange | July 31, 2024 Annual Shareholder Report www.strivefunds.com/buxx |
|
| | | | | | | | | | | |
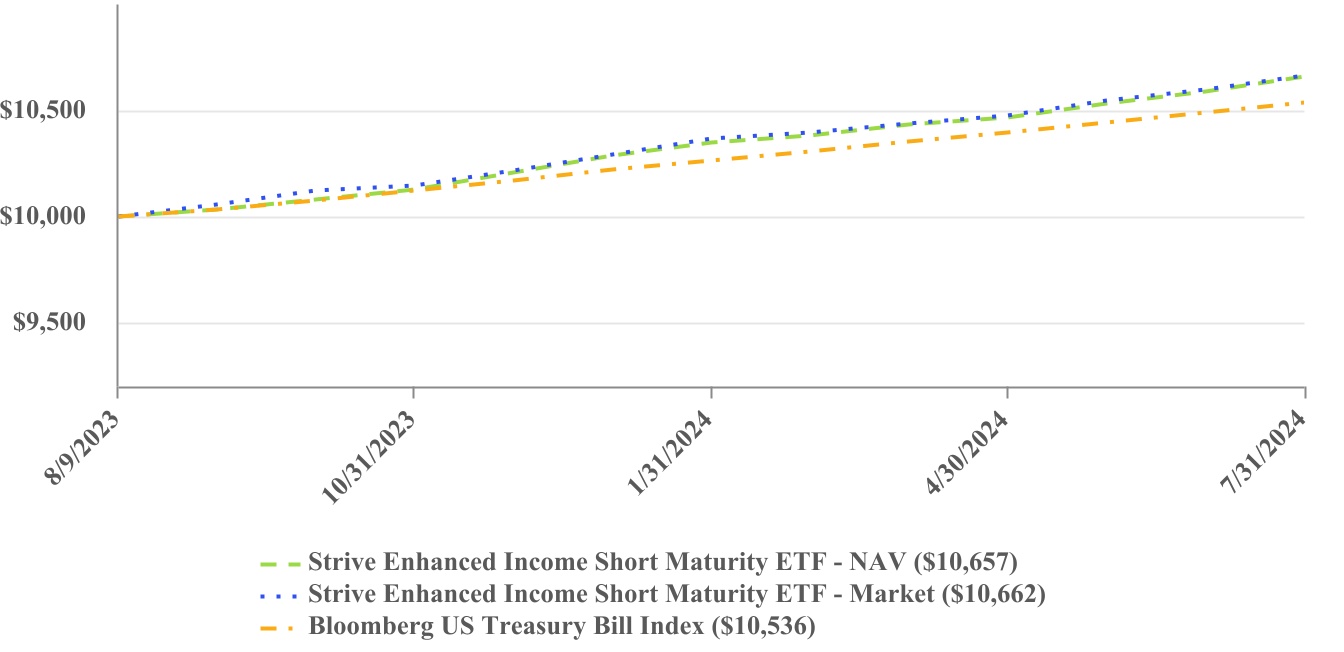
| This annual shareholder report contains important information about the Strive Enhanced Income Short Maturity ETF (the “Fund”) for the period of August 9, 2023 to July 31, 2024 (the “Period”). You can find additional information about the Fund at www.strivefunds.com/buxx. You can also request this information by contacting us at (215) 882-9983. |
| | | | | | | | | | | |
WHAT WERE THE FUND COSTS FOR THE PERIOD?
(based on a hypothetical $10,000 investment) |
| COST OF $10,000 INVESTMENT | COST PAID AS A PERCENTAGE OF $10,000 INVESTMENT |
| $25 | 0.25% |
| | | | | | | | | | | |
| PERFORMANCE OF A HYPOTHETICAL $10,000 INVESTMENT |
| | | | | | | | | | | | | | |
| CUMULATIVE TOTAL RETURNS |
| | | | Since Inception (8/9/2023) |
| Strive Enhanced Income Short Maturity ETF - NAV | | | | 6.57% |
| Strive Enhanced Income Short Maturity ETF - Market | | | | 6.62% |
| Bloomberg US Treasury Bill Index | | | | 5.36% |
| | | | |
The Fund’s past performance is not a good predictor of how the Fund will perform in the future. The graph and table do not reflect the deduction of taxes that a shareholder would pay on Fund distributions or redemption of Fund shares. Visit www.strivefunds.com/buxx for more recent performance information. |
| | | | | | | | | | | |
| WHAT FACTORS INFLUENCED PERFORMANCE FOR THE PERIOD? |
The Fund provides exposure to short-term investment grade assets in structured credit and investment grade corporate sectors to provide durable enhanced yield and outperformance over a full market cycle. The Fund’s return was impacted by changes in interest rates over the Period.
The Fund’s allocations to asset-backed securities (ABS), corporate bonds, and agency commercial mortgage-backed securities were the most significant drivers of positive performance, while exposure to collateralized loan obligations, non-agency residential mortgage-backed securities, and Treasuries were smaller positive contributions to overall performance. ABS was the most significant contributor to positive performance, specifically with income generation coming from an overweight to short-duration auto and consumer credits that benefited from the attractive higher yields on the front end of the yield curve. The Fund’s higher yield, duration, and tighter spreads contributed to relative performance versus the benchmark. The Fund’s overweight to investment grade bonds led to less relative outperformance versus other fixed income sectors like securitized credit during the Period.
Annual Shareholder Report: July 31, 2024
The Fund is distributed by Quasar Distributors, LLC.
| | | | | | | | |
| Fund Name: Strive Enhanced Income Short Maturity ETF Ticker: BUXX Listed on: New York Stock Exchange | July 31, 2024 Annual Shareholder Report www.strivefunds.com/buxx |
|
| | | | | | | | | | | | | | | | | | | | |
| KEY FUND STATISTICS (as of Period End) |
| Net Assets | | $115,628,066 | | Portfolio Turnover Rate* | | 83% |
| # of Portfolio Holdings | | 220 | | Advisory Fees Paid | | $175,960 |
| *Portfolio turnover is not annualized and is calculated without regard to short-term securities having a maturity of less than one year. Excludes impact of in-kind transactions. |
| | | | | |
SECTOR WEIGHTING
(as a % of Net Assets) |
| Asset-Backed Securities | 28.0% |
| Corporate Bonds | 27.3% |
| Collateralized Mortgage Obligations | 26.4% |
| Collateralized Loan Obligations | 9.8% |
| U.S. Treasury Securities | 1.5% |
| Mortgage-Backed Securities | 0.6% |
| Cash & Cash Equivalents | 6.4% |
| | | | | |
TOP 10 HOLDINGS
(as a % of Net Assets) |
| Federal Home Loan Mortgage Corp. Series K056, Class A2, 2.53%, 05/25/2026 | 2.1% |
| Federal Home Loan Mortgage Corp. Series K048, Class A2, 3.28%, 06/25/2025 | 1.7% |
| Federal Home Loan Mortgage Corp. Series K047, Class A2, 3.33%, 05/25/2025 | 1.4% |
| Freddie Mac Structured Agency Credit Risk Debt Notes Series 2024-DNA1, Class M1, 6.70% (30 day avg SOFR US +1.35%), 02/25/2044 | 1.3% |
| THL Credit Lake Shore MM CLO Ltd. Series 2019-2A, Class A1RR, 6.69% (3mo. Term SOFR + 1.40%), 10/17/2031 | 1.3% |
| Gallatin CLO Ltd., Series 2017-1a, Class A1R, 6.65% (3 mo. Term SOFR + 1.35%), 07/15/2031 | 1.2% |
| American Credit Acceptance Receivables Trust, Series 2022-4, Class D, 8.00%, 02/15/2029 | 1.2% |
| Pagaya AI Debt Selection Trust, Series 2024-3, Class B, 6.57%, 10/15/2031 | 1.1% |
| Federal Home Loan Mortgage Corp. Series K055, Class A2, 2.67%, 03/25/2026 | 1.0% |
| Federal Home Loan Mortgage Corp. Series K057, Class A2, 2.57%, 07/25/2026 | 1.0% |
Availability of Additional Information
For additional information about the Fund, including its prospectus, financial information, holdings, and proxy information, visit www.strivefunds.com/buxx. You can also request information by calling (215) 882-9983.
Householding
Householding is an option available to certain investors of the Fund. Householding is a method of delivery, based on the preference of the individual investor, in which a single copy of certain shareholder documents can be delivered to investors who share the same address, even if their accounts are registered under different names. Householding for the Fund is available through certain broker-dealers. If you are interested in enrolling in householding and receiving a single copy of prospectuses and other shareholder documents or you are currently enrolled in householding and wish to change your householding status, please contact your broker-dealer.
Annual Shareholder Report: July 31, 2024
The Fund is distributed by Quasar Distributors, LLC.
(b) Not applicable
Item 2. Code of Ethics.
The registrant has adopted a code of ethics that applies to the registrant’s principal executive officer and principal financial officer. The registrant has not made any amendments to its code of ethics during the year covered by this report. The registrant has not granted any waivers from any provisions of the code of ethics during the year covered by this report.
A copy of the registrant’s Code of Ethics is incorporated by reference.
Item 3. Audit Committee Financial Expert.
The registrant’s Board of Trustees of the Trust has determined that there is at least one audit committee financial expert serving on its audit committee. Dr. Michael Pagano is an “audit committee financial expert” and is considered to be “independent” as each term is defined in Item 3 of Form N-CSR.
Item 4. Principal Accountant Fees and Services.
The registrant has engaged its principal accountant to perform audit services, audit-related services, tax services and other services during the past fiscal year. “Audit services” refer to performing an audit of the registrant’s annual financial statements or services that are normally provided by the accountant in connection with statutory and regulatory filings or engagements for those fiscal years. “Audit-related services” refer to the assurance and related services by the principal accountant that are reasonably related to the performance of the audit. “Tax services” refer to professional services rendered by the principal accountant for tax compliance, tax advice, and tax planning, including review of the registrant’s tax returns and calculations of required income, capital gain and excise distributions. There were no “Other services” provided by the principal accountant. The following table details the aggregate fees billed or expected to be billed for the last fiscal year for audit fees, audit-related fees, tax fees and other fees by the principal accountant.
| | | | | | | | | | | | | | | | | | | | | | | | | | | | | | | | | |
| STRV | | STXM | | | STXK | | STXG |
| | FYE 7/31/2024 | FYE 7/31/2023 | | FYE 7/31/2024 | | | FYE 7/31/2024 | FYE 7/31/2023 | | FYE 7/31/2024 | FYE 7/31/2023 |
| (a) Audit Fees | $8,750 | $7,250 | | $7,250 | | | $8,750 | $7,250 | | $8,750 | $7,250 |
| (b) Audit-Related Fees | N/A | N/A | | N/A | | | N/A | N/A | | N/A | N/A |
| (c)Tax Fees | $2,250 | $1,750 | | $1,750 | | | $2,250 | $1,750 | | $2,250 | $1,750 |
| (d) All Other Fees | N/A | N/A | | N/A | | | N/A | N/A | | N/A | N/A |
| | | | | | | | | | | | | | | | | | | | | | | | | | | | | | | | | | | |
| | STXV | | STXD | | DRLL | | SHOC |
FYE 7/31/2024 | FYE 7/31/2023 | | FYE 7/31/2024 | FYE 7/31/2023 | | FYE 7/31/2024 | FYE 7/31/2023 | | FYE 7/31/2024 | FYE 7/31/2023 |
| (a) Audit Fees | $8,750 | $7,250 | | $8,750 | $7,250 | | $8,750 | $7,250 | | $8,750 | $7,250 |
| (b) Audit-Related Fees | N/A | N/A | | N/A | N/A | | N/A | N/A | | N/A | N/A |
| (c)Tax Fees | $2,250 | $1,750 | | $2,250 | $1,750 | | $2,250 | $1,750 | | $2,250 | $1,750 |
| (d) All Other Fees | N/A | N/A | | N/A | N/A | | N/A | N/A | | N/A | N/A |
| | | | | | | | | | | | | | | | | | | | | | | | | | | | | | | | | | | |
| | FTWO | | STXE | | STXI | | STXT | | BUXX | |
FYE 7/31/2024 | | | FYE 7/31/2024 | FYE 7/31/2023 | | FYE 7/31/2024 | | | FYE 7/31/2024 | | FYE 7/31/2024 | |
| (a) Audit Fees | $7,250 | | | $8,750 | $7,250 | | $7,250 | | | $7,250 | | $7,250 | |
| (b) Audit-Related Fees | N/A | | | N/A | N/A | | N/A | | | N/A | | N/A | |
| (c)Tax Fees | $1,750 | | | $2,250 | $1,750 | | $1,750 | | | $1,750 | | $1,750 | |
| (d) All Other Fees | N/A | | | N/A | N/A | | N/A | | | N/A | | N/A | |
(e)(1) The audit committee has adopted pre-approval policies and procedures that require the audit committee to pre-approve all audit and non-audit services of the registrant, including services provided to any entity affiliated with the registrant.
(e)(2) None of the fees billed by any Fund's principal accountant were applicable to non-audit services pursuant to a waiver of the pre-approval requirement.
(f) All of the principal accountant’s hours spent on auditing the registrant’s financial statements were attributed to work performed by full-time permanent employees of the principal accountant.
(g) None of the fees billed by any Fund's principal accountant were applicable to non-audit services billed or expected to be billed to any Fund’s imvestment adviser.
(h) The audit committee of the board of trustees/directors has considered whether the provision of non-audit services that were rendered to the registrant's investment adviser is compatible with maintaining the principal accountant's independence and has concluded that the provision of such non-audit services by the accountant has not compromised the accountant’s independence.
(i) The registrant has not been identified by the U.S. Securities and Exchange Commission as having filed an annual report issued by a registered public accounting firm branch or office that is located in a foreign jurisdiction where the Public Company Accounting Oversight Board is unable to inspect or completely investigate because of a position taken by an authority in that jurisdiction..
(j) The registrant is not a foreign issuer.
Item 5. Audit Committee of Listed Registrants.
(a) The registrant is an issuer as defined in Rule 10A-3 under the Securities Exchange Act of 1934, (the “Act”) and has a separately-designated standing audit committee established in accordance with Section 3(a)(58)(A) of the Act. The independent members of the committee are as follows: Daniel Dorn, Chukwuemeka (Emeka) Oguh, and Michael Pagano.
(b) Not applicable.
Item 6. Investments
(a)
| | |
| STRIVE 500 ETF |
| SCHEDULE OF INVESTMENTS |
| July 31, 2024 |
| | | | | | | | | | | | | | |
| COMMON STOCKS - 97.6% | | Shares | | Value |
| Advertising - 0.1% | | | | |
| Omnicom Group, Inc. | | 2,389 | | | $ | 234,218 | |
Trade Desk, Inc. - Class A (a) | | 5,590 | | | 502,429 | |
| | | | 736,647 | |
| | | | |
| Aerospace & Defense - 2.0% | | | | |
Axon Enterprise, Inc. (a) | | 786 | | | 235,808 | |
Boeing Co. (a) | | 8,130 | | | 1,549,578 | |
| General Dynamics Corp. | | 3,147 | | | 940,040 | |
| General Electric Co. | | 13,829 | | | 2,353,696 | |
| Heico Corp. | | 457 | | | 110,292 | |
| Heico Corp. - Class A | | 839 | | | 159,502 | |
| Howmet Aerospace, Inc. | | 5,156 | | | 493,429 | |
| L3Harris Technologies, Inc. | | 2,312 | | | 524,570 | |
| Lockheed Martin Corp. | | 3,065 | | | 1,660,985 | |
| Northrop Grumman Corp. | | 1,739 | | | 842,233 | |
| RTX Corp. | | 17,165 | | | 2,016,716 | |
| TransDigm Group, Inc. | | 713 | | | 922,779 | |
| | | | 11,809,628 | |
| | | | |
| Agricultural & Farm Machinery - 0.2% | | | | |
| Deere & Co. | | 3,459 | | | 1,286,679 | |
| | | | |
| Agricultural Products & Services - 0.1% | | | | |
| Archer-Daniels-Midland Co. | | 6,813 | | | 422,474 | |
| | | | |
| Air Freight & Logistics - 0.4% | | | | |
| Expeditors International of Washington, Inc. | | 1,833 | | | 228,795 | |
| FedEx Corp. | | 2,870 | | | 867,458 | |
| United Parcel Service, Inc. - Class B | | 9,201 | | | 1,199,534 | |
| | | | 2,295,787 | |
| | | | |
| Apparel Retail - 0.4% | | | | |
| Ross Stores, Inc. | | 4,139 | | | 592,829 | |
| TJX Cos., Inc. | | 14,505 | | | 1,639,355 | |
| | | | 2,232,184 | |
| | | | |
| Apparel, Accessories & Luxury Goods - 0.1% | | | | |
Lululemon Athletica, Inc. (a) | | 1,441 | | | 372,729 | |
| | | | |
| Application Software - 2.7% | | | | |
Adobe, Inc. (a) | | 5,821 | | | 3,211,155 | |
Ansys, Inc. (a) | | 1,218 | | | 382,001 | |
Atlassian Corp. - Class A (a) | | 1,930 | | | 340,780 | |
Autodesk, Inc. (a) | | 2,607 | | | 645,285 | |
The accompanying notes are an integral part of these financial statements.
1
| | |
| STRIVE 500 ETF |
| SCHEDULE OF INVESTMENTS (CONTINUED) |
| July 31, 2024 |
| | | | | | | | | | | | | | |
| COMMON STOCKS - 97.6% (CONTINUED) | | Shares | | Value |
| Application Software - 2.7% (Continued) | | | | |
| Bentley Systems, Inc. - Class B | | 2,692 | | | $ | 131,208 | |
Cadence Design Systems, Inc. (a) | | 3,458 | | | 925,568 | |
Datadog, Inc. - Class A (a) | | 3,533 | | | 411,382 | |
Fair Isaac Corp. (a) | | 310 | | | 496,000 | |
HubSpot, Inc. (a) | | 692 | | | 343,945 | |
| Intuit, Inc. | | 3,485 | | | 2,256,015 | |
Palantir Technologies, Inc. - Class A (a) | | 24,726 | | | 664,882 | |
PTC, Inc. (a) | | 1,736 | | | 308,748 | |
| Roper Technologies, Inc. | | 1,324 | | | 721,249 | |
| Salesforce, Inc. | | 12,037 | | | 3,115,176 | |
Synopsys, Inc. (a) | | 1,911 | | | 1,066,949 | |
Tyler Technologies, Inc. (a) | | 453 | | | 257,354 | |
Unity Software, Inc. (a) | | 3,115 | | | 50,961 | |
Workday, Inc. - Class A (a) | | 2,513 | | | 570,752 | |
Zoom Video Communications, Inc. - Class A (a) | | 2,837 | | | 171,355 | |
| | | | 16,070,765 | |
| | | | |
| Asset Management & Custody Banks - 1.1% | | | | |
| Ameriprise Financial, Inc. | | 1,271 | | | 546,619 | |
| Ares Management Corp. - Class A | | 2,097 | | | 321,260 | |
| Bank of New York Mellon Corp. | | 9,515 | | | 619,141 | |
| BlackRock, Inc. | | 1,751 | | | 1,534,752 | |
| Blackstone, Inc. | | 9,061 | | | 1,288,021 | |
| Blue Owl Capital, Inc. - Class A | | 5,694 | | | 108,585 | |
| Franklin Resources, Inc. | | 3,962 | | | 90,611 | |
| KKR & Co., Inc. | | 8,598 | | | 1,061,423 | |
| Northern Trust Corp. | | 2,420 | | | 214,533 | |
| State Street Corp. | | 3,608 | | | 306,572 | |
| T Rowe Price Group, Inc. | | 2,668 | | | 304,712 | |
| | | | 6,396,229 | |
| | | | |
| Automobile Manufacturers - 1.7% | | | | |
| Ford Motor Co. | | 50,346 | | | 544,744 | |
| General Motors Co. | | 14,651 | | | 649,332 | |
Rivian Automotive, Inc. - Class A (a) | | 9,782 | | | 160,523 | |
Stellantis NV (b) | | 26,307 | | | 439,064 | |
Tesla, Inc. (a) | | 36,030 | | | 8,361,482 | |
| | | | 10,155,145 | |
| | | | |
Automotive Parts & Equipment - 0.0%(c) | | | | |
Aptiv PLC (a) | | 3,583 | | | 248,624 | |
| | | | |
The accompanying notes are an integral part of these financial statements.
2
| | |
| STRIVE 500 ETF |
| SCHEDULE OF INVESTMENTS (CONTINUED) |
| July 31, 2024 |
| | | | | | | | | | | | | | |
| COMMON STOCKS - 97.6% (CONTINUED) | | Shares | | Value |
| Automotive Retail - 0.3% | | | | |
AutoZone, Inc. (a) | | 239 | | | $ | 748,952 | |
O'Reilly Automotive, Inc. (a) | | 766 | | | 862,776 | |
| | | | 1,611,728 | |
| | | | |
| Biotechnology - 2.1% | | | | |
| AbbVie, Inc. | | 22,935 | | | 4,250,314 | |
Alnylam Pharmaceuticals, Inc. (a) | | 1,380 | | | 327,695 | |
| Amgen, Inc. | | 6,862 | | | 2,281,409 | |
Biogen, Inc. (a) | | 1,835 | | | 391,222 | |
BioMarin Pharmaceutical, Inc. (a) | | 2,291 | | | 193,200 | |
| Gilead Sciences, Inc. | | 15,935 | | | 1,212,016 | |
GRAIL, Inc. (a) | | 320 | | | 4,922 | |
Incyte Corp. (a) | | 2,280 | | | 148,360 | |
Moderna, Inc. (a) | | 4,189 | | | 499,412 | |
Regeneron Pharmaceuticals, Inc. (a) | | 1,380 | | | 1,489,282 | |
Vertex Pharmaceuticals, Inc. (a) | | 3,261 | | | 1,616,543 | |
| | | | 12,414,375 | |
| | | | |
Broadcasting - 0.0%(c) | | | | |
| Fox Corp. - Class A | | 2,951 | | | 112,256 | |
| Fox Corp. - Class B | | 1,327 | | | 47,016 | |
| | | | 159,272 | |
| | | | |
| Broadline Retail - 3.8% | | | | |
Amazon.com, Inc. (a) | | 119,422 | | | 22,329,525 | |
| eBay, Inc. | | 6,439 | | | 358,073 | |
| | | | 22,687,598 | |
| | | | |
| Building Products - 0.5% | | | | |
Builders FirstSource, Inc. (a) | | 1,785 | | | 298,755 | |
| Carrier Global Corp. | | 10,683 | | | 727,619 | |
| Johnson Controls International PLC | | 8,701 | | | 622,470 | |
| Masco Corp. | | 2,716 | | | 211,441 | |
| Trane Technologies PLC | | 2,976 | | | 994,817 | |
| | | | 2,855,102 | |
| | | | |
| Cable & Satellite - 0.5% | | | | |
Charter Communications, Inc. - Class A (a) | | 1,304 | | | 495,155 | |
| Comcast Corp. - Class A | | 50,432 | | | 2,081,329 | |
Liberty Broadband Corp. - Class A (a) | | 176 | | | 11,655 | |
Liberty Broadband Corp. - Class C (a) | | 1,304 | | | 87,876 | |
| Sirius XM Holdings, Inc. | | 7,747 | | | 26,727 | |
| | | | 2,702,742 | |
| | | | |
The accompanying notes are an integral part of these financial statements.
3
| | |
| STRIVE 500 ETF |
| SCHEDULE OF INVESTMENTS (CONTINUED) |
| July 31, 2024 |
| | | | | | | | | | | | | | |
| COMMON STOCKS - 97.6% (CONTINUED) | | Shares | | Value |
| Cargo Ground Transportation - 0.1% | | | | |
| JB Hunt Transport Services, Inc. | | 909 | | | $ | 157,393 | |
| Old Dominion Freight Line, Inc. | | 2,411 | | | 506,744 | |
| | | | 664,137 | |
| | | | |
| Casinos & Gaming - 0.1% | | | | |
DraftKings, Inc. - Class A (a) | | 5,301 | | | 195,872 | |
| Las Vegas Sands Corp. | | 4,690 | | | 186,052 | |
MGM Resorts International (a) | | 3,093 | | | 132,906 | |
| | | | 514,830 | |
| | | | |
Commercial & Residential Mortgage Finance - 0.0%(c) | | | | |
Rocket Cos., Inc. - Class A (a) | | 1,364 | | | 22,083 | |
| | | | |
| Commodity Chemicals - 0.1% | | | | |
| Dow, Inc. | | 8,933 | | | 486,580 | |
| LyondellBasell Industries NV - Class A | | 3,091 | | | 307,431 | |
| Westlake Corp. | | 366 | | | 54,117 | |
| | | | 848,128 | |
| | | | |
| Communications Equipment - 0.7% | | | | |
Arista Networks, Inc. (a) | | 3,234 | | | 1,120,743 | |
| Cisco Systems, Inc. | | 47,718 | | | 2,311,937 | |
| Motorola Solutions, Inc. | | 2,271 | | | 905,947 | |
| | | | 4,338,627 | |
| | | | |
Computer & Electronics Retail - 0.0%(c) | | | | |
| Best Buy Co., Inc. | | 2,351 | | | 203,408 | |
| | | | |
| Construction & Engineering - 0.1% | | | | |
| Quanta Services, Inc. | | 1,824 | | | 484,053 | |
| | | | |
| Construction Machinery & Heavy Transportation Equipment - 0.6% | | | | |
| Caterpillar, Inc. | | 6,548 | | | 2,266,918 | |
| Cummins, Inc. | | 1,798 | | | 524,656 | |
| Paccar, Inc. | | 6,396 | | | 631,029 | |
| Westinghouse Air Brake Technologies Corp. | | 2,190 | | | 352,919 | |
| | | | 3,775,522 | |
| | | | |
| Construction Materials - 0.3% | | | | |
| CRH PLC | | 8,609 | | | 737,791 | |
| Martin Marietta Materials, Inc. | | 794 | | | 471,120 | |
| Vulcan Materials Co. | | 1,861 | | | 510,863 | |
| | | | 1,719,774 | |
| | | | |
The accompanying notes are an integral part of these financial statements.
4
| | |
| STRIVE 500 ETF |
| SCHEDULE OF INVESTMENTS (CONTINUED) |
| July 31, 2024 |
| | | | | | | | | | | | | | |
| COMMON STOCKS - 97.6% (CONTINUED) | | Shares | | Value |
| Consumer Electronics - 0.1% | | | | |
| Garmin Ltd. | | 1,931 | | | $ | 330,684 | |
| | | | |
| Consumer Finance - 0.5% | | | | |
| American Express Co. | | 6,956 | | | 1,760,146 | |
| Capital One Financial Corp. | | 4,492 | | | 680,089 | |
| Discover Financial Services | | 3,149 | | | 453,425 | |
| Synchrony Financial | | 5,180 | | | 263,092 | |
| | | | 3,156,752 | |
| | | | |
| Consumer Staples Merchandise Retail - 1.7% | | | | |
| Costco Wholesale Corp. | | 5,686 | | | 4,673,892 | |
| Dollar General Corp. | | 2,665 | | | 320,839 | |
Dollar Tree, Inc. (a) | | 2,500 | | | 260,850 | |
| Target Corp. | | 5,818 | | | 875,086 | |
| Walmart, Inc. | | 56,628 | | | 3,886,946 | |
| | | | 10,017,613 | |
| | | | |
| Copper - 0.1% | | | | |
| Freeport-McMoRan, Inc. | | 18,163 | | | 824,782 | |
| | | | |
| Data Processing & Outsourced Services - 0.1% | | | | |
| Broadridge Financial Solutions, Inc. | | 1,764 | | | 377,496 | |
| SS&C Technologies Holdings, Inc. | | 2,623 | | | 191,348 | |
| | | | 568,844 | |
| | | | |
| Distillers & Vintners - 0.1% | | | | |
| Brown-Forman Corp. - Class A | | 526 | | | 23,980 | |
| Brown-Forman Corp. - Class B | | 3,798 | | | 171,518 | |
| Constellation Brands, Inc. - Class A | | 2,005 | | | 491,546 | |
| | | | 687,044 | |
| | | | |
Distributors - 0.0%(c) | | | | |
| Genuine Parts Co. | | 1,756 | | | 258,325 | |
| | | | |
| Diversified Banks - 3.0% | | | | |
| Bank of America Corp. | | 87,825 | | | 3,540,226 | |
| Citigroup, Inc. | | 23,478 | | | 1,523,252 | |
| Fifth Third Bancorp | | 8,664 | | | 366,834 | |
| First Citizens BancShares, Inc. - Class A | | 166 | | | 346,556 | |
| JPMorgan Chase & Co. | | 36,601 | | | 7,788,693 | |
| PNC Financial Services Group, Inc. | | 5,340 | | | 967,074 | |
| US Bancorp | | 19,502 | | | 875,250 | |
| Wells Fargo & Co. | | 45,159 | | | 2,679,735 | |
| | | | 18,087,620 | |
| | | | |
The accompanying notes are an integral part of these financial statements.
5
| | |
| STRIVE 500 ETF |
| SCHEDULE OF INVESTMENTS (CONTINUED) |
| July 31, 2024 |
| | | | | | | | | | | | | | |
| COMMON STOCKS - 97.6% (CONTINUED) | | Shares | | Value |
| Diversified Financial Services - 0.1% | | | | |
| Apollo Global Management, Inc. | | 4,739 | | | $ | 593,844 | |
| Corebridge Financial, Inc. | | 2,916 | | | 86,168 | |
| | | | 680,012 | |
| | | | |
| Diversified Support Services - 0.2% | | | | |
| Cintas Corp. | | 1,087 | | | 830,403 | |
Copart, Inc. (a) | | 11,078 | | | 579,711 | |
| | | | 1,410,114 | |
| | | | |
Drug Retail - 0.0%(c) | | | | |
| Walgreens Boots Alliance, Inc. | | 9,040 | | | 107,305 | |
| | | | |
| Electric Utilities - 1.5% | | | | |
| Alliant Energy Corp. | | 3,024 | | | 168,316 | |
| American Electric Power Co., Inc. | | 6,408 | | | 628,753 | |
| Avangrid, Inc. | | 792 | | | 28,251 | |
| Constellation Energy Corp. | | 3,994 | | | 758,061 | |
| Duke Energy Corp. | | 9,700 | | | 1,059,919 | |
| Edison International | | 4,714 | | | 377,167 | |
| Entergy Corp. | | 2,574 | | | 298,507 | |
| Evergy, Inc. | | 2,746 | | | 159,268 | |
| Eversource Energy | | 4,312 | | | 279,892 | |
| Exelon Corp. | | 12,666 | | | 471,175 | |
| FirstEnergy Corp. | | 6,972 | | | 292,197 | |
| NextEra Energy, Inc. | | 25,962 | | | 1,983,237 | |
| PG&E Corp. | | 26,405 | | | 481,891 | |
| PPL Corp. | | 9,246 | | | 274,791 | |
| Southern Co. | | 13,887 | | | 1,159,842 | |
| Xcel Energy, Inc. | | 7,030 | | | 409,708 | |
| | | | 8,830,975 | |
| | | | |
| Electrical Components & Equipment - 0.7% | | | | |
| Ametek, Inc. | | 2,784 | | | 482,968 | |
| Eaton Corp. PLC | | 5,121 | | | 1,560,830 | |
| Emerson Electric Co. | | 7,228 | | | 846,471 | |
| Hubbell, Inc. | | 746 | | | 295,155 | |
| Rockwell Automation, Inc. | | 1,264 | | | 352,214 | |
| Vertiv Holdings Co. - Class A | | 4,423 | | | 348,090 | |
| | | | 3,885,728 | |
| | | | |
| Electronic Components - 0.2% | | | | |
| Amphenol Corp. - Class A | | 15,090 | | | 969,683 | |
| Corning, Inc. | | 9,715 | | | 388,697 | |
| | | | 1,358,380 | |
| | | | |
The accompanying notes are an integral part of these financial statements.
6
| | |
| STRIVE 500 ETF |
| SCHEDULE OF INVESTMENTS (CONTINUED) |
| July 31, 2024 |
| | | | | | | | | | | | | | |
| COMMON STOCKS - 97.6% (CONTINUED) | | Shares | | Value |
| Electronic Equipment & Instruments - 0.2% | | | | |
Keysight Technologies, Inc. (a) | | 2,151 | | | $ | 300,215 | |
Teledyne Technologies, Inc. (a) | | 723 | | | 305,005 | |
Trimble, Inc. (a) | | 2,977 | | | 162,366 | |
Zebra Technologies Corp. - Class A (a) | | 749 | | | 263,041 | |
| | | | 1,030,627 | |
| | | | |
| Electronic Manufacturing Services - 0.1% | | | | |
| TE Connectivity Ltd. | | 3,877 | | | 598,337 | |
| | | | |
| Environmental & Facilities Services - 0.3% | | | | |
| Republic Services, Inc. | | 2,848 | | | 553,423 | |
| Rollins, Inc. | | 3,717 | | | 178,082 | |
| Veralto Corp. | | 2,800 | | | 298,368 | |
| Waste Management, Inc. | | 5,161 | | | 1,045,928 | |
| | | | 2,075,801 | |
| | | | |
| Fertilizers & Agricultural Chemicals - 0.1% | | | | |
| CF Industries Holdings, Inc. | | 2,327 | | | 177,759 | |
| Corteva, Inc. | | 8,906 | | | 499,627 | |
| | | | 677,386 | |
| | | | |
| Financial Exchanges & Data - 1.2% | | | | |
| Cboe Global Markets, Inc. | | 1,461 | | | 268,108 | |
| CME Group, Inc. | | 4,445 | | | 861,041 | |
Coinbase Global, Inc. - Class A (a) | | 2,362 | | | 529,939 | |
| FactSet Research Systems, Inc. | | 559 | | | 230,917 | |
| Intercontinental Exchange, Inc. | | 7,227 | | | 1,095,324 | |
| Moody's Corp. | | 1,972 | | | 900,179 | |
| MSCI, Inc. | | 1,049 | | | 567,257 | |
| Nasdaq, Inc. | | 5,121 | | | 346,589 | |
| S&P Global, Inc. | | 4,144 | | | 2,008,721 | |
| Tradeweb Markets, Inc. - Class A | | 1,260 | | | 140,717 | |
| | | | 6,948,792 | |
| | | | |
| Food Distributors - 0.1% | | | | |
| Sysco Corp. | | 6,163 | | | 472,394 | |
| | | | |
| Food Retail - 0.1% | | | | |
| Kroger Co. | | 8,538 | | | 465,321 | |
| | | | |
| Footwear - 0.2% | | | | |
Deckers Outdoor Corp. (a) | | 275 | | | 253,723 | |
| NIKE, Inc. - Class B | | 15,421 | | | 1,154,416 | |
| | | | 1,408,139 | |
| | | | |
The accompanying notes are an integral part of these financial statements.
7
| | |
| STRIVE 500 ETF |
| SCHEDULE OF INVESTMENTS (CONTINUED) |
| July 31, 2024 |
| | | | | | | | | | | | | | |
| COMMON STOCKS - 97.6% (CONTINUED) | | Shares | | Value |
Gas Utilities - 0.0%(c) | | | | |
| Atmos Energy Corp. | | 1,898 | | | $ | 242,716 | |
| | | | |
| Gold - 0.1% | | | | |
| Newmont Corp. | | 14,648 | | | 718,777 | |
| | | | |
| Health Care Distributors - 0.3% | | | | |
| Cardinal Health, Inc. | | 2,946 | | | 297,045 | |
| Cencora, Inc. | | 2,092 | | | 497,645 | |
| McKesson Corp. | | 1,590 | | | 981,062 | |
| | | | 1,775,752 | |
| | | | |
| Health Care Equipment - 2.2% | | | | |
| Abbott Laboratories | | 22,201 | | | 2,351,974 | |
| Baxter International, Inc. | | 6,310 | | | 226,024 | |
| Becton Dickinson & Co. | | 3,670 | | | 884,690 | |
Boston Scientific Corp. (a) | | 18,797 | | | 1,388,722 | |
Dexcom, Inc. (a) | | 4,722 | | | 320,246 | |
Edwards Lifesciences Corp. (a) | | 7,612 | | | 479,937 | |
| GE HealthCare Technologies, Inc. | | 6,044 | | | 511,504 | |
Hologic, Inc. (a) | | 2,803 | | | 228,753 | |
IDEXX Laboratories, Inc. (a) | | 1,086 | | | 517,066 | |
Insulet Corp. (a) | | 778 | | | 151,204 | |
Intuitive Surgical, Inc. (a) | | 4,536 | | | 2,016,751 | |
| Medtronic PLC | | 17,083 | | | 1,372,107 | |
| ResMed, Inc. | | 1,849 | | | 394,299 | |
| STERIS PLC | | 1,388 | | | 331,399 | |
| Stryker Corp. | | 4,488 | | | 1,469,596 | |
| Teleflex, Inc. | | 507 | | | 112,006 | |
| Zimmer Biomet Holdings, Inc. | | 2,556 | | | 284,611 | |
| | | | 13,040,889 | |
| | | | |
| Health Care Facilities - 0.2% | | | | |
| HCA Healthcare, Inc. | | 2,557 | | | 928,319 | |
| | | | |
| Health Care Services - 0.4% | | | | |
| Cigna Group | | 3,697 | | | 1,289,033 | |
| CVS Health Corp. | | 16,359 | | | 986,938 | |
| Labcorp Holdings, Inc. | | 942 | | | 202,945 | |
| Quest Diagnostics, Inc. | | 1,233 | | | 175,456 | |
| | | | 2,654,372 | |
| | | | |
| Health Care Supplies - 0.1% | | | | |
Align Technology, Inc. (a) | | 799 | | | 185,272 | |
| Cooper Cos., Inc. | | 2,429 | | | 226,699 | |
The accompanying notes are an integral part of these financial statements.
8
| | |
| STRIVE 500 ETF |
| SCHEDULE OF INVESTMENTS (CONTINUED) |
| July 31, 2024 |
| | | | | | | | | | | | | | |
| COMMON STOCKS - 97.6% (CONTINUED) | | Shares | | Value |
| Health Care Supplies - 0.1% (Continued) | | | | |
Solventum Corp. (a) | | 1,759 | | | $ | 103,570 | |
| | | | 515,541 | |
| | | | |
| Heavy Electrical Equipment - 0.1% | | | | |
GE Vernova, Inc. (a) | | 3,457 | | | 616,176 | |
| | | | |
| Home Improvement Retail - 1.1% | | | | |
| Home Depot, Inc. | | 12,833 | | | 4,724,597 | |
| Lowe's Cos., Inc. | | 7,272 | | | 1,785,349 | |
| | | | 6,509,946 | |
| | | | |
| Homebuilding - 0.3% | | | | |
| DR Horton, Inc. | | 3,692 | | | 664,302 | |
| Lennar Corp. - Class A | | 3,422 | | | 605,454 | |
| Lennar Corp. - Class B | | 109 | | | 17,981 | |
NVR, Inc. (a) | | 44 | | | 378,729 | |
| PulteGroup, Inc. | | 2,614 | | | 345,048 | |
| | | | 2,011,514 | |
| | | | |
| Hotels, Resorts & Cruise Lines - 0.7% | | | | |
Airbnb, Inc. - Class A (a) | | 4,652 | | | 649,233 | |
| Booking Holdings, Inc. | | 428 | | | 1,590,024 | |
Carnival Corp. (a) | | 12,665 | | | 210,999 | |
Expedia Group, Inc. (a) | | 1,705 | | | 217,677 | |
| Hilton Worldwide Holdings, Inc. | | 3,024 | | | 649,162 | |
| Marriott International, Inc. - Class A | | 3,055 | | | 694,402 | |
Royal Caribbean Cruises Ltd. (a) | | 2,696 | | | 422,517 | |
| | | | 4,434,014 | |
| | | | |
| Household Products - 1.2% | | | | |
| Church & Dwight Co., Inc. | | 2,958 | | | 289,913 | |
| Clorox Co. | | 1,364 | | | 179,952 | |
| Colgate-Palmolive Co. | | 10,498 | | | 1,041,297 | |
| Kimberly-Clark Corp. | | 4,219 | | | 569,776 | |
| Procter & Gamble Co. | | 30,422 | | | 4,890,641 | |
| | | | 6,971,579 | |
| | | | |
| Human Resource & Employment Services - 0.3% | | | | |
| Automatic Data Processing, Inc. | | 5,240 | | | 1,376,129 | |
| Paychex, Inc. | | 4,014 | | | 513,872 | |
| Paycom Software, Inc. | | 555 | | | 92,568 | |
| | | | 1,982,569 | |
| | | | |
The accompanying notes are an integral part of these financial statements.
9
| | |
| STRIVE 500 ETF |
| SCHEDULE OF INVESTMENTS (CONTINUED) |
| July 31, 2024 |
| | | | | | | | | | | | | | |
| COMMON STOCKS - 97.6% (CONTINUED) | | Shares | | Value |
Independent Power Producers & Energy Traders - 0.0%(c) | | | | |
| AES Corp. | | 8,221 | | | $ | 146,252 | |
| | | | |
| Industrial Conglomerates - 0.4% | | | | |
| 3M Co. | | 7,052 | | | 899,483 | |
| Honeywell International, Inc. | | 8,323 | | | 1,704,134 | |
| | | | 2,603,617 | |
| | | | |
| Industrial Gases - 0.6% | | | | |
| Air Products and Chemicals, Inc. | | 2,818 | | | 743,529 | |
| Linde PLC | | 6,194 | | | 2,808,979 | |
| | | | 3,552,508 | |
| | | | |
| Industrial Machinery & Supplies & Components - 0.7% | | | | |
| Dover Corp. | | 1,777 | | | 327,430 | |
| Fortive Corp. | | 4,355 | | | 312,907 | |
| IDEX Corp. | | 843 | | | 175,749 | |
| Illinois Tool Works, Inc. | | 3,648 | | | 902,077 | |
| Ingersoll Rand, Inc. | | 5,184 | | | 520,473 | |
| Otis Worldwide Corp. | | 5,236 | | | 494,802 | |
| Parker-Hannifin Corp. | | 1,735 | | | 973,613 | |
| Stanley Black & Decker, Inc. | | 1,922 | | | 203,002 | |
Symbotic, Inc. (a) | | 305 | | | 8,177 | |
| Xylem, Inc./NY | | 3,464 | | | 462,444 | |
| | | | 4,380,674 | |
| | | | |
| Insurance Brokers - 0.6% | | | | |
| Aon PLC - Class A | | 2,362 | | | 775,941 | |
| Arthur J Gallagher & Co. | | 2,615 | | | 741,326 | |
| Brown & Brown, Inc. | | 2,824 | | | 280,790 | |
| Marsh & McLennan Cos., Inc. | | 6,472 | | | 1,440,473 | |
| Willis Towers Watson PLC | | 1,427 | | | 402,814 | |
| | | | 3,641,344 | |
| | | | |
| Integrated Oil & Gas - 1.8% | | | | |
| Chevron Corp. | | 22,243 | | | 3,569,334 | |
| Exxon Mobil Corp. | | 57,889 | | | 6,865,057 | |
| Occidental Petroleum Corp. | | 7,937 | | | 482,728 | |
| | | | 10,917,119 | |
| | | | |
| Integrated Telecommunication Services - 0.6% | | | | |
| AT&T, Inc. | | 91,926 | | | 1,769,576 | |
| Verizon Communications, Inc. | | 49,733 | | | 2,015,181 | |
| | | | 3,784,757 | |
| | | | |
The accompanying notes are an integral part of these financial statements.
10
| | |
| STRIVE 500 ETF |
| SCHEDULE OF INVESTMENTS (CONTINUED) |
| July 31, 2024 |
| | | | | | | | | | | | | | |
| COMMON STOCKS - 97.6% (CONTINUED) | | Shares | | Value |
| Interactive Home Entertainment - 0.2% | | | | |
| Electronic Arts, Inc. | | 3,444 | | | $ | 519,837 | |
Roblox Corp. - Class A (a) | | 6,156 | | | 255,597 | |
Take-Two Interactive Software, Inc. (a) | | 2,086 | | | 314,006 | |
| | | | 1,089,440 | |
| | | | |
| Interactive Media & Services - 6.3% | | | | |
| Alphabet, Inc. - Class A | | 75,859 | | | 13,012,853 | |
| Alphabet, Inc. - Class C | | 63,313 | | | 10,962,646 | |
| Meta Platforms, Inc. - Class A | | 28,251 | | | 13,414,422 | |
Pinterest, Inc. - Class A (a) | | 7,393 | | | 236,207 | |
Snap, Inc. - Class A (a) | | 13,085 | | | 174,292 | |
| | | | 37,800,420 | |
| | | | |
| Internet Services & Infrastructure - 0.3% | | | | |
Akamai Technologies, Inc. (a) | | 1,873 | | | 184,078 | |
Cloudflare, Inc. - Class A (a) | | 3,523 | | | 273,033 | |
MongoDB, Inc. (a) | | 1,114 | | | 281,129 | |
Okta, Inc. (a) | | 1,951 | | | 183,277 | |
Snowflake, Inc. - Class A (a) | | 3,677 | | | 479,407 | |
VeriSign, Inc. (a) | | 983 | | | 183,831 | |
| | | | 1,584,755 | |
| | | | |
| Investment Banking & Brokerage - 0.9% | | | | |
| Charles Schwab Corp. | | 18,245 | | | 1,189,392 | |
| Goldman Sachs Group, Inc. | | 4,244 | | | 2,160,323 | |
| Interactive Brokers Group, Inc. - Class A | | 1,138 | | | 135,729 | |
| LPL Financial Holdings, Inc. | | 833 | | | 184,526 | |
| Morgan Stanley | | 15,898 | | | 1,640,833 | |
| Raymond James Financial, Inc. | | 2,302 | | | 267,032 | |
| | | | 5,577,835 | |
| | | | |
| IT Consulting & Other Services - 1.1% | | | | |
| Accenture PLC - Class A | | 8,825 | | | 2,917,722 | |
| Cognizant Technology Solutions Corp. - Class A | | 6,249 | | | 472,924 | |
EPAM Systems, Inc. (a) | | 609 | | | 131,014 | |
Gartner, Inc. (a) | | 1,063 | | | 532,765 | |
| International Business Machines Corp. | | 12,032 | | | 2,311,828 | |
| | | | 6,366,253 | |
| | | | |
| Life & Health Insurance - 0.4% | | | | |
| Aflac, Inc. | | 7,349 | | | 700,948 | |
| MetLife, Inc. | | 7,817 | | | 600,736 | |
The accompanying notes are an integral part of these financial statements.
11
| | |
| STRIVE 500 ETF |
| SCHEDULE OF INVESTMENTS (CONTINUED) |
| July 31, 2024 |
| | | | | | | | | | | | | | |
| COMMON STOCKS - 97.6% (CONTINUED) | | Shares | | Value |
| Life & Health Insurance - 0.4% (Continued) | | | | |
| Principal Financial Group, Inc. | | 2,860 | | | $ | 233,119 | |
| Prudential Financial, Inc. | | 4,464 | | | 559,428 | |
| | | | 2,094,231 | |
| | | | |
| Life Sciences Tools & Services - 1.4% | | | | |
| Agilent Technologies, Inc. | | 3,699 | | | 523,039 | |
Avantor, Inc. (a) | | 8,625 | | | 230,719 | |
| Danaher Corp. | | 8,652 | | | 2,397,296 | |
Icon PLC (a) | | 1,126 | | | 369,823 | |
Illumina, Inc. (a) | | 1,984 | | | 243,238 | |
Iqvia Holdings, Inc. (a) | | 2,196 | | | 540,721 | |
Mettler-Toledo International, Inc. (a) | | 288 | | | 438,057 | |
| Revvity, Inc. | | 1,357 | | | 170,453 | |
| Thermo Fisher Scientific, Inc. | | 4,844 | | | 2,971,019 | |
Waters Corp. (a) | | 806 | | | 271,042 | |
| West Pharmaceutical Services, Inc. | | 974 | | | 298,209 | |
| | | | 8,453,616 | |
| | | | |
| Managed Health Care - 1.6% | | | | |
Centene Corp. (a) | | 6,822 | | | 524,748 | |
| Elevance Health, Inc. | | 2,983 | | | 1,587,046 | |
| Humana, Inc. | | 1,704 | | | 616,183 | |
Molina Healthcare, Inc. (a) | | 781 | | | 266,532 | |
| UnitedHealth Group, Inc. | | 11,782 | | | 6,788,317 | |
| | | | 9,782,826 | |
| | | | |
Metal, Glass & Plastic Containers - 0.0%(c) | | | | |
| Ball Corp. | | 3,933 | | | 251,043 | |
| | | | |
| Movies & Entertainment - 1.1% | | | | |
Liberty Media Corp.-Liberty Formula One - Class A (a) | | 255 | | | 18,862 | |
Liberty Media Corp.-Liberty Formula One - Class C (a) | | 2,503 | | | 202,418 | |
Live Nation Entertainment, Inc. (a) | | 1,960 | | | 188,532 | |
Netflix, Inc. (a) | | 5,562 | | | 3,494,883 | |
Spotify Technology SA (a) | | 1,352 | | | 465,007 | |
| Walt Disney Co. | | 23,340 | | | 2,186,725 | |
Warner Bros Discovery, Inc. (a) | | 28,282 | | | 244,639 | |
| Warner Music Group Corp. - Class A | | 1,407 | | | 42,224 | |
| | | | 6,843,290 | |
| | | | |
| Multi-line Insurance - 0.1% | | | | |
| American International Group, Inc. | | 8,930 | | | 707,524 | |
| | | | |
The accompanying notes are an integral part of these financial statements.
12
| | |
| STRIVE 500 ETF |
| SCHEDULE OF INVESTMENTS (CONTINUED) |
| July 31, 2024 |
| | | | | | | | | | | | | | |
| COMMON STOCKS - 97.6% (CONTINUED) | | Shares | | Value |
| Multi-Sector Holdings - 1.2% | | | | |
Berkshire Hathaway, Inc. - Class B (a) | | 16,480 | | | $ | 7,226,480 | |
| | | | |
| Multi-Utilities - 0.6% | | | | |
| Ameren Corp. | | 3,127 | | | 247,877 | |
| CenterPoint Energy, Inc. | | 7,892 | | | 219,003 | |
| CMS Energy Corp. | | 3,682 | | | 238,594 | |
| Consolidated Edison, Inc. | | 4,294 | | | 418,751 | |
| Dominion Energy, Inc. | | 10,665 | | | 570,151 | |
| DTE Energy Co. | | 2,222 | | | 267,818 | |
| Public Service Enterprise Group, Inc. | | 6,224 | | | 496,488 | |
| Sempra | | 7,916 | | | 633,755 | |
| WEC Energy Group, Inc. | | 3,947 | | | 339,679 | |
| | | | 3,432,116 | |
| | | | |
| Oil & Gas Equipment & Services - 0.3% | | | | |
| Baker Hughes Co. | | 12,789 | | | 495,190 | |
| Halliburton Co. | | 10,494 | | | 363,932 | |
| Schlumberger NV | | 18,134 | | | 875,691 | |
| | | | 1,734,813 | |
| | | | |
| Oil & Gas Exploration & Production - 0.8% | | | | |
| ConocoPhillips | | 15,018 | | | 1,670,001 | |
| Coterra Energy, Inc. | | 9,276 | | | 239,321 | |
| Devon Energy Corp. | | 7,989 | | | 375,723 | |
| Diamondback Energy, Inc. | | 2,198 | | | 444,677 | |
| EOG Resources, Inc. | | 7,370 | | | 934,516 | |
| EQT Corp. | | 5,229 | | | 180,453 | |
| Hess Corp. | | 3,536 | | | 542,493 | |
| Marathon Oil Corp. | | 7,393 | | | 207,374 | |
| | | | 4,594,558 | |
| | | | |
| Oil & Gas Refining & Marketing - 0.4% | | | | |
| Marathon Petroleum Corp. | | 4,656 | | | 824,205 | |
| Phillips 66 | | 5,555 | | | 808,141 | |
| Valero Energy Corp. | | 4,234 | | | 684,723 | |
| | | | 2,317,069 | |
| | | | |
| Oil & Gas Storage & Transportation - 0.4% | | | | |
| Cheniere Energy, Inc. | | 2,792 | | | 509,931 | |
| Kinder Morgan, Inc. | | 24,788 | | | 523,771 | |
| ONEOK, Inc. | | 7,361 | | | 613,392 | |
| Targa Resources Corp. | | 2,665 | | | 360,521 | |
| Williams Cos., Inc. | | 15,549 | | | 667,674 | |
| | | | 2,675,289 | |
| | | | |
The accompanying notes are an integral part of these financial statements.
13
| | |
| STRIVE 500 ETF |
| SCHEDULE OF INVESTMENTS (CONTINUED) |
| July 31, 2024 |
| | | | | | | | | | | | | | |
| COMMON STOCKS - 97.6% (CONTINUED) | | Shares | | Value |
| Other Specialty Retail - 0.1% | | | | |
| Tractor Supply Co. | | 1,466 | | | $ | 386,027 | |
Ulta Beauty, Inc. (a) | | 668 | | | 243,747 | |
| | | | 629,774 | |
| | | | |
| Packaged Foods & Meats - 0.6% | | | | |
| Campbell Soup Co. | | 2,425 | | | 113,635 | |
| Conagra Brands, Inc. | | 5,981 | | | 181,344 | |
| General Mills, Inc. | | 7,206 | | | 483,811 | |
| Hershey Co. | | 1,866 | | | 368,498 | |
| Hormel Foods Corp. | | 3,636 | | | 116,752 | |
| J M Smucker Co. | | 1,122 | | | 132,340 | |
| Kellanova | | 3,431 | | | 199,512 | |
| Kraft Heinz Co. | | 9,870 | | | 347,523 | |
| McCormick & Co., Inc. | | 2,974 | | | 229,028 | |
| Mondelez International, Inc. - Class A | | 17,372 | | | 1,187,376 | |
| Tyson Foods, Inc. - Class A | | 3,591 | | | 218,692 | |
| | | | 3,578,511 | |
| | | | |
Paper & Plastic Packaging Products & Materials - 0.0%(c) | | | | |
| Amcor PLC | | 18,322 | | | 192,931 | |
| | | | |
Passenger Airlines - 0.0%(c) | | | | |
| Delta Air Lines, Inc. | | 2,011 | | | 86,513 | |
| Southwest Airlines Co. | | 1,883 | | | 50,728 | |
United Airlines Holdings, Inc. (a) | | 914 | | | 41,514 | |
| | | | 178,755 | |
| | | | |
| Passenger Ground Transportation - 0.3% | | | | |
Grab Holdings Ltd. - Class A (a) | | 35,261 | | | 116,361 | |
Uber Technologies, Inc. (a) | | 26,425 | | | 1,703,620 | |
| | | | 1,819,981 | |
| | | | |
| Personal Care Products - 0.1% | | | | |
| Estee Lauder Cos., Inc. - Class A | | 2,635 | | | 262,473 | |
| Kenvue, Inc. | | 22,266 | | | 411,698 | |
| | | | 674,171 | |
| | | | |
| Pharmaceuticals - 3.7% | | | | |
| Bristol-Myers Squibb Co. | | 26,087 | | | 1,240,698 | |
| Eli Lilly & Co. | | 11,014 | | | 8,858,230 | |
| Johnson & Johnson | | 31,349 | | | 4,948,440 | |
| Merck & Co., Inc. | | 32,444 | | | 3,670,390 | |
| Pfizer, Inc. | | 72,464 | | | 2,213,050 | |
The accompanying notes are an integral part of these financial statements.
14
| | |
| STRIVE 500 ETF |
| SCHEDULE OF INVESTMENTS (CONTINUED) |
| July 31, 2024 |
| | | | | | | | | | | | | | |
| COMMON STOCKS - 97.6% (CONTINUED) | | Shares | | Value |
| Pharmaceuticals - 3.7% (Continued) | | | | |
| Royalty Pharma PLC - Class A | | 4,685 | | | $ | 131,976 | |
| Zoetis, Inc. | | 5,410 | | | 974,016 | |
| | | | 22,036,800 | |
| | | | |
| Property & Casualty Insurance - 1.0% | | | | |
| Allstate Corp. | | 3,074 | | | 526,023 | |
Arch Capital Group Ltd. (a) | | 4,485 | | | 429,573 | |
| Chubb Ltd. | | 5,173 | | | 1,425,989 | |
| Cincinnati Financial Corp. | | 1,932 | | | 252,358 | |
| Erie Indemnity Co. - Class A | | 272 | | | 119,993 | |
| Hartford Financial Services Group, Inc. | | 3,782 | | | 419,500 | |
| Loews Corp. | | 2,267 | | | 181,247 | |
Markel Group, Inc. (a) | | 138 | | | 226,161 | |
| Progressive Corp. | | 7,695 | | | 1,647,653 | |
| Travelers Cos., Inc. | | 3,132 | | | 677,890 | |
| W R Berkley Corp. | | 3,522 | | | 194,168 | |
| | | | 6,100,555 | |
| | | | |
| Rail Transportation - 0.6% | | | | |
| CSX Corp. | | 25,130 | | | 882,063 | |
| Norfolk Southern Corp. | | 3,131 | | | 781,372 | |
| Union Pacific Corp. | | 7,716 | | | 1,903,769 | |
| | | | 3,567,204 | |
| | | | |
| Real Estate Services - 0.1% | | | | |
CBRE Group, Inc. - Class A (a) | | 3,747 | | | 422,324 | |
CoStar Group, Inc. (a) | | 5,182 | | | 404,300 | |
| | | | 826,624 | |
| | | | |
| Regional Banks - 0.3% | | | | |
| Citizens Financial Group, Inc. | | 5,613 | | | 239,507 | |
| Huntington Bancshares, Inc. | | 18,116 | | | 270,834 | |
| M&T Bank Corp. | | 2,040 | | | 351,227 | |
| Regions Financial Corp. | | 11,908 | | | 266,382 | |
| Truist Financial Corp. | | 17,039 | | | 761,473 | |
| | | | 1,889,423 | |
| | | | |
| Research & Consulting Services - 0.3% | | | | |
| Booz Allen Hamilton Holding Corp. | | 1,406 | | | 201,494 | |
| Equifax, Inc. | | 1,667 | | | 465,710 | |
| Jacobs Solutions, Inc. | | 1,532 | | | 224,208 | |
| Leidos Holdings, Inc. | | 1,742 | | | 251,545 | |
The accompanying notes are an integral part of these financial statements.
15
| | |
| STRIVE 500 ETF |
| SCHEDULE OF INVESTMENTS (CONTINUED) |
| July 31, 2024 |
| | | | | | | | | | | | | | |
| COMMON STOCKS - 97.6% (CONTINUED) | | Shares | | Value |
| Research & Consulting Services - 0.3% (Continued) | | | | |
| TransUnion | | 2,357 | | | $ | 212,743 | |
| Verisk Analytics, Inc. | | 1,827 | | | 478,217 | |
| | | | 1,833,917 | |
| | | | |
| Restaurants - 1.0% | | | | |
Chipotle Mexican Grill, Inc. (a) | | 17,760 | | | 964,723 | |
| Darden Restaurants, Inc. | | 1,314 | | | 192,225 | |
| Domino's Pizza, Inc. | | 375 | | | 160,763 | |
DoorDash, Inc. - Class A (a) | | 3,888 | | | 430,479 | |
| McDonald's Corp. | | 9,225 | | | 2,448,315 | |
| Starbucks Corp. | | 14,182 | | | 1,105,487 | |
| Yum! Brands, Inc. | | 3,570 | | | 474,203 | |
| | | | 5,776,195 | |
| | | | |
| Semiconductor Materials & Equipment - 1.0% | | | | |
| Applied Materials, Inc. | | 10,591 | | | 2,247,410 | |
Enphase Energy, Inc. (a) | | 1,703 | | | 196,033 | |
| Entegris, Inc. | | 1,886 | | | 223,095 | |
| KLA Corp. | | 1,730 | | | 1,423,911 | |
| Lam Research Corp. | | 1,713 | | | 1,578,084 | |
| Teradyne, Inc. | | 1,918 | | | 251,565 | |
| | | | 5,920,098 | |
| | | | |
| Semiconductors - 10.3% | | | | |
Advanced Micro Devices, Inc. (a) | | 20,631 | | | 2,980,767 | |
| Analog Devices, Inc. | | 6,183 | | | 1,430,623 | |
| Broadcom, Inc. | | 58,332 | | | 9,372,786 | |
First Solar, Inc. (a) | | 1,118 | | | 241,477 | |
Global Foundries, Inc. (a) | | 932 | | | 47,541 | |
| Intel Corp. | | 54,168 | | | 1,665,124 | |
| Marvell Technology, Inc. | | 10,960 | | | 734,101 | |
| Microchip Technology, Inc. | | 6,815 | | | 605,036 | |
| Micron Technology, Inc. | | 14,077 | | | 1,545,936 | |
| Monolithic Power Systems, Inc. | | 568 | | | 490,235 | |
| Nvidia Corp. | | 310,553 | | | 36,340,912 | |
| NXP Semiconductors NV | | 3,452 | | | 908,428 | |
On Semiconductor Corp. (a) | | 5,453 | | | 426,697 | |
| Qualcomm, Inc. | | 14,252 | | | 2,578,899 | |
| Skyworks Solutions, Inc. | | 1,998 | | | 227,013 | |
| Texas Instruments, Inc. | | 11,891 | | | 2,423,505 | |
| | | | 62,019,080 | |
| | | | |
The accompanying notes are an integral part of these financial statements.
16
| | |
| STRIVE 500 ETF |
| SCHEDULE OF INVESTMENTS (CONTINUED) |
| July 31, 2024 |
| | | | | | | | | | | | | | |
| COMMON STOCKS - 97.6% (CONTINUED) | | Shares | | Value |
| Soft Drinks & Non-alcoholic Beverages - 1.2% | | | | |
| Coca-Cola Co. | | 49,865 | | | $ | 3,327,990 | |
| Keurig Dr Pepper, Inc. | | 15,385 | | | 527,398 | |
Monster Beverage Corp. (a) | | 9,524 | | | 490,010 | |
| PepsiCo, Inc. | | 17,582 | | | 3,035,884 | |
| | | | 7,381,282 | |
| | | | |
| Specialty Chemicals - 0.5% | | | | |
| Albemarle Corp. | | 1,292 | | | 121,022 | |
| Celanese Corp. | | 1,199 | | | 169,239 | |
| DuPont de Nemours, Inc. | | 4,725 | | | 395,482 | |
| Ecolab, Inc. | | 3,214 | | | 741,438 | |
| International Flavors & Fragrances, Inc. | | 3,056 | | | 304,011 | |
| PPG Industries, Inc. | | 2,843 | | | 361,004 | |
| Sherwin-Williams Co. | | 3,102 | | | 1,088,181 | |
| | | | 3,180,377 | |
| | | | |
| Steel - 0.1% | | | | |
| Nucor Corp. | | 2,940 | | | 479,043 | |
| Steel Dynamics, Inc. | | 1,908 | | | 254,184 | |
| | | | 733,227 | |
| | | | |
| Systems Software - 8.0% | | | | |
Crowdstrike Holdings, Inc. - Class A (a) | | 2,964 | | | 687,530 | |
Fortinet, Inc. (a) | | 7,967 | | | 462,405 | |
| Microsoft Corp. | | 95,924 | | | 40,129,805 | |
| Oracle Corp. | | 20,520 | | | 2,861,514 | |
Palo Alto Networks, Inc. (a) | | 4,234 | | | 1,374,907 | |
ServiceNow, Inc. (a) | | 2,693 | | | 2,193,152 | |
Zscaler, Inc. (a) | | 1,004 | | | 180,067 | |
| | | | 47,889,380 | |
| | | | |
| Technology Distributors - 0.1% | | | | |
| CDW Corp. | | 1,716 | | | 374,277 | |
| | | | |
| Technology Hardware, Storage & Peripherals - 7.3% | | | | |
| Apple, Inc. | | 187,790 | | | 41,704,403 | |
| Dell Technologies, Inc. - Class C | | 3,673 | | | 417,547 | |
| Hewlett Packard Enterprise Co. | | 16,471 | | | 327,938 | |
| HP, Inc. | | 12,037 | | | 434,415 | |
| NetApp, Inc. | | 2,519 | | | 319,863 | |
| Seagate Technology Holdings PLC | | 2,468 | | | 252,155 | |
Super Micro Computer, Inc. (a) | | 580 | | | 406,957 | |
Western Digital Corp. (a) | | 4,028 | | | 270,077 | |
| | | | 44,133,355 | |
| | | | |
The accompanying notes are an integral part of these financial statements.
17
| | |
| STRIVE 500 ETF |
| SCHEDULE OF INVESTMENTS (CONTINUED) |
| July 31, 2024 |
| | | | | | | | | | | | | | |
| COMMON STOCKS - 97.6% (CONTINUED) | | Shares | | Value |
| Tobacco - 0.6% | | | | |
| Altria Group, Inc. | | 22,945 | | | $ | 1,124,534 | |
| Philip Morris International, Inc. | | 19,773 | | | 2,277,059 | |
| | | | 3,401,593 | |
| | | | |
| Trading Companies & Distributors - 0.4% | | | | |
| Fastenal Co. | | 7,260 | | | 513,645 | |
| Ferguson PLC | | 2,488 | | | 553,953 | |
| United Rentals, Inc. | | 828 | | | 626,879 | |
| WW Grainger, Inc. | | 565 | | | 551,898 | |
| | | | 2,246,375 | |
| | | | |
| Transaction & Payment Processing Services - 2.3% | | | | |
Block, Inc. (a) | | 7,027 | | | 434,831 | |
Corpay, Inc. (a) | | 949 | | | 276,937 | |
| Fidelity National Information Services, Inc. | | 7,449 | | | 572,307 | |
Fiserv, Inc. (a) | | 7,538 | | | 1,232,990 | |
| Global Payments, Inc. | | 3,089 | | | 313,966 | |
| Mastercard, Inc. - Class A | | 10,746 | | | 4,983,028 | |
PayPal Holdings, Inc. (a) | | 13,800 | | | 907,764 | |
| Visa, Inc. - Class A | | 20,165 | | | 5,357,235 | |
| | | | 14,079,058 | |
| | | | |
| Water Utilities - 0.1% | | | | |
| American Water Works Co., Inc. | | 2,377 | | | 338,390 | |
| | | | |
| Wireless Telecommunication Services - 0.2% | | | | |
| T-Mobile US, Inc. | | 6,652 | | | 1,212,526 | |
TOTAL COMMON STOCKS (Cost $475,044,121) | | | | 586,883,097 | |
| | | | |
| REAL ESTATE INVESTMENT TRUSTS - 2.0% | | | | |
| Alexandria Real Estate Equities, Inc. | | 2,139 | | | 250,883 | |
| American Tower Corp. | | 5,869 | | | 1,293,528 | |
| AvalonBay Communities, Inc. | | 1,780 | | | 364,758 | |
| Crown Castle, Inc. | | 5,490 | | | 604,339 | |
| Digital Realty Trust, Inc. | | 3,814 | | | 570,155 | |
| Equinix, Inc. | | 1,234 | | | 975,156 | |
| Equity Residential | | 4,546 | | | 316,538 | |
| Essex Property Trust, Inc. | | 974 | | | 271,123 | |
| Extra Space Storage, Inc. | | 2,559 | | | 408,468 | |
| Invitation Homes, Inc. | | 7,266 | | | 256,272 | |
| Iron Mountain, Inc. | | 3,674 | | | 376,805 | |
| Mid-America Apartment Communities, Inc. | | 1,280 | | | 178,906 | |
| Prologis, Inc. | | 11,621 | | | 1,464,827 | |
The accompanying notes are an integral part of these financial statements.
18
| | |
| STRIVE 500 ETF |
| SCHEDULE OF INVESTMENTS (CONTINUED) |
| July 31, 2024 |
| | | | | | | | | | | | | | |
| REAL ESTATE INVESTMENT TRUSTS - 2.0% (CONTINUED) | | Shares | | Value |
| Public Storage | | 1,978 | | | $ | 585,330 | |
| Realty Income Corp. | | 12,176 | | | 699,268 | |
| SBA Communications Corp. | | 1,520 | | | 333,701 | |
| Simon Property Group, Inc. | | 3,907 | | | 599,490 | |
| Sun Communities, Inc. | | 1,354 | | | 171,592 | |
| UDR, Inc. | | 4,108 | | | 164,607 | |
| Ventas, Inc. | | 5,142 | | | 279,930 | |
| VICI Properties, Inc. | | 13,091 | | | 409,225 | |
| Welltower, Inc. | | 7,913 | | | 880,321 | |
| Weyerhaeuser Co. | | 9,256 | | | 293,970 | |
| WP Carey, Inc. | | 2,628 | | | 151,925 | |
TOTAL REAL ESTATE INVESTMENT TRUSTS (Cost $10,943,655) | | | | 11,901,117 | |
| | | | |
| SHORT-TERM INVESTMENTS - 0.4% | | | | |
Investments Purchased with Proceeds from Securities Lending - 0.0%(c) | | |
First American Government Obligations Fund - Class X, 5.23% (d) | | 59,400 | | | 59,400 | |
| | | | |
| Money Market Funds - 0.4% | | | | |
First American Government Obligations Fund - Class X, 5.23% (d) | | 2,096,029 | | | 2,096,029 | |
TOTAL SHORT-TERM INVESTMENTS (Cost $2,155,429) | | | | 2,155,429 | |
| | | | |
TOTAL INVESTMENTS - 100.0% (Cost $488,143,205) | | | | $ | 600,939,643 | |
Other Assets in Excess of Liabilities - 0.0% (c) | | | | 268,335 | |
| TOTAL NET ASSETS - 100.0% | | | | $ | 601,207,978 | |
Percentages are stated as a percent of net assets.
NV - Naamloze Vennootschap
PLC - Public Limited Company
SA - Sociedad Anónima
| | | | | | | | |
| (a) | | Non-income producing security. |
| (b) | | All or a portion of this security is on loan as of July 31, 2024. The total market value of these securities was $55,077 which represented 0.0% of net assets. |
| (c) | | Represents less than 0.05% of net assets. |
| (d) | | The rate shown represents the 7-day effective yield as of July 31, 2024. |
The Global Industry Classification Standard (GICS®) was developed by and/or is the exclusive property of MSCI, Inc. and Standard & Poor’s Financial Services LLC (“S&P”). GICS is a service mark of MSCI, Inc. and S&P and has been licensed for use by U.S. Bank Global Fund Services.
The accompanying notes are an integral part of these financial statements.
19
| | |
| STRIVE MID-CAP ETF |
| SCHEDULE OF INVESTMENTS |
| July 31, 2024 |
| | | | | | | | | | | | | | |
| COMMON STOCKS - 92.2% | | Shares | | Value |
| Advertising - 0.4% | | | | |
| Interpublic Group of Cos., Inc. | | 1,372 | | | $ | 44,137 | |
| | | | |
| Aerospace & Defense - 1.9% | | | | |
| BWX Technologies, Inc. | | 321 | | | 31,936 | |
| Curtiss-Wright Corp. | | 138 | | | 40,668 | |
| Hexcel Corp. | | 294 | | | 19,466 | |
| Huntington Ingalls Industries, Inc. | | 147 | | | 41,157 | |
| Textron, Inc. | | 692 | | | 64,287 | |
| Woodward, Inc. | | 211 | | | 32,914 | |
| | | | 230,428 | |
| | | | |
| Agricultural & Farm Machinery - 0.7% | | | | |
| AGCO Corp. | | 217 | | | 20,489 | |
| CNH Industrial NV | | 2,876 | | | 30,629 | |
| Toro Co. | | 367 | | | 35,133 | |
| | | | 86,251 | |
| | | | |
| Agricultural Products & Services - 0.9% | | | | |
| Bunge Global SA | | 503 | | | 52,931 | |
Darling Ingredients, Inc. (a) | | 563 | | | 22,368 | |
| Ingredion, Inc. | | 251 | | | 31,217 | |
| | | | 106,516 | |
| | | | |
| Air Freight & Logistics - 0.5% | | | | |
| CH Robinson Worldwide, Inc. | | 404 | | | 35,976 | |
GXO Logistics, Inc. (a) | | 416 | | | 23,288 | |
| | | | 59,264 | |
| | | | |
| Apparel Retail - 0.7% | | | | |
Burlington Stores, Inc. (a) | | 235 | | | 61,175 | |
| Gap, Inc. | | 882 | | | 20,710 | |
| | | | 81,885 | |
| | | | |
| Apparel, Accessories & Luxury Goods - 1.0% | | | | |
Capri Holdings Ltd. (a) | | 407 | | | 13,651 | |
| Levi Strauss & Co. - Class A | | 343 | | | 6,287 | |
| PVH Corp. | | 204 | | | 20,806 | |
| Ralph Lauren Corp. | | 138 | | | 24,231 | |
| Tapestry, Inc. | | 833 | | | 33,395 | |
| VF Corp. | | 1,274 | | | 21,607 | |
| | | | 119,977 | |
| | | | |
The accompanying notes are an integral part of these financial statements.
20
| | |
| STRIVE MID-CAP ETF |
| SCHEDULE OF INVESTMENTS (CONTINUED) |
| July 31, 2024 |
| | | | | | | | | | | | | | |
| COMMON STOCKS - 92.2% (CONTINUED) | | Shares | | Value |
| Application Software - 5.4% | | | | |
Altair Engineering, Inc. - Class A (a) | | 196 | | | $ | 17,319 | |
Appfolio, Inc. - Class A (a) | | 79 | | | 17,497 | |
AppLovin Corp. - Class A (a) | | 686 | | | 52,891 | |
Aspen Technology, Inc. (a) | | 98 | | | 18,419 | |
BILL Holdings, Inc. (a) | | 362 | | | 18,085 | |
CCC Intelligent Solutions Holdings, Inc. (a) | | 1,309 | | | 13,430 | |
Confluent, Inc. - Class A (a) | | 686 | | | 17,164 | |
DocuSign, Inc. (a) | | 735 | | | 40,778 | |
DoubleVerify Holdings, Inc. (a) | | 490 | | | 10,349 | |
Dropbox, Inc. - Class A (a) | | 892 | | | 21,337 | |
Dynatrace, Inc. (a) | | 999 | | | 43,876 | |
Elastic NV (a) | | 301 | | | 33,011 | |
Freshworks, Inc. - Class A (a) | | 745 | | | 9,312 | |
Guidewire Software, Inc. (a) | | 298 | | | 44,721 | |
Informatica, Inc. - Class A (a) | | 196 | | | 4,692 | |
Klaviyo, Inc. - Class A (a) | | 207 | | | 5,423 | |
Manhattan Associates, Inc. (a) | | 214 | | | 54,651 | |
MicroStrategy, Inc. - Class A (a) | | 57 | | | 92,023 | |
Nutanix, Inc. - Class A (a) | | 882 | | | 44,550 | |
PowerSchool Holdings, Inc. - Class A (a) | | 203 | | | 4,580 | |
Procore Technologies, Inc. (a) | | 357 | | | 25,358 | |
Samsara, Inc. - Class A (a) | | 692 | | | 26,490 | |
Smartsheet, Inc. - Class A (a) | | 490 | | | 23,500 | |
SPS Commerce, Inc. (a) | | 139 | | | 29,943 | |
| | | | 669,399 | |
| | | | |
| Asset Management & Custody Banks - 1.1% | | | | |
| Carlyle Group, Inc. | | 882 | | | 43,871 | |
| Hamilton Lane, Inc. - Class A | | 127 | | | 18,335 | |
| Invesco Ltd. | | 1,617 | | | 27,909 | |
| SEI Investments Co. | | 441 | | | 29,918 | |
| TPG, Inc. | | 270 | | | 13,767 | |
| | | | 133,800 | |
| | | | |
| Automobile Manufacturers - 0.2% | | | | |
Lucid Group, Inc. (a) | | 3,185 | | | 11,211 | |
| Thor Industries, Inc. | | 175 | | | 18,575 | |
| | | | 29,786 | |
| | | | |
| Automotive Parts & Equipment - 0.6% | | | | |
| BorgWarner, Inc. | | 833 | | | 29,413 | |
| Gentex Corp. | | 833 | | | 25,873 | |
| Lear Corp. | | 203 | | | 24,774 | |
| | | | 80,060 | |
| | | | |
The accompanying notes are an integral part of these financial statements.
21
| | |
| STRIVE MID-CAP ETF |
| SCHEDULE OF INVESTMENTS (CONTINUED) |
| July 31, 2024 |
| | | | | | | | | | | | | | |
| COMMON STOCKS - 92.2% (CONTINUED) | | Shares | | Value |
| Automotive Retail - 1.6% | | | | |
AutoNation, Inc. (a) | | 135 | | | $ | 25,747 | |
CarMax, Inc. (a) | | 561 | | | 47,371 | |
Carvana Co. (a) | | 366 | | | 48,762 | |
| Lithia Motors, Inc. | | 98 | | | 27,080 | |
| Murphy USA, Inc. | | 69 | | | 34,840 | |
| Penske Automotive Group, Inc. | | 63 | | | 10,969 | |
| | | | 194,769 | |
| | | | |
| Biotechnology - 2.6% | | | | |
Apellis Pharmaceuticals, Inc. (a) | | 364 | | | 14,414 | |
Bridgebio Pharma, Inc. (a) | | 494 | | | 12,819 | |
Cerevel Therapeutics Holdings, Inc. (a) | | 269 | | | 12,094 | |
Cytokinetics, Inc. (a) | | 363 | | | 21,421 | |
Exact Sciences Corp. (a) | | 660 | | | 30,149 | |
Exelixis, Inc. (a) | | 1,037 | | | 24,318 | |
Ionis Pharmaceuticals, Inc. (a) | | 456 | | | 22,554 | |
Natera, Inc. (a) | | 407 | | | 41,673 | |
Neurocrine Biosciences, Inc. (a) | | 355 | | | 50,257 | |
Roivant Sciences Ltd. (a) | | 1,991 | | | 21,602 | |
Sarepta Therapeutics, Inc. (a) | | 331 | | | 47,081 | |
Vaxcyte, Inc. (a) | | 358 | | | 28,243 | |
| | | | 326,625 | |
| | | | |
| Brewers - 0.3% | | | | |
| Molson Coors Beverage Co. - Class B | | 646 | | | 34,141 | |
| | | | |
| Broadcasting - 0.3% | | | | |
| Nexstar Media Group, Inc. | | 110 | | | 20,327 | |
| Paramount Global - Class A | | 49 | | | 1,122 | |
| Paramount Global - Class B | | 1,849 | | | 21,116 | |
| | | | 42,565 | |
| | | | |
| Broadline Retail - 0.3% | | | | |
| Dillard's, Inc. - Class A | | 12 | | | 4,783 | |
Etsy, Inc. (a) | | 413 | | | 26,903 | |
| | | | 31,686 | |
| | | | |
| Building Products - 4.0% | | | | |
| A O Smith Corp. | | 441 | | | 37,503 | |
| AAON, Inc. | | 245 | | | 21,690 | |
| Advanced Drainage Systems, Inc. | | 286 | | | 50,633 | |
| Allegion PLC | | 310 | | | 42,411 | |
AZEK Co., Inc. (a) | | 510 | | | 22,894 | |
| Carlisle Cos., Inc. | | 172 | | | 71,996 | |
The accompanying notes are an integral part of these financial statements.
22
| | |
| STRIVE MID-CAP ETF |
| SCHEDULE OF INVESTMENTS (CONTINUED) |
| July 31, 2024 |
| | | | | | | | | | | | | | |
| COMMON STOCKS - 92.2% (CONTINUED) | | Shares | | Value |
| Building Products - 4.0% (Continued) | | | | |
| Fortune Brands Innovations, Inc. | | 449 | | | $ | 36,284 | |
| Lennox International, Inc. | | 119 | | | 69,436 | |
| Owens Corning | | 307 | | | 57,219 | |
| Simpson Manufacturing Co., Inc. | | 151 | | | 29,005 | |
Trex Co., Inc. (a) | | 392 | | | 32,783 | |
| UFP Industries, Inc. | | 211 | | | 27,837 | |
| | | | 499,691 | |
| | | | |
| Cable & Satellite - 0.1% | | | | |
Liberty Media Corp.-Liberty SiriusXM (a) | | 512 | | | 11,525 | |
Liberty Media Corp.-Liberty SiriusXM (a) | | 245 | | | 5,542 | |
| | | | 17,067 | |
| | | | |
| Cargo Ground Transportation - 1.3% | | | | |
| Knight-Swift Transportation Holdings, Inc. | | 558 | | | 30,372 | |
| Landstar System, Inc. | | 125 | | | 23,781 | |
Saia, Inc. (a) | | 100 | | | 41,785 | |
| U-Haul Holding Co. | | 357 | | | 22,751 | |
U-Haul Holding Co. (a) | | 25 | | | 1,670 | |
XPO, Inc. (a) | | 403 | | | 46,301 | |
| | | | 166,660 | |
| | | | |
| Casinos & Gaming - 1.2% | | | | |
| Boyd Gaming Corp. | | 245 | | | 14,913 | |
Caesars Entertainment, Inc. (a) | | 735 | | | 29,363 | |
| Churchill Downs, Inc. | | 250 | | | 35,890 | |
Light & Wonder, Inc. - Class A (a) | | 312 | | | 33,447 | |
| Red Rock Resorts, Inc. - Class A | | 173 | | | 9,861 | |
| Wynn Resorts Ltd. | | 343 | | | 28,407 | |
| | | | 151,881 | |
| | | | |
| Commercial & Residential Mortgage Finance - 0.2% | | | | |
| Essent Group Ltd. | | 367 | | | 23,062 | |
| UWM Holdings Corp. | | 294 | | | 2,470 | |
| | | | 25,532 | |
| | | | |
| Commodity Chemicals - 0.2% | | | | |
| Olin Corp. | | 441 | | | 20,114 | |
| | | | |
| Communications Equipment - 0.9% | | | | |
Ciena Corp. (a) | | 510 | | | 26,897 | |
F5, Inc. (a) | | 208 | | | 42,357 | |
| Juniper Networks, Inc. | | 1,152 | | | 43,419 | |
| | | | 112,673 | |
| | | | |
The accompanying notes are an integral part of these financial statements.
23
| | |
| STRIVE MID-CAP ETF |
| SCHEDULE OF INVESTMENTS (CONTINUED) |
| July 31, 2024 |
| | | | | | | | | | | | | | |
| COMMON STOCKS - 92.2% (CONTINUED) | | Shares | | Value |
| Construction & Engineering - 1.9% | | | | |
| AECOM | | 490 | | | $ | 44,399 | |
API Group Corp. (a) | | 864 | | | 32,737 | |
| Comfort Systems USA, Inc. | | 127 | | | 42,218 | |
| EMCOR Group, Inc. | | 173 | | | 64,951 | |
Fluor Corp. (a) | | 603 | | | 29,004 | |
WillScot Holdings Corp. (a) | | 660 | | | 27,060 | |
| | | | 240,369 | |
| | | | |
| Construction Machinery & Heavy Transportation Equipment - 0.2% | | | | |
| Oshkosh Corp. | | 252 | | | 27,380 | |
| | | | |
| Construction Materials - 0.4% | | | | |
| Eagle Materials, Inc. | | 117 | | | 31,859 | |
Summit Materials, Inc. - Class A (a) | | 441 | | | 18,425 | |
| | | | 50,284 | |
| | | | |
| Consumer Finance - 0.8% | | | | |
| Ally Financial, Inc. | | 980 | | | 44,110 | |
Credit Acceptance Corp. (a) | | 19 | | | 10,923 | |
| OneMain Holdings, Inc. | | 441 | | | 23,047 | |
SoFi Technologies, Inc. (a) | | 3,463 | | | 26,111 | |
| | | | 104,191 | |
| | | | |
| Consumer Staples Merchandise Retail - 0.3% | | | | |
BJ's Wholesale Club Holdings, Inc. (a) | | 468 | | | 41,165 | |
| | | | |
| Data Processing & Outsourced Services - 0.3% | | | | |
| Concentrix Corp. | | 196 | | | 13,818 | |
| Genpact Ltd. | | 637 | | | 22,085 | |
| | | | 35,903 | |
| | | | |
| Distributors - 0.7% | | | | |
| LKQ Corp. | | 953 | | | 39,550 | |
| Pool Corp. | | 135 | | | 50,495 | |
| | | | 90,045 | |
| | | | |
| Diversified Banks - 0.6% | | | | |
| Comerica, Inc. | | 467 | | | 25,596 | |
| KeyCorp | | 3,381 | | | 54,536 | |
| | | | 80,132 | |
| | | | |
| Diversified Financial Services - 0.6% | | | | |
| Equitable Holdings, Inc. | | 1,179 | | | 51,416 | |
| Voya Financial, Inc. | | 360 | | | 26,183 | |
| | | | 77,599 | |
| | | | |
The accompanying notes are an integral part of these financial statements.
24
| | |
| STRIVE MID-CAP ETF |
| SCHEDULE OF INVESTMENTS (CONTINUED) |
| July 31, 2024 |
| | | | | | | | | | | | | | |
| COMMON STOCKS - 92.2% (CONTINUED) | | Shares | | Value |
| Education Services - 0.4% | | | | |
Bright Horizons Family Solutions, Inc. (a) | | 205 | | | $ | 24,651 | |
Duolingo, Inc. (a) | | 121 | | | 20,805 | |
| | | | 45,456 | |
| | | | |
| Electric Utilities - 1.0% | | | | |
| NRG Energy, Inc. | | 740 | | | 55,626 | |
| OGE Energy Corp. | | 735 | | | 28,496 | |
| Pinnacle West Capital Corp. | | 406 | | | 34,749 | |
| | | | 118,871 | |
| | | | |
| Electrical Components & Equipment - 1.5% | | | | |
| Acuity Brands, Inc. | | 108 | | | 27,146 | |
| Atkore, Inc. | | 123 | | | 16,605 | |
Generac Holdings, Inc. (a) | | 210 | | | 32,693 | |
NEXTracker, Inc. - Class A (a) | | 464 | | | 22,801 | |
| nVent Electric PLC | | 594 | | | 43,142 | |
| Regal Rexnord Corp. | | 249 | | | 40,009 | |
| | | | 182,396 | |
| | | | |
| Electronic Components - 0.5% | | | | |
Coherent Corp. (a) | | 552 | | | 38,463 | |
| Littelfuse, Inc. | | 89 | | | 23,773 | |
| | | | 62,236 | |
| | | | |
| Electronic Equipment & Instruments - 0.2% | | | | |
| Cognex Corp. | | 613 | | | 30,417 | |
| | | | |
| Electronic Manufacturing Services - 0.8% | | | | |
Flex Ltd. (a) | | 1,502 | | | 48,289 | |
| Jabil, Inc. | | 413 | | | 46,533 | |
| | | | 94,822 | |
| | | | |
| Environmental & Facilities Services - 0.7% | | | | |
Clean Harbors, Inc. (a) | | 183 | | | 43,687 | |
| Tetra Tech, Inc. | | 199 | | | 42,435 | |
| | | | 86,122 | |
| | | | |
| Fertilizers & Agricultural Chemicals - 0.5% | | | | |
| FMC Corp. | | 441 | | | 25,737 | |
| Mosaic Co. | | 1,176 | | | 35,009 | |
| | | | 60,746 | |
| | | | |
The accompanying notes are an integral part of these financial statements.
25
| | |
| STRIVE MID-CAP ETF |
| SCHEDULE OF INVESTMENTS (CONTINUED) |
| July 31, 2024 |
| | | | | | | | | | | | | | |
| COMMON STOCKS - 92.2% (CONTINUED) | | Shares | | Value |
| Financial Exchanges & Data - 0.5% | | | | |
| MarketAxess Holdings, Inc. | | 139 | | | $ | 31,070 | |
| Morningstar, Inc. | | 98 | | | 31,130 | |
| | | | 62,200 | |
| | | | |
| Food Distributors - 0.7% | | | | |
Performance Food Group Co. (a) | | 551 | | | 38,019 | |
US Foods Holding Corp. (a) | | 833 | | | 45,307 | |
| | | | 83,326 | |
| | | | |
| Food Retail - 0.6% | | | | |
| Albertsons Cos., Inc. - Class A | | 1,225 | | | 24,292 | |
| Casey's General Stores, Inc. | | 132 | | | 51,195 | |
| | | | 75,487 | |
| | | | |
| Footwear - 0.8% | | | | |
Crocs, Inc. (a) | | 208 | | | 27,949 | |
On Holding AG - Class A (a) | | 813 | | | 33,674 | |
Skechers USA, Inc. - Class A (a) | | 490 | | | 31,914 | |
| | | | 93,537 | |
| | | | |
| Gold - 0.3% | | | | |
| Royal Gold, Inc. | | 249 | | | 34,392 | |
| | | | |
| Health Care Distributors - 0.3% | | | | |
Henry Schein, Inc. (a) | | 454 | | | 32,661 | |
| | | | |
| Health Care Equipment - 0.7% | | | | |
Globus Medical, Inc. - Class A (a) | | 402 | | | 28,928 | |
Inspire Medical Systems, Inc. (a) | | 103 | | | 14,528 | |
Masimo Corp. (a) | | 171 | | | 18,294 | |
Penumbra, Inc. (a) | | 145 | | | 24,228 | |
| | | | 85,978 | |
| | | | |
| Health Care Facilities - 1.4% | | | | |
Acadia Healthcare Co., Inc. (a) | | 317 | | | 20,557 | |
| Encompass Health Corp. | | 353 | | | 32,808 | |
| Ensign Group, Inc. | | 200 | | | 28,150 | |
Tenet Healthcare Corp. (a) | | 350 | | | 52,395 | |
| Universal Health Services, Inc. - Class B | | 204 | | | 43,607 | |
| | | | 177,517 | |
| | | | |
| Health Care Services - 0.4% | | | | |
| Chemed Corp. | | 53 | | | 30,218 | |
DaVita, Inc. (a) | | 167 | | | 22,816 | |
| | | | 53,034 | |
| | | | |
The accompanying notes are an integral part of these financial statements.
26
| | |
| STRIVE MID-CAP ETF |
| SCHEDULE OF INVESTMENTS (CONTINUED) |
| July 31, 2024 |
| | | | | | | | | | | | | | |
| COMMON STOCKS - 92.2% (CONTINUED) | | Shares | | Value |
| Health Care Supplies - 0.2% | | | | |
| Dentsply Sirona, Inc. | | 741 | | | $ | 20,111 | |
| | | | |
| Home Furnishings - 0.5% | | | | |
Mohawk Industries, Inc. (a) | | 196 | | | 31,570 | |
| Tempur Sealy International, Inc. | | 602 | | | 31,514 | |
| | | | 63,084 | |
| | | | |
| Home Improvement Retail - 0.3% | | | | |
Floor & Decor Holdings, Inc. - Class A (a) | | 358 | | | 35,084 | |
| | | | |
| Homebuilding - 1.3% | | | | |
| Meritage Homes Corp. | | 135 | | | 27,388 | |
Taylor Morrison Home Corp. (a) | | 367 | | | 24,618 | |
| Toll Brothers, Inc. | | 367 | | | 52,375 | |
TopBuild Corp. (a) | | 119 | | | 56,946 | |
| | | | 161,327 | |
| | | | |
| Homefurnishing Retail - 0.7% | | | | |
Wayfair, Inc. - Class A (a) | | 318 | | | 17,309 | |
| Williams-Sonoma, Inc. | | 455 | | | 70,379 | |
| | | | 87,688 | |
| | | | |
| Hotels, Resorts & Cruise Lines - 0.7% | | | | |
| Choice Hotels International, Inc. | | 102 | | | 13,000 | |
| Hyatt Hotels Corp. - Class A | | 155 | | | 22,836 | |
Norwegian Cruise Line Holdings Ltd. (a) | | 1,519 | | | 27,995 | |
| Wyndham Hotels & Resorts, Inc. | | 294 | | | 22,262 | |
| | | | 86,093 | |
| | | | |
| Household Appliances - 0.2% | | | | |
| Whirlpool Corp. | | 196 | | | 19,986 | |
| | | | |
Household Products - 0.0%(b) | | | | |
| Reynolds Consumer Products, Inc. | | 196 | | | 5,453 | |
| | | | |
| Human Resource & Employment Services - 0.7% | | | | |
Dayforce, Inc. (a) | | 539 | | | 31,952 | |
Paylocity Holding Corp. (a) | | 154 | | | 23,111 | |
| Robert Half, Inc. | | 363 | | | 23,301 | |
| TriNet Group, Inc. | | 109 | | | 11,363 | |
| | | | 89,727 | |
| | | | |
| Independent Power Producers & Energy Traders - 0.8% | | | | |
| Vistra Corp. | | 1,246 | | | 98,708 | |
| | | | |
The accompanying notes are an integral part of these financial statements.
27
| | |
| STRIVE MID-CAP ETF |
| SCHEDULE OF INVESTMENTS (CONTINUED) |
| July 31, 2024 |
| | | | | | | | | | | | | | |
| COMMON STOCKS - 92.2% (CONTINUED) | | Shares | | Value |
| Industrial Machinery & Supplies & Components - 3.6% | | | | |
| Crane Co. | | 169 | | | $ | 27,111 | |
| Donaldson Co., Inc. | | 421 | | | 31,499 | |
| Graco, Inc. | | 602 | | | 51,200 | |
| ITT, Inc. | | 302 | | | 42,721 | |
| Lincoln Electric Holdings, Inc. | | 202 | | | 41,493 | |
Middleby Corp. (a) | | 196 | | | 26,574 | |
| Nordson Corp. | | 192 | | | 48,063 | |
| Pentair PLC | | 595 | | | 52,283 | |
RBC Bearings, Inc. (a) | | 102 | | | 29,666 | |
| Snap-on, Inc. | | 187 | | | 53,674 | |
| Timken Co. | | 256 | | | 22,259 | |
| Watts Water Technologies, Inc. - Class A | | 98 | | | 20,337 | |
| | | | 446,880 | |
| | | | |
| Insurance Brokers - 0.2% | | | | |
| Ryan Specialty Holdings, Inc. | | 362 | | | 22,296 | |
| | | | |
| Integrated Telecommunication Services - 0.2% | | | | |
Frontier Communications Parent, Inc. (a) | | 882 | | | 25,843 | |
| | | | |
| Interactive Media & Services - 0.4% | | | | |
Match Group, Inc. (a) | | 980 | | | 37,377 | |
ZoomInfo Technologies, Inc. (a) | | 1,095 | | | 12,439 | |
| | | | 49,816 | |
| | | | |
| Internet Services & Infrastructure - 0.9% | | | | |
GoDaddy, Inc. - Class A (a) | | 526 | | | 76,507 | |
Twilio, Inc. - Class A (a) | | 599 | | | 35,419 | |
| | | | 111,926 | |
| | | | |
| Investment Banking & Brokerage - 1.4% | | | | |
| Evercore, Inc. - Class A | | 131 | | | 32,801 | |
| Houlihan Lokey, Inc. | | 201 | | | 30,200 | |
| Jefferies Financial Group, Inc. | | 539 | | | 31,515 | |
Robinhood Markets, Inc. - Class A (a) | | 2,217 | | | 45,604 | |
| Stifel Financial Corp. | | 349 | | | 30,946 | |
| | | | 171,066 | |
| | | | |
| IT Consulting & Other Services - 0.5% | | | | |
| Amdocs Ltd. | | 415 | | | 36,300 | |
Globant SA (a) | | 151 | | | 29,401 | |
| | | | 65,701 | |
| | | | |
The accompanying notes are an integral part of these financial statements.
28
| | |
| STRIVE MID-CAP ETF |
| SCHEDULE OF INVESTMENTS (CONTINUED) |
| July 31, 2024 |
| | | | | | | | | | | | | | |
| COMMON STOCKS - 92.2% (CONTINUED) | | Shares | | Value |
| Leisure Facilities - 0.4% | | | | |
Planet Fitness, Inc. - Class A (a) | | 309 | | | $ | 22,773 | |
| Vail Resorts, Inc. | | 143 | | | 26,028 | |
| | | | 48,801 | |
| | | | |
| Leisure Products - 0.4% | | | | |
| Hasbro, Inc. | | 464 | | | 29,909 | |
Mattel, Inc. (a) | | 1,233 | | | 23,785 | |
| | | | 53,694 | |
| Life & Health Insurance - 0.8% | | | | |
| F&G Annuities & Life, Inc. | | 49 | | | 2,113 | |
| Globe Life, Inc. | | 352 | | | 32,644 | |
| Primerica, Inc. | | 128 | | | 32,227 | |
| Unum Group | | 598 | | | 34,403 | |
| | | | 101,387 | |
| | | | |
| Life Sciences Tools & Services - 1.7% | | | | |
Bio-Rad Laboratories, Inc. - Class A (a) | | 74 | | | 25,039 | |
| Bio-Techne Corp. | | 558 | | | 45,527 | |
| Bruker Corp. | | 322 | | | 22,060 | |
Charles River Laboratories International, Inc. (a) | | 186 | | | 45,403 | |
Medpace Holdings, Inc. (a) | | 88 | | | 33,662 | |
Repligen Corp. (a) | | 201 | | | 33,637 | |
| | | | 205,328 | |
| | | | |
| Managed Health Care - 0.2% | | | | |
HealthEquity, Inc. (a) | | 302 | | | 23,701 | |
| | | | |
| Metal, Glass & Plastic Containers - 0.8% | | | | |
| AptarGroup, Inc. | | 250 | | | 36,745 | |
| Berry Global Group, Inc. | | 403 | | | 26,485 | |
| Crown Holdings, Inc. | | 423 | | | 37,520 | |
| | | | 100,750 | |
| | | | |
| Movies & Entertainment - 0.5% | | | | |
| Endeavor Group Holdings, Inc. - Class A | | 490 | | | 13,436 | |
Roku, Inc. (a) | | 451 | | | 26,253 | |
| TKO Group Holdings, Inc. | | 253 | | | 27,665 | |
| | | | 67,354 | |
| | | | |
| Multi-Utilities - 0.4% | | | | |
| NiSource, Inc. | | 1,619 | | | 50,594 | |
| | | | |
| Office Services & Supplies - 0.2% | | | | |
| MSA Safety, Inc. | | 143 | | | 26,977 | |
| | | | |
The accompanying notes are an integral part of these financial statements.
29
| | |
| STRIVE MID-CAP ETF |
| SCHEDULE OF INVESTMENTS (CONTINUED) |
| July 31, 2024 |
| | | | | | | | | | | | | | |
| COMMON STOCKS - 92.2% (CONTINUED) | | Shares | | Value |
| Oil & Gas Drilling - 0.2% | | | | |
| Noble Corp. PLC | | 406 | | | $ | 19,171 | |
| | | | |
| Oil & Gas Equipment & Services - 0.5% | | | | |
| NOV, Inc. | | 1,421 | | | 29,585 | |
Weatherford International PLC (a) | | 257 | | | 30,290 | |
| | | | 59,875 | |
| | | | |
| Oil & Gas Exploration & Production - 2.9% | | | | |
Antero Resources Corp. (a) | | 1,029 | | | 29,862 | |
| APA Corp. | | 1,323 | | | 41,264 | |
| Chesapeake Energy Corp. | | 448 | | | 34,196 | |
| Chord Energy Corp. | | 147 | | | 25,234 | |
| Civitas Resources, Inc. | | 356 | | | 24,835 | |
| Matador Resources Co. | | 410 | | | 25,207 | |
| Murphy Oil Corp. | | 514 | | | 21,269 | |
| Ovintiv, Inc. | | 980 | | | 45,511 | |
| Range Resources Corp. | | 848 | | | 26,483 | |
Southwestern Energy Co. (a) | | 3,969 | | | 25,600 | |
| Texas Pacific Land Corp. | | 67 | | | 56,608 | |
| | | | 356,069 | |
| | | | |
| Oil & Gas Refining & Marketing - 0.4% | | | | |
| HF Sinclair Corp. | | 603 | | | 31,036 | |
| PBF Energy, Inc. - Class A | | 366 | | | 14,915 | |
| | | | 45,951 | |
| | | | |
| Oil & Gas Storage & Transportation - 0.2% | | | | |
| Antero Midstream Corp. | | 1,225 | | | 17,591 | |
| New Fortress Energy, Inc. | | 343 | | | 6,771 | |
| | | | 24,362 | |
| | | | |
| Other Specialty Retail - 0.8% | | | | |
| Bath & Body Works, Inc. | | 803 | | | 29,510 | |
Chewy, Inc. - Class A (a) | | 400 | | | 9,672 | |
| Dick's Sporting Goods, Inc. | | 203 | | | 43,919 | |
Five Below, Inc. (a) | | 196 | | | 14,257 | |
| | | | 97,358 | |
| | | | |
| Packaged Foods & Meats - 0.4% | | | | |
| Lamb Weston Holdings, Inc. | | 512 | | | 30,730 | |
Pilgrim's Pride Corp. (a) | | 147 | | | 6,061 | |
Post Holdings, Inc. (a) | | 170 | | | 18,591 | |
| | | | 55,382 | |
| | | | |
The accompanying notes are an integral part of these financial statements.
30
| | |
| STRIVE MID-CAP ETF |
| SCHEDULE OF INVESTMENTS (CONTINUED) |
| July 31, 2024 |
| | | | | | | | | | | | | | |
| COMMON STOCKS - 92.2% (CONTINUED) | | Shares | | Value |
| Paper & Plastic Packaging Products & Materials - 2.2% | | | | |
| Avery Dennison Corp. | | 296 | | | $ | 64,182 | |
| Graphic Packaging Holding Co. | | 1,127 | | | 33,923 | |
| International Paper Co. | | 1,245 | | | 57,868 | |
| Packaging Corp. of America | | 313 | | | 62,559 | |
| Smurfit WestRock PLC | | 931 | | | 41,746 | |
| Sonoco Products Co. | | 343 | | | 18,494 | |
| | | | 278,772 | |
| | | | |
| Passenger Airlines - 0.1% | | | | |
American Airlines Group, Inc. (a) | | 588 | | | 6,256 | |
| | | | |
Passenger Ground Transportation - 0.0%(b) | | | | |
| Avis Budget Group, Inc. | | 57 | | | 5,758 | |
| | | | |
| Personal Care Products - 0.6% | | | | |
BellRing Brands, Inc. (a) | | 463 | | | 23,742 | |
Coty, Inc. - Class A (a) | | 1,421 | | | 14,139 | |
elf Beauty, Inc. (a) | | 196 | | | 33,826 | |
| | | | 71,707 | |
| | | | |
| Pharmaceuticals - 1.3% | | | | |
Catalent, Inc. (a) | | 637 | | | 37,800 | |
Elanco Animal Health, Inc. (a) | | 1,764 | | | 23,002 | |
Intra-Cellular Therapies, Inc. (a) | | 350 | | | 27,552 | |
Jazz Pharmaceuticals PLC (a) | | 213 | | | 23,483 | |
| Viatris, Inc. | | 4,277 | | | 51,581 | |
| | | | 163,418 | |
| | | | |
| Property & Casualty Insurance - 2.1% | | | | |
| American Financial Group, Inc./OH | | 252 | | | 33,002 | |
| Assurant, Inc. | | 198 | | | 34,624 | |
| Fidelity National Financial, Inc. | | 957 | | | 53,027 | |
| First American Financial Corp. | | 355 | | | 21,506 | |
| Kinsale Capital Group, Inc. | | 82 | | | 37,480 | |
| Old Republic International Corp. | | 931 | | | 32,231 | |
| RLI Corp. | | 157 | | | 23,643 | |
| Selective Insurance Group, Inc. | | 211 | | | 19,058 | |
| | | | 254,571 | |
| | | | |
| Publishing - 0.6% | | | | |
| New York Times Co. - Class A | | 554 | | | 29,689 | |
| News Corp. - Class A | | 1,372 | | | 37,840 | |
| News Corp. - Class B | | 441 | | | 12,564 | |
| | | | 80,093 | |
| | | | |
The accompanying notes are an integral part of these financial statements.
31
| | |
| STRIVE MID-CAP ETF |
| SCHEDULE OF INVESTMENTS (CONTINUED) |
| July 31, 2024 |
| | | | | | | | | | | | | | |
| COMMON STOCKS - 92.2% (CONTINUED) | | Shares | | Value |
| Real Estate Services - 0.6% | | | | |
Jones Lang LaSalle, Inc. (a) | | 174 | | | $ | 43,656 | |
Zillow Group, Inc. - Class A (a) | | 147 | | | 6,968 | |
Zillow Group, Inc. - Class C (a) | | 554 | | | 26,980 | |
| | | | 77,604 | |
| | | | |
| Regional Banks - 2.7% | | | | |
| Commerce Bancshares, Inc./MO | | 419 | | | 27,114 | |
| Cullen/Frost Bankers, Inc. | | 210 | | | 24,583 | |
| East West Bancorp, Inc. | | 499 | | | 43,857 | |
| First Horizon Corp. | | 1,943 | | | 32,506 | |
| Pinnacle Financial Partners, Inc. | | 264 | | | 25,428 | |
| Popular, Inc. | | 253 | | | 25,965 | |
| Prosperity Bancshares, Inc. | | 323 | | | 23,424 | |
| SouthState Corp. | | 265 | | | 26,227 | |
| Webster Financial Corp. | | 611 | | | 30,318 | |
| Western Alliance Bancorp | | 369 | | | 29,690 | |
| Wintrust Financial Corp. | | 214 | | | 23,155 | |
| Zions Bancorp NA | | 539 | | | 27,850 | |
| | | | 340,117 | |
| | | | |
| Reinsurance - 1.3% | | | | |
| Everest Group Ltd. | | 153 | | | 60,109 | |
| Reinsurance Group of America, Inc. | | 239 | | | 53,878 | |
| RenaissanceRe Holdings Ltd. | | 187 | | | 43,367 | |
| | | | 157,354 | |
| | | | |
| Research & Consulting Services - 1.2% | | | | |
CACI International, Inc. - Class A (a) | | 78 | | | 35,995 | |
Clarivate PLC (a) | | 1,421 | | | 9,578 | |
FTI Consulting, Inc. (a) | | 134 | | | 29,208 | |
| KBR, Inc. | | 490 | | | 32,629 | |
Parsons Corp. (a) | | 161 | | | 14,711 | |
| Science Applications International Corp. | | 176 | | | 21,894 | |
| | | | 144,015 | |
| | | | |
| Restaurants - 0.9% | | | | |
| Aramark | | 931 | | | 31,905 | |
| Texas Roadhouse, Inc. | | 252 | | | 44,002 | |
| Wingstop, Inc. | | 104 | | | 38,884 | |
| | | | 114,791 | |
| | | | |
| Semiconductor Materials & Equipment - 0.6% | | | | |
| Amkor Technology, Inc. | | 441 | | | 14,403 | |
| MKS Instruments, Inc. | | 245 | | | 30,846 | |
The accompanying notes are an integral part of these financial statements.
32
| | |
| STRIVE MID-CAP ETF |
| SCHEDULE OF INVESTMENTS (CONTINUED) |
| July 31, 2024 |
| | | | | | | | | | | | | | |
| COMMON STOCKS - 92.2% (CONTINUED) | | Shares | | Value |
| Semiconductor Materials & Equipment - 0.6% (Continued) | | | | |
Onto Innovation, Inc. (a) | | 184 | | | $ | 35,199 | |
| | | | 80,448 | |
| | | | |
| Semiconductors - 1.2% | | | | |
Lattice Semiconductor Corp. (a) | | 490 | | | 25,970 | |
MACOM Technology Solutions Holdings, Inc. (a) | | 203 | | | 20,487 | |
Qorvo, Inc. (a) | | 343 | | | 41,091 | |
Rambus, Inc. (a) | | 392 | | | 20,165 | |
| Universal Display Corp. | | 161 | | | 35,842 | |
| | | | 143,555 | |
| | | | |
| Soft Drinks & Non-alcoholic Beverages - 0.4% | | | | |
Celsius Holdings, Inc. (a) | | 593 | | | 27,770 | |
| Coca-Cola Consolidated, Inc. | | 21 | | | 24,064 | |
| | | | 51,834 | |
| | | | |
| Specialized Consumer Services - 0.7% | | | | |
| ADT, Inc. | | 1,422 | | | 11,063 | |
| H&R Block, Inc. | | 497 | | | 28,796 | |
| Service Corp. International/US | | 514 | | | 41,074 | |
| | | | 80,933 | |
| | | | |
| Specialty Chemicals - 1.0% | | | | |
Axalta Coating Systems Ltd. (a) | | 784 | | | 27,949 | |
| Eastman Chemical Co. | | 415 | | | 42,882 | |
| RPM International, Inc. | | 456 | | | 55,386 | |
| | | | 126,217 | |
| | | | |
| Steel - 1.2% | | | | |
Cleveland-Cliffs, Inc. (a) | | 1,681 | | | 25,804 | |
| Commercial Metals Co. | | 409 | | | 24,581 | |
| Reliance, Inc. | | 204 | | | 62,130 | |
| United States Steel Corp. | | 735 | | | 30,201 | |
| | | | 142,716 | |
| | | | |
| Systems Software - 1.8% | | | | |
CyberArk Software Ltd. (a) | | 152 | | | 38,970 | |
| Dolby Laboratories, Inc. - Class A | | 208 | | | 16,382 | |
| Gen Digital, Inc. | | 2,009 | | | 52,214 | |
Gitlab, Inc. - Class A (a) | | 399 | | | 20,441 | |
Monday.com Ltd. (a) | | 136 | | | 31,254 | |
Qualys, Inc. (a) | | 144 | | | 21,476 | |
The accompanying notes are an integral part of these financial statements.
33
| | |
| STRIVE MID-CAP ETF |
| SCHEDULE OF INVESTMENTS (CONTINUED) |
| July 31, 2024 |
| | | | | | | | | | | | | | |
| COMMON STOCKS - 92.2% (CONTINUED) | | Shares | | Value |
| Systems Software - 1.8% (Continued) | | | | |
SentinelOne, Inc. - Class A (a) | | 954 | | | $ | 21,847 | |
UiPath, Inc. - Class A (a) | | 1,479 | | | 17,999 | |
| | | | 220,583 | |
| | | | |
| Technology Distributors - 0.7% | | | | |
Arrow Electronics, Inc. (a) | | 196 | | | 24,243 | |
Insight Enterprises, Inc. (a) | | 125 | | | 28,062 | |
| TD Synnex Corp. | | 245 | | | 29,197 | |
| | | | 81,502 | |
| | | | |
| Technology Hardware, Storage & Peripherals - 0.5% | | | | |
Pure Storage, Inc. - Class A (a) | | 1,103 | | | 66,103 | |
| | | | |
| Trading Companies & Distributors - 2.1% | | | | |
| AerCap Holdings NV | | 706 | | | 66,329 | |
| Applied Industrial Technologies, Inc. | | 142 | | | 30,983 | |
Core & Main, Inc. - Class A (a) | | 686 | | | 36,680 | |
| MSC Industrial Direct Co., Inc. - Class A | | 157 | | | 13,965 | |
SiteOne Landscape Supply, Inc. (a) | | 158 | | | 23,175 | |
| Watsco, Inc. | | 121 | | | 59,228 | |
| WESCO International, Inc. | | 191 | | | 33,416 | |
| | | | 263,776 | |
| | | | |
| Transaction & Payment Processing Services - 1.2% | | | | |
Affirm Holdings, Inc. (a) | | 799 | | | 22,604 | |
| Jack Henry & Associates, Inc. | | 258 | | | 44,242 | |
Shift4 Payments, Inc. - Class A (a) | | 210 | | | 14,446 | |
Toast, Inc. - Class A (a) | | 1,519 | | | 39,737 | |
WEX, Inc. (a) | | 147 | | | 26,967 | |
| | | | 147,996 | |
| | | | |
| Water Utilities - 0.3% | | | | |
| Essential Utilities, Inc. | | 903 | | | 36,707 | |
TOTAL COMMON STOCKS (Cost $10,977,086) | | | | 11,425,542 | |
| | | | |
| REAL ESTATE INVESTMENT TRUSTS - 7.4% | | | | |
| AGNC Investment Corp. | | 2,577 | | | 25,796 | |
| Agree Realty Corp. | | 354 | | | 24,415 | |
| American Homes 4 Rent - Class A | | 1,127 | | | 40,673 | |
| Americold Realty Trust, Inc. | | 1,029 | | | 30,757 | |
| Annaly Capital Management, Inc. | | 1,813 | | | 36,097 | |
| Brixmor Property Group, Inc. | | 1,078 | | | 27,457 | |
| BXP, Inc. | | 512 | | | 36,511 | |
| Camden Property Trust | | 373 | | | 41,310 | |
The accompanying notes are an integral part of these financial statements.
34
| | |
| STRIVE MID-CAP ETF |
| SCHEDULE OF INVESTMENTS (CONTINUED) |
| July 31, 2024 |
| | | | | | | | | | | | | | |
| REAL ESTATE INVESTMENT TRUSTS - 7.4% (CONTINUED) | | Shares | | Value |
| CubeSmart | | 834 | | | $ | 39,682 | |
| EastGroup Properties, Inc. | | 182 | | | 34,032 | |
| Equity LifeStyle Properties, Inc. | | 598 | | | 41,071 | |
| Federal Realty Investment Trust | | 305 | | | 34,053 | |
| First Industrial Realty Trust, Inc. | | 468 | | | 25,609 | |
| Gaming and Leisure Properties, Inc. | | 958 | | | 48,091 | |
| Healthcare Realty Trust, Inc. | | 1,372 | | | 24,271 | |
| Healthpeak Properties, Inc. | | 2,607 | | | 56,885 | |
| Host Hotels & Resorts, Inc. | | 2,511 | | | 43,968 | |
| Kimco Realty Corp. | | 2,401 | | | 52,174 | |
| Lamar Advertising Co. - Class A | | 310 | | | 37,156 | |
| NNN REIT, Inc. | | 651 | | | 29,223 | |
| Omega Healthcare Investors, Inc. | | 882 | | | 32,105 | |
| Regency Centers Corp. | | 657 | | | 44,242 | |
| Rexford Industrial Realty, Inc. | | 784 | | | 39,286 | |
| Ryman Hospitality Properties, Inc. | | 204 | | | 20,504 | |
| STAG Industrial, Inc. | | 652 | | | 26,608 | |
| Starwood Property Trust, Inc. | | 1,078 | | | 21,506 | |
TOTAL REAL ESTATE INVESTMENT TRUSTS (Cost $839,420) | | | | 913,482 | |
| | | | |
| SHORT-TERM INVESTMENTS - 0.4% | | | | |
| Money Market Funds - 0.4% | | | | |
First American Government Obligations Fund - Class X, 5.23% (c) | | 46,635 | | | 46,635 | |
TOTAL SHORT-TERM INVESTMENTS (Cost $46,635) | | | | 46,635 | |
| | | | |
TOTAL INVESTMENTS - 100.0% (Cost $11,863,141) | | | | $ | 12,385,659 | |
Other Assets in Excess of Liabilities - 0.0% (b) | | | | 2,162 | |
| TOTAL NET ASSETS - 100.0% | | | | $ | 12,387,821 | |
Percentages are stated as a percent of net assets.
| | |
| AG - Aktiengesellschaft |
| NV - Naamloze Vennootschap |
| PLC - Public Limited Company |
| SA - Sociedad Anónima |
| | | | | | | | |
| (a) | | Non-income producing security. |
| (b) | | Represents less than 0.05% of net assets. |
| (c) | | The rate shown represents the 7-day annualized effective yield as of July 31, 2024. |
The Global Industry Classification Standard (GICS®) was developed by and/or is the exclusive property of MSCI, Inc. and Standard & Poor’s Financial Services LLC (“S&P”). GICS is a service mark of MSCI, Inc. and S&P and has been licensed for use by U.S. Bank Global Fund Services.
The accompanying notes are an integral part of these financial statements.
35
| | |
| STRIVE SMALL-CAP ETF |
| SCHEDULE OF INVESTMENTS |
| July 31, 2024 |
| | | | | | | | | | | | | | |
| COMMON STOCKS - 93.6% | | Shares | | Value |
| Advertising - 0.1% | | | | |
Integral Ad Science Holding Corp. (a) | | 2,549 | | | $ | 25,949 | |
| | | | |
| Aerospace & Defense - 1.2% | | | | |
AAR Corp. (a) | | 930 | | | 60,078 | |
AeroVironment, Inc. (a) | | 796 | | | 142,118 | |
Kratos Defense & Security Solutions, Inc. (a) | | 4,096 | | | 92,324 | |
Leonardo DRS, Inc. (a) | | 2,040 | | | 57,528 | |
| Moog, Inc. - Class A | | 807 | | | 158,252 | |
Rocket Lab USA, Inc. (a) | | 9,162 | | | 48,009 | |
Spirit AeroSystems Holdings, Inc. - Class A (a) | | 3,200 | | | 116,000 | |
| | | | 674,309 | |
| | | | |
| Agricultural & Farm Machinery - 0.1% | | | | |
| Alamo Group, Inc. | | 307 | | | 59,165 | |
| | | | |
| Air Freight & Logistics - 0.2% | | | | |
| Hub Group, Inc. - Class A | | 1,740 | | | 81,380 | |
| | | | |
| Alternative Carriers - 0.4% | | | | |
| Cogent Communications Holdings, Inc. | | 1,220 | | | 86,120 | |
Globalstar, Inc. (a) | | 21,008 | | | 25,420 | |
| Iridium Communications, Inc. | | 3,068 | | | 88,051 | |
| | | | 199,591 | |
| | | | |
| Aluminum - 0.4% | | | | |
| Alcoa Corp. | | 4,915 | | | 162,392 | |
Constellium SE (a) | | 3,497 | | | 62,281 | |
| | | | 224,673 | |
| | | | |
| Apparel Retail - 1.1% | | | | |
Abercrombie & Fitch Co. - Class A (a) | | 1,406 | | | 207,357 | |
| American Eagle Outfitters, Inc. | | 5,181 | | | 114,241 | |
Boot Barn Holdings, Inc. (a) | | 873 | | | 116,528 | |
| Foot Locker, Inc. | | 2,545 | | | 73,957 | |
Urban Outfitters, Inc. (a) | | 1,914 | | | 88,140 | |
| | | | 600,223 | |
| | | | |
| Apparel, Accessories & Luxury Goods - 0.6% | | | | |
| Carter's, Inc. | | 1,052 | | | 63,699 | |
| Columbia Sportswear Co. | | 926 | | | 75,654 | |
| Kontoor Brands, Inc. | | 1,512 | | | 106,067 | |
Under Armour, Inc. - Class A (a) | | 5,231 | | | 36,460 | |
Under Armour, Inc. - Class C (a) | | 5,289 | | | 35,912 | |
| | | | 317,792 | |
| | | | |
The accompanying notes are an integral part of these financial statements.
36
| | |
| STRIVE SMALL-CAP ETF |
| SCHEDULE OF INVESTMENTS (CONTINUED) |
| July 31, 2024 |
| | | | | | | | | | | | | | |
| COMMON STOCKS - 93.6% (CONTINUED) | | Shares | | Value |
| Application Software - 4.4% | | | | |
ACI Worldwide, Inc. (a) | | 2,976 | | | $ | 128,652 | |
Agilysys, Inc. (a) | | 655 | | | 73,419 | |
Alarm.com Holdings, Inc. (a) | | 1,299 | | | 91,644 | |
Alkami Technology, Inc. (a) | | 1,106 | | | 36,199 | |
Asana, Inc. - Class A (a) | | 2,189 | | | 31,850 | |
Aurora Innovation, Inc. (a) | | 24,396 | | | 97,584 | |
Blackbaud, Inc. (a) | | 1,469 | | | 116,609 | |
BlackLine, Inc. (a) | | 1,701 | | | 80,832 | |
Box, Inc. - Class A (a) | | 3,805 | | | 106,997 | |
Braze, Inc. - Class A (a) | | 1,677 | | | 73,889 | |
C3.ai, Inc. - Class A (a) | | 3,187 | | | 85,252 | |
| Clear Secure, Inc. - Class A | | 2,476 | | | 52,863 | |
Clearwater Analytics Holdings, Inc. - Class A (a) | | 4,069 | | | 79,549 | |
Envestnet, Inc. (a) | | 1,352 | | | 83,797 | |
Five9, Inc. (a) | | 1,979 | | | 88,164 | |
HashiCorp, Inc. - Class A (a) | | 3,364 | | | 113,535 | |
Instructure Holdings, Inc. (a) | | 487 | | | 11,376 | |
Intapp, Inc. (a) | | 1,152 | | | 41,276 | |
| InterDigital, Inc. | | 701 | | | 86,055 | |
Jamf Holding Corp. (a) | | 1,876 | | | 34,350 | |
LiveRamp Holdings, Inc. (a) | | 1,764 | | | 53,414 | |
Marathon Digital Holdings, Inc. (a) | | 7,220 | | | 142,017 | |
nCino, Inc. (a) | | 2,242 | | | 73,448 | |
PagerDuty, Inc. (a) | | 2,328 | | | 48,725 | |
| Pegasystems, Inc. | | 1,292 | | | 90,078 | |
Q2 Holdings, Inc. (a) | | 1,521 | | | 102,622 | |
RingCentral, Inc. - Class A (a) | | 2,266 | | | 79,423 | |
Riot Platforms, Inc. (a) | | 6,469 | | | 65,919 | |
Sprinklr, Inc. - Class A (a) | | 3,242 | | | 31,869 | |
Sprout Social, Inc. - Class A (a) | | 1,296 | | | 50,635 | |
Vertex, Inc. - Class A (a) | | 1,477 | | | 58,563 | |
Workiva, Inc. (a) | | 1,423 | | | 104,975 | |
| | | | 2,415,580 | |
| | | | |
| Asset Management & Custody Banks - 1.3% | | | | |
| Affiliated Managers Group, Inc. | | 918 | | | 170,399 | |
| Artisan Partners Asset Management, Inc. - Class A | | 1,840 | | | 81,255 | |
AssetMark Financial Holdings, Inc. (a) | | 588 | | | 20,286 | |
| Cohen & Steers, Inc. | | 792 | | | 67,970 | |
| Federated Hermes, Inc. - Class B | | 2,325 | | | 79,817 | |
| Janus Henderson Group PLC | | 3,680 | | | 137,006 | |
The accompanying notes are an integral part of these financial statements.
37
| | |
| STRIVE SMALL-CAP ETF |
| SCHEDULE OF INVESTMENTS (CONTINUED) |
| July 31, 2024 |
| | | | | | | | | | | | | | |
| COMMON STOCKS - 93.6% (CONTINUED) | | Shares | | Value |
| Asset Management & Custody Banks - 1.3% (Continued) | | | | |
| StepStone Group, Inc. - Class A | | 1,686 | | | $ | 84,738 | |
| Victory Capital Holdings, Inc. - Class A | | 1,315 | | | 68,893 | |
| | | | 710,364 | |
| | | | |
| Automotive Parts & Equipment - 1.2% | | | | |
Adient PLC (a) | | 2,503 | | | 64,477 | |
Dorman Products, Inc. (a) | | 726 | | | 73,595 | |
Fox Factory Holding Corp. (a) | | 1,151 | | | 61,452 | |
| LCI Industries | | 733 | | | 85,534 | |
Modine Manufacturing Co. (a) | | 1,408 | | | 165,665 | |
| Patrick Industries, Inc. | | 573 | | | 73,378 | |
QuantumScape Corp. (a)(b) | | 8,724 | | | 56,357 | |
Visteon Corp. (a) | | 744 | | | 85,962 | |
| | | | 666,420 | |
| | | | |
| Automotive Retail - 1.0% | | | | |
| Advance Auto Parts, Inc. | | 1,691 | | | 107,091 | |
Asbury Automotive Group, Inc. (a) | | 578 | | | 155,609 | |
| Group 1 Automotive, Inc. | | 363 | | | 132,757 | |
Valvoline, Inc. (a) | | 3,586 | | | 166,749 | |
| | | | 562,206 | |
| | | | |
| Biotechnology - 5.4% | | | | |
Acadia Pharmaceuticals, Inc. (a) | | 3,346 | | | 63,641 | |
Alkermes PLC (a) | | 4,832 | | | 132,010 | |
Alvotech SA (a) | | 2,027 | | | 23,716 | |
Amicus Therapeutics, Inc. (a) | | 8,120 | | | 83,717 | |
Arcellx, Inc. (a) | | 1,150 | | | 71,081 | |
Arrowhead Pharmaceuticals, Inc. (a) | | 3,274 | | | 93,505 | |
Biohaven Ltd. (a) | | 1,954 | | | 76,851 | |
Blueprint Medicines Corp. (a) | | 1,745 | | | 188,983 | |
Crinetics Pharmaceuticals, Inc. (a) | | 2,102 | | | 111,658 | |
Crispr Therapeutics AG (a) | | 2,296 | | | 131,538 | |
Denali Therapeutics, Inc. (a) | | 3,212 | | | 78,276 | |
Halozyme Therapeutics, Inc. (a) | | 3,532 | | | 195,178 | |
Ideaya Biosciences, Inc. (a) | | 1,984 | | | 85,411 | |
ImmunityBio, Inc. (a)(b) | | 3,787 | | | 19,503 | |
Immunovant, Inc. (a) | | 1,683 | | | 48,925 | |
Insmed, Inc. (a) | | 4,181 | | | 304,168 | |
Intellia Therapeutics, Inc. (a) | | 2,551 | | | 66,862 | |
Ironwood Pharmaceuticals, Inc. (a) | | 3,765 | | | 25,715 | |
Krystal Biotech, Inc. (a) | | 700 | | | 145,922 | |
Madrigal Pharmaceuticals, Inc. (a) | | 489 | | | 139,199 | |
MoonLake Immunotherapeutics (a) | | 559 | | | 23,282 | |
The accompanying notes are an integral part of these financial statements.
38
| | |
| STRIVE SMALL-CAP ETF |
| SCHEDULE OF INVESTMENTS (CONTINUED) |
| July 31, 2024 |
| | | | | | | | | | | | | | |
| COMMON STOCKS - 93.6% (CONTINUED) | | Shares | | Value |
| Biotechnology - 5.4% (Continued) | | | | |
Nuvalent, Inc. - Class A (a) | | 1,005 | | | $ | 80,340 | |
Revolution Medicines, Inc. (a) | | 4,225 | | | 192,829 | |
Rhythm Pharmaceuticals, Inc. (a) | | 1,631 | | | 78,631 | |
Rocket Pharmaceuticals, Inc. (a) | | 1,936 | | | 46,851 | |
SpringWorks Therapeutics, Inc. (a) | | 1,816 | | | 65,213 | |
Summit Therapeutics, Inc. (a) | | 3,051 | | | 32,951 | |
TG Therapeutics, Inc. (a) | | 4,218 | | | 83,348 | |
Ultragenyx Pharmaceutical, Inc. (a) | | 2,146 | | | 96,613 | |
Viking Therapeutics, Inc. (a) | | 2,902 | | | 165,414 | |
| | | | 2,951,331 | |
| | | | |
| Brewers - 0.1% | | | | |
Boston Beer Co., Inc. - Class A (a) | | 196 | | | 54,921 | |
| | | | |
| Broadcasting - 0.1% | | | | |
| Tegna, Inc. | | 4,889 | | | 77,882 | |
| | | | |
| Broadline Retail - 0.8% | | | | |
| Kohl's Corp. | | 2,993 | | | 64,828 | |
| Macy's, Inc. | | 7,492 | | | 129,462 | |
| Nordstrom, Inc. | | 2,697 | | | 61,573 | |
Ollie's Bargain Outlet Holdings, Inc. (a) | | 1,758 | | | 171,651 | |
Savers Value Village, Inc. (a) | | 712 | | | 7,255 | |
| | | | 434,769 | |
| | | | |
| Building Products - 1.4% | | | | |
| Armstrong World Industries, Inc. | | 1,241 | | | 163,067 | |
| CSW Industrials, Inc. | | 445 | | | 144,367 | |
Gibraltar Industries, Inc. (a) | | 816 | | | 60,604 | |
| Griffon Corp. | | 1,261 | | | 90,868 | |
Hayward Holdings, Inc. (a) | | 3,913 | | | 57,873 | |
Resideo Technologies, Inc. (a) | | 4,218 | | | 95,833 | |
| Tecnoglass, Inc. | | 605 | | | 32,555 | |
| Zurn Elkay Water Solutions Corp. | | 3,838 | | | 124,582 | |
| | | | 769,749 | |
| | | | |
| Cable & Satellite - 0.2% | | | | |
| Cable One, Inc. | | 131 | | | 54,153 | |
EchoStar Corp. - Class A (a) | | 3,374 | | | 67,750 | |
| | | | 121,903 | |
| | | | |
| Cargo Ground Transportation - 0.8% | | | | |
| ArcBest Corp. | | 598 | | | 75,378 | |
RXO, Inc. (a) | | 3,214 | | | 101,916 | |
The accompanying notes are an integral part of these financial statements.
39
| | |
| STRIVE SMALL-CAP ETF |
| SCHEDULE OF INVESTMENTS (CONTINUED) |
| July 31, 2024 |
| | | | | | | | | | | | | | |
| COMMON STOCKS - 93.6% (CONTINUED) | | Shares | | Value |
| Cargo Ground Transportation - 0.8% (Continued) | | | | |
| Ryder System, Inc. | | 1,140 | | | $ | 159,783 | |
| Schneider National, Inc. - Class B | | 1,075 | | | 28,928 | |
| Werner Enterprises, Inc. | | 1,706 | | | 66,858 | |
| | | | 432,863 | |
| | | | |
| Casinos & Gaming - 0.4% | | | | |
| International Game Technology PLC | | 3,144 | | | 73,790 | |
Penn Entertainment, Inc. (a) | | 4,262 | | | 85,112 | |
Sportradar Group AG - Class A (a) | | 3,360 | | | 36,489 | |
| | | | 195,391 | |
| | | | |
| Coal & Consumable Fuels - 0.4% | | | | |
Consol Energy, Inc. (a) | | 615 | | | 61,383 | |
| Peabody Energy Corp. | | 3,322 | | | 73,782 | |
Uranium Energy Corp. (a) | | 11,963 | | | 70,940 | |
| | | | 206,105 | |
| | | | |
| Commercial & Residential Mortgage Finance - 1.4% | | | | |
| Enact Holdings, Inc. | | 791 | | | 26,918 | |
| MGIC Investment Corp. | | 7,616 | | | 189,181 | |
Mr Cooper Group, Inc. (a) | | 1,763 | | | 158,458 | |
NMI Holdings, Inc. - Class A (a) | | 2,268 | | | 89,246 | |
| PennyMac Financial Services, Inc. | | 697 | | | 68,390 | |
| Radian Group, Inc. | | 4,220 | | | 156,562 | |
| Walker & Dunlop, Inc. | | 903 | | | 96,531 | |
| | | | 785,286 | |
| | | | |
| Commercial Printing - 0.2% | | | | |
| Brady Corp. - Class A | | 1,277 | | | 91,446 | |
| | | | |
| Commodity Chemicals - 0.4% | | | | |
| Cabot Corp. | | 1,537 | | | 154,146 | |
| Tronox Holdings PLC | | 3,210 | | | 51,873 | |
| | | | 206,019 | |
| | | | |
| Communications Equipment - 0.5% | | | | |
Calix, Inc. (a) | | 1,568 | | | 64,492 | |
Lumentum Holdings, Inc. (a) | | 1,974 | | | 102,214 | |
Viasat, Inc. (a) | | 3,023 | | | 61,125 | |
Viavi Solutions, Inc. (a) | | 5,955 | | | 47,878 | |
| | | | 275,709 | |
| | | | |
| Computer & Electronics Retail - 0.3% | | | | |
GameStop Corp. - Class A (a) | | 7,413 | | | 168,053 | |
| | | | |
The accompanying notes are an integral part of these financial statements.
40
| | |
| STRIVE SMALL-CAP ETF |
| SCHEDULE OF INVESTMENTS (CONTINUED) |
| July 31, 2024 |
| | | | | | | | | | | | | | |
| COMMON STOCKS - 93.6% (CONTINUED) | | Shares | | Value |
| Construction & Engineering - 1.9% | | | | |
| Arcosa, Inc. | | 1,332 | | | $ | 123,756 | |
Construction Partners, Inc. - Class A (a) | | 1,163 | | | 75,188 | |
Dycom Industries, Inc. (a) | | 815 | | | 149,561 | |
MasTec, Inc. (a) | | 1,741 | | | 191,562 | |
| MDU Resources Group, Inc. | | 5,600 | | | 150,864 | |
MYR Group, Inc. (a) | | 437 | | | 61,390 | |
Sterling Infrastructure, Inc. (a) | | 806 | | | 93,786 | |
| Valmont Industries, Inc. | | 563 | | | 167,977 | |
| | | | 1,014,084 | |
| | | | |
| Construction Machinery & Heavy Transportation Equipment - 0.9% | | | | |
| Allison Transmission Holdings, Inc. | | 2,437 | | | 215,894 | |
| Federal Signal Corp. | | 1,729 | | | 172,848 | |
| Terex Corp. | | 1,869 | | | 118,233 | |
| | | | 506,975 | |
| | | | |
| Construction Materials - 0.2% | | | | |
Knife River Corp. (a) | | 1,576 | | | 125,324 | |
| | | | |
| Consumer Finance - 0.6% | | | | |
| FirstCash Holdings, Inc. | | 1,067 | | | 119,077 | |
| Nelnet, Inc. - Class A | | 362 | | | 40,801 | |
| SLM Corp. | | 6,007 | | | 136,299 | |
Upstart Holdings, Inc. (a)(b) | | 1,995 | | | 55,720 | |
| | | | 351,897 | |
| | | | |
| Consumer Staples Merchandise Retail - 0.1% | | | | |
| PriceSmart, Inc. | | 701 | | | 64,022 | |
| | | | |
| Data Processing & Outsourced Services - 0.8% | | | | |
ExlService Holdings, Inc. (a) | | 4,453 | | | 157,013 | |
| Maximus, Inc. | | 1,748 | | | 162,371 | |
Verra Mobility Corp. (a) | | 4,614 | | | 139,020 | |
| | | | 458,404 | |
| | | | |
| Diversified Chemicals - 0.4% | | | | |
| Chemours Co. | | 4,077 | | | 98,541 | |
| Huntsman Corp. | | 4,566 | | | 109,264 | |
| | | | 207,805 | |
| | | | |
| Diversified Financial Services - 0.3% | | | | |
| Jackson Financial, Inc. - Class A | | 2,090 | | | 184,045 | |
| | | | |
The accompanying notes are an integral part of these financial statements.
41
| | |
| STRIVE SMALL-CAP ETF |
| SCHEDULE OF INVESTMENTS (CONTINUED) |
| July 31, 2024 |
| | | | | | | | | | | | | | |
| COMMON STOCKS - 93.6% (CONTINUED) | | Shares | | Value |
| Diversified Metals & Mining - 0.2% | | | | |
| Materion Corp. | | 553 | | | $ | 66,598 | |
MP Materials Corp. (a)(b) | | 3,412 | | | 46,130 | |
| | | | 112,728 | |
| | | | |
| Diversified Real Estate Activities - 0.1% | | | | |
| St Joe Co. | | 1,089 | | | 67,170 | |
| | | | |
| Diversified Support Services - 0.3% | | | | |
Driven Brands Holdings, Inc. (a) | | 1,646 | | | 22,122 | |
| UniFirst Corp. | | 448 | | | 87,154 | |
| Vestis Corp. | | 3,624 | | | 47,003 | |
| | | | 156,279 | |
| | | | |
| Education Services - 0.6% | | | | |
| Graham Holdings Co. - Class B | | 94 | | | 72,836 | |
Grand Canyon Education, Inc. (a) | | 830 | | | 129,439 | |
| Strategic Education, Inc. | | 590 | | | 62,186 | |
Stride, Inc. (a) | | 1,132 | | | 86,009 | |
| | | | 350,470 | |
| | | | |
| Electric Utilities - 1.2% | | | | |
| Allete, Inc. | | 1,606 | | | 103,587 | |
| Idacorp, Inc. | | 1,415 | | | 138,316 | |
| MGE Energy, Inc. | | 981 | | | 86,171 | |
| Otter Tail Corp. | | 1,135 | | | 110,004 | |
| PNM Resources, Inc. | | 2,501 | | | 103,992 | |
| Portland General Electric Co. | | 2,809 | | | 133,090 | |
| | | | 675,160 | |
| | | | |
| Electrical Components & Equipment - 0.9% | | | | |
| EnerSys | | 1,094 | | | 120,263 | |
Fluence Energy, Inc. (a) | | 1,664 | | | 27,256 | |
Plug Power, Inc. (a)(b) | | 18,977 | | | 46,873 | |
| Sensata Technologies Holding PLC | | 4,190 | | | 163,368 | |
Shoals Technologies Group, Inc. - Class A (a) | | 4,641 | | | 30,167 | |
Sunrun, Inc. (a) | | 5,965 | | | 104,567 | |
| | | | 492,494 | |
| | | | |
| Electronic Components - 0.5% | | | | |
| Belden, Inc. | | 1,107 | | | 102,608 | |
Rogers Corp. (a) | | 558 | | | 68,176 | |
| Vishay Intertechnology, Inc. | | 3,489 | | | 84,818 | |
| | | | 255,602 | |
| | | | |
The accompanying notes are an integral part of these financial statements.
42
| | |
| STRIVE SMALL-CAP ETF |
| SCHEDULE OF INVESTMENTS (CONTINUED) |
| July 31, 2024 |
| | | | | | | | | | | | | | |
| COMMON STOCKS - 93.6% (CONTINUED) | | Shares | | Value |
| Electronic Equipment & Instruments - 1.8% | | | | |
| Advanced Energy Industries, Inc. | | 1,058 | | | $ | 123,119 | |
| Badger Meter, Inc. | | 812 | | | 167,402 | |
| Crane NXT Co. | | 1,408 | | | 88,535 | |
Itron, Inc. (a) | | 1,270 | | | 131,369 | |
Mirion Technologies, Inc. (a) | | 5,273 | | | 55,577 | |
Novanta, Inc. (a) | | 1,016 | | | 184,079 | |
OSI Systems, Inc. (a) | | 426 | | | 63,040 | |
| Vontier Corp. | | 4,376 | | | 171,670 | |
| | | | 984,791 | |
| | | | |
| Electronic Manufacturing Services - 0.5% | | | | |
IPG Photonics Corp. (a) | | 783 | | | 62,953 | |
Plexus Corp. (a) | | 737 | | | 94,461 | |
Sanmina Corp. (a) | | 1,493 | | | 112,468 | |
| | | | 269,882 | |
| | | | |
| Environmental & Facilities Services - 0.8% | | | | |
| ABM Industries, Inc. | | 1,759 | | | 97,730 | |
Casella Waste Systems, Inc. - Class A (a) | | 1,595 | | | 165,178 | |
Stericycle, Inc. (a) | | 2,619 | | | 153,343 | |
| | | | 416,251 | |
| | | | |
| Fertilizers & Agricultural Chemicals - 0.2% | | | | |
| Scotts Miracle-Gro Co. | | 1,148 | | | 90,233 | |
| | | | |
| Food Retail - 0.6% | | | | |
Grocery Outlet Holding Corp. (a) | | 2,514 | | | 49,174 | |
Sprouts Farmers Market, Inc. (a) | | 2,836 | | | 283,288 | |
| | | | 332,462 | |
| | | | |
| Footwear - 0.2% | | | | |
| Steven Madden Ltd. | | 1,984 | | | 89,955 | |
| | | | |
| Forest Products - 0.3% | | | | |
| Louisiana-Pacific Corp. | | 1,821 | | | 178,749 | |
| | | | |
| Gas Utilities - 1.6% | | | | |
| Chesapeake Utilities Corp. | | 646 | | | 76,247 | |
| National Fuel Gas Co. | | 2,501 | | | 146,534 | |
| New Jersey Resources Corp. | | 2,858 | | | 133,612 | |
| ONE Gas, Inc. | | 1,586 | | | 110,433 | |
| Southwest Gas Holdings, Inc. | | 1,946 | | | 144,315 | |
| Spire, Inc. | | 1,420 | | | 94,558 | |
| UGI Corp. | | 5,965 | | | 147,813 | |
| | | | 853,512 | |
| | | | |
The accompanying notes are an integral part of these financial statements.
43
| | |
| STRIVE SMALL-CAP ETF |
| SCHEDULE OF INVESTMENTS (CONTINUED) |
| July 31, 2024 |
| | | | | | | | | | | | | | |
| COMMON STOCKS - 93.6% (CONTINUED) | | Shares | | Value |
| Health Care Distributors - 0.1% | | | | |
| Patterson Cos., Inc. | | 2,289 | | | $ | 57,797 | |
| | | | |
| Health Care Equipment - 2.0% | | | | |
Alphatec Holdings, Inc. (a) | | 2,663 | | | 26,896 | |
Axonics, Inc. (a) | | 1,396 | | | 95,598 | |
| Conmed Corp. | | 823 | | | 56,820 | |
Enovis Corp. (a) | | 1,484 | | | 70,698 | |
Envista Holdings Corp. (a) | | 4,752 | | | 81,117 | |
Glaukos Corp. (a) | | 1,344 | | | 157,476 | |
Inari Medical, Inc. (a) | | 1,485 | | | 69,142 | |
Integer Holdings Corp. (a) | | 904 | | | 107,359 | |
Integra LifeSciences Holdings Corp. (a) | | 1,890 | | | 46,891 | |
iRhythm Technologies, Inc. (a) | | 829 | | | 71,501 | |
LivaNova PLC (a) | | 1,473 | | | 72,766 | |
Procept BioRobotics Corp. (a) | | 1,303 | | | 82,506 | |
QuidelOrtho Corp. (a) | | 1,346 | | | 52,884 | |
TransMedics Group, Inc. (a) | | 902 | | | 128,319 | |
| | | | 1,119,973 | |
| | | | |
| Health Care Facilities - 0.3% | | | | |
| Select Medical Holdings Corp. | | 2,823 | | | 112,242 | |
Surgery Partners, Inc. (a) | | 2,094 | | | 63,574 | |
| | | | 175,816 | |
| | | | |
| Health Care Services - 1.6% | | | | |
agilon health, Inc. (a) | | 8,361 | | | 57,607 | |
Amedisys, Inc. (a) | | 893 | | | 87,559 | |
AMN Healthcare Services, Inc. (a) | | 1,061 | | | 71,745 | |
CorVel Corp. (a) | | 272 | | | 83,450 | |
Guardant Health, Inc. (a) | | 3,424 | | | 120,285 | |
LifeStance Health Group, Inc. (a) | | 2,108 | | | 11,615 | |
Option Care Health, Inc. (a) | | 4,895 | | | 145,333 | |
| Premier, Inc. - Class A | | 3,252 | | | 68,227 | |
Privia Health Group, Inc. (a) | | 3,230 | | | 66,990 | |
R1 RCM, Inc. (a) | | 4,285 | | | 55,191 | |
RadNet, Inc. (a) | | 1,806 | | | 107,908 | |
| | | | 875,910 | |
| | | | |
| Health Care Supplies - 1.2% | | | | |
Haemonetics Corp. (a) | | 1,394 | | | 125,530 | |
ICU Medical, Inc. (a) | | 676 | | | 85,838 | |
Lantheus Holdings, Inc. (a) | | 1,852 | | | 194,145 | |
Merit Medical Systems, Inc. (a) | | 1,618 | | | 137,999 | |
The accompanying notes are an integral part of these financial statements.
44
| | |
| STRIVE SMALL-CAP ETF |
| SCHEDULE OF INVESTMENTS (CONTINUED) |
| July 31, 2024 |
| | | | | | | | | | | | | | |
| COMMON STOCKS - 93.6% (CONTINUED) | | Shares | | Value |
| Health Care Supplies - 1.2% (Continued) | | | | |
Neogen Corp. (a) | | 5,484 | | | $ | 93,393 | |
| | | | 636,905 | |
| | | | |
| Health Care Technology - 0.5% | | | | |
Certara, Inc. (a) | | 3,271 | | | 51,060 | |
Doximity, Inc. - Class A (a) | | 3,140 | | | 87,920 | |
Evolent Health, Inc. - Class A (a) | | 3,042 | | | 70,940 | |
GoodRx Holdings, Inc. - Class A (a) | | 2,048 | | | 18,534 | |
Teladoc Health, Inc. (a) | | 4,577 | | | 43,161 | |
| | | | 271,615 | |
| | | | |
| Heavy Electrical Equipment - 0.1% | | | | |
Bloom Energy Corp. - Class A (a)(b) | | 5,478 | | | 74,172 | |
| | | | |
| Home Furnishings - 0.1% | | | | |
| Leggett & Platt, Inc. | | 3,579 | | | 47,135 | |
| | | | |
| Homebuilding - 1.9% | | | | |
Cavco Industries, Inc. (a) | | 213 | | | 88,314 | |
| Century Communities, Inc. | | 773 | | | 80,941 | |
Dream Finders Homes, Inc. - Class A (a) | | 600 | | | 18,930 | |
Green Brick Partners, Inc. (a) | | 871 | | | 63,714 | |
| Installed Building Products, Inc. | | 649 | | | 175,457 | |
| KB Home | | 1,834 | | | 157,871 | |
LGI Homes, Inc. (a) | | 563 | | | 64,784 | |
M/I Homes, Inc. (a) | | 742 | | | 123,788 | |
Skyline Champion Corp. (a) | | 1,461 | | | 119,086 | |
Tri Pointe Homes, Inc. (a) | | 2,663 | | | 120,501 | |
| | | | 1,013,386 | |
| | | | |
| Homefurnishing Retail - 0.2% | | | | |
RH (a) | | 432 | | | 125,315 | |
| | | | |
| Hotels, Resorts & Cruise Lines - 0.5% | | | | |
Global Business Travel Group I (a)(b) | | 3,855 | | | 25,906 | |
Hilton Grand Vacations, Inc. (a) | | 2,145 | | | 92,685 | |
| Marriott Vacations Worldwide Corp. | | 923 | | | 78,067 | |
| Travel + Leisure Co. | | 1,930 | | | 88,954 | |
| | | | 285,612 | |
| | | | |
| Household Appliances - 0.2% | | | | |
Helen of Troy Ltd. (a) | | 715 | | | 42,264 | |
| Worthington Enterprises, Inc. | | 839 | | | 41,874 | |
| | | | 84,138 | |
| | | | |
The accompanying notes are an integral part of these financial statements.
45
| | |
| STRIVE SMALL-CAP ETF |
| SCHEDULE OF INVESTMENTS (CONTINUED) |
| July 31, 2024 |
| | | | | | | | | | | | | | |
| COMMON STOCKS - 93.6% (CONTINUED) | | Shares | | Value |
| Household Products - 0.5% | | | | |
Central Garden & Pet Co. (a) | | 249 | | | $ | 9,920 | |
Central Garden & Pet Co. - Class A (a) | | 1,350 | | | 46,386 | |
| Energizer Holdings, Inc. | | 1,971 | | | 60,687 | |
| Spectrum Brands Holdings, Inc. | | 809 | | | 68,450 | |
| WD-40 Co. | | 367 | | | 96,011 | |
| | | | 281,454 | |
| | | | |
| Housewares & Specialties - 0.2% | | | | |
| Newell Brands, Inc. | | 11,718 | | | 100,658 | |
| | | | |
| Human Resource & Employment Services - 0.8% | | | | |
Alight, Inc. - Class A (a) | | 11,727 | | | 88,773 | |
| First Advantage Corp. | | 1,394 | | | 24,005 | |
| Insperity, Inc. | | 956 | | | 98,200 | |
| Korn Ferry | | 1,502 | | | 110,728 | |
| ManpowerGroup, Inc. | | 1,327 | | | 101,622 | |
Paycor HCM, Inc. (a) | | 1,918 | | | 23,802 | |
| | | | 447,130 | |
| | | | |
| Industrial Machinery & Supplies & Components - 3.3% | | | | |
| Albany International Corp. - Class A | | 832 | | | 77,858 | |
Chart Industries, Inc. (a) | | 1,164 | | | 187,497 | |
| Enpro, Inc. | | 567 | | | 96,923 | |
| Esab Corp. | | 1,589 | | | 161,442 | |
| ESCO Technologies, Inc. | | 697 | | | 85,703 | |
| Flowserve Corp. | | 3,683 | | | 186,176 | |
| Franklin Electric Co., Inc. | | 1,147 | | | 122,293 | |
Gates Industrial Corp. PLC (a) | | 5,320 | | | 98,899 | |
| Hillenbrand, Inc. | | 1,960 | | | 86,691 | |
| John Bean Technologies Corp. | | 873 | | | 85,886 | |
| Kadant, Inc. | | 326 | | | 114,586 | |
| Mueller Industries, Inc. | | 3,135 | | | 222,397 | |
| Mueller Water Products, Inc. - Class A | | 4,265 | | | 88,200 | |
SPX Technologies, Inc. (a) | | 1,287 | | | 189,884 | |
| | | | 1,804,435 | |
| | | | |
| Insurance Brokers - 0.3% | | | | |
Baldwin Insurance Group, Inc. - Class A (a) | | 1,753 | | | 76,676 | |
Goosehead Insurance, Inc. - Class A (a) | | 730 | | | 65,912 | |
Hagerty, Inc. - Class A (a) | | 598 | | | 6,614 | |
| | | | 149,202 | |
| | | | |
The accompanying notes are an integral part of these financial statements.
46
| | |
| STRIVE SMALL-CAP ETF |
| SCHEDULE OF INVESTMENTS (CONTINUED) |
| July 31, 2024 |
| | | | | | | | | | | | | | |
| COMMON STOCKS - 93.6% (CONTINUED) | | Shares | | Value |
| Interactive Media & Services - 0.7% | | | | |
Bumble, Inc. - Class A (a) | | 2,824 | | | $ | 26,376 | |
Cargurus, Inc. (a) | | 2,528 | | | 62,745 | |
IAC, Inc. (a) | | 1,962 | | | 103,613 | |
Rumble, Inc. (a)(b) | | 1,783 | | | 11,269 | |
TripAdvisor, Inc. (a) | | 2,818 | | | 49,681 | |
Yelp, Inc. (a) | | 1,745 | | | 63,571 | |
Ziff Davis, Inc. (a) | | 1,350 | | | 64,638 | |
| | | | 381,893 | |
| | | | |
| Internet Services & Infrastructure - 0.3% | | | | |
DigitalOcean Holdings, Inc. (a) | | 1,705 | | | 56,487 | |
Fastly, Inc. - Class A (a) | | 3,342 | | | 27,070 | |
Squarespace, Inc. - Class A (a) | | 1,616 | | | 71,411 | |
| | | | 154,968 | |
| | | | |
| Investment Banking & Brokerage - 1.2% | | | | |
| BGC Group, Inc. - Class A | | 10,305 | | | 94,909 | |
| Lazard, Inc. | | 3,141 | | | 154,443 | |
| Moelis & Co. - Class A | | 1,822 | | | 123,896 | |
| Piper Sandler Cos. | | 492 | | | 134,454 | |
| PJT Partners, Inc. - Class A | | 605 | | | 80,429 | |
| Virtu Financial, Inc. - Class A | | 2,442 | | | 66,715 | |
| | | | 654,846 | |
| | | | |
| IT Consulting & Other Services - 0.8% | | | | |
ASGN, Inc. (a) | | 1,268 | | | 120,042 | |
DXC Technology Co. (a) | | 4,979 | | | 101,273 | |
Kyndryl Holdings, Inc. (a) | | 6,305 | | | 169,415 | |
Perficient, Inc. (a) | | 934 | | | 70,433 | |
| | | | 461,163 | |
| | | | |
| Leisure Facilities - 0.2% | | | | |
Dave & Buster's Entertainment, Inc. (a) | | 890 | | | 33,473 | |
Life Time Group Holdings, Inc. (a) | | 1,940 | | | 40,294 | |
United Parks & Resorts, Inc. (a) | | 971 | | | 51,123 | |
| | | | 124,890 | |
| | | | |
| Leisure Products - 0.9% | | | | |
| Acushnet Holdings Corp. | | 824 | | | 59,806 | |
| Brunswick Corp. | | 1,873 | | | 152,556 | |
| Polaris, Inc. | | 1,466 | | | 122,088 | |
Topgolf Callaway Brands Corp. (a) | | 3,847 | | | 63,476 | |
YETI Holdings, Inc. (a) | | 2,368 | | | 97,917 | |
| | | | 495,843 | |
| | | | |
The accompanying notes are an integral part of these financial statements.
47
| | |
| STRIVE SMALL-CAP ETF |
| SCHEDULE OF INVESTMENTS (CONTINUED) |
| July 31, 2024 |
| | | | | | | | | | | | | | |
| COMMON STOCKS - 93.6% (CONTINUED) | | Shares | | Value |
| Life & Health Insurance - 1.0% | | | | |
Brighthouse Financial, Inc. (a) | | 1,777 | | | $ | 88,619 | |
| CNO Financial Group, Inc. | | 3,001 | | | 104,615 | |
Genworth Financial, Inc. - Class A (a) | | 12,311 | | | 83,346 | |
| Lincoln National Corp. | | 4,638 | | | 154,445 | |
Oscar Health, Inc. - Class A (a) | | 4,983 | | | 88,099 | |
| | | | 519,124 | |
| | | | |
| Life Sciences Tools & Services - 0.5% | | | | |
10X Genomics, Inc. - Class A (a) | | 2,645 | | | 54,672 | |
Azenta, Inc. (a) | | 1,490 | | | 92,812 | |
Fortrea Holdings, Inc. (a) | | 2,441 | | | 67,348 | |
Sotera Health Co. (a) | | 3,568 | | | 49,488 | |
| | | | 264,320 | |
| | | | |
| Managed Health Care - 0.1% | | | | |
Progyny, Inc. (a) | | 2,306 | | | 65,029 | |
| | | | |
| Marine Transportation - 0.6% | | | | |
Kirby Corp. (a) | | 1,621 | | | 199,188 | |
| Matson, Inc. | | 931 | | | 123,553 | |
| | | | 322,741 | |
| | | | |
| Metal, Glass & Plastic Containers - 0.4% | | | | |
| Ardagh Metal Packaging SA | | 3,965 | | | 14,591 | |
| Greif, Inc. - Class A | | 652 | | | 43,476 | |
| Greif, Inc. - Class B | | 62 | | | 4,382 | |
O-I Glass, Inc. (a) | | 4,226 | | | 56,459 | |
| Silgan Holdings, Inc. | | 2,312 | | | 118,906 | |
| | | | 237,814 | |
| | | | |
| Motorcycle Manufacturers - 0.2% | | | | |
| Harley-Davidson, Inc. | | 3,368 | | | 126,300 | |
| | | | |
| Movies & Entertainment - 0.5% | | | | |
Atlanta Braves Holdings, Inc. - Class A (a) | | 262 | | | 12,031 | |
Atlanta Braves Holdings, Inc. - Class C (a) | | 1,005 | | | 43,647 | |
Liberty Media Corp.-Liberty Live - Class A (a) | | 555 | | | 20,962 | |
Liberty Media Corp.-Liberty Live - Class C (a) | | 1,284 | | | 50,102 | |
Lions Gate Entertainment Corp. - Class A (a) | | 1,680 | | | 15,406 | |
Lions Gate Entertainment Corp. - Class B (a) | | 3,553 | | | 29,277 | |
Madison Square Garden Sports Corp. (a) | | 479 | | | 95,996 | |
| | | | 267,421 | |
| | | | |
The accompanying notes are an integral part of these financial statements.
48
| | |
| STRIVE SMALL-CAP ETF |
| SCHEDULE OF INVESTMENTS (CONTINUED) |
| July 31, 2024 |
| | | | | | | | | | | | | | |
| COMMON STOCKS - 93.6% (CONTINUED) | | Shares | | Value |
| Multi-Utilities - 0.5% | | | | |
| Avista Corp. | | 2,122 | | | $ | 83,140 | |
| Black Hills Corp. | | 1,929 | | | 113,907 | |
| Northwestern Energy Group, Inc. | | 1,661 | | | 89,312 | |
| | | | 286,359 | |
| | | | |
| Oil & Gas Drilling - 0.9% | | | | |
| Helmerich & Payne, Inc. | | 2,393 | | | 96,725 | |
| Patterson-UTI Energy, Inc. | | 11,343 | | | 124,660 | |
Transocean Ltd. (a) | | 20,013 | | | 115,875 | |
Valaris Ltd. (a) | | 1,710 | | | 134,389 | |
| | | | 471,649 | |
| | | | |
| Oil & Gas Equipment & Services - 1.1% | | | | |
| Archrock, Inc. | | 4,215 | | | 87,377 | |
| Cactus, Inc. - Class A | | 1,793 | | | 113,174 | |
| ChampionX Corp. | | 5,362 | | | 183,702 | |
| Liberty Energy, Inc. | | 4,254 | | | 102,734 | |
Tidewater, Inc. (a) | | 1,259 | | | 124,591 | |
| | | | 611,578 | |
| | | | |
| Oil & Gas Exploration & Production - 1.8% | | | | |
| California Resources Corp. | | 1,966 | | | 101,131 | |
CNX Resources Corp. (a) | | 4,176 | | | 110,539 | |
| Comstock Resources, Inc. | | 2,512 | | | 23,788 | |
| EQT Corp. | | 4,098 | | | 141,422 | |
Gulfport Energy Corp. (a) | | 356 | | | 52,407 | |
| Magnolia Oil & Gas Corp. - Class A | | 4,807 | | | 130,942 | |
| Northern Oil & Gas, Inc. | | 2,472 | | | 106,766 | |
| Sitio Royalties Corp. - Class A | | 2,215 | | | 53,935 | |
| SM Energy Co. | | 3,164 | | | 146,177 | |
| Viper Energy, Inc. | | 2,546 | | | 108,638 | |
| | | | 975,745 | |
| | | | |
| Oil & Gas Refining & Marketing - 0.1% | | | | |
| CVR Energy, Inc. | | 967 | | | 27,656 | |
Par Pacific Holdings, Inc. (a) | | 1,522 | | | 40,409 | |
| | | | 68,065 | |
| | | | |
| Oil & Gas Storage & Transportation - 1.0% | | | | |
| DT Midstream, Inc. | | 2,796 | | | 210,706 | |
| Golar LNG Ltd. | | 2,671 | | | 93,218 | |
| International Seaways, Inc. | | 1,278 | | | 71,568 | |
| Kinetik Holdings, Inc. | | 971 | | | 40,277 | |
The accompanying notes are an integral part of these financial statements.
49
| | |
| STRIVE SMALL-CAP ETF |
| SCHEDULE OF INVESTMENTS (CONTINUED) |
| July 31, 2024 |
| | | | | | | | | | | | | | |
| COMMON STOCKS - 93.6% (CONTINUED) | | Shares | | Value |
| Oil & Gas Storage & Transportation - 1.0% (Continued) | | | | |
| Scorpio Tankers, Inc. | | 1,372 | | | $ | 105,205 | |
| | | | 520,974 | |
| | | | |
| Other Specialty Retail - 0.4% | | | | |
| Academy Sports & Outdoors, Inc. | | 2,035 | | | 110,032 | |
| Signet Jewelers Ltd. | | 1,230 | | | 103,480 | |
| | | | 213,512 | |
| | | | |
| Packaged Foods & Meats - 1.3% | | | | |
| Cal-Maine Foods, Inc. | | 1,084 | | | 77,582 | |
| Flowers Foods, Inc. | | 4,821 | | | 108,569 | |
Freshpet, Inc. (a) | | 1,306 | | | 158,940 | |
| J & J Snack Foods Corp. | | 353 | | | 59,551 | |
| Lancaster Colony Corp. | | 560 | | | 108,113 | |
| Seaboard Corp. | | 6 | | | 19,487 | |
Simply Good Foods Co. (a) | | 2,674 | | | 90,702 | |
| Tootsie Roll Industries, Inc. | | 382 | | | 11,781 | |
TreeHouse Foods, Inc. (a) | | 1,395 | | | 56,191 | |
| Utz Brands, Inc. | | 1,833 | | | 27,202 | |
| | | | 718,118 | |
| | | | |
| Paper & Plastic Packaging Products & Materials - 0.3% | | | | |
| Pactiv Evergreen, Inc. | | 1,062 | | | 13,955 | |
| Sealed Air Corp. | | 3,967 | | | 150,944 | |
| | | | 164,899 | |
| | | | |
| Passenger Airlines - 0.3% | | | | |
Alaska Air Group, Inc. (a) | | 878 | | | 32,951 | |
| Copa Holdings SA - Class A | | 222 | | | 19,702 | |
Joby Aviation, Inc. (a)(b) | | 11,317 | | | 67,676 | |
SkyWest, Inc. (a) | | 268 | | | 21,424 | |
Wheels Up Experience, Inc. (a) | | 4,225 | | | 11,112 | |
| | | | 152,865 | |
| | | | |
| Passenger Ground Transportation - 0.2% | | | | |
Hertz Global Holdings, Inc. (a) | | 3,406 | | | 13,897 | |
Lyft, Inc. - Class A (a) | | 9,241 | | | 111,354 | |
| | | | 125,251 | |
| | | | |
| Personal Care Products - 0.1% | | | | |
| Inter Parfums, Inc. | | 475 | | | 66,823 | |
| | | | |
The accompanying notes are an integral part of these financial statements.
50
| | |
| STRIVE SMALL-CAP ETF |
| SCHEDULE OF INVESTMENTS (CONTINUED) |
| July 31, 2024 |
| | | | | | | | | | | | | | |
| COMMON STOCKS - 93.6% (CONTINUED) | | Shares | | Value |
| Pharmaceuticals - 1.2% | | | | |
Amphastar Pharmaceuticals, Inc. (a) | | 1,007 | | | $ | 43,825 | |
Arvinas, Inc. (a) | | 1,668 | | | 45,887 | |
Axsome Therapeutics, Inc. (a) | | 1,067 | | | 93,160 | |
Corcept Therapeutics, Inc. (a) | | 2,338 | | | 90,410 | |
| Organon & Co. | | 7,172 | | | 156,780 | |
| Perrigo Co. PLC | | 3,899 | | | 110,225 | |
Prestige Consumer Healthcare, Inc. (a) | | 1,340 | | | 94,885 | |
Scilex Holding Co. (a) | | 85 | | | 135 | |
| | | | 635,307 | |
| | | | |
| Property & Casualty Insurance - 1.3% | | | | |
| Assured Guaranty Ltd. | | 1,482 | | | 122,072 | |
| Axis Capital Holdings Ltd. | | 2,186 | | | 165,590 | |
| Hanover Insurance Group, Inc. | | 903 | | | 124,153 | |
| Kemper Corp. | | 1,774 | | | 113,642 | |
| Mercury General Corp. | | 734 | | | 43,945 | |
| White Mountains Insurance Group Ltd. | | 71 | | | 126,806 | |
| | | | 696,208 | |
| | | | |
| Real Estate Development - 0.1% | | | | |
Howard Hughes Holdings, Inc. (a) | | 883 | | | 65,492 | |
| | | | |
| Real Estate Operating Companies - 0.1% | | | | |
| DigitalBridge Group, Inc. | | 4,751 | | | 67,132 | |
| | | | |
| Real Estate Services - 0.3% | | | | |
Cushman & Wakefield PLC (a) | | 5,960 | | | 78,136 | |
| Newmark Group, Inc. - Class A | | 3,684 | | | 47,818 | |
Opendoor Technologies, Inc. (a) | | 17,016 | | | 39,477 | |
| | | | 165,431 | |
| | | | |
| Regional Banks - 7.7% | | | | |
| Ameris Bancorp | | 1,923 | | | 117,091 | |
| Associated Banc-Corp. | | 4,056 | | | 93,207 | |
| Atlantic Union Bankshares Corp. | | 2,540 | | | 104,877 | |
Axos Financial, Inc. (a) | | 1,417 | | | 103,455 | |
| Banc of California, Inc. | | 4,120 | | | 57,598 | |
| BancFirst Corp. | | 472 | | | 50,707 | |
Bancorp, Inc. (a) | | 1,311 | | | 67,962 | |
| Bank of Hawaii Corp. | | 1,075 | | | 73,734 | |
| Bank OZK | | 3,180 | | | 149,110 | |
| BOK Financial Corp. | | 621 | | | 63,864 | |
| Cadence Bank | | 5,092 | | | 167,374 | |
| Cathay General Bancorp | | 1,924 | | | 85,272 | |
The accompanying notes are an integral part of these financial statements.
51
| | |
| STRIVE SMALL-CAP ETF |
| SCHEDULE OF INVESTMENTS (CONTINUED) |
| July 31, 2024 |
| | | | | | | | | | | | | | |
| COMMON STOCKS - 93.6% (CONTINUED) | | Shares | | Value |
| Regional Banks - 7.7% (Continued) | | | | |
| Columbia Banking System, Inc. | | 6,008 | | | $ | 157,169 | |
| Community Financial System, Inc. | | 1,547 | | | 95,419 | |
| CVB Financial Corp. | | 3,533 | | | 67,339 | |
| Eastern Bankshares, Inc. | | 5,663 | | | 94,232 | |
| First BanCorp | | 4,741 | | | 101,694 | |
| First Financial Bancorp | | 2,488 | | | 68,072 | |
| First Financial Bankshares, Inc. | | 3,340 | | | 128,456 | |
| First Hawaiian, Inc. | | 3,513 | | | 87,965 | |
| First Interstate BancSystem, Inc. - Class A | | 2,452 | | | 77,410 | |
| FNB Corp./PA | | 10,201 | | | 156,483 | |
| Fulton Financial Corp. | | 4,375 | | | 84,744 | |
| Glacier Bancorp, Inc. | | 3,047 | | | 136,231 | |
| Hancock Whitney Corp. | | 2,446 | | | 133,870 | |
| Home BancShares, Inc. | | 5,399 | | | 152,954 | |
| Independent Bank Corp. | | 1,162 | | | 74,542 | |
| International Bancshares Corp. | | 1,644 | | | 110,871 | |
| New York Community Bancorp, Inc. | | 7,344 | | | 77,259 | |
| Old National Bancorp | | 8,939 | | | 178,959 | |
| Pacific Premier Bancorp, Inc. | | 2,579 | | | 69,788 | |
| ServisFirst Bancshares, Inc. | | 1,438 | | | 115,385 | |
| Simmons First National Corp. - Class A | | 3,310 | | | 71,264 | |
| Synovus Financial Corp. | | 3,888 | | | 181,764 | |
Texas Capital Bancshares, Inc. (a) | | 1,257 | | | 83,088 | |
| TFS Financial Corp. | | 1,432 | | | 19,418 | |
| UMB Financial Corp. | | 1,126 | | | 114,875 | |
| United Bankshares, Inc. | | 3,732 | | | 145,287 | |
| United Community Banks, Inc. | | 3,513 | | | 108,727 | |
| Valley National Bancorp | | 11,727 | | | 98,507 | |
| WSFS Financial Corp. | | 1,623 | | | 91,683 | |
| | | | 4,217,706 | |
| | | | |
| Reinsurance - 0.2% | | | | |
Enstar Group Ltd. (a) | | 319 | | | 103,484 | |
| | | | |
| Renewable Electricity - 0.5% | | | | |
| Clearway Energy, Inc. - Class A | | 945 | | | 23,275 | |
| Clearway Energy, Inc. - Class C | | 2,289 | | | 61,071 | |
| NextEra Energy Partners LP | | 2,622 | | | 66,992 | |
| Ormat Technologies, Inc. | | 1,478 | | | 114,752 | |
| | | | 266,090 | |
| | | | |
| Research & Consulting Services - 0.7% | | | | |
CBIZ, Inc. (a) | | 1,302 | | | 90,359 | |
| Dun & Bradstreet Holdings, Inc. | | 8,946 | | | 97,333 | |
The accompanying notes are an integral part of these financial statements.
52
| | |
| STRIVE SMALL-CAP ETF |
| SCHEDULE OF INVESTMENTS (CONTINUED) |
| July 31, 2024 |
| | | | | | | | | | | | | | |
| COMMON STOCKS - 93.6% (CONTINUED) | | Shares | | Value |
| Research & Consulting Services - 0.7% (Continued) | | | | |
| Exponent, Inc. | | 1,393 | | | $ | 147,769 | |
| ICF International, Inc. | | 492 | | | 72,373 | |
| | | | 407,834 | |
| | | | |
| Restaurants - 0.9% | | | | |
| Bloomin' Brands, Inc. | | 2,441 | | | 50,895 | |
Cava Group, Inc. (a) | | 1,936 | | | 163,050 | |
Dutch Bros, Inc. - Class A (a) | | 1,748 | | | 66,861 | |
| Krispy Kreme, Inc. | | 2,211 | | | 23,503 | |
| Papa John's International, Inc. | | 889 | | | 39,320 | |
Shake Shack, Inc. - Class A (a) | | 1,067 | | | 93,491 | |
| Wendy's Co. | | 4,766 | | | 80,688 | |
| | | | 517,808 | |
| | | | |
| Security & Alarm Services - 0.2% | | | | |
| Brink's Co. | | 1,223 | | | 134,518 | |
| | | | |
| Semiconductor Materials & Equipment - 0.6% | | | | |
Axcelis Technologies, Inc. (a) | | 894 | | | 112,957 | |
FormFactor, Inc. (a) | | 2,101 | | | 112,530 | |
| Kulicke & Soffa Industries, Inc. | | 1,496 | | | 70,566 | |
SolarEdge Technologies, Inc. (a) | | 1,569 | | | 45,281 | |
| | | | 341,334 | |
| | | | |
| Semiconductors - 1.7% | | | | |
Cirrus Logic, Inc. (a) | | 1,501 | | | 195,850 | |
Credo Technology Group Holding Ltd. (a) | | 3,887 | | | 107,864 | |
Diodes, Inc. (a) | | 1,229 | | | 96,108 | |
Impinj, Inc. (a) | | 654 | | | 104,176 | |
| Power Integrations, Inc. | | 1,567 | | | 114,454 | |
Silicon Laboratories, Inc. (a) | | 879 | | | 105,594 | |
SiTime Corp. (a) | | 508 | | | 72,110 | |
Synaptics, Inc. (a) | | 1,080 | | | 94,306 | |
Wolfspeed, Inc. (a)(b) | | 3,441 | | | 64,863 | |
| | | | 955,325 | |
| | | | |
| Silver - 0.2% | | | | |
| Hecla Mining Co. | | 16,023 | | | 92,613 | |
| | | | |
| Soft Drinks & Non-alcoholic Beverages - 0.1% | | | | |
National Beverage Corp. (b) | | 628 | | | 30,640 | |
| | | | |
The accompanying notes are an integral part of these financial statements.
53
| | |
| STRIVE SMALL-CAP ETF |
| SCHEDULE OF INVESTMENTS (CONTINUED) |
| July 31, 2024 |
| | | | | | | | | | | | | | |
| COMMON STOCKS - 93.6% (CONTINUED) | | Shares | | Value |
| Specialized Consumer Services - 0.2% | | | | |
Frontdoor, Inc. (a) | | 2,187 | | | $ | 86,299 | |
Mister Car Wash, Inc. (a) | | 2,517 | | | 19,129 | |
| | | | 105,428 | |
| | | | |
| Specialty Chemicals - 2.1% | | | | |
Arcadium Lithium PLC (a) | | 30,150 | | | 95,877 | |
| Ashland, Inc. | | 1,263 | | | 122,069 | |
| Avient Corp. | | 2,615 | | | 118,303 | |
| Balchem Corp. | | 919 | | | 163,086 | |
| Element Solutions, Inc. | | 6,362 | | | 171,456 | |
Ginkgo Bioworks Holdings, Inc. (a) | | 40,997 | | | 15,579 | |
| HB Fuller Co. | | 1,477 | | | 127,317 | |
| Innospec, Inc. | | 657 | | | 86,159 | |
| NewMarket Corp. | | 197 | | | 110,491 | |
| Quaker Chemical Corp. | | 416 | | | 75,533 | |
| Sensient Technologies Corp. | | 1,139 | | | 88,899 | |
| | | | 1,174,769 | |
| | | | |
| Steel - 1.3% | | | | |
| Alpha Metallurgical Resources, Inc. | | 308 | | | 90,986 | |
| Arch Resources, Inc. | | 531 | | | 77,818 | |
ATI, Inc. (a) | | 3,508 | | | 237,527 | |
| Carpenter Technology Corp. | | 1,398 | | | 203,926 | |
| Warrior Met Coal, Inc. | | 1,425 | | | 98,482 | |
| | | | 708,739 | |
| | | | |
| Systems Software - 1.5% | | | | |
Appian Corp. - Class A (a) | | 1,113 | | | 41,114 | |
CommVault Systems, Inc. (a) | | 1,246 | | | 190,451 | |
N-able, Inc. (a) | | 1,792 | | | 24,980 | |
| Progress Software Corp. | | 1,174 | | | 68,562 | |
Rapid7, Inc. (a) | | 1,649 | | | 64,872 | |
Tenable Holdings, Inc. (a) | | 3,366 | | | 154,567 | |
Teradata Corp. (a) | | 2,674 | | | 86,691 | |
Varonis Systems, Inc. (a) | | 3,009 | | | 165,886 | |
| | | | 797,123 | |
| | | | |
| Technology Distributors - 0.2% | | | | |
| Avnet, Inc. | | 2,472 | | | 132,895 | |
| | | | |
| Technology Hardware, Storage & Peripherals - 0.1% | | | | |
| Xerox Holdings Corp. | | 3,132 | | | 33,716 | |
| | | | |
The accompanying notes are an integral part of these financial statements.
54
| | |
| STRIVE SMALL-CAP ETF |
| SCHEDULE OF INVESTMENTS (CONTINUED) |
| July 31, 2024 |
| | | | | | | | | | | | | | |
| COMMON STOCKS - 93.6% (CONTINUED) | | Shares | | Value |
| Tires & Rubber - 0.2% | | | | |
Goodyear Tire & Rubber Co. (a) | | 8,324 | | | $ | 97,391 | |
| | | | |
| Trading Companies & Distributors - 2.3% | | | | |
| Air Lease Corp. | | 2,862 | | | 142,012 | |
Beacon Roofing Supply, Inc. (a) | | 1,769 | | | 181,853 | |
| Boise Cascade Co. | | 1,078 | | | 153,173 | |
| FTAI Aviation Ltd. | | 2,541 | | | 283,194 | |
| GATX Corp. | | 999 | | | 139,361 | |
GMS, Inc. (a) | | 1,083 | | | 104,217 | |
| Herc Holdings, Inc. | | 727 | | | 113,296 | |
McGrath RentCorp (b) | | 652 | | | 71,609 | |
| Rush Enterprises, Inc. - Class A | | 1,645 | | | 83,912 | |
| Rush Enterprises, Inc. - Class B | | 222 | | | 10,496 | |
| | | | 1,283,123 | |
| | | | |
| Transaction & Payment Processing Services - 0.9% | | | | |
AvidXchange Holdings, Inc. (a) | | 4,439 | | | 39,685 | |
Euronet Worldwide, Inc. (a) | | 1,184 | | | 120,756 | |
| Evertec, Inc. | | 1,793 | | | 61,805 | |
Flywire Corp. (a) | | 3,202 | | | 58,628 | |
Marqeta, Inc. - Class A (a) | | 12,918 | | | 69,628 | |
Remitly Global, Inc. (a) | | 3,705 | | | 48,943 | |
| Western Union Co. | | 9,438 | | | 112,218 | |
| | | | 511,663 | |
| | | | |
| Water Utilities - 0.3% | | | | |
| American States Water Co. | | 993 | | | 81,952 | |
| California Water Service Group | | 1,601 | | | 85,590 | |
| | | | 167,542 | |
| | | | |
| Wireless Telecommunication Services - 0.1% | | | | |
| Telephone and Data Systems, Inc. | | 2,734 | | | 57,961 | |
United States Cellular Corp. (a) | | 384 | | | 20,640 | |
| | | | 78,601 | |
TOTAL COMMON STOCKS (Cost $45,146,449) | | | | 51,338,128 | |
| | | | |
| REAL ESTATE INVESTMENT TRUSTS - 6.2% | | | | |
| Apple Hospitality REIT, Inc. | | 6,054 | | | 89,539 | |
Arbor Realty Trust, Inc. (b) | | 5,077 | | | 68,539 | |
Blackstone Mortgage Trust, Inc. - Class A (b) | | 4,403 | | | 78,594 | |
| Broadstone Net Lease, Inc. | | 5,088 | | | 88,582 | |
| CareTrust REIT, Inc. | | 3,631 | | | 97,892 | |
| COPT Defense Properties | | 3,088 | | | 89,459 | |
| Cousins Properties, Inc. | | 4,186 | | | 115,157 | |
The accompanying notes are an integral part of these financial statements.
55
| | |
| STRIVE SMALL-CAP ETF |
| SCHEDULE OF INVESTMENTS (CONTINUED) |
| July 31, 2024 |
| | | | | | | | | | | | | | |
| | | | |
| REAL ESTATE INVESTMENT TRUSTS - 6.2% (CONTINUED) | | Shares | | Value |
| Douglas Emmett, Inc. | | 4,950 | | | $ | 79,646 | |
| EPR Properties | | 2,035 | | | 91,575 | |
| Essential Properties Realty Trust, Inc. | | 4,718 | | | 139,606 | |
| HA Sustainable Infrastructure Capital, Inc. | | 3,059 | | | 100,243 | |
| Highwoods Properties, Inc. | | 2,875 | | | 89,039 | |
| Independence Realty Trust, Inc. | | 6,177 | | | 115,201 | |
| Innovative Industrial Properties, Inc. | | 821 | | | 100,827 | |
| Kilroy Realty Corp. | | 3,218 | | | 118,969 | |
| Kite Realty Group Trust | | 6,343 | | | 156,418 | |
| LXP Industrial Trust | | 7,845 | | | 80,804 | |
| Macerich Co. | | 5,932 | | | 94,971 | |
| National Health Investors, Inc. | | 1,149 | | | 86,014 | |
| National Storage Affiliates Trust | | 2,175 | | | 92,590 | |
| Outfront Media, Inc. | | 4,320 | | | 70,070 | |
| Park Hotels & Resorts, Inc. | | 5,432 | | | 81,806 | |
| Phillips Edison & Co., Inc. | | 3,557 | | | 124,851 | |
| PotlatchDeltic Corp. | | 2,127 | | | 94,354 | |
| Rayonier, Inc. | | 4,094 | | | 124,171 | |
| Rithm Capital Corp. | | 13,763 | | | 159,788 | |
| Sabra Health Care REIT, Inc. | | 6,317 | | | 102,525 | |
| SITE Centers Corp. | | 5,281 | | | 81,591 | |
| SL Green Realty Corp. | | 1,786 | | | 119,019 | |
| Sunstone Hotel Investors, Inc. | | 5,656 | | | 58,596 | |
| Tanger, Inc. | | 3,043 | | | 87,943 | |
| Terreno Realty Corp. | | 2,656 | | | 181,697 | |
| Vornado Realty Trust | | 4,874 | | | 146,171 | |
TOTAL REAL ESTATE INVESTMENT TRUSTS (Cost $2,988,417) | | | | 3,406,247 | |
| | | | |
| SHORT-TERM INVESTMENTS - 1.3% | | | | |
| Investments Purchased with Proceeds from Securities Lending - 1.1% | | | | |
First American Government Obligations Fund - Class X, 5.23% (c) | | 592,281 | | | 592,281 | |
| | | | |
| Money Market Funds - 0.2% | | | | |
First American Government Obligations Fund - Class X, 5.23% (c)(d) | | 96,598 | | | 96,598 | |
TOTAL SHORT-TERM INVESTMENTS (Cost $688,879) | | | | 688,879 | |
| | | | |
TOTAL INVESTMENTS - 101.1% (Cost $48,823,745) | | | | $ | 55,433,254 | |
| Liabilities in Excess of Other Assets - (1.1)% | | | | (587,521) | |
| TOTAL NET ASSETS - 100.0% | | | | $ | 54,845,733 | |
Percentages are stated as a percent of net assets.
| | |
| AG - Aktiengesellschaft |
| PLC - Public Limited Company |
| SA - Sociedad Anónima |
The accompanying notes are an integral part of these financial statements.
56
| | |
| STRIVE SMALL-CAP ETF |
| SCHEDULE OF INVESTMENTS (CONTINUED) |
| July 31, 2024 |
| | | | | | | | |
| (a) | | Non-income producing security. |
| (b) | | All or a portion of this security is on loan as of July 31, 2024. The total market value of these securities was $582,329 which represented 1.1% of net assets. |
| (c) | | The rate shown represents the 7-day effective yield as of July 31, 2024. |
The Global Industry Classification Standard (GICS®) was developed by and/or is the exclusive property of MSCI, Inc. and Standard & Poor’s Financial Services LLC (“S&P”). GICS is a service mark of MSCI, Inc. and S&P and has been licensed for use by U.S. Bank Global Fund Services.
The accompanying notes are an integral part of these financial statements.
57
| | |
| STRIVE 1000 GROWTH ETF |
| SCHEDULE OF INVESTMENTS |
| July 31, 2024 |
| | | | | | | | | | | | | | |
| COMMON STOCKS - 97.9% | | Shares | | Value |
| Advertising - 0.1% | | | | |
Trade Desk, Inc. - Class A (a) | | 1,076 | | | $ | 96,711 | |
| | | | |
| Aerospace & Defense - 1.4% | | | | |
Axon Enterprise, Inc. (a) | | 194 | | | 58,202 | |
Boeing Co. (a) | | 1,553 | | | 296,002 | |
| BWX Technologies, Inc. | | 138 | | | 13,730 | |
| Curtiss-Wright Corp. | | 68 | | | 20,040 | |
| General Dynamics Corp. | | 173 | | | 51,677 | |
| General Electric Co. | | 1,452 | | | 247,130 | |
| HEICO Corp. | | 97 | | | 23,410 | |
| HEICO Corp. - Class A | | 172 | | | 32,699 | |
| Hexcel Corp. | | 83 | | | 5,495 | |
| Howmet Aerospace, Inc. | | 662 | | | 63,353 | |
| Huntington Ingalls Industries, Inc. | | 39 | | | 10,919 | |
| L3Harris Technologies, Inc. | | 213 | | | 48,328 | |
| Lockheed Martin Corp. | | 157 | | | 85,081 | |
| Northrop Grumman Corp. | | 113 | | | 54,728 | |
| Textron, Inc. | | 103 | | | 9,569 | |
| TransDigm Group, Inc. | | 116 | | | 150,130 | |
| Woodward, Inc. | | 55 | | | 8,579 | |
| | | | 1,179,072 | |
| | | | |
| Agricultural & Farm Machinery - 0.2% | | | | |
| Deere & Co. | | 405 | | | 150,652 | |
| Toro Co. | | 220 | | | 21,060 | |
| | | | 171,712 | |
| | | | |
Agricultural Products & Services - 0.0%(b) | | | | |
Darling Ingredients, Inc. (a) | | 131 | | | 5,205 | |
| | | | |
| Air Freight & Logistics - 0.1% | | | | |
| CH Robinson Worldwide, Inc. | | 10 | | | 891 | |
| Expeditors International of Washington, Inc. | | 222 | | | 27,710 | |
GXO Logistics, Inc. (a) | | 126 | | | 7,053 | |
| United Parcel Service, Inc. - Class B | | 70 | | | 9,126 | |
| | | | 44,780 | |
| | | | |
Alternative Carriers - 0.0%(b) | | | | |
| Iridium Communications, Inc. | | 258 | | | 7,405 | |
| | | | |
Aluminum - 0.0%(b) | | | | |
| Alcoa Corp. | | 111 | | | 3,667 | |
| | | | |
The accompanying notes are an integral part of these financial statements.
58
| | |
| STRIVE 1000 GROWTH ETF |
| SCHEDULE OF INVESTMENTS (CONTINUED) |
| July 31, 2024 |
| | | | | | | | | | | | | | |
| COMMON STOCKS - 97.9% (CONTINUED) | | Shares | | Value |
| Apparel Retail - 0.5% | | | | |
Burlington Stores, Inc. (a) | | 160 | | | $ | 41,651 | |
| Ross Stores, Inc. | | 804 | | | 115,157 | |
| TJX Cos., Inc. | | 2,789 | | | 315,213 | |
| | | | 472,021 | |
| | | | |
| Apparel, Accessories & Luxury Goods - 0.1% | | | | |
| Columbia Sportswear Co. | | 22 | | | 1,797 | |
Lululemon Athletica, Inc. (a) | | 279 | | | 72,166 | |
| PVH Corp. | | 50 | | | 5,100 | |
| Ralph Lauren Corp. | | 81 | | | 14,223 | |
Under Armour, Inc. - Class A (a) | | 103 | | | 718 | |
Under Armour, Inc. - Class C (a) | | 105 | | | 713 | |
| | | | 94,717 | |
| | | | |
| Application Software - 4.1% | | | | |
Adobe, Inc. (a) | | 1,108 | | | 611,228 | |
Altair Engineering, Inc. - Class A (a) | | 78 | | | 6,892 | |
ANSYS, Inc. (a) | | 233 | | | 73,076 | |
Appfolio, Inc. - Class A (a) | | 34 | | | 7,530 | |
AppLovin Corp. - Class A (a) | | 467 | | | 36,006 | |
Aspen Technology, Inc. (a) | | 44 | | | 8,270 | |
Atlassian Corp. - Class A (a) | | 391 | | | 69,039 | |
Autodesk, Inc. (a) | | 522 | | | 129,206 | |
| Bentley Systems, Inc. - Class B | | 521 | | | 25,394 | |
BILL Holdings, Inc. (a) | | 245 | | | 12,240 | |
Cadence Design Systems, Inc. (a) | | 663 | | | 177,459 | |
CCC Intelligent Solutions Holdings, Inc. (a) | | 681 | | | 6,987 | |
Confluent, Inc. - Class A (a) | | 459 | | | 11,484 | |
Datadog, Inc. - Class A (a) | | 675 | | | 78,597 | |
DocuSign, Inc. (a) | | 481 | | | 26,686 | |
DoubleVerify Holdings, Inc. (a) | | 252 | | | 5,322 | |
Dropbox, Inc. - Class A (a) | | 574 | | | 13,730 | |
Dynatrace, Inc. (a) | | 589 | | | 25,869 | |
Elastic NV (a) | | 239 | | | 26,211 | |
Fair Isaac Corp. (a) | | 63 | | | 100,800 | |
Five9, Inc. (a) | | 128 | | | 5,702 | |
Freshworks, Inc. - Class A (a) | | 461 | | | 5,763 | |
Guidewire Software, Inc. (a) | | 233 | | | 34,966 | |
HashiCorp, Inc. - Class A (a) | | 247 | | | 8,336 | |
HubSpot, Inc. (a) | | 116 | | | 57,656 | |
Informatica, Inc. - Class A (a) | | 90 | | | 2,155 | |
| Intuit, Inc. | | 678 | | | 438,903 | |
Klaviyo, Inc. - Class A (a) | | 66 | | | 1,729 | |
The accompanying notes are an integral part of these financial statements.
59
| | |
| STRIVE 1000 GROWTH ETF |
| SCHEDULE OF INVESTMENTS (CONTINUED) |
| July 31, 2024 |
| | | | | | | | | | | | | | |
| COMMON STOCKS - 97.9% (CONTINUED) | | Shares | | Value |
| Application Software - 4.1% (Continued) | | | | |
Manhattan Associates, Inc. (a) | | 162 | | | $ | 41,372 | |
MicroStrategy, Inc. - Class A (a) | | 43 | | | 69,421 | |
Nutanix, Inc. - Class A (a) | | 553 | | | 27,932 | |
Palantir Technologies, Inc. - Class A (a) | | 5,211 | | | 140,124 | |
| Pegasystems, Inc. | | 77 | | | 5,369 | |
Procore Technologies, Inc. (a) | | 144 | | | 10,228 | |
PTC, Inc. (a) | | 321 | | | 57,090 | |
RingCentral, Inc. - Class A (a) | | 146 | | | 5,117 | |
| Roper Technologies, Inc. | | 228 | | | 124,203 | |
| Salesforce, Inc. | | 2,318 | | | 599,898 | |
Samsara, Inc. - Class A (a) | | 700 | | | 26,796 | |
Smartsheet, Inc. - Class A (a) | | 297 | | | 14,244 | |
SPS Commerce, Inc. (a) | | 103 | | | 22,188 | |
Synopsys, Inc. (a) | | 384 | | | 214,395 | |
Tyler Technologies, Inc. (a) | | 103 | | | 58,515 | |
Unity Software, Inc. (a) | | 587 | | | 9,603 | |
Workday, Inc. - Class A (a) | | 517 | | | 117,421 | |
Zoom Video Communications, Inc. - Class A (a) | | 540 | | | 32,616 | |
| | | | 3,583,768 | |
| | | | |
| Asset Management & Custody Banks - 0.9% | | | | |
| Affiliated Managers Group, Inc. | | 10 | | | 1,856 | |
| Ameriprise Financial, Inc. | | 214 | | | 92,035 | |
| Ares Management Corp. - Class A | | 446 | | | 68,327 | |
| BlackRock, Inc. | | 199 | | | 174,423 | |
| Blackstone, Inc. | | 1,494 | | | 212,372 | |
| Blue Owl Capital, Inc. - Class A | | 795 | | | 15,161 | |
| KKR & Co., Inc. | | 1,350 | | | 166,658 | |
| SEI Investments Co. | | 126 | | | 8,548 | |
| | | | 739,380 | |
| | | | |
| Automobile Manufacturers - 1.9% | | | | |
Lucid Group, Inc. (a)(c) | | 2,106 | | | 7,413 | |
Rivian Automotive, Inc. - Class A (a) | | 1,027 | | | 16,853 | |
Tesla, Inc. (a) | | 6,887 | | | 1,598,266 | |
| | | | 1,622,532 | |
| | | | |
Automotive Parts & Equipment - 0.0%(b) | | | | |
Aptiv PLC (a) | | 240 | | | 16,653 | |
| Gentex Corp. | | 320 | | | 9,939 | |
QuantumScape Corp. (a)(c) | | 745 | | | 4,813 | |
| | | | 31,405 | |
| | | | |
The accompanying notes are an integral part of these financial statements.
60
| | |
| STRIVE 1000 GROWTH ETF |
| SCHEDULE OF INVESTMENTS (CONTINUED) |
| July 31, 2024 |
| | | | | | | | | | | | | | |
| COMMON STOCKS - 97.9% (CONTINUED) | | Shares | | Value |
| Automotive Retail - 0.4% | | | | |
AutoZone, Inc. (a) | | 40 | | | $ | 125,348 | |
CarMax, Inc. (a) | | 84 | | | 7,093 | |
Carvana Co. (a) | | 241 | | | 32,108 | |
| Murphy USA, Inc. | | 32 | | | 16,157 | |
O'Reilly Automotive, Inc. (a) | | 149 | | | 167,825 | |
Valvoline, Inc. (a) | | 256 | | | 11,904 | |
| | | | 360,435 | |
| | | | |
| Biotechnology - 1.9% | | | | |
| AbbVie, Inc. | | 1,912 | | | 354,332 | |
Alnylam Pharmaceuticals, Inc. (a) | | 328 | | | 77,887 | |
| Amgen, Inc. | | 660 | | | 219,430 | |
Apellis Pharmaceuticals, Inc. (a) | | 240 | | | 9,504 | |
Arrowhead Pharmaceuticals, Inc. (a) | | 272 | | | 7,768 | |
Biogen, Inc. (a) | | 86 | | | 18,335 | |
BioMarin Pharmaceutical, Inc. (a) | | 455 | | | 38,370 | |
Cerevel Therapeutics Holdings, Inc. (a) | | 137 | | | 6,160 | |
Crispr Therapeutics AG (a) | | 90 | | | 5,156 | |
Exact Sciences Corp. (a) | | 441 | | | 20,145 | |
Exelixis, Inc. (a) | | 723 | | | 16,954 | |
Grail, Inc. (a) | | 11 | | | 169 | |
Halozyme Therapeutics, Inc. (a) | | 294 | | | 16,246 | |
Incyte Corp. (a) | | 453 | | | 29,477 | |
Ionis Pharmaceuticals, Inc. (a) | | 19 | | | 940 | |
Moderna, Inc. (a) | | 820 | | | 97,760 | |
Natera, Inc. (a) | | 263 | | | 26,929 | |
Neurocrine Biosciences, Inc. (a) | | 233 | | | 32,986 | |
Regeneron Pharmaceuticals, Inc. (a) | | 266 | | | 287,065 | |
Roivant Sciences Ltd. (a) | | 1,098 | | | 11,913 | |
Sarepta Therapeutics, Inc. (a) | | 220 | | | 31,293 | |
Vaxcyte, Inc. (a) | | 256 | | | 20,196 | |
Vertex Pharmaceuticals, Inc. (a) | | 650 | | | 322,218 | |
| | | | 1,651,233 | |
| | | | |
Brewers - 0.0%(b) | | | | |
Boston Beer Co., Inc. - Class A (a) | | 14 | | | 3,923 | |
| | | | |
| Broadline Retail - 5.0% | | | | |
Amazon.com, Inc. (a) | | 22,875 | | | 4,277,167 | |
| Dillard's, Inc. - Class A | | 1 | | | 399 | |
| eBay, Inc. | | 106 | | | 5,895 | |
Etsy, Inc. (a) | | 273 | | | 17,783 | |
| | | | 4,301,244 | |
| | | | |
The accompanying notes are an integral part of these financial statements.
61
| | |
| STRIVE 1000 GROWTH ETF |
| SCHEDULE OF INVESTMENTS (CONTINUED) |
| July 31, 2024 |
| | | | | | | | | | | | | | |
| COMMON STOCKS - 97.9% (CONTINUED) | | Shares | | Value |
| Building Products - 0.7% | | | | |
| A O Smith Corp. | | 249 | | | $ | 21,175 | |
| Advanced Drainage Systems, Inc. | | 175 | | | 30,982 | |
| Allegion PLC | | 161 | | | 22,026 | |
| Armstrong World Industries, Inc. | | 56 | | | 7,358 | |
Builders FirstSource, Inc. (a) | | 256 | | | 42,847 | |
| Carlisle Cos., Inc. | | 106 | | | 44,369 | |
| Carrier Global Corp. | | 1,578 | | | 107,478 | |
| Fortune Brands Innovations, Inc. | | 42 | | | 3,394 | |
| Johnson Controls International PLC | | 517 | | | 36,986 | |
| Lennox International, Inc. | | 93 | | | 54,266 | |
| Masco Corp. | | 231 | | | 17,983 | |
| Owens Corning | | 26 | | | 4,846 | |
| Simpson Manufacturing Co., Inc. | | 76 | | | 14,599 | |
| Trane Technologies PLC | | 565 | | | 188,868 | |
Trex Co., Inc. (a) | | 253 | | | 21,158 | |
| UFP Industries, Inc. | | 64 | | | 8,444 | |
| | | | 626,779 | |
| | | | |
| Cable & Satellite - 0.1% | | | | |
Charter Communications, Inc. - Class A (a) | | 54 | | | 20,505 | |
Liberty Broadband Corp. - Class A (a) | | 29 | | | 1,920 | |
Liberty Broadband Corp. - Class C (a) | | 272 | | | 18,330 | |
| Sirius XM Holdings, Inc. | | 568 | | | 1,960 | |
| | | | 42,715 | |
| | | | |
| Cargo Ground Transportation - 0.2% | | | | |
| JB Hunt Transport Services, Inc. | | 251 | | | 43,461 | |
| Knight-Swift Transportation Holdings, Inc. | | 92 | | | 5,007 | |
| Landstar System, Inc. | | 53 | | | 10,083 | |
| Old Dominion Freight Line, Inc. | | 474 | | | 99,625 | |
Saia, Inc. (a) | | 64 | | | 26,742 | |
U-Haul Holding Co. (a) | | 2 | | | 134 | |
| U-Haul Holding Co. – Class B | | 27 | | | 1,721 | |
XPO, Inc. (a) | | 58 | | | 6,664 | |
| | | | 193,437 | |
| | | | |
| Casinos & Gaming - 0.1% | | | | |
| Boyd Gaming Corp. | | 5 | | | 304 | |
Caesars Entertainment, Inc. (a) | | 129 | | | 5,154 | |
| Churchill Downs, Inc. | | 151 | | | 21,678 | |
DraftKings, Inc. - Class A (a) | | 1,263 | | | 46,668 | |
Light & Wonder, Inc. - Class A (a) | | 220 | | | 23,584 | |
The accompanying notes are an integral part of these financial statements.
62
| | |
| STRIVE 1000 GROWTH ETF |
| SCHEDULE OF INVESTMENTS (CONTINUED) |
| July 31, 2024 |
| | | | | | | | | | | | | | |
| COMMON STOCKS - 97.9% (CONTINUED) | | Shares | | Value |
| Casinos & Gaming - 0.1% (Continued) | | | | |
MGM Resorts International (a) | | 320 | | | $ | 13,750 | |
| Wynn Resorts Ltd. | | 90 | | | 7,454 | |
| | | | 118,592 | |
| | | | |
Commercial & Residential Mortgage Finance - 0.0%(b) | | | | |
Rocket Cos., Inc. - Class A (a) | | 281 | | | 4,549 | |
| UWM Holdings Corp. | | 94 | | | 790 | |
| | | | 5,339 | |
| | | | |
Commodity Chemicals - 0.0%(b) | | | | |
| Olin Corp. | | 251 | | | 11,448 | |
| Westlake Corp. | | 35 | | | 5,175 | |
| | | | 16,623 | |
| | | | |
| Communications Equipment - 0.6% | | | | |
Arista Networks, Inc. (a) | | 625 | | | 216,594 | |
Ciena Corp. (a) | | 154 | | | 8,122 | |
| Cisco Systems, Inc. | | 1,591 | | | 77,084 | |
F5, Inc. (a) | | 105 | | | 21,382 | |
| Juniper Networks, Inc. | | 81 | | | 3,053 | |
Lumentum Holdings, Inc. (a) | | 70 | | | 3,625 | |
| Motorola Solutions, Inc. | | 395 | | | 157,573 | |
| | | | 487,433 | |
| | | | |
Computer & Electronics Retail - 0.0%(b) | | | | |
GameStop Corp. - Class A (a) | | 455 | | | 10,315 | |
| | | | |
| Construction & Engineering - 0.3% | | | | |
| AECOM | | 239 | | | 21,656 | |
API Group Corp. (a) | | 483 | | | 18,301 | |
| Comfort Systems USA, Inc. | | 80 | | | 26,593 | |
| Emcor Group, Inc. | | 91 | | | 34,165 | |
| Quanta Services, Inc. | | 358 | | | 95,006 | |
| Valmont Industries, Inc. | | 22 | | | 6,564 | |
WillScot Holdings Corp. (a) | | 454 | | | 18,614 | |
| | | | 220,899 | |
| | | | |
| Construction Machinery & Heavy Transportation Equipment - 0.4% | | | | |
| Caterpillar, Inc. | | 907 | | | 314,003 | |
| Cummins, Inc. | | 1 | | | 292 | |
| Oshkosh Corp. | | 1 | | | 109 | |
| Paccar, Inc. | | 35 | | | 3,453 | |
| Westinghouse Air Brake Technologies Corp. | | 255 | | | 41,093 | |
| | | | 358,950 | |
| | | | |
The accompanying notes are an integral part of these financial statements.
63
| | |
| STRIVE 1000 GROWTH ETF |
| SCHEDULE OF INVESTMENTS (CONTINUED) |
| July 31, 2024 |
| | | | | | | | | | | | | | |
| COMMON STOCKS - 97.9% (CONTINUED) | | Shares | | Value |
| Construction Materials - 0.2% | | | | |
| Eagle Materials, Inc. | | 61 | | | $ | 16,610 | |
| Martin Marietta Materials, Inc. | | 139 | | | 82,476 | |
| Vulcan Materials Co. | | 313 | | | 85,922 | |
| | | | 185,008 | |
| | | | |
Consumer Electronics - 0.0%(b) | | | | |
| Garmin Ltd. | | 225 | | | 38,531 | |
| | | | |
| Consumer Finance - 0.2% | | | | |
| American Express Co. | | 762 | | | 192,816 | |
Credit Acceptance Corp. (a) | | 5 | | | 2,875 | |
| Discover Financial Services | | 20 | | | 2,880 | |
| | | | 198,571 | |
| | | | |
| Consumer Staples Merchandise Retail - 1.2% | | | | |
BJ's Wholesale Club Holdings, Inc. (a) | | 102 | | | 8,972 | |
| Costco Wholesale Corp. | | 975 | | | 801,450 | |
| Dollar General Corp. | | 51 | | | 6,140 | |
Dollar Tree, Inc. (a) | | 271 | | | 28,276 | |
| Target Corp. | | 3 | | | 451 | |
| Walmart, Inc. | | 2,898 | | | 198,919 | |
| | | | 1,044,208 | |
| | | | |
| Copper - 0.2% | | | | |
| Freeport-McMoRan, Inc. | | 2,881 | | | 130,826 | |
| | | | |
| Data Processing & Outsourced Services - 0.1% | | | | |
| Broadridge Financial Solutions, Inc. | | 269 | | | 57,566 | |
| Genpact Ltd. | | 77 | | | 2,670 | |
| Maximus, Inc. | | 53 | | | 4,923 | |
| SS&C Technologies Holdings, Inc. | | 245 | | | 17,873 | |
| | | | 83,032 | |
| | | | |
| Distillers & Vintners - 0.1% | | | | |
| Brown-Forman Corp. - Class A | | 76 | | | 3,465 | |
| Brown-Forman Corp. - Class B | | 588 | | | 26,554 | |
| Constellation Brands, Inc. - Class A | | 126 | | | 30,890 | |
| | | | 60,909 | |
| | | | |
| Distributors - 0.1% | | | | |
| Genuine Parts Co. | | 50 | | | 7,356 | |
| Pool Corp. | | 107 | | | 40,022 | |
| | | | 47,378 | |
| | | | |
The accompanying notes are an integral part of these financial statements.
64
| | |
| STRIVE 1000 GROWTH ETF |
| SCHEDULE OF INVESTMENTS (CONTINUED) |
| July 31, 2024 |
| | | | | | | | | | | | | | |
| COMMON STOCKS - 97.9% (CONTINUED) | | Shares | | Value |
Diversified Banks - 0.0%(b) | | | | |
| First Citizens BancShares, Inc. - Class A | | 11 | | | $ | 22,965 | |
| | | | |
| Diversified Financial Services - 0.1% | | | | |
| Apollo Global Management, Inc. | | 931 | | | 116,664 | |
| | | | |
| Diversified Support Services - 0.3% | | | | |
| Cintas Corp. | | 219 | | | 167,303 | |
Copart, Inc. (a) | | 2,328 | | | 121,824 | |
| | | | 289,127 | |
| | | | |
Education Services - 0.0%(b) | | | | |
Bright Horizons Family Solutions, Inc. (a) | | 83 | | | 9,981 | |
Duolingo, Inc. (a) | | 99 | | | 17,022 | |
| | | | 27,003 | |
| | | | |
| Electric Utilities - 0.3% | | | | |
| Alliant Energy Corp. | | 1 | | | 56 | |
| Constellation Energy Corp. | | 770 | | | 146,146 | |
| Idacorp, Inc. | | 6 | | | 586 | |
| NextEra Energy, Inc. | | 1,599 | | | 122,148 | |
| Southern Co. | | 8 | | | 668 | |
| | | | 269,604 | |
| | | | |
| Electrical Components & Equipment - 0.8% | | | | |
| Acuity Brands, Inc. | | 33 | | | 8,295 | |
| Ametex, Inc. | | 563 | | | 97,669 | |
| Eaton Corp. PLC | | 886 | | | 270,044 | |
| Emerson Electric Co. | | 616 | | | 72,140 | |
Generac Holdings, Inc. (a) | | 106 | | | 16,502 | |
| Hubbell, Inc. | | 120 | | | 47,478 | |
NEXTracker, Inc. - Class A (a) | | 281 | | | 13,808 | |
| nVent Electric PLC | | 319 | | | 23,169 | |
| Regal Rexnord Corp. | | 31 | | | 4,981 | |
| Rockwell Automation, Inc. | | 311 | | | 86,660 | |
Sunrun, Inc. (a) | | 277 | | | 4,856 | |
| Vertiv Holdings Co. - Class A | | 878 | | | 69,099 | |
| | | | 714,701 | |
| | | | |
| Electronic Components - 0.2% | | | | |
| Amphenol Corp. - Class A | | 2,985 | | | 191,816 | |
Coherent Corp. (a) | | 74 | | | 5,156 | |
| Littelfuse, Inc. | | 40 | | | 10,685 | |
| | | | 207,657 | |
| | | | |
The accompanying notes are an integral part of these financial statements.
65
| | |
| STRIVE 1000 GROWTH ETF |
| SCHEDULE OF INVESTMENTS (CONTINUED) |
| July 31, 2024 |
| | | | | | | | | | | | | | |
| COMMON STOCKS - 97.9% (CONTINUED) | | Shares | | Value |
| Electronic Equipment & Instruments - 0.2% | | | | |
| Cognex Corp. | | 368 | | | $ | 18,260 | |
Keysight Technologies, Inc. (a) | | 478 | | | 66,714 | |
Teledyne Technologies, Inc. (a) | | 106 | | | 44,717 | |
Trimble, Inc. (a) | | 502 | | | 27,379 | |
| Vontier Corp. | | 130 | | | 5,100 | |
Zebra Technologies Corp. - Class A (a) | | 135 | | | 47,411 | |
| | | | 209,581 | |
| | | | |
| Electronic Manufacturing Services - 0.1% | | | | |
IPG Photonics Corp. (a) | | 28 | | | 2,251 | |
| Jabil, Inc. | | 163 | | | 18,365 | |
| TE Connectivity Ltd. | | 375 | | | 57,874 | |
| | | | 78,490 | |
| | | | |
| Environmental & Facilities Services - 0.5% | | | | |
Clean Harbors, Inc. (a) | | 130 | | | 31,035 | |
| Republic Services, Inc. | | 522 | | | 101,435 | |
| Rollins, Inc. | | 706 | | | 33,824 | |
Stericycle, Inc. (a) | | 75 | | | 4,391 | |
| Tetra Tech, Inc. | | 121 | | | 25,802 | |
| Veralto Corp. | | 575 | | | 61,272 | |
| Waste Management, Inc. | | 907 | | | 183,813 | |
| | | | 441,572 | |
| | | | |
| Fertilizers & Agricultural Chemicals - 0.1% | | | | |
| CF Industries Holdings, Inc. | | 344 | | | 26,278 | |
| Corteva, Inc. | | 1,205 | | | 67,601 | |
| | | | 93,879 | |
| | | | |
| Financial Exchanges & Data - 1.4% | | | | |
| Cboe Global Markets, Inc. | | 248 | | | 45,511 | |
| CME Group, Inc. | | 237 | | | 45,909 | |
Coinbase Global, Inc. - Class A (a) | | 459 | | | 102,981 | |
| FactSet Research Systems, Inc. | | 94 | | | 38,830 | |
| Intercontinental Exchange, Inc. | | 1,098 | | | 166,413 | |
| MarketAxess Holdings, Inc. | | 66 | | | 14,753 | |
| Moody's Corp. | | 383 | | | 174,832 | |
| Morningstar, Inc. | | 74 | | | 23,506 | |
| MSCI, Inc. | | 195 | | | 105,448 | |
| Nasdaq, Inc. | | 700 | | | 47,376 | |
| S&P Global, Inc. | | 782 | | | 379,059 | |
| Tradeweb Markets, Inc. - Class A | | 264 | | | 29,484 | |
| | | | 1,174,102 | |
| | | | |
The accompanying notes are an integral part of these financial statements.
66
| | |
| STRIVE 1000 GROWTH ETF |
| SCHEDULE OF INVESTMENTS (CONTINUED) |
| July 31, 2024 |
| | | | | | | | | | | | | | |
| COMMON STOCKS - 97.9% (CONTINUED) | | Shares | | Value |
Food Distributors - 0.0%(b) | | | | |
| Sysco Corp. | | 257 | | | $ | 19,699 | |
US Foods Holding Corp. (a) | | 37 | | | 2,012 | |
| | | | 21,711 | |
| | | | |
Food Products - 0.0%(b) | | | | |
| Lamb Weston Holdings, Inc. | | 310 | | | 18,606 | |
| | | | |
Food Retail - 0.0%(b) | | | | |
| Casey's General Stores, Inc. | | 58 | | | 22,495 | |
| | | | |
| Footwear - 0.4% | | | | |
Crocs, Inc. (a) | | 125 | | | 16,796 | |
Deckers Outdoor Corp. (a) | | 61 | | | 56,280 | |
| NIKE, Inc. - Class B | | 2,930 | | | 219,340 | |
On Holding AG - Class A (a) | | 490 | | | 20,296 | |
Skechers USA, Inc. - Class A (a) | | 138 | | | 8,988 | |
| | | | 321,700 | |
| | | | |
Gold - 0.0%(b) | | | | |
| Royal Gold, Inc. | | 113 | | | 15,608 | |
| | | | |
Health Care Distributors - 0.0%(b) | | | | |
Henry Schein, Inc. (a) | | 75 | | | 5,396 | |
| | | | |
| Health Care Equipment - 2.4% | | | | |
| Abbott Laboratories | | 3,905 | | | 413,696 | |
| Becton Dickinson & Co. | | 448 | | | 107,995 | |
Boston Scientific Corp. (a) | | 3,624 | | | 267,741 | |
Dexcom, Inc. (a) | | 928 | | | 62,937 | |
Edwards Lifesciences Corp. (a) | | 1,570 | | | 98,988 | |
| GE HealthCare Technologies, Inc. | | 897 | | | 75,913 | |
Globus Medical, Inc. - Class A (a) | | 246 | | | 17,702 | |
Hologic, Inc. (a) | | 331 | | | 27,013 | |
Idexx Laboratories, Inc. (a) | | 215 | | | 102,366 | |
Inspire Medical Systems, Inc. (a) | | 52 | | | 7,335 | |
Insulet Corp. (a) | | 159 | | | 30,902 | |
Integra LifeSciences Holdings Corp. (a) | | 61 | | | 1,513 | |
Intuitive Surgical, Inc. (a) | | 858 | | | 381,475 | |
Masimo Corp. (a) | | 140 | | | 14,977 | |
| Medtronic PLC | | 252 | | | 20,241 | |
Penumbra, Inc. (a) | | 105 | | | 17,544 | |
QuidelOrtho Corp. (a) | | 70 | | | 2,750 | |
| ResMed, Inc. | | 350 | | | 74,638 | |
The accompanying notes are an integral part of these financial statements.
67
| | |
| STRIVE 1000 GROWTH ETF |
| SCHEDULE OF INVESTMENTS (CONTINUED) |
| July 31, 2024 |
| | | | | | | | | | | | | | |
| COMMON STOCKS - 97.9% (CONTINUED) | | Shares | | Value |
| Health Care Equipment - 2.4% (Continued) | | | | |
| Steris PLC | | 235 | | | $ | 56,109 | |
| Stryker Corp. | | 836 | | | 273,748 | |
| Teleflex, Inc. | | 89 | | | 19,662 | |
| Zimmer Biomet Holdings, Inc. | | 166 | | | 18,484 | |
| | | | 2,093,729 | |
| | | | |
| Health Care Facilities - 0.1% | | | | |
Acadia Healthcare Co., Inc. (a) | | 100 | | | 6,485 | |
| Encompass Health Corp. | | 52 | | | 4,833 | |
| HCA Healthcare, Inc. | | 154 | | | 55,909 | |
| Universal Health Services, Inc. - Class B | | 1 | | | 214 | |
| | | | 67,441 | |
| | | | |
| Health Care Services - 0.1% | | | | |
| Chemed Corp. | | 41 | | | 23,377 | |
DaVita, Inc. (a) | | 29 | | | 3,962 | |
Option Care Health, Inc. (a) | | 374 | | | 11,104 | |
| Quest Diagnostics, Inc. | | 42 | | | 5,977 | |
R1 RCM, Inc. (a) | | 97 | | | 1,249 | |
| | | | 45,669 | |
| | | | |
| Health Care Supplies - 0.1% | | | | |
Align Technology, Inc. (a) | | 159 | | | 36,869 | |
| Cooper Cos., Inc. | | 457 | | | 42,652 | |
| Dentsply Sirona, Inc. | | 133 | | | 3,609 | |
| | | | 83,130 | |
| | | | |
Health Care Technology - 0.0%(b) | | | | |
Doximity, Inc. - Class A (a) | | 231 | | | 6,468 | |
Teladoc Health, Inc. (a) | | 354 | | | 3,338 | |
| | | | 9,806 | |
| | | | |
| Heavy Electrical Equipment - 0.1% | | | | |
GE Vernova, Inc. (a) | | 386 | | | 68,801 | |
| | | | |
Home Furnishings - 0.0%(b) | | | | |
| Tempur Sealy International, Inc. | | 357 | | | 18,689 | |
| | | | |
| Home Improvement Retail - 1.0% | | | | |
Floor & Decor Holdings, Inc. - Class A (a) | | 239 | | | 23,422 | |
| Home Depot, Inc. | | 1,770 | | | 651,643 | |
| Lowe's Cos., Inc. | | 714 | | | 175,294 | |
| | | | 850,359 | |
| | | | |
The accompanying notes are an integral part of these financial statements.
68
| | |
| STRIVE 1000 GROWTH ETF |
| SCHEDULE OF INVESTMENTS (CONTINUED) |
| July 31, 2024 |
| | | | | | | | | | | | | | |
| COMMON STOCKS - 97.9% (CONTINUED) | | Shares | | Value |
| Homebuilding - 0.2% | | | | |
| DR Horton, Inc. | | 341 | | | $ | 61,356 | |
| Lennar Corp. - Class A | | 22 | | | 3,893 | |
| Lennar Corp. - Class B | | 1 | | | 165 | |
NVR, Inc. (a) | | 5 | | | 43,037 | |
| PulteGroup, Inc. | | 36 | | | 4,752 | |
TopBuild Corp. (a) | | 89 | | | 42,590 | |
| | | | 155,793 | |
| | | | |
Homefurnishing Retail - 0.0%(b) | | | | |
RH (a) | | 13 | | | 3,771 | |
| Williams-Sonoma, Inc. | | 182 | | | 28,152 | |
| | | | 31,923 | |
| | | | |
| Hotels, Resorts & Cruise Lines - 0.9% | | | | |
Airbnb, Inc. - Class A (a) | | 952 | | | 132,861 | |
| Booking Holdings, Inc. | | 84 | | | 312,061 | |
Choice Hotels International, Inc. (c) | | 51 | | | 6,500 | |
Expedia Group, Inc. (a) | | 281 | | | 35,875 | |
| Hilton Worldwide Holdings, Inc. | | 595 | | | 127,729 | |
| Hyatt Hotels Corp. - Class A | | 123 | | | 18,121 | |
| Marriott International, Inc. - Class A | | 576 | | | 130,925 | |
Royal Caribbean Cruises Ltd. (a) | | 264 | | | 41,374 | |
| Wyndham Hotels & Resorts, Inc. | | 64 | | | 4,846 | |
| | | | 810,292 | |
| | | | |
| Household Products - 0.9% | | | | |
| Church & Dwight Co., Inc. | | 468 | | | 45,869 | |
| Clorox Co. | | 57 | | | 7,520 | |
| Colgate-Palmolive Co. | | 986 | | | 97,801 | |
| Kimberly-Clark Corp. | | 179 | | | 24,174 | |
| Procter & Gamble Co. | | 3,728 | | | 599,313 | |
| Reynolds Consumer Products, Inc. | | 20 | | | 557 | |
| | | | 775,234 | |
| | | | |
| Human Resource & Employment Services - 0.5% | | | | |
| Automatic Data Processing, Inc. | | 1,019 | | | 267,610 | |
Dayforce, Inc. (a) | | 327 | | | 19,384 | |
| Paychex, Inc. | | 590 | | | 75,532 | |
| Paycom Software, Inc. | | 92 | | | 15,345 | |
Paylocity Holding Corp. (a) | | 77 | | | 11,555 | |
| Robert Half, Inc. | | 76 | | | 4,878 | |
| TriNet Group, Inc. | | 51 | | | 5,317 | |
| | | | 399,621 | |
| | | | |
The accompanying notes are an integral part of these financial statements.
69
| | |
| STRIVE 1000 GROWTH ETF |
| SCHEDULE OF INVESTMENTS (CONTINUED) |
| July 31, 2024 |
| | | | | | | | | | | | | | |
| COMMON STOCKS - 97.9% (CONTINUED) | | Shares | | Value |
| Independent Power Producers & Energy Traders - 0.1% | | | | |
| Vistra Corp. | | 777 | | | $ | 61,554 | |
| | | | |
| Industrial Conglomerates - 0.2% | | | | |
| Honeywell International, Inc. | | 943 | | | 193,079 | |
| | | | |
| Industrial Gases - 0.7% | | | | |
| Air Products and Chemicals, Inc. | | 398 | | | 105,012 | |
| Linde PLC | | 1,186 | | | 537,851 | |
| | | | 642,863 | |
| | | | |
| Industrial Machinery & Supplies & Components - 1.1% | | | | |
Chart Industries, Inc. (a) | | 149 | | | 24,001 | |
| Crane Co. | | 147 | | | 23,582 | |
| Donaldson Co., Inc. | | 142 | | | 10,624 | |
| Dover Corp. | | 225 | | | 41,458 | |
| Flowserve Corp. | | 96 | | | 4,853 | |
| Fortive Corp. | | 466 | | | 33,482 | |
| Graco, Inc. | | 454 | | | 38,613 | |
| IDEX Corp. | | 181 | | | 37,735 | |
| Illinois Tool Works, Inc. | | 585 | | | 144,659 | |
| Ingersoll Rand, Inc. | | 964 | | | 96,786 | |
| ITT, Inc. | | 175 | | | 24,756 | |
| Lincoln Electric Holdings, Inc. | | 152 | | | 31,222 | |
Middleby Corp. (a) | | 60 | | | 8,135 | |
| Nordson Corp. | | 143 | | | 35,797 | |
| Otis Worldwide Corp. | | 749 | | | 70,781 | |
| Parker-Hannifin Corp. | | 296 | | | 166,103 | |
| Pentair PLC | | 416 | | | 36,554 | |
RBC Bearings, Inc. (a) | | 79 | | | 22,976 | |
| Snap-on, Inc. | | 29 | | | 8,324 | |
Symbotic, Inc. (a) | | 51 | | | 1,367 | |
| Watts Water Technologies, Inc. - Class A | | 48 | | | 9,961 | |
| Xylem, Inc. | | 454 | | | 60,609 | |
| | | | 932,378 | |
| | | | |
| Insurance Brokers - 0.7% | | | | |
| Aon PLC - Class A | | 368 | | | 120,892 | |
| Arthur J Gallagher & Co. | | 523 | | | 148,265 | |
| Brown & Brown, Inc. | | 538 | | | 53,493 | |
| Marsh & McLennan Cos., Inc. | | 1,184 | | | 263,523 | |
| Ryan Specialty Holdings, Inc. | | 234 | | | 14,412 | |
| Willis Towers Watson PLC | | 156 | | | 44,036 | |
| | | | 644,621 | |
| | | | |
The accompanying notes are an integral part of these financial statements.
70
| | |
| STRIVE 1000 GROWTH ETF |
| SCHEDULE OF INVESTMENTS (CONTINUED) |
| July 31, 2024 |
| | | | | | | | | | | | | | |
| COMMON STOCKS - 97.9% (CONTINUED) | | Shares | | Value |
| Integrated Oil & Gas - 0.1% | | | | |
| Exxon Mobil Corp. | | 261 | | | $ | 30,952 | |
| Occidental Petroleum Corp. | | 314 | | | 19,097 | |
| | | | 50,049 | |
| | | | |
| Interactive Home Entertainment - 0.2% | | | | |
| Electronic Arts, Inc. | | 483 | | | 72,904 | |
Roblox Corp. - Class A (a) | | 1,442 | | | 59,872 | |
Take-Two Interactive Software, Inc. (a) | | 333 | | | 50,126 | |
| | | | 182,902 | |
| | | | |
| Interactive Media & Services - 8.4% | | | | |
| Alphabet, Inc. - Class A | | 14,557 | | | 2,497,108 | |
| Alphabet, Inc. - Class C | | 12,135 | | | 2,101,175 | |
IAC, Inc. (a) | | 45 | | | 2,376 | |
Match Group, Inc. (a) | | 107 | | | 4,081 | |
| Meta Platforms, Inc. - Class A | | 5,409 | | | 2,568,356 | |
Pinterest, Inc. - Class A (a) | | 1,401 | | | 44,762 | |
Snap, Inc. - Class A (a) | | 2,508 | | | 33,407 | |
Ziff Davis, Inc. (a) | | 9 | | | 431 | |
ZoomInfo Technologies, Inc. (a) | | 881 | | | 10,008 | |
| | | | 7,261,704 | |
| | | | |
| Internet Services & Infrastructure - 0.5% | | | | |
Akamai Technologies, Inc. (a) | | 435 | | | 42,752 | |
Cloudflare, Inc. - Class A (a) | | 674 | | | 52,235 | |
GoDaddy, Inc. - Class A (a) | | 364 | | | 52,944 | |
MongoDB, Inc. (a) | | 164 | | | 41,387 | |
Okta, Inc. (a) | | 438 | | | 41,145 | |
Snowflake, Inc. - Class A (a) | | 789 | | | 102,870 | |
Twilio, Inc. - Class A (a) | | 552 | | | 32,640 | |
VeriSign, Inc. (a) | | 254 | | | 47,500 | |
| | | | 413,473 | |
| | | | |
| Investment Banking & Brokerage - 0.4% | | | | |
| Charles Schwab Corp. | | 2,444 | | | 159,324 | |
| Evercore, Inc. - Class A | | 34 | | | 8,513 | |
| Goldman Sachs Group, Inc. | | 22 | | | 11,199 | |
| Houlihan Lokey, Inc. | | 147 | | | 22,087 | |
| Interactive Brokers Group, Inc. - Class A | | 155 | | | 18,487 | |
| LPL Financial Holdings, Inc. | | 180 | | | 39,874 | |
| Raymond James Financial, Inc. | | 390 | | | 45,240 | |
Robinhood Markets, Inc. - Class A (a) | | 1,229 | | | 25,280 | |
| | | | 330,004 | |
| | | | |
The accompanying notes are an integral part of these financial statements.
71
| | |
| STRIVE 1000 GROWTH ETF |
| SCHEDULE OF INVESTMENTS (CONTINUED) |
| July 31, 2024 |
| | | | | | | | | | | | | | |
| COMMON STOCKS - 97.9% (CONTINUED) | | Shares | | Value |
| IT Consulting & Other Services - 0.9% | | | | |
| Accenture PLC - Class A | | 1,663 | | | $ | 549,821 | |
| Amdocs Ltd. | | 74 | | | 6,473 | |
| Cognizant Technology Solutions Corp. - Class A | | 508 | | | 38,445 | |
Epam Systems, Inc. (a) | | 128 | | | 27,537 | |
Gartner, Inc. (a) | | 195 | | | 97,732 | |
Globant SA (a) | | 75 | | | 14,603 | |
| | | | 734,611 | |
| | | | |
Leisure Facilities - 0.0%(b) | | | | |
Planet Fitness, Inc. - Class A (a) | | 256 | | | 18,867 | |
| Vail Resorts, Inc. | | 50 | | | 9,101 | |
| | | | 27,968 | |
| | | | |
Leisure Products - 0.0%(b) | | | | |
| Brunswick Corp. | | 40 | | | 3,258 | |
Mattel, Inc. (a) | | 713 | | | 13,754 | |
Yeti Holdings, Inc. (a) | | 154 | | | 6,368 | |
| | | | 23,380 | |
| | | | |
Life & Health Insurance - 0.0%(b) | | | | |
| Globe Life, Inc. | | 17 | | | 1,577 | |
| Primerica, Inc. | | 25 | | | 6,294 | |
| | | | 7,871 | |
| | | | |
| Life Sciences Tools & Services - 2.0% | | | | |
10X Genomics, Inc. - Class A (a) | | 230 | | | 4,754 | |
| Agilent Technologies, Inc. | | 786 | | | 111,140 | |
Avantor, Inc. (a) | | 1,624 | | | 43,442 | |
Bio-Rad Laboratories, Inc. - Class A (a) | | 22 | | | 7,444 | |
| Bio-Techne Corp. | | 340 | | | 27,741 | |
| Bruker Corp. | | 221 | | | 15,141 | |
Charles River Laboratories International, Inc. (a) | | 127 | | | 31,001 | |
| Danaher Corp. | | 1,664 | | | 461,061 | |
Icon PLC (a) | | 166 | | | 54,521 | |
Illumina, Inc. (a) | | 71 | | | 8,705 | |
Iqvia Holdings, Inc. (a) | | 439 | | | 108,095 | |
Medpace Holdings, Inc. (a) | | 65 | | | 24,864 | |
Mettler-Toledo International, Inc. (a) | | 50 | | | 76,051 | |
Repligen Corp. (a) | | 144 | | | 24,098 | |
| Revvity, Inc. | | 225 | | | 28,262 | |
Sotera Health Co. (a) | | 235 | | | 3,259 | |
| Thermo Fisher Scientific, Inc. | | 934 | | | 572,860 | |
Waters Corp. (a) | | 132 | | | 44,389 | |
The accompanying notes are an integral part of these financial statements.
72
| | |
| STRIVE 1000 GROWTH ETF |
| SCHEDULE OF INVESTMENTS (CONTINUED) |
| July 31, 2024 |
| | | | | | | | | | | | | | |
| COMMON STOCKS - 97.9% (CONTINUED) | | Shares | | Value |
| Life Sciences Tools & Services - 2.0% (Continued) | | | | |
| West Pharmaceutical Services, Inc. | | 193 | | | $ | 59,091 | |
| | | | 1,705,919 | |
| | | | |
| Managed Health Care - 1.4% | | | | |
| Elevance Health, Inc. | | 151 | | | 80,337 | |
HealthEquity, Inc. (a) | | 240 | | | 18,835 | |
| Humana, Inc. | | 59 | | | 21,335 | |
Molina Healthcare, Inc. (a) | | 101 | | | 34,468 | |
| UnitedHealth Group, Inc. | | 1,784 | | | 1,027,869 | |
| | | | 1,182,844 | |
| | | | |
Metal, Glass & Plastic Containers - 0.0%(b) | | | | |
| AptarGroup, Inc. | | 64 | | | 9,407 | |
| Ball Corp. | | 336 | | | 21,447 | |
| Crown Holdings, Inc. | | 41 | | | 3,636 | |
| | | | 34,490 | |
| | | | |
| Movies & Entertainment - 1.2% | | | | |
| Endeavor Group Holdings, Inc. - Class A | | 59 | | | 1,618 | |
Liberty Media Corp.-Liberty Formula One - Class A (a) | | 42 | | | 3,107 | |
Liberty Media Corp.-Liberty Formula One - Class C (a) | | 485 | | | 39,222 | |
Liberty Media Corp.-Liberty Live - Class A (a) | | 29 | | | 1,095 | |
Liberty Media Corp.-Liberty Live - Class C (a) | | 67 | | | 2,614 | |
Live Nation Entertainment, Inc. (a) | | 340 | | | 32,705 | |
Madison Square Garden Sports Corp. (a) | | 22 | | | 4,409 | |
Netflix, Inc. (a) | | 1,068 | | | 671,078 | |
Roku, Inc. (a) | | 77 | | | 4,482 | |
Spotify Technology SA (a) | | 308 | | | 105,933 | |
| TKO Group Holdings, Inc. | | 72 | | | 7,873 | |
| Walt Disney Co. | | 1,759 | | | 164,801 | |
| Warner Music Group Corp. - Class A | | 289 | | | 8,673 | |
| | | | 1,047,610 | |
| | | | |
| Multi-Sector Holdings - 1.0% | | | | |
Berkshire Hathaway, Inc. - Class B (a) | | 2,024 | | | 887,524 | |
| | | | |
Multi-Utilities - 0.0%(b) | | | | |
| WEC Energy Group, Inc. | | 20 | | | 1,721 | |
| | | | |
Office Services & Supplies - 0.0%(b) | | | | |
| MSA Safety, Inc. | | 53 | | | 9,998 | |
| | | | |
Oil & Gas Drilling - 0.0%(b) | | | | |
| Noble Corp. PLC | | 262 | | | 12,372 | |
| | | | |
The accompanying notes are an integral part of these financial statements.
73
| | |
| STRIVE 1000 GROWTH ETF |
| SCHEDULE OF INVESTMENTS (CONTINUED) |
| July 31, 2024 |
| | | | | | | | | | | | | | |
| COMMON STOCKS - 97.9% (CONTINUED) | | Shares | | Value |
| Oil & Gas Equipment & Services - 0.2% | | | | |
| ChampionX Corp. | | 327 | | | $ | 11,203 | |
| Halliburton Co. | | 489 | | | 16,959 | |
| NOV, Inc. | | 764 | | | 15,906 | |
| Schlumberger NV | | 2,453 | | | 118,455 | |
| | | | 162,523 | |
| | | | |
| Oil & Gas Exploration & Production - 0.3% | | | | |
Antero Resources Corp. (a) | | 87 | | | 2,525 | |
| ConocoPhillips | | 1,112 | | | 123,654 | |
| Hess Corp. | | 719 | | | 110,309 | |
| Texas Pacific Land Corp. | | 49 | | | 41,400 | |
| | | | 277,888 | |
| | | | |
| Oil & Gas Storage & Transportation - 0.2% | | | | |
| Cheniere Energy, Inc. | | 398 | | | 72,691 | |
| New Fortress Energy, Inc. | | 222 | | | 4,382 | |
| Targa Resources Corp. | | 563 | | | 76,163 | |
| Williams Cos., Inc. | | 125 | | | 5,367 | |
| | | | 158,603 | |
| | | | |
| Other Specialty Retail - 0.1% | | | | |
Chewy, Inc. - Class A (a) | | 236 | | | 5,707 | |
| Dick's Sporting Goods, Inc. | | 9 | | | 1,947 | |
Five Below, Inc. (a) | | 149 | | | 10,838 | |
| Tractor Supply Co. | | 219 | | | 57,667 | |
Ulta Beauty, Inc. (a) | | 116 | | | 42,327 | |
| | | | 118,486 | |
| | | | |
| Packaged Foods & Meats - 0.3% | | | | |
| General Mills, Inc. | | 35 | | | 2,350 | |
| Hershey Co. | | 248 | | | 48,975 | |
| Lancaster Colony Corp. | | 24 | | | 4,633 | |
| McCormick & Co., Inc. | | 254 | | | 19,561 | |
| Mondelez International, Inc. - Class A | | 2,029 | | | 138,682 | |
Pilgrim's Pride Corp. (a) | | 1 | | | 41 | |
| | | | 214,242 | |
| | | | |
| Paper & Plastic Packaging Products & Materials - 0.1% | | | | |
| Avery Dennison Corp. | | 160 | | | 34,693 | |
| Graphic Packaging Holding Co. | | 18 | | | 542 | |
| Packaging Corp. of America | | 25 | | | 4,996 | |
| | | | 40,231 | |
| | | | |
The accompanying notes are an integral part of these financial statements.
74
| | |
| STRIVE 1000 GROWTH ETF |
| SCHEDULE OF INVESTMENTS (CONTINUED) |
| July 31, 2024 |
| | | | | | | | | | | | | | |
| COMMON STOCKS - 97.9% (CONTINUED) | | Shares | | Value |
| Passenger Ground Transportation - 0.4% | | | | |
Grab Holdings Ltd. - Class A (a) | | 6,699 | | | $ | 22,107 | |
Lyft, Inc. - Class A (a) | | 767 | | | 9,242 | |
Uber Technologies, Inc. (a) | | 4,945 | | | 318,804 | |
| | | | 350,153 | |
| | | | |
| Personal Care Products - 0.2% | | | | |
BellRing Brands, Inc. (a) | | 293 | | | 15,025 | |
Coty, Inc. - Class A (a) | | 937 | | | 9,323 | |
elf Beauty, Inc. (a) | | 143 | | | 24,679 | |
| Estee Lauder Cos., Inc. - Class A | | 485 | | | 48,311 | |
| Kenvue, Inc. | | 2,557 | | | 47,279 | |
| | | | 144,617 | |
| | | | |
| Pharmaceuticals - 2.9% | | | | |
Catalent, Inc. (a) | | 336 | | | 19,938 | |
Elanco Animal Health, Inc. (a) | | 283 | | | 3,690 | |
| Eli Lilly & Co. | | 2,100 | | | 1,688,967 | |
Jazz Pharmaceuticals PLC (a) | | 12 | | | 1,323 | |
| Johnson & Johnson | | 1,659 | | | 261,873 | |
| Merck & Co., Inc. | | 2,882 | | | 326,041 | |
| Zoetis, Inc. | | 1,028 | | | 185,081 | |
| | | | 2,486,913 | |
| | | | |
| Property & Casualty Insurance - 0.5% | | | | |
| Allstate Corp. | | 38 | | | 6,503 | |
Arch Capital Group Ltd. (a) | | 208 | | | 19,922 | |
| Chubb Ltd. | | 160 | | | 44,106 | |
| Cincinnati Financial Corp. | | 12 | | | 1,567 | |
| Erie Indemnity Co. - Class A | | 75 | | | 33,086 | |
| Kinsale Capital Group, Inc. | | 60 | | | 27,424 | |
Markel Group, Inc. (a) | | 6 | | | 9,833 | |
| Progressive Corp. | | 1,449 | | | 310,260 | |
| RLI Corp. | | 73 | | | 10,993 | |
| Selective Insurance Group, Inc. | | 36 | | | 3,252 | |
| W R Berkley Corp. | | 103 | | | 5,678 | |
| | | | 472,624 | |
| | | | |
Publishing - 0.0%(b) | | | | |
| New York Times Co. - Class A | | 338 | | | 18,113 | |
| News Corp. - Class A | | 289 | | | 7,971 | |
| News Corp. - Class B | | 68 | | | 1,937 | |
| | | | 28,021 | |
| | | | |
The accompanying notes are an integral part of these financial statements.
75
| | |
| STRIVE 1000 GROWTH ETF |
| SCHEDULE OF INVESTMENTS (CONTINUED) |
| July 31, 2024 |
| | | | | | | | | | | | | | |
| COMMON STOCKS - 97.9% (CONTINUED) | | Shares | | Value |
| Rail Transportation - 0.6% | | | | |
| CSX Corp. | | 3,355 | | | $ | 117,760 | |
| Norfolk Southern Corp. | | 246 | | | 61,392 | |
| Union Pacific Corp. | | 1,197 | | | 295,336 | |
| | | | 474,488 | |
| | | | |
Real Estate Development - 0.0%(b) | | | | |
Howard Hughes Holdings, Inc. (a) | | 48 | | | 3,560 | |
| | | | |
| Real Estate Services - 0.2% | | | | |
CBRE Group, Inc. - Class A (a) | | 710 | | | 80,024 | |
CoStar Group, Inc. (a) | | 964 | | | 75,211 | |
Zillow Group, Inc. - Class A (a) | | 68 | | | 3,223 | |
Zillow Group, Inc. - Class C (a) | | 332 | | | 16,169 | |
| | | | 174,627 | |
| | | | |
Regional Banks - 0.0%(b) | | | | |
| Commerce Bancshares, Inc. | | 71 | | | 4,594 | |
| Cullen/Frost Bankers, Inc. | | 1 | | | 117 | |
| First Financial Bankshares, Inc. | | 135 | | | 5,192 | |
| Pinnacle Financial Partners, Inc. | | 21 | | | 2,023 | |
| TFS Financial Corp. | | 5 | | | 68 | |
| Western Alliance Bancorp | | 10 | | | 805 | |
| | | | 12,799 | |
| | | | |
Reinsurance - 0.0%(b) | | | | |
| RenaissanceRe Holdings Ltd. | | 1 | | | 232 | |
| | | | |
| Research & Consulting Services - 0.4% | | | | |
| Booz Allen Hamilton Holding Corp. | | 288 | | | 41,273 | |
CACI International, Inc. - Class A (a) | | 21 | | | 9,691 | |
Clarivate PLC (a) | | 922 | | | 6,214 | |
| Dun & Bradstreet Holdings, Inc. | | 470 | | | 5,114 | |
| Equifax, Inc. | | 312 | | | 87,163 | |
FTI Consulting, Inc. (a) | | 97 | | | 21,143 | |
| Jacobs Solutions, Inc. | | 91 | | | 13,318 | |
| KBR, Inc. | | 235 | | | 15,649 | |
| Leidos Holdings, Inc. | | 100 | | | 14,440 | |
Parsons Corp. (a) | | 69 | | | 6,305 | |
| Science Applications International Corp. | | 30 | | | 3,732 | |
| TransUnion | | 465 | | | 41,971 | |
| Verisk Analytics, Inc. | | 344 | | | 90,042 | |
| | | | 356,055 | |
| | | | |
The accompanying notes are an integral part of these financial statements.
76
| | |
| STRIVE 1000 GROWTH ETF |
| SCHEDULE OF INVESTMENTS (CONTINUED) |
| July 31, 2024 |
| | | | | | | | | | | | | | |
| COMMON STOCKS - 97.9% (CONTINUED) | | Shares | | Value |
| Restaurants - 1.1% | | | | |
Chipotle Mexican Grill, Inc. (a) | | 3,340 | | | $ | 181,429 | |
| Darden Restaurants, Inc. | | 144 | | | 21,066 | |
| Domino's Pizza, Inc. | | 74 | | | 31,724 | |
DoorDash, Inc. - Class A (a) | | 297 | | | 32,884 | |
Dutch Bros, Inc. - Class A (a) | | 348 | | | 13,311 | |
| McDonald's Corp. | | 1,316 | | | 349,266 | |
| Starbucks Corp. | | 2,245 | | | 174,998 | |
| Texas Roadhouse, Inc. | | 174 | | | 30,382 | |
| Wendy's Co. | | 96 | | | 1,625 | |
| Wingstop, Inc. | | 67 | | | 25,050 | |
| Yum! Brands, Inc. | | 618 | | | 82,089 | |
| | | | 943,824 | |
| | | | |
| Semiconductor Materials & Equipment - 1.4% | | | | |
| Amkor Technology, Inc. | | 99 | | | 3,233 | |
| Applied Materials, Inc. | | 2,044 | | | 433,737 | |
Enphase Energy, Inc. (a) | | 403 | | | 46,389 | |
| Entegris, Inc. | | 386 | | | 45,660 | |
| KLA Corp. | | 344 | | | 283,136 | |
| Lam Research Corp. | | 329 | | | 303,088 | |
| MKS Instruments, Inc. | | 162 | | | 20,396 | |
Onto Innovation, Inc. (a) | | 133 | | | 25,443 | |
SolarEdge Technologies, Inc. (a) | | 101 | | | 2,915 | |
| Teradyne, Inc. | | 365 | | | 47,873 | |
| | | | 1,211,870 | |
| | | | |
| Semiconductors - 12.9% | | | | |
Advanced Micro Devices, Inc. (a) | | 4,007 | | | 578,931 | |
| Analog Devices, Inc. | | 1,108 | | | 256,369 | |
| Broadcom, Inc. | | 11,274 | | | 1,811,506 | |
Cirrus Logic, Inc. (a) | | 155 | | | 20,224 | |
First Solar, Inc. (a) | | 241 | | | 52,054 | |
Global Foundries, Inc. (a) | | 150 | | | 7,652 | |
Lattice Semiconductor Corp. (a) | | 304 | | | 16,112 | |
| Marvell Technology, Inc. | | 2,081 | | | 139,385 | |
| Microchip Technology, Inc. | | 1,294 | | | 114,881 | |
| Micron Technology, Inc. | | 191 | | | 20,976 | |
| Monolithic Power Systems, Inc. | | 110 | | | 94,940 | |
| Nvidia Corp. | | 59,493 | | | 6,961,871 | |
| NXP Semiconductors NV | | 619 | | | 162,896 | |
ON Semiconductor Corp. (a) | | 1,159 | | | 90,692 | |
Qorvo, Inc. (a) | | 233 | | | 27,913 | |
| Qualcomm, Inc. | | 2,483 | | | 449,299 | |
The accompanying notes are an integral part of these financial statements.
77
| | |
| STRIVE 1000 GROWTH ETF |
| SCHEDULE OF INVESTMENTS (CONTINUED) |
| July 31, 2024 |
| | | | | | | | | | | | | | |
| COMMON STOCKS - 97.9% (CONTINUED) | | Shares | | Value |
| Semiconductors - 12.9% (Continued) | | | | |
Rambus, Inc. (a) | | 250 | | | $ | 12,860 | |
Silicon Laboratories, Inc. (a) | | 56 | | | 6,727 | |
| Skyworks Solutions, Inc. | | 59 | | | 6,704 | |
Synaptics, Inc. (a) | | 64 | | | 5,589 | |
| Texas Instruments, Inc. | | 1,848 | | | 376,641 | |
| Universal Display Corp. | | 79 | | | 17,587 | |
Wolfspeed, Inc. (a)(c) | | 253 | | | 4,769 | |
| | | | 11,236,578 | |
| | | | |
| Soft Drinks & Non-alcoholic Beverages - 1.1% | | | | |
Celsius Holdings, Inc. (a) | | 467 | | | 21,870 | |
| Coca-Cola Co. | | 5,593 | | | 373,277 | |
| Coca-Cola Consolidated, Inc. | | 9 | | | 10,313 | |
| Keurig Dr Pepper, Inc. | | 942 | | | 32,292 | |
Monster Beverage Corp. (a) | | 2,045 | | | 105,215 | |
| PepsiCo, Inc. | | 2,224 | | | 384,018 | |
| | | | 926,985 | |
| | | | |
Specialized Consumer Services - 0.0%(b) | | | | |
| H&R Block, Inc. | | 58 | | | 3,360 | |
| Service Corp. International/US | | 227 | | | 18,140 | |
| | | | 21,500 | |
| | | | |
| Specialty Chemicals - 0.5% | | | | |
| Albemarle Corp. | | 50 | | | 4,684 | |
| Ashland, Inc. | | 39 | | | 3,769 | |
Axalta Coating Systems Ltd. (a) | | 297 | | | 10,588 | |
| Celanese Corp. | | 58 | | | 8,187 | |
| DuPont de Nemours, Inc. | | 310 | | | 25,947 | |
| Ecolab, Inc. | | 587 | | | 135,415 | |
| PPG Industries, Inc. | | 282 | | | 35,808 | |
| RPM International, Inc. | | 230 | | | 27,936 | |
| Sherwin-Williams Co. | | 571 | | | 200,307 | |
| | | | 452,641 | |
| | | | |
Steel - 0.0%(b) | | | | |
Cleveland-Cliffs, Inc. (a) | | 119 | | | 1,827 | |
| Reliance, Inc. | | 17 | | | 5,177 | |
| | | | 7,004 | |
| | | | |
| Systems Software - 10.7% | | | | |
Crowdstrike Holdings, Inc. - Class A (a) | | 559 | | | 129,666 | |
CyberArk Software Ltd. (a) | | 125 | | | 32,048 | |
| Dolby Laboratories, Inc. - Class A | | 72 | | | 5,671 | |
The accompanying notes are an integral part of these financial statements.
78
| | |
| STRIVE 1000 GROWTH ETF |
| SCHEDULE OF INVESTMENTS (CONTINUED) |
| July 31, 2024 |
| | | | | | | | | | | | | | |
| COMMON STOCKS - 97.9% (CONTINUED) | | Shares | | Value |
| Systems Software - 10.7% (Continued) | | | | |
Fortinet, Inc. (a) | | 1,555 | | | $ | 90,252 | |
| Gen Digital, Inc. | | 981 | | | 25,496 | |
Gitlab, Inc. - Class A (a) | | 231 | | | 11,834 | |
| Microsoft Corp. | | 18,373 | | | 7,686,345 | |
Monday.com Ltd. (a) | | 92 | | | 21,143 | |
| Oracle Corp. | | 3,954 | | | 551,385 | |
Palo Alto Networks, Inc. (a) | | 802 | | | 260,433 | |
Qualys, Inc. (a) | | 64 | | | 9,545 | |
SentinelOne, Inc. - Class A (a) | | 559 | | | 12,801 | |
ServiceNow, Inc. (a) | | 514 | | | 418,596 | |
Teradata Corp. (a) | | 232 | | | 7,521 | |
UiPath, Inc. - Class A (a) | | 924 | | | 11,245 | |
Zscaler, Inc. (a) | | 222 | | | 39,816 | |
| | | | 9,313,797 | |
| | | | |
| Technology Distributors - 0.1% | | | | |
| CDW Corp. | | 349 | | | 76,120 | |
| | | | |
| Technology Hardware, Storage & Peripherals - 9.4% | | | | |
| Apple, Inc. | | 36,014 | | | 7,997,989 | |
| NetApp, Inc. | | 277 | | | 35,174 | |
Pure Storage, Inc. - Class A (a) | | 711 | | | 42,610 | |
| Seagate Technology Holdings PLC | | 44 | | | 4,496 | |
Super Micro Computer, Inc. (a) | | 125 | | | 87,706 | |
| | | | 8,167,975 | |
| | | | |
| Trading Companies & Distributors - 0.5% | | | | |
| Applied Industrial Technologies, Inc. | | 52 | | | 11,346 | |
Core & Main, Inc. - Class A (a) | | 279 | | | 14,918 | |
| Fastenal Co. | | 1,219 | | | 86,244 | |
| Ferguson PLC | | 362 | | | 80,599 | |
SiteOne Landscape Supply, Inc. (a) | | 80 | | | 11,735 | |
| United Rentals, Inc. | | 128 | | | 96,909 | |
| Watsco, Inc. | | 85 | | | 41,607 | |
| WW Grainger, Inc. | | 115 | | | 112,333 | |
| | | | 455,691 | |
| | | | |
| Transaction & Payment Processing Services - 3.0% | | | | |
Affirm Holdings, Inc. (a) | | 502 | | | 14,201 | |
Block, Inc. (a) | | 1,344 | | | 83,167 | |
Corpay, Inc. (a) | | 163 | | | 47,567 | |
Euronet Worldwide, Inc. (a) | | 28 | | | 2,856 | |
Fiserv, Inc. (a) | | 1,428 | | | 233,578 | |
| Global Payments, Inc. | | 337 | | | 34,253 | |
The accompanying notes are an integral part of these financial statements.
79
| | |
| STRIVE 1000 GROWTH ETF |
| SCHEDULE OF INVESTMENTS (CONTINUED) |
| July 31, 2024 |
| | | | | | | | | | | | | | |
| COMMON STOCKS - 97.9% (CONTINUED) | | Shares | | Value |
| Transaction & Payment Processing Services - 3.0% (Continued) | | | | |
| Jack Henry & Associates, Inc. | | 165 | | | $ | 28,294 | |
| Mastercard, Inc. - Class A | | 2,050 | | | 950,605 | |
PayPal Holdings, Inc. (a) | | 2,206 | | | 145,111 | |
Toast, Inc. - Class A (a) | | 981 | | | 25,663 | |
| Visa, Inc. - Class A | | 3,876 | | | 1,029,737 | |
WEX, Inc. (a) | | 76 | | | 13,942 | |
| | | | 2,608,974 | |
| | | | |
Water Utilities - 0.0%(b) | | | | |
| American Water Works Co., Inc. | | 199 | | | 28,330 | |
| Essential Utilities, Inc. | | 239 | | | 9,715 | |
| | | | 38,045 | |
| | | | |
| Wireless Telecommunication Services - 0.1% | | | | |
| T-Mobile US, Inc. | | 557 | | | 101,530 | |
TOTAL COMMON STOCKS (Cost $69,924,064) | | | | 85,127,634 | |
| | | | |
| REAL ESTATE INVESTMENT TRUSTS - 1.8% | | | | |
| Agree Realty Corp. | | 3 | | | 207 | |
| American Homes 4 Rent - Class A | | 670 | | | 24,180 | |
| American Tower Corp. | | 1,131 | | | 249,272 | |
| AvalonBay Communities, Inc. | | 160 | | | 32,787 | |
| Brixmor Property Group, Inc. | | 56 | | | 1,426 | |
| Camden Property Trust | | 238 | | | 26,359 | |
| Crown Castle, Inc. | | 544 | | | 59,884 | |
| CubeSmart | | 272 | | | 12,942 | |
| Digital Realty Trust, Inc. | | 577 | | | 86,256 | |
| EastGroup Properties, Inc. | | 120 | | | 22,439 | |
| Equinix, Inc. | | 228 | | | 180,175 | |
| Equity LifeStyle Properties, Inc. | | 500 | | | 34,340 | |
| Equity Residential | | 96 | | | 6,684 | |
| Essex Property Trust, Inc. | | 48 | | | 13,361 | |
| Extra Space Storage, Inc. | | 328 | | | 52,355 | |
| Federal Realty Investment Trust | | 49 | | | 5,471 | |
| First Industrial Realty Trust, Inc. | | 261 | | | 14,282 | |
| Host Hotels & Resorts, Inc. | | 109 | | | 1,909 | |
| Invitation Homes, Inc. | | 1,131 | | | 39,890 | |
| Iron Mountain, Inc. | | 600 | | | 61,536 | |
| Lamar Advertising Co. - Class A | | 64 | | | 7,671 | |
| Mid-America Apartment Communities, Inc. | | 96 | | | 13,418 | |
| National Storage Affiliates Trust | | 68 | | | 2,895 | |
| Prologis, Inc. | | 2,220 | | | 279,831 | |
| Public Storage | | 300 | | | 88,776 | |
The accompanying notes are an integral part of these financial statements.
80
| | |
| STRIVE 1000 GROWTH ETF |
| SCHEDULE OF INVESTMENTS (CONTINUED) |
| July 31, 2024 |
| | | | | | | | | | | | | | |
| REAL ESTATE INVESTMENT TRUSTS - 1.8% (CONTINUED) | | Shares | | Value |
| Rayonier, Inc. | | 131 | | | $ | 3,973 | |
| Regency Centers Corp. | | 88 | | | 5,926 | |
| Rexford Industrial Realty, Inc. | | 495 | | | 24,804 | |
| Ryman Hospitality Properties, Inc. | | 62 | | | 6,232 | |
| SBA Communications Corp. | | 252 | | | 55,324 | |
| STAG Industrial, Inc. | | 232 | | | 9,468 | |
| Sun Communities, Inc. | | 236 | | | 29,908 | |
| UDR, Inc. | | 307 | | | 12,302 | |
| Vornado Realty Trust | | 261 | | | 7,827 | |
| Welltower, Inc. | | 472 | | | 52,510 | |
| Weyerhaeuser Co. | | 346 | | | 10,989 | |
TOTAL REAL ESTATE INVESTMENT TRUSTS (Cost $1,413,456) | | | | 1,537,609 | |
| | | | |
CONTINGENT VALUE RIGHTS - 0.0%(b) | | | | |
Health Care - 0.0%(b) | | | | |
Abiomed, Inc., Exercise Price $0.00 (a)(d) | | 4 | | | 0 | |
TOTAL CONTINGENT VALUE RIGHTS (Cost $0) | | | | 0 | |
| | | | |
| SHORT-TERM INVESTMENTS - 0.3% | | | | |
Investments Purchased with Proceeds from Securities Lending - 0.0%(b) | | |
First American Government Obligations Fund - Class X, 5.23% (e) | | 22,744 | | | 22,744 | |
| | | | |
| Money Market Funds - 0.3% | | | | |
First American Government Obligations Fund - Class X, 5.23% (e) | | 273,363 | | | 273,363 | |
TOTAL SHORT-TERM INVESTMENTS (Cost $296,107) | | | | 296,107 | |
| | | | |
TOTAL INVESTMENTS - 100.0% (Cost $71,633,627) | | | | $ | 86,961,350 | |
Liabilities in Excess of Other Assets - (0.0)% (b) | | | | (8,821) | |
| TOTAL NET ASSETS - 100.0% | | | | $ | 86,952,529 | |
Percentages are stated as a percent of net assets.
| | |
| AG - Aktiengesellschaft |
| NV - Naamloze Vennootschap |
| PLC - Public Limited Company |
| SA - Sociedad Anónima |
| | | | | | | | |
| (a) | | Non-income producing security. |
| (b) | | Represents less than 0.05% of net assets. |
| (c) | | All or a portion of this security is on loan as of July 31, 2024. The total market value of these securities was $21,918 which represented 0.0% of net assets. |
The accompanying notes are an integral part of these financial statements.
81
| | |
| STRIVE 1000 GROWTH ETF |
| SCHEDULE OF INVESTMENTS (CONTINUED) |
| July 31, 2024 |
| | | | | | | | |
| (d) | | Fair value determined using significant unobservable inputs in accordance with procedures established by and under the supervision of the Adviser, acting as Valuation Designee. These securities represented $0 or 0.0% of net assets as of July 31, 2024. |
| (e) | | The rate shown represents the 7-day effective yield as of July 31, 2024. |
The Global Industry Classification Standard (GICS®) was developed by and/or is the exclusive property of MSCI, Inc. and Standard & Poor’s Financial Services LLC (“S&P”). GICS is a service mark of MSCI, Inc. and S&P and has been licensed for use by U.S. Bank Global Fund Services.
The accompanying notes are an integral part of these financial statements.
82
| | |
| STRIVE 1000 VALUE ETF |
| SCHEDULE OF INVESTMENTS |
| July 31, 2024 |
| | | | | | | | | | | | | | |
| COMMON STOCKS - 95.6% | | Shares | | Value |
| Advertising - 0.2% | | | | |
| Interpublic Group of Cos., Inc. | | 1,334 | | | $ | 42,915 | |
| Omnicom Group, Inc. | | 676 | | | 66,275 | |
| | | | 109,190 | |
| | | | |
| Aerospace & Defense - 3.2% | | | | |
| BWX Technologies, Inc. | | 43 | | | 4,278 | |
| Curtiss-Wright Corp. | | 19 | | | 5,599 | |
| General Dynamics Corp. | | 590 | | | 176,239 | |
| General Electric Co. | | 1,677 | | | 285,425 | |
| Hexcel Corp. | | 128 | | | 8,475 | |
| Howmet Aerospace, Inc. | | 437 | | | 41,821 | |
| Huntington Ingalls Industries, Inc. | | 52 | | | 14,559 | |
| L3Harris Technologies, Inc. | | 417 | | | 94,613 | |
| Lockheed Martin Corp. | | 617 | | | 334,365 | |
| Northrop Grumman Corp. | | 294 | | | 142,390 | |
| RTX Corp. | | 4,765 | | | 559,840 | |
| Textron, Inc. | | 534 | | | 49,609 | |
| TransDigm Group, Inc. | | 22 | | | 28,473 | |
| Woodward, Inc. | | 88 | | | 13,727 | |
| | | | 1,759,413 | |
| | | | |
| Agricultural & Farm Machinery - 0.3% | | | | |
| AGCO Corp. | | 205 | | | 19,356 | |
| CNH Industrial NV | | 3,152 | | | 33,569 | |
| Deere & Co. | | 314 | | | 116,802 | |
| Toro Co. | | 32 | | | 3,063 | |
| | | | 172,790 | |
| | | | |
| Agricultural Products & Services - 0.4% | | | | |
| Archer-Daniels-Midland Co. | | 1,775 | | | 110,068 | |
| Bunge Global SA | | 485 | | | 51,037 | |
Darling Ingredients, Inc. (a) | | 262 | | | 10,409 | |
| Ingredion, Inc. | | 274 | | | 34,077 | |
| | | | 205,591 | |
| | | | |
| Air Freight & Logistics - 1.2% | | | | |
| CH Robinson Worldwide, Inc. | | 382 | | | 34,017 | |
| Expeditors International of Washington, Inc. | | 190 | | | 23,716 | |
| FedEx Corp. | | 814 | | | 246,031 | |
GXO Logistics, Inc. (a) | | 109 | | | 6,102 | |
| United Parcel Service, Inc. - Class B | | 2,470 | | | 322,014 | |
| | | | 631,880 | |
| | | | |
The accompanying notes are an integral part of these financial statements.
83
| | |
| STRIVE 1000 VALUE ETF |
| SCHEDULE OF INVESTMENTS (CONTINUED) |
| July 31, 2024 |
| | | | | | | | | | | | | | |
| COMMON STOCKS - 95.6% (CONTINUED) | | Shares | | Value |
Aluminum - 0.0%(b) | | | | |
| Alcoa Corp. | | 395 | | | $ | 13,051 | |
| | | | |
| Apparel Retail - 0.1% | | | | |
| Gap, Inc. | | 819 | | | 19,230 | |
| Ross Stores, Inc. | | 63 | | | 9,024 | |
| | | | 28,254 | |
| | | | |
| Apparel, Accessories & Luxury Goods - 0.2% | | | | |
Capri Holdings Ltd. (a) | | 399 | | | 13,382 | |
| Columbia Sportswear Co. | | 65 | | | 5,311 | |
| Levi Strauss & Co. - Class A | | 247 | | | 4,528 | |
| PVH Corp. | | 151 | | | 15,400 | |
| Ralph Lauren Corp. | | 60 | | | 10,535 | |
| Tapestry, Inc. | | 788 | | | 31,591 | |
Under Armour, Inc. - Class A (a) | | 613 | | | 4,273 | |
Under Armour, Inc. - Class C (a) | | 629 | | | 4,271 | |
| VF Corp. | | 1,181 | | | 20,030 | |
| | | | 109,321 | |
| | | | |
| Application Software - 0.1% | | | | |
Altair Engineering, Inc. - Class A (a) | | 24 | | | 2,121 | |
Aspen Technology, Inc. (a) | | 13 | | | 2,443 | |
CCC Intelligent Solutions Holdings, Inc. (a) | | 214 | | | 2,196 | |
DoubleVerify Holdings, Inc. (a) | | 71 | | | 1,500 | |
Procore Technologies, Inc. (a) | | 8 | | | 568 | |
| Roper Technologies, Inc. | | 74 | | | 40,311 | |
| | | | 49,139 | |
| | | | |
| Asset Management & Custody Banks - 1.6% | | | | |
| Affiliated Managers Group, Inc. | | 118 | | | 21,903 | |
| Ameriprise Financial, Inc. | | 68 | | | 29,245 | |
| Bank of New York Mellon Corp. | | 2,667 | | | 173,542 | |
| BlackRock, Inc. | | 203 | | | 177,930 | |
| Blackstone, Inc. | | 395 | | | 56,149 | |
| Blue Owl Capital, Inc. - Class A | | 439 | | | 8,372 | |
| Carlyle Group, Inc. | | 810 | | | 40,289 | |
| Franklin Resources, Inc. | | 1,122 | | | 25,660 | |
| Invesco Ltd. | | 1,536 | | | 26,511 | |
| KKR & Co., Inc. | | 401 | | | 49,504 | |
| Northern Trust Corp. | | 756 | | | 67,019 | |
| SEI Investments Co. | | 118 | | | 8,005 | |
| State Street Corp. | | 986 | | | 83,781 | |
| T Rowe Price Group, Inc. | | 766 | | | 87,485 | |
The accompanying notes are an integral part of these financial statements.
84
| | |
| STRIVE 1000 VALUE ETF |
| SCHEDULE OF INVESTMENTS (CONTINUED) |
| July 31, 2024 |
| | | | | | | | | | | | | | |
| COMMON STOCKS - 95.6% (CONTINUED) | | Shares | | Value |
| Asset Management & Custody Banks - 1.6% (Continued) | | | | |
| TPG, Inc. | | 263 | | | $ | 13,410 | |
| | | | 868,805 | |
| | | | |
| Automobile Manufacturers - 0.9% | | | | |
| Ford Motor Co. | | 13,964 | | | 151,090 | |
| General Motors Co. | | 4,096 | | | 181,535 | |
Rivian Automotive, Inc. - Class A (a) | | 1,172 | | | 19,233 | |
| Stellantis NV | | 7,490 | | | 125,008 | |
| Thor Industries, Inc. | | 185 | | | 19,636 | |
| | | | 496,502 | |
| | | | |
| Automotive Parts & Equipment - 0.2% | | | | |
Aptiv PLC (a) | | 615 | | | 42,675 | |
| BorgWarner, Inc. | | 787 | | | 27,789 | |
| Gentex Corp. | | 384 | | | 11,927 | |
| Lear Corp. | | 197 | | | 24,042 | |
| | | | 106,433 | |
| | | | |
| Automotive Retail - 0.2% | | | | |
| Advance Auto Parts, Inc. | | 193 | | | 12,223 | |
AutoNation, Inc. (a) | | 122 | | | 23,268 | |
CarMax, Inc. (a) | | 386 | | | 32,594 | |
| Lithia Motors, Inc. | | 103 | | | 28,462 | |
| Murphy USA, Inc. | | 8 | | | 4,039 | |
| Penske Automotive Group, Inc. | | 65 | | | 11,317 | |
Valvoline, Inc. (a) | | 53 | | | 2,464 | |
| | | | 114,367 | |
| | | | |
| Biotechnology - 2.7% | | | | |
| AbbVie, Inc. | | 3,566 | | | 660,851 | |
| Amgen, Inc. | | 956 | | | 317,841 | |
Biogen, Inc. (a) | | 406 | | | 86,559 | |
CRISPR Therapeutics AG (a) | | 63 | | | 3,609 | |
Cytokinetics, Inc. (a) | | 340 | | | 20,064 | |
| Gilead Sciences, Inc. | | 4,513 | | | 343,259 | |
GRAIL, Inc. (a) | | 60 | | | 923 | |
Ionis Pharmaceuticals, Inc. (a) | | 429 | | | 21,218 | |
Vaxcyte, Inc. (a) | | 32 | | | 2,525 | |
| | | | 1,456,849 | |
| | | | |
| Brewers - 0.1% | | | | |
Boston Beer Co., Inc. - Class A (a) | | 2 | | | 560 | |
| Molson Coors Beverage Co. - Class B | | 602 | | | 31,816 | |
| | | | 32,376 | |
| | | | |
The accompanying notes are an integral part of these financial statements.
85
| | |
| STRIVE 1000 VALUE ETF |
| SCHEDULE OF INVESTMENTS (CONTINUED) |
| July 31, 2024 |
| | | | | | | | | | | | | | |
| COMMON STOCKS - 95.6% (CONTINUED) | | Shares | | Value |
| Broadcasting - 0.2% | | | | |
| Fox Corp. - Class A | | 945 | | | $ | 35,948 | |
| Fox Corp. - Class B | | 418 | | | 14,810 | |
| Nexstar Media Group, Inc. | | 81 | | | 14,968 | |
| Paramount Global - Class A | | 13 | | | 298 | |
| Paramount Global - Class B | | 1,704 | | | 19,459 | |
| | | | 85,483 | |
| | | | |
| Broadline Retail - 0.2% | | | | |
| Dillard's, Inc. - Class A | | 20 | | | 7,972 | |
| eBay, Inc. | | 1,728 | | | 96,094 | |
| Macy's, Inc. | | 970 | | | 16,761 | |
| | | | 120,827 | |
| | | | |
| Building Products - 0.6% | | | | |
| A O Smith Corp. | | 38 | | | 3,232 | |
| Allegion PLC | | 72 | | | 9,850 | |
| Armstrong World Industries, Inc. | | 36 | | | 4,730 | |
Builders FirstSource, Inc. (a) | | 114 | | | 19,080 | |
| Carlisle Cos., Inc. | | 14 | | | 5,860 | |
| Carrier Global Corp. | | 638 | | | 43,454 | |
| Fortune Brands Innovations, Inc. | | 379 | | | 30,627 | |
| Johnson Controls International PLC | | 1,624 | | | 116,181 | |
| Masco Corp. | | 417 | | | 32,464 | |
| Owens Corning | | 245 | | | 45,663 | |
| UFP Industries, Inc. | | 121 | | | 15,964 | |
| | | | 327,105 | |
| | | | |
| Cable & Satellite - 1.3% | | | | |
| Cable One, Inc. | | 11 | | | 4,547 | |
Charter Communications, Inc. - Class A (a) | | 218 | | | 82,779 | |
| Comcast Corp. - Class A | | 14,163 | | | 584,507 | |
Liberty Media Corp.-Liberty SiriusXM (a) | | 577 | | | 12,988 | |
Liberty Media Corp.-Liberty SiriusXM – Class A (a) | | 236 | | | 5,338 | |
| Sirius XM Holdings, Inc. | | 1,672 | | | 5,769 | |
| | | | 695,928 | |
| | | | |
| Cargo Ground Transportation - 0.1% | | | | |
| Knight-Swift Transportation Holdings, Inc. | | 373 | | | 20,302 | |
| Landstar System, Inc. | | 17 | | | 3,234 | |
| U-Haul Holding Co. | | 263 | | | 16,761 | |
U-Haul Holding Co. – Class B (a) | | 7 | | | 468 | |
XPO, Inc. (a) | | 325 | | | 37,339 | |
| | | | 78,104 | |
| | | | |
The accompanying notes are an integral part of these financial statements.
86
| | |
| STRIVE 1000 VALUE ETF |
| SCHEDULE OF INVESTMENTS (CONTINUED) |
| July 31, 2024 |
| | | | | | | | | | | | | | |
| COMMON STOCKS - 95.6% (CONTINUED) | | Shares | | Value |
| Casinos & Gaming - 0.2% | | | | |
| Boyd Gaming Corp. | | 210 | | | $ | 12,783 | |
Caesars Entertainment, Inc. (a) | | 440 | | | 17,578 | |
| International Game Technology PLC | | 378 | | | 8,872 | |
| Las Vegas Sands Corp. | | 1,338 | | | 53,079 | |
MGM Resorts International (a) | | 392 | | | 16,844 | |
Penn Entertainment, Inc. (a) | | 556 | | | 11,103 | |
| Wynn Resorts Ltd. | | 115 | | | 9,524 | |
| | | | 129,783 | |
| | | | |
| Commercial & Residential Mortgage Finance - 0.1% | | | | |
| Essent Group Ltd. | | 380 | | | 23,879 | |
| MGIC Investment Corp. | | 972 | | | 24,144 | |
| Radian Group, Inc. | | 558 | | | 20,702 | |
| UWM Holdings Corp. | | 77 | | | 647 | |
| | | | 69,372 | |
| | | | |
| Commodity Chemicals - 0.4% | | | | |
| Dow, Inc. | | 2,468 | | | 134,432 | |
| LyondellBasell Industries NV - Class A | | 931 | | | 92,597 | |
| Olin Corp. | | 30 | | | 1,368 | |
| Westlake Corp. | | 33 | | | 4,880 | |
| | | | 233,277 | |
| | | | |
| Communications Equipment - 1.1% | | | | |
Ciena Corp. (a) | | 199 | | | 10,495 | |
| Cisco Systems, Inc. | | 10,935 | | | 529,801 | |
F5, Inc. (a) | | 56 | | | 11,404 | |
| Juniper Networks, Inc. | | 949 | | | 35,768 | |
Lumentum Holdings, Inc. (a) | | 64 | | | 3,314 | |
| | | | 590,782 | |
| | | | |
| Computer & Electronics Retail - 0.1% | | | | |
| Best Buy Co., Inc. | | 675 | | | 58,401 | |
GameStop Corp. - Class A (a) | | 250 | | | 5,667 | |
| | | | 64,068 | |
| | | | |
| Construction & Engineering - 0.1% | | | | |
| AECOM | | 175 | | | 15,857 | |
| EMCOR Group, Inc. | | 20 | | | 7,509 | |
MasTec, Inc. (a) | | 208 | | | 22,886 | |
| MDU Resources Group, Inc. | | 635 | | | 17,107 | |
| Valmont Industries, Inc. | | 20 | | | 5,967 | |
| | | | 69,326 | |
| | | | |
The accompanying notes are an integral part of these financial statements.
87
| | |
| STRIVE 1000 VALUE ETF |
| SCHEDULE OF INVESTMENTS (CONTINUED) |
| July 31, 2024 |
| | | | | | | | | | | | | | |
| COMMON STOCKS - 95.6% (CONTINUED) | | Shares | | Value |
| Construction Machinery & Heavy Transportation Equipment - 1.0% | | | | |
| Allison Transmission Holdings, Inc. | | 296 | | | $ | 26,223 | |
| Caterpillar, Inc. | | 460 | | | 159,252 | |
| Cummins, Inc. | | 507 | | | 147,943 | |
| Oshkosh Corp. | | 270 | | | 29,335 | |
| Paccar, Inc. | | 1,766 | | | 174,233 | |
| Westinghouse Air Brake Technologies Corp. | | 225 | | | 36,259 | |
| | | | 573,245 | |
| | | | |
| Construction Materials - 0.4% | | | | |
| CRH PLC | | 2,449 | | | 209,879 | |
| | | | |
| Consumer Electronics - 0.1% | | | | |
| Garmin Ltd. | | 211 | | | 36,134 | |
| | | | |
| Consumer Finance - 1.3% | | | | |
| Ally Financial, Inc. | | 976 | | | 43,930 | |
| American Express Co. | | 786 | | | 198,889 | |
| Capital One Financial Corp. | | 1,297 | | | 196,366 | |
Credit Acceptance Corp. (a) | | 13 | | | 7,474 | |
| Discover Financial Services | | 860 | | | 123,831 | |
| OneMain Holdings, Inc. | | 399 | | | 20,852 | |
| SLM Corp. | | 771 | | | 17,494 | |
SoFi Technologies, Inc. (a) | | 3,071 | | | 23,155 | |
| Synchrony Financial | | 1,491 | | | 75,728 | |
| | | | 707,719 | |
| | | | |
| Consumer Staples Merchandise Retail - 2.4% | | | | |
BJ's Wholesale Club Holdings, Inc. (a) | | 252 | | | 22,166 | |
| Costco Wholesale Corp. | | 186 | | | 152,892 | |
| Dollar General Corp. | | 667 | | | 80,300 | |
Dollar Tree, Inc. (a) | | 321 | | | 33,493 | |
| Target Corp. | | 1,672 | | | 251,486 | |
| Walmart, Inc. | | 11,319 | | | 776,936 | |
| | | | 1,317,273 | |
| | | | |
| Copper - 0.1% | | | | |
| Freeport-McMoRan, Inc. | | 849 | | | 38,553 | |
| | | | |
| Data Processing & Outsourced Services - 0.1% | | | | |
| Concentrix Corp. | | 194 | | | 13,677 | |
| Genpact Ltd. | | 448 | | | 15,532 | |
| Maximus, Inc. | | 86 | | | 7,988 | |
| SS&C Technologies Holdings, Inc. | | 389 | | | 28,378 | |
| | | | 65,575 | |
| | | | |
The accompanying notes are an integral part of these financial statements.
88
| | |
| STRIVE 1000 VALUE ETF |
| SCHEDULE OF INVESTMENTS (CONTINUED) |
| July 31, 2024 |
| | | | | | | | | | | | | | |
| COMMON STOCKS - 95.6% (CONTINUED) | | Shares | | Value |
| Distillers & Vintners - 0.2% | | | | |
| Brown-Forman Corp. - Class A | | 1 | | | $ | 45 | |
| Brown-Forman Corp. - Class B | | 93 | | | 4,200 | |
| Constellation Brands, Inc. - Class A | | 380 | | | 93,161 | |
| | | | 97,406 | |
| | | | |
| Distributors - 0.2% | | | | |
| Genuine Parts Co. | | 379 | | | 55,755 | |
| LKQ Corp. | | 941 | | | 39,051 | |
| | | | 94,806 | |
| | | | |
| Diversified Banks - 9.3% | | | | |
| Bank of America Corp. | | 24,537 | | | 989,087 | |
| Citigroup, Inc. | | 6,618 | | | 429,376 | |
| Comerica, Inc. | | 548 | | | 30,036 | |
| Fifth Third Bancorp | | 2,427 | | | 102,759 | |
| First Citizens BancShares, Inc. - Class A | | 22 | | | 45,929 | |
| JPMorgan Chase & Co. | | 10,223 | | | 2,175,454 | |
| KeyCorp | | 3,354 | | | 54,100 | |
| PNC Financial Services Group, Inc. | | 1,419 | | | 256,981 | |
| US Bancorp | | 5,416 | | | 243,070 | |
| Wells Fargo & Co. | | 12,600 | | | 747,684 | |
| | | | 5,074,476 | |
| | | | |
Diversified Chemicals - 0.0%(b) | | | | |
| Huntsman Corp. | | 586 | | | 14,023 | |
| | | | |
| Diversified Financial Services - 0.2% | | | | |
| Corebridge Financial, Inc. | | 822 | | | 24,290 | |
| Equitable Holdings, Inc. | | 1,189 | | | 51,852 | |
| Voya Financial, Inc. | | 370 | | | 26,910 | |
| | | | 103,052 | |
| | | | |
| Drug Retail - 0.1% | | | | |
| Walgreens Boots Alliance, Inc. | | 2,487 | | | 29,521 | |
| | | | |
Education Services - 0.0%(b) | | | | |
Bright Horizons Family Solutions, Inc. (a) | | 27 | | | 3,247 | |
| | | | |
| Electric Utilities - 4.2% | | | | |
| Alliant Energy Corp. | | 985 | | | 54,825 | |
| American Electric Power Co., Inc. | | 1,890 | | | 185,447 | |
| Avangrid, Inc. | | 219 | | | 7,812 | |
| Duke Energy Corp. | | 2,743 | | | 299,728 | |
| Edison International | | 1,439 | | | 115,134 | |
The accompanying notes are an integral part of these financial statements.
89
| | |
| STRIVE 1000 VALUE ETF |
| SCHEDULE OF INVESTMENTS (CONTINUED) |
| July 31, 2024 |
| | | | | | | | | | | | | | |
| COMMON STOCKS - 95.6% (CONTINUED) | | Shares | | Value |
| Electric Utilities - 4.2% (Continued) | | | | |
| Entergy Corp. | | 750 | | | $ | 86,977 | |
| Evergy, Inc. | | 777 | | | 45,066 | |
| Eversource Energy | | 1,315 | | | 85,357 | |
| Exelon Corp. | | 3,555 | | | 132,246 | |
| FirstEnergy Corp. | | 1,906 | | | 79,880 | |
| Idacorp, Inc. | | 138 | | | 13,490 | |
| NextEra Energy, Inc. | | 4,901 | | | 374,387 | |
| NRG Energy, Inc. | | 779 | | | 58,557 | |
| OGE Energy Corp. | | 661 | | | 25,627 | |
| PG&E Corp. | | 7,468 | | | 136,291 | |
| Pinnacle West Capital Corp. | | 398 | | | 34,065 | |
| PNM Resources, Inc. | | 301 | | | 12,516 | |
| Portland General Electric Co. | | 297 | | | 14,072 | |
| PPL Corp. | | 2,612 | | | 77,629 | |
| Southern Co. | | 3,924 | | | 327,732 | |
| Xcel Energy, Inc. | | 2,044 | | | 119,124 | |
| | | | 2,285,962 | |
| | | | |
| Electrical Components & Equipment - 0.5% | | | | |
| Acuity Brands, Inc. | | 60 | | | 15,081 | |
| AMETEK, Inc. | | 18 | | | 3,123 | |
| Eaton Corp. PLC | | 143 | | | 43,585 | |
| Emerson Electric Co. | | 1,241 | | | 145,334 | |
Generac Holdings, Inc. (a) | | 1 | | | 156 | |
| Hubbell, Inc. | | 10 | | | 3,956 | |
| nVent Electric PLC | | 63 | | | 4,576 | |
| Regal Rexnord Corp. | | 202 | | | 32,457 | |
| Sensata Technologies Holding PLC | | 665 | | | 25,928 | |
Sunrun, Inc. (a) | | 421 | | | 7,380 | |
| | | | 281,576 | |
| | | | |
| Electronic Components - 0.2% | | | | |
Coherent Corp. (a) | | 380 | | | 26,478 | |
| Corning, Inc. | | 2,695 | | | 107,827 | |
| Littelfuse, Inc. | | 1 | | | 267 | |
| | | | 134,572 | |
| | | | |
| Electronic Equipment & Instruments - 0.1% | | | | |
| Crane NXT Co. | | 156 | | | 9,809 | |
Teledyne Technologies, Inc. (a) | | 22 | | | 9,281 | |
Trimble, Inc. (a) | | 81 | | | 4,418 | |
| Vontier Corp. | | 237 | | | 9,298 | |
Zebra Technologies Corp. - Class A (a) | | 1 | | | 351 | |
| | | | 33,157 | |
| | | | |
The accompanying notes are an integral part of these financial statements.
90
| | |
| STRIVE 1000 VALUE ETF |
| SCHEDULE OF INVESTMENTS (CONTINUED) |
| July 31, 2024 |
| | | | | | | | | | | | | | |
| COMMON STOCKS - 95.6% (CONTINUED) | | Shares | | Value |
| Electronic Manufacturing Services - 0.3% | | | | |
Flex Ltd. (a) | | 1,515 | | | $ | 48,707 | |
IPG Photonics Corp. (a) | | 13 | | | 1,045 | |
| Jabil, Inc. | | 213 | | | 23,999 | |
| TE Connectivity Ltd. | | 556 | | | 85,808 | |
| | | | 159,559 | |
| | | | |
| Environmental & Facilities Services - 0.1% | | | | |
| Republic Services, Inc. | | 28 | | | 5,441 | |
Stericycle, Inc. (a) | | 208 | | | 12,178 | |
| Waste Management, Inc. | | 103 | | | 20,874 | |
| | | | 38,493 | |
| | | | |
| Fertilizers & Agricultural Chemicals - 0.2% | | | | |
| CF Industries Holdings, Inc. | | 74 | | | 5,653 | |
| Corteva, Inc. | | 642 | | | 36,016 | |
| FMC Corp. | | 418 | | | 24,394 | |
| Mosaic Co. | | 1,150 | | | 34,236 | |
| Scotts Miracle-Gro Co. | | 191 | | | 15,013 | |
| | | | 115,312 | |
| | | | |
| Financial Exchanges & Data - 0.5% | | | | |
| CME Group, Inc. | | 927 | | | 179,569 | |
| Intercontinental Exchange, Inc. | | 414 | | | 62,746 | |
| Nasdaq, Inc. | | 389 | | | 26,328 | |
| | | | 268,643 | |
| | | | |
| Food Distributors - 0.3% | | | | |
Performance Food Group Co. (a) | | 568 | | | 39,192 | |
| Sysco Corp. | | 1,440 | | | 110,376 | |
US Foods Holding Corp. (a) | | 741 | | | 40,303 | |
| | | | 189,871 | |
| | | | |
Food Products - 0.0%(b) | | | | |
| Lamb Weston Holdings, Inc. | | 1 | | | 60 | |
| | | | |
| Food Retail - 0.3% | | | | |
| Albertsons Cos., Inc. - Class A | | 1,110 | | | 22,011 | |
| Casey's General Stores, Inc. | | 51 | | | 19,780 | |
| Kroger Co. | | 2,374 | | | 129,383 | |
| | | | 171,174 | |
| | | | |
Footwear - 0.0%(b) | | | | |
Crocs, Inc. (a) | | 36 | | | 4,837 | |
Skechers USA, Inc. - Class A (a) | | 223 | | | 14,524 | |
| | | | 19,361 | |
| | | | |
The accompanying notes are an integral part of these financial statements.
91
| | |
| STRIVE 1000 VALUE ETF |
| SCHEDULE OF INVESTMENTS (CONTINUED) |
| July 31, 2024 |
| | | | | | | | | | | | | | |
| COMMON STOCKS - 95.6% (CONTINUED) | | Shares | | Value |
| Gas Utilities - 0.2% | | | | |
| Atmos Energy Corp. | | 509 | | | $ | 65,091 | |
| National Fuel Gas Co. | | 306 | | | 17,928 | |
| UGI Corp. | | 747 | | | 18,511 | |
| | | | 101,530 | |
| | | | |
| Gold - 0.4% | | | | |
| Newmont Corp. | | 4,096 | | | 200,991 | |
| Royal Gold, Inc. | | 1 | | | 138 | |
| | | | 201,129 | |
| | | | |
| Health Care Distributors - 1.0% | | | | |
| Cardinal Health, Inc. | | 896 | | | 90,344 | |
| Cencora, Inc. | | 612 | | | 145,582 | |
Henry Schein, Inc. (a) | | 268 | | | 19,280 | |
| McKesson Corp. | | 456 | | | 281,361 | |
| | | | 536,567 | |
| | | | |
| Health Care Equipment - 1.3% | | | | |
| Abbott Laboratories | | 631 | | | 66,848 | |
| Baxter International, Inc. | | 1,757 | | | 62,936 | |
| Becton Dickinson & Co. | | 376 | | | 90,638 | |
Envista Holdings Corp. (a) | | 591 | | | 10,088 | |
| GE HealthCare Technologies, Inc. | | 187 | | | 15,826 | |
Globus Medical, Inc. - Class A (a) | | 1 | | | 72 | |
Hologic, Inc. (a) | | 252 | | | 20,566 | |
Integra LifeSciences Holdings Corp. (a) | | 74 | | | 1,836 | |
| Medtronic PLC | | 4,377 | | | 351,561 | |
QuidelOrtho Corp. (a) | | 4 | | | 157 | |
| STERIS PLC | | 1 | | | 239 | |
| Teleflex, Inc. | | 37 | | | 8,174 | |
| Zimmer Biomet Holdings, Inc. | | 505 | | | 56,232 | |
| | | | 685,173 | |
| | | | |
| Health Care Facilities - 0.5% | | | | |
Acadia Healthcare Co., Inc. (a) | | 79 | | | 5,123 | |
| Encompass Health Corp. | | 253 | | | 23,514 | |
| HCA Healthcare, Inc. | | 442 | | | 160,468 | |
Tenet Healthcare Corp. (a) | | 326 | | | 48,802 | |
| Universal Health Services, Inc. - Class B | | 202 | | | 43,180 | |
| | | | 281,087 | |
| | | | |
| Health Care Services - 1.4% | | | | |
| Cigna Group | | 1,005 | | | 350,413 | |
| CVS Health Corp. | | 4,535 | | | 273,597 | |
The accompanying notes are an integral part of these financial statements.
92
| | |
| STRIVE 1000 VALUE ETF |
| SCHEDULE OF INVESTMENTS (CONTINUED) |
| July 31, 2024 |
| | | | | | | | | | | | | | |
| COMMON STOCKS - 95.6% (CONTINUED) | | Shares | | Value |
| Health Care Services - 1.4% (Continued) | | | | |
DaVita, Inc. (a) | | 142 | | | $ | 19,400 | |
| Labcorp Holdings, Inc. | | 299 | | | 64,417 | |
| Quest Diagnostics, Inc. | | 314 | | | 44,682 | |
R1 RCM, Inc. (a) | | 299 | | | 3,851 | |
| | | | 756,360 | |
| | | | |
| Health Care Supplies - 0.1% | | | | |
| Cooper Cos., Inc. | | 21 | | | 1,960 | |
| Dentsply Sirona, Inc. | | 446 | | | 12,105 | |
Solventum Corp. (a) | | 455 | | | 26,790 | |
| | | | 40,855 | |
| | | | |
Health Care Technology - 0.0%(b) | | | | |
Doximity, Inc. - Class A (a) | | 1 | | | 28 | |
| | | | |
| Heavy Electrical Equipment - 0.1% | | | | |
GE Vernova, Inc. (a) | | 452 | | | 80,564 | |
| | | | |
| Home Furnishings - 0.1% | | | | |
| Leggett & Platt, Inc. | | 418 | | | 5,505 | |
Mohawk Industries, Inc. (a) | | 190 | | | 30,603 | |
| | | | 36,108 | |
| | | | |
| Home Improvement Retail - 1.1% | | | | |
| Home Depot, Inc. | | 1,029 | | | 378,837 | |
| Lowe's Cos., Inc. | | 973 | | | 238,881 | |
| | | | 617,718 | |
| | | | |
| Homebuilding - 0.8% | | | | |
| DR Horton, Inc. | | 598 | | | 107,598 | |
| Lennar Corp. - Class A | | 799 | | | 141,367 | |
| Lennar Corp. - Class B | | 18 | | | 2,969 | |
NVR, Inc. (a) | | 3 | | | 25,823 | |
| PulteGroup, Inc. | | 694 | | | 91,608 | |
| Toll Brothers, Inc. | | 380 | | | 54,230 | |
| | | | 423,595 | |
| | | | |
| Homefurnishing Retail - 0.1% | | | | |
RH (a) | | 18 | | | 5,221 | |
Wayfair, Inc. - Class A (a) | | 422 | | | 22,970 | |
| Williams-Sonoma, Inc. | | 191 | | | 29,544 | |
| | | | 57,735 | |
| | | | |
The accompanying notes are an integral part of these financial statements.
93
| | |
| STRIVE 1000 VALUE ETF |
| SCHEDULE OF INVESTMENTS (CONTINUED) |
| July 31, 2024 |
| | | | | | | | | | | | | | |
| COMMON STOCKS - 95.6% (CONTINUED) | | Shares | | Value |
| Hotels, Resorts & Cruise Lines - 0.4% | | | | |
Carnival Corp. (a) | | 3,551 | | | $ | 59,160 | |
| Choice Hotels International, Inc. | | 1 | | | 127 | |
Expedia Group, Inc. (a) | | 21 | | | 2,681 | |
| Marriott Vacations Worldwide Corp. | | 92 | | | 7,781 | |
Norwegian Cruise Line Holdings Ltd. (a) | | 1,542 | | | 28,419 | |
Royal Caribbean Cruises Ltd. (a) | | 482 | | | 75,539 | |
| Travel + Leisure Co. | | 220 | | | 10,140 | |
| Wyndham Hotels & Resorts, Inc. | | 190 | | | 14,387 | |
| | | | 198,234 | |
| | | | |
Household Appliances - 0.0%(b) | | | | |
| Whirlpool Corp. | | 190 | | | 19,374 | |
| | | | |
| Household Products - 1.5% | | | | |
| Church & Dwight Co., Inc. | | 206 | | | 20,190 | |
| Clorox Co. | | 323 | | | 42,613 | |
| Colgate-Palmolive Co. | | 1,429 | | | 141,742 | |
| Kimberly-Clark Corp. | | 1,015 | | | 137,076 | |
| Procter & Gamble Co. | | 3,093 | | | 497,231 | |
| Reynolds Consumer Products, Inc. | | 311 | | | 8,652 | |
| | | | 847,504 | |
| | | | |
Housewares & Specialties - 0.0%(b) | | | | |
| Newell Brands, Inc. | | 1,370 | | | 11,768 | |
| | | | |
| Human Resource & Employment Services - 0.1% | | | | |
| ManpowerGroup, Inc. | | 114 | | | 8,730 | |
| Paychex, Inc. | | 246 | | | 31,493 | |
| Robert Half, Inc. | | 224 | | | 14,379 | |
| | | | 54,602 | |
| | | | |
| Independent Power Producers & Energy Traders - 0.1% | | | | |
| AES Corp. | | 2,499 | | | 44,457 | |
| Vistra Corp. | | 50 | | | 3,961 | |
| | | | 48,418 | |
| | | | |
| Industrial Conglomerates - 0.8% | | | | |
| 3M Co. | | 1,998 | | | 254,845 | |
| Honeywell International, Inc. | | 939 | | | 192,260 | |
| | | | 447,105 | |
| | | | |
| Industrial Gases - 0.1% | | | | |
| Air Products and Chemicals, Inc. | | 232 | | | 61,213 | |
| | | | |
The accompanying notes are an integral part of these financial statements.
94
| | |
| STRIVE 1000 VALUE ETF |
| SCHEDULE OF INVESTMENTS (CONTINUED) |
| July 31, 2024 |
| | | | | | | | | | | | | | |
| COMMON STOCKS - 95.6% (CONTINUED) | | Shares | | Value |
| Industrial Machinery & Supplies & Components - 0.7% | | | | |
| Crane Co. | | 17 | | | $ | 2,727 | |
| Donaldson Co., Inc. | | 210 | | | 15,712 | |
| Dover Corp. | | 141 | | | 25,981 | |
| Flowserve Corp. | | 211 | | | 10,666 | |
| Fortive Corp. | | 574 | | | 41,242 | |
Gates Industrial Corp. PLC (a) | | 581 | | | 10,801 | |
| IDEX Corp. | | 1 | | | 209 | |
| Illinois Tool Works, Inc. | | 207 | | | 51,187 | |
| ITT, Inc. | | 51 | | | 7,214 | |
Middleby Corp. (a) | | 90 | | | 12,202 | |
| Otis Worldwide Corp. | | 301 | | | 28,445 | |
| Parker-Hannifin Corp. | | 24 | | | 13,468 | |
| Pentair PLC | | 98 | | | 8,611 | |
| Snap-on, Inc. | | 106 | | | 30,425 | |
| Stanley Black & Decker, Inc. | | 594 | | | 62,738 | |
| Timken Co. | | 213 | | | 18,520 | |
| Xylem, Inc. | | 271 | | | 36,179 | |
| | | | 376,327 | |
| | | | |
| Insurance Brokers - 0.2% | | | | |
| Aon PLC - Class A | | 115 | | | 37,779 | |
| Marsh & McLennan Cos., Inc. | | 22 | | | 4,897 | |
| Willis Towers Watson PLC | | 148 | | | 41,777 | |
| | | | 84,453 | |
| | | | |
| Integrated Oil & Gas - 5.4% | | | | |
| Chevron Corp. | | 6,190 | | | 993,309 | |
| Exxon Mobil Corp. | | 15,742 | | | 1,866,844 | |
| Occidental Petroleum Corp. | | 1,718 | | | 104,489 | |
| | | | 2,964,642 | |
| | | | |
| Integrated Telecommunication Services - 2.0% | | | | |
| AT&T, Inc. | | 25,811 | | | 496,862 | |
Frontier Communications Parent, Inc. (a) | | 808 | | | 23,674 | |
| Verizon Communications, Inc. | | 13,908 | | | 563,552 | |
| | | | 1,084,088 | |
| | | | |
| Interactive Home Entertainment - 0.1% | | | | |
| Electronic Arts, Inc. | | 217 | | | 32,754 | |
Roblox Corp. - Class A (a) | | 1 | | | 42 | |
Take-Two Interactive Software, Inc. (a) | | 142 | | | 21,375 | |
| | | | 54,171 | |
| | | | |
The accompanying notes are an integral part of these financial statements.
95
| | |
| STRIVE 1000 VALUE ETF |
| SCHEDULE OF INVESTMENTS (CONTINUED) |
| July 31, 2024 |
| | | | | | | | | | | | | | |
| COMMON STOCKS - 95.6% (CONTINUED) | | Shares | | Value |
| Interactive Media & Services - 0.1% | | | | |
IAC, Inc. (a) | | 108 | | | $ | 5,703 | |
Match Group, Inc. (a) | | 748 | | | 28,529 | |
Ziff Davis, Inc. (a) | | 92 | | | 4,405 | |
| | | | 38,637 | |
| | | | |
Internet Services & Infrastructure - 0.0%(b) | | | | |
Akamai Technologies, Inc. (a) | | 18 | | | 1,769 | |
| | | | |
| Investment Banking & Brokerage - 2.3% | | | | |
| Charles Schwab Corp. | | 1,534 | | | 100,001 | |
| Evercore, Inc. - Class A | | 41 | | | 10,266 | |
| Goldman Sachs Group, Inc. | | 1,119 | | | 569,605 | |
| Interactive Brokers Group, Inc. - Class A | | 149 | | | 17,771 | |
| Jefferies Financial Group, Inc. | | 516 | | | 30,171 | |
| Lazard, Inc. | | 381 | | | 18,734 | |
| Morgan Stanley | | 4,440 | | | 458,252 | |
| Raymond James Financial, Inc. | | 185 | | | 21,460 | |
Robinhood Markets, Inc. - Class A (a) | | 266 | | | 5,472 | |
| Stifel Financial Corp. | | 397 | | | 35,202 | |
| | | | 1,266,934 | |
| | | | |
| IT Consulting & Other Services - 1.4% | | | | |
| Amdocs Ltd. | | 241 | | | 21,080 | |
| Cognizant Technology Solutions Corp. - Class A | | 982 | | | 74,318 | |
DXC Technology Co. (a) | | 745 | | | 15,153 | |
| International Business Machines Corp. | | 3,279 | | | 630,027 | |
| | | | 740,578 | |
| | | | |
Leisure Facilities - 0.0%(b) | | | | |
| Vail Resorts, Inc. | | 23 | | | 4,186 | |
| | | | |
| Leisure Products - 0.1% | | | | |
| Brunswick Corp. | | 108 | | | 8,797 | |
| Hasbro, Inc. | | 470 | | | 30,296 | |
Mattel, Inc. (a) | | 188 | | | 3,627 | |
| Polaris, Inc. | | 198 | | | 16,489 | |
| | | | 59,209 | |
| | | | |
| Life & Health Insurance - 1.3% | | | | |
| Aflac, Inc. | | 2,056 | | | 196,101 | |
| Globe Life, Inc. | | 333 | | | 30,882 | |
| Lincoln National Corp. | | 572 | | | 19,048 | |
| MetLife, Inc. | | 2,152 | | | 165,381 | |
| Primerica, Inc. | | 81 | | | 20,393 | |
The accompanying notes are an integral part of these financial statements.
96
| | |
| STRIVE 1000 VALUE ETF |
| SCHEDULE OF INVESTMENTS (CONTINUED) |
| July 31, 2024 |
| | | | | | | | | | | | | | |
| COMMON STOCKS - 95.6% (CONTINUED) | | Shares | | Value |
| Life & Health Insurance - 1.3% (Continued) | | | | |
| Principal Financial Group, Inc. | | 801 | | | $ | 65,290 | |
| Prudential Financial, Inc. | | 1,265 | | | 158,530 | |
| Unum Group | | 583 | | | 33,540 | |
| | | | 689,165 | |
| | | | |
| Life Sciences Tools & Services - 0.1% | | | | |
Bio-Rad Laboratories, Inc. - Class A (a) | | 20 | | | 6,767 | |
ICON PLC (a) | | 39 | | | 12,809 | |
Illumina, Inc. (a) | | 406 | | | 49,776 | |
| Revvity, Inc. | | 73 | | | 9,169 | |
| | | | 78,521 | |
| | | | |
| Managed Health Care - 1.8% | | | | |
Centene Corp. (a) | | 1,878 | | | 144,456 | |
| Elevance Health, Inc. | | 596 | | | 317,090 | |
HealthEquity, Inc. (a) | | 14 | | | 1,099 | |
| Humana, Inc. | | 324 | | | 117,161 | |
Molina Healthcare, Inc. (a) | | 62 | | | 21,159 | |
| UnitedHealth Group, Inc. | | 697 | | | 401,583 | |
| | | | 1,002,548 | |
| | | | |
| Metal, Glass & Plastic Containers - 0.2% | | | | |
| AptarGroup, Inc. | | 106 | | | 15,580 | |
| Ball Corp. | | 565 | | | 36,064 | |
| Berry Global Group, Inc. | | 393 | | | 25,828 | |
| Crown Holdings, Inc. | | 324 | | | 28,739 | |
| | | | 106,211 | |
| | | | |
Motorcycle Manufacturers - 0.0%(b) | | | | |
| Harley-Davidson, Inc. | | 417 | | | 15,638 | |
| | | | |
| Movies & Entertainment - 0.9% | | | | |
| Endeavor Group Holdings, Inc. - Class A | | 373 | | | 10,228 | |
Liberty Media Corp.-Liberty Live - Class A (a) | | 1 | | | 38 | |
Liberty Media Corp.-Liberty Live - Class C (a) | | 1 | | | 39 | |
Madison Square Garden Sports Corp. (a) | | 17 | | | 3,407 | |
Roku, Inc. (a) | | 255 | | | 14,843 | |
| TKO Group Holdings, Inc. | | 77 | | | 8,420 | |
| Walt Disney Co. | | 4,087 | | | 382,911 | |
Warner Bros Discovery, Inc. (a) | | 7,983 | | | 69,053 | |
| | | | 488,939 | |
| | | | |
| Multi-line Insurance - 0.4% | | | | |
| American International Group, Inc. | | 2,468 | | | 195,540 | |
| | | | |
The accompanying notes are an integral part of these financial statements.
97
| | |
| STRIVE 1000 VALUE ETF |
| SCHEDULE OF INVESTMENTS (CONTINUED) |
| July 31, 2024 |
| | | | | | | | | | | | | | |
| COMMON STOCKS - 95.6% (CONTINUED) | | Shares | | Value |
| Multi-Sector Holdings - 1.3% | | | | |
Berkshire Hathaway, Inc. - Class B (a) | | 1,680 | | | $ | 736,680 | |
| | | | |
| Multi-Utilities - 1.9% | | | | |
| Ameren Corp. | | 931 | | | 73,800 | |
| Black Hills Corp. | | 208 | | | 12,283 | |
| CenterPoint Energy, Inc. | | 2,244 | | | 62,271 | |
| CMS Energy Corp. | | 1,126 | | | 72,965 | |
| Consolidated Edison, Inc. | | 1,262 | | | 123,070 | |
| Dominion Energy, Inc. | | 2,990 | | | 159,845 | |
| DTE Energy Co. | | 638 | | | 76,898 | |
| NiSource, Inc. | | 1,592 | | | 49,750 | |
| Public Service Enterprise Group, Inc. | | 1,811 | | | 144,464 | |
| Sempra | | 2,237 | | | 179,094 | |
| WEC Energy Group, Inc. | | 1,069 | | | 91,998 | |
| | | | 1,046,438 | |
| | | | |
Office Services & Supplies - 0.0%(b) | | | | |
| MSA Safety, Inc. | | 19 | | | 3,584 | |
| | | | |
Oil & Gas Drilling - 0.0%(b) | | | | |
Transocean Ltd. (a) | | 2,507 | | | 14,516 | |
| | | | |
| Oil & Gas Equipment & Services - 0.5% | | | | |
| Baker Hughes Co. | | 3,580 | | | 138,618 | |
| ChampionX Corp. | | 221 | | | 7,571 | |
| Halliburton Co. | | 2,137 | | | 74,111 | |
| NOV, Inc. | | 215 | | | 4,476 | |
| Schlumberger NV | | 1,499 | | | 72,387 | |
| | | | 297,163 | |
| | | | |
| Oil & Gas Exploration & Production - 2.3% | | | | |
Antero Resources Corp. (a) | | 789 | | | 22,897 | |
| APA Corp. | | 1,315 | | | 41,015 | |
Chesapeake Energy Corp. (c) | | 505 | | | 38,547 | |
| Chord Energy Corp. | | 139 | | | 23,861 | |
| ConocoPhillips | | 2,605 | | | 289,676 | |
| Coterra Energy, Inc. | | 2,624 | | | 67,699 | |
| Devon Energy Corp. | | 2,261 | | | 106,335 | |
| Diamondback Energy, Inc. | | 642 | | | 129,883 | |
| EOG Resources, Inc. | | 2,072 | | | 262,729 | |
| EQT Corp. | | 2,168 | | | 74,818 | |
| Marathon Oil Corp. | | 2,066 | | | 57,951 | |
| Matador Resources Co. | | 381 | | | 23,424 | |
| Murphy Oil Corp. | | 561 | | | 23,214 | |
The accompanying notes are an integral part of these financial statements.
98
| | |
| STRIVE 1000 VALUE ETF |
| SCHEDULE OF INVESTMENTS (CONTINUED) |
| July 31, 2024 |
| | | | | | | | | | | | | | |
| COMMON STOCKS - 95.6% (CONTINUED) | | Shares | | Value |
| Oil & Gas Exploration & Production - 2.3% (Continued) | | | | |
| Ovintiv, Inc. | | 952 | | | $ | 44,211 | |
| Range Resources Corp. | | 788 | | | 24,609 | |
Southwestern Energy Co. (a) | | 3,930 | | | 25,348 | |
| | | | 1,256,217 | |
| | | | |
| Oil & Gas Refining & Marketing - 1.3% | | | | |
| HF Sinclair Corp. | | 568 | | | 29,235 | |
| Marathon Petroleum Corp. | | 1,309 | | | 231,719 | |
| PBF Energy, Inc. - Class A | | 387 | | | 15,770 | |
| Phillips 66 | | 1,509 | | | 219,530 | |
| Valero Energy Corp. | | 1,179 | | | 190,668 | |
| | | | 686,922 | |
| | | | |
| Oil & Gas Storage & Transportation - 1.0% | | | | |
| Cheniere Energy, Inc. | | 200 | | | 36,528 | |
| DT Midstream, Inc. | | 376 | | | 28,335 | |
| Kinder Morgan, Inc. | | 6,897 | | | 145,734 | |
| ONEOK, Inc. | | 2,075 | | | 172,910 | |
| Williams Cos., Inc. | | 4,074 | | | 174,937 | |
| | | | 558,444 | |
| | | | |
| Other Specialty Retail - 0.2% | | | | |
| Bath & Body Works, Inc. | | 770 | | | 28,297 | |
| Dick's Sporting Goods, Inc. | | 200 | | | 43,270 | |
| Tractor Supply Co. | | 59 | | | 15,536 | |
| | | | 87,103 | |
| | | | |
| Packaged Foods & Meats - 1.4% | | | | |
| Campbell Soup Co. | | 686 | | | 32,146 | |
| Conagra Brands, Inc. | | 1,684 | | | 51,059 | |
| Flowers Foods, Inc. | | 598 | | | 13,467 | |
| General Mills, Inc. | | 1,916 | | | 128,640 | |
| Hershey Co. | | 150 | | | 29,622 | |
| Hormel Foods Corp. | | 988 | | | 31,725 | |
| J M Smucker Co. | | 377 | | | 44,467 | |
| Kellanova | | 937 | | | 54,486 | |
| Kraft Heinz Co. | | 2,810 | | | 98,940 | |
| Lancaster Colony Corp. | | 14 | | | 2,703 | |
| McCormick & Co., Inc. | | 560 | | | 43,126 | |
| Mondelez International, Inc. - Class A | | 1,864 | | | 127,404 | |
Pilgrim's Pride Corp. (a) | | 72 | | | 2,969 | |
Post Holdings, Inc. (a) | | 150 | | | 16,404 | |
| Seaboard Corp. | | 1 | | | 3,248 | |
The accompanying notes are an integral part of these financial statements.
99
| | |
| STRIVE 1000 VALUE ETF |
| SCHEDULE OF INVESTMENTS (CONTINUED) |
| July 31, 2024 |
| | | | | | | | | | | | | | |
| COMMON STOCKS - 95.6% (CONTINUED) | | Shares | | Value |
| Packaged Foods & Meats - 1.4% (Continued) | | | | |
| Tyson Foods, Inc. - Class A | | 1,092 | | | $ | 66,503 | |
| | | | 746,909 | |
| | | | |
| Paper & Plastic Packaging Products & Materials - 0.5% | | | | |
| Amcor PLC | | 5,215 | | | 54,914 | |
| Avery Dennison Corp. | | 67 | | | 14,528 | |
| Graphic Packaging Holding Co. | | 982 | | | 29,558 | |
| International Paper Co. | | 1,337 | | | 62,144 | |
| Packaging Corp. of America | | 276 | | | 55,164 | |
| Sealed Air Corp. | | 497 | | | 18,911 | |
| Smurfit WestRock PLC | | 880 | | | 39,459 | |
| Sonoco Products Co. | | 427 | | | 23,024 | |
| | | | 297,702 | |
| | | | |
| Passenger Airlines - 0.1% | | | | |
Alaska Air Group, Inc. (a) | | 88 | | | 3,303 | |
American Airlines Group, Inc. (a) | | 573 | | | 6,097 | |
| Delta Air Lines, Inc. | | 568 | | | 24,435 | |
| Southwest Airlines Co. | | 452 | | | 12,177 | |
United Airlines Holdings, Inc. (a) | | 248 | | | 11,264 | |
| | | | 57,276 | |
| | | | |
Passenger Ground Transportation - 0.0%(b) | | | | |
| Avis Budget Group, Inc. | | 31 | | | 3,132 | |
Grab Holdings Ltd. - Class A (a) | | 1 | | | 3 | |
| | | | 3,135 | |
| | | | |
| Personal Care Products - 0.1% | | | | |
| Estee Lauder Cos., Inc. - Class A | | 142 | | | 14,145 | |
| Kenvue, Inc. | | 2,405 | | | 44,468 | |
| | | | 58,613 | |
| | | | |
| Pharmaceuticals - 4.9% | | | | |
| Bristol-Myers Squibb Co. | | 7,289 | | | 346,665 | |
Catalent, Inc. (a) | | 49 | | | 2,908 | |
Elanco Animal Health, Inc. (a) | | 1,399 | | | 18,243 | |
Jazz Pharmaceuticals PLC (a) | | 190 | | | 20,947 | |
| Johnson & Johnson | | 6,231 | | | 983,563 | |
| Merck & Co., Inc. | | 4,857 | | | 549,472 | |
| Organon & Co. | | 989 | | | 21,620 | |
| Perrigo Co. PLC | | 446 | | | 12,608 | |
| Pfizer, Inc. | | 20,616 | | | 629,613 | |
| Royalty Pharma PLC - Class A | | 1,337 | | | 37,663 | |
The accompanying notes are an integral part of these financial statements.
100
| | |
| STRIVE 1000 VALUE ETF |
| SCHEDULE OF INVESTMENTS (CONTINUED) |
| July 31, 2024 |
| | | | | | | | | | | | | | |
| COMMON STOCKS - 95.6% (CONTINUED) | | Shares | | Value |
| Pharmaceuticals - 4.9% (Continued) | | | | |
| Viatris, Inc. | | 4,293 | | | $ | 51,774 | |
| | | | 2,675,076 | |
| | | | |
| Property & Casualty Insurance - 2.4% | | | | |
| Allstate Corp. | | 848 | | | 145,110 | |
| American Financial Group, Inc. | | 240 | | | 31,430 | |
Arch Capital Group Ltd. (a) | | 1,125 | | | 107,752 | |
| Assurant, Inc. | | 191 | | | 33,400 | |
| Axis Capital Holdings Ltd. | | 229 | | | 17,347 | |
| Chubb Ltd. | | 1,203 | | | 331,619 | |
| Cincinnati Financial Corp. | | 561 | | | 73,278 | |
| Fidelity National Financial, Inc. | | 929 | | | 51,476 | |
| First American Financial Corp. | | 382 | | | 23,142 | |
| Hanover Insurance Group, Inc. | | 92 | | | 12,649 | |
| Hartford Financial Services Group, Inc. | | 1,022 | | | 113,360 | |
| Loews Corp. | | 613 | | | 49,009 | |
Markel Group, Inc. (a) | | 32 | | | 52,443 | |
| Old Republic International Corp. | | 947 | | | 32,785 | |
| RLI Corp. | | 18 | | | 2,711 | |
| Selective Insurance Group, Inc. | | 105 | | | 9,484 | |
| Travelers Cos., Inc. | | 808 | | | 174,883 | |
| W R Berkley Corp. | | 791 | | | 43,608 | |
| | | | 1,305,486 | |
| | | | |
| Publishing - 0.1% | | | | |
| News Corp. - Class A | | 845 | | | 23,305 | |
| News Corp. - Class B | | 285 | | | 8,120 | |
| | | | 31,425 | |
| | | | |
| Rail Transportation - 0.5% | | | | |
| CSX Corp. | | 2,104 | | | 73,850 | |
| Norfolk Southern Corp. | | 427 | | | 106,562 | |
| Union Pacific Corp. | | 423 | | | 104,367 | |
| | | | 284,779 | |
| | | | |
Real Estate Development - 0.0%(b) | | | | |
Howard Hughes Holdings, Inc. (a) | | 23 | | | 1,706 | |
| | | | |
| Real Estate Services - 0.1% | | | | |
CBRE Group, Inc. - Class A (a) | | 135 | | | 15,216 | |
Jones Lang LaSalle, Inc. (a) | | 178 | | | 44,660 | |
| | | | 59,876 | |
| | | | |
The accompanying notes are an integral part of these financial statements.
101
| | |
| STRIVE 1000 VALUE ETF |
| SCHEDULE OF INVESTMENTS (CONTINUED) |
| July 31, 2024 |
| | | | | | | | | | | | | | |
| COMMON STOCKS - 95.6% (CONTINUED) | | Shares | | Value |
| Regional Banks - 1.7% | | | | |
| Bank OZK | | 382 | | | $ | 17,912 | |
| BOK Financial Corp. | | 40 | | | 4,114 | |
| Citizens Financial Group, Inc. | | 1,554 | | | 66,309 | |
| Commerce Bancshares, Inc. | | 249 | | | 16,113 | |
| Cullen/Frost Bankers, Inc. | | 198 | | | 23,178 | |
| East West Bancorp, Inc. | | 465 | | | 40,869 | |
| First Financial Bankshares, Inc. | | 215 | | | 8,269 | |
| First Horizon Corp. | | 2,060 | | | 34,464 | |
| Huntington Bancshares, Inc. | | 5,071 | | | 75,811 | |
| M&T Bank Corp. | | 572 | | | 98,481 | |
| New York Community Bancorp, Inc. | | 991 | | | 10,425 | |
| Pinnacle Financial Partners, Inc. | | 226 | | | 21,768 | |
| Popular, Inc. | | 216 | | | 22,168 | |
| Prosperity Bancshares, Inc. | | 394 | | | 28,573 | |
| Regions Financial Corp. | | 3,369 | | | 75,364 | |
| SouthState Corp. | | 324 | | | 32,066 | |
| Synovus Financial Corp. | | 603 | | | 28,190 | |
| TFS Financial Corp. | | 187 | | | 2,536 | |
| Truist Financial Corp. | | 4,884 | | | 218,266 | |
| United Bankshares, Inc. | | 421 | | | 16,389 | |
| Webster Financial Corp. | | 585 | | | 29,028 | |
| Western Alliance Bancorp | | 373 | | | 30,012 | |
| Wintrust Financial Corp. | | 199 | | | 21,532 | |
| Zions Bancorp NA | | 601 | | | 31,054 | |
| | | | 952,891 | |
| | | | |
| Reinsurance - 0.3% | | | | |
| Everest Group Ltd. | | 137 | | | 53,823 | |
| Reinsurance Group of America, Inc. | | 218 | | | 49,144 | |
| RenaissanceRe Holdings Ltd. | | 197 | | | 45,686 | |
| | | | 148,653 | |
| | | | |
Renewable Electricity - 0.0%(b) | | | | |
| Clearway Energy, Inc. - Class A | | 54 | | | 1,330 | |
| Clearway Energy, Inc. - Class C | | 237 | | | 6,323 | |
| | | | 7,653 | |
| | | | |
| Research & Consulting Services - 0.2% | | | | |
CACI International, Inc. - Class A (a) | | 36 | | | 16,613 | |
Clarivate PLC (a) | | 54 | | | 364 | |
| Dun & Bradstreet Holdings, Inc. | | 244 | | | 2,655 | |
| Jacobs Solutions, Inc. | | 295 | | | 43,173 | |
| KBR, Inc. | | 84 | | | 5,594 | |
The accompanying notes are an integral part of these financial statements.
102
| | |
| STRIVE 1000 VALUE ETF |
| SCHEDULE OF INVESTMENTS (CONTINUED) |
| July 31, 2024 |
| | | | | | | | | | | | | | |
| COMMON STOCKS - 95.6% (CONTINUED) | | Shares | | Value |
| Research & Consulting Services - 0.2% (Continued) | | | | |
| Leidos Holdings, Inc. | | 268 | | | $ | 38,699 | |
Parsons Corp. (a) | | 1 | | | 91 | |
| Science Applications International Corp. | | 141 | | | 17,541 | |
| | | | 124,730 | |
| | | | |
| Restaurants - 0.7% | | | | |
| Aramark | | 928 | | | 31,803 | |
| Darden Restaurants, Inc. | | 189 | | | 27,649 | |
| Domino's Pizza, Inc. | | 25 | | | 10,717 | |
DoorDash, Inc. - Class A (a) | | 655 | | | 72,522 | |
| McDonald's Corp. | | 676 | | | 179,410 | |
| Starbucks Corp. | | 636 | | | 49,576 | |
| Wendy's Co. | | 405 | | | 6,857 | |
| Yum! Brands, Inc. | | 109 | | | 14,478 | |
| | | | 393,012 | |
| | | | |
Semiconductor Materials & Equipment - 0.0%(b) | | | | |
| Amkor Technology, Inc. | | 209 | | | 6,826 | |
| MKS Instruments, Inc. | | 27 | | | 3,399 | |
| | | | 10,225 | |
| | | | |
| Semiconductors - 2.1% | | | | |
| Analog Devices, Inc. | | 144 | | | 33,319 | |
Cirrus Logic, Inc. (a) | | 9 | | | 1,174 | |
| Intel Corp. | | 15,313 | | | 470,721 | |
| Microchip Technology, Inc. | | 1 | | | 89 | |
| Micron Technology, Inc. | | 3,715 | | | 407,981 | |
| Qualcomm, Inc. | | 386 | | | 69,847 | |
| Skyworks Solutions, Inc. | | 486 | | | 55,219 | |
Synaptics, Inc. (a) | | 18 | | | 1,572 | |
| Texas Instruments, Inc. | | 595 | | | 121,267 | |
Wolfspeed, Inc. (a) | | 1 | | | 19 | |
| | | | 1,161,208 | |
| | | | |
| Soft Drinks & Non-alcoholic Beverages - 1.4% | | | | |
| Coca-Cola Co. | | 5,736 | | | 382,820 | |
| Coca-Cola Consolidated, Inc. | | 1 | | | 1,146 | |
| Keurig Dr Pepper, Inc. | | 2,521 | | | 86,420 | |
| PepsiCo, Inc. | | 1,688 | | | 291,467 | |
| | | | 761,853 | |
| | | | |
| Specialized Consumer Services - 0.1% | | | | |
| ADT, Inc. | | 1,152 | | | 8,962 | |
The accompanying notes are an integral part of these financial statements.
103
| | |
| STRIVE 1000 VALUE ETF |
| SCHEDULE OF INVESTMENTS (CONTINUED) |
| July 31, 2024 |
| | | | | | | | | | | | | | |
| COMMON STOCKS - 95.6% (CONTINUED) | | Shares | | Value |
| Specialized Consumer Services - 0.1% (Continued) | | | | |
| H&R Block, Inc. | | 404 | | | $ | 23,408 | |
| Service Corp. International/US | | 116 | | | 9,270 | |
| | | | 41,640 | |
| | | | |
| Specialty Chemicals - 0.7% | | | | |
| Albemarle Corp. | | 325 | | | 30,443 | |
| Ashland, Inc. | | 54 | | | 5,219 | |
Axalta Coating Systems Ltd. (a) | | 237 | | | 8,449 | |
| Celanese Corp. | | 261 | | | 36,840 | |
| DuPont de Nemours, Inc. | | 828 | | | 69,304 | |
| Eastman Chemical Co. | | 467 | | | 48,255 | |
| Ecolab, Inc. | | 53 | | | 12,226 | |
| International Flavors & Fragrances, Inc. | | 935 | | | 93,014 | |
| PPG Industries, Inc. | | 388 | | | 49,268 | |
| RPM International, Inc. | | 76 | | | 9,231 | |
| | | | 362,249 | |
| | | | |
| Steel - 0.6% | | | | |
Cleveland-Cliffs, Inc. (a) | | 1,571 | | | 24,115 | |
| Commercial Metals Co. | | 394 | | | 23,679 | |
| Nucor Corp. | | 862 | | | 140,454 | |
| Reliance, Inc. | | 187 | | | 56,953 | |
| Steel Dynamics, Inc. | | 569 | | | 75,802 | |
| United States Steel Corp. | | 633 | | | 26,010 | |
| | | | 347,013 | |
| | | | |
Systems Software - 0.0%(b) | | | | |
| Dolby Laboratories, Inc. - Class A | | 42 | | | 3,308 | |
| Gen Digital, Inc. | | 605 | | | 15,724 | |
| | | | 19,032 | |
| | | | |
| Technology Distributors - 0.1% | | | | |
Arrow Electronics, Inc. (a) | | 192 | | | 23,748 | |
| TD Synnex Corp. | | 235 | | | 28,005 | |
| | | | 51,753 | |
| | | | |
| Technology Hardware, Storage & Peripherals - 0.9% | | | | |
| Dell Technologies, Inc. - Class C | | 937 | | | 106,518 | |
| Hewlett Packard Enterprise Co. | | 4,647 | | | 92,522 | |
| HP, Inc. | | 3,423 | | | 123,536 | |
| NetApp, Inc. | | 275 | | | 34,920 | |
| Seagate Technology Holdings PLC | | 643 | | | 65,695 | |
Western Digital Corp. (a) | | 1,219 | | | 81,734 | |
| | | | 504,925 | |
| | | | |
The accompanying notes are an integral part of these financial statements.
104
| | |
| STRIVE 1000 VALUE ETF |
| SCHEDULE OF INVESTMENTS (CONTINUED) |
| July 31, 2024 |
| | | | | | | | | | | | | | |
| COMMON STOCKS - 95.6% (CONTINUED) | | Shares | | Value |
| Tobacco - 1.7% | | | | |
| Altria Group, Inc. | | 6,176 | | | $ | 302,686 | |
| Philip Morris International, Inc. | | 5,585 | | | 643,168 | |
| | | | 945,854 | |
| | | | |
| Trading Companies & Distributors - 0.5% | | | | |
| AerCap Holdings NV | | 743 | | | 69,805 | |
| Air Lease Corp. | | 380 | | | 18,856 | |
| Applied Industrial Technologies, Inc. | | 21 | | | 4,582 | |
Core & Main, Inc. - Class A (a) | | 215 | | | 11,496 | |
| Fastenal Co. | | 200 | | | 14,150 | |
| Ferguson PLC | | 253 | | | 56,330 | |
| MSC Industrial Direct Co., Inc. - Class A | | 185 | | | 16,456 | |
| United Rentals, Inc. | | 35 | | | 26,498 | |
| WESCO International, Inc. | | 205 | | | 35,865 | |
| | | | 254,038 | |
| | | | |
| Transaction & Payment Processing Services - 0.5% | | | | |
Euronet Worldwide, Inc. (a) | | 134 | | | 13,667 | |
| Fidelity National Information Services, Inc. | | 2,080 | | | 159,806 | |
| Global Payments, Inc. | | 370 | | | 37,607 | |
PayPal Holdings, Inc. (a) | | 609 | | | 40,060 | |
| Western Union Co. | | 1,320 | | | 15,695 | |
| | | | 266,835 | |
| | | | |
| Water Utilities - 0.1% | | | | |
| American Water Works Co., Inc. | | 379 | | | 53,955 | |
| Essential Utilities, Inc. | | 482 | | | 19,593 | |
| | | | 73,548 | |
| | | | |
| Wireless Telecommunication Services - 0.4% | | | | |
| T-Mobile US, Inc. | | 1,057 | | | 192,670 | |
TOTAL COMMON STOCKS (Cost $47,331,956) | | | | 52,267,720 | |
| | | | |
| REAL ESTATE INVESTMENT TRUSTS - 3.8% | | | | |
| AGNC Investment Corp. | | 2,662 | | | 26,647 | |
| Agree Realty Corp. | | 425 | | | 29,312 | |
| Alexandria Real Estate Equities, Inc. | | 654 | | | 76,708 | |
| American Homes 4 Rent - Class A | | 89 | | | 3,212 | |
| American Tower Corp. | | 91 | | | 20,056 | |
| Americold Realty Trust, Inc. | | 981 | | | 29,322 | |
| Annaly Capital Management, Inc. | | 1,721 | | | 34,265 | |
| AvalonBay Communities, Inc. | | 247 | | | 50,615 | |
| Blackstone Mortgage Trust, Inc. - Class A | | 573 | | | 10,228 | |
| Brixmor Property Group, Inc. | | 984 | | | 25,062 | |
The accompanying notes are an integral part of these financial statements.
105
| | |
| STRIVE 1000 VALUE ETF |
| SCHEDULE OF INVESTMENTS (CONTINUED) |
| July 31, 2024 |
| | | | | | | | | | | | | | |
| REAL ESTATE INVESTMENT TRUSTS - 3.8% (CONTINUED) | | Shares | | Value |
| BXP, Inc. | | 575 | | | $ | 41,003 | |
| Camden Property Trust | | 126 | | | 13,955 | |
| Cousins Properties, Inc. | | 451 | | | 12,407 | |
| Crown Castle, Inc. | | 679 | | | 74,744 | |
| CubeSmart | | 372 | | | 17,700 | |
| Digital Realty Trust, Inc. | | 266 | | | 39,764 | |
| EastGroup Properties, Inc. | | 5 | | | 935 | |
| Equity LifeStyle Properties, Inc. | | 17 | | | 1,168 | |
| Equity Residential | | 1,118 | | | 77,846 | |
| Essex Property Trust, Inc. | | 135 | | | 37,579 | |
| Extra Space Storage, Inc. | | 293 | | | 46,769 | |
| Federal Realty Investment Trust | | 204 | | | 22,777 | |
| First Industrial Realty Trust, Inc. | | 24 | | | 1,313 | |
| Gaming and Leisure Properties, Inc. | | 872 | | | 43,774 | |
| Healthcare Realty Trust, Inc. | | 1,334 | | | 23,598 | |
| Healthpeak Properties, Inc. | | 2,475 | | | 54,005 | |
| Host Hotels & Resorts, Inc. | | 2,323 | | | 40,676 | |
| Invitation Homes, Inc. | | 380 | | | 13,403 | |
| Iron Mountain, Inc. | | 207 | | | 21,230 | |
| Kilroy Realty Corp. | | 398 | | | 14,714 | |
| Kimco Realty Corp. | | 2,303 | | | 50,044 | |
| Lamar Advertising Co. - Class A | | 199 | | | 23,852 | |
| Mid-America Apartment Communities, Inc. | | 209 | | | 29,212 | |
| National Storage Affiliates Trust | | 72 | | | 3,065 | |
| NNN REIT, Inc. | | 590 | | | 26,485 | |
| Omega Healthcare Investors, Inc. | | 990 | | | 36,036 | |
| Prologis, Inc. | | 41 | | | 5,168 | |
| Public Storage | | 156 | | | 46,164 | |
| Rayonier, Inc. | | 222 | | | 6,733 | |
| Realty Income Corp. | | 3,072 | | | 176,425 | |
| Regency Centers Corp. | | 434 | | | 29,226 | |
| Rexford Industrial Realty, Inc. | | 1 | | | 50 | |
| Rithm Capital Corp. | | 1,734 | | | 20,132 | |
| Ryman Hospitality Properties, Inc. | | 52 | | | 5,227 | |
| Simon Property Group, Inc. | | 1,119 | | | 171,699 | |
| STAG Industrial, Inc. | | 230 | | | 9,386 | |
| Starwood Property Trust, Inc. | | 993 | | | 19,810 | |
| Sun Communities, Inc. | | 73 | | | 9,251 | |
| UDR, Inc. | | 634 | | | 25,404 | |
| Ventas, Inc. | | 1,398 | | | 76,107 | |
| VICI Properties, Inc. | | 3,720 | | | 116,287 | |
| Vornado Realty Trust | | 211 | | | 6,328 | |
| Welltower, Inc. | | 1,330 | | | 147,963 | |
| Weyerhaeuser Co. | | 1,968 | | | 62,504 | |
The accompanying notes are an integral part of these financial statements.
106
| | |
| STRIVE 1000 VALUE ETF |
| SCHEDULE OF INVESTMENTS (CONTINUED) |
| July 31, 2024 |
| | | | | | | | | | | | | | |
| | | | |
| REAL ESTATE INVESTMENT TRUSTS - 3.8% (CONTINUED) | | Shares | | Value |
| WP Carey, Inc. | | 750 | | | $ | 43,358 | |
TOTAL REAL ESTATE INVESTMENT TRUSTS (Cost $1,869,108) | | | | 2,050,703 | |
| | | | |
| SHORT-TERM INVESTMENTS - 0.6% | | | | |
Investments Purchased with Proceeds from Securities Lending - 0.0%(b) | | |
First American Government Obligations Fund - Class X, 5.23% (d) | | 28,860 | | | 28,860 | |
| | | | |
| Money Market Funds - 0.6% | | | | |
First American Government Obligations Fund - Class X, 5.23% (d) | | 305,194 | | | 305,194 | |
TOTAL SHORT-TERM INVESTMENTS (Cost $334,054) | | | | 334,054 | |
| | | | |
TOTAL INVESTMENTS - 100.0% (Cost $49,535,118) | | | | $ | 54,652,477 | |
Other Assets in Excess of Liabilities - 0.0% (b) | | | | 26,457 | |
| TOTAL NET ASSETS - 100.0% | | | | $ | 54,678,934 | |
Percentages are stated as a percent of net assets.
| | |
| AG - Aktiengesellschaft |
| NV - Naamloze Vennootschap |
| PLC - Public Limited Company |
| SA - Sociedad Anónima |
| | | | | | | | |
| (a) | | Non-income producing security. |
| (b) | | Represents less than 0.05% of net assets. |
| (c) | | All or a portion of this security is on loan as of July 31, 2024. The total market value of these securities was $28,242 which represented 0.1% of net assets. |
| (d) | | The rate shown represents the 7-day effective yield as of July 31, 2024. |
The Global Industry Classification Standard (GICS®) was developed by and/or is the exclusive property of MSCI, Inc. and Standard & Poor’s Financial Services LLC (“S&P”). GICS is a service mark of MSCI, Inc. and S&P and has been licensed for use by U.S. Bank Global Fund Services.
The accompanying notes are an integral part of these financial statements.
107
| | |
| STRIVE 1000 DIVIDEND GROWTH ETF |
| SCHEDULE OF INVESTMENTS |
| July 31, 2024 |
| | | | | | | | | | | | | | |
| COMMON STOCKS - 96.7% | | Shares | | Value |
| Aerospace & Defense - 2.3% | | | | |
| BWX Technologies, Inc. | | 239 | | | $ | 23,778 | |
| Curtiss-Wright Corp. | | 105 | | | 30,943 | |
| General Dynamics Corp. | | 667 | | | 199,240 | |
| HEICO Corp. | | 117 | | | 28,237 | |
| HEICO Corp. - Class A | | 199 | | | 37,832 | |
| Huntington Ingalls Industries, Inc. | | 107 | | | 29,958 | |
| L3Harris Technologies, Inc. | | 524 | | | 118,890 | |
| Lockheed Martin Corp. | | 663 | | | 359,293 | |
| Northrop Grumman Corp. | | 373 | | | 180,651 | |
| | | | 1,008,822 | |
| | | | |
| Agricultural & Farm Machinery - 0.1% | | | | |
| Toro Co. | | 281 | | | 26,900 | |
| | | | |
| Air Freight & Logistics - 0.7% | | | | |
| Expeditors International of Washington, Inc. | | 384 | | | 47,931 | |
| United Parcel Service, Inc. - Class B | | 2,011 | | | 262,174 | |
| | | | 310,105 | |
| | | | |
| Application Software - 1.5% | | | | |
| Intuit, Inc. | | 749 | | | 484,865 | |
| Roper Technologies, Inc. | | 295 | | | 160,701 | |
| | | | 645,566 | |
| | | | |
| Asset Management & Custody Banks - 1.1% | | | | |
| Ameriprise Financial, Inc. | | 276 | | | 118,699 | |
| BlackRock, Inc. | | 381 | | | 333,947 | |
| SEI Investments Co. | | 301 | | | 20,420 | |
| | | | 473,066 | |
| | | | |
| Biotechnology - 3.2% | | | | |
| AbbVie, Inc. | | 4,889 | | | 906,029 | |
| Amgen, Inc. | | 1,480 | | | 492,056 | |
| | | | 1,398,085 | |
| | | | |
Broadline Retail - 0.0%(a) | | | | |
| Dillard's, Inc. - Class A | | 7 | | | 2,790 | |
| | | | |
| Building Products - 1.3% | | | | |
| A O Smith Corp. | | 328 | | | 27,893 | |
| Advanced Drainage Systems, Inc. | | 201 | | | 35,585 | |
| Allegion PLC | | 229 | | | 31,329 | |
| Armstrong World Industries, Inc. | | 108 | | | 14,191 | |
| Carlisle Cos., Inc. | | 134 | | | 56,090 | |
The accompanying notes are an integral part of these financial statements.
108
| | |
| STRIVE 1000 DIVIDEND GROWTH ETF |
| SCHEDULE OF INVESTMENTS (CONTINUED) |
| July 31, 2024 |
| | | | | | | | | | | | | | |
| COMMON STOCKS - 96.7% (CONTINUED) | | Shares | | Value |
| Building Products - 1.3% (Continued) | | | | |
| Lennox International, Inc. | | 89 | | | $ | 51,932 | |
| Masco Corp. | | 606 | | | 47,177 | |
| Owens Corning | | 231 | | | 43,054 | |
| Trane Technologies PLC | | 629 | | | 210,262 | |
| UFP Industries, Inc. | | 160 | | | 21,109 | |
| | | | 538,622 | |
| | | | |
Cable & Satellite - 0.0%(a) | | | | |
| Sirius XM Holdings, Inc. | | 1,622 | | | 5,596 | |
| | | | |
| Cargo Ground Transportation - 0.4% | | | | |
| JB Hunt Transport Services, Inc. | | 215 | | | 37,227 | |
| Landstar System, Inc. | | 88 | | | 16,742 | |
| Old Dominion Freight Line, Inc. | | 540 | | | 113,497 | |
| | | | 167,466 | |
| | | | |
| Casinos & Gaming - 0.1% | | | | |
| Churchill Downs, Inc. | | 180 | | | 25,841 | |
| | | | |
Commodity Chemicals - 0.0%(a) | | | | |
| Westlake Corp. | | 84 | | | 12,420 | |
| | | | |
| Communications Equipment - 0.4% | | | | |
| Motorola Solutions, Inc. | | 462 | | | 184,301 | |
| | | | |
| Construction & Engineering - 0.3% | | | | |
| Comfort Systems USA, Inc. | | 97 | | | 32,245 | |
| Quanta Services, Inc. | | 398 | | | 105,621 | |
| | | | 137,866 | |
| | | | |
| Construction Machinery & Heavy Transportation Equipment - 1.4% | | | | |
| Caterpillar, Inc. | | 1,383 | | | 478,795 | |
| Cummins, Inc. | | 390 | | | 113,802 | |
| Oshkosh Corp. | | 180 | | | 19,557 | |
| | | | 612,154 | |
| | | | |
| Construction Materials - 0.5% | | | | |
| Martin Marietta Materials, Inc. | | 169 | | | 100,276 | |
| Vulcan Materials Co. | | 358 | | | 98,275 | |
| | | | 198,551 | |
| | | | |
| Consumer Electronics - 0.2% | | | | |
| Garmin Ltd. | | 419 | | | 71,754 | |
| | | | |
The accompanying notes are an integral part of these financial statements.
109
| | |
| STRIVE 1000 DIVIDEND GROWTH ETF |
| SCHEDULE OF INVESTMENTS (CONTINUED) |
| July 31, 2024 |
| | | | | | | | | | | | | | |
| COMMON STOCKS - 96.7% (CONTINUED) | | Shares | | Value |
| Consumer Finance - 0.2% | | | | |
| Discover Financial Services | | 679 | | | $ | 97,769 | |
| | | | |
| Consumer Staples Merchandise Retail - 2.9% | | | | |
| Costco Wholesale Corp. | | 1,223 | | | 1,005,306 | |
| Dollar General Corp. | | 594 | | | 71,512 | |
| Target Corp. | | 1,272 | | | 191,321 | |
| | | | 1,268,139 | |
| | | | |
| Data Processing & Outsourced Services - 0.3% | | | | |
| Broadridge Financial Solutions, Inc. | | 315 | | | 67,410 | |
| Genpact Ltd. | | 449 | | | 15,567 | |
| SS&C Technologies Holdings, Inc. | | 584 | | | 42,603 | |
| | | | 125,580 | |
| | | | |
| Distributors - 0.2% | | | | |
| Genuine Parts Co. | | 383 | | | 56,343 | |
| Pool Corp. | | 103 | | | 38,526 | |
| | | | 94,869 | |
| | | | |
| Diversified Banks - 0.1% | | | | |
| First Citizens BancShares, Inc. - Class A | | 28 | | | 58,455 | |
| | | | |
| Electric Utilities - 1.1% | | | | |
| Alliant Energy Corp. | | 689 | | | 38,350 | |
| IDACORP, Inc. | | 131 | | | 12,805 | |
| NextEra Energy, Inc. | | 5,605 | | | 428,166 | |
| | | | 479,321 | |
| | | | |
| Electrical Components & Equipment - 0.3% | | | | |
| Hubbell, Inc. | | 145 | | | 57,369 | |
| Rockwell Automation, Inc. | | 309 | | | 86,103 | |
| | | | 143,472 | |
| | | | |
| Electronic Components - 0.5% | | | | |
| Amphenol Corp. - Class A | | 3,307 | | | 212,508 | |
| Littelfuse, Inc. | | 61 | | | 16,294 | |
| | | | 228,802 | |
| | | | |
| Electronic Equipment & Instruments - 0.1% | | | | |
| Cognex Corp. | | 432 | | | 21,436 | |
| | | | |
| Electronic Manufacturing Services - 0.3% | | | | |
| TE Connectivity Ltd. | | 841 | | | 129,792 | |
| | | | |
The accompanying notes are an integral part of these financial statements.
110
| | |
| STRIVE 1000 DIVIDEND GROWTH ETF |
| SCHEDULE OF INVESTMENTS (CONTINUED) |
| July 31, 2024 |
| | | | | | | | | | | | | | |
| COMMON STOCKS - 96.7% (CONTINUED) | | Shares | | Value |
| Environmental & Facilities Services - 0.8% | | | | |
| Republic Services, Inc. | | 558 | | | $ | 108,430 | |
| Tetra Tech, Inc. | | 144 | | | 30,707 | |
| Waste Management, Inc. | | 1,099 | | | 222,723 | |
| | | | 361,860 | |
| | | | |
| Financial Exchanges & Data - 3.2% | | | | |
| Cboe Global Markets, Inc. | | 286 | | | 52,484 | |
| CME Group, Inc. | | 991 | | | 191,967 | |
| FactSet Research Systems, Inc. | | 109 | | | 45,027 | |
| Intercontinental Exchange, Inc. | | 1,570 | | | 237,949 | |
| MarketAxess Holdings, Inc. | | 102 | | | 22,800 | |
| Moody's Corp. | | 433 | | | 197,656 | |
| Morningstar, Inc. | | 74 | | | 23,506 | |
| MSCI, Inc. | | 212 | | | 114,641 | |
| Nasdaq, Inc. | | 1,181 | | | 79,930 | |
| S&P Global, Inc. | | 884 | | | 428,501 | |
| | | | 1,394,461 | |
| | | | |
| Food Distributors - 0.2% | | | | |
| Sysco Corp. | | 1,335 | | | 102,328 | |
| | | | |
| Food Products - 0.1% | | | | |
| Lamb Weston Holdings, Inc. | | 381 | | | 22,868 | |
| | | | |
| Food Retail - 0.1% | | | | |
| Casey's General Stores, Inc. | | 102 | | | 39,560 | |
| | | | |
| Footwear - 0.6% | | | | |
| NIKE, Inc. - Class B | | 3,283 | | | 245,765 | |
| | | | |
| Gold - 0.1% | | | | |
| Royal Gold, Inc. | | 181 | | | 25,000 | |
| | | | |
| Health Care Equipment - 2.7% | | | | |
| Abbott Laboratories | | 4,749 | | | 503,109 | |
| Medtronic PLC | | 3,668 | | | 294,614 | |
| STERIS PLC | | 270 | | | 64,465 | |
| Stryker Corp. | | 948 | | | 310,423 | |
| | | | 1,172,611 | |
| | | | |
| Health Care Services - 0.2% | | | | |
| Chemed Corp. | | 41 | | | 23,376 | |
| Quest Diagnostics, Inc. | | 302 | | | 42,975 | |
| | | | 66,351 | |
| | | | |
The accompanying notes are an integral part of these financial statements.
111
| | |
| STRIVE 1000 DIVIDEND GROWTH ETF |
| SCHEDULE OF INVESTMENTS (CONTINUED) |
| July 31, 2024 |
| | | | | | | | | | | | | | |
| COMMON STOCKS - 96.7% (CONTINUED) | | Shares | | Value |
Health Care Supplies - 0.0%(a) | | | | |
| Dentsply Sirona, Inc. | | 572 | | | $ | 15,524 | |
| | | | |
| Home Improvement Retail - 3.2% | | | | |
| Home Depot, Inc. | | 2,739 | | | 1,008,390 | |
| Lowe's Cos., Inc. | | 1,573 | | | 386,187 | |
| | | | 1,394,577 | |
| | | | |
| Homebuilding - 0.5% | | | | |
| DR Horton, Inc. | | 799 | | | 143,764 | |
| PulteGroup, Inc. | | 582 | | | 76,824 | |
| | | | 220,588 | |
| | | | |
| Homefurnishing Retail - 0.1% | | | | |
| Williams-Sonoma, Inc. | | 340 | | | 52,591 | |
| | | | |
| Household Products - 2.4% | | | | |
| Procter & Gamble Co. | | 6,558 | | | 1,054,264 | |
| | | | |
| Human Resource & Employment Services - 1.0% | | | | |
| Automatic Data Processing, Inc. | | 1,131 | | | 297,023 | |
| Paychex, Inc. | | 873 | | | 111,761 | |
| Robert Half, Inc. | | 282 | | | 18,102 | |
| | | | 426,886 | |
| | | | |
| Industrial Conglomerates - 0.9% | | | | |
| Honeywell International, Inc. | | 1,795 | | | 367,526 | |
| | | | |
| Industrial Gases - 1.8% | | | | |
| Air Products and Chemicals, Inc. | | 612 | | | 161,476 | |
| Linde PLC | | 1,325 | | | 600,888 | |
| | | | 762,364 | |
| | | | |
| Industrial Machinery & Supplies & Components - 1.7% | | | | |
| Donaldson Co., Inc. | | 329 | | | 24,616 | |
| Graco, Inc. | | 452 | | | 38,443 | |
| IDEX Corp. | | 200 | | | 41,696 | |
| Illinois Tool Works, Inc. | | 789 | | | 195,104 | |
| ITT, Inc. | | 215 | | | 30,414 | |
| Lincoln Electric Holdings, Inc. | | 154 | | | 31,633 | |
| Nordson Corp. | | 139 | | | 34,796 | |
| Parker-Hannifin Corp. | | 353 | | | 198,089 | |
| Snap-on, Inc. | | 141 | | | 40,471 | |
| Watts Water Technologies, Inc. - Class A | | 67 | | | 13,904 | |
| Xylem, Inc. | | 666 | | | 88,911 | |
| | | | 738,077 | |
| | | | |
The accompanying notes are an integral part of these financial statements.
112
| | |
| STRIVE 1000 DIVIDEND GROWTH ETF |
| SCHEDULE OF INVESTMENTS (CONTINUED) |
| July 31, 2024 |
| | | | | | | | | | | | | | |
| COMMON STOCKS - 96.7% (CONTINUED) | | Shares | | Value |
| Insurance Brokers - 1.8% | | | | |
| Aon PLC - Class A | | 524 | | | $ | 172,139 | |
| Arthur J Gallagher & Co. | | 592 | | | 167,826 | |
| Brown & Brown, Inc. | | 630 | | | 62,641 | |
| Marsh & McLennan Cos., Inc. | | 1,362 | | | 303,140 | |
| Willis Towers Watson PLC | | 281 | | | 79,321 | |
| | | | 785,067 | |
| | | | |
| Investment Banking & Brokerage - 1.3% | | | | |
| Evercore, Inc. - Class A | | 96 | | | 24,038 | |
| Goldman Sachs Group, Inc. | | 894 | | | 455,073 | |
| Houlihan Lokey, Inc. | | 141 | | | 21,185 | |
| Raymond James Financial, Inc. | | 504 | | | 58,464 | |
| | | | 558,760 | |
| | | | |
| IT Consulting & Other Services - 0.1% | | | | |
| Amdocs Ltd. | | 298 | | | 26,066 | |
| | | | |
Leisure Products - 0.0%(a) | | | | |
| Brunswick Corp. | | 181 | | | 14,742 | |
| | | | |
| Life & Health Insurance - 0.1% | | | | |
| Globe Life, Inc. | | 254 | | | 23,556 | |
| Primerica, Inc. | | 95 | | | 23,918 | |
| | | | 47,474 | |
| | | | |
| Life Sciences Tools & Services - 3.1% | | | | |
| Agilent Technologies, Inc. | | 807 | | | 114,110 | |
| Danaher Corp. | | 1,869 | | | 517,863 | |
| Thermo Fisher Scientific, Inc. | | 1,048 | | | 642,780 | |
| West Pharmaceutical Services, Inc. | | 195 | | | 59,703 | |
| | | | 1,334,456 | |
| | | | |
| Managed Health Care - 4.5% | | | | |
| Elevance Health, Inc. | | 641 | | | 341,031 | |
| Humana, Inc. | | 325 | | | 117,523 | |
| UnitedHealth Group, Inc. | | 2,535 | | | 1,460,566 | |
| | | | 1,919,120 | |
| | | | |
| Multi-Utilities - 0.2% | | | | |
| WEC Energy Group, Inc. | | 857 | | | 73,753 | |
| | | | |
| Oil & Gas Exploration & Production - 0.1% | | | | |
| Texas Pacific Land Corp. | | 52 | | | 43,935 | |
| | | | |
The accompanying notes are an integral part of these financial statements.
113
| | |
| STRIVE 1000 DIVIDEND GROWTH ETF |
| SCHEDULE OF INVESTMENTS (CONTINUED) |
| July 31, 2024 |
| | | | | | | | | | | | | | |
| COMMON STOCKS - 96.7% (CONTINUED) | | Shares | | Value |
| Oil & Gas Storage & Transportation - 0.3% | | | | |
| Williams Cos., Inc. | | 3,313 | | | $ | 142,260 | |
| | | | |
| Other Specialty Retail - 0.3% | | | | |
| Dick's Sporting Goods, Inc. | | 148 | | | 32,020 | |
| Tractor Supply Co. | | 293 | | | 77,153 | |
| | | | 109,173 | |
| | | | |
| Packaged Foods & Meats - 0.9% | | | | |
| Hershey Co. | | 406 | | | 80,177 | |
| Lancaster Colony Corp. | | 54 | | | 10,425 | |
| McCormick & Co., Inc. | | 677 | | | 52,136 | |
| Mondelez International, Inc. - Class A | | 3,707 | | | 253,373 | |
| | | | 396,111 | |
| | | | |
| Paper & Plastic Packaging Products & Materials - 0.2% | | | | |
| Avery Dennison Corp. | | 221 | | | 47,920 | |
| Packaging Corp. of America | | 244 | | | 48,768 | |
| | | | 96,688 | |
| | | | |
| Pharmaceuticals - 9.1% | | | | |
| Eli Lilly & Co. | | 2,351 | | | 1,890,839 | |
| Johnson & Johnson | | 6,657 | | | 1,050,808 | |
| Merck & Co., Inc. | | 6,972 | | | 788,742 | |
| Zoetis, Inc. | | 1,161 | | | 209,026 | |
| | | | 3,939,415 | |
| | | | |
| Property & Casualty Insurance - 0.7% | | | | |
| Allstate Corp. | | 715 | | | 122,351 | |
| Cincinnati Financial Corp. | | 419 | | | 54,730 | |
| Erie Indemnity Co. - Class A | | 70 | | | 30,880 | |
| Kinsale Capital Group, Inc. | | 61 | | | 27,881 | |
| Selective Insurance Group, Inc. | | 149 | | | 13,458 | |
| W R Berkley Corp. | | 769 | | | 42,395 | |
| | | | 291,695 | |
| | | | |
| Publishing - 0.1% | | | | |
| New York Times Co. - Class A | | 423 | | | 22,669 | |
| | | | |
| Rail Transportation - 1.8% | | | | |
| CSX Corp. | | 5,384 | | | 188,979 | |
| Norfolk Southern Corp. | | 622 | | | 155,226 | |
| Union Pacific Corp. | | 1,660 | | | 409,572 | |
| | | | 753,777 | |
| | | | |
The accompanying notes are an integral part of these financial statements.
114
| | |
| STRIVE 1000 DIVIDEND GROWTH ETF |
| SCHEDULE OF INVESTMENTS (CONTINUED) |
| July 31, 2024 |
| | | | | | | | | | | | | | |
| COMMON STOCKS - 96.7% (CONTINUED) | | Shares | | Value |
| Regional Banks - 0.1% | | | | |
| Commerce Bancshares, Inc. | | 298 | | | $ | 19,284 | |
| Cullen/Frost Bankers, Inc. | | 148 | | | 17,325 | |
| First Financial Bankshares, Inc. | | 336 | | | 12,922 | |
| | | | 49,531 | |
| | | | |
| Research & Consulting Services - 0.2% | | | | |
| Booz Allen Hamilton Holding Corp. | | 342 | | | 49,012 | |
| Jacobs Solutions, Inc. | | 335 | | | 49,027 | |
| | | | 98,039 | |
| | | | |
| Restaurants - 2.2% | | | | |
| Domino's Pizza, Inc. | | 96 | | | 41,155 | |
| McDonald's Corp. | | 1,992 | | | 528,677 | |
| Starbucks Corp. | | 3,064 | | | 238,839 | |
| Wingstop, Inc. | | 81 | | | 30,284 | |
| Yum! Brands, Inc. | | 777 | | | 103,209 | |
| | | | 942,164 | |
| | | | |
| Semiconductor Materials & Equipment - 2.6% | | | | |
| Applied Materials, Inc. | | 2,287 | | | 485,301 | |
| KLA Corp. | | 373 | | | 307,005 | |
| Lam Research Corp. | | 361 | | | 332,568 | |
| | | | 1,124,874 | |
| | | | |
| Semiconductors - 7.8% | | | | |
| Analog Devices, Inc. | | 1,365 | | | 315,834 | |
| Broadcom, Inc. | | 12,552 | | | 2,016,855 | |
| Microchip Technology, Inc. | | 1,442 | | | 128,021 | |
| Monolithic Power Systems, Inc. | | 129 | | | 111,339 | |
| NXP Semiconductors NV | | 702 | | | 184,738 | |
| Skyworks Solutions, Inc. | | 434 | | | 49,311 | |
| Texas Instruments, Inc. | | 2,509 | | | 511,359 | |
| Universal Display Corp. | | 121 | | | 26,937 | |
| | | | 3,344,394 | |
| | | | |
| Soft Drinks & Non-alcoholic Beverages - 1.5% | | | | |
| PepsiCo, Inc. | | 3,795 | | | 655,283 | |
| | | | |
| Specialized Consumer Services - 0.1% | | | | |
| Service Corp. International | | 398 | | | 31,804 | |
| | | | |
| Specialty Chemicals - 0.9% | | | | |
| Ashland, Inc. | | 127 | | | 12,275 | |
| Celanese Corp. | | 294 | | | 41,498 | |
The accompanying notes are an integral part of these financial statements.
115
| | |
| STRIVE 1000 DIVIDEND GROWTH ETF |
| SCHEDULE OF INVESTMENTS (CONTINUED) |
| July 31, 2024 |
| | | | | | | | | | | | | | |
| COMMON STOCKS - 96.7% (CONTINUED) | | Shares | | Value |
| Specialty Chemicals - 0.9% (Continued) | | | | |
| PPG Industries, Inc. | | 635 | | | $ | 80,632 | |
| RPM International, Inc. | | 341 | | | 41,418 | |
| Sherwin-Williams Co. | | 648 | | | 227,318 | |
| | | | 403,141 | |
| | | | |
| Steel - 0.1% | | | | |
| Reliance, Inc. | | 154 | | | 46,902 | |
| | | | |
| Systems Software - 6.0% | | | | |
| Dolby Laboratories, Inc. - Class A | | 146 | | | 11,499 | |
| Microsoft Corp. | | 4,736 | | | 1,981,305 | |
| Oracle Corp. | | 4,415 | | | 615,672 | |
| | | | 2,608,476 | |
| | | | |
| Technology Distributors - 0.2% | | | | |
| CDW Corp. | | 370 | | | 80,701 | |
| | | | |
| Technology Hardware, Storage & Peripherals - 5.2% | | | | |
| Apple, Inc. | | 10,186 | | | 2,262,107 | |
| | | | |
| Trading Companies & Distributors - 0.6% | | | | |
| Fastenal Co. | | 1,557 | | | 110,158 | |
| Watsco, Inc. | | 93 | | | 45,522 | |
| WW Grainger, Inc. | | 123 | | | 120,148 | |
| | | | 275,828 | |
| | | | |
| Transaction & Payment Processing Services - 5.2% | | | | |
| Jack Henry & Associates, Inc. | | 192 | | | 32,924 | |
| Mastercard, Inc. - Class A | | 2,277 | | | 1,055,868 | |
| Visa, Inc. - Class A | | 4,329 | | | 1,150,085 | |
| | | | 2,238,877 | |
| | | | |
| Water Utilities - 0.3% | | | | |
| American Water Works Co., Inc. | | 538 | | | 76,590 | |
| Essential Utilities, Inc. | | 686 | | | 27,886 | |
| | | | 104,476 | |
TOTAL COMMON STOCKS (Cost $35,196,480) | | | | 41,752,499 | |
| | | | |
| REAL ESTATE INVESTMENT TRUSTS - 3.1% | | | | |
| Agree Realty Corp. | | 249 | | | 17,174 | |
| American Tower Corp. | | 1,287 | | | 283,655 | |
| Crown Castle, Inc. | | 1,201 | | | 132,206 | |
| CubeSmart | | 617 | | | 29,357 | |
| EastGroup Properties, Inc. | | 121 | | | 22,626 | |
The accompanying notes are an integral part of these financial statements.
116
| | |
| STRIVE 1000 DIVIDEND GROWTH ETF |
| SCHEDULE OF INVESTMENTS (CONTINUED) |
| July 31, 2024 |
| | | | | | | | | | | | | | |
| REAL ESTATE INVESTMENT TRUSTS - 3.1% (CONTINUED) | | Shares | | Value |
| Equinix, Inc. | | 262 | | | $ | 207,043 | |
| Equity LifeStyle Properties, Inc. | | 449 | | | 30,837 | |
| Extra Space Storage, Inc. | | 570 | | | 90,983 | |
| First Industrial Realty Trust, Inc. | | 325 | | | 17,784 | |
| Invitation Homes, Inc. | | 1,558 | | | 54,951 | |
| Mid-America Apartment Communities, Inc. | | 313 | | | 43,748 | |
| National Storage Affiliates Trust | | 198 | | | 8,429 | |
| Prologis, Inc. | | 2,550 | | | 321,427 | |
| Rexford Industrial Realty, Inc. | | 572 | | | 28,663 | |
| Sun Communities, Inc. | | 330 | | | 41,821 | |
TOTAL REAL ESTATE INVESTMENT TRUSTS (Cost $1,246,513) | | | | 1,330,704 | |
| | | | |
| SHORT-TERM INVESTMENTS - 0.2% | | | | |
| Money Market Funds - 0.2% | | | | |
First American Government Obligations Fund - Class X, 5.23% (b) | | 96,543 | | | 96,543 | |
TOTAL SHORT-TERM INVESTMENTS (Cost $96,543) | | | | 96,543 | |
| | | | |
TOTAL INVESTMENTS - 100.0% (Cost $36,539,536) | | | | $ | 43,179,746 | |
Other Assets in Excess of Liabilities - 0.0%(a) | | | | 20,011 | |
| TOTAL NET ASSETS - 100.0% | | | | $ | 43,199,757 | |
Percentages are stated as a percent of net assets.
| | |
| NV - Naamloze Vennootschap |
| PLC - Public Limited Company |
| | | | | | | | |
| (a) | | Represents less than 0.05% of net assets. |
| (b) | | The rate shown represents the 7-day effective yield as of July 31, 2024. |
The Global Industry Classification Standard (GICS®) was developed by and/or is the exclusive property of MSCI, Inc. and Standard & Poor’s Financial Services LLC (“S&P”). GICS is a service mark of MSCI, Inc. and S&P and has been licensed for use by U.S. Bank Global Fund Services.
The accompanying notes are an integral part of these financial statements.
117
| | |
| STRIVE U.S. ENERGY ETF |
| SCHEDULE OF INVESTMENTS |
| July 31, 2024 |
| | | | | | | | | | | | | | |
| COMMON STOCKS - 99.9% | | Shares | | Value |
| Automotive Retail - 0.9% | | | | |
| Murphy USA, Inc. | | 6,353 | | | $ | 3,207,757 | |
| | | | |
Integrated Oil & Gas - 47.5%(a) | | | | |
| Chevron Corp. | | 448,999 | | | 72,050,869 | |
| Exxon Mobil Corp. | | 664,863 | | | 78,846,103 | |
| Occidental Petroleum Corp. | | 208,412 | | | 12,675,618 | |
| | | | 163,572,590 | |
| | | | |
Oil & Gas Exploration & Production - 36.5%(a) | | | | |
Antero Resources Corp. (b) | | 93,105 | | | 2,701,907 | |
| APA Corp. | | 122,559 | | | 3,822,615 | |
| California Resources Corp. | | 22,463 | | | 1,155,497 | |
Chesapeake Energy Corp. (c) | | 41,306 | | | 3,152,887 | |
| Chord Energy Corp. | | 13,401 | | | 2,300,416 | |
| Civitas Resources, Inc. | | 32,992 | | | 2,301,522 | |
CNX Resources Corp. (b) | | 47,664 | | | 1,261,666 | |
| Comstock Resources, Inc. | | 26,492 | | | 250,879 | |
| ConocoPhillips | | 129,943 | | | 14,449,662 | |
| Coterra Energy, Inc. | | 241,987 | | | 6,243,264 | |
| Devon Energy Corp. | | 209,228 | | | 9,839,993 | |
| Diamondback Energy, Inc. | | 58,868 | | | 11,909,585 | |
| EOG Resources, Inc. | | 121,835 | | | 15,448,678 | |
| EQT Corp. | | 145,014 | | | 5,004,433 | |
Gulfport Energy Corp. (b) | | 4,244 | | | 624,759 | |
| Hess Corp. | | 96,191 | | | 14,757,623 | |
| Magnolia Oil & Gas Corp. - Class A | | 56,761 | | | 1,546,170 | |
| Marathon Oil Corp. | | 188,958 | | | 5,300,272 | |
| Matador Resources Co. | | 38,087 | | | 2,341,589 | |
| Murphy Oil Corp. | | 47,822 | | | 1,978,874 | |
| Northern Oil & Gas, Inc. | | 29,696 | | | 1,282,570 | |
| Ovintiv, Inc. | | 88,886 | | | 4,127,866 | |
| Range Resources Corp. | | 78,144 | | | 2,440,437 | |
| Sitio Royalties Corp. - Class A | | 26,183 | | | 637,556 | |
| SM Energy Co. | | 37,730 | | | 1,743,126 | |
Southwestern Energy Co. (b) | | 362,784 | | | 2,339,957 | |
Texas Pacific Land Corp. (c) | | 6,244 | | | 5,275,556 | |
| Viper Energy, Inc. | | 28,476 | | | 1,215,071 | |
| | | | 125,454,430 | |
| | | | |
| Oil & Gas Refining & Marketing - 15.0% | | | | |
| CVR Energy, Inc. | | 11,262 | | | 322,093 | |
| HF Sinclair Corp. | | 55,722 | | | 2,868,011 | |
| Marathon Petroleum Corp. | | 87,253 | | | 15,445,526 | |
Par Pacific Holdings, Inc. (b) | | 18,478 | | | 490,591 | |
The accompanying notes are an integral part of these financial statements.
118
| | |
| STRIVE U.S. ENERGY ETF |
| SCHEDULE OF INVESTMENTS (CONTINUED) |
| July 31, 2024 |
| | | | | | | | | | | | | | |
| COMMON STOCKS - 99.9% (CONTINUED) | | Shares | | Value |
| Oil & Gas Refining & Marketing - 15.0% (Continued) | | | | |
| PBF Energy, Inc. - Class A | | 34,184 | | | $ | 1,392,998 | |
| Phillips 66 | | 107,479 | | | 15,636,045 | |
| Valero Energy Corp. | | 94,800 | | | 15,331,056 | |
| | | | 51,486,320 | |
TOTAL COMMON STOCKS (Cost $327,200,618) | | | | 343,721,097 | |
| | | | |
| SHORT-TERM INVESTMENTS - 0.3% | | | | |
| Investments Purchased with Proceeds from Securities Lending - 0.1% | | | | |
First American Government Obligations Fund - Class X, 5.23% (d) | | 560,016 | | | 560,016 | |
| | | | |
| Money Market Funds - 0.2% | | | | |
First American Government Obligations Fund - Class X, 5.23% (d) | | 564,521 | | | 564,521 | |
TOTAL SHORT-TERM INVESTMENTS (Cost $1,124,537) | | | | 1,124,537 | |
| | | | |
TOTAL INVESTMENTS - 100.2% (Cost $328,325,155) | | | | $ | 344,845,634 | |
| Liabilities in Excess of Other Assets - (0.2)% | | | | (634,780) | |
| TOTAL NET ASSETS - 100.0% | | | | $ | 344,210,854 | |
Percentages are stated as a percent of net assets.
| | | | | | | | |
| (a) | | To the extent that the Fund invests more heavily in a particular industry or sector of the economy, its performance will be especially sensitive to developments that significantly affect those industries or sectors. |
| (b) | | Non-income producing security. |
| (c) | | All or a portion of this security is on loan as of July 31, 2024. The total market value of these securities was $549,821 which represented 0.2% of net assets. |
| (d) | | The rate shown represents the 7-day effective yield as of July 31, 2024. |
The Global Industry Classification Standard (GICS®) was developed by and/or is the exclusive property of MSCI, Inc. and Standard & Poor’s Financial Services LLC (“S&P”). GICS is a service mark of MSCI, Inc. and S&P and has been licensed for use by U.S. Bank Global Fund Services.
The accompanying notes are an integral part of these financial statements.
119
| | |
| STRIVE U.S. SEMICONDUCTOR ETF |
| SCHEDULE OF INVESTMENTS |
| July 31, 2024 |
| | | | | | | | | | | | | | |
| COMMON STOCKS - 99.1% | | Shares | | Value |
| Application Software - 5.4% | | | | |
Cadence Design Systems, Inc. (a) | | 7,760 | | | $ | 2,077,042 | |
Synopsys, Inc. (a) | | 4,362 | | | 2,435,392 | |
| | | | 4,512,434 | |
| | | | |
| Electrical Components & Equipment - 0.2% | | | | |
| Sensata Technologies Holding PLC | | 4,297 | | | 167,540 | |
| | | | |
| Electronic Components - 2.7% | | | | |
| Amphenol Corp. - Class A | | 34,390 | | | 2,209,901 | |
| | | | |
| Electronic Equipment & Instruments - 0.8% | | | | |
Keysight Technologies, Inc. (a) | | 4,966 | | | 693,105 | |
| | | | |
| Electronic Manufacturing Services - 1.6% | | | | |
| TE Connectivity Ltd. | | 8,799 | | | 1,357,950 | |
| | | | |
Semiconductor Materials & Equipment - 25.2%(b) | | | | |
| Applied Materials, Inc. | | 17,031 | | | 3,613,978 | |
| ASML Holding NV | | 10,071 | | | 9,433,506 | |
| Entegris, Inc. | | 4,316 | | | 510,539 | |
| KLA Corp. | | 3,853 | | | 3,171,289 | |
| Lam Research Corp. | | 3,728 | | | 3,434,383 | |
| MKS Instruments, Inc. | | 1,905 | | | 239,839 | |
| Teradyne, Inc. | | 4,448 | | | 583,400 | |
| | | | 20,986,934 | |
| | | | |
Semiconductors - 62.8%(b) | | | | |
Advanced Micro Devices, Inc. (a) | | 41,427 | | | 5,985,373 | |
| Analog Devices, Inc. | | 14,220 | | | 3,290,224 | |
ARM Holdings PLC - ADR (a) | | 3,009 | | | 433,808 | |
| Broadcom, Inc. | | 26,500 | | | 4,258,020 | |
| Intel Corp. | | 118,255 | | | 3,635,159 | |
Lattice Semiconductor Corp. (a) | | 3,891 | | | 206,223 | |
Macom Technology Solutions Holdings, Inc. (a) | | 1,650 | | | 166,518 | |
| Marvell Technology, Inc. | | 24,812 | | | 1,661,908 | |
| Microchip Technology, Inc. | | 15,234 | | | 1,352,474 | |
| Micron Technology, Inc. | | 29,425 | | | 3,231,453 | |
| Nvidia Corp. | | 175,765 | | | 20,568,020 | |
On Semiconductor Corp. (a) | | 12,302 | | | 962,631 | |
| Qualcomm, Inc. | | 10,681 | | | 1,932,727 | |
Rambus, Inc. (a) | | 3,063 | | | 157,561 | |
| STMicroelectronics NV | | 18,380 | | | 620,509 | |
| Texas Instruments, Inc. | | 18,335 | | | 3,736,856 | |
| | | | 52,199,464 | |
| | | | |
The accompanying notes are an integral part of these financial statements.
120
| | |
| STRIVE U.S. SEMICONDUCTOR ETF |
| SCHEDULE OF INVESTMENTS (CONTINUED) |
| July 31, 2024 |
| | | | | | | | | | | | | | |
| COMMON STOCKS - 99.1% (CONTINUED) | | Shares | | Value |
| Specialty Chemicals - 0.4% | | | | |
| DuPont de Nemours, Inc. | | 3,533 | | | $ | 295,712 | |
TOTAL COMMON STOCKS (Cost $75,005,124) | | | | 82,423,040 | |
| | | | |
| SHORT-TERM INVESTMENTS - 0.3% | | | | |
| Money Market Funds - 0.3% | | | | |
First American Government Obligations Fund - Class X, 5.23% (c) | | 210,350 | | | 210,350 | |
TOTAL SHORT-TERM INVESTMENTS (Cost $210,350) | | | | 210,350 | |
| | | | |
TOTAL INVESTMENTS - 99.4% (Cost $75,215,474) | | | | $ | 82,633,390 | |
| Other Assets in Excess of Liabilities - 0.6% | | | | 535,901 | |
| TOTAL NET ASSETS - 100.0% | | | | $ | 83,169,291 | |
| | | | |
| Percentages are stated as a percent of net assets. | | | | |
| | |
| ADR - American Depositary Receipt |
| NV - Naamloze Vennootschap |
| PLC - Public Limited Company |
|
| | | | | | | | |
| (a) | | Non-income producing security. |
| (b) | | To the extent that the Fund invests more heavily in a particular industry or sector of the economy, its performance will be especially sensitive to developments that significantly affect those industries or sectors. |
| (c) | | The rate shown represents the 7-day effective yield as of July 31, 2024. |
The Global Industry Classification Standard (GICS®) was developed by and/or is the exclusive property of MSCI, Inc. and Standard & Poor’s Financial Services LLC (“S&P”). GICS is a service mark of MSCI, Inc. and S&P and has been licensed for use by U.S. Bank Global Fund Services.
The accompanying notes are an integral part of these financial statements.
121
| | |
STRIVE NATURAL RESOURCES AND SECURITY ETF (formerly known as Strive FAANG 2.0 ETF) |
| SCHEDULE OF INVESTMENTS |
| July 31, 2024 |
| | | | | | | | | | | | | | |
| COMMON STOCKS - 99.7% | | Shares | | Value |
| Aerospace & Defense - 23.0% | | | | |
Axon Enterprise, Inc. (a) | | 381 | | | $ | 114,304 | |
Boeing Co. (a) | | 3,432 | | | 654,139 | |
| BWX Technologies, Inc. | | 3,847 | | | 382,738 | |
| General Dynamics Corp. | | 1,351 | | | 403,557 | |
| General Electric Co. | | 5,853 | | | 996,181 | |
| Howmet Aerospace, Inc. | | 2,246 | | | 214,942 | |
| L3Harris Technologies, Inc. | | 1,054 | | | 239,142 | |
| Lockheed Martin Corp. | | 1,340 | | | 726,173 | |
| Northrop Grumman Corp. | | 742 | | | 359,365 | |
| RTX Corp. | | 7,399 | | | 869,308 | |
| TransDigm Group, Inc. | | 298 | | | 385,678 | |
| | | | 5,345,527 | |
| | | | |
| Agricultural & Farm Machinery - 10.4% | | | | |
| AGCO Corp. | | 1,233 | | | 116,420 | |
| CNH Industrial NV | | 16,001 | | | 170,410 | |
| Deere & Co. | | 5,188 | | | 1,929,832 | |
| Toro Co. | | 2,064 | | | 197,587 | |
| | | | 2,414,249 | |
| | | | |
| Agricultural Products & Services - 0.7% | | | | |
| Ingredion, Inc. | | 1,301 | | | 161,805 | |
| | | | |
| Coal & Consumable Fuels - 5.2% | | | | |
| Cameco Corp. | | 18,295 | | | 832,693 | |
Centrus Energy Corp. - Class A (a) | | 568 | | | 24,816 | |
Denison Mines Corp. (a) | | 37,529 | | | 73,936 | |
Energy Fuels, Inc. (a) | | 6,680 | | | 38,271 | |
NexGen Energy Ltd. (a) | | 20,937 | | | 139,514 | |
Uranium Energy Corp. (a) | | 16,816 | | | 99,719 | |
| | | | 1,208,949 | |
| | | | |
| Copper - 5.5% | | | | |
| First Quantum Minerals Ltd. | | 12,035 | | | 147,316 | |
| Freeport-McMoRan, Inc. | | 24,686 | | | 1,120,991 | |
| | | | 1,268,307 | |
| | | | |
| Diversified Metals & Mining - 0.6% | | | | |
Ivanhoe Mines Ltd. - Class A (a) | | 10,749 | | | 140,528 | |
| | | | |
| Electric Utilities - 10.9% | | | | |
| Constellation Energy Corp. | | 13,343 | | | 2,532,501 | |
| | | | |
The accompanying notes are an integral part of these financial statements.
122
| | |
STRIVE NATURAL RESOURCES AND SECURITY ETF (formerly known as Strive FAANG 2.0 ETF) |
| SCHEDULE OF INVESTMENTS (CONTINUED) |
| July 31, 2024 |
| | | | | | | | | | | | | | |
| COMMON STOCKS - 99.7% (CONTINUED) | | Shares | | Value |
| Fertilizers & Agricultural Chemicals - 8.2% | | | | |
| CF Industries Holdings, Inc. | | 3,741 | | | $ | 285,775 | |
| Corteva, Inc. | | 13,683 | | | 767,616 | |
| FMC Corp. | | 2,487 | | | 145,141 | |
| Mosaic Co. | | 6,410 | | | 190,826 | |
| Nutrien Ltd. | | 9,899 | | | 507,695 | |
| | | | 1,897,053 | |
| | | | |
| Gold - 14.7% | | | | |
| Agnico Eagle Mines Ltd. | | 8,271 | | | 638,185 | |
| Barrick Gold Corp. | | 30,131 | | | 558,252 | |
| Franco-Nevada Corp. | | 3,295 | | | 424,616 | |
| Kinross Gold Corp. | | 21,145 | | | 192,207 | |
| Newmont Corp. | | 19,934 | | | 978,161 | |
| Royal Gold, Inc. | | 1,131 | | | 156,214 | |
| Wheaton Precious Metals Corp. | | 7,820 | | | 467,563 | |
| | | | 3,415,198 | |
| | | | |
| Heavy Electrical Equipment - 0.1% | | | | |
NuScale Power Corp. (a)(b) | | 2,903 | | | 29,669 | |
| | | | |
| Integrated Oil & Gas - 12.1% | | | | |
| Chevron Corp. | | 6,010 | | | 964,424 | |
| Exxon Mobil Corp. | | 15,620 | | | 1,852,376 | |
| | | | 2,816,800 | |
| | | | |
| Oil & Gas Equipment & Services - 1.0% | | | | |
| Schlumberger NV | | 4,962 | | | 239,615 | |
| | | | |
| Oil & Gas Exploration & Production - 4.2% | | | | |
| Canadian Natural Resources Ltd. | | 7,293 | | | 258,938 | |
| ConocoPhillips | | 4,057 | | | 451,138 | |
| EOG Resources, Inc. | | 2,010 | | | 254,868 | |
| | | | 964,944 | |
| | | | |
| Oil & Gas Refining & Marketing - 1.9% | | | | |
| Marathon Petroleum Corp. | | 1,233 | | | 218,266 | |
| Phillips 66 | | 1,467 | | | 213,419 | |
| | | | 431,685 | |
| | | | |
The accompanying notes are an integral part of these financial statements.
123
| | |
STRIVE NATURAL RESOURCES AND SECURITY ETF (formerly known as Strive FAANG 2.0 ETF) |
| SCHEDULE OF INVESTMENTS (CONTINUED) |
| July 31, 2024 |
| | | | | | | | | | | | | | |
| COMMON STOCKS - 99.7% (CONTINUED) | | Shares | | Value |
| Oil & Gas Storage & Transportation - 1.2% | | | | |
| Enbridge, Inc. | | 7,370 | | | $ | 275,818 | |
TOTAL COMMON STOCKS (Cost $22,307,075) | | | | 23,142,648 | |
| | | | |
| SHORT-TERM INVESTMENTS - 0.4% | | | | |
| Investments Purchased with Proceeds from Securities Lending - 0.1% | | | | |
First American Government Obligations Fund - Class X, 5.23% (c) | | 21,713 | | | 21,713 | |
| | | | |
| Money Market Funds - 0.3% | | | | |
First American Government Obligations Fund - Class X, 5.23% (c) | | 62,463 | | | 62,463 | |
TOTAL SHORT-TERM INVESTMENTS (Cost $84,176) | | | | 84,176 | |
| | | | |
TOTAL INVESTMENTS - 100.1% (Cost $22,391,251) | | | | $ | 23,226,824 | |
| Liabilities in Excess of Other Assets - (0.1)% | | | | (19,058) | |
| TOTAL NET ASSETS - 100.0% | | | | $ | 23,207,766 | |
Percentages are stated as a percent of net assets.
| | |
| NV - Naamloze Vennootschap |
| | | | | | | | |
| (a) | | Non-income producing security. |
| (b) | | All or a portion of this security is on loan as of July 31, 2024. The total market value of these securities was $22,760 which represented 0.1% of net assets. |
| (c) | | The rate shown represents the 7-day effective yield as of July 31, 2024. |
The Global Industry Classification Standard (GICS®) was developed by and/or is the exclusive property of MSCI, Inc. and Standard & Poor’s Financial Services LLC (“S&P”). GICS is a service mark of MSCI, Inc. and S&P and has been licensed for use by U.S. Bank Global Fund Services.
The accompanying notes are an integral part of these financial statements.
124
| | |
| STRIVE EMERGING MARKETS EX-CHINA ETF |
| SCHEDULE OF INVESTMENTS |
| July 31, 2024 |
| | | | | | | | | | | | | | |
| COMMON STOCKS - 96.8% | | Shares | | Value |
| Brazil - 4.1% | | | | |
| Ambev SA | | 91,582 | | | $ | 187,013 | |
| B3 SA - Brasil Bolsa Balcao | | 125,650 | | | 240,364 | |
| Banco BTG Pactual SA | | 26,937 | | | 154,779 | |
| Banco do Brasil SA | | 63,721 | | | 298,769 | |
| Banco Santander Brasil SA | | 83,949 | | | 423,741 | |
| Centrais Eletricas Brasileiras SA | | 25,012 | | | 174,496 | |
| Cia de Saneamento Basico do Estado de Sao Paulo SABESP | | 6,633 | | | 103,257 | |
| Energisa SA | | 11,157 | | | 86,654 | |
| Equatorial Energia SA | | 18,526 | | | 106,712 | |
| Klabin SA | | 23,483 | | | 91,256 | |
| Localiza Rent a Car SA | | 18,162 | | | 140,514 | |
| Petroleo Brasileiro SA | | 82,468 | | | 589,333 | |
| PRIO SA | | 17,701 | | | 150,310 | |
| Raia Drogasil SA | | 25,982 | | | 127,564 | |
Rede D'Or Sao Luiz SA (a) | | 22,494 | | | 110,240 | |
| Suzano SA | | 14,700 | | | 139,173 | |
| Vale SA | | 66,610 | | | 723,316 | |
| WEG SA | | 34,391 | | | 307,358 | |
| | | | 4,154,849 | |
| | | | |
| Greece - 0.1% | | | | |
| National Bank of Greece SA | | 15,161 | | | 133,069 | |
| | | | |
| Hungary - 0.3% | | | | |
| OTP Bank Nyrt | | 5,732 | | | 293,525 | |
| | | | |
India - 30.4%(b) | | | | |
| Adani Enterprises Ltd. | | 5,677 | | | 214,893 | |
Adani Green Energy Ltd. (c) | | 9,598 | | | 211,748 | |
| Adani Ports & Special Economic Zone Ltd. | | 16,594 | | | 311,135 | |
Adani Power Ltd. (c) | | 28,440 | | | 249,469 | |
| Apollo Hospitals Enterprise Ltd. | | 1,939 | | | 153,198 | |
| Asian Paints Ltd. | | 10,056 | | | 370,449 | |
Avenue Supermarts Ltd. (a)(c) | | 5,201 | | | 306,608 | |
| Axis Bank Ltd. | | 62,107 | | | 864,971 | |
| Bajaj Auto Ltd. | | 2,400 | | | 277,015 | |
| Bajaj Finance Ltd. | | 5,501 | | | 447,218 | |
| Bajaj Finserv Ltd. | | 10,375 | | | 204,659 | |
| Bank of Baroda | | 31,823 | | | 96,405 | |
| Bharat Electronics Ltd. | | 79,980 | | | 301,900 | |
| Bharat Petroleum Corp. Ltd. | | 41,698 | | | 174,329 | |
| Bharti Airtel Ltd. | | 50,530 | | | 900,145 | |
Britannia Industries Ltd. (c) | | 2,053 | | | 141,833 | |
| Cholamandalam Investment and Finance Co. Ltd. | | 8,521 | | | 144,166 | |
The accompanying notes are an integral part of these financial statements.
125
| | |
| STRIVE EMERGING MARKETS EX-CHINA ETF |
| SCHEDULE OF INVESTMENTS (CONTINUED) |
| July 31, 2024 |
| | | | | | | | | | | | | | |
| COMMON STOCKS - 96.8% (CONTINUED) | | Shares | | Value |
India - 30.4%(b) (Continued) | | | | |
| Cipla Ltd. | | 9,921 | | | $ | 182,984 | |
| Coal India Ltd. | | 35,461 | | | 221,163 | |
| Cummins India Ltd. | | 2,869 | | | 132,002 | |
| Divi's Laboratories Ltd. | | 2,329 | | | 136,944 | |
| DLF Ltd. | | 12,176 | | | 129,302 | |
| Dr Reddy's Laboratories Ltd. | | 2,175 | | | 175,356 | |
| Eicher Motors Ltd. | | 2,583 | | | 153,097 | |
| GAIL India Ltd. | | 56,974 | | | 163,970 | |
| Godrej Consumer Products Ltd. | | 7,180 | | | 123,549 | |
| Grasim Industries Ltd. | | 6,831 | | | 226,541 | |
| HCL Technologies Ltd. | | 20,969 | | | 411,372 | |
| HDFC Bank Ltd. | | 155,498 | | | 3,000,712 | |
HDFC Life Insurance Co. Ltd. (a) | | 18,011 | | | 153,912 | |
| Hero MotoCorp Ltd. | | 2,099 | | | 137,590 | |
| Hindalco Industries Ltd. | | 28,292 | | | 226,258 | |
| Hindustan Aeronautics Ltd. | | 3,963 | | | 233,006 | |
| Hindustan Unilever Ltd. | | 17,406 | | | 562,466 | |
| ICICI Bank Ltd. | | 142,393 | | | 2,066,115 | |
| Indian Hotels Co. Ltd. | | 16,617 | | | 127,423 | |
| Indian Oil Corp. Ltd. | | 58,873 | | | 127,739 | |
| IndusInd Bank Ltd. | | 13,936 | | | 237,646 | |
| Infosys Ltd. | | 68,213 | | | 1,522,045 | |
InterGlobe Aviation Ltd. (a)(c) | | 2,963 | | | 158,263 | |
| ITC Ltd. | | 150,099 | | | 888,005 | |
Jio Financial Services Ltd. (c) | | 63,011 | | | 247,216 | |
| JSW Steel Ltd. | | 17,100 | | | 189,577 | |
| Kotak Mahindra Bank Ltd. | | 29,204 | | | 630,583 | |
| Larsen & Toubro Ltd. | | 21,617 | | | 984,953 | |
| Mahindra & Mahindra Ltd. | | 19,030 | | | 660,889 | |
| Maruti Suzuki India Ltd. | | 2,761 | | | 432,501 | |
| Max Healthcare Institute Ltd. | | 12,809 | | | 141,088 | |
| Nestle India Ltd. | | 7,032 | | | 206,298 | |
| NTPC Ltd. | | 92,480 | | | 459,480 | |
| Oil & Natural Gas Corp. Ltd. | | 51,730 | | | 206,478 | |
| Power Finance Corp. Ltd. | | 28,062 | | | 186,614 | |
| Power Grid Corp. of India Ltd. | | 95,639 | | | 397,731 | |
| REC Ltd. | | 24,733 | | | 190,308 | |
| Reliance Industries Ltd. | | 65,532 | | | 2,356,503 | |
SBI Life Insurance Co. Ltd. (a) | | 7,723 | | | 161,754 | |
| Shree Cement Ltd. | | 562 | | | 186,198 | |
| Shriram Finance Ltd. | | 5,236 | | | 183,350 | |
| Siemens Ltd. | | 1,604 | | | 136,646 | |
| State Bank of India | | 66,397 | | | 691,814 | |
The accompanying notes are an integral part of these financial statements.
126
| | |
| STRIVE EMERGING MARKETS EX-CHINA ETF |
| SCHEDULE OF INVESTMENTS (CONTINUED) |
| July 31, 2024 |
| | | | | | | | | | | | | | |
| COMMON STOCKS - 96.8% (CONTINUED) | | Shares | | Value |
India - 30.4%(b) (Continued) | | | | |
| Sun Pharmaceutical Industries Ltd. | | 22,874 | | | $ | 469,712 | |
Suzlon Energy Ltd. (c) | | 220,910 | | | 183,052 | |
| Tata Consultancy Services Ltd. | | 18,915 | | | 990,686 | |
| Tata Consumer Products Ltd. | | 11,183 | | | 158,799 | |
| Tata Motors Ltd. | | 36,828 | | | 508,751 | |
| Tata Power Co. Ltd. | | 29,877 | | | 161,859 | |
| Tata Steel Ltd. | | 162,067 | | | 320,016 | |
| Tech Mahindra Ltd. | | 10,513 | | | 195,171 | |
| Titan Co. Ltd. | | 7,733 | | | 319,461 | |
| Trent Ltd. | | 4,392 | | | 306,285 | |
| TVS Motor Co. Ltd. | | 4,380 | | | 132,401 | |
| UltraTech Cement Ltd. | | 2,471 | | | 350,815 | |
| Varun Beverages Ltd. | | 9,471 | | | 178,428 | |
| Wipro Ltd. | | 24,440 | | | 152,369 | |
Yes Bank Ltd. (c) | | 418,760 | | | 132,587 | |
Zomato Ltd. (c) | | 144,585 | | | 396,220 | |
| | | | 30,474,194 | |
| | | | |
| Indonesia - 2.4% | | | | |
Amman Mineral Internasional PT (c) | | 254,529 | | | 185,105 | |
| Astra International Tbk PT | | 336,814 | | | 97,771 | |
| Bank Central Asia Tbk PT | | 1,169,704 | | | 739,158 | |
| Bank Mandiri Persero Tbk PT | | 819,188 | | | 322,435 | |
| Bank Rakyat Indonesia Persero Tbk PT | | 1,540,564 | | | 442,462 | |
| Barito Renewables Energy Tbk PT | | 320,038 | | | 170,254 | |
| Chandra Asri Pacific Tbk PT | | 480,030 | | | 284,889 | |
| Telkom Indonesia Persero Tbk PT | | 963,969 | | | 170,740 | |
| | | | 2,412,814 | |
| | | | |
| Kuwait - 1.1% | | | | |
| Kuwait Finance House KSCP | | 251,149 | | | 605,981 | |
| National Bank of Kuwait SAKP | | 176,101 | | | 521,759 | |
| | | | 1,127,740 | |
| | | | |
| Malaysia - 0.6% | | | | |
| CIMB Group Holdings Bhd | | 92,303 | | | 149,268 | |
| Malayan Banking Bhd | | 95,409 | | | 212,228 | |
| Public Bank Bhd | | 221,168 | | | 202,659 | |
| | | | 564,155 | |
| | | | |
| Mexico - 3.0% | | | | |
America Movil SAB de CV (c) | | 642,467 | | | 536,912 | |
| Cemex SAB de CV | | 299,335 | | | 192,155 | |
| Fomento Economico Mexicano SAB de CV | | 48,104 | | | 530,665 | |
The accompanying notes are an integral part of these financial statements.
127
| | |
| STRIVE EMERGING MARKETS EX-CHINA ETF |
| SCHEDULE OF INVESTMENTS (CONTINUED) |
| July 31, 2024 |
| | | | | | | | | | | | | | |
| COMMON STOCKS - 96.8% (CONTINUED) | | Shares | | Value |
| Mexico - 3.0% (Continued) | | | | |
| Grupo Comercial Chedraui SAB de CV | | 19,574 | | | $ | 145,741 | |
| Grupo Financiero Banorte SAB de CV | | 64,628 | | | 485,326 | |
| Grupo Mexico SAB de CV - Class B | | 140,861 | | | 792,197 | |
| Wal-Mart de Mexico SAB de CV | | 115,033 | | | 382,805 | |
| | | | 3,065,801 | |
| | | | |
| Peru - 0.3% | | | | |
| Credicorp Ltd. | | 808 | | | 137,877 | |
| Southern Copper Corp. | | 1,705 | | | 181,770 | |
| | | | 319,647 | |
| | | | |
| Philippines - 0.7% | | | | |
| Bank of the Philippine Islands | | 54,490 | | | 113,226 | |
| BDO Unibank, Inc. | | 55,531 | | | 130,324 | |
| International Container Terminal Services, Inc. | | 22,307 | | | 136,038 | |
| SM Investments Corp. | | 12,270 | | | 190,854 | |
| SM Prime Holdings, Inc. | | 217,510 | | | 107,310 | |
| | | | 677,752 | |
| | | | |
| Poland - 1.1% | | | | |
Allegro.eu SA (a)(c) | | 24,601 | | | 225,919 | |
| Bank Polska Kasa Opieki SA | | 4,121 | | | 166,766 | |
Dino Polska SA (a)(c) | | 933 | | | 82,856 | |
| ORLEN SA | | 12,159 | | | 198,381 | |
| Powszechna Kasa Oszczednosci Bank Polski SA | | 18,919 | | | 281,420 | |
| Powszechny Zaklad Ubezpieczen SA | | 11,155 | | | 136,549 | |
| | | | 1,091,891 | |
| | | | |
| Qatar - 0.8% | | | | |
| Industries Qatar QSC | | 37,100 | | | 133,381 | |
| Qatar Islamic Bank QPSC | | 38,936 | | | 210,667 | |
| Qatar National Bank QPSC | | 99,627 | | | 418,373 | |
| | | | 762,421 | |
| | | | |
| Saudi Arabia - 7.2% | | | | |
| ACWA Power Co. | | 4,823 | | | 507,765 | |
| Al Rajhi Bank | | 87,634 | | | 1,999,379 | |
| Alinma Bank | | 50,337 | | | 434,691 | |
| Arab National Bank | | 19,489 | | | 111,369 | |
| Bank AlBilad | | 14,183 | | | 139,112 | |
| Banque Saudi Fransi | | 17,350 | | | 171,100 | |
| Dr Sulaiman Al Habib Medical Services Group Co. | | 2,090 | | | 160,431 | |
| Elm Co. | | 514 | | | 125,215 | |
| Etihad Etisalat Co. | | 10,796 | | | 149,629 | |
The accompanying notes are an integral part of these financial statements.
128
| | |
| STRIVE EMERGING MARKETS EX-CHINA ETF |
| SCHEDULE OF INVESTMENTS (CONTINUED) |
| July 31, 2024 |
| | | | | | | | | | | | | | |
| COMMON STOCKS - 96.8% (CONTINUED) | | Shares | | Value |
| Saudi Arabia - 7.2% (Continued) | | | | |
| Riyad Bank | | 39,586 | | | $ | 289,623 | |
| SABIC Agri-Nutrients Co. | | 4,627 | | | 145,029 | |
Saudi Arabian Mining Co. (c) | | 27,117 | | | 311,146 | |
Saudi Arabian Oil Co. (a) | | 98,027 | | | 721,113 | |
| Saudi Awwal Bank | | 22,329 | | | 234,187 | |
| Saudi Basic Industries Corp. | | 20,122 | | | 422,616 | |
| Saudi National Bank | | 84,239 | | | 853,190 | |
| Saudi Telecom Co. | | 40,704 | | | 417,683 | |
| | | | 7,193,278 | |
| | | | |
| South Africa - 2.8% | | | | |
| Absa Group Ltd. | | 14,205 | | | 124,637 | |
| Anglogold Ashanti PLC | | 7,435 | | | 213,344 | |
| Bid Corp. Ltd. | | 5,975 | | | 148,718 | |
| Capitec Bank Holdings Ltd. | | 1,850 | | | 288,077 | |
| FirstRand Ltd. | | 102,503 | | | 459,821 | |
| Gold Fields Ltd. | | 11,894 | | | 208,459 | |
| MTN Group Ltd. | | 31,452 | | | 136,619 | |
| Naspers Ltd. | | 3,316 | | | 641,299 | |
| Nedbank Group Ltd. | | 9,640 | | | 147,179 | |
| Sanlam Ltd. | | 35,523 | | | 159,061 | |
| Shoprite Holdings Ltd. | | 9,780 | | | 163,531 | |
| Standard Bank Group Ltd. | | 28,277 | | | 344,339 | |
| | | | 3,035,084 | |
| | | | |
| South Korea - 14.2% | | | | |
| Celltrion, Inc. | | 3,010 | | | 447,100 | |
Doosan Enerbility Co. Ltd. (c) | | 8,158 | | | 111,578 | |
Ecopro BM Co. Ltd. (c) | | 820 | | | 107,150 | |
Ecopro Co. Ltd. (c) | | 1,940 | | | 130,061 | |
| Hana Financial Group, Inc. | | 5,835 | | | 274,214 | |
HLB, Inc. (c) | | 2,498 | | | 146,605 | |
| HMM Co. Ltd. | | 4,802 | | | 63,480 | |
| Hyundai Mobis Co. Ltd. | | 1,116 | | | 178,738 | |
| Hyundai Motor Co. | | 2,617 | | | 473,313 | |
| Kakao Corp. | | 5,861 | | | 166,879 | |
| KB Financial Group, Inc. | | 6,817 | | | 435,238 | |
| Kia Corp. | | 4,775 | | | 388,798 | |
| KT&G Corp. | | 1,902 | | | 128,895 | |
| LG Chem Ltd. | | 899 | | | 199,488 | |
| LG Corp. | | 1,943 | | | 122,359 | |
| LG Electronics, Inc. | | 1,888 | | | 142,620 | |
LG Energy Solution Ltd. (c) | | 445 | | | 104,725 | |
The accompanying notes are an integral part of these financial statements.
129
| | |
| STRIVE EMERGING MARKETS EX-CHINA ETF |
| SCHEDULE OF INVESTMENTS (CONTINUED) |
| July 31, 2024 |
| | | | | | | | | | | | | | |
| COMMON STOCKS - 96.8% (CONTINUED) | | Shares | | Value |
| South Korea - 14.2% (Continued) | | | | |
| Naver Corp. | | 2,865 | | | $ | 362,092 | |
| Posco Future M Co. Ltd. | | 514 | | | 78,962 | |
| Posco Holdings, Inc. | | 1,416 | | | 361,521 | |
Samsung Biologics Co. Ltd. (a)(c) | | 362 | | | 246,636 | |
| Samsung C&T Corp. | | 1,441 | | | 162,548 | |
| Samsung Electro-Mechanics Co. Ltd. | | 995 | | | 115,346 | |
| Samsung Electronics Co. Ltd. | | 110,186 | | | 6,714,803 | |
| Samsung Fire & Marine Insurance Co. Ltd. | | 619 | | | 167,480 | |
| Samsung SDI Co. Ltd. | | 1,041 | | | 241,583 | |
| Shinhan Financial Group Co. Ltd. | | 9,778 | | | 424,714 | |
| SK Hynix, Inc. | | 10,757 | | | 1,520,474 | |
| SK Telecom Co. Ltd. | | 2,675 | | | 105,115 | |
| Woori Financial Group, Inc. | | 10,973 | | | 125,451 | |
| | | | 14,247,966 | |
| | | | |
| Taiwan - 22.9% | | | | |
| Accton Technology Corp. | | 8,360 | | | 128,948 | |
| Alchip Technologies Ltd. | | 1,255 | | | 100,033 | |
| ASE Technology Holding Co. Ltd. | | 71,041 | | | 324,191 | |
| Asustek Computer, Inc. | | 10,723 | | | 148,758 | |
| Cathay Financial Holding Co. Ltd. | | 160,889 | | | 305,430 | |
| Chailease Holding Co. Ltd. | | 25,744 | | | 119,046 | |
| China Development Financial Holding Corp. | | 275,693 | | | 135,037 | |
| China Steel Corp. | | 205,119 | | | 144,775 | |
| Chunghwa Telecom Co. Ltd. | | 81,203 | | | 300,157 | |
| CTBC Financial Holding Co. Ltd. | | 329,060 | | | 355,389 | |
| Delta Electronics, Inc. | | 35,952 | | | 453,365 | |
| E Ink Holdings, Inc. | | 13,128 | | | 107,636 | |
| E.Sun Financial Holding Co. Ltd. | | 267,333 | | | 215,932 | |
| Evergreen Marine Corp. Taiwan Ltd. | | 27,793 | | | 144,165 | |
| Far EasTone Telecommunications Co. Ltd. | | 40,401 | | | 105,950 | |
| First Financial Holding Co. Ltd. | | 179,070 | | | 159,894 | |
| Formosa Plastics Corp. | | 77,659 | | | 136,795 | |
| Fubon Financial Holding Co. Ltd. | | 141,205 | | | 378,895 | |
| Hon Hai Precision Industry Co. Ltd. | | 220,050 | | | 1,325,522 | |
| Hotai Motor Co. Ltd. | | 4,882 | | | 96,095 | |
| Hua Nan Financial Holdings Co. Ltd. | | 161,832 | | | 136,624 | |
| Largan Precision Co. Ltd. | | 1,558 | | | 133,428 | |
| Lite-On Technology Corp. | | 35,683 | | | 107,581 | |
| MediaTek, Inc. | | 26,666 | | | 989,733 | |
| Mega Financial Holding Co. Ltd. | | 203,233 | | | 267,103 | |
| Nan Ya Plastics Corp. | | 79,551 | | | 121,008 | |
| Novatek Microelectronics Corp. | | 9,888 | | | 157,330 | |
The accompanying notes are an integral part of these financial statements.
130
| | |
| STRIVE EMERGING MARKETS EX-CHINA ETF |
| SCHEDULE OF INVESTMENTS (CONTINUED) |
| July 31, 2024 |
| | | | | | | | | | | | | | |
| COMMON STOCKS - 96.8% (CONTINUED) | | Shares | | Value |
| Taiwan - 22.9% (Continued) | | | | |
| Pegatron Corp. | | 32,686 | | | $ | 99,937 | |
| Quanta Computer, Inc. | | 50,778 | | | 420,961 | |
| Realtek Semiconductor Corp. | | 7,538 | | | 117,416 | |
| Shanghai Commercial & Savings Bank Ltd. | | 70,982 | | | 90,050 | |
| SinoPac Financial Holdings Co. Ltd. | | 182,863 | | | 147,982 | |
| Taishin Financial Holding Co. Ltd. | | 199,675 | | | 123,316 | |
| Taiwan Cooperative Financial Holding Co. Ltd. | | 163,411 | | | 133,483 | |
| Taiwan Mobile Co. Ltd. | | 41,417 | | | 132,933 | |
| Taiwan Semiconductor Manufacturing Co. Ltd. | | 462,503 | | | 13,142,008 | |
| TCC Group Holdings Co. Ltd. | | 122,465 | | | 129,097 | |
| Unimicron Technology Corp. | | 20,367 | | | 111,222 | |
| Uni-President Enterprises Corp. | | 82,678 | | | 211,034 | |
| United Microelectronics Corp. | | 207,838 | | | 318,681 | |
| Wistron Corp. | | 44,157 | | | 130,039 | |
| Wiwynn Corp. | | 1,425 | | | 88,006 | |
| Yageo Corp. | | 5,644 | | | 135,992 | |
| Yang Ming Marine Transport Corp. | | 42,886 | | | 82,719 | |
| Yuanta Financial Holding Co. Ltd. | | 229,030 | | | 228,542 | |
| | | | 22,942,238 | |
| | | | |
| Thailand - 2.0% | | | | |
| Advanced Info Service PCL | | 20,147 | | | 132,260 | |
| Airports of Thailand PCL | | 79,744 | | | 126,400 | |
| Bangkok Bank PCL | | 34,442 | | | 132,376 | |
| Bangkok Dusit Medical Services PCL | | 236,892 | | | 174,454 | |
| Central Pattana PCL | | 63,427 | | | 98,312 | |
| CP ALL PCL | | 120,130 | | | 196,313 | |
| Delta Electronics Thailand PCL | | 101,411 | | | 290,193 | |
| Gulf Energy Development PCL | | 125,185 | | | 167,698 | |
| Kasikornbank PCL | | 47,436 | | | 174,999 | |
| PTT Exploration & Production PCL | | 25,812 | | | 106,449 | |
| PTT PCL | | 295,256 | | | 265,063 | |
| SCB X PCL | | 49,313 | | | 142,495 | |
| | | | 2,007,012 | |
| | | | |
| Turkey - 0.4% | | | | |
| BIM Birlesik Magazalar AS | | 8,713 | | | 164,564 | |
| KOC Holding AS | | 20,940 | | | 136,005 | |
Turk Hava Yollari AO (c) | | 13,942 | | | 121,769 | |
| | | | 422,338 | |
| | | | |
| United Arab Emirates - 2.2% | | | | |
| Abu Dhabi Commercial Bank PJSC | | 56,655 | | | 137,128 | |
| Abu Dhabi Islamic Bank PJSC | | 43,716 | | | 145,920 | |
The accompanying notes are an integral part of these financial statements.
131
| | |
| STRIVE EMERGING MARKETS EX-CHINA ETF |
| SCHEDULE OF INVESTMENTS (CONTINUED) |
| July 31, 2024 |
| | | | | | | | | | | | | | |
| COMMON STOCKS - 96.8% (CONTINUED) | | Shares | | Value |
| United Arab Emirates - 2.2% (Continued) | | | | |
| Aldar Properties PJSC | | 74,328 | | | $ | 149,548 | |
| Dubai Electricity & Water Authority PJSC | | 173,923 | | | 112,699 | |
| Dubai Islamic Bank PJSC | | 106,135 | | | 169,044 | |
| Emaar Properties PJSC | | 139,172 | | | 327,000 | |
| Emirates NBD Bank PJSC | | 55,045 | | | 286,244 | |
| Emirates Telecommunications Group Co. PJSC | | 77,935 | | | 347,561 | |
| First Abu Dhabi Bank PJSC | | 155,037 | | | 550,425 | |
| | | | 2,225,569 | |
| | | | |
TOTAL COMMON STOCKS (Cost $82,331,512) | | | | 97,151,343 | |
| | | | |
| PREFERRED STOCKS - 2.8% | | | | |
| Brazil - 1.8% | | | | |
| Banco Bradesco SA 0.00% | | 116,271 | | | 255,313 | |
| Itau Unibanco Holding SA 0.00% | | 108,037 | | | 649,236 | |
| Itausa SA 0.00% | | 112,084 | | | 200,541 | |
| Klabin SA 0.00% | | 3 | | | 3 | |
| Petroleo Brasileiro SA 0.00% | | 102,305 | | | 673,936 | |
| | | | 1,779,029 | |
| | | | |
| Chile - 0.1% | | | | |
| Sociedad Quimica y Minera de Chile SA 0.00% | | 2,758 | | | 104,566 | |
| | | | |
| South Korea - 0.9% | | | | |
| Samsung Electronics Co. Ltd. 0.00% | | 18,416 | | | 868,130 | |
TOTAL PREFERRED STOCKS (Cost $2,914,912) | | | | 2,751,725 | |
| | | | |
| REAL ESTATE INVESTMENT TRUSTS - 0.1% | | | | |
| Mexico - 0.1% | | | | |
| Fibra Uno Administracion SAB de CV | | 77,905 | | | 99,101 | |
TOTAL REAL ESTATE INVESTMENT TRUSTS (Cost $111,864) | | | | 99,101 | |
| | | | |
RIGHTS - 0.0%(d) | | Contracts | | |
Brazil - 0.0%(d) | | | | |
Localiza Rent a Car SA, Expires 08/07/2024, Exercise Price $33.48 (c) | | 184 | | | 356 | |
| | | | |
India - 0.0%(d) | | | | |
Tata Consumer Products Ltd., Expires 08/20/2024, Exercise Price $818.00 (c)(e) | | 430 | | | 1,906 | |
TOTAL RIGHTS (Cost $1,546) | | | | 2,262 | |
| | | | |
The accompanying notes are an integral part of these financial statements.
132
| | |
| STRIVE EMERGING MARKETS EX-CHINA ETF |
| SCHEDULE OF INVESTMENTS (CONTINUED) |
| July 31, 2024 |
| | | | | | | | | | | | | | |
| SHORT-TERM INVESTMENTS - 1.3% | | Shares | | Value |
| Money Market Funds - 1.3% | | | | |
First American Government Obligations Fund - Class X, 5.23% (f) | | 1,296,373 | | | $ | 1,296,373 | |
TOTAL SHORT-TERM INVESTMENTS (Cost $1,296,373) | | | | 1,296,373 | |
| | | | |
TOTAL INVESTMENTS - 101.0% (Cost $86,656,207) | | | | $ | 101,300,804 | |
| Liabilities in Excess of Other Assets - (1.0)% | | | | (955,137) | |
| TOTAL NET ASSETS - 100.0% | | | | $ | 100,345,667 | |
Percentages are stated as a percent of net assets.
| | |
| PJSC - Public Joint Stock Company |
| PLC - Public Limited Company |
| SA - Sociedad Anónima |
| SAB de CV - Sociedad Anónima Bursátil de Capital Variable |
| | | | | | | | |
| (a) | | Security is exempt from registration pursuant to Rule 144A under the Securities Act of 1933, as amended. These securities may only be resold in transactions exempt from registration to qualified institutional investors. As of July 31, 2024, the value of these securities total $2,167,301 or 2.2% of the Fund’s net assets. |
| (b) | | To the extent that the Fund invests a significant portion of its assets in the securities of companies of a single country or region, it is more likely to be impacted by events or conditions affecting the country or region. |
| (c) | | Non-income producing security. |
| (d) | | Represents less than 0.05% of net assets. |
| (e) | | Fair value determined using significant unobservable inputs in accordance with procedures established by and under the supervision of the Adviser, acting as Valuation Designee. These securities represented $1,906 or 0.0% of net assets as of July 31, 2024. |
| (f) | | The rate shown represents the 7-day effective yield as of July 31, 2024. |
The accompanying notes are an integral part of these financial statements.
133
| | |
| STRIVE INTERNATIONAL DEVELOPED MARKETS ETF |
| SCHEDULE OF INVESTMENTS |
| July 31, 2024 |
| | | | | | | | | | | | | | |
| COMMON STOCKS - 99.4% | | Shares | | Value |
| Australia - 6.0% | | | | |
| ANZ Group Holdings Ltd. | | 2,104 | | | $ | 39,970 | |
| Aristocrat Leisure Ltd. | | 408 | | | 14,467 | |
| BHP Group Ltd. | | 3,568 | | | 98,698 | |
| Commonwealth Bank of Australia | | 1,176 | | | 105,736 | |
| CSL Ltd. | | 336 | | | 68,054 | |
| Fortescue Ltd. | | 1,112 | | | 13,722 | |
| Macquarie Group Ltd. | | 272 | | | 37,318 | |
| National Australia Bank Ltd. | | 2,184 | | | 55,101 | |
| QBE Insurance Group Ltd. | | 1,056 | | | 12,486 | |
| Rio Tinto Ltd. | | 264 | | | 20,282 | |
| Transurban Group | | 2,176 | | | 18,513 | |
| Wesfarmers Ltd. | | 792 | | | 38,145 | |
| Westpac Banking Corp. | | 2,440 | | | 47,550 | |
| Woodside Energy Group Ltd. | | 1,336 | | | 24,114 | |
| Woolworths Group Ltd. | | 856 | | | 19,312 | |
| | | | 613,468 | |
| | | | |
| Belgium - 0.7% | | | | |
| Anheuser-Busch InBev SA/NV | | 648 | | | 38,543 | |
| KBC Group NV | | 192 | | | 14,886 | |
| UCB SA | | 88 | | | 14,729 | |
| | | | 68,158 | |
| | | | |
| Canada - 11.3% | | | | |
| Agnico Eagle Mines Ltd. | | 336 | | | 25,925 | |
| Alimentation Couche-Tard, Inc. | | 512 | | | 31,562 | |
| Bank of Montreal | | 496 | | | 41,835 | |
| Bank of Nova Scotia | | 824 | | | 38,477 | |
| Barrick Gold Corp. | | 1,224 | | | 22,678 | |
| Brookfield Corp. | | 920 | | | 44,865 | |
| Cameco Corp. | | 304 | | | 13,836 | |
| Canadian Imperial Bank of Commerce | | 640 | | | 33,097 | |
| Canadian National Railway Co. | | 440 | | | 50,936 | |
| Canadian Natural Resources Ltd. | | 1,480 | | | 52,547 | |
| Canadian Pacific Kansas City Ltd. | | 656 | | | 55,012 | |
| Cenovus Energy, Inc. | | 1,144 | | | 23,051 | |
CGI, Inc. (a) | | 144 | | | 16,420 | |
| Constellation Software, Inc. | | 16 | | | 50,484 | |
| Dollarama, Inc. | | 192 | | | 17,999 | |
| Enbridge, Inc. | | 1,496 | | | 55,987 | |
| Fairfax Financial Holdings Ltd. | | 16 | | | 18,869 | |
| Fortis, Inc./Canada | | 344 | | | 14,381 | |
| Franco-Nevada Corp. | | 136 | | | 17,526 | |
The accompanying notes are an integral part of these financial statements.
134
| | |
| STRIVE INTERNATIONAL DEVELOPED MARKETS ETF |
| SCHEDULE OF INVESTMENTS (CONTINUED) |
| July 31, 2024 |
| | | | | | | | | | | | | | |
| COMMON STOCKS - 99.4% (CONTINUED) | | Shares | | Value |
| Canada - 11.3% (Continued) | | | | |
| Intact Financial Corp. | | 128 | | | $ | 23,261 | |
| Manulife Financial Corp. | | 1,272 | | | 33,886 | |
| National Bank of Canada | | 240 | | | 20,074 | |
| Nutrien Ltd. | | 344 | | | 17,643 | |
| Pembina Pipeline Corp. | | 384 | | | 14,883 | |
| Restaurant Brands International, Inc. | | 216 | | | 15,124 | |
| Royal Bank of Canada | | 936 | | | 104,593 | |
Shopify, Inc. - Class A (a) | | 824 | | | 50,467 | |
| Sun Life Financial, Inc. | | 408 | | | 20,254 | |
| Suncor Energy, Inc. | | 904 | | | 36,104 | |
| TC Energy Corp. | | 728 | | | 30,910 | |
| Teck Resources Ltd. - Class B | | 352 | | | 17,255 | |
| Thomson Reuters Corp. | | 96 | | | 15,558 | |
| Toronto-Dominion Bank | | 1,192 | | | 70,390 | |
| Waste Connections, Inc. | | 184 | | | 32,725 | |
| Wheaton Precious Metals Corp. | | 320 | | | 19,133 | |
| WSP Global, Inc. | | 88 | | | 14,618 | |
| | | | 1,162,365 | |
| | | | |
| Denmark - 3.8% | | | | |
| Danske Bank AS | | 472 | | | 14,443 | |
| DSV AS | | 112 | | | 20,531 | |
| Novo Nordisk AS | | 2,384 | | | 315,313 | |
| Novonesis (Novozymes) B | | 288 | | | 18,336 | |
Vestas Wind Systems AS (a) | | 712 | | | 17,579 | |
| | | | 386,202 | |
| | | | |
| Finland - 0.6% | | | | |
| Kone Oyj - Class B | | 248 | | | 12,658 | |
| Nokia Oyj | | 3,624 | | | 14,202 | |
| Nordea Bank Abp | | 2,296 | | | 26,886 | |
| UPM-Kymmene Oyj | | 368 | | | 12,159 | |
| | | | 65,905 | |
| | | | |
| France - 11.6% | | | | |
| Air Liquide SA | | 408 | | | 74,526 | |
| Airbus SE | | 416 | | | 63,012 | |
| AXA SA | | 1,552 | | | 54,572 | |
| BNP Paribas SA | | 728 | | | 49,999 | |
| Capgemini SE | | 112 | | | 22,255 | |
| Cie de Saint-Gobain SA | | 280 | | | 24,073 | |
| Cie Generale des Etablissements Michelin SCA | | 480 | | | 19,013 | |
| Credit Agricole SA | | 912 | | | 13,848 | |
| Danone SA | | 456 | | | 29,689 | |
The accompanying notes are an integral part of these financial statements.
135
| | |
| STRIVE INTERNATIONAL DEVELOPED MARKETS ETF |
| SCHEDULE OF INVESTMENTS (CONTINUED) |
| July 31, 2024 |
| | | | | | | | | | | | | | |
| COMMON STOCKS - 99.4% (CONTINUED) | | Shares | | Value |
| France - 11.6% (Continued) | | | | |
| Dassault Systemes SE | | 472 | | | $ | 17,899 | |
| Engie SA | | 1,240 | | | 19,513 | |
| EssilorLuxottica SA | | 216 | | | 49,488 | |
| Hermes International | | 24 | | | 52,545 | |
| Kering SA | | 48 | | | 14,779 | |
| Legrand SA | | 184 | | | 19,889 | |
| L'Oreal SA | | 168 | | | 72,845 | |
| LVMH Moet Hennessy Louis Vuitton SE | | 176 | | | 124,381 | |
| Orange SA | | 1,440 | | | 15,974 | |
| Pernod Ricard SA | | 136 | | | 18,251 | |
| Publicis Groupe SA | | 160 | | | 16,731 | |
| Safran SA | | 264 | | | 58,029 | |
| Sanofi SA | | 800 | | | 82,537 | |
| Schneider Electric SE | | 400 | | | 96,472 | |
| Societe Generale SA | | 552 | | | 14,326 | |
| TotalEnergies SE | | 1,576 | | | 106,568 | |
| Veolia Environnement SA | | 480 | | | 15,086 | |
| Vinci SA | | 400 | | | 45,714 | |
| | | | 1,192,014 | |
| | | | |
| Germany - 7.7% | | | | |
| adidas AG | | 112 | | | 28,036 | |
| Allianz SE | | 264 | | | 74,514 | |
| BASF SE | | 632 | | | 29,480 | |
| Bayer AG | | 664 | | | 19,758 | |
| Bayerische Motoren Werke AG | | 208 | | | 19,319 | |
| Deutsche Bank AG | | 1,280 | | | 19,998 | |
| Deutsche Boerse AG | | 136 | | | 27,877 | |
| Deutsche Post AG | | 680 | | | 30,357 | |
| Deutsche Telekom AG | | 2,288 | | | 59,850 | |
| E.ON SE | | 1,560 | | | 21,889 | |
| Infineon Technologies AG | | 864 | | | 29,969 | |
| Mercedes-Benz Group AG | | 592 | | | 39,185 | |
| Merck KGaA | | 88 | | | 15,790 | |
| Muenchener Rueckversicherungs-Gesellschaft AG in Muenchen | | 96 | | | 47,335 | |
| Rheinmetall AG | | 32 | | | 17,448 | |
| RWE AG | | 440 | | | 16,424 | |
| SAP SE | | 728 | | | 153,652 | |
| Siemens AG | | 560 | | | 102,679 | |
| Volkswagen AG | | 128 | | | 15,113 | |
| Vonovia SE | | 544 | | | 16,726 | |
| | | | 785,399 | |
| | | | |
The accompanying notes are an integral part of these financial statements.
136
| | |
| STRIVE INTERNATIONAL DEVELOPED MARKETS ETF |
| SCHEDULE OF INVESTMENTS (CONTINUED) |
| July 31, 2024 |
| | | | | | | | | | | | | | |
| COMMON STOCKS - 99.4% (CONTINUED) | | Shares | | Value |
| Hong Kong - 0.9% | | | | |
| AIA Group Ltd. | | 7,896 | | | $ | 53,059 | |
| Hong Kong Exchanges & Clearing Ltd. | | 840 | | | 24,922 | |
| Prudential PLC | | 1,936 | | | 17,402 | |
| | | | 95,383 | |
| | | | |
| Ireland - 0.5% | | | | |
| Experian PLC | | 648 | | | 30,589 | |
Flutter Entertainment PLC (a) | | 120 | | | 23,718 | |
| | | | 54,307 | |
| | | | |
| Italy - 2.0% | | | | |
| Enel SpA | | 5,464 | | | 38,993 | |
| Eni SpA | | 1,536 | | | 24,599 | |
| Ferrari NV | | 72 | | | 29,737 | |
| Generali | | 744 | | | 19,268 | |
| Intesa Sanpaolo SpA | | 11,352 | | | 46,078 | |
| UniCredit SpA | | 1,120 | | | 46,006 | |
| | | | 204,681 | |
| | | | |
| Japan - 19.8% | | | | |
| Advantest Corp. | | 520 | | | 20,928 | |
| Ajinomoto Co., Inc. | | 352 | | | 14,641 | |
| Bridgestone Corp. | | 400 | | | 16,515 | |
| Canon, Inc. | | 680 | | | 21,525 | |
| Central Japan Railway Co. | | 600 | | | 14,199 | |
| Chugai Pharmaceutical Co. Ltd. | | 448 | | | 19,765 | |
| Dai-ichi Life Holdings, Inc. | | 640 | | | 19,857 | |
| Daiichi Sankyo Co. Ltd. | | 1,328 | | | 54,501 | |
| Daikin Industries Ltd. | | 192 | | | 28,075 | |
| Denso Corp. | | 1,304 | | | 21,884 | |
| Disco Corp. | | 64 | | | 21,130 | |
| Fanuc Corp. | | 664 | | | 19,990 | |
| Fast Retailing Co. Ltd. | | 120 | | | 33,363 | |
| Fujifilm Holdings Corp. | | 800 | | | 19,118 | |
| Fujitsu Ltd. | | 1,248 | | | 22,764 | |
| Hitachi Ltd. | | 3,200 | | | 70,235 | |
| Honda Motor Co. Ltd. | | 3,216 | | | 35,358 | |
| Hoya Corp. | | 240 | | | 30,343 | |
| ITOCHU Corp. | | 1,000 | | | 51,954 | |
| Japan Post Holdings Co. Ltd. | | 1,376 | | | 14,733 | |
| Japan Tobacco, Inc. | | 768 | | | 22,732 | |
| Kao Corp. | | 320 | | | 14,107 | |
| KDDI Corp. | | 1,032 | | | 31,138 | |
| Keyence Corp. | | 128 | | | 56,299 | |
The accompanying notes are an integral part of these financial statements.
137
| | |
| STRIVE INTERNATIONAL DEVELOPED MARKETS ETF |
| SCHEDULE OF INVESTMENTS (CONTINUED) |
| July 31, 2024 |
| | | | | | | | | | | | | | |
| COMMON STOCKS - 99.4% (CONTINUED) | | Shares | | Value |
| Japan - 19.8% (Continued) | | | | |
| Komatsu Ltd. | | 656 | | | $ | 19,079 | |
| Lasertec Corp. | | 56 | | | 10,030 | |
| Marubeni Corp. | | 1,152 | | | 21,997 | |
| Mitsubishi Corp. | | 2,712 | | | 56,918 | |
| Mitsubishi Electric Corp. | | 1,384 | | | 24,030 | |
| Mitsubishi Estate Co. Ltd. | | 800 | | | 13,749 | |
| Mitsubishi Heavy Industries Ltd. | | 2,216 | | | 27,070 | |
| Mitsubishi UFJ Financial Group, Inc. | | 7,032 | | | 82,147 | |
| Mitsui & Co. Ltd. | | 1,968 | | | 46,374 | |
| Mitsui Fudosan Co. Ltd. | | 1,824 | | | 19,159 | |
| Mizuho Financial Group, Inc. | | 1,680 | | | 38,668 | |
| MS&AD Insurance Group Holdings, Inc. | | 952 | | | 22,763 | |
| Murata Manufacturing Co. Ltd. | | 1,296 | | | 28,990 | |
| NEC Corp. | | 176 | | | 15,273 | |
| Nidec Corp. | | 344 | | | 15,381 | |
| Nintendo Co. Ltd. | | 808 | | | 45,242 | |
| Nippon Steel Corp. | | 608 | | | 13,312 | |
| Nippon Telegraph & Telephone Corp. | | 36,720 | | | 39,317 | |
| Olympus Corp. | | 808 | | | 14,045 | |
| Oriental Land Co. Ltd. | | 720 | | | 20,580 | |
| ORIX Corp. | | 760 | | | 18,588 | |
| Panasonic Holdings Corp. | | 1,520 | | | 12,643 | |
| Recruit Holdings Co. Ltd. | | 976 | | | 56,408 | |
| Renesas Electronics Corp. | | 952 | | | 16,383 | |
| Seven & I Holdings Co. Ltd. | | 1,504 | | | 18,177 | |
| Shin-Etsu Chemical Co. Ltd. | | 1,384 | | | 62,343 | |
| SMC Corp. | | 40 | | | 19,799 | |
| SoftBank Corp. | | 1,944 | | | 25,500 | |
| SoftBank Group Corp. | | 704 | | | 43,056 | |
| Sompo Holdings, Inc. | | 640 | | | 14,812 | |
| Sony Group Corp. | | 800 | | | 72,254 | |
| Sumitomo Corp. | | 816 | | | 20,579 | |
| Sumitomo Mitsui Financial Group, Inc. | | 816 | | | 59,455 | |
| Suzuki Motor Corp. | | 1,200 | | | 14,094 | |
| Takeda Pharmaceutical Co. Ltd. | | 1,032 | | | 29,636 | |
| TDK Corp. | | 264 | | | 18,566 | |
| Terumo Corp. | | 992 | | | 17,919 | |
| Tokio Marine Holdings, Inc. | | 1,288 | | | 51,776 | |
| Tokyo Electron Ltd. | | 312 | | | 64,606 | |
| Toyota Motor Corp. | | 7,592 | | | 149,453 | |
| | | | 2,035,325 | |
| | | | |
The accompanying notes are an integral part of these financial statements.
138
| | |
| STRIVE INTERNATIONAL DEVELOPED MARKETS ETF |
| SCHEDULE OF INVESTMENTS (CONTINUED) |
| July 31, 2024 |
| | | | | | | | | | | | | | |
| COMMON STOCKS - 99.4% (CONTINUED) | | Shares | | Value |
| Netherlands - 4.9% | | | | |
Adyen NV (a)(b) | | 16 | | | $ | 19,578 | |
Argenx SE (a) | | 40 | | | 20,394 | |
| ASM International NV | | 32 | | | 21,943 | |
| ASML Holding NV | | 272 | | | 250,364 | |
| Heineken NV | | 200 | | | 17,753 | |
| ING Groep NV | | 2,328 | | | 42,201 | |
| Koninklijke Ahold Delhaize NV | | 664 | | | 21,400 | |
Koninklijke Philips NV (a) | | 552 | | | 15,580 | |
| Prosus NV | | 984 | | | 34,200 | |
| Stellantis NV | | 1,464 | | | 24,434 | |
| Universal Music Group NV | | 504 | | | 11,995 | |
| Wolters Kluwer NV | | 168 | | | 28,200 | |
| | | | 508,042 | |
| | | | |
| Singapore - 1.0% | | | | |
| DBS Group Holdings Ltd. | | 1,416 | | | 38,761 | |
| Oversea-Chinese Banking Corp. Ltd. | | 2,704 | | | 30,040 | |
Sea Ltd. - ADR (a) | | 200 | | | 13,140 | |
| United Overseas Bank Ltd. | | 1,008 | | | 24,395 | |
| | | | 106,336 | |
| | | | |
| Spain - 2.6% | | | | |
| Amadeus IT Group SA | | 304 | | | 19,984 | |
| Banco Bilbao Vizcaya Argentaria SA | | 4,072 | | | 42,765 | |
| Banco Santander SA | | 10,896 | | | 52,534 | |
| CaixaBank SA | | 2,560 | | | 14,922 | |
Cellnex Telecom SA (b) | | 360 | | | 12,538 | |
| Iberdrola SA | | 4,375 | | | 57,670 | |
| Industria de Diseno Textil SA | | 776 | | | 37,675 | |
| Repsol SA | | 824 | | | 11,749 | |
| Telefonica SA | | 3,240 | | | 14,654 | |
| | | | 264,491 | |
| | | | |
| Sweden - 2.0% | | | | |
| Assa Abloy AB - Class B | | 688 | | | 20,937 | |
| Atlas Copco AB - Class A | | 1,816 | | | 32,321 | |
| Atlas Copco AB - Class B | | 1,056 | | | 16,521 | |
Evolution AB (b) | | 128 | | | 12,400 | |
| Hexagon AB - Class B | | 1,368 | | | 13,924 | |
Investor AB (a) | | 1,240 | | | 35,176 | |
| Sandvik AB | | 736 | | | 15,065 | |
| Skandinaviska Enskilda Banken AB - Class A | | 1,048 | | | 16,147 | |
The accompanying notes are an integral part of these financial statements.
139
| | |
| STRIVE INTERNATIONAL DEVELOPED MARKETS ETF |
| SCHEDULE OF INVESTMENTS (CONTINUED) |
| July 31, 2024 |
| | | | | | | | | | | | | | |
| COMMON STOCKS - 99.4% (CONTINUED) | | Shares | | Value |
| Sweden - 2.0% (Continued) | | | | |
| Swedbank AB - Class A | | 768 | | | $ | 16,351 | |
| Volvo AB - Class B | | 1,040 | | | 26,541 | |
| | | | 205,383 | |
| | | | |
| Switzerland - 10.6% | | | | |
| ABB Ltd. | | 1,120 | | | 62,243 | |
| Alcon, Inc. | | 352 | | | 33,438 | |
| Cie Financiere Richemont SA | | 328 | | | 50,074 | |
| DSM-Firmenich AG | | 136 | | | 17,375 | |
| Geberit AG | | 24 | | | 15,323 | |
| Givaudan SA | | 8 | | | 39,255 | |
| Glencore PLC | | 7,728 | | | 42,699 | |
| Holcim AG | | 352 | | | 32,980 | |
| Lonza Group AG | | 56 | | | 37,476 | |
| Nestle SA | | 1,824 | | | 185,237 | |
| Novartis AG | | 1,504 | | | 168,914 | |
| Partners Group Holding AG | | 16 | | | 21,592 | |
| Roche Holding AG | | 496 | | | 161,500 | |
| Sika AG | | 112 | | | 34,043 | |
| STMicroelectronics NV | | 448 | | | 14,836 | |
| Swiss Life Holding AG | | 24 | | | 18,423 | |
| Swiss Re AG | | 208 | | | 25,699 | |
| UBS Group AG | | 2,216 | | | 67,307 | |
| Zurich Insurance Group AG | | 104 | | | 57,252 | |
| | | | 1,085,666 | |
| | | | |
| United Kingdom - 13.4% | | | | |
| 3i Group PLC | | 672 | | | 27,022 | |
| Anglo American PLC | | 792 | | | 23,927 | |
| Ashtead Group PLC | | 304 | | | 21,893 | |
| AstraZeneca PLC | | 1,056 | | | 167,900 | |
| BAE Systems PLC | | 2,128 | | | 35,481 | |
| Barclays PLC | | 10,560 | | | 31,739 | |
| BP PLC | | 10,688 | | | 63,046 | |
| British American Tobacco PLC | | 1,568 | | | 55,332 | |
| Compass Group PLC | | 1,200 | | | 36,962 | |
| Diageo PLC | | 1,568 | | | 48,761 | |
| GSK PLC | | 2,776 | | | 53,958 | |
| Haleon PLC | | 4,704 | | | 21,141 | |
| HSBC Holdings PLC | | 13,280 | | | 120,187 | |
| Imperial Brands PLC | | 608 | | | 16,758 | |
| Lloyds Banking Group PLC | | 44,552 | | | 34,124 | |
| London Stock Exchange Group PLC | | 328 | | | 39,931 | |
The accompanying notes are an integral part of these financial statements.
140
| | |
| STRIVE INTERNATIONAL DEVELOPED MARKETS ETF |
| SCHEDULE OF INVESTMENTS (CONTINUED) |
| July 31, 2024 |
| | | | | | | | | | | | | | |
| COMMON STOCKS - 99.4% (CONTINUED) | | Shares | | Value |
| United Kingdom - 13.4% (Continued) | | | | |
| National Grid PLC | | 3,280 | | | $ | 41,575 | |
| NatWest Group PLC | | 4,360 | | | 20,632 | |
| Reckitt Benckiser Group PLC | | 496 | | | 26,640 | |
| Relx PLC | | 1,320 | | | 62,328 | |
| Rio Tinto PLC | | 752 | | | 48,588 | |
Rolls-Royce Holdings PLC (a) | | 5,928 | | | 34,263 | |
| Shell PLC | | 4,504 | | | 164,439 | |
| SSE PLC | | 768 | | | 18,566 | |
| Standard Chartered PLC | | 1,824 | | | 17,989 | |
| Tesco PLC | | 4,952 | | | 21,110 | |
| Unilever PLC | | 1,704 | | | 104,622 | |
| Vodafone Group PLC | | 18,104 | | | 16,859 | |
| | | | 1,375,773 | |
TOTAL COMMON STOCKS (Cost $10,087,923) | | | | 10,208,898 | |
| | | | |
| REAL ESTATE INVESTMENT TRUSTS - 0.3% | | | | |
| Australia - 0.3% | | | | |
| Goodman Group | | 1,192 | | | 27,361 | |
TOTAL REAL ESTATE INVESTMENT TRUSTS (Cost $28,065) | | | | 27,361 | |
| | | | |
| SHORT-TERM INVESTMENTS - 0.3% | | | | |
| Money Market Funds - 0.3% | | | | |
First American Government Obligations Fund - Class X, 5.23% (c) | | 31,540 | | | 31,540 | |
TOTAL SHORT-TERM INVESTMENTS (Cost $31,540) | | | | 31,540 | |
| | | | |
TOTAL INVESTMENTS - 100.0% (Cost $10,147,528) | | | | $ | 10,267,799 | |
Other Assets in Excess of Liabilities - 0.0% (d) | | | | 1,682 | |
| TOTAL NET ASSETS - 100.0% | | | | $ | 10,269,481 | |
Percentages are stated as a percent of net assets.
| | |
| ADR - American Depositary Receipt |
| AG - Aktiengesellschaft |
| NV - Naamloze Vennootschap |
| PLC - Public Limited Company |
| SA - Sociedad Anónima |
| SA/NV - Societe Anonime/Naamloze Vennootschap |
The accompanying notes are an integral part of these financial statements.
141
| | |
| STRIVE INTERNATIONAL DEVELOPED MARKETS ETF |
| SCHEDULE OF INVESTMENTS (CONTINUED) |
| July 31, 2024 |
| | | | | | | | |
| (a) | | Non-income producing security. |
| (b) | | Security is exempt from registration pursuant to Rule 144A under the Securities Act of 1933, as amended. These securities may only be resold in transactions exempt from registration to qualified institutional investors. As of July 31, 2024, the value of these securities total $44,516 or 0.4% of the Fund’s net assets. |
| (c) | | The rate shown represents the 7-day annualized effective yield as of July 31, 2024. |
| (d) | | Represents less than 0.05% of net assets. |
The accompanying notes are an integral part of these financial statements.
142
| | |
| STRIVE TOTAL RETURN BOND ETF |
| SCHEDULE OF INVESTMENTS (CONTINUED) |
| July 31, 2024 |
| | | | | | | | | | | | | | |
| MORTGAGE-BACKED SECURITIES - 45.6% | | Par | | Value |
| Federal Home Loan Mortgage Corp. | | | | |
| Pool QF5342, 4.00%, 12/01/2052 | | $ | 1,443,404 | | | $ | 1,350,871 | |
| Pool QI2043, 6.00%, 03/01/2054 | | 298,994 | | | 303,757 | |
| Pool QJ0225, 6.00%, 07/01/2054 | | 1,300,000 | | | 1,319,898 | |
| Pool SD1961, 5.50%, 12/01/2052 | | 400,413 | | | 400,849 | |
| Pool SD5781, 6.00%, 07/01/2054 | | 650,000 | | | 660,355 | |
| Pool SD5809, 6.00%, 07/01/2054 | | 1,400,000 | | | 1,420,117 | |
| Pool SD8256, 4.00%, 10/01/2052 | | 1,999,861 | | | 1,871,654 | |
| Pool SD8322, 4.50%, 05/01/2053 | | 933,766 | | | 898,452 | |
| Pool SD8325, 6.00%, 05/01/2053 | | 1,064,767 | | | 1,080,399 | |
| Pool SD8384, 6.00%, 12/01/2053 | | 2,338,473 | | | 2,371,342 | |
| Federal National Mortgage Association | | | | |
| Pool DB6624, 5.50%, 06/01/2054 | | 699,248 | | | 702,853 | |
| Pool FS4932, 6.00%, 06/01/2053 | | 795,024 | | | 807,689 | |
| Pool FS5635, 4.00%, 11/01/2052 | | 1,903,762 | | | 1,781,716 | |
| Pool MA4919, 5.50%, 02/01/2053 | | 965,526 | | | 966,577 | |
| Pool MA4941, 5.50%, 03/01/2053 | | 929,753 | | | 930,764 | |
| Pool MA5008, 4.50%, 05/01/2053 | | 1,400,919 | | | 1,347,938 | |
| Pool MA5039, 5.50%, 06/01/2053 | | 1,000,883 | | | 1,001,972 | |
| Pool MA5109, 6.50%, 08/01/2053 | | 395,582 | | | 405,716 | |
| Pool MA5165, 5.50%, 10/01/2053 | | 944,432 | | | 945,460 | |
| Ginnie Mae II Pool | | | | |
| Pool MA8491, 5.50%, 12/20/2052 | | 1,484,119 | | | 1,487,589 | |
| Pool MA8493, 6.50%, 12/20/2052 | | 149,433 | | | 152,263 | |
| Pool MA8570, 5.50%, 01/20/2053 | | 885,161 | | | 887,231 | |
| Pool MA8571, 6.00%, 01/20/2053 | | 1,147,750 | | | 1,161,058 | |
| Pool MA8647, 5.00%, 02/20/2053 | | 915,577 | | | 904,020 | |
| Pool MA8649, 6.00%, 02/20/2053 | | 465,656 | | | 471,637 | |
| Pool MA8725, 5.00%, 03/20/2053 | | 462,418 | | | 456,581 | |
| Pool MA8726, 5.50%, 03/20/2053 | | 799,608 | | | 801,477 | |
| Pool MA8727, 6.00%, 03/20/2053 | | 1,330,812 | | | 1,346,242 | |
| Pool MA8800, 5.00%, 04/20/2053 | | 466,911 | | | 461,017 | |
| Pool MA8801, 5.50%, 04/20/2053 | | 1,001,165 | | | 1,004,757 | |
| Pool MA8877, 4.50%, 05/20/2053 | | 1,426,955 | | | 1,379,456 | |
| Pool MA8878, 5.00%, 05/20/2053 | | 577,339 | | | 570,051 | |
| Pool MA8879, 5.50%, 05/20/2053 | | 977,381 | | | 979,666 | |
| Pool MA8880, 6.00%, 05/20/2053 | | 852,897 | | | 862,786 | |
| Pool MA8948, 5.50%, 06/20/2053 | | 1,200,679 | | | 1,203,486 | |
| Pool MA8949, 6.00%, 06/20/2053 | | 1,340,482 | | | 1,359,376 | |
| Pool MA9017, 5.50%, 07/20/2053 | | 758,227 | | | 760,000 | |
| Pool MA9018, 6.00%, 07/20/2053 | | 446,637 | | | 451,816 | |
| Pool MA9105, 5.00%, 08/20/2053 | | 1,932,050 | | | 1,907,661 | |
| Pool MA9106, 5.50%, 08/20/2053 | | 1,435,986 | | | 1,439,343 | |
The accompanying notes are an integral part of these financial statements.
143
| | |
| STRIVE TOTAL RETURN BOND ETF |
| SCHEDULE OF INVESTMENTS (CONTINUED) |
| July 31, 2024 |
| | | | | | | | | | | | | | |
| | | | |
| MORTGAGE-BACKED SECURITIES - 45.6% (CONTINUED) | | Par | | Value |
| Pool MA9107, 6.00%, 08/20/2053 | | $ | 1,188,993 | | | $ | 1,202,780 | |
| Pool MA9166, 3.00%, 09/20/2053 | | 187,422 | | | 167,609 | |
| Pool MA9171, 5.50%, 09/20/2053 | | 2,113,975 | | | 2,118,917 | |
| Pool MA9305, 5.50%, 11/20/2053 | | 881,556 | | | 883,617 | |
| Pool MA9485, 4.00%, 02/20/2054 | | 493,842 | | | 465,366 | |
| Pool MA9539, 4.50%, 03/20/2054 | | 990,341 | | | 957,684 | |
TOTAL MORTGAGE-BACKED SECURITIES (Cost $45,888,648) | | | | 46,411,865 | |
| | | | |
| ASSET-BACKED SECURITIES - 17.2% | | | | |
Affirm, Inc., Series 2024-A, Class D, 6.89%, 02/15/2029 (a) | | 200,000 | | | 201,177 | |
Arivo Acceptance Auto Loan Receivables Trust, Series 2024-1A, Class B, 6.87%, 06/17/2030 (a) | | 300,000 | | | 304,504 | |
Avis Budget Car Rental LLC, Series 2023-1A, Class C, 6.23%, 04/20/2029(a) | | 300,000 | | | 303,573 | |
Bankers Healthcare Group, Inc., Series 2024-1CON, Class C, 6.86%, 04/17/2035 (a) | | 400,000 | | | 405,863 | |
| Carvana Auto Receivables Trust | | | | |
Series 2023-P5, Class D, 7.18%, 12/10/2030 (a) | | 500,000 | | | 531,959 | |
| Series 2024-P2, Class D, 6.10%, 06/10/2031 | | 250,000 | | | 255,911 | |
COLT Funding LLC, Series 2022-4, Class A2, 4.50%, 03/25/2067 (a)(b) | | 479,028 | | | 460,641 | |
CPS Auto Trust, Series 2021-D, Class E, 4.06%, 12/15/2028 (a) | | 500,000 | | | 479,395 | |
Ellington Financial Mortgage Trust, Series 2021-2, Class M1, 2.30%, 06/25/2066 (a)(b) | | 885,000 | | | 588,213 | |
FHF Trust, Series 2024-2A, Class D, 7.15%, 09/15/2031 (a) | | 500,000 | | | 509,405 | |
FIGRE Trust 2024-HE1, Series 2024-HE1, Class B, 6.51%, 03/25/2054 (a)(b) | | 925,548 | | | 940,497 | |
Foundation Finance Trust, Series 2024-1A, Class D, 8.13%, 12/15/2049 (a) | | 150,000 | | | 152,839 | |
| FREED ABS Trust | | | | |
Series 2021-3FP, Class D, 2.37%, 11/20/2028 (a) | | 202,274 | | | 198,738 | |
Series 2022-4FP, Class D, 7.40%, 12/18/2029 (a) | | 350,000 | | | 353,330 | |
GCAT, Series 2021-NQM4, Class A3, 1.56%, 08/25/2066 (a)(b) | | 1,188,730 | | | 993,601 | |
GLS Auto Select Receivables Trust, Series 2024-2A, Class D, 6.37%, 08/15/2031 (a) | | 1,000,000 | | | 1,019,279 | |
GreenSky Home Improvement Trust 2024-1, Series 2024-1, Class D, 7.33%, 07/25/2059 (a) | | 400,000 | | | 401,254 | |
GS Mortgage-Backed Securities Trust, Series 2021-MM1, Class A2, 2.50%, 04/25/2052 (a)(b) | | 1,722,090 | | | 1,413,471 | |
Helios Issuer LLC, Series 2021-B, Class A, 1.62%, 07/20/2048 (a) | | 79,210 | | | 67,965 | |
Hertz Vehicle Financing LLC, Series 2023-4A, Class C, 7.51%, 03/25/2030(a) | | 500,000 | | | 527,640 | |
| Marlette Funding Trust | | | | |
Series 2023-2A, Class D, 7.92%, 06/15/2033 (a) | | 300,000 | | | 301,345 | |
Series 2024-1A, Class D, 6.93%, 07/17/2034 (a) | | 500,000 | | | 508,778 | |
MFRA Trust, Series 2021-NQM2, Class A3, 1.47%, 11/25/2064 (a)(b) | | 428,582 | | | 369,320 | |
The accompanying notes are an integral part of these financial statements.
144
| | |
| STRIVE TOTAL RETURN BOND ETF |
| SCHEDULE OF INVESTMENTS (CONTINUED) |
| July 31, 2024 |
| | | | | | | | | | | | | | |
| | | | |
| ASSET-BACKED SECURITIES - 17.2% (CONTINUED) | | Par | | Value |
| Pagaya AI Debt Selection Trust | | | | |
Series 2023-7, Class C, 8.80%, 07/15/2031 (a) | | $ | 699,739 | | | $ | 718,119 | |
Series 2024-1, Class C, 8.34%, 07/15/2031 (a) | | 499,875 | | | 509,965 | |
Series 2024-2, Class C, 7.57%, 08/15/2031 (a) | | 199,911 | | | 202,215 | |
Series 2024-3, Class C, 7.30%, 10/15/2031 (a) | | 200,000 | | | 201,891 | |
Series 2024-5, Class C, 7.27%, 10/15/2031 (a) | | 1,000,000 | | | 1,007,477 | |
Prosper Marketplace Issuance Trust, Series 2023-1A, Class C, 8.29%, 07/16/2029 (a) | | 600,000 | | | 615,140 | |
PRPM LLC, Series 2022-NQM1, Class A3, 5.50%, 08/25/2067 (a)(c) | | 297,203 | | | 300,068 | |
Purchasing Power Funding, Series 2024-A, Class D, 7.26%, 08/15/2028 (a) | | 200,000 | | | 202,255 | |
Republic Finance Issuance Trust, Series 2024-A, Class C, 7.28%, 08/20/2032 (a) | | 250,000 | | | 252,077 | |
Saluda Grade Mortgage Funding LLC, Series 2023-FIG4, Class A, 6.72%, 11/25/2053 (a)(b) | | 447,540 | | | 461,057 | |
SBNA Auto Receivables Trust 2024-A, Series 2024-A, Class D, 6.04%, 04/15/2030 (a) | | 500,000 | | | 506,802 | |
Sunnova Energy International, Inc., Series 2023-B, Class A, 5.30%, 08/22/2050 (a) | | 93,840 | | | 91,203 | |
Theorem Funding Trust, Series 2022-2A, Class B, 9.27%, 12/15/2028 (a) | | 200,000 | | | 205,702 | |
| Veros Automobile Receivables Trust | | | | |
Series 2021-1, Class C, 3.64%, 08/15/2028 (a) | | 500,000 | | | 499,596 | |
Series 2024-1, Class C, 7.57%, 12/15/2028 (a) | | 500,000 | | | 508,663 | |
TOTAL ASSET-BACKED SECURITIES (Cost $17,204,350) | | | | 17,570,928 | |
| | | | |
| U.S. TREASURY SECURITIES - 15.2% | | | | |
| United States Treasury Note/Bond | | | | |
| 3.13%, 08/15/2025 | | 1,500,000 | | | 1,475,832 | |
| 4.63%, 11/15/2026 | | 1,350,000 | | | 1,360,336 | |
| 4.13%, 10/31/2027 | | 1,850,000 | | | 1,851,012 | |
| 4.38%, 08/31/2028 | | 1,000,000 | | | 1,012,363 | |
| 3.50%, 04/30/2030 | | 1,000,000 | | | 973,418 | |
| 4.13%, 08/31/2030 | | 1,000,000 | | | 1,005,234 | |
| 4.13%, 11/15/2032 | | 1,200,000 | | | 1,204,758 | |
| 3.50%, 02/15/2033 | | 1,000,000 | | | 957,735 | |
| 3.88%, 08/15/2033 | | 1,000,000 | | | 983,027 | |
| 4.38%, 05/15/2034 | | 1,000,000 | | | 1,021,641 | |
| 4.50%, 05/15/2038 | | 1,000,000 | | | 1,034,531 | |
| 3.50%, 02/15/2039 | | 1,200,000 | | | 1,109,156 | |
| 3.88%, 08/15/2040 | | 1,000,000 | | | 953,145 | |
| 1.88%, 11/15/2051 | | 1,000,000 | | | 597,461 | |
TOTAL U.S. TREASURY SECURITIES (Cost $15,353,448) | | | | 15,539,649 | |
| | | | |
The accompanying notes are an integral part of these financial statements.
145
| | |
| STRIVE TOTAL RETURN BOND ETF |
| SCHEDULE OF INVESTMENTS (CONTINUED) |
| July 31, 2024 |
| | | | | | | | | | | | | | |
| | | | |
| CORPORATE BONDS - 9.8% | | Par | | Value |
| Aerospace & Defense - 0.2% | | | | |
| Northrop Grumman Corp., 5.20%, 06/01/2054 | | $ | 100,000 | | | $ | 95,927 | |
| RTX Corp., 6.10%, 03/15/2034 | | 100,000 | | | 107,434 | |
| | | | 203,361 | |
| | | | |
| | | | | | | | | | | | | | |
| Automotive - 0.1% | | | | |
| General Motors Financial Co., Inc., 6.10%, 01/07/2034 | | 100,000 | | | 102,674 | |
| | | | |
| Banks - 1.0% | | | | |
| Bank of America Corp., 2.48% to 09/21/2031 then 5 yr. CMT Rate + 1.20%, 09/21/2036 | | 250,000 | | | 204,318 | |
| JPMorgan Chase & Co., 6.25% to 10/23/2033 then SOFR + 1.81%, 10/23/2034 | | 300,000 | | | 323,544 | |
| PNC Financial Services Group, Inc., 5.68% to 01/22/2034 then SOFR + 1.90%, 01/22/2035 | | 200,000 | | | 205,536 | |
| Wells Fargo & Co., 5.56% to 07/25/2033 then SOFR + 1.99%, 07/25/2034 | | 300,000 | | | 305,867 | |
| | | | 1,039,265 | |
| | | | |
| Beverages - 0.5% | | | | |
| Brown-Forman Corp., 4.00%, 04/15/2038 | | 100,000 | | | 89,724 | |
| Constellation Brands, Inc., 4.90%, 05/01/2033 | | 150,000 | | | 147,657 | |
| Keurig Dr Pepper, Inc., 5.30%, 03/15/2034 | | 200,000 | | | 202,809 | |
| Molson Coors Beverage Co., 4.20%, 07/15/2046 | | 100,000 | | | 82,076 | |
| | | | 522,266 | |
| | | | |
| Biotechnology - 0.1% | | | | |
| Amgen, Inc., 5.25%, 03/02/2033 | | 100,000 | | | 101,358 | |
| | | | |
| Brokerage & Investment Management - 0.2% | | | | |
LPL Holdings, Inc., 4.00%, 03/15/2029 (a) | | 200,000 | | | 187,960 | |
| | | | |
| Building Products - 0.1% | | | | |
| Carrier Global Corp., 3.38%, 04/05/2040 | | 100,000 | | | 79,505 | |
| | | | |
| Capital Markets - 0.8% | | | | |
| Goldman Sachs Group, Inc., 3.10% to 02/24/2032 then SOFR + 1.41%, 02/24/2033 | | 200,000 | | | 174,229 | |
| Morgan Stanley, 5.95% to 01/19/2033 then 5 yr. CMT Rate + 2.43%, 01/19/2038 | | 300,000 | | | 305,609 | |
MSCI, Inc., 3.25%, 08/15/2033 (a) | | 100,000 | | | 84,947 | |
UBS Group AG, 5.70% to 02/08/2034 then 1 yr. CMT Rate + 1.77%, 02/08/2035 (a) | | 200,000 | | | 204,008 | |
| | | | 768,793 | |
| | | | |
The accompanying notes are an integral part of these financial statements.
146
| | |
| STRIVE TOTAL RETURN BOND ETF |
| SCHEDULE OF INVESTMENTS (CONTINUED) |
| July 31, 2024 |
| | | | | | | | | | | | | | |
| | | | |
| CORPORATE BONDS - 9.8% (CONTINUED) | | Par | | Value |
| Chemicals - 0.1% | | | | |
| Nutrien Ltd., 2.95%, 05/13/2030 | | $ | 150,000 | | | $ | 135,659 | |
| | | | |
| Commercial Services & Supplies - 0.1% | | | | |
| Waste Management, Inc., 4.88%, 02/15/2034 | | 100,000 | | | 100,060 | |
| | | | |
| Construction & Engineering - 0.1% | | | | |
MasTec, Inc., 4.50%, 08/15/2028 (a) | | 150,000 | | | 145,026 | |
| | | | |
| Construction Machinery - 0.3% | | | | |
Ashtead Capital, Inc., 5.95%, 10/15/2033 (a) | | 200,000 | | | 204,886 | |
United Rentals North America, Inc., 6.00%, 12/15/2029 (a) | | 100,000 | | | 101,547 | |
| | | | 306,433 | |
| | | | |
| Consumer Finance - 0.3% | | | | |
| American Express Co., 5.04% to 05/01/2033 then SOFR + 1.84%, 05/01/2034 | | 100,000 | | | 99,878 | |
| Capital One Financial Corp., 5.82% to 02/01/2033 then SOFR + 2.60%, 02/01/2034 | | 200,000 | | | 201,525 | |
| | | | 301,403 | |
| | | | |
| Electronic Equipment, Instruments & Components - 0.2% | | | | |
| Amphenol Corp., 5.25%, 04/05/2034 | | 100,000 | | | 101,864 | |
| Arrow Electronics, Inc., 5.88%, 04/10/2034 | | 100,000 | | | 100,847 | |
| | | | 202,711 | |
| | | | |
| Finance Companies - 0.4% | | | | |
| AerCap Ireland Capital DAC / AerCap Global Aviation Trust, 3.00%, 10/29/2028 | | 250,000 | | | 230,715 | |
Avolon Holdings Funding Ltd., 5.75%, 11/15/2029 (a) | | 100,000 | | | 101,538 | |
Macquarie Airfinance Holdings Ltd., 6.50%, 03/26/2031 (a) | | 100,000 | | | 103,853 | |
| | | | 436,106 | |
| | | | |
| Finance-Leasing Companies - 0.1% | | | | |
GGAM Finance Ltd., 6.88%, 04/15/2029 (a) | | 100,000 | | | 102,493 | |
| | | | |
| Financial Services - 0.8% | | | | |
| Enact Holdings, Inc., 6.25%, 05/28/2029 | | 100,000 | | | 101,532 | |
| Fiserv, Inc., 5.63%, 08/21/2033 | | 150,000 | | | 154,964 | |
| Global Payments, Inc., 5.40%, 08/15/2032 | | 150,000 | | | 149,615 | |
HA Sustainable Infrastructure Capital, Inc., 6.38%, 07/01/2034 (a) | | 100,000 | | | 98,810 | |
| NMI Holdings, Inc., 6.00%, 08/15/2029 | | 100,000 | | | 100,642 | |
| | | | |
The accompanying notes are an integral part of these financial statements.
147
| | |
| STRIVE TOTAL RETURN BOND ETF |
| SCHEDULE OF INVESTMENTS (CONTINUED) |
| July 31, 2024 |
| | | | | | | | | | | | | | |
| | | | |
| CORPORATE BONDS - 9.8% (CONTINUED) | | Par | | Value |
| Radian Group, Inc. | | | | |
| 4.88%, 03/15/2027 | | $ | 100,000 | | | $ | 98,804 | |
| 6.20%, 05/15/2029 | | 100,000 | | | 102,956 | |
| | | | 807,323 | |
| | | | |
| Food & Beverage - 0.3% | | | | |
| Bunge Ltd. Finance Corp., 2.75%, 05/14/2031 | | 200,000 | | | 174,984 | |
JBS USA Holding Lux Sarl/ JBS USA Food Co./ JBS Lux Co. Sarl, 6.75%, 03/15/2034 (a) | | 93,000 | | | 99,623 | |
| | | | 274,607 | |
| | | | |
| Food Products - 0.4% | | | | |
| Conagra Brands, Inc., 5.30%, 11/01/2038 | | 100,000 | | | 96,974 | |
| | | | |
| Food Products - 0.4% (Continued) | | | | |
| J M Smucker Co., 6.20%, 11/15/2033 | | 200,000 | | | 215,326 | |
| Tyson Foods, Inc., 4.88%, 08/15/2034 | | 100,000 | | | 96,687 | |
| | | | 408,987 | |
| | | | |
| Ground Transportation - 0.2% | | | | |
| Burlington Northern Santa Fe LLC, 4.13%, 06/15/2047 | | 100,000 | | | 84,598 | |
| CSX Corp., 6.15%, 05/01/2037 | | 100,000 | | | 109,611 | |
| | | | 194,209 | |
| | | | |
| Health Care Equipment & Supplies - 0.4% | | | | |
| Baxter International, Inc., 2.54%, 02/01/2032 | | 100,000 | | | 83,949 | |
| GE HealthCare Technologies, Inc., 5.91%, 11/22/2032 | | 150,000 | | | 157,529 | |
| Zimmer Biomet Holdings, Inc., 2.60%, 11/24/2031 | | 200,000 | | | 170,796 | |
| | | | 412,274 | |
| | | | |
| Household Durables - 0.3% | | | | |
| MDC Holdings, Inc., 6.00%, 01/15/2043 | | 100,000 | | | 103,888 | |
| NVR, Inc., 3.00%, 05/15/2030 | | 100,000 | | | 90,560 | |
| PulteGroup, Inc., 6.38%, 05/15/2033 | | 100,000 | | | 107,708 | |
| | | | 302,156 | |
| | | | |
| Insurance - 0.1% | | | | |
| MetLife, Inc., 6.50%, 12/15/2032 | | 100,000 | | | 110,503 | |
| | | | |
| Life Sciences Tools & Services - 0.1% | | | | |
| Bio-Rad Laboratories, Inc., 3.70%, 03/15/2032 | | 100,000 | | | 90,846 | |
| | | | |
The accompanying notes are an integral part of these financial statements.
148
| | |
| STRIVE TOTAL RETURN BOND ETF |
| SCHEDULE OF INVESTMENTS (CONTINUED) |
| July 31, 2024 |
| | | | | | | | | | | | | | |
| | | | |
| CORPORATE BONDS - 9.8% (CONTINUED) | | Par | | Value |
| Media - 0.1% | | | | |
| Comcast Corp., 6.50%, 11/15/2035 | | $ | 100,000 | | | $ | 111,361 | |
| | | | |
| Metals & Mining - 0.1% | | | | |
| Freeport-McMoRan, Inc., 5.40%, 11/14/2034 | | 100,000 | | | 99,638 | |
| | | | |
| Midstream - 0.1% | | | | |
| Cheniere Corpus Christi Holdings LLC, 2.74%, 12/31/2039 | | 100,000 | | | 81,358 | |
| | | | |
| Oil Field Services - 0.1% | | | | |
Shelf Drilling Holdings Ltd., 9.63%, 04/15/2029 (a) | | 100,000 | | | 96,206 | |
| | | | |
| Oil, Gas & Consumable Fuels - 1.0% | | | | |
Continental Resources, Inc., 5.75%, 01/15/2031 (a) | | 100,000 | | | 100,468 | |
Energy Transfer LP, 7.38%, 02/01/2031 (a) | | 100,000 | | | 105,636 | |
Greenfire Resources Ltd., 12.00%, 10/01/2028 (a) | | 40,000 | | | 42,978 | |
| Hess Corp., 7.13%, 03/15/2033 | | 100,000 | | | 113,659 | |
| Kinder Morgan, Inc., 5.95%, 08/01/2054 | | 100,000 | | | 100,023 | |
| MPLX LP, 5.00%, 03/01/2033 | | 100,000 | | | 97,571 | |
| ONEOK, Inc., 6.05%, 09/01/2033 | | 100,000 | | | 104,897 | |
| Targa Resources Corp., 6.50%, 03/30/2034 | | 100,000 | | | 107,941 | |
| Western Midstream Operating LP, 6.15%, 04/01/2033 | | 100,000 | | | 103,981 | |
| Williams Cos., Inc., 5.65%, 03/15/2033 | | 100,000 | | | 102,988 | |
| | | | 980,142 | |
| | | | |
| Pharmaceuticals - 0.1% | | | | |
| Royalty Pharma PLC, 3.30%, 09/02/2040 | | 100,000 | | | 74,137 | |
| | | | |
| Software - 0.2% | | | | |
| Roper Technologies, Inc., 1.75%, 02/15/2031 | | 100,000 | | | 82,227 | |
| VMware LLC, 2.20%, 08/15/2031 | | 100,000 | | | 83,292 | |
| | | | 165,519 | |
| | | | |
| Specialized REITs - 0.2% | | | | |
| American Tower Corp., 5.55%, 07/15/2033 | | 150,000 | | | 153,359 | |
| Crown Castle, Inc., 5.10%, 05/01/2033 | | 100,000 | | | 99,238 | |
| | | | 252,597 | |
| | | | |
| Specialty Retail - 0.2% | | | | |
| Lowe's Cos., Inc., 5.15%, 07/01/2033 | | 100,000 | | | 101,294 | |
| O'Reilly Automotive, Inc., 4.70%, 06/15/2032 | | 100,000 | | | 98,194 | |
| | | | 199,488 | |
| | | | |
The accompanying notes are an integral part of these financial statements.
149
| | |
| STRIVE TOTAL RETURN BOND ETF |
| SCHEDULE OF INVESTMENTS (CONTINUED) |
| July 31, 2024 |
| | | | | | | | | | | | | | |
| | | | |
| CORPORATE BONDS - 9.8% (CONTINUED) | | Par | | Value |
| Technology - 0.2% | | | | |
| Dell International LLC / EMC Corp., 5.75%, 02/01/2033 | | $ | 100,000 | | | $ | 104,355 | |
| IBM International Capital Pte Ltd., 4.90%, 02/05/2034 | | 100,000 | | | 99,234 | |
| | | | 203,589 | |
| | | | |
| Tobacco - 0.1% | | | | |
| Philip Morris International, Inc., 5.25%, 02/13/2034 | | 100,000 | | | 100,473 | |
| | | | |
| Utilities - 0.1% | | | | |
Vistra Operations Co. LLC, 6.00%, 04/15/2034 (a) | | 100,000 | | | 102,387 | |
| | | | |
| Wireless - 0.1% | | | | |
| T-Mobile USA, Inc., 5.05%, 07/15/2033 | | 150,000 | | | 149,776 | |
TOTAL CORPORATE BONDS (Cost $9,636,212) | | | | 9,952,649 | |
| | | | |
| COLLATERALIZED LOAN OBLIGATIONS - 4.8% | | | | |
Apidos CLO, Series 2022-42A, Class C, 9.18% (3 mo. Term SOFR + 3.90%), 01/20/2036 (a) | | 475,000 | | | 483,779 | |
ARES CLO, Series 2020-57A, Class BR, 7.20% (3 mo. Term SOFR + 1.91%), 01/25/2035 (a) | | 1,050,000 | | | 1,053,243 | |
Dryden Senior Loan Fund, Series 2022-106A, Class D, 11.00% (3 mo. Term SOFR + 5.70%), 10/15/2035 (a) | | 750,000 | | | 754,687 | |
Halsey Point CLO Ltd., Series 2023-7A, Class D, 11.12% (3 mo. Term SOFR + 5.84%), 07/20/2036 (a) | | 350,000 | | | 362,660 | |
LCM LP, Series 22A, Class A2R, 6.99% (3 mo. Term SOFR + 1.71%), 10/20/2028 (a) | | 496,568 | | | 496,318 | |
Saranac CLO, Series 2013-1A, Class BR, 7.44% (3 mo. Term SOFR + 2.16%), 07/26/2029 (a) | | 250,000 | | | 250,341 | |
Symphony CLO Ltd., Series 2022-37A, Class B1R, 7.68% (3 mo. Term SOFR + 2.40%), 01/20/2037 (a) | | 450,000 | | | 452,203 | |
Trimaran CAVU LLC, Series 2022-1A, Class D, 11.11% (3 mo. Term SOFR + 5.83%), 10/22/2035 (a) | | 500,000 | | | 504,833 | |
Trinitas CLO Ltd., Series 2020-14A, Class D, 9.85% (3 mo. Term SOFR + 4.56%), 01/25/2034 (a) | | 500,000 | | | 500,966 | |
TOTAL COLLATERALIZED LOAN OBLIGATIONS (Cost $4,843,687) | | | | 4,859,030 | |
| | | | |
| COLLATERALIZED MORTGAGE OBLIGATIONS - 4.5% | | | | |
| A&D Mortgage LLC | | | | |
Series 2023-NQM4, Class A1, 7.47%, 09/25/2068 (a)(c) | | 91,458 | | | 94,389 | |
Series 2023-NQM4, Class A3, 8.10%, 09/25/2068 (a)(c) | | 91,458 | | | 94,741 | |
Ellington Financial Mortgage Trust, Series 2024-INV1, Class A1A, 6.56%, 03/25/2069 (a)(c) | | 479,102 | | | 495,199 | |
The accompanying notes are an integral part of these financial statements.
150
| | |
| STRIVE TOTAL RETURN BOND ETF |
| SCHEDULE OF INVESTMENTS (CONTINUED) |
| July 31, 2024 |
| | | | | | | | | | | | | | |
| COLLATERALIZED MORTGAGE OBLIGATIONS - 4.5% (CONTINUED) | | Par | | Value |
Freddie Mac Structured Agency Credit Risk Debt Notes, Series 2023-HQA2, Class M1B, 8.70% (30 day avg SOFR US + 3.35%), 06/25/2043 (a) | | $ | 500,000 | | | $ | 527,553 | |
GS Mortgage-Backed Securities Trust, Series 2023-PJ4, Class A15, 6.00%, 01/25/2054 (a)(b) | | 408,225 | | | 415,539 | |
JP Morgan Mortgage Trust, Series 2021-1, Class A3, 2.50%, 06/25/2051(a)(b) | | 475,933 | | | 390,552 | |
Onslow Bay Mortgage Loan Trust, Series 2021-NQM2, Class A3, 1.56%, 05/25/2061 (a)(b) | | 624,610 | | | 510,895 | |
RCKT Mortgage Trust, Series 2022-4, Class A2, 3.50%, 06/25/2052 (a)(b) | | 869,569 | | | 772,466 | |
| SGR Residential Mortgage Trust | | | | |
Series 2020-2, Class A1, 1.38%, 05/25/2065 (a)(b) | | 424,613 | | | 382,412 | |
Series 2021-1, Class M1, 2.50%, 07/25/2061 (a)(b) | | 744,000 | | | 488,076 | |
Western Alliance Bancorp, Series 2021-CL2, Class M3, 9.45% (30 day avg SOFR US + 4.10%), 07/25/2059 (a) | | 465,447 | | | 468,006 | |
TOTAL COLLATERALIZED MORTGAGE OBLIGATIONS (Cost $4,484,189) | | | | 4,639,828 | |
| | | | |
| | | | |
| SHORT-TERM INVESTMENTS - 3.0% | | Shares | | |
| Money Market Funds - 3.0% | | | | |
First American Government Obligations Fund - Class X, 5.23% (d) | | 3,030,619 | | | 3,030,619 | |
TOTAL SHORT-TERM INVESTMENTS (Cost $3,030,619) | | | | 3,030,619 | |
| | | | |
TOTAL INVESTMENTS - 100.1% (Cost $100,441,153) | | | | $ | 102,004,568 | |
| Liabilities in Excess of Other Assets - (0.1)% | | | | (148,314) | |
| TOTAL NET ASSETS - 100.0% | | | | $ | 101,856,254 | |
Percentages are stated as a percent of net assets.
| | |
| AG - Aktiengesellschaft |
| CMT - Constant Maturity Treasury Rate |
| PLC - Public Limited Company |
| REIT - Real Estate Investment Trust |
| SOFR - Secured Overnight Financing Rate |
| | | | | | | | |
| (a) | | Security is exempt from registration pursuant to Rule 144A under the Securities Act of 1933, as amended. These securities may only be resold in transactions exempt from registration to qualified institutional investors. As of July 31, 2024, the value of these securities total $28,696,241 or 28.2% of the Fund’s net assets. |
| (b) | | Coupon rate is variable based on the weighted average coupon of the underlying collateral. To the extent the weighted average coupon of the underlying assets which comprise the collateral increases or decreases, the coupon rate of this security will increase or decrease correspondingly. The rate disclosed is as of July 31, 2024. |
| (c) | | Step coupon bond. The rate disclosed is as of July 31, 2024. |
| (d) | | The rate shown represents the 7-day annualized effective yield as of July 31, 2024. |
The Global Industry Classification Standard (GICS®) was developed by and/or is the exclusive property of MSCI, Inc. and Standard & Poor’s Financial Services LLC (“S&P”). GICS is a service mark of MSCI, Inc. and S&P and has been licensed for use by U.S. Bank Global Fund Services.
The accompanying notes are an integral part of these financial statements.
151
| | |
| STRIVE TOTAL RETURN BOND ETF |
| SCHEDULE OF FUTURES CONTRACTS |
| July 31, 2024 |
| | | | | | | | | | | | | | | | | | | | | | | | | | |
| Description | | Contracts Purchased | | Expiration Date | | Notional | | Value / Unrealized Appreciation (Depreciation) |
| U.S. Treasury 10 Year Notes | | 207 | | 09/19/2024 | | $ | 23,145,188 | | | $ | 596,011 | |
| U.S. Treasury 5 Year Note | | 106 | | 09/30/2024 | | 11,436,406 | | | 117,715 | |
| U.S. Treasury Long Bonds | | 19 | | 09/19/2024 | | 2,294,844 | | | 64,063 | |
| Total Unrealized Appreciation (Depreciation) | | | | | | | | $ | 777,789 | |
The accompanying notes are an integral part of these financial statements.
152
| | |
| STRIVE ENHANCED INCOME SHORT MATURITY ETF |
| SCHEDULE OF INVESTMENTS |
| July 31, 2024 |
| | | | | | | | | | | | | | |
| ASSET-BACKED SECURITIES - 28.0% | | Par | | Value |
| ACHV ABS Trust | | $ | 350,000 | | | $ | 351,984 | |
| Series 2023-4CP, Class B, 7.24%, 11/25/2030 (a) | | | | |
Series 2023-3PL, Class C, 7.35%, 08/19/2030 (a) | | 250,000 | | | 251,829 | |
Series 2024-1PL, Class C, 6.42%, 04/25/2031 (a) | | 500,000 | | | 505,787 | |
ACM Auto Trust, Series 2023-2A, Class A, 7.97%, 06/20/2030 (a) | | 119,272 | | | 120,103 | |
Affirm, Inc., Series 2023-B, Class 1B, 7.44%, 09/15/2028 (a) | | 300,000 | | | 305,398 | |
AMCR ABS Trust, Series 2023-1A, Class A, 7.66%, 01/21/2031 (a) | | 459,886 | | | 462,438 | |
| American Credit Acceptance Receivables Trust | | | | |
Series 2022-4, Class D, 8.00%, 02/15/2029 (a) | | 1,300,000 | | | 1,333,289 | |
Series 2024-1, Class B, 5.60%, 11/12/2027 (a) | | 800,000 | | | 801,428 | |
Aqua Finance Trust, Series 2017-A, Class B, 6.61%, 11/15/2035 (a) | | 185,722 | | | 186,106 | |
| Avis Budget Car Rental LLC | | | | |
Series 2019-2A, Class C, 4.24%, 09/22/2025 (a) | | 166,667 | | | 166,731 | |
Series 2020-1A, Class B, 2.68%, 08/20/2026 (a) | | 500,000 | | | 488,110 | |
Series 2020-2A, Class C, 4.25%, 02/20/2027 (a) | | 400,000 | | | 390,832 | |
BOF URSA Funding Trust, Series 2023-CAR2, Class A2, 5.54%, 10/27/2031 (a) | | 710,268 | | | 711,423 | |
| CPS Auto Trust | | | | |
Series 2022-D, Class D, 8.73%, 01/16/2029 (a) | | 605,000 | | | 638,746 | |
Series 2024-B, Class B, 6.04%, 10/16/2028 (a) | | 1,000,000 | | | 1,016,723 | |
| DT Auto Owner Trust | | | | |
Series 2022-2A, Class D, 5.46%, 03/15/2028 (a) | | 1,000,000 | | | 995,557 | |
Series 2022-3A, Class C, 7.69%, 07/17/2028 (a) | | 250,000 | | | 254,540 | |
| Exeter Automobile Receivables Trust | | | | |
Series 2020-3A, Class F, 5.56%, 06/15/2027 (a) | | 500,000 | | | 497,687 | |
| Series 2022-3A, Class D, 6.76%, 09/15/2028 | | 800,000 | | | 813,374 | |
| Series 2023-2A, Class C, 5.75%, 07/17/2028 | | 500,000 | | | 501,814 | |
Flagship Credit Auto Trust, Series 2019-4, Class D, 3.12%, 01/15/2026 (a) | | 173,307 | | | 172,561 | |
| FREED ABS Trust | | | | |
Series 2021-3FP, Class D, 2.37%, 11/20/2028 (a) | | 134,850 | | | 132,492 | |
Series 2022-4FP, Class D, 7.40%, 12/18/2029 (a) | | 500,000 | | | 504,758 | |
FREED ABS TRUST, Series 2022-3FP, Class D, 7.36%, 08/20/2029 (a) | | 500,000 | | | 503,991 | |
| GLS Auto Receivables Trust | | | | |
Series 2022-2A, Class D, 6.15%, 04/17/2028 (a) | | 800,000 | | | 803,114 | |
Series 2023-1A, Class B, 6.19%, 06/15/2027 (a) | | 100,000 | | | 100,243 | |
Hertz Global Holdings, Inc., Series 2021-1A, Class B, 1.56%, 12/26/2025(a) | | 250,000 | | | 247,393 | |
Lendbuzz Securitization Trust, Series 2021-1A, Class A, 1.46%, 06/15/2026 (a) | | 37,462 | | | 36,685 | |
| Marlette Funding Trust | | | | |
Series 2021-3A, Class C, 1.81%, 12/15/2031 (a) | | 370,750 | | | 365,086 | |
Series 2022-3A, Class B, 5.95%, 11/15/2032 (a) | | 269,708 | | | 270,232 | |
Series 2022-3A, Class C, 6.89%, 11/15/2032 (a) | | 1,000,000 | | | 1,011,043 | |
Series 2023-1A, Class C, 7.20%, 04/15/2033 (a) | | 862,000 | | | 877,691 | |
Series 2023-3A, Class C, 7.06%, 09/15/2033 (a) | | 600,000 | | | 611,440 | |
The accompanying notes are an integral part of these financial statements.
153
| | |
| STRIVE ENHANCED INCOME SHORT MATURITY ETF |
| SCHEDULE OF INVESTMENTS (CONTINUED) |
| July 31, 2024 |
| | | | | | | | | | | | | | |
| ASSET-BACKED SECURITIES - 28.0% (CONTINUED) | | Par | | Value |
Mercury Financial Credit Card Master Trust, Series 2023-1A, Class A, 8.04%, 09/20/2027 (a) | | $ | 150,000 | | | $ | 151,040 | |
Oportun Financial Corp., Series 2022-A, Class B, 5.25%, 06/09/2031 (a) | | 400,000 | | | 393,780 | |
| Pagaya AI Debt Selection Trust | | | | |
Series 2021-HG1, Class B, 1.82%, 01/16/2029 (a) | | 65,628 | | | 63,407 | |
Series 2022-1, Class B, 3.34%, 10/15/2029 (a) | | 399,947 | | | 395,356 | |
Series 2022-2, Class B, 6.63%, 01/15/2030 (a) | | 899,946 | | | 903,715 | |
Series 2022-5, Class A, 8.10%, 06/17/2030 (a) | | 52,007 | | | 52,732 | |
Series 2023-5, Class B, 7.63%, 04/15/2031 (a) | | 399,997 | | | 403,539 | |
Series 2023-5, Class C, 9.10%, 04/15/2031 (a) | | 499,996 | | | 513,172 | |
Series 2023-7, Class C, 8.80%, 07/15/2031 (a) | | 499,814 | | | 512,942 | |
Series 2023-8, Class A, 7.30%, 06/16/2031 (a) | | 244 | | | 247 | |
Series 2024-1, Class B, 7.11%, 07/15/2031 (a) | | 999,750 | | | 1,011,829 | |
Series 2024-2, Class A, 6.32%, 08/15/2031 (a) | | 433,447 | | | 435,828 | |
Series 2024-2, Class B, 6.61%, 08/15/2031 (a) | | 899,600 | | | 905,623 | |
Series 2024-3, Class A, 6.26%, 10/15/2031 (a) | | 471,827 | | | 473,885 | |
Series 2024-3, Class B, 6.57%, 10/15/2031 (a) | | 1,300,000 | | | 1,310,703 | |
Series 2024-5, Class B, 6.60%, 10/15/2031 (a) | | 1,000,000 | | | 1,006,833 | |
Pretium Mortgage Credit Partners LLC, Series 2024-NPL3, Class A1, 7.52%, 04/27/2054 (a)(b) | | 491,836 | | | 499,633 | |
| Prosper Marketplace Issuance Trust | | | | |
Series 2023-1A, Class B, 7.48%, 07/16/2029 (a) | | 350,000 | | | 354,614 | |
Series 2023-1A, Class C, 8.29%, 07/16/2029 (a) | | 200,000 | | | 205,047 | |
PRPM LLC, Series 2024-RCF1, Class A1, 4.00%, 01/25/2054 (a)(b) | | 944,674 | | | 912,954 | |
Purchasing Power Funding, Series 2024-A, Class B, 6.43%, 08/15/2028 (a) | | 400,000 | | | 403,226 | |
| Reach Financial LLC | | | | |
Series 2022-2A, Class C, 8.40%, 05/15/2030 (a) | | 500,000 | | | 508,115 | |
Series 2024-1A, Class B, 6.29%, 02/18/2031 (a) | | 500,000 | | | 502,496 | |
Republic Finance Issuance Trust, Series 2020-A, Class A, 2.47%, 11/20/2030 (a) | | 29,746 | | | 29,681 | |
| Research-Driven Pagaya Motor Asset Trust | | | | |
Series 2023-3A, Class A, 7.13%, 01/26/2032 (a) | | 159,289 | | | 160,595 | |
Series 2023-4A, Class A, 7.54%, 03/25/2032 (a) | | 175,942 | | | 178,792 | |
SAFCO Auto Receivables Trust, Series 2024-1A, Class A, 6.51%, 03/20/2028 (a) | | 63,513 | | | 63,751 | |
Saluda Grade Mortgage Funding LLC, Series 2023-FIG4, Class A, 6.72%, 11/25/2053 (a)(c) | | 447,540 | | | 461,057 | |
| Upstart Pass-Through Trust Series | | | | |
Series 2022-ST1, Class A, 2.60%, 03/20/2030 (a) | | 79,976 | | | 78,915 | |
Series 2022-ST3, Class A, 4.30%, 05/20/2030 (a) | | 222,846 | | | 218,703 | |
| Upstart Securitization Trust | | | | |
Series 2021-2, Class C, 3.61%, 06/20/2031 (a) | | 691,362 | | | 680,537 | |
Series 2021-5, Class B, 2.49%, 11/20/2031 (a) | | 172,595 | | | 171,447 | |
Series 2022-2, Class B, 6.10%, 05/20/2032 (a) | | 353,550 | | | 353,857 | |
The accompanying notes are an integral part of these financial statements.
154
| | |
| STRIVE ENHANCED INCOME SHORT MATURITY ETF |
| SCHEDULE OF INVESTMENTS (CONTINUED) |
| July 31, 2024 |
| | | | | | | | | | | | | | |
| ASSET-BACKED SECURITIES - 28.0% (CONTINUED) | | Par | | Value |
| Upstart Structured Pass-Through Trust | | | | |
Series 2022-1A, Class A, 3.40%, 04/15/2030 (a) | | $ | 156,465 | | | $ | 154,619 | |
Series 2022-4A, Class B, 8.54%, 11/15/2030 (a) | | 600,000 | | | 612,103 | |
| Verizon Master Trust, Series 2023-5, Class A1B, 6.02% (30 day avg SOFR US + 0.68%), 09/08/2028 | | 300,000 | | | 301,557 | |
Westlake Automobile Receivables Trust, Series 2022-2A, Class D, 5.48%, 09/15/2027 (a) | | 510,000 | | | 510,263 | |
TOTAL ASSET-BACKED SECURITIES (Cost $32,095,225) | | | | 32,327,221 | |
| | | | |
| CORPORATE BONDS - 27.3% | | | | |
| Aerospace & Defense - 1.3% | | | | |
| Boeing Co., 4.88%, 05/01/2025 | | 500,000 | | | 496,267 | |
| Howmet Aerospace, Inc., 6.88%, 05/01/2025 | | 500,000 | | | 504,847 | |
Rolls-Royce PLC, 3.63%, 10/14/2025 (a) | | 500,000 | | | 488,516 | |
| | | | 1,489,630 | |
| | | | |
| Automotive - 1.4% | | | | |
| American Honda Finance Corp., 0.75%, 08/09/2024 | | 100,000 | | | 99,891 | |
| Ford Motor Credit Co. LLC | | | | |
| 4.06%, 11/01/2024 | | 250,000 | | | 248,810 | |
| 2.30%, 02/10/2025 | | 200,000 | | | 196,266 | |
| General Motors Financial Co., Inc., 2.90%, 02/26/2025 | | 250,000 | | | 246,215 | |
Harley-Davidson Financial Services, Inc., 3.35%, 06/08/2025 (a) | | 500,000 | | | 489,950 | |
Volkswagen Group of America Finance LLC, 3.35%, 05/13/2025 (a) | | 300,000 | | | 295,214 | |
| | | | 1,576,346 | |
| | | | |
| Banks - 1.8% | | | | |
| Bank of America Corp., 4.00%, 01/22/2025 | | 300,000 | | | 298,080 | |
| JPMorgan Chase & Co., 3.88%, 09/10/2024 | | 400,000 | | | 399,300 | |
| Truist Financial Corp., 2.50%, 08/01/2024 | | 500,000 | | | 500,000 | |
| UBS AG/Stamford CT, 3.63%, 09/09/2024 | | 500,000 | | | 498,887 | |
| Wells Fargo & Co., 3.00%, 02/19/2025 | | 400,000 | | | 395,061 | |
| | | | 2,091,328 | |
| | | | |
| Building Products - 0.6% | | | | |
| Carrier Global Corp., 2.24%, 02/15/2025 | | 500,000 | | | 491,496 | |
| Owens Corning, 4.20%, 12/01/2024 | | 250,000 | | | 248,764 | |
| | | | 740,260 | |
| | | | |
| Capital Markets - 0.8% | | | | |
| Ares Capital Corp., 3.25%, 07/15/2025 | | 600,000 | | | 586,693 | |
| Bank of New York Mellon Corp., 0.85%, 10/25/2024 | | 300,000 | | | 296,739 | |
| | | | 883,432 | |
| | | | |
The accompanying notes are an integral part of these financial statements.
155
| | |
| STRIVE ENHANCED INCOME SHORT MATURITY ETF |
| SCHEDULE OF INVESTMENTS (CONTINUED) |
| July 31, 2024 |
| | | | | | | | | | | | | | |
| CORPORATE BONDS - 27.3% (CONTINUED) | | Par | | Value |
| Chemicals - 1.3% | | | | |
| Eastman Chemical Co., 3.80%, 03/15/2025 | | $ | 500,000 | | | $ | 495,036 | |
| Nutrien Ltd., 3.00%, 04/01/2025 | | 250,000 | | | 246,208 | |
| Sherwin-Williams Co., 4.05%, 08/08/2024 | | 250,000 | | | 249,909 | |
| Westlake Corp., 0.88%, 08/15/2024 | | 506,000 | | | 505,016 | |
| | | | 1,496,169 | |
| | | | |
| Commerical Services - 0.2% | | | | |
Ashtead Capital, Inc., 1.50%, 08/12/2026 (a) | | 250,000 | | | 231,492 | |
| | | | |
| Consumer Finance - 0.4% | | | | |
| Capital One Financial Corp., 3.30%, 10/30/2024 | | 515,000 | | | 511,963 | |
| | | | |
| Diversified Telecommunication Services - 0.2% | | | | |
| Verizon Communications, Inc., 3.50%, 11/01/2024 | | 207,000 | | | 205,916 | |
| | | | |
| Electric Utilities - 0.5% | | | | |
| Edison International | | | | |
| 3.55%, 11/15/2024 | | 320,000 | | | 317,668 | |
| 4.95%, 04/15/2025 | | 200,000 | | | 199,076 | |
| | | | 516,744 | |
| | | | |
| Electronic Equipment, Instruments & Components - 0.4% | | | | |
| Arrow Electronics, Inc., 3.25%, 09/08/2024 | | 100,000 | | | 99,711 | |
| Flex Ltd., 4.75%, 06/15/2025 | | 306,000 | | | 303,939 | |
| | | | 403,650 | |
| | | | |
| Finance Companies - 0.9% | | | | |
| AerCap Ireland Capital DAC / AerCap Global Aviation Trust, 2.88%, 08/14/2024 | | 500,000 | | | 499,455 | |
Avolon Holdings Funding Ltd., 2.88%, 02/15/2025 (a) | | 600,000 | | | 589,934 | |
| | | | 1,089,389 | |
| | | | |
| Financial Services - 0.7% | | | | |
| Global Payments, Inc., 2.65%, 02/15/2025 | | 500,000 | | | 492,322 | |
| Radian Group, Inc., 4.50%, 10/01/2024 | | 314,000 | | | 313,565 | |
| | | | 805,887 | |
| | | | |
| Food & Beverage - 0.3% | | | | |
Mondelez International Holdings Netherlands BV, 2.25%, 09/19/2024 (a) | | 370,000 | | | 368,276 | |
| | | | |
| Food Products - 0.5% | | | | |
| Campbell Soup Co., 3.95%, 03/15/2025 | | 500,000 | | | 495,287 | |
| Tyson Foods, Inc., 3.95%, 08/15/2024 | | 100,000 | | | 99,927 | |
| | | | 595,214 | |
| | | | |
The accompanying notes are an integral part of these financial statements.
156
| | |
| STRIVE ENHANCED INCOME SHORT MATURITY ETF |
| SCHEDULE OF INVESTMENTS (CONTINUED) |
| July 31, 2024 |
| | | | | | | | | | | | | | |
| | | | |
| CORPORATE BONDS - 27.3% (CONTINUED) | | Par | | Value |
| Ground Transportation - 0.6% | | | | |
| CSX Corp., 3.40%, 08/01/2024 | | $ | 250,000 | | | $ | 250,000 | |
| Ryder System, Inc., 2.50%, 09/01/2024 | | 440,000 | | | 438,552 | |
| | | | 688,552 | |
| | | | |
| Health Care Equipment & Supplies - 1.3% | | | | |
| Baxter International, Inc., 1.32%, 11/29/2024 | | 500,000 | | | 493,015 | |
| GE HealthCare Technologies, Inc., 5.55%, 11/15/2024 | | 550,000 | | | 549,795 | |
| Zimmer Biomet Holdings, Inc., 1.45%, 11/22/2024 | | 410,000 | | | 404,650 | |
| | | | 1,447,460 | |
| | | | |
| Health Care Providers & Services - 1.0% | | | | |
| HCA, Inc., 5.38%, 02/01/2025 | | 650,000 | | | 648,771 | |
| Laboratory Corp. of America Holdings | | | | |
| 2.30%, 12/01/2024 | | 200,000 | | | 197,824 | |
| 3.60%, 02/01/2025 | | 300,000 | | | 296,792 | |
| | | | 1,143,387 | |
| | | | |
| Hotels, Restaurants & Leisure - 0.2% | | | | |
Expedia Group, Inc., 6.25%, 05/01/2025 (a) | | 194,000 | | | 194,577 | |
| | | | |
| Household Durables - 0.4% | | | | |
| Whirlpool Corp., 3.70%, 05/01/2025 | | 500,000 | | | 493,282 | |
| | | | |
| Industrial Conglomerates - 0.3% | | | | |
| 3M Co., 2.65%, 04/15/2025 | | 400,000 | | | 392,574 | |
| | | | |
| Insurance - 0.6% | | | | |
New York Life Global Funding, 2.00%, 01/22/2025 (a) | | 410,000 | | | 403,641 | |
Prudential Insurance Co. of America, 8.30%, 07/01/2025 (a) | | 250,000 | | | 255,463 | |
| | | | 659,104 | |
| | | | |
| Leisure Products - 0.4% | | | | |
| Brunswick Corp., 0.85%, 08/18/2024 | | 495,000 | | | 493,730 | |
| | | | |
| Machinery - 0.5% | | | | |
| Westinghouse Air Brake Technologies Corp., 3.20%, 06/15/2025 | | 600,000 | | | 588,387 | |
| | | | |
| Metals & Mining - 0.5% | | | | |
| Freeport-McMoRan, Inc., 4.55%, 11/14/2024 | | 550,000 | | | 548,677 | |
| | | | |
| Midstream - 0.6% | | | | |
| Plains All American Pipeline LP / PAA Finance Corp., 3.60%, 11/01/2024 | | 550,000 | | | 547,024 | |
| Sabine Pass Liquefaction LLC, 5.63%, 03/01/2025 | | 120,000 | | | 119,903 | |
| | | | 666,927 | |
| | | | |
The accompanying notes are an integral part of these financial statements.
157
| | |
| STRIVE ENHANCED INCOME SHORT MATURITY ETF |
| SCHEDULE OF INVESTMENTS (CONTINUED) |
| July 31, 2024 |
| | | | | | | | | | | | | | |
| | | | |
| CORPORATE BONDS - 27.3% (CONTINUED) | | Par | | Value |
| Oil, Gas & Consumable Fuels - 5.7% | | | | |
| Canadian Natural Resources Ltd., 3.90%, 02/01/2025 | | $ | 305,000 | | | $ | 302,367 | |
| Enbridge, Inc., 2.50%, 02/14/2025 | | 500,000 | | | 491,920 | |
| Energy Transfer LP, 2.90%, 05/15/2025 | | 455,000 | | | 445,939 | |
| EnLink Midstream Partners LP | | | | |
| 4.15%, 06/01/2025 | | 500,000 | | | 492,976 | |
| 4.85%, 07/15/2026 | | 200,000 | | | 197,701 | |
| Kinder Morgan, Inc., 4.30%, 06/01/2025 | | 539,000 | | | 533,702 | |
| Marathon Petroleum Corp., 3.63%, 09/15/2024 | | 444,000 | | | 442,768 | |
| MPLX LP | | | | |
| 4.88%, 12/01/2024 | | 250,000 | | | 249,310 | |
| 4.88%, 06/01/2025 | | 149,000 | | | 148,249 | |
| ONEOK Partners LP, 4.90%, 03/15/2025 | | 400,000 | | | 398,444 | |
| ONEOK, Inc., 2.75%, 09/01/2024 | | 300,000 | | | 299,025 | |
| Phillips 66 Co., 3.61%, 02/15/2025 | | 690,000 | | | 682,556 | |
| TransCanada PipeLines Ltd., 1.00%, 10/12/2024 | | 450,000 | | | 445,713 | |
| Western Midstream Operating LP, 3.10%, 02/01/2025 | | 650,000 | | | 641,913 | |
| Williams Cos., Inc., 3.90%, 01/15/2025 | | 800,000 | | | 793,793 | |
| | | | 6,566,376 | |
| | | | |
| Packagaing & Containers - 0.1% | | | | |
Graphic Packaging International LLC, 1.51%, 04/15/2026 (a) | | 108,000 | | | 101,142 | |
| | | | |
| Private Equity - 0.4% | | | | |
HAT Holdings I LLC / HAT Holdings II LLC, 3.38%, 06/15/2026 (a) | | 500,000 | | | 477,526 | |
| | | | |
| Software - 0.4% | | | | |
| Oracle Corp., 2.50%, 04/01/2025 | | 490,000 | | | 480,633 | |
| | | | |
| Specialized REITs - 0.6% | | | | |
| American Tower Corp., 2.95%, 01/15/2025 | | 500,000 | | | 493,835 | |
| Host Hotels & Resorts LP, 4.00%, 06/15/2025 | | 150,000 | | | 148,008 | |
| | | | 641,843 | |
| | | | |
| Specialty Retail - 0.5% | | | | |
| AutoNation, Inc., 3.50%, 11/15/2024 | | 600,000 | | | 595,297 | |
| | | | |
| Technology Hardware, Storage & Peripherals - 0.4% | | | | |
| Hewlett Packard Enterprise Co., 5.90%, 10/01/2024 | | 500,000 | | | 500,062 | |
| | | | |
| Trading Companies & Distributors - 0.8% | | | | |
Aircastle Ltd., 5.25%, 08/11/2025 (a) | | 500,000 | | | 497,478 | |
| GATX Corp., 3.25%, 03/30/2025 | | 450,000 | | | 442,686 | |
| | | | 940,164 | |
| | | | |
The accompanying notes are an integral part of these financial statements.
158
| | |
| STRIVE ENHANCED INCOME SHORT MATURITY ETF |
| SCHEDULE OF INVESTMENTS (CONTINUED) |
| July 31, 2024 |
| | | | | | | | | | | | | | |
| | | | |
| CORPORATE BONDS - 27.3% (CONTINUED) | | Par | | Value |
| Trucking & Leasing - 0.3% | | | | |
| Penske Truck Leasing Co. Lp / PTL Finance Corp. | | | | |
2.70%, 11/01/2024 (a) | | $ | 105,000 | | | $ | 104,204 | |
3.95%, 03/10/2025 (a) | | 275,000 | | | 272,282 | |
| | | | 376,486 | |
| | | | |
| Wireless Telecommunication Services - 0.4% | | | | |
| Sprint LLC, 7.63%, 02/15/2025 | | 500,000 | | | 502,978 | |
TOTAL CORPORATE BONDS (Cost $31,469,132) | | | | 31,504,860 | |
| | | | |
| COLLATERALIZED MORTGAGE OBLIGATIONS - 26.4% | | | | |
| A&D Mortgage LLC | | | | |
Series 2023-NQM4, Class A1, 7.47%, 09/25/2068 (a)(b) | | 182,915 | | | 188,779 | |
Series 2023-NQM4, Class A3, 8.10%, 09/25/2068 (a)(b) | | 182,915 | | | 189,481 | |
Series 2023-NQM5, Class A3, 7.76%, 11/25/2068 (a)(b) | | 473,658 | | | 489,137 | |
COLT 2023-2 Mortgage Loan Trust, Series 2024-1, Class A1, 5.84%, 02/25/2069 (a)(b) | | 891,731 | | | 895,798 | |
Cross Mortgage Trust, Series 2023-H2, Class A1A, 7.14%, 11/25/2068 (a)(b) | | 437,193 | | | 449,511 | |
Ellington Financial Mortgage Trust, Series 2024-INV1, Class A1A, 6.56%, 03/25/2069 (a)(b) | | 958,204 | | | 990,398 | |
| Federal Home Loan Mortgage Corp. | | | | |
| Series K045, Class A2, 3.02%, 01/25/2025 | | 1,131,689 | | | 1,118,644 | |
| Series K046, Class A2, 3.21%, 03/25/2025 | | 919,673 | | | 907,683 | |
Series K047, Class A2, 3.33%, 05/25/2025 (c) | | 1,589,193 | | | 1,566,731 | |
Series K048, Class A2, 3.28%, 06/25/2025 (c) | | 2,000,000 | | | 1,970,404 | |
| Series K049, Class A2, 3.01%, 07/25/2025 | | 198,730 | | | 195,200 | |
| Series K054, Class A2, 2.75%, 01/25/2026 | | 800,000 | | | 777,075 | |
| Series K055, Class A2, 2.67%, 03/25/2026 | | 1,200,000 | | | 1,162,249 | |
| Series K056, Class A2, 2.53%, 05/25/2026 | | 2,500,000 | | | 2,408,815 | |
| Series K057, Class A2, 2.57%, 07/25/2026 | | 1,200,000 | | | 1,155,905 | |
| Series K058, Class A2, 2.65%, 08/25/2026 | | 500,000 | | | 480,875 | |
Series K731, Class A2, 3.60%, 02/25/2025 (c) | | 945,835 | | | 937,447 | |
| Series K732, Class A2, 3.70%, 05/25/2025 | | 477,748 | | | 472,496 | |
| Series K-F100, Class AS, 5.52% (30 day avg SOFR US + 0.18%), 01/25/2028 | | 387,813 | | | 384,656 | |
| Series K-F101, Class AS, 5.54% (30 day avg SOFR US + 0.20%), 01/25/2031 | | 396,698 | | | 390,360 | |
| Series K-F113, Class AS, 5.57% (30 day avg SOFR US + 0.23%), 05/25/2028 | | 454,976 | | | 452,240 | |
| Series K-F115, Class AS, 5.55% (30 day avg SOFR US + 0.21%), 06/25/2031 | | 108,708 | | | 107,104 | |
| Series K-F117, Class AS, 5.58% (30 day avg SOFR US + 0.24%), 06/25/2031 | | 450,831 | | | 445,884 | |
| Series KF129, Class AS, 5.59% (30 day avg SOFR US + 0.25%), 01/25/2029 | | 483,649 | | | 476,822 | |
The accompanying notes are an integral part of these financial statements.
159
| | |
| STRIVE ENHANCED INCOME SHORT MATURITY ETF |
| SCHEDULE OF INVESTMENTS (CONTINUED) |
| July 31, 2024 |
| | | | | | | | | | | | | | |
| COLLATERALIZED MORTGAGE OBLIGATIONS - 26.4% (CONTINUED) | | Par | | Value |
| Federal Home Loan Mortgage Corp. (Continued) | | | | |
| Series KF133, Class AS, 5.71% (30 day avg SOFR US + 0.37%), 02/25/2029 | | $ | 465,028 | | | $ | 462,668 | |
| Series KF160, Class AS, 6.04% (30 day avg SOFR US + 0.70%), 10/25/2030 | | 637,628 | | | 641,098 | |
| Series KF48, Class A, 5.74% (30 day avg SOFR US + 0.40%), 06/25/2028 | | 1,097,533 | | | 1,094,179 | |
| Series KF57, Class A, 5.99% (30 day avg SOFR US + 0.65%), 12/25/2028 | | 949,798 | | | 955,503 | |
| Series KF59, Class A, 5.99% (30 day avg SOFR US + 0.65%), 02/25/2029 | | 1,005,833 | | | 1,012,005 | |
| Series KF75, Class AS, 5.89% (SOFR 1M Historical Calendar Day Compounded + 0.55%), 12/25/2029 | | 398,667 | | | 399,532 | |
| Series KF90, Class AS, 5.72% (30 day avg SOFR US + 0.38%), 09/25/2030 | | 395,774 | | | 391,239 | |
| Series KF95, Class AL, 5.71% (30 day avg SOFR US + 0.37%), 11/25/2030 | | 741,043 | | | 735,320 | |
| Series KF96, Class AL, 5.71% (30 day avg SOFR US + 0.37%), 12/25/2030 | | 1,005,226 | | | 998,288 | |
| Series KF97, Class AS, 5.59% (30 day avg SOFR US + 0.25%), 12/25/2030 | | 409,603 | | | 404,713 | |
| Freddie Mac Structured Agency Credit Risk Debt Notes | | | | |
Series 2021-DNA7, Class M1, 6.20% (30 day avg SOFR US + 0.85%), 11/25/2041 (a) | | 339,510 | | | 339,829 | |
Series 2022-DNA3, Class M1A, 7.35% (30 day avg SOFR US + 2.00%), 04/25/2042 (a) | | 273,524 | | | 277,867 | |
Series 2024-DNA1, Class M1, 6.70% (30 day avg SOFR US + 1.35%), 02/25/2044 (a) | | 1,517,653 | | | 1,524,833 | |
GS Mortgage-Backed Securities Trust, Series 2023-PJ6, Class A16, 6.50%, 04/25/2054 (a)(c) | | 422,250 | | | 432,698 | |
Home RE Ltd., Series 2023-1, Class M1A, 7.50% (30 day avg SOFR US + 2.15%), 10/25/2033 (a) | | 500,000 | | | 502,905 | |
Onslow Bay Mortgage Loan Trust, Series 2024-NQM2, Class A1, 5.88%, 12/25/2063 (a)(b) | | 921,473 | | | 931,177 | |
PRKCM Trust, Series 2023-AFC4, Class A1, 7.23%, 11/25/2058 (a)(b) | | 448,203 | | | 462,901 | |
Sequoia Mortgage Trust, Series 2023-4, Class A10, 6.00%, 11/25/2053 (a)(c) | | 391,988 | | | 396,299 | |
TOTAL COLLATERALIZED MORTGAGE OBLIGATIONS (Cost $30,439,815) | | | | 30,576,748 | |
| | | | |
| COLLATERALIZED LOAN OBLIGATIONS - 9.8% | | | | |
| Apidos CLO | | | | |
Series 2015-20A, Class A1RA, 6.65% (3 mo. Term SOFR + 1.36%), 07/16/2031 (a) | | 346,268 | | | 345,747 | |
Series XXXA, Class A1A, 6.68% (3 mo. Term SOFR + 1.40%), 10/18/2031 (a) | | 368,247 | | | 369,093 | |
Atlas Senior Loan Fund Ltd., Series 2021-18A, Class X, 6.39% (3 mo. Term SOFR + 1.11%), 01/18/2035 (a) | | 400,000 | | | 399,992 | |
The accompanying notes are an integral part of these financial statements.
160
| | |
| STRIVE ENHANCED INCOME SHORT MATURITY ETF |
| SCHEDULE OF INVESTMENTS (CONTINUED) |
| July 31, 2024 |
| | | | | | | | | | | | | | |
| | | | |
| COLLATERALIZED LOAN OBLIGATIONS - 9.8% (CONTINUED) | | Par | | Value |
Barings Middle Market CLO Ltd., Series 2019-IA, Class A1A, 7.31% (3 mo. Term SOFR + 2.01%), 10/15/2031 (a) | | $ | 208,648 | | | $ | 208,697 | |
Blackstone, Inc., Series 2018-1A, Class A2, 6.57% (3 mo. Term SOFR + 1.27%), 04/15/2031 (a) | | 269,205 | | | 269,749 | |
Dryden Senior Loan Fund, Series 2019-72A, Class AR, 6.66% (3 mo. Term SOFR + 1.34%), 05/15/2032 (a) | | 800,000 | | | 801,213 | |
Gallatin CLO Ltd., Series 2017-1A, Class A1R, 6.65% (3 mo. Term SOFR + 1.35%), 07/15/2031 (a) | | 1,333,940 | | | 1,335,983 | |
| Golub Capital Partners CLO Ltd. | | | | |
Series 2013-17A, Class A1R, 7.20% (3 mo. Term SOFR + 1.91%), 10/25/2030 (a) | | 180,152 | | | 180,830 | |
Series 2014-21A, Class AR, 7.02% (3 mo. Term SOFR + 1.73%), 01/25/2031 (a) | | 548,548 | | | 547,689 | |
Series 2018-36A, Class A, 6.90% (3 mo. Term SOFR + 1.56%), 02/05/2031 (a) | | 446,190 | | | 446,859 | |
LCM LP, Series 22A, Class A2R, 6.99% (3 mo. Term SOFR + 1.71%), 10/20/2028 (a) | | 647,698 | | | 647,371 | |
LCM XIII LP, Series 14A, Class AR, 6.58% (3 mo. Term SOFR + 1.30%), 07/20/2031 (a) | | 259,872 | | | 260,381 | |
| Madison Park Funding Ltd. | | | | |
Series 2017-23A, Class AR, 6.50% (3 mo. Term SOFR + 1.23%), 07/27/2031 (a) | | 483,935 | | | 484,833 | |
Series 2021-52A, Class X, 6.44% (3 mo. Term SOFR + 1.16%), 01/22/2035 (a) | | 473,684 | | | 473,681 | |
Neuberger Berman CLO Ltd., Series 2017-26A, Class AR, 6.46% (3 mo. Term SOFR + 1.18%), 10/18/2030 (a) | | 810,028 | | | 811,227 | |
ROMARK CLO LLC, Series 2021-5A, Class X, 6.56% (3 mo. Term SOFR + 1.26%), 01/15/2035 (a) | | 1,052,632 | | | 1,052,609 | |
Saranac CLO, Series 2013-1A, Class BR, 7.44% (3 mo. Term SOFR + 2.16%), 07/26/2029 (a) | | 250,000 | | | 250,341 | |
| THL Credit Lake Shore MM CLO Ltd. | | | | |
Series 2019-2A, Class A1RR, 6.69% (3 mo. Term SOFR + 1.40%), 10/17/2031 (a) | | 1,500,000 | | | 1,499,941 | |
Series 2021-1A, Class X, 6.74% (3 mo. Term SOFR + 1.44%), 10/15/2033 (a) | | 666,666 | | | 666,644 | |
Voya CLO Ltd., Series 2014-2A, Class A1RR, 6.57% (3 mo. Term SOFR + 1.28%), 04/17/2030 (a) | | 330,657 | | | 330,306 | |
TOTAL COLLATERALIZED LOAN OBLIGATIONS (Cost $11,374,831) | | | | 11,383,186 | |
| | | | |
| U.S. TREASURY SECURITIES - 1.5% | | | | |
| United States Treasury Note/Bond | | | | |
| 4.25%, 12/31/2024 | | 500,000 | | | 498,203 | |
| 1.50%, 02/15/2025 | | 800,000 | | | 784,804 | |
| 2.75%, 05/15/2025 | | 500,000 | | | 491,748 | |
TOTAL U.S. TREASURY SECURITIES (Cost $1,773,546) | | | | 1,774,755 | |
| | | | |
The accompanying notes are an integral part of these financial statements.
161
| | |
| STRIVE ENHANCED INCOME SHORT MATURITY ETF |
| SCHEDULE OF INVESTMENTS (CONTINUED) |
| July 31, 2024 |
| | | | | | | | | | | | | | |
| | | | |
| MORTGAGE-BACKED SECURITIES - 0.6% | | Par | | Value |
Federal Home Loan Mortgage Corp., Series KF130, Class AS, 0.00% (30 day avg SOFR US + 0.29%), 01/25/2029 | | $ | 650,832 | | | $ | 647,273 | |
TOTAL MORTGAGE-BACKED SECURITIES (Cost $647,273) | | | | 647,273 | |
| | | | |
| SHORT-TERM INVESTMENTS - 9.6% | | | | |
| Money Market Funds - 6.1% | | Shares | | |
First American Government Obligations Fund - Class X, 5.23% (d) | | 7,104,056 | | | 7,104,056 | |
| | | | |
| U.S. Treasury Bills - 3.5% | | Par | | |
5.23%, 08/22/2024 (e) | | 4,000,000 | | | 3,987,873 | |
TOTAL SHORT-TERM INVESTMENTS (Cost $11,091,929) | | | | 11,091,929 | |
| | | | |
TOTAL INVESTMENTS - 103.2% (Cost $118,891,751) | | | | $ | 119,305,972 | |
| Liabilities in Excess of Other Assets - (3.2)% | | | | (3,677,906) | |
| TOTAL NET ASSETS - 100.0% | | | | $ | 115,628,066 | |
Percentages are stated as a percent of net assets.
| | |
| AG - Aktiengesellschaft |
| PLC - Public Limited Company |
| REIT - Real Estate Investment Trust |
| SOFR - Secured Overnight Financing Rate |
| | | | | | | | |
| (a) | | Security is exempt from registration pursuant to Rule 144A under the Securities Act of 1933, as amended. These securities may only be resold in transactions exempt from registration to qualified institutional investors. As of July 31, 2024, the value of these securities total $54,934,970 or 47.5% of the Fund’s net assets. |
| (b) | | Step coupon bond. The rate disclosed is as of July 31, 2024. |
| (c) | | Coupon rate is variable based on the weighted average coupon of the underlying collateral. To the extent the weighted average coupon of the underlying assets which comprise the collateral increases or decreases, the coupon rate of this security will increase or decrease correspondingly. The rate disclosed is as of July 31, 2024. |
| (d) | | The rate shown represents the 7-day annualized effective yield as of July 31, 2024. |
| (e) | | The rate shown is the effective yield as of July 31, 2024. |
The Global Industry Classification Standard (GICS®) was developed by and/or is the exclusive property of MSCI, Inc. and Standard & Poor’s Financial Services LLC (“S&P”). GICS is a service mark of MSCI, Inc. and S&P and has been licensed for use by U.S. Bank Global Fund Services.
| | |
| SCHEDULE OF FUTURES CONTRACTS |
| July 31, 2024 |
| | | | | | | | | | | | | | | | | | | | | | | | | | |
| Description | | Contracts Purchased | | Expiration Date | | Notional | | Value / Unrealized Appreciation (Depreciation) |
| U.S. Treasury 2 Year Notes | | 10 | | 09/30/2024 | | $ | 2,053,672 | | | $ | 17,465 | |
| Total Unrealized Appreciation (Depreciation) | | | | | | | | $ | 17,465 | |
(b) Not applicable
The accompanying notes are an integral part of these financial statements.
162
Item 7. Financial Statements and Financial Highlights for Open-End Management Investment
Companies.
STATEMENTS OF ASSETS AND LIABILITIES
July 31, 2024
| | | | | | | | | | | | | | | | | | | | | | | | | | |
| | Strive 500 ETF | | Strive Mid-Cap ETF | | Strive Small-Cap ETF | | Strive 1000 Growth ETF |
| Assets: | | | | | | | | |
Investments in securities, at value(1) (See Note 2) | | $ | 600,939,643 | | | $ | 12,385,659 | | | $ | 55,433,254 | | | $ | 86,961,350 | |
| Dividends and interest receivable | | 354,198 | | | 3,714 | | | 11,235 | | | 26,937 | |
Securities lending income receivable
(See Note 5) | | 784 | | | — | | | 1,155 | | | 170 | |
| Total assets | | 601,294,625 | | 601,294,625 | | 12,389,373 | | | 55,445,644 | | | 86,988,457 | |
| | | | | | | | |
| Liabilities: | | | | | | | | |
| Due to securities lending agent (See Note 5) | | 59,400 | | | — | | | 592,281 | | | 22,744 | |
Accrued investment advisory fees
(See Note 4) | | 27,247 | | | 1,552 | | | 7,630 | | | 13,184 | |
| Total liabilities | | 86,647 | | | 1,552 | | | 599,911 | | | 35,928 | |
| Net Assets | | $ | 601,207,978 | | | $ | 12,387,821 | | | $ | 54,845,733 | | | $ | 86,952,529 | |
| | | | | | | | |
| Net Assets Consist of: | | | | | | | | |
| Paid-in capital | | $ | 488,832,194 | | | $ | 11,867,833 | | | $ | 49,412,068 | | | $ | 71,729,490 | |
| Total distributable earnings (accumulated deficit) | | 112,375,784 | | | 519,988 | | | 5,433,665 | | | 15,223,039 | |
| Net Assets: | | $ | 601,207,978 | | | $ | 12,387,821 | | | $ | 54,845,733 | | | $ | 86,952,529 | |
| | | | | | | | |
| Calculation of Net Asset Value Per Share: | | | | | | | | |
| Net Assets | | $ | 601,207,978 | | | $ | 12,387,821 | | | $ | 54,845,733 | | | $ | 86,952,529 | |
| Shares Outstanding (unlimited shares of beneficial interest authorized, no par value) | | 17,010,000 | | | 490,000 | | | 1,740,000 | | | 2,190,000 | |
| Net Asset Value per Share | | $ | 35.34 | | | $ | 25.28 | | | $ | 31.52 | | | $ | 39.70 | |
| | | | | | | | |
| Cost of Investments in Securities | | $ | 488,143,205 | | | $ | 11,863,141 | | | $ | 48,823,745 | | | $ | 71,633,627 | |
| | | | | | | | |
(1)Includes loaned securities with a value of | | $ | 55,077 | | | $ | — | | | $ | 582,329 | | | $ | 21,918 | |
The accompanying notes are an integral part of these financial statements.
1
STATEMENTS OF ASSETS AND LIABILITIES (CONTINUED)
July 31, 2024
| | | | | | | | | | | | | | | | | | | | | | | | | | |
| | Strive 1000 Value ETF | | Strive 1000 Dividend Growth ETF | | Strive U.S. Energy ETF | | Strive U.S. Semiconductor ETF |
| Assets: | | | | | | | | |
Investments in securities, at value(1) (See Note 2) | | $ | 54,652,477 | | | $ | 43,179,746 | | | $ | 344,845,634 | | | $ | 82,633,390 | |
| Receivable for investments sold | | — | | | — | | | — | | | 526,530 | |
| Dividends and interest receivable | | 62,795 | | | 32,316 | | | 42,614 | | | 39,754 | |
| Securities lending income receivable (See Note 5) | | 255 | | | 259 | | | 436 | | | 3 | |
| Total assets | | 54,715,527 | | | 43,212,321 | | | 344,888,684 | | | 83,199,677 | |
| | | | | | | | |
| Liabilities: | | | | | | | | |
| Due to securities lending agent (See Note 5) | | 28,860 | | | — | | | 560,016 | | | — | |
Accrued investment advisory fees
(See Note 4) | | 7,733 | | | 12,564 | | | 117,814 | | | 30,386 | |
| Total liabilities | | 36,593 | | | 12,564 | | | 677,830 | | | 30,386 | |
| Net Assets | | $ | 54,678,934 | | | $ | 43,199,757 | | | $ | 344,210,854 | | | $ | 83,169,291 | |
| | | | | | | | |
| Net Assets Consist of: | | | | | | | | |
| Paid-in capital | | $ | 49,760,546 | | | $ | 37,040,570 | | | $ | 336,891,921 | | | $ | 76,983,319 | |
| Total distributable earnings (accumulated deficit) | | 4,918,388 | | | 6,159,187 | | | 7,318,933 | | | 6,185,972 | |
| Net Assets: | | $ | 54,678,934 | | | $ | 43,199,757 | | | $ | 344,210,854 | | | $ | 83,169,291 | |
| | | | | | | | |
| Calculation of Net Asset Value Per Share: | | | | | | | | |
| Net Assets | | $ | 54,678,934 | | | $ | 43,199,757 | | | $ | 344,210,854 | | | $ | 83,169,291 | |
| Shares Outstanding (unlimited shares of beneficial interest authorized, no par value) | | 1,850,000 | | | 1,340,000 | | | 11,320,000 | | | 1,750,000 | |
| Net Asset Value per Share | | $ | 29.56 | | | $ | 32.24 | | | $ | 30.41 | | | $ | 47.53 | |
| | | | | | | | |
| Cost of Investments in Securities | | $ | 49,535,118 | | | $ | 36,539,536 | | | $ | 328,325,155 | | | $ | 75,215,474 | |
| | | | | | | | |
(1) Includes loaned securities with a value of | | $ | 28,242 | | | $ | — | | | $ | 549,821 | | | $ | — | |
The accompanying notes are an integral part of these financial statements.
2
STATEMENTS OF ASSETS AND LIABILITIES (CONTINUED)
July 31, 2024
| | | | | | | | | | | | | | | | | | | | |
| | Strive Natural Resources and Security ETF(2) | | Strive Emerging Markets Ex-China ETF | | Strive International Developed Markets ETF |
| Assets: | | | | | | |
Investments in securities, at value(1) (See Note 2) | | $ | 23,226,824 | | | $ | 101,300,804 | | | $ | 10,267,799 | |
| Foreign currencies, at value | | — | | | 62,945 | | | — | |
| Dividends and interest receivable | | 11,951 | | | 316,744 | | | 3,506 | |
| ETF variable fee receivable | | — | | | 23,022 | | | — | |
| Securities lending income receivable (See Note 5) | | 388 | | | — | | | — | |
| Total assets | | 23,239,163 | | | 101,703,515 | | | 10,271,305 | |
| | | | | | |
| Liabilities: | | | | | | |
| Deferred foreign capital gains tax | | — | | | 1,269,586 | | | — | |
| Payable for investment securities purchased | | — | | | 62,017 | | | — | |
| Due to securities lending agent (See Note 5) | | 21,713 | | | — | | | — | |
| Accrued investment advisory fees (See Note 4) | | 9,684 | | | 26,245 | | | 1,824 | |
| Total liabilities | | 31,397 | | | 1,357,848 | | | 1,824 | |
| Net Assets | | $ | 23,207,766 | | | $ | 100,345,667 | | | $ | 10,269,481 | |
| | | | | | | |
| Net Assets Consist of: | | | | | | |
| Paid-in capital | | $ | 22,470,458 | | | $ | 89,171,983 | | | $ | 10,144,320 | |
| Total distributable earnings (accumulated deficit) | | 737,308 | | | 11,173,684 | | | 125,161 | |
| Net Assets: | | $ | 23,207,766 | | | $ | 100,345,667 | | | $ | 10,269,481 | |
| | | | | | |
| Calculation of Net Asset Value Per Share: | | | | | | |
| Net Assets | | $ | 23,207,766 | | | $ | 100,345,667 | | | $ | 10,269,481 | |
| Shares Outstanding (unlimited shares of beneficial interest authorized, no par value) | | 800,000 | | | 3,350,000 | | | 400,000 | |
| Net Asset Value per Share | | $ | 29.01 | | | $ | 29.95 | | | $ | 25.67 | |
| | | | | | |
| Cost of investments in securities | | $ | 22,391,251 | | | $ | 86,656,207 | | | $ | 10,147,528 | |
| Cost of foreign currency | | $ | — | | | $ | 62,931 | | | $ | — | |
| | | | | | |
(1) Includes loaned securities with a value of | | $ | 22,760 | | | $ | — | | | $ | — | |
| | | | | | |
(2) Effective August 16, 2024, the name of the Fund has changed from Strive FAANG 2.0 ETF to Strive Natural Resources and Security ETF. |
The accompanying notes are an integral part of these financial statements.
3
STATEMENTS OF ASSETS AND LIABILITIES (CONTINUED)
July 31, 2024
| | | | | | | | | | | | | | |
| | Strive Total Return Bond ETF | | Strive Enhanced Income Short Maturity ETF |
| Assets: | | | | |
| Investments in securities, at value (See Note 2) | | $ | 102,004,568 | | | $ | 119,305,972 | |
| Dividend and interest receivable | | 632,058 | | | 575,323 | |
| Net unrealized appreciation on futures | | 777,789 | | | 17,465 | |
| Deposit at broker for futures | | 172,602 | | | 37,567 | |
| Total assets | | 103,587,017 | | | 119,936,327 | |
| | | | |
| Liabilities: | | | | |
| Payable for investment securities purchased | | 1,689,955 | | | 4,284,742 | |
| Accrued investment advisory fees (See Note 4) | | 40,808 | | | 23,519 | |
| Total liabilities | | 1,730,763 | | | 4,308,261 | |
| Net Assets | | $ | 101,856,254 | | | $ | 115,628,066 | |
| | | | | |
| Net Assets Consist of: | | | | |
| Paid-in capital | | $ | 100,345,459 | | | $ | 115,055,137 | |
| Total distributable earnings (accumulated deficit) | | 1,510,795 | | | 572,929 | |
| Net Assets: | | $ | 101,856,254 | | | $ | 115,628,066 | |
| | | | |
| Calculation of Net Asset Value Per Share: | | | | |
| Net Assets | | $ | 101,856,254 | | | $ | 115,628,066 | |
| Shares Outstanding (unlimited shares of beneficial interest authorized, no par value) | | 5,020,000 | | | 5,710,000 | |
| Net Asset Value per Share | | $ | 20.29 | | | $ | 20.25 | |
| | | | |
| Cost of investments in securities | | $ | 100,441,153 | | | $ | 118,891,751 | |
| Required margin held as collateral for futures contracts | | $ | 622,100 | | | $ | 10,500 | |
The accompanying notes are an integral part of these financial statements.
4
STATEMENTS OF OPERATIONS
For the Period Ended July 31, 2024
| | | | | | | | | | | | | | | | | | | | | | | | | | |
| | Strive 500 ETF | | Strive Mid-Cap ETF⁽1⁾ | | Strive Small-Cap ETF | | Strive 1000 Growth ETF |
| Investment Income: | | | | | | | | |
| Dividend income (net of foreign withholding tax of $6,674, $17, $731 and $279, respectively) | | $ | 5,791,828 | | | 34,330 | | | $ | 549,316 | | | $ | 423,425 | |
| Interest income | | 82,471 | | | 485 | | | 7,683 | | | 13,228 | |
| Securities lending income, net (See Note 5) | | 5,203 | | | — | | | 16,981 | | | 817 | |
| Total investment income | | 5,879,502 | | | 34,815 | | | 573,980 | | | 437,470 | |
| | | | | | | | |
| Expenses: | | | | | | | | |
| Investment advisory fees (See Note 4) | | 222,292 | | | 4,421 | | | 66,975 | | | 94,514 | |
| Net expenses | | 222,292 | | | 4,421 | | | 66,975 | | | 94,514 | |
| | | | | | | | |
| Net Investment Income (Loss) | | 5,657,210 | | | 30,394 | | | 507,005 | | | 342,956 | |
| | | | | | | | |
| Realized and Unrealized Gain (Loss) on Investments: | | | | | | | | |
| Net realized gain (loss) on: | | | | | | | | |
| Investments | | 4,645,378 | | | (11,259) | | | 1,497,696 | | | 102,826 | |
| | 4,645,378 | | | (11,259) | | | 1,497,696 | | | 102,826 | |
| Net change in unrealized appreciation (depreciation) on: | | | | | | | | |
| Investments | | 82,705,354 | | | 522,518 | | | 4,721,382 | | | 12,170,244 | |
| | 82,705,354 | | | 522,518 | | | 4,721,382 | | | 12,170,244 | |
| Net realized and unrealized gain (loss) on investments: | | 87,350,732 | | | 511,259 | | | 6,219,078 | | | 12,273,070 | |
| Net Increase (Decrease) in Net Assets Resulting from Operations | | $ | 93,007,942 | | | $ | 541,653 | | | $ | 6,726,083 | | | $ | 12,616,026 | |
(1) The Fund commenced operations on April 10, 2024.
The accompanying notes are an integral part of these financial statements.
5
STATEMENTS OF OPERATIONS (CONTINUED)
For the Year Ended July 31, 2024
| | | | | | | | | | | | | | | | | | | | | | | | | | |
| | Strive 1000 Value ETF | | Strive 1000 Dividend Growth ETF | | Strive U.S. Energy ETF | | Strive U.S. Semiconductor ETF |
| Investment Income: | | | | | | | | |
| Dividend income (net of foreign withholding tax of $1,515, $101, $6,158 and $4,733, respectively) | | $ | 863,397 | | | $ | 609,935 | | | $ | 10,863,624 | | | $ | 469,559 | |
| Interest income | | 6,381 | | | 5,691 | | | 47,672 | | | 9,982 | |
| Securities lending income, net (See Note 5) | | 1,031 | | | 1,010 | | | 1,270 | | | 990 | |
| Total investment income | | 870,809 | | | 616,636 | | | 10,912,566 | | | 480,531 | |
| | | | | | | | |
| Expenses: | | | | | | | | |
| Investment advisory fees (See Note 4) | | 55,133 | | | 116,836 | | | 1,419,497 | | | 211,458 | |
| Net expenses | | 55,133 | | | 116,836 | | | 1,419,497 | | | 211,458 | |
| | | | | | | | |
| Net Investment Income (Loss) | | 815,676 | | | 499,800 | | | 9,493,069 | | | 269,073 | |
| | | | | | | | |
| Realized and Unrealized Gain (Loss) on Investments: | | | | | | | | |
| Net realized gain (loss) on: | | | | | | | | |
| Investments | | 569,429 | | | 134,921 | | | 15,050,085 | | | 13,999,964 | |
| | 569,429 | | | 134,921 | | | 15,050,085 | | | 13,999,964 | |
| Net change in unrealized appreciation (depreciation) on: | | | | | | | | |
| Investments | | 4,181,033 | | | 5,164,282 | | | (4,310,160) | | | (1,271,109) | |
| | 4,181,033 | | | 5,164,282 | | | (4,310,160) | | | (1,271,109) | |
| Net realized and unrealized gain (loss) on investments: | | 4,750,462 | | | 5,299,203 | | | 10,739,925 | | | 12,728,855 | |
| Net Increase (Decrease) in Net Assets Resulting from Operations | | $ | 5,566,138 | | | $ | 5,799,003 | | | $ | 20,232,994 | | | $ | 12,997,928 | |
The accompanying notes are an integral part of these financial statements.
6
STATEMENTS OF OPERATIONS (CONTINUED)
For the Period Ended July 31, 2024
| | | | | | | | | | | | | | | | | | | | |
| | Strive Natural Resources and Security ETF(1) | | Strive Emerging Markets Ex-China ETF | | Strive International Developed Markets ETF(2) |
| Investment Income: | | | | | | |
| Dividend income (net of foreign withholding tax of $4,109, $388,660 and $1,079, respectively) | | $ | 121,151 | | | $ | 3,139,123 | | | $ | 6,684 | |
| Interest income | | 1,286 | | | 51,482 | | | 123 | |
| Securities lending income, net (See Note 5) | | 655 | | | — | | | — | |
| Total investment income | | 123,092 | | | 3,190,605 | | | 6,807 | |
| | | | | | |
| Expenses: | | | | | | |
| Investment advisory fees (See Note 4) | | 35,619 | | | 305,035 | | | 1,863 | |
| Overdraft fees expense | | — | | | 2,036 | | | — | |
| Net expenses | | 35,619 | | | 307,071 | | | 1,863 | |
| | | | | | |
| Net Investment Income (Loss) | | 87,473 | | | 2,883,534 | | | 4,944 | |
| | | | | | |
| Realized and Unrealized Gain (Loss) on Investments: | | | | | | |
| Net realized gain (loss) on: | | | | | | |
| Investments (net of foreign capital gains tax of $0, $539,965 and $0, respectively) | | 349,227 | | | (3,108,704) | | | — | |
| Foreign currency | | (310) | | | (26,344) | | | (56) | |
| | 348,917 | | | (3,135,048) | | | (56) | |
| Net change in unrealized appreciation (depreciation) on: | | | | | | |
| Investments (net change in deferred foreign capital gains tax of $0, $1,239,507 and $0, respectively) | | 889,286 | | | 5,835,383 | | | (24,787) | |
| Foreign currency | | (53,712) | | | (2,293,162) | | | 145,060 | |
| | 835,574 | | | 3,542,221 | | | 120,273 | |
| Net realized and unrealized gain (loss) on investments: | | 1,184,491 | | | 407,173 | | | 120,217 | |
| Net Increase (Decrease) in Net Assets Resulting from Operations | | $ | 1,271,964 | | | $ | 3,290,707 | | | $ | 125,161 | |
(1) The Fund commenced operations on August 30, 2023.
(2) The Fund commenced operations on June 25, 2024.
The accompanying notes are an integral part of these financial statements.
7
STATEMENTS OF OPERATIONS (CONTINUED)
For the Period Ended July 31, 2024
| | | | | | | | | | | | | | |
| | Strive Total Return Bond ETF ⁽¹⁾ | | Strive Enhanced Income Short Maturity ETF⁽¹⁾ |
| Investment Income: | | | | |
| Interest income | | $ | 4,040,562 | | | $ | 4,359,064 | |
| Total investment income | | 4,040,562 | | | 4,359,064 | |
| | | | |
| Expenses: | | | | |
| Investment advisory fees (See Note 4) | | 339,288 | | | 175,960 | |
| Net expenses | | 339,288 | | | 175,960 | |
| | | | |
| Net Investment Income (Loss) | | 3,701,274 | | | 4,183,104 | |
| | | | |
| Realized and Unrealized Gain (Loss) on Investments: | | | | |
| Net realized gain (loss) on: | | | | |
| Investments | | 162,495 | | | 88,234 | |
| Futures contracts | | (1,056,964) | | | (36,947) | |
| | (894,469) | | | 51,287 | |
| Net change in unrealized appreciation (depreciation) on: | | | | |
| Investments | | 1,563,416 | | | 414,221 | |
| Futures contracts | | 777,789 | | | 17,465 | |
| | 2,341,205 | | | 431,686 | |
| Net realized and unrealized gain (loss) on investments: | | 1,446,736 | | | 482,973 | |
| Net Increase (Decrease) in Net Assets Resulting from Operations | | $ | 5,148,010 | | | $ | 4,666,077 | |
(1) The Fund commenced operations on August 9, 2023.
The accompanying notes are an integral part of these financial statements.
8
STATEMENTS OF CHANGES IN NET ASSETS
| | | | | | | | | | | | | | | | | | | | | | |
| | Strive 500 ETF | | Strive Mid-Cap ETF | | |
| | For the Year Ended
July 31, 2024 | | For the Period Ended July 31, 2023(1) | | For the Period Ended July 31, 2024(2) | | |
| Increase (Decrease) in Net Assets from: | | | | | | | | |
| Operations: | | | | | | | | |
| Net investment income (loss) | | $ | 5,657,210 | | | $ | 1,648,426 | | | $ | 30,394 | | | |
| Net realized gain (loss) on investments | | 4,645,378 | | | 729,927 | | | (11,259) | | | |
| Net change in unrealized appreciation (depreciation) on investments | | 82,705,354 | | | 30,091,084 | | | 522,518 | | | |
| Net increase (decrease) in net assets resulting from operations | | 93,007,942 | | | 32,469,437 | | | 541,653 | | | |
| | | | | | | | | |
| Distributions to Shareholders: | | | | | | | | |
| Distributable earnings | | (5,358,321) | | | (1,419,614) | | | (21,665) | | | |
| Total distributions to shareholders | | (5,358,321) | | | (1,419,614) | | | (21,665) | | | |
| | | | | | | | | |
| Capital Share Transactions: | | | | | | | | |
| Proceeds from shares sold | | 281,414,552 | | | 229,618,180 | | | 11,867,833 | | | |
| Payments for shares redeemed | | (19,724,717) | | | (8,799,490) | | | — | | | |
| Transaction fees (See Note 1) | | 9 | | | — | | | — | | | |
| Net increase (decrease) in net assets derived from net change in capital share transactions | | 261,689,844 | | | 220,818,690 | | | 11,867,833 | | | |
| | | | | | | | |
| Net Increase (Decrease) in Net Assets | | 349,339,465 | | | 251,868,513 | | | 12,387,821 | | | |
| | | | | | | | |
| Net Assets: | | | | | | | | |
| Beginning of period | | 251,868,513 | | | — | | | — | | | |
| End of period | | $ | 601,207,978 | | | $ | 251,868,513 | | | $ | 12,387,821 | | | |
| | | | | | | | |
| Changes in Shares Outstanding: | | | | | | | | |
| Shares outstanding, beginning of period | | 8,600,000 | | | — | | | — | | | |
| Shares sold | | 9,060,000 | | | 8,950,000 | | | 490,000 | | | |
| Shares repurchased | | (650,000) | | | (350,000) | | | — | | | |
| Shares outstanding, end of period | | 17,010,000 | | 17,010,000 | | 8,600,000 | | | 490,000 | | | |
(1) The Fund commenced operations on September 14, 2022.
(2) The Fund commenced operations on April 10, 2024.
The accompanying notes are an integral part of these financial statements.
9
STATEMENTS OF CHANGES IN NET ASSETS (CONTINUED)
| | | | | | | | | | | | | | | | | | | | | | | | | | |
| | Strive Small-Cap ETF | | Strive 1000 Growth ETF |
| | For the Year Ended
July 31, 2024 | | For the Period Ended July 31, 2023(1) | | For the Year Ended
July 31, 2024 | | For the Period Ended July 31, 2023(1) |
| Increase (Decrease) in Net Assets from: | | | | | | | | |
| Operations: | | | | | | | | |
| Net investment income (loss) | | $ | 507,005 | | | $ | 82,659 | | | $ | 342,956 | | | $ | 54,117 | |
| Net realized gain (loss) on investments | | 1,497,696 | | | 133,494 | | | 102,826 | | | 28,675 | |
| Net change in unrealized appreciation (depreciation) on investments | | 4,721,382 | | | 1,888,127 | | | 12,170,244 | | | 3,157,479 | |
| Net increase (decrease) in net assets resulting from operations | | 6,726,083 | | | 2,104,280 | | | 12,616,026 | | | 3,240,271 | |
| | | | | | | | | |
| Distributions to Shareholders: | | | | | | | | |
| Distributable earnings | | (530,975) | | | (67,734) | | | (350,997) | | | (43,091) | |
| Total distributions to shareholders | | (530,975) | | | (67,734) | | | (350,997) | | | (43,091) | |
| | | | | | | | | |
| Capital Share Transactions: | | | | | | | | |
| Proceeds from shares sold | | 35,108,214 | | | 24,431,395 | | | 46,415,893 | | | 27,123,990 | |
| Payments for shares redeemed | | (10,297,175) | | | (2,628,360) | | | (706,110) | | | (1,343,455) | |
| Transaction fees (See Note 1) | | 4 | | | 1 | | | 1 | | | 1 | |
| Net increase (decrease) in net assets derived from net change in capital share transactions | | 24,811,043 | | | 21,803,036 | | | 45,709,784 | | | 25,780,536 | |
| | | | | | | | |
| Net Increase (Decrease) in Net Assets | | 31,006,151 | | | 23,839,582 | | | 57,974,813 | | | 28,977,716 | |
| | | | | | | | |
| Net Assets: | | | | | | | | |
| Beginning of period | | 23,839,582 | | | — | | | 28,977,716 | | | — | |
| End of period | | $ | 54,845,733 | | | $ | 23,839,582 | | | $ | 86,952,529 | | | $ | 28,977,716 | |
| | | | | | | | |
| Changes in Shares Outstanding: | | | | | | | | |
| Shares outstanding, beginning of period | | 850,000 | | | — | | | 900,000 | | | — | |
| Shares sold | | 1,260,000 | | | 950,000 | | | 1,310,000 | | | 950,000 | |
| Shares repurchased | | (370,000) | | | (100,000) | | | (20,000) | | | (50,000) | |
| Shares outstanding, end of period | | 1,740,000 | | | 850,000 | | | 2,190,000 | | | 900,000 | |
(1) The Fund commenced operations on November 9, 2022.
The accompanying notes are an integral part of these financial statements.
10
STATEMENTS OF CHANGES IN NET ASSETS (CONTINUED)
| | | | | | | | | | | | | | | | | | | | | | | | | | |
| | Strive 1000 Value ETF | | Strive 1000 Dividend Growth ETF |
| | For the Year Ended
July 31, 2024 | | For the Period Ended July 31, 2023(1) | | For the Year Ended
July 31, 2024 | | For the Period Ended July 31, 2023(1) |
| Increase (Decrease) in Net Assets from: | | | | | | | | |
| Operations: | | | | | | | | |
| Net investment income (loss) | | $ | 815,676 | | | $ | 133,064 | | | $ | 499,800 | | | $ | 105,293 | |
| Net realized gain (loss) on investments | | 569,429 | | | 1,603 | | | 134,921 | | | 30,599 | |
| Net change in unrealized appreciation (depreciation) on investments | | 4,181,033 | | | 936,325 | | | 5,164,282 | | | 1,475,928 | |
| Net increase (decrease) in net assets resulting from operations | | 5,566,138 | | 5,566,138 | | 1,070,992 | | | 5,799,003 | | | 1,611,820 | |
| | | | | | | | | |
| Distributions to Shareholders: | | | | | | | | |
| Distributable earnings | | (750,769) | | | (102,472) | | | (485,575) | | | (84,274) | |
| Total distributions to shareholders | | (750,769) | | | (102,472) | | | (485,575) | | | (84,274) | |
| | | | | | | | | |
| Capital Share Transactions: | | | | | | | | |
| Proceeds from shares sold | | 36,289,885 | | | 17,387,200 | | | 17,841,150 | | | 22,209,595 | |
| Payments for shares redeemed | | (3,526,850) | | | (1,255,190) | | | (2,370,182) | | | (1,321,780) | |
| Net increase (decrease) in net assets derived from net change in capital share transactions | | 32,763,035 | | | 16,132,010 | | | 15,470,968 | | | 20,887,815 | |
| | | | | | | | |
| Net Increase (Decrease) in Net Assets | | 37,578,404 | | | 17,100,530 | | | 20,784,396 | | | 22,415,361 | |
| | | | | | | | |
| Net Assets: | | | | | | | | |
| Beginning of period | | 17,100,530 | | | — | | | 22,415,361 | | | — | |
| End of period | | $ | 54,678,934 | | | $ | 17,100,530 | | | $ | 43,199,757 | | | $ | 22,415,361 | |
| | | | | | | | |
| Changes in Shares Outstanding: | | | | | | | | |
| Shares outstanding, beginning of period | | 650,000 | | | — | | | 800,000 | | | — | |
| Shares sold | | 1,330,000 | | | 700,000 | | | 620,000 | | | 850,000 | |
| Shares repurchased | | (130,000) | | | (50,000) | | | (80,000) | | | (50,000) | |
| Shares outstanding, end of period | | 1,850,000 | | | 650,000 | | | 1,340,000 | | | 800,000 | |
(1) The Fund commenced operations on November 9, 2022.
The accompanying notes are an integral part of these financial statements.
11
STATEMENTS OF CHANGES IN NET ASSETS (CONTINUED)
| | | | | | | | | | | | | | | | | | | | | | | | | | |
| | Strive U.S. Energy ETF | | Strive U.S.
Semiconductor ETF |
| | For the Year Ended
July 31, 2024 | | For the Period Ended July 31, 2023(1) | | For the Year Ended
July 31, 2024 | | For the Period Ended July 31, 2023(2) |
| Increase (Decrease) in Net Assets from: | | | | | | | | |
| Operations: | | | | | | | | |
| Net investment income (loss) | | $ | 9,493,069 | | | $ | 10,222,830 | | | $ | 269,073 | | | $ | 144,788 | |
| Net realized gain (loss) on investments | | 15,050,085 | | | 7,725,816 | | | 13,999,964 | | | 645,463 | |
| Net change in unrealized appreciation (depreciation) on investments | | (4,310,160) | | | 20,830,640 | | | (1,271,109) | | | 8,689,025 | |
| Net increase (decrease) in net assets resulting from operations | | 20,232,994 | | | 38,779,286 | | | 12,997,928 | | | 9,479,276 | |
| | | | | | | | | |
| Distributions to Shareholders: | | | | | | | | |
| Distributable earnings | | (9,743,291) | | | (9,891,239) | | | (254,625) | | | (137,017) | |
| Total distributions to shareholders | | (9,743,291) | | | (9,891,239) | | | (254,625) | | | (137,017) | |
| | | | | | | | | |
| Capital Share Transactions: | | | | | | | | |
| Proceeds from shares sold | | 98,672,695 | | | 423,825,077 | | | 67,659,754 | | | 31,001,497 | |
| Payments for shares redeemed | | (125,154,920) | | | (92,509,749) | | | (33,860,172) | | | (3,717,350) | |
| Transaction fees (See Note 1) | | — | | | 1 | | | — | | | — | |
| Net increase (decrease) in net assets derived from net change in capital share transactions | | (26,482,225) | | | 331,315,329 | | | 33,799,582 | | | 27,284,147 | |
| | | | | | | | |
| Net Increase (Decrease) in Net Assets | | (15,992,522) | | | 360,203,376 | | | 46,542,885 | | | 36,626,406 | |
| | | | | | | | |
| Net Assets: | | | | | | | | |
| Beginning of period | | 360,203,376 | | | — | | | 36,626,406 | | | — | |
| End of period | | $ | 344,210,854 | | | $ | 360,203,376 | | | $ | 83,169,291 | | | $ | 36,626,406 | |
| | | | | | | | |
| Changes in Shares Outstanding: | | | | | | | | |
| Shares outstanding, beginning of period | | 12,260,000 | | | — | | | 1,000,000 | | | — | |
| Shares sold | | 3,120,000 | | | 15,500,000 | | | 1,530,000 | | | 1,150,000 | |
| Shares repurchased | | (4,060,000) | | | (3,240,000) | | | (780,000) | | | (150,000) | |
| Shares outstanding, end of period | | 11,320,000 | | | 12,260,000 | | | 1,750,000 | | | 1,000,000 | |
(1) The Fund commenced operations on August 8, 2022.
(2) The Fund commenced operations on October 5, 2022.
The accompanying notes are an integral part of these financial statements.
12
STATEMENTS OF CHANGES IN NET ASSETS (CONTINUED)
| | | | | | | | | | | | | | | | | | | | | | |
| | Strive Natural Resources and Security ETF | | | | Strive Emerging Markets Ex-China ETF |
| | For the Period Ended July 31, 2024(1) | | | | For the Year Ended
July 31, 2024 | | For the Period Ended July 31, 2023(2) |
| Increase (Decrease) in Net Assets from: | | | | | | | | |
| Operations: | | | | | | | | |
| Net investment income (loss) | | $ | 87,473 | | | | | $ | 2,883,534 | | | $ | 1,362,334 | |
| Net realized gain (loss) on investments and foreign currency | | 348,917 | | | | | (3,135,048) | | | (1,324,066) | |
| Net change in unrealized appreciation (depreciation) on investments and foreign currency | | 835,574 | | | | | 3,542,221 | | | 9,799,698 | |
| Net increase (decrease) in net assets resulting from operations | | 1,271,964 | | 1,271,964 | | | | 3,290,707 | | | 9,837,966 | |
| | | | | | | | | |
| Distributions to Shareholders: | | | | | | | | |
| Distributable earnings | | (76,248) | | | | | (1,599,535) | | | (462,914) | |
| Total distributions to shareholders | | (76,248) | | | | | (1,599,535) | | | (462,914) | |
| | | | | | | | | |
| Capital Share Transactions: | | | | | | | | |
| Proceeds from shares sold | | 25,055,282 | | | | | 31,796,470 | | | 143,615,130 | |
| Payments for shares redeemed | | (3,043,232) | | | | | (87,293,030) | | | — | |
| Transaction fees (See Note 1) | | — | | | | | 424,052 | | | 736,821 | |
| Net increase (decrease) in net assets derived from net change in capital share transactions | | 22,012,050 | | | | | (55,072,508) | | | 144,351,951 | |
| | | | | | | | |
| Net Increase (Decrease) in Net Assets | | 23,207,766 | | | | | (53,381,336) | | | 153,727,003 | |
| | | | | | | | |
| Net Assets: | | | | | | | | |
| Beginning of period | | — | | | | | 153,727,003 | | | — | |
| End of period | | $ | 23,207,766 | | | | | $ | 100,345,667 | | | $ | 153,727,003 | |
| | | | | | | | |
| Changes in Shares Outstanding: | | | | | | | | |
| Shares outstanding, beginning of period | | — | | | | | 5,700,000 | | | — | |
| Shares sold | | 910,000 | | | | | 1,150,000 | | | 5,700,000 | |
| Shares repurchased | | (110,000) | | | | | (3,500,000) | | | — | |
| Shares outstanding, end of period | | 800,000 | | | | | 3,350,000 | | | 5,700,000 | |
(1) The Fund commenced operations on August 30, 2023.
(2) The Fund commenced operations on January 30, 2023.
The accompanying notes are an integral part of these financial statements.
13
STATEMENTS OF CHANGES IN NET ASSETS (CONTINUED)
| | | | | | | | | | | | | | | | | | | | | | |
| | Strive International Developed Markets ETF | | Strive Total Return
Bond ETF | | Strive Enhanced Income Short Maturity ETF | | |
| | For the Period Ended July 31, 2024(1) | | For the Period Ended July 31, 2024(2) | | For the Period Ended July 31, 2024(2) | | |
| Increase (Decrease) in Net Assets from: | | | | | | | | |
| Operations: | | | | | | | | |
| Net investment income (loss) | | $ | 4,944 | | | $ | 3,701,274 | | | $ | 4,183,104 | | | |
| Net realized gain (loss) on investments, futures, and foreign currency | | (56) | | | (894,469) | | | 51,287 | | | |
| Net change in unrealized appreciation (depreciation) on investments, futures, and foreign currency | | 120,273 | | | 2,341,205 | | | 431,686 | | | |
| Net increase (decrease) in net assets resulting from operations | | 125,161 | | 125,161 | | 5,148,010 | | | 4,666,077 | | | |
| | | | | | | | |
| Distributions to Shareholders: | | | | | | | | |
| Distributable earnings | | — | | | (3,637,215) | | | (4,093,148) | | | |
| Total distributions to shareholders | | — | | | (3,637,215) | | | (4,093,148) | | | |
| | | | | | | | |
| Capital Share Transactions: | | | | | | | | |
| Proceeds from shares sold | | 10,144,250 | | | 100,345,459 | | | 119,308,162 | | | |
| Payments for shares redeemed | | — | | | — | | | (4,253,025) | | | |
| Transaction fees (See Note 1) | | 70 | | | — | | | — | | | |
| Net increase (decrease) in net assets derived from net change in capital share transactions | | 10,144,320 | | | 100,345,459 | | | 115,055,137 | | | |
| | | | | | | | |
| Net Increase (Decrease) in Net Assets | | 10,269,481 | | | 101,856,254 | | | 115,628,066 | | | |
| | | | | | | | |
| Net Assets: | | | | | | | | |
| Beginning of period | | — | | | — | | | — | | | |
| End of period | | $ | 10,269,481 | | | $ | 101,856,254 | | | $ | 115,628,066 | | | |
| | | | | | | | |
| Changes in Shares Outstanding: | | | | | | | | |
| Shares outstanding, beginning of period | | — | | | — | | | — | | | |
| Shares sold | | 400,000 | | | 5,020,000 | | | 5,920,000 | | | |
| Shares repurchased | | — | | | — | | | (210,000) | | | |
| Shares outstanding, end of period | | 400,000 | | | 5,020,000 | | | 5,710,000 | | | |
(1) The Fund commenced operations on June 25, 2024.
(2) The Fund commenced operations on August 9, 2023.
The accompanying notes are an integral part of these financial statements.
14
STRIVE ETFs
FINANCIAL HIGHLIGHTS
| | | | | | | | | | | | | | | | | | | | | | | | | | | | | | | | | | | | | | | | | |
| Net Asset Value, Beginning of Period | Net Investment Income (Loss)(1) | Net Realized and Unrealized Gain (Loss) on Investments | Net Increase (Decrease) in Net Asset Value Resulting from Operations | Distributions from Net Investment Income | Total Distributions | Transaction Fee(7) | Net Asset Value, End of Period | Total Return(2) | Net Assets, End of Period (000's) | Net Expenses(3)(4) | Net Investment Income (Loss)(3) | Portfolio Turnover Rate(5) |
| Strive 500 ETF | | | | | | | | | | | | | |
| For the Year Ended July 31, 2024 | $ | 29.29 | | 0.44 | | 6.02 | | 6.46 | | (0.41) | | (0.41) | | 0.00 | | $ | 35.34 | | 22.26 | % | $ | 601,208 | | 0.0545 | % | 1.40 | % | 4 | % |
For the Period September 14, 2022(6) to July 31, 2023 | $ | 25.10 | | 0.35 | | 4.10 | | 4.45 | | (0.26) | | (0.26) | | N/A | $ | 29.29 | | 17.85 | % | $ | 251,869 | | 0.0545 | % | 1.52 | % | 3 | % |
| | | | | | | | | | | | | |
| Strive Mid-Cap ETF | | | | | | | | | | | | | |
For the Period April 10, 2024(6) to July 31, 2024 | $ | 24.50 | | 0.09 | | 0.75 | | 0.84 | | (0.06) | | (0.06) | | N/A | $ | 25.28 | | 3.44 | % | $ | 12,388 | | 0.18 | % | 1.24 | % | 4 | % |
| | | | | | | | | | | | | |
| Strive Small-Cap ETF | | | | | | | | | | | | | |
| For the Year Ended July 31, 2024 | $ | 28.05 | | 0.38 | | 3.48 | | 3.86 | | (0.39) | | (0.39) | | 0.00(8) | $ | 31.52 | | 13.99 | % | $ | 54,846 | | 0.18 | % | 1.36 | % | 31 | % |
For the Period November 9, 2022(6) to July 31, 2023 | $ | 24.32 | | 0.25 | | 3.67 | | 3.92 | | (0.19) | | (0.19) | | 0.00(8) | $ | 28.05 | | 16.20 | % | $ | 23,840 | | 0.18 | % | 1.34 | % | 20 | % |
| | | | | | | | | | | | | |
| Strive 1000 Growth ETF | | | | | | | | | | | | | |
| For the Year Ended July 31, 2024 | $ | 32.20 | | 0.24 | | 7.49 | | 7.73 | | (0.23) | | (0.23) | | 0.00(8) | $ | 39.70 | | 24.14 | % | $ | 86,953 | | 0.18 | % | 0.65 | % | 9 | % |
For the Period November 9, 2022(6) to July 31, 2023 | $ | 24.51 | | 0.16 | | 7.64 | | 7.80 | | (0.11) | | (0.11) | | N/A | $ | 32.20 | | 31.88 | % | $ | 28,978 | | 0.18 | % | 0.74 | % | 2 | % |
| | | | | | | | | | | | | |
| Strive 1000 Value ETF | | | | | | | | | | | | | |
| For the Year Ended July 31, 2024 | $ | 26.31 | | 0.73 | | 3.18 | | 3.91 | | (0.66) | | (0.66) | | N/A | $ | 29.56 | | 15.12 | % | $ | 54,679 | | 0.18 | % | 2.66 | % | 13 | % |
For the Period November 9, 2022(6) to July 31, 2023 | $ | 24.45 | | 0.47 | | 1.72 | | 2.19 | | (0.33) | | (0.33) | | N/A | $ | 26.31 | | 9.03 | % | $ | 17,101 | | 0.18 | % | 2.62 | % | 4 | % |
| | | | | | | | | | | | | |
The accompanying notes are an integral part of these financial statements.
15
STRIVE ETFs
FINANCIAL HIGHLIGHTS (CONTINUED)
| | | | | | | | | | | | | | | | | | | | | | | | | | | | | | | | | | | | | | | | | |
| Net Asset Value, Beginning of Period | Net Investment Income (Loss)(1) | Net Realized and Unrealized Gain (Loss) on Investments | Net Increase (Decrease) in Net Asset Value Resulting from Operations | Distributions from Net Investment Income | Total Distributions | Transaction Fee(7) | Net Asset Value, End of Period | Total Return(2) | Net Assets, End of Period (000's) | Net Expenses(3)(4) | Net Investment Income (Loss)(3) | Portfolio Turnover Rate(5) |
| Strive 1000 Dividend Growth ETF | | | | | | | | | | | | | |
| For the Year Ended July 31, 2024 | $ | 28.02 | | 0.44 | | 4.20 | | 4.64 | | (0.42) | | (0.42) | | N/A | $ | 32.24 | | 16.73 | % | $ | 43,200 | | 0.35 | % | 1.50 | % | 10 | % |
For the Period November 9, 2022(6) to July 31, 2023 | $ | 24.59 | | 0.30 | | 3.35 | | 3.65 | | (0.22) | | (0.22) | | 0.00(8) | $ | 28.02 | | 14.90 | % | $ | 22,415 | | 0.35 | % | 1.56 | % | 18 | % |
| | | | | | | | | | | | | |
| Strive U.S. Energy ETF | | | | | | | | | | | | | |
| For the Year Ended July 31, 2024 | $ | 29.38 | | 0.81 | | 1.06 | | 1.87 | | (0.84) | | (0.84) | | N/A | $ | 30.41 | | 6.43 | % | $ | 344,211 | | 0.41 | % | 2.74 | % | 21 | % |
For the Period August 8, 2022(6) to July 31, 2023 | $ | 25.12 | | 0.84 | | 4.20 | | 5.04 | | (0.78) | | (0.78) | | 0.00(8) | $ | 29.38 | | 20.22 | % | $ | 360,203 | | 0.41 | % | 3.04 | % | 6 | % |
| | | | | | | | | | | | | |
| Strive U.S. Semiconductor ETF | | | | | | | | | | | | | |
| For the Year Ended July 31, 2024 | $ | 36.63 | | 0.21 | | 10.90 | | 11.11 | | (0.21) | | (0.21) | | N/A | $ | 47.53 | | 30.46 | % | $ | 83,169 | | 0.40 | % | 0.51 | % | 29 | % |
For the Period October 5, 2022(6) to July 31, 2023 | $ | 25.07 | | 0.22 | | 11.53 | | 11.75 | | (0.19) | | (0.19) | | N/A | $ | 36.63 | | 47.03 | % | $ | 36,626 | | 0.40 | % | 0.92 | % | 10 | % |
| | | | | | | | | | | | | |
| Strive Natural Resources and Security ETF | | | | | | | | | | | | |
For the Period August 30, 2023(6) to July 31, 2024 | $ | 25.13 | | 0.30 | | 3.84 | | 4.14 | | (0.26) | | (0.26) | | N/A | $ | 29.01 | | 16.60 | % | $ | 23,208 | | 0.49 | % | 1.20 | % | 27 | % |
| | | | | | | | | | | | | |
| Strive Emerging Markets Ex-China ETF | | | | | | | | | | | | |
| For the Year Ended July 31, 2024 | $ | 26.97 | | 0.82 | | 2.35 | | 3.17 | | (0.31) | | (0.31) | | 0.12 | | $ | 29.95 | | 12.38 | % | $ | 100,346 | | 0.32 | % | 3.02 | % | 80 | % |
For the Period January 30, 2023(6) to July 31, 2023 | $ | 25.17 | | 0.29 | | 1.43 | | 1.88 | | (0.08) | | (0.08) | | 0.16 | | $ | 26.97 | | 7.49 | % | $ | 153,727 | | 1.29 | % | 2.28 | % | 39 | % |
| | | | | | | | | | | | | |
The accompanying notes are an integral part of these financial statements.
16
STRIVE ETFs
FINANCIAL HIGHLIGHTS (CONTINUED)
| | | | | | | | | | | | | | | | | | | | | | | | | | | | | | | | | | | | | | | | | |
| Net Asset Value, Beginning of Period | Net Investment Income (Loss)(1) | Net Realized and Unrealized Gain (Loss) on Investments | Net Increase (Decrease) in Net Asset Value Resulting from Operations | Distributions from Net Investment Income | Total Distributions | Transaction Fee(7) | Net Asset Value, End of Period | Total Return(2) | Net Assets, End of Period (000's) | Net Expenses(3)(4) | Net Investment Income (Loss)(3) | Portfolio Turnover Rate(5) |
| Strive International Developed Markets ETF | | | | | | | | | | | | |
For the Period June 25, 2024(6) to July 31, 2024 | $ | 25.11 | | 0.02 | | 0.54 | | 0.56 | | — | | — | | 0.00(8) | $ | 25.67 | | 2.24 | % | $ | 10,269 | | 0.29 | % | 0.77 | % | 0 | % |
| | | | | | | | | | | | | |
| Strive Total Return Bond ETF | | | | | | | | | | | | | |
For the Period August 9, 2023(6) to July 31, 2024 | $ | 20.00 | | 1.04 | | 0.21 | | 1.25 | | (0.96) | | (0.96) | | N/A | $ | 20.29 | | 6.45 | % | $ | 101,856 | | 0.49 | % | 5.35 | % | 51 | % |
| | | | | | | | | | | | | |
| Strive Enhanced Income Short Maturity ETF | | | | | | | | | | | | |
For the Period August 9, 2023(6) to July 31, 2024 | $ | 20.00 | | 1.17 | | 0.12 | | 1.29 | | (1.04) | | (1.04) | | N/A | $ | 20.25 | | 6.57 | % | $ | 115,628 | | 0.25 | % | 5.94 | % | 83 | % |
| | | | | | | | | | | | | |
| | |
| (1) Net investment income per share represents net investment income divided by the daily average shares of beneficial interest outstanding throughout the period. |
| (2) All returns reflect reinvested dividends, if any, but do not reflect the impact of taxes. Total return for a period of less than one year is not annualized. |
| (3) For periods of less than one year, these ratios are annualized. |
| (4) Net expenses include effects of any reimbursement or recoupment. |
| (5) Portfolio turnover is not annualized and is calculated without regard to short-term securities having a maturity of less than one year. Excludes the impact of in-kind transactions. |
| (6) Commencement of operations. |
| (7) See Note 1. |
| (8) Less than $0.005. |
The accompanying notes are an integral part of these financial statements.
17
STRIVE ETFs
NOTES TO THE FINANCIAL STATEMENTS
July 31, 2024
NOTE 1 – ORGANIZATION
Each fund listed in the table below (each, a “Fund”, or collectively, the “Funds”) is a series of the EA Series Trust (the “Trust”), which was organized as a Delaware statutory trust on October 11, 2013. Each Fund may be referred to herein by the ticker symbol indicated in the table below. The Trust is registered with the Securities and Exchange Commission (“SEC”) under the Investment Company Act of 1940, as amended (the “1940 Act”), as an open-end management investment company, and the offering of the Funds’ shares (“Shares”) is registered under the Securities Act of 1933, as amended (the “Securities Act”). Each of the Funds is considered non-diversified under the 1940 Act. Each Fund qualifies as an investment company as defined in the Financial Accounting Standards Codification Topic 946-Financial Services - Investment Companies. Each Fund is listed on the New York Stock Exchange.
| | | | | | | | | | | |
| Fund | Ticker | Commencement of Operations | Creation Unit Size |
| Strive 500 ETF | STRV | September 14, 2022 | 10,000 |
| Strive Mid-Cap ETF | STXM | April 10, 2024 | 10,000 |
| Strive Small-Cap ETF | STXK | November 9, 2022 | 10,000 |
| Strive 1000 Growth ETF | STXG | November 9, 2022 | 10,000 |
| Strive 1000 Value ETF | STXV | November 9, 2022 | 10,000 |
| Strive 1000 Dividend Growth ETF | STXD | November 9, 2022 | 10,000 |
| Strive U.S. Energy ETF | DRLL | August 8, 2022 | 10,000 |
| Strive U.S. Semiconductor ETF | SHOC | October 5, 2022 | 10,000 |
| Strive Natural Resources and Security ETF | FTWO | August 30, 2023 | 10,000 |
| Strive Emerging Markets Ex-China ETF | STXE | January 30, 2023 | 50,000 |
| Strive International Developed Markets ETF | STXI | June 25, 2024 | 50,000 |
| Strive Total Return Bond ETF | STXT | August 9, 2023 | 10,000 |
| Strive Enhanced Income Short Maturity ETF | BUXX | August 9, 2023 | 10,000 |
Prior to August 16, 2024, the name of the Strive Natural Resources and Security ETF was Strive FAANG 2.0 ETF.
The investment objective of the below Funds is to seek to track the total return performance, before fees and expenses, of an index as described in the table below, and each Fund’s strategy is to track the investment results of its underlying index. The underlying index for each Fund is defined below:
| | | | | | | | | | | | | | |
| Fund | | Index Description | | Index |
| STRV | | U.S.-listed large cap equity securities | | Bloomberg U.S. Large Cap Index |
| STXM | | U.S. mid-capitalization companies | | Bloomberg U.S. 400 Index |
| STXK | | U.S. small-capitalization companies | | Bloomberg U.S. 600 Index |
| STXG | | Large- and mid-capitalization U.S. equity securities that exhibit growth characteristics | | Bloomberg U.S. 1000 Growth Index |
| STXV | | Large- and mid-capitalization U.S. equity securities that exhibit value characteristics | | Bloomberg U.S. 1000 Value Index |
| STXD | | U.S.-listed equities with a history of consistently growing dividends | | Bloomberg U.S. 1000 Dividend Growth Index |
| DRLL | | U.S.-listed equities in the energy sector | | Bloomberg U.S. Energy Select Index |
| SHOC | | U.S.-listed equities in the semiconductor sector | | Bloomberg U.S. Listed Semiconductors Select Index |
| FTWO | | Companies that are engaged in national security and natural resource security | | Bloomberg FAANG 2.0 Select Index |
| STXE | | Emerging market, ex-China securities | | Bloomberg Emerging Markets ex China Large & Mid Cap Index |
| STXI | | Developed markets, ex-US securities | | Bloomberg Developed Markets ex U.S. Large & Mid Cap Index |
STRIVE ETFs
NOTES TO THE FINANCIAL STATEMENTS (CONTINUED)
July 31, 2024
Prior to January 26, 2024, STRV’s underlying index was the Solactive GBS United States 500 Index. Prior to January 25, 2023, STXK’s underlying index was the Bloomberg US 2000. Prior to April 11, 2024, DRLL’s underlying index was the Solactive United States Energy Regulated Capped Index. Prior to March 21, 2024, SHOC’s underlying index was the Solactive United States Semiconductors 30 Capped Total Return Index. The investment objective of BUXX is to seek to provide current income while seeking to minimize price volatility and maintain liquidity, and the investment objective of the STXT is to seek to maximize total return. Each Fund manages to its respective index.
Market prices for the shares may be different from their net asset value (“NAV”). The Funds issue and redeem shares on a continuous basis at NAV only in blocks of shares, called “Creation Units.” Creation Units are issued and redeemed principally in-kind for securities included in a specified universe. For STXT and BUXX, Creation Units are issued principally for cash. Once created, shares generally trade in the secondary market at market prices that change throughout the day in share amounts less than a Creation Unit. Except when aggregated in Creation Units, shares are not redeemable securities of the Funds. Shares of the Funds may only be purchased or redeemed by certain financial institutions (“Authorized Participants”). An Authorized Participant is a participant of a clearing agency registered with the SEC, which has a written agreement with the Trust or one of its service providers that allows the authorized participant to place orders for the purchase and redemption of creation units. Most retail investors do not qualify as Authorized Participants nor have the resources to buy and sell whole Creation Units. Therefore, they are unable to purchase or redeem the shares directly from a Fund. Rather, most retail investors may purchase Shares in the secondary market with the assistance of a broker and are subject to customary brokerage commissions or fees.
Authorized Participants may be required to pay a transaction fee to compensate the Trust or its custodian for costs incurred in connection with creation and redemption transactions. Certain transactions consisting all or partially of cash may also be subject to a variable charge, which is payable to the relevant Fund, of up to 2.00% of the value of the order in addition to the transaction fee. A Fund may determine to waive the variable charge on certain orders when such waiver is determined to be in the best interests of Fund shareholders. Transaction fees received by a Fund, if any, are displayed in the Capital Share Transactions sections of the Statements of Changes in Net Assets.
NOTE 2 – SIGNIFICANT ACCOUNTING POLICIES
The following is a summary of significant accounting policies consistently followed by the Fund. These policies are in conformity with accounting principles generally accepted in the United States of America (“GAAP”).
A.Security Valuation. Equity securities that are traded on a national securities exchange, except those listed on the NASDAQ Global Market® (“NASDAQ”) are valued at the last reported sale price on the exchange on which the security is principally traded. Securities traded on NASDAQ will be valued at the NASDAQ Official Closing Price (“NOCP”). If, on a particular day, an exchange-traded or NASDAQ security does not trade, then the most recent quoted bid for exchange-traded or the mean between the most recent quoted bid and ask price for NASDAQ securities will be used. Equity securities that are not traded on a listed exchange are generally valued at the last sale price in the over-the-counter market. If a non-exchange traded security does not trade on a particular day, then the mean between the last quoted closing bid and asked price will be used. Prices denominated in foreign currencies are converted to U.S. dollar equivalents at the current exchange rate, which approximates fair value. Redeemable securities issued by open-end investment companies are valued at the investment company’s applicable net asset value, with the exception of exchange-traded open-end investment companies which are priced as equity securities. Fair values for long-term debt securities, including asset-backed securities (“ABS”), collateralized loan obligations (“CLO”), collateralized mortgage obligations (“CMO”), corporate obligations, whole loans, and mortgage-backed securities (“MBS”) are normally determined on the basis of valuations provided by independent pricing services. Vendors typically value such securities based on one or more inputs, including but not limited to, benchmark yields, transactions, bids, offers, quotations from dealers and trading systems, new issues, spreads and other relationships observed in the markets among comparable securities; and pricing models such as yield measurers calculated using factors such as cash flows, financial or collateral performance and other reference data. In addition to these inputs, MBS and ABS may utilize cash flows, prepayment information, default rates, delinquency and loss assumptions, collateral characteristics, credit enhancements and specific deal information. Reverse repurchase agreements are priced at their acquisition cost, and assessed for credit adjustments, which represents fair value. Futures contracts are carried at fair value using the primary exchange’s closing (settlement) price.
STRIVE ETFs
NOTES TO THE FINANCIAL STATEMENTS (CONTINUED)
July 31, 2024
Subject to its oversight, the Trust’s Board of Trustees (the “Board”) has delegated primary responsibility for determining or causing to be determined the value of the Fund’s investments to Empowered Funds, LLC dba EA Advisers (the “Adviser”), pursuant to the Trust’s valuation policy and procedures, which have been adopted by the Trust and approved by the Board. In accordance with Rule 2a-5 under the 1940 Act, the Board designated the Adviser as the “valuation designee” of the Fund. If the Adviser, as valuation designee, determines that reliable market quotations are not readily available for an investment, the investment is valued at fair value as determined in good faith by the Adviser in accordance with the Trust’s fair valuation policy and procedures. The Adviser will provide the Board with periodic reports, no less frequently than quarterly, that discuss the functioning of the valuation process, if applicable, and that identify issues and valuation problems that have arisen, if any. As appropriate, the Adviser and the Board will review any securities valued by the Adviser in accordance with the Trust’s valuation policies during these periodic reports. The use of fair value pricing by the Fund may cause the net asset value of its shares to differ significantly from the net asset value that would be calculated without regard to such considerations. As of July 31, 2024, the Funds did not hold any securities that required fair valuation due to unobservable inputs.
As described above, the Fund may use various methods to measure the fair value of their investments on a recurring basis. GAAP establishes a hierarchy that prioritizes inputs to valuation methods. The three levels of inputs are:
Level 1 – Unadjusted quoted prices in active markets for identical assets or liabilities that the Fund has the ability to access.
Level 2 – Observable inputs other than quoted prices included in Level 1 that are observable for the asset or liability, either directly or indirectly. These inputs may include quoted prices for the identical instrument on an inactive market, prices for similar instruments, interest rates, prepayment speeds, credit risk, yield curves, default rates and similar data.
Level 3 – Unobservable inputs for the asset or liability, to the extent relevant observable inputs are not available; representing the Fund’s own assumptions about the assumptions a market participant would use in valuing the asset or liability and would be based on the best information available.
The availability of observable inputs can vary from security to security and is affected by a wide variety of factors, including, for example, the type of security, whether the security is new and not yet established in the marketplace, the liquidity of markets, and other characteristics particular to the security. To the extent that valuation is based on models or inputs that are less observable or unobservable in the market, the determination of fair value requires more judgment. Accordingly, the degree of judgment exercised in determining fair value is greatest for instruments categorized in Level 3.
The inputs used to measure fair value may fall into different levels of the fair value hierarchy. In such cases, for disclosure purposes, the level in the fair value hierarchy within which the fair value measurement falls in its entirety, is determined based on the lowest level input that is significant to the fair value measurement in its entirety.
STRIVE ETFs
NOTES TO THE FINANCIAL STATEMENTS (CONTINUED)
July 31, 2024
The following is a summary of the fair value classification of each Fund’s investments as of July 31, 2024:
| | | | | | | | | | | | | | | | | | | | | | | | | | |
| DESCRIPTION | | LEVEL 1 | | LEVEL 2 | | LEVEL 3 | | TOTAL |
| STRV | | | | | | | | |
| Assets | | | | | | | | |
| Common Stocks | | $ | 586,883,097 | | | $ | — | | | $ | — | | | $ | 586,883,097 | |
| Real Estate Investment Trusts | | 11,901,117 | | | — | | | — | | | 11,901,117 | |
| Investments Purchased with Proceeds from Securities Lending | | 59,400 | | | — | | | — | | | 59,400 | |
| Money Market Funds | | 2,096,029 | | | — | | | — | | | 2,096,029 | |
| Total Investments in Securities | | $ | 600,939,643 | | | $ | — | | | $ | — | | | $ | 600,939,643 | |
| | | | | | | | |
| STXM | | | | | | | | |
| Assets | | | | | | | | |
| Common Stocks | | $ | 11,425,542 | | | $ | — | | | $ | — | | | $ | 11,425,542 | |
| Real Estate Investment Trusts | | 913,482 | | | — | | | — | | | 913,482 | |
| Money Market Funds | | 46,635 | | | — | | | — | | | 46,635 | |
| Total Investments in Securities | | $ | 12,385,659 | | | $ | — | | | $ | — | | | $ | 12,385,659 | |
| | | | | | | | |
| STXK | | | | | | | | |
| Assets | | | | | | | | |
| Common Stocks | | $ | 51,338,128 | | | $ | — | | | $ | — | | | $ | 51,338,128 | |
| Real Estate Investment Trusts | | 3,406,247 | | | — | | | — | | | 3,406,247 | |
| Investments Purchased with Proceeds from Securities Lending | | 592,281 | | | — | | | — | | | 592,281 | |
| Money Market Funds | | 96,598 | | | — | | | — | | | 96,598 | |
| Total Investments in Securities | | $ | 55,433,254 | | | $ | — | | | $ | — | | | $ | 55,433,254 | |
| | | | | | | | |
| STXG | | | | | | | | |
| Assets | | | | | | | | |
| Common Stocks | | $ | 85,127,634 | | | $ | — | | | $ | — | | | $ | 85,127,634 | |
| Real Estate Investment Trusts | | 1,537,609 | | | — | | | — | | | 1,537,609 | |
| Contingent Value Rights | | — | | | — | | | 0* | | 0* |
| Investments Purchased with Proceeds from Securities Lending | | 22,744 | | | — | | | — | | | 22,744 | |
| Money Market Funds | | 273,363 | | | — | | | — | | | 273,363 | |
| Total Investments in Securities | | $ | 86,961,350 | | | $ | — | | | $ 0* | | $ | 86,961,350 | |
| | | | | | | | |
| STXV | | | | | | | | |
| Assets | | | | | | | | |
| Common Stocks | | $ | 52,267,720 | | | $ | — | | | $ | — | | | $ | 52,267,720 | |
| Real Estate Investment Trusts | | 2,050,703 | | | — | | | — | | | 2,050,703 | |
| Investments Purchased with Proceeds from Securities Lending | | 28,860 | | | — | | | — | | | 28,860 | |
| Money Market Funds | | 305,194 | | | — | | | — | | | 305,194 | |
| Total Investments in Securities | | $ | 54,652,477 | | | $ | — | | | $ | — | | | $ | 54,652,477 | |
| | | | | | | | |
STRIVE ETFs
NOTES TO THE FINANCIAL STATEMENTS (CONTINUED)
July 31, 2024
| | | | | | | | | | | | | | | | | | | | | | | | | | |
| DESCRIPTION | | LEVEL 1 | | LEVEL 2 | | LEVEL 3 | | TOTAL |
| STXD | | | | | | |
| Assets | | | | | | | | |
| Common Stocks | | $ | 41,752,499 | | | $ | — | | | $ | — | | | $ | 41,752,499 | |
| Real Estate Investment Trusts | | 1,330,704 | | | — | | | — | | | 1,330,704 | |
| Money Market Funds | | 96,543 | | | — | | | — | | | 96,543 | |
| Total Investments in Securities | | $ | 43,179,746 | | | $ | — | | | $ | — | | | $ | 43,179,746 | |
| | | | | | | | |
| DRLL | | | | | | | | |
| Assets | | | | | | | | |
| Common Stocks | | $ | 343,721,097 | | | $ | — | | | $ | — | | | $ | 343,721,097 | |
| Investments Purchased with Proceeds from Securities Lending | | 560,016 | | | — | | | — | | | 560,016 | |
| Money Market Funds | | 564,521 | | | — | | | — | | | 564,521 | |
| Total Investments in Securities | | $ | 344,845,634 | | | $ | — | | | $ | — | | | $ | 344,845,634 | |
| | | | | | | | |
| SHOC | | | | | | | | |
| Assets | | | | | | | | |
| Common Stocks | | $ | 82,423,040 | | | $ | — | | | $ | — | | | $ | 82,423,040 | |
| Money Market Funds | | 210,350 | | | — | | | — | | | 210,350 | |
| Total Investments in Securities | | $ | 82,633,390 | | | $ | — | | | $ | — | | | $ | 82,633,390 | |
| | | | | | | | |
| FTWO | | | | | | | | |
| Assets | | | | | | | | |
| Common Stocks | | $ | 23,142,648 | | | $ | — | | | $ | — | | | $ | 23,142,648 | |
| Investments Purchased with Proceeds from Securities Lending | | 21,713 | | | — | | | — | | | 21,713 | |
| Money Market Funds | | 62,463 | | | — | | | — | | | 62,463 | |
| Total Investments in Securities | | $ | 23,226,824 | | | $ | — | | | $ | — | | | $ | 23,226,824 | |
| | | | | | | | |
| STXE | | | | | | |
| Assets | | | | | | | | |
| Common Stocks | | $ | 97,151,343 | | | $ | — | | | $ | — | | | $ | 97,151,343 | |
| Preferred Stocks | | 2,751,725 | | | — | | | — | | | 2,751,725 | |
| Real Estate Investment Trusts | | 99,101 | | | — | | | — | | | 99,101 | |
| Rights | | 356 | | | — | | | 1,906 | | | 2,262 | |
| Money Market Funds | | 1,296,373 | | | — | | | — | | | 1,296,373 | |
| Total Investments in Securities | | $ | 101,298,898 | | | $ | — | | | $ | 1,906 | | | $ | 101,300,804 | |
| | | | | | | | |
| STXI | | | | | | |
| Assets | | | | | | | | |
| Common Stocks | | $ | 10,208,898 | | | $ | — | | | $ | — | | | $ | 10,208,898 | |
| Real Estate Investment Trusts | | 27,361 | | | — | | | — | | | 27,361 | |
| Money Market Funds | | 31,540 | | | — | | | — | | | 31,540 | |
| Total Investments in Securities | | $ | 10,267,799 | | | $ | — | | | $ | — | | | $ | 10,267,799 | |
| | | | | | | | |
| | | | | | | | |
STRIVE ETFs
NOTES TO THE FINANCIAL STATEMENTS (CONTINUED)
July 31, 2024
| | | | | | | | | | | | | | | | | | | | | | | | | | |
| DESCRIPTION | | LEVEL 1 | | LEVEL 2 | | LEVEL 3 | | TOTAL |
| STXT | | | | | | | | |
| Assets | | | | | | | | |
| Mortgage-backed Securities | | $ | — | | | $ | 46,411,865 | | | $ | — | | | $ | 46,411,865 | |
| Asset-backed Securities | | — | | | 17,570,928 | | | — | | | 17,570,928 | |
| U.S. Treasury Obligations | | — | | | 15,539,649 | | | — | | | 15,539,649 | |
| Corporate Bonds | | — | | | 9,952,649 | | | — | | | 9,952,649 | |
| Collateralized Loan Obligations | | — | | | 4,859,030 | | | — | | | 4,859,030 | |
| Collateralized Mortgage Obligations | | — | | | 4,639,828 | | | — | | | 4,639,828 | |
| Money Market Funds | | 3,030,619 | | | — | | | — | | | 3,030,619 | |
| Total Investments in Securities | | $ | 3,030,619 | | | $ | 98,973,949 | | | $ | — | | | $ | 102,004,568 | |
| | | | | | | | |
| Other Financial Instruments: | | | | | | | | |
| Futures** | | $ | 777,789 | | | $ | — | | | $ | — | | | $ | 777,789 | |
| Total Futures | | $ | 777,789 | | | $ | — | | | $ | — | | | $ | 777,789 | |
| | | | | | | | |
| BUXX | | | | |
| Assets | | | | | | | | |
| Asset-Backed Securities | | $ | — | | | $ | 32,327,221 | | | $ | — | | | $ | 32,327,221 | |
| Corporate Bonds | | — | | | 31,504,860 | | | — | | | 31,504,860 | |
| Collateralized Mortgage Obligations | | — | | | 30,576,748 | | | — | | | 30,576,748 | |
| Collateralized Loan Obligations | | — | | | 11,383,186 | | | — | | | 11,383,186 | |
| U.S. Treasury Securities | | — | | | 1,774,755 | | | — | | | 1,774,755 | |
| Mortgage-Backed Securities | | — | | | 647,273 | | | — | | | 647,273 | |
| Money Market Funds | | 7,104,056 | | | — | | | — | | | 7,104,056 | |
| U.S. Treasury Bills | | — | | | 3,987,873 | | | — | | | 3,987,873 | |
| Total Investments in Securities | | $ | 7,104,056 | | | $ | 112,201,916 | | | $ | — | | | $ | 119,305,972 | |
| | | | | | | | |
| Other Financial Instruments: | | | | | | | | |
| Futures** | | $ | 17,465 | | | $ | — | | | $ | — | | | $ | 17,465 | |
| Total Futures | | $ | 17,465 | | | $ | — | | | $ | — | | | $ | 17,465 | |
| | | | | |
| Refer to the Schedules of Investments for additional information. |
| * | Amount is less than $0.50. |
| ** | The fair value of the Fund's investment represents the net unrealized appreciation (depreciation) as of July 31, 2024. |
During the fiscal period ended July 31, 2024, the Funds, other than STXG and STXE, did not invest in any Level 3 investments and recognized no transfers to/from Level 3. Transfers between levels are recognized at the end of the reporting period.
STRIVE ETFs
NOTES TO THE FINANCIAL STATEMENTS (CONTINUED)
July 31, 2024
Below is a reconciliation of securities in Level 3 for the Funds for the fiscal period ended July 31, 2024:
| | | | | | | | | | | | | | | | | | | | | |
| | STXG | | | STXE |
| | Contingent Value Rights | | | Common Stock | | Rights |
| | | | | |
| Value, Beginning of Year | | $ | — | | | | $ | 275,658 | | | $ | — | |
| Purchases | | — | | | | 252,619 | | | — | |
| Proceeds from Sales | | — | | | | (267,243) | | | — | |
| Net Realized Gains (Losses) | | — | | | | 143,087 | | | — | |
| Return of Capital | | — | | | | — | | | — | |
| Change in Unrealized Appreciation (Depreciation) | | — | | | | (156,905) | | | — | |
| Transfers In/(Out) of Level 3 | | 0(a) | | | (247,216) | | | 1,906 | |
| Value, End of Year | | $ 0(a) | | | $ | — | | | $ | 1,906 | |
(a) Amount is less than $0.50.
Significant unobservable valuation inputs monitored by the Valuation Designee under the supervision of the Adviser for restricted securities or material Level 3 investments as of July 31, 2024, for each Fund are as follows:
| | | | | | | | | | | | | | | | | | | | | | | | | | |
| | Fair Value at July 31, 2024 | | Valuation Technique | | Unobservable Input | | Input Values (Ranges) |
| STXG | | | | | | |
| Contingent Value Rights | | $ | 0 | | | Corporate Action | | No market availability | | $0.00 |
| | | | | | | | |
| STXE | | | | |
| Rights | | $ | 1,906 | | | Corporate Action | | Parent price less subscription price | | 370.95 INR - 395.65 INR |
B.Derivative Transactions The values of derivative instruments on the Statements of Assets and Liabilities for STXT & BUXX as of July 31, 2024, were as follows:
| | | | | | | | | | | | | | | | | |
| Fund | Derivatives | Type of Derivative Risk | Statements of Assets and Liabilities Location | Fair Value of Deposit at Broker for Futures | Value of Unrealized Appreciation (Depreciation)* |
| STXT | Futures Contracts | Interest Rate | Deposit at Broker for Futures | $ | 172,602 | | $ | 777,789 | |
| BUXX | Futures Contracts | Interest Rate | Deposit at Broker for Futures | $ | 37,567 | | $ | 17,465 | |
* Represents the value of unrealized appreciation (depreciation) as presented in the Schedule of Open Futures Contracts.
The effect of derivative instruments on the Statements of Operations for the fiscal period ended July 31, 2024, for STXT and BUXX was as follows:
| | | | | | | | | | | | | | |
| Fund | Derivatives | Type of Derivative Risk | Location of Gain (Loss) on Derivatives in Income | Realized Gain (Loss) on Derivatives |
| STXT | Futures Contracts | Interest Rate | Net realized gain (loss) on futures contracts | $ | (1,056,964) | |
STRIVE ETFs
NOTES TO THE FINANCIAL STATEMENTS (CONTINUED)
July 31, 2024
| | | | | | | | | | | | | | |
| BUXX | Futures Contracts | Interest Rate | Net realized gain (loss) on futures contracts | $ | (36,947) | |
| | | | |
| Fund | Derivatives | Type of Derivative Risk | Location of Gain (Loss) on Derivatives in Income | Change in Unrealized Appreciation (Depreciation) on Derivatives |
| STXT | Futures Contracts | Interest Rate | Net change in Unrealized appreciation (depreciation) on futures contracts | $ | 777,789 | |
| BUXX | Futures Contracts | Interest Rate | Net change in Unrealized appreciation (depreciation) on futures contracts | $ | 17,465 | |
The average notional value of the long futures contracts held in STXT during the fiscal period ended July 31, 2024, was $19,947,855 and the average notional value of the long futures contracts held in BUXX during the fiscal period ended July 31, 2024, was $2,954,372.
Balance Sheet Offsetting Information
During the ordinary course of business, the Funds may enter into transactions subject to enforceable netting agreements or other similar arrangements (“netting agreements”). Generally, the right to offset in netting agreements allows the Funds to offset any exposure to a specific counterparty with any collateral received or delivered to that counterparty based on the terms of the agreement. Generally, the Funds manage their cash collateral and securities collateral on a counterparty basis. As of July 31, 2024, the Funds were not subject to any netting agreements.
The following table provides a summary of offsetting financial liabilities and derivatives and the effect of derivative instruments on the Statements of Assets and Liabilities as of July 31, 2024:
| | | | | | | | | | | | | | | | | | | | | | | | | | | | | | | | | | | | | | |
| | STXT | | |
| | Gross Amounts of Recognized Assets | | Gross Amounts offset in Statements of Assets and Liabilities | | Net Amounts of Assets Presented in Statements of Assets and Liabilities* | | Gross Amounts Not Offset in Statements of Assets and Liabilities |
| | | | Financial Instruments | | Cash Collateral Pledged | | Net Amount |
| Futures Contracts | | $ | 777,789 | | | $ | — | | | $ | 777,789 | | | $ | — | | | $ | — | | | $ | 777,789 | |
| | | | | | | | | | | | | | | | | | | | | | | | | | | | | | | | | | | | | | |
| BUXX |
| | Gross Amounts of Recognized Assets | | Gross Amounts offset in Statements of Assets and Liabilities | | Net Amounts of Assets Presented in Statements of Assets and Liabilities* | | Gross Amounts Not Offset in Statements of Assets and Liabilities |
| | | | Financial Instruments | | Cash Collateral Pledged | | Net Amount |
| Futures Contracts | | $17,465 | | $ | — | | | $17,465 | | $ | — | | | $ | — | | | $17,465 |
* Represents the value of unrealized appreciation (depreciation) as presented in the Schedule of Open Futures Contracts, which is included in deposit at broker for futures on the Statements of Assets and Liabilities.
C.Foreign Currency. Investment securities and other assets and liabilities denominated in foreign currencies are translated into U.S. dollar amounts using the spot rate of exchange at the date of valuation. Purchases and sales of investment securities and income and expense items denominated in foreign currencies are translated into U.S.
STRIVE ETFs
NOTES TO THE FINANCIAL STATEMENTS (CONTINUED)
July 31, 2024
dollar amounts on the respective dates of such transactions.The Fund isolates the portion of the results of operations resulting from changes in foreign exchange rates on investments from the fluctuations arising from changes in market prices of securities held. That portion of gains (losses) attributable to the changes in market prices and the portion of gains (losses) attributable to changes in foreign exchange rates are included on the “Statement of Operations” under “Net realized gain (loss) – Foreign currency” and “Change in Net Unrealized Appreciation (Depreciation) – Foreign Currency,” respectively.
The Funds report net realized foreign exchange gains or losses that arise from sales of foreign currencies, currency gains or losses realized between the trade and settlement dates on securities transactions, and the difference between the amounts of dividends, interest, and foreign withholding taxes recorded on the Fund’s books and the U.S. dollar equivalent of the amounts actually received or paid. Net unrealized foreign exchange gains and losses arise from changes in the fair values of assets and liabilities, other than investments in securities at fiscal year end, resulting from changes in exchange rates.
D.Federal Income Taxes. Each Fund intends to continue to comply with the requirements of subchapter M of the Internal Revenue Code of 1986, as amended, as necessary to qualify as a regulated investment company and distribute substantially all net taxable investment income and net realized gains to shareholders in a manner which results in no tax cost to the Funds. Therefore, no federal income tax provision is required. As of and during the fiscal period ended July 31, 2024, the Funds did not have any tax positions that did not meet the “more-likely-than-not” threshold of being sustained by the applicable tax authority. As of and during the fiscal period ended July 31, 2024, the Funds did not have liabilities for any unrecognized tax benefits. The Funds would/will recognize interest and penalties, if any, related to unrecognized tax benefits on uncertain tax positions as income tax expense in the Statement of Operations. During the fiscal period ended July 31, 2024, the Funds did not incur any interest or penalties. Each Fund is subject to examination by U.S. taxing authorities for the tax periods since each Fund’s commencement of operations.
The Funds may be subject to taxes imposed on realized and unrealized gains on securities of certain foreign countries in which each Fund invests. The foreign tax expense, if any, was recorded on an accrual basis and is included in “Net realized gain (loss) on investments” and “Net increase (decrease) in unrealized appreciation or depreciation on investments” on the accompanying Statements of Operations. The amount of foreign tax owed, if any, is included in“Deferred foreign capital gains tax” on the accompanying Statements of Assets and Liabilities and is comprised of and taxes on unrealized gains.
E.Security Transactions and Investment Income. Investment securities transactions are accounted for on the trade date. Gains and losses realized on sales of securities are determined on a specific identification basis. Dividend income is recorded on the ex-dividend date, net of any foreign taxes withheld at source. Interest income is recorded on an accrual basis. Withholding taxes on foreign dividends have been provided for in accordance with each Fund’s understanding of the applicable tax rules and regulations.
Distributions to shareholders from net investment income for each Fund are declared and paid on a quarterly basis except for STXE, STXT, and BUXX. Distributions to shareholders from net investment income for STXE are declared and paid on a semi-annual basis and distributions to shareholders from next investment income for STXT and BUXX are declared and paid on a monthly basis. Distributions to shareholders from net realized gains on securities normally are declared and paid on an annual basis for each Fund. Distributions are recorded on the ex-dividend date. The Funds may distribute more frequently, if necessary, for tax purposes.
F.Use of Estimates. The preparation of financial statements in conformity with GAAP requires management to make estimates and assumptions that affect the reported amounts of assets and liabilities at the date of the financial statements, as well as the reported amounts of increases and decreases in net assets from operations during the period. Actual results could differ from those estimates.
G.Share Valuation. The NAV per share of each Fund is calculated by dividing the sum of the value of the securities held by each Fund, plus cash and other assets, minus all liabilities (including estimated accrued expenses) by the
STRIVE ETFs
NOTES TO THE FINANCIAL STATEMENTS (CONTINUED)
July 31, 2024
total number of shares outstanding for the Fund, rounded to the nearest cent. Each Fund’s shares will not be priced on the days on which the New York Stock Exchange (“NYSE”) is closed for regular trading. The offering and redemption price per share for each Fund is equal to each Fund’s net asset value per share.
H.Guarantees and Indemnifications. In the normal course of business, the Fund enters into contracts with service providers that contain general indemnification clauses. Additionally, as is customary, the Trust’s organizational documents permit the Trust to indemnify its officers and trustees against certain liabilities under certain circumstances. The Fund’s maximum exposure under these arrangements is unknown as this would involve future claims that may be against the Fund that have not yet occurred. As of the date of this Report, no claim has been made for indemnification pursuant to any such agreement of the Funds.
I.Reclassification of Capital Accounts. GAAP requires that certain components of net assets relating to permanent differences be reclassified between financial and tax reporting. These reclassifications have no effect on net assets or net asset value per share. Each Fund’s realized net capital gains resulting from in-kind redemptions, in which shareholders exchanged a Fund shares for securities held by a Fund rather than for cash, are not taxable to a Fund and are not distributed to shareholders. As such, they have been reclassified from distributable earnings to paid-in capital. For the fiscal period ended July 31, 2024, the following table shows the reclassifications made:
| | | | | | | | | | | | | | |
| | Distributable
Earnings | | Paid-in
Capital |
| STRV | | $ | (5,280,251) | | | $ | 5,280,251 | |
STXM(1) | | — | | | — | |
| STXK | | (2,599,199) | | | 2,599,199 | |
| STXG | | (194,188) | | | 194,188 | |
| STXV | | (824,514) | | | 824,514 | |
| STXD | | (552,441) | | | 552,441 | |
| DRLL | | (22,019,103) | | | 22,019,103 | |
| SHOC | | (15,113,381) | | | 15,113,381 | |
FTWO(2) | | (458,408) | | | 458,408 | |
| STXE | | (440,047) | | | 440,047 | |
STXI(3) | | — | | | — | |
STXT(4) | | — | | | — | |
BUXX(4) | | — | | | — | |
(1) The Fund commenced operations on April 10, 2024.
(2) The Fund commenced operations on August 30, 2023.
(3) The Fund commenced operations on June 25, 2024.
(4) The Fund commenced operations on August 9, 2023.
STRIVE ETFs
NOTES TO THE FINANCIAL STATEMENTS (CONTINUED)
July 31, 2024
NOTE 3 – RISKS
An investment in the Funds involves risk, including those described below (in alphabetical order). There is no assurance that the Funds will achieve its investment objective. An investor may lose money by investing in the Funds. An investment in the Funds is not a bank deposit and is not insured or guaranteed by the FDIC or any government agency. See the Funds’ Prospectus and Statement of Additional Information regarding the risks of investing in shares of the Funds. Following the table, each risk is explained.
| | | | | | | | | | | | | | | | | | | | | | | | | | | | | | | | | | | | | | | | | | | | |
| | STRV | | STXM | | STXK | | STXG | | STXV | | STXD | | SHOC |
| | | | | | | | | | | | | | |
| | | | | | | | | | | | | | |
| | | | | | | | | | | | | | |
| | | | | | | | | | | | | | |
| | | | | | | | | | | | | | |
| | | | | | | | | | | | | | |
| Concentration Risk | | ✓ | | ✓ | | ✓ | | ✓ | | ✓ | | ✓ | | ✓ |
| Consumer Discretionary Sector Risk | | | | | | ✓ | | ✓ | | ✓ | | | | |
| | | | | | | | | | | | | | |
| | | | | | | | | | | | | | |
| | | | | | | | | | | | | | |
| | | | | | | | | | | | | | |
| | | | | | | | | | | | | | |
| | | | | | | | | | | | | | |
| | | | | | | | | | | | | | |
| Dividend-Paying Common Equity Security Risk | | | | | | | | | | | | ✓ | | |
| | | | | | | | | | | | | | |
| | | | | | | | | | | | | | |
| Energy Sector Risk | | | | | | | | | | ✓ | | | | ✓ |
| Equity Investing Risk | | ✓ | | ✓ | | ✓ | | ✓ | | ✓ | | ✓ | | ✓ |
| ETF Risks | | ✓ | | ✓ | | ✓ | | ✓ | | ✓ | | ✓ | | ✓ |
| | | | | | | | | | | | | | |
| Financials Sector Risk | | | | | | ✓ | | | | ✓ | | ✓ | | |
| | | | | | | | | | | | | | |
| | | | | | | | | | | | | | |
| | | | | | | | | | | | | | |
| Geopolitical/Natural Disaster Risks | | ✓ | | ✓ | | ✓ | | ✓ | | ✓ | | ✓ | | ✓ |
| Gold and Precious Metals Risk | | | | | | | | | | | | | | |
| Growth Investing Risk | | | | | | | | ✓ | | | | ✓ | | |
| Healthcare Sector Risk | | | | | | ✓ | | ✓ | | ✓ | | ✓ | | |
| | | | | | | | | | | | | | |
| | | | | | | | | | | | | | |
| | | | | | | | | | | | | | |
| | | | | | | | | | | | | | |
| Index Calculation Risk | | ✓ | | ✓ | | ✓ | | ✓ | | ✓ | | ✓ | | ✓ |
| Index Rebalance Risk | | ✓ | | ✓ | | ✓ | | ✓ | | ✓ | | ✓ | | ✓ |
| Industrials Sector Risk | | | | | | ✓ | | | | ✓ | | ✓ | | |
| Investment Risk | | ✓ | | ✓ | | ✓ | | ✓ | | ✓ | | ✓ | | ✓ |
| | | | | | | | | | | | | | |
| Large Capitalization Companies Risk | | ✓ | | | | | | ✓ | | ✓ | | ✓ | | ✓ |
| | | | | | | | | | | | | | |
| | | | | | | | | | | | | | |
| Limited Operating History Risk | | | | | | ✓ | | ✓ | | ✓ | | | | |
| Limited Operating History Risk. | | ✓ | | | | | | | | | | ✓ | | ✓ |
| | | | | | | | | | | | | | |
| | | | | | | | | | | | | | |
| Mid-Capitalization Companies Risk | | | | | | ✓ | | ✓ | | ✓ | | ✓ | | ✓ |
| | | | | | | | | | | | | | |
| | | | | | | | | | | | | | |
| | | | | | | | | | | | | | |
| New Fund Risk | | | | ✓ | | | | | | | | | | |
| | | | | | | | | | | | | | |
| Non-Diversification Risk | | | | | | | | | | | | | | ✓ |
| | | | | | | | | | | | | | |
| | | | | | | | | | | | | | |
| Oil and Gas Sector Risk | | | | | | | | | | | | | | ✓ |
| Passive Investment Risk | | ✓ | | ✓ | | ✓ | | ✓ | | ✓ | | ✓ | | ✓ |
| | | | | | | | | | | | | | |
| Real Estate Investment Trusts (REITs) Risk. | | | | | | ✓ | | ✓ | | ✓ | | | | |
| | | | | | | | | | | | | | |
| | | | | | | | | | | | | | |
| | | | | | | | | | | | | | |
| | | | | | | | | | | | | | |
| | | | | | | | | | | | | | |
| | | | | | | | | | | | | | |
| | | | | | | | | | | | | | |
| Small-Capitalization Companies Risk | | | | | | ✓ | | | | | | | | |
| | | | | | | | | | | | | | |
| Technology Sector Risk | | ✓ | | | | ✓ | | ✓ | | | | ✓ | | |
| | | | | | | | | | | | | | |
| Tracking Error Risk | | ✓ | | ✓ | | ✓ | | ✓ | | ✓ | | ✓ | | ✓ |
| | | | | | | | | | | | | | |
| | | | | | | | | | | | | | |
| | | | | | | | | | | | | | |
| Value Investing Risk | | | | | | | | | | ✓ | | | | |
| | | | | | | | | | | | | | |
STRIVE ETFs
NOTES TO THE FINANCIAL STATEMENTS (CONTINUED)
July 31, 2024
| | | | | | | | | | | | | | | | | | | | | | | | | | | | | | | | | | | | | | |
| | SHOC | | FTWO | | STXE | | STXI | | STXT | | BUXX |
| Aerospace and Defense Sector Risk | | | | ✓ | | | | | | | | |
| Agriculture Sector Risk | | | | ✓ | | | | | | | | |
| Borrowing and Leverage Risk | | | | | | | | | | ✓ | | ✓ |
| Canadian Investment Risk | | | | ✓ | | | | | | | | |
| Cash Creation Unit Risk | | | | | | | | | | ✓ | | ✓ |
| Concentration in Mortgage Loans, RMBS and CMBS Risk | | | | | | | | | | ✓ | | ✓ |
| Concentration Risk | | ✓ | | ✓ | | ✓ | | | | | | |
| Consumer Discretionary Sector Risk | | | | | | | | ✓ | | | | |
| Consumer Staples Sector Risk | | | | | | | | ✓ | | | | |
| Currency Risk | | | | | | | | | | ✓ | | ✓ |
| Debt Securities Risks | | | | | | | | | | ✓ | | ✓ |
| Defaulted Securities Risk | | | | | | | | | | ✓ | | ✓ |
| Depositary Receipt Risk. | | | | | | ✓ | | ✓ | | | | |
| Derivatives Risk | | | | | | | | | | ✓ | | ✓ |
| Developed Markets Risk. | | | | | | | | ✓ | | | | |
| | | | | | | | | | | | |
| Dollar Roll Transaction Risk | | | | | | | | | | ✓ | | ✓ |
| Emerging Markets Risk | | | | | | ✓ | | | | | | |
| | | | | | | | | | | | |
| Equity Investing Risk | | ✓ | | ✓ | | ✓ | | ✓ | | | | |
| ETF Risks | | ✓ | | | | | | | | | | |
| Financial Services Sector Risk | | | | | | | | | | ✓ | | |
| Financials Sector Risk | | | | | | ✓ | | ✓ | | | | |
| Foreign Fixed-Income Investment Risk | | | | | | | | | | ✓ | | ✓ |
| Foreign Investment Risk | | | | ✓ | | ✓ | | ✓ | | | | |
| | | | | | | | | | | | |
| Geopolitical/Natural Disaster Risks | | ✓ | | ✓ | | ✓ | | ✓ | | ✓ | | ✓ |
| Gold and Precious Metals Risk | | | | ✓ | | | | | | | | |
| | | | | | | | | | | | |
| Healthcare Sector Risk | | | | | | | | ✓ | | | | |
| Hedging Risk | | | | | | | | | | ✓ | | ✓ |
| High Portfolio Turnover Risk | | | | | | | | | | | | ✓ |
| High-Yield Debt Securities (Junk Bonds) Risk | | | | | | | | | | ✓ | | ✓ |
| Illiquid Investments Risk | | | | | | | | | | ✓ | | ✓ |
| Index Calculation Risk | | ✓ | | ✓ | | ✓ | | ✓ | | | | |
| Index Rebalance Risk | | ✓ | | ✓ | | ✓ | | ✓ | | | | |
| Industrials Sector Risk | | | | | | | | ✓ | | | | |
| Investment Risk | | ✓ | | ✓ | | ✓ | | ✓ | | ✓ | | ✓ |
| | | | | | | | | | | | |
| Large Capitalization Companies Risk | | ✓ | | ✓ | | ✓ | | ✓ | | | | |
| Large Shareholder and Large-Scale Redemption Risk | | | | | | | | | | ✓ | | ✓ |
| LIBOR Transition Risk | | | | | | | | | | ✓ | | ✓ |
| | | | | | | | | | | | |
| Limited Operating History Risk. | | ✓ | | | | ✓ | | | | | | |
| Liquidity Risk | | | | | | | | | | ✓ | | ✓ |
STRIVE ETFs
NOTES TO THE FINANCIAL STATEMENTS (CONTINUED)
July 31, 2024
| | | | | | | | | | | | | | | | | | | | | | | | | | | | | | | | | | | | | | |
| | SHOC | | FTWO | | STXE | | STXI | | STXT | | BUXX |
| Management Risk. | | | | | | | | | | ✓ | | ✓ |
| Mid-Capitalization Companies Risk | | ✓ | | ✓ | | ✓ | | ✓ | | | | |
| Mortgage-Backed and Asset Backed Securities Risk | | | | | | | | | | ✓ | | ✓ |
| Municipal Securities Risk | | | | | | | | | | ✓ | | |
| Natural Resources and Commodity-Related Industries Risk | | | ✓ | | | | | | | | |
| | | | | | | | | | | | |
| New Fund Risk | | | | ✓ | | | | ✓ | | ✓ | | ✓ |
| Non-Diversification Risk | | ✓ | | ✓ | | | | | | ✓ | | ✓ |
| | | | | | | | | | | | |
| Nuclear Energy Sector Risk | | | | ✓ | | | | | | | | |
| Oil and Gas Sector Risk | | | | ✓ | | | | | | | | |
| Passive Investment Risk | | ✓ | | ✓ | | ✓ | | ✓ | | | | |
| Rating Agencies Risk | | | | | | | | | | ✓ | | ✓ |
| Real Estate Investment Trusts (REITs) Risk. | | | | | | ✓ | | ✓ | | | | |
| Real Estate Sector Risk | | | | | | | | | | ✓ | | ✓ |
| Repurchase Agreement Risk | | | | | | | | | | ✓ | | ✓ |
| | | | | | | | | | | | |
| Reverse Repurchase Agreement Risk | | | | | | | | | | ✓ | | ✓ |
| | | | | | | | | | | | |
| Sampling Risk | | | | | | ✓ | | ✓ | | | | |
| Semiconductor Sector Risk | | ✓ | | | | | | | | | | |
| | | | | | | | | | | | |
| Structured Products Risk | | | | | | | | | | ✓ | | ✓ |
| Technology Sector Risk | | ✓ | | | | | | | | | | |
| To-Be-Announced (“TBA”) Transactions Risk | | | | | | | | | | ✓ | | ✓ |
| Tracking Error Risk | | ✓ | | ✓ | | ✓ | | ✓ | | | | |
| U.S. Government Securities Risk | | | | | | | | | | ✓ | | ✓ |
| Underlying Fund Risk | | | | | | | | | | ✓ | | ✓ |
| | | | | | | | | | | | |
| | | | | | | | | | | | |
| Variable and Floating Rate Securities Risk | | | | | | | | | | ✓ | | ✓ |
See the Funds’ Prospectus and Statement of Additional Information regarding the risks of investing in shares of the Funds.
Aerospace and Defense Sector Risk. Aerospace and defense companies can be significantly affected by government aerospace and defense regulation and spending policies because companies involved in this industry rely to a significant extent on U.S. (and other) government demand for their products and services. Thus, the financial condition of, and investor interest in, aerospace and defense companies are heavily influenced by governmental defense spending policies which are typically under pressure from efforts to control the U.S. (and other) government budgets. The aerospace industry in particular has recently been affected by adverse economic conditions and consolidation within the industry.
Agriculture Sector Risk. Economic forces, including forces affecting agricultural markets, as well as government policies and regulations affecting agriculture companies, could adversely impact a Fund’s investments. Agricultural and livestock production and trade flows are significantly affected by government policies and regulations. Governmental policies affecting agriculture companies, such as taxes, tariffs, duties, subsidies and import and export restrictions on agricultural commodities, commodity products and livestock, can influence agriculture company profitability, the planting/raising of certain crops/livestock versus other uses of resources, the location and size of crop and livestock production, whether unprocessed or processed commodity products are traded and the volume and types of imports and exports. In addition, companies in the
STRIVE ETFs
NOTES TO THE FINANCIAL STATEMENTS (CONTINUED)
July 31, 2024
agriculture sector must comply with a broad range of environmental laws and regulations. Additional or more stringent environmental laws and regulations may be enacted in the future and such changes could have a material adverse effect on the business of such companies. In addition, agriculture companies may be significantly affected by adverse weather, pollution and/or disease which could limit or halt production.
Borrowing and Leverage Risk. Borrowing for investment purposes or utilizing derivatives creates leverage, which will exaggerate the effect of any change in the value of securities in the Fund’s portfolio on the Fund’s net asset value and, therefore, may increase the volatility of the Fund. Money borrowed will be subject to interest and other costs (including commitment fees and/or the cost of maintaining minimum average balances). Unless the income and capital appreciation, if any, on securities acquired with borrowed funds exceed the cost of borrowing, the use of leverage will diminish the investment performance of the Fund.
Canadian Investment Risk. Investments in securities of Canadian issuers involve risks and special considerations not typically associated with investments in the U.S. securities markets. The Canadian economy is very dependent on the demand for, and supply and price of, natural resources. The Canadian market is relatively concentrated in issuers involved in the production and distribution of natural resources. There is a risk that any changes in natural resources sectors could have an adverse impact on the Canadian economy. Additionally, the Canadian economy is heavily dependent on relationships with certain key trading partners including the United States, countries in the European Union and China. Because the United States is Canada’s largest trading partner and foreign investor, the Canadian economy is dependent on and may be significantly affected by developments impacting the U.S. economy. Reduction in spending on Canadian products and services or changes in the U.S. economy may adversely impact the Canadian economy. Uncertainty as to the future of certain trade agreements between the U.S. and Canada may cause a decline in the value of the Fund’s Shares. In addition, certain sectors of Canada’s economy may be subject to foreign ownership limitations. This may negatively impact the Fund’s ability to invest in Canadian issuers and to track the Index.
Cash Creation Unit Risk. Unlike most other ETFs, the Fund expects to effect a substantial portion of its creations and redemptions for cash, rather than in-kind securities (although redemptions will also be done in-kind under certain circumstances). The use of cash creations and redemptions may also cause the Fund’s shares to trade in the market at greater bid-ask spreads or greater premiums or discounts to the Fund’s NAV. As a practical matter, only institutions and large investors, such as market makers or other large broker dealers, also known as “authorized participants,” create or redeem shares directly through the Fund. Most investors will buy and sell shares of the Fund on an exchange through a broker-dealer. Cash creation and redemption transactions may result in certain brokerage, tax, execution, price movement and other costs and expenses related to the execution of trades resulting from such transactions. To offset these expenses, the Fund will collect fees from the applicable authorized participant to reimburse the Fund for any costs incurred by the Fund that result from a cash creation or redemption. The use of cash for redemptions will limit the tax efficiency of the Fund.
Communications Sector Risk. Communication companies are particularly vulnerable to the potential obsolescence of products and services due to technological advancement and the innovation of competitors. Companies in the communication sector may also be affected by other competitive pressures, such as pricing competition, as well as research and development costs, substantial capital requirements and government regulation. Additionally, fluctuating domestic and international demand, shifting demographics and often unpredictable changes in consumer tastes can drastically affect a communication company’s profitability. While all companies may be susceptible to network security breaches, certain companies in the communication sector may be particular targets of hacking and potential theft of proprietary or consumer information or disruptions in service, which could have a material adverse effect on their businesses.
Concentration in Mortgage Loans, RMBS and CMBS Risk. The Fund’s assets will be concentrated in mortgage loans, RMBS (agency and non-agency) and CMBS, potentially exposing the Fund to greater risks than companies that invest in multiple sectors. The risks of concentrating in mortgage loans, RMBS (agency and non-agency) and CMBS include susceptibility to changes in interest rates and the risks associated with the market’s perception of issuers, the creditworthiness of the parties involved and investing in real estate securities.
Concentration Risk. In following its methodology, the Index from time to time may be concentrated to a significant degree in securities of issuers located in a single industry or group of industries. To the extent that the Index concentrates in the
STRIVE ETFs
NOTES TO THE FINANCIAL STATEMENTS (CONTINUED)
July 31, 2024
securities of issuers in a particular industry or group of industries, the Fund also may concentrate its investments to approximately the same extent. By concentrating its investments in an industry or group of industries, the Fund may face more risks than if it were diversified broadly over numerous industries or groups of industries. If the Index is not concentrated in a particular industry or group of industries, the Fund will not concentrate in a particular industry or group of industries.
Consumer Discretionary Sector Risk. The Fund is expected to have exposure to companies in the consumer discretionary sector, and therefore, the Fund’s performance could be negatively impacted by events affecting this sector. The consumer discretionary sector includes, for example, automobile, textile and retail companies. This sector can be significantly affected by, among other things, changes in domestic and international economies, exchange and interest rates, economic growth, worldwide demand, supply chain constraints and social trends. Success of companies in the consumer discretionary sector also depends heavily on disposable household income and consumer spending, which can be negatively impacted by inflationary pressures on consumers.
Consumer Staples Sector Risk. The Fund is expected to have exposure to companies in the consumer staples sector. The consumer staples sector may be affected by changes in general economic conditions, worldwide economic conditions, political events, world events, government regulation, environmental factors, depletion of resources, consumer confidence, consumer spending, marketing, competition, demographics and consumer preferences, product trends, and production spending. Companies in the consumer staples sector may also be subject to risks relating to the supply of, demand for, and prices of raw materials. Companies in this industry are also affected by natural and man-made disasters and political, social, or labor unrest that affect production and distribution of consumer staple products.
Currency Risk: The risk that non-U.S. currencies will change in value relative to the U.S. dollar and affect the Fund’s investments in non-U.S. currencies or in securities that trade in, and receive revenues in, or in derivatives that provide exposure to, non-U.S. currencies.
Debt Securities Risks.
Credit Risk. The financial condition of an issuer of a debt security or other instrument may cause such issuer to default, become unable to pay interest or principal due or otherwise fail to honor its obligations or cause such issuer to be perceived (whether by market participants, rating agencies, pricing services or otherwise) as being in such situations. The value of an investment in the Fund may change quickly and without warning in response to issuer defaults, changes in the credit ratings of the Fund’s portfolio investments and/or perceptions related thereto.
Interest Rate Risk. Interest rate risk is the risk that fixed income securities will decline in value because of an increase in interest rates and changes to other factors, such as perception of an issuer’s creditworthiness. Funds with higher durations generally are subject to greater interest rate risk, usually making them more volatile than debt securities, such as bonds, with shorter durations. For example, the price of a security with a seven-year duration would be expected to drop by approximately 7% in response to a 1% increase in interest rates.
Prepayment Risk. The risk that the issuer of a debt security repays all or a portion of the principal prior to the security’s maturity. In times of declining interest rates, there is a greater likelihood that the Fund’s higher yielding securities will be pre-paid with the Fund being unable to reinvest the proceeds in an investment with as favorable a yield. Prepayments can therefore result in lower yields to shareholders of the Fund.
Extension Risk. An issuer could exercise its right to pay principal on an obligation held by the Fund (such as a mortgage-backed security) later than expected. This may happen when there is a rise in interest rates. Under these circumstances, the value of the obligation will decrease, and the Fund will also suffer from the inability to reinvest in higher yielding securities.
Issuer-Specific Changes. Changes in the financial condition of an issuer or counterparty, changes in specific economic or political conditions that affect a particular type of security or issuer, and changes in general economic or political conditions can increase the risk of default by an issuer or counterparty, which can affect a security’s or instrument’s credit quality or value. Entities providing credit support or a maturity-shortening structure also can be
STRIVE ETFs
NOTES TO THE FINANCIAL STATEMENTS (CONTINUED)
July 31, 2024
affected by these types of changes, and if the structure of a security fails to function as intended, the security could decline in value.
Defaulted Securities Risk. Investments in defaulted securities and obligations of distressed issuers, including securities that are, or may be, involved in reorganizations or other financial restructurings, either out of court or in bankruptcy, involve substantial risks in addition to the risks of investing in high-yield debt securities. The Fund’s share price may decline if the reorganization or restructuring is not completed as anticipated. The Fund will generally not receive interest payments on the distressed securities and may incur costs to protect its investment. Repayment of defaulted securities and obligations of distressed issuers is subject to significant uncertainties. The Fund could lose its entire investment in such securities.
Depositary Receipt Risk. The Fund’s investments in foreign companies may be in the form of depositary receipts, including ADRs, EDRs, and GDRs. ADRs, EDRs, and GDRs are generally subject to the risks of investing directly in foreign securities and, in some cases, there may be less information available about the underlying issuers than would be the case with a direct investment in the foreign issuer. ADRs are U.S. dollar-denominated receipts representing shares of foreign-based corporations. GDRs are similar to ADRs but are shares of foreign-based corporations generally issued by international banks in one or more markets around the world. Investment in ADRs and GDRs may be more or less liquid than the underlying shares in their primary trading market and GDRs may be more volatile. Depositary receipts may be “sponsored” or “unsponsored” and may be unregistered and unlisted. Sponsored depositary receipts are established jointly by a depositary and the underlying issuer, whereas unsponsored depositary receipts may be established by a depositary without participation by the underlying issuer. Holders of an unsponsored depositary receipt generally bear all the costs associated with establishing the unsponsored depositary receipt. In addition, the issuers of the securities underlying unsponsored depositary receipts are not obligated to disclose material information in the United States and, therefore, there may be less information available regarding those issuers and there may not be a correlation between that information and the market value of the depositary receipts. In general, ADRs must be sponsored, but the Fund may invest in unsponsored ADRs under various limited circumstances. It is expected that not more than 10% of the net assets of the Fund will be invested in unsponsored ADRs. The Fund’s investments may also include ADRs and GDRs that are not purchased in the public markets and are restricted securities that can be offered and sold only to “qualified institutional buyers” under Rule 144A of the Securities Act of 1933, as amended (the “Securities Act”). The Adviser will determine the liquidity of these investments pursuant to guidelines established by the Board. If a particular investment in ADRs or GDRs is deemed illiquid, that investment will be included within the Fund’s limitation on investment in illiquid securities. Moreover, if adverse market conditions were to develop during the period between the Fund’s decision to sell these types of ADRs or GDRs and the point at which the Fund is permitted or able to sell the security, the Fund might obtain a price less favorable than the price that prevailed when it decided to sell.
Derivatives Risk. The risk of investing in derivative instruments (such as futures, swaps and structured securities), including leverage, liquidity, interest rate, market, credit and management risks, and valuation complexity. Changes in the value of a derivative may not correlate perfectly with, and may be more sensitive to market events than, the underlying asset, rate or index, and the Fund could lose more than the initial amount invested. The Fund’s use of derivatives may result in losses to the Fund, a reduction in the Fund’s returns and/or increased volatility. Over the counter (“OTC”) derivatives are also subject to the risk that a counterparty to the transaction will not fulfill its contractual obligations to the other party, as many of the protections afforded to centrally-cleared derivative transactions might not be available for OTC derivatives. The primary credit risk on derivatives that are exchange-traded or traded through a central clearing counterparty resides with the Fund’s clearing broker or the clearinghouse. Changes in regulation relating to a mutual fund’s use of derivatives and related instruments could potentially limit or impact the Fund’s ability to invest in derivatives, limit the Fund’s ability to employ certain strategies that use derivatives and/or adversely affect the value of derivatives and the Fund’s performance.
Developed Markets Risk. Developed market countries generally tend to rely on the services sectors (e.g., the financial sector) as the primary source of economic growth and may be susceptible to the risks of individual service sectors. Many developed market countries have heavy indebtedness, which may lead downward pressure on the economies of these countries. As a result, it is possible that interest rates on debt of certain developed countries may rise to levels that make it difficult for such countries to service high debt levels without significant help from other countries or from a central bank. Developed market countries generally are dependent on the economies of certain key trading partners. Changes in any one economy may cause an adverse impact on several developed countries.
STRIVE ETFs
NOTES TO THE FINANCIAL STATEMENTS (CONTINUED)
July 31, 2024
Dividend-Paying Common Equity Security Risk. The Fund will normally receive income from dividends that are paid by issuers of the Fund’s investments. The amount of the dividend payments may vary and depends on performance and decisions of the issuer. Poor performance by the issuer or other factors may cause the issuer to lower or eliminate dividend payments to investors, including the Fund. Additionally, these types of securities may fall out of favor with investors and underperform the broader market. Depending upon market conditions, dividend-paying securities that meet the Fund’s investment criteria may not be widely available or may be highly concentrated in only a few market sectors.
Dollar Roll Transaction Risk. The Fund may enter into dollar roll transactions, in which the Fund sells a mortgage-backed or other security for settlement on one date and buys back a substantially similar security for settlement at a later date. Dollar rolls involve a risk of loss if the market value of the securities that the Fund is committed to buy declines below the price of the securities the Fund has sold.
Emerging Markets Risk. Investments in securities and instruments traded in developing or emerging markets, or that provide exposure to those securities or markets, can involve additional risks relating to political, economic, or regulatory conditions not associated with investments in U.S. securities and instruments. For example, developing and emerging markets may be subject to (i) greater market volatility, (ii) lower trading volume and liquidity, (iii) greater social, political and economic uncertainty, (iv) governmental controls on foreign investments and limitations on repatriation of invested capital, (v) lower disclosure, corporate governance, auditing and financial reporting standards, (vi) fewer protections of property rights, (vii) restrictions on the transfer of securities or currency, and (viii) settlement and trading practices that differ from those in U.S. markets. Each of these factors may impact the ability of the Fund to buy, sell or otherwise transfer securities, adversely affect the trading market and price for Shares and cause the Fund to decline in value.
Specifically with respect to index funds, the conditions in emerging markets may lead to potential errors in index data, index computation, and/or index construction if information on non-U.S. companies is unreliable or outdated, or if less information about the non-U.S. companies is publicly available due to differences in regulatory, accounting, auditing and financial recordkeeping standards. This, in turn, may limit the fund adviser’s ability to oversee the index provider’s due diligence process over index data prior to its use in index computation, construction, and/or rebalancing. All of these factors may adversely impact fund performance. In addition, the rights and remedies associated with investments in a fund that tracks an index comprised of foreign securities may be different than a fund that tracks an index of domestic securities.
Energy Sector Risk. The Fund is expected to have exposure to companies in the industrials sector, and therefore, the Fund’s performance could be negatively impacted by events affecting this sector. The market value of securities in the energy sector may decline for many reasons including, fluctuations in energy prices and supply and demand of energy fuels caused by geopolitical events, the success of exploration projects, weather or meteorological events, taxes, increased governmental or environmental regulation, resource depletion, rising interest rates, declines in domestic or foreign production, accidents or catastrophic events that result in injury, loss of life or property, pollution or other environmental damage claims, terrorist threats or attacks, among other factors. Markets for various energy-related commodities can have significant volatility and are subject to control or manipulation by large producers or purchasers. Companies in the energy sector may need to make substantial expenditures, and may incur significant amounts of debt, to maintain or expand their reserves through exploration of new sources of supply, through the development of existing sources, through acquisitions, or through long-term contracts to acquire reserves. Factors adversely affecting producers, refiners, distributors, or others in the energy sector may adversely affect companies that service or supply those entities, either because demand for those services or products is curtailed, or those services or products come under price pressure. Issuers in the energy sector may also be impacted by changing investor and consumer preferences.
Equity Investing Risk. An investment in the Fund involves risks similar to those of investing in any fund holding equity securities, such as market fluctuations, changes in interest rates and perceived trends in stock prices. The values of equity securities could decline generally or could underperform other investments. Different types of equity securities tend to go through cycles of outperformance and underperformance in comparison to the general securities markets. In addition, securities may decline in value due to factors affecting a specific issuer, market or securities markets generally. Recent turbulence in financial markets and reduced liquidity in credit and fixed income markets may negatively affect many issuers worldwide, which may have an adverse effect on the Fund.
STRIVE ETFs
NOTES TO THE FINANCIAL STATEMENTS (CONTINUED)
July 31, 2024
Financial Services Sector Risk. Performance of companies in the financials sector may be adversely impacted by many factors, including, among others, changes in government regulations, economic conditions, and interest rates, credit rating downgrades, and decreased liquidity in credit markets. The impact of changes in capital requirements and recent or future regulation of any individual financial company, or of the financials sector as a whole, cannot be predicted. In recent years, cyberattacks and technology malfunctions and failures have become increasingly frequent in this sector and have caused significant losses to companies in this sector, which may negatively impact the Fund.
Financials Sector Risk. The Fund is expected to have exposure to companies in the financials sector, and therefore, the Fund’s performance could be negatively impacted by events affecting this sector. The financials sector includes, for example, banks and financial institutions providing mortgage and mortgage related services. This sector can be significantly affected by, among other things, changes in interest rates, government regulation, the rate of defaults on corporate, consumer and government debt, the availability and cost of capital, and fallout from the housing and sub-prime mortgage crisis.
Foreign Fixed-Income Investment Risk. Investments in fixed-income securities of non-U.S. issuers are subject to the same risks as other debt securities, notably credit risk, market risk, interest rate risk and liquidity risk, while also facing risks beyond those associated with investments in U.S. securities. For example, foreign securities may have relatively low market liquidity, greater market volatility, decreased publicly available information, and less reliable financial information about issuers, and inconsistent and potentially less stringent accounting, auditing and financial reporting requirements and standards of practice, including recordkeeping standards, comparable to those applicable to domestic issuers. Foreign securities also are subject to the risks of expropriation, nationalization, political instability or other adverse political or economic developments and the difficulty of enforcing obligations in other countries. Investments in foreign securities also may be subject to dividend withholding or confiscatory taxes, currency blockage and/or transfer restrictions and higher transactional costs.
Foreign Investment Risk. The Fund may invest in foreign securities, including non-U.S. dollar-denominated securities traded outside of the United States and U.S. dollar-denominated securities of foreign issuers traded in the United States. Returns on investments in foreign securities could be more volatile than, or trail the returns on, investments in U.S. securities. Investments in foreign securities, including investments in American Depositary Receipts (ADRs), European Depositary Receipts (EDRs) and Global Depositary Receipts (GDRs), are subject to special risks, including the following:
• Foreign Securities Risk. Investments in non-U.S. securities involve risks that may not be present with investments in U.S. securities. For example, investments in non-U.S. securities may be subject to risk of loss due to foreign currency fluctuations or to political or economic instability. There may be less information publicly available about a non-U.S. issuer than a U.S. issuer. Non-U.S. issuers may be subject to different accounting, auditing, financial reporting and investor protection standards than U.S. issuers. Changes to the financial condition or credit rating of foreign issuers may also adversely affect the value of the Fund’s securities. Investments in non-U.S. securities may be subject to withholding or other taxes and may be subject to additional trading, settlement, custodial, and operational risks. Because legal systems differ, there is also the possibility that it will be difficult to obtain or enforce legal judgments in some countries. Since foreign exchanges may be open on days when the Fund does not price its Shares, the value of the securities in the Fund’s portfolio may change on days when shareholders will not be able to purchase or sell the Fund’s Shares. Conversely, Shares may trade on days when foreign exchanges are closed. Investment in foreign securities may involve higher costs than investment in U.S. securities, including higher transaction and custody costs as well as the imposition of additional taxes by foreign governments. Each of these factors can make investments in the Fund more volatile and potentially less liquid than other types of investments.
• Capital Controls Risk. Economic conditions, such as volatile currency exchange rates and interest rates, political events and other conditions may, without prior warning, lead to government intervention and the imposition of “capital controls” or expropriation or nationalization of assets. The possible establishment of exchange controls or freezes on the convertibility of currency, or the adoption of other governmental restrictions, might adversely affect an investment in foreign securities. Capital controls include the prohibition of, or restrictions on, the ability to transfer currency, securities or other assets within or out of a jurisdiction. Levies may be placed on profits repatriated by foreign entities (such as the Fund). Capital controls may impact the ability of the Fund to buy, sell or
STRIVE ETFs
NOTES TO THE FINANCIAL STATEMENTS (CONTINUED)
July 31, 2024
otherwise transfer securities or currency, may adversely affect the trading market and price for Shares of the Fund, and may cause the Fund to decline in value.
• Currency Risk. The Fund’s NAV is determined on the basis of U.S. dollars; therefore, the Fund may lose value if the local currency of a foreign market depreciates against the U.S. dollar, even if the local currency value of the Fund’s holdings goes up. Currency exchange rates may fluctuate significantly over short periods of time. Currency exchange rates also can be affected unpredictably by intervention; by failure to intervene by U.S. or foreign governments or central banks; or by currency controls or political developments in the U.S. or abroad. Changes in foreign currency exchange rates may affect the NAV of the Fund and the price of the Fund’s Shares. Devaluation of a currency by a country’s government or banking authority would have a significant impact on the value of any investments denominated in that currency.
• Political and Economic Risk. The Fund is subject to foreign political and economic risk not associated with U.S. investments, meaning that political events (civil unrest, national elections, changes in political conditions and foreign relations, imposition of exchange controls and repatriation restrictions), social and economic events (labor strikes, rising inflation) and natural disasters occurring in a foreign country could cause the Fund’s investments to experience gains or losses. The Fund also could be unable to enforce its ownership rights or pursue legal remedies in countries where it invests.
• Foreign Market and Trading Risk. The trading markets for many foreign securities are not as active as U.S. markets and may have less governmental regulation and oversight. Foreign markets also may have clearance and settlement procedures that make it difficult for the Fund to buy and sell securities. The procedures and rules governing foreign transactions and custody (holding of the Fund’s assets) also may involve delays in payment, delivery or recovery of money or investments. These factors could result in a loss to the Fund by causing the Fund to be unable to dispose of an investment or to miss an attractive investment opportunity, or by causing Fund assets to be uninvested for some period of time.
Geographic Investment Risk. To the extent the Fund invests a significant portion of its assets in the securities of companies of a single country or region, it is more likely to be impacted by events or conditions affecting that country or region.
• Risks Related to Investing in Japan. To the extent the Fund invests Japanese securities, it will be subject to the risks related to investing in Japan. Political, social or economic disruptions in Japan or the region, even in countries in which the Fund is not invested, may adversely affect the value of investments held by the Fund.
The Japanese economy may be subject to considerable degrees of economic, political and social instability, which could have a negative impact on Japanese securities. Since the year 2000, Japan’s economic growth rate has remained relatively low and it may remain low in the future. In addition, Japan is subject to the risk of natural disasters, such as earthquakes, volcanoes, typhoons and tsunamis.
Additionally, decreasing U.S. imports, new trade regulations, changes in the U.S. dollar exchange rates, a recession in the United States or continued increases in foreclosure rates may have an adverse impact on the economy of Japan. Japan also has few natural resources, and any fluctuation or shortage in the commodity markets could have a negative impact on Japanese securities. In addition, Japan is subject to the risk of natural disasters, such as earthquakes, volcanic eruptions, typhoons and tsunamis, which could negatively affect the Funds’ investment in Japan.
• Risks Related to Investing in Europe. To the extent the Fund invests in European securities, it will be subject to risks related to investing in Europe. The economies and markets of European countries are often closely connected and interdependent, and events in one country in Europe can have an adverse impact on other European countries. The Fund makes investments in securities of issuers that are domiciled in, or have significant operations in, member countries of the European Union (the “EU”) that are subject to economic and monetary controls that can adversely affect the Fund’s investments. The European financial markets have experienced volatility and adverse trends in recent years and these events have adversely affected the exchange rate of the euro and may continue to significantly
STRIVE ETFs
NOTES TO THE FINANCIAL STATEMENTS (CONTINUED)
July 31, 2024
affect other European countries. Decreasing imports or exports, changes in governmental or EU regulations on trade, changes in the exchange rate of the euro, the default or threat of default by an EU member country on its sovereign debt, and/or an economic recession in an EU member country may have a significant adverse effect on the economies of EU member countries and their trading partners, including some or all of the European countries in which the Fund invests.
In addition, the United Kingdom resolved to leave the EU, an event commonly known as “Brexit.” The United Kingdom officially left the EU on January 31, 2020. Although the UK and EU have made a trade agreement that was entered into force on May 1, 2021, certain post-EU arrangements were outside the scope of the negotiating mandate and remain unresolved and subject to further negotiation and agreement. There remains significant market uncertainty regarding Brexit’s ramifications, and the range of possible political, regulatory, economic and market outcomes are difficult to predict. The uncertainty surrounding the UK’s economy, and its legal, political, and economic relationship with the remaining member states of the EU, may continue to be a source of instability and cause considerable disruption in securities markets, including increased volatility and illiquidity, as well as currency fluctuations in the British pound’s exchange rate against the U.S. dollar.
• Risks Related to Investing in Canada. The Canadian economy is very dependent on the demand for, and supply and price of, natural resources. The Canadian market is relatively concentrated in issuers involved in the production and distribution of natural resources. There is a risk that any changes in natural resources sectors could have an adverse impact on the Canadian economy. Additionally, the Canadian economy is heavily dependent on relationships with certain key trading partners including the United States, countries in the European Union and China. Because the United States is Canada’s largest trading partner and foreign investor, the Canadian economy is dependent on and may be significantly affected by developments impacting the U.S. economy. Reduction in spending on Canadian products and services or changes in the U.S. economy may adversely impact the Canadian economy. Uncertainty as to the future of certain trade agreements between the U.S. and Canada may cause a decline in the value of the Fund’s Shares. In addition, certain sectors of Canada’s economy may be subject to foreign ownership limitations. This may negatively impact the Fund’s ability to invest in Canadian issuers and to track the Index.
Geopolitical/Natural Disaster Risks. The value of your investment in the Fund is based on the values of the Fund’s investments, which may change due to economic and other events that affect markets generally, as well as those that affect particular regions, countries, industries, companies or governments. These events may be sudden and unexpected, and could adversely affect the liquidity of the Fund’s investments, which may in turn impact valuation, the Fund’s ability to sell securities and/or its ability to meet redemptions. The risks associated with these developments may be magnified if certain social, political, economic and other conditions and events (such as war, natural disasters, epidemics and pandemics, terrorism, conflicts, social unrest, recessions, inflation, rapid interest rate changes and supply chain disruptions) adversely interrupt the global economy and financial markets. It is difficult to predict when events affecting the U.S. or global financial markets may occur, the effects that such events may have and the duration of those effects (which may last for extended periods). These events may negatively impact broad segments of businesses and populations and have a significant and rapid negative impact on the performance of the Fund’s investments, adversely affect and increase the volatility of the Fund’s share price and exacerbate pre-existing risks to the Fund.
Gold and Precious Metals Risk. The Fund will be sensitive to changes in the overall condition of the gold, precious metals and mining sector. Competitive pressures may have a significant effect on the financial condition of companies in such industry. Also, such companies are highly dependent on the price of certain precious metals. These prices may fluctuate substantially over short periods of time, so the Fund’s share price may be more volatile than other types of investments. The prices of precious metals rise and fall in response to many factors, including: economic cycles; changes in inflation or expectations about inflation in various countries; interest rates; currency fluctuations; metal sales by governments, central banks, or international agencies; investment speculation; resource availability; fluctuations in industrial and commercial supply and demand; government regulation of the metals and materials industries; and government prohibitions or restrictions on the private ownership of certain precious and rare metals. The Index measures, in part, the performance of equity securities of gold and precious metals companies and does not measure the performance of direct investment in precious metals. Consequently, the Fund’s share price may not move in the same direction and to the same extent as the spot prices of precious metals.
STRIVE ETFs
NOTES TO THE FINANCIAL STATEMENTS (CONTINUED)
July 31, 2024
In times of stable economic growth, traditional equity and debt investments could offer greater appreciation potential, and the value of precious metals may be adversely affected, which could in turn affect the Fund’s returns. The production and sale of precious metals by governments, central banks, or other large holders can be affected by various economic, financial, social, and political factors, which may be unpredictable and may have a significant impact on the supply and prices of precious metals. Economic and political conditions in those countries that are the largest producers of precious metals may have a direct effect on the production and marketing of such metals and on sales of central bank holdings. Some precious metals mining operation companies may hedge their exposure to falls in precious metals prices by selling forward future production, which may result in lower returns during periods when the price of precious metals increases. The precious metals industry can be significantly affected by events relating to international political developments, the success of exploration projects, commodity prices, and tax and government regulations. If a natural disaster or other event with a significant economic impact occurs in a region where the companies in which the Fund invests operate, such disaster or event could negatively affect the profitability of such companies and, in turn, the Fund’s investment in them.
Growth Investing Risk. The Fund invests in growth securities, which may be more volatile than other types of investments, may perform differently than the market as a whole and may underperform when compared to securities with different investment parameters. Under certain market conditions, growth securities have performed better during the later stages of economic recovery (although there is no guarantee that they will continue to do so). Therefore, growth securities may go in and out of favor over time.
Healthcare Sector Risk. The Fund is expected to have exposure to companies in the healthcare sector, and therefore, the Fund’s performance could be negatively impacted by events affecting this sector. The healthcare sector includes companies relating to medical and healthcare goods and services, such as companies engaged in manufacturing medical equipment, supplies and pharmaceuticals, as well as operating healthcare facilities and the provision of managed healthcare. Companies in this sector may be affected by government regulations including new regulations and scrutiny related to data privacy, and government healthcare programs, increases or decreases in the cost of medical products and services and product liability claims, among other factors. Many healthcare companies are heavily dependent on patent protection, and the expiration of a company’s patent may adversely affect that company’s profitability. Healthcare companies are subject to competitive forces that may result in price discounting, and may be thinly capitalized and susceptible to product obsolescence. Companies in the healthcare sector may be subject to adverse government or regulatory actions, which may be costly.
Hedging Risk. A hedge is an investment made in order to reduce the risk of adverse price movements in a security, (including currencies), by taking an offsetting position in a related instrument or basket of instruments (often a derivative, such as an option or a short sale). While hedging strategies can be very useful and inexpensive ways of reducing risk, they are sometimes ineffective due to unexpected changes in the market. Hedging also involves the risk that changes in the value of the related instrument or basket of securities will not match those of the instruments being hedged as expected, in which case any losses on the instruments being hedged may not be reduced.
High Portfolio Turnover Risk. The Fund’s investment strategy may from time-to-time result in higher turnover rates. This may increase the Fund’s brokerage commission costs, which could negatively impact the performance of the Fund. Rapid portfolio turnover also exposes shareholders to a higher current realization of short-term capital gains, distributions of which would generally be taxed to you as ordinary income and thus cause you to pay higher taxes.
High-Yield Debt Securities (Junk Bonds) Risk. High-yield securities (also known as “junk bonds”) carry a greater degree of risk and are considered speculative by the major credit rating agencies. High-yield securities may be issued by companies that are restructuring, are smaller and less creditworthy, or are more highly indebted than other companies. This means that they may have more difficulty making scheduled payments of principal and interest. Changes in the value of high-yield securities are influenced more by changes in the financial and business position of the issuing company than by changes in interest rates when compared to investment grade securities. High-yield securities have greater volatility because there is less certainty that principal and interest payments will be made as scheduled. The Fund’s investments in high-yield securities expose it to a substantial degree of credit risk. These investments are considered speculative under traditional investment standards. Prices of high-yield securities will rise and fall primarily in response to actual or perceived changes in the issuer’s
STRIVE ETFs
NOTES TO THE FINANCIAL STATEMENTS (CONTINUED)
July 31, 2024
financial health, although changes in market interest rates also will affect prices. High-yield securities may experience reduced liquidity and sudden and substantial decreases in price.
Illiquid Investments Risk. The Fund may, at times, hold illiquid investments, by virtue of the absence of a readily available market for certain of its investments, or because of legal or contractual restrictions on sales. The Fund could lose money if it is unable to dispose of an investment at a time or price that is most beneficial to the Fund.
Index Calculation Risk. The Index relies on various sources of information to assess the criteria of issuers included in the Index, including fundamental information that may be based on assumptions and estimates. Neither the Fund, the Adviser, the Sub-Adviser nor the Index Provider can offer assurances that the Index’s calculation methodology or sources of information will provide a correct valuation of securities, nor can they guarantee the availability or timeliness of the production of the Index.
Index Rebalance Risk. Because each Index generally only changes their respective exposures based on data as of a quarter end, semi-annual period end or annually (each, a “Period End”), (i) an Index’s exposure may be affected by significant market movements at or near a Period End that are not predictive of the market’s performance for the subsequent Period End and (ii) changes to the Index’s exposure may lag a significant change in the market’s direction (up or down) by as long as the next Period End if such changes first take effect at or near the beginning of a Period End. Such lags between market performance and changes to the Index’s exposure may result in significant underperformance relative to the broader equity or fixed income market.
Industrials Sector Risk. The industrials sector includes, for example, aerospace and defense, non-residential construction, engineering, machinery, transportation, and commercial and professional services companies. This sector can be significantly affected by, among other things, business cycle fluctuations, worldwide economic growth, exchange rates, commodity prices, government and corporate spending, supply and demand for specific products and manufacturing, rapid technological developments, international political and economic developments, environmental issues, and tax and governmental regulatory policies. As the demand for, or prices of, industrials increase, the value of a Fund’s investments generally would be expected to also increase. Conversely, declines in the demand for, or prices of, industrials generally would be expected to contribute to declines in the value of such securities. Such declines may occur quickly and without warning and may negatively impact the value of a Fund and your investment.
Investment Risk. When you sell your Shares of the Fund, they could be worth less than what you paid for them. The Fund could lose money due to short-term market movements and over longer periods during market downturns. Securities may decline in value due to factors affecting securities markets generally or particular asset classes or industries represented in the markets. The value of a security may decline due to general market conditions, economic trends or events that are not specifically related to the issuer of the security or to factors that affect a particular industry or group of industries. During a general downturn in the securities markets, multiple asset classes may be negatively affected. Therefore, you may lose money by investing in the Fund.
Large Capitalization Companies Risk. Large-capitalization companies may trail the returns of the overall stock market. Large-capitalization stocks tend to go through cycles of doing better – or worse – than the stock market in general. These periods have, in the past, lasted for as long as several years. When large capitalization companies are out of favor, these securities may lose value or may not appreciate in line with the overall market. In addition, large capitalization companies may be unable to respond quickly to new competitive challenges, such as changes in technology or consumer tastes, and also may not be able to attain the high growth rate of successful small companies, especially during extended periods of economic expansion.
Large Shareholder and Large-Scale Redemption Risk. Certain shareholders, including an Authorized Participant, a third-party investor, a market maker, or another entity, may from time to time own or manage a substantial amount of Fund shares, or may invest in the Fund and hold its investment for a limited period of time. There can be no assurance that any large shareholder or large group of shareholders would not redeem their investment. Redemptions of a large number of Fund shares could require the Fund to dispose of assets to meet the redemption requests, which can accelerate the realization of taxable income and/or capital gains and cause the Fund to make taxable distributions to its shareholders earlier than the Fund
STRIVE ETFs
NOTES TO THE FINANCIAL STATEMENTS (CONTINUED)
July 31, 2024
otherwise would have. In addition, under certain circumstances, non-redeeming shareholders may be treated as receiving a disproportionately large taxable distribution during or with respect to such year.
LIBOR Transition Risk. The risk related to the anticipated discontinuation of the London Interbank Offered Rate (“LIBOR”). Certain instruments held by the Fund rely in some fashion upon LIBOR. Although the transition process away from LIBOR has become increasingly well-defined in advance of the anticipated discontinuation date, there remains uncertainty regarding the nature of any replacement rate, and any potential effects of the transition away from LIBOR on the Fund or on certain instruments in which the Fund invests can be difficult to ascertain. The transition process may involve, among other things, increased volatility or illiquidity in markets for instruments that currently rely on LIBOR and may result in a reduction in the value of certain instruments held by the Fund.
Limited Operating History Risk. Each Fund is a recently organized investment company with a limited operating history. As a result, prospective investors have a limited track record or history on which to base their investment decision. There can be no assurance that a Fund will grow to or maintain an economically viable size.
Liquidity Risk. Liquidity risk exists when particular investments are difficult to purchase or sell. Markets may become illiquid when, for example, there are few, if any, interested buyers or sellers or when dealers are unwilling or unable to make a market for particular securities. As a general matter, dealers recently have been less willing to make markets for fixed income securities. The Fund’s investments in illiquid securities may reduce the return of the Fund because it may be unable to sell the illiquid securities at an advantageous time or price. Investments in foreign securities, derivatives (e.g., options on securities, securities indexes, and foreign currencies) and securities with substantial market or credit risk tend to have the greatest exposure to liquidity risk. Illiquid securities may also be difficult to value.
Management Risk. The Fund is actively managed and the Sub-Advisers’ ability to choose suitable investments and implement the strategies described above has a significant impact on the ability of the Fund to achieve its investment objectives. In addition, there is the risk that the investment process, techniques and analyses used by the Sub-Advisers will not produce the desired investment results and the Fund may lose value as a result.
Mid-Capitalization Companies Risk. The securities of mid-capitalization companies may be more vulnerable to adverse issuer, market, political, or economic developments than securities of larger-capitalization companies. The securities of mid-capitalization companies generally trade in lower volumes and are subject to greater and more unpredictable price changes than larger capitalization stocks or the stock market as a whole. Some mid-capitalization companies have limited product lines, markets, and financial and managerial resources and tend to concentrate on fewer geographical markets relative to larger capitalization companies.
Mortgage-Backed and Asset Backed Securities Risk. Mortgage-backed and asset-backed securities represent interests in “pools” of mortgages or other assets, including consumer loans or receivables held in trust. Mortgage-backed securities are subject to “prepayment risk” (the risk that borrowers will repay a loan more quickly in periods of falling interest rates) and “extension risk” (the risk that borrowers will repay a loan more slowly in periods of rising interest rates). If the Fund invests in mortgage-backed or asset-backed securities that are subordinated to other interests in the same pool, the Fund may only receive payments after the pool’s obligations to other investors have been satisfied. An unexpectedly high rate of defaults on the assets held by a pool may limit substantially the pool’s ability to make payments of principal or interest to the Fund, reducing the values of those securities or in some cases rendering them worthless. The Fund’s investments in other asset-backed securities are subject to risks similar to those associated with mortgage-backed securities, as well as additional risks associated with the nature of the assets and the servicing of those assets.
Municipal Securities Risk. Litigation, legislation or other political events, local business or economic conditions or the bankruptcy of the issuer could have a significant effect on the ability of an issuer of municipal securities to make payments of principal and/or interest. Political changes and uncertainties in the municipal market related to taxation, legislative changes or the rights of municipal security holders can significantly affect municipal securities. Because many securities are issued to finance similar projects, especially those relating to education, health care, transportation and utilities, conditions in those sectors can affect the overall municipal market. In addition, changes in the financial condition of an individual municipal issuer can affect the overall municipal market. If the Internal Revenue Service (“IRS”) determines that an issuer of a
STRIVE ETFs
NOTES TO THE FINANCIAL STATEMENTS (CONTINUED)
July 31, 2024
municipal security has not complied with applicable tax requirements, interest from the security could become taxable and the security could decline significantly in value.
Natural Resources and Commodity-Related Industries Risk. The Fund is subject to the risks associated with companies in the natural resources and commodities-related industries. These industries can be significantly affected by (and often rapidly affected by) changes in the supply of, or demand for, various natural resources and commodities. Investments in natural resources companies, which include companies engaged in energy (oil, gas & consumable fuels), agriculture, and precious and industrial metals and mining can be significantly affected by events relating to these industries, including international political and economic developments, embargoes, tariffs, inflation, weather and natural disasters, livestock diseases, limits on exploration, rapid changes in the supply and demand for natural resources and other factors. The Fund’s investments may experience substantial price fluctuations as a result of these factors, and may move independently of the trends of other operating companies. Companies engaged in the sectors listed above may be adversely affected by changes in government policies and regulations, technological advances and/or obsolescence, environmental damage claims, energy conservation efforts, the success of exploration projects, limitations on the liquidity of certain natural resources and commodities and competition from new market entrants. Changes in general economic conditions, including commodity price volatility, changes in exchange rates, imposition of import controls, rising interest rates, prices of raw materials and other commodities, depletion of resources and labor relations, could adversely affect the Fund’s investments.
New Fund Risk. The Fund is a recently organized management investment company with no operating history. As a result, prospective investors have a limited track record or history on which to base their investment decision. There can be no assurance that the Fund will grow to or maintain an economically viable size.
Non-Diversification Risk. Because the Fund is non-diversified, it may be more sensitive to economic, business, political or other changes affecting individual issuers or investments than a diversified fund, which may result in greater fluctuation in the value of the Fund’s Shares and greater risk of loss.
Nuclear Energy Sector Risk. The Fund will be sensitive to, and its performance will depend to a greater extent on, the overall condition of nuclear energy companies. The companies represented in the Fund’s portfolio may face considerable risk as a result of, among other risks, incidents and accidents, breaches of security, ill-intentioned acts or terrorism, natural disasters (such as floods or earthquakes), equipment malfunctions or mishandling in storage, handling, transportation, treatment or conditioning of substances and nuclear materials. Such events could have serious consequences, especially in case of radioactive contamination and irradiation of the environment, for the general population, as well as a material, negative impact on the Fund’s portfolio companies and thus the Fund’s financial situation. In addition, the nuclear energy sector is subject to competitive risk associated with the prices of other energy sources, such as natural gas and oil, obsolescence of existing technology, short product cycles, falling prices and profits, competition from new market entrants and general economic conditions. The price of uranium may be affected by changes in inflation rates, interest rates, monetary policy, economic conditions and political stability. In addition, uranium mining companies may also be significantly affected by import controls, energy conservation efforts, the success of energy exploration projects, liability for environmental damage, depletion of resources, and mandated expenditures for safety and pollution control devices. Consumers of nuclear energy may have the ability to switch between nuclear energy and other energy sources and, as a result, during periods when competing energy sources are less expensive, the revenues of companies in the nuclear energy sector may decline with a corresponding impact on earnings.
Nuclear activity is also subject to particularly detailed and restrictive regulations, with a scheme for the monitoring and periodic re-examination of operating authorization, which primarily takes into account nuclear safety, environmental and public health protection, and also national security considerations (terrorist threats in particular). These regulations and any future regulations may be subject to significant tightening by national and international authorities. There are substantial differences among the regulatory practices and policies of various jurisdictions, and any given regulatory agency may make major shifts in policy from time to time. There is no assurance that regulatory authorities will, in the future, grant rate increases or that such increases will be adequate to permit the payment of dividends on common stocks issued by a utility company. Additionally, existing and possible future regulatory legislation may make it even more difficult for utilities to obtain adequate relief. In addition, governmental authorities may from time-to-time review existing policies and impose additional requirements governing the licensing, construction and operation of nuclear power plants. This could result in
STRIVE ETFs
NOTES TO THE FINANCIAL STATEMENTS (CONTINUED)
July 31, 2024
increased operating costs, which would have a negative impact on the Fund’s portfolio companies and may cause operating businesses related to nuclear energy to become unprofitable or impractical to operate.
Uranium prices are subject to fluctuation. The price of uranium has been and will continue to be affected by numerous factors beyond the Fund’s control. Such factors include the demand for nuclear power, political and economic conditions in uranium producing and consuming countries, uranium supply from secondary sources and uranium production levels and costs of production. In addition, the prices of crude oil, natural gas and electricity produced from traditional hydro power and possibly other undiscovered energy sources could potentially have a negative impact on the competitiveness of nuclear energy companies in which the Fund invests.
Securities of the companies involved in this industry have been significantly more volatile than securities of companies operating in other more established industries. Certain valuation methods currently used to value companies involved in the nuclear power and power technology sectors, particularly those companies that have not yet traded profitably, have not been in widespread use for a significant period of time. As a result, the use of these valuation methods may serve to increase further the volatility of certain alternative power and power technology company share prices.
Oil and Gas Sector Risk. The profitability of companies in the oil and gas sector is related to worldwide energy prices, exploration costs, and production spending. Companies in the oil and gas sector may be at risk for environmental damage claims and other types of litigation, as well as negative publicity and perception. Companies in the oil and gas sector may be adversely affected by natural disasters or other catastrophes, changes in exchange rates, interest rates, changes in prices for competitive energy services, economic conditions, tax treatment, government regulation and intervention, and unfavorable events in the regions where companies operate (e.g., expropriation, nationalization, confiscation of assets and property or imposition of restrictions on foreign investments and repatriation of capital, military coups, social unrest, violence or labor unrest). As a result, the value of these companies may fluctuate widely. Companies in the oil and gas sector may have significant capital investments in, or engage in transactions involving, emerging market countries, which may heighten these risks. Any of these factors could result in a material adverse impact on the Fund’s securities and the performance of the Fund.
Passive Investment Risk. The Fund is not actively managed and the Sub-Adviser will not sell any investments due to current or projected underperformance of the securities, industries or sector in which it invests, unless the investment is removed from the Index, sold in connection with a rebalancing of the Index as addressed in the Index methodology, or sold to comply with the Fund’s investment limitations (for example, to maintain the Fund’s tax status). The Fund will maintain investments until changes to its Index are triggered, which could cause the Fund’s return to be lower than if the Fund employed an active strategy.
Rating Agencies Risk. Rating agencies may fail to make timely changes in credit ratings and an issuer’s current financial condition may be better or worse than a rating indicates. In addition, rating agencies are subject to an inherent conflict of interest because they are often compensated by the same issuers whose securities they grade.
Real Estate Sector Risk. The risk that real estate-related investments may decline in value as a result of factors affecting the real estate sector, such as the supply of real property in certain markets, changes in zoning laws, delays in completion of construction, changes in real estate values, changes in property taxes, levels of occupancy, and local, regional, and general market conditions.
REIT Risk. Investments in REITs involve unique risks. REITs may have limited financial resources, may trade less frequently and in limited volume, and may be more volatile than other securities. In addition, to the extent the Fund holds interests in REITs, it is expected that investors in the Fund will bear two layers of asset-based management fees and expenses (directly at the Fund level and indirectly at the REIT level). The risks of investing in REITs include risks associated with the direct ownership of real estate and the real estate industry in general. These include risks related to general, regional and local economic conditions; fluctuations in interest rates and property tax rates; shifts in zoning laws, environmental regulations and other governmental action like the exercise of eminent domain; cash flow dependency; increased operating expenses; lack of availability of mortgage funds; losses due to natural disasters; overbuilding; losses due to casualty or condemnation; changes in property values and rental rates; and other factors. In addition to these risks, residential/diversified REITs and commercial equity REITs may be affected by changes in the value of the underlying property owned by the trusts, while mortgage REITs
STRIVE ETFs
NOTES TO THE FINANCIAL STATEMENTS (CONTINUED)
July 31, 2024
may be affected by the quality of any credit extended. Further, REITs are dependent upon management skills and generally may not be diversified. REITs are also subject to heavy cash flow dependency, defaults by borrowers and self-liquidation. In addition, REITs could possibly fail to qualify for the beneficial tax treatment available to REITs under the Internal Revenue Code of 1986 (the “Code”), or to maintain their exemptions from registration under the 1940 Act. The Fund expects that dividends received from a REIT and distributed to Fund shareholders generally will be taxable to the shareholder as ordinary income. The above factors may also adversely affect a borrower’s or a lessee’s ability to meet its obligations to the REIT. In the event of a default by a borrower or lessee, the REIT may experience delays in enforcing its rights as a mortgagee or lessor and may incur substantial costs associated with protecting investments.
Repurchase Agreement Risk. Repurchase agreements typically involve the acquisition by the Fund of fixed-income securities from a selling financial institution such as a bank or broker-dealer. The Fund may incur a loss if the other party to a repurchase agreement is unwilling or unable to fulfill its contractual obligations to repurchase the underlying security.
Reverse Repurchase Agreement Risk. A reverse repurchase agreement is the sale by the Fund of a debt obligation to a party for a specified price, with the simultaneous agreement by the Fund to repurchase that debt obligation from that party on a future date at a higher price. Similar to borrowing, reverse repurchase agreements provide the Fund with cash for investment purposes, which creates leverage and subjects the Fund to the risks of leverage. Reverse repurchase agreements also involve the risk that the other party may fail to return the securities in a timely manner or at all. The Fund could lose money if it is unable to recover the securities and/or if the value of collateral held by the Fund, including the value of the investments made with cash collateral, is less than the value of securities.
Sampling Risk. The Fund’s use of a representative sampling approach will result in it holding a smaller number of securities than are in the Index. As a result, an adverse development respecting a security held by the Fund could result in a greater decline in NAV than would be the case if the Fund held all of the securities in the Index. Conversely, a positive development relating to a security in the Index that is not held by the Fund could cause the Fund to underperform the Index. To the extent the assets in the Fund are smaller, these risks will be greater.
Semiconductor Sector Risk. The semiconductor sector is highly cyclical and periodically experiences significant economic downturns characterized by diminished product demand, resulting in production overcapacity and excess inventory, which can result in rapid erosion of product selling prices. The sector has experienced significant downturns, often in connection with, or in anticipation of, maturing product cycles of both semiconductor companies’ and their customers’ products and the decline in general economic conditions.
Small-Capitalization Companies Risk. The securities of small-capitalization companies may be more vulnerable to adverse issuer, market, political, or economic developments than securities of large- or mid-capitalization companies. The securities of small-capitalization companies generally trade in lower volumes and during adverse circumstances, may be more difficult to sell and receive a sales price comparable to the value assigned to the security by the Fund. These securities are subject to greater and more unpredictable price changes than large- or mid-capitalization stocks or the stock market as a whole. There is typically less publicly available information concerning smaller-capitalization companies than for larger, more established companies, which may make the valuation of such securities more difficult if there isn’t a readily available market price.
Structured Products Risk. The Fund may invest in Structured Products, including CLOs, CDOs, CMOs, and other asset-backed securities and debt securitizations. Some Structured Products have credit ratings but are typically issued in various classes with various priorities. Normally, Structured Products are privately offered and sold (that is, they are not registered under the securities laws) and may be characterized by the Fund as illiquid securities; however, an active dealer market may exist for Structured Products that qualify for Rule 144A transactions. The senior and junior tranches of Structured Products may have floating or variable interest rates based on LIBOR and are subject to the risks associated with securities tied to LIBOR, including the risks associated with the future replacement of LIBOR with an alternative reference rate. The Fund may also invest in the equity tranches of a Structured Product, which typically represent the first loss position in the Structured Product, are unrated and are subject to higher risks. Equity tranches of Structured Products typically do not have a fixed coupon and payments on equity tranches will be based on the income received from the underlying collateral and the payments made to the senior tranches, both of which may be based on floating rates based on LIBOR.
STRIVE ETFs
NOTES TO THE FINANCIAL STATEMENTS (CONTINUED)
July 31, 2024
Technology Sector Risk. The Fund is expected to have exposure to companies operating in the technology sector, and therefore, the Fund’s performance could be negatively impacted by events affecting this sector. Technology companies, including information technology companies, may have limited product lines, financial resources and/or personnel. Technology companies typically face intense competition and potentially rapid product obsolescence. They are also heavily dependent on intellectual property rights and may be adversely affected by the loss or impairment of those rights. Companies in the technology sector also face increased government regulation, including new regulations and scrutiny related to data privacy, and may be subject to adverse government or regulatory actions, which may be costly.
To-Be-Announced (“TBA”) Transactions Risk. TBA purchase commitments involve a risk of loss if the value of the securities to be purchased declines prior to settlement date or if the counterparty may not deliver the securities as promised. Selling a TBA involves a risk of loss if the value of the securities to be sold goes up prior to settlement date. TBA transactions involve counterparty risk. Default or bankruptcy of a counterparty to a TBA transaction would expose the Fund to potential loss and could affect the Fund’s returns.
Tracking Error Risk. As with all index funds, the performance of the Fund and its respective Index may differ from each other for a variety of reasons. For example, the Fund incurs operating expenses and portfolio transaction costs not incurred by the Index. In addition, the Fund may not be fully invested in the securities of the Index at all times or may hold securities not included in the Index.
U.S. Government Securities Risk. The Fund may invest in U.S. Treasury obligations and securities issued or guaranteed by the U.S. Treasury. U.S. government securities are subject to market risk, interest rate risk and credit risk. Securities, such as those issued or guaranteed the U.S. Treasury, that are backed by the full faith and credit of the United States are guaranteed only as to the timely payment of interest and principal when held to maturity and the market prices for such securities will fluctuate. Notwithstanding that these securities are backed by the full faith and credit of the United States, circumstances could arise that would prevent the payment of interest or principal. This would result in losses to the Fund.
Underlying Fund Risk. Because the Fund may invest in other investment companies, including but not limited to BDCs and ETFs (collectively, “Underlying Funds”), the Fund’s investment performance may depend on the investment performance of the Underlying Funds. An investment in the Fund is subject to the risks associated with the Underlying Funds in which the Fund invests. The Fund will indirectly pay a proportional share of the expenses of Underlying Funds in which it invests (which may include operating expenses and management fees). Some Underlying Funds may not produce qualifying income for purposes of the “Income Requirement,” which must be met in order for each Fund to maintain its status as a regulated investment company under the Internal Revenue Code of 1986, as amended (the “Code”). If one or more Underlying Funds generates more non-qualifying income for purposes of the “Income Requirement” than the Fund’s portfolio management expects, it could cause the Fund to inadvertently fail the “Income Requirement” thereby causing the Fund to inadvertently fail to qualify as a regulated investment company under the Code.
Value Investing Risk. Securities issued by companies that may be perceived as undervalued may be appropriately valued. Value securities may fail to appreciate for long periods of time or may never realize their full potential value. In addition, the Fund’s ability to realize any benefits of investing in value securities may depend on the Fund’s ability to stay invested until the market’s perception of such securities change. Value securities have generally performed better than non-value securities during periods of economic recovery (although there is no assurance that they will continue to do so). Value securities may go in and out of favor over time.
Variable and Floating Rate Securities Risk. Floating or variable rate securities pay interest at rates that adjust in response to changes in a specified interest rate or reset at predetermined dates (such as the end of a calendar quarter). Securities with floating or variable interest rates are generally less sensitive to interest rate changes but may decline in value if their interest rates do not rise as much, or as quickly, as interest rates in general. Conversely, floating rate securities will not generally increase in value if interest rates decline. Inverse floating rate securities may decrease in value if interest rates increase. Inverse floating rate securities may also exhibit greater price volatility than a fixed rate obligation with similar credit quality. When a Fund holds variable or floating rate securities, a decrease (or, in the case of inverse floating rate securities, an increase) in market interest rates will adversely affect the income received from such securities and the NAV of the Fund’s shares.
STRIVE ETFs
NOTES TO THE FINANCIAL STATEMENTS (CONTINUED)
July 31, 2024
NOTE 4 – COMMITMENTS AND OTHER RELATED PARTY TRANSACTIONS.
Empowered Funds, LLC dba EA Advisers (the “Adviser”) serves as the investment adviser to the Funds. Pursuant to an investment advisory agreement (the “Advisory Agreement”) between the Trust, on behalf of the Funds, and the Adviser, the Adviser provides investment advice to the Funds and oversees the day-to-day operations of the Funds, subject to the direction and control of the Board and the officers of the Trust. Under the Advisory Agreement, the Adviser is also responsible for arranging transfer agency, custody, fund administration and accounting, and other non-distribution related services necessary for the Funds to operate. The Adviser administers the Funds’ business affairs, provides office facilities and equipment and certain clerical, bookkeeping, and administrative services. The Adviser agrees to pay all expenses incurred by the Funds, except for the fee paid to the Adviser pursuant to the Advisory Agreement, payments under any distribution plan adopted pursuant to Rule 12b-1, brokerage expenses, acquired fund fees and expenses, taxes (including tax-related services), interest (including borrowing costs), litigation expense (including class action-related services) and other non-routine or extraordinary expenses.
Strive Asset Management, LLC, serves as a discretionary investment sub-adviser to the Funds. Pursuant to an investment sub-advisory agreement (the “Sub-Advisory Agreement”) among the Trust, the Adviser and the Sub-Adviser, the Sub-Adviser is responsible for determining the investment exposures for the Funds, subject to the overall supervision and oversight of the Adviser and the Board.
Along with Strive Asset Management, LLC, Angel Oak Capital Advisors, LLC (“Angel Oak”) also serves as a sub-adviser to STXT and BUXX only. Pursuant to an investment sub-advisory agreement (the “Angel Oak Sub-Advisory Agreement”) among the Trust, Angel Oak, and the Adviser, Angel Oak is responsible for implementing Strive Asset Management, LLC’s sector allocations and duration target by selecting investments and executing each Funds transactions in accordance with such sector allocations and duration targets, subject to the investment objective, policies and limitations of each Fund, subject to the overall supervision and oversight of the Adviser and the Board.
At a Board meeting held on June 7, 2024, the Trustees including each Trustee who is not an “interested person” of the Trust, as defined in the 1940 Act, approved the Advisory Agreement and Sub-Advisory Agreement for each STRV, STXK, STXG, STXV, STXD, DRLL, SHOC, FTWO, STXE, STXI, STXT, and BUXX.
At a Board meeting held on March 8-9, 2024, the Trustees including each Trustee who is not an “interested person” of the Trust, as defined in the 1940 Act, approved the Advisory Agreement and Sub-Advisory Agreement for STXM.
The table below represents the annual rate based on average daily net assets that each Fund pays the Adviser monthly:
| | | | | | | | |
| STRV | | 0.0545 | % |
| STXM | | 0.18 | % |
| STXK | | 0.18 | % |
| STXG | | 0.18 | % |
| STXV | | 0.18 | % |
| STXD | | 0.35 | % |
| DRLL | | 0.41 | % |
| SHOC | | 0.40 | % |
| FTWO | | 0.49 | % |
| STXE | | 0.32 | % |
| STXI | | 0.29 | % |
| STXT | | 0.49 | % |
| BUXX | | 0.25 | % |
STRIVE ETFs
NOTES TO THE FINANCIAL STATEMENTS (CONTINUED)
July 31, 2024
U.S. Bancorp Fund Services, LLC (“Fund Services” or “Administrator”), doing business as U.S. Bank Global Fund Services, acts as the Funds’ Administrator and, in that capacity, performs various administrative and accounting services for the Funds. The Administrator prepares various federal and state regulatory filings, reports and returns for the Funds, including regulatory compliance monitoring and financial reporting; prepares reports and materials to be supplied to the trustees; monitors the activities of the Funds’ Custodian, transfer agent and fund accountant. Fund Services also serves as the transfer agent and fund accountant to the Funds. U.S. Bank N.A. (the “Custodian”), an affiliate of the Administrator, serves as the Funds’ Custodian.
The Custodian acts as the securities lending agent (the “Securities Lending Agent”) for the Funds.
NOTE 5 – SECURITIES LENDING
The Funds may lend up to 33⅓% of the value of the securities in their portfolios to brokers, dealers and financial institutions (but not individuals) under terms of participation in a securities lending program administered by the Securities Lending Agent. The securities lending agreement requires that loans are collateralized at all times in an amount equal to at least 102% of the value of any domestic loaned securities at the time of the loan, plus accrued interest. The use of loans of foreign securities, which are denominated and payable in U.S. dollars, shall be collateralized in an amount equal to 105% of the value of any loaned securities at the time of the loan plus accrued interest. The Funds receive compensation in the form of fees and earn interest on the cash collateral. The amount of fees depends on a number of factors including the type of security and length of the loan. The Funds continue to receive interest payments or dividends on the securities loaned during the borrowing period. Gain or loss on the value of securities loaned that may occur during the term of the loan will be for the account of the Funds. The Funds have the right under the terms of the securities lending agreement to recall the securities from the borrower on demand.
The securities lending agreement provides that, in the event of a borrower’s material default, the Securities Lending Agent shall take all actions the Securities Lending Agent deems appropriate to liquidate the collateral, purchase replacement securities at the Securities Lending Agent’s expense, or pay the Fund an amount equal to the market value of the loaned securities, subject to certain limitations which are set forth in detail in the securities lending agreement between the Funds and the Securities Lending Agent.
During the current fiscal period, certain Funds had loaned securities and received cash collateral for the loans. The cash collateral is invested by the Securities Lending Agent in accordance with the Trust approved investment guidelines. Those guidelines require the cash collateral to be invested in readily marketable, high quality, short-term obligations; however, such investments are subject to risk of payment delays or default on the part of the issuer or counterparty or otherwise may not generate sufficient interest to support the costs associated with securities lending. The Funds could also experience delays in recovering its securities and possible loss of income or value if the borrower fails to return the borrowed securities, although the Funds are indemnified from this risk by contract with the Securities Lending Agent.
As of the end of the current fiscal period, the values of the securities on loan and payable for collateral due to broker for the Funds were as follows:
| | | | | | | | | | | | | | | | | | | | |
| | Value of Securities on Loan | | Payable for Collateral Received* | | Percentage of Net Assets of Securities On Loan |
| STRV | | $ | 55,077 | | | $ | 59,400 | | | 0.01 | % |
STXM(1) | | — | | | — | | | — | % |
| STXK | | 582,329 | | | 592,281 | | | 1.06 | % |
| STXG | | 21,918 | | | 22,744 | | | 0.03 | % |
| STXV | | 28,242 | | | 28,860 | | | 0.05 | % |
| STXD | | — | | | — | | | — | % |
| DRLL | | 549,821 | | | 560,016 | | | 0.16 | % |
| SHOC | | — | | | — | | | — | % |
FTWO(2) | | 22,760 | | | 21,713 | | | 0.10 | % |
| STXE | | — | | | — | | | — | % |
STRIVE ETFs
NOTES TO THE FINANCIAL STATEMENTS (CONTINUED)
July 31, 2024
| | | | | | | | | | | | | | | | | | | | |
| | Value of Securities on Loan | | Payable for Collateral Received* | | Percentage of Net Assets of Securities On Loan |
STXI(3) | | $ | — | | | $ | — | | | — | % |
STXT(4) | | — | | | — | | | — | % |
BUXX(4) | | — | | | — | | | — | % |
| | | | | |
| * | The cash collateral received was invested in the First American Money Market Government Obligations Fund as shown on the Schedule of Investments. The investment objective is to seek maximum current income to the extent consistent with the preservation of capital and maintenance of liquidity. |
The interest income earned by the Funds on the investment of cash collateral received from borrowers for the securities loaned to them (“Securities Lending Income, Net”) is reflected in the Funds’ Statement of Operations. Net securities lending income earned on collateral investments and recognized by the Funds during the fiscal period, were as follows:
| | | | | | | | |
| STRV | | $ | 5,203 | |
STXM(1) | | — | |
| STXK | | 16,981 | |
| STXG | | 817 | |
| STXV | | 1,031 | |
| STXD | | 1,010 | |
| DRLL | | 1,270 | |
| SHOC | | 990 | |
FTWO(2) | | 655 | |
| STXE | | — | |
STXI(3) | | — | |
STXT(4) | | — | |
BUXX(4) | | — | |
| | |
| (1) The Fund commenced operations on April 10, 2024. |
| (2) The Fund commenced operations on August 30, 2023. |
| (3) The Fund commenced operations on June 25, 2024. |
| (4) The Fund commenced operations on August 9, 2023. |
Due to the absence of a master netting agreement related to the Funds’ participation in securities lending, no additional offsetting disclosures have been made on behalf of the Fund for the total borrowings listed above.
STRIVE ETFs
NOTES TO THE FINANCIAL STATEMENTS (CONTINUED)
July 31, 2024
NOTE 6 – PURCHASES AND SALES OF SECURITIES
For the fiscal period ended July 31, 2024, purchases and sales of securities for each Fund, excluding short-term securities and in-kind transactions, were as follows:
| | | | | | | | | | | | | | |
| | Purchases | | Sales |
| STRV | | $ | 45,157,808 | | | $ | 14,471,820 | |
STXM(1) | | 477,086 | | | 265,968 | |
| STXK | | 17,324,849 | | | 11,417,163 | |
| STXG | | 10,509,506 | | | 4,897,773 | |
| STXV | | 8,283,643 | | | 3,935,227 | |
| STXD | | 6,638,522 | | | 3,426,239 | |
| DRLL | | 141,048,261 | | | 70,729,124 | |
| SHOC | | 41,185,950 | | | 15,522,741 | |
FTWO(2) | | 2,669,112 | | | 1,996,646 | |
| STXE | | 78,229,498 | | | 122,123,563 | |
STXI(3) | | 60,222 | | | — | |
STXT(4) | | 130,199,006 | | | 33,280,662 | |
BUXX(4) | | 155,077,674 | | | 48,180,039 | |
For the fiscal period ended July 31, 2024, in-kind transactions associated with creations and redemptions were as follows: | | | | | | | | | | | | | | |
| | Purchases | | Sales |
| STRV | | $ | 248,703,759 | | | $ | 18,611,722 | |
STXM(1) | | 11,621,848 | | | — | |
| STXK | | 29,231,613 | | | 10,080,046 | |
| STXG | | 40,535,621 | | | 638,800 | |
| STXV | | 31,636,814 | | | 3,407,134 | |
| STXD | | 14,443,292 | | | 2,184,666 | |
| DRLL | | 28,209,191 | | | 123,916,111 | |
| SHOC | | 41,735,628 | | | 34,262,518 | |
FTWO(2) | | 24,273,931 | | | 2,990,162 | |
| STXE | | 1,680,113 | | | 13,388,813 | |
STXI(3) | | 10,055,770 | | | — | |
STXT(4) | | — | | | — | |
BUXX(4) | | — | | | — | |
STRIVE ETFs
NOTES TO THE FINANCIAL STATEMENTS (CONTINUED)
July 31, 2024
For the fiscal period ended July 31, 2024, short-term and long-term gains on in-kind transactions were as follows:
| | | | | | | | | | | | | | |
| | Short-Term | | Long-Term |
| STRV | | $ | 2,066,907 | | | $ | 3,213,375 | |
STXM(1) | | — | | | — | |
| STXK | | 2,282,407 | | | 316,832 | |
| STXG | | 81,554 | | | 112,632 | |
| STXV | | 651,702 | | | 172,806 | |
| STXD | | 281,719 | | | 270,720 | |
| DRLL | | 3,073,371 | | | 18,945,732 | |
| SHOC | | 3,900,283 | | | 11,213,099 | |
FTWO(2) | | 458,408 | | | — | |
| STXE | | (238,613) | | | 164,098 | |
STXI(3) | | — | | | — | |
STXT(4) | | — | | | — | |
BUXX(4) | | — | | | — | |
| | |
| (1) The Fund commenced operations on April 10, 2024. |
| (2) The Fund commenced operations on August 30, 2023. |
| (3) The Fund commenced operations on June 25, 2024. |
| (4) The Fund commenced operations on August 9, 2023. |
There were no purchases or sales of U.S. Government securities during the fiscal period ended July 31, 2024, except for the following:
| | | | | | | | | | | | | | |
| | Purchases | | Sales |
STXT(1) | | $ | 17,814,170 | | | $ | 2,488,490 | |
BUXX(1) | | 1,931,289 | | | 192,602 | |
(1) The Fund commenced operations on August 9, 2023.
NOTE 7 – TAX INFORMATION
The components of tax basis cost of investments and net unrealized appreciation (depreciation) for federal income tax purposes at July 31, 2024, were as follows:
| | | | | | | | | | | | | | |
| | STRV | STXM | STXK |
| Tax cost of Investments | | $ | 489,037,462 | | $ | 11,879,298 | | $ | 49,372,553 | |
| Gross tax unrealized appreciation | | 123,870,725 | | 859,194 | | 8,970,177 | |
| Gross tax unrealized depreciation | | (11,968,544) | | (352,833) | | (2,909,476) | |
| Net tax unrealized appreciation (depreciation) | | $ | 111,902,181 | | $ | 506,361 | | $ | 6,060,701 | |
| Undistributed ordinary income | | 528,861 | | 13,017 | | 162,609 | |
| Undistributed long-term gain | | — | | 610 | | — | |
| Total distributable earnings | | $ | 528,861 | | $ | 13,627 | | $ | 162,609 | |
| Other accumulated gain (loss) | | (55,258) | | — | | (789,645) | |
| Total accumulated gain (loss) | | $ | 112,375,784 | | $ | 519,988 | | $ | 5,433,665 | |
| | | | |
STRIVE ETFs
NOTES TO THE FINANCIAL STATEMENTS (CONTINUED)
July 31, 2024
| | | | | | | | | | | | | | |
| | STXG | STXV | STXD |
| Tax cost of Investments | | $ | 71,772,558 | | $ | 49,822,893 | | $ | 36,628,522 | |
| Gross tax unrealized appreciation | | 16,806,203 | | 6,311,373 | | 7,287,931 | |
| Gross tax unrealized depreciation | | (1,617,411) | | (1,481,790) | | (736,707) | |
| Net tax unrealized appreciation (depreciation) | | $ | 15,188,792 | | $ | 4,829,583 | | $ | 6,551,224 | |
| Undistributed ordinary income | | 3,799 | | 98,361 | | 35,244 | |
| Undistributed long-term gain | | 30,448 | | — | | — | |
| Total distributable earnings | | $ | 34,247 | | $ | 98,361 | | $ | 35,244 | |
| Other accumulated gain (loss) | | — | | (9,556) | | (427,281) | |
| Total accumulated gain (loss) | | $ | 15,223,039 | | $ | 4,918,388 | | $ | 6,159,187 | |
| | | | |
| | DRLL | SHOC | FTWO |
| Tax cost of Investments | | $ | 329,470,092 | | $ | 75,421,511 | | $ | 22,493,123 | |
| Gross tax unrealized appreciation | | 30,711,802 | | 10,459,160 | | 1,466,824 | |
| Gross tax unrealized depreciation | | (15,336,260) | | (3,247,281) | | (733,122) | |
| Net tax unrealized appreciation (depreciation) | | $ | 15,375,542 | | $ | 7,211,879 | | $ | 733,702 | |
| Undistributed ordinary income | | 81,369 | | 22,219 | | 9,906 | |
| Undistributed long-term gain | | — | | — | | — | |
| Total distributable earnings | | $ | 81,369 | | $ | 22,219 | | $ | 9,906 | |
| Other accumulated gain (loss) | | (8,137,978) | | (1,048,126) | | (6,300) | |
| Total accumulated gain (loss) | | $ | 7,318,933 | | $ | 6,185,972 | | $ | 737,308 | |
| | | | |
| | STXE | STXI | STXT |
| Tax cost of Investments | | $ | 89,588,903 | | $ | 10,151,715 | | $ | 101,219,298 | |
| Gross tax unrealized appreciation | | 17,955,169 | | 318,909 | | 1,605,665 | |
| Gross tax unrealized depreciation | | (6,243,268) | | (202,823) | | (42,605) | |
| Net tax unrealized appreciation (depreciation) | | $ | 11,711,901 | | $ | 116,086 | | $ | 1,563,060 | |
| Undistributed ordinary income | | 1,980,405 | | 9,075 | | 73,570 | |
| Undistributed long-term gain | | — | | — | | — | |
| Total distributable earnings | | $ | 1,980,405 | | $ | 9,075 | | $ | 73,570 | |
| Other accumulated gain (loss) | | (2,518,622) | | — | | (125,835) | |
| Total accumulated gain (loss) | | $ | 11,173,684 | | $ | 125,161 | | $ | 1,510,795 | |
| | | | |
| | BUXX | | |
| Tax cost of Investments | | $ | 118,909,216 | | | |
| Gross tax unrealized appreciation | | 474,196 | | | |
| Gross tax unrealized depreciation | | (59,975) | | | |
| Net tax unrealized appreciation (depreciation) | | $ | 414,221 | | | |
| Undistributed ordinary income | | 158,708 | | | |
| Undistributed long-term gain | | — | | | |
| Total distributable earnings | | $ | 158,708 | | | |
| Other accumulated gain (loss) | | — | | | |
| Total accumulated gain (loss) | | $ | 572,929 | | | |
STRIVE ETFs
NOTES TO THE FINANCIAL STATEMENTS (CONTINUED)
July 31, 2024
The difference between book and tax-basis cost is attributable to the realization for tax purposes of unrealized gains on investments in REITs, partnerships, passive foreign investment companies and wash sales. Under tax law, certain capital and foreign currency losses realized after October 31 and within the taxable year are deemed to arise on the first business day of each Fund’s next taxable year.
For the fiscal period ended July 31, 2024, the Funds did not defer any post-October capital losses or qualified late-year losses.
At July 31, 2024, the Funds had the following capital loss carryforwards:
| | | | | | | | | | | | | | |
| | Unlimited
Short-Term | | Unlimited
Long-Term |
| STRV | | $ | (55,258) | | | $ | — | |
STXM(1) | | — | | | — | |
| STXK | | (765,619) | | | (24,026) | |
| STXG | | — | | | — | |
| STXV | | (9,556) | | | — | |
| STXD | | (345,068) | | | (82,213) | |
| DRLL | | (2,701,311) | | | (5,436,667) | |
| SHOC | | (622,822) | | | (425,304) | |
FTWO(2) | | (6,300) | | | — | |
| STXE | | (2,518,622) | | | — | |
STXI(3) | | — | | | — | |
STXT(4) | | — | | | (125,835) | |
BUXX(4) | | — | | | — | |
| | |
| (1) The Fund commenced operations on April 10, 2024. |
| (2) The Fund commenced operations on August 30, 2023. |
| (3) The Fund commenced operations on June 25, 2024. |
| (4) The Fund commenced operations on August 9, 2023. |
NOTE 8 – DISTRIBUTIONS TO SHAREHOLDERS
The tax character of distributions paid by each Fund during the fiscal periods ended July 31, 2024, and July 31, 2023, were as follows:
| | | | | | | | | | | | | | |
| | Fiscal Period Ended July 31, 2024 | | Fiscal Period Ended July 31, 2023 |
| | Ordinary Income | | Ordinary Income |
| STRV | | $ | 5,358,321 | | | $ | 1,419,614 | |
STXM(1) | | 21,665 | | | — | |
| STXK | | 530,975 | | | 67,734 | |
| STXG | | 350,997 | | | 43,091 | |
| STXV | | 750,769 | | | 102,472 | |
| STXD | | 485,575 | | | 84,274 | |
| DRLL | | 9,743,291 | | | 9,891,239 | |
| SHOC | | 254,625 | | | 137,017 | |
FTWO(2) | | 76,248 | | | — | |
| STXE | | 1,599,535 | | | 462,914 | |
STRIVE ETFs
NOTES TO THE FINANCIAL STATEMENTS (CONTINUED)
July 31, 2024
| | | | | | | | | | | | | | |
| | Fiscal Period Ended July 31, 2024 | | Fiscal Period Ended July 31, 2023 |
| | Ordinary Income | | Ordinary Income |
STXI(3) | | $ | — | | | $ | — | |
STXT(4) | | 3,637,215 | | | — | |
BUXX(4) | | 4,093,148 | | | — | |
| | |
| (1) The Fund commenced operations on April 10, 2024. |
| (2) The Fund commenced operations on August 30, 2023. |
| (3) The Fund commenced operations on June 25, 2024. |
| (4) The Fund commenced operations on August 9, 2023. |
NOTE 9 – CREDIT FACILITY
The Custodian has made available to STXE and another series of the Trust a $30 million secured credit facility, pursuant to a Loan Agreement (“Agreement”) effective December 13, 2023, expiring on December 11, 2024, for the purposes of having cash available to satisfy redemption requests. Advances under the Agreement would be limited to the lesser of $30 million, 25% of the gross market value of the Fund, or 33.33% of the unencumbered assets of the Fund. Principal is due 45 days after the initial advance and at the maturity. Interest is payable monthly in arrears. Under the credit facility, the interest rate paid on outstanding borrowings is equal to the lender’s prime rate. As of July 31, 2024, the prime rate was 8.50%. The interest paid on outstanding borrwoings is paid by the Adviser. For the fiscal period ended July 31, 2024, STXE’s activity under the credit facility was as follows:
| | | | | | | | | | | |
| Average Principal Balance, when in use | Average Interest Rate, when in use | Maximum Loan Outstanding | Period Maximum Loan was Outstanding |
| $735,875 | 8.50% | $2,377,000 | February 1, 2024 |
As of July 31, 2024, STXE had no outstanding borrowings under the Agreement.
NOTE 10 – SUBSEQUENT EVENTS
In preparing these financial statements, management of the Funds have evaluated events and transactions for potential recognition or disclosure through the date the financial statements were issued. There were no transactions that occurred during the year subsequent to July 31, 2024, that materially impacted the amounts or disclosures in the Funds’ financial statements other than the below:
Effective August 16, 2024, the name of the Fund changed from Strive FAANG 2.0 ETF to Strive Natural Resources and Security ETF.
Effective September 16, 2024, Michael D. Barolsky is President (principal executive officer) of the Trust.
REPORT OF INDEPENDENT REGISTERED PUBLIC ACCOUNTING FIRM
To the Shareholders of
Strive ETFs and
The Board of Trustees of
EA Series Trust
Opinion on the Financial Statements
We have audited the accompanying statements of assets and liabilities of Strive 500 ETF, Strive Mid-Cap ETF, Strive Small-Cap ETF, Strive 1000 Growth ETF, Strive 1000 Value ETF, Strive 1000 Dividend Growth ETF, Strive U.S. Energy ETF, Strive U.S. Semiconductor ETF, Strive Natural Resources and Security ETF, Strive Emerging Markets Ex-China ETF, Strive International Developed Markets ETF, Strive Total Return Bond Fund and Strive Enhanced Income Short Maturity ETF (the “Funds”), each a series of EA Series Trust (the “Trust”), including the schedules of investments, as of July 31, 2024, the related statements of operations, statements of changes in net assets, and the financial highlights for each of the periods indicated in the table below, and the related notes (collectively referred to as the “financial statements”). In our opinion, the financial statements present fairly, in all material respects, the financial position of the Funds as of July 31, 2024, the results of their operations, the changes in their net assets, and the financial highlights for the periods indicated in the table below, in conformity with accounting principles generally accepted in the United States of America.
| | | | | | | | | | | |
Individual Funds Constituting EA Series Trust | Statement Of Operations | Statements Of Changes In Net Assets | Financial Highlights |
| Strive 500 ETF | For the year ended July 31, 2024 | For the year ended July 31, 2024 and for the period September 14, 2022 (commencement of operations) to July 31, 2023 | For the year ended July 31, 2024 and for the period September 14, 2022 (commencement of operations) to July 31, 2023 |
| Strive Mid-Cap ETF | For the period April 10, 2024 (commencement of operations) to July 31, 2024 | For the period April 10, 2024 (commencement of operations) to July 31, 2024 | For the period April 10, 2024 (commencement of operations) to July 31, 2024 |
| Strive Small-Cap ETF, Strive 1000 Growth ETF, Strive 1000 Value ETF and Strive 1000 Dividend Growth ETF | For the year ended July 31, 2024 | For the year ended July 31, 2024 and for the period November 9, 2022 (commencement of operations) to July 31, 2023 | For the year ended July 31, 2024 and for the period November 9, 2022 (commencement of operations) to July 31, 2023 |
| Strive U.S. Energy ETF | For the year ended July 31, 2024 | For the year ended July 31, 2024 and for the period August 8, 2022 (commencement of operations) to July 31, 2023 | For the year ended July 31, 2024 and for the period August 8, 2022 (commencement of operations) to July 31, 2023 |
| Strive U.S. Semiconductor ETF | For the year ended July 31, 2024 | For the year ended July 31, 2024 and for the period October 5, 2022 (commencement of operations) to July 31, 2023 | For the year ended July 31, 2024 and for the period October 5, 2022 (commencement of operations) to July 31, 2023 |
| Strive Natural Resources and Security ETF | For the period August 30, 2023 (commencement of operations) to July 31, 2024 | For the period August 30, 2023 (commencement of operations) to July 31, 2024 | For the period August 30, 2023 (commencement of operations) to July 31, 2024 |
| Strive Emerging Markets Ex-China ETF | For the year ended July 31, 2024 | For the year ended July 31, 2024 and for the period January 30, 2023 (commencement of operations) to July 31, 2023 | For the year ended July 31, 2024 and for the period January 30, 2023 (commencement of operations) to July 31, 2023 |
REPORT OF INDEPENDENT REGISTERED PUBLIC ACCOUNTING FIRM
| | | | | | | | | | | |
Individual Funds Constituting EA Series Trust | Statement Of Operations | Statements Of Changes In Net Assets | Financial Highlights |
| Strive International Developed Markets ETF | For the period June 25, 2024 (commencement of operations) to July 31, 2024 | For the period June 25, 2024 (commencement of operations) to July 31, 2024 | For the period June 25, 2024 (commencement of operations) to July 31, 2024 |
| Strive Total Return Bond ETF and Strive Enhanced Income Short Maturity ETF | For the period August 9, 2023 (commencement of operations) to July 31, 2024 | For the period August 9, 2023 (commencement of operations) to July 31, 2024 | For the period August 9, 2023 (commencement of operations) to July 31, 2024 |
Basis for Opinion
These financial statements are the responsibility of the Funds’ management. Our responsibility is to express an opinion on the Funds’ financial statements based on our audits. We are a public accounting firm registered with the Public Company Accounting Oversight Board (United States) (“PCAOB”) and are required to be independent with respect to the Fund in accordance with the U.S. federal securities laws and the applicable rules and regulations of the Securities and Exchange Commission and the PCAOB. We have served as the auditor of one or more of the funds in the Trust since 2023.
We conducted our audits in accordance with the standards of the PCAOB. Those standards require that we plan and perform the audits to obtain reasonable assurance about whether the financial statements are free of material misstatement, whether due to error or fraud. The Funds are not required to have, nor were we engaged to perform, an audit of their internal control over financial reporting. As part of our audits, we are required to obtain an understanding of internal control over financial reporting, but not for the purpose of expressing an opinion on the effectiveness of the Funds’ internal control over financial reporting. Accordingly, we express no such opinion.
Our audits included performing procedures to assess the risks of material misstatement of the financial statements, whether due to error or fraud, and performing procedures that respond to those risks. Such procedures included examining, on a test basis, evidence regarding the amounts and disclosures in the financial statements. Our audits also included evaluating the accounting principles used and significant estimates made by management, as well as evaluating the overall presentation of the financial statements. Our procedures included confirmation of securities owned as of July 31, 2024 by correspondence with the custodian and brokers or through other appropriate auditing procedures when replies from brokers were unable to be obtained. We believe that our audits provide a reasonable basis for our opinion.
TAIT, WELLER & BAKER LLP
Philadelphia, Pennsylvania
September 27, 2024
FEDERAL TAX INFORMATION (UNAUDITED)
For the fiscal period ended July 31, 2024, certain dividends paid by the Funds may be subject to a maximum tax rate of 23.8%, as provided for by the Tax Cuts and Jobs Act of 2017. The percentage of dividends declared from ordinary income designated as qualified dividend income were as follows:
| | | | | | | | |
| STRV | | 97.28 | % |
STXM(1) | | 73.09 | % |
| STXK | | 64.62 | % |
| STXG | | 100.00 | % |
| STXV | | 99.27 | % |
| STXD | | 100.00 | % |
| DRLL | | 100.00 | % |
| SHOC | | 100.00 | % |
FTWO(2) | | 100.00 | % |
| STXE | | 48.35 | % |
STXI(3) | | 0.00 | % |
STXT(4) | | 0.00 | % |
BUXX(4) | | 0.00 | % |
For corporate shareholders, the percent of ordinary income distributions qualifying for the corporate dividends received deduction for the fiscal period ended July 31, 2024, were as follows:
| | | | | | | | |
| STRV | | 92.74 | % |
STXM(1) | | 67.19 | % |
| STXK | | 63.54 | % |
| STXG | | 100.00 | % |
| STXV | | 94.74 | % |
| STXD | | 100.00 | % |
| DRLL | | 100.00 | % |
| SHOC | | 100.00 | % |
FTWO(2) | | 100.00 | % |
| STXE | | 19.00 | % |
STXI(3) | | 0.00 | % |
STXT(4) | | 0.00 | % |
BUXX(4) | | 0.00 | % |
| | |
| (1) The Fund commenced operations on April 10, 2024. |
| (2) The Fund commenced operations on August 30, 2023. |
| (3) The Fund commenced operations on June 25, 2024. |
| (4) The Fund commenced operations on August 9, 2023. |
FEDERAL TAX INFORMATION (UNAUDITED) (CONTINUED)
The percentage of taxable ordinary income distributions that are designated as short-term capital gain distributions under the Internal Revenue Section 871 (k)(2)(C) for the fiscal period ended July 31, 2024, were as follows:
| | | | | | | | |
| STRV | | 0.00 | % |
STXM(1) | | 0.00 | % |
| STXK | | 0.00 | % |
| STXG | | 0.00 | % |
| STXV | | 0.00 | % |
| STXD | | 0.00 | % |
| DRLL | | 0.00 | % |
| SHOC | | 0.00 | % |
FTWO(2) | | 0.00 | % |
| STXE | | 0.00 | % |
STXI(3) | | 0.00 | % |
STXT(4) | | 0.00 | % |
BUXX(4) | | 0.00 | % |
| | |
| (1) The Fund commenced operations on April 10, 2024. |
| (2) The Fund commenced operations on August 30, 2023. |
| (3) The Fund commenced operations on June 25, 2024. |
| (4) The Fund commenced operations on August 9, 2023. |
FOREIGN TAX CREDIT PASS THROUGH (UNAUDITED)
Pursuant to Section 853 of the Internal Revenue code, the Funds designate the following amounts as foreign taxes paid for the fiscal period ended July 31, 2024. Foreign taxes paid for purposes of Section 853 may be less than actual foreign taxes paid for financial statement purposes.
| | | | | | | | | | | | | | | | | | | | |
| | Creditable Foreign Tax Credit Paid | | Per Share Amount | | Portion of Ordinary Income Distribution Derived From Foreign Sourced Income |
| STXE | | $ | 383,887 | | | $ | 0.11 | | | 99.85 | % |
| STXI | | 1,079 | | | 0.00 | | | 100.00 | % |
Foreign taxes paid or withheld should be included in taxable income with an offsetting deduction from gross income or as a credit for taxes paid to foreign governments.
Above figures may differ from those cited elsewhere in this report due to difference in the calculation of income and gains under GAAP purposes and Internal Revenue Service purposes.
Shareholders are strongly advised to consult their own tax advisers with respect to the tax consequences of their investments in the Funds.
Item 8. Changes in and Disagreements with Accountants for Open-End Management Investment
Companies.
There were no matters concerning changes in and disagreements with Accountants on accounting and financial disclosures required by Item 304 of Regulation S-K.
Item 9. Proxy Disclosures for Open-End Management Investment Companies.
There were no matters submitted during the period covered by the report to a vote of shareholders.
Item 10. Remuneration Paid to Directors, Officers, and Others of Open-End Management
Investment Companies
Not applicable. The Independent Trustees are paid by the Adviser out. See Note 4 to the Financial Statements under Item 7.
Item 11. Statement Regarding Basis for Approval of Investment Advisory Contracts.
Initial Approval of Strive Mid-Cap ETF (STXM)
The Board (the members of which are referred to as “Trustees”) of the EA Series Trust (the “Trust”) met in-person on March 8-9, 2024 to consider the approval of the Advisory Agreement between the Trust, on behalf of the Strive Mid-Cap ETF (the “Fund”), and Empowered Funds, LLC dba EA Advisers (the “Adviser”), as well as to consider the approval of the Sub-Advisory Agreement between the Adviser and Strive Asset Management, LLC (“Strive” or the “Sub-Adviser”), each for an initial two-year term. In accordance with Section 15(c) of the 1940 Act, the Board requested, reviewed and considered materials furnished by the Adviser and Sub-Adviser relevant to the Board’s consideration of whether to approve the Advisory Agreement and Sub-Advisory Agreement. In connection with considering approval of both the Advisory Agreement and Sub-Advisory Agreement, the Trustees who are not “interested persons” of the Trust, as that term is defined in the 1940 Act (the “Independent Trustees”), met in executive session with counsel to the Trust, who provided assistance and advice. In reaching the decision to approve both the Advisory Agreement and Sub-Advisory Agreement, the Board considered and reviewed information provided by the Adviser and Sub-Adviser, including among other things information about their respective personnel, operations, financial condition, and compliance and risk management. The Board also reviewed the proposed Advisory Agreement and Sub-Advisory Agreement. During its review and consideration, the Board focused on and reviewed the factors it deemed relevant, including:
Nature, Quality, and Extent of Services. The Board was presented with and considered information concerning the nature, quality, and extent of the overall services expected to be provided by the Adviser to the Fund. In this connection, the Board considered the responsibilities of the Adviser, recognizing that the Adviser had invested significant time and effort in structuring the Trust and the Fund, and arranging service providers for the Fund. In addition, the Board considered that the Adviser is responsible for providing investment advisory oversight services to the Fund, executing all Fund transactions, monitoring compliance with the Fund’s objectives, policies and restrictions, and carrying out directives of the Board. The Board also considered the services expected to be provided by the Adviser in the oversight of the Trust’s administrator, transfer agent and custodian. In addition, the Board evaluated the integrity of each of the Adviser’s and Strive’s personnel, the experience of the portfolio managers in managing assets and the adequacy of each of the Adviser’s and Strive’s resources to perform the services provided under the Advisory Agreement and Sub-Advisory Agreement. The Board also considered the Adviser’s ongoing oversight responsibilities vis-à-vis Strive, including its review of Strive’s proxy voting process as it relates to the Fund.
Performance. Performance information was not available for the Fund as it had not yet commenced investment operations. The Board did receive and consider the performance of the Bloomberg US 400 Index which is the index the Fund intends to track.
Comparative Fees and Expenses. In considering the advisory fees and sub-advisory fees, the Board reviewed and considered the fees in light of the nature, quality and extent of the services expected to be provided by the Adviser and Strive, respectively. With respect to the advisory fees and expense ratio for the Fund, the Board also considered the fees and expense ratio versus the fees and expenses charged to other ETFs and mutual funds. The Board also considered the allocation of fees between the Adviser and Strive.
The Board compared the Fund’s gross total expense ratio, net total expense ratio, and management fee against the average gross total expense ratio, average net total expense ratio, and average management fee for ETFs and mutual funds in the Fund’s peer group. The Fund’s gross total expense ratio (0.18%) was higher than the average for ETFs (0.13%) and was lower than the average for mutual funds (0.44%); the Fund’s net total expense ratio (0.18%) was higher than the average for ETFs (0.12%) and was lower than the average for mutual funds (0.41%); and the Fund’s management fee (0.18%) was higher than the average for ETFs (0.12%) and was lower than average for mutual funds (0.21%). The Board considered that the Fund’s fee arrangement in which the Adviser is responsible for paying most of the Fund’s operating expenses out of its resources, noting that comparisons with the Fund’s overall expense ratio may be more relevant than comparisons to management fees only. They stated that such a comparison demonstrates the Fund’s overall cost structure is within the range of expense ratios of its respective ETF and mutual fund peers.
The Board considered, among other information, the data provided in a third-party report comparing the Fund’s proposed fees to those of other funds that the third-party deemed to be comparable to the Fund. Fee information was provided in quartiles, ranging from quartile one (the least expensive) to quartile four (the most expensive). This data included a comparison of the Fund’s anticipated expense ratio against both ETFs and mutual funds. The Fund’s total expense ratio (for both gross and net) and management fee were in the following quartiles:
| | | | | | | | | | | | | | | | | | | | |
| Fund | Total Expense Ratio | Net Expense Ratio | Management Fee Only |
| ETFs | Mutual Funds | ETFs | Mutual Funds | ETFs | Mutual Funds |
STXM
| Quartile Three | Quartile Two | Quartile Three | Quartile Two | Quartile Four | Quartile Two |
The Board noted that a number of peers under consideration were large and likely enjoyed economies of scale that are not currently available to the Adviser and the Sub-Adviser. With respect to the sub-advisory fee, the Board noted that it was payable solely out of the unitary management fee payable to the Adviser. The Board considered the representations from the Adviser and the Sub-Adviser that neither firm manages any other accounts that follow a similar strategy as the Fund. The Board was agreeable to the fee levels.
Costs and Profitability. The Board further considered information regarding the potential profits, if any, that may be realized by each of the Adviser and Strive in connection with providing their respective services to the Fund. The Board reviewed estimated profit and loss information provided by each of the Adviser and the Sub-Adviser with respect to the Fund and estimated data regarding the proposed advisory and sub-advisory fees. The Board also reviewed the costs associated with the personnel, systems and equipment necessary to manage the Fund and to meet the regulatory and compliance requirements adopted by the SEC and other regulatory bodies. The Board also considered other expenses of the Fund that the Adviser would pay in accordance with the Advisory Agreement. The Board took into consideration that the Adviser agreed to pay most all the expenses incurred by the Fund except for the fees paid to the Adviser pursuant to the Advisory Agreement, payments under any distribution plan adopted pursuant to Rule 12b-1, brokerage expenses, acquired fund fees and expenses, taxes, interest (including borrowing costs), the fees and expenses associated with the Fund’s securities lending program (if applicable), litigation expenses and other non-routine or extraordinary expenses. The Board also considered the respective financial obligations of the Adviser, as well as Strive, who serves as the sponsor of the Fund. The Board also considered the Fund’s projected asset totals over the first year of operations, noting that based on the projected asset totals the Adviser and Sub-Adviser will not be profitable as it relates to their respective advisory fee arrangements. The Board discussed the financial condition of the Sub-Adviser, noting that the Sub-Adviser has sufficient capital to maintain its commitment to the Fund.
Other Benefits. The Board further considered the extent to which the Adviser or Strive might derive ancillary benefits from the Fund’s operations. For example, the Adviser may engage in soft dollar transactions in the future, although it did not currently plan to do so. In addition, the Adviser may benefit from continued growth in the Trust by potentially negotiating better fee arrangements with key vendors serving the Fund and other series in the Trust.
Economies of Scale. The Board also considered whether economies of scale would be realized by the Fund as its assets grow larger, including the extent to which this is reflected in the level of fees to be charged. The Board also noted that the proposed advisory and sub-advisory fees do not include breakpoints but concluded that it was premature to meaningfully evaluate potential economies of scale given that the Fund is new.
Conclusion. No single factor was determinative of the Board’s decision to approve the Advisory Agreement and Sub-Advisory Agreement; rather, the Board based its determination on the total mix of information available to it. Based on a consideration of all the factors in their totality, the Board, including the Independent Trustees, unanimously determined that the Advisory Agreement and Sub-Advisory Agreement, including the compensation payable under each Agreement, were fair and reasonable to the Fund. The Board, including the Independent Trustees, unanimously determined that the approval of each of the Advisory Agreement and the Sub-Advisory Agreement was in the best interests of the Fund and its shareholders.
Strive Developed Markets ETF (now known as Strive International Markets ETF) (STXI)
The Board (the members of which are referred to as “Trustees”) of the EA Series Trust (the “Trust”) met virtually on March 27, 2023 to consider the approval of the Advisory Agreement between the Trust, on behalf of the Strive Developed Markets ETF (the “Fund”), and Empowered Funds, LLC dba EA Advisers (the “Adviser”), as well as to consider the approval of the Sub-Advisory between the Adviser and Strive Asset Management, LLC (the “Sub-Adviser”), each for an initial two-year term. In accordance with Section 15(c) of the 1940 Act, the Board requested, reviewed and considered materials furnished by the Adviser and the Sub-Adviser relevant to the Board’s consideration of whether to approve the Advisory Agreement and Sub-Advisory Agreement. In connection with considering approval of both the Advisory Agreement and Sub-Advisory Agreement, the Trustees who are not “interested persons” of the Trust, as that term is defined in the 1940 Act (the “Independent Trustees”), met in executive session with counsel to the Trust, who provided assistance and advice. In reaching the decision to approve both the Advisory Agreement and Sub-Advisory Agreement, the Board considered and reviewed information provided by the Adviser and the Sub-Adviser, including among other things information about their respective personnel, operations, financial condition, and compliance and risk management. The Board also reviewed the proposed Advisory Agreement and Sub-Advisory Agreement. During its review and consideration, the Board focused on and reviewed the factors it deemed relevant, including:
Nature, Quality and Extent of Services. The Board was presented with and considered information concerning the nature, quality and extent of the overall services expected to be provided by the Adviser to the Fund. In this connection, the Board considered the responsibilities of the Adviser, recognizing that the Adviser had invested significant time and effort in structuring the Trust and the Fund, as well as arranging and overseeing service providers for the Fund. In addition, the Board considered that the Adviser is responsible for providing investment advisory oversight services to the Fund, executing all Fund transactions, monitoring compliance with the Fund’s objectives, policies and restrictions, and carrying out directives of the Board. The Board also considered the services expected to be provided by the Adviser in the oversight of the Trust’s administrator, transfer agent and custodian. In addition, the Board evaluated the integrity of each of the Adviser’s and Sub-Adviser’s personnel, the experience of the portfolio manager in managing assets, particularly given the Fund’s index strategy, and the adequacy of each of the Adviser’s and Sub-Adviser’s resources. In this regard, the Board considered additional investments made by the Adviser in enhancing its services both from a personnel and technology perspective, which are expected to create efficiencies and enhance its overall oversight of the Fund and the Trust. The Board also considered the Adviser’s ongoing oversight responsibilities vis-à-vis the Sub-Adviser, to include the augmented resources mentioned above. The Board also considered that the Sub-Adviser would provide its services to the Fund as a discretionary sub-adviser, and that the Adviser will be responsible for all trading and compliance for the Fund. The Board also considered that the Fund is passive and tracks a third-party index.
Performance. Performance information was not available for the Fund as it had not yet commenced operations.
Comparative Fees and Expenses. In considering the advisory fees and sub-advisory fees, the Board reviewed and considered the fees in light of the nature, quality and extent of the services expected to be provided by the Adviser and Sub-Adviser, respectively. With respect to the advisory fees and expense ratios for the Fund, the Board also considered the fees and expense ratios versus the fees and expenses charged to other exchange-traded funds and mutual funds. The Board noted that there were several comparable funds available for comparison, with the fees charged within a reasonable range as compared to the peers, although the fees were on the higher end of the spectrum. Nevertheless, the Board noted that certain of the peers under consideration were quite large and likely enjoyed material economies of scale that are not currently available to the Adviser and Sub-Adviser for the Fund. With respect to the sub-advisory fees, the Board noted that they were payable solely out of the unitary management fee payable to the Adviser. With respect to the sub-advisory fees, the Board noted that they were payable solely out of the unitary management fee payable to the Adviser. The Board considered, among other information, the data provided in the third-party fee analyses. Fee information was provided in quartiles, ranging from quartile one (the least expensive) to quartile four (the most expensive).
The Board considered the third-party peer group analyses that included comparison of the Fund’s anticipated expense ratio against funds that were both exchanged-traded funds and mutual funds. The Fund’s total expense ratio (for both gross and net) and management fee were in the following quartiles:
| | | | | | | | | | | | | | | | | | | | |
| Fund | Total Expense Ratio | Net Expense Ratio | Management Fee Only |
| ETFs | Mutual Funds | ETFs | Mutual Funds | ETFs | Mutual Funds |
| Strive Developed Markets ETF | Highest Quartile | 2nd Highest Quartile | Highest Quartile | 2nd Highest Quartile | Highest Quartile | 2nd Highest Quartile |
The Board was agreeable to the fee levels.
Costs and Profitability. The Board further considered information regarding the potential profits, if any, that may be realized by each of the Adviser and the Sub-Adviser in connection with providing their respective services to the Fund. The Board reviewed estimated profit and loss information provided by the Adviser with respect to the Fund and estimated data regarding the proposed sub-advisory fee. The Board also reviewed the costs associated with the personnel, systems and equipment necessary to manage the Fund and to meet the regulatory and compliance requirements adopted by the SEC and other regulatory bodies. The Board also considered other expenses the Adviser would pay in accordance with the Advisory Agreement. The Board took into consideration that the Adviser agreed to pay all expenses incurred by the Fund except for the fees paid to the Adviser pursuant to the Advisory Agreement, payments under any distribution plan adopted pursuant to Rule 12b-1, brokerage expenses, acquired fund fees and expenses, taxes, interest (including borrowing costs), litigation expenses and other non-routine or extraordinary expenses. The Board also considered the respective financial obligations of the Adviser and the Sub-Adviser, as the sponsor of the Fund. They also considered the Fund’s projected asset totals over the first two years of operations.
Other Benefits. The Board further considered the extent to which the Adviser or Sub-Adviser might derive ancillary benefits from the Fund’s operations. For example, the Adviser may engage in soft dollar transactions in the future, although it did not currently plan to do so. In addition, the Adviser may benefit from continued growth in the Trust by potentially negotiating better fee arrangements with key vendors serving the Fund.
Economies of Scale. The Board also considered whether economies of scale would be realized by the Fund as its assets grow larger, including the extent to which this is reflected in the level of fees to be charged. The Board also noted that the proposed advisory and sub-advisory fees do not include breakpoints but concluded that it was premature to meaningfully evaluate potential economies of scale prior to the launch of the Fund.
Conclusion. No single factor was determinative of the Board’s decision to approve each of the Advisory Agreement and Sub-Advisory Agreement; rather, the Board based its determination on the total mix of information available to it. Based on a consideration of all the factors in their totality, the Board, including a majority of the Independent Trustees, approved each of the Advisory Agreement and Sub-Advisory Agreement, including the compensation payable under each Agreement.
Strive 1000 Dividend Growth ETF (STXD), Strive 1000 Growth ETF (STXG), Strive 1000 Value ETF (STXV), Strive 500 ETF (STRV), Strive Emerging Markets Ex-China ETF (STXE), Strive Enhanced Income Short Maturity ETF (BUXX), Strive FAANG 2.0 ETF (FTWO), Strive International Developed Markets ETF (STXI), Strive Small-Cap ETF (STXK), Strive Total Return Bond ETF (STXT), Strive U.S. Energy ETF (DRLL), and Strive U.S. Semiconductor ETF (SHOC)
The Board (the members of which are referred to as “Trustees”) of the EA Series Trust (the “Trust”) met in-person on June 7, 2024 to consider the approval of the continuation of the Advisory Agreement between the Trust, on behalf the Strive 500 ETF (“STRV”), the Strive 1000 Dividend Growth ETF (“STXD”), the Strive 1000 Growth ETF (“STXG”), the Strive 1000 Value ETF (“STXV”), the Strive International Developed Markets ETF (“STXI”), the Strive Emerging Markets Ex-China ETF (“STXE”), the Strive Small-Cap ETF (“STXK”), the Strive U.S. Energy ETF (“DRLL”), the Strive U.S. Semiconductor ETF (“SHOC”), the Strive Enhanced Income Short Maturity ETF (“BUXX”), the Strive Total Return Bond ETF (“STXT”), and the Strive FAANG 2.0 ETF (“FTWO”), (each a “Fund” and collectively, the “Funds”), and Empowered Funds, LLC (the “Adviser”), as well as to consider the approval of the continuation of the Sub-Advisory Agreement between the Adviser and Strive Asset Management, LLC (the “Sub-Adviser), each for an additional annual term. In addition, the Board considered the approval of changing the tracking index of the Strive Developed Markets ETF to the Bloomberg Developed Markets ex US
Large & Mid Cap Total Return Index, and related changes including the Fund’s name to the Strive International Markets ETF and investment objective prior to the Fund’s launch.
In accordance with Section 15(c) of the 1940 Act, the Board requested, reviewed, and considered materials furnished by the Adviser and Sub-Adviser relevant to the Board’s consideration of whether to approve the continuation of the Advisory Agreement and Sub-Advisory Agreement. In connection with considering the approval of both the Advisory Agreement and Sub-Advisory Agreement, the Trustees who are not “interested persons” of the Trust, as that term is defined in the 1940 Act (the “Independent Trustees”), met in executive session with counsel to the Trust, who provided assistance and advice. In reaching the decision to approve both the Advisory Agreement and Sub-Advisory Agreement, the Board considered and reviewed information provided by the Adviser and Sub-Adviser at this meeting and throughout the year, including among other things information about their respective personnel, operations, financial condition, and compliance and risk management. The Board also reviewed the Advisory Agreement and Sub-Advisory Agreement. During its review and consideration, the Board focused on and reviewed the factors it deemed relevant, including:
Nature, Quality, and Extent of Services. The Board was presented with and considered information concerning the nature, quality, and extent of the overall services provided by the Adviser to the Fund. In this connection, the Board considered the responsibilities of the Adviser, recognizing that the Adviser had invested significant time and effort in structuring the Trust and the Funds, as well as arranging service providers for the Funds. In addition, the Board considered that the Adviser is responsible for providing investment advisory oversight services to the Funds, executing all Fund transactions, monitoring compliance with the Funds’ objectives, policies and restrictions, and carrying out directives of the Board. The Board also considered the services provided by the Adviser in the oversight of the Trust’s administrator, transfer agent, and custodian. In addition, the Board evaluated the integrity of each of the Adviser’s and Sub-Adviser’s personnel, the experience of the portfolio managers in managing assets, and the adequacy of each of the Adviser’s and the Sub-Adviser’s resources to perform the services provided under the Advisory Agreement and Sub-Advisory Agreement. They considered the Sub-Adviser’s hiring of an experienced compliance officer and their ongoing use of a consulting firm to provide support and services. The Board further discussed the enhancements to the Sub-Adviser’s compliance program and its willingness to add resources to its compliance, operations and portfolio management teams. The Board also considered the Adviser’s ongoing oversight responsibilities vis-à-vis the Sub-Adviser, including its review of the Sub-Adviser’s proxy voting process as it relates to the Funds. The Board also considered that the Sub-Adviser provides its services to the Funds as a discretionary investment sub-adviser.
Performance. The Board considered the relative performance information for the Funds. The Board utilized performance reports provided to the Board in anticipation of the meeting, as well as performance reports provided at regular Board meetings for the Funds. The Board considered the third-party peer group analysis comparing each Fund’s performance to the performance of other funds that the third-party deemed to be comparable to the respective Fund. It was determined that the Adviser and the Sub-Adviser have consistently managed the Funds’ portfolios in accordance with their stated investment objective and strategies.
For STRV, the Board considered STRV’s performance against its tracking index and its peer group for various periods ended March 31, 2024. The Board noted that STRV performed in line with its tracking index. The Board further noted that STRV underperformed relative to the average total return of its ETF peers by 17 (0.17%) basis points but outperformed its mutual fund peers for the by 22 (0.22%) basis points one-year period ended March 31, 2024. The Board concluded that STRV’s performance was reasonable.
For STXD, the Board considered STXD’s performance against its tracking index and its peer group for various periods ended March 31, 2024. The Board noted that STXD performed in line with its tracking index. The Board further noted that STXD outperformed its ETF and mutual fund peers by 440 (4.40%) and 227 (2.27%) basis points, respectively for the one-year period ended March 31, 2024. The Board concluded that STXD’s performance was reasonable.
For STXG, the Board considered STXG’s performance against its tracking index and its peer group for various periods ended March 31, 2024. The Board noted that STXG performed in line with its tracking index. The Board further noted that STXG outperformed relative to the average total return of its ETF peers and its mutual fund peers by 175 (1.75%) and 354 (3.54%) basis points, respectively, for the one-year period ended March 31, 2024. The Board concluded that STXG’s performance was reasonable.
For the STXV, the Board considered STXV’s performance against its tracking index and its peer group for various periods ended March 31, 2024. The Board noted that STXV’s performance varied from its tracking index, noting that this was the
result of the Sub-Adviser using a sampling approach to track the index. The Board further noted that STXV underperformed relative to the average total return of its ETF and mutual fund peers by 25 (0.25%) and 276 (2.76%) basis points, respectively, for the one-year period ended March 31, 2024. The Board concluded that STXV’s performance was reasonable.
For STXI, the Board noted that STXI’s had not begun operations, so it does not have a performance record.
For STXE, the Board considered STXE’s performance against its tracking index and its peer group for various periods ended March 31, 2024. The Board acknowledged STXE’s performance varied from its tracking index, noting the Sub-Adviser’s explanation that it is employing a sampling approach to track the index in order to cut down on transactional costs associated with investing in certain components of the index. The Board further noted that STXE underperformed relative to the average total return of its ETF peers by 50 (0.50%) basis points but outperformed its mutual fund peers by 28 (0.28%) basis points for the one-year period ended March 31, 2024. The Board concluded that STXE’s performance was reasonable.
For STXK, the Board considered STXK’s performance against its tracking index and its peer group for various periods ended March 31, 2024. The Board noted that STXK performed in line with its tracking index. The Board further noted that STXK outperformed relative to the average total return of its ETF peers and its mutual fund peers by 52 (0.52%) and 176 (1.76%) basis points, respectively, for the one-year period ended March 31, 2024. The Board concluded that STXK’s performance was reasonable.
For DRLL, the Board considered DRLL’s performance against its tracking index and its peer group for various periods ended March 31, 2024. The Board acknowledged that DRLL’s performance varied from its tracking index, noting that it was primarily the result of DRLL recently changing its tracking index. The Board further noted that DRLL underperformed relative to the average total return of its ETF peers and its mutual fund peers by 42 (0.42%) and 603 (6.03%) basis points, respectively, for the one-year period ended March 31, 2024. The Board concluded that DRLL’s performance was reasonable.
For SHOC, the Board considered SHOC’s performance against its tracking index and its peer group for various periods ended March 31, 2024. The Board acknowledged that SHOC’s performance varied from its tracking index, noting that it was primarily the result of SHOC recently changing its tracking index. The Board further noted that SHOC outperformed relative to the average total return of its ETF peers and its mutual fund peers by 522 (5.22%) and 1158 (11.58%) basis points, respectively, for the one-year period ended March 31, 2024. The Board concluded that SHOC’s performance was reasonable.
For BUXX, the Board noted that BUXX is an actively managed fund that started operations in August 2023, so it does not have a full year of performance to review. The Board further noted that BUXX’s short-term performance was in line with its benchmark index. The Board concluded that BUXX’s performance was reasonable.
For the Strive Total Return Bond ETF (“STXT”), the Board noted that STXT is an actively managed fund that started operations in August 2023, so it does not have a full year of performance to review. The Board further noted that STXT’s short-term performance was in line with its benchmark index. The Board concluded that STXT’s performance was reasonable.
For the Strive FAANG 2.0 ETF (“FTWO”), the Board noted that FTWO started operations in August 2023, so it does not have a full year of performance to review. The Board further noted that FTWO’s short-term performance was in line with its tracking index. The Board concluded that FTWO’s performance was reasonable.
Comparative Fees and Expenses. In considering the advisory fees and sub-advisory fees, the Board reviewed and considered the fees in light of the nature, quality, and extent of the services being provided by the Adviser and the Sub-Adviser. With respect to the advisory fees and expense ratio for each Fund, the Board also considered the fees and expense ratio versus the fees and expenses charged to other ETFs and mutual funds. The Board also considered the allocation of fees between the Adviser the Sub-Adviser.
The Board considered the third-party peer group analysis that included a comparison of each Fund’s gross total expense ratio, net total expense ratio, and management fee against the average gross total expense ratio, average net total expense ratio, and average management fee for ETFs and mutual funds in the Fund’s respective peer group.
STRV’s gross expense ratio was below the average gross expense ratio of its ETF and mutual fund peers. STRV’s net expense ratio was above the average net expense ratio of its ETF peers but below that of its mutual fund peers. STRV’s management fee was below the average management fee charged by its ETF and mutual fund peers.
STXD’s expense ratios (gross and net fees) were below the average expense ratios (gross and net) of its ETF and mutual fund peers. STXD’s management fee was above the average management fee charged by its ETF peers but below the average management fee charged by its mutual fund peers.
STXG’s gross and net expense ratios were above the average expense ratios (gross and net) of its ETF peers but below that of its mutual fund peers. STXG’s management fee was above the average management fee charged by its ETF peers but below that charged by its mutual fund peers.
STXV’s gross and net expense ratios were above the average expense ratios (gross and net) of its ETF peers but below that of its mutual fund peers. STXV’s management fee was above the average management fee charged by its ETF peers but below that charged by its mutual fund peers.
STXI’s gross and net expense ratios were above the average expense ratios (gross and net) of its ETF peers but below that of its mutual fund peers. STXI’s management fee was above the average management fee charged by its ETF peers but below that charged by its mutual fund peers.
STXE’s expense ratios (gross and net fees) were below the average expense ratios (gross and net) of its ETF and mutual fund peers. STXE’s management fee was below the average management fee charged by its ETF peers and its mutual fund peers.
STXK’s gross and net expense ratios were above the average expense ratios (gross and net) of its ETF peers but below that of its mutual fund peers. STXK’s management fee was above the average management fee charged by its ETF peers but below that charged by its mutual fund peers.
DRLL’s gross and net expense ratios were above the average expense ratios (gross and net) of its ETF peers but below that of its mutual fund peers. DRLL’s management fee was above the average management fee charged by its ETF peers but below that charged by its mutual fund peers.
SHOC’s gross and net expense ratios were above the average expense ratios (gross and net) of its ETF peers but below that of its mutual fund peers. SHOC’s management fee was above the average management fee charged by its ETF peers but below that charged by its mutual fund peers.
BUXX’s gross and net expense ratios were above the average expense ratios (gross and net) of its ETF peers but below that of its mutual fund peers. BUXX’s management fee was above the average management fee charged by its ETF peers but below that charged by its mutual fund peers.
STXT’s gross and net expense ratios were above the average expense ratios (gross and net) of its ETF peers but below that of its mutual fund peers. STXT’s management fee was above the average management fee charged by its ETF peers and mutual fund peers.
FTWO’s expense ratios (gross and net fees) were below the average expense ratios (gross and net) of its ETF and mutual fund peers. FTWO’s management fee was below the average management fee charged by its ETF peers and its mutual fund peers.
The Board considered, among other information, the data provided in the third-party report comparing the Fund’s fees to those of other funds that the third-party deemed to be comparable to the Fund. Fee information was provided in quartiles, ranging from quartile one (the least expensive) to quartile four (the most expensive). This data included a comparison of the Fund’s expense ratio against both ETFs and mutual funds. The Fund’s total expense ratio (for both gross and net) and management fee were in the following quartiles:
| | | | | | | | | | | | | | | | | | | | |
| Fund | Total Expense Ratio | Net Expense Ratio | Management Fee Only |
| ETFs | Mutual Funds | ETFs | Mutual Funds | ETFs | Mutual Funds |
| STRV | Quartile 3 | Quartile 2 | Quartile 4 | Quartile 2 | Quartile 4 | Quartile 2 |
| STXD | Quartile 2 | Quartile 1 | Quartile 2 | Quartile 1 | Quartile 3 | Quartile 1 |
| STXG | Quartile 3 | Quartile 1 | Quartile 3 | Quartile 1 | Quartile 3 | Quartile 1 |
| STXV | Quartile 3 | Quartile 1 | Quartile 3 | Quartile 1 | Quartile 3 | Quartile 1 |
| STXI | Quartile 4 | Quartile 2 | Quartile 4 | Quartile 2 | Quartile 4 | Quartile 3 |
| STXE | Quartile 1 | Quartile 1 | Quartile 2 | Quartile 1 | Quartile 1 | Quartile 1 |
| | | | | | | | | | | | | | | | | | | | |
| STXK | Quartile 3 | Quartile 1 | Quartile 3 | Quartile 1 | Quartile 3 | Quartile 2 |
| DRLL | Quartile 4 | Quartile 1 | Quartile 4 | Quartile 1 | Quartile 4 | Quartile 1 |
| SHOC | Quartile 3 | Quartile 1 | Quartile 3 | Quartile 1 | Quartile 3 | Quartile 1 |
| BUXX | Quartile 4 | Quartile 1 | Quartile 4 | Quartile 2 | Quartile 4 | Quartile 3 |
| STXT | Quartile 3 | Quartile 2 | Quartile 4 | Quartile 2 | Quartile 3 | Quartile 4 |
| FTWO | Quartile 2 | Quartile 1 | Quartile 2 | Quartile 1 | Quartile 2 | Quartile 1 |
With respect to the sub-advisory fee, the Board noted that it was payable solely out of the unitary management fee payable to the Adviser. The Board considered the representations from the Adviser and the Sub-Adviser that neither firm manages any other accounts that follow a similar strategy to the Fund. The Board was agreeable to the fee levels.
Costs and Profitability. The Board further considered information regarding the potential profits, if any, that may be realized by each of the Adviser and the Sub-Adviser in connection with providing their respective services to the Fund. The Board reviewed the profit and loss information provided by the Adviser with respect to the Fund, noting that STXE, DRLL, SHOC and STXT are profitable to the Adviser at this time while the remaining Funds are not. The Board also reviewed the same type of information provided by the Sub-Adviser that showed it was not profitable at this time. They also considered the information provided by the Sub-Adviser that provided an estimate of profitability (or lack of) for each Fund over the next two years. The Sub-Adviser estimated that only DRLL would be profitable to the Sub-Adviser in year two of the estimate. The Board discussed the financial condition of the Sub-Adviser, noting that the Sub-Adviser has sufficient capital to maintain its commitment to the Funds for an additional annual period. The Board also reviewed the costs associated with the personnel, systems, and equipment necessary to manage the Funds and to meet the regulatory and compliance requirements adopted by the SEC and other regulatory bodies. The Board also considered other expenses of the Funds the Adviser would pay in accordance with the Advisory Agreement. The Board took into consideration that the Adviser agreed to pay all expenses incurred by the Funds except for the fees paid to the Adviser pursuant to the Advisory Agreement, payments under any distribution plan adopted pursuant to Rule 12b-1, brokerage expenses, acquired fund fees and expenses, taxes, interest (including borrowing costs), the fees and expenses associated with a Fund’s securities lending program, litigation expenses and other non-routine or extraordinary expenses. The Board also considered the respective financial obligations of the Adviser, as well as the Sub-Adviser, who serves as the sponsor of the Funds.
Other Benefits. The Board further considered the extent to which the Adviser or the Sub-Adviser might derive ancillary benefits from the Funds’ operations. For example, the Adviser may engage in soft dollar transactions in the future, although it does not currently plan to do so. In addition, the Adviser may benefit from continued growth in the Trust by potentially negotiating better fee arrangements with key vendors serving the Funds and other series in the Trust.
Economies of Scale. The Board also considered whether economies of scale would be realized by each Fund as its assets grow larger, including the extent to which this is reflected in the level of fees to be charged. The Board also noted that the advisory and sub-advisory fees do not include breakpoints but concluded that it was premature to meaningfully evaluate potential economies of scale given each Fund’s current assets.
Conclusion. No single factor was determinative of the Board’s decision to approve the continuation of the Advisory Agreement and Sub-Advisory Agreement for an additional annual term; rather, the Board based its determination on the total mix of information available to it. Based on a consideration of all the factors in their totality, the Board, including the Independent Trustees, unanimously determined that the Advisory Agreement and Sub-Advisory Agreement, including the compensation payable under each Agreement, were fair and reasonable to the Funds. The Board, including the Independent Trustees, unanimously determined that the approval of the continuation of each of the Advisory Agreement and the Sub-Advisory Agreement was in the best interests of the Funds and their shareholders.
Item 12. Disclosure of Proxy Voting Policies and Procedures for Closed-End Management Investment Companies.
Not applicable to open-end investment companies.
Item 13. Portfolio Managers of Closed-End Management Investment Companies.
Not applicable to open-end investment companies.
Item 14. Purchases of Equity Securities by Closed-End Management Investment Company and Affiliated Purchasers.
Not applicable to open-end investment companies.
Item 15. Submission of Matters to a Vote of Security Holders.
There have been no material changes to the procedures by which shareholders may recommend nominees to the registrant’s board of trustees.
Item 16. Controls and Procedures.
(a) The Registrant’s President (principal executive officer) and Treasurer (principal financial officer) have reviewed the Registrant's disclosure controls and procedures (as defined in Rule 30a-3(c) under the Investment Company Act of 1940 (the “Act”)) as of a date within 90 days of the filing of this report, as required by Rule 30a-3(b) under the Act and Rules 13a-15(b) or 15d‑15(b) under the Securities Exchange Act of 1934. Based on their review, such officers have concluded that the disclosure controls and procedures are effective in ensuring that information required to be disclosed in this report is appropriately recorded, processed, summarized and reported and made known to them by others within the Registrant and by the Registrant’s service provider.
(b) There were no changes in the Registrant's internal control over financial reporting (as defined in Rule 30a-3(d) under the Act) that occurred during the period covered by this report that have materially affected, or are reasonably likely to materially affect, the Registrant's internal control over financial reporting.
Item 17. Disclosure of Securities Lending Activities for Closed-End Management Investment Companies
Not applicable to open-end investment companies.
Item 18. Recovery of Erroneously Awarded Compensation.
(a) Not applicable.
(b) Not applicable.
Item 19. Exhibits.
SIGNATURES
Pursuant to the requirements of the Securities Exchange Act of 1934 and the Investment Company Act of 1940, the registrant has duly caused this report to be signed on its behalf by the undersigned, thereunto duly authorized.
| | | | | | | | |
| (Registrant) | EA Series Trust | |
| | |
| By (Signature and Title) | /s/ Michael D. Barolsky | |
| | Michael D. Barolsky, President (principal executive officer) | |
| | |
| Date: | October 4, 2024 | |
Pursuant to the requirements of the Securities Exchange Act of 1934 and the Investment Company Act of 1940, this report has been signed below by the following persons on behalf of the registrant and in the capacities and on the dates indicated.
| | | | | | | | |
| By (Signature and Title) | /s/ Michael D. Barolsky | |
| | Michael D. Barolsky, President (principal executive officer) | |
| | | |
| Date: | October 4, 2024 | |
| | | |
| By (Signature and Title) | /s/ Sean Hegarty | |
| | Sean Hegarty, Treasurer (principal financial officer) | |
| | | |
| Date: | October 4, 2024 | |