UNITED STATES
SECURITIES AND EXCHANGE COMMISSION
Washington, D.C. 20549
FORM N-CSR
CERTIFIED SHAREHOLDER REPORT OF REGISTERED
MANAGEMENT INVESTMENT COMPANIES
Investment Company Act file number 811-22961
EA Series Trust
(Exact name of registrant as specified in charter)
19 E. Eagle Road
Havertown, PA 19083
(Address of principal executive offices) (Zip code)
19 E. Eagle Road
Havertown, PA 19083
(Name and address of agent for service)
(215) 330-4476
Registrant’s telephone number, including area code
Date of fiscal year end: September 30, 2024
Date of reporting period: September 30, 2024
Item 1. Report to Stockholders.
(a)
| | | | | | | | |
| Alpha Architect U.S. Quantitative Value ETF Ticker: QVAL Listed on: The Nasdaq Stock Market | September 30, 2024 Annual Shareholder Report https://funds.alphaarchitect.com/qval |
|
| | | | | | | | | | | |
| This annual shareholder report contains important information about the Alpha Architect U.S. Quantitative Value ETF (the “Fund”) for the period of October 1, 2023 to September 30, 2024 (the “Period”). You can find additional information about the Fund at https://funds.alphaarchitect.com/qval. You can also request this information by contacting us at (215) 330-4476. This report describes changes to the Fund that occurred during the Period. |
| | | | | | | | | | | |
WHAT WERE THE FUND COSTS FOR THE PERIOD?
(based on a hypothetical $10,000 investment) |
| COST OF $10,000 INVESTMENT | COST PAID AS A PERCENTAGE OF $10,000 INVESTMENT |
| $36 | 0.32% |
| | | | | | | | | | | |
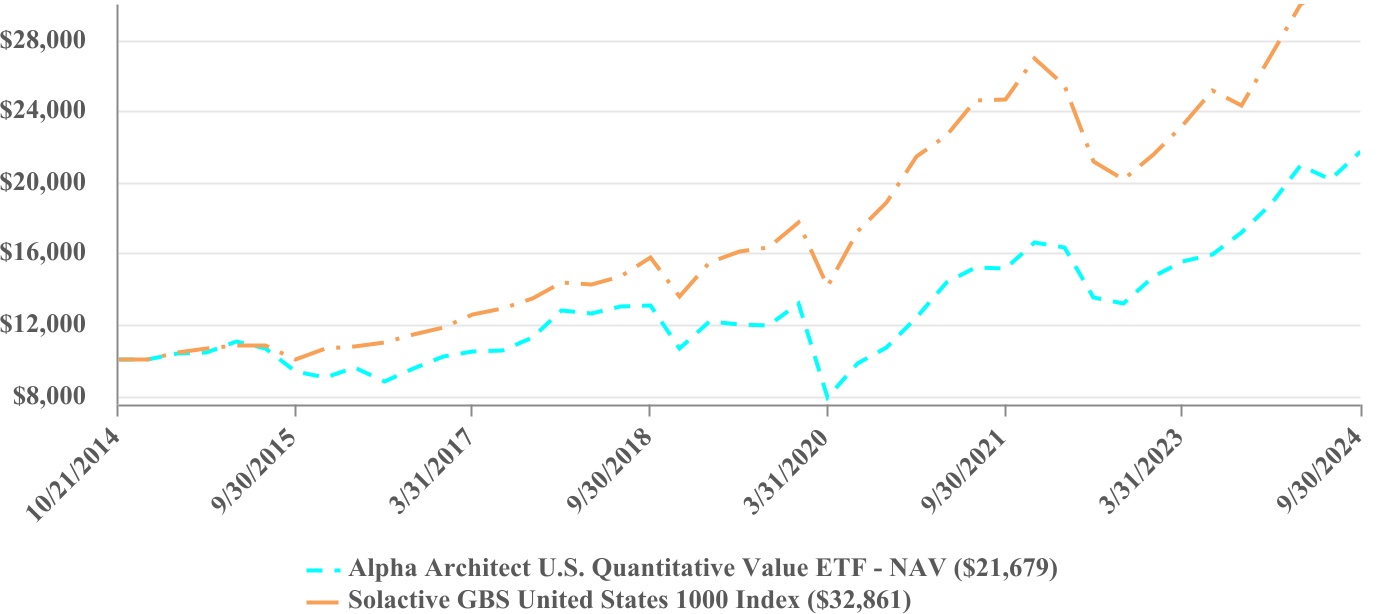
| PERFORMANCE OF A HYPOTHETICAL $10,000 INVESTMENT |
| | | | | | | | | | | | | | | | | | | | |
| AVERAGE ANNUAL TOTAL RETURNS |
| | 1 Year | | 5 Year | | Since Inception (10/21/2014) |
| Alpha Architect U.S. Quantitative Value ETF - NAV | | 26.33% | | 12.71% | | 8.09% |
| Solactive GBS United States 1000 Index | | 35.20% | | 15.06% | | 12.71% |
| | | | | | |
The Fund’s past performance is not a good predictor of how the Fund will perform in the future. The graph and table do not reflect the deduction of taxes that a shareholder would pay on Fund distributions or redemption of Fund shares. Visit https://funds.alphaarchitect.com/qval for more recent performance information. |
| | | | | | | | | | | |
| WHAT FACTORS INFLUENCED PERFORMANCE FOR THE PERIOD? |
The Fund returned 26.53% (NAV) for the Period vs. 35.20% for the Solactive GBS United States 1000 Index. During the Period, markets reacted positively to strong corporate earnings, resilient economic conditions, and Federal Reserve policy, with larger-cap stocks leading performance. The Fund’s tilt toward deeper value stocks as measured by EBIT/TEV contributed negatively to returns relative to the benchmark.
Annual Shareholder Report: September 30, 2024
| | | | | | | | |
| Alpha Architect U.S. Quantitative Value ETF Ticker: QVAL Listed on: The Nasdaq Stock Market | September 30, 2024 Annual Shareholder Report https://funds.alphaarchitect.com/qval |
|
| | | | | | | | | | | | | | | | | | | | |
| KEY FUND STATISTICS (as of Period End) |
| Net Assets | | $376,221,478 | | Portfolio Turnover Rate* | | 223% |
| # of Portfolio Holdings | | 51 | | Advisory Fees Paid | | $1,023,524 |
| *Excludes impact of in-kind transactions. |
| | | | | | |
| | | | | |
SECTOR WEIGHTING
(as a % of Net Assets) |
| Consumer Discretionary | 26.9% |
| Industrials | 23.0% |
| Energy | 16.3% |
| Communication Services | 10.1% |
| Health Care | 9.6% |
| Materials | 6.1% |
| Information Technology | 4.0% |
| Consumer Staples | 3.7% |
| Cash & Cash Equivalents | 0.2% |
| | | | | |
TOP 10 HOLDINGS
(as a % of Net Assets) |
| Powell Industries, Inc. | 2.6% |
| Signet Jewelers Ltd. | 2.4% |
| Delta Air Lines, Inc. | 2.3% |
| Williams-Sonoma, Inc. | 2.3% |
| Freeport-McMoRan, Inc. | 2.2% |
| Tapestry, Inc. | 2.2% |
| Caterpillar, Inc. | 2.1% |
| Jabil, Inc. | 2.1% |
| Ulta Beauty, Inc. | 2.1% |
| CVS Health Corp. | 2.1% |
Material Fund Changes
This is a summary of certain changes to the Fund since October 1, 2023. For more complete information, you may review the Fund’s next prospectus, which we expect to be available by January 31, 2025, at funds.alphaarchitect.com/qval or by calling (215) 330-4476.
Effective June 21, 2024, the Fund’s Board of Trustees approved Alpha Architect, LLC to serve as the Fund’s sub-adviser.
Availability of Additional Information
For additional information about the Fund, including its prospectus, financial information, holdings, and proxy information, visit https://funds.alphaarchitect.com/qval. You can also request information by calling (215) 330-4476.
Householding
Householding is an option available to certain investors of the Fund. Householding is a method of delivery, based on the preference of the individual investor, in which a single copy of certain shareholder documents can be delivered to investors who share the same address, even if their accounts are registered under different names. Householding for the Fund is available through certain broker-dealers. If you are interested in enrolling in householding and receiving a single copy of prospectuses and other shareholder documents or you are currently enrolled in householding and wish to change your householding status, please contact your broker-dealer.
Annual Shareholder Report: September 30, 2024
| | | | | | | | |
| Alpha Architect International Quantitative Value ETF Ticker: IVAL Listed on: The Nasdaq Stock Market | September 30, 2024 Annual Shareholder Report https://funds.alphaarchitect.com/ival |
|
| | | | | | | | | | | |
| This annual shareholder report contains important information about the Alpha Architect International Quantitative Value ETF (the “Fund”) for the period of October 1, 2023 to September 30, 2024 (the “Period”). You can find additional information about the Fund at https://funds.alphaarchitect.com/ival. You can also request this information by contacting us at (215) 330-4476. This report describes changes to the Fund that occurred during the Period. |
| | | | | | | | | | | |
WHAT WERE THE FUND COSTS FOR THE PERIOD?
(based on a hypothetical $10,000 investment) |
| COST OF $10,000 INVESTMENT | COST PAID AS A PERCENTAGE OF $10,000 INVESTMENT |
| $45 | 0.42% |
| | | | | | | | | | | |
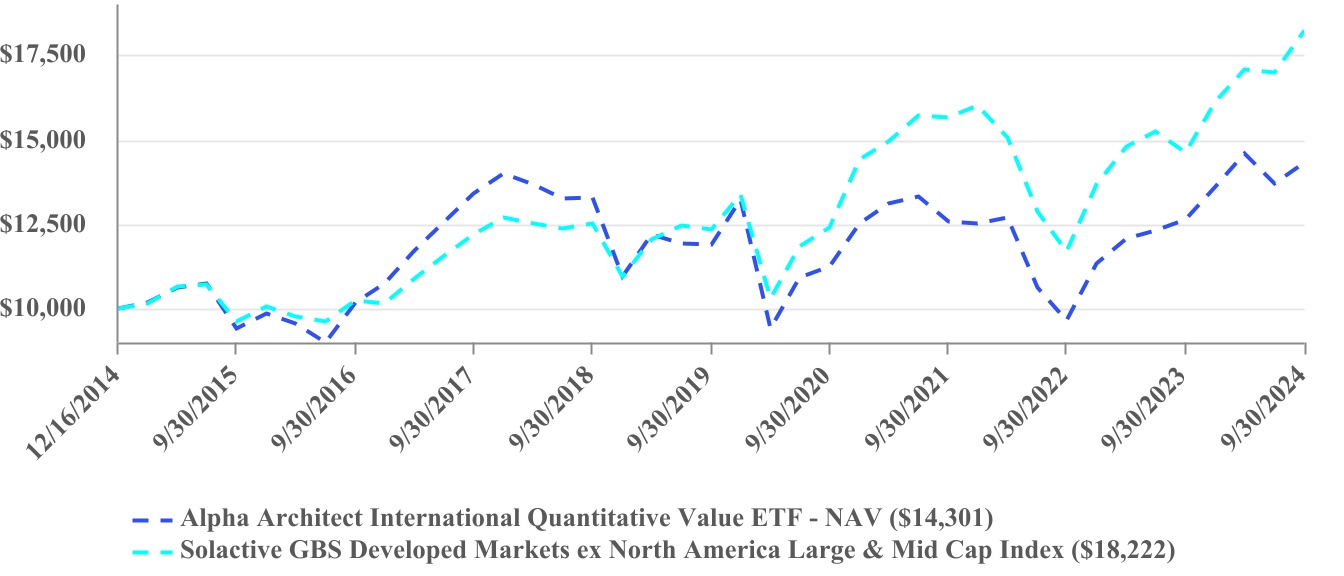
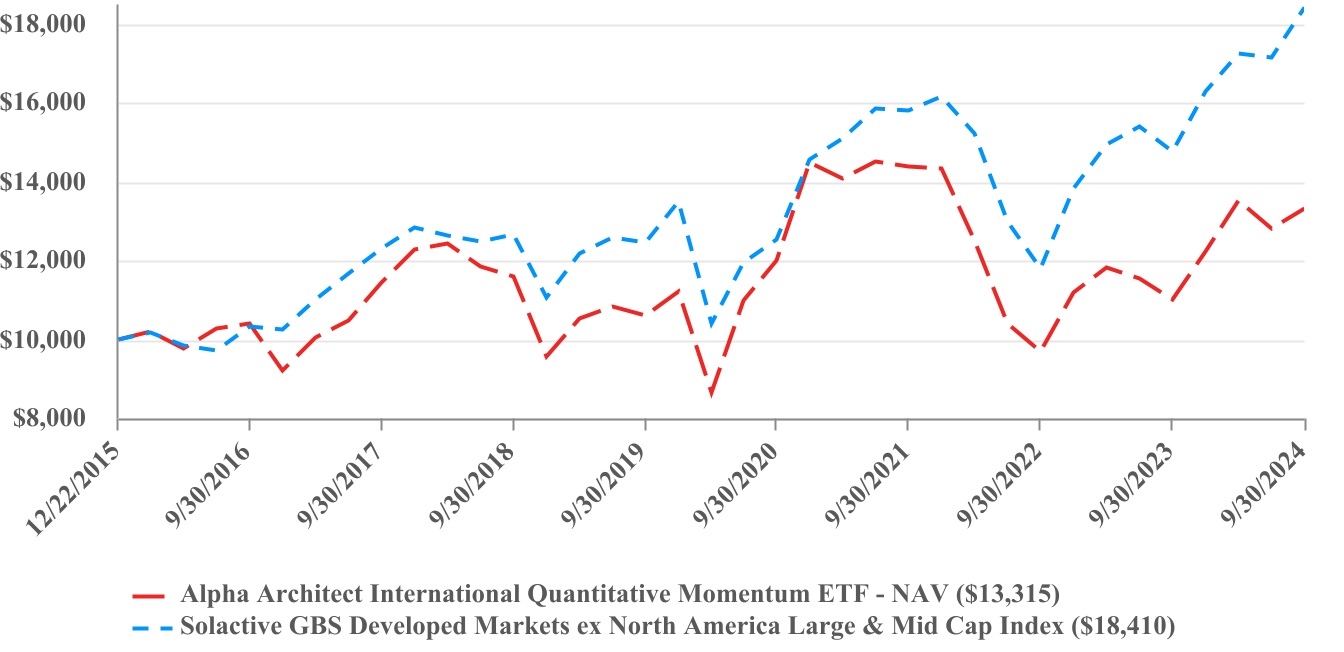
| PERFORMANCE OF A HYPOTHETICAL $10,000 INVESTMENT |
| | | | | | | | | | | | | | | | | | | | |
| AVERAGE ANNUAL TOTAL RETURNS |
| | 1 Year | | 5 Year | | Since Inception (12/16/2014) |
| Alpha Architect International Quantitative Value ETF - NAV | | 13.38% | | 3.79% | | 3.72% |
| Solactive GBS Developed Markets ex North America Large & Mid Cap Index | | 24.68% | | 8.12% | | 6.32% |
| | | | | | |
The Fund’s past performance is not a good predictor of how the Fund will perform in the future. The graph and table do not reflect the deduction of taxes that a shareholder would pay on Fund distributions or redemption of Fund shares. Visit https://funds.alphaarchitect.com/ival for more recent performance information. |
| | | | | | | | | | | |
| WHAT FACTORS INFLUENCED PERFORMANCE FOR THE PERIOD? |
The Fund returned 13.38% (NAV) for the Period vs. 24.68% for the Solactive GBS Developed Markets ex-North America Large Index. During the Period, markets reacted positively to strong corporate earnings, resilient economic conditions, and Federal Reserve policy, with larger-cap stocks leading performance. The Fund’s tilt toward deeper value stocks as measured by EBIT/TEV contributed negatively to returns relative to the benchmark.
Annual Shareholder Report: September 30, 2024
| | | | | | | | |
| Alpha Architect International Quantitative Value ETF Ticker: IVAL Listed on: The Nasdaq Stock Market | September 30, 2024 Annual Shareholder Report https://funds.alphaarchitect.com/ival |
|
| | | | | | | | | | | | | | | | | | | | |
| KEY FUND STATISTICS (as of Period End) |
| Net Assets | | $150,759,000 | | Portfolio Turnover Rate* | | 155% |
| # of Portfolio Holdings | | 51 | | Advisory Fees Paid | | $632,933 |
| *Excludes impact of in-kind transactions. |
| | | | | | |
| | | | | |
SECTOR WEIGHTING
(as a % of Net Assets) |
| Industrials | 27.9% |
| Consumer Discretionary | 26.6% |
| Materials | 13.1% |
| Energy | 9.6% |
| Utilities | 8.0% |
| Consumer Staples | 8.0% |
| Information Technology | 3.9% |
| Real Estate | 1.9% |
| Investments Purchased with Proceeds from Securities Lending | 1.8% |
| Cash & Cash Equivalents | 0.1% |
| | | | | |
TOP 10 HOLDINGS
(as a % of Net Assets) |
| Rio Tinto Ltd. | 2.4% |
| Fortescue Ltd. | 2.4% |
| Rexel SA | 2.3% |
| SSAB AB - Class B | 2.2% |
| SKF AB - Class B | 2.2% |
| easyJet PLC | 2.1% |
| Aurizon Holdings Ltd. | 2.1% |
| Cie de Saint-Gobain SA | 2.1% |
| Yamazaki Baking Co. Ltd. | 2.1% |
| Fortum Oyj | 2.1% |
| | | | | |
COUNTRY WEIGHTING
(as a % of Net Assets) |
| Japan | 49.8% |
| France | 10.0% |
| Australia | 8.9% |
| United Kingdom | 7.9% |
| Sweden | 6.5% |
| Italy | 6.1% |
| Finland | 4.0% |
| Singapore | 2.0% |
| China | 1.9% |
| Portugal | 1.9% |
| United States | 1.9% |
Material Fund Changes
This is a summary of certain changes to the Fund since October 1, 2023. For more complete information, you may review the Fund’s next prospectus, which we expect to be available by January 31, 2025, at funds.alphaarchitect.com/ival or by calling (215) 330-4476.
Effective June 21, 2024, the Fund’s Board of Trustees approved Alpha Architect, LLC to serve as the Fund’s sub-adviser.
Availability of Additional Information
For additional information about the Fund, including its prospectus, financial information, holdings, and proxy information, visit https://funds.alphaarchitect.com/ival. You can also request information by calling (215) 330-4476.
Householding
Householding is an option available to certain investors of the Fund. Householding is a method of delivery, based on the preference of the individual investor, in which a single copy of certain shareholder documents can be delivered to investors who share the same address, even if their accounts are registered under different names. Householding for the Fund is available through certain broker-dealers. If you are interested in enrolling in householding and receiving a single copy of prospectuses and other shareholder documents or you are currently enrolled in householding and wish to change your householding status, please contact your broker-dealer.
Annual Shareholder Report: September 30, 2024
| | | | | | | | |
| Alpha Architect U.S. Quantitative Momentum ETF Ticker: QMOM Listed on: The Nasdaq Stock Market | September 30, 2024 Annual Shareholder Report https://funds.alphaarchitect.com/qmom |
|
| | | | | | | | | | | |
| This annual shareholder report contains important information about the Alpha Architect U.S. Quantitative Momentum ETF (the “Fund”) for the period of October 1, 2023 to September 30, 2024 (the “Period”). You can find additional information about the Fund at https://funds.alphaarchitect.com/qmom. You can also request this information by contacting us at (215) 330-4476. This report describes changes to the Fund that occurred during the Period. |
| | | | | | | | | | | |
WHAT WERE THE FUND COSTS FOR THE PERIOD?
(based on a hypothetical $10,000 investment) |
| COST OF $10,000 INVESTMENT | COST PAID AS A PERCENTAGE OF $10,000 INVESTMENT |
| $40 | 0.32% |
| | | | | | | | | | | |
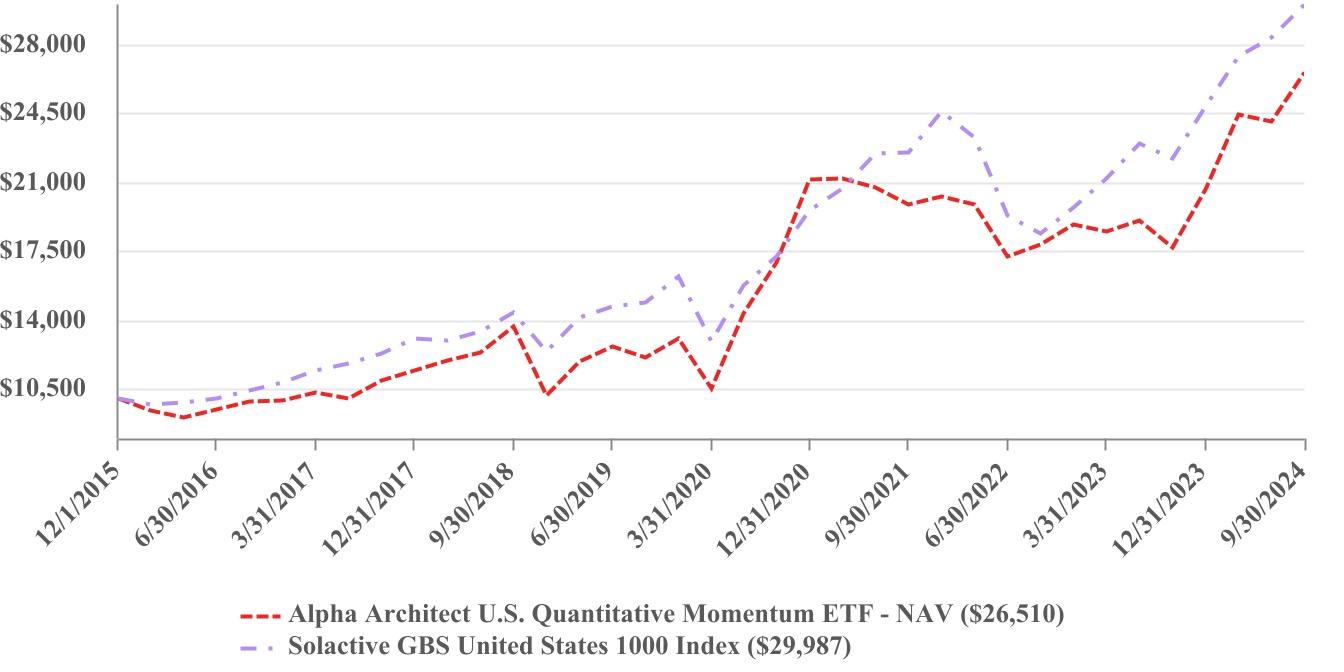
| PERFORMANCE OF A HYPOTHETICAL $10,000 INVESTMENT |
| | | | | | | | | | | | | | |
| AVERAGE ANNUAL TOTAL RETURNS |
| | 1 Year | | Since Inception (11/9/2022) |
| Alpha Architect U.S. Quantitative Momentum ETF - NAV | | 49.97% | 17.03% | 11.67% |
| | | | |
| Solactive GBS United States 1000 Index | | 35.20% | 15.06% | 13.24% |
| | | | |
| | | | |
The Fund’s past performance is not a good predictor of how the Fund will perform in the future. The graph and table do not reflect the deduction of taxes that a shareholder would pay on Fund distributions or redemption of Fund shares. Visit https://funds.alphaarchitect.com/qmom for more recent performance information. |
| | | | | | | | | | | |
| WHAT FACTORS INFLUENCED PERFORMANCE FOR THE PERIOD? |
The Fund returned 49.97% (NAV) for the Period vs. 35.20% for the Solactive GBS United States 1000 Index. During the Period, markets reacted positively to strong corporate earnings, resilient economic conditions, and Federal Reserve policy, with larger-cap stocks leading performance. The Fund’s tilt toward higher momentum stocks contributed positively to returns relative to the benchmark.
Annual Shareholder Report: September 30, 2024
| | | | | | | | |
| Alpha Architect U.S. Quantitative Momentum ETF Ticker: QMOM Listed on: The Nasdaq Stock Market | September 30, 2024 Annual Shareholder Report https://funds.alphaarchitect.com/qmom |
|
| | | | | | | | | | | | | | | | | | | | |
| KEY FUND STATISTICS (as of Period End) |
| Net Assets | | $252,563,718 | | Portfolio Turnover Rate* | | 363% |
| # of Portfolio Holdings | | 51 | | Advisory Fees Paid | | $625,008 |
| *Excludes impact of in-kind transactions. |
| | | | | |
SECTOR WEIGHTING
(as a % of Net Assets) |
| Financials | 27.0% |
| Consumer Discretionary | 17.7% |
| Industrials | 16.1% |
| Information Technology | 13.9% |
| Utilities | 7.3% |
| Health Care | 5.9% |
| Communication Services | 4.2% |
| Consumer Staples | 3.9% |
| Materials | 2.1% |
| Energy | 1.6% |
| Cash & Cash Equivalents | 0.3% |
| | | | | |
TOP 10 HOLDINGS
(as a % of Net Assets) |
| Vistra Corp. | 2.7% |
| Constellation Energy Corp. | 2.5% |
| Zeta Global Holdings Corp. - Class A | 2.2% |
| Fair Isaac Corp. | 2.2% |
| Carpenter Technology Corp. | 2.1% |
| Blue Owl Capital, Inc. - Class A | 2.1% |
| EMCOR Group, Inc. | 2.1% |
| Meta Platforms, Inc. - Class A | 2.1% |
| Natera, Inc. | 2.1% |
| Trane Technologies PLC | 2.1% |
Material Fund Changes
This is a summary of certain changes to the Fund since October 1, 2023. For more complete information, you may review the Fund’s next prospectus, which we expect to be available by January 31, 2025, at funds.alphaarchitect.com/qmom or by calling (215) 330-4476.
Effective June 21, 2024, the Fund’s Board of Trustees approved Alpha Architect, LLC to serve as the Fund’s sub-adviser.
Availability of Additional Information
For additional information about the Fund, including its prospectus, financial information, holdings, and proxy information, visit https://funds.alphaarchitect.com/qmom. You can also request information by calling (215) 330-4476.
Householding
Householding is an option available to certain investors of the Fund. Householding is a method of delivery, based on the preference of the individual investor, in which a single copy of certain shareholder documents can be delivered to investors who share the same address, even if their accounts are registered under different names. Householding for the Fund is available through certain broker-dealers. If you are interested in enrolling in householding and receiving a single copy of prospectuses and other shareholder documents or you are currently enrolled in householding and wish to change your householding status, please contact your broker-dealer.
Annual Shareholder Report: September 30, 2024
| | | | | | | | |
| Alpha Architect International Quantitative Momentum ETF Ticker: IMOM Listed on: The Nasdaq Stock Market | September 30, 2024 Annual Shareholder Report https://funds.alphaarchitect.com/imom |
|
| | | | | | | | | | | |
| This annual shareholder report contains important information about the Alpha Architect International Quantitative Momentum ETF (the “Fund”) for the period of October 1, 2023 to September 30, 2024 (the “Period”). You can find additional information about the Fund at https://funds.alphaarchitect.com/imom. You can also request this information by contacting us at (215) 330-4476. This report describes changes to the Fund that occurred during the Period. |
| | | | | | | | | | | |
WHAT WERE THE FUND COSTS FOR THE PERIOD?
(based on a hypothetical $10,000 investment) |
| COST OF $10,000 INVESTMENT | COST PAID AS A PERCENTAGE OF $10,000 INVESTMENT |
| $46 | 0.42% |
| | | | | | | | | | | |
| PERFORMANCE OF A HYPOTHETICAL $10,000 INVESTMENT |
| | | | | | | | | | | | | | | | | | | | |
| AVERAGE ANNUAL TOTAL RETURNS |
| | 1 Year | | 5 Year | | Since Inception (12/22/2015) |
| Alpha Architect International Quantitative Momentum ETF - NAV | | 21.01% | | 4.65% | | 3.32% |
| | | | | | |
| Solactive GBS Developed Markets ex North America Large & Mid Cap Index | | 24.68% | | 8.12% | | 7.20% |
| | | | | | |
The Fund’s past performance is not a good predictor of how the Fund will perform in the future. The graph and table do not reflect the deduction of taxes that a shareholder would pay on Fund distributions or redemption of Fund shares. Visit https://funds.alphaarchitect.com/ for more recent performance information. |
| | | | | | | | | | | |
| WHAT FACTORS INFLUENCED PERFORMANCE FOR THE PERIOD? |
The Fund returned 21.01% (NAV) for the Period vs. 24.68% for the Solactive GBS Developed Markets ex-North America Large Index. During the Period, markets reacted positively to strong corporate earnings, resilient economic conditions, and Federal Reserve policy, with larger-cap stocks leading performance. The Fund’s tilt toward higher momentum stocks contributed negatively to returns relative to the benchmark.
Annual Shareholder Report: September 30, 2024
| | | | | | | | |
| Alpha Architect International Quantitative Momentum ETF Ticker: IMOM Listed on: The Nasdaq Stock Market | September 30, 2024 Annual Shareholder Report https://funds.alphaarchitect.com/imom |
|
| | | | | | | | | | | | | | | | | | | | |
| KEY FUND STATISTICS (as of Period End) |
| Net Assets | | $82,652,321 | | Portfolio Turnover Rate* | | 219% |
| # of Portfolio Holdings | | 51 | | Advisory Fees Paid | | $332,566 |
| *Excludes impact of in-kind transactions. |
| | | | | |
SECTOR WEIGHTING
(as a % of Net Assets) |
| Financials | 31.8% |
| Industrials | 19.7% |
| Information Technology | 15.7% |
| Health Care | 8.4% |
| Communication Services | 6.2% |
| Materials | 6.2% |
| Consumer Discretionary | 5.9% |
| Consumer Staples | 2.1% |
| Energy | 1.9% |
| Real Estate | 1.3% |
| Cash & Cash Equivalents | 0.2% |
| | | | | |
TOP 10 HOLDINGS
(as a % of Net Assets) |
| Commerzbank AG | 2.5% |
| Telix Pharmaceuticals Ltd. | 2.4% |
| Pro Medicus Ltd. | 2.4% |
| Sea Ltd. - ADR | 2.3% |
| IHI Corp. | 2.2% |
| Rolls-Royce Holdings PLC | 2.2% |
| 3i Group PLC | 2.1% |
| Marks & Spencer Group PLC | 2.1% |
| Deutsche Bank AG | 2.1% |
| Asics Corp. | 2.1% |
| | | | | |
COUNTRY WEIGHTING
(as a % of Net Assets) |
| Japan | 27.0% |
| Italy | 9.9% |
| Australia | 8.7% |
| Germany | 8.4% |
| United Kingdom | 8.4% |
| Sweden | 7.8% |
| Denmark | 5.7% |
| Switzerland | 4.1% |
| Austria | 3.3% |
| Singapore | 2.3% |
| Israel | 2.0% |
| Spain | 2.0% |
| Ireland | 2.0% |
| Belgium | 1.9% |
| Norway | 1.9% |
| Portugal | 1.9% |
| Netherlands | 1.9% |
| United States | 0.2% |
Material Fund Changes
This is a summary of certain changes to the Fund since October 1, 2023. For more complete information, you may review the Fund’s next prospectus, which we expect to be available by January 31, 2025, at funds.alphaarchitect.com/imom or by calling (215) 330-4476.
Effective June 21, 2024, the Fund’s Board of Trustees approved Alpha Architect, LLC to serve as the Fund’s sub-adviser.
Availability of Additional Information
For additional information about the Fund, including its prospectus, financial information, holdings, and proxy information, visit https://funds.alphaarchitect.com/imom. You can also request information by calling (215) 330-4476.
Householding
Householding is an option available to certain investors of the Fund. Householding is a method of delivery, based on the preference of the individual investor, in which a single copy of certain shareholder documents can be delivered to investors who share the same address, even if their accounts are registered under different names. Householding for the Fund is available through certain broker-dealers. If you are interested in enrolling in householding and receiving a single copy of prospectuses and other shareholder documents or you are currently enrolled in householding and wish to change your householding status, please contact your broker-dealer.
Annual Shareholder Report: September 30, 2024
| | | | | | | | |
| Alpha Architect Value Momentum Trend ETF Ticker: VMOT Listed on: The Nasdaq Stock Market | September 30, 2024 Annual Shareholder Report https://funds.alphaarchitect.com/vmot |
|
| | | | | | | | | | | |
| This annual shareholder report contains important information about the Alpha Architect Value Momentum Trend ETF (the “Fund”) for the period of October 1, 2023 to September 30, 2024 (the “Period”). You can find additional information about the Fund at https://funds.alphaarchitect.com/vmot. You can also request this information by contacting us at (215) 330-4476. This report describes changes to the Fund that occurred during the Period. |
| | | | | | | | | | | |
WHAT WERE THE FUND COSTS FOR THE PERIOD?
(based on a hypothetical $10,000 investment) |
| COST OF $10,000 INVESTMENT | COST PAID AS A PERCENTAGE OF $10,000 INVESTMENT |
| $36 | 0.32% |
| | | | | | | | | | | |
| PERFORMANCE OF A HYPOTHETICAL $10,000 INVESTMENT |
| | | | | | | | | | | | | | | | | | | | |
| AVERAGE ANNUAL TOTAL RETURNS |
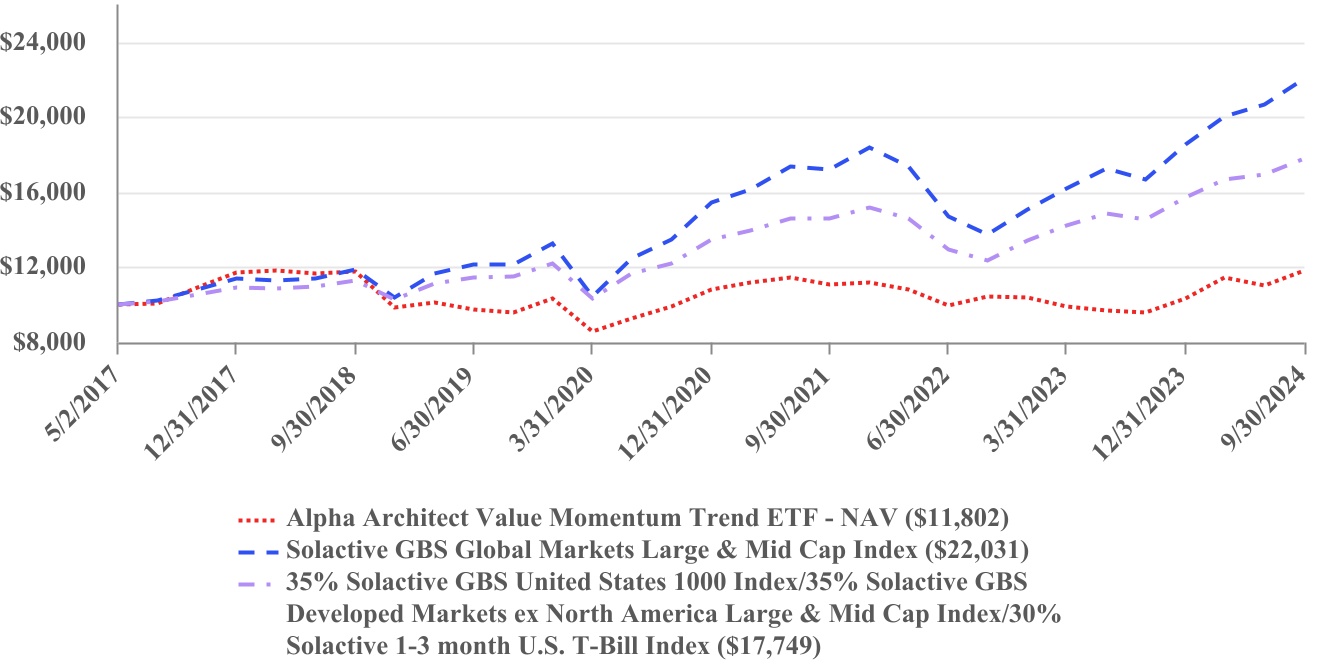
| | 1 Year | | 5 Year | | Since Inception (5/2/2017) |
| Alpha Architect Value Momentum Trend ETF - NAV | | 23.05% | | 4.22% | | 2.26% |
| Solactive GBS Global Markets Large & Mid Cap Index | | 32.22% | | 12.66% | | 11.24% |
35% Solactive GBS United States 1000 Index/35% Solactive GBS Developed Markets ex North America Large & Mid Cap Index/30% Solactive 1-3 month U.S. T-Bill Index | | 22.25% | | 9.12% | | 8.05% |
| Solactive GBS United States 1000 Index | | 35.20% | | 15.06% | | 13.70% |
| Solactive GBS Developed Markets ex North America Large & Mid Cap Index | | 24.68% | | 8.12% | | 6.74% |
| Solactive 1-3 month U.S. T-Bill Index | | 5.51% | | 2.34% | | 2.15% |
| | | | | | |
| The Solactive GBS Global Markets Large & Mid Cap Index is provided as a broad measure of market performance. The 35% Solactive GBS United States 1000 Index/35% Solactive GBS Developed Markets ex North America Large & Mid Cap Index/30% Solactive 1-3 month U.S. T-Bill Index is provided as a measure of the Fund’s investment strategy and universe. |
The Fund’s past performance is not a good predictor of how the Fund will perform in the future. The graph and table do not reflect the deduction of taxes that a shareholder would pay on Fund distributions or redemption of Fund shares. Visit https://funds.alphaarchitect.com/vmot for more recent performance information. |
Annual Shareholder Report: September 30, 2024
| | | | | | | | |
| Alpha Architect Value Momentum Trend ETF Ticker: VMOT Listed on: The Nasdaq Stock Market | September 30, 2024 Annual Shareholder Report https://funds.alphaarchitect.com/vmot |
|
| | | | | | | | | | | |
| WHAT FACTORS INFLUENCED PERFORMANCE FOR THE PERIOD? |
The Fund returned 23.05% (NAV) for the Period vs. 32.22% for the Solactive GBS Global Markets Large & Mid Cap Index. During the Period, markets reacted positively to strong corporate earnings, resilient economic conditions, and Federal Reserve policy, with larger-cap stocks leading performance. The Fund’s tilt toward (1) deeper value stocks as measured by EBIT/TEV, (2) higher momentum ex-U.S. stocks, (3) use of trend-following, and (4) relative value-momentum weighting detracted from returns relative to the benchmark, while exposure to higher momentum U.S. stocks contributed positively.
| | | | | | | | | | | | | | | | | | | | |
| KEY FUND STATISTICS (as of Period End) |
| Net Assets | | $21,787,725 | | Advisory Fees | | $128,537 |
| # of Portfolio Holdings | | 5 | | Fees Waived and/or Expenses Reimbursed | | (37,970) |
| Portfolio Turnover Rate* | | 33% | | Net Advisory Fees Paid | | $90,567 |
| *Excludes impact of in-kind transactions. |
| | | | | |
SECTOR WEIGHTING
(as a % of Net Assets) |
| Exchange Traded Funds | 99.6% |
| Investments Purchased with Proceeds from Securities Lending | 10.8% |
| Cash & Cash Equivalents | 0.4% |
| | | | | |
TOP HOLDINGS
(as a % of Net Assets) |
| Alpha Architect US Quantitative Momentum ETF | 35.6% |
| Alpha Architect US Quantitative Value ETF | 29.9% |
| Alpha Architect International Quantitative Momentum ETF | 19.5% |
| Alpha Architect International Quantitative Value ETF | 14.6% |
Material Fund Changes
This is a summary of certain changes to the Fund since October 1, 2023. For more complete information, you may review the Fund’s next prospectus, which we expect to be available by January 31, 2025, at funds.alphaarchitect.com/vmot or by calling (215) 330-4476.
Effective June 21, 2024, the Fund’s Board of Trustees approved Alpha Architect, LLC to serve as the Fund’s sub-adviser.
Availability of Additional Information
For additional information about the Fund, including its prospectus, financial information, holdings, and proxy information, visit https://funds.alphaarchitect.com/vmot. You can also request information by calling (215) 330-4476.
Householding
Householding is an option available to certain investors of the Fund. Householding is a method of delivery, based on the preference of the individual investor, in which a single copy of certain shareholder documents can be delivered to investors who share the same address, even if their accounts are registered under different names. Householding for the Fund is available through certain broker-dealers. If you are interested in enrolling in householding and receiving a single copy of prospectuses and other shareholder documents or you are currently enrolled in householding and wish to change your householding status, please contact your broker-dealer.
Annual Shareholder Report: September 30, 2024
| | | | | | | | |
| Alpha Architect High Inflation and Deflation ETF Ticker: HIDE Listed on: The Nasdaq Stock Market | September 30, 2024 Annual Shareholder Report https://funds.alphaarchitect.com/hide |
|
| | | | | | | | | | | |
| This annual shareholder report contains important information about the Alpha Architect High Inflation and Deflation ETF (the “Fund”) for the period of October 1, 2023, to September 30, 2024 (the “Period”). You can find additional information about the Fund at https://funds.alphaarchitect.com/hide. You can also request this information by contacting us at (215) 330-4476. |
| | | | | | | | | | | |
WHAT WERE THE FUND COSTS FOR THE PERIOD?
(based on a hypothetical $10,000 investment) |
| COST OF $10,000 INVESTMENT | COST PAID AS A PERCENTAGE OF $10,000 INVESTMENT |
| $24 | 0.24% |
| | | | | | | | | | | |
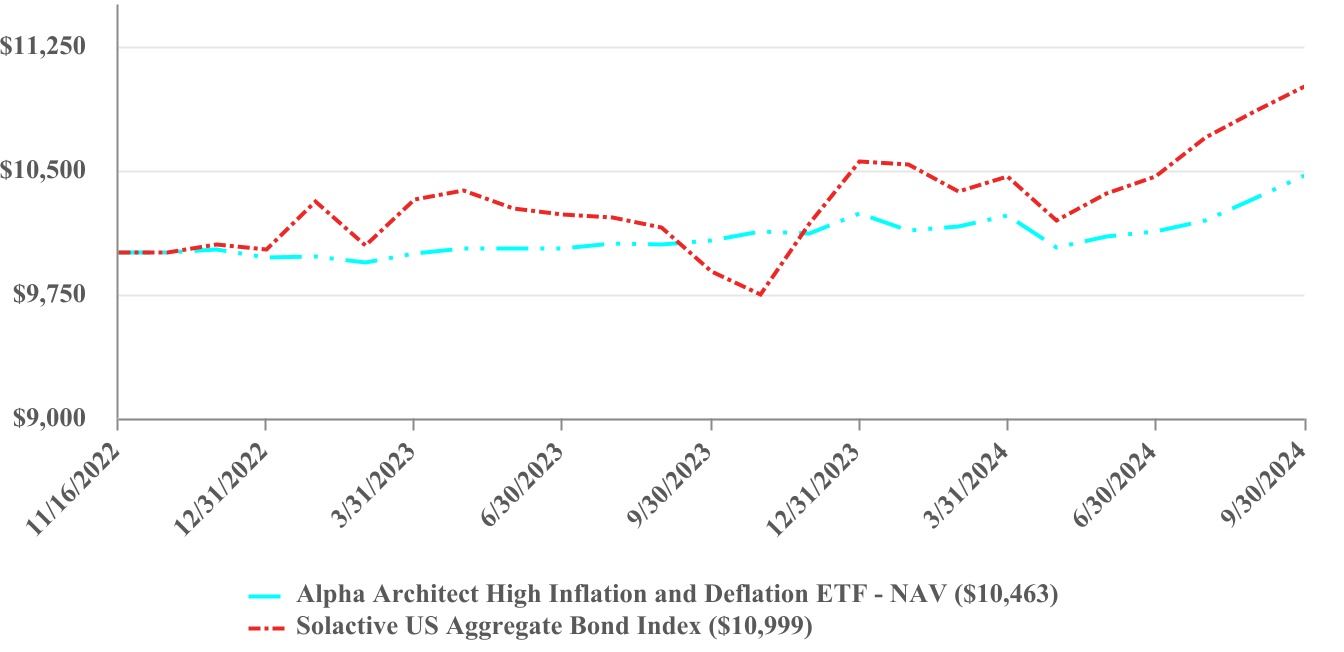
| PERFORMANCE OF A HYPOTHETICAL $10,000 INVESTMENT |
| | | | | | | | | | | | | | |
| AVERAGE ANNUAL TOTAL RETURNS |
| | 1 Year | | Since Inception (11/16/2022) |
| Alpha Architect High Inflation and Deflation ETF - NAV | | 3.91% | | 2.45% |
| | | | |
| Solactive US Aggregate Bond Index | | 11.25% | | 5.22% |
| | | | |
The Fund’s past performance is not a good predictor of how the Fund will perform in the future. The graph and table do not reflect the deduction of taxes that a shareholder would pay on Fund distributions or redemption of Fund shares. Visit https://funds.alphaarchitect.com/hide for more recent performance information. |
| | | | | | | | | | | |
| WHAT FACTORS INFLUENCED PERFORMANCE FOR THE PERIOD? |
The Fund returned 3.91% (NAV) for the Period vs. 11.25% for the Solactive US Aggregate Bond Index. During the Period, bond markets responded positively to strong corporate earnings, resilient economic conditions, and Federal Reserve policy. Bond markets also benefited from falling yields in the fiscal year. However, the Fund’s use of trend-following on REITs, bonds, and commodities contributed negatively to returns relative to the benchmark.
Annual Shareholder Report: September 30, 2024
| | | | | | | | |
| Alpha Architect High Inflation and Deflation ETF Ticker: HIDE Listed on: The Nasdaq Stock Market | September 30, 2024 Annual Shareholder Report https://funds.alphaarchitect.com/hide |
|
| | | | | | | | | | | | | | | | | | | | |
| KEY FUND STATISTICS (as of Period End) |
| Net Assets | | $30,270,823 | | Advisory Fees | | $62,674 |
| # of Portfolio Holdings | | 4 | | Fees Waived and/or Expenses Reimbursed | | (10,289) |
| Portfolio Turnover Rate* | | 267% | | Net Advisory Fees Paid | | $52,385 |
| *Excludes impact of in-kind transactions. |
| | | | | |
SECTOR WEIGHTING
(as a % of Net Assets) |
| Exchange Traded Funds | 75.8% |
| U.S. Treasury Bills | 23.7% |
| Cash & Cash Equivalents | 0.3% |
| | | | | |
TOP HOLDINGS
(as a % of Net Assets) |
| Schwab Intermediate-Term U.S. Treasury ETF | 51.2% |
| Vanguard Real Estate ETF | 24.6% |
| United States Treasury Bill 5.13%, 10/03/2024 | 23.6% |
Availability of Additional Information
For additional information about the Fund, including its prospectus, financial information, holdings, and proxy information, visit https://funds.alphaarchitect.com/hide. You can also request information by calling (215) 330-4476.
Householding
Householding is an option available to certain investors of the Fund. Householding is a method of delivery, based on the preference of the individual investor, in which a single copy of certain shareholder documents can be delivered to investors who share the same address, even if their accounts are registered under different names. Householding for the Fund is available through certain broker-dealers. If you are interested in enrolling in householding and receiving a single copy of prospectuses and other shareholder documents or you are currently enrolled in householding and wish to change your householding status, please contact your broker-dealer.
Annual Shareholder Report: September 30, 2024
| | | | | | | | |
| Alpha Architect Tail Risk ETF Ticker: CAOS Listed on: Cboe BZX Exchange, Inc. | September 30, 2024 Annual Shareholder Report https://funds.alphaarchitect.com/caos |
|
| | | | | | | | | | | |
| This annual shareholder report contains important information about the Alpha Architect Tail Risk ETF (the “Fund”) for the period of October 1, 2023 to September 30, 2024 (the “Period”). You can find additional information about the Fund at https://funds.alphaarchitect.com/caos. You can also request this information by contacting us at (215) 330-4476. This report describes changes to the Fund that occurred during the Period. |
| | | | | | | | | | | |
WHAT WERE THE FUND COSTS FOR THE PERIOD?
(based on a hypothetical $10,000 investment) |
| COST OF $10,000 INVESTMENT | COST PAID AS A PERCENTAGE OF $10,000 INVESTMENT |
| $55 | 0.53% |
| | | | | | | | | | | |
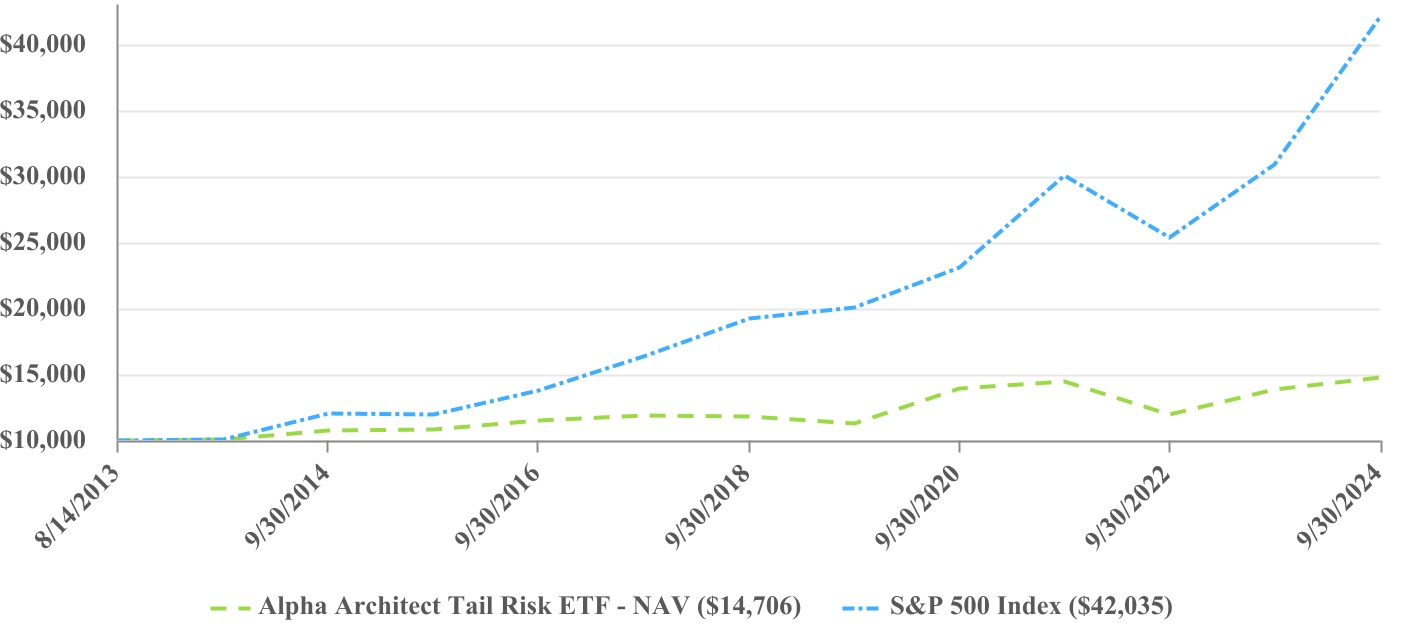
| PERFORMANCE OF A HYPOTHETICAL $10,000 INVESTMENT |
| | | | | | | | | | | | | | | | | | | | |
| AVERAGE ANNUAL TOTAL RETURNS |
| | 1 Year | | 5 Year | | 10 Year |
| Alpha Architect Tail Risk ETF - NAV | | 6.36% | | 5.48% | | 3.23% |
| S&P 500 Index | | 36.35% | | 15.98% | | 13.38% |
| | | | | | |
The Fund’s past performance is not a good predictor of how the Fund will perform in the future. The graph and table do not reflect the deduction of taxes that a shareholder would pay on Fund distributions or redemption of Fund shares. Visit https://funds.alphaarchitect.com/caos for more recent performance information. |
Annual Shareholder Report: September 30, 2024
| | | | | | | | |
| Alpha Architect Tail Risk ETF Ticker: CAOS Listed on: Cboe BZX Exchange, Inc. | September 30, 2024 Annual Shareholder Report https://funds.alphaarchitect.com/caos |
|
| | | | | | | | | | | |
| WHAT FACTORS INFLUENCED PERFORMANCE FOR THE PERIOD? |
As a tail risk fund, CAOS is designed to hedge against significant market downturns by using derivatives—primarily far-out-of-the-money put options on the S&P 500 Index—to protect portfolios during extreme market events. These far-out-of-the-money put options generally require periods of sharp market decline with an increase in implied volatility to gain value. If there is no such event, these options lose their value over time. To combat this erosion in value, the Fund employs two additional strategies in an effort to maintain its long volatility exposure while offering patient investors an opportunity for positive return during these sometimes long interim periods.
During the fiscal year, the equity market climbed higher, reducing the need for downside protection. The Fund trades short put spreads, which benefits the Fund should the market go higher. These put spreads involve selling a high strike put to gain market exposure, generally to the S&P 500 Index, and the purchase of a lower strike put on the same asset to limit any sizeable losses from the higher strike put. The maximum gain from this trade is the net premium collected at the outset of the trade, while the loss is equal to the difference in the strikes of the two put options less the initial net premium collected. This trade should benefit when the market climbs higher and was helpful to the Fund’s performance.
By the summer of 2024, growing concerns about a potential economic slowdown, coupled with speculation around possible rate cuts from the Federal Reserve, led to a modest increase in market volatility. The uptick in volatility towards the end of the fiscal year highlighted the potential of the Fund’s tail risk strategy. However, the degree to which the Federal Reserve sought to reduce short-term rates moderated. This delay permitted the Fund’s idle collateral to collect a stable return without equity market or volatility exposure. Similar to the put spread sales, the collateral yield positively contributed to the Fund return.
Overall, we believe the Fund provided valuable tail risk protection while managing hedging costs throughout the year, and it was well-positioned to deliver the intended downside protection as market conditions evolved.
| | | | | | | | | | | | | | | | | | | | |
| KEY FUND STATISTICS (as of Period End) |
| Net Assets | | $248,524,832 | | Advisory Fees | | $1,192,650 |
| # of Portfolio Holdings | | 19 | | Fees Waived and/or Expenses Reimbursed | | (186,924) |
| Portfolio Turnover Rate* | | 14% | | Net Advisory Fees Paid | | $1,005,726 |
| *Excludes impact of in-kind transactions. |
| | | | | |
| ASSET CLASSES (as a % of Net Assets) |
| Purchased Options | 117.0% |
| Exchange Traded Funds | 11.7% |
| Written Options | (29.2)% |
| Cash & Cash Equivalents | 0.5% |
Material Fund Changes
This is a summary of certain changes to the Fund since October 1, 2023. For more complete information, you may review the Fund’s next prospectus, which we expect to be available by January 31, 2025, at funds.alphaarchitect.com/caos or by calling (215) 330-4476.
Effective June 21, 2024, the Fund’s Board of Trustees approved Alpha Architect, LLC to serve as a sub-adviser to the Fund.
Availability of Additional Information
For additional information about the Fund, including its prospectus, financial information, holdings, and proxy information, visit https://funds.alphaarchitect.com/caos. You can also request information by calling (215) 330-4476.
Householding
Householding is an option available to certain investors of the Fund. Householding is a method of delivery, based on the preference of the individual investor, in which a single copy of certain shareholder documents can be delivered to investors who share the same address, even if their accounts are registered under different names. Householding for the Fund is available through certain broker-dealers. If you are interested in enrolling in householding and receiving a single copy of prospectuses and other shareholder documents or you are currently enrolled in householding and wish to change your householding status, please contact your broker-dealer.
Annual Shareholder Report: September 30, 2024
| | | | | | | | |
| Alpha Architect 1-3 Month Box ETF Ticker: BOXX Listed on: Cboe BZX Exchange, Inc. | September 30, 2024 Annual Shareholder Report https://funds.alphaarchitect.com/boxx |
|
| | | | | | | | | | | |
| This annual shareholder report contains important information about the Alpha Architect 1-3 Month Box ETF (the “Fund”) for the period of November 1, 2023 to September 30, 2024, (the “Period”). You can find additional information about the Fund at https://funds.alphaarchitect.com/. You can also request this information by contacting us at (215) 330-4476. This report describes changes to the Fund that occurred during the Period. |
| | | | | | | | | | | |
WHAT WERE THE FUND COSTS FOR THE PERIOD?
(based on a hypothetical $10,000 investment) |
| COST OF $10,000 INVESTMENT | COST PAID AS A PERCENTAGE OF $10,000 INVESTMENT |
| $18 | 0.1949% |
| | | | | | | | | | | |
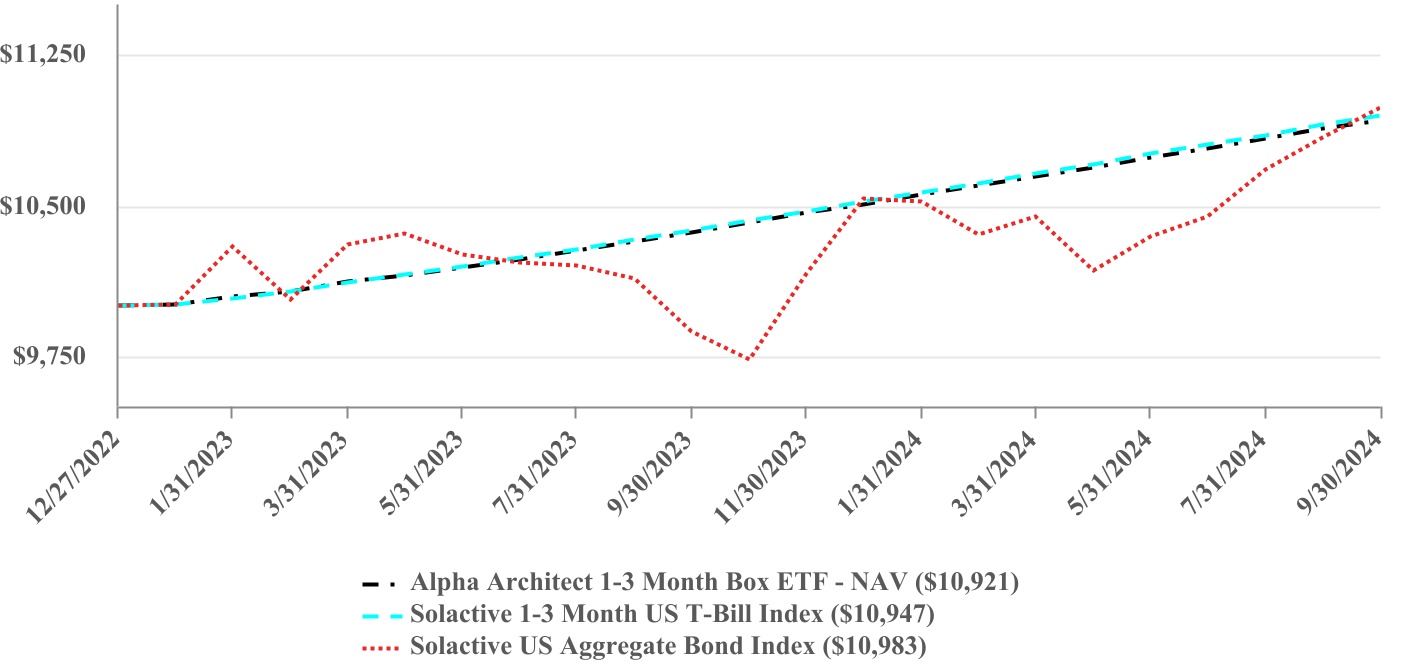
| PERFORMANCE OF A HYPOTHETICAL $10,000 INVESTMENT |
| | | | | | | | | | | | | | |
| AVERAGE ANNUAL TOTAL RETURNS |
| | 1 Year | | Since Inception (12/27/2022) |
| Alpha Architect 1-3 Month Box ETF - NAV | | 5.40% | | 5.14% |
| Solactive US Aggregate Bond Index | | 11.25% | | 5.48% |
| Solactive 1-3 Month US T-Bill Index | | 5.51% | | 5.28% |
| | | | |
| The Solactive US Aggregate Bond Index is provided as a broad measure of market performance. The Solactive 1-3 Month US T-Bill Index is provided as a measure of the Fund’s investment objective and strategy. |
The Fund’s past performance is not a good predictor of how the Fund will perform in the future. The graph and table do not reflect the deduction of taxes that a shareholder would pay on Fund distributions or redemption of Fund shares. Visit https://funds.alphaarchitect.com/boxx for more recent performance information. |
Annual Shareholder Report: September 30, 2024
| | | | | | | | |
| Alpha Architect 1-3 Month Box ETF Ticker: BOXX Listed on: Cboe BZX Exchange, Inc. | September 30, 2024 Annual Shareholder Report https://funds.alphaarchitect.com/boxx |
|
| | | | | | | | | | | |
| WHAT FACTORS INFLUENCED PERFORMANCE FOR THE PERIOD? |
The Fund benefited from the low-volatility environment and expectations for future rate cuts. The Fund primarily uses a strategy centered on derivatives, specifically box spreads utilizing options, such as those linked to the S&P 500.
•Stable Interest Rates: For much of the fiscal year, short-term interest rates remained stable, as the Federal Reserve maintained its interest rate policy after a period of aggressive tightening. This environment provided a consistent backdrop for the Fund’s box spread strategy, which aims to provide investment results that, before fees and expenses, equal or exceed the price and yield performance of an investment that tracks the 1-3 month sector of the United States Treasury Bill market.
•Increased Market Optimism in Mid-2024: By the summer of 2024, market sentiment shifted as expectations for rate cuts grew due to signs of economic slowing and inflation moderation. The Fund’s strategy benefited from the calm market environment as volatility remained low. This allowed the Fund to achieve modest positive returns without being impacted by the more pronounced shifts in longer-duration fixed-income securities.
•Derivatives Liquidity: Throughout the year, the liquidity of the options market, in which the Fund’s box spreads are executed, remained robust. This allowed the Fund to operate efficiently without major disruptions.
| | | | | | | | | | | | | | | | | | | | |
| KEY FUND STATISTICS (as of Period End) |
| Net Assets | | $3,968,953,465 | | Advisory Fees | | $8,116,529 |
| # of Portfolio Holdings | | 33 | | Fees Waived and/or Expenses Reimbursed | | (4,110,676) |
| Portfolio Turnover Rate* | | 0% | | Net Advisory Fees Paid | | $4,005,853 |
| *Portfolio turnover is not annualized and is calculated without regard to short-term securities having a maturity of less than one year. Excludes impact of in-kind transactions. |
| | | | | |
| ASSET CLASSES (as a % of net assets) |
| Purchased Options | 158.5% |
| Written Options | (58.5)% |
Material Fund Changes
This is a summary of certain changes to the Fund since November 1, 2023. For more complete information, you may review the Fund’s next prospectus, which we expect to be available by January 31, 2025, at funds.alphaarchitect.com/boxx or by calling (215) 330-4476.
•Effective June 21, 2024, the Fund’s Board of Trustees approved Alpha Architect, LLC to serve as a sub-adviser to the Fund.
•The Fund revised its principal investment strategies to reflect, among other things, its use of options on broad-based diversified assets such as the SPDR® S&P 500® ETF Trust for substantially all of the Fund’s holdings. The Fund also added “Tax Risk” as a principal investment risk.
•Effective November 12, 2024, the Adviser reduced the Fund’s management fee from 0.3949% to 0.2449%.
Availability of Additional Information
For additional information about the Fund, including its prospectus, financial information, holdings, and proxy information, visit https://funds.alphaarchitect.com/boxx. You can also request information by calling (215) 330-4476.
Householding
Householding is an option available to certain investors of the Fund. Householding is a method of delivery, based on the preference of the individual investor, in which a single copy of certain shareholder documents can be delivered to investors who share the same address, even if their accounts are registered under different names. Householding for the Fund is available through certain broker-dealers. If you are interested in enrolling in householding and receiving a single copy of prospectuses and other shareholder documents or you are currently enrolled in householding and wish to change your householding status, please contact your broker-dealer.
Annual Shareholder Report: September 30, 2024
(b) Not applicable
Item 2. Code of Ethics.
The registrant has adopted a code of ethics that applies to the registrant’s principal executive officer and principal financial officer. The registrant has not made any amendments to its code of ethics during the year covered by this report. The registrant has not granted any waivers from any provisions of the code of ethics during the year covered by this report.
A copy of the registrant’s Code of Ethics is incorporated by reference.
Item 3. Audit Committee Financial Expert.
The registrant’s Board of Trustees of the Trust has determined that there is at least one audit committee financial expert serving on its audit committee. Dr. Michael Pagano is an “audit committee financial expert” and is considered to be “independent” as each term is defined in Item 3 of Form N-CSR.
Item 4. Principal Accountant Fees and Services.
The registrant has engaged its principal accountant to perform audit services, audit-related services, tax services and other services during the past fiscal year. “Audit services” refer to performing an audit of the registrant’s annual financial statements or services that are normally provided by the accountant in connection with statutory and regulatory filings or engagements for those fiscal years. “Audit-related services” refer to the assurance and related services by the principal accountant that are reasonably related to the performance of the audit. “Tax services” refer to professional services rendered by the principal accountant for tax compliance, tax advice, and tax planning, including review of the registrant’s tax returns and calculations of required income, capital gain and excise distributions. There were no “Other services” provided by the principal accountant. The following table details the aggregate fees billed or expected to be billed for the last fiscal year for audit fees, audit-related fees, tax fees and other fees by the principal accountant.
| | | | | | | | | | | | | | | | | | | | | | | | | | | | | | | | | | | |
| QVAL | | IVAL | | QMOM | | IMOM |
| | FYE 9/30/2024 | FYE 9/30/2023 | | FYE 9/30/2024 | FYE 9/30/2023 | | FYE 9/30/2024 | FYE 9/30/2023 | | FYE 9/30/2024 | FYE 9/30/2023 |
| (a) Audit Fees | $8,750 | $8,750 | | $8,750 | $8,750 | | $8,750 | $8,750 | | $8,750 | $8,750 |
| (b) Audit-Related Fees | N/A | N/A | | N/A | N/A | | N/A | N/A | | N/A | N/A |
| (c) Tax Fees | $2,250 | $2,250 | | $2,250 | $2,250 | | $2,250 | $2,250 | | $2,250 | $2,250 |
| (d) All Other Fees | N/A | N/A | | N/A | N/A | | N/A | N/A | | N/A | N/A |
| | | | | | | | | | | | | | | | | | | | | | | | | | | | | | | | | | | |
| | VMOT | | HIDE | | CAOS | | BOXX |
FYE 9/30/2024 | FYE 9/30/2023 | | FYE 9/30/2024 | FYE 9/30/2023 | | FYE 9/30/2024 | FYE 9/30/2023 | | FYE 9/30/2024 | FYE 10/31/2023 |
| (a) Audit Fees | $8,750 | $8,750 | | $8,750 | $8,750 | | $11,000 | $8,750 | | $11,000 | $8,750 |
| (b) Audit-Related Fees | N/A | N/A | | N/A | N/A | | N/A | N/A | | N/A | N/A |
| (c) Tax Fees | $2,250 | $2,250 | | $2,250 | $2,250 | | $2,500 | $2,250 | | $2,500 | $2,250 |
| (d) All Other Fees | N/A | N/A | | N/A | N/A | | N/A | N/A | | N/A | N/A |
(e)(1) The audit committee has adopted pre-approval policies and procedures that require the audit committee to pre-approve all audit and non-audit services of the registrant, including services provided to any entity affiliated with the registrant.
(e)(2) None of the fees billed by any Fund's principal accountant were applicable to non-audit services pursuant to a waiver of the pre-approval requirement.
(f) All of the principal accountant’s hours spent on auditing the registrant’s financial statements were attributed to work performed by full-time permanent employees of the principal accountant.
(g) None of the fees billed by any Fund's principal accountant were applicable to non-audit services billed or expected to be billed to any Fund’s investment adviser.
(h) The audit committee of the board of trustees/directors has considered whether the provision of non-audit services that were rendered to the registrant's investment adviser is compatible with maintaining the principal accountant's independence and has concluded that the provision of such non-audit services by the accountant has not compromised the accountant’s independence.
(i) The registrant has not been identified by the U.S. Securities and Exchange Commission as having filed an annual report issued by a registered public accounting firm branch or office that is located in a foreign jurisdiction where the Public Company Accounting Oversight Board is unable to inspect or completely investigate because of a position taken by an authority in that jurisdiction..
(j) The registrant is not a foreign issuer.
Item 5. Audit Committee of Listed Registrants.
(a) The registrant is an issuer as defined in Rule 10A-3 under the Securities Exchange Act of 1934, (the “Act”) and has a separately-designated standing audit committee established in accordance with Section 3(a)(58)(A) of the Act. The independent members of the committee are as follows: Daniel Dorn, Chukwuemeka (Emeka) Oguh, and Michael Pagano.
(b) Not applicable.
Item 6. Investments
(a)
| | |
| ALPHA ARCHITECT U.S. QUANTITATIVE VALUE ETF |
| SCHEDULE OF INVESTMENTS |
| September 30, 2024 |
| | | | | | | | | | | | | | |
| COMMON STOCKS - 99.7% |
| Shares |
| Value |
| Advertising - 3.9% | | | |
|
| Interpublic Group of Cos., Inc. |
| 224,331 | |
| $ | 7,095,590 | |
| Omnicom Group, Inc. |
| 73,049 | |
| 7,552,536 | |
|
|
|
| 14,648,126 | |
|
|
|
|
|
| Apparel Retail - 2.1% | | | |
|
Urban Outfitters, Inc. (a) |
| 201,359 | |
| 7,714,063 | |
|
|
|
|
|
| Apparel, Accessories & Luxury Goods - 4.1% | | | |
|
| Carter's, Inc. |
| 110,644 | |
| 7,189,647 | |
| Tapestry, Inc. |
| 174,764 | |
| 8,210,413 | |
|
|
|
| 15,400,060 | |
|
|
|
|
|
| Brewers - 1.9% | | | |
|
| Molson Coors Beverage Co. - Class B |
| 126,708 | |
| 7,288,244 | |
|
|
|
|
|
| Broadcasting - 2.0% | | | |
|
| Fox Corp. - Class A |
| 176,808 | |
| 7,484,283 | |
|
|
|
|
|
| Building Products - 4.2% | | | |
|
| Owens Corning |
| 43,648 | |
| 7,704,745 | |
| UFP Industries, Inc. |
| 60,539 | |
| 7,943,322 | |
|
|
|
| 15,648,067 | |
|
|
|
|
|
| Cable & Satellite - 2.1% | | | |
|
| Comcast Corp. - Class A |
| 185,067 | |
| 7,730,249 | |
|
|
|
|
|
| Coal & Consumable Fuels - 2.0% | | | |
|
| CONSOL Energy, Inc. |
| 71,520 | |
| 7,484,568 | |
|
|
|
|
|
| Construction Machinery & Heavy Transportation Equipment - 8.0% | | | |
|
| Allison Transmission Holdings, Inc. |
| 79,687 | |
| 7,655,530 | |
| Caterpillar, Inc. |
| 20,657 | |
| 8,079,366 | |
| PACCAR, Inc. |
| 76,626 | |
| 7,561,453 | |
| Terex Corp. |
| 130,935 | |
| 6,927,771 | |
|
|
|
| 30,224,120 | |
|
|
|
|
|
| Copper - 2.2% | | | |
|
| Freeport-McMoRan, Inc. |
| 166,622 | |
| 8,317,770 | |
|
|
|
|
|
| Electrical Components & Equipment - 2.6% | | | |
|
| Powell Industries, Inc. |
| 44,557 | |
| 9,891,208 | |
|
|
|
|
|
The accompanying notes are an integral part of these financial statements.
1
| | |
| ALPHA ARCHITECT U.S. QUANTITATIVE VALUE ETF |
| SCHEDULE OF INVESTMENTS (CONTINUED) |
| September 30, 2024 |
| | | | | | | | | | | | | | |
| COMMON STOCKS - 99.7% (CONTINUED) |
| Shares |
| Value |
| Electronic Manufacturing Services - 2.1% | | | |
|
| Jabil, Inc. |
| 67,180 | |
| $ | 8,050,179 | |
|
|
|
|
|
| Footwear - 3.9% | | | |
|
Crocs, Inc. (a) |
| 50,562 | |
| 7,321,883 | |
Skechers USA, Inc. - Class A (a) |
| 108,254 | |
| 7,244,358 | |
|
|
|
| 14,566,241 | |
|
|
|
|
|
| Health Care Facilities - 2.0% | | | |
|
Tenet Healthcare Corp. (a) |
| 44,488 | |
| 7,393,906 | |
|
|
|
|
|
Health Care Services - 2.1% | | | |
|
| CVS Health Corp. |
| 127,581 | |
| 8,022,293 | |
|
|
|
|
|
| Homebuilding - 4.0% | | | |
|
| KB Home |
| 88,372 | |
| 7,572,597 | |
| Lennar Corp. - Class A |
| 40,463 | |
| 7,586,003 | |
|
|
|
| 15,158,600 | |
|
|
|
|
|
| Homefurnishing Retail - 2.3% | | | |
|
| Williams-Sonoma, Inc. |
| 54,992 | |
| 8,519,361 | |
|
|
|
|
|
| Industrial Machinery & Supplies & Components - 3.9% | | | |
|
Gates Industrial Corp. PLC (a) |
| 406,127 | |
| 7,127,529 | |
| Snap-on, Inc. |
| 25,855 | |
| 7,490,452 | |
|
|
|
| 14,617,981 | |
|
|
|
|
|
| Integrated Telecommunication Services - 2.1% | | | |
|
| AT&T, Inc. |
| 352,825 | |
| 7,762,150 | |
|
|
|
|
|
| IT Consulting & Other Services - 1.9% | | | |
|
| Cognizant Technology Solutions Corp. - Class A |
| 93,996 | |
| 7,254,611 | |
|
|
|
|
|
| Leisure Products - 1.9% | | | |
|
Mattel, Inc. (a) |
| 383,120 | |
| 7,298,436 | |
|
|
|
|
|
| Managed Health Care - 5.5% | | | |
|
Centene Corp. (a) |
| 89,493 | |
| 6,737,033 | |
| Elevance Health, Inc. |
| 13,132 | |
| 6,828,640 | |
Molina Healthcare, Inc. (a) |
| 20,849 | |
| 7,183,732 | |
|
|
|
| 20,749,405 | |
|
|
|
|
|
The accompanying notes are an integral part of these financial statements.
2
| | |
| ALPHA ARCHITECT U.S. QUANTITATIVE VALUE ETF |
| SCHEDULE OF INVESTMENTS (CONTINUED) |
| September 30, 2024 |
| | | | | | | | | | | | | | |
| COMMON STOCKS - 99.7% (CONTINUED) |
| Shares |
| Value |
| Oil & Gas Equipment & Services - 9.1% | | | |
|
| Baker Hughes Co. |
| 208,684 | |
| $ | 7,543,927 | |
| Halliburton Co. |
| 236,115 | |
| 6,859,141 | |
| Liberty Energy, Inc. |
| 358,817 | |
| 6,849,816 | |
| Schlumberger NV |
| 167,390 | |
| 7,022,010 | |
| Weatherford International PLC |
| 70,379 | |
| 5,976,585 | |
|
|
|
| 34,251,479 | |
|
|
|
|
|
| Oil & Gas Exploration & Production - 3.4% | | | |
|
| Devon Energy Corp. |
| 163,745 | |
| 6,405,704 | |
| SM Energy Co. |
| 161,818 | |
| 6,467,866 | |
|
|
|
| 12,873,570 | |
|
|
|
|
|
| Oil & Gas Refining & Marketing - 1.8% | | | |
|
| Marathon Petroleum Corp. |
| 41,185 | |
| 6,709,448 | |
|
|
|
|
|
| Other Specialty Retail - 6.6% | | | |
|
| Academy Sports & Outdoors, Inc. |
| 133,217 | |
| 7,774,544 | |
| Signet Jewelers Ltd. |
| 86,911 | |
| 8,964,001 | |
Ulta Beauty, Inc. (a) |
| 20,654 | |
| 8,036,884 | |
|
|
|
| 24,775,429 | |
|
|
|
|
|
| Paper & Plastic Packaging Products & Materials - 1.9% | | | |
|
| Graphic Packaging Holding Co. |
| 246,641 | |
| 7,298,107 | |
|
|
|
|
|
| Passenger Airlines - 2.3% | | | |
|
| Delta Air Lines, Inc. |
| 172,915 | |
| 8,782,353 | |
|
|
|
|
|
| Specialized Consumer Services - 2.0% | | | |
|
| H&R Block, Inc. |
| 115,263 | |
| 7,324,964 | |
|
|
|
|
|
| Steel - 2.0% | | | |
|
| Arch Resources, Inc. |
| 53,444 | |
| 7,383,823 | |
|
|
|
|
|
| Tobacco - 1.8% | | | |
|
| Altria Group, Inc. |
| 136,066 | |
| 6,944,809 | |
|
|
|
|
|
| Trading Companies & Distributors - 2.0% | | | |
|
| WESCO International, Inc. |
| 44,700 | |
| 7,508,706 | |
TOTAL COMMON STOCKS (Cost $346,457,717) | | |
| 375,076,609 | |
|
|
|
|
|
The accompanying notes are an integral part of these financial statements.
3
| | |
| ALPHA ARCHITECT U.S. QUANTITATIVE VALUE ETF |
| SCHEDULE OF INVESTMENTS (CONTINUED) |
| September 30, 2024 |
| | | | | | | | | | | | | | |
| SHORT-TERM INVESTMENTS - 0.2% | | Shares |
| Value |
| Money Market Funds - 0.2% |
| |
| |
First American Government Obligations Fund - Class X, 4.82% (b) |
| 907,975 | |
| $ | 907,975 | |
TOTAL SHORT-TERM INVESTMENTS (Cost $907,975) | | |
| 907,975 | |
|
|
|
|
|
TOTAL INVESTMENTS - 99.9% (Cost $347,365,692) | | |
| $ | 375,984,584 | |
| Other Assets in Excess of Liabilities - 0.1% | | |
| 236,894 | |
| TOTAL NET ASSETS - 100.0% |
| |
| $ | 376,221,478 | |
Percentages are stated as a percent of net assets.
| | |
| NV - Naamloze Vennootschap |
| | | | | | | | |
| (a) |
| Non-income producing security. |
| (b) |
| The rate shown represents the 7-day effective yield as of September 30, 2024. |
The Global Industry Classification Standard (GICS®) was developed by and/or is the exclusive property of MSCI, Inc. and Standard & Poor’s Financial Services LLC (“S&P”). GICS is a service mark of MSCI, Inc. and S&P and has been licensed for use by U.S. Bank Global Fund Services.
The accompanying notes are an integral part of these financial statements.
4
| | |
| ALPHA ARCHITECT INTERNATIONAL QUANTITATIVE VALUE ETF |
| SCHEDULE OF INVESTMENTS |
| September 30, 2024 |
| | | | | | | | | | | | | | |
| COMMON STOCKS - 99.0% |
| Shares |
| Value |
| Australia - 8.9% | | | |
|
| AGL Energy Ltd. |
| 376,277 | |
| $ | 3,077,436 | |
| Aurizon Holdings Ltd. |
| 1,294,828 | |
| 3,159,973 | |
| Fortescue Ltd. |
| 248,728 | |
| 3,556,082 | |
| Rio Tinto Ltd. |
| 40,718 | |
| 3,635,048 | |
|
|
|
| 13,428,539 | |
|
|
|
|
|
| China - 1.9% | | | |
|
| Yangzijiang Shipbuilding Holdings Ltd. |
| 1,495,130 | |
| 2,850,083 | |
|
|
|
|
|
| Finland - 4.0% | | | |
|
| Fortum Oyj |
| 188,683 | |
| 3,107,436 | |
| Nokia Oyj |
| 671,887 | |
| 2,934,808 | |
|
|
|
| 6,042,244 | |
|
|
|
|
|
| France - 10.0% | | | |
|
| Cie de Saint-Gobain SA |
| 34,406 | |
| 3,129,803 | |
| Cie Generale des Etablissements Michelin SCA |
| 75,847 | |
| 3,078,290 | |
| Eiffage SA |
| 27,562 | |
| 2,658,175 | |
| Engie SA |
| 166,146 | |
| 2,869,433 | |
| Rexel SA |
| 118,515 | |
| 3,426,097 | |
|
|
|
| 15,161,798 | |
|
|
|
|
|
| Italy - 6.1% | | | |
|
| Buzzi SpA |
| 77,865 | |
| 3,102,986 | |
| Enel SpA |
| 379,181 | |
| 3,028,467 | |
Saipem SpA (a) |
| 1,365,666 | |
| 3,007,703 | |
|
|
|
| 9,139,156 | |
|
|
|
|
|
Japan - 49.8%(b) | | | |
|
| Amada Co. Ltd. |
| 286,794 | |
| 2,908,347 | |
| Asahi Kasei Corp. |
| 411,579 | |
| 3,098,476 | |
| Bridgestone Corp. |
| 76,417 | |
| 2,924,289 | |
| Daito Trust Construction Co. Ltd. |
| 23,828 | |
| 2,886,384 | |
| Hitachi Construction Machinery Co. Ltd. |
| 119,438 | |
| 2,884,462 | |
| Honda Motor Co. Ltd. |
| 268,205 | |
| 2,813,143 | |
| Inpex Corp. |
| 197,660 | |
| 2,665,264 | |
Japan Airlines Co. Ltd. (c) |
| 176,584 | |
| 3,093,061 | |
| Komatsu Ltd. |
| 107,075 | |
| 2,954,666 | |
| Macnica Holdings, Inc. |
| 217,854 | |
| 3,010,319 | |
| Mazda Motor Corp. |
| 349,582 | |
| 2,602,559 | |
| Niterra Co. Ltd. |
| 99,064 | |
| 2,753,597 | |
The accompanying notes are an integral part of these financial statements.
5
| | |
| ALPHA ARCHITECT INTERNATIONAL QUANTITATIVE VALUE ETF |
| SCHEDULE OF INVESTMENTS (CONTINUED) |
| September 30, 2024 |
| | | | | | | | | | | | | | |
| COMMON STOCKS - 99.0% (CONTINUED) |
| Shares |
| Value |
Japan - 49.8%(b) (Continued) | | | | |
| Nitto Denko Corp. |
| 176,440 | |
| $ | 2,932,176 | |
| Persol Holdings Co. Ltd. |
| 1,499,448 | |
| 2,679,132 | |
| Sekisui Chemical Co. Ltd. |
| 193,975 | |
| 3,011,690 | |
| Shimamura Co. Ltd. |
| 54,974 | |
| 2,992,636 | |
| Subaru Corp. |
| 155,215 | |
| 2,680,422 | |
| Suntory Beverage & Food Ltd. |
| 80,131 | |
| 3,007,317 | |
| Suzuki Motor Corp. |
| 257,532 | |
| 2,853,503 | |
| Takashimaya Co. Ltd. |
| 379,627 | |
| 3,019,055 | |
| Toyo Tire Corp. |
| 200,003 | |
| 2,904,201 | |
| Toyota Motor Corp. |
| 155,232 | |
| 2,746,059 | |
| Toyota Tsusho Corp. |
| 154,325 | |
| 2,775,649 | |
| Yamaha Motor Co. Ltd. |
| 333,441 | |
| 2,969,591 | |
| Yamazaki Baking Co. Ltd. |
| 157,103 | |
| 3,110,361 | |
| Yokohama Rubber Co. Ltd. |
| 128,689 | |
| 2,875,972 | |
|
|
|
| 75,152,331 | |
|
|
|
|
|
| Portugal - 1.9% | | | |
|
| Galp Energia SGPS SA |
| 150,727 | |
| 2,818,738 | |
|
|
|
|
|
| Singapore - 2.0% | | | |
|
| Hafnia Ltd. |
| 416,653 | |
| 2,965,109 | |
|
|
|
|
|
| Sweden - 6.5% | | | |
|
| SKF AB - Class B |
| 165,923 | |
| 3,300,211 | |
| SSAB AB - Class B |
| 662,012 | |
| 3,389,635 | |
| Volvo AB - Class B |
| 117,102 | |
| 3,092,479 | |
|
|
|
| 9,782,325 | |
|
|
|
|
|
| United Kingdom - 7.9% | | | |
|
| easyJet PLC |
| 463,002 | |
| 3,218,860 | |
| Imperial Brands PLC |
| 101,482 | |
| 2,948,252 | |
| Shell PLC |
| 86,311 | |
| 2,798,296 | |
| Tesco PLC |
| 615,936 | |
| 2,953,811 | |
|
|
|
| 11,919,219 | |
TOTAL COMMON STOCKS (Cost $148,454,401) | | |
| 149,259,542 | |
|
|
|
|
|
| SHORT-TERM INVESTMENTS - 1.9% | |
|
|
|
| Investments Purchased with Proceeds from Securities Lending - 1.8% |
| |
| |
First American Government Obligations Fund - Class X, 4.82% (d) |
| 2,701,695 | |
| 2,701,695 | |
|
|
|
|
|
The accompanying notes are an integral part of these financial statements.
6
| | |
| ALPHA ARCHITECT INTERNATIONAL QUANTITATIVE VALUE ETF |
| SCHEDULE OF INVESTMENTS (CONTINUED) |
| September 30, 2024 |
| | | | | | | | | | | | | | |
| SHORT-TERM INVESTMENTS - 1.9% | | Shares | | Value |
| Money Market Funds - 0.1% |
| |
| |
First American Government Obligations Fund - Class X, 4.82% (d) |
| 150,545 | |
| $ | 150,545 | |
TOTAL SHORT-TERM INVESTMENTS (Cost $2,852,240) | | |
| 2,852,240 | |
|
|
|
|
|
TOTAL INVESTMENTS - 100.9% (Cost $151,306,641) | | |
| $ | 152,111,782 | |
| Liabilities in Excess of Other Assets - (0.9)% | | |
| (1,352,782) | |
| TOTAL NET ASSETS - 100.0% |
| |
| $ | 150,759,000 | |
Percentages are stated as a percent of net assets.
| | |
| AB - Aktiebolag |
| PLC - Public Limited Company |
| SA - Sociedad Anónima |
| | | | | | | | |
| (a) |
| Non-income producing security. |
| (b) |
| To the extent that the Fund invests a significant portion of its assets in the securities of companies of a single country or region, it is more likely to be impacted by events or conditions affecting the country or region. See the Fund’s prospectus for additional risk disclosures. |
| (c) |
| All or a portion of this security is on loan as of September 30, 2024. The total market value of these securities was $2,549,585 which represented 1.7% of net assets. |
| (d) |
| The rate shown represents the 7-day effective yield as of September 30, 2024. |
The accompanying notes are an integral part of these financial statements.
7
| | |
| ALPHA ARCHITECT U.S. QUANTITATIVE MOMENTUM ETF |
| SCHEDULE OF INVESTMENTS |
| September 30, 2024 |
| | | | | | | | | | | | | | |
| COMMON STOCKS - 99.7% |
| Shares |
| Value |
| Aerospace & Defense - 4.1% | | | |
|
| General Electric Co. |
| 27,846 | |
| $ | 5,251,199 | |
| Howmet Aerospace, Inc. |
| 50,156 | |
| 5,028,139 | |
|
|
|
| 10,279,338 | |
|
|
|
|
|
| Apparel Retail - 1.8% | | | |
|
Abercrombie & Fitch Co. - Class A (a) |
| 33,252 | |
| 4,651,955 | |
|
|
|
|
|
| Application Software - 6.2% | | | |
|
Fair Isaac Corp. (a) |
| 2,825 | |
| 5,490,444 | |
Nutanix, Inc. - Class A (a) |
| 76,838 | |
| 4,552,651 | |
Zeta Global Holdings Corp. - Class A (a) |
| 184,961 | |
| 5,517,387 | |
|
|
|
| 15,560,482 | |
|
|
|
|
|
| Asset Management & Custody Banks - 8.2% | | | |
|
| Blue Owl Capital, Inc. - Class A |
| 276,487 | |
| 5,352,788 | |
| Carlyle Group, Inc. |
| 121,551 | |
| 5,233,986 | |
| KKR & Co., Inc. |
| 39,355 | |
| 5,138,976 | |
| StepStone Group, Inc. - Class A |
| 88,955 | |
| 5,055,313 | |
|
|
|
| 20,781,063 | |
|
|
|
|
|
| Automotive Retail - 1.8% | | | |
|
| Murphy USA, Inc. |
| 9,368 | |
| 4,617,206 | |
|
|
|
|
|
| Biotechnology - 2.1% | | | |
|
Natera, Inc. (a) |
| 41,684 | |
| 5,291,784 | |
|
|
|
|
|
| Building Products - 6.1% | | | |
|
| Carlisle Cos., Inc. |
| 11,530 | |
| 5,185,617 | |
| Lennox International, Inc. |
| 8,289 | |
| 5,008,960 | |
| Trane Technologies PLC |
| 13,540 | |
| 5,263,404 | |
|
|
|
| 15,457,981 | |
|
|
|
|
|
| Construction & Engineering - 2.1% | | | |
|
| EMCOR Group, Inc. |
| 12,425 | |
| 5,349,335 | |
|
|
|
|
|
| Consumer Electronics - 1.9% | | | |
|
| Garmin Ltd. |
| 26,601 | |
| 4,682,574 | |
|
|
|
|
|
| Consumer Finance - 3.5% | | | |
|
| Ally Financial, Inc. |
| 112,522 | |
| 4,004,658 | |
| Synchrony Financial |
| 96,805 | |
| 4,828,633 | |
|
|
|
| 8,833,291 | |
|
|
|
|
|
The accompanying notes are an integral part of these financial statements.
8
| | |
| ALPHA ARCHITECT U.S. QUANTITATIVE MOMENTUM ETF |
| SCHEDULE OF INVESTMENTS (CONTINUED) |
| September 30, 2024 |
| | | | | | | | | | | | | | |
| COMMON STOCKS - 99.7% (CONTINUED) |
| Shares |
| Value |
| Diversified Banks - 3.8% | | | |
|
| Fifth Third Bancorp |
| 114,178 | |
| $ | 4,891,385 | |
| PNC Financial Services Group, Inc. |
| 26,135 | |
| 4,831,055 | |
|
|
|
| 9,722,440 | |
|
|
|
|
|
| Electric Utilities - 4.6% | | | |
|
| Constellation Energy Corp. |
| 24,492 | |
| 6,368,410 | |
| NRG Energy, Inc. |
| 57,648 | |
| 5,251,733 | |
|
|
|
| 11,620,143 | |
|
|
|
|
|
| Food Retail - 2.0% | | | |
|
Sprouts Farmers Market, Inc. (a) |
| 46,611 | |
| 5,146,320 | |
|
|
|
|
|
| Footwear - 1.9% | | | |
|
Deckers Outdoor Corp. (a) |
| 30,722 | |
| 4,898,623 | |
|
|
|
|
|
| Health Care Facilities - 3.8% | | | |
|
Tenet Healthcare Corp. (a) |
| 29,493 | |
| 4,901,737 | |
| Universal Health Services, Inc. - Class B |
| 20,405 | |
| 4,672,949 | |
|
|
|
| 9,574,686 | |
|
|
|
|
|
| Homebuilding - 4.1% | | | |
|
| KB Home |
| 58,540 | |
| 5,016,292 | |
| Toll Brothers, Inc. |
| 33,920 | |
| 5,240,301 | |
|
|
|
| 10,256,593 | |
|
|
|
|
|
| Independent Power Producers & Energy Traders - 2.7% | | | |
|
| Vistra Corp. |
| 56,941 | |
| 6,749,786 | |
|
|
|
|
|
| Interactive Media & Services - 2.1% | | | |
|
| Meta Platforms, Inc. - Class A |
| 9,302 | |
| 5,324,837 | |
|
|
|
|
|
| Internet Services & Infrastructure - 1.8% | | | |
|
GoDaddy, Inc. - Class A (a) |
| 29,097 | |
| 4,561,828 | |
|
|
|
|
|
| Investment Banking & Brokerage - 3.9% | | | |
|
| Evercore, Inc. - Class A |
| 19,812 | |
| 5,019,172 | |
| Goldman Sachs Group, Inc. |
| 9,513 | |
| 4,709,981 | |
|
|
|
| 9,729,153 | |
|
|
|
|
|
| Movies & Entertainment - 2.1% | | | |
|
Spotify Technology SA (a) |
| 14,085 | |
| 5,190,745 | |
|
|
|
|
|
The accompanying notes are an integral part of these financial statements.
9
| | |
| ALPHA ARCHITECT U.S. QUANTITATIVE MOMENTUM ETF |
| SCHEDULE OF INVESTMENTS (CONTINUED) |
| September 30, 2024 |
| | | | | | | | | | | | | | |
| COMMON STOCKS - 99.7% (CONTINUED) |
| Shares |
| Value |
| Oil & Gas Equipment & Services - 1.6% | | | |
|
Tidewater, Inc. (a) |
| 54,902 | |
| $ | 3,941,415 | |
|
|
|
|
|
| Property & Casualty Insurance - 3.9% | | | |
|
| Allstate Corp. |
| 25,672 | |
| 4,868,695 | |
| Progressive Corp. |
| 19,276 | |
| 4,891,477 | |
|
|
|
| 9,760,172 | |
|
|
|
|
|
| Regional Banks - 1.8% | | | |
|
| Truist Financial Corp. |
| 109,139 | |
| 4,667,875 | |
|
|
|
|
|
| Reinsurance - 1.9% | | | |
|
| Reinsurance Group of America, Inc. |
| 22,064 | |
| 4,807,084 | |
|
|
|
|
|
| Restaurants - 6.2% | | | |
|
Brinker International, Inc. (a) |
| 68,497 | |
| 5,242,076 | |
| Texas Roadhouse, Inc. |
| 28,705 | |
| 5,069,303 | |
| Wingstop, Inc. |
| 12,627 | |
| 5,253,842 | |
|
|
|
| 15,565,221 | |
|
|
|
|
|
| Soft Drinks & Non-alcoholic Beverages - 1.9% | | | |
|
| Coca-Cola Consolidated, Inc. |
| 3,627 | |
| 4,774,583 | |
|
|
|
|
|
| Steel - 2.1% | | | |
|
| Carpenter Technology Corp. |
| 33,677 | |
| 5,374,176 | |
|
|
|
|
|
| Systems Software - 1.9% | | | |
|
Crowdstrike Holdings, Inc. - Class A (a) |
| 17,362 | |
| 4,869,520 | |
| | | | |
| Technology Hardware, Storage & Peripherals - 4.0% | | | |
|
| NetApp, Inc. |
| 40,364 | |
| 4,985,357 | |
Western Digital Corp. (a) |
| 74,430 | |
| 5,082,825 | |
|
|
|
| 10,068,182 | |
|
|
|
|
|
| Trading Companies & Distributors - 3.8% | | | |
|
Core & Main, Inc. - Class A (a) |
| 100,270 | |
| 4,451,988 | |
| FTAI Aviation Ltd. |
| 38,423 | |
| 5,106,417 | |
|
|
|
| 9,558,405 | |
TOTAL COMMON STOCKS (Cost $217,733,813) | | |
| 251,666,796 | |
|
|
|
|
|
The accompanying notes are an integral part of these financial statements.
10
| | |
| ALPHA ARCHITECT U.S. QUANTITATIVE MOMENTUM ETF |
| SCHEDULE OF INVESTMENTS (CONTINUED) |
| September 30, 2024 |
| | | | | | | | | | | | | | |
| SHORT-TERM INVESTMENTS - 0.3% | | Shares |
| Value |
| Money Market Funds - 0.3% |
| |
| |
First American Government Obligations Fund - Class X, 4.82% (b) |
| 866,204 | |
| $ | 866,204 | |
TOTAL SHORT-TERM INVESTMENTS (Cost $866,204) | | |
| 866,204 | |
|
|
|
|
|
TOTAL INVESTMENTS - 100.0% (Cost $218,600,017) | | |
| $ | 252,533,000 | |
Other Assets in Excess of Liabilities - 0.0% (c) | | |
| 30,718 | |
| TOTAL NET ASSETS - 100.0% |
| |
| $ | 252,563,718 | |
| | |
| PLC - Public Limited Company |
| SA - Sociedad Anónima |
| | | | | | | | |
| (a) |
| Non-income producing security. |
| (b) |
| The rate shown represents the 7-day effective yield as of September 30, 2024. |
| (c) |
| Represents less than 0.05% of net assets. |
The Global Industry Classification Standard (GICS®) was developed by and/or is the exclusive property of MSCI, Inc. and Standard & Poor’s Financial Services LLC (“S&P”). GICS is a service mark of MSCI, Inc. and S&P and has been licensed for use by U.S. Bank Global Fund Services.
The accompanying notes are an integral part of these financial statements.
11
| | |
| ALPHA ARCHITECT INTERNATIONAL QUANTITATIVE MOMENTUM ETF |
| SCHEDULE OF INVESTMENTS |
| September 30, 2024 |
| | | | | | | | | | | | | | |
| COMMON STOCKS - 99.2% |
| Shares |
| Value |
| Australia - 8.7% | | | |
|
| JB Hi-Fi Ltd. |
| 29,731 | |
| $ | 1,643,124 | |
| Pro Medicus Ltd. |
| 15,920 | |
| 1,961,865 | |
Telix Pharmaceuticals Ltd. (a) |
| 136,891 | |
| 1,961,872 | |
| Westpac Banking Corp. |
| 76,127 | |
| 1,669,431 | |
|
|
|
| 7,236,292 | |
|
|
|
|
|
| Austria - 3.3% | | | |
|
| Erste Group Bank AG |
| 30,354 | |
| 1,664,089 | |
Immofinanz AG (a) |
| 55,426 | |
| 1,108,088 | |
|
|
|
| 2,772,177 | |
|
|
|
|
|
| Belgium - 1.9% | | | |
|
| UCB SA |
| 8,749 | |
| 1,577,712 | |
|
|
|
|
|
| Denmark - 5.7% | | | |
|
| Novonesis (Novozymes) B |
| 23,728 | |
| 1,708,587 | |
| Pandora AS |
| 9,285 | |
| 1,528,655 | |
Zealand Pharma AS (a) |
| 12,473 | |
| 1,514,295 | |
|
|
|
| 4,751,537 | |
|
|
|
|
|
| Germany - 8.4% | | | |
|
| Commerzbank AG |
| 110,595 | |
| 2,034,377 | |
| Deutsche Bank AG |
| 100,818 | |
| 1,739,275 | |
| Rheinmetall AG |
| 2,710 | |
| 1,467,294 | |
| SAP SE |
| 7,504 | |
| 1,707,372 | |
|
|
|
| 6,948,318 | |
|
|
|
|
|
| Ireland - 2.0% | | | |
|
| AerCap Holdings NV |
| 17,099 | |
| 1,619,617 | |
|
|
|
|
|
| Israel - 2.0% | | | |
|
CyberArk Software Ltd. (a) |
| 5,642 | |
| 1,645,264 | |
|
|
|
|
|
| Italy - 9.9% | | | |
|
| Banco BPM SpA |
| 238,335 | |
| 1,607,206 | |
| Intesa Sanpaolo SpA |
| 389,607 | |
| 1,664,292 | |
| Leonardo SpA |
| 68,323 | |
| 1,522,599 | |
| Prysmian SpA |
| 23,271 | |
| 1,688,951 | |
| UniCredit SpA |
| 38,581 | |
| 1,690,589 | |
|
|
|
| 8,173,637 | |
|
|
|
|
|
The accompanying notes are an integral part of these financial statements.
12
| | |
| ALPHA ARCHITECT INTERNATIONAL QUANTITATIVE MOMENTUM ETF |
| SCHEDULE OF INVESTMENTS (CONTINUED) |
| September 30, 2024 |
| | | | | | | | | | | | | | |
| COMMON STOCKS - 99.2% (CONTINUED) |
| Shares |
| Value |
Japan - 27.0%(b) | | | |
|
| Asics Corp. |
| 82,790 | |
| $ | 1,728,668 | |
| Credit Saison Co. Ltd. |
| 68,264 | |
| 1,700,841 | |
| Dai-ichi Life Holdings, Inc. |
| 55,104 | |
| 1,411,674 | |
| Dexerials Corp. |
| 110,190 | |
| 1,552,895 | |
| Disco Corp. |
| 5,900 | |
| 1,538,988 | |
| Fuji Soft, Inc. |
| 26,415 | |
| 1,657,772 | |
| Idemitsu Kosan Co. Ltd. |
| 221,443 | |
| 1,583,882 | |
| IHI Corp. |
| 35,572 | |
| 1,842,146 | |
| MS&AD Insurance Group Holdings, Inc. |
| 62,386 | |
| 1,445,437 | |
| NEC Corp. |
| 17,327 | |
| 1,657,653 | |
| NS Solutions Corp. |
| 63,439 | |
| 1,648,597 | |
| Sompo Holdings, Inc. |
| 66,297 | |
| 1,476,547 | |
| Sumitomo Mitsui Financial Group, Inc. |
| 71,730 | |
| 1,519,693 | |
| TDK Corp. |
| 119,970 | |
| 1,521,693 | |
|
|
|
| 22,286,486 | |
|
|
|
|
|
| Netherlands - 1.9% | | | |
|
| Arcadis NV |
| 22,438 | |
| 1,553,563 | |
|
|
|
|
|
| Norway - 1.9% | | | |
|
| Kongsberg Gruppen ASA |
| 16,025 | |
| 1,567,126 | |
|
|
|
|
|
| Portugal - 1.9% | | | |
|
| Banco Comercial Portugues SA |
| 3,453,127 | |
| 1,558,299 | |
|
|
|
|
|
| Singapore - 2.3% | | | |
|
Sea Ltd. - ADR (a) |
| 20,420 | |
| 1,925,198 | |
|
|
|
|
|
| Spain - 2.0% | | | |
|
| CaixaBank SA |
| 272,644 | |
| 1,627,943 | |
|
|
|
|
|
| Sweden - 7.8% | | | |
|
Investor AB (a) |
| 55,067 | |
| 1,694,707 | |
| Saab AB |
| 73,607 | |
| 1,564,788 | |
| Tele2 AB - Class B |
| 142,523 | |
| 1,612,459 | |
| Telia Co. AB |
| 499,651 | |
| 1,615,674 | |
|
|
|
| 6,487,628 | |
|
|
|
|
|
| Switzerland - 4.1% | | | |
|
| Givaudan SA |
| 313 |
| 1,715,980 | |
| Holcim AG |
| 17,009 | |
| 1,659,199 | |
|
|
|
| 3,375,179 | |
|
|
|
|
|
The accompanying notes are an integral part of these financial statements.
13
| | |
| ALPHA ARCHITECT INTERNATIONAL QUANTITATIVE MOMENTUM ETF |
| SCHEDULE OF INVESTMENTS (CONTINUED) |
| September 30, 2024 |
| | | | | | | | | | | | | | |
| COMMON STOCKS - 99.2% (CONTINUED) |
| Shares |
| Value |
| United Kingdom - 8.4% | | | |
|
| 3i Group PLC |
| 39,890 | |
| $ | 1,762,590 | |
| Marks & Spencer Group PLC |
| 349,482 | |
| 1,740,939 | |
| RELX PLC |
| 34,928 | |
| 1,638,600 | |
Rolls-Royce Holdings PLC (a) |
| 252,214 | |
| 1,777,708 | |
|
|
|
| 6,919,837 | |
TOTAL COMMON STOCKS (Cost $76,034,797) | | |
| 82,025,813 | |
|
|
|
|
|
| SHORT-TERM INVESTMENTS - 0.2% | |
|
|
|
| Money Market Funds - 0.2% |
| |
| |
First American Government Obligations Fund - Class X, 4.82% (c) |
| 134,817 | |
| 134,817 | |
TOTAL SHORT-TERM INVESTMENTS (Cost $134,817) | | |
| 134,817 | |
|
|
|
|
|
TOTAL INVESTMENTS - 99.4% (Cost $76,169,614) | | |
| $ | 82,160,630 | |
| Other Assets in Excess of Liabilities - 0.6% | | |
| 491,691 | |
| TOTAL NET ASSETS - 100.0% |
| |
| $ | 82,652,321 | |
Percentages are stated as a percent of net assets.
| | |
| AB - Aktiebolag |
| ADR - American Depositary Receipt |
| AG - Aktiengesellschaft |
| ASA - Advanced Subscription Agreement |
| NV - Naamloze Vennootschap |
| PLC - Public Limited Company |
| SA - Sociedad Anónima |
| | | | | | | | |
| (a) |
| Non-income producing security. |
| (b) |
| To the extent that the Fund invests a significant portion of its assets in the securities of companies of a single country or region, it is more likely to be impacted by events or conditions affecting the country or region. |
| (c) |
| The rate shown represents the 7-day effective yield as of September 30, 2024. |
The accompanying notes are an integral part of these financial statements.
14
| | |
| ALPHA ARCHITECT VALUE MOMENTUM TREND ETF |
| SCHEDULE OF INVESTMENTS |
| September 30, 2024 |
| | | | | | | | | | | | | | |
EXCHANGE TRADED FUNDS - 99.6% (a) |
| Shares |
| Value |
| International Developed Equity - 34.1% | | | | |
Alpha Architect International Quantitative Momentum ETF ( b) |
| 147,148 | |
| $ | 4,239,334 | |
| Alpha Architect International Quantitative Value ETF |
| 123,574 | |
| 3,186,677 | |
| | | | 7,426,011 | |
| U.S. Equity - 65.5% | | | | |
Alpha Architect US Quantitative Momentum ETF (b)(c) |
| 120,912 | |
| 7,761,341 | |
Alpha Architect US Quantitative Value ETF (b)(c) |
| 141,116 | |
| 6,510,556 | |
| | | | 14,271,897 | |
TOTAL EXCHANGE TRADED FUNDS (Cost $18,464,880) | | |
| 21,697,908 | |
|
|
|
|
|
| SHORT-TERM INVESTMENTS - 11.2% | |
|
|
|
| Investments Purchased with Proceeds from Securities Lending - 10.8% |
| |
| |
First American Government Obligations Fund - Class X, 4.82% (d) |
| 2,350,525 | |
| 2,350,525 | |
|
|
|
|
|
| Money Market Funds - 0.4% |
| |
| |
First American Government Obligations Fund - Class X, 4.82% (d) |
| 93,732 | |
| 93,732 | |
TOTAL SHORT-TERM INVESTMENTS (Cost $2,444,257) | | |
| 2,444,257 | |
|
|
|
|
|
TOTAL INVESTMENTS - 110.8% (Cost $20,909,137) | | |
| $ | 24,142,165 | |
| Liabilities in Excess of Other Assets - (10.8)% | | |
| (2,354,440) | |
| TOTAL NET ASSETS - 100.0% |
| |
| $ | 21,787,725 | |
Percentages are stated as a percent of net assets.
| | | | | | | | |
| (a) | | Affiliated company as defined by the Investment Company Act of 1940. |
| (b) |
| All or a portion of this security is on loan as of September 30, 2024. The total market value of these securities was $2,303,118 which represented 10.6% of net assets. |
| (c) |
| Fair value of this security exceeds 25% of the Fund’s net assets. Additional information for this security, including the financial statements, is available from the SEC’s EDGAR database at www.sec.gov. |
| (d) |
| The rate shown represents the 7-day effective yield as of September 30, 2024. |
The accompanying notes are an integral part of these financial statements.
15
| | |
| ALPHA ARCHITECT HIGH INFLATION AND DEFLATION ETF |
| SCHEDULE OF INVESTMENTS |
| September 30, 2024 |
| | | | | | | | | | | | | | |
| EXCHANGE TRADED FUNDS - 75.8% |
| Shares |
| Value |
Schwab Intermediate-Term U.S. Treasury ETF (a) |
| 306,351 | |
| $ | 15,501,361 | |
| Vanguard Real Estate ETF |
| 76,479 | |
| 7,450,584 | |
TOTAL EXCHANGE TRADED FUNDS (Cost $21,867,993) | | |
| 22,951,945 | |
|
|
|
|
|
| SHORT-TERM INVESTMENTS - 24.0% | |
|
|
|
| Money Market Funds - 0.3% |
| |
| |
First American Government Obligations Fund - Class X, 4.82% (b) |
| 98,287 | |
| 98,287 | |
|
|
|
|
|
| U.S. Treasury Bills - 23.7% |
| Par |
| |
5.13%, 10/03/2024 (c) |
| $ | 7,166,000 | |
| 7,163,974 | |
TOTAL SHORT-TERM INVESTMENTS (Cost $7,262,261) | | |
| 7,262,261 | |
|
|
|
|
|
TOTAL INVESTMENTS - 99.8% (Cost $29,130,254) | | |
| $ | 30,214,206 | |
| Other Assets in Excess of Liabilities - 0.2% | | |
| 56,617 | |
| TOTAL NET ASSETS - 100.0% |
| |
| $ | 30,270,823 | |
Percentages are stated as a percent of net assets.
| | | | | | | | |
| (a) |
| Fair value of this security exceeds 25% of the Fund’s net assets. Additional information for this security, including the financial statements, is available from the SEC’s EDGAR database at www.sec.gov. |
| (b) |
| The rate shown represents the 7-day effective yield as of September 30, 2024. |
| (c) |
| The rate shown is the effective yield as of September 30, 2024. |
The accompanying notes are an integral part of these financial statements.
16
| | |
| ALPHA ARCHITECT TAIL RISK ETF |
| SCHEDULE OF INVESTMENTS |
| September 30, 2024 |
| | | | | | | | | | | | | | | | | |
PURCHASED OPTIONS - 117.0% (a)(b)(c) | Notional Amount |
| Contracts |
| Value |
| Call Options - 4.6% | |
| | | |
| SPDR S&P 500 ETF Trust | |
| | | |
Expiration: 11/15/2024; Exercise Price: $10.01(d) | $ | 11,188,320 | |
| 195 | |
| $ | 10,998,031 | |
Expiration: 11/15/2024; Exercise Price: $1.01(d) | 459,008 | |
| 8 | |
| 458,344 | |
| Total Call Options |
|
|
|
| 11,456,375 | |
|
|
|
|
|
|
| Put Options - 112.4% | |
|
|
| |
| S&P 500 Index | |
| | | |
| Expiration: 10/18/2024; Exercise Price: $2,500.00 | 1,588,715,736 | |
| 2,757 | |
| 13,785 | |
| Expiration: 11/15/2024; Exercise Price: $2,600.00 | 1,627,900,600 | |
| 2,825 | |
| 91,813 | |
| Expiration: 12/20/2024; Exercise Price: $10,000.00 | 132,537,040 | |
| 230 | |
| 95,187,634 | |
Expiration: 12/20/2024; Exercise Price: $10,000.01(d) | 576,248 | |
| 1 | |
| 413,859 | |
| Expiration: 12/20/2024; Exercise Price: $2,500.00 | 1,597,359,456 | |
| 2,772 | |
| 353,430 | |
| Expiration: 01/17/2025; Exercise Price: $2,500.00 | 523,233,184 | |
| 908 | |
| 206,570 | |
| SPDR S&P 500 ETF Trust | |
| | | |
Expiration: 11/15/2024; Exercise Price: $10,010.01(d) | 11,188,320 | |
| 195 | |
| 182,690,721 | |
Expiration: 11/15/2024; Exercise Price: $1,001.01(d) | 459,008 | |
| 8 | |
| 336,280 | |
| Total Put Options |
|
|
|
| 279,294,092 | |
TOTAL PURCHASED OPTIONS (Cost $293,095,735) | | | |
| 290,750,467 | |
|
|
|
|
|
|
| EXCHANGE TRADED FUNDS - 11.7% | |
| Shares |
| |
Alpha Architect 1-3 Month Box ETF (e) | |
| 265,475 | |
| 28,918,192 | |
TOTAL EXCHANGE TRADED FUNDS (Cost $27,974,451) | | |
| 28,918,192 | |
|
|
|
|
|
|
| SHORT-TERM INVESTMENTS - 0.6% | | |
|
|
|
| Money Market Funds - 0.6% | |
| |
| |
First American Government Obligations Fund - Class X, 4.82% (f) |
| 1,608,862 | |
| 1,608,862 | |
TOTAL SHORT-TERM INVESTMENTS (Cost $1,608,862) | | |
| 1,608,862 | |
|
|
|
|
|
|
TOTAL INVESTMENTS - 129.3% (Cost $322,679,048) | | |
| $ | 321,277,521 | |
| Liabilities in Excess of Other Assets - (29.3)% | | | |
| (72,752,689) | |
| TOTAL NET ASSETS - 100.0% |
|
| |
| $ | 248,524,832 | |
Percentages are stated as a percent of net assets.
| | | | | | | | |
| (a) |
| Exchange-traded. |
| (b) |
| 100 shares per contract. |
| (c) |
| Purchased option contracts are held in connection with corresponding written option contracts. See the Schedule of Written Options for further information. |
| (d) |
| FLexible EXchange® Options. |
| (e) |
| Affiliated company as defined by the Investment Company Act of 1940. |
| (f) |
| The rate shown represents the 7-day effective yield as of September 30, 2024. |
The accompanying notes are an integral part of these financial statements.
17
| | |
| ALPHA ARCHITECT TAIL RISK ETF |
| SCHEDULE OF WRITTEN OPTIONS |
| September 30, 2024 |
| | | | | | | | | | | | | | | | | |
WRITTEN OPTIONS - (29.2)% (a)(b) | Notional Amount |
| Contracts |
| Value |
Call Options - 0.0% (c) |
|
|
|
|
|
SPDR S&P 500 ETF Trust (a)(b)(d) |
|
|
|
|
|
| Expiration: 11/15/2024; Exercise Price: $1,001.01 | $ | (459,008) | |
| (8) | |
| $ (0)(e) |
| Expiration: 11/15/2024; Exercise Price: $10,010.01 | (11,188,320) | |
| (195) | |
| (0)(e) |
| Total Call Options |
|
|
|
| (0)(e) |
|
|
|
|
|
|
Put Options - (29.2)% (a)(b) |
|
|
|
|
|
| S&P 500 Index |
|
|
|
|
|
Expiration: 12/20/2024; Exercise Price: $9,000.01 (d) | (576,248) | |
| (1) | |
| (314,991) | |
| Expiration: 12/20/2024; Exercise Price: $8,000.00 | (576,248) | |
| (1) | |
| (216,395) | |
| Expiration: 12/20/2024; Exercise Price: $9,000.00 | (131,960,792) | |
| (229) | |
| (72,132,847) | |
SPDR S&P 500 ETF Trust (d) |
|
|
|
|
|
| Expiration: 11/15/2024; Exercise Price: $1.01 | (459,008) | |
| (8) | |
| (5) | |
| Expiration: 11/15/2024; Exercise Price: $10.01 | (11,188,320) | |
| (195) | |
| (332) | |
| Total Put Options |
|
|
|
| (72,664,570) | |
TOTAL WRITTEN OPTIONS (Premiums received $74,370,791) |
|
|
| $ | (72,664,570) | |
Percentages are stated as a percent of net assets.
| | | | | | | | |
| (a) |
| 100 shares per contract. |
| (b) |
| Exchange-traded. |
| (c) |
| Represents less than 0.05% of net assets. |
| (d) |
| FLexible Exchange® Options. |
| (e) | | Less than $0.50. |
The accompanying notes are an integral part of these financial statements.
18
| | |
| ALPHA ARCHITECT 1-3 MONTH BOX ETF |
| SCHEDULE OF INVESTMENTS |
| September 30, 2024 |
| | | | | | | | | | | | | | | | | |
PURCHASED OPTIONS - 158.5%(a)(b)(c) | Notional Amount |
| Contracts |
| Value |
| Call Options - 9.9% | |
|
|
| |
| Invesco QQQ Trust Series 1 | | | | | |
Expiration: 11/15/2024; Exercise Price: $10,005.01(d) | $ | 97,614 | |
| 2 | |
| $ 0(g) |
| S&P 500 Index | |
| | | |
| Expiration: 11/15/2024; Exercise Price: $5,000.00 | 112,944,608 | |
| 196 | |
| 15,691,544 | |
Expiration: 11/15/2024; Exercise Price: $5,000.01(d) | 576,248 | |
| 1 | |
| 80,059 | |
| Expiration: 12/20/2024; Exercise Price: $5,000.00 | 121,012,080 | |
| 210 | |
| 17,569,650 | |
| Expiration: 12/20/2024; Exercise Price: $9,200.00 | 1,427,942,544 | |
| 2,478 | |
| 2,429 | |
Expiration: 12/20/2024; Exercise Price: $9,200.01(d) | 27,083,656 | |
| 47 | |
| 46 | |
| SPDR S&P 500 ETF Trust | |
| | | |
Expiration: 11/15/2024; Exercise Price: $10.01(d) | 360,837,664 | |
| 6,289 | |
| 354,700,606 | |
Expiration: 11/15/2024; Exercise Price: $1.01(d) | 5,737,600 | |
| 100 | |
| 5,729,302 | |
| Total Call Options |
|
|
|
| 393,773,636 | |
|
|
|
|
|
|
| Put Options - 148.6% | |
|
|
| |
| Invesco QQQ Trust Series 1 | | | | | |
Expiration: 11/15/2024; Exercise Price: $15.01(d) | 97,614 | |
| 2 | |
| 0(g) |
| S&P 500 Index | |
| | | |
| Expiration: 11/15/2024; Exercise Price: $4,000.00 | 112,944,608 | |
| 196 | |
| 58,335 | |
Expiration: 11/15/2024; Exercise Price: $4,000.01(d) | 576,248 | |
| 1 | |
| 298 | |
| Expiration: 12/20/2024; Exercise Price: $4,000.00 | 121,012,080 | |
| 210 | |
| 154,350 | |
| Expiration: 12/20/2024; Exercise Price: $200.00 | 1,427,942,544 | |
| 2,478 | |
| 0(g) |
Expiration: 12/20/2024; Exercise Price: $200.01(d) | 27,083,656 | |
| 47 | |
| 0(g) |
| SPDR S&P 500 ETF Trust | |
| | | |
Expiration: 11/15/2024; Exercise Price: $10,010.01(d) | 360,837,664 | |
| 6,289 | |
| 5,892,009,957 | |
Expiration: 11/15/2024; Exercise Price: $1,001.01(d) | 5,737,600 | |
| 100 | |
| 4,203,501 | |
| Total Put Options |
|
|
|
| 5,896,426,441 | |
TOTAL PURCHASED OPTIONS (Cost $6,266,644,846) | | |
| 6,290,200,077 | |
|
|
|
|
|
|
SHORT-TERM INVESTMENTS - 0.0%(e) | | |
|
|
|
Money Market Funds - 0.0%(e) | |
| |
| |
First American Government Obligations Fund - Class X, 4.82% (f) |
| 1,969,805 | |
| 1,969,805 | |
TOTAL SHORT-TERM INVESTMENTS (Cost $1,969,805) | | |
| 1,969,805 | |
|
|
|
|
|
|
TOTAL INVESTMENTS - 158.5% (Cost $6,268,614,651) | | |
| $ | 6,292,169,882 | |
| Liabilities in Excess of Other Assets - (58.5)% | | | |
| (2,323,216,417) | |
| TOTAL NET ASSETS - 100.0% |
|
| |
| $ | 3,968,953,465 | |
Percentages are stated as a percent of net assets.
The accompanying notes are an integral part of these financial statements.
19
| | |
| ALPHA ARCHITECT 1-3 MONTH BOX ETF |
| SCHEDULE OF INVESTMENTS (CONTINUED) |
| September 30, 2024 |
| | | | | | | | |
| (a) |
| Exchange-traded. |
| (b) |
| 100 shares per contract. |
| (c) |
| Purchased option contracts are held in connection with corresponding written option contracts. See the Schedule of Written Options for further information. |
| (d) |
| FLexible EXchange® Options. |
| (e) |
| Represents less than 0.05% of net assets. |
| (f) |
| The rate shown represents the 7-day effective yield as of September 30, 2024. |
| (g) | | Less than $0.50. |
| | | | | | | | | | | | | | | | | |
| SCHEDULE OF WRITTEN OPTIONS |
| September 30, 2024 |
| | | | | | | | | | | | | | | | | |
WRITTEN OPTIONS - (58.5)% (a)(b) | Notional Amount |
| Contracts |
| Value |
Call Options - (37.1)% (a)(b) |
|
|
|
|
|
Invesco QQQ Trust Series 1 Expiration: 11/15/2024; Exercise Price: $15.01(c) | $ | (97,614) | |
| (2) | |
| $ | (94,601) | |
| S&P 500 Index |
|
|
|
|
|
Expiration: 11/15/2024; Exercise Price: $4,000.01(c) | (576,248) | |
| (1) | |
| (178,356) | |
| Expiration: 11/15/2024; Exercise Price: $4,000.00 | (112,944,608) | |
| (196) | |
| (34,957,837) | |
Expiration: 12/20/2024; Exercise Price: $200.01(c) | (27,083,656) | |
| (47) | |
| (26,088,516) | |
| Expiration: 12/20/2024; Exercise Price: $200.00 | (1,427,942,544) | |
| (2,478) | |
| (1,375,475,354) | |
| Expiration: 12/20/2024; Exercise Price: $4,000.00 | (121,012,080) | |
| (210) | |
| (37,893,450) | |
| SPDR S&P 500 ETF Trust |
|
|
|
|
|
Expiration: 11/15/2024; Exercise Price: $1,001.01(c) | (5,737,600) | |
| (100) | |
| (2) | |
Expiration: 11/15/2024; Exercise Price: $10,010.01(c) | (360,837,664) | |
| (6,289) | |
| (0)(d) |
| Total Call Options |
|
|
|
| (1,474,688,116) | |
|
|
|
|
|
|
Put Options - (21.4)% (a)(b) |
|
|
|
|
|
Invesco QQQ Trust Series 1 Expiration: 11/15/2024; Exercise Price: $10,005.01(c) | (97,614) | |
| (2) | |
| (1,889,960) | |
| S&P 500 Index |
|
|
|
|
|
Expiration: 11/15/2024; Exercise Price: $5,000.01(c) | (576,248) | |
| (1) | |
| (1,328) | |
| Expiration: 11/15/2024; Exercise Price: $5,000.00 | (112,944,608) | |
| (196) | |
| (260,225) | |
Expiration: 12/20/2024; Exercise Price: $9,200.01(c) | (27,083,656) | |
| (47) | |
| (15,733,888) | |
| Expiration: 12/20/2024; Exercise Price: $5,000.00 | (121,012,080) | |
| (210) | |
| (580,650) | |
| Expiration: 12/20/2024; Exercise Price: $9,200.00 | (1,427,942,544) | |
| (2,478) | |
| (829,544,127) | |
| SPDR S&P 500 ETF Trust |
|
|
|
|
|
Expiration: 11/15/2024; Exercise Price: $1.01(c) | (5,737,600) | |
| (100) | |
| (61) | |
Expiration: 11/15/2024; Exercise Price: $10.01(c) | (360,837,664) | |
| (6,289) | |
| (10,691) | |
| Total Put Options |
|
|
|
| (848,020,930) | |
TOTAL WRITTEN OPTIONS (Premiums received $2,282,106,882) |
|
|
| $ | (2,322,709,046) | |
| | | | | | | | |
| (a) |
| 100 shares per contract. |
| (b) |
| Exchange-traded. |
| (c) |
| FLexible EXchange® Options. |
| (d) | | Less than $0.50. |
The accompanying notes are an integral part of these financial statements.
20
(b) Not applicable
Item 7. Financial Statements and Financial Highlights for Open-End Management Investment
Companies.
STATEMENTS OF ASSETS AND LIABILITIES
September 30, 2024
| | | | | | | | | | | | | | |
| | Alpha Architect U.S. Quantitative Value ETF | | Alpha Architect International Quantitative Value ETF |
| Assets: | | | | |
Investments in securities, at value1 (See Note 2) | | $ | 375,984,584 | | | $ | 152,111,782 | |
| Dividends and interest receivable | | 323,118 | | | 1,381,703 | |
| Foreign currency, at value | | — | | | 13,992 | |
| Securities lending income receivable (See Note 5) | | — | | | 657 | |
| Total assets | | 376,307,702 | | | 153,508,134 | |
| | | | |
| Liabilities: | | | | |
| Due to securities lending agent (See Note 5) | | — | | | 2,701,695 | |
| Accrued investment advisory fees (See Note 4) | | 86,224 | | | 47,439 | |
| Total liabilities | | 86,224 | | | 2,749,134 | |
| Net Assets | | $ | 376,221,478 | | | $ | 150,759,000 | |
| | | | | |
| Net Assets Consist of: | | | | |
| Paid-in capital | | $ | 494,966,477 | | | $ | 262,147,749 | |
| Total distributable earnings (accumulated deficit) | | (118,744,999) | | | (111,388,749) | |
| Net Assets: | | $ | 376,221,478 | | | $ | 150,759,000 | |
| | | | |
| Calculation of Net Asset Value Per Share: | | | | |
| Net Assets | | $ | 376,221,478 | | | $ | 150,759,000 | |
| Shares Outstanding (unlimited shares of beneficial interest authorized, no par value) | | 8,160,000 | | | 5,850,000 | |
| Net Asset Value per Share | | $ | 46.11 | | | $ | 25.77 | |
| | | | |
| Cost of Investments in Securities | | $ | 347,365,692 | | | $ | 151,306,641 | |
| Cost of Foreign Currency | | $ | — | | | $ | 13,977 | |
| | | | |
| | | | |
(1) Includes loaned securities with a value of | | $ | — | | | $ | 2,549,585 | |
The accompanying notes are an integral part of these financial statements.
1
STATEMENTS OF ASSETS AND LIABILITIES
September 30, 2024
| | | | | | | | | | | | | | |
| | Alpha Architect U.S. Quantitative Momentum ETF | | Alpha Architect International Quantitative Momentum ETF |
| Assets: | | | | |
| Investments in securities, at value (See Note 2) | | $ | 252,533,000 | | | $ | 82,160,630 | |
| Receivable for fund shares sold | | 1,923,075 | | | — | |
| Dividends and interest receivable | | 68,878 | | | 537,821 | |
| Securities lending income receivable (See Note 5) | | 2 | | | 18 | |
| Total assets | | 254,524,955 | | | 82,698,469 | |
| | | | |
| Liabilities: | | | | |
| Foreign currency due to custodian | | — | | | 20,124 | |
| Payable for investment securities purchased | | 1,902,140 | | | — | |
| Accrued investment advisory fees (See Note 4) | | 59,097 | | | 26,024 | |
| Total liabilities | | 1,961,237 | | | 46,148 | |
| Net Assets | | $ | 252,563,718 | | | $ | 82,652,321 | |
| | | | | |
| Net Assets Consist of: | | | | |
| Paid-in capital | | $ | 343,494,295 | | | $ | 170,126,103 | |
| Total distributable earnings (accumulated deficit) | | (90,930,577) | | | (87,473,782) | |
| Net Assets: | | $ | 252,563,718 | | | $ | 82,652,321 | |
| | | | |
| Calculation of Net Asset Value Per Share: | | | | |
| Net Assets | | $ | 252,563,718 | | | $ | 82,652,321 | |
| Shares Outstanding (unlimited shares of beneficial interest authorized, no par value) | | 3,940,000 | | | 2,875,000 | |
| Net Asset Value per Share | | $ | 64.10 | | | $ | 28.75 | |
| | | | |
| Cost of Investments in Securities | | $ | 218,600,017 | | | $ | 76,169,614 | |
| | | | |
| | | | |
The accompanying notes are an integral part of these financial statements.
2
STATEMENTS OF ASSETS AND LIABILITIES
September 30, 2024
| | | | | | | | | | | | | | |
| | Alpha Architect Value Momentum Trend ETF | | Alpha Architect High Inflation and
Deflation ETF |
| Assets: | | | | |
Investments in affiliates, at value1 (See Note 2) | | $ | 21,697,908 | | | $ | — | |
Non-affiliated investments, at value1 (See Note 2) | | 2,444,257 | | | 30,214,206 | |
| Dividends and interest receivable | | 344 | | | 62,525 | |
| Securities lending income receivable (See Note 5) | | 1,237 | | | 1 | |
| Deposit at broker for securities sold short | | 963 | | | — | |
| Total assets | | 24,144,709 | | | 30,276,732 | |
| | | | |
| Liabilities: | | | | |
| Due to securities lending agent (See Note 5) | | 2,350,525 | | | — | |
| Accrued investment advisory fees, net (See Note 4) | | 6,459 | | | 5,909 | |
| Total liabilities | | 2,356,984 | | | 5,909 | |
| Net Assets | | $ | 21,787,725 | | | $ | 30,270,823 | |
| | | | | |
| Net Assets Consist of: | | | | |
| Paid-in capital | | $ | 45,215,339 | | | $ | 30,077,927 | |
| Total distributable earnings (accumulated deficit) | | (23,427,614) | | | 192,896 | |
| Net Assets: | | $ | 21,787,725 | | | $ | 30,270,823 | |
| | | | |
| Calculation of Net Asset Value Per Share: | | | | |
| Net Assets | | $ | 21,787,725 | | | $ | 30,270,823 | |
| Shares Outstanding (unlimited shares of beneficial interest authorized, no par value) | | 820,000 | | | 1,280,000 | |
| Net Asset Value per Share | | $ | 26.57 | | | $ | 23.65 | |
| | | | |
| Cost of investments in affiliates | | $ | 18,464,880 | | | $ | — | |
| Cost of non-affiliated investments | | $ | 2,444,257 | | | $ | 29,130,254 | |
| | | | |
(1) Includes loaned securities with a value of | | $ | 2,303,118 | | | $ | — | |
The accompanying notes are an integral part of these financial statements.
3
STATEMENTS OF ASSETS AND LIABILITIES
September 30, 2024
| | | | | | | | | | | | | | |
| | Alpha Architect Tail Risk ETF | | Alpha Architect 1-3 Month Box ETF |
| Assets: | | | | |
| Non-affiliated investments, at value (See Note 2) | | $ | 292,359,329 | | | $ | 6,292,169,882 | |
| Investments in affiliates, at value (See Note 2) | | 28,918,192 | | | — | |
| ETF variable fee receivable | | — | | | 2,434 | |
| Receivable for investments sold | | 2,442,464 | | | — | |
| Deposit at broker for written options | | — | | | 113,547 | |
| Dividends and interest receivable | | 2,848 | | | 11,575 | |
| Broker interest and fees receivable | | 1,882 | | | 1,673 | |
| Total assets | | 323,724,715 | | | 6,292,299,111 | |
| | | | |
| Liabilities: | | | | |
| Written options, at value | | 72,664,570 | | | 2,322,709,046 | |
| Payable for investments purchased | | 2,412,394 | | | — | |
| Accrued investment advisory fees, net (See Note 4) | | 122,919 | | | 636,600 | |
| Total liabilities | | 75,199,883 | | | 2,323,345,646 | |
| Net Assets | | $ | 248,524,832 | | | $ | 3,968,953,465 | |
| | | | |
| Net Assets Consist of: | | | | |
| Paid-in capital | | $ | 312,461,192 | | | $ | 3,971,234,617 | |
| Total distributable earnings (accumulated deficit) | | (63,936,360) | | | (2,281,152) | |
| Net Assets: | | $ | 248,524,832 | | | $ | 3,968,953,465 | |
| | | | |
| Calculation of Net Asset Value Per Share: | | | | |
| Net Assets | | $ | 248,524,832 | | | $ | 3,968,953,465 | |
| Shares Outstanding (unlimited shares of beneficial interest authorized, no par value) | | 2,873,847 | | | 36,440,000 | |
| Net Asset Value per Share | | $ | 86.48 | | | $ | 108.92 | |
| | | | |
| Cost of non-affiliated investments | | $ | 294,704,597 | | | $ | 6,268,614,651 | |
| Cost of investments in affiliates | | $ | 27,974,451 | | | $ | — | |
| Premiums received from options written | | $ | 74,370,791 | | | $ | 2,282,106,882 | |
| | | | |
The accompanying notes are an integral part of these financial statements.
4
STATEMENTS OF OPERATIONS
For the Year Ended September 30, 2024
| | | | | | | | | | | | | | |
| | Alpha Architect U.S. Quantitative Value ETF | | Alpha Architect International Quantitative Value ETF |
| Investment Income: | | | | |
| Dividend income (net of foreign withholding tax of $0 and $477,928, respectively) | | $ | 7,094,028 | | | $ | 5,562,315 | |
| Interest income | | 41,449 | | | 41,459 | |
| Securities lending income, net (See Note 5) | | 43 | | | 3,234 | |
| Total investment income | | 7,135,520 | | | 5,607,008 | |
| | | | |
| Expenses: | | | | |
| Investment advisory fees (See Note 4) | | 1,023,524 | | | 632,933 | |
| Net expenses | | 1,023,524 | | | 632,933 | |
| | | | |
| Net Investment Income (Loss) | | 6,111,996 | | | 4,974,075 | |
| | | | |
| Realized and Unrealized Gain (Loss) on Investments & Foreign Currency: | | | | |
| Net realized gain (loss) on: | | | | |
| Investments | | 55,313,182 | | | 17,074,269 | |
| Foreign currency | | — | | | (332,904) | |
| | 55,313,182 | | | 16,741,365 | |
| Net change in unrealized appreciation (depreciation) on: | | | | |
| Investments | | 10,986,491 | | | (13,702,380) | |
| Foreign currency | | — | | | 10,323,694 | |
| | 10,986,491 | | | (3,378,686) | |
| Net realized and unrealized gain (loss) on investments & foreign currency: | | 66,299,673 | | | 13,362,679 | |
| Net Increase (Decrease) in Net Assets Resulting from Operations | | $ | 72,411,669 | | | $ | 18,336,754 | |
The accompanying notes are an integral part of these financial statements.
5
STATEMENTS OF OPERATIONS
For the Year Ended September 30, 2024
| | | | | | | | | | | | | | |
| | Alpha Architect U.S. Quantitative Momentum ETF | | Alpha Architect International Quantitative Momentum ETF |
| Investment Income: | | | | |
| Dividend income (net of foreign withholding tax of $0 and $269,523, respectively) | | $ | 1,454,149 | | | $ | 1,937,722 | |
| Interest income | | 33,421 | | | 19,720 | |
| Securities lending income, net (See Note 5) | | 93 | | | 761 | |
| Total investment income | | 1,487,663 | | | 1,958,203 | |
| | | | |
| Expenses: | | | | |
| Investment advisory fees (See Note 4) | | 625,008 | | | 332,566 | |
| Net expenses | | 625,008 | | | 332,566 | |
| | | | |
| Net Investment Income (Loss) | | 862,655 | | | 1,625,637 | |
| | | | |
| Realized and Unrealized Gain (Loss) on Investments & Foreign Currency: | | | | |
| Net realized gain (loss) on: | | | | |
| Investments | | 39,100,637 | | | 4,894,698 | |
| Foreign currency | | — | | | (48,957) | |
| | 39,100,637 | | | 4,845,741 | |
| Net change in unrealized appreciation (depreciation) on: | | | | |
| Investments | | 34,363,108 | | | 3,932,515 | |
| Foreign currency | | — | | | 3,882,540 | |
| | 34,363,108 | | | 7,815,055 | |
| Net realized and unrealized gain (loss) on investments & foreign currency: | | 73,463,745 | | | 12,660,796 | |
| Net Increase (Decrease) in Net Assets Resulting from Operations | | $ | 74,326,400 | | | $ | 14,286,433 | |
The accompanying notes are an integral part of these financial statements.
6
STATEMENTS OF OPERATIONS
For the Year Ended September 30, 2024
| | | | | | | | | | | | | | |
| | Alpha Architect Value Momentum Trend ETF | | Alpha Architect High Inflation and
Deflation ETF |
| Investment Income: | | | | |
| Dividend income from affiliates | | $ | 649,810 | | | $ | — | |
| Dividend income from non-affiliates | | — | | | 258,419 | |
| Interest income | | 33,119 | | | 642,885 | |
| Securities lending income, net (See Note 5) | | 24,526 | | | 28 | |
| Total investment income | | 707,455 | | 707,455 | | 901,332 | |
| | | | |
| Expenses: | | | | |
| Investment advisory fees (See Note 4) | | 128,537 | | | 62,674 | |
| Total expenses | | 128,537 | | | 62,674 | |
| Less: Reimbursement of expenses from Advisor (See Note 4) | | (37,970) | | | (10,289) | |
| Net expenses | | 90,567 | | | 52,385 | |
| | | | |
| Net Investment Income (Loss) | | 616,888 | | | 848,947 | |
| | | | |
| Realized and Unrealized Gain (Loss) on Investments & Securities Sold Short: | | | | |
| Net realized gain (loss) on: | | | | |
| Investments in affiliates | | 3,052,540 | | | — | |
| Investments in non-affiliates | | — | | | (968,955) | |
| Securities sold short | | (828,965) | | | — | |
| | 2,223,575 | | | (968,955) | |
| Net change in unrealized appreciation (depreciation) on: | | | | |
| Investments in affiliates | | 2,946,404 | | | — | |
| Investments in non-affiliates | | — | | | 1,110,402 | |
| | 2,946,404 | | | 1,110,402 | |
| Net realized and unrealized gain (loss) on investments & securities sold short: | | 5,169,979 | | | 141,447 | |
| Net Increase (Decrease) in Net Assets Resulting from Operations | | $ | 5,786,867 | | | $ | 990,394 | |
The accompanying notes are an integral part of these financial statements.
7
STATEMENTS OF OPERATIONS
For the Year Ended September 30, 2024
| | | | | | | | | | | | | | | | | | | | |
| | Alpha Architect Tail Risk ETF | | Alpha Architect 1-3 Month Box ETF |
| | | Period Ended September 30, 2024(1) | | Period Ended October 31, 2023(2) |
| Investment Income: | | | | | | |
| Short-term capital gain from affiliated investments | | $ | 66,142 | | | $ | — | | | $ | — | |
| Interest income | | 27,144 | | | 63,268 | | | 15,649 | |
| Total investment income | | 93,286 | | | 63,268 | | | 15,649 | |
| | | | | | |
| Expenses: | | | | | | |
| Investment advisory fees (See Note 4) | | 1,192,650 | | | 8,116,529 | | | 734,894 | |
| Total expenses | | 1,192,650 | | | 8,116,529 | | | 734,894 | |
| Less: Reimbursement of expenses from Advisor (See Note 4) | | (186,924) | | | (4,110,676) | | | (372,192) | |
| Net expenses | | 1,005,726 | | | 4,005,853 | | | 362,702 | |
| | | | | | |
| Net Investment Income (Loss) | | (912,440) | | | (3,942,585) | | | (347,053) | |
| | | | | | |
| Realized and Unrealized Gain (Loss) on Investments and Options Written: | | | | | | |
| Net realized gain (loss) on: | | | | | | |
| Investments in affiliates | | 6,532,766 | | | — | | | — | |
| Non-affiliated investments | | 344,806,479 | | | (50,942,962) | | | 390,561,646 | |
| Capital gain distributions from affiliated investments | | 90,426 | | | — | | | — | |
| Options written | | (354,234,315) | | | 183,891,920 | | | (385,650,661) | |
| | (2,804,644) | | | 132,948,958 | | | 4,910,985 | |
| Net change in unrealized appreciation (depreciation) on: | | | | | | |
| Investments in affiliates | | (1,718,484) | | | — | | | — | |
| Non-affiliated investments | | 7,868,237 | | | 17,556,751 | | | 5,998,480 | |
| Options written | | 9,020,605 | | | (39,510,241) | | | (1,091,923) | |
| | 15,170,358 | | | (21,953,490) | | | 4,906,557 | |
| Net realized and unrealized gain (loss) on investments and options written: | | 12,365,714 | | | 110,995,468 | | | 9,817,542 | |
| Net Increase (Decrease) in Net Assets Resulting from Operations | | $ | 11,453,274 | | | $ | 107,052,883 | | | $ | 9,470,489 | |
| | | | | | |
(1) For the period November 1, 2023 to September 30, 2024. See Note 1. |
(2) The Fund commenced operations on December 27, 2022. |
The accompanying notes are an integral part of these financial statements.
8
STATEMENTS OF CHANGES IN NET ASSETS
| | | | | | | | | | | | | | | | | | | | | | | | | | |
| | Alpha Architect U.S. Quantitative Value ETF | | Alpha Architect International Quantitative Value ETF |
| | Year Ended September 30, 2024 | | Year Ended September 30, 2023 | | Year Ended September 30, 2024 | | Year Ended September 30, 2023 |
| Increase (Decrease) in Net Assets from: | | | | | | | | |
| Operations: | | | | | | | | |
| Net investment income (loss) | | $ | 6,111,996 | | | $ | 5,476,897 | | | $ | 4,974,075 | | | $ | 7,190,747 | |
| Net realized gain (loss) on investments & foreign currency | | 55,313,182 | | | 18,716,123 | | | 16,741,365 | | | (3,903,688) | |
| Net change in unrealized appreciation (depreciation) on investments & foreign currency | | 10,986,491 | | | 33,513,536 | | | (3,378,686) | | | 29,690,037 | |
| Net increase (decrease) in net assets resulting from operations | | 72,411,669 | | | 57,706,556 | | | 18,336,754 | | | 32,977,096 | |
| | | | | | | | |
| Distributions to Shareholders: | | | | | | | | |
| Distributable earnings | | (5,758,591) | | | (5,720,298) | | | (5,691,752) | | | (15,398,314) | |
| Total distributions to shareholders | | (5,758,591) | | | (5,720,298) | | | (5,691,752) | | | (15,398,314) | |
| | | | | | | | |
| Capital Share Transactions: | | | | | | | | |
| Proceeds from shares sold | | 466,179,689 | | | 289,669,681 | | | 177,186,999 | | | 166,148,095 | |
| Payments for shares redeemed | | (434,464,143) | | | (251,704,860) | | | (190,750,707) | | | (137,521,678) | |
| Transaction Fees (See Note 1) | | — | | | 1 | | | — | | | 500 | |
| Net increase (decrease) in net assets derived from net change in capital share transactions | | 31,715,546 | | | 37,964,822 | | | (13,563,708) | | | 28,626,917 | |
| Net Increase (Decrease) in Net Assets | | 98,368,624 | | | 89,951,080 | | | (918,706) | | | 46,205,699 | |
| | | | | | | | |
| Net Assets: | | | | | | | | |
| Beginning of period | | 277,852,854 | | | 187,901,774 | | | 151,677,706 | | | 105,472,007 | |
| End of period | | $ | 376,221,478 | | | $ | 277,852,854 | | | $ | 150,759,000 | | | $ | 151,677,706 | |
| | | | | | | | |
| Changes in Shares Outstanding: | | | | | | | | |
| Shares outstanding, beginning of period | | 7,480,000 | | | 6,440,000 | | | 6,425,000 | | | 5,200,000 | |
| Shares sold | | 11,170,000 | | | 8,340,000 | | | 7,000,000 | | | 7,025,000 | |
| Shares repurchased | | (10,490,000) | | | (7,300,000) | | | (7,575,000) | | | (5,800,000) | |
| Shares outstanding, end of period | | 8,160,000 | | | 7,480,000 | | | 5,850,000 | | | 6,425,000 | |
The accompanying notes are an integral part of these financial statements.
9
STATEMENTS OF CHANGES IN NET ASSETS
| | | | | | | | | | | | | | | | | | | | | | | | | | |
| | Alpha Architect U.S. Quantitative Momentum ETF | | Alpha Architect International Quantitative Momentum ETF |
| | Year Ended September 30, 2024 | | Year Ended September 30, 2023 | | Year Ended September 30, 2024 | | Year Ended September 30, 2023 |
| Increase (Decrease) in Net Assets from: | | | | | | | | |
| Operations: | | | | | | | | |
| Net investment income (loss) | | $ | 862,655 | | | $ | 1,912,504 | | | $ | 1,625,637 | | | $ | 2,595,556 | |
| Net realized gain (loss) on investments & foreign currency | | 39,100,637 | | | (13,661,716) | | | 4,845,741 | | | (1,092,297) | |
| Net change in unrealized appreciation (depreciation) on investments & foreign currency | | 34,363,108 | | | 4,866,116 | | | 7,815,055 | | | 5,502,530 | |
| Net increase (decrease) in net assets resulting from operations | | 74,326,400 | | | (6,883,096) | | | 14,286,433 | | | 7,005,789 | |
| | | | | | | | |
| Distributions to Shareholders: | | | | | | | | |
| Distributable earnings | | (1,434,103) | | | (2,115,259) | | | (2,136,152) | | | (3,768,945) | |
| Total distributions to shareholders | | (1,434,103) | | | (2,115,259) | | | (2,136,152) | | | (3,768,945) | |
| | | | | | | | |
| Capital Share Transactions: | | | | | | | | |
| Proceeds from shares sold | | 404,714,536 | | | 220,184,121 | | | 134,028,213 | | | 112,964,493 | |
| Payments for shares redeemed | | (370,364,114) | | | (157,210,632) | | | (137,550,133) | | | (97,628,132) | |
| Transaction Fees (See Note 1) | | — | | | 7,116 | | | — | | | 52 | |
| Net increase (decrease) in net assets derived from net change in capital share transactions | | 34,350,422 | | | 62,980,605 | | | (3,521,920) | | | 15,336,413 | |
| Net Increase (Decrease) in Net Assets | | 107,242,719 | | | 53,982,250 | | | 8,628,361 | | | 18,573,257 | |
| | | | | | | | |
| Net Assets: | | | | | | | | |
| Beginning of period | | 145,320,999 | | | 91,338,749 | | | 74,023,960 | | | 55,450,703 | |
| End of period | | $ | 252,563,718 | | | $ | 145,320,999 | | | $ | 82,652,321 | | | $ | 74,023,960 | |
| | | | | | | | |
| Changes in Shares Outstanding: | | | | | | | | |
| Shares outstanding, beginning of period | | 3,370,000 | | | 2,070,000 | | | 3,025,000 | | | 2,425,000 | |
| Shares sold | | 7,540,000 | | | 4,700,000 | | | 4,850,000 | | | 4,400,000 | |
| Shares repurchased | | (6,970,000) | | | (3,400,000) | | | (5,000,000) | | | (3,800,000) | |
| Shares outstanding, end of period | | 3,940,000 | | | 3,370,000 | | — | | 2,875,000 | | | 3,025,000 | |
The accompanying notes are an integral part of these financial statements.
10
STATEMENTS OF CHANGES IN NET ASSETS
| | | | | | | | | | | | | | | | | | | | | | | | | | |
| | Alpha Architect Value Momentum Trend ETF | | Alpha Architect High Inflation and Deflation ETF |
| | Year Ended September 30, 2024 | | Year Ended September 30, 2023 | | Year Ended September 30, 2024 | | Period Ended September 30, 2023⁽¹⁾ |
| Increase (Decrease) in Net Assets from: | | | | | | | | |
| Operations: | | | | | | | | |
| Net investment income (loss) | | $ | 616,888 | | | $ | 2,084,371 | | | $ | 848,947 | | | $ | 730,617 | |
| Net realized gain (loss) on investments & securities sold short | | 2,223,575 | | | (3,092,197) | | | (968,955) | | | (550,547) | |
| Net change in unrealized appreciation (depreciation) on investments & securities sold short | | 2,946,404 | | | (1,993,560) | | | 1,110,402 | | | (26,450) | |
| Net increase (decrease) in net assets resulting from operations | | 5,786,867 | | | (3,001,386) | | | 990,394 | | | 153,620 | |
| | | | | | | | |
| Distributions to Shareholders: | | | | | | | | |
| Distributable earnings | | (1,247,610) | | | (877,779) | | | (665,962) | | | (292,778) | |
| Total distributions to shareholders | | (1,247,610) | | | (877,779) | | | (665,962) | | | (292,778) | |
| | | | | | | | |
| Capital Share Transactions: | | | | | | | | |
| Proceeds from shares sold | | 2,824,066 | | | 1,415,122 | | | 17,879,432 | | | 18,377,775 | |
| Payments for shares redeemed | | (20,648,759) | | | (3,828,931) | | | (4,485,245) | | | (1,690,136) | |
| Transaction Fees (See Note 1) | | — | | | — | | | 1,905 | | | 1,818 | |
| Net increase (decrease) in net assets derived from net change in capital share transactions | | (17,824,693) | | | (2,413,809) | | | 13,396,092 | | | 16,689,457 | |
| Net Increase (Decrease) in Net Assets | | (13,285,436) | | | (6,292,974) | | | 13,720,524 | | | 16,550,299 | |
| | | | | | | | |
| Net Assets: | | | | | | | | |
| Beginning of period | | 35,073,161 | | | 41,366,135 | | | 16,550,299 | | | — | |
| End of period | | $ | 21,787,725 | | | $ | 35,073,161 | | | $ | 30,270,823 | | | $ | 16,550,299 | |
| | | | | | | | |
| Changes in Shares Outstanding: | | | | | | | | |
| Shares outstanding, beginning of period | | 1,560,000 | | | 1,660,000 | | | 700,000 | | | — | |
| Shares sold | | 130,000 | | | 60,000 | | | 770,000 | | | 770,000 | |
| Shares repurchased | | (870,000) | | | (160,000) | | | (190,000) | | | (70,000) | |
| Shares outstanding, end of period | | 820,000 | | | 1,560,000 | | | 1,280,000 | | | 700,000 | |
| | |
| (1) The Fund commenced operations on November 16, 2022. |
The accompanying notes are an integral part of these financial statements.
11
STATEMENTS OF CHANGES IN NET ASSETS
| | | | | | | | | | | | | | | | | | | | |
| | Alpha Architect Tail Risk ETF |
| | Year Ended September 30, 2024 | | Year Ended September 30, 2023(1)(2) | | Year Ended February 28, 2023 |
| Increase (Decrease) in Net Assets from: | | | | | | |
| Operations: | | | | | | |
| Net investment income (loss) | | $ | (912,440) | | | $ | (419,237) | | | (1,019,600) | |
| Net realized gain (loss) on investments & written options | | (2,895,070) | | | 23,737,339 | | | (16,443,146) | |
| Capital Gain Distributions from Investment Companies | | 90,426 | | | | | |
| Net change in unrealized appreciation (depreciation) on investments & written options | | 15,170,358 | | | (12,612,906) | | | (2,289,283) | |
| Net increase (decrease) in net assets resulting from operations | | 11,453,274 | | | 10,705,196 | | | (19,752,029) | |
| | | | | | |
| Distributions to Shareholders: | | | | | | |
| Distributable earnings | | — | | | — | | | — | |
| Total distributions to shareholders | | — | | | — | | | — | |
| | | | | | |
Capital Share Transactions(3): | | | | | | |
| Proceeds from shares sold | | 167,856,362 | | | 36,099,474 | | | 68,236,684 | |
| Payments for shares redeemed | | (95,408,522) | | | (6,532,109) | | | (113,157,924) | |
| Transaction Fees (See Note 1) | | 33,670 | | | 4,387 | | | — | |
| Net increase (decrease) in net assets derived from net change in capital share transactions | | 72,481,510 | | | 29,571,752 | | | (44,921,240) | |
| Net Increase (Decrease) in Net Assets | | 83,934,784 | | | 40,276,948 | | | (64,673,269) | |
| | | | | | |
| Net Assets: | | | | | | |
| Beginning of period | | 164,590,048 | | | 124,313,100 | | | 188,986,369 | |
| End of period | | $ | 248,524,832 | | | $ | 164,590,048 | | | $ | 124,313,100 | |
| | | | | | |
Changes in Shares Outstanding:(3) | | | | | | |
| Shares outstanding, beginning of period | | 2,023,847 | | | 1,640,927 | | | 2,272,177 | |
| Shares sold | | 1,970,000 | | | 463,303 | | | 875,194 | |
| Shares repurchased | | (1,120,000) | | | (80,383) | | | (1,506,444) | |
| Shares outstanding, end of period | | 2,873,847 | | | 2,023,847 | | | 1,640,927 | |
| | | | | | |
| | | | | | | | |
| (1) | | The Fund acquired all of the assets and liabilities of the Arin Large Cap Theta Fund ("Predecessor Fund") in a reorganization on March 6, 2023. The Predecessor Fund’s Institutional Class Shares' performance and financial history have been adopted by the Fund and will be used going forward. As a result, the information prior to March 6, 2023, reflects that of the Predecessor Fund's Institutional Class Shares. |
| (2) | | Reflects reorganization from the Predecessor Fund on March 6, 2023. See Note 1. |
| (3) | | Effective March 22, 2023, the Alpha Architect Tail Risk ETF had a 1:8 reverse stock split. Share amounts for all periods have been adjusted to give effect to the 1:8 stock split. |
| | |
The accompanying notes are an integral part of these financial statements.
12
STATEMENTS OF CHANGES IN NET ASSETS
| | | | | | | | | | | | | | |
| | Alpha Architect 1-3 Month Box ETF |
| | Period Ended September 30, 2024(1) | | Period Ended October 31, 2023(2) |
| Increase (Decrease) in Net Assets from: | | | | |
| Operations: | | | | |
| Net investment income (loss) | | $ | (3,942,585) | | | $ | (347,053) | |
| Net realized gain (loss) on investments & written options | | 132,948,958 | | | 4,910,985 | |
| Net change in unrealized appreciation (depreciation) on investments & written options | | (21,953,490) | | | 4,906,557 | |
| Net increase (decrease) in net assets resulting from operations | | 107,052,883 | | | 9,470,489 | |
| | | | |
| Distributions to Shareholders: | | | | |
| Distributable earnings | | (10,281,074) | | | — | |
| Total distributions to shareholders | | (10,281,074) | | | — | |
| | | | |
Capital Share Transactions(2)(3): | | | | |
| Proceeds from shares sold | | 3,626,281,994 | | | 564,203,019 | |
| Payments for shares redeemed | | (298,731,150) | | | (29,241,791) | |
| Transaction Fees (See Note 1) | | 161,462 | | | 37,633 | |
| Net increase (decrease) in net assets derived from net change in capital share transactions | | 3,327,712,306 | | | 534,998,861 | |
| Net Increase (Decrease) in Net Assets | | 3,424,484,115 | | | 544,469,350 | |
| | | | |
| Net Assets: | | | | |
| Beginning of period | | 544,469,350 | | | — | |
| End of period | | $ | 3,968,953,465 | | | $ | 544,469,350 | |
| | | | |
| Changes in Shares Outstanding: | | | | |
| Shares outstanding, beginning of period | | 5,230,000 | | | — | |
| Shares sold | | 33,990,000 | | | 5,520,000 | |
| Shares repurchased | | (2,780,000) | | | (290,000) | |
| Shares outstanding, end of period | | 36,440,000 | | | 5,230,000 | |
| | | | |
(1) For the period November 1, 2023 to September 30, 2024. See Note 1. | | | | |
(2) The Fund commenced operations on December 27, 2022. | | | | |
The accompanying notes are an integral part of these financial statements.
13
ALPHA ARCHITECT ETFs
FINANCIAL HIGHLIGHTS
| | | | | | | | | | | | | | | | | | | | | | | | | | | | | | | | | | | | | | | | | | | | | | | | | | |
| Net Asset Value, Beginning of Period | Net Investment Income (Loss)(1) | Net Realized and Unrealized Gain (Loss) on Investments | Net Increase (Decrease) in Net Asset Value Resulting from Operations | Distributions from Net Investment Income | Distributions from Realized Gains | Return of Capital Distribution | Total Distributions | Transaction Fees (9) | Net Asset Value, End of Period | Total Return(2) | Net Assets, End of Period (000's) | Net Expenses(3)(4) | Gross Expenses(3) | Net Investment Income (Loss)(3) | Portfolio Turnover Rate(5) |
| Alpha Architect U.S. Quantitative Value ETF | | | | | | | | | | | | | | |
For the Year Ended September 30, 2024 | $37.15 | 0.79 | 8.92 | 9.71 | (0.75) | - | - | (0.75) | - | $46.11 | 26.33% | $376,221 | 0.32% | 0.32% | 1.90% | 223% |
For the Year Ended September 30, 2023 | $29.18 | 0.78 | 8.00 | 8.78 | (0.81) | - | - | (0.81) | - | $37.15 | 30.39% | $277,853 | 0.42% | 0.42% | 2.27% | 101% |
For the Year Ended September 30, 2022 | $34.15 | 0.60 | (4.94) | (4.34) | (0.63) | - | - | (0.63) | - | $29.18 | -12.99% | $187,902 | 0.49% | 0.49% | 1.73% | 89% |
For the Year Ended September 30, 2021 | $24.44 | 0.42 | 9.74 | 10.16 | (0.45) | - | - | (0.45) | - | $34.15 | 41.82% | $213,768 | 0.49% | 0.49% | 1.33% | 44% |
For the Year Ended September 30, 2020 | $27.86 | 0.59 | (3.51) | (2.92) | (0.50) | - | - | (0.50) | - | $24.44 | -10.52% | $113,653 | 0.49% | 0.49% | 2.36% | 78% |
| | | | | | | | | | | | | | | | |
| | | | | | | | | | | | | | | | |
| Alpha Architect International Quantitative Value ETF | | | | | | | | | | | | | |
For the Year Ended
September 30, 2024 | $23.61 | 0.83 | 2.28 | 3.11 | (0.95) | - | - | (0.95) | - | $25.77 | 13.38% | $150,759 | 0.42% | 0.42% | 3.32% | 155% |
For the Year Ended
September 30, 2023 | $20.28 | 1.25 | 4.79 | 6.04 | (2.71) | - | - | (2.71) | - | $23.61 | 30.86% | $151,678 | 0.52% | 0.52% | 5.36% | 74% |
For the Year Ended
September 30, 2022 | $27.13 | 1.54 | (7.72) | (6.18) | (0.67) | - | - | (0.67) | - | $20.28 | -23.33% | $105,472 | 0.59% | 0.59% | 6.14% | 124% |
For the Year Ended
September 30, 2021 | $24.69 | 0.78 | 2.19 | 2.97 | (0.53) | - | - | (0.53) | - | $27.13 | 12.00% | $133,633 | 0.60% | 0.60% | 2.78% | 103% |
For the Year Ended
September 30, 2020 | $26.76 | 0.58 | (2.05) | (1.47) | (0.60) | - | - | (0.60) | - | $24.69 | -5.47% | $92,569 | 0.59% | 0.59% | 2.26% | 76% |
| | | | | | | | | | | | | | | | |
| | | | | | | | | | | | | | | | |
| Alpha Architect U.S. Quantitative Momentum ETF | | | | | | | | | | | | | |
For the Year Ended
September 30, 2024 | $43.12 | 0.24 | 21.18 | 21.42 | (0.44) | - | - | (0.44) | - | $64.10 | 49.97% | $252,564 | 0.32% | 0.32% | 0.44% | 363% |
For the Year Ended
September 30, 2023 | $44.12 | 0.64 | (0.91) | (0.27) | (0.73) | - | - | (0.73) | - | $43.12 | -0.71% | $145,321 | 0.42% | 0.42% | 1.39% | 193% |
For the Year Ended
September 30, 2022 | $49.20 | 0.82 | (5.84) | (5.02) | (0.06) | - | - | (0.06) | - | $44.12 | -10.20% | $91,339 | 0.49% | 0.49% | 1.72% | 125% |
For the Year Ended
September 30, 2021 | $41.89 | (0.07) | 7.38 | 7.31 | - | - | - | - | - | $49.20 | 17.45% | $85,114 | 0.49% | 0.49% | (0.13%) | 120% |
For the Year Ended
September 30, 2020 | $30.02 | 0.06 | 11.85 | 11.91 | (0.02) | - | (0.02) | (0.04) | - | $41.89 | 39.79% | $73,308 | 0.49% | 0.49% | 0.18% | 84% |
| | | | | | | | | | | | | | | | |
| | | | | | | | | | | | | | | | |
The accompanying notes are an integral part of these financial statements.
14
ALPHA ARCHITECT ETFs
FINANCIAL HIGHLIGHTS (CONTINUED)
| | | | | | | | | | | | | | | | | | | | | | | | | | | | | | | | | | | | | | | | | | | | | | | | | | |
| Net Asset Value, Beginning of Period | Net Investment Income (Loss)(1) | Net Realized and Unrealized Gain (Loss) on Investments | Net Increase (Decrease) in Net Asset Value Resulting from Operations | Distributions from Net Investment Income | Distributions from Realized Gains | Return of Capital Distribution | Total Distributions | Transaction Fees (9) | Net Asset Value, End of Period | Total Return(2) | Net Assets, End of Period (000's) | Net Expenses(3)(4) | Gross Expenses(3) | Net Investment Income (Loss)(3) | Portfolio Turnover Rate(5) |
| Alpha Architect International Quantitative Momentum ETF | | | | | | | | | | | | | |
For the Year Ended
September 30, 2024 | $24.47 | 0.56 | 4.50 | 5.06 | (0.78) | - | - | (0.78) | - | $28.75 | 21.01% | $82,652 | 0.42% | 0.42% | 2.06% | 219% |
For the Year Ended
September 30, 2023 | $22.87 | 0.95 | 2.16 | 3.11 | (1.51) | - | - | (1.51) | - | $24.47 | 13.50% | $74,024 | 0.52% | 0.52% | 3.72% | 140% |
For the Year Ended
September 30, 2022 | $34.24 | 1.41 | (12.42) | (11.01) | (0.36) | - | - | (0.36) | - | $22.87 | -32.52% | $55,451 | 0.59% | 0.59% | 4.86% | 187% |
For the Year Ended
September 30, 2021 | $28.63 | 0.28 | 5.40 | 5.68 | (0.07) | - | - | (0.07) | - | $34.24 | 19.83% | $71,907 | 0.60% | 0.60% | 0.84% | 99% |
For the Year Ended
September 30, 2020 | $25.63 | 0.29 | 2.97 | 3.26 | (0.26) | - | - | (0.26) | - | $28.63 | 13.00% | $83,024 | 0.59% | 0.59% | 1.13% | 158% |
| | | | | | | | | | | | | | | | |
| | | | | | | | | | | | | | | | |
Alpha Architect Value Momentum Trend ETF(7) | | | | | | | | | | | | | |
For the Year Ended
September 30, 2024 | $22.48 | 0.52 | 4.53 | 5.05 | (0.96) | - | - | (0.96) | - | $26.57 | 23.05% | $21,788 | 0.32% | 0.45% | 2.16% | 33% |
For the Year Ended
September 30, 2023 | $24.92 | 1.29 | (3.18) | (1.89) | (0.55) | - | - | (0.55) | - | $22.48 | -7.75% | $35,073 | 0.95% | 1.14% | 5.44% | 49% |
For the Year Ended
September 30, 2022 | $26.69 | (0.06) | (1.51) | (1.57) | (0.20) | - | - | (0.20) | - | $24.92 | -5.95% | $41,366 | 2.12% | 2.31% | (0.24%) | 39% |
For the Year Ended
September 30, 2021 | $23.91 | 0.15 | 2.65 | 2.80 | (0.02) | - | - | (0.02) | - | $26.69 | 11.73% | $45,639 | 0.28% | 0.49% | 0.57% | 3% |
For the Year Ended
September 30, 2020 | $23.52 | 0.03 | 0.72 | 0.75 | (0.36) | - | - | (0.36) | - | $23.91 | 3.10% | $49,609 | 1.18% | 1.40% | 0.14% | 20% |
| | | | | | | | | | | | | | | | |
| | | | | | | | | | | | | | | | |
Alpha Architect High Inflation and Deflation ETF(7) | | | | | | | | | | | | | |
For the Year Ended
September 30, 2024 | $23.64 | 0.91 | - | 0.91 | (0.90) | - | - | (0.90) | 0.00(6) | $23.65 | 3.91% | $30,271 | 0.24% | 0.29% | 3.93% | 267% |
For the Period November 16, 2022(8) to September 30, 2023 | $24.95 | 1.35 | (1.20) | 0.15 | (1.46) | - | - | (1.46) | - | $23.64 | 0.69% | $16,550 | 0.27% | 0.29% | 6.54% | 402% |
| | | | | | | | | | | | | | | | |
The accompanying notes are an integral part of these financial statements.
15
ALPHA ARCHITECT ETFs
FINANCIAL HIGHLIGHTS (CONTINUED)
| | | | | | | | | | | | | | | | | | | | | | | | | | | | | | | | | | | | | | | | | | | | | | | | | | |
| Net Asset Value, Beginning of Period | Net Investment Income (Loss)(1) | Net Realized and Unrealized Gain (Loss) on Investments | Net Increase (Decrease) in Net Asset Value Resulting from Operations | Distributions from Net Investment Income | Distributions from Realized Gains | Return of Capital Distribution | Total Distributions | Transaction Fees (9) | Net Asset Value, End of Period | Total Return(2) | Net Assets, End of Period (000's) | Net Expenses(3)(4) | Gross Expenses(3) | Net Investment Income (Loss)(3) | Portfolio Turnover Rate(5) |
Alpha Architect Tail Risk ETF(7)(10) | | | | | | | | | | | | | | |
For the Year Ended September 30, 2024 | $81.33 | (0.41) | 5.55 | 5.14 | - | - | - | - | 0.01 | $86.48 | 6.36% | $248,525 | 0.53%(14) | 0.63%(14) | (0.48%) | 14% |
For the Period March 1, 2023 to September 30, 2023(11)(12) | $75.76 | (0.14) | 5.71 | 5.57 | - | - | - | - | - | $81.33 | 7.32% | $164,590 | 0.51% (14) | 0.63% (14) | (0.46%) | 0% |
For the Year Ended February 28, 2023 | $83.12 | (0.48) | (6.88) | (7.36) | - | - | - | - | - | $75.76 | -8.85% | $124,313 | 0.64% (14) | 0.64% (14) | (0.61%) | 0% |
For the Year Ended February 28, 2022(12) | $90.40 | (0.56) | (0.64) | (1.20) | - | - | (6.08) | (6.08) | - | $83.12 | -1.47% | $188,926 | 0.63% (14) | 0.63% (14) | (0.63%) | 0% |
For the Year Ended February 28, 2021(12) | $76.32 | (0.56) | 19.52 | 18.96 | (0.08) | - | (4.80) | (4.88) | - | $90.40 | 24.94% | $166,869 | 0.65% (14) | 0.65% (14) | (0.59%) | 0% |
For the Year Ended February 28, 2020(12) | $76.00 | 0.88 | 1.04 | 1.92 | (1.60) | - | - | (1.60) | - | $76.32 | 2.55% | $96,449 | 0.71% (14) | 0.71% (14) | 1.11% | 457%(13) |
| | | | | | | | | | | | | | | | |
| Alpha Architect 1-3 Month Box ETF | | | | | | | | | | | | | | |
For the Period November 1, 2023(9) to September 30, 2024 | $104.11 | (0.19) | 5.28 | 5.09 | - | (0.29) | - | (0.29) | 0.01 | $108.92 | 4.89% | $3,968,953 | 0.1949% | 0.3949% | (0.1918%) | 0% |
For the Period December 27, 2022(8) to October 31, 2023 | $100.00 | (0.16) | 4.25 | 4.09 | - | - | - | - | 0.02 | $104.11 | 4.11% | $544,469 | 0.1949% | 0.3949% | (0.1865%) | 0% |
| | |
| (1) Net investment income (loss) per share represents net investment income divided by the daily average shares of beneficial interest outstanding throughout the period. |
| (2) All returns reflect reinvested dividends, if any, but do not reflect the impact of taxes. Total return for a period of less than one year is not annualized. |
| (3) For periods of less than one year, these ratios are annualized. |
| (4) Net expenses include effects of any reimbursement or recoupment. |
| (5) Portfolio turnover is not annualized and is calculated without regard to short-term securities having a maturity of less than one year. Excludes the impact of in-kind transactions. |
| (6) Rounds to less than $0.005. |
| (7) Net and gross expenses do not include expenses of the investment companies in which the Fund invests. |
| (8) Commencement of operations. |
| (9) See Note 1 in the Notes to Financials. |
| (10) Effective March 22, 2023, the Alpha Architect Tail Risk ETF had a 1:8 reverse stock split. Share amounts for all periods have been adjusted to give effect to the 1:8 stock split |
(11) Alpha Architect Tail Risk ETF (the “Fund”) acquired all of the assets and liabilities of the Arin Large Cap Theta Fund (“Predecessor Fund”) in a reorganization on March 6, 2023. Market price returns are calculated using the official closing price of the Fund on the listing exchange as of the time that the Fund’s NAV is calculated. Prior to the Fund’s listing on March 6, 2023, the NAV performance of the Institutional Class Shares of the Predecessor Fund are used as proxy market price returns. |
| (12) Includes adjustments in accordance with accounting principles generally accepted in the United States and, consequently, the net asset values for financial reporting purposes and the returns based upon those net asset values may differ from the net asset values and returns for shareholder transactions. |
The accompanying notes are an integral part of these financial statements.
16
ALPHA ARCHITECT ETFs
FINANCIAL HIGHLIGHTS (CONTINUED)
| | |
| (13) Portfolio turnover was calculated using the total long-term purchase amount of $27,391. All securities considered short-term were excluded from the calculation according to prescribed rules. |
| (14) Includes less than 0.01%, less than 0.01%, less than 0.01%, less than 0.01%, less than 0.01% & 0.03% of average net assets in interest expense, respectively. |
The accompanying notes are an integral part of these financial statements.
17
ALPHA ARCHITECT ETFs
NOTES TO THE FINANCIAL STATEMENTS
September 30, 2024
NOTE 1 – ORGANIZATION
Alpha Architect U.S. Quantitative Value ETF (“QVAL”), Alpha Architect International Quantitative Value ETF (“IVAL”), Alpha Architect U.S. Quantitative Momentum ETF (“QMOM”), Alpha Architect International Quantitative Momentum ETF (“IMOM”), Alpha Architect Value Momentum Trend ETF (“VMOT”), Alpha Architect High Inflation and Deflation ETF (“HIDE”), Alpha Architect Tail Risk ETF (“CAOS”) and Alpha Architect 1-3 Month Box ETF (“BOXX”) (individually, a “Fund” or collectively the “Funds”) each are a series of the EA Series Trust (the “Trust”), which was organized as a Delaware statutory trust on October 11, 2013. The Trust is registered with the Securities and Exchange Commission (“SEC”) under the Investment Company Act of 1940, as amended (the “1940 Act”), as an open-end management investment company and the offering of the Funds’ shares (“Shares”) is registered under the Securities Act of 1933, as amended (the “Securities Act”). Each Fund is considered diversified under the 1940 Act. Each Fund qualifies as an investment company as defined in the Financial Accounting Standards Codification Topic 946-Financial Services-Investment Companies.
| | | | | | | | | | | |
| Ticker | Commencement
of Operations | Creation Unit Size | Listing Exchange |
| QVAL | October 21, 2014 | 25,000 | The Nasdaq Stock Market® |
| IVAL | January 16, 2024 | 25,000 | The Nasdaq Stock Market® |
| QMOM | December 1, 2015 | 10,000 | The Nasdaq Stock Market® |
| IMOM | December 22, 2015 | 10,000 | The Nasdaq Stock Market® |
| VMOT | May 2, 2017 | 10,000 | The Nasdaq Stock Market® |
| HIDE | November 16, 2022 | 10,000 | The Nasdaq Stock Market® |
| CAOS | August 14, 2013 | 10,000 | Cboe BZX Exchange, Inc. |
| BOXX | December 27, 2022 | 10,000 | Cboe BZX Exchange, Inc. |
The investment objective for each Fund is to:
| | | | | |
| Fund | Investment Objective |
| QVAL | seek long-term capital appreciation. |
| IVAL | seek long-term capital appreciation. |
| QMOM | seek long-term capital appreciation. |
| IMOM | seek long-term capital appreciation. |
| VMOT | seek long-term capital appreciation while attempting to minimize market drawdown. |
| HIDE | seek long-term total return |
| CAOS | seek maximum total return through a combination of capital appreciation and current income. |
| BOXX | seek to provide investment results that, before fees and expenses, equals or exceeds the price and yield performance of an investment that tracks the 1-3 month sector of the United States Treasury Bill market. |
Alpha Architect Tail Risk ETF converted from an open-end mutual fund to an exchange-traded fund (“ETF”) on March 6, 2023.The Fund is the successor to the Arin Large Cap Theta Fund (the “Predecessor Fund”), a series of the Starboard Investment Trust, which had the same investment objective as the Fund. Arin Risk Advisors, LLC, was also the adviser to the Predecessor Fund. Effective March 6, 2023, the assets and liabilities of the Predecessor Fund were transferred to the Fund in exchange for shares of the Fund. For financial reporting purposes, assets received and shares issued by the Fund were recorded at fair value; however, for tax purposes the cost basis of the investments received from the Predecessor Fund was carried forward to align ongoing reporting of the Fund’s realized and unrealized gains and losses with amounts distributable to shareholders for tax purposes. Costs incurred by the Fund in connection with the reorganization were paid by the Sub-Adviser.
The fiscal year end of the Predecessor Fund was February 28th; after conversion, the Fund changed its fiscal year end to September 30th. Operations prior to March 6, 2023 were for the Predecessor Fund. As of March 6, 2023, the net assets of the
ALPHA ARCHITECT ETFs
NOTES TO THE FINANCIAL STATEMENTS (CONTINUED)
September 30, 2024
Predecessor Fund were $126,488,085, including $2,569,806 of net unrealized appreciation of investments, all of which were transferred into the Fund at the closing of the reorganization. The transfer of net assets resulted in the creation of 13,152,191 shares of the Fund and an initial NAV per share of $9.62 at the closing of the reorganization.
The primary purpose of the reorganization into the Trust was to provide shareholders the continued benefit of a stable and highly regulated investment vehicle in addition to the benefits of tax efficiency.
The reorganization was accomplished by a tax-free exchange of shares. Fees and expenses incurred to affect the reorganizations were borne by the Sub-Advisor. The reorganization did not result in a material change to the Predecessor Fund’s investment portfolios as compared to that of the Fund. There are no material differences in accounting policies of the Predecessor Fund as compared to that of the Fund.
The Fund did not purchase or sell securities following the reorganization for purposes of realigning its investment portfolio. Accordingly, the acquisition of the Predecessor Fund did not affect the Fund’s portfolio turnover ratio for the year ended September 30, 2023.
On March 22, 2023, shares of the CAOS were adjusted to reflect a reverse stock split. The effect of the reverse stock split was to decrease the number of shares outstanding and increase the net asset value. The reverse stock split has no impact on the net assets of the Fund or the value of a shareholder’s investment in the Fund. A summary of the reverse stock split is as follows:
| | | | | | | | | | | | | | | | | | | | | | | | | | | | | | | | |
Effective
Date | | Rate | | Net Asset Value
Before Split | | Net Asset Value
After Split | | Shares
Outstanding
Before Split | | Shares
Outstanding
After Split |
| 3/22/2023 | | 1:8 | | $9.56 | | $76.51 | | 13,150,783 | | 1,643,847 |
Effective November 1, 2023, BOXX’s fiscal year changed to September 30th.
Market prices for the shares may be different from their net asset value (“NAV”). Each Fund issues and redeems shares on a continuous basis at NAV only in blocks of shares, called “Creation Units.” Creation Units are issued and redeemed principally in-kind for securities included in a specified universe. Once created, shares generally trade in the secondary market at market prices that change throughout the day in share amounts less than a Creation Unit. Except when aggregated in Creation Units, shares are not redeemable securities of the Fund. Shares of the Fund may only be purchased or redeemed by certain financial institutions (“Authorized Participants”). An Authorized Participant is a participant of a clearing agency registered with the SEC, which has a written agreement with the Trust or one of its service providers that allows the authorized participant to place orders for the purchase and redemption of creation units. Most retail investors do not qualify as Authorized Participants nor have the resources to buy and sell whole Creation Units. Therefore, they are unable to purchase or redeem the shares directly from the Fund. Rather, most retail investors may purchase shares in the secondary market with the assistance of a broker and are subject to customary brokerage commissions or fees.
Authorized Participants may be required to pay a transaction fee to compensate the Trust or its custodian for costs incurred in connection with creation and redemption transactions. Certain transactions consisting all or partially of cash may also be subject to a variable charge, which is payable to the relevant Fund, of up to 2.00% of the value of the order in addition to the transaction fee. A Fund may determine to waive the variable charge on certain orders when such waiver is determined to be in the best interests of Fund shareholders. Transaction fees received by a Fund, if any, are displayed in the Capital Share Transactions sections of the Statements of Changes in Net Assets.
NOTE 2 – SIGNIFICANT ACCOUNTING POLICIES
The following is a summary of significant accounting policies consistently followed by the Fund. These policies are in conformity with accounting principles generally accepted in the United States of America (“GAAP”).
ALPHA ARCHITECT ETFs
NOTES TO THE FINANCIAL STATEMENTS (CONTINUED)
September 30, 2024
A.Security Valuation. Equity securities that are traded on a national securities exchange, except those listed on the NASDAQ Global Market® (“NASDAQ”) are valued at the last reported sale price on the exchange on which the security is principally traded. Securities traded on NASDAQ will be valued at the NASDAQ Official Closing Price (“NOCP”). If, on a particular day, an exchange-traded or NASDAQ security does not trade, then the most recent quoted bid for exchange-traded or the mean between the most recent quoted bid and ask price for NASDAQ securities will be used. Equity securities that are not traded on a listed exchange are generally valued at the last sale price in the over-the-counter market. If a non-exchange traded security does not trade on a particular day, then the mean between the last quoted closing bid and asked price will be used. Prices denominated in foreign currencies are converted to U.S. dollar equivalents at the current exchange rate, which approximates fair value. Redeemable securities issued by open-end investment companies are valued at the investment company’s applicable net asset value, with the exception of exchange-traded open-end investment companies which are priced as equity securities. Fair values for long-term debt securities, including asset-backed securities (“ABS”), collateralized loan obligations (“CLO”), collateralized mortgage obligations (“CMO”), corporate obligations, whole loans, and mortgage-backed securities (“MBS”) are normally determined on the basis of valuations provided by independent pricing services. Vendors typically value such securities based on one or more inputs, including but not limited to, benchmark yields, transactions, bids, offers, quotations from dealers and trading systems, new issues, spreads and other relationships observed in the markets among comparable securities; and pricing models such as yield measurers calculated using factors such as cash flows, financial or collateral performance and other reference data. In addition to these inputs, MBS and ABS may utilize cash flows, prepayment information, default rates, delinquency and loss assumptions, collateral characteristics, credit enhancements and specific deal information. Reverse repurchase agreements are priced at their acquisition cost, and assessed for credit adjustments, which represents fair value. Futures contracts are carried at fair value using the primary exchange’s closing (settlement) price.
Subject to its oversight, the Trust’s Board of Trustees (the “Board”) has delegated primary responsibility for determining or causing to be determined the value of the Fund’s investments to Empowered Funds, LLC dba EA Advisers (the “Adviser”), pursuant to the Trust’s valuation policy and procedures, which have been adopted by the Trust and approved by the Board. In accordance with Rule 2a-5 under the 1940 Act, the Board designated the Adviser as the “valuation designee” of the Fund. If the Adviser, as valuation designee, determines that reliable market quotations are not readily available for an investment, the investment is valued at fair value as determined in good faith by the Adviser in accordance with the Trust’s fair valuation policy and procedures. The Adviser will provide the Board with periodic reports, no less frequently than quarterly, that discuss the functioning of the valuation process, if applicable, and that identify issues and valuation problems that have arisen, if any. As appropriate, the Adviser and the Board will review any securities valued by the Adviser in accordance with the Trust’s valuation policies during these periodic reports. The use of fair value pricing by the Fund may cause the net asset value of its shares to differ significantly from the net asset value that would be calculated without regard to such considerations. As of September 30, 2024, the Funds did not hold any securities that required fair valuation due to unobservable inputs.
As described above, the Funds may use various methods to measure the fair value of their investments on a recurring basis. GAAP establishes a hierarchy that prioritizes inputs to valuation methods. The three levels of inputs are:
Level 1 – Unadjusted quoted prices in active markets for identical assets or liabilities that the Funds have the ability to access.
Level 2 – Observable inputs other than quoted prices included in Level 1 that are observable for the asset or liability, either directly or indirectly. These inputs may include quoted prices for the identical instrument on an inactive market, prices for similar instruments, interest rates, prepayment speeds, credit risk, yield curves, default rates and similar data.
Level 3 – Unobservable inputs for the asset or liability, to the extent relevant observable inputs are not available; representing the Funds’ own assumptions about the assumptions a market participant would use in valuing the asset or liability and would be based on the best information available.
ALPHA ARCHITECT ETFs
NOTES TO THE FINANCIAL STATEMENTS (CONTINUED)
September 30, 2024
The availability of observable inputs can vary from security to security and is affected by a wide variety of factors, including, for example, the type of security, whether the security is new and not yet established in the marketplace, the liquidity of markets, and other characteristics particular to the security. To the extent that valuation is based on models or inputs that are less observable or unobservable in the market, the determination of fair value requires more judgment. Accordingly, the degree of judgment exercised in determining fair value is greatest for instruments categorized in Level 3.
The inputs used to measure fair value may fall into different levels of the fair value hierarchy. In such cases, for disclosure purposes, the level in the fair value hierarchy within which the fair value measurement falls in its entirety, is determined based on the lowest level input that is significant to the fair value measurement in its entirety.
The following is a summary of the fair value classification of the Funds’ investments as of September 30, 2024:
| | | | | | | | | | | | | | | | | | | | | | | | | | |
| DESCRIPTION | | LEVEL 1 | | LEVEL 2 | | LEVEL 3 | | TOTAL |
| QVAL | | | | |
| Assets | | | | | | | | |
| Common Stocks | | $ | 375,076,609 | | | $ | — | | | $ | — | | | $ | 375,076,609 | |
| Money Market Funds | | 907,975 | | | — | | | — | | | 907,975 | |
| Total Investments in Securities | | $ | 375,984,584 | | | $ | — | | | $ | — | | | $ | 375,984,584 | |
| | | | | | | | |
| IVAL | | |
| Assets | | | | | | | | |
| Common Stocks | | $ | 149,259,542 | | | $ | — | | | $ | — | | | $ | 149,259,542 | |
| Investments Purchased with Proceeds from Securities Lending | | 2,701,695 | | | — | | | — | | | 2,701,695 | |
| Money Market Funds | | 150,545 | | | — | | | — | | | 150,545 | |
| Total Investments in Securities | | $ | 152,111,782 | | | $ | — | | | $ | — | | | $ | 152,111,782 | |
| | | | | | | | |
| QMOM | | | | |
| Assets | | | | | | | | |
| Common Stocks | | $ | 251,666,796 | | | $ | — | | | $ | — | | | $ | 251,666,796 | |
| Money Market Funds | | 866,204 | | | — | | | — | | | 866,204 | |
| Total Investments in Securities | | $ | 252,533,000 | | | $ | — | | | $ | — | | | $ | 252,533,000 | |
| | | | | | | | |
| IMOM | | |
| Assets | | | | | | | | |
| Common Stocks | | $ | 82,025,813 | | | $ | — | | | $ | — | | | $ | 82,025,813 | |
| Money Market Funds | | 134,817 | | | — | | | — | | | 134,817 | |
| Total Investments in Securities | | $ | 82,160,630 | | | $ | — | | | $ | — | | | $ | 82,160,630 | |
| | | | | | | | |
| VMOT | | |
| Assets | | | | | | | | |
| Exchange Traded Funds | | $ | 21,697,908 | | | $ | — | | | $ | — | | | $ | 21,697,908 | |
| Investments Purchased with Proceeds from Securities Lending | | 2,350,525 | | | — | | | — | | | 2,350,525 | |
| Money Market Funds | | 93,732 | | | — | | | — | | | 93,732 | |
| Total Investments in Securities | | $ | 24,142,165 | | | $ | — | | | $ | — | | | $ | 24,142,165 | |
| | | | | | | | |
ALPHA ARCHITECT ETFs
NOTES TO THE FINANCIAL STATEMENTS (CONTINUED)
September 30, 2024
| | | | | | | | | | | | | | | | | | | | | | | | | | |
| DESCRIPTION | | LEVEL 1 | | LEVEL 2 | | LEVEL 3 | | TOTAL |
| HIDE |
| Assets | | | | | | | | |
| Exchange Traded Funds | | $ | 22,951,945 | | | $ | — | | | $ | — | | | $ | 22,951,945 | |
| Money Market Funds | | 98,287 | | | — | | | — | | | 98,287 | |
| U.S. Treasury Bills | | — | | | 7,163,974 | | | — | | | 7,163,974 | |
| Total Investments in Securities | | $ | 23,050,232 | | | $ | 7,163,974 | | | $ | — | | | $ | 30,214,206 | |
| | | | | | | | |
| CAOS | | |
| Assets | | | | | | | | |
| Purchased Options | | $ | — | | | $ | 290,750,467 | | | $ | — | | | $ | 290,750,467 | |
| Exchange Traded Funds | | 28,918,192 | | | — | | | — | | | 28,918,192 | |
| Money Market Funds | | 1,608,862 | | | — | | | — | | | 1,608,862 | |
| Total Investments in Securities | | $ | 30,527,054 | | | $ | 290,750,467 | | | $ | — | | | $ | 321,277,521 | |
| | | | | | | | |
| Liabilities: | | | | | | | | |
| Written Options | | $ | — | | | $ | (72,664,570) | | | $ | — | | | $ | (72,664,570) | |
| Total Investments in Securities | | $ | — | | | $ | (72,664,570) | | | $ | — | | | $ | (72,664,570) | |
| | | | | | | | |
| BOXX | | | | | | |
| Assets | | | | | | | | |
| Purchased Options | | $ | — | | | $ | 6,290,200,077 | | | $ | — | | | $ | 6,290,200,077 | |
| Money Market Funds | | 1,969,805 | | | — | | | — | | | 1,969,805 | |
| Total Assets | | $ | 1,969,805 | | | $ | 6,290,200,077 | | | | | $ | 6,292,169,882 | |
| | | | | | | | |
| Liabilities: | | | | | | | | |
| Written Options | | $ | — | | | $ | (2,322,709,046) | | | $ | — | | | $ | (2,322,709,046) | |
| Total Investments in Securities | | $ | — | | | $ | (2,322,709,046) | | | $ | — | | | $ | (2,322,709,046) | |
Refer to the Schedules of Investments for additional information.
During the fiscal period ended September 30, 2024, the Funds did not invest in any Level 3 investments and recognized no transfers to/from Level 3. Transfers between levels are recognized at the end of the reporting period.
B.Options Contracts. In general, an option contract is an agreement between a buyer and seller that gives the purchaser of the option the right to buy or sell a particular asset at a specified future date at an agreed upon price (commonly known as the “strike price”). CAOS and BOXX’s portfolios include several types of FLEX Options, including both purchased and written put and call options (as further described below). The FLEX Options are all European style options, which means that they are exercisable at the strike price only on the FLEX Option expiration date. FLEX Options are customized option contracts available through national securities exchanges that are guaranteed for settlement by the Options Clearing Corporation (“OCC”), a market clearinghouse. FLEX Options provide investors with the ability to customize terms of an option, including exercise prices, exercise styles (European style versus American style options which are exercisable any time prior to the expiration date) and expiration dates, while achieving price discovery in competitive, transparent auctions markets and avoiding the counterparty exposure of the over-the-counter option positions.
ALPHA ARCHITECT ETFs
NOTES TO THE FINANCIAL STATEMENTS (CONTINUED)
September 30, 2024
Each FLEX Option contract entitles the holder thereof (i.e., the purchaser of the FLEX Option) the option to purchase (for the call options) or sell (for the put options) the cash value of the reference asset as of the close of the market on the FLEX Option expiration date at the strike price. The Fund intends to be structured so that any amount owed by the Fund on the written FLEX Options will be covered by payouts at expiration from the purchased FLEX Options. As a result, the FLEX Options will be fully covered, and no additional collateral will be necessary during the life of the Fund. The Fund receives premiums in exchange for the written FLEX Options and pays premiums in exchange for the purchased FLEX Options. The OCC and securities exchange that the FLEX Options are listed on do not charge ongoing fees to writers or purchasers of the FLEX Options during their life for continuing to hold the option contracts. In general, put options give the holder (i.e., the buyer) the right to sell an asset (or deliver the cash value of the index, in case of an index put option) and the seller (i.e., the writer) of the put has the obligation to buy the asset (or receive cash value of the index, in case of an index put option) at a certain defined price. Call options give the holder (i.e., the buyer) the right to buy an asset (or receive cash value of the index, in case of an index call option) and the seller (i.e., the writer) the obligation to sell the asset (or deliver cash value of the index, in case of an index call option) at a certain defined price.
When the Funds purchase an option, an amount equal to the premium paid by the Funds are recorded as an investment and is subsequently adjusted to the current value of the option purchased. If an option expires on the stipulated expiration date or if the Funds enter into a closing sale transaction, a gain or loss is realized. If a call option is exercised, the cost of the security acquired is increased by the premium paid for the call. If a put option is exercised, a gain or loss is realized from the sale of the underlying security, and the proceeds from such sale are decreased by the premium originally paid. Purchased options are non-income producing securities. When the Funds write an option, an amount equal to the premium received by the Funds are recorded as a liability and is subsequently adjusted to the current value of the option written. Premiums received from writing options that expire unexercised are treated by the Funds on the expiration date as realized gain from written options. The difference between the premium and the amount paid on effecting a closing purchase transaction, including brokerage commissions, is also treated as a realized gain, or if the premium is less than the amount paid for the closing purchase transaction, as a realized loss. If a call option is exercised, the premium is added to the proceeds from the sale of the underlying security in determining whether the Funds have realized a gain or loss. If a put option is exercised, the premium reduces the cost basis of the securities purchased by the Funds. The Funds, as writers of an option, bear the market risk of an unfavorable change in the price of the security underlying the written option.
The OCC guarantees performance by each of the counterparties to FLEX Options, becoming the “buyer for every seller and the seller for every buyer,” protecting clearing members and options traders from counterparty risk. Subject to determination by the Securities Committee of the OCC, adjustments may be made to the FLEX Options for certain events (collectively, “Corporate Actions”) specified in the OCC’s by-laws and rules: certain stock dividends or distributions, stock splits, reverse stock splits, rights offerings, distributions, reorganizations, recapitalizations, or reclassifications with respect to an underlying security, or a merger, consolidation, dissolution or liquidation of the issuer of the underlying security. According to the OCC’s by-laws, the nature and extent of any such adjustment is to be determined by the OCC’s Securities Committee, in light of the circumstances known to it at the time such determination is made, based on its judgment as to what is appropriate for the protection of investors and the public interest, taking into account such factors as fairness to holders and writers (or purchasers and sellers) of the affected options, the maintenance of a fair and orderly market in the affected options, consistency of interpretation and practice, efficiency of exercise settlement procedures, and the coordination with other clearing agencies of the clearance and settlement of transactions in the underlying interest.
ALPHA ARCHITECT ETFs
NOTES TO THE FINANCIAL STATEMENTS (CONTINUED)
September 30, 2024
The value of derivative instruments on the Statements of Assets and Liabilities for the CAOS and BOXX as of September 30, 2024, are as follows:
| | | | | | | | | | | | | | |
| | Equity Risk - Call and Put Options not Accounted for as Hedging Instruments |
| | Asset Derivatives | | Liability Derivatives |
| | Purchased Options, at Value | | Written Options, at Value |
| CAOS | | $ | 290,750,467 | | | $ | 72,664,570 | |
| BOXX | | $ | 6,290,200,077 | | | $ | 2,322,709,046 | |
The effects of derivative instruments on the Statement of Operations for the period ended September 30, 2024, are as follows:
| | | | | | | | | | | | | | | | | | | | | | | | | | |
| | Equity Risk - Call and Put Options not Accounted for as Hedging Instruments |
| | Amount of Realized Gain (Loss) on Derivatives Recognized in Income(1) |
| | Purchased Options | | Purchased Options in-kind | | Written Options | | Written Options in-kind |
| CAOS | | $ | 342,906,828 | | | $ | 1,889,038 | | | $ | (354,221,761) | | | $ | (12,554) | |
| BOXX | | $ | (133,850,898) | | | $ | 83,517,410 | | | $ | 73,978,155 | | | $ | 109,913,765 | |
(1) Realized gain (loss) on purchased options is included within the net realized (loss) on investments balance on the Statements of Operations. |
| | | | | | | | | | | | | | |
| | Equity Risk - Call and Put Options not Accounted for as Hedging Instruments |
| | Amount of Change in Unrealized Appreciation (Depreciation) on Derivatives Recognized in Income (1) |
| | Purchased Options | | Written Options |
| CAOS | | $ | 7,868,237 | | | $ | 9,020,605 | |
| BOXX | | $ | 17,556,751 | | | $ | (39,510,241) | |
(1) Unrealized gain (loss) on purchased options is included within the change in net unrealized gain (loss) on investments balance on the Statements of Operations. |
The average volume of derivative activity for the period ended September 30, 2024, is as follows:
| | | | | | | | | | | | | | |
| | Purchased Options | | Written Options |
| | Average Monthly Market Value | | Average Monthly Market Value |
| CAOS | | $ | 150,630,953 | | | $ | (52,176,198) | |
| BOXX | | $ | 3,370,926,802 | | | $ | (954,449,629) | |
C.Hedging. To seek to avoid down trending markets, VMOT may hedge up to 100% of the value of its long portfolio. The Fund will engage in hedging of its U.S. portfolio by shorting a representative broad-based U.S. securities index ETF or similar futures contracts. Likewise, the Fund will engage in hedging of its international portfolio by shorting a representative broad-based international securities index ETF or similar futures contracts. When the Fund engages in a short sale, the Fund must borrow the security sold short and deliver the security to the counterparty. Short selling allows the Fund to profit from a decline in a market price to the extent such decline exceeds the transaction costs and the costs of borrowing the securities. The Fund will pay a fee or premium to borrow the securities sold short and is obligated to repay the lenders of the securities. Any dividends or interest that accrues on the securities during the period of the loan are due to the lenders. A gain, limited to the price at which the security was sold short, or a loss, unlimited in size, will be recognized upon the termination of the short sale; which is affected by the Fund purchasing the security sold short and delivering the security to the lender. Any such gain or loss may be offset, completely or in part, by the change in the value of the long portion of the Fund’s portfolio. The Fund is subject to
ALPHA ARCHITECT ETFs
NOTES TO THE FINANCIAL STATEMENTS (CONTINUED)
September 30, 2024
the risk that it may be unable to reacquire a security to terminate a short position except at a price substantially in excess of the last quoted price. Also, there is the risk that the counterparty to a short sale may fail to honor its contractual terms, causing a loss to the Fund. Securities that are hard to borrow may earn a rebate that is less than the foregoing or may be subject to a premium charge on a security by security basis. The different rebate rate is determined at the time of a short sale request. For the year ended September 30, 2024, the Fund did not incur any dividend interest income or dividend interest expense, as shown on the Statement of Operations. Restricted cash in the amount of $963, as shown on the Statement of Assets and Liabilities, is associated with collateral at the broker as of September 30, 2024.
D.Foreign Currency. Investment securities and other assets and liabilities denominated in foreign currencies are translated into U.S. dollar amounts using the spot rate of exchange at the date of valuation. Purchases and sales of investment securities and income and expense items denominated in foreign currencies are translated into U.S. dollar amounts on the respective dates of such transactions.
The Funds isolate the portion of the results of operations resulting from changes in foreign exchange rates on investments from the fluctuations arising from changes in market prices of securities held. That portion of gains (losses) attributable to the changes in market prices and the portion of gains (losses) attributable to changes in foreign exchange rates are included on the “Statement of Operations” under “Net realized gain (loss) – Foreign currency.”
Each Fund reports net realized foreign exchange gains or losses that arise from sales of foreign currencies, currency gains or losses realized between the trade and settlement dates on securities transactions, and the difference between the amounts of dividends, interest, and foreign withholding taxes recorded on the Fund’s books and the U.S. dollar equivalent of the amounts actually received or paid. Net unrealized foreign exchange gains and losses arise from changes in the fair values of assets and liabilities, other than investments in securities at fiscal year-end, resulting from changes in exchange rates.
E.Federal Income Taxes. Each Fund intends to continue to comply with the requirements of Subchapter M of the Internal Revenue Code of 1986, as amended, as necessary to qualify as a regulated investment company and distribute substantially all net taxable investment income and net realized gains to shareholders in a manner which results in no tax cost to a Fund. Therefore, no federal income tax provision is required. As of and during the fiscal period ended September 30, 2024, the Funds did not have any tax positions that did not meet the “more-likely-than-not” threshold of being sustained by the applicable tax authority. As of and during the fiscal period ended September 30, 2024, the Funds did not have liabilities for any unrecognized tax benefits. A Fund would/will recognize interest and penalties, if any, related to unrecognized tax benefits on uncertain tax positions as income tax expense in the Funds’ Statement of Operations. During the fiscal period ended September 30, 2024, the Funds did not incur any interest or penalties. Each Fund is subject to examination by U.S. taxing authorities for the tax periods since each Fund’s commencement of operations.
Each Fund may be subject to taxes imposed on realized and unrealized gains on securities of certain foreign countries in which the Fund invests. The foreign tax expense, if any, was recorded on an accrual basis and is included in “Net realized gain (loss) on investments” and “Net increase (decrease) in unrealized appreciation or depreciation on investments” on the accompanying Statements of Operations. The amount of foreign tax owed, if any, is included in “Payable for foreign taxes” on the accompanying Statements of Assets and Liabilities and is comprised of taxes on unrealized gains.
F.Security Transactions and Investment Income. Investment securities transactions are accounted for on the trade date. Gains and losses realized on sales of securities are determined on a specific identification basis. Dividend income is recorded on the ex-dividend date, net of any foreign taxes withheld at source. Interest income is recorded on an accrual basis. Withholding taxes on foreign dividends have been provided for in accordance with the Funds’ understanding of the applicable tax rules and regulations.
ALPHA ARCHITECT ETFs
NOTES TO THE FINANCIAL STATEMENTS (CONTINUED)
September 30, 2024
Distributions received from a Funds’ investments in REITs and MLPs may be characterized as ordinary income, net capital gain, or return of capital. The proper characterization of such distributions is generally not known until after the end of each calendar year. As such, the Funds must use estimates in reporting the character of their income and distributions for financial statement purposes. Such estimates are based on historical information available from each MLP and other industry sources. The actual character of distributions to each Fund’s shareholders will be reflected on the Form 1099 received by shareholders after the end of the calendar year. Due to the nature of such investments, a portion of the distributions received by each Fund’s shareholders may represent a return of capital.
Distributions to shareholders from net investment income for QVAL and IVAL are declared and paid on a quarterly basis. Distributions to shareholders from net investment income for QMOM, IMOM, VMOT, HIDE, CAOS and BOXX are declared and paid on an annual basis. Distributions to shareholders from net realized gains on securities normally are declared and paid on an annual basis for each Fund. Distributions are recorded on the ex-dividend date. Each Fund may distribute more frequently, if necessary, for tax purposes.
G.Use of Estimates. The preparation of financial statements in conformity with GAAP requires management to make estimates and assumptions that affect the reported amounts of assets and liabilities at the date of the financial statements, as well as the reported amounts of increases and decreases in net assets from operations during the period. Actual results could differ from those estimates.
H.Share Valuation. The NAV per share of each Fund is calculated by dividing the sum of the value of the securities held by the Fund, plus cash and other assets, minus all liabilities (including estimated accrued expenses) by the total number of shares outstanding for the Fund, rounded to the nearest cent. The Funds’ shares will not be priced on the days on which the New York Stock Exchange (“NYSE”) is closed for regular trading. The offering and redemption price per share for each Fund is equal to the Fund’s net asset value per share.
I.Guarantees and Indemnifications. In the normal course of business, the Funds enter into contracts with service providers that contain general indemnification clauses. Additionally, as is customary, the Trust’s organizational documents permit the Trust to indemnify its officers and trustees against certain liabilities under certain circumstances. Each Fund’s maximum exposure under these arrangements is unknown as this would involve future claims that may be against the Funds that have not yet occurred. As of the date of this Report, no claim has been made for indemnification pursuant to any such agreement of the Funds.
J.Reclassification of Capital Accounts. GAAP requires that certain components of net assets relating to permanent differences be reclassified between financial and tax reporting. These reclassifications have no effect on net assets or net asset value per share. In addition, the Funds realized net capital gains resulting from in-kind redemptions, in which shareholders exchanged Fund shares for securities held by the Funds rather than for cash. Because such gains are not taxable to the Funds, and are not distributed to shareholders, they have been reclassified from distributable earnings to paid-in capital. For the fiscal period ended September 30, 2024, the following table shows the reclassifications made:
| | | | | | | | | | | | | | |
| | Distributable
Earnings | | Paid-in
Capital |
| QVAL | | $ | (72,450,275) | | | $ | 72,450,275 | |
| IVAL | | (28,092,171) | | | 28,092,171 | |
| QMOM | | (61,514,726) | | | 61,514,726 | |
| IMOM | | (15,772,406) | | | 15,772,406 | |
| VMOT | | (4,083,449) | | | 4,083,449 | |
| HIDE | | 6,247 | | | (6,247) | |
| CAOS | | (7,632,349) | | | 7,632,349 | |
| BOXX | | (48,068,008) | | | 48,068,008 | |
ALPHA ARCHITECT ETFs
NOTES TO THE FINANCIAL STATEMENTS (CONTINUED)
September 30, 2024
NOTE 3 – RISKS
An investment in the Funds involves risk, including those described below. There is no assurance that the Funds will achieve its investment objective. An investor may lose money by investing in the Funds. An investment in the Funds is not a bank deposit and is not insured or guaranteed by the FDIC or any government agency.
| | | | | | | | | | | | | | |
| Risks | QVAL | IVAL | QMOM | IMOM |
| Consumer Discretionary Sector Risk | ☑ | ☑ | ☑ | ☑ |
| Depositary Receipts Risk | | ☑ | | ☑ |
| Energy Sector Risk | ☑ | ☑ | | |
| Equity Investing Risk | ☑ | ☑ | ☑ | ☑ |
| ETF Risks | ☑ | ☑ | ☑ | ☑ |
| Financials Sector Risk | | | | ☑ |
| Foreign Investment Risk | | ☑ | | ☑ |
| Geopolitical/Natural Disasters Risks | ☑ | ☑ | ☑ | ☑ |
| | | | |
| High Portfolio Turnover Risk | ☑ | | ☑ | ☑ |
| Industrials Sector Risk | ☑ | ☑ | ☑ | |
| Information Technology Risk | | | ☑ | |
| Investment Risk | ☑ | ☑ | ☑ | ☑ |
| Large-Capitalization Companies Risk | ☑ | ☑ | ☑ | ☑ |
| Management Risk | ☑ | ☑ | ☑ | ☑ |
| | | | |
| Momentum Style Risk | | | ☑ | ☑ |
| Periodic Reallocation Risk | ☑ | ☑ | ☑ | ☑ |
| Quantitative Security Selection Risk | ☑ | ☑ | ☑ | ☑ |
| Small and Mid-Capitalization Company Risk | ☑ | ☑ | ☑ | ☑ |
| Value Style Investing Risk | ☑ | ☑ | | |
| | | | | | | | | | | | | | |
| Risks | VMOT | HIDE | CAOS | BOXX |
| Asset Allocation Risk | | ☑ | | |
| Cash and Cash Equivalents Risk | | ☑ | ☑ | ☑ |
| Cash Creation Unit Risk | | | ☑ | ☑ |
| Commodity Futures Risk | | ☑ | | |
| Commodity Risk | | ☑ | | |
| Commodity Swaps Risk | | ☑ | | |
| Commodity-Linked Derivatives Risk | | ☑ | | |
| Commodity-Linked Note Risk | | ☑ | | |
| Consumer Discretionary Sector Risk | ☑ | | | |
| Counterparty Risk | | | ☑ | ☑ |
| Credit Risk | | ☑ | | |
| Depositary Receipts Risk | ☑ | | | |
| Derivatives Risk | ☑ | ☑ | ☑ | |
| Energy Sector Risk | ☑ | | | |
| Equity Investing Risk | ☑ | | | |
| Equity Securities Risk | | | ☑ | |
| ETF Risks | ☑ | ☑ | ☑ | ☑ |
| Fixed Income Risk | | ☑ | | |
ALPHA ARCHITECT ETFs
NOTES TO THE FINANCIAL STATEMENTS (CONTINUED)
September 30, 2024
| | | | | | | | | | | | | | |
| Risks | VMOT | HIDE | CAOS | BOXX |
| Foreign Investment Risk | ☑ | | | |
| Frequent Trading Risk | | | | ☑ |
| Fund of Funds Risk | ☑ | ☑ | | |
| Geopolitical/Natural Disasters Risks | ☑ | ☑ | ☑ | ☑ |
| Hedging Model Risk | ☑ | | | |
| Hedging Risk – General | ☑ | | | |
| High Portfolio Turnover Risk | | ☑ | ☑ | |
| Interest Rate Risk | | ☑ | | |
| Investment Company Risk | | ☑ | ☑ | |
| Investment Risk | ☑ | ☑ | ☑ | ☑ |
| Large-Capitalization Companies Risk | ☑ | | ☑ | |
| Large Shareholder Risk | | | | ☑ |
| Leverage Risk | | ☑ | ☑ | |
| Limited Operating History Risk | | | | ☑ |
| Low Short-Term Interest Rates Risk | | | | ☑ |
| Management Risk | ☑ | ☑ | ☑ | ☑ |
| Market Risk | | | ☑ | ☑ |
| Momentum Style Risk | ☑ | | | |
| Non-Diversification Risk | | ☑ | | |
| Options Risk | | | ☑ | ☑ |
| Periodic Reallocation Risk | ☑ | | | |
| Portfolio Size Risk | ☑ | | | |
| Quantitative Security Selection Risk | ☑ | ☑ | | |
| Real Estate Investment Risk | | ☑ | | |
| Risk of U.S. Treasury Bills | | ☑ | | |
| Short Sale Risk | ☑ | | | |
| Small- and Mid-Capitalization Company Risk | ☑ | | | |
| Tax Risk | | | ☑ | |
| Underlying Alpha Architect ETFs Risk | ☑ | | | |
| U.S. Government Securities Risk | | | ☑ | |
| Valuation Risk | | | ☑ | ☑ |
| Value Style Investing Risk | ☑ | | | |
Asset Allocation Risk. The Fund is also subject to asset allocation risk, which is the chance that the selection of investments, and the allocation of assets to such investments, will cause the Fund to underperform other funds with a similar investment objective.
Cash and Cash Equivalents Risk. At any time, the Fund may have significant investments in cash or cash equivalents. When a substantial portion of a portfolio is held in cash or cash equivalents, there is the risk that the value of the cash account, including interest, will not keep pace with inflation, thus reducing purchasing power over time.
Commodity Risk. Investing in physical commodities is speculative and can be extremely volatile. Market prices of commodities may fluctuate rapidly based on numerous factors, including: changes in supply and demand relationships (whether actual, perceived, anticipated, unanticipated or unrealized); weather; agriculture; trade; domestic and foreign political and economic events and policies; diseases; pestilence; technological developments; currency exchange rate
ALPHA ARCHITECT ETFs
NOTES TO THE FINANCIAL STATEMENTS (CONTINUED)
September 30, 2024
fluctuations; and monetary and other governmental policies, action and inaction. When the Fund obtains exposure to commodities through its investments in other underlying funds, it will be indirectly exposed to the foregoing risks.
Commodity-Linked Derivatives Risk. The Fund seeks to gain exposure to commodity markets by investing in underlying funds that have exposure to commodities and this may include exposure to commodity-linked derivatives. The value of a commodity-linked derivative investment is typically based upon the price movements of a physical commodity (such as heating oil, precious metals, livestock, or agricultural products), a commodity futures contract or commodity index, or some other readily measurable economic variable. Commodity-linked derivatives provide exposure, which may include long and/or short exposure, to the investment returns of physical commodities that trade in the commodities markets without investing directly in physical commodities. The value of commodity-linked derivative instruments may be affected by changes in overall market movements, volatility of the underlying Index, changes in interest rates, or factors affecting a particular industry or commodity, such as drought, floods, weather, livestock disease, embargoes, tariffs and international economic, political and regulatory developments. The value of commodity-linked derivatives will rise or fall in response to changes in the underlying commodity or related index. Investments in commodity-linked derivatives may be subject to greater volatility than non-derivative based investments. A highly liquid secondary market may not exist for certain commodity-linked derivatives, and there can be no assurance that one will develop.
Commodity Futures Risk. The Fund seeks to gain exposure to commodity markets by investing in underlying funds that have exposure to commodities and this may include exposure to commodity futures. Risks of commodity futures include: (i) an imperfect correlation between the value of the futures contract and the underlying commodity or commodity index; (ii) possible lack of a liquid secondary market; (iii) the inability to close a futures contract when desired; (iv) losses caused by unanticipated market movements, which may be unlimited; and (v) an obligation for the investor to make daily cash payments to maintain its required collateral, or margin, particularly at times when the investor may have insufficient cash or must sell securities to meet those margin requirements. Although the counterparty to an exchange-traded futures contract is often backed by a futures commission merchant (“FCM”) or clearing organization that is further backed by a group of financial institutions, there may be instances in which the FCM or the clearing organization could fail to perform its obligations, causing significant losses to the investor.
Commodity Swaps Risk. The Fund seeks to gain exposure to commodity markets by investing in underlying funds that have exposure to commodities and this may include exposure to commodity swaps. If a counterparty to a commodity swap agreement becomes bankrupt or otherwise fails to perform its obligations under the commodity swap due to financial difficulties, the Fund could suffer losses. Central clearing is designed to reduce counterparty credit risk compared to uncleared commodity swaps because central clearing interposes the central clearinghouse as the counterparty to each participant’s swap, but it does not eliminate those risks completely. Credit risk of cleared commodity swap participants is concentrated in a few clearinghouses and the consequences of insolvency of a clearinghouse are not clear. Commodity Swaps are subject to pricing risk (i.e., commodity swaps may be hard to value) and may be considered illiquid.
Commodity-Linked Note Risk. The Fund seeks to gain exposure to commodity markets by investing in underlying funds that have exposure to commodities and this may include exposure to commodity-linked notes. Commodity-linked notes have characteristics of both a debt security and a derivative. Typically, they are issued by a bank at a specified face value and pay a fixed or floating rate linked to the performance of an underlying asset, such as commodity indices, particular commodities or commodity futures contracts. As such, an investor faces the economic risk of movements in commodity prices by investing in such notes. These notes also are subject to credit, market and interest rate risks that in general affect the values of debt securities.
Counterparty Risk. Counterparty risk is the risk that a counterparty to a financial instrument held by the Fund may become insolvent or otherwise fail to perform its obligations, and the Fund may obtain no or limited recovery of its investment, and any recovery may be significantly delayed. Exchange listed options, including FLEX Options, are issued and guaranteed for settlement by the Options Clearing Corporation (“OCC”). The Fund’s investments are at risk that the OCC will be unable or unwilling to perform its obligations under the option contract terms. In the unlikely event that the OCC becomes insolvent or is otherwise unable to meet its settlement obligations, the Fund could suffer significant losses.
ALPHA ARCHITECT ETFs
NOTES TO THE FINANCIAL STATEMENTS (CONTINUED)
September 30, 2024
Credit Risk. Debt securities are subject to credit risk. Credit risk refers to the possibility that the issuer or guarantor of a security will be unable and/or unwilling to make timely interest payments and/or repay the principal on its debt or to otherwise honor its obligations and/or default completely. Debt securities are subject to varying degrees of credit risk, depending on the issuer’s financial condition and on the terms of the securities, which may be reflected in credit ratings. There is a possibility that the credit rating of a debt security may be downgraded after purchase or the perception of an issuer’s credit worthiness may decline, which may adversely affect the value of the security.
Depositary Receipts Risk. The risks of investments in depositary receipts, including American Depositary Receipts (“ADRs”), European Depositary Receipts (“EDRs”), and Global Depositary Receipts (“GDRs”), are substantially similar to Foreign Investment Risk. In addition, depositary receipts may not track the price of the underlying foreign securities, and their value may change materially at times when the U.S. markets are not open for trading.
Derivatives Risk. A derivative is any financial instrument whose value is based on, and determined by, another asset, rate or index (i.e., stock options, futures contracts, caps, floors, etc.). Unfavorable changes in the value of the underlying asset, rate or index may cause sudden losses. Changes in the value of a derivative may not correlate perfectly with the underlying asset, rate or index, a the Fund could lose more than the principal amount invested. Derivative instruments are subject to a number of risks including counterparty, liquidity, interest rate, market, credit and management risks, as well as the risk of improper valuation. To the extent a derivative contract is used to hedge another position in the Fund, the Fund will be exposed to the risks associated with hedging. Since the Fund primarily uses exchange-traded equity index futures contracts and exchange-traded interest rate futures contracts, the primary risks associated with the Fund’s use of derivatives are equity market risk and hedging risk.
Equity Investing Risk. An investment in the Fund involves risks similar to those of investing in any fund holding equity securities, such as market fluctuations, changes in interest rates and perceived trends in stock prices. The values of equity securities could decline generally or could underperform other investments. In addition, securities may decline in value due to factors affecting a specific issuer, market or securities markets generally.
Equity Securities Risk. Investments in securities whose performance is linked to that of equity securities, such as SPX Options, may fluctuate in value in response to many factors, including the activities of the individual issuers included in the Index, general market and economic conditions, interest rates, and specific industry changes. Such price fluctuations subject the Fund to potential losses.
Fixed Income Risk. The market value of fixed income securities will change in response to interest rate changes and other factors, such as changes in the effective maturities and credit ratings of fixed income investments. During periods of falling interest rates, the values of outstanding fixed income securities and related financial instruments generally rise. Conversely, during periods of rising interest rates, the values of such securities and related financial instruments generally decline. Fixed income investments are also subject to credit risk.
Foreign Investment Risk. Returns on investments in foreign securities could be more volatile than, or trail the returns on, investments in U.S. securities. Investments in or exposures to foreign securities are subject to special risks, including risks associated with foreign securities generally, including differences in information available about issuers of securities and investor protection standards applicable in other jurisdictions; capital controls risks, including the risk of a foreign jurisdiction imposing restrictions on the ability to repatriate or transfer currency or other assets; currency risks; political, diplomatic and economic risks; regulatory risks; and foreign market and trading risks, including the costs of trading and risks of settlement in foreign jurisdictions.
•Risks Related to Investing in Australia. To the extent the Fund invests in Australian securities, it will be subject to risks related to investing in Australia. Investments in Australian issuers may subject the Fund to regulatory, political, currency, security, and economic risk specific to Australia. The Australian economy is heavily dependent on exports from the agricultural and mining sectors. This makes the Australian economy susceptible to fluctuations in the commodity markets. Australia is also dependent on trading with key trading partners.
ALPHA ARCHITECT ETFs
NOTES TO THE FINANCIAL STATEMENTS (CONTINUED)
September 30, 2024
•Risks Related to Investing in Europe. To the extent the Fund invests in European securities, it will be subject to risks related to investing in Europe. The economies and markets of European countries are often closely connected and interdependent, and events in one country in Europe can have an adverse impact on other European countries. The Fund makes investments in securities of issuers that are domiciled in, or have significant operations in, member countries of the European Union (the “EU”) that are subject to economic and monetary controls that can adversely affect the Fund’s investments. The European financial markets have experienced volatility and adverse trends in recent years and these events have adversely affected the exchange rate of the euro and may continue to significantly affect other European countries. Decreasing imports or exports, changes in governmental or EU regulations on trade, changes in the exchange rate of the euro, the default or threat of default by an EU member country on its sovereign debt, and/or an economic recession in an EU member country may have a significant adverse effect on the economies of EU member countries and their trading partners, including some or all of the European countries in which the Fund invests.
In addition, the United Kingdom resolved to leave the EU, an event commonly known as “Brexit.” The United Kingdom officially left the EU on January 31, 2020. Although the UK and EU have made a trade agreement that was entered into force on May 1, 2021, certain post-EU arrangements were outside the scope of the negotiating mandate and remain unresolved and subject to further negotiation and agreement. There remains significant market uncertainty regarding Brexit’s ramifications, and the range of possible political, regulatory, economic and market outcomes are difficult to predict. The uncertainty surrounding the UK’s economy, and its legal, political, and economic relationship with the remaining member states of the EU, may continue to be a source of instability and cause considerable disruption in securities markets, including increased volatility and illiquidity, as well as currency fluctuations in the British pound’s exchange rate against the U.S. dollar.
•Risks Related to Investing in Japan. As of September 30, 2023, a significant portion of the Fund’s assets was invested in Japanese securities. As a result, the Fund is subject to greater risks of adverse developments in Japan and/or the surrounding regions than a fund that is more broadly diversified geographically. Political, social or economic disruptions in Japan or the region, even in countries in which the Fund is not invested, may adversely affect the value of investments held by the Fund.
The Japanese economy may be subject to considerable degrees of economic, political and social instability, which could have a negative impact on Japanese securities. Since the year 2000, Japan’s economic growth rate has remained relatively low and it may remain low in the future. In addition, Japan is subject to the risk of natural disasters, such as earthquakes, volcanoes, typhoons and tsunamis.
Additionally, decreasing U.S. imports, new trade regulations, changes in the U.S. dollar exchange rates, a recession in the United States or continued increases in foreclosure rates may have an adverse impact on the economy of Japan. Japan also has few natural resources, and any fluctuation or shortage in the commodity markets could have a negative impact on Japanese securities. In addition, Japan is subject to the risk of natural disasters, such as earthquakes, volcanic eruptions, typhoons and tsunamis, which could negatively affect the Funds’ investment in Japan.
Fund of Funds Risk. Because it invests primarily in other funds, the Fund’s investment performance largely depends on the investment performance of those Underlying Alpha Architect ETFs. An investment in the Fund is subject to the risks associated with the Underlying Alpha Architect ETFs that comprise the Fund’s portfolio. At times, certain of the segments of the market represented by constituent Underlying Alpha Architect ETFs may be out of favor and underperform other segments. The Fund indirectly pays a proportional share of the expenses of the Underlying Alpha Architect ETFs in which it invests (including operating expenses and management fees), which are identified in the fee schedule above as “Acquired Fund Fees and Expenses.”
Geopolitical/Natural Disaster Risks. The Fund’s investments are subject to geopolitical and natural disaster risks, such as war, terrorism, trade disputes, political or economic dysfunction within some nations, public health crises and related geopolitical events, as well as environmental disasters, epidemics and/or pandemics, which may add to instability in world economies and volatility in markets. The impact may be short-term or may last for extended periods.
ALPHA ARCHITECT ETFs
NOTES TO THE FINANCIAL STATEMENTS (CONTINUED)
September 30, 2024
Hedging Risk - General. A hedge is an investment made in order to reduce the risk of adverse price movements in a security, by taking an offsetting position in a related security or basket of securities (often a derivative, such as an option or a short sale). While hedging strategies can be very useful and inexpensive ways of reducing risk, they are sometimes ineffective due to unexpected changes in the market. Hedging also involves the risk that changes in the value of the related security or basket of securities will not match those of the instruments being hedged as expected, in which case any losses on the instruments being hedged may not be reduced.
Hedging Model Risk. The risk that the Fund’s use of hedging strategies based on mathematical models may not produce the desired result or risk that the Adviser is unable to trade certain derivatives effectively or in a timely manner. The Adviser uses a mathematical approach to the implementation of hedging strategies. Maintenance of the hedging strategies will not ensure that the Fund will deliver competitive returns. The use of derivatives in connection with the Fund’s hedging strategies may expose the Fund to losses (some of which may be sudden) that it would not have otherwise been exposed to if it had only invested directly in equity securities. Hedging strategies could limit the Fund’s gains in rising markets and may expose the Fund to costs to which it would otherwise not have been exposed. The Fund’s hedging strategies may result in the Fund outperforming the general securities market during periods of flat or negative market performance and underperforming the general securities market during periods of positive market performance.
High Portfolio Turnover Risk. The Fund’s investment strategy may from time-to-time result in higher turnover rates. This may increase the Fund’s brokerage commission costs, which could negatively impact the performance of the Fund. Rapid portfolio turnover also exposes shareholders to a higher current realization of short-term capital gains, distributions of which would generally be taxed to you as ordinary income and thus cause you to pay higher taxes.
Investment Risk. When you sell your Shares of the Fund, they could be worth less than what you paid for them. The Fund could lose money due to short-term market movements and over longer periods during market downturns. Securities may decline in value due to factors affecting securities markets generally or particular asset classes or industries represented in the markets. The value of a security may decline due to general market conditions, economic trends or events that are not specifically related to the issuer of the security or to factors that affect a particular industry or group of industries. During a general downturn in the securities markets, multiple asset classes may be negatively affected. Therefore, you may lose money by investing in the Fund.
Investment Company Risk. An investment in other registered investment companies (including other ETFs, affiliated and non-affiliated) is subject to the risks associated with those investment companies, which include, but are not limited to, the risk that such fund’s investment strategy may not produce the intended results; the risk that securities in such fund may underperform in comparison to the general securities markets or other asset classes; and the risk that the fund will be concentrated in a particular issuer, market, industry or sector, and therefore will be especially susceptible to loss due to adverse occurrences affecting that issuer, market, industry or sector. Moreover, the Fund will incur duplicative expenses from such investments, bearing its share of that fund’s expenses while also paying its own advisory fees and trading costs. Investments in ETFs are also subject to the “ETF Risks” described below.
In addition, the Fund may invest in underlying funds which invest a larger portion of their assets in one or more sectors than many other mutual funds, and thus will be more susceptible to negative events affecting those sectors.
The Fund may invest in affiliated ETFs managed by the Adviser and/or Sub-Adviser. The Adviser and/or Sub-Adviser may be subject to potential conflicts of interest in selecting underlying funds because the fees paid to it by certain affiliated underlying funds are higher than the fees paid by other affiliated and unaffiliated underlying funds. To the extent the Fund invests a significant percentage of its assets in any one affiliated ETF or across multiple affiliated ETFs, the Fund will be subject to a greater degree to the risks particular to the investment strategies employed by the Adviser and/or Sub-Adviser.
Large-Capitalization Companies Risk. Large-capitalization companies may trail the returns of the overall stock market. Large-capitalization stocks tend to go through cycles of doing better - or worse - than the stock market in general. These periods have, in the past, lasted for as long as several years. Larger, more established companies may be slow to respond to challenges and may grow more slowly than smaller companies.
ALPHA ARCHITECT ETFs
NOTES TO THE FINANCIAL STATEMENTS (CONTINUED)
September 30, 2024
Leverage Risk. The Fund does not seek leveraged returns but as a result of the Fund’s investments in underlying funds that use certain derivatives it may create investment leverage. As a result, the use of these derivatives by the underlying funds may magnify losses to the Fund, and even a small market movement may result in significant losses to the Fund.
Low Short-Term Interest Rates Risk. During market conditions in which short-term interest rates are at low levels, the Fund’s yield can be very low, and the Fund may have a negative yield (i.e., it may lose money on an operating basis). During these conditions, it is possible that the Fund will generate an insufficient amount of income to pay its expenses. In addition, it is possible that during these conditions the Fund may experience difficulties purchasing and/or selling securities with respect to scheduled rebalances, and may, as a result, maintain a portion of its assets in cash, on which it may earn little, if any, income.
Management Risk. The Fund is actively managed and may not meet its investment objective based on the Adviser’s success or failure to implement investment strategies for the Fund.
Market Risk. The Fund’s investments are subject to changes in general economic conditions, general market fluctuations and the risks inherent in investment in interest rate sensitive markets. Interest rate markets can be volatile and prices of investments can change substantially due to various factors including, but not limited to, economic growth or recession, the investment’s average time to maturity, changes in interest rates, changes in the actual or perceived creditworthiness of issuers, and general market liquidity. The Fund is subject to the risk that geopolitical events will disrupt securities markets and adversely affect global economies and markets. Local, regional or global events such as war, acts of terrorism, the spread of infectious illness or other public health issues, or other events could have a significant impact on the Fund and its investments.
Momentum Style Risk. Investing in or having exposure to securities with the highest relative momentum entails investing in securities that have had above-average recent returns. These securities may be more volatile than a broad cross- section of securities. Returns on securities that have previously exhibited momentum may be less than returns on other styles of investing or the overall stock market. Momentum can turn quickly and cause significant variation from other types of investments, and stocks that previously exhibited high momentum may not experience continued highest relative momentum. In addition, there may be periods when the momentum style is out of favor, and during which the investment performance of the Fund using a momentum strategy may suffer.
Non-Diversification Risk. The Fund is non-diversified, meaning that it is permitted to invest a larger percentage of its assets in fewer issuers than diversified funds. Thus, the Fund may be more susceptible to adverse developments affecting any single issuer held in its portfolio and may be more susceptible to greater losses because of these developments.
Options Risk.
•Selling or Writing Options. Writing option contracts can result in losses that exceed the seller’s initial investment and may lead to additional turnover and higher tax liability. The risk involved in writing a call option is that there could be an increase in the market value of the underlying or reference asset. An underlying or reference asset may be an index, equity security, or ETF. If this occurs, the call option could be exercised and the underlying asset would then be sold at a lower price than its current market value. In the case of cash settled call options such as SPX options, the call seller would be required to purchase the call option at a price that is higher than the original sales price for such call option. Similarly, while writing call options can reduce the risk of owning the underlying asset, such a strategy limits the opportunity to profit from an increase in the market value of the underlying asset in exchange for up-front cash at the time of selling the call option. The risk involved in writing a put option is that there could be a decrease in the market value of the underlying asset. If this occurs, the put option could be exercised and the underlying asset would then be sold at a higher price than its current market value. In the case of cash settled put options, the put seller would be required to purchase the put option at a price that is higher than the original sales price for such put option.
•Buying or Purchasing Options Risk. If a call or put option is not sold when it has remaining value and if the market price of the underlying asset, in the case of a call option, remains less than or equal to the exercise price, or, in the case of a put option, remains equal to or greater than the exercise price, the buyer will lose its entire investment in
ALPHA ARCHITECT ETFs
NOTES TO THE FINANCIAL STATEMENTS (CONTINUED)
September 30, 2024
the call or put option. Since many factors influence the value of an option, including the price of the underlying asset, the exercise price, the time to expiration, the interest rate, and the dividend rate of the underlying asset, the buyer’s success in implementing an option buying strategy may depend on an ability to predict movements in the prices of individual assets, fluctuations in markets, and movements in interest rates. There is no assurance that a liquid market will exist when the buyer seeks to close out any option position. When an option is purchased to hedge against price movements in an underlying asset, the price of the option may move more or less than the price of the underlying asset.
•Box Spread Risk. A Box Spread is a synthetic bond created by combining different options trades that have offsetting spreads (e.g., purchases and sales on the same underlying instrument, such as an index or an ETF, but with different strike prices). If one or more of these individual option positions are modified or closed separately prior to the option contract’s expiration, then the Box Spread may no longer effectively eliminate risk tied to the underlying asset’s price movement. Furthermore, the Box Spread’s value is derived in the market and is in part, based on the time until the options comprising the Box Spread expire and the prevailing market interest rates. If the Fund (or an underlying ETF) sells a Box Spread prior to its expiration, then the Fund may incur a loss. The Fund’s ability to profit from Box Spreads is dependent on the availability and willingness of other market participants to sell Box Spreads to the Fund (or the underlying ETF) at competitive prices.
•FLEX Options Risk. FLEX Options are exchange-traded options contracts with uniquely customizable terms like exercise price, style, and expiration date. Due to their customization and potentially unique terms, FLEX Options may be less liquid than other securities, such as standard exchange listed options. In less liquid markets for the FLEX Options, the Fund may have difficulty closing out certain FLEX Options positions at desired times and prices. The value of FLEX Options will be affected by, among others, changes in the underlying share or equity index price, changes in actual and implied interest rates, changes in the actual and implied volatility of the underlying shares or equity index and the remaining time to until the FLEX Options expire. The value of the FLEX Options will be determined based upon market quotations or using other recognized pricing methods. During periods of reduced market liquidity or in the absence of readily available market quotations for the holdings of the Fund, the ability of the Fund to value the FLEX Options becomes more difficult and the judgment of the Fund’s Sub-Adviser (employing the fair value procedures adopted by the Board of Trustees of the Trust) may play a greater role in the valuation of the Fund’s holdings due to reduced availability of reliable objective pricing data.
Periodic Reallocation Risk. Because the Adviser will generally reallocate the Fund’s portfolio on a periodic basis (e.g., every two months), but at least quarterly, (i) the Fund’s market exposure may be affected by significant market movements promptly following the periodic reconstitution that are not predictive of the market’s performance for the subsequent period and (ii) changes to the Fund’s market exposure may lag a significant change in the market’s direction (up or down) by as long as a quarter if such changes first take effect promptly following the periodic reconstitution. Such lags between market performance and changes to the Fund’s exposure may result in significant underperformance relative to the broader equity or fixed income market.
Portfolio Size Risk. Pursuant to the Adviser’s methodology, the Fund’s portfolio is composed of a relatively small number of constituents. To the extent that a significant portion of the Fund’s total assets is invested in a limited number of holdings, the appreciation or depreciation of any one holding of the Fund may have a greater impact on the Fund’s NAV than it would if the Fund’s portfolio was comprised of a greater number of constituents.
Quantitative Security Selection Risk. Data for some companies may be less available and/or less current than data for companies in other markets. The Adviser uses a quantitative model, and its processes could be adversely affected if erroneous or outdated data is utilized. In addition, securities selected using the quantitative model could perform differently from the financial markets as a whole as a result of the characteristics used in the analysis, the weight placed on each characteristic and changes in the characteristic’s historical trends.
Real Estate Investment Risk. Companies in the real estate sector include companies that invest in real estate, such as real estate investment trusts (REITs) and real estate management and development companies. Companies that invest in real estate are subject to the risks of owning real estate directly as well as to risks that relate specifically to the way that such
ALPHA ARCHITECT ETFs
NOTES TO THE FINANCIAL STATEMENTS (CONTINUED)
September 30, 2024
companies operate, including management risk (such companies are dependent upon the management skills of a few key individuals and may have limited financial resources). Adverse economic, business or political developments affecting real estate could have a major effect on the value of an underlying fund’s investments. Investing in real estate is subject to such risks as decreases in real estate values, overbuilding, increased competition and other risks related to local or general economic conditions, increases in operating costs and property taxes, changes in zoning laws, casualty or condemnation losses, possible environmental liabilities, regulatory limitations on rent, possible lack of availability of mortgage financing, market saturation, fluctuations in rental income and the value of underlying properties and extended vacancies of properties. Certain real estate securities have a relatively small market capitalization, which may tend to increase the volatility of the market price of these securities. Real estate securities have limited diversification and are, therefore, subject to risks inherent in operating and financing a limited number of projects. Real estate securities are also subject to heavy cash flow dependency and defaults by borrowers or tenants. The Fund’s investments in REITs are subject to additional risks, such as poor performance by the manager of the REIT or failure by the REIT to qualify for tax-free pass through of income under the Code.
Risk of U.S. Treasury Bills. Direct obligations of the U.S. Treasury have historically involved little risk of loss of principal if held to maturity. However, due to fluctuations in interest rates, the market value of such securities may vary.
Sector Risk. Companies with similar characteristics may be grouped together in broad categories called sectors. A certain sector may underperform other sectors or the market as a whole. As the Sub-Adviser allocates more of the Fund’s portfolio holdings to a particular sector, the Fund’s performance will be more susceptible to any economic, business or other developments which generally affect that sector.
•Consumer Discretionary Sector Risk. Companies engaged in the design, production or distribution of products or services for the consumer discretionary sector are subject to the risk that their products or services may become obsolete quickly. The success of these companies can depend heavily on disposable household income and consumer spending. During periods of an expanding economy, the consumer discretionary sector may outperform the consumer staples sector, but may underperform when economic conditions worsen.
•Energy Sector Risk. The market value of securities in the energy sector may decline for many reasons including, fluctuations in energy prices and supply and demand of energy fuels caused by geopolitical events, the success of exploration projects, weather or meteorological events, taxes, increased governmental or environmental regulation, resource depletion, rising interest rates, declines in domestic or foreign production, accidents or catastrophic events that result in injury, loss of life or property, pollution or other environmental damage claims, terrorist threats or attacks, among other factors. Markets for various energy-related commodities can have significant volatility and are subject to control or manipulation by large producers or purchasers. Companies in the energy sector may need to make substantial expenditures, and may incur significant amounts of debt, to maintain or expand their reserves through exploration of new sources of supply, through the development of existing sources, through acquisitions, or through long-term contracts to acquire reserves. Factors adversely affecting producers, refiners, distributors, or others in the energy sector may adversely affect companies that service or supply those entities, either because demand for those services or products is curtailed, or those services or products come under price pressure. Issuers in the energy sector may also be impacted by changing investor and consumer preferences arising from the sector’s potential exposure to sustainability and environmental concerns.
•Industrials Sector Risk. The value of securities issued by companies in the industrials sector may be affected by supply and demand both for their specific products or services and for industrials sector products in general. The products of manufacturing companies may face obsolescence due to rapid technological developments and frequent new product introduction.
Short Sale Risk. Short selling is generally considered speculative, has the potential for unlimited loss and may involve leverage, which can magnify a Fund’s exposure to assets that decline in value and increase the volatility of the Fund’s net asset value. If the price of a security which the Fund has sold short increases between the time of the short sale and when the position is closed out, the Fund will incur a loss equal to the increase in price from the time of the short sale plus any related interest payments, dividends, transaction or other costs. There can be no assurance that the Fund will be able to close out a
ALPHA ARCHITECT ETFs
NOTES TO THE FINANCIAL STATEMENTS (CONTINUED)
September 30, 2024
short position at any particular time or at an acceptable price. Purchasing a security to cover a short position can itself cause the price of the security to rise, potentially exacerbating a loss or reducing a gain. In addition, the Fund is subject to the risk that the lender of a security will terminate the loan at a time when the Fund is unable to borrow the same instrument from another lender. A Fund that uses short sales is subject to the risk that its prime broker will be unwilling or unable to perform its contractual obligations. Regulatory restrictions limit the extent to which the Fund may engage in short sales.
Small- and Mid-Capitalization Company Risk. Investing in securities of small- and mid-capitalization companies involves greater risk than customarily is associated with investing in larger, more established companies. These companies’ securities may be more volatile and less liquid than those of more established companies. Often small- and mid-capitalization companies and the industries in which they focus are still evolving and, as a result, they may be more sensitive to changing market conditions.
Underlying Alpha Architect ETFs Risk. The Fund expects to invest a substantial portion of its assets in the Underlying Alpha Architect ETFs, so the Fund’s investment performance is likely to be directly related to the performance of the Underlying Alpha Architect ETFs. The Fund’s NAV will change with changes in the value of the Underlying Alpha Architect ETFs and other instruments in which the Fund invests based on their market valuations. If the investment advisory fee waiver is discontinued, an investment in the Fund will entail more costs and expenses than the combined costs and expenses of direct investments in the Underlying Alpha Architect ETFs and the costs and expense of engaging in hedging strategies as contemplated by the Adviser.
U.S. Government Securities Risk. U.S. government securities risk refers to the risk that debt securities issued or guaranteed by certain U.S. Government agencies, instrumentalities, and sponsored enterprises are not supported by the full faith and credit of the U.S. Government, and so investments in their securities or obligations issued by them involve credit risk greater than investments in other types of U.S. Government securities.
Valuation Risk. Some portfolio holdings, potentially a large portion of the Fund’s investment portfolio, may be valued on the basis of factors other than market quotations. This may occur more often in times of market turmoil or reduced liquidity. There are multiple methods that can be used to value a portfolio holding when market quotations are not readily available. The value established for any portfolio holding at a point in time might differ from what would be produced using a different methodology or if it had been priced using market quotations.
Portfolio holdings that are valued using techniques other than market quotations, including “fair valued” securities, may be subject to greater fluctuation in their valuations from one day to the next than if market quotations were used. In addition, there is no assurance that the Fund could sell or close out a portfolio position for the value established for it at any time, and it is possible that the Fund would incur a loss because a portfolio position is sold or closed out at a discount to the valuation established by the Fund at that time.
Value Style Investing Risk. A value stock may not increase in price if other investors fail to recognize the company’s value and bid up the price or the markets favor faster-growing companies. Cyclical stocks in which the Fund may invest tend to lose value more quickly in periods of anticipated economic downturns than non-cyclical stocks. Companies that may be considered out of favor, particularly companies emerging from bankruptcy, may tend to lose value more quickly in periods of anticipated economic downturns, may have difficulty retaining customers and suppliers and, during economic downturns, may have difficulty paying their debt obligations or finding additional financing.
See the Fund’s Prospectus and Statement of Additional Information regarding the risks of investing in shares of the Fund.
NOTE 4 – COMMITMENTS AND OTHER RELATED PARTY TRANSACTIONS
Empowered Funds, LLC dba EA Advisers (the “Adviser”) serves as the investment adviser to the Funds. Pursuant to investment advisory agreements (the “Advisory Agreements”) between the Trust, on behalf of the Funds, and the Adviser, the Adviser provides investment advice to the Funds and oversees the day-to-day operations of the Funds, subject to the direction and control of the Board and the officers of the Trust. Under the Advisory Agreements, the Adviser is also responsible for
ALPHA ARCHITECT ETFs
NOTES TO THE FINANCIAL STATEMENTS (CONTINUED)
September 30, 2024
arranging transfer agency, custody, fund administration and accounting, and other non-distribution related services necessary for the Funds to operate. The Adviser administers the Funds’ business affairs, provides office facilities and equipment and certain clerical, bookkeeping and administrative services. The Adviser agrees to pay all expenses incurred by the Funds except for the fee paid to the Adviser pursuant to the Advisory Agreement, payments under any distribution plan adopted pursuant to Rule 12b-1, brokerage expenses, acquired fund fees and expenses, taxes, interest (including borrowing costs), litigation expense (including class action-related services) and other non-routine or extraordinary expenses. The table below represents the annual rate based on average daily net assets that each Fund pays the Adviser monthly:
| | | | | | | | |
| QVAL | | 0.29% |
| IVAL | | 0.39% |
| QMOM | | 0.29% |
| IMOM | | 0.39% |
| VMOT | | 0.45% |
| HIDE | | 0.29% |
| CAOS | | 0.63% |
| BOXX | | 0.3949% |
Effective January 31, 2024, the Adviser reduced its management fee for QVAL, IVAL, QMOM and IMOM from an annual rate based on average daily net assets from 0.39% to 0.29%, 0.49% to 0.39%, 0.39% to 0.29%, and 0.49% to 0.39%, respectively.
The Adviser has contractually agreed to waive all or a portion of its management fee for VMOT until at least January 31, 2025 to the extent necessary to prevent (i) management fees paid to the investment adviser for the Fund plus (ii) the aggregate amount of management fees paid to the Adviser for management of the Alpha Architect ETFs that are directly attributable to the Fund’s ownership of shares of the Alpha Architect ETFs, from exceeding 0.69% of the Fund’s daily net assets. This waiver agreement may be terminated only by agreement of the investment adviser and the Fund’s Board of Trustees. The fee waived is not subject to recoupment.
The Adviser has contractually agreed to waive receipt of its management fees and/or assume expenses of HIDE to the extent necessary to offset AFFE so that the total annual operating expenses of the Fund (excluding payments under the Fund’s Rule 12b-1 distribution and service plan (if any), brokerage expenses, taxes (including tax-related services), interest (including borrowing costs), litigation expense (including class action-related services) and other non-routine or extraordinary expenses) do not exceed 0.29% of the Fund’s average daily net assets. This agreement is in effect until November 15, 2025, and it may be terminated before that date only by a majority vote of the “non-interested” trustees. The fee waived is not subject to recoupment.
The Adviser has contractually agreed to waive receipt of its management fees and/or assume expenses of CAOS, including AFFE related to the Fund’s investment in BOXX so that the total annual operating expenses of the Fund (excluding payments under the Fund’s Rule 12b-1 distribution and service plan (if any), brokerage expenses, taxes (including tax-related services), interest (including borrowing costs), litigation expense (including class action-related services) and other non-routine or extraordinary expenses) do not exceed 0.63% of the Fund’s average daily net assets. Any AFFE associated with fund investments in any other acquired funds are not included in the fee waiver. This agreement may only be changed or terminated by a vote of the holders of a majority of the Fund's outstanding voting securities.
The Adviser has contractually agreed to waive receipt of its management fees and/or assume expenses of BOXX so that the total annual operating expenses of the Fund (excluding payments under the Fund’s Rule 12b-1 distribution and service plan (if any), acquired fund fees and expenses, brokerage expenses, taxes (including tax-related services), interest (including borrowing costs), litigation expense (including class action-related services) and other non-routine or extraordinary expenses) do not exceed 0.1949% of the Fund’s average daily net assets. This agreement will remain in place until at least February 28, 2025. The agreement may be terminated only by the Board of Trustees.
ALPHA ARCHITECT ETFs
NOTES TO THE FINANCIAL STATEMENTS (CONTINUED)
September 30, 2024
Alpha Architect, LLC (“Alpha Architect”), serves as a discretionary investment sub-adviser to HIDE, QVAL, IVAL, QMOM, IMOM, and VMOT. Pursuant to an investment sub-advisory agreement among the Trust, the Adviser, and Alpha Architect, Alpha Architect is responsible for determining the investments for the Fund, subject to the overall supervision and oversight of the Adviser and the Board.
Alpha Architect serves as a non-discretionary investment sub-adviser to CAOS and BOXX. Pursuant to an investment sub-advisory agreement among the Trust, the Adviser, and Alpha Architect, Alpha Architect is investment guidance and strategic investment advice to Arin Risk Advisors, LLC (“Arin”) with respect to Arin’s investment models, subject to the overall supervision and oversight of the Adviser and the Board.
Arin serves as a discretionary investment sub-adviser to CAOS and BOXX. Pursuant to an investment sub-advisory agreement among the Trust, the Adviser, and Arin, Arin has discretion to purchase and sell securities in accordance with the Funds’ objectives, policies, and restrictions. Arin continuously reviews, supervises, and administers the Funds’ investment program subject to oversight by the Adviser.
U.S. Bancorp Fund Services, LLC (“Fund Services” or “Administrator”), doing business as U.S. Bank Global Fund Services, acts as the Funds’ Administrator and, in that capacity, performs various administrative and accounting services for the Funds. The Administrator prepares various federal and state regulatory filings, reports and returns for the Funds, including regulatory compliance monitoring and financial reporting; prepares reports and materials to be supplied to the trustees; monitors the activities of the Funds’ Custodian, transfer agent and fund accountant. Fund Services also serves as the transfer agent and fund accountant to the Funds. U.S. Bank N.A. (the “Custodian”), an affiliate of the Administrator, serves as the Funds’ Custodian.
The Custodian acts as the securities lending agent (the “Securities Lending Agent”) for the Funds.
NOTE 5 – SECURITIES LENDING
Each Fund may lend up to 331/3% of the value of the securities in their portfolios to brokers, dealers and financial institutions (but not individuals) under terms of participation in a securities lending program administered by the Securities Lending Agent. The securities lending agreement requires that loans are collateralized at all times in an amount equal to at least 102% of the value of any domestic loaned securities at the time of the loan, plus accrued interest. The use of loans of foreign securities, which are denominated and payable in U.S. dollars, shall be collateralized in an amount equal to 105% of the value of any loaned securities at the time of the loan plus accrued interest. The Funds receive compensation in the form of fees and earn interest on the cash collateral. The amount of fees depends on a number of factors including the type of security and length of the loan. The Funds continue to receive interest payments or dividends on the securities loaned during the borrowing period. Gain or loss on the value of securities loaned that may occur during the term of the loan will be for the account of the Funds. The Funds have the right under the terms of the securities lending agreement to recall the securities from the borrower on demand.
The securities lending agreement provides that, in the event of a borrower’s material default, the Securities Lending Agent shall take all actions the Securities Lending Agent deems appropriate to liquidate the collateral, purchase replacement securities at the Securities Lending Agent’s expense, or pay the Fund an amount equal to the market value of the loaned securities, subject to certain limitations which are set forth in detail in the securities lending agreement between the Fund and the Securities Lending Agent.
As of the end of the current fiscal period, certain Funds had loaned securities and received cash collateral for the loans. The cash collateral is invested by the Securities Lending Agent in accordance with the Trust-approved investment guidelines. Those guidelines require the cash collateral to be invested in readily marketable, high quality, short-term obligations; however, such investments are subject to risk of payment delays or default on the part of the issuer or counterparty or otherwise may not generate sufficient interest to support the costs associated with securities lending. The Funds could also experience delays in recovering their securities and possible loss of income or value if the borrower fails to return the borrowed securities, although the Funds are indemnified from this risk by contract with the Securities Lending Agent.
ALPHA ARCHITECT ETFs
NOTES TO THE FINANCIAL STATEMENTS (CONTINUED)
September 30, 2024
As of the end of the current fiscal year, the values of the securities on loan and payable for collateral due to broker for the applicable funds were as follows:
| | | | | | | | | | | | | | | | | | | | |
| | Value of Securities on Loan | | Payable for Collateral Received* | | Percentage of Net Assets of Securities On Loan |
| | | | | | |
| | | | | | |
| | | | | | |
| | | | | | |
| IVAL | | $ | 2,549,585 | | | $ | 2,701,695 | | | 1.7% |
| VMOT | | 2,303,118 | | | 2,350,525 | | | 10.6% |
| | | | | | |
| | | | | | |
| | | | | | |
* The cash collateral received was invested in the First American Money Market Government Obligations Fund as shown on the Schedule of Investments. The investment objective is to seek maximum current income to the extent consistent with the preservation of capital and maintenance of liquidity.
The interest income earned by the funds on the investment of cash collateral received from borrowers for the securities loaned to them (“Securities Lending Income, Net”) is reflected in the Funds’ Statements of Operations. Net securities lending income earned on collateral investments and recognized by the applicable funds during the current fiscal period was as follows:
| | | | | | | | |
| QVAL | | $ | 43 | |
| IVAL | | 3,234 | |
| QMOM | | 93 | |
| IVAL | | 761 | |
| VMOT | | 24,526 | |
| HIDE | | 28 | |
| | |
| | |
| | |
Due to the absence of a master netting agreement related to the Funds’ participation in securities lending, no additional offsetting disclosures have been made on behalf of the Funds for the total borrowings listed above.
NOTE 6 – PURCHASES AND SALES OF SECURITIES
For the fiscal period ended September 30, 2024, purchases and sales of securities for the applicable funds, excluding short-term securities and in-kind transactions for each Fund were as follows:
| | | | | | | | | | | | | | |
| | Purchases | | Sales |
| QVAL | | $ | 717,417,418 | | | $ | 716,722,241 | |
| IVAL | | 398,827,673 | | | 231,286,030 | |
| QMOM | | 714,155,434 | | | 711,604,730 | |
| IMOM | | 297,574,035 | | | 172,515,348 | |
| VMOT | | 9,311,233 | | | 10,355,379 | |
| HIDE | | 40,359,923 | | | 26,725,219 | |
| CAOS | | 13,265,546 | | | 13,939,046 | |
| BOXX | | 34,017,102 | | | 50,965 | |
For the fiscal period ended September 30, 2024, in-kind transactions associated with creations and redemptions for each Fund were as follows:
| | | | | | | | | | | | | | |
| | Purchases | | Sales |
| QVAL | | $ | 461,726,980 | | | $ | 430,919,025 | |
| IVAL | | 7,603,606 | | | 189,518,385 | |
| QMOM | | 397,767,418 | | | 367,257,671 | |
ALPHA ARCHITECT ETFs
NOTES TO THE FINANCIAL STATEMENTS (CONTINUED)
September 30, 2024
| | | | | | | | | | | | | | |
| | Purchases | | Sales |
| IMOM | | 6,435,049 | | | 136,002,840 | |
| VMOT | | 2,819,375 | | | 20,670,805 | |
| HIDE | | 7,945,797 | | | 778,461 | |
| CAOS | | 9,509,600 | | | 93,240,912 | |
| BOXX | | — | | | — | |
For the fiscal period ended September 30, 2024, short-term and long-term gains (losses) on in-kind transactions for each fund were as follows:
| | | | | | | | | | | | | | |
| | Short-Term | | Long-Term |
| QVAL | | $ | 58,893,495 | | | $ | 13,556,780 | |
| IVAL | | 21,567,575 | | | 6,524,596 | |
| QMOM | | 58,158,489 | | | 3,356,237 | |
| IMOM | | 15,739,725 | | | 32,681 | |
| VMOT | | 579,687 | | | 3,503,762 | |
| HIDE | | (6,247) | | | — | |
| CAOS | | 1,876,483 | | | 5,966,772 | |
| BOXX | | 193,025,778 | | | — | |
There were no purchases or sales of long-term U.S. Government securities during the fiscal period in any fund..
NOTE 7 – TRANSACTIONS WITH AFFILIATES
VMOT’s (the “Fund”) transactions with affiliates represent holdings for which the Fund and the underlying Alpha Architect ETFs have the same investment adviser. The Fund had the following transactions with such affiliated Alpha Architect ETFs during the fiscal period ended September 30, 2024:
| | | | | | | | | | | | | | | | | | | | | | | | | | | | | | | | |
| | QVAL | | IVAL | | QMOM | | IMOM | | Total |
| Value, Beginning of Period | | $ | 10,585,702 | | | $ | 12,112,351 | | | $ | 5,004,121 | | | $ | 6,892,369 | | | $ | 34,594,542 | |
| Purchases | | 2,378,430 | | | 1,466,164 | | | 6,525,028 | | | 1,760,986 | | | 12,130,608 | |
| Proceeds from Sales | | (8,315,852) | | | (11,367,405) | | | (5,948,749) | | | (5,394,181) | | | (31,026,186) | |
| Net Realized Gains (Losses) | | 1,655,616 | | | (963,330) | | | 2,015,916 | | | 344,338 | | | 3,052,540 | |
| Change in Unrealized Appreciation (Depreciation) | | 206,660 | | | 1,938,897 | | | 165,025 | | | 635,822 | | | 2,946,404 | |
| Value, End of Period | | $ | 6,510,556 | | | $ | 3,186,677 | | | $ | 7,761,341 | | | $ | 4,239,334 | | | $ | 21,697,908 | |
| Dividend Income | | $ | 152,906 | | | $ | 271,593 | | | $ | 43,077 | | | $ | 182,235 | | | $ | 649,810 | |
| | | | | | | | | | |
| Shares, Beginning of Period | | 285,252 | | | 513,468 | | | 116,054 | | | 281,078 | | | |
| Number of Shares Purchased | | 59,179 | | | 63,869 | | | 115,094 | | | 65,929 | | | |
| Number of Shares Sold | | (203,315) | | | (453,763) | | | (110,236) | | | (199,859) | | | |
| Shares, End of Period | | 141,116 | | | 123,574 | | | 120,912 | | | 147,148 | | | |
ALPHA ARCHITECT ETFs
NOTES TO THE FINANCIAL STATEMENTS (CONTINUED)
September 30, 2024
CAOS’ (the “Fund”) transactions with affiliates represent holdings for which the Fund and the underlying Alpha Architect ETFs have the same investment adviser. The Fund had the following transactions with such affiliated Alpha Architect ETFs during the fiscal period ended September 30, 2024:
| | | | | |
| BOXX |
| Value, Beginning of Period | $ | 107,308,800 | |
| Purchases | 22,784,947 | |
| Proceeds from Sales | (105,989,844) | |
| Net Realized Gains (Losses) | 6,532,773 | |
| Change in Unrealized Appreciation (Depreciation) | (1,718,484) | |
| Value, End of Period | $ | 28,918,192 | |
| Capital gains distributions | $ | 156,568 | |
| |
| Shares, Beginning of Period | 1,035,000 | |
| Number of Shares Purchased | 212,609 | |
| Number of Shares Sold | (982,134) | |
| Shares, End of Period | 265,475 | |
NOTE 8 – TAX INFORMATION
The components of tax basis cost of investments and net unrealized appreciation (depreciation) for federal income tax purposes at September 30, 2024, for each Fund were as follows:
| | | | | | | | | | | | | | | | | | | | | | | | | | |
| | | QVAL | | IVAL | | QMOM | | IMOM |
| Tax cost of Investments | | $ | 350,069,705 | | | $ | 152,729,676 | | | $ | 221,868,471 | | | $ | 77,151,814 | |
| Gross tax unrealized appreciation | | 37,617,009 | | | 8,222,186 | | | 37,696,928 | | | 7,963,574 | |
| Gross tax unrealized depreciation | | (11,702,129) | | (8,838,614) | | (7,032,399) | | (2,945,098) |
| Net tax unrealized appreciation (depreciation) | | $ | 25,914,880 | | | $ | (616,428) | | | $ | 30,664,529 | | | $ | 5,018,476 | |
| Undistributed ordinary income | | 353,405 | | 735,030 | | 3,790,339 | | 3,462,039 |
| Undistributed long-term gain | | — | | | — | | | — | | | — | |
| Total distributable earnings | | 353,405 | | 735,030 | | 3,790,339 | | 3,462,039 |
| Other accumulated gain (loss) | | (145,013,284) | | (111,507,351) | | (125,385,445) | | (95,954,297) |
| Total accumulated gain (loss) | | $ | (118,744,999) | | | $ | (111,388,749) | | | $ | (90,930,577) | | | $ | (87,473,782) | |
| | | | | | | | | | | | | | | | | | | | | | | | | | |
| | | VMOT | | HIDE | | CAOS | | BOXX |
| Tax cost of Investments | | $ | 21,046,164 | | | $ | 29,133,038 | | | $ | 247,119,616 | | | $ | 3,950,916,797 | |
| Gross tax unrealized appreciation | | 3,435,775 | | | 1,087,717 | | | 1,516,404 | | | 18,983,439 | |
| Gross tax unrealized depreciation | | (339,774) | | (6,549) | | (23,069) | | (439,400) |
| Net tax unrealized appreciation (depreciation) | | $ | 3,096,001 | | | $ | 1,081,168 | | | $ | 1,493,335 | | | $ | 18,544,039 | |
| Undistributed ordinary income | | 212,575 | | | 620,824 | | | — | | | — | |
| Undistributed long-term gain | | — | | | — | | | — | | | — | |
| Total distributable earnings | | 212,575 | | | 620,824 | | | — | | | — | |
| Other accumulated gain (loss) | | (26,736,190) | | | (1,509,096) | | | (65,429,695) | | | (20,825,191) | |
| Total accumulated gain (loss) | | $ | (23,427,614) | | | $ | 192,896 | | | $ | (63,936,360) | | | $ | (2,281,152) | |
Under tax law, certain capital and foreign currency losses realized after October 31 and within the taxable year are deemed to arise on the first business day of each Fund’s next taxable year.
ALPHA ARCHITECT ETFs
NOTES TO THE FINANCIAL STATEMENTS (CONTINUED)
September 30, 2024
For the fiscal year ended September 30, 2024, CAOS and BOXX had the following post-October late year losses and post-October capital losses:
| | | | | | | | | | | | | | |
| | Post-October Late Year Loss | | Post-October Capital Loss |
| CAOS | | $ | 710,048 | | | $ | — | |
| BOXX | | 3,889,448 | | | — | |
At September 30, 2024, each Fund had the following capital loss carryforwards that do not expire:
| | | | | | | | | | | | | | |
| | Unlimited Short-Term | | Unlimited Long-Term |
| QVAL | | $ | (123,698,404) | | | $ | (21,314,880) | |
| IVAL | | (85,680,087) | | | (25,827,264) | |
| QMOM | | (124,648,184) | | | (737,261) | |
| IMOM | | (95,529,921) | | | (424,376) | |
| VMOT | | (22,462,977) | | | (4,273,213) | |
| HIDE | | (1,509,096) | | | — | |
| CAOS | | (58,002,164) | | | (6,717,483) | |
| BOXX | | (7,309,306) | | | (9,626,437) | |
NOTE 9 – DISTRIBUTIONS TO SHAREHOLDERS
The tax character of distributions paid by each Fund during the fiscal periods ended September 30, 2024, October 31, 2023, and September 30, 2023 were as follows:
| | | | | | | | | | | | | | | | | | | | | | | |
| Fiscal Period Ended September 30, 2024 | | Fiscal Period Ended October 31, 2023 | | Fiscal Period Ended September 30, 2023 |
| Ordinary Income | | Long-Term Capital Gain | | Ordinary Income | | Ordinary Income |
| QVAL | $ | 5,758,591 | | | — | | | $ N/A | | $ | 5,720,298 | |
| IVAL | 5,691,752 | | | — | | | N/A | | 15,398,314 | |
| QMOM | 1,434,103 | | | — | | | N/A | | 2,115,259 | |
| IMOM | 2,136,152 | | | — | | | N/A | | 3,768,945 | |
| VMOT | 1,247,610 | | | — | | | N/A | | 877,779 | |
| HIDE | 665,962 | | | — | | | N/A | | 292,778 | |
| CAOS | — | | | — | | | N/A | | — | |
| BOXX | 4,343,602 | (1) | 5,937,472 | | | — | | | N/A |
(1) 100% of BOXX’s taxable ordinary income distributions are designated as short-term capital gain distributions under the Internal Revenue Section 871(k)(2)(C). |
NOTE 10 – SUBSEQUENT EVENTS
In preparing these financial statements, management of the Funds have evaluated events and transactions for potential recognition or disclosure through the date the financial statements were issued. There were no transactions that occurred during the year subsequent to September 30, 2024 that materially impacted the amounts or disclosures in the Funds’ financial statements other than the below:
Effective November 12, 2024, the Adviser reduced its management fee for BOXX from an annual rate based on average daily net assets from 0.3949% to 0.2449%.
REPORT OF INDEPENDENT REGISTERED PUBLIC ACCOUNTING FIRM
To the Shareholders of
Alpha Architect ETFs and
The Board of Trustees of
EA Series Trust
Opinion on the Financial Statements
We have audited the accompanying statements of assets and liabilities of Alpha Architect U.S. Quantitative Value ETF, Alpha Architect International Quantitative Value ETF, Alpha Architect U.S. Quantitative Momentum ETF, Alpha Architect International Quantitative Momentum ETF, Alpha Architect Value Momentum Trend ETF, Alpha Architect High Inflation and Deflation ETF, Alpha Architect Tail Risk ETF and Alpha Architect 1-3 Month Box ETF, (the “Funds”), each a series of EA Series Trust (the “Trust”), including the schedules of investments, as of September 30, 2024, the related statements of operations, statements of changes in net assets, and the financial highlights for each of the periods indicated in the table below, and the related notes (collectively referred to as the “financial statements”). In our opinion, the financial statements present fairly, in all material respects, the financial position of the Funds as of September 30, 2024, the results of their operations, the changes in their net assets, and their financial highlights for each of the periods indicated in the table below, in conformity with accounting principles generally accepted in the United States of America.
| | | | | | | | | | | |
Individual Funds Constituting EA Series Trust | Statement of Operations | Statements of Changes in Net Assets | Financial Highlights |
| Alpha Architect U.S. Quantitative Value ETF, Alpha Architect International Quantitative Value ETF, Alpha Architect U.S. Quantitative Momentum ETF, Alpha Architect International Quantitative Momentum ETF, and Alpha Architect Value Momentum ETF | For the year ended September 30, 2024
| For each of the two years ended September 30, 2024 | For each of the two years ended September 30, 2024 |
| Alpha Architect High Inflation and Deflation ETF | For the year ended September 30, 2024
| For the year ended September 30, 2024 and for the period November 16, 2022 (commencement of operations) to September 30, 2023
| For the year ended September 30, 2024 and for the period November 16, 2022 (commencement of operations) to September 30, 2023
|
Alpha Architect Tail Risk ETF
| For the year ended September 30, 2024
| For the year ended September 30, 2024 and for the period March 1, 2023 to September 30, 2023
| For year ended September 30, 2024 and for the period March 1, 2023 to September 30, 2023
|
| Alpha Architect 1-3 Month Box ETF | For the period November 1, 2023 to September 30, 2024 and for the period December 27, 2022 (commencement of operations) to October 31, 2023 | For the period November 1, 2023 to September 30, 2024 and for the period December 27, 2022 (commencement of operations) to October 31, 2023 | For the period November 1, 2023 to September 30, 2024 and for the period December 27, 2022 (commencement of operations) to October 31, 2023 |
REPORT OF INDEPENDENT REGISTERED PUBLIC ACCOUNTING FIRM
The financial highlights for each of the three years in the period ended September 30, 2022, for Alpha Architect U.S. Quantitative Value ETF, Alpha Architect International Quantitative Value ETF, Alpha Architect U.S. Quantitative Momentum ETF, Alpha Architect International Quantitative Momentum ETF, and Alpha Architect Value Momentum Trend ETF, were audited by other auditors, whose report dated November 29, 2022 expressed an unqualified opinion on such financial statements and financial highlights. The statement of changes in net assets for the year ended February 28, 2023, and the financial highlights for each of the four years in the period then ended before the effects of the adjustments to retrospectively apply the reverse stock split for Alpha Architect Tail Risk ETF, formerly known as Arin Large Cap Theta Fund, were audited by other auditors, whose reports dated April 28, 2023 and April 27, 2022, expressed an unqualified opinion on those financial statements and financial highlights.
We also have audited the adjustments to the statements of changes and the financial highlights of Alpha Architect Tail Risk ETF (formerly known as Arin Large Cap Theta Fund) for the years ended February 28, 2023, 2022, 2021 and 2020 to reflect the reverse stock split, as described in Note 1. In our opinion, such adjustments are appropriate and have been properly applied. We were not engaged to audit, review, or apply any procedures to the February 28, 2023, 2022, 2021 and 2020 financial statements and financial highlights of the Fund other than with respect to the adjustments and, accordingly, we do not express an opinion or any other form of assurance on the February 28, 2023, 2022, 2021 and 2020 financial statements and financial highlights taken as a whole.
Basis for Opinion
These financial statements are the responsibility of the Funds’ management. Our responsibility is to express an opinion on the Funds’ financial statements based on our audits. We are a public accounting firm registered with the Public Company Accounting Oversight Board (United States) (“PCAOB”) and are required to be independent with respect to the Funds in accordance with the U.S. federal securities laws and the applicable rules and regulations of the Securities and Exchange Commission and the PCAOB. We have served as the auditor of one or more of the funds in the Trust since 2023.
We conducted our audits in accordance with the standards of the PCAOB. Those standards require that we plan and perform the audits to obtain reasonable assurance about whether the financial statements are free of material misstatement, whether due to error or fraud. The Funds are not required to have, nor were we engaged to perform, an audit of the Funds’ internal control over financial reporting. As part of our audits we are required to obtain an understanding of internal control over financial reporting, but not for the purpose of expressing an opinion on the effectiveness of the Funds’ internal control over financial reporting. Accordingly, we express no such opinion.
Our audits included performing procedures to assess the risks of material misstatement of the financial statements, whether due to error or fraud, and performing procedures that respond to those risks. Such procedures included examining, on a test basis, evidence regarding the amounts and disclosures in the financial statements. Our audits also included evaluating the accounting principles used and significant estimates made by management, as well as evaluating the overall presentation of the financial statements. Our procedures included confirmation of securities owned as of September 30, 2024 by correspondence with the custodian and brokers; when replies were not received from brokers, we performed other auditing procedures. We believe that our audits provide a reasonable basis for our opinion.
TAIT, WELLER & BAKER LLP
Philadelphia, Pennsylvania
November 27, 2024
FEDERAL TAX INFORMATION (UNAUDITED)
For the fiscal year ended September 30, 2024, certain dividends paid by each Fund may be subject to a maximum tax rate of 23.8%, as provided for by the Tax Cuts and Jobs Act of 2017. The percentage of dividends declared from ordinary income designated as qualified dividend income for each Fund was:
| | | | | | | | |
| QVAL | | 100.00% |
| IVAL | | 95.61% |
| QMOM | | 86.88% |
| IMOM | | 94.10% |
| VMOT | | 96.35% |
| HIDE | | 3.90% |
| CAOS | | 0.00% |
| BOXX | | 0.00% |
For corporate shareholders, the percent of ordinary income distributions qualifying for the corporate dividends received deduction for the fiscal year ended September 30, 2024 for each Fund was:
| | | | | | | | |
| QVAL | | 92.90% |
| IVAL | | 0.00% |
| QMOM | | 86.70% |
| IMOM | | 5.33% |
| VMOT | | 27.37% |
| HIDE | | 3.01% |
| CAOS | | 0.00% |
| BOXX | | 0.00% |
The percentage of taxable ordinary income distributions that are designated as short-term capital gain distributions under the Internal Revenue Section 871 (k)(2)(C) for each Fund was:
| | | | | | | | |
| QVAL | | 0.00% |
| IVAL | | 0.00% |
| QMOM | | 0.00% |
| IMOM | | 0.00% |
| VMOT | | 0.00% |
| HIDE | | 0.00% |
| CAOS | | 0.00% |
| BOXX | | 100.00% |
FOREIGN TAX CREDIT PASS THROUGH (UNAUDITED)
Pursuant to Section 853 of the Internal Revenue code, the applicable Funds designate the following amounts as foreign taxes paid for the year ended September 30, 2024. Foreign taxes paid for financial statement purposes of Section 853 may be less than actual foreign taxes paid for financial statement purposes.
| | | | | | | | | | | | | | | | | | | | |
| | Creditable Foreign Tax Credit Paid | | Per Share Amount | | Portion of Ordinary Income Distribution Derived From Foreign Sourced Income |
| | | | | | |
| IVAL | | $ | 499,157 | | | $ | 0.08533 | | | 100.00 | % |
| IMOM | | 260,286 | | 0.09053 | | 100.00 | % |
| | | | | | |
| | | | | | |
| | | | | | |
| | | | | | |
| | | | | | |
Foreign taxes paid or withheld should be included in taxable income with an offsetting deduction from gross income or as a credit for taxes paid to foreign governments.
Above figures may differ from those cited elsewhere in this report due to difference in the calculation of income and gains under GAAP purposes and Internal Revenue Service purposes.
Shareholders are strongly advised to consult their own tax advisers with respect to the tax consequences of their investments in the Fund.
Item 8. Changes in and Disagreements with Accountants for Open-End Management Investment
Companies.
There were no matters concerning changes in and disagreements with Accountants on accounting and financial disclosures required by Item 304 of Regulation S-K.
Item 9. Proxy Disclosures for Open-End Management Investment Companies.
There were no matters submitted during the period covered by the report to a vote of shareholders.
Item 10. Remuneration Paid to Directors, Officers, and Others of Open-End Management
Investment Companies
Not applicable. The Independent Trustees are paid by the Adviser out. See Note 4 to the Financial Statements under Item 7.
Item 11. Statement Regarding Basis for Approval of Investment Advisory Contracts.
The Board (the members of which are referred to as “Trustees”) of the EA Series Trust (the “Trust”) met in-person on June 7, 2024 to consider the approval of the continuation of the Advisory Agreement between the Trust, on behalf of the Alpha Architect U.S. Quantitative Value ETF (“QVAL”), the Alpha Architect International Quantitative Value ETF (“IVAL”), the Alpha Architect U.S. Quantitative Momentum ETF (“QMOM”), the Alpha Architect International Quantitative Momentum ETF (“IMOM”), the Alpha Architect Value Momentum Trend ETF (“VMOT”), the Alpha Architect 1-3 Month Box ETF (“BOXX”), the Alpha Architect High Inflation and Deflation ETF (“HIDE”), and the Alpha Architect Tail Risk ETF (“CAOS”) (each a “Fund” and collectively the “Funds”), and Empowered Funds, LLC (the “Adviser”), as well as to consider the approval of each Sub-Advisory Agreement between the Adviser and Alpha Architect, LLC (“AA”). As it relates to the Alpha Architect 1-3 Month Box ETF and the Alpha Architect Tail Risk ETF the Board considered the approval of the continuation of the Sub-Advisory Agreement between the Adviser and Arin Risk Advisors, LLC (“Arin”). In accordance with Section 15(c) of the 1940 Act, the Board requested, reviewed and considered materials furnished by the Adviser, AA and Arin relevant to the Board’s consideration of whether to approve the Advisory Agreement and Sub-Advisory Agreements. In accordance with Section 15(c) of the 1940 Act, the Board requested, reviewed and considered materials furnished by the Adviser, AA and Arin relevant to the Board’s consideration of whether to approve the the Advisory Agreement and Sub-Advisory Agreements. In connection with considering the approval of both the Advisory Agreement and Sub-Advisory Agreements, the Trustees who are not “interested persons” of the Trust, as that term is defined in the 1940 Act (the “Independent Trustees”), met in executive session with counsel to the Trust, who provided assistance and advice. In reaching the decision to approve the Advisory Agreement and the Sub-Advisory Agreements, the Board considered and reviewed information provided by the Adviser, AA and Arin at this meeting and throughout the year, including among other things information about their respective personnel, operations, financial condition, and compliance and risk management. The Board also reviewed the Advisory Agreement and Sub-Advisory Agreements. During its review and consideration, the Board focused on and reviewed the factors it deemed relevant, including:
Nature, Quality, and Extent of Services. The Board was presented with and considered information concerning the nature, quality, and extent of the overall services provided by the Adviser to the Funds. In this connection, the Board considered the responsibilities of the Adviser, recognizing that the Adviser had invested significant time and effort in structuring the Trust and the Funds, and arranging service providers for the Funds. In addition, the Board considered that the Adviser is responsible for providing investment advisory oversight services to the Funds, executing all the Funds transactions, monitoring compliance with each Fund’s objectives, policies and restrictions, and carrying out directives of the Board. The Board also considered the services provided by the Adviser in the oversight of the Trust’s administrator, transfer agent and custodian. In addition, the Board evaluated the integrity of each of the Adviser’ AA’s and Arin’s personnel, the experience of the portfolio managers in managing assets and the adequacy of each of the Adviser’s, AA’s and Arin’s resources to perform the services provided under the Advisory Agreement and Sub-Advisory Agreements. The Board also considered the Adviser’s ongoing oversight responsibilities vis-à-vis AA and Arin.
Performance. The Board considered the relative performance information for the Funds. The Board utilized performance reports provided to the Board in anticipation of the meeting, as well as performance reports provided at regular Board meetings for the Funds. The Board considered the third-party peer group analysis comparing each Fund’s performance to the performance of other funds that the third-party deemed to be comparable to the respective Fund. It was determined that the Adviser, AA and Arin (as applicable) have consistently managed the respective Funds’ portfolios in accordance with their stated investment objective and strategies.
For QVAL, the Board considered QVAL’s performance against its peer group for various periods ended March 31, 2024. The Board noted that QVAL outperformed the average total return of its ETF and mutual fund peer groups by 1526 (15.26%) and 1019 (10.19%) basis points, respectively, for the one-year period, by 839 (8.39%) and 569 (5.69%) basis points, respectively, for the two-year period, and by 1484 (14.84%) and 1233 (12.33%) basis points, respectively, for the three-year period ended March 31, 2024. The Board concluded that QVAL’s performance was reasonable.
For IVAL, the Board considered IVAL’s performance against its peer group for various periods ended March 31, 2024. The Board noted that IVAL outperformed its ETF and mutual fund peer groups by 609 (6.09%) and 614 (6.14%) basis points, respectively, for the for the one-year period ended March 31, 2024, but trailed its ETF and mutual fund peer groups by 681 (6.81%) and 857 (8.57%) basis points, respectively, for the two-year period and by 1375 (13.75%) and 1495 (14.95%) basis points, respectively, for the three-year period ended March 31, 2024. The Board concluded that IVAL’s performance was reasonable.
For QMOM, the Board considered QMOM’s performance against its peer group for various periods ended March 31, 2024. The Board noted that QMOM underperformed its ETF and mutual fund peer groups by 368 (3.68%) and 164 (1.64%) basis points, respectively, for the for the one-year period and by 1367 (13.67%) and 37 (0.37%) basis points, respectively, for the three-year period ended March 31, 2024. It was further noted that QMOM trailed its ETF peers by 427 (4.27%) basis points but outperformed its mutual fund peers by 267 (2.67%) basis points for the two-year period ended March 31, 2024. The Board concluded that QMOM’s performance was reasonable.
For IMOM, the Board considered IMOM’s performance against its peer group for various periods ended March 31, 2024. The Board noted that IMOM underperformed its ETF peers by 358 (3.58%), 507 (5.07%), and 306 (3.06%) basis points for the one-, two- and three- year periods ended March 31, 2024, respectively. It was further noted that IMOM trailed its mutual fund peers by 320 (3.20%) and 623 (6.23%) basis points for the two- and three- year periods ended March 31, 2024, respectively but outperformed by 95 (0.95%) basis points for one-year period ended March 31, 2024. The Board concluded that IMOM’s performance was reasonable.
For VMOT, the Board considered VMOT’s performance against two different peer groups for various periods ended March 31, 2024. The Board noted VMOT underperformed its ETF peer groups (Global Multi-factor Equity Funds) by 1266 (12.66%), 1294 (12.94%), and 2593 (25.93%) basis points for the one- two- and three- year periods ended March 31, 2024, respectively. The Board noted that VMOT underperformed the mutual fund peer groups (Global Multi-factor Equity Funds) by 1301 (13.01%), 1558 (15.58%), and 2804 (28.04%) basis points for the one- two- and three- year periods ended March 31, 2024. The Board further noted that VMOT underperformed its ETF peers (Global Long-Short Equity Funds) by 152 (1.52%), 1020 (10.20%), and 1690 (16.90%) basis points for one-, two-, three- year periods ended March 31, 2024, respectively. It was further noted that VMOT outperformed its mutual fund peers (Global Long-Short Equity Funds) by 361 (3.61%) basis points for the one-year period ended March 31, 2024, but trailed its mutual fund peers by 927 (9.27%) and 1951 (19.51%) basis points for two- and three- year periods ended March 31, 2024, respectively. The Board acknowledged VMOT’s strategy does not necessarily fit into either of the selected peer groups, considered the reasons provided for the performance, and concluded that VMOT’s performance was reasonable.
For BOXX, the Board considered BOXX’s performance against its peer group basis points for the one-year period ended March 31, 2024. The Board noted that BOXX underperformed its ETF peers by 23 (0.23%) basis points for the one-year period ended March 31, 2024, but outperformed its mutual fund peers by 10 (0.10%) basis points for the one-year period ended March 31, 2024. The Board considered BOXX’s limited period of operations and concluded that BOXX’s performance was reasonable over that time period.
For HIDE, the Board considered HIDE’s performance against its peer group for the one-year period ended March 31, 2024. The Board noted that HIDE underperformed its ETF and mutual fund peer groups by 986 (9.86%) and 702 (7.02%) basis points for the one-year period ended March 31, 2024, respectively. The Board considered HIDE’s limited period of operations concluded that HIDE’s performance was reasonable over that time period.
For CAOS, the Board considered CAOS’s performance against its peer group for the one-year period ended March 31, 2024. The Board noted that CAOS outperformed its ETF peers by 252 (2.52%) basis points for the one-year period ended March 31, 2024 but underperformed its mutual fund peers by 182 (1.82%) basis points for the one-year period ended March 31, 2024. The Board considered CAOS’s limited period of operations and concluded that CAOS’s performance was reasonable over that time period.
Comparative Fees and Expenses. In considering the advisory fees and sub-advisory fees, the Board reviewed and considered the fees in light of the nature, quality, and extent of the services being provided by the Adviser, AA and Arin, respectively. With respect to the advisory fees and expense ratio for each Fund, the Board also considered the fees and expense ratio versus the fees and expenses charged to other ETFs and mutual funds. The Board also considered the allocation of fees between the Adviser, AA and Arin.
The Board considered the third-party peer group analysis that included a comparison of each Fund’s gross total expense ratio, net total expense ratio, and management fee against the average gross total expense ratio, average net total expense ratio, and average management fee for ETFs and mutual funds in the Fund’s respective peer group.
QVAL’s expense ratios (gross and net fees) were below the average expense ratios (gross and net) of its ETF and mutual fund peers. QVAL’s management fee was below the average management fee charged by its ETF and mutual fund peers.
IVAL’s expense ratios (gross and net fees) were below the average expense ratios (gross and net) of its ETF and mutual fund peers. IVAL’s management fee was above the average management fee charged by its ETF peers but below the average management fee charged by its mutual fund peers.
QMOM’s expense ratios (gross and net fees) were below the average expense ratios (gross and net) of its ETF and mutual fund peers. QMOM’s management fee was below the average management fee charged by its ETF and mutual fund peers.
IMOM’s expense ratios (gross and net fees) were below the average expense ratios (gross and net) of its ETF and mutual fund peers. IMOM’s management fee was below the average management fee charged by its ETF and mutual fund peers.
VMOT’s expense ratios (gross and net fees) were above the average expense ratios (gross and net) of its ETF and mutual fund peers (Global Multi-factor Equity Funds). It was further noted that VMOT’s expense ratios (gross and net fees) were below the average expense ratios (gross and net) of its ETF and mutual fund peers (Global Long-Short Equity Funds) The Board considered the impact acquired fund fees and expenses and dividend expenses on securities sold short have on VMOT’s expense ratio and acknowledged VMOT’s strategy does not necessarily fit into either of the selected peer groups.
BOXX’s gross expense ratio was above the average gross expense ratio of its ETF peers but below the average gross expense ratio of its mutual fund peers. BOXX’s net expense ratio was below the average net expense ratio of its ETF and mutual fund peers. BOXX’s management fee was above the average management fee charged by its ETF and mutual fund peers.
HIDE’s expense ratios (gross and net fees) were below the average expense ratios (gross and net) of its ETF and mutual fund peers. HIDE’s management fee was below the average management fee charged by its ETF and mutual fund peers.
CAOS’s expense ratios (gross and net fees) were below the average expense ratios (gross and net) of its ETF and mutual fund peers. CAOS’s management fee was above the average management fee charged by its ETF peers but below the average management fee charged by its mutual fund peers.
The Board considered that each Fund’s fee arrangement in which the Adviser is responsible for paying most of a Fund’s operating expenses out of its resources, noting that comparisons with a Fund’s overall expense ratio may be more relevant than comparisons to management fees only. They stated that such comparisons demonstrate that each Fund’s overall cost structure is within the range of expense ratios of its respective ETF and mutual fund peers.
The Board considered, among other information, the data provided in the third-party report comparing each Fund’s fees to those of other funds that the third-party deemed to be comparable to the Fund. Fee information was provided in quartiles, ranging from quartile one (the least expensive) to quartile four (the most expensive). This data included a comparison of each Fund’s expense ratio against both ETFs and mutual funds.
The Fund’s total expense ratio (for both gross and net) and management fee were in the following quartiles:
| | | | | | | | | | | | | | | | | | | | |
| Fund | Total Expense Ratio | Net Expense Ratio | Management Fee Only |
| ETFs | Mutual Funds | ETFs | Mutual Funds | ETFs | Mutual Funds |
| QVAL | Quartile 3 | Quartile 1 | Quartile 3 | Quartile 1 | Quartile 3 | Quartile 1 |
| IVAL | Quartile 3 | Quartile 1 | Quartile 3 | Quartile 1 | Quartile 3 | Quartile 1 |
| QMOM | Quartile 3 | Quartile 1 | Quartile 3 | Quartile 1 | Quartile 3 | Quartile 1 |
| IMOM | Quartile 2 | Quartile 1 | Quartile 2 | Quartile 1 | Quartile 2 | Quartile 1 |
| VMOT | Quartile 3 | Quartile 3 | Quartile 2 | Quartile 1 | Quartile 1 | Quartile 1 |
| BOXX | Quartile 4 | Quartile 2 | Quartile 3 | Quartile 1 | Quartile 4 | Quartile 4 |
| HIDE | Quartile 1 | Quartile 1 | Quartile 1 | Quartile 1 | Quartile 1 | Quartile 1 |
| CAOS | Quartile 3 | Quartile 1 | Quartile 2 | Quartile 1 | Quartile 3 | Quartile 1 |
With respect to the sub-advisory fees, the Board noted that they were payable solely out of the unitary management fee payable to the Adviser. The Board considered the representations from the Adviser that it does not manage any other accounts that follow a similar strategy as the respective Funds. AA reported that it manages a number of legacy accounts that follow similar strategies as IMOM, QMOM, IVAL and QVAL and provided an explanation for the legacy accounts being charged a lower management fee than those Funds. Arin confirmed that it does not manage any other accounts that follow the strategy employed by CAOS. Arin represented that it does manage a number of separately managed accounts that follow an options strategy similar to BOXX and confirmed that BOXX pays a lower management fee than the separately managed accounts. The Board was agreeable to the advisory and respective sub-advisory fee levels.
Costs and Profitability. The Board further considered information regarding the potential profits, if any, that may be realized by each of the Adviser, AA and Arin in connection with providing their respective services to the Funds. The Board reviewed the profit and loss information provided by the Adviser with respect to each Fund, noting that CAOS, IMOM, IVAL, QMOM, QVAL and BOXX are all profitable to the Adviser at this time while HIDE and VMOT are not profitable. The Board also reviewed the same type of information provided by AA that showed it would be profitable as it relates to QVAL, IVAL, QMOM, BOXX and CAOS in its first year of service to these Funds but would not profitable as it relates HIDE to VMOT. The Board reviewed the same type of information provided by Arin that it is profitable as it relates to BOXX but is not currently profitable as it relates to CAOS. They also considered the information provided by the Adviser, AA and Arin that estimated each firm’s profitability (or lack thereof) over the next two years. The Board discussed the financial condition of the Adviser, AA and Arin, noting that each firm has sufficient capital to maintain its commitment to the respective Funds for an additional annual period. The Board also reviewed the costs associated with the personnel, systems and equipment necessary to manage each Fund and to meet the regulatory and compliance requirements adopted by the SEC and other regulatory bodies. The Board also considered other expenses of each Fund the Adviser would pay in accordance with the Advisory Agreement. The Board took into consideration that the Adviser agreed to pay all expenses incurred by each Fund except for the fees paid to the Adviser pursuant to the Advisory Agreement, payments under any distribution plan adopted pursuant to Rule 12b-1, brokerage expenses, acquired fund fees and expenses, taxes, interest (including borrowing costs), the fees and expenses associated with the Fund’s securities lending program, litigation expenses and other non-routine or extraordinary expenses. With respect to VMOT, BOXX, HIDE and CAOS, the Board also took into consideration the respective fee waiver arrangements the Adviser agreed to as it relates to each of these Funds and the impact these arrangements have on the Adviser’s profitability. The Board also considered the respective financial obligations of the Adviser, AA and Arin to the respective Funds.
Other Benefits. The Board further considered the extent to which the Adviser, AA or Arin might derive ancillary benefits from a Fund’s operations. For example, the Adviser may engage in soft dollar transactions in the future, although it did not currently plan to do so. In addition, the Adviser may benefit from continued growth in the Trust by potentially negotiating better fee arrangements with key vendors serving the Funds and other series in the Trust.
Economies of Scale. The Board also considered whether economies of scale would be realized by each of the Funds as their assets grow larger, including the extent to which this is reflected in the level of fees to be charged. The Board noted that the advisory fee and sub-advisory fee for each Fund does not include breakpoints, but noted the Adviser’s permanent fee reduction for QVAL, QMOM, IVAL and IMOM and the fee waivers associated with VMOT, BOXX, HIDE and CAOS.
Conclusion. No single factor was determinative of the Board’s decision to approve the continuation of the Advisory Agreement and Sub-Advisory Agreements for an annual term; rather, the Board based its determination on the total mix of information available to it. Based on a consideration of all the factors in their totality, the Board, including the Independent Trustees, unanimously determined that the Advisory Agreement and Sub-Advisory Agreements, including the compensation payable under each Agreement, were fair and reasonable to the respective Funds. The Board, including the Independent Trustees, unanimously determined that the approval of the continuation of each of the Advisory Agreement and the Sub-Advisory Agreement was in the best interests of the Fund and its shareholders.
Item 12. Disclosure of Proxy Voting Policies and Procedures for Closed-End Management Investment Companies.
Not applicable to open-end investment companies.
Item 13. Portfolio Managers of Closed-End Management Investment Companies.
Not applicable to open-end investment companies.
Item 14. Purchases of Equity Securities by Closed-End Management Investment Company and Affiliated Purchasers.
Not applicable to open-end investment companies.
Item 15. Submission of Matters to a Vote of Security Holders.
There have been no material changes to the procedures by which shareholders may recommend nominees to the registrant’s board of trustees.
Item 16. Controls and Procedures.
(a) The Registrant’s President (principal executive officer) and Treasurer (principal financial officer) have reviewed the Registrant's disclosure controls and procedures (as defined in Rule 30a-3(c) under the Investment Company Act of 1940 (the “Act”)) as of a date within 90 days of the filing of this report, as required by Rule 30a-3(b) under the Act and Rules 13a-15(b) or 15d‑15(b) under the Securities Exchange Act of 1934. Based on their review, such officers have concluded that the disclosure controls and procedures are effective in ensuring that information required to be disclosed in this report is appropriately recorded, processed, summarized and reported and made known to them by others within the Registrant and by the Registrant’s service provider.
(b) There were no changes in the Registrant's internal control over financial reporting (as defined in Rule 30a-3(d) under the Act) that occurred during the period covered by this report that have materially affected, or are reasonably likely to materially affect, the Registrant's internal control over financial reporting.
Item 17. Disclosure of Securities Lending Activities for Closed-End Management Investment Companies
Not applicable to open-end investment companies.
Item 18. Recovery of Erroneously Awarded Compensation.
There have been no required recovery of erroneously awarded incentive based compensation to an executive officer from the registrant that required an accounting restatement.
Item 19. Exhibits.
SIGNATURES
Pursuant to the requirements of the Securities Exchange Act of 1934 and the Investment Company Act of 1940, the registrant has duly caused this report to be signed on its behalf by the undersigned, thereunto duly authorized.
| | | | | | | | |
| (Registrant) | EA Series Trust | |
| | |
| By (Signature and Title) | /s/ Michael D. Barolsky | |
| | Michael D. Barolsky, President (principal executive officer) | |
| | |
| Date: | December 4, 2024 | |
Pursuant to the requirements of the Securities Exchange Act of 1934 and the Investment Company Act of 1940, this report has been signed below by the following persons on behalf of the registrant and in the capacities and on the dates indicated.
| | | | | | | | |
| By (Signature and Title) | /s/ Michael D. Barolsky | |
| | Michael D. Barolsky, President (principal executive officer) | |
| | | |
| Date: | December 4, 2024 | |
| | | |
| By (Signature and Title) | /s/ Sean R. Hegarty | |
| | Sean R. Hegarty, Treasurer (principal financial officer) | |
| | | |
| Date: | December 4, 2024 | |