UNITED STATES
SECURITIES AND EXCHANGE COMMISSION
Washington, D.C. 20549
FORM N-CSR
CERTIFIED SHAREHOLDER REPORT OF REGISTERED
MANAGEMENT INVESTMENT COMPANIES
Investment Company Act file number 811-22961
EA Series Trust
(Exact name of registrant as specified in charter)
19 E. Eagle Road
Havertown, PA 19083
(Address of principal executive offices) (Zip code)
19 E. Eagle Road
Havertown, PA 19083
(Name and address of agent for service)
(215) 330-4476
Registrant’s telephone number, including area code
Date of fiscal year end: September 30, 2024
Date of reporting period: September 30, 2024
Item 1. Report to Stockholders.
(a)
| | | | | | | | |
| Freedom 100 Emerging Markets ETF Ticker: FRDM Listed on: Cboe BZX Exchange, Inc. | September 30, 2024 Annual Shareholder Report www.freedometfs.com/frdm |
|
| | | | | | | | | | | |
| This annual shareholder report contains important information about the Freedom 100 Emerging Markets ETF (the “Fund”) for the period of October 1, 2023 to September 30, 2024 (the “Period”). You can find additional information about the Fund at www.freedometfs.com/frdm. You can also request this information by contacting us at (215) 330-4476. |
| | | | | | | | | | | |
WHAT WERE THE FUND COSTS FOR THE PERIOD?
(based on a hypothetical $10,000 investment) |
| COST OF $10,000 INVESTMENT | COST PAID AS A PERCENTAGE OF $10,000 INVESTMENT |
| $56 | 0.49% |
| | | | | | | | | | | |
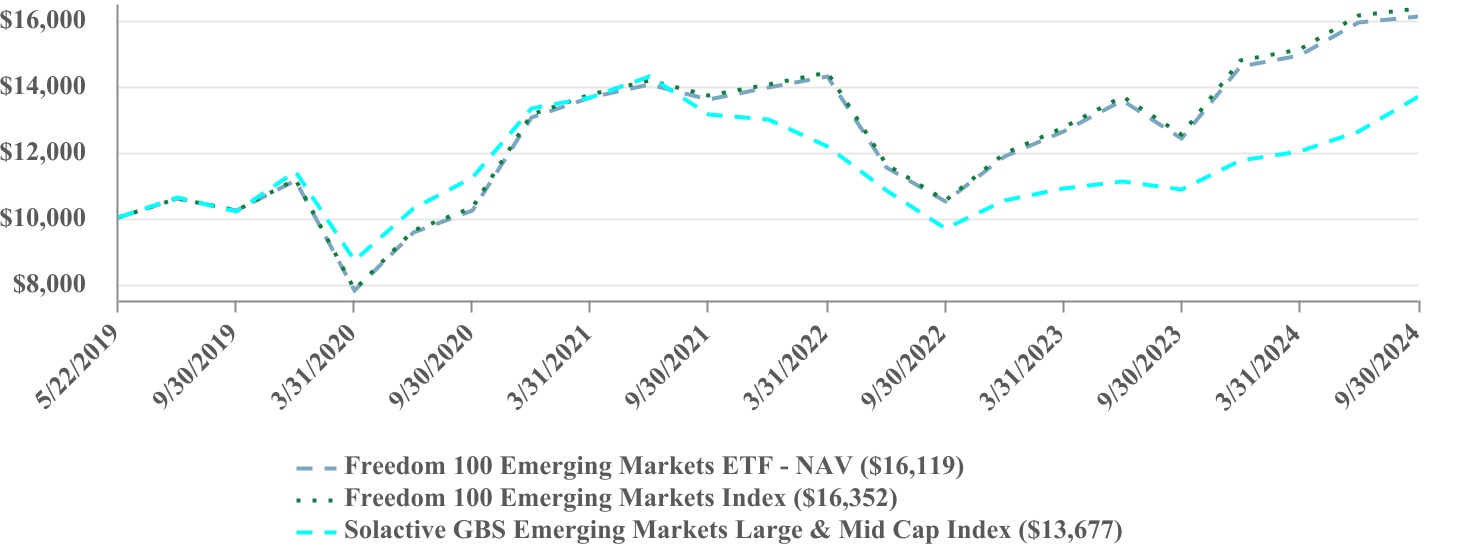
| PERFORMANCE OF A HYPOTHETICAL $10,000 INVESTMENT |
| | | | | | | | | | | | | | | | | | | | |
| AVERAGE ANNUAL TOTAL RETURNS |
| | 1 Year | | 5 Year | | Since Inception (5/22/2019) |
| Freedom 100 Emerging Markets ETF - NAV | | 29.81% | | 9.56% | | 9.32% |
| Freedom 100 Emerging Markets Index | | 30.46% | | 9.83% | | 9.61% |
| Solactive GBS Emerging Markets Large & Mid Cap Index | | 25.79% | | 6.04% | | 6.02% |
| | | | | | |
The Fund’s past performance is not a good predictor of how the Fund will perform in the future. The graph and table do not reflect the deduction of taxes that a shareholder would pay on Fund distributions or redemption of Fund shares. Visit www.freedometfs.com/frdm for more recent performance information. |
| | | | | | | | | | | |
| WHAT FACTORS INFLUENCED PERFORMANCE FOR THE PERIOD? |
During the Period, stocks in the freest emerging market countries outperformed the Solactive GBS Emerging Markets Large & Mid Cap Index, led by strong returns from Taiwanese technology companies. Portfolio companies in the information technology sector, particularly those in the semiconductor industry, benefited from increased global demand due to the ability to respond to rapid advancements in artificial intelligence (AI) technology, the need for specialized chips, and greater computing power requirements.
Annual Shareholder Report: September 30, 2024
| | | | | | | | |
| Freedom 100 Emerging Markets ETF Ticker: FRDM Listed on: Cboe BZX Exchange, Inc. | September 30, 2024 Annual Shareholder Report www.freedometfs.com/frdm |
|
| | | | | | | | | | | | | | | | | | | | |
| KEY FUND STATISTICS (as of Period End) |
| Net Assets | | $847,996,380 | | Portfolio Turnover Rate* | | 20% |
| # of Portfolio Holdings | | 114 | | Advisory Fees Paid | | $3,731,552 |
| *Excludes impact of in-kind transactions. |
| | | | | | |
| | | | | | | | | | | | | | | | | | | | |
SECTOR WEIGHTING
(as a % of Net Assets) | | | | | |
| Information Technology | 32.5% | | | | | |
| Financials | 24.9% | | | | | |
| Materials | 11.2% | | | | | |
| Consumer Discretionary | 10.8% | | | | | |
| Consumer Staples | 6.4% | | | | | |
| Communication Services | 5.1% | | | | | |
| Industrials | 4.5% | | | | | |
| Health Care | 2.2% | | | | | |
| Utilities | 1.4% | | | | | |
| Real Estate | 0.6% | | | | | |
| Energy | 0.2% | | | | | |
| Cash & Cash Equivalents | 0.2% | | | | | |
| | | | | |
TOP 10 HOLDINGS
(as a % of Net Assets) |
| Taiwan Semiconductor Manufacturing Co. Ltd. - ADR | 10.4% |
| Samsung Electronics Co. Ltd. | 5.7% |
| Hon Hai Precision Industry Co. Ltd. | 5.0% |
| Bank Polska Kasa Opieki SA | 3.5% |
| Sociedad Quimica y Minera de Chile SA - ADR | 3.3% |
| MediaTek, Inc. | 3.2% |
| SK Hynix, Inc. | 3.0% |
| Banco de Chile | 2.8% |
| Latam Airlines Group SA | 2.5% |
| Falabella SA | 2.3% |
| | | | | |
COUNTRY WEIGHTING
(as a % of Net Assets) |
| Taiwan | 27.6% |
| Chile | 17.6% |
| South Korea | 15.3% |
| Poland | 14.0% |
| South Africa | 6.8% |
| Brazil | 4.9% |
| Thailand | 3.9% |
| Malaysia | 3.5% |
| Indonesia | 2.9% |
| Mexico | 1.8% |
| Philippines | 1.5% |
| Cash & cash equivalents | 0.2% |
Availability of Additional Information
For additional information about the Fund, including its prospectus, financial information, holdings, and proxy information, visit www.freedometfs.com/frdm. You can also request information by calling (215) 330-4476.
Householding
Householding is an option available to certain investors of the Fund. Householding is a method of delivery, based on the preference of the individual investor, in which a single copy of certain shareholder documents can be delivered to investors who share the same address, even if their accounts are registered under different names. Householding for the Fund is available through certain broker-dealers. If you are interested in enrolling in householding and receiving a single copy of prospectuses and other shareholder documents or you are currently enrolled in householding and wish to change your householding status, please contact your broker-dealer.
Annual Shareholder Report: September 30, 2024
(b) Not applicable
Item 2. Code of Ethics.
The registrant has adopted a code of ethics that applies to the registrant’s principal executive officer and principal financial officer. The registrant has not made any amendments to its code of ethics during the year covered by this report. The registrant has not granted any waivers from any provisions of the code of ethics during the year covered by this report.
A copy of the registrant’s Code of Ethics is incorporated by reference.
Item 3. Audit Committee Financial Expert.
The registrant’s Board of Trustees of the Trust has determined that there is at least one audit committee financial expert serving on its audit committee. Dr. Michael Pagano is an “audit committee financial expert” and is considered to be “independent” as each term is defined in Item 3 of Form N-CSR.
Item 4. Principal Accountant Fees and Services.
The registrant has engaged its principal accountant to perform audit services, audit-related services, tax services and other services during the past fiscal year. “Audit services” refer to performing an audit of the registrant’s annual financial statements or services that are normally provided by the accountant in connection with statutory and regulatory filings or engagements for those fiscal years. “Audit-related services” refer to the assurance and related services by the principal accountant that are reasonably related to the performance of the audit. “Tax services” refer to professional services rendered by the principal accountant for tax compliance, tax advice, and tax planning, including review of the registrant’s tax returns and calculations of required income, capital gain and excise distributions. There were no “Other services” provided by the principal accountant. The following table details the aggregate fees billed or expected to be billed for the last fiscal year for audit fees, audit-related fees, tax fees and other fees by the principal accountant.
| | | | | | | | | |
| | FYE 9/30/2024 | FYE 9/30/2023 | |
| (a) Audit Fees | $8,750 | $8,750 | |
| (b) Audit-Related Fees | N/A | N/A | |
| (c) Tax Fees | $2,250 | $2,250 | |
| (d) All Other Fees | N/A | N/A | |
(e)(1) The audit committee has adopted pre-approval policies and procedures that require the audit committee to pre-approve all audit and non-audit services of the registrant, including services provided to any entity affiliated with the registrant.
(e)(2) None of the fees billed by any Fund's principal accountant were applicable to non-audit services pursuant to a waiver of the pre-approval requirement.
(f) All of the principal accountant’s hours spent on auditing the registrant’s financial statements were attributed to work performed by full-time permanent employees of the principal accountant.
(g) None of the fees billed by any Fund's principal accountant were applicable to non-audit services billed or expected to be billed to any Fund’s investment adviser.
(h) The audit committee of the board of trustees/directors has considered whether the provision of non-audit services that were rendered to the registrant's investment adviser is compatible with maintaining the principal accountant's independence
and has concluded that the provision of such non-audit services by the accountant has not compromised the accountant’s independence.
(i) The registrant has not been identified by the U.S. Securities and Exchange Commission as having filed an annual report issued by a registered public accounting firm branch or office that is located in a foreign jurisdiction where the Public Company Accounting Oversight Board is unable to inspect or completely investigate because of a position taken by an authority in that jurisdiction..
(j) The registrant is not a foreign issuer.
Item 5. Audit Committee of Listed Registrants.
(a) The registrant is an issuer as defined in Rule 10A-3 under the Securities Exchange Act of 1934, (the “Act”) and has a separately-designated standing audit committee established in accordance with Section 3(a)(58)(A) of the Act. The independent members of the committee are as follows: Daniel Dorn, Chukwuemeka (Emeka) Oguh, and Michael Pagano.
(b) Not applicable.
Item 6. Investments.
(a)
| | |
| FREEDOM 100 EMERGING MARKETS ETF |
| SCHEDULE OF INVESTMENTS |
| September 30, 2024 |
| | | | | | | | | | | | | | |
| COMMON STOCKS - 99.8% |
| Shares |
| Value |
| Brazil - 4.9% | | | |
|
| B3 SA - Brasil Bolsa Balcao |
| 1,371,391 | |
| $ | 2,703,662 | |
| Banco Bradesco SA - ADR |
| 382,080 | |
| 1,016,333 | |
| Banco Santander Brasil SA - ADR |
| 989,553 | |
| 5,205,049 | |
| Itau Unibanco Holding SA - ADR |
| 1,233,206 | |
| 8,200,820 | |
| Localiza Rent a Car SA |
| 199,326 | |
| 1,509,297 | |
| Raia Drogasil SA |
| 322,721 | |
| 1,518,318 | |
Rede D'Or Sao Luiz SA (a) |
| 224,044 | |
| 1,277,384 | |
| Suzano SA |
| 181,333 | |
| 1,810,101 | |
| Vale SA |
| 1,200,268 | |
| 14,028,134 | |
| WEG SA |
| 390,608 | |
| 3,916,333 | |
|
|
|
| 41,185,431 | |
|
|
|
|
|
| Chile - 17.6% | | | |
|
| Banco de Chile |
| 186,995,918 | |
| 23,850,141 | |
| Banco de Credito e Inversiones SA |
| 406,547 | |
| 12,653,453 | |
| Cencosud SA |
| 5,460,741 | |
| 11,021,066 | |
Cia Cervecerias Unidas SA - ADR (b) |
| 271,772 | |
| 3,160,708 | |
| Cia Sud Americana de Vapores SA |
| 73,786,001 | |
| 4,512,654 | |
| Colbun SA |
| 31,809,979 | |
| 4,308,302 | |
| Empresas CMPC SA |
| 4,901,412 | |
| 8,524,195 | |
| Empresas Copec SA |
| 1,852,208 | |
| 12,398,857 | |
Falabella SA (c) |
| 5,251,586 | |
| 19,445,993 | |
Latam Airlines Group SA (c) |
| 1,656,568,562 | |
| 21,312,686 | |
Sociedad Quimica y Minera de Chile SA - ADR (b) |
| 667,349 | |
| 27,815,106 | |
|
|
|
| 149,003,161 | |
|
|
|
|
|
| Indonesia - 2.9% | | | |
|
| Adaro Energy Indonesia Tbk PT |
| 5,641,301 | |
| 1,419,641 | |
| Bank Central Asia Tbk PT |
| 22,908,933 | |
| 15,623,166 | |
| Barito Pacific Tbk PT |
| 13,627,816 | |
| 945,126 | |
| Charoen Pokphand Indonesia Tbk PT |
| 3,133,581 | |
| 972,776 | |
GoTo Gojek Tokopedia Tbk PT (c) |
| 327,603,686 | |
| 1,428,127 | |
| Indah Kiat Pulp & Paper Tbk PT |
| 994,276 | |
| 568,064 | |
| Kalbe Farma Tbk PT |
| 7,788,681 | |
| 887,416 | |
Merdeka Copper Gold Tbk PT (c) |
| 5,579,144 | |
| 1,002,330 | |
The accompanying notes are an integral part of these financial statements.
1
| | |
| FREEDOM 100 EMERGING MARKETS ETF |
| SCHEDULE OF INVESTMENTS (CONTINUED) |
| September 30, 2024 |
| | | | | | | | | | | | | | |
| COMMON STOCKS - 99.8% (CONTINUED) |
| Shares |
| Value |
| Indonesia - 2.9% (Continued) | | | | |
| Sarana Menara Nusantara Tbk PT |
| 8,233,935 | |
| $ | 464,994 | |
| Sumber Alfaria Trijaya Tbk PT |
| 8,140,209 | |
| 1,699,013 | |
|
|
|
| 25,010,653 | |
|
|
|
|
|
| Malaysia - 3.5% | | | |
|
| Celcomdigi Bhd |
| 2,364,176 | |
| 2,132,833 | |
| Hong Leong Bank Bhd |
| 447,088 | |
| 2,337,630 | |
| IOI Corp. Bhd |
| 1,937,009 | |
| 1,766,255 | |
| Kuala Lumpur Kepong Bhd |
| 369,060 | |
| 1,838,364 | |
| Maxis Bhd |
| 1,731,869 | |
| 1,658,999 | |
| PPB Group Bhd |
| 494,351 | |
| 1,733,555 | |
| Press Metal Aluminium Holdings Bhd |
| 2,849,187 | |
| 3,496,274 | |
| Public Bank Bhd |
| 10,631,527 | |
| 11,756,945 | |
| YTL Corp. Bhd |
| 2,808,546 | |
| 1,709,579 | |
| YTL Power International Bhd |
| 1,642,674 | |
| 1,458,030 | |
|
|
|
| 29,888,464 | |
|
|
|
|
|
| Mexico - 1.8% | | | |
|
America Movil SAB de CV (c) |
| 2,326,969 | |
| 1,910,975 | |
| Arca Continental SAB de CV |
| 111,433 | |
| 1,041,154 | |
| Cemex SAB de CV - ADR |
| 201,404 | |
| 1,228,564 | |
| Fomento Economico Mexicano SAB de CV - ADR |
| 27,135 | |
| 2,678,496 | |
| Grupo Aeroportuario del Sureste SAB de CV - ADR |
| 2,335 | |
| 660,245 | |
| Grupo Bimbo SAB de CV - Class A |
| 184,895 | |
| 635,817 | |
| Grupo Carso SAB de CV - Class A1 |
| 71,631 | |
| 442,155 | |
Grupo Elektra SAB DE CV (d) |
| 6,751 | |
| 323,990 | |
| Grupo Financiero Banorte SAB de CV |
| 416,870 | |
| 2,966,996 | |
Grupo Financiero Inbursa SAB de CV (c) |
| 244,957 | |
| 558,213 | |
| Grupo Mexico SAB de CV - Class B |
| 441,190 | |
| 2,464,749 | |
|
|
|
| 14,911,354 | |
|
|
|
|
|
| Philippines - 1.5% | | | |
|
| Ayala Corp. |
| 80,974 | |
| 970,315 | |
| Ayala Land, Inc. |
| 1,864,336 | |
| 1,217,661 | |
| Bank of the Philippine Islands |
| 642,363 | |
| 1,548,664 | |
| BDO Unibank, Inc. |
| 525,099 | |
| 1,480,538 | |
| International Container Terminal Services, Inc. |
| 256,973 | |
| 1,852,636 | |
| Jollibee Foods Corp. |
| 116,358 | |
| 557,729 | |
| Manila Electric Co. |
| 75,773 | |
| 592,527 | |
| SM Investments Corp. |
| 144,974 | |
| 2,473,257 | |
| SM Prime Holdings, Inc. |
| 2,587,759 | |
| 1,491,584 | |
| Universal Robina Corp. |
| 233,040 | |
| 431,251 | |
|
|
|
| 12,616,162 | |
| | | | |
The accompanying notes are an integral part of these financial statements.
2
| | |
| FREEDOM 100 EMERGING MARKETS ETF |
| SCHEDULE OF INVESTMENTS (CONTINUED) |
| September 30, 2024 |
| | | | | | | | | | | | | | |
| COMMON STOCKS - 99.8% (CONTINUED) |
| Shares |
| Value |
| Poland - 14.0% | | | |
|
| Alior Bank SA |
| 319,245 | |
| $ | 7,687,094 | |
Allegro.eu SA (a)(c) |
| 1,645,507 | |
| 14,881,813 | |
| Bank Polska Kasa Opieki SA |
| 777,872 | |
| 29,688,074 | |
CCC SA (c) |
| 169,780 | |
| 7,476,672 | |
| CD Projekt SA |
| 238,633 | |
| 10,797,074 | |
Cyfrowy Polsat SA (c) |
| 879,877 | |
| 2,919,207 | |
Dino Polska SA (a)(c) |
| 173,449 | |
| 15,803,732 | |
| Grupa Kety SA |
| 33,572 | |
| 7,191,508 | |
| KRUK SA |
| 63,132 | |
| 7,279,289 | |
| LPP SA |
| 3,710 | |
| 15,219,771 | |
|
|
|
| 118,944,234 | |
|
|
|
|
|
| South Africa - 6.9% | | | |
|
| Absa Group Ltd. |
| 383,327 | |
| 3,892,397 | |
Anglogold Ashanti PLC (b) |
| 199,571 | |
| 5,314,576 | |
| Capitec Bank Holdings Ltd. |
| 48,523 | |
| 8,550,355 | |
| FirstRand Ltd. |
| 2,447,203 | |
| 11,764,704 | |
Gold Fields Ltd. - ADR (b) |
| 383,974 | |
| 5,894,001 | |
| MTN Group Ltd. |
| 814,006 | |
| 4,326,446 | |
| Sanlam Ltd. |
| 769,400 | |
| 3,918,808 | |
Sasol Ltd. - ADR (b) |
| 284,429 | |
| 1,922,740 | |
| Shoprite Holdings Ltd. |
| 205,734 | |
| 3,522,037 | |
| Standard Bank Group Ltd. |
| 609,116 | |
| 8,544,018 | |
|
|
|
| 52,335,506 | |
|
|
|
|
|
| South Korea - 15.3% | | | |
|
| Celltrion, Inc. |
| 39,272 | |
| 5,868,126 | |
| Hyundai Motor Co. |
| 53,284 | |
| 9,942,109 | |
| Kia Corp. |
| 96,715 | |
| 7,388,414 | |
| LG Chem Ltd. |
| 20,297 | |
| 5,533,288 | |
| NAVER Corp. |
| 53,970 | |
| 6,991,296 | |
POSCO Holdings, Inc. - ADR (b) |
| 119,986 | |
| 8,397,820 | |
Samsung Biologics Co. Ltd. (a)(c) |
| 6,688 | |
| 4,996,694 | |
| Samsung Electronics Co. Ltd. |
| 1,033,538 | |
| 48,606,398 | |
| Samsung SDI Co. Ltd. |
| 22,439 | |
| 6,494,732 | |
| SK Hynix, Inc. |
| 193,114 | |
| 25,783,975 | |
|
|
|
| 130,002,852 | |
|
|
|
|
|
Taiwan - 27.6%(e) | | | |
|
| Cathay Financial Holding Co. Ltd. |
| 4,516,462 | |
| 9,490,614 | |
| Chunghwa Telecom Co. Ltd. |
| 2,248,035 | |
| 8,914,995 | |
| CTBC Financial Holding Co. Ltd. |
| 8,976,939 | |
| 9,758,005 | |
| Delta Electronics, Inc. |
| 1,383,291 | |
| 16,631,925 | |
The accompanying notes are an integral part of these financial statements.
3
| | |
| FREEDOM 100 EMERGING MARKETS ETF |
| SCHEDULE OF INVESTMENTS (CONTINUED) |
| September 30, 2024 |
| | | | | | | | | | | | | | |
| COMMON STOCKS - 99.8% (CONTINUED) |
| Shares |
| Value |
Taiwan - 27.6%(e) (Continued) | | | | |
| Fubon Financial Holding Co. Ltd. |
| 3,914,135 | |
| $ | 11,180,945 | |
| Hon Hai Precision Industry Co. Ltd. |
| 7,104,442 | |
| 42,092,581 | |
| MediaTek, Inc. |
| 741,959 | |
| 27,548,128 | |
| Quanta Computer, Inc. |
| 1,257,678 | |
| 10,491,745 | |
| Taiwan Semiconductor Manufacturing Co. Ltd. - ADR |
| 505,695 | |
| 87,824,051 | |
United Microelectronics Corp. - ADR (b) |
| 1,212,691 | |
| 10,210,858 | |
|
|
|
| 234,143,847 | |
|
|
|
|
|
| Thailand - 3.9% | | | |
|
| Advanced Info Service PCL |
| 406,837 | |
| 3,287,316 | |
| Bangkok Bank PCL |
| 735,095 | |
| 3,438,173 | |
| Bangkok Dusit Medical Services PCL |
| 4,286,062 | |
| 3,996,018 | |
| Bumrungrad Hospital PCL |
| 243,402 | |
| 2,034,811 | |
| Central Pattana PCL |
| 1,274,986 | |
| 2,654,776 | |
Central Retail Corp. PCL (a) |
| 1,436,574 | |
| 1,384,004 | |
| CP ALL PCL |
| 3,484,573 | |
| 7,093,141 | |
| Gulf Energy Development PCL |
| 1,946,112 | |
| 3,447,390 | |
| Intouch Holdings PCL |
| 328,139 | |
| 943,294 | |
| Kasikornbank PCL |
| 1,021,326 | |
| 4,761,057 | |
|
|
|
| 33,039,980 | |
TOTAL COMMON STOCKS (Cost $721,336,930) | | |
| 846,396,220 | |
|
|
|
|
|
| SHORT-TERM INVESTMENTS - 6.0% | |
|
|
|
| Investments Purchased with Proceeds from Securities Lending - 5.8% |
| |
| |
First American Government Obligations Fund - Class X, 4.82% (f) |
| 49,228,873 | |
| 49,228,873 | |
|
|
|
|
|
| Money Market Funds - 0.2% |
| |
| |
First American Government Obligations Fund - Class X, 4.82% (f) |
| 1,849,443 | |
| 1,849,443 | |
TOTAL SHORT-TERM INVESTMENTS (Cost $51,078,316) | | |
| 51,078,316 | |
|
|
|
|
|
TOTAL INVESTMENTS - 105.8% (Cost $772,415,246) | | |
| $ | 897,474,536 | |
| Liabilities in Excess of Other Assets - (5.8)% | | |
| (49,478,156) | |
| TOTAL NET ASSETS - 100.0% |
| |
| $ | 847,996,380 | |
Percentages are stated as a percent of net assets.
| | |
| ADR - American Depositary Receipt |
| PLC - Public Limited Company |
| SA - Sociedad Anónima |
| SAB de CV - Sociedad Anónima Bursátil de Capital Variable |
The accompanying notes are an integral part of these financial statements.
4
| | |
| FREEDOM 100 EMERGING MARKETS ETF |
| SCHEDULE OF INVESTMENTS (CONTINUED) |
| September 30, 2024 |
| | | | | | | | |
| (a) |
| Security is exempt from registration pursuant to Rule 144A under the Securities Act of 1933, as amended. These securities may only be resold in transactions exempt from registration to qualified institutional investors. As of September 30, 2024, the value of these securities total $38,343,627 or 4.5% of the Fund’s net assets. |
| (b) |
| All or a portion of this security is on loan as of September 30, 2024. The total market value of these securities was $47,211,098 which represented 5.6% of net assets. |
| (c) |
| Non-income producing security. |
| (d) |
| Fair value determined using significant unobservable inputs in accordance with procedures established by and under the supervision of the Adviser, acting as Valuation Designee. These securities represented $323,990 or 0.0% of net assets as of September 30, 2024. |
| (e) |
| To the extent that the Fund invests a significant portion of its assets in the securities of companies of a single country or region, it is more likely to be impacted by events or conditions affecting the country or region. |
| (f) |
| The rate shown represents the 7-day effective yield as of September 30, 2024. |
(b) Not applicable
The accompanying notes are an integral part of these financial statements.
5
FREEDOM 100 EMERGING MARKETS ETF
Item 7. Financial Statements and Financial Highlights for Open-End Management Investment
Companies.
STATEMENT OF ASSETS AND LIABILITIES
September 30, 2024
| | | | | |
| Assets: | |
Investments in securities, at value1 (See Note 2) | $ | 897,474,536 | |
| Foreign currencies, at value | 595,591 | |
| Receivable for fund shares sold | 8,945,150 | |
| Dividends and interest receivable | 1,279,819 | |
| Securities lending income receivable (See Note 5) | 42,104 | |
| Total assets | 908,337,200 | |
| |
| Liabilities: | |
| Due to securities lending agent (See Note 5) | 49,228,873 | |
| Payable for investment securities purchased | 10,783,498 | |
| Accrued investment advisory fees (See Note 4) | 328,449 | |
| Total liabilities | 60,340,820 | |
| Net Assets | $ | 847,996,380 | |
| | |
| Net Assets Consist of: | |
| Paid-in capital | $ | 752,991,152 | |
| Total distributable earnings (accumulated deficit) | 95,005,228 | |
| Net Assets: | $ | 847,996,380 | |
| |
| Calculation of Net Asset Value Per Share: | |
| Net Assets | $ | 847,996,380 | |
| Shares Outstanding (unlimited shares of beneficial interest authorized, no par value) | 23,700,000 | |
| Net Asset Value per Share | $ | 35.78 | |
| |
| Cost of Investments in Securities | $ | 772,415,246 | |
| Cost of Foreign Currency | $ | 595,613 | |
| |
(1) Includes loaned securities with a value of | $ | 47,211,098 | |
The accompanying notes are an integral part of these financial statements.
1
FREEDOM 100 EMERGING MARKETS ETF
STATEMENT OF OPERATIONS
For the Year Ended September 30, 2024
| | | | | | | | |
| Investment Income: | | |
| Dividend income (net of foreign withholding tax of $4,637,295) | | $ | 22,525,201 | |
| Securities lending income, net (See Note 5) | | 579,908 | |
| Interest income | | 113,458 | |
| Total investment income | | 23,218,567 | |
| | |
| Expenses: | | |
| Investment advisory fees (See Note 4) | | 3,731,552 | |
| Net expenses | | 3,731,552 | |
| | |
| Net Investment Income (Loss) | | 19,487,015 | |
| | |
| Realized and Unrealized Gain (Loss) on Investments: | | |
| Net realized gain (loss) on: | | |
| Investments (net of foreign capital gains tax of $104) | | 3,218,968 | |
| Foreign currency | | 74,946 | |
| | 3,293,914 | |
| Net change in unrealized appreciation (depreciation) on: | | |
| Investments | | 141,151,607 | |
| Foreign currency | | 28,524,920 | |
| | 169,676,527 | |
| Net realized and unrealized gain (loss) on investments: | | 172,970,441 | |
| Net Increase (Decrease) in Net Assets Resulting from Operations | | $ | 192,457,456 | |
The accompanying notes are an integral part of these financial statements.
2
FREEDOM 100 EMERGING MARKETS ETF
STATEMENT OF CHANGES IN NET ASSETS
| | | | | | | | | | | | | | |
| | For the Year Ended September 30, 2024 | | For the Year Ended September 30, 2023 |
| Increase (Decrease) in Net Assets from: | | | | |
| Operations: | | | | |
| Net investment income (loss) | | $ | 19,487,015 | | | $ | 13,588,968 | |
| Net realized gain (loss) on investments & foreign currency | | 3,293,914 | | | (6,636,554) | |
| Net change in unrealized appreciation (depreciation) on investments & foreign currency | | 169,676,527 | | | 17,335,729 | |
| Net increase (decrease) in net assets resulting from operations | | 192,457,456 | | | 24,288,143 | |
| | | | |
| Distributions to Shareholders: | | | | |
| Distributable earnings | | (20,070,542) | | | (19,049,112) | |
| Total distributions to shareholders | | (20,070,542) | | | (19,049,112) | |
| | | | |
| Capital Share Transactions: | | | | |
| Proceeds from shares sold | | 157,536,790 | | | 418,679,520 | |
| Payments for shares redeemed | | (91,409,910) | | | (22,228,200) | |
| Transaction fees (See Note 1) | | 352,154 | | | 857,045 | |
| Net increase (decrease) in net assets derived from net change in capital share transactions | | 66,479,034 | | | 397,308,365 | |
| Net Increase (Decrease) in Net Assets | | 238,865,948 | | | 402,547,396 | |
| | | | |
| Net Assets: | | | | |
| Beginning of period | | 609,130,432 | | | 206,583,036 | |
| End of period | | $ | 847,996,380 | | | $ | 609,130,432 | |
| | | | |
| Changes in Shares Outstanding: | | | | |
| Shares outstanding, beginning of period | | 21,550,000 | | | 8,250,000 | |
| Shares sold | | 5,000,000 | | | 14,050,000 | |
| Shares repurchased | | (2,850,000) | | | (750,000) | |
| Shares outstanding, end of period | | 23,700,000 | | | 21,550,000 | |
The accompanying notes are an integral part of these financial statements.
3
FREEDOM 100 EMERGING MARKETS ETF
FINANCIAL HIGHLIGHTS
| | | | | | | | | | | | | | | | | | | | | | | | | | | | | | | | | | | | | | | | | | | | |
| Net Asset Value, Beginning of Period | Net Investment Income (Loss) (1) | Net Realized and Unrealized Gain (Loss) on Investments | Net Increase (Decrease) in Net Asset Value Resulting from Operations | Distributions from Net Investment Income | Distributions from Realized Gains | Total Distributions | Transaction Fees (See Note 1) | Net Asset Value, End of Period | Total Return(2) | Net Assets, End of Period (000's) | Net Expenses(3)(4) | Net Investment Income(3) | Portfolio Turnover Rate(5) |
For the Year Ended
September 30, 2024 | $ | 28.27 | | 0.84 | 7.52 | 8.36 | (0.87) | - | (0.87) | 0.02 | $35.78 | 29.81% | $ | 847,996 | | 0.49% | 2.56% | 20% |
For the Year Ended
September 30, 2023 | $ | 25.04 | | 0.94 | 3.60 | 4.54 | (1.32) | (0.05) | (1.37) | 0.06 | $28.27 | 18.42% | $ | 609,130 | | 0.49% | 3.18% | 15% |
For the Year Ended
September 30, 2022 | $ | 32.99 | | 1.22 | (8.73) | (7.51) | (0.48) | (0.02) | (0.50) | 0.06 | $25.04 | -22.96% | $ | 206,583 | | 0.49% | 3.99% | 8% |
For the Year Ended
September 30, 2021 | $ | 25.07 | | 0.82 | 7.33 | 8.15 | (0.35) | - | (0.35) | 0.12 | $32.99 | 32.97% | $ | 100,613 | | 0.49% | 2.49% | 22% |
For the Year Ended
September 30, 2020 | $ | 25.33 | | 0.34 | (0.31) | 0.03 | (0.31) | - | (0.31) | 0.02 | $25.07 | 0.25% | $ | 20,058 | | 0.49% | 1.40% | 19% |
| | |
| (1) Net investment income per share represents net investment income divided by the daily average shares of beneficial interest outstanding throughout the period. |
| (2) All returns reflect reinvested dividends, if any, but do not reflect the impact of taxes. Total return for a period of less than one year is not annualized. |
| (3) For periods of less than one year, these ratios are annualized. |
| (4) Net expenses include effects of any reimbursement or recoupment. |
| (5) Portfolio turnover is not annualized and is calculated without regard to short-term securities having a maturity of less than one year. Excludes impact of in-kind transactions. |
The accompanying notes are an integral part of these financial statements.
4
FREEDOM 100 EMERGING MARKETS ETF
NOTES TO THE FINANCIAL STATEMENTS
September 30, 2024
NOTE 1 – ORGANIZATION
Freedom 100 Emerging Markets ETF (the “Fund”) is a series of the EA Series Trust (the “Trust”), which was organized as a Delaware statutory trust on October 11, 2013. The Trust is registered with the Securities and Exchange Commission (“SEC”) under the Investment Company Act of 1940, as amended (the “1940 Act”), as an open-end management investment company and the offering of the Fund’s shares (“Shares”) is registered under the Securities Act of 1933, as amended (the “Securities Act”). The Fund is considered diversified under the 1940 Act. The Fund commenced operations on May 22, 2019. The Fund qualifies as an investment company as defined in the Financial Accounting Standards Codification Topic 946-Financial Services- Investment Companies. The Fund’s investment objective is to seek to track the total return performance, before fees and expenses, of the Freedom 100 Emerging Markets Index (the “Index”).
Shares of the Fund are listed and traded on Cboe BZX Exchange, Inc. (the “Exchange”). Market prices for the shares may be different from their net asset value (“NAV”). The Fund issues and redeems shares on a continuous basis at NAV only in blocks of 50,000 shares, called “Creation Units.” Creation Units are issued and redeemed principally in-kind for securities included in a specified universe. Once created, shares generally trade in the secondary market at market prices that change throughout the day in share amounts less than a Creation Unit. Except when aggregated in Creation Units, shares are not redeemable securities of the Fund. Shares of the Fund may only be purchased or redeemed by certain financial institutions (“Authorized Participants”). An Authorized Participant is a participant of a clearing agency registered with the SEC, which has a written agreement with the Trust or one of its service providers that allows the authorized participant to place orders for the purchase and redemption of creation units. Most retail investors do not qualify as Authorized Participants nor have the resources to buy and sell whole Creation Units. Therefore, they are unable to purchase or redeem the shares directly from the Fund. Rather, most retail investors may purchase shares in the secondary market with the assistance of a broker and are subject to customary brokerage commissions or fees.
Authorized Participants may be required to pay a transaction fee to compensate the Trust or its custodian for costs incurred in connection with creation and redemption transactions. Certain transactions consisting all or partially of cash may also be subject to a variable charge, which is payable to the relevant Fund, of up to 2.00% of the value of the order in addition to the transaction fee. A Fund may determine to waive the variable charge on certain orders when such waiver is determined to be in the best interests of Fund shareholders. Transaction fees received by a Fund, if any, are displayed in the Capital Share Transactions sections of the Statements of Changes in Net Assets.
NOTE 2 – SIGNIFICANT ACCOUNTING POLICIES
The following is a summary of significant accounting policies consistently followed by the Fund. These policies are in conformity with accounting principles generally accepted in the United States of America (“GAAP”).
A.Security Valuation. Equity securities that are traded on a national securities exchange, except those listed on the NASDAQ Global Market® (“NASDAQ”) are valued at the last reported sale price on the exchange on which the security is principally traded. Securities traded on NASDAQ will be valued at the NASDAQ Official Closing Price (“NOCP”). If, on a particular day, an exchange-traded or NASDAQ security does not trade, then the most recent quoted bid for exchange-traded or the mean between the most recent quoted bid and ask price for NASDAQ securities will be used. Equity securities that are not traded on a listed exchange are generally valued at the last sale price in the over-the-counter market. If a non-exchange traded security does not trade on a particular day, then the mean between the last quoted closing bid and asked price will be used. Prices denominated in foreign currencies are converted to U.S. dollar equivalents at the current exchange rate, which approximates fair value. Redeemable securities issued by open-end investment companies are valued at the investment company’s applicable net asset value, with the exception of exchange-traded open-end investment companies which are priced as equity securities.
Subject to its oversight, the Trust’s Board of Trustees (the “Board”) has delegated primary responsibility for determining or causing to be determined the value of the Fund’s investments to Empowered Funds, LLC dba EA Advisers (the “Adviser”), pursuant to the Trust’s valuation policy and procedures, which have been adopted by the Trust and approved by the Board. In accordance with Rule 2a-5 under the 1940 Act, the Board designated the
FREEDOM 100 EMERGING MARKETS ETF
NOTES TO THE FINANCIAL STATEMENTS (CONTINUED)
September 30, 2024
Adviser as the “valuation designee” of the Fund. If the Adviser, as valuation designee, determines that reliable market quotations are not readily available for an investment, the investment is valued at fair value as determined in good faith by the Adviser in accordance with the Trust’s fair valuation policy and procedures. The Adviser will provide the Board with periodic reports, no less frequently than quarterly, that discuss the functioning of the valuation process, if applicable, and that identify issues and valuation problems that have arisen, if any. As appropriate, the Adviser and the Board will review any securities valued by the Adviser in accordance with the Trust’s valuation policies during these periodic reports. The use of fair value pricing by the Fund may cause the net asset value of its shares to differ significantly from the net asset value that would be calculated without regard to such considerations. As of September 30, 2024, the Fund held securities that required fair valuation due to unobservable inputs.
As described above, the Fund may use various methods to measure the fair value of their investments on a recurring basis. GAAP establishes a hierarchy that prioritizes inputs to valuation methods. The three levels of inputs are:
Level 1 – Unadjusted quoted prices in active markets for identical assets or liabilities that the Fund has the ability to access.
Level 2 – Observable inputs other than quoted prices included in Level 1 that are observable for the asset or liability, either directly or indirectly. These inputs may include quoted prices for the identical instrument on an inactive market, prices for similar instruments, interest rates, prepayment speeds, credit risk, yield curves, default rates and similar data.
Level 3 – Unobservable inputs for the asset or liability, to the extent relevant observable inputs are not available; representing the Fund’s own assumptions about the assumptions a market participant would use in valuing the asset or liability and would be based on the best information available.
The availability of observable inputs can vary from security to security and is affected by a wide variety of factors, including, for example, the type of security, whether the security is new and not yet established in the marketplace, the liquidity of markets, and other characteristics particular to the security. To the extent that valuation is based on models or inputs that are less observable or unobservable in the market, the determination of fair value requires more judgment. Accordingly, the degree of judgment exercised in determining fair value is greatest for instruments categorized in Level 3.
The inputs used to measure fair value may fall into different levels of the fair value hierarchy. In such cases, for disclosure purposes, the level in the fair value hierarchy within which the fair value measurement falls in its entirety, is determined based on the lowest level input that is significant to the fair value measurement in its entirety.
The following is a summary of the fair value classification of the Fund’s investments as of September 30, 2024:
| | | | | | | | | | | | | | | | | | | | | | | | | | |
| DESCRIPTION | | LEVEL 1 | | LEVEL 2 | | LEVEL 3 | | TOTAL |
| Assets | | | | | | | | |
| Common Stocks | | $ | 846,072,230 | | | $ | — | | | $ | 323,990 | | | $ | 846,396,220 | |
| Investments Purchased with Proceeds from Securities Lending | | 49,228,873 | | | — | | | — | | | 49,228,873 | |
| Money Market Funds | | 1,849,443 | | | — | | | — | | | 1,849,443 | |
| Total Investments in Securities | | $ | 897,150,546 | | | $ | — | | | $ | 323,990 | | | $ | 897,474,536 | |
Refer to the Schedule of Investments for additional information.
FREEDOM 100 EMERGING MARKETS ETF
NOTES TO THE FINANCIAL STATEMENTS (CONTINUED)
September 30, 2024
Below is a reconciliation of securities in Level 3 for the Fund for the fiscal year ended September 30, 2024:
| | | | | |
| Common Stocks |
| Value, Beginning of Period | $ | — | |
| Purchases | — | |
| Proceeds from Sales | — | |
| Net Realized Gains (Losses) | — | |
| Corporate Action | — | |
| Change in Unrealized Appreciation (Depreciation) | — | |
| Transfers In/(Out) of Level 3 | 323,990 | |
| Value, End of Year | $ | 323,990 | |
Significant unobservable valuation inputs monitored by the Valuation Designee under the supervision of the Adviser for restricted securities or material Level 3 investments as of September 30, 2024, for the Fund are as follows:
| | | | | | | | | | | | | | | | | | | | | | | | | | |
| | Fair Value at September 30, 2024 | | Valuation Technique | | Unobservable Input | | Input Values (Ranges) |
| Common Stocks | | $ | 323,990 | | | Last Close Price | | Shares suspended from trading | | 944.95 - 1,203.26 Mexican Peso |
B.Foreign Currency. Investment securities and other assets and liabilities denominated in foreign currencies are translated into U.S. dollar amounts using the spot rate of exchange at the date of valuation. Purchases and sales of investment securities and income and expense items denominated in foreign currencies are translated into U.S. dollar amounts on the respective dates of such transactions.The Fund isolates the portion of the results of operations resulting from changes in foreign exchange rates on investments from the fluctuations arising from changes in market prices of securities held. That portion of gains (losses) attributable to the changes in market prices and the portion of gains (losses) attributable to changes in foreign exchange rates are included on the “Statement of Operations” under “Net realized gain (loss) – Foreign currency” and “Change in Net Unrealized Appreciation (Depreciation) – Foreign Currency,” respectively.
The Fund reports net realized foreign exchange gains or losses that arise from sales of foreign currencies, currency gains or losses realized between the trade and settlement dates on securities transactions, and the difference between the amounts of dividends, interest, and foreign withholding taxes recorded on the Fund’s books and the U.S. dollar equivalent of the amounts actually received or paid. Net unrealized foreign exchange gains and losses arise from changes in the fair values of assets and liabilities, other than investments in securities at fiscal period end, resulting from changes in exchange rates.
C.Federal Income Taxes. The Fund intends to continue to comply with the requirements of subchapter M of the Internal Revenue Code of 1986, as amended, as necessary to qualify as a regulated investment company and distribute substantially all net taxable investment income and net realized gains to shareholders in a manner which results in no tax cost to the Fund. Therefore, no federal income tax provision is required. As of and during the fiscal year ended September 30, 2024, the Fund did not have any tax positions that did not meet the “more-likely-than-not” threshold of being sustained by the applicable tax authority. As of and during the fiscal year ended September 30, 2024, the Fund did not have liabilities for any unrecognized tax benefits. The Fund would/will recognize interest and penalties, if any, related to unrecognized tax benefits on uncertain tax positions as income tax expense in the Statement of Operations. During the fiscal year ended September 30, 2024, the Fund did not incur any interest or penalties. The Fund is subject to examination by U.S. taxing authorities for the tax periods since the Fund’s commencement of operations.
The Fund may be subject to taxes imposed on realized and unrealized gains on securities of certain foreign countries in which the Fund invests. The foreign tax expense, if any, was recorded on an accrual basis and is included in “Net
FREEDOM 100 EMERGING MARKETS ETF
NOTES TO THE FINANCIAL STATEMENTS (CONTINUED)
September 30, 2024
realized gain (loss) on investments” and “Net increase (decrease) in unrealized appreciation or depreciation on investments” on the accompanying Statements of Operations. The amount of foreign tax owed, if any, is included in“Payable for foreign taxes” on the accompanying Statements of Assets and Liabilities and is comprised of and taxes on unrealized gains.
D.Security Transactions and Investment Income. Investment securities transactions are accounted for on the trade date. Gains and losses realized on sales of securities are determined on a specific identification basis. Dividend income is recorded on the ex-dividend date, net of any foreign taxes withheld at source. Interest income is recorded on an accrual basis. Withholding taxes on foreign dividends have been provided for in accordance with the Fund’s understanding of the applicable tax rules and regulations.
Distributions to shareholders from net investment income for the Fund are declared and paid on a quarterly basis and distributions to shareholders from net realized gains on securities normally are declared and paid on an annual basis. Distributions are recorded on the ex-dividend date. The Fund may distribute more frequently, if necessary, for tax purposes.
E.Use of Estimates. The preparation of financial statements in conformity with GAAP requires management to make estimates and assumptions that affect the reported amounts of assets and liabilities at the date of the financial statements, as well as the reported amounts of increases and decreases in net assets from operations during the period. Actual results could differ from those estimates.
F.Share Valuation. The NAV per share of the Fund is calculated by dividing the sum of the value of the securities held by the Fund, plus cash and other assets, minus all liabilities (including estimated accrued expenses) by the total number of shares outstanding for the Fund, rounded to the nearest cent. The Fund’s shares will not be priced on the days on which the New York Stock Exchange (“NYSE”) is closed for regular trading. The offering and redemption price per share for the Fund is equal to the Fund’s net asset value per share.
G.Guarantees and Indemnifications. In the normal course of business, the Fund enters into contracts with service providers that contain general indemnification clauses. Additionally, as is customary, the Trust’s organizational documents permit the Trust to indemnify its officers and trustees against certain liabilities under certain circumstances. The Fund’s maximum exposure under these arrangements is unknown as this would involve future claims that may be against the Fund that have not yet occurred. As of the date of this report, no claim has been made for indemnification pursuant to any such agreement of the Fund.
H.Reclassification of Capital Accounts. GAAP requires that certain components of net assets relating to permanent differences be reclassified between financial and tax reporting. These reclassifications have no effect on net assets or net asset value per share. The Fund’s realized net capital gains resulting from in-kind redemptions, in which shareholders exchanged Fund shares for securities held by the Fund rather than for cash, are not taxable to the Fund and are not distributed to shareholders. As such, they have been reclassified from distributable earnings to paid-in capital. For the fiscal year ended September 30, 2024, the following table shows the reclassifications made:
| | | | | | | | |
Distributable
Earnings | | Paid-in
Capital |
| $(20,607,179) | | $20,607,179 |
NOTE 3 – RISKS
An investment in the Fund involves risk, including those described below. There is no assurance that the Fund will achieve its investment objective. An investor may lose money by investing in the Fund. An investment in the Fund is not a bank deposit and is not insured or guaranteed by the FDIC or any government agency.
FREEDOM 100 EMERGING MARKETS ETF
NOTES TO THE FINANCIAL STATEMENTS (CONTINUED)
September 30, 2024
Foreign Investment Risk. Returns on investments in foreign securities could be more volatile than, or trail the returns on, investments in U.S. securities. Investments in or exposures to foreign securities are subject to special risks, including risks associated with foreign securities generally, including differences in information available about issuers of securities and investor protection standards applicable in other jurisdictions; capital controls risks, including the risk of a foreign jurisdiction imposing restrictions on the ability to repatriate or transfer currency or other assets; currency risks; political, diplomatic and economic risks; regulatory risks; and foreign market and trading risks, including the costs of trading and risks of settlement in foreign jurisdictions.
Concentration Risk. The Fund may be susceptible to an increased risk of loss, including losses due to adverse occurrences affecting the Fund more than the market as a whole, to the extent that the Fund’s investments are concentrated in the securities of a particular issuer or issuers, country, group of countries, region, market, industry, group of industries, sector, or asset class.
Depositary Receipts Risk. The risks of investments in depositary receipts, including American Depositary Receipts (“ADRs”), European Depositary Receipts (“EDRs”), and Global Depositary Receipts (“GDRs”), are substantially similar to Foreign Investment Risk. In addition, depositary receipts may not track the price of the underlying foreign securities, and their value may change materially at times when the U.S. markets are not open for trading.
Emerging Markets Risk. The Fund may invest in companies organized in emerging market nations. Investments in securities and instruments traded in developing or emerging markets, or that provide exposure to such securities or markets, can involve additional risks relating to political, economic, or regulatory conditions not associated with investments in U.S. securities and instruments or investments in more developed international markets. Such conditions may impact the ability of the Fund to buy, sell or otherwise transfer securities, adversely affect the trading market and price for Fund shares and cause the Fund to decline in value.
Geographic Investment Risk. To the extent the Fund invests a significant portion of its assets in the securities of companies of a single country or region, it is more likely to be impacted by events or conditions affecting that country or region.
Taiwan Risk. The economy of Taiwan is heavily dependent on exports. Currency fluctuations, increasing competition from Asia’s other emerge economies, and conditions that weaken demand for Taiwan’s export products worldwide could have a negative impact on the Taiwanese economy as a whole. Concerns over Taiwan’s history of political contention and its current relationship with China may also have a significant impact on the economy of Taiwan.
South Korea Risk. The Fund is susceptible to adverse market, political, regulatory and geographic events affecting South Korea. The South Korean economy is dependent on the economies of other Asian countries, especially China and Southeast Asia, and the United States as key trading partners. Furthermore, South Korea’s economy may be significantly affected by currency fluctuations and increasing competition from Asia’s other low-cost emerging economies. Also, tensions with North Korea could escalate and lead to further uncertainty in the political and economic climate of South Korea.
Investing in Chile Risk. Investments in Chilean issuers involve risks that are specific to Chile, including legal, regulatory, political, currency, environmental and economic risks. Among other things, the Chilean economy is heavily dependent on the export of certain commodities.
Investing in Poland Risk. Investments in Polish issuers may subject the Fund to legal, regulatory, political, currency and economic risk specific to Poland. Among other things, Poland’s economy is still relatively undeveloped and is heavily dependent on relationships with certain key trading partners, including Germany and other European Union (“the EU”) countries. As a result, Poland’s continued growth is dependent on the growth of these economies.
FREEDOM 100 EMERGING MARKETS ETF
NOTES TO THE FINANCIAL STATEMENTS (CONTINUED)
September 30, 2024
International Closed-Market Trading Risk. Because the Fund’s investments may be traded in markets that are closed when the U.S. markets are open, there are likely to be deviations between the current pricing of an underlying investment and stale investment pricing (i.e., the last quote from its closed foreign market), resulting in premiums or discounts to NAV that may be greater than those experienced by other ETFs.
Freedom Investment Strategy Risk. The Fund’s Freedom investment strategy limits the types and number of investment opportunities available to the Fund and, as a result, the Fund may underperform other emerging markets funds that do not have a freedom focus. In addition, the Index Provider may be unsuccessful in creating an index composed only of companies in countries that benefit from significant personal and economic freedoms.
Freedom Score Risk. The Index Provider relies upon the Fraser Institute, a global, independent think-tank partnership, to obtain the Freedom Score used in the Index. The Freedom Score is derived using quantified data derived from government organizations, non-governmental organizations (“NGO” or collectively “NGOs”), private sector actors, and other entities. This data is consolidated, analyzed, and disseminated by the Fraser Institute. Changes to the Freedom Score methodology or its data sources by the Fraser Institute are not controlled by the Index Provider, who relies exclusively upon the Freedom Score output for use in the Index. Should the Fraser Institute cease to provide the Freedom Score entirely, materially delay its reporting of the Freedom Score, or materially modify the calculation of the Freedom Score, the Index Provider will use its own patent-pending algorithm to produce the Freedom Score output internally using similar inputs and variables.
Annual Rebalance Risk. The Index’s components are reconstituted annually. As a result, (i) the Index’s exposure to one or more markets may be affected by significant market movements promptly following the annual reconstitution that are not predictive of those markets’ performance for the subsequent year and (ii) changes to the Index’s market exposure may lag a significant change in one or more market’s direction (up or down) by as long as a year if such changes first take effect promptly following the reconstitution. Such lags between market performance and changes to the Index’s exposure may result in significant underperformance relative to the broader foreign equity markets.
Information Technology Sector Risk. The Fund will have exposure to companies operating in the technology sector. Technology companies, including information technology companies, may have limited product lines, financial resources and/or personnel. Technology companies typically face intense competition and potentially rapid product obsolescence. They are also heavily dependent on intellectual property rights and may be adversely affected by the loss or impairment of those rights.
Financials Sector Risk. The Fund is expected to have exposure to companies in the financials sector, and therefore, the Fund’s performance could be negatively impacted by events affecting this sector. The financials sector includes, for example, banks and financial institutions providing mortgage and mortgage related services. This sector can be significantly affected by, among other things, changes in interest rates, government regulation, the rate of defaults on corporate, consumer and government debt, the availability and cost of capital, and fallout from the housing and sub-prime mortgage crisis.
Materials Sector Risk. Issuers in the materials sector may be adversely affected by commodity price volatility, exchange rates, import controls, increased competition, depletion of resources, technical progress, labor relations and government regulations, among other factors. Issuers in the materials sector may be liable for environmental damage and product liability claims. Production of materials may exceed demand as a result of market imbalances or economic downturns, leading to poor investment returns.
Geopolitical/Natural Disaster Risks. The Fund’s investments are subject to geopolitical and natural disaster risks, such as war, terrorism, trade disputes, political or economic dysfunction within some nations, public health crises and related geopolitical events, as well as environmental disasters, epidemics and/or pandemics, which may add to instability in world economies and volatility in markets. The impact may be short-term or may last for extended periods.
Quantitative Security Selection Risk. Data for some companies in which the Fund invests or upon which the Fund calculates its allocations may be less available and/or less current than data for companies in other markets. The Index uses a quantitative model to generate investment decisions and its processes and stock selection could be adversely affected if it relies on erroneous or outdated data. In addition, securities selected using the quantitative model could perform differently
FREEDOM 100 EMERGING MARKETS ETF
NOTES TO THE FINANCIAL STATEMENTS (CONTINUED)
September 30, 2024
from the financial markets as a whole as a result of the characteristics used in the analysis, the weight placed on each characteristic and changes in the characteristic’s historical trends.
Equity Investing Risk. An investment in the Fund involves risks similar to those of investing in any fund holding equity securities, such as market fluctuations, changes in interest rates and perceived trends in stock prices. The values of equity securities could decline generally or could underperform other investments. In addition, securities may decline in value due to factors affecting a specific issuer, market or securities markets generally.
Passive Investment Risk. The Fund is not actively managed and the Adviser will not sell shares of an equity security due to current or projected underperformance of a security, industry or sector, unless that security is removed from the Index, sold in connection with a rebalancing of the Index as addressed in the Index methodology, or sold to comply with the Fund’s investment limitations (for example, to maintain the Fund’s tax status). Maintaining investments regardless of market conditions or the performance of individual investments could cause the Fund’s return to be lower than if the Fund employed an active strategy.
Tracking Error Risk. As with all index funds, the performance of the Fund and its Index may differ from each other for a variety of reasons. For example, the Fund incurs operating expenses and portfolio transaction costs not incurred by the Index. In addition, the Fund may not be fully invested in the securities of the Index at all times or may hold securities not included in the Index.
Investment Risk. When you sell your Shares of the Fund, they could be worth less than what you paid for them. The Fund could lose money due to short-term market movements and over longer periods during market downturns. Securities may decline in value due to factors affecting securities markets generally or particular asset classes or industries represented in the markets. The value of a security may decline due to general market conditions, economic trends or events that are not specifically related to the issuer of the security or to factors that affect a particular industry or group of industries. During a general downturn in the securities markets, multiple asset classes may be negatively affected. Therefore, you may lose money by investing in the Fund.
Non-Diversification Risk. Because the Fund is non-diversified, it may be more sensitive to economic, business, political or other changes affecting individual issuers or investments than a diversified fund, which may result in greater fluctuation in the value of the Fund’s Shares and greater risk of loss.
Market Capitalization Risk. To the extent the Fund emphasizes large-, mid- or small-capitalization stocks, it will assume the associated risks. At any given time, any of these market capitalizations may be out of favor with investors.
•Large-Capitalization Investing. The securities of large-capitalization companies may be relatively mature compared to smaller companies and therefore subject to slower growth during times of economic expansion. Large-capitalization companies may also be unable to respond quickly to new competitive challenges, such as changes in technology and consumer tastes.
•Mid-Capitalization Investing. The securities of mid-capitalization companies may be more vulnerable to adverse issuer, market, political, or economic developments than securities of large-capitalization companies. The securities of mid-capitalization companies generally trade in lower volumes and are subject to greater and more unpredictable price changes than large capitalization stocks or the stock market as a whole.
•Small-Capitalization Investing. The securities of small-capitalization companies may be more vulnerable to adverse issuer, market, political, or economic developments than securities of large- or mid-capitalization companies. The securities of small-capitalization companies generally trade in lower volumes and are subject to greater and more unpredictable price changes than large- or mid-capitalization stocks or the stock market as a whole. There is typically less publicly available information concerning smaller-capitalization companies than for larger, more established companies.
See the Fund’s Prospectus and Statement of Additional Information regarding the risks of investing in shares of the Fund.
FREEDOM 100 EMERGING MARKETS ETF
NOTES TO THE FINANCIAL STATEMENTS (CONTINUED)
September 30, 2024
NOTE 4 – COMMITMENTS AND OTHER RELATED PARTY TRANSACTIONS.
Empowered Funds, LLC dba EA Advisers (the “Adviser”) serves as the investment adviser to the Fund. Pursuant to an investment advisory agreement (the “Advisory Agreement”) between the Trust, on behalf of the Fund, and the Adviser, the Adviser provides investment advice to the Fund and oversees the day-to-day operations of the Fund, subject to the direction and control of the Board and the officers of the Trust. Under the Advisory Agreement, the Adviser is also responsible for arranging transfer agency, custody, fund administration and accounting, and other non-distribution related services necessary for the Fund to operate. The Adviser administers the Fund’s business affairs, provides office facilities and equipment and certain clerical, bookkeeping and administrative services. The Adviser agrees to pay all expenses incurred by the Fund except for the fee paid to the Adviser pursuant to the Advisory Agreement, payments under any distribution plan adopted pursuant to Rule 12b-1, brokerage expenses, acquired fund fees and expenses, taxes (including tax-related services), interest (including borrowing costs), litigation expense (including class action-related services) and other non-routine or extraordinary expenses.
At a Board meeting held on June 7, 2024, the Board of Trustees of the Trust (the “Trustees”) including each Trustee who is not an “interested person” of the Trust, as defined in the 1940 Act (the “Independent Trustees”), approved the continuation of the Advisory Agreement. Per the Advisory Agreement, the Fund pays an annual rate of 0.49% to the Adviser monthly based on average daily net assets.
U.S. Bancorp Fund Services, LLC (“Fund Services” or “Administrator”), doing business as U.S. Bank Global Fund Services, acts as the Fund’s Administrator and, in that capacity, performs various administrative and accounting services for the Fund. The Administrator prepares various federal and state regulatory filings, reports and returns for the Fund, including regulatory compliance monitoring and financial reporting; prepares reports and materials to be supplied to the trustees; monitors the activities of the Fund’s Custodian, transfer agent and fund accountant. Fund Services also serves as the transfer agent and fund accountant to the Fund. U.S. Bank N.A. (the “Custodian”), an affiliate of the Administrator, serves as the Fund’s Custodian.
The Custodian acts as the securities lending agent (the “Securities Lending Agent”) for the Fund.
NOTE 5 – SECURITIES LENDING
The Fund may lend up to 331/3% of the value of the securities in its portfolio to brokers, dealers and financial institutions (but not individuals) under terms of participation in a securities lending program administered by the Securities Lending Agent. The securities lending agreement requires that loans are collateralized at all times in an amount equal to at least 102% of the value of any domestic loaned securities at the time of the loan, plus accrued interest. The use of loans of foreign securities, which are denominated and payable in U.S. dollars, shall be collateralized in an amount equal to 105% of the value of any loaned securities at the time of the loan plus accrued interest. The Fund receives compensation in the form of fees and earns interest on the cash collateral. The amount of fees depends on a number of factors including the type of security and length of the loan. The Fund continues to receive interest payments or dividends on the securities loaned during the borrowing period. Gain or loss on the value of securities loaned that may occur during the term of the loan will be for the account of the Fund. The Fund has the right under the terms of the securities lending agreement to recall the securities from the borrower on demand.
The securities lending agreement provides that, in the event of a borrower’s material default, the Securities Lending Agent shall take all actions the Securities Lending Agent deems appropriate to liquidate the collateral, purchase replacement securities at the Securities Lending Agent’s expense or pay the Fund an amount equal to the market value of the loaned securities, subject to certain limitations which are set forth in detail in the securities lending agreement between the Fund and the Securities Lending Agent.
During the fiscal period, the Fund had loaned securities and received cash collateral for the loans. The cash collateral was invested by the Securities Lending Agent in accordance with the Trust approved investment guidelines. Those guidelines require the cash collateral to be invested in readily marketable, high quality, short-term obligations; however, such investments are subject to risk of payment delays or default on the part of the issuer or counterparty or otherwise may not generate sufficient interest to support the costs associated with securities lending. The Fund could also experience delays in
FREEDOM 100 EMERGING MARKETS ETF
NOTES TO THE FINANCIAL STATEMENTS (CONTINUED)
September 30, 2024
recovering its securities and possible loss of income or value if the borrower fails to return the borrowed securities, although the Fund is indemnified from this risk by contract with the Securities Lending Agent.
For the fiscal year ended September 30, 2024, the value of the securities on loan and payable for collateral due to broker were as follows:
| | | | | | | | | | | |
Value of Securities
on Loan | | Payable for
Collateral Received* | Percentage of Net Assets of Securities On Loan |
| $47,211,098 | | $49,228,873 | 5.6% |
| | | | | | | | |
| * | The cash collateral received was invested in the First American Money Market Government Obligations Fund as shown on the Schedule of Investments. The investment objective is to seek maximum current income to the extent consistent with the preservation of capital and maintenance of liquidity. |
The interest income earned by the Fund on the investment of cash collateral received from borrowers for the securities loaned to them (“Securities lending income, net”) is reflected in the Fund’s Statement of Operations. Net securities lending income earned on collateral investments and recognized by the Fund during the fiscal year ended September 30, 2024, was $579,908.
Due to the absence of a master netting agreement related to the Funds’ participation in securities lending, no additional offsetting disclosures have been made on behalf of the Fund for the total borrowings listed above.
NOTE 6 – PURCHASES AND SALES OF SECURITIES
For the fiscal year ended September 30, 2024, purchases and sales of securities for the Fund, excluding short-term securities and in-kind transactions, were as follows:
| | | | | | | | |
| Purchases | | Sales |
| $ | 222,823,942 | | | $ | 148,331,063 | |
For the fiscal year ended September 30, 2024, in-kind transactions associated with creations and redemptions were as follows:
| | | | | | | | |
| Purchases | | Sales |
| $ | 55,020,858 | | | $ | 62,748,361 | |
For the fiscal year ended September 30, 2024, short-term and long-term gains on in-kind transactions were as follows:
| | | | | | | | |
| Short Term | | Long Term |
| $ | 8,765,000 | | | $ | 11,842,179 | |
There were no purchases or sales of U.S. Government securities during the fiscal year.
FREEDOM 100 EMERGING MARKETS ETF
NOTES TO THE FINANCIAL STATEMENTS (CONTINUED)
September 30, 2024
NOTE 7 – TAX INFORMATION
The components of tax basis cost of investments and net unrealized appreciation (depreciation) for federal income tax purposes at September 30, 2024, were as follows:
| | | | | | | | |
| Tax cost of Investments | | $ | 785,946,735 | |
| Gross tax unrealized appreciation | | 174,485,590 | |
| Gross tax unrealized depreciation | | (62,962,039) | |
| Net tax unrealized appreciation (depreciation) | | $ | 111,523,557 | |
| Undistributed ordinary income | | 4,580,705 | |
| Undistributed long-term gain | | — | |
| Total distributable earnings | | 4,580,705 | |
| Other accumulated gain (loss) | | (21,099,034) | |
| Total accumulated gain (loss) | | $ | 95,005,228 | |
Under tax law, certain capital and foreign currency losses realized after October 31st and within the taxable year are deemed to arise on the first business day of the Fund’s next taxable year.
For the fiscal year ended September 30, 2024, the Fund did not defer any post-October capital or late-year losses.
At September 30, 2024, the Fund had the following capital loss carryforwards that do not expire:
| | | | | | | | |
Unlimited
Short-Term | | Unlimited
Long-Term |
| $ | (14,423,023) | | | $ | (6,676,011) | |
NOTE 8 – DISTRIBUTIONS TO SHAREHOLDERS
The tax character of distributions paid by the Fund during the fiscal years ended September 30, 2024, and September 30, 2023, were as follows:
| | | | | | | | | | | | | | |
Fiscal Year Ended
September 30, 2024 | | Fiscal Year Ended
September 30, 2023 |
Ordinary
Income | | Ordinary
Income | | Realized
Gain |
| $ | 20,070,542 | | | $ | 18,598,841 | | | $ | 450,271 | |
NOTE 9 – CREDIT FACILITY
The Custodian has made available to the Fund and another series of the Trust a $30 million secured credit facility, pursuant to a Loan Agreement (“Agreement”) effective December 13, 2023, expiring on December 11, 2024, for the purposes of having cash available to satisfy redemption requests. Advances under the Agreement would be limited to the lesser of $30 million, 25% of the gross market value of the Fund, or 33.33% of the unencumbered assets of the Fund. Principal is due 45 days after the initial advance and at the maturity. Interest is payable monthly in arrears. Under the credit facility, the interest rate paid on outstanding borrowings is equal to the lender’s prime rate. As of September 30, 2024, the prime rate was 8.00%. The interest paid on outstanding borrowings is paid by the Adviser.
FREEDOM 100 EMERGING MARKETS ETF
NOTES TO THE FINANCIAL STATEMENTS (CONTINUED)
September 30, 2024
For the fiscal year ended September 30, 2024, the Fund’s activity under the credit facility was as follows:
| | | | | | | | | | | |
| Average Principal Balance, when in use | Average Interest Rate, when in use | Maximum Loan Outstanding | Period Maximum Loan was Outstanding |
| $1,460,800 | 8.50% | $5,458,000 | June 12, 2024 |
As of September 30, 2024, the Fund had no outstanding borrowings under the Agreement.
NOTE 10 – SUBSEQUENT EVENTS
In preparing these financial statements, management of the Fund has evaluated events and transactions for potential recognition or disclosure through the date the financial statements were issued. There were no transactions that occurred during the year subsequent to September 30, 2024, that materially impacted the amounts or disclosures in the Fund’s financial statements other than the below.
Effective November 15, 2024, the standard fixed creation transaction fee and the standard fixed redemption transaction fee for the Fund, regardless of the number of Creation Units created or redeemed in the transaction, is $2,000.
REPORT OF INDEPENDENT REGISTERED PUBLIC ACCOUNTING FIRM
To the Shareholders of
Freedom 100 Emerging Markets ETF and
The Board of Trustees of
EA Series Trust
Opinion on the Financial Statements
We have audited the accompanying statement of assets and liabilities of Freedom 100 Emerging Markets ETF (the “Fund”), a series of EA Series Trust (the “Trust”), including the schedule of investments, as of September 30, 2024, the related statement of operations for the year ended September 30, 2024, the statements of changes in net assets and the financial highlights for each of the two years ended September 30, 2024, and the related notes (collectively referred to as the “financial statements”). In our opinion, the financial statements present fairly, in all material respects, the financial position of the Fund as of September 30, 2024, the results of its operations for the year ended September 30, 2024, and the changes in its net assets and the financial highlights for the each of the two years ended September 30, 2024, in conformity with accounting principles generally accepted in the United States of America.
The financial highlights for each of the three years in the period then ended September 30, 2022 were audited by other auditors, whose report dated November 29, 2022, expressed an unqualified opinion on the financial statements and financial highlights.
Basis for Opinion
These financial statements are the responsibility of the Fund’s management. Our responsibility is to express an opinion on the Fund’s financial statements based on our audits. We are a public accounting firm registered with the Public Company Accounting Oversight Board (United States) (“PCAOB”) and are required to be independent with respect to the Fund in accordance with the U.S. federal securities laws and the applicable rules and regulations of the Securities and Exchange Commission and the PCAOB. We have served as the auditor of one or more of the funds in the Trust since 2023.
We conducted our audits in accordance with the standards of the PCAOB. Those standards require that we plan and perform the audits to obtain reasonable assurance about whether the financial statements are free of material misstatement, whether due to error or fraud. The Fund is not required to have, nor were we engaged to perform, an audit of its internal control over financial reporting. As part of our audits, we are required to obtain an understanding of internal control over financial reporting, but not for the purpose of expressing an opinion on the effectiveness of the Fund’s internal control over financial reporting. Accordingly, we express no such opinion.
Our audits included performing procedures to assess the risks of material misstatement of the financial statements, whether due to error or fraud, and performing procedures that respond to those risks. Such procedures included examining, on a test basis, evidence regarding the amounts and disclosures in the financial statements. Our audits also included evaluating the accounting principles used and significant estimates made by management, as well as evaluating the overall presentation of the financial statements. Our procedures included confirmation of securities owned as of September 30, 2024, by correspondence with the custodian and brokers; when replies were not received from brokers, we performed other auditing procedures. We believe that our audits provide a reasonable basis for our opinion.
TAIT, WELLER & BAKER LLP
Philadelphia, Pennsylvania
November 27, 2024
FREEDOM 100 EMERGING MARKETS ETF
FEDERAL TAX INFORMATION (UNAUDITED)
For the fiscal year ended September 30, 2024, certain dividends paid by the Fund may be subject to a maximum tax rate of 23.8%, as provided for by the Tax Cuts and Jobs Act of 2017. The percentage of dividends declared from ordinary income designated as qualified dividend income for the Fund was 56.06%.
For corporate shareholders, the percent of ordinary income distributions qualifying for the corporate dividends received deduction for the fiscal year ended September 30, 2024, for the Fund was 0.00%
The percentage of taxable ordinary income distributions that are designated as short-term capital gain distributions under the Internal Revenue Section 871 (k)(2)(C) for the Fund was 0.00%.
FOREIGN TAX CREDIT PASS THROUGH (UNAUDITED)
Pursuant to Section 853 of the Internal Revenue code, the Funds designate the following amounts as foreign taxes paid for the fiscal year ended September 30, 2024. Foreign taxes paid for purposes of Section 853 may be less than actual foreign taxes paid for financial statement purposes.
| | | | | | | | | | | | | | |
| Creditable Foreign Tax Credit Paid | | Per Share Amount | | Portion of Ordinary Income Distribution Derived From Foreign Sourced Income |
| $ | 4,637,295 | | | $ | 0.19567 | | | 100.00% |
Foreign taxes paid or withheld should be included in taxable income with an offsetting deduction from gross income or as a credit for taxes paid to foreign governments.
Above figures may differ from those cited elsewhere in this report due to difference in the calculation of income and gains under GAAP purposes and Internal Revenue Service purposes.
Shareholders are strongly advised to consult their own tax advisers with respect to the tax consequences of their investments in the Funds.
Item 8. Changes in and Disagreements with Accountants for Open-End Management Investment
Companies.
There were no matters concerning changes in and disagreements with Accountants on accounting and financial disclosures required by Item 304 of Regulation S-K.
Item 9. Proxy Disclosures for Open-End Management Investment Companies.
There were no matters submitted during the period covered by the report to a vote of shareholders.
Item 10. Remuneration Paid to Directors, Officers, and Others of Open-End Management
Investment Companies
Not applicable. The Independent Trustees are paid by the Adviser out of the advisory fee. See Note 4 to the Financial Statements under Item 7.
Item 11. Statement Regarding Basis for Approval of Investment Advisory Contracts.
The Board (the members of which are referred to as “Trustees”) of the EA Series Trust (the “Trust”) met in-person on June 7, 2024 to consider the approval of the continuation of the Advisory Agreement between the Trust, on behalf of the Freedom 100 Emerging Markets ETF (the “Fund”), and Empowered Funds, LLC dba EA Advisers (the “Adviser”), for an additional annual term. In accordance with Section 15(c) of the 1940 Act, the Board requested, reviewed, and considered materials furnished by the Adviser relevant to the Board’s consideration of whether to approve the continuation of the Advisory Agreement. In connection with considering the approval of the Advisory Agreement, the Trustees who are not “interested persons” of the Trust, as that term is defined in the 1940 Act (the “Independent Trustees”), met in executive session with counsel to the Trust, who provided assistance and advice. In reaching the decision to approve the Advisory Agreement, the Board considered and reviewed information provided by the Adviser and the index provider at this meeting and throughout the year, including among other things information about their respective personnel, operations, financial condition, and compliance and risk management. The Board also reviewed the Advisory Agreement. During its review and consideration, the Board focused on and reviewed the factors it deemed relevant, including:
Nature, Quality, and Extent of Services. The Board was presented with and considered information concerning the nature, quality, and extent of the overall services provided by the Adviser to the Fund. In this connection, the Board considered the responsibilities of the Adviser, recognizing that the Adviser had invested significant time and effort in structuring the Trust and the Fund, as well as arranging service providers for the Fund. In addition, the Board considered that the Adviser is responsible for providing investment advisory oversight services to the Fund, executing all Fund transactions, monitoring compliance with the Fund’s objectives, policies and restrictions, and carrying out directives of the Board. The Board also considered the services provided by the Adviser in the oversight of the Trust’s administrator, transfer agent, and custodian. In addition, the Board evaluated the integrity of the Adviser’s personnel, the experience of the portfolio managers in managing assets, and the adequacy of each of the Adviser’s resources to perform the services provided under the Advisory Agreement. The Board also considered the Adviser’s ongoing oversight responsibilities vis-à-vis the index provider, including its review of the index provider’s process for maintaining the index that is tracked by the Fund along with its oversight of the index calculation agent.
Performance. The Board considered the third-party peer group analysis comparing the Fund’s performance to the performance of other funds that the third-party deemed to be comparable to the Fund. It was determined that the Adviser has consistently managed the Fund’s portfolio in accordance with its stated investment objective and strategies. The Board noted that the Fund outperformed the average total return of both its ETF peer group by 948 (9.48%) basis points and its mutual fund peer group by 663 (6.63%) basis points over the past 12 months ended March 31, 2024. The Board noted that the Fund outperformed the average total return of its ETF and mutual fund peer groups by 593 (5.93%) and 214 (2.14%) basis points, respectively, over the past 24 months ended March 31, 2024. The Board further noted that the Fund outperformed the average total return of its ETF and mutual fund peer groups by 1592 (15.92%) and 1883 (18.83%) basis points, respectively, over the past 36 months ended March 31, 2024. The Board concluded that the Fund’s performance was reasonable.
Comparative Fees and Expenses. In considering the advisory fees and sub-advisory fees, the Board reviewed and considered the fees in light of the nature, quality, and extent of the services being provided by the Adviser. With respect to the advisory
fees and expense ratio for the Fund, the Board also considered the fees and expense ratio versus the fees and expenses charged to other exchange-traded funds and mutual funds.
The Board compared the Fund’s gross total expense ratio, net total expense ratio, and management fee against the average gross total expense ratio, average net total expense ratio, and average management fee for ETFs and mutual funds in the Fund’s peer group. The Fund’s gross total expense ratio (0.49%) was higher than the average for ETFs (0.30%) and was lower than the average for mutual funds (6.68%); the Fund’s net total expense ratio (0.49%) was higher than the average for ETFs (0.24%) and was lower than the average for mutual funds (0.91%); and the Fund’s management fee (0.49%) was higher than the average for ETFs (0.29%) and lower than the average for mutual funds (0.76%). The Board considered that the Fund’s fee arrangement in which the Adviser is responsible for paying most of the Fund’s operating expenses out of its resources, noting that comparisons with the Fund’s overall expense ratio may be more relevant than comparisons to management fees only. They stated that such a comparison demonstrates the Fund’s overall cost structure is within the range of expense ratios of its respective ETF and mutual fund peers.
The Board considered, among other information, the data provided in the third-party report comparing the Fund’s fees to those of other funds that the third-party deemed to be comparable to the Fund. Fee information was provided in quartiles, ranging from quartile one (the least expensive) to quartile four (the most expensive). This data included a comparison of the Fund’s expense ratio against both ETFs and mutual funds. The Fund’s total expense ratio (for both gross and net) and management fee were in the following quartiles:
| | | | | | | | | | | | | | | | | | | | |
| Fund | Total Expense Ratio | Net Expense Ratio | Management Fee Only |
| ETFs | Mutual Funds | ETFs | Mutual Funds | ETFs | Mutual Funds |
| FRDM | Quartile 4 | Quartile 1 | Quartile 4 | Quartile 1 | Quartile 4 | Quartile 1 |
With respect to the sub-advisory fee, the Board noted that it was payable solely out of the unitary management fee payable to the Adviser. The Board considered the representations from the Adviser and the Sub-Adviser that neither firm manages any other accounts that follow a similar strategy to the Fund. The Board was agreeable to the fee levels.
Costs and Profitability. The Board further considered information regarding the potential profits, if any, that may be realized by the Adviser in connection with providing its services to the Fund. The Board reviewed the profit and loss information provided by the Adviser with respect to the Fund, noting that the Fund is profitable to the Adviser at this time. The Board also reviewed the costs associated with the personnel, systems, and equipment necessary to manage the Fund and to meet the regulatory and compliance requirements adopted by the SEC and other regulatory bodies. The Board also considered other expenses of the Fund the Adviser would pay in accordance with the Advisory Agreement. The Board took into consideration that the Adviser agreed to pay all expenses incurred by the Fund except for the fees paid to the Adviser pursuant to the Advisory Agreement, payments under any distribution plan adopted pursuant to Rule 12b-1, brokerage expenses, acquired fund fees and expenses, taxes, interest (including borrowing costs), the fees and expenses associated with the Fund’s securities lending program, litigation expenses and other non-routine or extraordinary expenses.
Other Benefits. The Board further considered the extent to which the Adviser might derive ancillary benefits from the Fund’s operations. For example, the Adviser may engage in soft dollar transactions in the future, although it does not currently plan to do so. In addition, the Adviser may benefit from continued growth in the Trust by potentially negotiating better fee arrangements with key vendors serving the Fund and other series in the Trust.
Economies of Scale. The Board also considered whether economies of scale would be realized by the Fund as its assets grow larger, including the extent to which this is reflected in the level of fees to be charged. The Board also noted that the Fund’s advisory fee does not include breakpoint reductions as the Fund’s assets grow but considered that the Fund’s fee structure is a unitary fee. The Board concluded that the current fee structure reflects a sharing of economies of scale between the Adviser and the Fund at the Fund’s current asset level. The Board also noted its intention to monitor fees as the Fund grows in size and assess whether advisory fee breakpoints may be warranted.
Conclusion. No single factor was determinative of the Board’s decision to approve the continuation of the Advisory Agreement for an additional annual term; rather, the Board based its determination on the total mix of information available to it. Based on a consideration of all the factors in their totality, the Board, including the Independent Trustees, unanimously determined that the Advisory Agreement, including the compensation payable under the Advisory Agreement, were fair and
reasonable to the Fund. The Board, including the Independent Trustees, unanimously determined that the approval of the continuation of the Advisory Agreement was in the best interests of the Fund and its shareholders.
Item 12. Disclosure of Proxy Voting Policies and Procedures for Closed-End Management Investment Companies.
Not applicable to open-end investment companies.
Item 13. Portfolio Managers of Closed-End Management Investment Companies.
Not applicable to open-end investment companies.
Item 14. Purchases of Equity Securities by Closed-End Management Investment Company and Affiliated Purchasers.
Not applicable to open-end investment companies.
Item 15. Submission of Matters to a Vote of Security Holders.
There have been no material changes to the procedures by which shareholders may recommend nominees to the registrant’s board of trustees.
Item 16. Controls and Procedures.
(a) The Registrant’s President (principal executive officer) and Treasurer (principal financial officer) have reviewed the Registrant's disclosure controls and procedures (as defined in Rule 30a-3(c) under the Investment Company Act of 1940 (the “Act”)) as of a date within 90 days of the filing of this report, as required by Rule 30a-3(b) under the Act and Rules 13a-15(b) or 15d‑15(b) under the Securities Exchange Act of 1934. Based on their review, such officers have concluded that the disclosure controls and procedures are effective in ensuring that information required to be disclosed in this report is appropriately recorded, processed, summarized and reported and made known to them by others within the Registrant and by the Registrant’s service provider.
(b) There were no changes in the Registrant's internal control over financial reporting (as defined in Rule 30a-3(d) under the Act) that occurred during the period covered by this report that have materially affected, or are reasonably likely to materially affect, the Registrant's internal control over financial reporting.
Item 17. Disclosure of Securities Lending Activities for Closed-End Management Investment Companies
Not applicable to open-end investment companies.
Item 18. Recovery of Erroneously Awarded Compensation.
(a) Not applicable.
(b) Not applicable.
Item 19. Exhibits.
SIGNATURES
Pursuant to the requirements of the Securities Exchange Act of 1934 and the Investment Company Act of 1940, the registrant has duly caused this report to be signed on its behalf by the undersigned, thereunto duly authorized.
| | | | | | | | |
| (Registrant) | EA Series Trust | |
| | |
| By (Signature and Title) | /s/ Michael D. Barolsky | |
| | Michael D. Barolsky, President (principal executive officer) | |
| | |
| Date: | December 4, 2024 | |
Pursuant to the requirements of the Securities Exchange Act of 1934 and the Investment Company Act of 1940, this report has been signed below by the following persons on behalf of the registrant and in the capacities and on the dates indicated.
| | | | | | | | |
| By (Signature and Title) | /s/ Michael D. Barolsky | |
| | Michael D. Barolsky, President (principal executive officer) | |
| | | |
| Date: | December 4, 2024 | |
| | | |
| By (Signature and Title) | /s/ Sean R. Hegarty | |
| | Sean Hegarty, Treasurer (principal financial officer) | |
| | | |
| Date: | December 4, 2024 | |